Numerical diffusive terms in weakly-compressible SPH schemes
Published: March 29, 2011
r 2011 American Chemical Society 3272 dx.doi.org/10.1021/jp111299m | J. Phys. Chem. A 2011, 115, 3272–3278
ARTICLE
pubs.acs.org/JPCA
Anharmonicity of Weakly Bound Mþ�H2 ComplexesNuwan De Silva, Bosiljka Njegic, and Mark S. Gordon*
Department of Chemistry, Iowa State University, Ames, Iowa 50011, United States
I. INTRODUCTION
Hydrogen is a promising candidate to meet the global energydemand and to foster a cleaner and sustainable new energyeconomy.1 In addition, oxidation of hydrogen in a fuel cell yieldswater as a byproduct; hence, there is no emission of green housegases or ozone precursors. With the recent advances in fuel celltechnology, the extensive production of hydrogen using renew-able energy sources appears to be a promising direction forsolving the current energy crisis.
Although hydrogen is the most abundant element in theuniverse, constituting about 93% of all atoms, pure hydrogen isnot available in significant quantities in nature. Because hydrogenis not available as a pre-existing energy source like fossil fuels, itfirst must be produced and then stored as a carrier, much like abattery. Production of hydrogen can involve a variety of sources,including natural gas and coal. However, precautions must betaken to avoid the emissions of greenhouse gases and ozoneprecursors during the hydrogen extraction process.2
Another challenge is presented in the large storage capacitynecessary for hydrogen, which requires about four times thevolume required by gasoline. Therefore, design of suitable, highcapacity storage material is of great importance for hydrogen tobe an efficient fuel.3 There are presently three general waysknown for storing hydrogen: compressed hydrogen gas tanks,liquid hydrogen tanks, and materials-based hydrogen storage.The energy density of gaseous hydrogen can be improved bystoring hydrogen in compressed hydrogen gas tanks and liquidhydrogen tanks. However, the compressed hydrogen gas tanksand liquid hydrogen tanks have significant disadvantages. Com-pression is hindered by low hydrogen density and high-pressureoperations, resulting in high costs for compression and tanks, andcauses safety issues associated with high-pressure storage.4
Liquefaction of hydrogen requires an amount of energy equalto almost half of that available from hydrogen combustion,and continuous boil-off occurring in the tanks limits theapplications.3
Recent research has been focused on lighter storage materialwith favorable uptake and release kinetics to overcome the issuesassociated with compression and liquefaction tanks. Hydrogencan be bound to materials, such as fullerenes5,6 and carbonnanotubes,7,8 stored as a solid compound via physisorption.However, materials that utilize physisorption have a low gravi-metric uptake compared to that of chemisorption. Molecularhydrogen bound into a solid storage material via chemisorptionsuch as metal hydrides,9 complex hydrides,10 metal cation-dopedzeolites,11 and metal-organic frameworks (MOF),12 is a promis-ing technique to overcome the storage problem.
Metal cation�dihydrogen (Mþ�H2) complexes are simplecharged polyatomic molecules and therefore constitute a usefulbenchmark system for assessing computational strategies aimedat describing ion-neutral complexes that are relevant for thehydrogen storage problem. In general, Mþ�H2 complexes areweakly bound, with binding energies typically less than 5 kcal/mol.Therefore, the weak interaction in Mþ�H2 complexes alonecannot achieve a significant adsorption capacity at reasonabletemperatures. However, there are strategies to improve adsorp-tion by making charged metal sites available within the materialsuch as alkali-doped carbon nanotubes.13,14 Analysis of bindingbetween molecular hydrogen and a metal cation is useful tounderstand the various aspects of hydrogen storage. Such insightmight be applied in the future to the design of novel materialswith favorable absorption/desorption kinetics.
Interactions between metal cations and dihydrogen adductshave been explored experimentally and theoretically. RecentlyBieske, et al. reported rotationally resolved infrared spectra ofsimple metal cation�dihydrogen complexes in the gas phase,including Liþ�H2,
15 Bþ�H2,16 Naþ�H2,
17 and Alþ�H2.18 A
correlation between the red shift in the H2 stretching frequencies
Received: November 28, 2010Revised: March 14, 2011
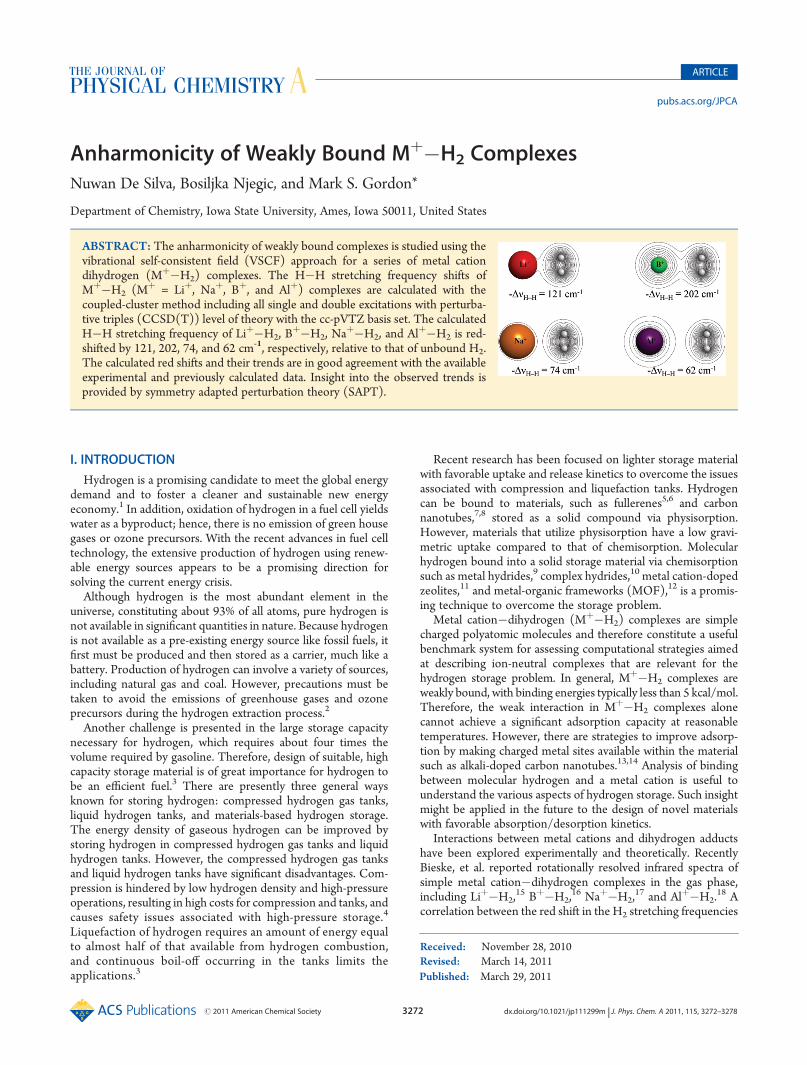
ABSTRACT: The anharmonicity of weakly bound complexes is studied using thevibrational self-consistent field (VSCF) approach for a series of metal cationdihydrogen (Mþ�H2) complexes. The H�H stretching frequency shifts ofMþ�H2 (Mþ = Liþ, Naþ, Bþ, and Alþ) complexes are calculated with thecoupled-cluster method including all single and double excitations with perturba-tive triples (CCSD(T)) level of theory with the cc-pVTZ basis set. The calculatedH�H stretching frequency of Liþ�H2, B
þ�H2, Naþ�H2, and Alþ�H2 is red-
shifted by 121, 202, 74, and 62 cm-1, respectively, relative to that of unbound H2.The calculated red shifts and their trends are in good agreement with the availableexperimental and previously calculated data. Insight into the observed trends isprovided by symmetry adapted perturbation theory (SAPT).
3273 dx.doi.org/10.1021/jp111299m |J. Phys. Chem. A 2011, 115, 3272–3278
The Journal of Physical Chemistry A ARTICLE
upon complexation (ΔνHH) and the Mþ�H2 interaction en-ergies was explored. A second paper by Bieske et al. reconsideredthe relationship between the red shift and the metal�H2
binding.19 The observed red shifts in the H�H frequencies uponmetal complexation was interpreted in terms of a charge transferfrom the H�H bonding orbital into the sp hybrid orbital of themetal cation, especially for the more polarizable Bþ and Alþ
cations. The correlation between the binding energy and ΔνHHof dihydrogen adducts with alkaline cations (Liþ, Naþ, Kþ, Rbþ)was also investigated by Vitillo et al.,11 using Hartree�Fock(HF) and second-order perturbation theory (MP2), as well asdensity functional theory (DFT) with the B3LYP functional. Alinear correlation between binding energy andΔνHH was reported.
The advent of a wide variety of high-resolution infraredspectroscopic methods facilitates more accurate probing of abroader frequency range. To accurately interpret the origin of thespectral features, computational guidance is essential. The com-putationally least demanding approach and the most commonmethod for determining vibrational frequencies is the harmonicapproximation, a normal-mode analysis based on the matrix ofsecond derivatives of the energy (Hessian). However, in general,molecular vibrations are not purely harmonic and the intrinsicanharmonicity (diagonal potential) of a particular mode oftenincreases as the frequency of the vibration decreases. Further-more, the anharmonicity of a particular mode may increase dueto coupling with other modes (coupling potential), coupling thatis ignored in the harmonic approximation. The traditionalapproach to estimate anharmonic frequencies is to use scalingfactors for the harmonic frequencies.20 Scaling the harmonicfrequencies has often worked well. However, using a single scalefactor for a great diversity of vibrational modes, ranging from thequasi-rigid vibrational motions that take place in strongly bondedmolecules to the far more extended and floppy motions thatoccur in clusters bound by weak van der Waals interactions is notadequate. Therefore, improvements beyond the harmonic ap-proximation can be important. A useful approach for predictingaccurate vibrational spectra is the vibrational self-consistent field(VSCF) method, which starts from the harmonic approximationand systematically approaches the correct anharmonic frequencies.The VSCF21�24 method has emerged in recent years as a powerfultool for accurate predictions of vibrational spectra. The VSCFmethod can be augmented by second-order perturbation theory(PT2-VSCF)25 to correct for correlation effects among the modes.
The aim of the present paper is to examine the anharmonicityassociated with the Liþ�H2, Na
þ�H2, Bþ�H2, and Alþ�H2
complexes and characterize the interaction between a hydrogenmolecule and a metal cation. The results are compared with theexperimental vibrational data, including the bond lengths, thefrequency of the H�H stretching mode, and the binding energy.An important motivation for this work is to examine, and attemptto understand, the red shifts in the H�H stretching mode (ν1) inthe Mþ�H2 complexes. The organization of the paper is asfollows. Section II describes the computational details. In sectionIII, the geometry, anharmonic frequencies, and interactionenergies of the Mþ�H2 complexes are discussed. Concludingremarks are summarized in section IV.
II. COMPUTATIONAL DETAILS
All calculations were performed using the GAMESS26,27
electronic structure code, and the molecules were visualized withMacMolPlt.28 Electronic structure calculations were performed
on Mþ�H2 (Mþ = Liþ, Naþ, Bþ, and Alþ) complexes using
coupled-cluster theory including all single and double excitationswith perturbative triples (CCSD(T))29,30 and the cc-pVTZ31
basis set. The geometry optimizations were carried out in C2v
symmetry. The CCSD(T) geometry optimizations were per-formed using numerical gradients. All stationary points are trueminima (all positive force constants).
To obtain the anharmonic frequencies, PT2-VSCF calcula-tions were carried out on the potential energy surface (PES) thatwas generated on a 16� 16 point grid, by making displacementsalong normal mode vectors expressed as a sum of simple internalcoordinate contributions.32 Cartesian normal mode displace-ment vectors are often not suitable for treating nonlinear, lowfrequency vibrational motions, such as, bending and torsion.32
Because selection of internal coordinates is not unique even in asystem as small as three atoms, two internal coordinate selections,3-bond (two M�H bonds and the H�H bond) and 2-bond-1-angle (two M�H bonds and H�M�H angle), were considered.To obtain the optimum set of coordinates, the normal modevibrational frequencies were partitioned into each internal coordi-nate according to the method described by Boatz and Gordon.33
A series of calculations were carried out in which the spacing ofthe PES grid points along each vibrational mode was system-atically increased until the diagonal frequencies converged, asdescribed in a paper by Njegic and Gordon.34While convergenceof diagonal ν1 and ν3 frequencies was achieved as expected, thediagonal potential for the antisymmetric stretch (ν2) frequencyrequires special treatment. At large displacements along the ν2mode, the three atoms of Mþ�H2 adopt close to a colinearconfiguration (due to the H�H internal rotation in the molec-ular plane). This near linearity causes a failure of the internal toCartesian coordinate transformation due to a very small deter-minant of theWilson Bmatrix35 in the iterative procedure. Whenthe internal-to-Cartesian coordinate transformation fails, thedisplacement vector that was used to generate the point that isclosest to the failed point is used to step to the next point on thePES. Because such displacement vectors are expressed in theform of Cartesian rather than internal coordinates, artificialstretching may be introduced in a similar manner as if Cartesiancoordinates VSCF were used to generate PES. If the number offailed points is small, the consequent errors may make onlynegligible contributions to the calculated VSCF frequencies.Unfortunately, for Mþ�H2, there is a large number of failedpoints generated along both diagonal and coupling potentialsinvolving the ν2 mode, whereas the number of failed points fortheν1 andν3 frequencies is zero. To address this problem, a differentapproach was used for the ν2 mode, in which the energies of thefailed points were extrapolated by a fourth order polynomial fit.
To obtain bond dissociation energies that can be related toexperiment, D0, zero point energy (ZPE) corrections have beenobtained using the anharmonic frequencies. To analyze therelationship between the Mþ�H2 binding energies and the redshifts in the H�H vibrational frequencies, symmetry adaptedperturbation theory (SAPT)36 calculations were performed foreach complex, also using the cc-pVTZ basis set. An additionalinterpretive tool is provided by the electrostatic potential (ESP)-derived MP2/cc-pVTZ atomic charges.37,38
III. RESULTS AND DISCUSSION
Molecular hydrogen adopts a C2v structure with each of thefour isovalent metal cations, Mþ (Liþ: [He]; Bþ: [He]2s2; Naþ:
3274 dx.doi.org/10.1021/jp111299m |J. Phys. Chem. A 2011, 115, 3272–3278
The Journal of Physical Chemistry A ARTICLE
[Ne]; Alþ: [Ne]3s2).11 Table 1 lists selected CCSD(T) geo-metric parameters of Mþ�H2 complexes, obtained with thecc-pVTZ basis set. The distance between Mþ and the midpointalong the H�H bond (R) increases with the size of the metalcation. The R values are obtained experimentally via vibrationallyaveraged separations (R0), whereas calculated values are equilib-rium separations (Re). As one would expect, R0 is generally largerthan Re. The H�H bond length changes (ΔrHH) are takenrelative to isolated H2, whose calculated bond distance is 0.743 Å.The Liþ�H2 and B
þ�H2 complexes have a larger ΔrHH (about0.010 Å) than the Naþ�H2 and Alþ�H2 complexes (about0.005 Å). The larger ΔrHH may be due to greater electrondelocalization of the H�H bond toward the Liþ and Bþ centersthan for Naþ and Alþ, leading to greater H�H bond weakening.These relationships are discussed in more detail below.
The threeMþ�H2 vibrational modes may be characterized bynormalmodevectors asH�Hsymmetric stretch(ν1=∼4000cm�1),Mþ�H2 antisymmetric stretch (ν2 =∼700 cm�1), andMþ�H2
symmetric stretch (ν3 = ∼400 cm�1). Choosing a coordinatesystem to use for the PES displacements plays a vital role inVSCF calculations. Choosing the most separable coordinatesystem even for triatomic molecules is not trivial. The idealcoordinate system has minimal mode�mode coupling. In someprevious rovibrational energy level calculations, the Hamiltonianwas written in Jacobi coordinates (r, R, θ) for Liþ�H2,
39
Naþ�H2,17 and Alþ�H2
18 complexes, where r is the H�Hintramolecular vector, R is the vector between Mþ and themidpoint along H�H bond, and θ is the angle between r and R.In this paper, the following three choices of coordinates forMþ�H2 complexes are considered: (1) Cartesian coordinates;
(2) twoM�H bonds and the subsumed angle (2-bond-1-angle);(3) three bonds (3-bond). Previous work has demonstrated theutility of internal coordinates for performing VSCF calculations.32,34
Boatz and Gordon33 demonstrated how to decompose normalmodes and the corresponding force constants in terms of internalcoordinates. This method can be used to help determine themost separable set of internal coordinates. For example, Table 2presents the contribution of each internal coordinate to eachnormal coordinate force constant for the Liþ�H2 complex at theCCSD(T)/cc-pVTZ level of theory. In all three normal modes,the Li�H bond distances contribute for both choices of internalcoordinates, whereas the H�H distance appears to be a moreappropriate choice than the H�Li�H angle.
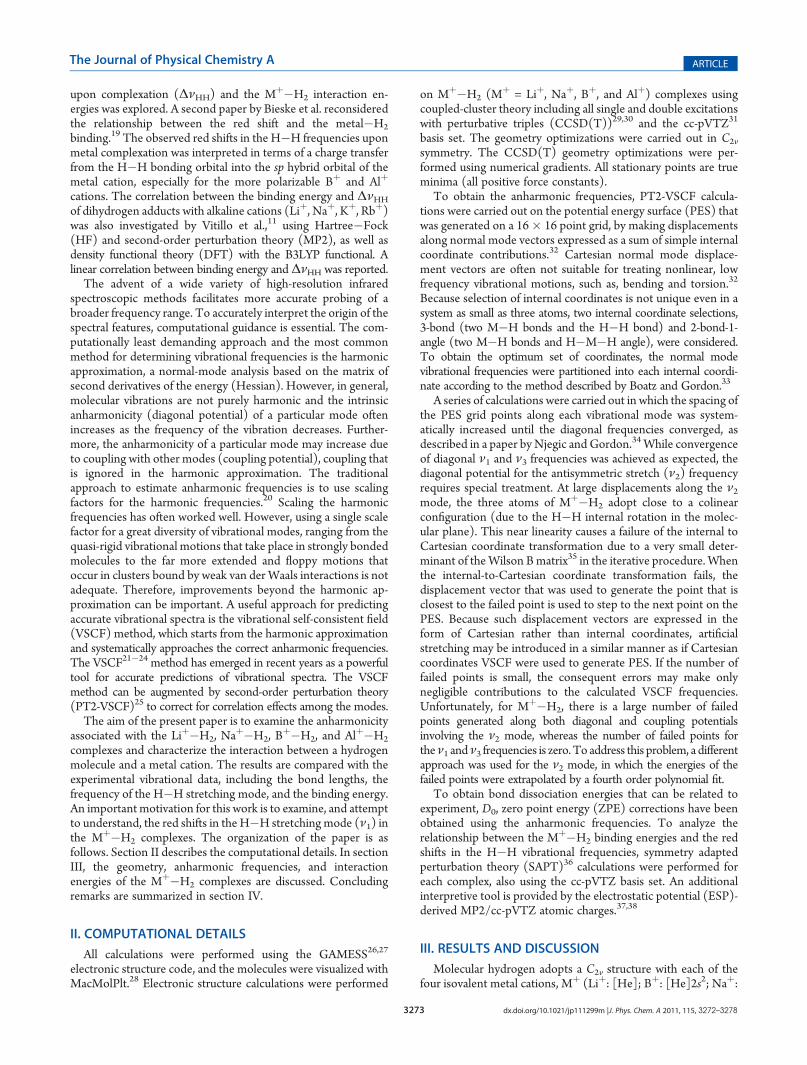
The difference between the two sets of internal coordinatesarises from the treatment of the H�H bond distance. The3-bond set of internals ensures an explicit treatment of theH�H bond length during molecular vibrations. The contribu-tion of the H�Li�H angle to the ν2 mode is zero (Table 2). InFigure 1a and b, the H�H distance is plotted as a function of the
Table 1. Selected CCSD(T) Mþ�H2 Geometric Parameters,with the cc-pVTZ Basis Set
Mþ�H2 Re (Å)a,b R0 (Å)
a,b rHH (Å) ΔrHH (Å)c
Liþ�H2 2.018 2.056d 0.751 0.008
Bþ�H2 2.242 2.262e 0.756 0.013
Naþ�H2 2.469 2.493f 0.748 0.005
Alþ�H2 2.987 3.035g 0.747 0.004aThe distance between Mþ and the midpoint along H�H bond.b Experimental values are R0; calculated values are Re.
cH�H bondlength (rHH) changes (ΔrHH) are taken relative to isolated H2. Theisolated H�H bond distance is 0.743 Å at CCSD(T) with thecc-pVTZbasis. dReference 15. eReference 16. fReference 17. gReference 18.
Table 2. The CCSD(T)/cc-pVTZ contribution of internalcoordinates to the normal coordinate force constant forLiþ�H2
Figure 1. (a)H�Hdistance plotted as a function of displacement madealong mode ν2 (Li
þ�H2 antisymmetric stretching); (b) H�H distanceplotted as a function of displacement made along mode ν3 (Li
þ�H2
symmetric stretching). The displacements are made in Cartesian(black), 3-bond internal (red) and 2-bond-1-angle internal (green)coordinates for Liþ�H2 at the CCSD(T) level of theory with the cc-pVTZ basis set (at small amplitude displacements).
3275 dx.doi.org/10.1021/jp111299m |J. Phys. Chem. A 2011, 115, 3272–3278
The Journal of Physical Chemistry A ARTICLE
displacements (at small amplitude displacements) made alongthe ν2 and ν3 modes, respectively, when Cartesian, 2-bond-1-angle and 3-bond coordinates are used to generate the diagonalPES. While both Cartesian and 2-bond-1-angle coordinates leadto changes in theH�Hdistance as displacements are made alongmode ν2, the H�H distance is preserved if 3-bond coordinatesare used. The performance of the three coordinate sets is alsoreflected in the very different values of the ν2 diagonal frequencyat amplitude ∼1100, ∼1100, ∼800 cm�1 for the Cartesian,2-bond-1-angle, and 3-bond coordinates, respectively. Impor-tantly, any errors that are made in the diagonal potential (forexample, by using inappropriate coordinates) will be propagatedinto the coupling potential, and this will be reflected in errors inthe predicted anharmonic frequencies. Both Cartesian and3-bond coordinates preserve the H�Hdistance as displacementsare made along mode ν3, while the 2-bond-1-angle coordinatechoice leads to changes in the H�H distance (Figure 1b).
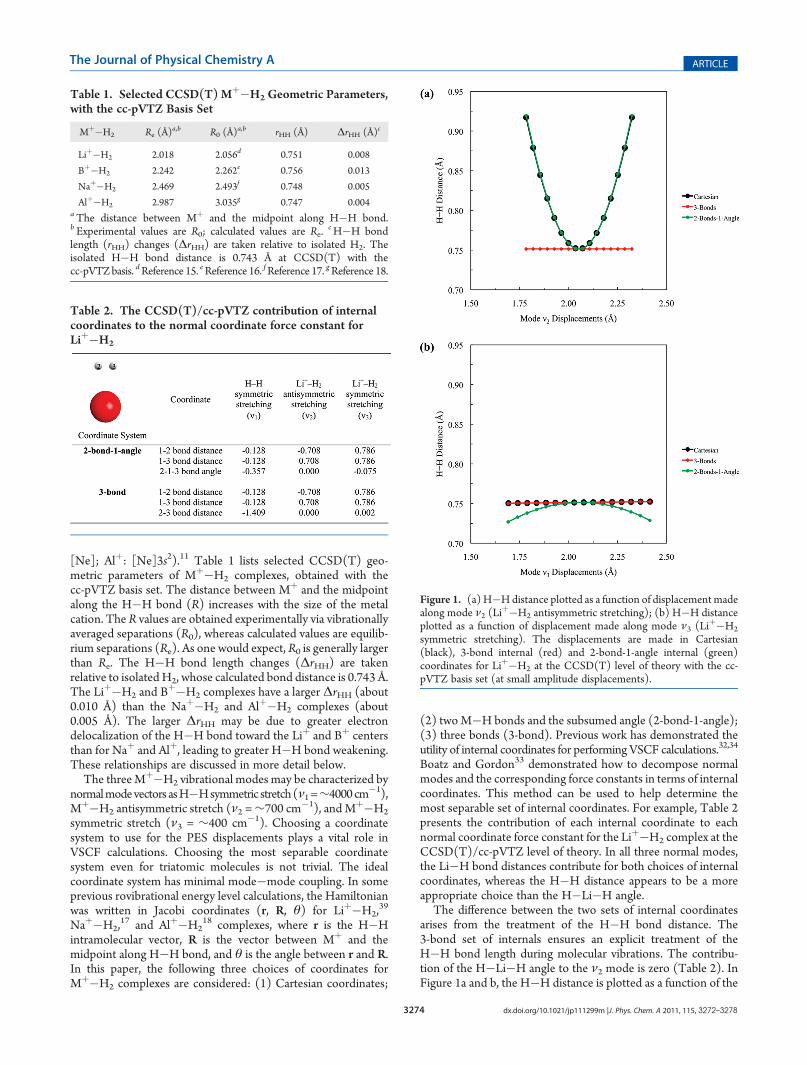
Figure 2 shows vectors associated with the three types ofvibrational motion exhibited by the M�H2
þ molecules. Whilethe ν1 and ν3 modes can be described as linear displacements, theν2 mode vectors show strikingly different types of motion,depending on whether they are expressed in terms of 2-bond-1-angle (Figure 2a) or 3-bond (Figure 2b). While the ν2
antisymmetric stretch can be described as linear displacementsalong the bonds when the 2-bond-1-angle internal coordinatesare used, one sees the in-plane internal rotation noted earlierwhen the 3-bond internal coordinates are used. The 3-bondcoordinate system ensures maximum separation of all threemodes and thus is used in all subsequent calculations ofmolecular vibrations.
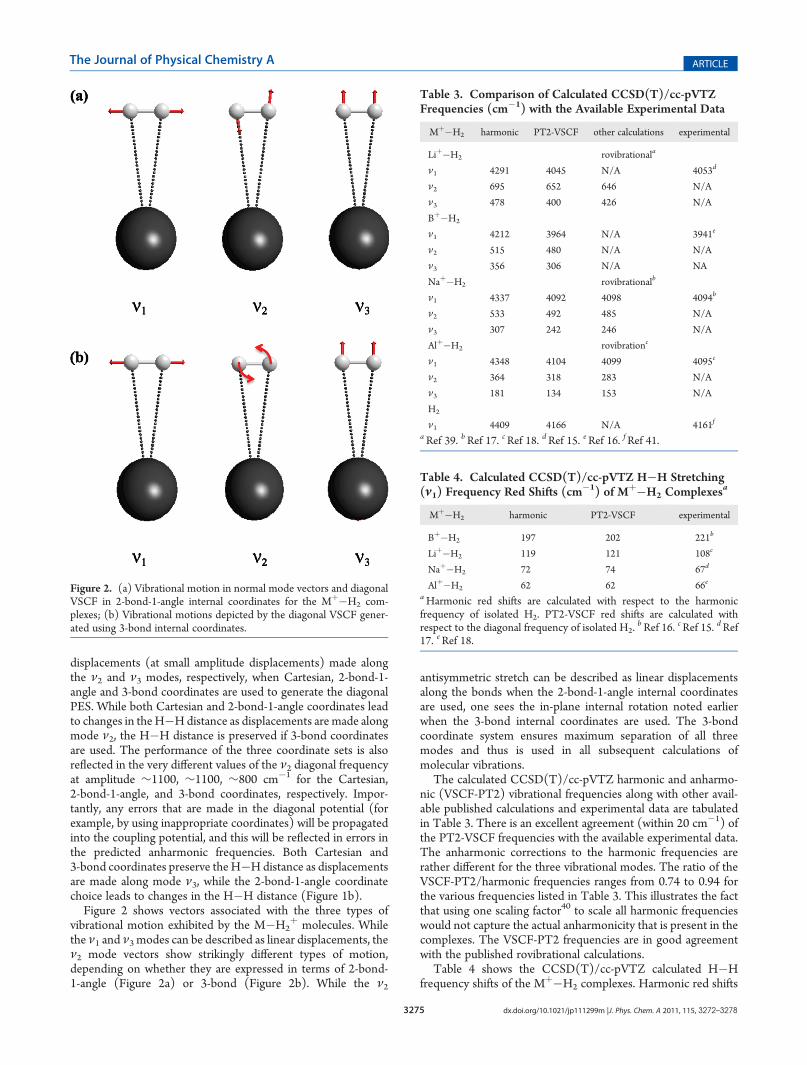
The calculated CCSD(T)/cc-pVTZ harmonic and anharmo-nic (VSCF-PT2) vibrational frequencies along with other avail-able published calculations and experimental data are tabulatedin Table 3. There is an excellent agreement (within 20 cm�1) ofthe PT2-VSCF frequencies with the available experimental data.The anharmonic corrections to the harmonic frequencies arerather different for the three vibrational modes. The ratio of theVSCF-PT2/harmonic frequencies ranges from 0.74 to 0.94 forthe various frequencies listed in Table 3. This illustrates the factthat using one scaling factor40 to scale all harmonic frequencieswould not capture the actual anharmonicity that is present in thecomplexes. The VSCF-PT2 frequencies are in good agreementwith the published rovibrational calculations.
Table 4 shows the CCSD(T)/cc-pVTZ calculated H�Hfrequency shifts of the Mþ�H2 complexes. Harmonic red shifts
Figure 2. (a) Vibrational motion in normal mode vectors and diagonalVSCF in 2-bond-1-angle internal coordinates for the Mþ�H2 com-plexes; (b) Vibrational motions depicted by the diagonal VSCF gener-ated using 3-bond internal coordinates.
Table 3. Comparison of Calculated CCSD(T)/cc-pVTZFrequencies (cm�1) with the Available Experimental Data
Mþ�H2 harmonic PT2-VSCF other calculations experimental
Liþ�H2 rovibrationala
ν1 4291 4045 N/A 4053d
ν2 695 652 646 N/A
ν3 478 400 426 N/A
Bþ�H2
ν1 4212 3964 N/A 3941e
ν2 515 480 N/A N/A
ν3 356 306 N/A NA
Naþ�H2 rovibrationalb
ν1 4337 4092 4098 4094b
ν2 533 492 485 N/A
ν3 307 242 246 N/A
Alþ�H2 rovibrationc
ν1 4348 4104 4099 4095c
ν2 364 318 283 N/A
ν3 181 134 153 N/A
H2
ν1 4409 4166 N/A 4161f
aRef 39. bRef 17. cRef 18. dRef 15. eRef 16. fRef 41.
Table 4. Calculated CCSD(T)/cc-pVTZ H�H Stretching(ν1) Frequency Red Shifts (cm�1) of Mþ�H2 Complexesa
Mþ�H2 harmonic PT2-VSCF experimental
Bþ�H2 197 202 221b
Liþ�H2 119 121 108c
Naþ�H2 72 74 67d
Alþ�H2 62 62 66e
aHarmonic red shifts are calculated with respect to the harmonicfrequency of isolated H2. PT2-VSCF red shifts are calculated withrespect to the diagonal frequency of isolated H2.
bRef 16. cRef 15. dRef17. eRef 18.

3276 dx.doi.org/10.1021/jp111299m |J. Phys. Chem. A 2011, 115, 3272–3278
The Journal of Physical Chemistry A ARTICLE
are calculated with respect to the harmonic frequencies ofisolated H2. The PT2-VSCF red shifts are calculated withrespect to the diagonal frequencies of isolated H2. Theexperimental H�H stretching frequency of molecular H2 is4161.17 cm�1.41 The VSCF-PT2 frequencies capture thetrends in the experimental red shifts both qualitatively andquantitatively.
The binding energies (De) of the Mþ�H2 complexes arecalculated as De = [total energy (Mþ and H2 fragments)] �[total energy (Mþ�H2 complex)]. The ZPE-corrected bindingenthalpy (D0) is the sum of De and ΔZPE. The CCSD(T)/cc-pVTZ Mþ�H2 binding energies are given in Table 5. Theoryand experiment are in good agreement, with errors in thecalculated values in the range of 0.3 to 0.6 kcal/mol, well belowchemical accuracy (∼1 kcal/mol). The trend in binding energiesis also captured, with the binding energies in the order Li > B >Na > Al. H2 binds weakly to these cations, with the CCSD(T)D0
ranging from 0.93 to 4.48 kcal/mol.The values of D0 and R follow the expected inverse relation-
ship, as theD0 values increase nearly linearly as theR values of theMþ�H2 complexes decrease, as shown in Figure 3. TheM
þ�H2
symmetric stretching frequencies, ν3, are linearly correlated withD0 as shown in Figure 4. This is to be expected, as the ν3 mode isthe one that leads to the dissociation of the Mþ�H2 complexinto H2 molecule and a metal cation.
Based on the binding energies, one might predict the red shiftassociated with the H�H stretching frequency to be in the orderLiþ�H2 > Bþ�H2 > Naþ�H2 > Alþ�H2, because this is theorder in which the Mþ�H bond energy decreases. That is, onemight expect a concomitant decrease in the H�H bond energyand frequency based on common bond distance�bond energyrelationships. However, as shown in Table 4 and in Figure 5, theobserved red shifts are in the order Bþ�H2 > Liþ�H2 >Naþ�H2 > Alþ�H2. The main disagreement between the redshifts and the binding energies occurs for Liþ versus Bþ. Inaddition, the red shifts induced by Naþ versus Alþ are much
Table 5. CCSD(T) ZPE-Corrected Binding Energy (D0) inkcal/mol for the Mþ�H2 Complexes with cc-pVTZ Basis Set
Liþ�H2 Bþ�H2 Naþ�H2 Alþ�H2
De 5.81 4.02 3.04 1.49
ΔZPE 1.33 0.83 0.94 0.56
D0 4.48 3.19 2.09 0.93
experimental D0 4.79a 3.8 ( 0.2b 2.45 ( 0.2c 1.35 ( 0.15d
a From rovibrational calculations.42 bRef 43. cRef 44. dRef 45.
Figure 3. Graph of distance betweenMþ and themidpoint alongH�Hbond (R) vs the ZPE-corrected binding energy (D0) for Li
þ�H2 (red),Bþ�H2 (green), Naþ�H2 (yellow), and Alþ�H2 (purple). Thecalculated values at the CCSD(T) level of theory with cc-pVTZ basisset are displayed in circles, and the experimental values are displayed incrosses. The binding energies (De) of the Mþ�H2 complexes arecalculated as follows: De = [total energy (Mþ and H2 fragments)] �[total energy (Mþ�H2 molecule)].
Figure 4. Graph ofMþ�H2 symmetric stretching frequency (ν3) vs theZPE-corrected binding energy (D0) for Li
þ�H2 (red), Bþ�H2 (green),
Naþ�H2 (yellow), and Alþ�H2 (purple) complexes computed atCCSD(T) level of theory with cc-pVTZ basis set. The binding energies(De) of the M
þ�H2 complexes are calculated as follows: De = [totalenergy (Mþ and H2 fragments)]� [total energy (Mþ�H2 molecule)].The zero-point energy corrections (ΔZPE) are calculated using PT2-VSCF frequencies. The ZPE-corrected binding energy (D0) is given asthe sum of De and ΔZPE.
Figure 5. Graph of CCSD(T)/cc-pVTZ H�H stretching frequencyred shifts (�ΔνH�H) vs the ZPE-corrected binding energy (D0) forLiþ�H2 (red), Bþ�H2 (green), Naþ�H2 (yellow), and Alþ�H2
(purple) complexes. The calculated values are displayed in circles andthe experimental values are displayed in crosses.
3277 dx.doi.org/10.1021/jp111299m |J. Phys. Chem. A 2011, 115, 3272–3278
The Journal of Physical Chemistry A ARTICLE
closer to each other than would be predicted based on thecorresponding binding energies.
In an attempt to understand the relationship between theobserved metal�H2 binding energies and the red shifts inthe H�H frequencies that are observed upon complexation,the symmetry adapted perturbation theory (SAPT) method thatwas developed by Jeziorski, Szalewicz, and co-workers36 isemployed as an appealing interpretive tool. The SAPT methodis based on many body perturbation theory and is thereforeexpected to provide relative energies that are as accurate asCCSD(T).
The SAPT total interaction energies and the correspondingcomponents for the four complexes of interest here are summar-ized in Table 6. For convenience, the CCSD(T) binding energies(excluding zero point vibrational corrections) and H�H redshifts are included in this table as well. First, note that the totalSAPT interaction energies are in very good agreement with theCCSD(T) binding energies. This lends credence to employingthe SAPT energy decomposition. Now, note that each of theattractive terms in Table 6, those that contribute to bondinginteractions (Coulomb, induction, dispersion, and charge trans-fer), demonstrate the same trend as do the red shifts in the H�Hfrequencies, not the trend followed by the M�H bindingenergies. That is, those interactions that one would conceptuallyassociate with binding demonstrate the expected relationshipwith the weakening of the H�H bond. The fact that the chargetransfer essentially follows the same trend (except for the verysmall values of Na and Al) supports the conjecture by Bieske andco-workers regarding the role of charge transfer. However,charge transfer is certainly not the whole or even the mostimportant part of the story, because the largest contribution tobinding of each metal to H2 comes from the induction interac-tion. The sum of the four attractive contributions, labeled “totalattraction” in Table 6, follows the same trend as the H�Hfrequency red shifts.
On the other hand, the repulsive terms, dominated by theexchange repulsion, are much larger for B than for the othermetals. These repulsive terms more than counter balance the
attractive terms that favor B over Li for binding to H2. So, as isusually the case, the net binding is a balance between attractiveand repulsive contributions, and in this case, the balance results instronger net binding of H2 to Li than to B.
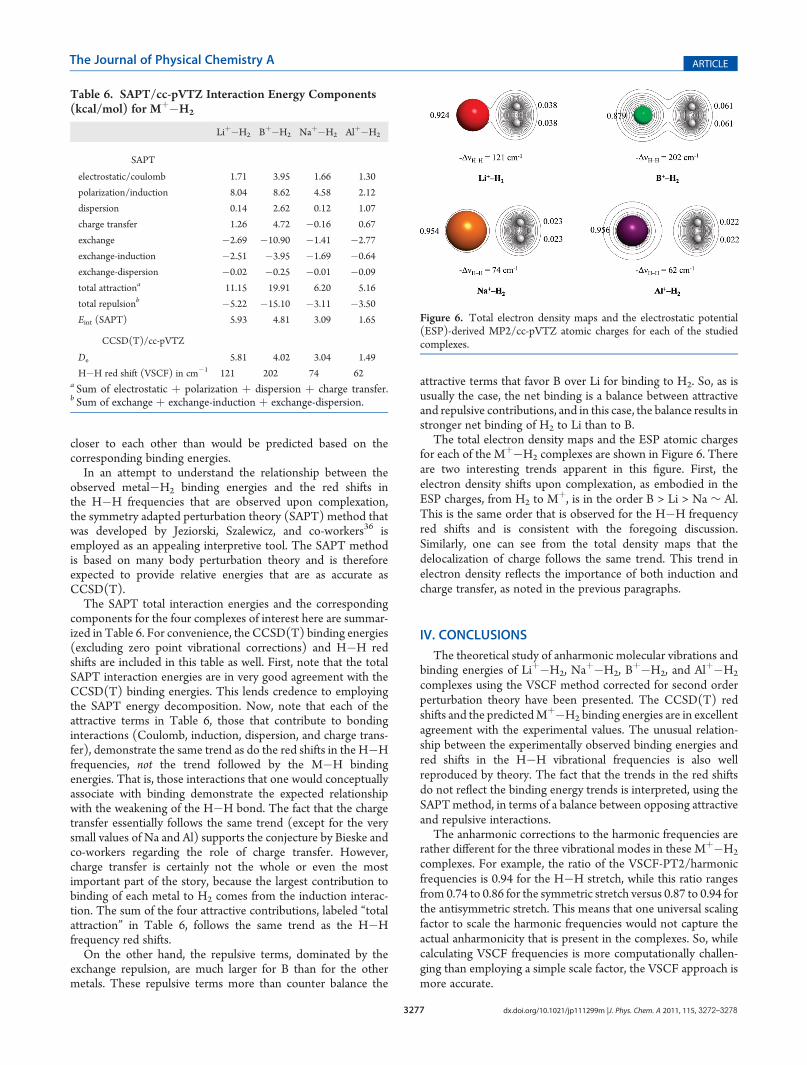
The total electron density maps and the ESP atomic chargesfor each of the Mþ�H2 complexes are shown in Figure 6. Thereare two interesting trends apparent in this figure. First, theelectron density shifts upon complexation, as embodied in theESP charges, from H2 to Mþ, is in the order B > Li > Na ∼ Al.This is the same order that is observed for the H�H frequencyred shifts and is consistent with the foregoing discussion.Similarly, one can see from the total density maps that thedelocalization of charge follows the same trend. This trend inelectron density reflects the importance of both induction andcharge transfer, as noted in the previous paragraphs.
IV. CONCLUSIONS
The theoretical study of anharmonic molecular vibrations andbinding energies of Liþ�H2, Na
þ�H2, Bþ�H2, and Alþ�H2
complexes using the VSCF method corrected for second orderperturbation theory have been presented. The CCSD(T) redshifts and the predictedMþ�H2 binding energies are in excellentagreement with the experimental values. The unusual relation-ship between the experimentally observed binding energies andred shifts in the H�H vibrational frequencies is also wellreproduced by theory. The fact that the trends in the red shiftsdo not reflect the binding energy trends is interpreted, using theSAPTmethod, in terms of a balance between opposing attractiveand repulsive interactions.
The anharmonic corrections to the harmonic frequencies arerather different for the three vibrational modes in these Mþ�H2
complexes. For example, the ratio of the VSCF-PT2/harmonicfrequencies is 0.94 for the H�H stretch, while this ratio rangesfrom 0.74 to 0.86 for the symmetric stretch versus 0.87 to 0.94 forthe antisymmetric stretch. This means that one universal scalingfactor to scale the harmonic frequencies would not capture theactual anharmonicity that is present in the complexes. So, whilecalculating VSCF frequencies is more computationally challen-ging than employing a simple scale factor, the VSCF approach ismore accurate.
Table 6. SAPT/cc-pVTZ Interaction Energy Components(kcal/mol) for Mþ�H2
Liþ�H2 Bþ�H2 Naþ�H2 Alþ�H2
SAPT
electrostatic/coulomb 1.71 3.95 1.66 1.30
polarization/induction 8.04 8.62 4.58 2.12
dispersion 0.14 2.62 0.12 1.07
charge transfer 1.26 4.72 �0.16 0.67
exchange �2.69 �10.90 �1.41 �2.77
exchange-induction �2.51 �3.95 �1.69 �0.64
exchange-dispersion �0.02 �0.25 �0.01 �0.09
total attractiona 11.15 19.91 6.20 5.16
total repulsionb �5.22 �15.10 �3.11 �3.50
Eint (SAPT) 5.93 4.81 3.09 1.65
CCSD(T)/cc-pVTZ
De 5.81 4.02 3.04 1.49
H�H red shift (VSCF) in cm�1 121 202 74 62a Sum of electrostatic þ polarization þ dispersion þ charge transfer.b Sum of exchange þ exchange-induction þ exchange-dispersion.
Figure 6. Total electron density maps and the electrostatic potential(ESP)-derived MP2/cc-pVTZ atomic charges for each of the studiedcomplexes.

3278 dx.doi.org/10.1021/jp111299m |J. Phys. Chem. A 2011, 115, 3272–3278
The Journal of Physical Chemistry A ARTICLE
’AUTHOR INFORMATION
Corresponding Author*E-mail: [email protected].
’ACKNOWLEDGMENT
This work was supported by a National Science FoundationPetascale Applications Grant.
’REFERENCES
(1) Service, R. F. Science 2004, 305, 958.(2) Schultz, M. G.; Diehl, T.; Brasseur, G. P.; Zittel, W. Science 2003,
302, 624.(3) Schlapbach, L.; Zuttel, A. Nature 2001, 414, 353.(4) Zhou, L. Renewable Sustainable Energy Rev. 2005, 9, 395.(5) Kim, Y. H.; Zhao, Y. F.; Williamson, A.; Heben, M. J.; Zhang,
S. B. Phys. Rev. Lett. 2006, 96, 016102.(6) Liu, Y.; Brown, C. M.; Blackburn, J. L.; Neumann, D. A.;
Gennett, T.; Simpson, L.; Parilla, P.; Dillon, A. C.; Heben, M. J. AlloysCompd. 2007, 446, 368.(7) Fakioglu, E.; Yurum, Y.; Veziroglu, T. N. Int. J. Hydrogen Energy
2004, 29, 1371.(8) Tang, C. C.; Bando, Y.; Ding, X. X.; Qi, S. R.; Golberg, D. J. Am.
Chem. Soc. 2002, 124, 14550.(9) Grochala, W.; Edwards, P. P. Chem. Rev. 2004, 104, 1283.(10) Orimo, S. I.; Nakamori, Y.; Eliseo, J. R.; Zuttel, A.; Jensen, C.M.
Chem. Rev. 2007, 107, 4111.(11) Vitillo, J. G.; Damin, A.; Zecchina, A.; Ricchiardi, G. J. Chem.
Phys. 2005, 122, 114311.(12) Mulder, F.M.; Dingemans, T. J.; Schimmel, H. G.; Ramirez-Cuesta,
A. J.; Kearley, G. J. Chem. Phys. 2008, 351, 72.(13) Chen, P.; Wu, X.; Lin, J.; Tan, K. L. Science 1999, 285, 91.(14) Yang, R. T. Carbon 2000, 38, 623.(15) Emmeluth, C.; Poad, B. L. J.; Thompson, C. D.; Weddle, G. H.;
Bieske, E. J. J. Chem. Phys. 2007, 126, 204309.(16) Dryza, V.; Poad, B. L. J.; Bieske, E. J. J. Am. Chem. Soc. 2008,
130, 12986.(17) Poad, B. L. J.; Wearne, P. J.; Bieske, E. J.; Buchachenko, A. A.;
Bennett, D. I. G.; Klos, J.; Alexander, M. H. J. Chem. Phys. 2008,129, 184306.(18) Emmeluth, C.; Poad, B. L. J.; Thompson, C. D.; Weddle, G.;
Bieske, E. J.; Buchachenko, A. A.; Grinev, T. A.; Klos, J. J. Chem. Phys.2007, 127, 164310.(19) Dryza, V.; Poad, B. L. J.; Bieske, E. J. J. Phys. Chem. A 2009,
113, 6044.(20) Pople, J. A.; Scott, A. P.; Wong, M. W.; Radom, L. Isr. J. Chem.
1993, 33, 345.(21) Chaban, G. M.; Jung, J. O.; Gerber, R. B. J. Chem. Phys. 1999,
111, 1823.(22) Yagi, K.; Taketsugu, T.; Hirao, K.; Gordon, M. S. J. Chem. Phys.
2000, 113, 1005.(23) Yagi, K.; Hirao, K.; Taketsugu, T.; Schmidt, M. W.; Gordon,
M. S. J. Chem. Phys. 2004, 121, 1383.(24) Matsunaga, N.; Chaban, G. M.; Gerber, R. B. J. Chem. Phys.
2002, 117, 3541.(25) Jung, J. O.; Gerber, R. B. J. Chem. Phys. 1996, 105, 10332.(26) Gordon, M. S.; Schmidt, M. W. Theory and Applications of
Computational Chemistry: The First Forty Years; Elsevier: Amsterdam,The Netherlands, 2005.(27) Schmidt, M. W.; Baldridge, K. K.; Boatz, J. A.; Elbert, S. T.;
Gordon, M. S.; Jensen, J. H.; Koseki, S.; Matsunaga, N.; Nguyen, K. A.;Su, S. J.; Windus, T. L.; Dupuis, M.; Montgomery, J. A. J. Comput. Chem.1993, 14, 1347.(28) Bode, B.M.; Gordon,M. S. J. Mol. Graph. Modell. 1998, 16, 133.(29) Piecuch, P.; Kucharski, S. A.; Kowalski, K.; Musial, M. Comput.
Phys. Commun. 2002, 149, 71.
(30) Raghavachari, K.; Trucks, G.W.; Pople, J. A.; Head-Gordon, M.Chem. Phys. Lett. 1989, 157, 479.
(31) Dunning, T. H. J. Chem. Phys. 1989, 90, 1007.(32) Njegic, B.; Gordon, M. S. J. Chem. Phys. 2006, 125, 224102.(33) Boatz, J. A.; Gordon, M. S. J. Phys. Chem. 1989, 93, 1819.(34) Njegic, B.; Gordon, M. S. J. Chem. Phys. 2008, 129, 164107.(35) Wilson, E. B., Jr.; Decius, J. C.; Cross, P. C.Molecular Vibrations:
The Theory of Infrared and Raman Vibrational Spectra; Dover Publica-tions, Inc.: New York, 1955.
(36) Jeziorski, B.; Moszynski, R.; Szalewicz, K. Chem. Rev. 1994,94, 1887.
(37) Singh, U. C.; Kollman, P. A. J. Comput. Chem. 1984, 5, 129.(38) Bayly, C. I.; Cieplak, P.; Cornell, W. D.; Kollman, P. A. J. Phys.
Chem. 1993, 97, 10269.(39) Sanz, C.; Bodo, E.; Gianturco, F. A.Chem. Phys. 2005, 314, 135.(40) Scott, A. P.; Radom, L. J. Phys. Chem. 1996, 100, 16502.(41) Bragg, S. L.; Brault, J. W.; Smith, W. H. Astrophys. J. 1982,
263, 999.(42) Kraemer, W. P.; Spirko, V. Chem. Phys. 2006, 330, 190.(43) Kemper, P. R.; Bushnell, J. E.; Weis, P.; Bowers, M. T. J. Am.
Chem. Soc. 1998, 120, 7577.(44) Bushnell, J. E.; Kemper, P. R.; Bowers, M. T. J. Phys. Chem.
1994, 98, 2044.(45) Kemper, P. R.; Bushnell, J.; Bowers, M. T.; Gellene, G. I. J. Phys.
Chem. A 1998, 102, 8590.
Copyright © 2022 FDOKUMEN