Continuous function decay analysis of a multisite impurity activated solid
10
15 November 1998 Ž . Optics Communications 156 1998 409–418 Full length article Continuous function decay analysis of a multisite impurity activated solid Marek Grinberg a,1 , D.L. Russell b , Keith Holliday b, ) , K. Wisniewski c , Cz. Koepke c a Institute of Experimental Physics, UniÕersity of Gdansk, Wita Stwosza 57, 80-952 Gdansk, Poland ˜ ˜ b Optical Materials Research Centre, Department of Physics and Applied Physics, UniÕersity of Strathclyde, ColÕille Building, North Portland Street, Glasgow G1 1XN, UK c Institute of Physics, N. Copernicus UniÕersity, 87-100 Torun, Poland ˜ Received 30 April 1998; revised 17 August 1998; accepted 18 August 1998 Abstract The technique of continuous function decay analysis, previously used in studies of molecular dynamics, is applied to a solid that is optically activated through impurity doping. Chromium ions occupy several different sites in gahnite glass ceramics, each of which has different luminescence lifetime characteristics but overlapping absorption and emission spectra. Continuous function decay analysis maps the decay patterns of the decaying species, producing histograms of the relative Ž . strengths of decay at in this case 125 logarithmically spaced lifetimes. The results for chromium ions in gahnite glass ceramics are related to the interaction between the impurity ions and the solid state environment and correlate well with previous studies of this material that have used standard techniques. Continuous function decay analysis is thus shown to be an effective method for understanding the optical behaviour of multisite materials. q 1998 Elsevier Science B.V. All rights reserved. Keywords: Continuous function decay analysis; Impurity doping; Multisite material 1. Introduction This paper presents the application of a technique previously used in studies of molecular dynamics to study the decay of a multisite optically activated solid. When materials contain optically active species that occupy more than one site it is often difficult to determine site occupan- cies and dynamics due to the overlap of absorption and luminescence spectra. Time resolved spectroscopy can oc- casionally help to resolve some of the site dependent structure but when the number of centres increases beyond ) Corresponding author. E-mail: [email protected] 1 E-mail: [email protected] two or when one of the sites consists of a continuous Ž distribution of environment parameters crystal field pa- . rameters for a solid a new method is required. Here the technique of continuous decay analysis is presented. This allows simple luminescence decays to be broken down into a large number of contributions at different lifetimes. In the case presented here, decay curves of chromium ions in gahnite glass ceramics are decomposed into histograms showing the contributions of 125 logarithmically spaced lifetimes to the overall decay. These decays are shown to correspond very well to the known properties of the mate- rial and, such is the aptitude of the technique, new conclu- sions can also be drawn. Gahnite glasses are composed of a mixture of oxide compounds, principally SiO and Al O but with concen- 2 2 3 0030-4018r98r$ - see front matter q 1998 Elsevier Science B.V. All rights reserved. Ž . PII: S0030-4018 98 00463-5
-
Upload
independent -
Category
Documents
-
view
3 -
download
0
Transcript of Continuous function decay analysis of a multisite impurity activated solid

15 November 1998
Ž .Optics Communications 156 1998 409–418
Full length article
Continuous function decay analysisof a multisite impurity activated solid
Marek Grinberg a,1, D.L. Russell b, Keith Holliday b,), K. Wisniewski c,Cz. Koepke c
a Institute of Experimental Physics, UniÕersity of Gdansk, Wita Stwosza 57, 80-952 Gdansk, Poland˜ ˜b Optical Materials Research Centre, Department of Physics and Applied Physics, UniÕersity of Strathclyde,
ColÕille Building, North Portland Street, Glasgow G1 1XN, UKc Institute of Physics, N. Copernicus UniÕersity, 87-100 Torun, Poland˜
Received 30 April 1998; revised 17 August 1998; accepted 18 August 1998
Abstract
The technique of continuous function decay analysis, previously used in studies of molecular dynamics, is applied to asolid that is optically activated through impurity doping. Chromium ions occupy several different sites in gahnite glassceramics, each of which has different luminescence lifetime characteristics but overlapping absorption and emission spectra.Continuous function decay analysis maps the decay patterns of the decaying species, producing histograms of the relative
Ž .strengths of decay at in this case 125 logarithmically spaced lifetimes. The results for chromium ions in gahnite glassceramics are related to the interaction between the impurity ions and the solid state environment and correlate well withprevious studies of this material that have used standard techniques. Continuous function decay analysis is thus shown to bean effective method for understanding the optical behaviour of multisite materials. q 1998 Elsevier Science B.V. All rightsreserved.
Keywords: Continuous function decay analysis; Impurity doping; Multisite material
1. Introduction
This paper presents the application of a techniquepreviously used in studies of molecular dynamics to studythe decay of a multisite optically activated solid. Whenmaterials contain optically active species that occupy morethan one site it is often difficult to determine site occupan-cies and dynamics due to the overlap of absorption andluminescence spectra. Time resolved spectroscopy can oc-casionally help to resolve some of the site dependentstructure but when the number of centres increases beyond
) Corresponding author. E-mail: [email protected] E-mail: [email protected]
two or when one of the sites consists of a continuousŽdistribution of environment parameters crystal field pa-
.rameters for a solid a new method is required. Here thetechnique of continuous decay analysis is presented. Thisallows simple luminescence decays to be broken down intoa large number of contributions at different lifetimes. Inthe case presented here, decay curves of chromium ions ingahnite glass ceramics are decomposed into histogramsshowing the contributions of 125 logarithmically spacedlifetimes to the overall decay. These decays are shown tocorrespond very well to the known properties of the mate-rial and, such is the aptitude of the technique, new conclu-sions can also be drawn.
Gahnite glasses are composed of a mixture of oxidecompounds, principally SiO and Al O but with concen-2 2 3
0030-4018r98r$ - see front matter q 1998 Elsevier Science B.V. All rights reserved.Ž .PII: S0030-4018 98 00463-5

( )M. Grinberg et al.rOptics Communications 156 1998 409–418410
trations of up to 10% of ZnO, Li O, TiO , ZrO and2 2 2
As O . Heat treatment produces gahnite glass ceramics,2 3
which include various crystal phases. The duration of theheat treatment determines the degree and type of crystalli-sation as evidenced by the effects on the luminescencespectra of Cr3q ions included in the structure as impuritiesw x1 . Long term heat treatment results in the majority of theCr 3q ions being incorporated in crystallites of ZnAl O2 4
with sizes of around 30 nm. This is confirmed by thesimilarity of Cr3q luminescence spectra of such ceramics
w xto the bulk spinel crystal 2,3 . Shorter periods of heattreatment produce some crystallites of ZnAl O but also2 4
w x 3qother crystalline phases 1 . Cr impurity ions in bothcrystalline phases luminesce via vibronically structured2E™
4A transitions. The luminescence spectrum of the2
untreated Cr 3q-doped glass is much broader and smoother,characteristic of 4T ™
4A emission.2 2
The gahnite glass ceramic used in this study has inter-mediate crystallinity as can be seen from luminescence
Ž .spectra excited at different wavelengths Fig. 1 . Whenexcited in the middle of the 4A ™
4T absorption band the2 2
sample luminescence shows the characteristic structure of3q Ž .Cr in spinel hosts 686–725 nm as well as features
Žassociated with the other crystalline phase ;690–750. w xnm , thought to be virgilite 1,4 . As the excitation energy
is reduced, the contribution of the crystalline phases to theluminescence spectrum reduces and a broad, smooth spec-trum becomes dominant. This corresponds to Cr 3q ionsdecaying via the 4T ™
4A transition which must occupy2 2
a third phase of the sample, corresponding to the puregahnite glass.
The multisite nature of the ceramic can immediately beidentified by considering Fig. 1a, in particular by consider-ing the 4A ™
4T absorption band at wavelengths longer2 2
than about 470 nm. The absorption spectrum of the ce-ramic appears to be composed of components from thecrystalline phases, represented by the R-line excitationspectrum, and the glassy phase, represented by the absorp-tion spectrum of the glass. The 4A ™
4T absorption band2 2
of the Cr 3q ions in the glassy phase is shifted to lowerenergy relative to those in the crystalline phases. That theshift is large can be immediately seen by inspecting thesamples; the glass is green whereas the ceramic is red. TheR-line at 686 nm and the sharp sideband structure arebarely apparent when the system is excited at wavelengthslonger than about 590 nm because the glassy phase hasmuch stronger absorption at these wavelengths.
The luminescence lifetime of Cr3q ions in spinel crys-w xtals is around 30 ms at low temperatures 3 whereas the
other crystalline phase has been shown to decay morew x 4rapidly using time-resolved measurements 1,5 . The T2
™4A transition always has a shorter lifetime than 2E™2
4A transitions and so three quite different lifetimes can be2Žexpected to dominate the behaviour of this sample in fact,
.it will be shown that a fourth centre also contributes .Different combinations of lifetimes will dominate depend-
Ž .Fig. 1. a Absorption, excitation and luminescence spectra of theCr 3q-doped gahnite materials measured at 10 K. Absorption
w xspectra are shown as dashed lines for the glass g and the glassw xceramic g–c . Above the absorption spectra, the excitation spectra
for the same samples are indicated by solid lines. The Fanoanti-resonance between the 4 T and 2 E states is indicated by FA2
for the glass. It is not resonant with the R line of the emissionfrom the Cr 3q ions in the spinel phase of the glass ceramic as canbe seen in the luminescence spectrum excited at 488 nm, alsodrawn using a solid line above. Two other emission spectra are
Ž .shown, excited at 540 nm and 590 nm as indicated. b The threeŽ .luminescence spectra of the glass ceramic, as shown in a , on a
larger scale. The R and N lines are indicated. All spectra were1
excited by a dye laser providing constant excitation power. Theluminescence was dispersed by a 0.5 m monochromator, detectedby a germanium detector and corrected for instrumental response.
ing on the combination of excitation energy, detectionwavelength and sample temperature but the decay wouldrarely be expected to be a single exponential.
This paper is mainly concerned with the analysis ofluminescence kinetics, the purpose being to show that the
( )M. Grinberg et al.rOptics Communications 156 1998 409–418 411
technique of continuous decay analysis can be applied tosolids. This technique is used to estimate the number ofdifferent contributions to the luminescence decay and torelate them to various chromium sites or other emissioncentres.
2. Luminescence decay analysis
In studying radiative processes in Cr3q impurity ions itis necessary to consider the effect of breaking the spin-selection rule. Depending on the strength of the localcrystal field, the first excited state of the Cr3q ion is either2 Ž . 4 Ž .E strong field or T weak field . Since the ground2
state is always 4A , the doublet 2E is a metastable state in2
strong field sites with the spin-forbidden 2E™4A transi-2
tion yielding narrow R-line luminescence mainly due tothe spin–orbit interaction which mixes the 2E and 4T2
w xstates 6–10 . It has been found that this mixing is relatedto the energy separation between the doublet and quartetstates, and to the electron–lattice coupling of the 4T state2w x11 . Since both quantities depend on the crystal fieldstrength and nearest neighbour arrangement, there is a siteto site variation and this yields a distribution of the radia-tive lifetime. Ions in weak field sites decay via the muchstronger 4T ™
4A spin-allowed transition leading to con-2 2
siderably shorter radiative lifetimes.Several factors influence luminescence decay. For par-
ity forbidden electric dipole radiative transitions, localcrystal field symmetry is important but, in many cases,non-radiative processes compete with radiative relaxation.Donor–acceptor energy transfer, multiphonon processesand internal conversion transitions are all examples of suchnon-radiative processes and all prevent the total lumines-cence decay from having a single exponential form.
The luminescence detected is a superposition of theemission from all the emitting centres. Independent of theprocesses that influence the relaxation, the intensity of theluminescence from each individual site, i, excited at timets0, is given by
P tŽ .iI t s 1Ž . Ž .i
t i ,rad
Ž .where t is the radiative lifetime of the centre and P ti,rad i
is the probability of finding the ith centre in the excitedstate at time t. This is a solution of the master equationw x12 :
d P Pi is w k™ i P y w i™k p yŽ . Ž .Ý Ýik k ki id t t i ,radk/ i k
2Ž .Ž . Ž . Ž .In Eq. 2 , w k™ i and w i™k denote the non-ik ki
radiative transfer rates describing intercentre excitationŽ .exchange. In the second sum the rate for ks i, w i™ iii
corresponds to the intracentre non-radiative internal con-w xversion rate 13,14 .
For an ensemble of centres that all have the sameradiative decay rate, it can be shown that the distributionof measured luminescence lifetimes is related to the distri-bution of the efficiency of non-radiative processes. This isalso valid when donor–acceptor non-radiative transfer per-
Ž .turbs the luminescence. The effective averaged lumines-w xcence decay has been modelled 15–18 and found to be
related to the overlap between absorption and emission.Luminescence decay for an individual centre is still expo-
w xnential however 19 . Fig. 1a shows that there is someoverlap between the absorption and emission of the Cr 3q-doped glass ceramic, indicating that energy transfer be-tween sites might be possible. However, the overlap issmall so that the rate of energy transfer is expected to be
Ž .low and in the analysis that follows the rates w k™ iikŽ . Ž Ž .and w i™k are set to zero except for ks i, w i™ iki ii
which corresponds to the intracentre non-radiative decay.rate .
Ž .For each centre, the probability P t , depends expo-i
nentially on time;
Ni ytrt i ,effP t s e 3Ž . Ž .i N0
Here N is the number of initially excited centres charac-i
terised by the decay time t and N is the total numberi,rad 0
of such centres, respectively. The ratio of N to N willi 0
vary with excitation wavelength. The effective decay rateis given by;
1 1 1s q 4Ž .
t t ti ,eff i ,rad i ,nr
Ž .where t and t s1rw i™ i are the radiative andi,rad i,nr i iŽnon-radiative decay constants respectively as intercentre
.transfer is set to zero in this case .The conclusion is that, in solids, variation in lumines-
cent decay between centres is related to both non-radiativedecay rates as well as the oscillator strengths for radiativetransitions. This is important in the analysis of materialswith internal disorder such as gallogermanates, garnets andglasses. The starting point for luminescence decay analy-sis, in all cases, is the assumption of a single-exponentialluminescence decay for each individual site, and this re-sults in the following relationship for the time dependenceof the total luminescence;
A tŽ .i i ,eff ytrt i ,effI t s e 5Ž . Ž .Ýt i ,radi
The main challenges are to recover the distribution of theŽ .decay constants, A t , and then to relate them toi i,eff
Ž .specific physical phenomena. The coefficients, A t ,i i,eff
will vary with excitation and detection wavelength as theyrepresent the number of ions of any given lifetime that arecontributing to the total luminescence.
To recover the distribution of decay constants from theexperimentally measured luminescence decays, the non-
w xlinear least squares analysis 20,21 has been used in this

( )M. Grinberg et al.rOptics Communications 156 1998 409–418412
work, whereby the x 2 function of the luminescence decayprofile was minimised. This function is defined as
2exI t y I tŽ . Ž .k k2x s 6Ž .Ýskk
Ž .where I t is the theoretical decay function given by Eq.kŽ . exŽ .6 , I t is the experimental emission decay and s isk k
the weighting of the experimental point, k.In glasses and internally disordered crystals a continu-
ous distribution of the local crystal field is expected and soŽ Ž ..the summation Eq. 5 represents a continuous distribu-
Ž . w xtion of the decay constant, A t 22 . In order to representthe decay contributions over a wide variation in lifetime, it
w xis common practice 22,23 to use a logarithmic scale forthe decay constant. When only the radiative processes aretaken into account, t st st , and;eff rad
A tŽ .ytrt ytrtI t s dt e s d ln t A t e 7Ž . Ž . Ž . Ž .H H
t
so that the following expression;
I t s A eytrt i 8Ž . Ž .Ý ii
Ž .can replace Eq. 5 under the assumption that the constantdifference t yt is replaced by a constant difference ofi iy1Ž . Ž .ln t y ln t . The coefficients A enumerate the con-i iy1 i
tributions of those sites that have a decay constant of t .iIn the more general case, when the radiative process is
not the only process to deexcite the centres, the quantitiesrecovered are not the distribution of the decay constants,A . When the logarithmic scale is used for t the follow-i eff
Ž .ing analogue of Eq. 9 is obtained;t i ,eff ytrt i ,effI t s A e 9Ž . Ž .Ý it i ,radi
so that the recovered quantity, A , is actually;i,rec
t i ,effA sA 10Ž .i ,rec i
t i ,rad
It is important to discuss the relationship between thedistribution, A , and the probability of finding the systemi
in the excited state, P , which is a solution of master Eq.iŽ .2 . Effectively, A corresponds to the probability that thei
excited system will emit a photon. Assuming that allprocesses are local and take place in the individual centre;
t i ,effA sP 11Ž .i i
t i ,rad
Ž . Ž .so that, combining Eqs. 10 and 11 , the recovereddistribution coefficients can be written;
2t i ,eff
A sP 12Ž .i ,rec i ž /t i ,rad
Since the nonradiative transition rate and consequentlythe effective decay time, t , is a function of tempera-i,eff
ture, the recovered decay time distribution must also de-pend on temperature. In particular, the coefficients result-
Ž .ing from Eq. 12 will be expected to describe the shift ofthe distribution to shorter times as temperature increases.
Ž .Returning to Eq. 6 , the final consideration is thechoice of the weighting factors, s . They have beenk
chosen to reflect the actual errors associated with individ-ual experimental points. The weightings chosen are there-fore;
ex exs s I t y I t 13Ž .Ž . Ž .k k ky1
FORTRAN procedures, which minimise s 2 using thew xLevenberg–Marquardt method 24 were used to find solu-
tions. The 10 000 data points per decay curve of theoriginal experimental data were initially reduced to onethousand by adjacent value averaging. The first 200 pointswere not averaged so that the number of points at shorttimes was greater. This is numerically convenient whenusing logarithmic spacings for histogram contributions.The lifetime distribution could then be approximated by amaximum of 200 t values. The results presented belowi
correspond to 125 different values for t .iAs the experimental curve is fit using 125 parameters it
is important to discuss how reasonable the fits are, inparticular whether the results of the fits are unambiguous.In order to determine the reliability of the process, com-puter generated artificial multiexponential decays wereproduced and the fitting procedure applied to them. Anexample of a fit using this method is presented in Fig. 2.Here the solid curve represents an invented distribution ofthe decay constants with a signal to noise ratio of 0.1%and the histogram shows the lifetimes subsequently recov-ered using the technique outlined above. It was found thatthe method reproduces the shape of continuous lifetimedistributions quite well. Single value exponential decaysare also represented by a continuous distribution, albeitcentred on the single lifetime value and with an integrated
Fig. 2. A test case for the continuous decay analysis technique.The solid curve represents a computer generated input decay
Ž .distribution with a 0.1% noise component and the histogramcorresponds to the recovered distribution.

( )M. Grinberg et al.rOptics Communications 156 1998 409–418 413
Ž .area proportional to the size of the input actual sharpdistribution. A proper choice of the range of the decayconstants is extremely important for the quality of the fits.If the predicted decay range is adequate it is possible tounambiguously distinguish various different decay distri-butions whose peaks differ by no less than 1r5 of thedecay range. Experimental signal to noise ratios vary withtime after excitation during the signal decay but theweighting procedure outlined above is chosen to takeaccount of this. At almost all times the experimental signalto noise ratio is less than 1% and at such levels theanalysis can be taken to be unambiguous.
3. Luminescence decay measurements and fitting to theexperimental data
The luminescence was excited by a small nitrogenpumped dye laser and detected using a photomultiplierafter emission dispersion by a monochromator. The datawas accumulated by a digital oscilloscope and the wholeapparatus was controlled by a computer. Initially 10 000points were taken over the decay of the luminescence, thepoints being separated by 0.1–10 ms depending on thedecay rate. Typical decay curves are shown in Fig. 3.
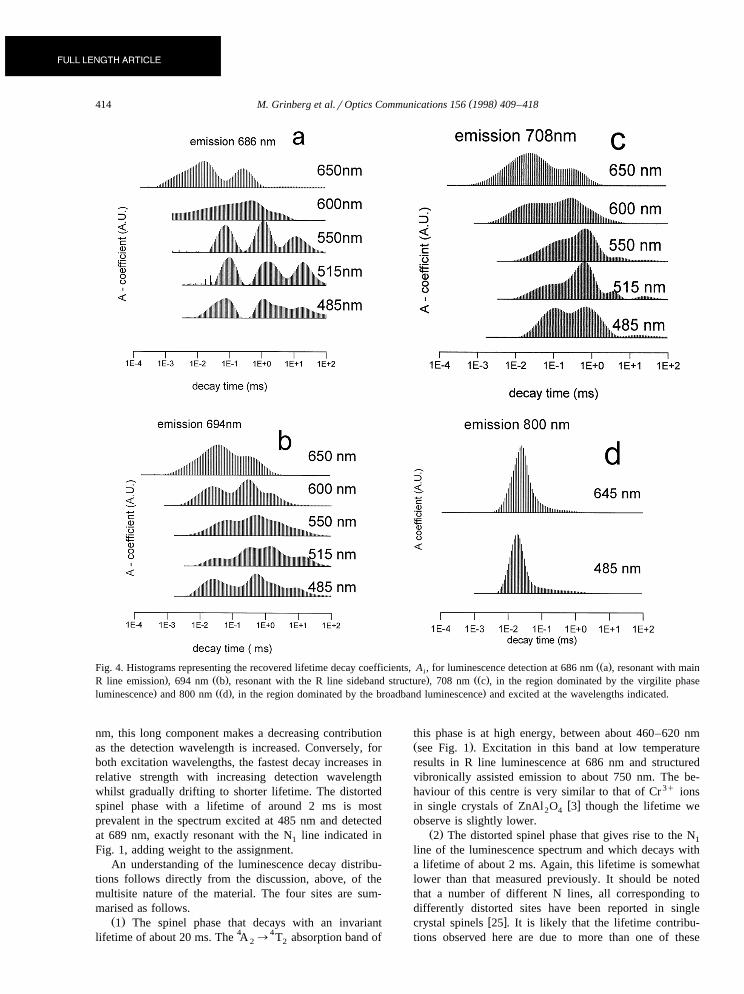
The results of the lifetime decay analyses for variouscombinations of excitation photon energies and detectionwavelengths are illustrated in Fig. 4. The emission lifetime
Žcontributions are monitored at 686 nm resonant with the. ŽR line emission , 694 nm resonant with the R line side-
. Žband structure , 708 nm at the wavelength dominated by
Fig. 3. Typical experimental luminescence decays detected at 686nm and excited by laser radiation at the wavelengths indicated. Asfor the calculations, the first 200 data points are not adjacent pointaveraged so that noise appears to be greater for the first 2 ms of
Žthe decay of the upper three traces and for a shorter period not.clearly visible in the lower two traces . Smooth lines represent fits
obtained using the technique outlined in this paper.
w x. Žthe virgilite phase luminescence 1 and 800 nm in theregion where contributions from the crystalline phases are
.expected to be very small . For high photon energy excita-Ž .tion 485 nm, 515 nm and 550 nm and high photon
Ž .energy detection 686 nm there are three different decaydistributions with mean constants of about 20 ms, 1 msand 0.08 ms. For the same detection conditions but excit-
Ž .ing at lower photon energies 600 nm and 645 nm thelongest decay time distribution is not present and the other
Žtwo distributions drift to shorter lifetimes 0.3 ms and 0.02.ms . The differences in the luminescence decay distribu-
tions can be directly related to the differences in theemission spectra excited at different wavelengths. Forinstance, in Fig. 1, it is seen that the R line and sharp linesideband disappears from the spectrum when the excitationwavelength is changed from 540 nm to 590 nm whilst Fig.4 shows that the longest lifetime contribution disappearsfrom the distribution between 550 nm and 600 nm.
The three main lifetime distribution contributions ob-served in Fig. 4a can be simply related to the three phasesinto which Cr 3q ions are incorporated as discussed in theintroduction. The longest lifetime corresponds to the spinelcrystalline phase with a lifetime of about 20 ms, theintermediate lifetime corresponds to the virgilite crystallinephase with a lifetime around 1 ms and the shortest lifetime,significantly below 1 ms, corresponds to the glassy phaseemission.
A fourth contribution at around 2 ms appears whenŽ .monitoring emission at 694 nm Fig. 4b and this isŽ .thought to be related to the N line see Fig. 1 . The N1 1
line is observed in many gahnite ceramic samples and hasw xbeen ascribed to a distorted spinel site 3 .
Ž .When detecting emission at 708 nm Fig. 4c , thespinel and distorted spinel phases make only small contri-butions to the decay. At high excitation energies thevirgilite phase decay is dominant but, as for higher detec-tion photon energies, the glassy phase becomes the majorcontributor when the excitation wavelength increases be-yond 600 nm. When detecting emission beyond the limitof the vibronic structure, around 750 nm, only the fastdecay corresponding to the glassy phase remains. Exam-ples of this are shown in Fig. 4d for detection at 800 nmwith excitation at high and low photon energy. It isinstructive to examine a plot of the lifetime data for one of
Ž .these distributions on a logarithmic scale Fig. 5 . The bestfit is not a straight line and so is not a single exponentialdecay but rather a distribution. Thus the distribution recov-ered in Fig. 4d appears to provide a good representation ofthe broadening of the lifetime distribution.
In Fig. 6 the recovered luminescence decay time distri-butions for the emission excited at 485 nm and 645 nmand monitored at different wavelengths are shown. Again,the distributions are dominated by four separate decayscorresponding to the four different Cr 3q sites as discussedabove. The absence of the longest decay when exciting at645 nm is immediately noticeable. When exciting at 485
( )M. Grinberg et al.rOptics Communications 156 1998 409–418414
ŽŽ .Fig. 4. Histograms representing the recovered lifetime decay coefficients, A , for luminescence detection at 686 nm a , resonant with maini. ŽŽ . . ŽŽ .R line emission , 694 nm b , resonant with the R line sideband structure , 708 nm c , in the region dominated by the virgilite phase
. ŽŽ . .luminescence and 800 nm d , in the region dominated by the broadband luminescence and excited at the wavelengths indicated.
nm, this long component makes a decreasing contributionas the detection wavelength is increased. Conversely, forboth excitation wavelengths, the fastest decay increases inrelative strength with increasing detection wavelengthwhilst gradually drifting to shorter lifetime. The distortedspinel phase with a lifetime of around 2 ms is mostprevalent in the spectrum excited at 485 nm and detectedat 689 nm, exactly resonant with the N line indicated in1
Fig. 1, adding weight to the assignment.An understanding of the luminescence decay distribu-
tions follows directly from the discussion, above, of themultisite nature of the material. The four sites are sum-marised as follows.
Ž .1 The spinel phase that decays with an invariantlifetime of about 20 ms. The 4A ™
4T absorption band of2 2
this phase is at high energy, between about 460–620 nmŽ .see Fig. 1 . Excitation in this band at low temperatureresults in R line luminescence at 686 nm and structuredvibronically assisted emission to about 750 nm. The be-haviour of this centre is very similar to that of Cr 3q ions
w xin single crystals of ZnAl O 3 though the lifetime we2 4
observe is slightly lower.Ž .2 The distorted spinel phase that gives rise to the N1
line of the luminescence spectrum and which decays witha lifetime of about 2 ms. Again, this lifetime is somewhatlower than that measured previously. It should be notedthat a number of different N lines, all corresponding todifferently distorted sites have been reported in single
w xcrystal spinels 25 . It is likely that the lifetime contribu-tions observed here are due to more than one of these

( )M. Grinberg et al.rOptics Communications 156 1998 409–418 415
Fig. 5. Experimental luminescence decays detected at 800 nm andexcited by laser radiation at the wavelengths indicated. Smoothlines obtained represent fits using the technique outlined in thispaper.
distorted sites though it is difficult to identify unambigu-ously other N lines due to the complexity of the lumines-cence spectrum of this multiphase material.
Ž .3 The second crystalline phase, thought to be virgilitebut not conclusively ascribed, that decays with a lifetimeof between 0.3 and 1 ms. Such ions can be excited at allwavelengths used in this investigation and luminesce atwavelengths similar to the spinel phase. The structureclose to 708 nm seems to be dominated by the virgilitephase as can be seen from the dominance of the 1 msdecay contribution in Fig. 4c and from previous experi-ments that have measured time resolved luminescence
w xspectra 1 . The broad absorption spectrum and shift inlifetime as a function of excitation and emission wave-length suggests that this phase is considerably disordered,perhaps due to substitutional disorder as is observed in
w xgallogermanate crystals 11 .Ž .4 The glassy phase that decays with a lifetime of
between 0.01 and 0.08 ms. The excitation band of thisphase is again across the full range of excitation wave-lengths used here and can be expected to be well into theinfrared according to the absorption spectra shown in Fig.1. The emission band is similarly broad and dominates theemission spectrum at wavelengths beyond about 750 nm.
The contributions of each of the four sites at any givencombination of excitation and detection energies is thus areflection of the relative strength of emission of the differ-ent phases for these experimental conditions.
The configuration coordinate diagrams shown in Fig. 7further illustrate how selection takes place during theexcitation and emission processes. Sets of curves are shownfor Cr3q ions in the spinel phase, in the virgilite phase andin the glassy phase. The distorted spinel would appear very
similar to the spinel and so is not shown. As the 2E state islower in energy than the 4T state in the spinel and2
Žvirgilite phases then R line emission with structured vi-.bronic sidebands is observed. For the spinel phase, only
one set of sites is observed leading to a relatively narrowabsorption band and luminescence with a single lifetime.
The virgilite phase is represented by several slightlydifferent potential wells shifted by the effects of disorderwithin the ceramic. The energies of the 4T states are at2
slightly lower energy than in the spinel phase thus increas-ing the wavefunction mixing between 2E and 4T states2
due to spin–orbit coupling and reducing the luminescencew x 4lifetime 7,9 . The T states of these differently distorted2
Fig. 6. Histograms representing the recovered lifetime decayŽŽ .coefficients, A , for excitation at 485 nm a , resonant withi
4 4 . ŽŽ .A ™ T absorption for all phases and 800 nm b , beyond the2 24 4 .T ™ A excitation band for R line emission and detected at the2 2
wavelengths indicated.

( )M. Grinberg et al.rOptics Communications 156 1998 409–418416
Fig. 7. Schematic sets of configuration coordinate diagrams indi-cating the effect of the variation in crystal field from site to site
Ž . Ž . Ž .for a the spinel phase and distorted spinel phase , b theŽ .virgilite phase and c the glassy phase.
sites are shifted to different energies thus causing variationin the amount of wavefunction mixing, leading to a varia-tion in the luminescence lifetime as different sites areselectively excited or detected. Low energy excitation ordetection implies lower energy 4T states and this implies2
shorter lifetimes. This is observed. The lifetime decreasesas either the excitation or detection wavelength decreases.The diagrams shown imply that the site-to-site variation isonly in crystal field strength so that the potential wells areshifted vertically up and down in configuration coordinatespace. However, it is entirely possible that, as in the case
w x w xof gallogermanates 11 and CaYAlO 26 , variation in4
electron–phonon coupling also contributes to the lifetimevariation. The data recovered using this technique cannotdistinguish clearly between the two.
Similar shifts in the lifetime distribution peak are ob-served for the glassy phase but to a greater extent. Adifferent explanation of this effect than for the virgilitephase must be invoked as mixing of the 2E state into the4T state does not greatly effect the luminescence lifetime2
when the 4T state is the lower in energy. For the glassy2
phase, the decrease in emission lifetime with decreasingexcitation energy can be explained in terms of non-radia-tive internal conversion processes. It has been shown forgallogermanates that nonradiative processes are consider-ably more effective for weaker field sites within a distribu-
w x Ž .tion 27 . Thus, considering Eq. 4 , the effective decaytime is shorter when the weaker field sites are preferen-tially excited or detected.
A final speculative comment on the low temperaturedata is in relation to the somewhat lower lifetime of the
3q Ž .Cr ions present in the spinel nanocrystals ;20 msŽ w x.relative to that reported in bulk samples 31 ms 3 . It is
known that long term heat treatment of gahnite glassesproduces crystallites with sizes of around 30 nm. The sizeof the nanocrystals in the present sample are likely to besomewhat smaller due to a reduced heat treatment period.Studies of Mn2q impurities in ZnS nanocrystals revealed a
significant reduction in luminescence lifetime compared tow xthat measured in bulk material 28 . Though these results
have proved controversial and have been refuted by somew x29 , it is possible that the measured luminescence lifetimein our samples is influenced by the small size of thecrystallites in which the chromium impurities are housed.
Further evidence that the technique presented here isable to quantitatively describe the decay of multisite mate-rials can be seen in Fig. 8 in which the decay distributionsfor excitation at 550 nm and detection at 686 nm, resonantwith the R line, are compared for different temperatures.The same three components are observed but relativecontributions differ with temperature. With increasing tem-perature, the longest component becomes weaker whilstthe shortest component becomes stronger. This is due tothe decreased intensity of the R line luminescence from thespinel phase and the increased intensity of luminescence athigher energies in the ‘glassy’ phase. Both of these effectsare due to the blue shift of luminescence bands withtemperature due to the thermal occupation of higher vi-bronic states. Thus there is less spinel phase luminescenceat 686 nm and more from the glassy phase.
There is a shift in the distribution maxima towardshorter time with increasing temperature. The shift of theshortest component, related to the glassy phase Cr3q ions,can be explained in terms of increasing internal conversionrates though it is unclear why this effect is seen only fortemperatures smaller than 100 K. For the longer compo-nents, this effect is due to increasing occupation of thehigher vibronic states of the first excited electronic mani-
Žfold which, due to the spin–orbit interaction, is a superpo-2 4 w x .sition of the E and T states 7,9 , as mentioned above .2
The thermally occupied higher states are energeticallycloser to the 4T level and consequently have more quartet2
character than the zero-phonon level resulting in faster
Fig. 8. Histograms representing the lifetime decay coefficients,A , for luminescence detection at 686 nm, resonant with the Cr 3q
i
R line emission from the spinel phase of the gahnite glassceramic, excited at 550 nm at different temperatures as indicated.

( )M. Grinberg et al.rOptics Communications 156 1998 409–418 417
decay of the luminescence than when only the groundvibronic state is occupied.
When monitoring emission at 739 nm, only lumines-cence from the medium and weak field sites is observed.Fig. 9 compares the decay constant distributions measuredat 10 K and room temperature, excited at various wave-lengths. In all cases decays at 10 ms and 800 ms areobserved, corresponding to the glassy and virgilite phasesof the ceramic. For all excitation energies, in going from10 K to room temperature, there is a significant increase inthe relative magnitude of the short lifetime contributionand a decrease in the lifetime of the longer contribution.The relative changes in the distribution concern the decay
Fig. 9. Comparison of histograms representing the lifetime decaycoefficients, A , at 10 K and room temperature. Emission wasi
detected at 739 nm, beyond the range of spinel phase emission,and excited at various wavelengths as indicated.
distribution of the luminescence and are best seen forexcitation at 485 nm and 515 nm. Here the situation is thesame as in the case of luminescence monitored at 686 nm,the increase in the shorter component of the decay isrelated to the shift of the respective emission band tohigher energy. When the luminescence is excited withlonger wavelength an additional effect is observed, the
Ž .appearance of a much shorter decay F1 ms at roomtemperature. This is related to the broad distribution ofcrystal fields experienced by the chromium ions in theglassy phase. The weakest field sites have an increasedprobability of decaying non-radiatively through internal
w xconversion 13,14 . Since the rate at which this processtakes place increases strongly with temperature, the effec-tive decay constant is expected to decrease with tempera-ture as observed. Since this effect mainly concerns the
Žsites characterised by the weakest crystal field and there-.fore the longest wavelength absorption peak , shorter de-
cays are observed when exciting at 550 nm, 600 nm andŽ .especially at 645 nm. Taking into account Eq. 12 which
describes the relationship between the recovered quantityand the actual distribution of the decay constants, that is,the probability that the ith site is excited, it can be seenthat the actual change in luminescence decay for an indi-vidual site is even more dramatic than can be observed bycomparing Fig. 9a and 9b.
4. Conclusions
At first thought, it may seem absurdly hopeful to fit theluminescence decay of a disordered multisite material us-ing what are effectively 125 exponentials but the be-haviour of Cr3q impurities in the gahnite glass ceramichave been shown to be well modelled by the technique ofcontinuous function decay analysis presented here. It hasrevealed detailed characteristics of the luminescent centresin the materials. Four different groups of sites, detailedabove, have been clearly identified and their behaviour hasbeen directly related to previous experiments on Cr3q-doped gahnite ceramics, gahnite glasses and spinel crys-tals.
The only remaining question is whether the widths ofthe distribution have real meaning. It would seem likelythat the longest lifetime contribution, relating to Cr 3q ionsin the spinel phase, should be a single exponential and
Žtherefore not correctly described by a distribution thoughnanocrystals of different sizes could conceivably influence
.the decay times of impurity ions contained within . The‘glassy’ phase, on the other hand, is likely to have agenuine spread of lifetimes as evidenced by the shift in itspeak with excitation wavelength and the non-exponentialdecays presented in Fig. 5.
The approach we have used to recover the distributionof luminescence decay times can be applied for any arbi-
Žtrary non-exponential luminescence decay where, as isalmost always the case, each emitting chromophore decays

( )M. Grinberg et al.rOptics Communications 156 1998 409–418418
.exponentially . The advantage of this method is that noluminescence decay model or physical model of the mate-rial are required a priori. This method of analysis also hasa great advantage over time resolved spectroscopy in thatdifferent sites can be identified even when they emit viabroad bands which overlap the same spectral region. It isalso worth briefly mentioning the validity of our methodwhen nonexponential luminescence decay is related tononradiative donor acceptor energy transfer. When back
Ž .transfer from acceptor to donor can be excluded, theemission of any particular donor is single exponential with
Ž .a decay constant given by Eq. 3 . In such a case the decaytime distribution is related to the distribution of the accep-tors around the donor site.
Acknowledgements
This paper is supported in part by KBN Research Grantnumber 2P03B003 13.
References
w x1 V. Poncon, J. Kalisky, G. Boulon, R. Reisfeld, Chem. Phys.Ž .Lett. 133 1987 363.
w x Ž .2 G.H. Beall, D.A. Duke, J. Mater. Sci. 4 1969 340.w x3 D.L. Wood, G.F. Imbusch, R.M. Macfarlane, P. Kisliuk,
Ž .D.M. Larkin, J. Chem. Phys. 48 1968 5255.w x4 C. Koepke, K. Wisniewski, M. Grinberg, D.L. Russell, K.
Ž .Holliday, Proc. SPIE 3176 1997 42.w x5 V. Poncon, M. Bouderbala, G. Boulon, A.-M. Lejus, R.
Reisfeld, A. Buch, M. Ish-Shalom, Chem. Phys. Lett. 130Ž .1986 444.
w x6 S. Sugano, Y. Tanabe, H. Kamimura, Multiplets of Transi-tion Metal Ions in Crystals, Academic Press, New York,1970.
w x Ž .7 M. Grinberg, T. Orlikowski, J. Lumin. 53 1992 447.w x Ž .8 B. Struve, G. Huber, Appl. Phys. B. 36 1985 195.w x Ž .9 M. Grinberg, J. Lumin. 54 1993 369.
w x10 D. Galanciak, P. Perlin, M. Grinberg, A. Suchocki, J. Lumin.Ž .60 1994 223.
w x11 M. Grinberg, P.I. Macfarlane, B. Henderson, K. Holliday,Ž .Phys. Rev. B. 52 1995 3917.
w x Ž .12 C. Bojarski, G. Zurkowska, Z. Naturforsch. A 42 19871451.
w x13 M. Grinberg, A. Mandelis, K. Fieldsted, Phys. Rev. B 48Ž .1993 5955.
w x Ž .14 M. Grinberg, A. Mandelis, Phys. Rev. B 49 1994 12496.w x Ž .15 Th. Forster, Z. Naturforsh. A 4 1949 321.¨w x Ž .16 Th. Forster, Ann. Phys. 2 1948 55.¨w x Ž .17 D.L. Dexter, J. Chem. Phys. 21 1953 836.w x Ž .18 M. Inokuti, F. Hirayama, J. Chem. Phys. 43 1965 1978.w x Ž .19 J. Kaminski, A. Kawski, Z. Naturforsch. A 32 1977 140.˜w x20 J.N. Demas, Excited State Lifetime Measurements, Aca-
demic Press, New York, 1983.w x21 M. Grinberg, K. Wisniewski, Cz. Koepke, D. Russell, K.
Holliday, Spectrochimica Acta, in press.w x22 L.B. McGrown, S.L. Hemmingsen, J.M. Shaver, L. Geng,
Ž .Appl. Spectr. 49 1995 60.w x23 J.C. Brochon, A.K. Liversey, J. Pouget, B. Valeur, Chem.
Ž .Phys. Lett. 174 1990 517.w x24 W.H. Press, B.P. Flannery, S.A. Tenkolsky, W.T. Vetterling,
Numerical Recipes, The Art of Scientific Computing, Cam-bridge Univ. Press, 1986.
w x Ž .25 W. Mikenda, A. Preisinger, J. Lumin. 26 1981 53.w x26 M. Yamaga, P.I. Macfarlane, K. Holliday, B. Henderson, N.
Ž .Kodama, Y. Inoue, J. Phys.: Cond. Matter 8 1996 3487.w x27 M. Grinberg, W. Jaskolski, P.I. Macfarlane, K. Holliday, J.
Ž .Phys.: Cond. Matter 9 1997 2815.w x28 R.N. Bhargava, D. Gallagher, X. Hong, A. Nurmikko, Phys.
Ž .Rev. Lett. 72 1994 416.w x29 M.A. Chamarro, V. Voliotis, R. Grousson, P. Lavallard, T.
Gacoin, G. Counio, J.P. Boilot, R. Cases, J. Cryst. GrowthŽ .159 1996 853.