Maximising return on conservation investment in the conterminous USA
Upload
khangminh22Category
view
1download
0
RETURN ON INVESTMENT: A MULTISITE CASE STUDY OF COST-EFFECTIVE, HIGH
ACHIEVING SOUTH CAROLINA SCHOOL DISTRICTS
by
Timothy R. Nelson
Liberty University
A Dissertation Presented in Partial Fulfillment
Of the Requirements for the Degree
Doctor of Education
Liberty University
April, 2014
2
RETURN ON INVESTMENT: A MULTISITE CASE STUDY OF COST-EFFECTIVE, HIGH
ACHIEVING SOUTH CAROLINA SCHOOL DISTRICTS
by Timothy R. Nelson
A Dissertation Presented in Partial Fulfillment
Of the Requirements for the Degree
Doctor of Education
Liberty University, Lynchburg, VA
April, 2014
APPROVED BY:
John R. Duryea, Ed.D., Committee Chair
Gary W. Kuhne, D.Ed., Committee Member
Glen R. Carson, Ed.D., Committee Member
Scott Watson, Ph.D., Associate Dean, Advanced Programs

3
ABSTRACT
The purpose of this multisite case study was to understand and explain how a school district can
be cost-efficient and sustain high student academic achievement. Based on a 2011 study, three
school districts were selected because they had high ratios of student academic achievement to
per pupil expenditures. The school districts differed in size, geographic location, student body
demographics, and district organizational structure. Using a postpositivist perspective and a
transformational leadership theoretical framework, 15 in-depth interviews with district leaders
and school principals were conducted along with evaluation of district archives and South
Carolina school report card data. A flexible, qualitative design was used to allow modifications
in the research plan, but the overall structure followed the general scientific method. Cross-case
analysis found districts which are cost-effective and provide high student academic achievement
(a) cultivate camaraderie among administrators and faculty, (b) provide individualized attention
to students, (c) complete comprehensive data analysis, (d) advance a strong relationship with
community members, and (e) focus on priorities.
Keywords: cost-effectiveness, student academic achievement, return on investment,
transformational leadership, school district consolidation.

4
DEDICATION
This dissertation is dedicated to my parents, Dr. Reid E. Nelson and Robin V. Nelson,
RPT. Dad, as a young father I am only now beginning to understand the depth and breadth of
love you gave to us through your tireless example and countless acts of self-less love. Mom,
your refusal to quit through your examination to be a piano technician was a great inspiration. –
IIII

5
ACKNOWLEDGEMENTS
First and foremost, I wish to thank my Lord and Savior – Jesus Christ. First Corinthians
4:7 – “For what maketh thee to differ from another? And what hast thou that thou didst not
receive? Now if thou didst receive it, why dost thou glory as if thou hadst not received it?”
Second, I wish to thank my beautiful wife and best friend, Allyson. In our first ten years
of marriage, I spent eight of those years in graduate school. I will never understand your
sacrifice, but I will always cherish your support.
I wish to thank my three girls: Caroline, Elizabeth, and Anna Reid. It is a joy to watch
you grow up in the Lord, and I count it a great privilege to be your father. I hope I never again
have to say “Daddy has to leave so he can work on his paper.”
I wish to thank the three members of my dissertation committee. Dr. Duryea, thank you
so much for your direction, feedback, and encouragement. You made this process much easier
through your guidance. Dr. Kuhne, thank you for sticking with me to the end. It has been a
longer journey than I hoped, but I appreciate your willingness to help more than once. Dr.
Carson, your positive outlook on life has been contagious and your willingness to help is much
appreciated. It has been encouraging to work with you.
I wish to thank my in-laws, Dan and Nancy Fulmer. Thank you for your help throughout
this process and for the loan of a room for many late night study sessions.
Finally, thank you to my great aunt, Mildred Duke. Your support throughout this journey
has been vital, and I would not be at this position without you. I hope I have made you proud.

6
Table of Contents
ABSTRACT .....................................................................................................................................3
DEDICATION .................................................................................................................................4
ACKNOWLEDGEMENTS .............................................................................................................5
Table of Contents .............................................................................................................................6
List of Tables .................................................................................................................................10
List of Figures ................................................................................................................................11
List of Abbreviations .....................................................................................................................12
CHAPTER ONE: INTRODUCTION ............................................................................................13
Background ....................................................................................................................................15
Situation to Self..............................................................................................................................16
Problem Statement .........................................................................................................................19
Purpose Statement ..........................................................................................................................19
Significance of the Study ...............................................................................................................19
Research Questions ........................................................................................................................21
Research Plan .................................................................................................................................22
Delimitations ..................................................................................................................................25
CHAPTER TWO: LITERATURE REVIEW ................................................................................27
Search Process ...............................................................................................................................27
Theoretical Framework ..................................................................................................................29
Transformational Leadership .....................................................................................................29
Contrasting Theory ....................................................................................................................36
Current Trends in Transformational Leadership .......................................................................36

7
Cost-Effectiveness .........................................................................................................................42
Cost-Effectiveness Defined .......................................................................................................43
Current State of Cost-Effectiveness Research ...........................................................................44
Public School Districts ...................................................................................................................49
School District Consolidation ....................................................................................................50
School District Evaluation .........................................................................................................53
South Carolina School District Organization ............................................................................55
Summary ........................................................................................................................................56
CHAPTER THREE: METHODOLOGY ......................................................................................57
Design ............................................................................................................................................57
Research Questions ........................................................................................................................59
Setting ............................................................................................................................................59
School Districts ..........................................................................................................................59
Participants .................................................................................................................................62
Procedures ......................................................................................................................................69
Pilot Study ..................................................................................................................................69
Personal Biography ........................................................................................................................71
Data Collection ..............................................................................................................................72
School Report Card Data ...........................................................................................................72
Archival Records .......................................................................................................................73
Interviews ...................................................................................................................................75
Data Analysis .................................................................................................................................79
Trustworthiness ..............................................................................................................................82

8
Ethical Considerations ...................................................................................................................82
CHAPTER FOUR: FINDINGS .....................................................................................................84
Applewood School District ............................................................................................................84
School Report Card Data ...........................................................................................................85
Archival Records .......................................................................................................................86
Interviews ...................................................................................................................................86
Research Questions ....................................................................................................................89
Grandview Unified School District .............................................................................................102
School Report Card Data .........................................................................................................102
Archival Records .....................................................................................................................103
Interviews .................................................................................................................................103
Research Questions ..................................................................................................................106
Blue Ridge School District ..........................................................................................................118
School Report Card Data .........................................................................................................118
Archival Records .....................................................................................................................120
Interviews .................................................................................................................................120
Research Questions ..................................................................................................................122
Member Checking ........................................................................................................................132
Cross Case Analysis .....................................................................................................................132
Collective Answers to Research Questions .............................................................................132
Assertions .................................................................................................................................136
CHAPTER FIVE: DISCUSSION ...............................................................................................141
Summary of Findings ...................................................................................................................141

9
RQ 1 .........................................................................................................................................142
RQ 2 .........................................................................................................................................143
RQ 3 .........................................................................................................................................143
Discussion of Findings .................................................................................................................144
Practical Implications...................................................................................................................148
Limitations ...................................................................................................................................151
Recommendations for Future Research .......................................................................................152
REFERENCES ............................................................................................................................153
Appendix A ..................................................................................................................................172
Appendix B ..................................................................................................................................175
Appendix C ..................................................................................................................................176
Appendix D ..................................................................................................................................177
Appendix E ..................................................................................................................................178
Appendix F...................................................................................................................................180
Appendix G ..................................................................................................................................181
Appendix H ..................................................................................................................................182
Appendix I ...................................................................................................................................183
Appendix J ...................................................................................................................................184
Appendix K ..................................................................................................................................185
Appendix L ..................................................................................................................................186
Appendix M .................................................................................................................................188
Appendix N ..................................................................................................................................190

10
List of Tables
Table 1: Summary of Three School Districts.………………………….………...………..…….61
Table 2: Participants from Applewood School District...…..…………………………………...64
Table 3: Participants from Grandview Unified School District....……………….....…………...66
Table 4: Participants from Blue Ridge School District…..…………..……...…...….…………..68
Table 5: Summary of Archival Records....………………………..………….…….……………74
Table 6: Standardized Semi-Structured Interview Questions...……………….…..……………..77

11
List of Figures
Figure 1: Summary of RQ answers from Applewood School District…………........................101
Figure 2: Summary of RQ answers from Grandview Unified School District......................…..117
Figure 3: Summary of RQ answers from Blue Ridge School District…………….....................131
Figure 4: Summary of RQ answers from all sites….....................…………………………...…135

12
List of Abbreviations
Advanced Placement (AP)
Applewood School District (ASD)
Blue Ridge School District (BRSD)
Cost-Effectiveness (CE)
Developmental Reading Assessment (DRA)
Education and Secondary Education Act (ESEA)
End of Course (EOC)
Grandview Unified School District (GUSD)
High School Assessment Program (HSAP)
Institutional Review Board (IRB)
Measures of Academic Progress (MAP)
Palmetto Assessment of State Standards (PASS)
Professional Learning Community (PLC)
Research Question (RQ)
Return On Investment (ROI)

13
CHAPTER ONE: INTRODUCTION
Two recent national trends have made a dynamic impact on the current state of American
education. First, the recent economic downturn has caused many state governments to decrease
funding of public education (Oliff, Mai, & Leachman, 2012). Second, the global comparisons of
U.S. education to other countries causes “perennial discontent” due to American students lagging
behind other developed nations in student academic achievement (Banzhaf & Bhalla, 2012, p.
819). Cavanagh (2012), Ornstein (2010), and Gray (2012) all describe international testing
results and public perception that the U.S. educational system is behind other developed
countries. Gray (2012) suggested American students are “unable to compete in a more technical,
globalized economy” due to their inability to beat out foreign competition for higher paying jobs
(p. 557). Ornstein (2010) claims American students lag behind their foreign counterparts due to
less instructional time being spent in science and math, and he further states the United States’
failures to improve education have resulted in a potential loss of nearly two trillion dollars in
Gross Domestic Product. However, Cavanagh (2012) cautions that “cultural and political
factors” shape opinions and cites the fact that 88% of Americans have a high school diploma
compared to 78% of Americans from a generation ago (p. 1). A significant gap between the
highest and lowest achievement of students remains in America while other nations have smaller
gaps between groups, suggesting that other countries “do a better job in challenging students at
all levels” than U.S. schools (Cavanagh, 2012, p. 7).
The combination of these two forces is an impetus in the need to evaluate the allocation
of funds of school districts along with an evaluation of year-to-year student academic
achievement on state and national achievement tests. Pioneered by Levin (1975), the concept of
cost-effectiveness (CE) in education has been used throughout educational research, but calls for
14
greater student academic achievement for the expenditure of public funds are increasing. A 2011
study by the Center for American Progress rated almost every American public school district,
comparing student academic achievement and per pupil expenditures while controlling for
mediating factors such as poverty rates and special education expenditures (Boser, 2011). Boser
suggests that the quality of American education could be improved without spending additional
funds as long as the funds are allocated effectively (2011).
There is much debate over the allocation of funds in public education (Kim, 2011;
Mensah, Schoderbek, & Werner, 2009; Yeh, 2010a). One aspect of education that has received
attention in recent years is school consolidation or school district consolidation (Banzhaf &
Bhalla, 2012; Bjork & Blasé, 2009; Hanley, 2007). Public policy makers often argue that
combining school districts will decrease expenditures in the administrative and services
department (Adcox, 2012; Bjork & Blasé, 2009). However, research suggests providing
additional services, like transportation, end up costing more when smaller school districts are
combined (Hanley, 2007). Bjork and Blasé (2009) noted problems involved in the consolidation
of school districts and Garner (1998) found school districts can become so large that the cost
savings evaporate. The theoretical idea that consolidation of services will bring eventual cost
savings has not been found to be true, and smaller school districts often have higher overall
student academic achievement compared to larger school districts (Diaz, 2008; Driscoll,
Halcoussis, & Svorny, 2003; Robertson, 2007). Sanders’ (2011) recent work suggests
coordinated changes from the central district office can produce positive educational gains over
an extended period of time. Sanders (2011) also commented “deeper and more targeted analysis
is needed to understand the complexities” of school reform (181). In-depth research is needed to
discern how some school districts are able to keep per pupil expenditures below average, yet

15
sustain above average student academic achievement.
Background
Based on scarcity of resources in education and the fact that U.S. education is
consistently behind other developed countries, educational leaders must begin to take steps to
create schools that increase student academic achievement while efficiently allocating funds.
Educational CE analysis research has been present in educational literature since 1975 and most
recently has been used to compare the effect sizes of educational initiatives (Yeh, 2012).
However, Donmoyer (2012) pointed out that simply assigning values to educational phenomena
“creates the illusion that we can know what is and is not working . . . without actually providing
accurate information about what works” (p. 668). CE analysis may show one program to
initially be more effective than another, but it does not answer the question of why one program
appears to be more cost-effective than another program.
Avolio, Reichard, Hannah, Walumbwa, and Chan’s (2009) meta-analysis on
transformational leadership stated there is a 66% probability that leadership makes a difference
in educational outcomes, and this finding suggests that implementation of new district initiatives
may not have the same results in a second location. Furthermore, the principal’s role in
education has changed into being an instructional leader and not simply a manager (Newton,
Tunison, & Viczko, 2010), and transformational leadership has been found to increase
confidence, creativity, and passion in followers (Fitzgerald & Schutte, 2010; Hackman &
Johnson, 2009). To this point research has not addressed the intersection of CE analysis and
transformational leadership. While CE research has compared initiatives (Yeh, 2007, 2008,
2009a, 2009b, 2010a, 2010b, 2012) and found certain programs to be more cost-effective, there
has not been a structured analysis investigating leadership behaviors in the decision making

16
process. There are quantitative analyses and correlations, but there is a lack of thick description
of the process whereby CE is achieved.
Boser (2011) analyzed nearly every school district in the United States and found great
differences in CE of school districts. The results of the study recognize that factors like
geographic location, school size, and student body demographics can affect student academic
achievement. In contrast to other published educational literature (Jacques & Brorsen, 2002;
Lindahl & Cain, 2012), Boser (2011) accounted for these differences and found, despite
demographic characteristics, some school districts provided an excellent “return on investment”
(ROI) (p. 18). The purpose of Boser’s (2011) work was not to contradict an overwhelming body
of research that suggests demographic factors are related to student academic achievement,
rather, it quantitatively showed that some districts are able to achieve “higher-than-average
[student] achievement per dollar spent” compared to other districts with similar student
populations (p. 1). Research is needed to understand what high ROI school districts are doing to
promote higher than average student academic achievement and lower than average spending
while accounting for differences in student demographics.
Situation to Self
In this section I first discuss why I want to conduct this study and then follow with my
philosophical assumptions and paradigms that influenced the study (Creswell, 2007). One
reason I conducted this study was that I have a core belief that any child can learn regardless of
past research findings. I believe educators can make a difference in any child’s life, and
exceptional education can make a difference “regardless of family background or economic
status” (Parveen, Anwar, & Majoka, 2011, p. 306). Second, I believe much wisdom can be
gained by listening to experts in the field. Many problems in education are similar and have

17
been faced by educators for hundreds of years. Educators who have been in the trenches and
face difficulties provide insight and instruction that cannot be found in a textbook or research
report. Finally, I do not believe spending additional money is the key to improved education. I
do believe public education is vital to the success of any country, but I do not believe that simply
adding more educational programs or government services, like after school care or evening
meals, will necessarily improve student academic achievement. I believe there is an essential
human element that cannot be divorced from exceptional education, and it is this element that I
hope to discover and describe.
Creswell (2007) offers five assumptions which must be addressed in qualitative research
– ontological, epistemological, axiological, rhetorical, and methodological – and I will address
them in order. My ontological assumption assumes that although reality exists – in this case
cost-effective education – multiple participants could see the situation in a different light. Using
perspectives and quotations from multiple participants will allow a broad description of the
problem that may or may not converge into central themes (Creswell, 2007). While I spent
significant time in the field researching this topic, my epistemological assumption did not
interfere with the business and decisions of the cases. My role was to listen and learn, not be the
expert offering counsel.
As noted in the previous paragraph, I believe any child can learn regardless of
circumstances, and I believe funding is not the key variable in the education of children. My
rhetorical perspective of case study research leads me to believe that I can discover best practices
through careful, deep investigation (Yin, 2009). I want to know “why” certain school districts
are cost-effective and “how” they achieve this delicate balance (Yin, 2009, p. 9). The “how” of
the delicate balance refers to the overt, describable actions taken by leaders as they actively

18
decide how to allocate funds. If a school district won a grant, would they upgrade all technology
in each school or decrease class sizes by hiring new teachers? The “why” of this balance
involves the personal philosophy of each individual and the corporate group philosophy or vision
of each school district. For example, the leadership may espouse a philosophy of customer
service, and funds may be spent on providing comfortable settings for students and families
where those same funds could have been used to hire additional teachers and decrease class
sizes. I agree with Donmoyer (2012) in stating that qualitative research can answer the “what-
works” question. Donmoyer (2012) noted quantitative researchers often “overestimated” their
ability to discover best practices in education while qualitative researchers “underestimated”
their ability to explain best practices (666). I do not believe I can provide a resolution to this
debate, but I do believe there is an unanswered qualitative component to CE research that, when
unearthed, may provide significant insight.
My qualitative research paradigm is postpositivism (Creswell, 2007). Postpositivism
uses a “logical … cause-and-effect oriented” approach to research design and data collection
with a strong foundation based on established educational theory (Creswell, 2007, p. 20). I
employed a scientific approach to my study which involved a rigorous and thorough collection of
data while allowing for changes based on initial research findings (Yin, 2009). My
methodological assumption used inductive logic by studying the current topic in context hoping
to find answers to gaps in the literature (Creswell, 2007). I do believe qualitative research,
although not supported by statistical tests, can identify cause and effect relationships (Donmoyer,
2012). Specifically, I believe my research can enlighten the research based cause and effect or
divert attention to an unknown cause or effect that statistical research has not considered.
Employing an emerging design allowed the freedom to modify the study as demanded by the

19
initial findings (Yin, 2009).
Problem Statement
A dearth of funds for education (Oliff et al., 2012) and a lack of satisfaction in American
education (Banzhaf & Bhalla, 2012) have caused a renewed focus on cost-effectiveness in
education. Boser (2011) found a wide range in CE of school districts despite controlling for
demographic factors. Policy makers have suggested district consolidation to control rising
educational costs (Adcox, 2012), but educational research is not clear as to the optimal district
size or structure (Banzhaf & Bhalla 2012; Bjork & Blasé, 2009; Colegrave & Giles, 2008;
Sanders, 2011). The question remains – what are cost-effective school districts doing to
encourage student academic achievement while controlling per pupil expenditures? How are
decisions made at the district level to keep costs low and student academic achievement high?
This study investigated three South Carolina school districts that provided a high ROI (Boser,
2011).
Purpose Statement
The purpose of this multisite case study is to understand and explain how three South
Carolina public school districts can provide a high ROI. At this state of the research, ROI is
defined as the ability to “generate higher-than-average [student] achievement per dollar spent”
(Boser, 2011, p. 1). Each South Carolina public school district has more than 250 students and
was identified by Boser (2011) as providing a high ROI. The unit of analysis, three South
Carolina public school districts, was investigated by interviewing five administrative staff,
collecting archival records, and analyzing publicly available school report card data.
Significance of the Study
This study has the potential to add to the body of educational literature, expand the

20
understanding of transformational leadership, instruct educational leaders in best practices, and
inform government policy makers. First, there is a growing body of CE literature which suggests
that school systems and educational programs can be compared based on their relative
effectiveness (Boser, 2011; Yeh, 2007, 2008, 2009a, 2009b, 2010a, 2010b, 2012). Further, cost-
effectiveness research suggests that individual programs can be compared and the most efficient
programs can be identified (Carruthers, 2012; Yeh, 2010). While many CE studies employ
quantitative data gathering and correlation coefficients demonstrating positive or negative
relationships, this study has the opportunity to provide a “thick description” (Donmoyer, 2012, p.
670) of what efficient school systems are doing to make them more efficient. The study may
build a depth of knowledge behind why certain programs, schools, or school districts are more
cost-effective. The ratios and comparisons can offer insight, but they cannot explain the entire
phenomenon. Second, the theory of transformational leadership has found that leaders can
inspire confidence in their followers, which will in turn produce positive results (Hackman &
Johnson, 2009; Fitzgerald & Schutte, 2010). The findings of this study may lend support to the
theory of transformational leadership if leaders of cost-effective school districts are acting in
accordance with the theory. However, the results may show transformational leadership is not an
integral part of an educational leader’s actions in high performing school districts.
Because this study seeks to understand “what” is taking place and “how” decisions are
made in high performing school districts, consistent themes of best practices should emerge.
These themes can be reported to other educational leaders who are facing similar problems.
Instead of floundering in the decision making process, educational leaders can trust the collective
wisdom of experts and make wise choices to increase student academic achievement without
needing additional funds (Houck, Rolle, & He, 2010). Finally, policy makers in state

21
governments have been, and continue to be, forced to make decisions about school funding
(Adcox, 2012). For example, one of the primary considerations in South Carolina school
systems is whether or not to consolidate school districts. Boser (2011) suggests that school
district size may not matter with regard to CE. This research will give a broader view of
effective school districts, and it may show that CE is more related to leadership rather than
organizational structure.
Research Questions
This multisite case study begins with a central theme of cost-effectiveness: maintaining
high student academic achievement while keeping costs low (Creswell, 2007). There are three
initial research questions:
1. What is the structure of the school district leadership and how do the inner workings
function?
This question addressed the overall leadership structure of the district and allowed insight
into the inner workings of the district. The inner workings of the district can often be found in an
organizational flow chart or a listing of departments. A description of the organizational flow
chart or departments allowed analysis of leadership structure (centralized/decentralized) and
style (authoritarian, authoritative, Laissez-faire, etc.). There are differing opinions on the
optimal size of school districts (Banzhaf & Bhalla, 2012; Bjork & Blasé, 2009; Colegrave &
Giles, 2008; Sanders, 2011), and the answers to this question may show the impact of size on a
district’s cost-effectiveness. Further, the information gained here may show that size has no
impact on a district’s CE (Houck et al., 2010; Lindahl & Cain, 2012). Additionally, the
information gained from this question may clarify the role of the building principal and the
principal’s impact on a school’s CE (Hentschke, Nayfack, & Wohlstetter, 2009; Mensah et al.,

22
2009; Wright & Harris, 2010).
2. How does the school district leadership encourage student academic achievement?
The goal of this question is to elicit responses that lead to participants’ perceptions of
how they affect student academic achievement. Responses will be compared to theoretical
paradigms (Bass, 1995; Bass & Steidlmeier, 1999; Greenleaf, 1977), current literature in
educational leadership (Bass, 2007; Bjork & Blasé, 2009; Feuerstein, 2009; Hentschke et al.,
2009; Iatarola & Fruchter, 2004; King & Rohmer-Hirt, 2011; Wright & Harris, 2010), and other
participants in the study (Yin, 2009). The findings may support theory and current literature but
may be very different from one site to another. Alternatively, there may be common
denominators in participants’ opinions which may conflict with educational literature.
Regardless, the answers to this question will develop another facet of understanding (Wiggins &
McTighe, 1998) to explain CE.
3. How does the school district leadership allocate financial resources?
There is no shortage of educational programs that can be implemented in schools, but the
CE of many programs is relatively unknown. Answers to this question should explain the
decision making process behind the allocation of resources (Banzhaf & Bhalla, 2012; Gislason,
2009; Hanley, 2007) and the behaviors of school district leaders as they implement educational
programs (Hentschke et al., 2009). Research suggests that the process of implementation can
greatly affect the results, positively or negatively (Bjork & Blasé, 2009). The answers may also
reveal the evaluation systems used by school districts as they self-evaluate the success of their
programs (Alvik, 1995; Ryan, Chandler, & Samuels, 2007; Smith, 2012).
Research Plan
This qualitative study employed a multisite case study design with a single unit of

23
analysis, which was the three South Carolina public school districts (Yin, 2009). After obtaining
permission to conduct my study from my dissertation committee and Liberty University’s
Institutional Review Board (IRB), I conducted a pilot study to “refine my data collection plans”
(Yin, 2009, p. 92). The site is Eagle Heights School District (pseudonym, as are all other
names). The pilot study was a full “dress rehearsal” for the in-depth case study and analysis to
be used afterwards (Yin, 2009, p. 92). I analyzed the questions used in the pilot study and
discussed logistical concerns (Gall, Gall, & Borg, 2007; Yin, 2009). Further, I reported “lessons
learned” from the pilot study and then conducted the case study having made necessary
modifications (Yin, 2009, p. 94).
After implementing modifications from the pilot study, I conducted the multisite case
study at three South Carolina public school districts. Utilizing the 12 South Carolina school
districts that were rated high on ROI (Boser, 2011), I employed purposeful sampling to choose
three school districts and obtain district permission to use them in my study (Creswell, 2007;
Elliot, Combs, & Boyce, 2011; Purcell, Horn, & Palmer, 2007; Wright & Harris, 2010).
Purposeful sampling can be described as both “criterion” and “maximum variation”
(Creswell, 2007, p. 127). Based on student academic achievement and per pupil expenditure,
Boser’s study (2011) rated all South Carolina public school districts into high, medium, and low
ROI. The sampling used is criterion based because only districts that are rated in the highest
category will be reviewed in the case study. The purpose of the case study is to learn how and
why school districts are cost-effective and to what degree the role of leadership plays to this end.
Using districts that are not cost-effective would not accomplish this purpose. Great care was
taken in order to locate maximum variation in the three selected school districts. For example, I
attempted to find school districts with differences in geographic location, demographics, size,

24
and leadership structure.
Once site access was achieved, I began collecting data from a multitude of sources in
order to achieve triangulation (Creswell, 2007; Yin, 2009). I interviewed district office leaders
responsible for curriculum, instruction, and assessment, along with business managers and
principals from each school district. Five people from each school district were interviewed for
between 30 and 60 minutes (Elliot et al., 2011; Gislason, 2009; Zhao & Ma, 2009). Follow-up
interviews were scheduled as needed.
I obtained information from the South Carolina State Department of Education’s website
(http://www.ed.sc.gov/) which provides over ten years of district report cards. This information
showed per pupil expenditures, student demographics, educator demographics, parent survey
information, and measures of student academic achievement. Specifically, measures of student
academic achievement were Absolute Rating; Growth Rating; Federal Accountability Rating
(met/not met Annual Yearly Progress as part of No Child Left Behind); Palmetto Assessment of
State Standards scores in reading, math, science, social studies, and writing; and National
Assessment of Educational Progress scores in math and reading from 2011. The data gathered
was compared using descriptive statistics to compare present achievement to 2008 student
academic achievement. 2008 student academic achievement was used as a benchmark because
2008 student academic achievement was used in the Boser (2011) study to identify high ROI
districts. Finally, I obtained a copy of publically available school board minutes from the last
five years. Following the collection of data, I provided answers to the three research questions.
A full description of the research process and data analysis can be found in chapter three of this
document.

25
Delimitations
The proposed study employed four delimitations. First, the study was delimited in scope
to three public school districts in South Carolina that provided a high ROI as determined by
Boser (2011). School districts that were not rated high ROI were excluded from this study under
the assumption that best practices are observable in districts with the best results. The study is
not a comparison study with high ROI districts compared to low ROI districts. The goal was not
to find fault with school systems but to simply uncover themes or behaviors from high ROI
districts.
Second, the study was delimited geographically to the state of South Carolina. While
much could be learned by examining high ROI schools in other states, this was not within the
scope of the study. By restricting the possible list of participants to one state, comparisons of
student academic achievement were possible because students take the same standardized
assessments and report the results using the same format (South Carolina School Report Cards).
Third, the study was delimited to using district office leaders and school principals as
participants for interviews. The perspective of school board members, teachers, students, and
parents were not ascertained. Also, the study did not employ site observations. Although adding
data from other perspectives or anecdotal data from site observations may have added to this
study, the data may not have exposed how and why school districts are able to provide a high
ROI. While this study attempted to provide a full description of the cases, the study is restricted
in its scope.
Finally, the study was delimited to data from the 2008-2009 school year to the present.
Boser (2011) used data from this time period to identify high ROI districts. Further, data from
this recent time period coincides with a decline in funding for education and overall economic

26
difficulty (Oliff et al., 2012). The situation provided an opportunity to study how and why
districts can provide high ROI during difficult economic circumstances.

27
CHAPTER TWO: LITERATURE REVIEW
The fact that international assessments continue to place American students behind their
international competition, and funding for public education has decreased in recent years has
forced American educators to place renewed emphasis on cost-effectiveness (CE) (Banzhaf &
Bhalla, 2012; Cavanagh, 2012; Gray, 2012; Oliff et al., 2012; Ornstein, 2010). While some
higher educational institutions have implemented courses teaching CE evaluation, few research
studies have reported CE in action (Levin, 2001). Further, qualitative studies reviewing the
process of evaluating CE and the theoretical propositions behind CE are scarce. Boser (2011)
found that certain districts are able to maintain higher levels of CE than others even after
controlling for specific factors such as the poverty level. Research is needed to understand how
districts are able to maintain high student academic achievement while keeping per pupil
expenditures relatively low.
The proceeding literature review opens with a description of the search for literature and
justification for inclusion in the study (Boote & Beile, 2005; Maxwell, 2006) followed by a
description of the theoretical framework, transformational leadership. Next, a comprehensive
analysis of the available educational research and literature on the subjects of CE and public
school districts are analyzed. The researcher then describes the concept of cost-effectiveness and
its use in Boser’s 2011 study. Finally, the intersection of transformational leadership and CE is
discussed along with practical implications regarding this study. Concurrent with qualitative
research standards, the literature review’s headings increased in depth, complexity, and number
as data emerged (Yin, 2009).
Search Process
The Center for American Progress published a research article which ranked every South
28
Carolina school district in terms of student academic achievement compared to per pupil
expenditures (Boser, 2011). The research suggested some of the most affluent districts were not
rated as providing a good “return on investment” when compared to other less affluent school
districts (Boser, 2011, p.18). Further study revealed profound differences exist district by district
and even within counties when comparing expenditures of funds on public education. The
researcher began a cursory search of educational literature using the ERIC data base and Liberty
University’s Summon search engine. Using school district size, school district evaluation, and
school district case studies as key words, the researcher cataloged multiple professional journal
articles using the EndNote© program (Glatthorn & Joyner, 2005). The search parameters limited
the articles to those from professional journals written within the last 10 years. After the
preliminary review of the literature, the search parameters were expanded to include research
conducted since 1930.
After reading those studies, three broad generalizations began to appear. First, there is a
strong base of studies in educational literature dealing with CE, but these studies only discussed
quantitative results. Second, many of the studies used transformational leadership as their
theoretical framework. Finally, very few of these studies were exhaustive case studies, and none
explained how or why district level financial decisions were made with regard to student
academic achievement and per pupil expenditures (Yin, 2009).
In order to complete a comprehensive review of the emerging topics (Boote & Beile,
2005), the researcher returned to multiple databases (Avolio et al., 2009) and used Boolean
search operators to combine the terms transformational leadership, school district size, school
district evaluation, and cost-effectiveness to find additional articles. Two research librarians
from different universities were contacted and asked for assistance. Using Bass’s (1995)

29
description of transformational leadership as a theoretical foundation, each of the component
pieces of each topic were analyzed. The synthesis of their intersection provided direction for the
next steps in educational research (Maxwell, 2006).
Theoretical Framework
The theoretical framework of this study is transformational leadership as pioneered by
Burns and developed by Bass (Hackman & Johnson, 2009). After describing the major tenets of
transformational leadership, the qualities of a transformational leader will be listed. Current
trends in transformational leadership will be described next. The impact of transformational
leadership on the current study will be explained along with how the current study could shed
light on the theory of transformational leadership.
Transformational Leadership
When James Burns first described transformational leadership, it was in juxtaposition to
transactional leadership and in relation to Maslow’s hierarchy of needs (Hackman & Johnson,
2009). Transactional leadership met “basic human needs” while transformational leadership
fulfills “a follower’s higher-level needs” (Hackman & Johnson, 2009, p. 102). When describing
the nexus of his development of transformational leadership, Bass stated that transactional
leaders “motivate followers by exchanging with them rewards for services rendered” (Bass,
1995, p. 466) while transformational leaders develop leaders and begin to support “a cause
around which they can rally” (Bass, 1995, p. 467). Bass began working with South African
scholars, Master’s of Business Administration students, and U.S. Army servicemen to discover
different facets of transformational leadership (Bass, 1995). Bass found transformational leaders
were like father figures to employees, and the employees began to work many additional hours in
appreciation for the support they received (Bass, 1995). Employees were setting aside their own

30
self-interests and working “for the good of the team” (Bass, 1995, p. 489).
Major tenets of transformational leadership. Bass (1995) found four factors of
transformational leaders: (a) idealized influence (charisma), (b) individualized consideration, (c)
inspirational motivation, and (d) intellectual stimulation. Initially termed charismatic but
changed due to connection to despots like Hitler and Mussolini (Bass, 1995), idealized influence
refers to leaders that “emphasize the importance of purpose, commitment and the ethical
consequences of decisions,” and are “role models” that develop a “shared purpose” among
followers (Bass, 1997, p. 133). In contrast to transactional leadership, leaders with idealized
influence have the ability to develop followers who will “take a stand” when options are
presented that violate their principles (Bass, 1997, p. 133). Transformational leaders who exhibit
idealized influence are found to be agreeable by their subordinates, and this finding supports the
development of a shared purpose (Judge & Bono, 2000). Leaders who disagree with followers
are unable to develop a shared purpose or develop commitment through difficult situations if
they do not appear agreeable to followers.
A second characteristic, individualized consideration, refers to leaders who can show
individual, specific concern for each follower (Bass, 1995). Like a “coach or mentor”
transactional leaders can promote development in their followers both to emulate leadership and
to develop new leadership abilities (Bass, Avolio, Jung, & Berson, 2003, p. 208).
Transformational leaders are consistently available to followers and thereby create a trusting
relationship (Atkinson & Pilgreen, 2011). Transformational leaders emphasize the “human
dimension” of management by having genuine concern for employees and honestly reflecting on
their performance (Day, 2000, p. 58).
A third characteristic of transformational leadership is inspirational motivation, and this
31
character quality “provides followers with challenges and meaning for engaging in shared goals
and undertakings” (Bass & Steidlmeier, 1999, p. 188). Transformational leaders develop a sense
of empowerment in their followers which supports creativity and self-reliance (Kark, Shamir, &
Chen, 2003). While there are some components of transactional leadership in this facet, these
leaders are able to encourage action based on shared principles and theoretical agreement.
However, Bass and Steidlmeier (1999) cautioned that transformational leaders can use this
quality to “mislead, deceive, and prevaricate” followers in the same vein as Hitler and Mussolini
(p. 188). When describing the empowerment transformational leaders develop in their followers,
Kark, Shamir, and Chen (2003) caution that empowerment can lead to dependence.
A final characteristic of transformational leadership is intellectual stimulation. Followers
are encouraged to “challenge organizational norms,” take part in “divergent thinking,” and
“develop innovative strategies” to solve problems (Bono & Judge, 2004, p. 901). Kouzes and
Posner (2007) illustrated this concept by describing the process of creating a shared vision.
Transformational leaders are able to stimulate followers by “turning possibility thinking into an
inspiring vision” (Kouzes & Posner, 2007, p. 106). Transformational leaders develop a shared
vision by encouraging participation from as many stakeholders as possible (Ackoff, 1999), and
the followers must see the changes in action. Transformational leaders “do what [they] say
[they] will do” by completing tasks and keeping promises (Kouzes & Posner, 2007, p. 41).
Qualities of a transformational leader. To some degree, transformational leaders will
possess each of the four major tenets proposed by Bass: idealized influence, individualized
consideration, inspirational motivation, and intellectual stimulation (Bass, 1995). In addition to
these primary characteristics, further research suggests transformational leaders may possess
additional character traits: (a) “we” orientation, (b) integrity, (c) innovation, and (d) follower

32
behavior.
“We” orientation. Transformational leaders have a “we” orientation and are not
concerned with gaining praise or favor from followers (Kanungo, 2001). Dionne, Yammarino,
Atwater, and Spangler (2004) suggested the globalization of the economy is moving leaders to
incorporate a team philosophy which may improve communication and decrease conflict. Later
research supported this hypothesis when a strong relationship was found between
transformational leadership and group performance in the financial districts of Hong Kong and
the United States (Schaubroeck, Lam, & Cha, 2007). The researchers found statistically
significant results suggesting that transformational leadership behaviors were strongly related to
team potency and team performance (.33 and .25 respectively, p < .001). These results lend
credence to the hypothesis that transformational leaders can make a difference in follower and
team behaviors. More recently, research found that transformational leaders can positively
influence both individual and group behavior (Wang & Howell, 2012). Authoritarian leaders
may foster a compliant atmosphere, but transformational leaders will “create a sense of
empowerment in followers and motivate them to perform well” (Wang & Howell, 2012, p. 787).
Transformational leaders create a climate of team unity by “creating a shared commitment to
innovation” (Eisenbeiss, van Knippenberg, & Boerner, 2008, p. 1438).
Integrity. A key component of transformational leadership is the moral foundation of a
leader, and the moral foundation becomes a catalyst for integrity (Hannah & Avolio, 2011;
Kanungo, 2001; Zhu, Avolio, Riggio, & Sosik, 2011). Kanungo (2001) suggested that “when the
leader’s moral integrity is in doubt all attempts by the leader to influence followers” ultimately
end in failure (p. 258). The leader’s integrity causes him or her to position the needs of others
first and foremost even when this decision causes “personal sacrifice or inconvenience”

33
(Kanungo, 2001, p. 260). Further, the foundation of integrity compels transformational leaders
to sacrifice for the benefit of the group and develop future leaders (Bass, 1993; Hannah &
Avolio, 2011). Bass (1995) suggests this moral training often begins with parents who gave their
children “difficult challenges but also support [the child’s] efforts whether or not they resulted in
success” (p. 474). When following an authentic transformational leader, followers act morally,
ethically, and in accordance to stated institutional goals (Zhu et al., 2011).
Research has found a strong correlation between leaders’ moral values and
transformational leadership behaviors. Turner, Barling, Epitropaki, Butcher, and Milner (2002)
surveyed 132 managers using the Defining Issues Test (Rest, 1990) and then looked for
correlations with followers’ test results on the Multifactor Leadership Questionnaire (Bass &
Avolio, 1993). The results found leaders with high moral values exhibited many more
transformational leadership behaviors than leaders who did not exhibit high moral values (Turner
et al., 2002). Mulla and Krishnan (2011) have more recently found that not only do
transformational leaders need to have strong moral values, but they can also positively impact
the moral values of followers. The results suggested when leaders stay in a leadership position
for more extended periods of time (duration > 24 months), followers gain more self-respect and
are more ambitious and forgiving (Mulla & Krishnan, 2011). However, the same study also
found that leaders that spent less than 24 months only provided “limited support” to the
hypothesis that transformational leaders can positively influence followers’ moral behaviors
(Mulla & Krishnan, 2011, p. 141). This finding needs to be investigated by reviewing the tenure
of leadership teams in public school districts. The data gained from this study may find that
leadership teams from high return on investment (ROI) districts have spent a considerable
number of years working with employees, and this extended time may positively influence

34
student academic achievement.
Innovation. Financial and political factors are influencing the course of education today
(Adcox, 2012; Cavanagh, 2012; Gray, 2012; Oliff et al., 2012; Ornstein, 2010), and
transformational leaders need to encourage their followers to be innovators because of these
rapid changes (Waldman & Bass, 1991). Transformational leaders nurture followers by
reminding them of the shared vision and showing confidence in followers (Waldman & Bass,
1991). Further, transformational leaders exhibit perseverance by “maintain[ing] the energy and
enthusiasm” throughout the innovation process (Waldman & Bass, 1991, p. 170). While
transactional leaders can influence follower behavior through contingent rewards (Hater & Bass,
1988; Sadeghi & Pihie, 2012; Waldman & Bass, 1991), transformational leaders, through
encouraging innovation, are able to change the culture of environments (Ehrlich, Meindl, &
Viellieu, 1990).
Follower behavior. A key result of transformational leadership is its effect on followers.
Employees become increasingly more likely to work longer hours voluntarily and share their
expertise with team members when they are in a positive working environment (Eisenbeiss et al.,
2008). A possible connection can be made here to public school districts. When led by a
transformational leader who has developed a shared vision among the employees, teachers may
be inspired to expend more energy and give more time to accomplish a shared vision.
Followers grew in their sense of performance and employability when led by a
transformational leader (Camps & Rodriguez, 2011). Employability is characterized by people
who are “more capable of doing their tasks and are more motivated to make extra effort” (Camps
& Rodriguez, 2011, p. 429). Theoretically, educational leaders displaying transformational
leadership will create teachers who are more proficient and will give extra effort and time

35
towards teaching students. This impact could positively influence overall student academic
achievement.
Teachers may also sacrifice personally to meet the needs of the group, which is a by-
product of transformational leadership (Bass, 1995). Eisenbeiss et al. (2008) suggested that
research should be conducted on “mediating and moderating effects” that may explain the
connection between transformation leadership, team innovation and organizational climate, and
qualitative research describing high ROI school districts may fill this gap in the literature (p.
1438). For example, interviews and archival data may point to transformational leadership
behaviors, and the resulting influence on followers may be increased expenditures for
instructional programs and decreased expenditures on non-instructional programs that do not
further the shared vision.
The interaction between transformational leadership and team behavior has been explored
by other researchers, and positive relationships have been found. Early research by Seltzer and
Bass (1990) found that individual followers were encouraged to expend extra effort, but Seltzer
and Bass had to encourage future research based on inconclusive group results. Leaders can
create a positive ethical climate in an organization through modeling expected behavior and
clearly communicating expectations, and a 1990 qualitative case study supported this theory.
Ehrlich et al. (1990) completed a case study involving a change of leadership in a business in
crisis. The results of the study found both transactional and transformational leadership behavior
can have a positive influence on follower behavior, but transformational leadership behavior was
more strongly related to extra effort of employees compared to transactional leadership
behaviors.

36
Contrasting Theory
In contrast to transformational leadership, transactional leadership is sometimes referred
to as contingent reward leadership (Brymer & Gray, 2006). Leaders present standards of
performance and then specify the reward or benefit for the employee. Bass and Avolio (1993)
describe transactional leadership in the following way: “There is a price on everything.
Commitments are short-term. Self-interests are stressed” (p. 116). The employee clearly
understands his or her responsibility and expects the reward if his or her performance is adequate
(Leithwood & Poplin, 1992). Transactional leadership allows followers to meet their basic
needs, but it “may not be effective in developing longer-term outcomes or leading when
outcomes are not pre-determined” (Brymer & Gray, 2006, p. 16). This description contrasts with
transformational leadership because transformational leadership encourages followers to work
beyond their own interests and expend additional effort (Bass, 1995). Later research found both
transformational and transactional leadership are important and contribute to effective leadership
(Judge & Piccolo, 2004).
Current Trends in Transformational Leadership
Global development. The concept of transformational leadership is being studied all
across the globe. The country of Malaysia is pushing to become a “fully developed nation by
2020” and higher education is expected to play a key role in the country’s success (Sadeghi &
Pihie, 2012). Higher educational institutions found transformational leaders are having a
positive influence on followers, which is improving the overall success of each academic
department. However, certain elements of transactional leadership – contingent reward – have
also been found to positively influence overall success (Sadeghi & Pihie, 2012). Another study
found that building contractors in Iran who exhibited characteristics of transformational

37
leadership were able to give “attention to the concerns and developmental needs of individual
team members” because different employees were at different skill levels (Tabassi & Bakar,
2010, p. 255). Transformational leaders increased the quantity, quality, and problem solving
capabilities of employees (Sadeghi & Pihie, 2012).
There are many multinational studies of transformational leadership which are finding
similar conclusions across geographic boundaries. A transformational leader that is socially
sensitive motivates followers in India, Singapore, the United Kingdom, and the United States
(Khatri, Templer, & Budhwar, 2011). The study did find slight variations among other
characteristics. Leaders with knowledge and expertise had a strong relationship with follower
outcomes in India and Singapore, while change seeking leaders had a strong relationship with
follower outcomes in the United Kingdom and the United States (Khatri et al., 2011). A study of
U.S. and Israeli business leaders found some support of a relationship between transformational
leaders and organizational commitment. Transformational leaders increased the level of
commitment exhibited by employees to an organization, but this commitment may be dependent
on each employee’s situation (Dunn, Dastoor, & Sims, 2012). Further research is needed in this
area, and this study provides some anecdotal evidence. For example, teacher turnover at districts
is related to poor student academic achievement (Jackson, 2012; Levy, Lois, Ellis, Jablonski, &
Karelitz, 2012; Ronfeldt, Loeb, & Wyckoff, 2013). Transformational leaders may work
diligently to retain employees, which in turn allows for the continuance of a shared vision and
better education for students.
Pseudo-transformational leadership. First described by Bass and Steidlmeier in 1999,
pseudo-transformational leaders “seek to become the ideals … of their followers” (Bass, 1999, p.
190). The primary difference between authentic transformational leadership and pseudo-

38
transformational leadership is the moral values of the leader (Bass & Steidlmeier, 1999; Christie,
Barling, & Turner, 2011). Bass was asked about pseudo-transformational leadership in an
interview, and he noted that these leaders often “excuse their own behavior” and blame others for
their own mistakes (Kidwell, 2005, p. 90). In order for followers to believe in leadership, they
must first trust the integrity of leadership (Storr, 2004). When leaders replace principle with
“personal ambitions,” followers lost fundamental trust in leadership (Storr, 2004, p. 415).
Pseudo-transformational leadership impaired followers, and leaders became abusive and fostered
job insecurity (Christie et al., 2011).
There is a growing body of literature that provides examples of pseudo-transformational
leadership. Bass noted the Enron scandal as an example of leadership that became self-serving
and violated transformational leadership principles (Kidwell, 2005; Odom & Green, 2003).
Odom and Green (2003) described another incident of pseudo-transformational leadership when
a female African American employee was fired from a company despite positive evaluations.
The managers violated company ethics along with federal law when they put their own interests
above the company. In agreement with other published research (Khoo & Burch, 2008; Kidwell,
2005; Price, 2003), the managers excused their own behavior by saying it was too difficult and
time consuming to fire an employee over poor performance. Their lack of transformational
leadership forced the court system to become “the bastion … of justice because leadership failed
to do the right thing” (Odom & Green, 2003, p. 63).
In addition to examples of pseudo-transformational leadership, published research has
begun to develop a working model of pseudo-transformational leadership. Barling, Christie, and
Turner (2008) suggested pseudo-transformational leaders created a fear among followers and
that fear developed into an unquestioning obedience among followers. Followers became highly

39
dependent on pseudo-transformational leaders, and those same leaders began to take credit for
“good ideas of their followers” but blamed mistakes on the followers (Barling, Christie, &
Turner, 2008, p. 854). Finally, followers are often in a state of insecurity because they fear
losing their jobs because of retribution from the pseudo-transformational leader. Barling et al.
(2008) suggested pseudo-transformational leaders can be “conceptually and empirically
distinguished from transformational leaders” (p. 859).
Price (2003) contrasted authentic transformational leadership with three types of pseudo-
transformational leadership: (a) base, (b) incontinent, and (c) opportunistic. Base pseudo-
transformational leadership does apply principles and rules to a situation, but the wrong rules and
governing principles are followed. For example, Odom and Green (2003) related a story where
an armored truck driver left his post to stop an attempted murder. The employee was fired for
breaking company policy, leaving the vehicle unattended, but the courts overturned the
termination because it was more important to help a person in need than to follow a policy.
Incontinent pseudo-transformational leaders have the correct policies in place, but they
fail to adhere to and implement the policies (Price, 2003). The scandal at Enron is a good
example of incontinent pseudo-transformational leadership because Enron had policies
promoting “open communication, integrity, and respect for its stakeholders” (Odom & Green,
2003). The leaders of Enron were clearly pseudo-transformational leaders when they profited
from stock sales but dishonestly told employees to keep their money in company stocks. Finally,
opportunistic pseudo-transformational leaders often appear to have their followers’ best interests
in mind, but they ultimately served themselves (Price, 2003). Jim Baker was a well-known
“religious charlatan” who initially appeared virtuous but exemplified opportunistic pseudo-
transformational leadership when he later embezzled funds and was convicted of numerous

40
crimes (Price, 2003).
Servant leadership. In contrast to pseudo-transformational leadership, a servant leader
“behaves ethically, and encourages and empowers subordinates to grow and succeed, both
personally and professionally” (Schneider & George, 2010, p. 63). Schneider and George (2010)
found servant leadership was more likely to explain positive attitudes and commitment of
followers when compared with transformational leadership, but the study was conducted at a
volunteer service organization. Avolio, Walumbwa, and Weber (2009) found servant leaders
were good communicators and encouraged followers. Followers had increased job satisfaction
and were more committed to the group. Research on servant leadership has found servant
leaders are good listeners, and they are wise stewards of resources (Crippen, 2005). Teachers
exhibiting servant leadership made a difference in the lives of their students and positively
impacted student academic achievement (Russell, 2012). This contrasts transformational
leadership because servant leadership focuses primarily on the followers (Boyum, 2008) where
transformational leadership primarily focuses on leaders.
Berendt, Christofi, Kasibhatla, Malindretos and Maruffi (2012) studied the life of Moses
from the Hebrew Old Testament and found many characteristics of servant leadership. Konorti
(2008) also suggested Moses displayed transformational leadership because of his wisdom,
courage, and vision. Berendt et al. (2012) especially noted Moses’ humility as a defining
characteristic of his servant leadership. Moses understood the needs of his followers by listening
carefully to people and helping the entire nation to achieve its goals (Berendt, Christofi,
Kasibhatla, Malindretos, & Maruffi, 2012; Crippen, 2005). Moses’ leadership also aligns with
transformational leadership in that he was a man of innovation. Moses was unable to answer all
of the problems and questions of the Israelites so he delegated that responsibility to “able men”

41
(Exodus 18:21). Instead of solving all of the problems himself he set up a structure that would
benefit the entire group and create future leaders (Berendt et al., 2012).
Another study of servant leadership found a strong, positive correlation between school
climate and servant leadership (Black, 2010). The study gave servant leadership and school
climate instruments to the administration and teachers at a Catholic school. The results revealed
there was a positive school climate, and servant leadership was being practiced at the school.
The positive environment and servant leadership were related, and the overall student academic
achievement was improving (Black, 2010; Burgess & Dixon, 2012). There was a difference in
the perception of both school climate and servant leadership between the faculty and
administration. The administration believed there were high levels of servant leadership and a
very positive school climate while the teachers only saw moderate levels of servant leadership
and a less open school climate (Black, 2010).
E-leadership. A final trend in leadership is referred to as e-leadership. First defined by
Avolio, Kahai, and Dodge (2001), e-leadership is a “social influence process mediated by
[Advanced Information Technology] to produce a change” (p. 617). Researchers have connected
e-leadership and transformational leadership by stating examples of transformational leadership
that are necessary for the success of e-leadership. For example, e-leadership must evolve to meet
the needs of the current team (Pulley & Sessa, 2001), and transformational leadership encourages
creativity and innovation (Bass, 1995). Kelloway, Barling, Kelley, Comtois, and Gatien (2003)
found leaders can inspire innovation in followers through sending intellectually stimulating
emails for followers to read.
E-leadership requires community building which “develops over time among … group
members who share a commitment to a common goal” (van de Bunt-Kokhuis & Sultan, 2012, p.

42
4). E-leaders must focus on both the individual and the collective group to develop the shared
vision found in transformational leadership (Pulley & Sessa, 2001). E-leadership has also been
found to improve the communication and trust between the top and bottom of organizations
(Avolio et al., 2001; Bansal & Singh, 2005; Fahlman, 2012; Pulley & Sessa, 2001). E-leaders
give individualized consideration (Bass, 1995) to low level employees because of the increased
use of technology such as email, text messaging, and video conferencing where previously
leaders met only with middle managers. Effective e-leaders can also build trust in followers
(Avolio et al., 2001), and the moral integrity of leaders is a key component of transformational
leadership (Bass & Steidlmeier, 1999).
Cost-Effectiveness
In 1975 Henry Levin described a systematic method for evaluating educational programs
using a method he called cost-effectiveness. Levin wrote Cost-Effectiveness Analysis in 1983
and followed with a second edition in 2001, co-authored with Patrick McEwan. Levin and
McEwan (2001) describe the purpose of cost-effectiveness: “to provide a method for choosing
among alternatives in order to select those that are able to accomplish a given result most
parsimoniously” (p. 1). Shortly thereafter the authors wrote the following:
Lest we become overly optimistic, let us consider a dire scenario. In the wake of an
economic recession, the education revenues of a large urban district have declined
sharply. The district must eliminate several programs if it is to remain within its budget.
If the goal is to minimize the declines that might occur in student learning, which
programs should be eliminated? (Levin & McEwan, 2001, p. 2)
This quotation summarizes the current state of education (Oliff et al., 2012) and shows the
importance of CE evaluation. This study investigated cost-effective school districts and
43
attempted to discover how and why decisions were made.
Cost-Effectiveness Defined
In order to complete an educational CE analysis, educational leaders must only compare
“programs with similar or identical goals” and have a “common measure of effectiveness”
(Levin & McEwan, 2001, p. 11). For example, a district may find that many students are
dropping out of high school. To perform a CE analysis, a number of programs that purport to
stop high school dropouts would be analyzed by the district. One program may use after school
clubs to decrease the number of high school dropouts and another program may use peer
mentoring. The goal of each program is the same, and that is to reduce the number of high
school dropouts. Leaders cannot compare those programs to an after school tutoring program
aimed at increasing test scores because they do not have the same objective (Levin, 1988).
In addition to using the same measure of effectiveness, educational leaders must also
know the cost of each alternative program (Levin & McEwan, 2001). Costs are generally
monetary in value and encompass the price associated with implementing an entire program
(Levin & McEwan, 2001). The CE ratio becomes the cost associated with each program divided
by the effect of that program. The program with the greatest effect relative to the cost of
implementing the program is the most cost-effective.
In contrast to CE, Levin and McEwan (2001) describe three other methods of evaluation
of educational programs. Cost-utility analysis is used to compare educational alternatives while
comparing multiple effects (Levin & McEwan, 2001). Using the previous example of high
school dropouts, a school district may want to increase overall student academic achievement.
Educational leaders could compare a dropout prevention program to an after school tutoring
program aimed at increasing student academic achievement. The educational leaders may find

44
that increasing student academic achievement through the tutoring program has a greater effect
on overall student satisfaction when compared with reducing the number of high school dropouts
relative to the cost of each program. Caution must be taken by educational leaders when using
cost-utility analysis because of its “highly subjective estimates” (Berger et al., 2004; Levin &
McEwan, 2001, p. 19).
A second alternative to CE is cost-benefit analysis which compares two or more
educational programs but only compares the programs with regard to monetary values. The
effect of each program (student academic achievement, health, or well-being) is not compared
(Levin & McEwan, 2001). Using the previous scenario, the after school tutoring program may
have a high cost due to staffing issues when compared to a low-cost high school dropout
prevention program. The low cost alternative may be chosen without regard to personal
preference of educational leaders. Finally, cost-feasibility analysis evaluates programs with
regard to budgets or financial constraints. This analysis makes little attempt to decide which
educational program will be most effective, but only attempts to decide if a school system can
afford the program. For example, educational leaders may choose to implement both the after
school tutoring program and the dropout prevention program because monetary resources are
plenteous.
Current State of Cost-Effectiveness Research
Levin (2001) wrote “cost-effectiveness analyses, especially in education, are too rare” but
recently published articles suggest a change in this trend (p. 55). The researcher will first discuss
a few current CE studies followed by an analysis of the most prolific current author. This section
will conclude with an analysis of Boser (2011) due to the fact that the report identifies the pool
of participants in this study.

45
A French study published in 2012 found an early literacy program was more cost-
effective than simple class size reduction (Massoni & Vergnaud, 2011). A recent study using CE
analysis found that alternate routes of training special education teachers is more cost-effective
than traditional preparation (Sindelar et al., 2012). Another analysis of an early literacy program
called “Success for All” found students in the program were statistically significantly ahead of
their peers in reading and math (Borman & Hewes, 2002). Borman and Hewes (2002) also
suggested the “Success for All” program could be cost neutral if resources were reallocated.
This suggestion aligns with Boser (2011) because he suggests funding should be reallocated
within a district to provide a higher ROI as opposed to arbitrarily increased spending. A study
published in 2011 attempted to find a relationship between educational expenditures on
leadership and graduation rates (Ng, 2011). Although the study’s title used the words “cost-
effectiveness” there was no CE analysis present in the study. Further, the study found a negative
relationship between expenditures and graduation rates but did not clearly show a connection
between the two items. The study concluded that expenditures on educational leadership were
not cost-effective because graduation rates did not increase at an acceptable rate, but the actual
analysis along with a connection between the two topics is missing from the article (Ng, 2011).
While the medical field increasingly uses CE analysis, a few of the studies have a
connection to education. One recent study found a multimedia program for stoma patients was
more cost-effective than traditional education classes teaching the same content and skills (Lo et
al., 2009). Another study discussed the CE of training students to use automated external
defibrillators in high schools (Berger et al., 2004). The program found the training was much
more cost-effective than the possible loss of life, but this research “arbitrarily” assigned a
number to the value of a life (Berger et al., 2004, p. 660). This example is provided to note the

46
difficulty of completing a cost-effectiveness analysis in all circumstances.
Most prolific current author. Beginning in 2007, Yeh began comparing the cost of
rapid feedback with numerous educational programs (2007, 2008, 2009a, 2009b, 2010a, 2010b,
2012). In each study, Yeh compared the effect size of different educational programs to the
effect size of studies on rapid feedback. Among others, Yeh suggested rapid feedback is more
cost-effective than smaller class sizes (2009a), National Board Certified Teachers (2010b),
value-added teacher assessments (2012), and school vouchers (2010a).
Although Yeh provided a significant number of CE studies, there are glaring
methodological and theoretical issues in the studies. First, Levin and McEwan (2001) argued
against using effect sizes in CE research (p. 2), and Yeh used effect sizes in his analysis.
Previous research by Levin, Glass, and Meister (1986) criticized the use of effect sizes because
they use “averages of studies with unknown properties” conducted over a number of years (p.
71). Although it is possible to compare effect sizes, Yeh does not address the fact that his
evaluation violates the theoretical assumptions made by Levin and McEwan. Further, Yeh often
uses effect sizes found in meta-analysis articles. Unless the meta-analysis carefully evaluated
and eliminated substandard articles from the meta-analysis, the average effect size could be
seriously flawed.
In addition to theoretical issues, there are specific comparisons used in Yeh’s CE
evaluation that are not substantiated. For example, Yeh’s 2012 study stated the cost of using
value-added methods to evaluate teachers has “low reliability…reduces student achievement”
and was “extremely expensive” (p. 374). For his evaluation, Yeh used a benchmark of 40%
teacher turnover – meaning that 40% of teachers will be removed annually based on poor
performance. However, Yeh discussed dismissing teachers in his 2008 article concerning raising

47
teacher quality. In that article, Yeh described removing the bottom quartile of novice teachers
after two years of work. This amounts to just 2% of the entire teaching force (Yeh, 2008). No
published literature suggests the removal of 40% of the teaching force each year, as the cost of
rehiring and training 40% of the teaching faculty each year would be astronomical. Yeh (2012)
noted that “federal policy endorses this approach by directing federal funds to states that adopt [a
value-added model]” but he does not state criterion that would define effective versus ineffective
teachers (p. 375). Yeh (2012) also does not justify this use of a 40% benchmark (Yeh, p. 381).
He writes “the working assumption is that the teachers are replaced annually. This may be
impractical” (Yeh, 2012, p. 381). Further evaluation is necessary to make more accurate
comparisons.
Return on investment. As part of the Center for American Progress, Boser (2011)
produced the first district by district comparison of educational productivity. Using a regression
analysis, Boser compared and ranked public school districts using state achievement test results
and per pupil expenditures while accounting for student demographic differences. Each school
district used in the study was required to have at least 250 students. The achievement tests only
measured 4th, 8th, and 12th grade students. The achievement tests were state specific, measured
math and reading achievement, and allowed comparisons to be made from district to district.
Comparisons cannot be made in districts from different states because the standardized tests are
not the same. The study used 2008 per pupil expenditure data which was the most recent data
available. The study also adjusted the results for “cost-of-living differences” which were defined
by the author as “low income, non-English speaking, and special education students” (Boser,
2011, p. 7). Low-income and non-English speaking students were weighted 1.4, or they cost
140% of the amount of a typical student to serve. Special educated students were weighted 2.1

48
or 210% of the amount of a typical student to serve. By making this adjustment, districts were
not unfairly penalized due to a large percentage of students being from historically
disadvantaged environments (Boser, 2011).
Using this data allowed Boser (2011) to place each school district within a 3 x 3 matrix.
The x axis had low, medium, and high achievement and the y axis had low, medium, and high
cost. The categories were split evenly (33% each). Using this matrix, Boser (2011) was able to
identify the most and least productive school districts using this basic return on investment index
(p. 18). Boser (2011) then ran two regression analyses on the data to compute the adjusted
return on investment index rating (p. 20) and the predicted efficiency index rating (p. 21).
The results of this study fit into the framework of CE analysis. Levin and McEwan
(2001) wrote “when costs are combined with measures of effectiveness and all alternatives can
be evaluated according to their costs and their contribution to meeting the same effectiveness
criterion, we have the ingredients for a [cost-effectiveness analysis]” (pp. 10-11). First, a
consistent measure of analysis is used because student academic achievement test scores from
the same year from the same state from the same age of students are used to compare schools.
Second, each alternative, or school district, is evaluated based on their published per pupil
expenditures.
In addition to meeting the criteria of a CE analysis, this study meets the criteria of a
published research article. The study gives a clear description of the historical background, the
methodology used in the study including the regression equation, and a summary of finding and
implications. The two missing components of the study are a thorough review of the literature
and a stated theoretical framework. Gall et al. (2007) provide a protocol for evaluating research
reports, and this study provides answers to most of the 17 areas mentioned (pp. 618-621). The

49
study could easily be replicated due to the clarity of the description and the specific references to
data used in the study. In addition to meeting the standards of published research, Boser (2011)
agrees with other experts in the field. When discussing solutions to budget issues and school
district consolidation, Levenson (2012) wrote “refocusing, not cutting, is the best way to …
ensur[e] better outcomes at lower costs” (p. 13).
When considering the most recent work in CE research, one can draw some conclusions.
First, quantitative measures are the primary source of CE data which means that qualitative
measures have not been used to discover how or why CE is achieved. Transformational
leadership may provide answers to why certain school districts are able to achieve greater results
due to the fact that leaders have “transformed their followers” to greater levels of efficiency
(Bass, 1993, p. 375). Second, caution should be taken when interpreting results of CE studies
due to the data being used to make comparisons. Finally, CE evaluations can provide accurate
analysis and provoke meaningful educational discussions.
Public School Districts
The following section of the literature review will discuss the history of public school
districts in America, school district consolidation, and current trends of school district
evaluation. Beginning in the 1930s, the optimal size of school districts has been debated with
research findings suggesting many different optimal sizes (Dawson, 1934). While Dawson
(1934) suggested school district sizes of around 10,000, Faber (1966) noted that smaller school
district sizes of around 2,500 were optimal. Since that time, a number of studies have been
completed with results varying between 500 and 20,000 being the optimal size for a school
district (Banzhaf & Bhalla, 2012; Brasington, 2003; Driscoll et al., 2003; Garner, 1998; Hanley,
2007; Heinesen, 2005; Jones, Toma, & Zimmer, 2008; Lindahl & Cain, 2012; Ornstein, 1989;

50
Strike, 2008; Ulbrich, 2010). One of the most recent studies suggests that school district size
may have little effect on student academic achievement. Lindahl and Cain (2012) found that
school size had little effect on student academic achievement for regular and special education
students, but there was an inverse relationship between the number of low-socio economic status
students and student academic achievement. This finding, along with Robertson (2007), bolsters
the methodology used by Boser (2011) because Boser adjusted his quantitative ROI findings
because of cost-of-living differences. Robertson (2007) also controlled for percent of English
Language Learners and the percentage of college graduates among adults in each attendance
zone.
A 2008 study by Diaz found school size and school district size in Washington were not
correlated with differences in student academic achievement. The study did suggest
socioeconomic status was a predictor of student academic achievement, and this concurs with
other research (Lindahl & Cain, 2012). However, a careful inspection of the statistical analysis
found that regression to the mean could explain a lack of statistically significant differences
(Howell, 2011). For example the Diaz (2008) study used scores of 20,000 students in the
smallest school size (500-999 students per school, n = 43) and compared them to the scores of
approximately 25,000 students in the second school size (1000-1499 students per school, n = 25).
Such a large sample size could have hidden any differences, and there was no attempt to equalize
groups in the study.
School District Consolidation
A recent topic of political discourse is school district consolidation (Banzhaf & Bhalla,
2012; Sanders, 2011). Jones, Toma, and Zimmer (2008) reported there were nearly 120,000
school districts in America in 1940, and that number has decreased to only 15,000 school

51
districts in 2000. Although some policy makers suggest larger school districts will decrease
funds spent on administration, research suggests other problems may arise. Jones et al. (2008)
conducted a multiple regression study and noted an inverse relationship between school district
size and attendance rates. The results suggest larger school districts have difficulty keeping
students in school. In contrast “there is particular hope that small schools are good for poor and
minority students” because smaller schools can focus on individual student needs (Strike, 2008,
p. 169). Smaller districts are also able to “respond better to parental input” and “compete with
one another for students” (Banzhaf & Bhalla, 2012, p. 820).
There is a steady stream of research that promotes school district consolidation. A study
of rural school systems in New York found consolidation of school districts with less than 500
students offered significant cost savings (Duncombe, Miner, & Ruggiero, 1995), and another
study in Alabama suggested consolidation of districts with less than 350 students could save up
to 40 million dollars annually (Dodson & Garrett, 2004). The state of Iowa is promoting school
district consolidation through tax benefits and is suggesting whole grade sharing (Gordon &
Knight, 2008). To illustrate the concept of whole grade sharing, consider consolidating two
school systems from neighboring towns. One town will have a middle school and the other town
will have the high school. This way both communities are part of a school system. This
program has not seen a rise in student academic achievement or a decrease in dropout rates, but
the program has had a surplus in revenue (Gordon & Knight, 2008). Other benefits of school
district consolidation are increased diversity and social justice (Alsbury & Shaw, 2005), and a
rise in lower priced home values (Hu & Yinger, 2008).
While proponents of school district consolidation offer evidence of their position, other
educational research attempts to refute those claims. The study that found a rise in lower priced

52
homes also found that more expensive home values fell because of school district consolidation
(Hu & Yinger, 2008). Shakrani (2010) compiled a rough cost-effectiveness analysis suggesting
the consolidation of 10 Michigan counties, but Arsen (2011) suggested the analysis was faulty
due to poor estimation of potential savings, faulty procedures, and loss of tax revenue from a
decrease in home values. Further, research is now open to the possibility of school district
deconsolidation. Berry and West (2010) found smaller schools had higher student academic
achievement and higher graduation rates, and large school districts reallocate money that used to
go to different superintendents by hiring additional middle level administrative staff (Howley,
Johnson, & Petrie, 2011). Another study suggested combining small school districts up to a
population of around 3,000 students or deconsolidating school districts to 3,000 students per
school district. According to Spradlin, Carson, Hess, and Plucker (2010), “If the goal is to save
tax revenues, then deconsolidation is a better option” than compulsory consolidation (p. 3).
In addition to problems with attendance and personal attention, large school districts
often have increased costs due to secondary services. Hanley found that Iowa school districts
were consolidated but had to increase their per pupil expenditures due to busing students from
longer distances (2007). CE of school district consolidation is often limited to savings at the
administrative level with little regard to cost increases in secondary services (Hanley, 2007).
Recent work in by Levenson (2012) suggests many alternatives to cost increases in secondary
services. For example, school districts can coordinate services across districts, work together to
increase buying power, or disassociate with unions to promote healthy competition (Levenson,
2012). To complete an accurate CE analysis, educators must factor in all costs associated with
school district consolidation.
Although many studies suggest smaller school districts will result in higher student

53
academic achievement, the totality of educational literature is not in agreement. For example, a
2005 study by Heinesen found larger school districts in Denmark were more likely to have
higher student academic achievement and send more students to college. Smaller, rural school
districts were much less likely to encourage students to attend a university later in life (Heinesen,
2005). Near the same time period, Driscoll et al. (2003) published a study that suggested large
school districts in California were associated with lower student academic achievement.
However, the results of the study were called into question because one participant, a large
California school district, skewed the results. By removing the outlier from the data, the results
of the study are not conclusive.
A common theme in school district consolidation literature is the fact that communities
will be impacted, and often in a negative fashion. Students, teachers, and administrators whose
schools were restructured felt less supported educationally, had fewer extra-curricular
opportunities, spent longer times on buses, and parents participated less in the new schools
(Howard, Wrobel, & Nitta, 2010). One administrator noted a rise in discipline incidents but
remarked “if you take them up there and trap them for an hour, what do you expect?” (Howard et
al., 2010, p. 22). School districts can find successful conclusions to the consolidation process if
they build relationships with communities through communication, maintain facilities in the old
community, and work towards a new identity that all communities can gather around (Dodson &
Garrett, 2004; Hyndman, Cleveland, & Huffman, 2010; Howard et al., 2010; Warner & Lindle,
2009).
School District Evaluation
Regardless of the size of public school districts, all school districts are being evaluated
based on their average student academic achievement. An earlier study by Alvik (1995)

54
reviewed the concept of school based evaluation and noted that multiple aspects of a school
system should be evaluated. King and Rohmer-Hirt (2011) more recently found that evaluation
should include a “description of the multiple variables of the educational programs that have
generated [standardized test scores]” (p. 81). These findings suggest that the effectiveness of a
school district is not explained in a quantitative measure (like student academic achievement or
CE ratio), but it must be searched out and explained in all of its complexities.
The role of administration in school district evaluation has seen recent changes. Wright
and Harris (2010) found superintendents can have a positive effect on student achievement by
embracing cultures of the school district. A superintendent must “cause [teachers] to embrace
and promote the district’s vision” and this finding aligns with the intellectual stimulation
component of transformational leadership (Bass, 1995). However, central office staff can
“impede school reform” when they do not exhibit characteristics of transformational leadership
(Bjork & Blasé, 2009, p. 199). Leaders that do not “contribute to enhancing individual
commitment and build a sense of community and shared ownership” do not promote positive
improvement in a school district (Bjork & Blasé, 2009, p. 197).
There is a growing body of literature that suggests ways to evaluate school districts based
on their expenditures. Jacques and Brorsen (2002) found that “test scores were positively related
to expenditures on instruction” but there was a negative correlation between expenditures on
administration and student academic achievement (p. 997). Houck et al. (2010) found school
districts that spend less on special education are more efficient than schools spending increased
amounts of money in this area (2010). This finding bolsters Boser’s (2011) work because he
allocated additional funds in his statistical analysis for special education students. Houck et al.
(2010) agreed with Jacques and Brorsen (2002) in that both studies found that expenditures on

55
administration often resulted in less student academic achievement.
One item of agreement among school district evaluation studies is the fact that central
office policies and procedures can be completed more efficiently to save money (Houck et al.,
2010; Hentschke et al., 2009; Howard et al., 2010; Nitta, Wrobel, Howard, & Jimmerson-
Eddings, 2009). Nitta, Wrobel, Howard, and Jimmerson-Eddings (2009) suggest “eliminating
central office positions and redistributing resources to schools” as part of the evaluation process
(p. 463). Research is needed to discover how certain school districts decide how to allocate
resources to central office staff while spending most of the resources on classroom instruction.
South Carolina School District Organization
Ulbrich (2010) prepared a report on school district organization in the state of South
Carolina. Ultimate governance of the schools in South Carolina is the responsibility of the South
Carolina Department of Education. The Department of Education controls funding, curriculum,
and local taxation which provides funds to school districts for building new schools. The state of
South Carolina has 84 school districts and 30 of those districts serve students of a single county.
Most school districts serve students only within county lines.
Fiscal responsibility varies across the state with 23 districts having fiscal autonomy while
26 districts have no fiscal autonomy. Some counties (like Spartanburg or Anderson County)
have multiple districts within the county, and the school districts work together to allocate
resources among the school districts. For example, if one district gained a disproportionate share
of local tax money due to an increased quantity of business infrastructure, they would share
resources with other districts. This system affects one of the participants in the study
(Applewood School District). In 2010 the state provided 50% of school funding, local revenue
provided 41%, and 9% of revenue came from federal aid (Ulbrich, 2010, p. 14).

56
There is debate in South Carolina concerning consolidation of school districts, but only
four school district consolidations have occurred in the last 20 years. Ulbrich (2010) suggests
that “diseconomies of scale (rising costs associated with bureaucracy) appear to set in past a
student enrollment of 15,000” in a particular school district, and this observation is in line with
previously published research (p. 10). Ulbrich (2010) goes on to suggest that sharing services
could reduce cost and give “access to specialized academic resources” (p. 18). For example,
small districts could use gymnasiums from other schools or band together to create a greater
purchasing power when buying supplies. There are some problems with counties that have
decided not to consolidate. Ulbrich (2010) noted that some wealthier school districts are
reluctant to share resources with poorer school districts in the same county and only a few
districts “have an actual coordination agency that has any fiscal authority” (p. 26). An
investigation of the fiscal authority of each participating school district may shed light on why
some districts provide a high ROI.
Summary
CE research affords educators and policy makers the ability to make sound decisions
regarding educational expenditures. While there are a significant number of quantitative studies
that investigate the CE of educational programs, there is a lack of qualitative studies
investigating the decision making processes used by cost-effective school systems. The theory
of transformational leadership suggests that certain leaders can inspire followers to higher levels
of performance due to idealized influence, individualized consideration, inspirational motivation,
and intellectual stimulation (Bass, 1995). Qualitative research needs to be conducted to provide
a description of the decision making process in cost-effective school districts so other school
districts can improve student academic achievement.

57
CHAPTER THREE: METHODOLOGY
Changes in public education funding (Oliff et al., 2012) and persistent demand for
increased student academic achievement (Banzhaf & Bhalla, 2012; Cavanagh, 2012; Gray, 2012;
Ornstein, 2010) have forced educators to examine the impact of funding in public education.
Boser (2011) found certain school districts provide a high “return on investment” (ROI) despite
student demographics that are commonly found to be associated with below average
achievement (King & Rohmer-Hirt, 2011; Lindahl & Cain, 2012). While cost-effectiveness
(CE) research has been used in education for over three decades, there is a lack of literature
explaining the decision making process of creating a cost-effective school system. Boser’s
(2011) report suggests specific school districts are able to achieve above average student
academic achievement while keeping per-pupil expenditures below average, and qualitative
research is “required for the evidence to make sense” (Donmoyer, 2012, p. 672). A multisite
case study needs to be conducted on high ROI school districts to discover “why” and “how”
certain school districts are able to achieve this balance (Yin, 2009, p. 9).
Design
This qualitative study employed a multisite case study design (Yin, 2009). This design is
often “compelling” and “robust” in that it provides a measure of replication similar to that of a
quantitative study (Yin, 2009, p. 53). Yin notes when studies are “explanatory,” a case study is
an effective method to answer those types of questions (2009, p. 9). CE research is well
established in educational literature, but there are few, if any, studies that explain the
mechanisms behind operating in a cost-effective environment. Correlation and regression
studies may suggest the best available option, but they lack a full description of the decision
making process. Furthermore, a case study is a viable option in this instance because case

58
studies allow “a full variety of evidence – documents, artifacts, interviews” to be studied in order
to provide a full description of the specific case (Yin, 2009, p. 11). The case study also benefits
from the development of leadership theories and prior research on CE (Yin, 2009) because the
theory and research can guide the study while the results of the study may extend theory and
explain prior research.
Specifically, this research study employed a multisite case study design with a single unit
of analysis, three South Carolina public school districts (Yin, 2009). Out of 84 South Carolina
public school districts, 12 school districts were identified by Boser (2011) as providing a high
ROI, and three school districts were invited into the multisite case study. One school district,
Applewood School District, was invited to join the study because of the connection with one of
the members of my dissertation committee. The other two districts were purposefully chosen to
obtain sites with different sizes, locations, and district office structure. One school district
declined and another school district was invited to participate in the study. Having three
different school districts to investigate allows themes and similarities to emerge between the
schools districts.
In each school district, school report card data and archival records were collected, and
different personnel were interviewed. These are the “embedded” units of analysis (Yin, 2009, p.
46). Within each site, different perspectives were ascertained and this gave a thick description of
each case. Comparisons and themes emerged by comparing data and interviews collected from
individual districts and then comparing all of the data across separate districts. By extending the
case study to several sites, different data sources, and multiple groups of people, I “ensured [that]
the bigger picture [was not] lost” which might have occurred if only one site or data source was
used (Munyua & Stilwell, 2009, p. 6).

59
Research Questions
The following research questions (RQ) guided the study:
1. What is the structure of the school district leadership and how do the inner workings
function?
2. How does the school district leadership encourage student academic achievement?
3. How does the school district leadership allocate financial resources?
Setting
Three school districts took part in this study. Appropriate pseudonyms were added to this
description once three districts agreed to participate in the study. Further, special care was given
to protect against deductive disclosure which “occurs when the traits of individuals or groups
make them identifiable in research reports” (Kaiser, 2009, p. 1632). Kaiser (2009) suggests data
must be left out or cleaned to protect anonymity, and this may involve not publishing certain
identifying information.
School Districts
Boser (2011) identified 12 South Carolina school districts that had high ROI. I invited
three school districts to take part in the study. A full description of each school district is
provided in chapter four of this document, including student achievement, poverty rates, and
other descriptive data found on South Carolina school report cards (South Carolina Department
of Education, 2013).
I used purposeful sampling to choose three school districts and obtain district permission
to use them in my study (Creswell, 2007; Elliot et al., 2011; Purcell et al., 2007; Wright &
Harris, 2010). The sampling can be described as both “criterion” and “maximum variation”
(Creswell, 2007, p. 127). The sampling is criterion based because only districts that are rated in

60
the highest category will be invited into the study.
I was careful to attempt to find maximum variation in the three selected school districts.
I attempted to find three school districts with differences in geographic location, demographics,
district size, and district office structure. For example, eight of the 12 school districts come from
counties with multiple school districts, and four school districts are county-wide. Using cases
with different central office structures may illustrate how to be cost-effective despite
organizational structure differences (Hanley, 2007; Jones et al., 2008). Finally, I chose school
districts that could help answer each research question (Purcell et al., 2007). School districts
allowed access to the business manager or financial director in order to ascertain information to
answer RQ 3. A full description of the research study was presented to each district prior to
including them in the study. Table 1 lists information about each school district that elected to
participate in this study. Following Table 1, individual districts and participants from each
district are described.

61
Table 1
Summary of Three School Districts
Applewood
School District
Grandview
Unified School
District
Blue Ridge
School District
Number of students
2,862
10,345
5,166
Dollars spent per pupil $7,434 $8,287 $8,852
Average teacher salary $49,610 $48,980 $49,383
ESEA federal accountability
ratinga
90.8% (A) 84.5% (B) 92.8% (A)
Subsidized meals b 57.8% 55.8% 60.6%
On-time graduation rate 77.6% 78.7% 75.1%
Annual dropout rate 0.6% 2.9% 3.0%
HSAP passage rate spring 2012 92.3% 92.4% 93.2%
Percent of expenditures for
instruction
56.6% 59.4% 57.1%
Note. Data collected from 2012 South Carolina School Report Cards. ESEA = Elementary and
Secondary Education Act; HSAP = High School Assessment Program. a ESEA grades: A = Performance substantially exceeds the state’s expectations; B = Performance
exceeds the state’s expectations (SCDE, 2013). b Subsidized meals percentage calculated using number of students receiving subsidized meals
divided by number of students taking Palmetto Assessment of State Standards (PASS) testing
(grades 3-8).
62
Participants
In each school district, five administrators were interviewed to help answer the research
questions. The interviews were conducted at the convenience of the participants and lasted for
between 43 minutes and 1 hour and 41 minutes (M = 61 minutes) (Elliott et al., 2011; Farrell &
Collier, 2010; Kim & Hannafin, 2011; Zhao & Ma, 2009). One administrator was a district
office staff member who was familiar with curriculum and instruction. This person understood
standardized testing and selection of curriculum. One administrator was a district office staff
member that was familiar with finances and budgeting. This participant had an in-depth
understanding of the school district’s budgeting process. Although they may not give away
confidential information (such as individual salaries), they were able to discuss allocation of
money, hierarchy of monetary responsibility, and accountability of funds.
The other three participants were principals from district schools. The principals could
have worked at the elementary, middle school, or high school levels. All principals were
certified by the state of South Carolina and had worked in the district for at least one year. These
principals gave valuable insight to the mission and goals of the district from different
perspectives. Below are descriptions of the three school districts that participated in the study
and participants from each school district.
Applewood School District. The first school district to take part in this study is
Applewood School District. This school district has nearly 3,000 students and has only four
schools: primary, elementary, middle, and high school. The 2011 graduation rate was 79.7%,
and the attendance rate for both teachers and students was nearly 96%. The school district has a
board of nine elected members, and they have overall fiscal authority for the district. The
district’s SAT scores were slightly below state and national averages while their ACT scores

63
were above state and national average (South Carolina Department of Education, 2013). U.S.
News and World Report ranks Applewood School District among its best high schools (12th in
South Carolina), and they received an overall silver rating (U.S. News and World Report, 2012).
Applewood School District (ASD) was chosen for two primary reasons. First, one of the
members of my dissertation committee is an employee of the district and is providing
“gatekeeper” access to the site (Creswell, 2007, p. 125). Second, Applewood School District is a
convenient site for the study, but it has a track record of academic excellence combined with
fiscal responsibility.
Participants from ASD were invited to participate in the study after being contacted by
email. There were only four principals in the district, and I have a personal connection with one
of the principals. This person was not included in the study. The other three principals accepted
an invitation to participate in the study. I also contacted the chief financial officer and the
director of curriculum and instruction in the district. Both participants agreed to take part in the
study. In Table 2, information is given about each participant.

64
Table 2
Participants from Applewood School District
Name Position Gender Race Years of
Experience
Mr. Smith Chief Financial Officer Male White 16
Ms. Johnson Curriculum and Instruction Female White 40
Ms. Williams Middle School Principal Female White 31
Ms. Jones Elementary School Principal Female Black 30
Ms. Davis Primary School Principal Female White 28

65
Grandview Unified School District. The second school district to take part in this study
is Grandview Unified School District. Grandview Unified School District (GUSD) is located in
the southeastern United States and sits outside of an urban expanse with some distinctly rural
fringe areas. The district serves approximately 10,500 students and earned an Excellent report
card rating in 2013 with a growth rating of Excellent. The high school graduation rate was
72.7% in 2007 and has grown almost 15% points to 87.4% in 2013.
The district serves a student population where approximately 52% of the students receive
free/reduced meals. The district has seen considerable growth in overall performance and
graduation rate. The school report card rating has grown steadily from Below Average in 2009
to Excellent in 2013. Of the 18 schools in the district, 15 were honored as Palmetto Gold or
Silver award winners in 2012 compared to only five schools being honored in 2008. The district
average for end of course testing is above state average, and the district was above average in
end of course testing in Algebra 1 and English 1. The dropout rate is 0.5% below the state
average.
I contacted the superintendent from GUSD to receive permission to conduct the study
there. The superintendent gave permission and a list of principals who wanted to be included in
the study. I contacted the first elementary, middle, and high school principal on the list, and all
three agreed to participate. Then, I contacted the chief financial officer and the superintendent
who were also on the list of volunteers. All participants were given informed consent forms
prior to agreeing to participate in the study. Table 3 lists information about each participant.

66
Table 3
Participants from Grandview Unified School District
Name Position Gender Race Years of
Experience
Mr. Miller Chief Financial Officer Male White 12
Dr. Moore Superintendent Male White 38
Mr. Taylor High School Principal Male White 30
Ms. Anderson Middle School Principal Female White 24
Ms. Thomas Elementary School Principal Female White 19

67
Blue Ridge School District. Blue Ridge School District (BRSD) is located in the
southeastern United States and is a primarily rural district with a common city-center. The
district serves approximately 5,100 students and earned an Excellent report card rating in 2013
with a growth rating of Excellent. The High School Assessment Program (HSAP) passing rate
has been higher than state average every year since 2008, and the graduation rate has been higher
than state average five of the six years since 2008.
According to the state department of education website, the district poverty index was
70.88% in 2011. Since 2008, the district has seen considerable growth in overall performance
and graduation rate. The school report card rating of district schools has increased as a district
and in individual schools. The school district, the middle school, and one elementary school
increased two levels and are now rated Excellent. The high school and one elementary school
increased one level, and the four remaining schools stayed consistent year to year. No school has
declined in performance when comparing 2008 levels to 2013 levels. Five of the eight schools in
the district received Palmetto Gold or Silver Awards for the 2012-2013 school year. The dropout
rate has dropped from 4.8% to 1.7% over the same period. The district average (77.5%) for end
of course testing in all subjects is 7% higher than state average.
Participants from BRSD were contacted via email and phone calls and all volunteered to
participate in the study. All participants were given informed consent forms prior to agreeing to
participate in the study. Table 4 lists information about each participant.

68
Table 4
Participants from Blue Ridge School District
Name Position Gender Race Years of
Experience
Ms. Jackson Chief Financial Officer Female White 14
Mr. White Assistant Superintendent Male White 37
Mr. Harris Career Center Director Male White 23
Ms. Martin Elementary School Principal Female White 27
Mr. Thompson Elementary School Principal Male Black 18

69
Procedures
This qualitative study employed a multisite case study design with a single unit of
analysis, three South Carolina public school districts (Yin, 2009). After receiving permission to
conduct the study from Liberty University’s Institutional Review Board, I conducted a pilot
study to “refine my data collection plans” (Yin, 2009, p. 92). The pilot study was a full “dress
rehearsal” for the in-depth case study and analysis to be used afterwards (Yin, 2009, p. 92). I
analyzed the interview questions used in the pilot study and discussed logistical concerns (Gall et
al., 2007; Yin, 2009). Further, I reported “lessons learned” from this activity and conducted the
actual case study after making necessary modifications which are described below (Yin, 2009, p.
94). I was able to evaluate my recording device to make sure that interviews could be clearly
heard for later transcription (Gall et al., 2007).
Pilot Study
I contacted Eagle Heights School District (pseudonym, as are all other names) to see if I
could use participants from the district for a pilot study. The assistant superintendent from Eagle
Heights School District asked for a preliminary meeting to discuss my methodology and
confidentiality measures, and the 30 minute meeting took place at the district office. After
meeting with the assistant superintendent of instruction, I received documented permission to
conduct the study. I secured interviews with the assistant superintendent of instruction, the chief
financial officer, one middle school principal, and two elementary principals. Each participant
met the qualifications required for the study.
Interviews took place during two weeks in July 2013 at the office of each participant.
Each participant was assured of anonymity and given an informed consent form. Interviews
followed the semi-structured interview protocol. Interview sessions ranged between 39 minutes

70
and 1 hour and 13 minutes (M = 51 minutes). I used an application on my smartphone, Easy
Recorder, and a program on my laptop, Sound Recorder, to record each interview. I then fully
transcribed one of the interviews to check the audio quality. There were no problems with audio
quality on either of the devices, and my laptop recording was used to back up the phone
recording as the phone recording was slightly easier to understand. I also discussed access to
archival records with the participants of my pilot study. I was able to easily locate many records
online and other archival records were kept at the district office.
An advantage of the pilot study was the opportunity to evaluate the interview questions
(Gall et al., 2007). There were questions that appeared “threatening” or ones that made
respondents feel “uneasy talking about the topic” (Gall et al., 2007, p. 253). Changes were made
to the interview protocol, and they are described below in the data collection section of this
chapter.
After implementing modifications from the pilot study, I conducted the multisite case
study at three South Carolina public school districts. Utilizing the 12 South Carolina school
districts that were rated high ROI (Boser, 2011), I employed purposeful sampling to choose three
school districts and obtained district permission to use them in my study (Creswell, 2007; Elliot
et al., 2011; Purcell et al., 2007; Wright & Harris, 2010). Each participant was given a Consent
Form (Appendix A). I was careful to attempt to find maximum variation in the three selected
school districts. For example, I attempted to find school districts with differences in geographic
location, demographics, size, and district office structure.
Once site access was permitted, I began collecting data from a multitude of sources in
order to achieve triangulation (Creswell, 2007; Yin, 2009). I interviewed district office leaders
responsible for curriculum, instruction, and assessment, along with business managers and three

71
principals from each school district. I obtained information from the South Carolina State
Department of Education’s website (http://www.ed.sc.gov/) which provides over ten years of
district report cards. This information listed per pupil expenditures, student demographics,
educator demographics, parent survey information, and measures of student academic
achievement. Specifically, measures of student academic achievement were Absolute Rating;
Growth Rating; Federal Accountability Rating (met/not met Adequate Yearly Progress as part of
No Child Left Behind); Palmetto Assessment of State Standards scores in reading, math, science,
social studies, and writing; and National Assessment of Educational Progress scores in math and
reading from 2012. Current student academic achievement data was compared to 2008 student
academic achievement. Student academic achievement from 2008 was used as a benchmark
because 2008 student academic achievement was used in the Boser study to identify high ROI
districts. Finally, I obtained a copy of publically available archival records (Bjork & Blasé,
2009; Hentschke et al., 2009; Ryan et al., 2007). I asked school districts for school board
minutes, government reports, strategic plans, mission statements, grant applications, school
forum notes, accreditation reports, and school improvement committee meeting minutes. All
data was stored in a locked filing cabinet in my school office. Transcriptions of interviews were
password protected. Following the collection of data, I began answering the three research
questions.
Personal Biography
I am currently in my 10th year in education and have spent time as an elementary, middle
school, and high school teacher. I have two advanced degrees and National Board Certification
in Early Adolescence Mathematics. I have spent eight years in public education and two years in
private education. I am currently in my first year of administration as the principal of a private

72
school. My varied background does give me a wealth of experiences to compare information
against, and I do not believe this presented any conflicts.
My role in this research project was that of an unbiased observer or reporter. I also
considered myself to be the “human instrument” in this study because I needed to “cope with an
indeterminate situation” (Lincoln & Guba, 1985, p. 193). A survey or questionnaire is not able
to capture all of the complexities of a school district, and I needed to adapt my inquiry based on
my initial discoveries. I do not have a professional connection with any school district that was a
part of this study. I do have some personal relationships with Applewood School District
personnel. My brother-in-law is the principal of the district’s high school. Also, I used to work
with a teacher whose father is the superintendent of the school district. This relationship may
have helped me obtain access to the district, but it did not have any effect on the information that
was obtained as part of this study. My personal biases may have influenced this study as stated
in chapter one. I believe all students can learn regardless of background (Parveen et al., 2011;
Winters & Cowen, 2012), I believe wisdom can be gained from listening to experts, and I do not
believe that adding additional funds to education will necessarily improve the results. I believe
the human element is the critical aspect of education.
Data Collection
Data collection involved three sources to allow for triangulation (Creswell, 2007; Gall et
al., 2007; Yin, 2009). I used school report card data, archival records, and interviews.
School Report Card Data
First, school report card data was collected from the South Carolina Department of
Education website. These reports present student demographics, teachers, Elementary and
Secondary Education ACT (ESEA) federal accountability ratings, state testing information, per

73
pupil expenditures, and measures of student academic achievement mentioned above. This
information was used as background to compare against information gathered in interviews. For
example, there may be a significant number of underperforming minority students in the district.
In the interview questions, I asked about district initiatives that have been proposed. I found that
the district central office used data to find current and potential problems, and they were trying to
address each problem area.
Archival Records
Yin (2009) notes that statistical data, charts, and organizational records are considered
archival records. When asking permission to conduct the study, I asked each school district for
school board minutes, government reports, strategic plans, mission statements, grant
applications, school forum notes, accreditation reports, and school improvement committee
meeting minutes (Bjork & Blasé, 2009; Hentschke et al., 2009; Ryan et al., 2007). This request
is listed on the informed consent form (Appendix A). During the interview with each participant
I verbally requested these records. A final request was made via email during the month of
February. Table 5 lists types of documents requested and the types of documents I received.

74
Table 5
Summary of Archival Records
Applewood
School District
Grandview
Unified School
District
Blue Ridge
School District
School board minutes
Complete
record online
and/or emailed
from site
Complete
record online
Complete
record emailed
from site
Government reports Complete
financial audit
reports found
online
Complete
financial audit
reports found
online
Complete
financial audit
reports found
online
Strategic plans None given None given None given
Mission statements Complete
record online
Complete
record online
Complete
record online
Grant applications None given None given None given
School forum notes One set of notes
from one
meeting at one
school
None given None given
Accreditation reports None given None given One record
found online
School improvement
committee minutes
One set of notes
from one
meeting at one
school
One set of notes
from one
meeting at one
school
None given

75
I asked for records from 2008 to the 2013. I decided to collect records from 2008 because that
was the same year of the data used in the Boser study, and there were cuts in state funding during
2008 due to financial difficulty in South Carolina (Davenport, 2008). These records allowed me
to see trends over a number of years. This documentation provided self-directed initiatives that
each district decided to follow, and they showed the district’s priorities.
Interviews
Semi-structured, focused interviews took place with five members of each school district.
Semi-structured interviews give “considerable insight pertaining to the way leaders motivate
followers and influence change” (Vinger & Cilliers, 2006, p. 3).
Because I conducted a pilot study I was able to review the quality of my interview
protocol. I concluded a few questions needed to be changed. I eliminated question 11 which
asked about key indices of academic achievement. With all five pilot study interviews, the
participants had already clearly described their key indices of student academic achievement.
The question was redundant, and the participants appeared to think that I had not been listening
when I asked them a question they previously answered. I also chose to modify question 15.
The question previously stated, “Please describe the most efficient and the least efficient way to
use funding in your district.” Most of the participants declined to state any way their district was
inefficient in its use of funds. I modified the question to ask “Is there any way you would
reallocate funds in your district?” This question was much more open and did not ask
participants to make negative comments about their districts.
Finally, I added a direct question regarding return on investment. I asked each participant
“Why do you believe your school district provides a high return on investment?” I believe this
direct question was necessary to obtain a clear answer to the overall purpose of the study. I

76
contacted Liberty University’s Institutional Review Board and my doctoral chair to submit a
Change in Protocol Form. Permission to make changes was granted and a copy of the
permission form is in Appendix I.
I interviewed two members of the district office staff and three building principals. The
following interview questions guided the semi-structured interview:

77
Table 6
Standardized Semi-Structured Interview Questions
__________________________________________ ________________
Questions
____________________________________________________ ___ _________
School District Structure
1. Please describe your school district.
2. What is the administrative structure of the school district?
3. Please describe how information is passed from the district office to schools.
4. Please describe how district initiatives are implemented into the district from their
inception to completion.
5. What initiatives have you implemented in the past few years?
6. How do you communicate with stakeholders in the district?
Academic Achievement
7. How do you measure student academic achievement?
8. What are your most recent successes in student academic achievement?
9. What are your greatest challenges to sustained student academic achievement?
10. How do you use data to inform the decision making process?
11. How do changes in state and federal requirements affect your decisions regarding student
academic achievement?
Financial Resources
12. Please describe the budgeting process in your school district.
13. What funds do you have direct control over and how do you decide where to allocate
those funds?
14. Is there any way you would reallocate funds in your district?

78
15. Do you believe district consolidation would help or hurt your school district? How?
16. Why do you believe your school district provides a high return on investment?
________________________________________________________________________

79
The purpose of the first six questions was to answer RQ 1. The answers to these
questions gave a description of how the district is organized (Gislason, 2009) and described the
communication structure of the district (Farrell & Collier, 2010; Hentschke et al., 2009;
Franciosi, 2012). The answers to the questions also gave an opportunity to discover traits of
transformational leadership, servant leadership, and pseudo-transformational leadership (Bass,
1985; Greenleaf, 1977; Christie et al., 2011).
The purpose of the second set of questions (#7-11) was to answer RQ 2. The answers to
the questions provided insight into the priorities of the district and participant opinions on the
keys to academic achievement (de Maeyer, van den Bergh, Rymenans, Van Petegem &
Rijlaarsdam, 2010; Hummel-Rossi & Ashdown, 2002; Kim, 2011; Saito & McIntosh, 2010).
The purpose of the final set of questions (#12-16) was to answer RQ 3. These answers to
the questions gave insight into how funds are allocated and the priorities of allocating those
funds (Feuerstein, 2009; French, 2009; Saito & McIntosh, 2010). Furthermore, research
suggests that expenditures on administration and special education are not as efficient compared
to expenditures on instruction (Houck et al., 2010; Jacques & Brorsen, 2002). The answers shed
light on district consolidation and the impact it has on funding (Banzhaf & Bhalla, 2012; Bjork
& Blasé, 2009; Brasington, 2003).
Data Analysis
My general analytic strategy is defined by Yin (2009) as “relying on theoretical
propositions” (p. 130). To build this study I read educational research on the topics of
transformational leadership, school district consolidation, and cost-effectiveness. From those
topics emerged gaps in the literature and subsequent research questions. To answer the research
questions, I returned to my theoretical foundation and used those topics as my initial themes

80
(Rocco & Plakhotnik, 2009; Yin, 2009). As part of the data analysis I used a “reiterative cycle
of definition, data collection, analysis, and subsequent redefinition” as the study progressed
(Bjork & Blasé, 2009, p. 200). This case study collected data from three different sites. I
conducted an analysis of data from each individual site first. After I analyzed each individual
site, I conducted a cross-case analysis to compare the three sites (Stake, 2006; Yin, 2009).
Following a description of the data collection, I will further describe the analysis process.
The first step in data analysis was to create an Analysts Log (sample in Appendix J) using
Microsoft® OneNote 2010 (Stake, 2006). The log lists dates, contact information, anecdotal
records, and researcher notes to document the entire analytic process from site access to final
analysis. Once the Analysts Log was created, OneNote was used to collect data from all three
sites. Statistical data was collected in tables and organized in folders. I collected similar
demographic data about each school district. I collected data from archival records and scanned
items as pdf files if possible. These files were saved directly into the OneNote program. I
catalogued each item with a description and then recorded notes about each item using OneNote.
I used Stake’s (2006) worksheets for analysis of the case study, and worksheets 1–7 were used in
accordance with copyright requirements. I modified the worksheets slightly based on the
number of cases I used in my study.
I used worksheet 1 (Appendix B) to present an overview of the case study. While putting
data into OneNote, I kept a copy of worksheet 2 (Appendix C) available to keep the focus of
inquiry at the forefront of my thoughts. By reading the themes prior to inputting data, I was
looking for answers to my questions rather than simply transcribing text. I also transcribed the
interviews in Microsoft® OneNote 2010. I converted all of the data into text in OneNote so that
searches could be completed without missing non-converted data (Yin, 2009).

81
Once data had been collected from all three sites, I prepared an individual case study
analysis of each school district. I compiled school report card data, archival records, and
interview transcripts. From that report I began to fill out worksheet 3 (Appendix D) on each case
while keeping worksheet 2 available for quick reference (Stake, 2006). Multiple copies of
worksheet 3 were utilized as needed. The analysis for an entire case took place during one
session. Multiple sessions were utilized for the different cases as one session was not always
sufficient for analysis of all three cases. Once all three cases have been analyzed using
worksheet 3, the findings were summarized using worksheet 4 (Appendix E). Themes were
listed and data from different sites were listed using codes and a rating system of low (L),
middling (M), and high (H) (Stake, 2006). Following completion of worksheet 4, I used 3x5
cards to list key findings from each site. I coded each card in this fashion: CCA1-2 meaning
cross case analysis, site 1, theme 2 or CCA3-5 meaning cross case analysis, site 3, theme 5.
Once each card was coded to ensure that I knew where the data came from, I set out all of the
cards from all sites and organized them around themes. The individual cards received ratings
like + or – based on how well they supported each theme (Stake, 2006). I selected between 8
and 12 cards to support each theme. I used worksheet 5 (Appendix F) to summarize the findings
and I listed the different codes on worksheet 5 based on the supporting information. I used
worksheet 5 based on merged findings rather than individual findings because the goal of the
multiple case study is to find commonalities rather than individual traits used by school districts
in order to create cost-effective school systems.
Once worksheet 5 had been completed, I used worksheet 6 (Appendix G) to list tentative
assertions. I also used space on worksheet 6 to write justifications, notes, or atypical information
about cases. This sheet allows triangulation across cases to bolster the assertions (Stake, 2006).

82
I was also able to review the assertions to see if they fit together, overlap, are redundant, or
require additional analysis (Stake, 2006). The assertions listed on worksheet 6 allowed me to use
worksheet 7 (Appendix H) to plan writing chapter four and five of this study.
Trustworthiness
I employed a number of strategies and safeguards to improve the trustworthiness of my
study. First, I used member checking (Lincoln & Guba, 1985) of the initial analysis so that I
could be more certain that what I gathered from interviews was what each participant meant to
communicate (Creswell & Miller, 2000; Purcell et al., 2007). Participants were contacted in
mid-October and early November to review portions of chapter four concerning their school
district. Two responses were received. One participant noted a single grammar mistake. The
other response from a participant noted how proud she was of the district, but she did not offer
any suggestions for improvement.
I increased the dependability of the study by providing a detailed description of each site
using multiple data sources, and the “weight of evidence should become persuasive” (Creswell,
2007, p. 204). I left a considerable audit trail so my study could be replicated (Creswell, 2007;
Yin, 2009). I created a data collection timeline (Appendix K) in OneNote that summarized my
activities (date, interview information, dates of data collection). The transferability of the study
was bolstered by a strong description of each site. Because data triangulation found themes in all
cases, I was able to suggest possible transferability of certain items while realizing that the
results are not conclusive (Yin, 2009).
Ethical Considerations
Because only 12 South Carolina school districts were rated high ROI, maintaining
participant confidentiality was a significant challenge. Kaiser (2009) suggests discussing the

83
audience as part of the informed consent protocol. Participants need to be assured they will be
protected and “meticulous data cleaning” may need to occur (Kaiser, 2009, p. 1635). Kaiser
(2009) notes that data may need to be modified and this is possible through the use of averages.
For example, Applewood School District may have a graduation rate of 79.7%, but this number
could be modified to “just below 80%.” Further, the district could be described as a
Southeastern school district with between 2000-5000 students. There are a significant number of
school districts in the entire Southeast with similar characteristics. I will also note in any
published material that numbers have been modified to protect against “deductive disclosure”
(Kaiser, 2009, p. 1632). Data was stored in a locked filing cabinet and electronic files were
password protected.

84
CHAPTER FOUR: FINDINGS
A decrease in funding of American public education (Oliff, Mai, & Leachman, 2012) and
an increase in the scrutiny of student academic achievement (Banzhaf & Bhalla, 2012) has
caused an increase in scrutiny of the public educational system. School districts must evaluate
the cost-effectiveness (Levin, 1975) of each budget item so they can allocate their resources
wisely. Published research (Boser, 2011) has found that certain school districts provide a high
return on investment (ROI) despite differences in student demographics like poverty, special
education, and English speakers of other languages. The purpose of this multisite case study is
to understand and explain how three South Carolina public school districts can provide a high
ROI. In order to understand and explain how districts provide a high ROI, I selected three
research questions to answer:
1. What is the structure of the school district leadership and how do the inner workings
function?
2. How does the school district leadership encourage student academic achievement?
3. How does the school district leadership allocate financial resources?
To answer the research questions, I invited three school districts that had high ROI
(Boser, 2011) to participate in the study. To achieve data triangulation (Stake, 2006; Yin, 2009)
I gathered data from a multitude of sources. I gathered publicly available school report card
data, archival records, and conducted interviews of five district leaders. I will present the
findings of each district separately. Following a description of the information gained from each
data source, I will list answers to research questions.
Applewood School District
Applewood School District (ASD) is located in the southeastern United States and is

85
primarily a rural district. The district serves approximately 3,000 students and earned an
Excellent report card rating in 2013. Using weighted averages, the district averaged spending
$7,519 dollars per pupil from 2008 to 2013, and this was often in the lowest five districts in the
state. The school report card stated that fiscal authority resided in the school board in 2008, but
changes in state law have changed that status. The district received an A rating in the
Elementary and Secondary Education Act (ESEA) rating (90.8%) in 2012 and were second in the
state in their ESEA rating in 2013 (98.2%). The district serves a student population where
approximately 60% of the students receive free/reduced meals. The district led the state in 2008
in the percentage of students taking Advanced Placement (AP) exams and the district was above
average in end of course testing in Algebra 1 and English 1. The dropout rate is generally below
the state average (0.5% compared to 3.1%).
School Report Card Data
Each year the state department of education publishes a school report card for each public
school district and each public school. Public schools and districts are rated At-Risk (lowest),
Below Average, Average, Good, and Excellent (highest) each year based on test scores and other
indicators. High performing schools are given a Palmetto Gold or Palmetto Silver Award for
overall achievement on end of year testing and graduation rates. Since 2008, Palmetto Gold and
Silver Awards have been given for Closing the Achievement Gap between historically
underperforming subgroups and historically high achieving subgroups. A summary of ASD
school report card data can be found in Appendix L. I will briefly summarize the data below.
ASD has four schools, and the high school consistently performs above the state average.
They received an Excellent rating five of the six years between 2008 and 2013, and the school
received a B federal ESEA rating (87.0%) in 2012 and an A (91.4%) in 2013. Applewood

86
Middle School improved from an Average rating in 2008 to an Excellent rating in 2013, and
72% of their students are on the all-academic team. Student End of Course (EOC) test scores
averaged 25% higher than the state average, and Applewood Middle School received a B for
their 2012 ESEA rating (89.6%) and an A (97.3%) in 2013. Applewood Elementary School
received an Excellent rating from 2011 to 2013 and won awards for Closing the Achievement
Gap in 2011 and 2012. The elementary school has many clubs such as the After School Focus
Program, 4H, Rising Stars, Steel Drums, Girls Basketball Club and a program for gifted/talented
students. The school received an A ESEA rating in 2012 (93.8%) and a B (88.1%) in 2013.
Applewood Primary School received an Excellent rating for all six years from 2008-2013. In
2012 72% of second grade students scored at or above the national average on the Measures of
Academic Progress (MAP) in reading, and 84% of 2nd graders scored at or above the national
average in mathematics on the MAP test. The school did not receive an ESEA rating because
students in grades K3-2nd are not required to take state standardized tests.
Archival Records
During the study I asked each school district and each participant for archival records.
The request was mentioned in the Consent Form, and another request was made in October 2013
via email for any additional documents. I asked for school board minutes, government reports,
strategic plans, mission statements, grant applications, school forum notes, accreditation reports,
and school improvement committee meeting minutes. A listing of items received can be found
in Table 5 in chapter three.
Interviews
Semi-structured interviews were conducted with five participants from Applewood
School District. All participants met the qualifications for the study, and the interviews took

87
place in each participant’s office. The interviews took place between August 5, 2013, and
August 9, 2013, at the convenience of each participant (see Appendix K). The interviews lasted
between 43 minutes and 1 hour and 23 minutes (M = 1 hour and 5 minutes). I personally
transcribed each interview and then reviewed the transcript while listening to the interview to
check for accuracy. During transcription I kept a running log of informal conclusions and ideas.
For example, multiple participants discussed using data in multi-faceted ways to assess student
achievement. When I noticed this pattern, I wrote “MULTI-FACETED DATA USE” in the
transcript using all caps so I could locate this note later during analysis.
Each interview began with informal conversation, and I asked about the professional
history of each participant prior to asking questions from the interview protocol. I will describe
the interviews of the district office staff first and then the school principals.
Mr. Smith, Chief Financial Officer. Mr. Smith has worked in ASD for 16 years and
has professional experience as a CPA prior to his employment with ASD. When describing ASD
he stated, “It’s a hometown district, don’t have a whole lot of influx from out of state…
hometown feel which I think is a good thing.”
Ms. Johnson, Curriculum. My next participant worked in the curriculum department
and has experience in mathematics, gifted/talented services, advanced placement, instructional
technology, and staff development. Ms. Johnson grew up in the community and has worked her
entire 40 year professional career in Applewood School District. When asked to describe ASD
she said, “There are high expectations that are set. The old adage success breed success… It’s as
close to a private school environment in a public school setting.”
Ms. Williams, Middle School Principal. Ms. Williams grew up in ASD schools and
worked in the district almost the entire 31 years of her career. Part of her working years have

88
been spent in the district office working on curriculum and the most recent employment has been
spent working at the middle school. My interview with Ms. Williams began as follows.
Tim: Tell me about ASD.
Ms. Williams: I know how fortunate and how blessed I am to work in this district.
When I look at what we produce, even I’m in awe sometimes. When people try to come
and they come to visit ASD or even my own family because I grew up in a family of
educators, they don’t really understand where I work. It’s just kind of a little slice of
Mayberry.
Ms. Williams also mentioned the fact there is very little staff turnover in the district.
“There’s nobody I’d rather go to battle with than [the district administrative team]. If I need
support, there’s nobody who could do a better job.” Ms. Williams was genuinely pleased and
felt blessed to be in her present situation.
Ms. Jones, Elementary School Principal. Ms. Jones has been an educator for 30 years,
and she brought a different perspective to the study when compared to other participants from
this site. Ms. Jones has previous professional experience in other school districts, and one of
those districts was a very large consolidated district. I asked Ms. Jones to describe her school
district.
Everyone knows everyone. I go to the grocery store or I go to the football games, and I
see my parents and families. It’s a more friendly or personal type of relationship here
opposed to other districts I’ve worked for. The focus on academics here is concentrated.
Ms. Davis, Primary School Principal. Ms. Davis has 28 years of professional
experience and 14 of those years were spent in early childhood education. Ms. Davis left the
classroom to be the assistant principal of the primary school for seven years and moved to the

89
principalship of the primary school for the previous seven years. Ms. Davis describes the
community as “tightknit” and noted many constituents come back to raise their families. “They
move away in this district because it’s a small town. They want larger, more exciting, big city
with more to offer. They end up, when they have children, wanting to come back here.” The
parents value educators and the “teachers see parents and children as their customers. It is a
reciprocal relationship” she stated. Ms. Davis believed there was a “strong bond and trust”
between the educators and their families and that made a positive impact on the schools.
Research Questions
The purpose of the study was to explain how and why a school district can provide a high
return on investment. Three research questions were created to answer explain ROI. Beginning
with the first research question, I will list answers below.
RQ 1. The first research question asked, what is the structure of the school district
leadership and how do the inner workings function? The primary focus of South Carolina
School Report Cards is to summarize student academic achievement. With this in mind, the
school report card data did little to answer the first research question. The collection of archival
records provided answers to the structure of school district leadership, and the structure and
function of school district leadership was evident in school board minutes. Each district leader
was expected to give a detailed monthly report highlighting student achievement (academic and
non-academic) along with a summary of events. However, the primary focus of school board
minutes revolved around students, and the administrative side of the district was minimized.
Although school report card data and archival records provided limited answers to RQ 1,
the data gathered through interviews provided many answers to this question. Each participant
was able to describe the organizational flow of the district and describe regular monthly
90
meetings. The three principals all commented on the quality of the district office staff and some
even said “there’s nobody better than [the district office staff].” In addition to the factual
information, specific answers to RQ 1 emerged.
Accessibility. All of the participants noted how accessible the district office leadership
was and many noted they had the superintendent’s personal cell phone number. Ms. Davis
commented if she had not returned a phone call, it was possible that a parent would tell this to
the superintendent when he visited the local grocery store. All three principals commented that
if they had a question they could immediately get in touch with their supervisors at the district
office level or they could reach the superintendent personally. Ms. Johnson stated “all the
administration is involved in the final decision making” and Ms. Williams said “there’s not a lot
of hierarchy” in the administrative team. “We really do root for each other and want the schools
to do well,” said Ms. Davis. The participants appeared to genuinely care for each other and the
overall success of the students.
All of the participants noted the importance of athletics and community events. Each
participant commented on the fact that they were expected to attend fall football games and that
they were able to have many parent conferences while attending those games. “Parents stop me
on Friday nights at the football game” said Ms. Williams. All participants mentioned the
importance of the Visions paper that was produced prior to each school year. This paper gave
updated contact information from each school and district and made the district leadership very
accessible to the public.
Camaraderie. A common theme among the principals was the fact that the schools were
working together. They noted decisions were often made corporately with “the decision makers
being in the room,” and one example of this was the major software purchase made during the

91
summer of 2013. All of the administrators were in the board room together to find a way to
purchase software that all four schools needed. Mr. Smith commented that new initiatives were
discussed across all departments, and the leadership team worked to incorporate suggestions
from all administrative members. All three principals stated they cheered for the other schools
when test scores came out, and they did not mind spending additional funds at the
primary/elementary level. They realized early investment in literacy would pay dividends in the
future. Ms. Williams, the middle school principal, mentioned if her students could not read a
science book, they could not understand the concept. By spending additional resources on
literacy, it gave her students the ability to be successful at the middle school level.
In addition to camaraderie among staff members, there is camaraderie with stakeholders
in the community. Ms. Williams described relationships between local churches and the school
district that positively impacted students. The local churches worked together on a program
called Great Start which provided school supplies free of charge to needy families, and
community volunteers helped families sign up for medical services and government assistance if
it was necessary. Ms. Jones said the following:
In terms of community here at our school, we really like the idea of reaching out to the
community because we really understand the importance of our parents and other stake
holders … we are acutely aware of our community needs … sometimes there’s a money
problem or a transportation problem.
Ms. Jones succinctly summarized her philosophy of working with families. “If you keep the end
result [in mind], how will this benefit the students, you’ve got a winner … It’s not about brownie
points, it’s about how to make it better.”
RQ 2. The second research question asked, how does the school district leadership

92
encourage student academic achievement? Four of the five participants were able to clearly
describe current student academic achievement. The business manager noted he was in meetings
where student academic achievement was discussed, but he did not give specific information.
Expectations for student achievement were very high and current results – school report card
rating and ESEA ratings – suggest student academic achievement remains high.
School Report Card data did provide information that helped answer RQ 2 with regard to
student academic achievement. Multiple measures of student academic achievement are given
and delineated into multiple forms. Those measures lend credence to the fact that students in
Applewood School District have high academic achievement. The summaries written by each
principal provided additional insight into other types of achievement – athletic, fine arts, or
whole school awards. The School Report Card data supplemented and validated statements from
interviews and archival records, but themes did not readily emerge from School Report Card
data.
Archival records provided some information to help answer RQ 2. The first way this
question was answered was through detailed recognition of academic achievement in regular
school board meetings. Educational leaders listed students by name and with exact, up-to-date
figures. School websites showed how each school promoted student academic achievement by
listing students who earned high student academic achievement (honor roll, special awards like
Junior Scholars, etc.) and providing assistance to parents. Each website had multiple points of
contact information where parents could get additional help for their child regardless of how well
they were performing (special education and gifted/talented services).
Interviews with participants provided copious amounts of data regarding student
academic achievement. ASD uses individualized attention, multi-faceted data analysis, and high

93
expectations to encourage student academic achievement.
Individualized attention. The first theme concerning student academic achievement was
the amount of individualized attention students received. Students at the primary school could
receive up to three sessions of reading instruction per day based on their struggles with reading.
Meetings were held every three weeks to discuss, by name, students who are struggling with
academic achievement.
Ms. Davis: So when I sit down with my literacy coach and say, tell me by name which
child is not progressing which is a pretty huge undertaking when you have 850 kids in the
building.
Tim: Some teachers can’t even do that with their own 20 kids.
Ms. Davis: They may not Tim, but if we’re pulling her kids, then you better know
something about that child.
Immediate modifications were made to help those students.
At the elementary school, Rising Star teachers and special area teachers were expected to
help struggling students. Anonymous student achievement data was publicly displayed to
encourage students to improve, and a private data wall with pictures of struggling students
helped remind teachers to “build relationships” with those students so they would not “fall
through the cracks.” Ms. Jones, the elementary principal, said the following:
We also have a war room and that one is serious business. In that room we have a huge
board and we have the faces of our children and the categories in terms of, not PASS
performance, but MAP performance because we can evaluate that, ongoing, as the year
progresses. So we have the faces and the names of their teachers. The reason for that is I
tell our teachers you need to form a personal relationship with struggling students and not

94
let them sort of fade into the cracks.
The middle school provided after school help, and Ms. Williams stated she would work
with parents to make sure parents understood the importance of academics.
Sometimes parents will say no thank you. I say, no we can’t do that. You have to leave
little Johnny with me until 3:30 and I’ll put him on a bus. But he’s got football practice.
I’ll walk him to football practice. We have to argue with our constituents in that friendly
positive way. We have to say this is important … then I will make sure that he will go
out and play defensive end for the 8th grade football team.
At the district level, Ms. Johnson was actively working to find ways to help students who
were in danger of dropping out or who had already left high school without finishing. A special
Applewood Academy was created to help struggling freshman and plans were being made with
adult education to help students who were close to earning a diploma. At all levels of the
district, individual attention was being given to struggling students and every effort was being
made to help the students be successful.
Multi-faceted data analysis. Most school districts analyze state testing data, and they
report findings to teachers and stake holders. What made ASD different was the multi-faceted
analysis of data. At the district level, administrators found “delta z scores” for each teacher.
First, the administrators found the z score for each student compared to students of similar ability
based on the previous year’s state standardized assessment. The administrator then computed the
z score for the student compared to students of similar ability based on the current year’s state
assessment. The two scores are analyzed to see if a teacher made a positive impact on the
student’s academic achievement. This is the delta z score which showed if the teacher helped
students grow academically year to year. The class average was computed and a true “value

95
added” score could be computed. The classroom teacher could be fairly evaluated and know if
he or she was doing a good job. Ms. Johnson also computed “AP Potential” to find how many
students could earn a 2, 3, 4, or 5; not just a passing score. She went on to compute how many
students who should have earned a 2 went on to earn a passing score. Ms. Davis used
extrapolated MAP data to compare her first grade students to second graders. She could see how
many of her students were on track or advanced using this data. The educational leaders of this
district not only use common data points, but they also dig deeper into the numbers to find
comparisons, connections, and ways to improve instruction.
High expectations. Without question, there were many examples of high expectations
for students in Applewood School District. The primary school did their best to get all students
above the 50 percentile in reading and math as opposed to just getting half of their students to
this point. The middle school realized that a large majority of students entering in sixth grade
were already proficient in math, and they needed to increase this academic achievement in order
to keep the achievement as high as it already was.
Like most public school districts, ASD has students who struggle financially or have
difficult home environments. During our interview Ms. Jones shared part of her personal story
with me as she came from a difficult financial situation, and then related it to her work as an
educator.
So I am you, I am you. I get what you’re going through. We understand you were up
late last night because you had to babysit. But that should not prevent you from doing
your best. It’s because of those situations that you should do your best. In a sense you’re
almost better equipped because of those circumstances to exceed expectations.
In addition to high expectations for students, this district has very high expectations for

96
their teachers. Each teacher is given his/her delta z scores, and they are expected to have a
neutral or positive class average every year. All three principals explained they have
conferences with teachers who do not have positive z scores. Those teachers are given
professional development to help them improve. If professional development does not help, a
formal action plan or observations from the district office may be implemented. Although no
participant gave specifics on removal of teachers, one participant did note that two teachers had
left the school because they were not willing to live up to these high expectations.
I also noted a sense of fairness with regard to high expectations for teachers. Ms. Davis
noted she spent considerable time balancing class rosters so each teacher had a chance to work
with an even distribution of stronger and weaker students. Ms. Williams noted that some of the
gifted/talented classes had a difficult time showing a year’s growth, so she often looked at
overall achievement compared to the state average. Ms. Jones, along with the other principals,
noted she looked for a three year trend in the data. If a teacher had one very low year, but other
years were better, she would not jump to a conclusion about a teacher’s ability to teach. Ms.
Williams did discuss how she would react to a longitudinal trend of below average achievement
from a single teacher. Once a teacher was found to be struggling, she asked some soul searching
questions. “Are you right for this position?” she would ask the teacher. “Are you satisfied? Are
you fulfilled? Do you leave every day at 3:05? If this really what you want to do because you
can’t come here and hide and pull down a paycheck.” Teachers are fairly evaluated, and a lack
of student academic achievement is addressed.
RQ 3. The final research question asked, how does the school district leadership allocate
financial resources? As stated previously, the primary focus of South Carolina School Report
Cards is to summarize student academic achievement, and the school report card data did little to

97
answer RQ 3 about allocation of financial resources. The school report card did list per pupil
expenditures and the percentage of expenditures on teacher salaries and the percentage of
expenditures for instruction. However, those percentages were slightly misleading. The
percentages spent on salaries or instruction ranged between 52% and 57%, but those percentages
did not include benefits, such as health insurance, paid to teachers. When other benefits are
combined with salaries, the total compensation package to instructional and non-instructional
employees is closer to 85% of the district’s expenditures.
Archival records provided some answers to RQ 3. I found the Visions paper most helpful
in that it clearly and simply explained how much money the district had and where those tax
dollars were being spent. A caption on the 2013-2014 Visions reads “The budget has been
developed with great care and concern for maintaining quality instructional programs at the least
cost to taxpayers.” Although a public school district budget is extremely complex, the district
took time to communicate their purpose in developing the budget and provided an easy to read
bar graphs so that all stake holders could understand where money was being allocated. Further,
school board minutes mentioned multiple bids for services that were accepted where a “low bid”
was the accepted bid. The district was constantly analyzing their expenses and always looking
for ways to save money. They were willing to change suppliers to save taxpayer funds.
Data collected from interviews provided many answers to RQ 3. When allocating funds,
district leaders are frugal, share resources with other departments or schools, and creatively find
solutions to an ostensible lack of funds. District leaders were against school district
consolidation.
Frugality. Many of the participants stated money was not spent frivolously on non-
instructional items. “We don’t spend a lot of money on things that don’t have to do with

98
education” said Ms. Davis. Mr. Smith commented, “I know a lot of districts will say, all right
the high school has $50,000 of supply money, you spend it. Nope, we say, send your purchase
orders over here, we’ll look at it.” All participants mentioned the fact that purchase orders went
to the district office and each expense needed to be justified. The principals also noted that since
the economic downturn in 2008, there was less freedom to spend money.
Ms. Williams noted teachers and administrators were furloughed and yearly pay increases
were frozen during that time. Ms. Williams stated the following:
I think the reason that went over so well with our faculty was that [the superintendent]
went to every faculty and did a miniature whiteboard presentation. No one was in the
dark. You could disagree, but no one could say they didn’t know or I didn’t understand.
Communication was important.
The amount of available resources decreased significantly and there was no extra money for
unnecessary items. The district looked for ways to not spend additional funds and one example
of this frugality was not paying educational consultants to come to the district to help with
Common Core implementation. The educational leaders believed in the competence of their own
staff to provide this professional development, and using in-house professional development
saved money.
Sharing. Because of recent changes in the economy, there was a need to share resources
and share expenses. At times, schools are expected to use student activity funds to pay for part
of an expense. For example, when the gym floor needed to be refinished, the middle school and
the district office split the cost when in the past the district office paid the entire cost. The
principals openly discussed sharing resources, and one principal jokingly mentioned additional
expenses for the primary school. They asked if the primary school had purchased enough

99
cubbies for the young children, and they wondered if they could buy something now. All three
principals stated they did not have everything they wanted but they had everything they needed.
Creativity. When discussing the allocation of funds with the two district office
personnel, I noticed there was a sense of creativity in their approach. Mr. Smith, the Chief
Financial Officer, was always looking for ways to reallocate money in order to provide for the
educational needs of the students. Although he always followed the law and stayed within
guidelines, Mr. Smith tried to work out ways to share costs among different accounts. Ms.
Johnson noted different fund accounts are often used to benefit all students like when the EIA
funds were used to replace computers or the special education funds that were used to purchase
class sets of iPads. When the district is confronted with a need, the educational leaders think
outside the box to find a solution that benefits as many students as possible.
School district consolidation. Each of the participants stated they were against school
district consolidation. ASD is located in a county with several other larger school districts, and
participants felt ASD community would be negatively impacted. Ms. Jones stated the following:
Hurt and I’m saying that from experience. You know, the fact that you would lose some
of those personal aspects that make each district special. I didn’t feel that same sense of
belonging or connectedness when I taught in [a large consolidated district].
One participant mentioned students already had long bus rides and if they were absorbed by
another school district, the bus rides would increase. Another participant felt ASD would lose its
identity. Ms. Johnson stated “if it were costing ASD to operate and we were bleeding tax payers
dry, then I think it’s worthy of consideration. But that is not the case.” ASD is performing better
than other school districts, and their per pupil expenditures are much lower than other school
districts which suggests they continue to provide a high ROI.

100
The purpose of this multisite case study was to understand and explain how three South
Carolina public school districts can provide a high ROI. In Figure 1 below I have summarized
the findings from Applewood School District, the first site in this multisite case study. Boser
(2011) suggested that student academic achievement could be increased by reallocating existing
funds as opposed to arbitrarily increasing tax revenue as a way to improve a district’s ROI. The
findings below support that assertion because none of the answers to the research questions
summarized in Figure 1 require an increase in tax revenue.

101
Figure 1. Summary of RQ answers from Applewood School District.
Applewood School District
High ROI
Leadership Structure-RQ 1:
• Accessibility
• Camaraderie
Student Academic Achievement-RQ 2:
• Individualized attention
• Multi-faceted data analysis
• High expectations
Allocation of Resources-RQ 3:
• Frugaility
• Sharing
• Creativity

102
Grandview Unified School District
Grandview Unified School District (GUSD) is located in the southeastern United States
and sits outside of an urban expanse with some distinctly rural fringe areas. The district serves
approximately 10,500 students and earned an Excellent report card rating in 2013 with a growth
rating of Excellent. Using weighted averages, the district averaged spending $8,553 dollars per
pupil from 2008 to 2013, and this total is in the lowest one third of districts statewide. The
school report card stated that fiscal authority resided in the school board and county council, but
current state law requires the county council to approve millage increases. The district received
a B ESEA rating (84.5%) in 2012 and a B (88.7%) in 2013. The district serves a student
population where approximately 52% of the students receive free/reduced meals. The district
has seen considerable growth in overall performance and graduation rate. The school report card
rating has grown steadily from Below Average in 2009 to Excellent in 2013. Of the 18 schools
in the district, 15 were honored as Palmetto Gold or Silver award winners in 2012 compared to
only 5 schools being honored in 2008. The high school graduation rate was 72.7% in 2007 and
has grown by almost 15% to 87.4% in 2013. The district average for end of course testing is
above state averages, and the district was above average in end of course testing in Algebra 1 and
English 1. The dropout rate is 0.5% below the state average.
School Report Card Data
Each year the state department of education publishes a school report card for each public
school district and each public school. Public schools and districts are rated At-Risk (lowest),
Below Average, Average, Good, and Excellent (highest) each year based on test scores and other
indicators. A summary of school report card data from GUSD can be found in Appendix M. I
will briefly summarize the data below.

103
There are three high schools in GUSD, and two high schools received an Excellent rating
in 2013. All three high schools have improved their report card ratings since 2008, and 93.7% of
students passed the HSAP test (1.1% above state average). The average 2012 ESEA rating for
the three high schools was 72.0% (D) in 2012 and 85.0% (B) in 2013. There are four middle
schools in GUSD, and three of the four middle schools received a Good rating on their school
report card in 2013. The GUSC Middle Schools averaged an 87.9% on their ESEA rating with
one middle school earing an A and the other three earning B’s. GUSD has 11 elementary
schools, and in 2013 four schools received Average absolute ratings, five schools received Good
absolute ratings, and two schools received Excellent absolute ratings. When comparing 2009
school report card data to 2013 school report card data, seven of the 11 elementary schools have
increased their absolute rating by at least one category and three of the 11 schools have kept the
same absolute rating. The eleven elementary schools had an ESEA rating of 88.4% in 2012 and
89.5% in 2013.
Archival Records
During the study I asked each school district and each participant for archival records.
The request was mentioned in the Consent Form, and another request was made in October 2013
via email for any additional documents. I asked for school board minutes, government reports,
strategic plans, mission statements, grant applications, school forum notes, accreditation reports,
and school improvement committee meeting minutes. A listing of items received can be found
in Table 5 in chapter three.
Interviews
Semi-structured interviews were conducted with five participants from GUSD. All
participants met the qualifications for the study and the interviews took place in each

104
participant’s office. The interviews took place between July 22, 2013, and July 25, 2013, at the
convenience of each participant (see Appendix K). The interviews lasted between 56 minutes
and 1 hour and 41 minutes (M = 1 hour and 18 minutes). I personally transcribed each interview
and then reviewed the transcript while listening to the interview to check for accuracy. During
transcription I kept a running log of informal conclusions and ideas. For example, multiple
participants discussed an attitude of perseverance when dealing with a lack of funding or
resources. When I noticed this pattern, I wrote “ATTITUDE” in the transcript using all caps so I
could locate this note later during analysis.
Each interview began with informal conversation, and I asked about the professional
history of each participant prior to asking questions from the interview protocol. I will describe
the interviews of the district office staff first and then the school principals.
Mr. Miller, Chief Financial Officer. Mr. Miller has a varied background in the
financial world. He spent 25 years working for private companies and was involved in a private
software company, yellow pine products, and a significant amount of due diligence work. He
has worked in GUSD for 12 years. When asked about the circumstances that led to him working
for the school district Mr. Miller stated the following:
I love this place. If I ever get a chance to help my community with any skills or
knowledge I might have picked up along the way, I wanted to. So I was at the point in
my life where I could do it and I have absolutely no regrets.
Mr. Miller and I discussed the school district and he mentioned there was “really good
community support” and the teaching staff was “wonderful, very dedicated.” He took time to
discuss the recent downturn in the economy and the negative effect it had on the salaries of
employees. Staff took pay cuts, furloughs, and did not receive a step increase for a number of

105
years. He stated “[the teachers and principals] sucked it up and did what they had to do” despite
the economic difficulties.
Dr. Moore, Superintendent. Dr. Moore came to GUSD in 2007 and immediately began
working towards improving the education of students in the district. During the first part of our
meeting we discussed a variety of topics. Dr. Moore passed on current student achievement data.
He received the data the day of our interview and he had already reviewed and summarized the
data. “We are outperforming our resources” stated Dr. Moore when we discussed the positive
results from PASS and HSAP testing. “I think a big part of it is that we’ve got a lot of people
that teach here that are very committed to this community. They grew up here” he said when
explaining why GUSD performed so well each year. “I think that kind of internal commitment is
real important.”
Mr. Taylor, High School Principal. Mr. Taylor has 30 years of experience in education
and has spent time working at both the high school and collegiate level. He also worked for the
state department of education before assuming his present position as principal of the largest
high school in GUSD, and this is Mr. Taylor’s seventh year at the high school. When I asked
Mr. Taylor about GUSD he began by saying, “Our strength is we get more out of what our
community provides than anybody else.” He then went on to briefly describe his high school
and commented that the high school had been rated Average for many years, but it finally had
earned the report card rating of Excellent this past year.
Ms. Anderson, Middle School Principal. Ms. Anderson has 24 years of experience in
education with 16 years of classroom experience and eight years of administrative experience.
About half of her experience has been in GUSD, and Ms. Anderson felt the leadership team at
the high school was very strong. “The expectations were very clear. Commitment to excellence

106
was the motto there and that truly was exemplified in everything that was done.”
Ms. Thomas, Elementary School Principal. Prior to her 19 years in education, Ms.
Thomas spent a considerable amount of time in the business sector and was in multiple
supervisory roles over other adults. Ms. Thomas has experience working with students of all
ages and has been working in her present position for four years. When I asked her about her
school she said “I’m focused on knowing every one of those children individually, hopefully by
name. I know their data, their backgrounds at home.” Although the student body and staff are
nearly 700 people, Ms. Thomas works hard at developing relationships with each person. “I
can’t answer for what everybody else does, so I make things happen.” Ms. Thomas mentioned
there were, at times, financial difficulties with students, but that her staff worked hard to provide
for the needs of the students.
Research Questions
The purpose of the study was to explain how and why a school district can provide a high
return on investment. Three research questions were created to explain ROI. Beginning with the
first research question, I will list answers below.
RQ 1. The first research question asked, what is the structure of the school district
leadership and how do the inner workings function? The primary focus of South Carolina
School Report Cards is to summarize student academic achievement, and the school report card
data did little to answer the first research question. Archival records provided some information
that helped answer RQ 1. School district leadership were actively involved in the community
through meetings and community events. Multiple members of the district leadership team
presented information at school board meetings (finance, operations, instruction, etc.), and the
superintendent was actively involved in activities throughout the district. The leadership

107
structure at the district requires district personnel to present information to the public frequently,
at least two times per month, and the district personnel is available through public meetings or
email/phone contact.
The data gathered through interviews provided many answers to RQ 1. Ms. Anderson
stated, “We’re structured in a streamlined manner.” Multiple participants described the structure
as being “flat” and noted there was a very limited district office staff. The structure and inner
workings of the district office can be described as a place of camaraderie and a positive attitude.
Camaraderie. Multiple participants mentioned they enjoyed working with other staff
members and they often expressed a desire to work with other principals. Dr. Moore described
the working environment this way:
All the instructional folks are across the hall, with that proximity, there is a lot of good
discussion. … I’m in the same mud everybody else is in. At the end of the day I like to
think I’m just as dirty as everybody else.
Ms. Anderson mentioned the fact that she commonly calls other principals and asks for advice on
how to handle certain situations. “Having that collegiality so you can bounce questions off; I
think that’s real important.” Mr. Miller stated, “You have a problem? Let’s sit down and solve
it. There are no stupid questions and you [work through the problem] cooperatively.” All three
principals felt like they could ask for resources for their schools, but they knew each request
could not be granted.
The school district has recently gone through a challenging economic period, and the
shared difficulty has strengthened the bond of the district leadership. “They give us the
autonomy if we can make it work” said Ms. Thomas, and this illustrated that the district provided
flexibility for administrators to work as long as they demonstrated strong academic achievement.

108
From the district office perspective, Dr. Moore mentioned the fact the he had many
conversations with other staff from the district office, and he personally evaluated principals in
the district. This vital connection builds camaraderie in the district.
Attitude. During each interview we discussed recent economic struggles, and all five
participants stated a “make it happen” attitude. Dr. Moore, the superintendent, stated “these are
the resources we have, we gotta win with them”; and Mr. Miller, the chief financial officer,
described numerous situations where he had to creatively discover a way to pay for necessary
changes to improve the educational environment. The high school principal could use additional
staff, but he praised his staff for working hard and providing an exceptional education for the
students. Instead of spending time lamenting a lack of funds or the inability of the county
council to raise millage rates, the district leaders in GUSD “make it happen.”
RQ 2. The second research question asked, how does the school district leadership
encourage student academic achievement? The fact that student academic achievement is
improving in the district – increases in Federal ESEA rating and the number of Palmetto Gold
and Silver Award winners – suggests student academic achievement is very high.
School Report Card data did provide information that helped answer RQ 2 with regard to
student academic achievement. GUSD showed significant improvement in school report card
rating from 2008 to 2013. Fifteen of the 18 schools were given Palmetto Silver or Gold awards
in 2012 compared to only five of 18 schools in 2008. The overall district school report card
grade increased from Below Average absolute rating and an At-Risk growth rating in 2009 to an
Excellent absolute rating and an Excellent growth rating in 2013.
Each principal writes a paragraph that is published as part of the annual school report
card and the paragraphs provided some themes. First, schools take an active role in their

109
community and they participate in many fundraising campaigns for local charities. The two
largest high schools are intense rivals on the football field, but they team up in a friendly
competition to raise funds for the local United Way. Together the high schools raised over
$28,000 and the district personnel raised $120,000 for the United Way. A middle school raised
over $20,000 for charity during one school year. Many community members take an active role
in supporting schools. One elementary school has a community buddy program with 50
members, while the school only has 135 students. Over one third of the students have a mentor
from the community, and this suggests an overwhelming level of support and concern for the
success of students. In return, one middle school had students who donated over 2,000 hours to
community service. The community is actively engaged in supporting students, and the schools
take an active role in helping local charities and performing community service.
Archival records provided answers to RQ 2. The school board minutes provided
information about awards that were won by schools, and instructional leaders reported on
services that were available to the public. Throughout the school year different instructional
departments presented information at school board meetings about the progress of their
departments. For example, a special education audit was conducted and the school district was
found to be fully compliant. The use of social media, monthly articles, and current news events
highlighted the academic achievement of students. The school district takes advantage of any
opportunity to share positive results of student academic achievement such as an increase in
school report card ratings, PASS data, or award winning schools.
Data collected from interviews provided answers to RQ 2. All five participants were able
to give specific information about academic achievement of students. Mr. Miller was able to
analyze changes in student academic achievement and looked for connections between changes

110
in funding and the connection to decreased student academic achievement. “If I ever see a
connection between a performance number and a deficiency in funding for that, that’s when I
start asking questions,” said Mr. Miller. District administrators are able to monitor student
academic achievement throughout the year and adjust as needed, focus on priorities, and employ
a quality staff.
Monitor and adjust. The first theme concerning student academic achievement was the
amount of monitoring and adjusting teachers do throughout the year. The school district
adjusted the timing of MAP testing to allow teachers time to receive the formative data and then
adjust instruction based on student needs. Dr. Moore stated, “We’ve got to get people to think
outside of the box. How are we going to serve that kid because he’s a square peg in a round
hole.” Teachers at the elementary school spend time at specific intervals describing student
academic achievement, and they know exactly which students are performing below standard.
Ms. Thomas writes personal notes to every student who takes the MAP test and “we watch the
wall move.” Ms. Thomas uses a data wall to monitor student progress and she noted 80% of
students are already meeting their goals. When discussing how difficult it was to help high
achieving students continue to show growth she said, “We’re just going to make it happen.”
Those students are given a specific plan of attack to help them improve their achievement, and
they are given all available resources to make the achievement possible.
The high school has two methods of monitoring and adjusting instruction throughout the
year. Mr. Taylor noticed many students wanted to take dual credit classes, but the students had
to drive to other high schools in order to take those classes. By developing a partnership with a
local technical college, the high school was able to provide classes for students. The program
has grown in size each year. Second, Mr. Taylor created an “I-Room” for students with

111
incomplete work. “We do a prescriptive treatment with every student who fails to do
assignments to the point that they figure they will just go ahead and do it rather than getting
harassed.” Rather than getting to the end a marking period and discovering students are in
danger of failing because of incomplete work, the educators monitor student achievement
throughout the year and adjust student schedules to make sure students continue to achieve.
Focus. A second theme that emerged was the idea of focus. Mr. Miller, the chief
financial officer, commented on the intense focus of GUSD district employees. “It’s all about the
students” said Mr. Miller. “If we lose that focus, then you’ve lost the reason you’re here.” Dr.
Moore recounted an anecdote of his interview prior to becoming superintendent of GUSD. He
was asked about his vision of education and he stated, with a bit of humor, “learn the kids.” This
concise vision impacts every area of the district and this vision permeates the culture of the
district.
The high school principal mentioned he focuses a considerable amount of time and
attention on graduation rates. “I think if you focus on graduation everything else falls into
place.” This focus on learning and achievement has made a vast improvement in graduation
rates for high school students. Ms. Anderson described the focus of her staff at the middle
school. “My teachers pretty much do whatever it takes to make a child successful… That’s one
of the reasons that we’ve had the success that we’ve had at our school, that whole ‘whatever it
takes’ philosophy.”
Staff. Multiple participants mentioned the educators in the district were high quality. I
was surprised to hear how many times the each participant mentioned who was not going to be
hired. The middle school was in need of a Spanish teacher, and the middle school principal was
willing to wait for a quality candidate rather than potentially having to work with an inferior

112
candidate because the pool of available teachers was limited. The superintendent and Ms.
Thomas, an elementary school principal, mentioned they do not simply hire family members or
friends. “One of the biggest problems in South Carolina is that everybody expects the schools to
hire everybody’s cousin at low paying jobs with state benefits,” said Dr. Moore. Ms. Thomas
stated, “If you’ve taught 25 years ineffectively, it’s time to go…. I just believe in doing the right
thing for children. That’s the bottom line.”
Dr. Moore summarized his attitude regarding student academic achievement as follows:
I can’t sit there and wait for the day where things are going to change. I have to figure
out how to work within what I got. If what I got sucks, I still have to figure out how to
work with it. You just have to do what you have to do. It is what it is. I can’t worry …
control the variables you can control.
Dr. Moore expects the staff to replicate his attitude. Educators in GUSD must do their best
regardless of current circumstances. There is an expectation of professionalism and quality in
the staff of the school district.
RQ 3. The final research question asked, how does the school district leadership allocate
financial resources? School report cards provided limited answers to RQ 3. The school report
card did list per pupil expenditures, the percentage of expenditures on teacher salaries, and the
percentage of expenditures for instruction. The percentages spent on salaries or instruction
ranged between 59% and 61%, but those percentages did not include benefits, such as health
insurance, paid to teachers or non-instructional staff members such as custodians or cafeteria
workers. When other benefits are combined with salaries, the total compensation package to
instructional and non-instructional employees is closer to 81% of the district’s expenditures.
Archival records provided some answers to RQ 3. The school board minutes provided

113
detailed and current results of financial information in the district. The district leadership
provided reports of current revenue along with information regarding the following year’s
budget. The district leadership took time to explain why cuts or changes had to be made through
both community meetings and school board meetings. The school district is in the middle of
their second $100 million dollar building project in the last ten years, and they have taken extra
steps to inform and involve the public in the process. The fact that the public was clearly
involved and informed prior to voting on a millage increase may have had a positive impact on
the outcome of the referendum. A culture of openness, transparency, and rational explanation
describes the allocation of resources in Grandview Unified School District.
Data from interviews provided many answers to RQ 3. GUSD transparently
communicates with stakeholders, involves the community in the decision making process, and
keeps its focus on priorities. GUSD is a larger consolidated school district, and participants were
largely against de-consolidation.
Communication and transparency. The first theme that emerged was the idea of
communication with stakeholders and transparency in actions. Mr. Miller and Dr. Moore
conducted six community meetings to share details of the proposed budget in addition to
regularly scheduled school board meetings. School district leaders listened to their constituents
and did their best to explain how and why they chose to spend money. The elementary principal
mentioned she communicated with parents when they spent Title I items on larger expenditures
so parents would know what was being purchased and where the funds originated. All three
principals mentioned their school improvement committees were open to the public and highly
valued for their communication and input on educational matters.
In addition to communicating with teachers and parents, the school district leadership

114
attempts to communicate with the community at large. Mr. Miller and Dr. Moore work
extensively with the county council, and Mr. Miller takes time to explain his calculations. The
school district sent out surveys to businesses prior to the recent referendum explaining why they
were asking for a tax increase and what the effect would be on local businesses. School district
leader make every attempt to communicate with stakeholders in a transparent manner.
Community. A second theme that emerged was engagement with and consideration of
the community GUSD serves. The elementary principal mentioned she personally shops for
school supplies because she knows some students are unable to purchase their own supplies. Her
shopping in the community provides commerce for local businesses which has a positive impact
on the local economy. Mr. Miller commented that he is paid less than previous places of
employment, but he was honored to give back to his community. The high school principal and
middle school principal mentioned multiple times their school was participating in fundraisers to
help support local charities. Students were developing a pattern of giving back to their local
community through fundraisers.
Focus. Both Mr. Miller and Dr. Moore discussed the allocation of funds. Dr. Moore’s
vision to focus on the education of students permeates the culture of the financial department of
GUSD. “Spend your money on priorities after you deal with what you may not like but have to
do anyway.” Dr. Moore also mentioned a desire to increase the salaries of educators who have
taken pay freezes or furlough days over the past few years. His goal was to focus as much
money on instruction and the classroom as possible. Mr. Miller told a few stories of reallocating
money because of their focus on instruction. District office staff presented a need for updated
technology and Mr. Miller reallocated funds to make sure those needs were met. Throughout the
interview Mr. Miller reiterated “It’s all about the students.”

115
School district consolidation. When asked about school district consolidation,
participants stated GUSD was a good size and that it was small enough to give individual
attention where needed. When I asked participants if GUSD should be de-consolidated into
three separate districts based on the three distinct geographic regions of GUSD, all five
participants disagreed with the potential change. Mr. Miller stated “It would be an enormous
waste of money.” Mr. Taylor said “It’s gonna take all of us” to help the schools on the district’s
rural fringes. He stated the rural schools would not be able to adequately function if there were
no shared resources. Ms. Anderson liked the current harmony among the district. “I’m big on
collaboration, and I’m big on sharing ideas with each other. When you have these dividing lines,
it doesn’t create harmony.”
Finally, the superintendent recounted an anecdote. A few years ago Dr. Moore was asked
to evaluate another school system in the state with multiple districts in a single county. When
Dr. Moore presented his results, this is what he told the district leaders from that county.
The savings are in jobs. The people you let go are the people you went to school with,
you grew up with, that you go to church with, that you work with, or little league parents
that you play with. You are going to cut the jobs of your friends and neighbors. That’s
how you save money.
Dr. Moore observed the primary negative effect of school district consolidation is friends,
neighbors, and co-workers losing their jobs.
The purpose of this multisite case study was to understand and explain how three South
Carolina public school districts can provide a high ROI. In Figure 2 I have summarized the
findings from Grandview Unified School District, the second site in this multisite case study.
Boser (2011) suggested that student academic achievement could be increased by reallocating

116
existing funds as opposed to arbitrarily increasing tax revenue as a way to improve a district’s
ROI. The findings below support that assertion because none of the answers to the research
questions summarized in Figure 2 require an increase in tax revenue.

117
Figure 2. Summary of RQ answers from Grandview Unified School District.
Grandview Unified School
District High ROI
Leadership Structure-RQ 1:
• Camaraderie
• Attitude
Student Academic Achievement-RQ 2:
• Monitor and adjust
• Focus
• StaffAllocation of Resources-RQ 3:
• Communication and transparency
• Community
• Focus

118
Blue Ridge School District
Blue Ridge School District (BRSD) is located in the southeastern United States and is a
primarily rural district with a common city-center. The district serves approximately 5,100
students and earned an Excellent report card rating in 2013 with a growth rating of Excellent.
Using weighted averages, the district averaged spending $8,800 dollars per pupil from 2008 to
2013. The school report card stated that fiscal authority resided in the school board and the
legislative delegation, but current state law requires the county council to approve millage
increases. The district received an A ESEA rating (92.8%) in 2012 and a B (85.4%) in 2013.
According to the state department of education website, the district poverty index is 70.88%.
Since 2008 the district has seen considerable growth in overall performance and graduation rate.
The school report card rating of district schools has increased as a district and in
individual schools. The school district, the middle school, and one elementary school increased
two levels and are now rated Excellent. The high school and one elementary school increased
one level, and the four remaining schools stayed consistent year to year. No school has declined
in performance when comparing 2008 levels to 2013 levels. Five of the eight schools in the
district received Palmetto Gold or Silver Awards for the 2012-2013 school year. The HSAP
passing rate has been higher than state average every year since 2008 and the graduation rate has
been higher than state average five of the six years since 2008. The dropout rate has dropped
from 4.8% to 1.7% over the same period. The district average (77.5%) for end of course testing
in all subjects is 7% higher than state average.
School Report Card Data
Each year the state department of education publishes a school report card for each public
school district and each public school. Public schools and districts are rated At-Risk (lowest),

119
Below Average, Average, Good, and Excellent (highest) each year based on test scores and other
indicators. Beginning with the high schools, I will describe the school using data from the
school report cards from 2008-2013. A list of school report card data can be found in Appendix
N.
Blue Ridge High School received an Excellent school report card rating with an Excellent
growth rating in 2013. 95.1% of students pass the HSAP test (4% above state average), and the
ESEA rating for the high school was 87.6% (B) in 2012 and 69.8% (D) in 2013. Nearly 80% of
high school students take advantage of courses at the technical center that shares a campus with
the high school. The high school won the AP District Honor Roll award for increasing the
percentage of students participating in AP classes and increasing the number of students with
passing scores (3 or better on AP exam). Between the 2009-2010 school year and 2010-2011
school year there was a reorganization of students between grades 5 and 9. Prior to 2010-2011,
students in grade 6 and 7 attended a middle school, and students in grades 8 and 9 attended a
junior high. Since 2010-2011, students in grades 5 and 6 have attended an intermediate school
and students in grades 7 and 8 attend a middle school. For purposes of this report, I will report
the data from 2008 – 2010 followed by data from 2011 to the present. See Appendix N for
summary of school report card data.
Blue Ridge Intermediate School earned an Average school report card rating in 2013 and
received an A (90.6%) ESEA rating in 2012 and a B (84.1%) in 2013. Blue Ridge Middle
School’s report card grade increased from Average to Good from 2011 to 2013. The middle
school earned an A (94.1%) ESEA rating in 2012 and a B (86.2%) in 2013. Blue Ridge School
District has 4 elementary schools from 2008 to 2011, and a new elementary school opened in
2012. In 2013 one school received an Excellent rating, one school received a Good rating, and

120
the other three remained at an Average rating. The elementary schools had an A (92.9%) ESEA
rating in 2012 and a B (89.7%) in 2013.
Archival Records
During the study I asked each school district and each participant for archival records.
The request was mentioned in the Consent Form, and another request was made in October 2013
via email for any additional documents. I asked for school board minutes, government reports,
strategic plans, mission statements, grant applications, school forum notes, accreditation reports,
and school improvement committee meeting minutes. A listing of items received can be found
in Table 5 in chapter three.
Interviews
Semi-structured interviews were conducted with five participants from BRSD. All
participants met the qualifications for the study, and the interviews took place in each
participant’s office. The interviews took place between July 29, 2013, and August 9, 2013, at the
convenience of each participant (see Appendix K). The interviews lasted between 47 minutes
and 1 hour and 4 minutes (M = 56 minutes). I personally transcribed each interview and then
reviewed the transcript while listening to the interview to check for accuracy. During
transcription I kept a running log of informal conclusions and ideas. For example, multiple
participants discussed winning grants or using grant money to fund activities. When I noticed
this pattern, I wrote “GRANT” in the transcript using all caps so I could locate this note later
during analysis.
Each interview began with informal conversation, and I asked about the professional
history of each participant prior to asking questions from the interview protocol. I will describe
the interviews of the district office staff first and then the school principals.

121
Ms. Jackson, Chief Financial Officer. Ms. Jackson has 14 years of experience as a
director of finance, working with two different school districts along with experience in county
government and a technical college. School board minutes list two separate occasions where Ms.
Jackson received the Certificate of Achievement for Excellence in Financial Reporting given by
the Government Finance Officer Association for her comprehensive annual financial report.
Prior to the current school year, the district office staff went through some restructuring due to
financial constraint. A position was eliminated and the remaining staff had to take on additional
responsibilities. Ms. Jackson oversees finance and food services.
Mr. White, Assistant Superintendent. Mr. White has spent his entire 37 year career
with BRSD, and 18 of those years were as the band director. Mr. White was responsible for the
recent construction of the new high school. The school was built ahead of schedule and within
budget. Mr. White described the school district as having a pretty high poverty level and
covering a large land mass. “Our busses travel right at 4,900 miles per day” he said. The local
constituents are “good, dedicated” people. “Our community supports the process. They care
about our schools and want their kids to get a good education.” Mr. White oversees operations
(transportation, maintenance, technology) and administrative (enrollment, homeless, policy)
services for the district.
Mr. Harris, Career Center Director. Mr. Harris has 23 years of experience in
education and has spent time teaching and administrating in career and technology centers for the
entire duration of his career. One of the primary features of the career center where he works is
the fact that the high school and the career center are on the same campus, which allows students
to “walk down the hallway” and take career and technology classes. “High performing students,
who have a lot of rigor in their schedule” can still take classes because they do not lose time

122
driving to and from a career center. Mr. Harris described his district as very “lean” and that in
other districts “two or three people do the job of one person in this district.” Mr. Harris is
considered a building principal and reports directly to the superintendent, although he interacts
with other district office staff members.
Ms. Martin, Elementary School Principal. Ms. Martin has 27 years of experience in
education and 11 of those years were spent teaching elementary grades. She worked in the
district office over technology, and has been in her current position for 10 years. She stated the
administrative teams were very close and principals frequently got together to discuss upcoming
events or changes.
Mr. Thompson, Elementary School Principal. Mr. Thompson started his career in the
business field and later spent time teaching at a junior high. He has been the principal of an
elementary school for nine years. Mr. Thompson described the district as rural and said the
community was comprised of “good, hardworking people who trust the educators here to do
what’s best for their kids.”
Research Questions
The purpose of the study was to explain how and why a school district can provide a high
return on investment. Three research questions were created to answer explain ROI. Beginning
with the first research question, I will list answers below.
RQ 1. The first research question asked, what is the structure of the school district
leadership and how do the inner workings function? School report card data did not provide
answers to RQ 1.
Involvement. Archival records and interviews provided information that answered RQ 1.
Each month nearly every member of the district office staff presented an update on their

123
department. Also, principals from schools took time to honor students by reporting
academic/non-academic awards won by both staff and students. The superintendent and finance
director were actively involved with the community through public budget meetings. Mr. White
expects principals and teachers to “get them in [the schools] and get them feeling good.” The
schools have special nights, like Hispanic Night, where specific cultures, groups of students, or
activities are highlighted as a way to get parents in the buildings. Mr. White went on to mention
that police officers can eat lunch for free in the schools. “[Police officers] just walk around and
this helps our kids see them and helps them see the building if we ever have an emergency.”
Mr. Harris has an advisory team made up of community/business leaders that he
collectively meets with twice a year. There is a group of human resource managers from local
companies that Mr. Harris meets with frequently, and the group gives feedback about workforce
readiness. “We have a huge skills gap in the country right now. We have these skilled jobs in
manufacturing that employers are having a hard time filling.” Mr. Harris works intricately with
this advisory team help prepare students to be “industry certified” and “industry ready.” District
leadership were actively involved in school board meetings and were expected to report current
events and recognitions.
Collaboration. Data gathered from interview transcription provided many instances
where district leadership worked together to solve problems. District administrators
communicate through formal monthly meetings and informal, spontaneous instances when
problems arise. For example, the district grant writer actively seeks grants based on targeted
information she gleans from conversations with principals and other instructional staff members.
Ms. Jackson stated the following:
[The district grant writer] is real good. Like at our principal’s meeting she’ll talk to the

124
principal and she’ll say, “If you guys can point me in the right direction, I’ll help. I’ll do
the research. I’ll help write it.” She is all the time helping teachers write individual
grants. A school may find a grant where they could qualify. She’ll go over to the school
and write their grant.
Elementary school principals were actively collaborating on Common Core
implementation by sharing staff development among schools. Mr. Harris described the
Professional Learning Community (PLC) at his school this way:
You don’t always want your faculty to just hear from administration…. Administrators
are not just the experts. You have experts all over your building and you need to
empower them. They’re going to feel like they’re part of a team. They are going to feel
a sense of worth.
PLCs were led by teachers rather than district office staff in order to help staff members take
ownership in their professional development.
RQ 2. The second research question asked, how does the school district leadership
encourage student academic achievement? All three data sources provided answers to this
question. School Report Card data did provide information that helped answer RQ 2 with regard
to student academic achievement. BRSD showed improvement in school report card rating from
2008 to 2013. Four of the eight schools improved their school report card rating from 2008 to
2013. Five of the eight schools received a Palmetto Gold or Silver award in 2013 compared to
only two schools receiving such an award in 2008. The district increased from a report card
rating of Average and a growth rating of Below Average in 2008 to an absolute rating and
growth rating of Excellent in 2013.
Each principal writes an annual paragraph that is published as part of the school report

125
card and the paragraphs provided some themes. First, following an accreditation visit, all
schools developed a unified vision and purpose. Each of the 2010 school report cards began
mentioning four points of emphasis: (a) data-driven instructional decision, (b) literacy across the
curriculum, (c) extra time/extra assistance, and (d) technology. Each principal then explained
how the school was implementing those four focal points. For example, schools used flexible
grouping based on MAP scores (data-driven decision), participated in a reading initiative
(literacy across the curriculum), began working with at-risk learners (extra time/extra assistance),
and purchased Promethean Boards for classrooms (technology). This unified purpose was
evident at all schools. Second, many of the schools mentioned have active school improvement
councils or parent teacher organizations. One school improvement council applied for and won a
grant to create anoutdoor classroom for the elementary schools. A parent teacher organization
provided playground equipment, and multiple school improvement councils set up a mentoring
program and a lunch buddies program for struggling students. Parents also donated books (over
800 at one school) for students to reading during the summer. The parents and communities
surrounding BRSD take an active role in the education of students.
Archival records provided more answers to RQ 2. In the school board minutes the
principals routinely reported on the academic progress in their schools, and they honored
multiple students based on their specific academic achievements. The district leadership also
honored students who won athletic, fine arts, and career/technology awards. To help students
continue their academic achievements, the district sought out grants to help finance these
programs. The district sought and won grants which allowed them to partner with colleges in
order to offer dual credit programs for students and services for students and staff. Their
partnership with a local college provided professional development for staff and additional

126
college student interns to help children during the school day. The school board was made aware
of student safety concerns and took time to approve overnight field trips.
During the interviews, all five participants were able to give specific information about
academic achievement of students. Although the two participants from the district office were
not directly linked to student achievement and test scores, both participants were able to explain
how student test scores impacted their responsibilities. Principals were expected to stay apprised
of student achievement data throughout the year and each principal used more than one data
source to evaluate student achievement. District leaders encourage student academic
achievement by listening to staff members and expecting students and staff to perform well.
Voice. Staff members are expected to share their expertise with other faculty members.
At the technology center, faculty members are expected to lead professional development
meetings by sharing their areas of expertise. Faculty feel valued because they are allowed to
share their knowledge, and they are also challenged to keep improving so they can continue in
their personal professional development. At the elementary level, staff members are expected to
come to a consensus when making decisions about new school initiatives. A core group of
teachers must agree that a new program is a good choice before the principal will suggest
implementation at the district level.
At another elementary school, staff meetings have been partially replaced with grade
level meetings to foster discussion and allow timid teachers to present their ideas and ask
questions. “I’ll put it this way” Mr. Thompson said. “It’s more intimate when you have only
four teachers in there at a time. They’re more willing to share and talk instead of having 50
people in a meeting.”
Performance. Students are expected to perform at high levels of achievement in BRSD.

127
At the high school level, clubs are expected to perform in competition and students are expected
to earn industry certifications in addition to getting good grades. “We wanted to make sure when
our students are graduating that they just didn’t get a hodge podge of training. They get industry
training and industry credentials,” said Mr. Harris. Mr. Harris compared classwork and
competition to a football team. Just like the football team practices all week and then plays on
Friday night, students in career and technology courses are expected to perform in competition.
At the elementary level, students anonymously keep track of their class achievements
through a public data wall. Mr. Thompson described the use of the data way this way:
The teachers talk to the kids about it. “We want ours to be above everybody else’s.”
Everybody walks by that way to lunch or to the gym or they walk this way to go to the
library. Kids always see it. Every time a parent goes to the cafeteria they see it. That
idea came from a teacher.
Students are reminded of the expectation to improve each time they go to the cafeteria or gym
because they can see the graph showing class academic achievement. Ms. Martin discussed
using Developmental Reading Assessment (DRA) and MAP to check academic achievement
throughout the year, and her staff works together to find solutions for a lack of student
achievement.
RQ 3. The third research question asked, how does the school district leadership allocate
financial resources? The school report cards provided no answers to RQ 3. The report cards did
list contact information of school district leadership and each leader wrote a one page summary
of current school achievements each year. The school report card did list per pupil expenditures
and the percentage of expenditures on teacher salaries and the percentage of expenditures for
instruction. The percentages spent on salaries or instruction ranged between 55% and 60%, but

128
those percentages did not include benefits, such as health insurance, paid to teachers or non-
instructional staff members such as custodians or cafeteria workers. When other benefits are
combined with salaries, the total compensation package to instructional and non-instructional
employees is closer to 90% of the district’s expenditures.
Archival records provided some answers to the allocation of resources. The district
office staff clearly and consistently communicated financial data to the school board so they
were aware of changes that were going to be made. District administrators consistently made
lists of programs that would be cut if funding was not available, and programs that could be
returned if funding was available. Care was taken to diligently seek the best price available
when seeking to purchase new resources such as the Automatic External Defibrillators that were
purchased for schools in November 2008. District staff also worked together to save money by
decreasing energy usage. An energy reduction committee was assembled in March 2009, and
schools were challenged to take simple steps to decrease energy consumption where possible.
Because of the rising cost in utilities, the district office pursued an energy grant which was won
in December 2009. The $159,000 grant updated light bulbs and paid for an energy management
system for computers and exterior lighting.
Data collected during interviews provided answers to RQ 3. All participants were able to
discuss the budgeting process and each participant noted recent cuts in the budget made a direct
impact during the current school year (2013-2014). Participants stressed the importance of
grants in supplementing the education of students when there was a lack of funding, and the
necessity of creativity when finding ways to fund valuable education programs. Participants
varied in their view of school district consolidation.
Grants. Each participant mentioned the fact that grants are very important to the success

129
of BRSD. Mr. White described the situation this way:
We do a lot with grants. We have a grant writer that’s worth her weight in gold. She
brings in tons of money for us…. Once [the grant funds have been used], you’ve got to be
creative and see if you can find another grant to help it go on.
Multiple participants mentioned the grant funded after school program and stated the program
would not be able to continue this year unless new grant funds were secured.
The grants provided many opportunities for needy students such as the middle college
program. Students who may normally not attend college were able to earn almost 18 credits
prior to graduation from high school for little to no cost because of the grant funded middle
college program. Grants funded school day activities and after school activities. For example,
grant funds were used to purchase field turf for the new football stadium that was completed in
2010. Without these additional funds, the football field would have been of a lower quality. The
grant writer is truly “worth her weight in gold.”
Creativity. Multiple participants described ways the school district solved problems by
creatively looking for solutions to problems. The financial problems “make us sit down as a
group and be creative” said Ms. Jackson. The district office found a creative way to purchase
HVAC equipment for the high school using an equipment purchase lease. Technology has been
added through interest free government loans. In the most recent budget year, multiple positions
were eliminated due to a budget shortfall. Instead of lamenting the loss, district administration
looked for creative solutions to those problems such as securing additional grants.
School district consolidation. BRSD is located just south of one of the largest school
districts in America. The geographic location of BRSD may have led to participants being
divided in their comments on school district consolidation. Some participants pointed to the

130
nearby school district and used that large consolidated district as a reason why school district
consolidation was a poor decision. Mr. Harris commented that over 200 teaching vacancies
remain unfilled each year, and those vacancies are filled by unqualified substitute teachers.
Three participants stated consolidation would negatively impact the community, and one shared
“our community enjoys the control of our people.” However, Ms. Jackson suggested the BRSD
may be better off financially if they were to consolidate with smaller nearby school districts.
Other nearby school districts have a larger tax base and are able to pay higher wages. BRSD has
recently lost employees to these nearby school districts.
The purpose of this multisite case study was to understand and explain how three South
Carolina public school districts can provide a high ROI. In Figure 3 I have summarized the
findings from Blue Ridge School District, the third site in this multisite case study. Boser (2011)
suggested that student academic achievement could be increased by reallocating existing funds
as opposed to arbitrarily increasing tax revenue as a way to improve a district’s ROI. The
findings below support that assertion because none of the answers to the research questions
summarized in Figure 3 require an increase in tax revenue. One answer to RQ 3, grants, does
require an infusion of funds, but the grant funds would not cause an increase in local or state
taxes.

131
Figure 3. Summary of RQ answers from Blue Ridge School District.
Blue Ridge School District
High ROI
Leadership Structure-RQ 1:
• Involvement
• Collaboration
Student Academic Achievement-RQ 2:
• Voice
• Performance
Allocation of Resources-RQ 3:
• Grants
• Creativity

132
Member Checking
Once each case had been reviewed and analyzed, participants were given the opportunity
to review the analysis. Portions of chapter four specific to each participant were emailed to each
participant in late November/early December 2013. Participants were asked to review the
analysis, make suggestions for changes, and return their analyses within two weeks. Other than a
grammar mistake, there were no recommendations to make changes from any of the participants.
Cross Case Analysis
The purpose of the study is to discover how and why a school district provides a high
ROI. To this point, each of the three cases has been analyzed separately in order to answer the
three research questions. Below is a summary of the collective answers to each research
question from all three sites. Following this summary, I will use Worksheets 4, 5 and 6 to
analyze the merged findings into assertions (Stake, 2006).
Collective Answers to Research Questions
RQ 1. Research question one asked what is the structure of the school district leadership
and how do the inner workings function? Each site provided answers to this research question.
All three sites evidenced an atmosphere of camaraderie between and among district office
leaders and school principals. Principals were routinely expected to give input on important
decisions, and district office leaders considered other departments before making decisions. For
example, when asked about new technology initiatives, participants from each site mentioned
involving the director of technology in the discussion to make sure the technology would work
effectively with current infrastructure. Building principals and teachers were asked for input on
programs and technology that would help students increase academic achievement. Also,
multiple participants mentioned joint professional development sessions between schools

133
horizontally (elementary school to elementary school) and vertically (elementary school to
middle school). The participants expressed a genuine concern to help other educators be
successful.
In addition to an atmosphere of camaraderie, the educational leaders were available to
other staff members and stakeholders in the community. Multiple participants mentioned the
importance of attending local sporting events and participating with local charities. District
leaders recounted many instances where extra meetings were held to discuss budget matters so
staff and community members could be informed with current economic information.
RQ 2. Research question two asked how does the school district leadership encourage
student academic achievement? Each site provided answers to this research question. First,
educational leaders used data to keep informed of student academic achievement and then used
that data to monitor and adjust during the school year. Participants from each site were expected
to be aware of current student academic achievement through monthly meetings, and many
participants had to report current results during school board meetings. Further, participants
were expected to monitor and adjust the educational services of students immediately – not at the
conclusion of the year. For example, data from MAP tests and DRA were used to flexibly group
students based on need.
Second, educational leaders focused on the classroom and the classroom teachers.
Participants had high expectations of teachers and expected them to show positive student
academic achievement with each student. Multiple participants praised the effort and results of
teachers, and many principals told anecdotes of teachers crying tears of joy when they found out
their test scores had improved. Educational leaders mentioned focusing resources on the
classroom during difficult economic times at the expense of other departments, and

134
principals/teachers were given the opportunity to express their opinion on products/services that
were needed to improve student academic achievement.
RQ 3. Research question three asked how does the school district leadership allocate
financial resources? Each site provided answers to the research question. Participants from each
site provided evidence of creativity when allocating resources. Multiple participants mentioned
expenses were often shared between departments or schools. This sharing allowed each
department to gain the benefit of the service while not having to pay for the entire expense out of
one budget. Financial leaders creatively worked with existing law and policy to continue
providing services. For example, when state policies were adjusted to no longer provided for an
aide position, money was reallocated from other departments to pay for the much needed aide
position. Further, each site used different methods to continue services. One site stressed
frugality and spent as little money as possible on non-academic expenses. Another site
participated heavily in community events and charities and found the community reciprocated
the involvement. Grants were a primary vehicle of increased funds in the third site.
In addition to allocating resources creatively, participants allocated resources openly with
stakeholder input. Two of the three sites, over and above regular school board meetings,
provided multiple opportunities for the public to review the proposed district budget and provide
feedback. During times of economic difficulty, each of the sites took extra steps to inform the
teaching staff of potential changes. Although some staff may have been frustrated with changes,
they were made aware of the changes at the first reasonable opportunity. Figure 4 summarizes
the collective answers to the research questions from all sites.

135
Figure 4. Summary of RQ answers from all sites.
High ROI School
Districts
Leadership Structure-RQ 1:
• Accessibility
• Camaraderie
• Attitude
• Involvement
• Collaboration
Student Academic Achievement-RQ 2:
• Individualized attention
• Multi-faceted data analysis
• High expectations
• Monitor and adjust
• Focus
• Staff
• Voice
• Performance
Allocation of Resources-RQ 3:
• Frugality
• Sharing
• Creativity
• Communication and transparency
• Community
• Focus
• Grants

136
Assertions
Using Worksheet 4 (Appendix E) I listed each answer to the research questions as a
possible theme. I then listed data to support the themes from each case, adding new themes as I
reviewed the second and third cases. I listed a total of 11 possible themes from the data: (a)
monthly reports, (b) competence of co-workers, (c) accessibility, (d) camaraderie, (e)
individualized attention, (f) data analysis, (g) community, (h) focus, (i) staff development, (j)
creativity, and (k) attitude. Worksheet 5 (Appendix F) lists each possible theme and the research
question/s answered by that possible theme. For example, the second theme (competence of co-
workers) was used to answer RQ 1; however, it did not provide answers to RQ 2 or RQ 3.
Theme five (individualized attention) provided answers to all three research questions.
In addition to listing possible themes, I also ranked the information as high utility,
middling utility, and low utility (see Appendix E). Themes marked high utility offered
significant amounts of data across multiple participants and multiple sources of data. For
example the theme of Individualized Attention received a high rating in Case 1 (ASD). All three
principals described ways students were evaluated and then explained actions like after school
tutoring, which followed to help individual students. Further, school board records listed
monthly principal reports where principals adjusted groups mid-year based on student
achievement, and school report card data noted flexible grouping was used to focus instruction
based on student need.
Multiple themes were ranked as middling utility or low utility. For example, Case C
(BRSD) provided limited information about Theme 1 (monthly reports) during participant
interviews and in the school board minutes. There was very limited information concerning
monthly reports in school report card data. Theme 3 was accessibility, and all three cases were

137
rated as providing middling utility. There was some mention of working with district office staff
from all cases, but a number of participants mentioned a desire to work with other principals on a
more regular basis. For example, Mr. Thompson from BRSD stated, “We’re all teaching kids.
Why can’t we help each other?”
After rating each theme as high, middling, or low, I picked themes with high utility
rankings to be my assertions. Each case provided significant evidence of the theme across
multiple participants and multiple data sources. Using Worksheet 5 (Appendix F) I compiled a
list of merged answers to the research questions. I then used Worksheet 6 (Appendix G) to state
five assertions based on the merged findings. The five assertions are (a) camaraderie, (b)
individualized attention, (c) data analysis, (d) community, and (e) focus.
Camaraderie. In order to provide a high ROI, schools districts must develop and value a
sense of camaraderie. School districts sought for and valued the input of staff members and the
staff members could actually see their input mattered. One participant appreciated the fact that
“the decision makers were in the room” because she knew her vote would directly affect the
district’s instructional decisions. Multiple participants mentioned impromptu meetings and
informal conversations where staff members could share expertise on matters. Each case also
mentioned working together on professional development. Changes to Common Core state
standards caused principals to conduct corporate faculty meetings and share ideas and best
practices. An elementary and middle school implementing the same new initiative, Read 180,
conducted joint faculty meetings so students would be served well as they transitioned from one
school to the next. The idea of camaraderie is best summed up in a quote from one participant:
“We’re all teaching kids, so why can’t we help each other?
Individualized attention. In order to provide a high ROI, schools districts must provide

138
individualized attention to all learners. School board records and interview data from each case
provided evidence that schools are using flexible grouping based on data to best serve the needs
of all learners. In addition to initial placement, schools reevaluate throughout the year and add or
remove services based on student performance. Staff from non-core areas are expected to teach
reading to struggling students, and all staff members are expected to build relationships with
students. At the high school level, district officials have created specialized tracks or schools for
students who are at risk of dropping out. Another school created a room for students with
incomplete work. Although older students should have shared responsibility in their own
academic success, schools that provide a high ROI give individualized attention to students who
need additional assistance regardless of their age. The attitude of individualized attention is best
summarized by one elementary school principal: “We understand you were up late last night
because you had to babysit. But that should not prevent you from doing your best. It’s because
of those situations that you should do your best.”
Data analysis. School districts that provide a high ROI analyze data and make decisions
based on careful analysis. Data analysis was used to allocate funds. Two of the three cases used
survey data to ascertain public input. All cases solicited bids for major purchases and archival
records provided numerous instances where a lower bid was accepted as a means of saving
funds. All three cases mentioned having a “data wall” and those data walls were anonymously
displayed in school hallways. Students were challenged to improve their achievement, and all
stakeholders were made aware of the expectation to improve student academic achievement.
Principals were expected to know and present current statistics concerning student academic
achievement on a regular basis. Although there were differences in the exact method of
evaluation, principals developed and used methods of data analysis to evaluate staff members.

139
Fairness was expected in evaluation because participants from each site mentioned the fact that
three years of data were used to identify an instructional weakness. “It’s not a critical
conversation where ‘My scores are better than yours.’ It’s a team effort.”
Community. School districts that provide a high ROI involve the community in their
daily operations and value the relationship with community members. One case provided, free
of charge to stake holders, a newspaper which highlighted key achievements and communicated
important information. Another case conducted convenient additional budget meetings each year
in different geographic regions to allow more stakeholders an opportunity to learn about the
district budget and to give input on the budget. All participants mentioned the importance of
being seen in the community at stores and school athletic events. Multiple participants
mentioned purchasing items at local stores rather than purchasing school supplies from online
retailers or major corporations.
Each participant also mentioned the importance of giving back to the community through
local charities. Schools were encouraged to collect items for or donate money to local charities.
School district leaders found it very important to be seen at these events and take part in giving
back to the community. Two of the three cases have recently passed budget referendums. The
same two cases attempted and failed at passing a budget referendum during the previous 10
years. Both cases mentioned the fact that the failing referendum was poorly conceived, poorly
explained, and lacked public input and support. The two cases mentioned learning from their
mistakes and solicited public support and input when the second referendum was considered. By
gaining the support of local businesses, providing specific details of how money would be used,
and listening to public input, the referendums passed. One participant commented, “We’ve got a
lot of people that teach here that are very committed to this community. They grew up here. I

140
think that kind of internal commitment is real important.”
Focus. School districts that provide a high ROI focus on priorities. When discussing
budget cuts, one participant said he always focuses on his priorities first and other items deemed
less important, such as maintenance, are temporarily postponed. All three cases mentioned
cutting non-instructional personnel so the lack of funding impacted the students in the smallest
possible way. Another case chose not to spend money on non-instructional programs. Due to an
accreditation visit, one case developed a shared mission and vision statement. The unified focus
from all schools was evident in school report card data, archival records, and interviews. “We
really work hard on focusing as much of our resources on instruction as we can,” said one
participant. “What are your priorities? Spend your money on priorities.”

141
CHAPTER FIVE: DISCUSSION
Changes in public education funding (Oliff et al., 2012) and persistent demand for
increased student academic achievement (Banzhaf & Bhalla, 2012; Cavanagh, 2012; Gray, 2012;
Ornstein, 2010) have forced educators to examine the impact of funding in public education.
Boser (2011) found certain school districts provide a high “return on investment” (ROI) despite
student demographics that are commonly found to be associated with below average
achievement (King & Rohmer-Hirt, 2011; Lindahl & Cain, 2012). While cost-effectiveness
(CE) research has been used in education for over three decades, there is a lack of literature
explaining the decision making process of creating a cost-effective school system. The purpose
of this multisite case study was to understand and explain how three South Carolina public
school districts can provide a high ROI. In order to understand and explain how districts
provided a high ROI, I selected three research questions to answer:
1. What is the structure of the school district leadership and how do the inner workings
function?
2. How does the school district leadership encourage student academic achievement?
3. How does the school district leadership allocate financial resources?
In this chapter I will summarize the findings and provide answers to the three research
questions. I will then discuss the implications of the findings and their implications in light of
relevant literature. Following this discussion I will list a discussion of the findings, practical
implication, limitations, and recommendations for future research.
Summary of Findings
In order to answer the three research questions, I conducted a multisite case study on
three high performing South Carolina school districts. Sites were selected based on a group of

142
high performing school districts based on published research (Boser, 2011). Triangulation of
data was achieved by obtaining information from three data sources. I gathered a complete
record of South Carolina School Report Card data from each site, and worked with school
district officials to obtain archival records. I also gathered a complete record of all school board
minutes beginning with the 2008-2009 school year to the present from all three sites. I printed
and organized data from online records and received additional records, such as school
improvement council minutes, newspaper articles, and parent handbooks.
In addition to collecting school report card data and archival records, I conducted
interviews with five district leaders from each site. Each participant met the qualifications for
the study, and the 15 participants had a combined total of 387 years of experience in their field
(M = 25.8). Interviews took place in July and August 2013 in the office of each participant, and
lasted between 43 minutes and one 1 hour and 41 minutes (M = 61 minutes). I personally
transcribed each interview and then reviewed the recording and transcription for accuracy.
After collecting data from each source, I took notes on multiple copies of Worksheet 3
(Appendix D) from each data source. Using copies of Worksheet 3 from each site, I compiled
answers to the research questions from each specific site. I then combined the answers to the
research questions across all three sites, and those answers are summarized below. A full
description of the answers to the research questions can be found in chapter four of this
document.
RQ 1
Research question one asked, what is the structure of the school district leadership and
how do the inner workings function? Each site provided answers to this research question. All
three sites evidenced an atmosphere of camaraderie between and among district office leaders

143
and school principals. Building principals and teachers were asked for input on programs and
technology that would be help students increase academic achievement. Multiple participants
mentioned joint professional development sessions between schools. Also, educational leaders
were available to other staff members and stakeholders in the community. Multiple participants
mentioned the importance of attending local sporting events and participating with local
charities.
RQ 2
Research question two asked, how does the school district leadership encourage student
academic achievement? Each site provided answers to this research question. First, educational
leaders used data to keep informed of student academic achievement and then used that data to
monitor and adjust during the school year. Second, educational leaders focused on the classroom
and the classroom teachers. Participants had high expectations of teachers and expected them to
show positive student academic achievement with each student. Educational leaders mentioned
focusing resources on the classroom during difficult economic times at the expense of other
departments.
RQ 3
Research question three asked, how does the school district leadership allocate financial
resources? Each site provided answers to the research question. Participants from each site
provided evidence of creativity when allocating resources such as sharing resources and
expenses across schools and departments. Financial leaders creatively worked with existing law
and policy to continue providing services. Sites differed in their creativity as one district
promoted frugality, another district partnered with the community to provide services, and a final
district found grants to fund desired initiatives. In addition to allocating resources creatively,

144
participants allocated resources openly with stakeholder input. During times of economic
difficulty, each of the sites took extra steps to inform the teaching staff and community members
of potential changes.
Discussion of Findings
According to Yin (2009), a case study design is “compelling” and “robust” in that it can
provide replicability and an explanation of phenomena being studied (p. 53). The concept of
cost-effectiveness (CE) can be found in educational literature from within the past 40 years, but I
was unable to locate any qualitative studies explaining how and why CE is achieved. Thus, the
findings from this research study do not support other qualitative studies of CE research. The
findings provide a rich description that complements quantitative CE research.
A study of a “Success for All” program (Borman & Hewes, 2002) found that district
resources could be reallocated to provide for this program, and the findings of this study support
that claim. In the present study all three participants who were the district chief financial officers
described many ways resources were reallocated based on priorities. The “Success for All”
program was implemented to aid at-risk students, and the long-term benefits of this program
include a reduction in special education services, a decreased number of student retentions, and
an increase in student academic achievement (Borman & Hewes, 2002). The findings from this
study support Borman and Hewes’ (2002) prior research. ASD provides a universal, all day 4K
program and a few 3K classes which provide services to some at-risk students. Longitudinal
student achievement data from ASD suggests those students perform well in elementary school.
Further, the middle school principal in ASD stated she did not mind resources being spent at the
primary and elementary level because those students were learning to read. If those same
students were not able to read by the time they entered middle school, it would be very difficult

145
to show strong academic achievement.
The results of this study call into question a study that looked for correlations between
expenditures on high school leadership and graduation rates (Ng, 2011). Ng’s (2011) study
found no significant positive correlations between expenditures and high school graduation rates.
Ng’s (2011) study suggests that individual attention through specialized programs along with a
focus on student academic achievement may be related to improvement in graduation rates.
Participants in Ng’s (2011) study suggested that individualized data analysis can potentially
predict students who may be at risk of dropping out of high school. Participants then described
ways those students were served as a means of keeping them in school and helping them
graduate. One case provided a special academy setting for struggling students while the two
other cases provided dual credit classes at little or no cost to students. Further, one case spent
additional time and resources sending students with incomplete work to the “Incomplete Room”
so the students would finish their work. The results from this study suggest that Ng (2011) may
have correlated the wrong data, which led to insignificant and negative correlations. Further
analysis is necessary to investigate this possibility.
The most prolific current author in the field of CE is Yeh, and this study provides
additional information to consider. Yeh’s 2012 study of the CE of using value-added methods of
teacher evaluation used a benchmark of 40% teacher turnover rate. One case listed the number
of new teachers to the district in their school board minutes, showing only 5% of the teaching
force (20 of 393) were new to the district. Of those 20 new employees only 10 were first year
teachers, which is only 2.5% of the district teaching staff. The next two school years had a staff
turnover of 6% each year with seven of nine of those teachers being first year teachers. The
percentage of teacher turnover was consistently less than 10%, and this data suggests the CE

146
analysis performed in 2012 used an incorrect estimate.
In addition to providing insight into CE studies, the current study provides relevant
information concerning school district consolidation. Strike (2008) suggested high achieving
schools were focused on one goal or mission, and students will perform well if they received
individual attention. Data from this study supports both of those claims. First, a primary
assertion of this study is that high ROI school districts focus on their priorities – student
academic achievement. One participant stated he allocated resources to instruction and learning
if at all possible. A second assertion of the study stated that high ROI school districts provide
individual attention to students. This study suggests individual data analysis and targeted
instruction can improve student academic achievement, and this conclusion supports Strike
(2008).
Recent research suggests that smaller school districts “respond better to parental input,”
and this study supports that assertion (Banzhaf & Bhalla, 2012, p. 820). All participants in the
study stated the importance of developing school/community relationships. Two cases provided
evidence of parent surveys that were used to aid in decision making. High ROI school districts
develop relationships with parents and community members.
Concurrent with current research, this study provided differing opinions on the topic of
school district consolidation. The opinions of participants from ASD and some participants from
BRSD were consistently against school district consolidation. One reason that was given was
long bus rides. Hanley (2007) and Howard et al. (2010) both noted longer bus rides and
increased costs of secondary services of district consolidation. Proponents of school district
consolidation, all participants from GUSD and some participants from BRSD, suggested
significant amounts of money could be saved through consolidation, and this data supports prior

147
research (Dodson & Garrett, 2004; Duncombe et al., 1995; Gordon & Knight, 2008). Proponents
of consolidation correctly suggested school districts of smaller size (500 students or less) would
provide a significant cost savings. Participants differed in opinion on consolidation of school
districts with 3,000 students or more, and this finding supports the fact that published research
has the same disagreement (Shakiri, 2010; Spradlin et al., 2010).
Although participants and published research disagree on school district consolidation, all
participants agree that school district consolidation makes a profound impact on local
communities. Published research suggests school districts can maintain high student academic
achievement if they communicate with stake holders, maintain facilities, and work towards a
new identity (Dodson & Garrett, 2004; Hyndman et al., 2010; Howard et al., 2010; Warner &
Lindle, 2009). As stated previously, each case dedicates time and resources to communication
with stakeholders. Further, BRSD involved the community during the process of building a new
high school in 2010. The high school was designed using architectural themes based on
historical buildings in the community dating back to the Civil War. Participants from the two
cases that were part of a multi-district county commented on the fact that local control and
influence would be decreased if the local school district was consolidated. Howard et al. (2010)
found that discipline problems increased, students spent longer time on buses, and parents were
less involved in school/community programs. The assertions of this study support this finding.
The largest of the three cases (GUSD) was the only case to mention an initiative to decrease
behavior problems – Positive Behavior Intervention and Supports. An assertion of this study is
that high ROI school districts make a concerted effort to develop positive, reciprocal
relationships with stakeholders.

148
Practical Implications
Findings from this study offer may practical applications to educational leaders. One
implication from this study is the need for careful analysis by policy makers prior to
consolidating school districts. To this point, published research has provided no clear direction
with regard to the appropriateness of school district consolidation in all situations (Banzhaf &
Bhalla, 2012; Jones et al., 2008; Sanders, 2011; Strike, 2008). This study does not claim to have
provided such an answer. The study only provides data for policy makers to consider when
making decisions concerning district consolidation. First, policy makers should review the
student academic achievement of a school district compared to similar districts across the state
and to nearby districts, regardless of size. School districts that are significantly outperforming
adjacent school districts should not necessarily be combined as a means of saving money. Policy
makers must understand district consolidation has personal consequences, as much of the savings
are in deleted personnel positions. Further, policy makers should review the per pupil
expenditures and audit reports of districts prior to making decisions to consolidate school
districts. Published research suggests costs may escalate based on diseconomies of scale if
school districts become too large (Jones et al., 2008; Spradlin et al., 2010; Strike, 2008). This
study suggests that each educational situation is unique, and multiple factors must be considered
prior to making a final decision.
A second implication from this study is the necessity of developing and nurturing
relationships with community members. Much was gained by district administrators partnering
with local businesses and charities to improve the quality of graduates and meet community
needs. One participant created an active advisory board consisting of industry leaders. The
industry leaders were invited to tour the school and provide feedback on exactly what skills and

149
certifications the students needed to learn. The district administrator then modified curriculum to
meet industry demand. Students benefited from employment opportunities and industry
certifications while local businesses benefited from a skilled workforce. Although this
connection is not verifiable, the same school district recently passed a referendum to increase
funding through an increase in millage rates. The local business association openly supported
the referendum. The relationship built between district administration and local business leaders
could have made a positive impact on the passage of the referendum.
In addition to relationships with business leaders, district administrators should develop
relationships with charitable organizations. One site developed a strong relationship with a
group of local churches. In turn, the local churches provided school supplies for needy students
and provided financial information and medical assistance to needy families. One site held
friendly competitions among schools and donated funds to the local United Way. Staff and
student donations totaled more than $100,000 for the local charity. Community members who
saw the school leadership take an active role in giving back to the community may make a
positive impact in building school/community relationships.
A third implication of this study is the importance of individualized attention to student
achievement. District administrators were aware of specific performance indicators of current
student academic achievement, and plans were immediately made to assist struggling students.
Educators must take advantage of both formative and summative assessments throughout the
school year to measure student academic achievement, and then monitor and adjust instruction
based on student needs. Educators at the high school level must also give individual attention to
struggling students, even at the earliest stage of high school. District administrators created
pathways for atypical learners to complete high school and progress into higher education or the

150
job market. District administrators sought relationships with colleges and universities to provide
dual credit opportunities for learners who may not have been considering college. Other
opportunities were available in career and technical fields. School districts in the process of
building a new high school may need to consider adding career and technical classrooms to the
plans if feasible. One case in this study had a career and technical campus connected to the high
school, and over 80% of students took career and technical classes compared to less than 25% of
students from other cases.
A fourth recommendation from this study is the necessity of building an atmosphere of
camaraderie and collaboration. Each participant in this study mentioned the importance of
camaraderie or a desire to increase the collaboration in the district. Participants shared
professional development resources, which allowed faculty and administration from different
schools to build relationships. Educators should also attempt to build camaraderie through
shared professional development activities. Educators who have input in the creation of
professional development activities through professional learning communities are more likely to
take ownership in the professional development. Further, educators who are asked to share as
experts in a field could feel more valued and develop increased levels of self-confidence.
A final recommendation from this study is a self-assessment of an educator’s focus. This
study found data which suggests many changes in state standards are coming and will continue
to come in the future. Participants in the study stated repeatedly that they needed to remember
why they were educators and keep the focus on instruction and student academic achievement.
Through an accreditation visit, one case developed a shared district mission and vision, and that
shared mission and vision informs policy making. Educators should self-assess their primary
focus and always remember their primary purpose.

151
Limitations
The present qualitative study of return on investment was limited in geography, data
sources, participants, and transferability. The study was limited geographically to the state of
South Carolina. Only a small pool of school districts (n = 12) were identified as providing a high
ROI, and thus much could be gained by studying school districts from different states or regions
of the country. To achieve data triangulation, school report card data, archival records, and
interviews were analyzed. The study did not include observations or survey data. Observations
of school board meetings or budget workshops could have provided additional information to
help answer research questions. The study was limited to participants from the district office
(one instructional, one financial) and three building administrators. Additional participants, such
as a book keeper, could have provided more information about day to day operations. Further, a
participant in a managerial capacity from transportation or maintenance could have given
practical information about cost savings. One participant in the study mentioned the fact that
during budget cuts very little preventative maintenance was performed. Additional information
could have been gathered from a maintenance manager on how they kept up facilities with
limited maintenance funding.
The study is limited in its transferability. Levels of funding, and thus overall budget are
set by local, state, and federal governments. According to state funding formulas, certain school
districts may be allocated additional funds which are not necessarily needed. When those funds
are spent, they increase the per pupil expenditures and lower the cost-effectiveness ratio. For
example, a school district may be located in a high poverty area and receive large amounts of
Title I funding. Data from this study suggests school districts should seek grant funding when
they need resources, but that school district with additional Title I funds may have no need of

152
additional funds. Thus, some assertions gained from this study may not apply to all locations.
Recommendations for Future Research
Although cost-effectiveness research has been conducted since the 1970s, I was unable to
find any qualitative research studies that explained how and why school districts were able to
provide a cost-effective environment. Further studies should be conducted in other geographic
locations to compare findings with this study. Qualitative studies should also be completed on
recently consolidated or de-consolidated districts to review the cost-effectiveness before and
after the change. This current study was conducted with high ROI school districts. An
additional study could be conducted on school districts that were rated low ROI in order to
compare the results to this present study.
Additional qualitative studies could be completed which rely on additional data sources,
such as observational records, school board meetings, or budget meetings. Such data from open
discussion of adding or deleting positions, choosing to remove an educational program, or
deciding how to make up for budget shortfalls mid-year could provide practical solutions to
problems facing districts all across the United States. Care would have to be taken to provide
anonymity and protection of personal data, but much could be gained from potential solutions.
The results of this study did not specifically address special education students. The data did not
provide ways educational leaders specifically worked with special needs students in a cost-
effective way. Further analysis is needed.
The theoretical foundation of this study was transformational leadership.
Transformational leadership is measured quantitatively through a survey and a study could be
conducted comparing leaders of high ROI districts compared to low ROI districts. The study
may find correlations between transformational leaders and the overall return on investment.

153
REFERENCES
Ackoff, R. L. (1999). Transformational leadership. Strategy & Leadership, 27(1), 20-25.
doi:10.1108/eb054626
Adcox, S. (2012, January 21). Bill would combine school districts. The Post and Courier.
Retrieved from http://www.postandcourier.com/article/20120121/PC1602/301219952
Alsbury, T. L., & Shaw, N. L. (2005). Policy implications for social justice in school district
consolidation. Leadership and Policy in Schools, 4(2), 105-126.
doi:10.1080/15700760590965578
Alvik, T. (1995). School-based evaluation: A close-up. Studies in Educational Evaluation, 31,
311-343.
Arsen, D. (2011). Reaction to “Observations on School District and Service Consolidation”.
(Working Paper #17). Retrieved from
http://education.msu.edu/epc/forms/Shakrani%20_2011_%20Reaction_to_Arsen_Cosolid
ation_Paper.pdf
Atkinson, T. N., & Pilgreen, T. (2011). Adopting the transformational leadership perspective in a
complex research environment. Research Management Review, 18(1), 42-63.
Avolio, B. J., Kahai, S., & Dodge, G. E. (2001). E-leadership: Implications for theory, research,
and practice. Leadership Quarterly, 11(4), 615-668.
Avolio, B. J., Reichard, R. J., Hannah, S. T., Walumbwa, F. O., & Chan, A. (2009) A meta-
analytic review of leadership impact research: Experimental and quasi-experimental
studies. Leadership Quarterly, 20(5), 764-784. doi:10.1016/jleaqua.2009.06.006
Avolio, B. J., Walumbwa, F. O., & Weber, T. J. (2009). Leadership: Current theories, research,
and future directions. Annual Review of Psychology, 60(1), 421-449. doi:10.1146/

154
annurev.psych.60.110707.163621
Bansal, M., & Singh, K. (2005). From leadership to e-leadership: A paradigm shift. Indian
Journal of Industrial Relations, 40(3), 394-409.
Banzhaf, H. S., & Bhalla, G. (2012). Do households prefer small school districts? A natural
experiment. Southern Economic Journal, 78(3), 819-841.
Barling, J., Christie, A., & Turner, N. (2008). Pseudo-transformational leadership: Towards the
development and test of a model. Journal of Business Ethics, 81(4), 851-861. doi:10.
1007/s10551-007-9552-8
Bass, B. M. (1993). A seminal shift: The impact of James Burns’ leadership. Leadership
Quarterly, 4(3/4), 375-377. doi:10.1016/1048-9843(93)90042-r
Bass, B. M. (1995). Theory of transformational leadership redux. Leadership Quarterly, 6(4),
463-478. doi:10.1016/1048-9843(95)90021-7
Bass, B. M. (1997). Does the transactional – transformational leadership paradigm transcend
organizational and national boundaries? American Psychologist, 52(2), 130-139.
doi:10.1037/0003-066x.52.2.130
Bass, B. M. (2007). Executive and strategic leadership. International Journal of Business, 12(1),
33-52.
Bass, B. M., & Avolio, B. J. (1993). Transformational leadership and organizational culture.
Public Administration Quarterly, 17(1), 112-121.
Bass, B. M., Avolio, B. J., Jung, D. I., & Berson, Y. (2003). Predicting unit performance by
assessing transformational and transactional leadership. Journal of Applied Psychology,
88(2), 207-218. doi:10.1037/0021-9010.88.2.207
Bass, B. M., & Steidlmeier, P. (1999). Ethics, character and authentic transformational

155
leadership behavior. Leadership Quarterly, 10(2), 181-217. doi:10.1016/s1048-
9843(99)00016-8
Berendt, C. J., Christofi, A., Kasibhatla, K. M., Malindretos, J., & Maruffi, B. (2012).
Transformational leadership: Lessons in management for today. International Business
Research, 5(10), 227-232. doi:10.5539/ibr.v5n10p227
Berger, S., Whitstone, B. N., Frisbee, S. J., Miner, J. T., Dhala, A., Pirrallo, R. G., Utech, L. M.,
& Sachdeva, R. C. (2004). Cost-effectiveness of Project ADAM: A projects to prevent
sudden cardiac death in high school students. Pediatric Cardiology, 25, 660-667.
doi:10.1007/s00246-003-0668-z
Berry, C. R., & West, M. R. (2010). Growing pains: The school consolidation movement and
student outcomes. Journal of Law, Economics, & Organization, 26(1), 1-30.
doi:10.1093/jleo/ewn015
Black, G. L. (2010). Correlational analysis of servant leadership and school climate. Catholic
Education: A Journal of Inquiry and Practice, 13(4), 437-466.
Bjork, L. G., & Blasé, J. (2009). The micropolitics of school district decentralization.
Educational Assessment, Evaluation and Accountability, 21, 195-208. doi:10.
1007/s11092-009-9078-y
Bono, J. E., & Judge, T. A. (2004). Personality and transformational and transactional
leadership: A meta-analysis. Journal of Applied Psychology, 89(5), 901-910.
doi:10.1037/0021-9010.89.5.901
Boote, D. N., & Beile, P. (2005). Scholars before researchers: On the centrality of the
dissertation literature review in research preparation. Educational Researcher, 34(6), 3-
15. doi:10.3102/0013189X034006003
156
Borman, G. D., & Hewes, G. M. (2002). The long-term effects and cost-effectiveness of success
for all. Educational Evaluation and Policy Analysis, 24(4), 243-266. doi:10.3102/
01623737024004243
Boser, U. (2011). Return on educational investment: A district-by-district evaluation of U.S.
educational productivity. Retrieved from Center for American Progress website:
http://www.americanprogress.org/wp-content/uploads/issues/2011/01/pdf/dwwroi.pdf
Boyum, G. (2008). The historical and philosophical influence on Greenleaf’s concept of servant
leadership: Setting the state for theory building. Retrieved from ERIC database.
(ED501687)
Brasington, D. M. (2003). Size and school district consolidation: Do opposites attract?
Economica, 70(280), 673-690. doi:10.1046/j.0013-0427.2003.01046.x
Brymer, E., & Gray, T. (2006). Effective leadership: Transformational or transactional?
Australian Journal of Outdoor Education, 10(2), 13-19.
Burgess, M. & Dixon, P. (2012). A comparative study of school effectiveness in Aguablanca,
Colombia. Educational Management Administration & Leadership, 40(3), 362-375.
doi:10.1177/1741143212436956
Camps, J., & Rodríguez, H. (2011). Transformational leadership, learning, and employability:
Effects on performance among faculty members. Personnel Review, 40(4), 423-442.
doi:10.1108/00483481111133327
Carruthers, C. K. (2012). New schools, new students, new teachers: Evaluating the effectiveness
of charter schools. Economics of Education Review, 31(2), 280-292. doi:10.1016/
j.econedurev.2011.06.001
Cavanagh, S. (2012, January 9). U.S. education pressured by international comparisons.

157
Education Week. Retrieved from http://www.edweek.org/ew/articles/2012/01/12/
16overview.h31.html
Christie, A., Barling, J., & Turner, N. (2011). Pseudo-transformational leadership: Model
specification and outcomes. Journal of Applied School Psychology, 41(12), 2943-2984.
doi:10.1111/j.1559-1816.2011.00858.x
Colegrave, A. D. & Giles, M. (2008). School cost functions: A meta-regression analysis.
Economics of Education Review, 27(6), 688-696. doi:10.1016/j.econedurev.2007.05.006
Creswell, J. W. (2007). Qualitative inquiry & research design: Choosing among five
approaches. (2nd ed.). Thousand Oaks, CA: Sage Publications, Inc. Florida Journal of
Educational Administration & Policy, 4(1), 131-146.
Creswell, J. W., & Miller, D. L. (2000). Determining validity in qualitative inquiry. Theory into
Practice, 39(3), 124-130. Retrieved from http://www.jstor.org/stable/1477543
Crippen, C. (2005). The democratic school: First to serve, then to lead. Canadian Journal of
Educational Administration and Policy, 47, 1-17. Retrieved from http://www.eric.ed.gov
/PDFS/EJ846732.pdf
Dawson, H. A. (1934). Satisfactory local school units, field study no. 7. Nashville, TN: George
Peabody College for Teachers.
Davenport, J. (2008, October 17). SC lawmakers propose $488M in budget cuts. GOUpstate.
Retrieved from http://www.goupstate.com/article/20081017/NEWS/810170290
Day, C. (2000). Beyond transformational leadership. Educational Leadership, 57(7), 56-59.
de Maeyer, S., van den Bergh, H., Rymenans, R., Van Petegem, P., & Rijlaarsdam, G. (2010).
Effectiveness criteria in school effectiveness studies: Further research on the choice for a
multivariate model. Educational Research Review, 5(1), 81-96. doi:10.1016/j.edurev.

158
2009.09.001
Diaz, V. (2008). Relationship between district size, socioeconomics, expenditures, and student
achievement in Washington. The Rural Educator, 29(3), 30-39.
Dionne, S. D., Yammarino, F. J., Atwater, L. E., & Spangler, W. D. (2004). Transformational
leadership and team performance. Journal of Organizational Change Management,
17(2), 177-193. doi:10.1108/09534810410530601
Dodson, M. E., & Garrett, T. A. (2004). Inefficient education spending in public school districts:
A case for consolidation. Contemporary Economic Policy, 22(2), 270-280.
doi:10.1093/cep/byh019
Donmoyer, R. (2012). Can qualitative researchers answer policymakers’ what-works question?
Qualitative Inquiry, 18(8), 662-673. doi:10.1177/1077800412454531
Driscoll, D., Halcoussis, D., & Svorny, S. (2003). School district size and student performance.
Economics of Education Review, 22(2), 193-201. doi:10.1016/S0272-7757(02)00002-X
Duncombe, W., Miner, J., & Ruggiero, J. (1995). Potential cost savings from school district
consolidation: A case study of New York. Economics of Education Review, 14(3), 265-
284. doi:10.1016/0272-7757(94)00011-T
Dunn, M. W., Dastoor, B., & Sims, R. L. (2012). Transformational leadership and organizational
commitment: A cross-cultural perspective. Journal of Multidisciplinary Research, 4(1),
45-59.
Ehrlich, S. B., Meindl, J. R., & Viellieu, B. (1990). The charismatic appeal of a transformational
leader: An empirical case study of a small, high-technology contractor. The Leadership
Quarterly, 1(4), 229-247. doi:10.1016/1048-9843(90)90003-Z
Eisenbeiss, S. A., van Knippenberg, D., & Boerner, S. (2008). Transformational leadership and

159
team innovation: Integrating team climate principles. Journal of Applied Psychology,
93(6), 1438-1446. doi:10.1037/a0012716
Elliott, S., Combs, S., & Boyce, R. (2011). Recess physical activity packs in elementary schools:
A qualitative investigation. Physical Educator, 68(3), 150-162.
Faber, C. F. (1966). The size of a school district. The Phi Delta Kappan, 48(1), 33-35.
Fahlman, D. (2012). Educational leadership for e-learning in the healthcare workplace.
International review of research in open and distance learning, 13(2), 236-246.
Retrieved from http://www.eric.ed.gov/PDFS/EJ983282.pdf
Farrell, A. F., & Collier, M. A. (2010). School personnel’s perceptions of family-school
communication: A qualitative study. Improving Schools, 13(4), 4-20. doi:10.1177/
136580209352547
Feuerstein, A. (2009). School board ethics and effectiveness. Planning and Changing, 40(1/2), 3-
34. 19. doi:10.1016/0883-0355(89)90023-2
Fitzgerald, S., & Schutte, N. S. (2010). Increasing transformational leadership through enhancing
self-efficacy. Journal of Management Development, 29(5), 495-505. doi:10.1108/
02621711011039240
Franciosi, S. J. (2012). Transformational leadership for education in a digital culture. Digital
Culture & Education, 4(2), 235-247. Retrieved from http://www.digitalculture
andeducation.com/cms/wp-content/uploads/2012/09/ dce_4001_franciosi.pdf
French, P. E. (2009). Assessing the impact of perceived school board effectiveness on financing
k-12 education in Tennessee. Journal of Public Budgeting, Accounting & Financial
Management, 21(1), 105-124.
Gall, M. D., Gall, J. P., & Borg, W. R. (2007). Educational research: An introduction (8th

160
ed.). New York: Allyn & Bacon.
Garner, C. W. (1998). A cost efficiency analysis of school districts: Is larger more efficient?
Journal of Public Budgeting, Accounting & Financial Management, 10(4), 513-526.
Gislason, N. (2009). Mapping school design: A qualitative study of the relations among facilities
design, curriculum delivery, and school climate. Journal of Environmental Education,
40(4), 17-33. doi:10.3200/joee.40.4.17-34
Glatthorn, A. A., & Joyner, R. L. (2005). Writing the winning thesis or dissertation: A step-by-
step guide. (2nd ed.). Thousand Oaks, CA: Corwin Press.
Gordon, N., & Knight, B. (2008). The effects of school district consolidation on educational cost
and quality. Public Finance Review, 36(4), 408-430. doi:10.1177/1091142107305219
Gray, N. L. (2012). School choice and achievement: The Ohio charter school experience. Cato
Journal, 32(3), 557-579.
Greenleaf, R. K. (1977). Servant Leadership. New York, NY: Paulist Press. NY
Hackman, M. Z., & Johnson, C. E. (2009). Leadership: A communication perspective. Long
Grove, IL: Waveland Press, Inc.
Hanley, P. F. (2007). Transportation cost changes with statewide school district consolidation.
Socio-Economic Planning Sciences, 41(2), 163-179. doi:10.1016/j.seps.2005.10.004
Hannah, S. T., & Avolio, B. J. (2011). The locus of leader character. The Leadership Quarterly,
22(5), 979-983. doi:10.1016/j.leaqua.2011.07.016
Harrison, L. M. (2011). Transformational leadership, integrity, and power. New Directions for
Student Services, 2011(135), 45-52. doi:10.1002/ss.403
Hater, J. J., & Bass, B. M. (1988). Superiors' evaluations and subordinates' perceptions of
transformational and transactional leadership. Journal of Applied Psychology, 73(4), 695-

161
702. doi:10.1037/0021-9010.73.4.695
Heinesen, E. (2005). School district size and student educational attainment: Evidence from
Denmark. Economics of Education Review, 24(6), 677-689. doi:10.1016/j.econedurev.
2004.10.002
Hentschke, G. C., Nayfack, M. B., & Wohlstetter, P. (2009). Exploring superintendent leadership
in smaller urban districts: Does district size influence superintendent behavior? Education
and Urban Society, 41(3), 317-337. doi:10.1177/0013124508329626
Houck, E. A., Rolle, E. A., & He, J. (2010). Examining school district efficiency in Georgia.
Journal of Education Finance, 35(4), 331-357. doi:10.1353/jef.0.0022
Howard, J. Y., Wrobel, S. L., & Nitta, K. A. (2010). Implementing change in an urban school
district: A case study of the reorganization of the Little Rock School District. Public
Administration Review, 70(6), 934-941. doi:10.1111/j.1540-6210.2010.02229.x
Howell, D. C. (2011). Fundamental statistics for the behavioral sciences. (7th ed.). Belmont, CA:
Thomson/Wadsworth.
Howley, C., Johnson, J., & Petrie, J. (2011). Consolidation of schools and districts: What the
research says and what it means. Retrieved from http://nepc.colorado.edu/files/PB-
Consol-Howley-Johnson-Petrie.pdf
Hu, Y., & Yinger, J. (2008). The impact of school district consolidation on housing prices.
National Tax Journal, 61(4), 609-633.
Hummel-Rossi, B., & Ashdown, J. (2002). The state of cost-benefit and cost-effectiveness
analyses in education. Review of Educational Research, 72(1), 1-30. doi:10.3102/
00346543072001001
Iatarola, P., & Fruchter, N. (2004). District effectiveness: A study of investment strategies in

162
New York City public schools and districts. Educational Policy, 18(3), 491-512.
doi:10.1177/0895904804265020
Jackson, K. M. (2012). Influence matters: The link between principal and teacher influence over
school policy and teacher turnover. Journal of School Leadership, 22(5), 875-901.
Jacques, C., & Brorsen, B. W. (2002). Relationship between types of school district expenditures
and student performance. Applied Economics Letters, 9(15), 997-1002. doi:10.1080/
13504850210148161
Jones, J. T., Toma, E. F., & Zimmer, R. W. (2008). School attendance and district and school
size. Economics of Educational Review, 27(2), 140-148. doi:10.1016/j.econedurev.
2006.09.005
Judge, T. A., & Bono, J. E. (2000). Five-factor model of personality and transformational
leadership. The Journal of Applied Psychology, 85(5), 751-765. doi:10.1037/0021-
9010.85.5.751
Judge, T. A., & Piccolo, R. F. (2004). Transformational and transactional leadership: A meta-
analytic test of their relative validity. The Journal of Applied Psychology, 89(5), 755-768.
doi:10.1037/0021-9010.89.5.755
Kaiser, K. (2009). Protecting respondent confidentiality in qualitative research. Qualitative
Health Research, 19(1), 1632-1641. doi:10.1177/1049732309350879
Kanungo, R. N. (2001). Ethical values of transactional and transformational leaders. Canadian
Journal of Administrative Sciences, 18(4), 257-265. doi:10.1111/j.1936-4490.2001.
tb00261.x
Kark, R., Shamir, B., & Chen, G. (2003). The two faces of transformational leadership:
Empowerment and dependency. The Journal of Applied Psychology, 88(2), 246-255.

163
doi:10.1037/0021-9010.88.2.246
Kelloway, E. K., Barling, J., Kelley, E., Comtois, J., & Gatien, B. (2003). Remote
transformational leadership. Leadership & Organization Development, 24(3), 163-171.
doi:10.1108/01437730310469589
Khoo, H. S., & Burch, G. S. (2008). The ‘dark side’ of leadership personality and
transformational leadership: An exploratory study. Personality and Individual
Differences, 44(1), 86-97. doi:10.1016/j.paid.2007.07.018
Khatri, N., Templer, K. J., & Budhwar, P. S. (2011). Great (transformational) leadership =
charisma + vision. South Asian Journal of Global Business Research, 1(1), 38-62.
doi:10.1108/20454451211205941
Kidwell, R. E. (2005). Seven decades of leadership and performance: An interview with Bernard
M. Bass. Journal of Applied Management and Entrepreneurship, 10(3), 87-96.
Kim, M. C., & Hannafin, M. J. (2010). Scaffolding 6th graders’ problem solving in technology-
enhanced science classrooms: A qualitative case study. Instructional Science, 39(3), 255-
282. doi:10.1007/s11251-010-9127-4
Kim, Y. (2011). Program evaluation for strategic planning and resource management: An
approach for school effectiveness evaluation. KEDI Journal of Educational Policy, 8(2),
303-322.
King, J. A., & Rohmer-Hirt, J. A. (2011). Internal evaluation in American public school districts:
The importance of externally driven accountability mandates. New Directions for
Evaluation, 132, 73-86. doi:10.1002/ev.397
Konorti, E. (2008). The 3D transformational leadership model. The Journal of American
Academy of Business, 14(1), 10-20.

164
Kouzes, J. M., & Posner, B. Z. (2007). The leadership challenge. (4th ed.). San Francisco, CA:
Jossey-Bass Inc.
Leithwood, K. A., & Poplin, M. S. (1992). The move toward transformational leadership.
Educational Leadership, 49(5). 8-12.
Levenson, B. (2012). Applying systems thinking to improve special education in Ohio. Retrieved
from Thomas Fordham Institute website: http://www.edexcellencemedia.net/publications/
2012/20120905-Applying-Systems-Thinking-to-Improve-Special-Education-in-Ohio/
20120905-Applying-Systems-Thinking-to-Improve-Special-Education-in-Ohio.pdf
Levin, H. M. (1975). Cost-effectiveness in evaluation research. In M. Guttentag & E. Struening
(Eds.), Handbook of evaluation research (Vol. 2, pp. 89-122). Beverly Hills, CA: Sage.
Levin, H. M. (1988). Cost-effectiveness and educational policy. Educational Evaluation and
Policy Analysis, 10(1), 51-69. Retrieved from http://www.jstor.org/stable/1163864
Levin, H. M. (2001). Waiting for godot: Cost-effectiveness analysis in education. New
Directions for Evaluation, 2001(90), 55-68. doi: 10.1002/ev.12
Levin, H. M., & McEwan, P. J. (2001). Cost-effectiveness Analysis. (2nd ed.). Thousand Oaks,
CA: Sage Publications, Inc.
Levy, A. J., Lois, J., Ellis, P., Jablonski, E., & Karelitz, T. M. (2012). Estimating teacher
turnover costs: A case study. Journal of Educational Finance, 38(2), 102-129.
Lincoln, Y. S., & Guba, E. G. (1985). Naturalistic inquiry. Beverly Hills, CA: Sage.
Lindahl, R. A., & Cain, P. M. (2012). A study of school size among Alabama’s public high
schools. International Journal of Education Policy & Leadership, 7(1), 1-27.
Lo, S., Wang, Y., Wu, L., Hsu, M., Chang, S., & Hayter, M. (2009). A cost-effectiveness
analysis of a multimedia learning education program for stoma patients. Journal of

165
Clinical Nursing, 19, 1844-1854. doi:10.111/j.1365-2702.2009.02931.x
Massoni, S., & Vergnaud, J. (2011). How to improve pupils’ literacy? A cost-effectiveness
analysis of a French educational project. Economics of Education Review, 31, 84-91.
doi:10.1016/j.econedurev.2011.08.013
Maxwell, J. A. (2006). Literature reviews of, and for, educational research: A commentary on
Boote and Beile’s “Scholars Before Researchers.” Educational Researcher, 35 (9), 28-35.
Mensah, Y. M., Schoderbek, M. P., & Werner, R. B. (2009). A methodology for evaluating the
cost-effectiveness of alternative management tools in public-sector institutions: An
application to public education. Journal of Management Accounting Research, 21, 203-
239.
Mulla, Z. R., & Krishnan, V. R. (2011). Transformational leadership: Do the leader’s morals
matter and do the follower’s morals change? Journal of Human Values, 17(2), 129-143.
doi:10.1177/097168581101700203
Munyua, H., & Stilwell, C. (2009). A mixed qualitative-quantitative-participatory methodology:
A study of the agricultural knowledge and information system (AKIS of small-scale
farmers in Kirinyaga district, Kenya. Library Management, 31(1), 5-18. doi:10.1108/
01435121011013359
Newton, P., Tunison, S., & Viczko, M. (2010). The school principal’s role in large-scale
assessment. Canadian Journal of Educational Administration and Policy, 105, 1-24.
Ng, L. (2011). Educational leadership cost-effectiveness and high school completion among
Oahu’s public school districts. The Business Review, Cambridge, 17(1), 39-45.
Nitta, K. A., Wrobel, S. L., Howard, J. Y., & Jimmerson-Eddings, E. (2009). Leading change of
a school district reorganization. Public Performance & Management Review, 32(3), 463-

166
488. doi:10.2753/PMR1530-9576320305
Odom, L., & Green, M. T. (2003). Law and ethics of transformational leadership. Leadership &
Organization Development Journal, 24(2), 62-69. doi:10.1108/01437730310463251
Oliff, P., Mai, C., & Leachman, M. (2012). New school year brings more cuts in state funding
for schools. Retrieved from http://www.cbpp.org/files/9-4-12sfp.pdf
Ornstein, A. C. (1989). School district and school size: An evolving controversy. The Clearing
House, 63(4), 156-158.
Ornstein, A. C. (2010). Achievement gaps in education. Society, 47(5), 424-429.
doi:10.1007/s12115-010-9354-y
Parveen, S., Anwar, S., & Majoka, M. I. (2011). Relationship between school effectiveness and
academic performance: A study of secondary schools in Khybar Pakhtoonkhaw, Pakistan.
Interdisciplinary Journal of Contemporary Research in Business, 2(12), 306-315.
Price, T. L. (2003). The ethics of authentic transformational leadership. The Leadership
Quarterly, 14(1), 67-81. doi:10.1016/s1048-9843(02)00187-x
Pulley, M. L., & Sessa, V. I. (2001). E-leadership: Tackling complex challenges. Industrial and
Commercial Training, 33(6), 225-230. doi:10.1108/00197850110405379
Purcell, M. L., Horn, E., & Palmer, S. (2007). A qualitative study of the initiation and
continuation of preschool inclusion programs. Exceptional Children, 74(1), 85-99.
Rest, J. R. (1990). DIT manual (3rd ed.). Minneapolis, MN: Center for the Study of Ethical
Development.
Robertson, F. W. (2007). Economies of scale for large school districts: A national study with
local implication. The Social Science Journal, 44(4), 620-629. doi:10.1016/j.socjij.
2007.10.005
Rocco, T. S., & Plakhotnik, M. S. (2009). Literature reviews, conceptual frameworks, and

167
theoretical frameworks: Terms, functions, and distinctions. Human Resource
Development Review, 8(1), 120-130. doi:10.1177/1534484309332617
Ronfeldt, M., Loeb, S., & Wyckoff, J. (2013). How teacher turnover harms student achievement.
American Educational Research Journal, 50(1), 4-36. doi:10.3102/0002831212463813
Russell, E. J. (2012). The role of servant leadership in faculty development programs: A review
of the literature. Turkish Online Journal of Distance Education, 13(1), 15-19. Retrieved
from http://www.eric.ed.gov/PDFS/EJ976925.pdf
Ryan, K. E., Chandler, M., & Samuels, M. (2007). What should school-based evaluation look
like? Studies in Educational Evaluation, 33(3), 197-212. doi:10.1016/j.stueduc.
2007.07.001
Sadeghi, A., & Pihie, Z. A. (2012). Transformational leadership and its predictive effects on
leadership effectiveness. International Journal of Business and Social Science, 3(7), 186-
197.
Saito, Y., & McIntosh, C. S. (2010). The economic value of auditing and its effectiveness in
public school operations. Contemporary Accounting Research, 27(2), 639-667. doi:10.
1111/j.1911-3846.2010.01019.x
Sanders, M. G. (2011). Achieving scale at the district level: A longitudinal multiple case study of
a partnership reform. Educational Administration Quarterly, 48(1), 154-186. doi:10.
1177/0013161X11417432
Schaubroeck, J., Lam, S. S., & Cha, S. E. (2007). Embracing transformational leadership: Teams
values and the impact of leader behavior on team performance. Journal of Applied
Psychology, 92(4), 1020-1030. doi:10.1037/0021-9010.92.4.1020
Schneider, S. K., & George, W. M. (2010). Servant leadership versus transformational leadership

168
in voluntary service organizations. Leadership & Organization Development Journal,
32(1), 60-77. doi:10.1108/01437731111099283
Seltzer, J., & Bass, B. M. (1990). Transformational leadership: Beyond initiation and
consideration. Journal of Management, 16(4), 693-703. doi:10.1177/
014920639001600403
Shakrani, S. M. (2010). School district consolidation study in 10 Michigan counties. (Working
Paper No. 15) Retrieved from http://media.mlive.com/news_impact/other/textreport.pdf
Sindelar, P. T., Dewey, J. F., Rosenberg, M. S., Corbett, N. L., Denslow, D., & Lotfinia, B.
(2012). Cost effectiveness of alternative route special education teacher preparation.
Exceptional Children, 79(1), 25-42.
Smith, M. D. (2012). School self-evaluation: A Jamaican perspective. Journal of Third World
Studies, 29(1), 137-153.
South Carolina Department of Education. (2013). South Carolina district/school report cards.
Retrieved from http://ed.sc.gov/data/report-cards/
Spradlin, T. E., Carson, F. R., Hess, S. E., & Plucker, J. A. (2010). Revisiting school district
consolidation issues. Center for Evaluation & Education Policy, 8(3), 1-20.
Stake, R. E. (2006). Multiple case study analysis. New York: The Guilford Press.
Storr, L. (2004). Leading with integrity: A qualitative research study. Journal of Health
Organization and Management, 18(6), 415-434. doi:10.1108/14777260410569984
Strike, K. A. (2008). Small schools: Size or community? American Journal of Education, 114(3),
169-190. doi:10.1086/529499
Tabassi, A. A., & Bakar, A. B. (2010). Towards assessing the leadership style and quality of
transformational leadership: The case of construction firms of Iran. Journal of

169
Technology Management in China, 5(3), 245-258. doi: 10.1108/17468771011086256
Turner, N., Barling, J., Epitropaki, O., Butcher, V., & Milner, C. (2002). Transformational
leadership and moral reasoning. Journal of Applied Psychology, 87(2), 304-311.
doi:10.1037//0021-9010.87.2.304
Ulbrich, H. H. (2010). School district organization and governance in South Carolina. Retrieved
from Strong Thurmond Institute of Government & Public Affairs http://sti.clemson.edu/
component/docman/cat_view/29-jim-self-center-on-the-future/67-education
U.S. News and World Report. (2012). Woodruff High Overview. U.S. News and World Report.
Retrieved from http://www.usnews.com/education/best-high-schools/south-
carolina/districts/spartanburg-04/woodruff-high-17721
van de Bunt-Kokhuis, S., & Sultan, N. (2012). Servant leadership: The online way! e-learning
where community building is key. European Journal of Open, Distance and E-Learning,
1-10.
Vinger, G., & Cilliers, F. (2006). Effective transformational leadership behaviors for managing
change. Journal of Human Resource Management, 4(2), 1-9.
Waldman, D. A., & Bass, B. M. (1991). Transformational leadership at different phases of the
innovation process. The Journal of High Technology Management Research, 2(2), 169-
180. doi: 10.1016/1047-8310(91)90002-6
Wang, X., & Howell, J. M. (2012). A multilevel study of transformational leadership,
identification, and follower outcomes. The Leadership Quarterly, 23(5), 775-790. doi:
10.1016/j.leaqua.2012.02.001.
Warner, W., & Lindle, J. C. (2009). Hard choices in school consolidation: Providing education in
the best interests of students or preserving community identity. Journal of Cases in

170
Educational Leadership, 12(1), 1-11. doi:10.1177/1555458908329776
Wiggins, G., & McTighe, J. (1998). Understanding by Design. Alexandria, VA: ASCD.
Winters, M. A., & Cowen, J. M. (2012). Grading New York: Accountability and student
proficiency in America’s largest school district. Educational Evaluation and Policy
Analysis, 34(3), 313-327. doi:10.3102/0162373712440039
Wright, H., & Harris, S. (2010). The role of the superintendent in closing the achievement gap in
diverse small school districts. Planning and Changing, 41(3/4), 220-233.
Yeh, S. S. (2007). The cost-effectiveness of five policies for improving student achievement.
American Journal of Evaluation, 28(4), 416-435. doi:10.1177/1098214007307928
Yeh, S. S. (2008). The cost-effectiveness of comprehensive school reform and rapid assessment.
Education Policy Analysis Archives, 16(13), 1-28. Retrieved from
http://epaa.asu.edu/epaa/v16n13
Yeh, S. S. (2009a). Class size reduction or rapid formative assessment? A comparison of cost-
effectiveness. Educational Research Review, 4, 7-15. doi:10.1016/j.edurev.2008.09.001
Yeh, S. S. (2009b). The cost-effectiveness of raising teacher quality. Educational Research
Review, 4, 220-232. doi:10.1016/jedurev.2008.06.002
Yeh, S. S. (2010a). The cost-effectiveness of 22 approaches for raising student achievement.
Journal of Education Finance, 36(1), 38-75. doi:10.1353/jef.0.0029
Yeh, S. S. (2010b). The cost-effectiveness of NBPTS teacher certification. Evaluation Review,
34(3), 220-241. doi:10.1177/0193841X10369752
Yeh, S. S. (2012). The reliability, impact, and cost-effectiveness of value-added teacher
assessment methods. Journal of Education Finance, 37(4), 374-399. doi:10.1353/
jef.2012.0009
171
Yin, R. K. (2009). Case study research: Design and methods. (2nd ed.). Thousand Oaks, CA:
Sage Publications, Inc.
Zhao, D., & Ma, Y. (2009). A qualitative study on primary school mathematics lesson
evaluation. Frontier Education in China, 4(4), 506-525. doi:10.1007/s11516-009-0028-8
Zhu, W., Avolio, B. J., Riggio, R. E., & Sosik, J. J. (2011). The effect of authentic
transformational leadership on follower and group ethics. The Leadership Quarterly,
22(5), 801-817. doi:10.1016/j.leaqua.2011.07.004

172
Appendix A
CONSENT FORM
Return on Investment: A Multisite Case Study of South Carolina School Districts
Doctoral Dissertation
Timothy R. Nelson
Liberty University
School of Education
You are invited to be in a study of how and why certain public South Carolina school districts
are able to provide a high return on investment: higher than average student academic
achievement and lower than average per pupil expenditures. You were selected as a possible
participant because published research has found your school district provides high return on
investment. You are in a leadership position in your school district. I ask that you read this form
and ask any questions you may have before agreeing to be in the study.
This study is being conducted by Timothy R. Nelson, Liberty University School of Education.
Background Information:
The purpose of the study is to discover how and why certain public school districts are able to
provide a high return on investment (ROI): the school district has higher than average student
academic achievement while having lower than average per pupil expenditures. There are three
research questions. What is the structure of the school district leadership and how do the inner
workings function? How does the school district leadership encourage student academic
achievement? How does the school district leadership allocate financial resources?
Procedures:
If you agree to be in this study, I would ask you to do the following things:
Between July 1, 2013 and January 1, 2014 be interviewed by the researcher. The
interview is semi-structured (there is a specific list of questions that will be asked to each
person) and should take between 30 and 60 minutes.
The interview will be audio recorded so it can be transcribed. The audio recording and
the transcription will be locked in a filing cabinet and password protected when it is
transcribed.
There will only be one interview for each participant.
Each participant will be allowed to review the analysis of his/her interview prior to
publication.

173
Risks and Benefits of being in the Study:
The study has minimal risks. Your school district has a record of high student academic
achievement and low per pupil expenditures when compared to other South Carolina public
school districts. You are being asked to participate to help educators understand how and why
you are able to provide high return on investment. The data collected from this study will help
other educators make instructional and financial choices to help students increase their academic
achievement. The risks of this study are no more than you would encounter in everyday life.
Participants in the study (the school district, your school, and your name) will all be given
pseudonyms to protect their identity.
The benefit to participation is the opportunity to help other educators make decisions to improve
student academic achievement. You will increase the level of professional knowledge about
transformational leadership, cost-effectiveness, and school district consolidation.
Confidentiality:
The records of this study will be kept private. In any sort of report I might publish, I will not
include any information that will make it possible to identify a subject. Research records will be
stored securely and only the researcher will have access to the records.
All participants (school districts, schools, and principals) will be given pseudonyms to protect
their identity. Printed data will be kept in a locked filing cabinet and electronic data will be
password protected. Data will be kept for 3 years in accordance with federal law. Printed data
will be shredded and electronic data will be deleted after 3 years. Audio recordings will be kept
in a locked cabinet and will be deleted after 3 years. Audio recordings will not be used in any
manner other than for transcription.
Voluntary Nature of the Study:
Participation in this study is voluntary. Your decision whether or not to participate will not affect
your current or future relations with Liberty University or the school district where you are
employed. If you decide to participate, you are free to not answer any question or withdraw at
any time without affecting those relationships. If you withdraw from the study the audio
recording and the transcription of the audio recording will be deleted.

174
Contacts and Questions:
The researcher conducting this study is Timothy R. Nelson. You may ask any questions you have
now. If you have questions later, you are encouraged to contact him at (omitted). My
dissertation chair is Dr. John Duryea(omitted).
If you have any questions or concerns regarding this study and would like to talk to someone
other than the researcher, you are encouraged to contact the Institutional Review Board, 1971
University Blvd, Suite 1837, Lynchburg, VA 24502 or email at [email protected].
You will be given a copy of this information to keep for your records.
Statement of Consent:
I have read and understood the above information. I have asked questions and have received
answers. I consent to participate in the study.
(Check) I agree to allow the interview to be audio recorded.
Signature: ________________________________________ Date: ________________
Signature of Investigator:____________________________ Date: ________________
IRB Code Numbers: 1627
IRB Expiration Date:

175
Appendix B
Worksheet 1. Graphic Design of a Case Study
•Main Information Questions
•Issues:
•Changes in funding
•Changes in state testing
•Economic Conditions
•Revelant Research
•Cultural Context
•History
•Community
•Educational System
Applewood School District
Grandview Unified School District
Blue Ridge School District
School Report Card Data
Archival Records
Interviews

176
Appendix C
Worksheet 2. The Themes of a Multicase Study (Research Questions)
Theme 1:
What is the structure of the school district leadership and how do the inner workings function?
Theme 2:
How does the school district leadership encourage student academic achievement?
Theme 3:
How does the school district leadership allocate financial resources?
177
Appendix D
Worksheet 3. Analyst’s Notes While Reading a Case Report Case ID: ________ Analyst’s Synopsis:
The case: The sites: The activity: Key information sources and contextual information:
Uniqueness of case situation for program/phenomenon: Relevance of case for cross-case Themes:
Theme 1______ Theme 2______ Theme 3______ Theme 4______ Theme 5______
Possible excerpts for cross-case report:
Page Page Page
Case Findings:
I. II. III. IV.
Commentary

178
Appendix E
Worksheet 4. Ratings of Expected Utility of Each Case for Each RQ Answer
Case A Case B Case C
Answers to Research
Questions (possible
themes)
Monthly reports
True, staff expected to know student
achievement up to date (M)
Monthly minutes update student
achievement; awards won (M)
Monthly report, limited
information in minutes (L)
Competence of co-
workers
There’s nobody better than [district office
staff] (M)
Stated reason for ROI was staff (H)
Staff given voice to express needs
(M)
Accessibility
Phone call or see in store, impromptu informal meetings
(H)
Flat district office staff; used social
media and website to communicate (M)
DO staff visits schools to get a list of needs (M)
Camaraderie
Decision makers in room; invest in other
schools; share in expenses (DO and
school); collaborate on Read 180 (H)
Enjoyed working together; seek more PD with other staff; went to meals (H)
Collaborate on implementing common core;
“we’re all teaching kids so
why can’t we help each other?”
(H)
Individualized
attention
Struggling students given attention from
multiple staff members; academy made for potential
drop outs (H)
Monitor and adjust to student need (H)
Flexibly grouping at all elementary
schools (H)
Data analysis
Creativity; look for ways to show growth
in addition to standard measures;
data wall (H)
Principals expected to know how
students were doing through standard
measures; data wall in elementary (H)
Data wall for students;
mentioned in school board minutes; (H)
Community
Used Visions to
simply communicate
to public, no school
board budget
meetings; visit in
stores; ball games (H)
6 extra meetings to
meet with
community;
community outreach,
help charities; did
surveys to get public
input; explained
cuts; shop in
community for
school supplies; (H)
PTO actively
involved, SIC;
passing of
referendum based
on partnership
with businesses;
design for new
high school (H)

179
Focus
Don’t spend money
on things that aren’t
education; did own
staff development;
(H)
Superintendent
focuses on student
achievement, not
finances; focus on
priorities (H)
School report
card shows all
schools focusing
on 4 points of
emphasis (H)
Staff development
Did own to save
money from common
core implementation
(M)
interview with desire
to collaborate (L)
Partner with local
college, use PLC
to improve (M)
Creativity
Found ways to
reallocate money to
pay for items; use
money to benefit
more than just one
group of students;
creative data analysis
(H)
Found ways to
finance 100 million
building project
through creative
financing (M)
Ways to decrease
energy costs; look
for grants (M)
Attitude
Limited data (L) Make it happen
attitude in spite of
cuts from multiple
participants;
evidence in archival
records (website) (H)
Limited data (L)

180
Appendix F
Worksheet 5B. A Matrix for Theme-Based Assertions
Merged Answers to
RQ 1, 2, and 3
From Which Cases? RQ 1 RQ 2 RQ 3
Finding I
Monthly Reports
Case A only H Yes Yes No
Finding II
Competence of co-
workers
Case B only H Yes No No
Finding III
Accessibility
Case A only H Yes No No
Finding IV
Camaraderie
H for Case A, B, C Yes Yes Yes
Finding V
Individualized
attention
H for Case A, B, C No Yes Yes
Finding VI
Data analysis
H for Case A, B, C Yes Yes Yes
Finding VII
Community
H for Case A, B, C Yes Yes Yes
Finding VIII
Focus
H for Case A, B, C Yes Yes Yes
Finding IX
Staff development
No case rated H Yes No No
Finding X
Creativity
Case A only H No Yes Yes
Finding XI
Attitude
Case B only H Yes Yes No

181
Appendix G
Worksheet 6. Multi-case Assertions for the Final Report
# Assertion Evidence in Which Cases?
Related to Which RQs?
1 Camaraderie All cases provide H utility Answers from all three RQs
2 Individualized Attention All cases provide H utility Answers from all three RQs
3 Data Analysis All cases provide H utility Answers from all three RQs
4 Community All cases provide H utility Answers from all three RQs
5 Focus All cases provide H utility Answers from all three RQs

182
Appendix H
Worksheet 7. Planning the Multicase Final Report
Main Topics Pages Case A Case B Case C Theme 1 Theme 2 Theme 3 Future
The Study
The Quintain
Themes
Assertion 1
Assertion 2
Assertion 3
Assertion 4
Assertion 5
Summary

183
Appendix I
Wed 7/24/2013 9:44 AM
Inbox
To: Nelson, Timothy R;
Cc: IRB, IRB;
Duryea, John R (School of Education);
Garzon, Fernando (Center for Counseling and Family Studies);
Good Morning Tim,
This email is to inform you that your request to make changes to your approved interview questions as a result of information gained through three pilot interviews has been approved. Changes include eliminating question 11 because it "did not yield any new information that had not already been stated during the interview," revising question 15 to read, "Are there any funds you would like to reallocate?" instead of "Is there any way you would like to reallocate funds?" due to participant hesitancy to answer the question as originally worded, and to add the question, "Why do you think your district provides a high return on investment?" as the last question of the interview to allow for a more informative response to your study focus.
Thank you for complying with the IRB requirements for making changes to your approved study. Please do not hesitate to contact us with any questions. We wish you well as you continue with your research.
Best,
G. Michele Baker, M.A. Institutional Review Board Coordinator The Graduate School
Liberty University | Training Champions for Christ since 1971

184
Appendix J
Analysts Log
Date Contact information Anecdotal records Researcher notes
June 28, 2013 Initial contact for
District X, X, and X
Spoke with all three
superintendents; two
agreed and the last
may not be able to
- follow up last
district
July 1, 2013 Follow up contact for
permission form
Received from ASD
July 2, 2013 Email from
superintendent GUSD
Permission from
GUSD given via
email, but no hard
copy
- asked again for
hard copy on
stationary
(received July 10)
July 8, 2013 Email to last district Emailed last district;
followed call that
went to voice mail
- no response from
district, may need
to move on
July 10, 2013 Email/phone Final contact
attempt for last
district
- contact chair with
change and new
site
July 12, 2013 Phone to new district Contact new district
by phone,
superintendent
agreed
- got permission
from new district
over phone (hard
copy July 15)
July 15, 2013 IRB Turned in all
permission forms
July 16, 2013 Email contact for X, X,
X, X and X. Phone
numbers X; Applewood
School District
permission form
received
Contacted X at
district office. Get
school board
minutes from X at
district office
- multiple responses
first day, one
participant out with
surgery, back in 1
week
- All participants
ready for interviews
last week before
school prep begins
July 16, 2013 Email contact for first
five members from
GUSD
All members
emailed consent;
will bring consent
forms on day of
interview;
4 interviews on one
day; must prep for
possible battery
issues with phone
and tablet
July 22, 2013 Email to participants
confirming dates,
reminding of interview,
inviting participants in
last district
Dates set for ASD
and GUSD; working
on last participants
from BRSD
- multiple
principals on
vacation in BRSD;
email/call next
week

185
Appendix K
Data Collection Timeline
Date Interviews Dates of Data collection
July 22, 2013 Interview with principal
GUSD
Began at 10:30 am; 1:41 total
time
July 25, 2013 GUSD
Interview with CFO 9 am
Middle Principal 11 noon
HS principal 1 pm
Superintendent 4 pm
Began 9 am, 1 hr 33 min
Began 11, 1 hr 6 min
Began 1 pm, 56 min
Began 4 pm, 1 hr 17 min
July 29, 2013 BRSD
Career Center director
Began 9 am, 1 hr, 4 min
August 1, 2013 BRSD
Elementary Principal
Began 8:45 am, 50 min
August 5, 2013 Curriculum, ASD Began 9 am, 1 hr, 1 min
August 6, 2013 Primary principal, ASD
CFO, ASD
Began 11 am, 1 hr 7 min
Began 1 pm, 57 min
August 7, 2013 Assistant Superintendent,
BRSD
Began 9 am, 58 min
August 7, 2013 Middle School Principal,
ASD
Began 4 pm, 1 hr 23 min
August 8, 2013 Elementary Principal, ASD Began 8:15, 43 min
August 8, 2013 CFO, BRSD Began 11 am, 1hr, 1 min
August 9, 2013 Elementary Principal, BRSD Began 9 am, 48 min
October 10, 2013 All participants via email –
request for archival records
Received records from
elementary principal, 1 packet
in the mail, email from
middle school principal;
October 28, 2013 Received all missing school
board minutes from ASD
secretary
Complete record of ASD and
GUSD
December 5, 2013 Received all missing school
board minutes from BRSD
secretary
Complete record of all school
board minutes for all
participants

186
Appendix L
Summary of Applewood School District School Report Card Data
Applewood High School Academic Achievement
School
Report
Card Year
HSAP
Passing Rate
Percent
Above/Below
State Average
On Time
Graduation
Rate
Percent
Above/Below State
Average
2008
96.9%
+ 3.4%
88.4%
+ 14.6%
2009 98.1% + 3.5% 83.6% + 8.8%
2010 95.0% + 3.8% 77.8% + 5.5%
2011 93.0% + 0.4% 75.1% + 4.3%
2012 92.3% - 1.0% 77.6% + 1.3%
2013 93.0% + 1.5% 81.5% + 5.1%
Note. Data collected South Carolina School Report Cards. HSAP = High School Assessment
Program.

187
Applewood Middle School Academic Achievement
School
Report
Card Year
Algebra 1 and
English 1
EOC Passing
Rate
Percent
Above/Below
State Average
% of students
taking classes
for high school
credit
Percent
Above/Below State
Average
2008
100%
+ 2.1%
45.5%
+ 22.6%
2009 98.3% + 2.7% 50.6% + 29.2%
2010 100% + 2.9% 51.9% + 27.0%
2011 100% + 3.2% 48.8% + 25.1%
2012 100% + 3.8% 50.8% + 17.7%
2013 99.3 + 3.7% 49.6% + 23.9%
Note. Data collected South Carolina School Report Cards. EOC = End of Course testing.
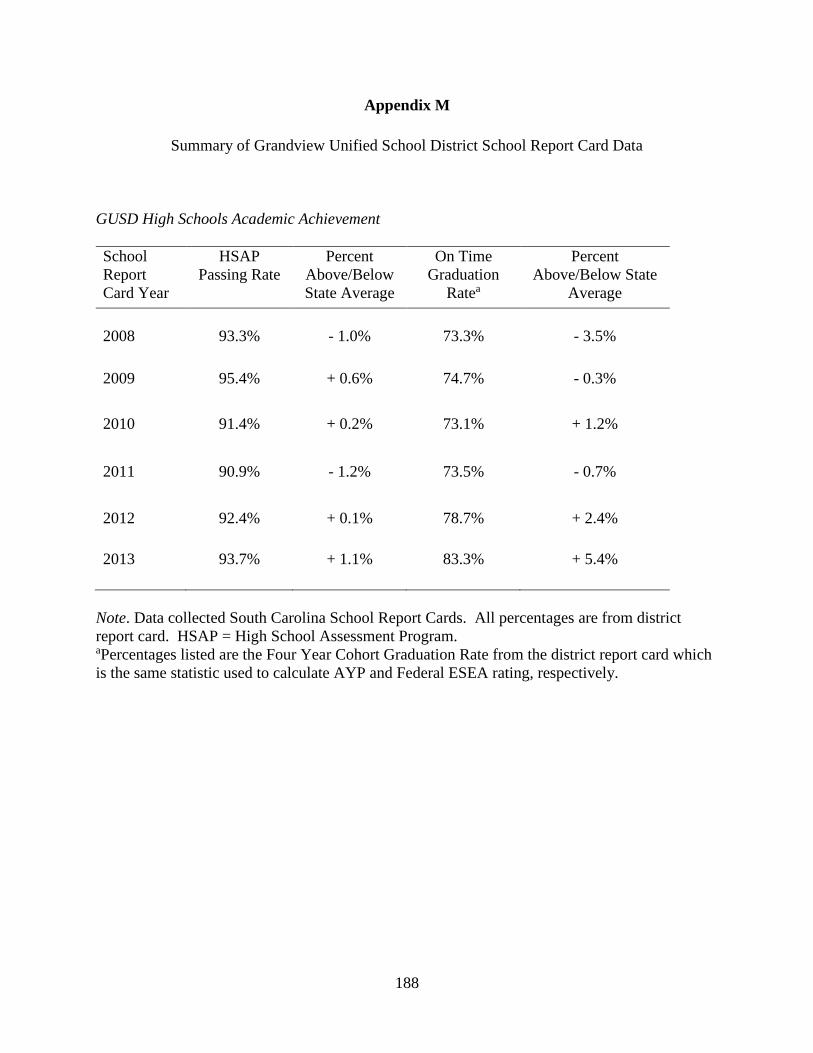
188
Appendix M
Summary of Grandview Unified School District School Report Card Data
GUSD High Schools Academic Achievement
School
Report
Card Year
HSAP
Passing Rate
Percent
Above/Below
State Average
On Time
Graduation
Ratea
Percent
Above/Below State
Average
2008
93.3%
- 1.0%
73.3%
- 3.5%
2009 95.4% + 0.6% 74.7% - 0.3%
2010 91.4% + 0.2% 73.1% + 1.2%
2011 90.9% - 1.2% 73.5% - 0.7%
2012 92.4% + 0.1% 78.7% + 2.4%
2013 93.7% + 1.1% 83.3% + 5.4%
Note. Data collected South Carolina School Report Cards. All percentages are from district
report card. HSAP = High School Assessment Program. aPercentages listed are the Four Year Cohort Graduation Rate from the district report card which
is the same statistic used to calculate AYP and Federal ESEA rating, respectively.

189
Summary of GUSD Middle Schools Academic Achievement
School
Report
Card Year
Algebra 1 and
English 1
EOC Passing
Rate
Percent
Above/Below
State Average
% of students
taking classes
for high school
credit
Percent
Above/Below State
Average
2008
99.1%
+ 3.1%
24.0%
+ 0.3%
2009 98.1% + 2.8% 18.2% - 6.9%
2010 99.0% + 2.4% 23.7% - 4.1%
2011 100% + 4.7% 19.9% - 6.9%
2012 98.5% + 4.5% 16.3% - 12.4%
2013 99.5 + 4.9% 15.5% - 10.5%
Note. Data collected South Carolina School Report Cards. All percentages are weighted
averages of the four middle schools. EOC = End of Course testing.
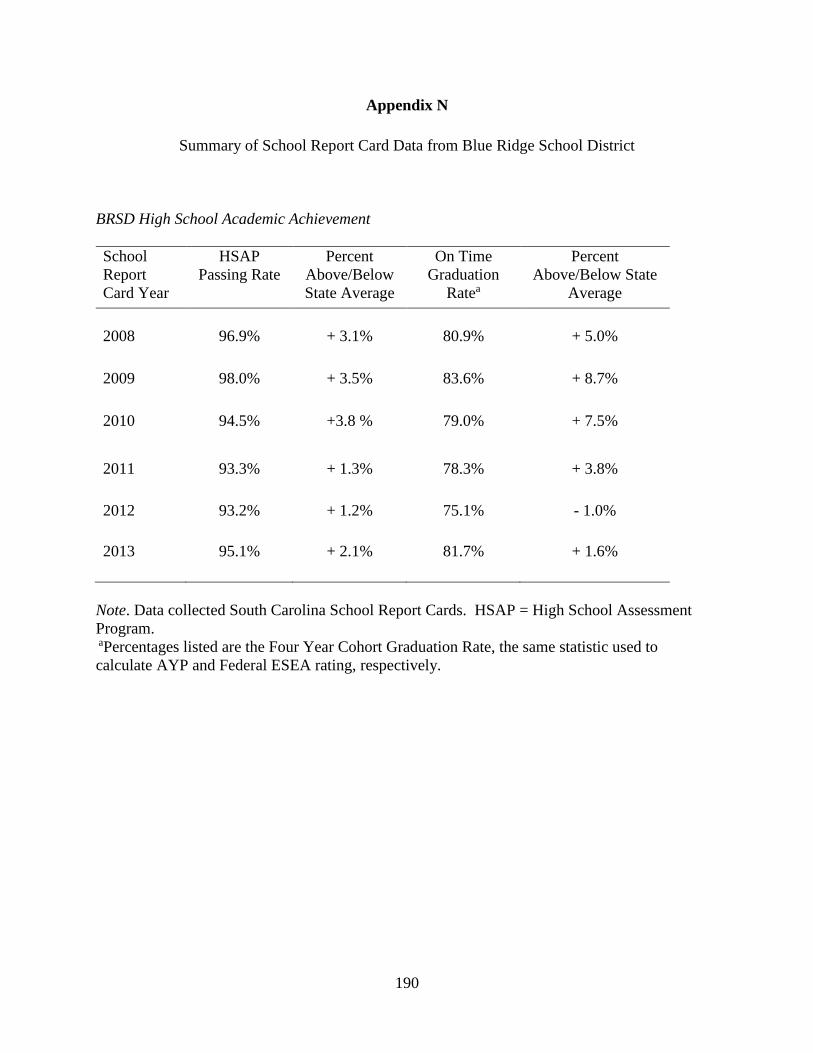
190
Appendix N
Summary of School Report Card Data from Blue Ridge School District
BRSD High School Academic Achievement
School
Report
Card Year
HSAP
Passing Rate
Percent
Above/Below
State Average
On Time
Graduation
Ratea
Percent
Above/Below State
Average
2008
96.9%
+ 3.1%
80.9%
+ 5.0%
2009 98.0% + 3.5% 83.6% + 8.7%
2010 94.5% +3.8 % 79.0% + 7.5%
2011 93.3% + 1.3% 78.3% + 3.8%
2012 93.2% + 1.2% 75.1% - 1.0%
2013 95.1% + 2.1% 81.7% + 1.6%
Note. Data collected South Carolina School Report Cards. HSAP = High School Assessment
Program. aPercentages listed are the Four Year Cohort Graduation Rate, the same statistic used to
calculate AYP and Federal ESEA rating, respectively.

191
Summary of BRSD Junior High School Academic Achievement
School
Report
Card Year
Algebra 1 and
English 1
EOC Passing
Ratea
Percent
Above/Below
State Average
% of students
taking classes
for high school
creditb
Percent
Above/Below State
Average
2008
72.2%
- 25.6%
43.0%
+ 13.6%
2009 72.0% - 23.7% 42.6% + 21.0%
2010 71.1% - 26.1% 45.9% + 16.4%
Note. Data collected South Carolina School Report Cards. EOC = End of Course testing. aPassing rate of both 8th and 9th grade students. bPercentage includes only 8th grade students.
Summary of BRSD Middle School Academic Achievement
School
Report
Card Year
Algebra 1 and
English 1
EOC Passing
Rate
Percent
Above/Below
State Average
% of students
taking classes
for high school
credit
Percent
Above/Below State
Average
2011
96.3%
+ 5.5 %
14.0%
- 16.8%
2012 98.4% + 4.5% 19.5% - 14.7%
2013 99.6% + 4.2% 15.4% - 10.1%
Note. Data collected South Carolina School Report Cards. EOC = End of Course testing.
Copyright © 2022 FDOKUMEN