The Certification of the Impurity Contents (Ag, As, Bi, Cd, Cu ...
152
Commission of the European Communities Community Bureau of Reference BCR information The Certification of the Impurity Contents (Ag, As, Bi, Cd, Cu, Ni, Sb, Se, Sn, Te, TI and Zn) in three grades of lead Electrolytically refined lead BCR No 286 Thermally refined lead BCR No 287 Lead with added impurities BCR No 288
-
Upload
khangminh22 -
Category
Documents
-
view
2 -
download
0
Transcript of The Certification of the Impurity Contents (Ag, As, Bi, Cd, Cu ...

Commission of the European Communities Community Bureau of Reference
BCR information
The Certification of the Impurity Contents (Ag, As, Bi, Cd, Cu, Ni, Sb, Se, Sn, Te, TI and Zn)
in three grades of lead
Electrolytically refined lead BCR No 286 Thermally refined lead BCR No 287
Lead wi th added impurities BCR No 288


Commission of the European Communities Community Bureau of Reference
BCR information
The Cert i f icat ion of the Impur i ty Contents (Ag, As, Bi, Cd, Cu, N i , Sb, Se, Sn , Te, TI and Zn)
in three grades of lead
Electrolytically refined lead BCR No 286 Thermally refined lead BCR No 287
Lead with added impurities BCR No 288
H. MARCHANDISE and S. VANDENDRIESSCHE Community Bureau of Reference, CEC, Brussels, Belgium
Directorate-General for Science, Research and Development Community Bureau of Reference
1985 EUR 9665 EN

Published by the COMMISSION OF THE EUROPEAN COMMUNITIES
Directorate-General Information Market and Innovation
Bâtiment Jean Monnet LUXEMBOURG
LEGAL NOTICE Neither the Commission of the European Communities nor any person
acting on behalf of the Commission is responsible for the use which might be made of the following information
© ECSC-EEC-EAEC, Brussels · Luxembourg, 1985
1
ABSTRACT
The report describes the certification of three Lead reference materials.
CRM 286 is electroLytical Ly refined lead, CRM 287 is thermally refined lead
and CRM 288 contains added impurities. They were analysed for twelve elements
using a wide range of techniques in 20 laboratories.
The concentration of each determined element in each material is shown on the
table below. The values given in brackets are not certified.
The materials are available in two forms : square blocks (e.g. for emission
spectrometry or Xray fluorescence) and chips for wet chemical methods.
I Ag | As
Bi
| Cd
| Cu
| Ni
! Sb
I Se Sn
I Te
Ι τι I Zn
CRM 286
j jg /g
0.015 + / 0.006
« 0 . 0 0 2 )
21.5 + / 0.5
0 .125+ / 0.012
1.49 + / 0.04 0 .041+ / 0.006
0.10 + / 0.02
« 0 . 0 5 )
« 0 . 0 5 )
« 0 . 1 )
2.5 + / 0.1
< 0 . 1
CRM 287
jjg/g
15.2 + / 0.2
« 0 . 0 0 3 )
67.3 + / 1.1 0.36 + / 0.03
0.98 + / 0.05 0.024 + / 0.012
0.040 + / 0.015
« 0 . 0 5 )
<0.05
« 0 . 2 )
0.73 + / 0.04
< 0 . 1
CRM 288 Ì
30.5 55.7
215.8
33.3
19.3 4.57
32.5
j j g /g i
+ / 0.5 |
+/ 1.6 i + / 2.4 | + / 0.9 |
+ / 0.4 |
+ / 0.11 |
+ / 0.9 |
¿0 .2 |
30.6
32.8
2.3
8.2
+ / 1.5 |
+ / 1.3 |
+ / 0.1 |
+ / 0.4 |
RESUME
Le rapport décrit la certification de la teneur en impurités de trois nuances
de plomb : CRM 286 et CRM 287 sont des plombs raffinés tandis que CRM 288
contient des quantités assez élevées d'impurités ajoutées intentionnellement.
Les analyses ont été confiées à 20 laboratoires.
La teneur en chaque élément déterminé est donnée pour chaque matériau, dans le
tableau cidessus. Les valeurs données entre parenthèses ne sont pas
certifiées.
Ces matériaux de référence sont disponibles sous forme de blocs carrés (pour
spectrographie d'émission et fluorescence X) et sous forme de copeaux (pour
méthodes chimiques).

- 2 -
Contents Page
1. Introduction
2. Participating Laboratories
3. Production of the materials
4. Homogeneity
5. Analytical methods 17
6. Presentation of the reported results 40
7. Technical discussion of the results 41
8. Calculations 51
9. Instructions for use 54
Appendix : Tables of results; diagrams; statistical data 55

1. INTRODUCTION
This report describes the work done to prepare, analyse and certify samples of three grades of lead, intended in particular as reference materials for the analysis of impurities in lead.
The three materials were :
lead purified by electrolytic refining RM 286;
lead obtained by normal thermal refining RM 287;
lead with added impurities RM 288.
At the time the project was decided, it appeared too expensive to produce series of spectrographic standards which would provide calibration curves for emission spectroscopy. The work was therefore reduced to the certification of two typical commercial lead materials (RM 286 and RM 287). Although no data were available, electrolytic lead was believed to be much purer than the thermally refined one. It turns out that they are very similar except for silver and bismuth. The third material was obtained by adding impurities to a thermally refined lead.
These materials are recommended for use by the laboratories to verify the internal standards they use to establish their calibration curves.

- 4
2. PARTICIPATING LABORATORIES
Throughout the report, one letter codes will be used to refer to participants
in the certification campaign. These laboratories are listed alphabetically on
table 2.1.
Laboratory H was in charge of the production (see chapter 3) and of much of
the homogeneity testing (see chapter 4); further homogeneity controls were
performed by labs E and M and by a fourth lab (Berzelius-Duisburg) not
participating in the certification campaign.
All labs listed in table 2.1. have analysed several elements in one or more
samples by one or more methods; the analytical methods and the results of the
measurements are given in chapters 5 and 6, respectively. In some cases,
estimates by spark source mass spectrometry were obtained from SCK (Mol, Β)
and/or CEA (Fontenay-aux-Roses, F).
Table 2.1. - Participating laboratories
Accumulateurs Tudor S.A.
Archennes - Belgium
Associated Lead Manufacturers Ltd - Research Laboratories
Greenford - Middlesex - United Kingdom
Blei- und Silberhuette Braubach
Braubach - FR Germany
Bundesanstalt fuer Materialpruefung
Berlin - FR Germany
Chloride Power Storage
Swinton - United Kingdom
CNRS - Centre d'Etude Chimie Métallurgique
Vitry-sur-Seine - France
ENEA - Lab. Chimica Analitica
Roma - Italy
Joint Research Centre
Ispra - Italy
Laboratoire National d'Essais
Paris - France
Metallurgie Hoboken-Overpelt
Hoboken - Belgium
Minemet Recherche
Trappes - France
Norddeutsche Affinerie AG
Hamburg - FR Germany

- 5 -
Table 2.1 Cont../.
Preussag AG Metall Oker/Harz - FR Germany
Preussag Boliden Blei GmbH Nordenham - FR Germany
Ridsdale S Co Ltd Middlesborough - United Kingdom
Rijksuniversiteit Gent - Instituut voor Nucleaire Wetenschappen Gent - Belgium
Tonolli Grezzi S.p.A. (Sameton) Paderno Pugnano (Mi) - Italy
Vieille Montagne Angleur - Belgium

- 6 -
3. PRODUCTION OF THE MATERIALS
3.1. Preparation of the solid samples
The metal samples were obtained by melting and casting as shown in the next paragraphs. One single melt was prepared for each grade.
As already explained RM 286 was produced from electrorefined lead and RM 287 from thermal refined lead. The concentration levels for RM 288 were adjusted by adding appropriate quantitites of other alloys. These additions were wrapped in lead sheets in order to ensure their immersion in the liquid lead bath.
The metal was melted in an iron crucible placed in a gas-fired furnace. It was homogenised by means of a mechanical agitator. The temperature before casting was adjusted to 370 °C. When the metal bath was ready and its surface was cleaned from any slag by a scraper, it was poured quickly on a mould preheated to 350 °C.
The mould consisted of a heavy steel plate 10 mm thick welded on a rigid beam structure to resist against possible distortions during casting. The mould was 2000 χ 1500 mm and the sides 50 mm high.
About 20 seconds after casting, the mould was cooled on its bottom face by an intense water spray. About half a minute later, when the surface of the cast metal became solid it was sprayed with atomized water, and after another half minute, water was poured on it. The total cast and solidification time was approximately 1 minute and 30 seconds. The thickness of the solidified metal was 18 to 20 mm.
Each plate was cut as follows : The outside band 70 mm wide was discarded all around the plate. The rest was sawed into square specimens 70 χ 70 mm. This produced a total of 450 specimens for each metal.
Square samples from the periphery were used to produce chips; those from the central part of the plates form the batch of square samples for sale.
3.2. Preparation of Chips
The periphery of the plate was reduced into chips by milling.
The chips were mechanically treated in small portions in a mixer with high strength steel in order to cut the chips and then roll the pieces into small spheres. The small batches of spherodized particles were then remixed and the whole amount (65 kg) was homogenized in a V mixer. The fraction (about 2%) smaller than 0,4 mm was eliminated by sieving. Each batch of mixed chips of each RM was then divided by riffling and each fraction was in turn divided by a rotating divider. The individual bottles contained 180 g of metal. The homogeneity of the chips samples was not investigated as such because they are made by homogenizing a metal previously shown to be adequately homogeneous. The results of the analysis campaign gave no reason to doubt on the homogeneity of the chips.

- 7 -
Fig 3.1 Use of each cast plate for production of chips and square samples; location of the samples used for the homogeneity studies on RM 288
(see Chapter 4)
S = sample used for analysis by spark emission spectrometry C = sample used for chemical analysis Τ = sample used for homogeneity in thickness study Ρ = sample used for point-to-point homogeneity study 4 = sample used for inter laboratory comparison
A B C D E F G H I J K L M N O P Q R
25 24 23 22 21 20 19 18 17 16 15 14 13 12 11 10 9 8 7 6 5 4 3 2 1
S C Ρ
s c
s c
s c
s c
s c
s c
s c
SC Ρ / sc
s c
s c Ρ
τ
S C P
Ρ Ρ '
S c
s c
s c 4 Τ
s c
s c
A B C D E F G H I J K L X M N O P Q R
This part of the plates was mi I led to chips
S C
S C
S C
S C
S C Ρ S C
25 24 23 22 21 20 19 18 17 16 15 14 13 12 11 10 9 8 7 6 5 4 3 2 1
This part was kept as square samples
-This outer zone has been discarded

- 8 -
HOMOGENEITY
Before studying actual analyses it is important to understand the causes of possible inhomogenen ties.
We can note first that the basic necessary precautions were taken to ensure homogeneity : mixing the molten metal before casting, rapid casting and rapid cooling.
Inhomogeneities could result from the low solubility of some impurities, including formation of possible intermetallic compounds. Although solubility would decrease with decreasing temperature, the mobility of atoms is not sufficient for migration to occur after the metal is solidified. Rapid cooling prevents detectable segregations from occuring.
The impurities can be grouped as follows :
very soluble Ag, As, Bi, In, Sb, Sn, Tl
limited solubility Au, Cd, Cu, Te, Zn
insoluble Al, Fe, Ni, S, Se.
The homogeneity of the material will be discussed in the following order :
homogeneity of the cast plate;
homogeneity of the metal in the thickness;
point to point homogeneity.
4.1. Homogeneity of the Cast Plates
The investigation was made on RM 288, the metal most heavily loaded with impurities. Samples were selected at 24 locations of the plate. From each location, one sample was investigated by emission spectrometry and the neighbour sample by wet chemical methods.
The emission spectrometrie investigation consisted of bismuth determinations at 9 to 12 points at three levels in the samples after appropriate milling.
The results of the chemical methods show that the homogeneity is acceptable if one also takes into account that the variance includes the imprecision of the methods. The results obtained by spark emission spectrometry have a much higher variance, therefore essentially due to the method itself and the apparatus used. Similar high variance appear in the next paragraphs and cannot be interpreted as indications of inhomogeneity.
The data of table 4.1. show that RM 288 is sufficiently homogeneous at the level of whole square samples. As the other two RMs have much lower impurity concentrations there is no reason to doubt their homogeneity.

9
Table 4.1.
Homogeneity of CRM 288 Investigated by Chemical Methods and
by Spark Emission Spectroscopy (SES)
¡ELEMENT
As | Sb
I Sn
| Cu
I Zn
ì Te
I Bi
NUMBER
of SAMPLES
10
8
8 24
24 10
24
24
METHOD
Spec
Spec
Spec
Spec
AAS Spec
Spec
SES top middle
bottom
average
SMALLEST
VALUE
fjg/g
56,0
25,0
31,25
19,4
9,2 30,0
215
205 209 207
208
HIGHEST
VALUE
pg/g
59,75
27,75
34,0
20,3
9,9 34,0
220
222 223 225
222
MEAN
jug/g
57,45
26,47
32,69
19,9
9,6 32,4
218
214 215 216
215
ST.
DEV.
ug/g
1,33
0,97
1,1 0,30
0,21
1,5
1,8
4,8 5,3 5,0
4,5
C.V. ¡
% |
2,3 |
3,7 |
3,4 |
1,5 I
2,2 |
4,5 |
0,8 |
2,2 |
2,5 |
2,3 |
2,1 I
4.2. Comparison of outer and inner zone
The data summarised in table 4.1 have been further analysed to ensure that the
material used for the production of chips and that kept as square samples are
identical.
The samples were taken at regular intervals, 2 χ 15 from the outer zone (used
for chips) and 2 x 9 from the inner zone (kept as square samples). They were
investigated by colorimetry (Bi, Cu) and by spark emission spectroscopy
on three levels of each sample (Ag, Bi).Table 4.2 shows the results of
this homogeneity study for the outer and inner zones. Standard deviation and
C.V. are calculated for the population of sample mean values.
Again the variance obtained with SES is much larger than the one obtained with
colorimetry, due to instrument performance, but again the colorimetrie data
have a low variance; this is further evidence for a good homogeneity. The
differences found between the outer and inner zones are so small that, for all
practical purposes, the chips and the square samples are concluded to have the
same composition.

- 10 -
Table 4.2. - Homogeneity of the Cast Plate of RM 288
I I I I I I I |MAX-MIN | | ¡METHOD¡ZONES OF THE¡NUMBER OF¡MEAN VALUEJ ST DEV | C.V. | MEAN | I ¡CAST PLATE ¡SAMPLES | yg/g I ;jg/g % I % I
¡Biispec ¡External 15 ¡ 218,3 1,9 | 0,88 | 3,2 | | | ¡Internal | 9 | 218,0 ¡ . 1,8 j 0,84 j 2,3 | ¡ ¡SES ¡External ¡ 15 ¡ 212,3 | 5,9 ¡ 2,8 ¡ 9,4 | | | ¡Internal | 9 | 212,7 | 3,7 | 1,8 | 5,2 |
¡Ag¡SES ¡External | 15 ¡ 21,4 | 0,8 ¡ 3,7 ¡ 14,0 | I | ¡Internal | 9 | 21,0 | 1,1 | 5,2 | 13,8 |
¡CulSpec ¡External 15 ¡ 199,1 | 3,8 1,9 | 8,5 | | ¡Internal | 9 | 199,7 | 2,8 j 1,4 5,0 |
4.3. Homogeneity in the thickness
Because of the fabrication process, no variation of composition of the material can be expected to occur in the thickness of the metal plates. Nevertheless, four square samples of each material were investigated in the following manner.
The plane surfaces were machined from the samples by successive milling; the planes so obtained correspond to the depth shown on fig. 4.1. For each sample, one half was milled from the top and the second half was milled from the bottom.
Each plane was analysed by emission spectroscopy (4 spark points per location) for Bi in RM 286, Bi and Ag in RM 287 and Bi, Ag and Cu in RM 288. Fig. 4.2. shows the results for one sample of RM 288 and does not show any inhomogeneity, as is expected from the casting and cooling process.
Better precision could be obtained in laboratory M however, and this lab verified the absence of composition variation with depth; its results are shown, for one sample of RM 288, on fig. 4.3. The homogeneity in the thickness is seen to be excellent.
It is worth mentioning that the homogeneity in the thickness was studied with chemical methods (having a better precision) in materials with higher impurity contents but cast under identical circumstances. The spread on the results is given on table 4.3., and is seen to be extremely low.

11
Fig. 4.1. Locations where the samples have been analysed
by spark emission spectroscopy
upper face
cut face
lower face
Table 4.3. Variance observed with chemical methods through
the thickness of lead plates (one analysis every mm)
Impurity
element
Bi
Cu Cu Zn
Concentration
level
0,6 mg/g
54 jjg/g
0,04 mg/g
0,47 mg/g
Maxmin
mean
χ 100%
0,8 %
3,5 %
4,2 %
2,3 %
St.dev.
mean
χ 100 %
0,27 %
1,0 %
1,3 %
0,65 %
4.4 Point to Point Homogeneity
As the reference materials were expected to be used mainly for spark emission
spectroscopy , it was felt important to verify whether they were also homog
eneous when the areas investigated or analysed were small. This had to be
done by emission spectroscopy although it is, in principle, difficult because
of the inherent imprecision of SES.
A first part of the homogeneity study was carried out in lab on 15 samples
randomly selected from each plate. SES analyses were performed on 4 spark
points on each face of each sample. The data for RM 288 are summarized in
table 4.4. The intrasample standard deviation is calculated as
c ζ" ih
-■ 1 I (z¿ ■z..y
Ί (if * J) 1 V*
where x. = mean per set of 4 data (1 side of 1 sample) and x.. = a single measurement value. "IJ

12
Fig. 4.2. Bar diagram presenting the results of the homogeneity
tests in the thickness, for one sample (M 19) of
RM 288 as observed by laboratory H. Each bar shows
the mean and standard deviation of 4 spark points.
The location numbers refer to fig. 4.1.
3 4 _ 1 _
10 —J
30
28
26 ...
24
22
j j g /g Ag
■ ■
1
■
1 : ι 1
I
»
ecu ·
210 ■
200
180 .
180 .
>jg/g Bi
I
<
<
I
I
<
■
• *
1
'
[ ' 1
.
23
21
19
pg/g Cu
T 17
4 5 6
location numbers 10

13
Fig. 4.3. Bar diagram presenting the results obtained by lab M
on the same sample as for fig. 4.2.
Two millimeters were investigated (6 levels 0,4 mm
apart; 4 spark points per level) on each side; only
one side is shown.
27
26
/jg/g Ag
25
225
223
■ 1
' 1
1 1
jug/g Bi
221
219
I I
■
J
i I
■
ι
24 i¿a¿2 Cu
23
t ι 22
21
0.4 0.8
ι
1.2
ι
1.6 ■
mm depth
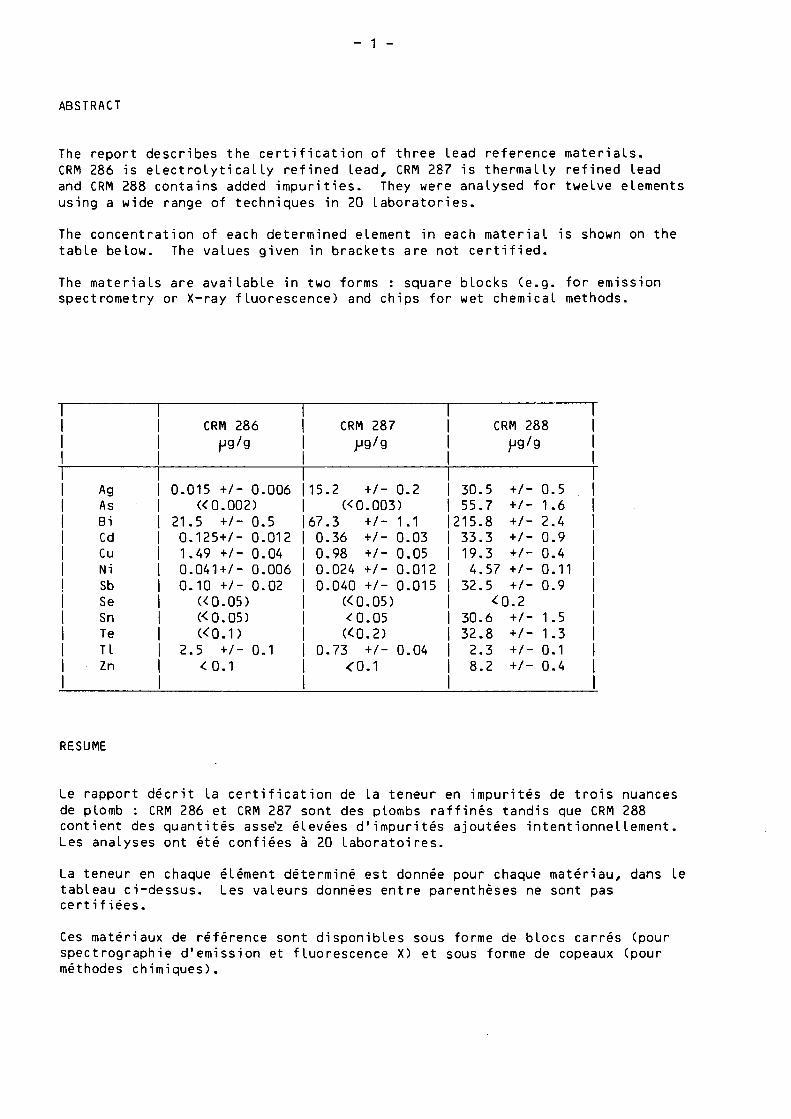
Table 4.4.
- 14 -
Point to point homogeneity study by SES: summary of lab H data for RM 288 (all data in ;jg/g)
Element
Ag Bi Cu
Mean of a l l data
25,5 199,1
19,24
S t . d e v . of a l l data
2,5 13,8
1,51
I n t ra - samp le s t . dev.
13,7 1,25
Because most of the observed variance was believed to be due to imprecision of the apparatus used, a limited interlaboratory comparison was set up with 3 other laboratories using spectrometers with a higher performance. Each laboratory did several determinations on one sample of each material. The emphasis was on precision, not on accuracy; there was no attempt for a rigorous calibration, so the differences in mean value have no significance.
The results for Bi in RM 288 are presented graphically in fig. 4.4.; the full data are summarized on table 4.5.
It can be seen that the larger variance obtained by lab H is due to instrumental error, whereas the results of the other labs show that the sample is quite homogeneous.
4.5. Conclusions
It was shown that, for each of the materials, the batch of square samples does not contain any detectable macroscopic inhomogeneity. There is therefore no inhomogeneity between the samples, the chips are homogeneous, and they have the same composition as the square samples.
No significant point-to-point inhomogegeity was detected.

15 -
Fig. 4.4. Variance in bismuth concentration in a sample of RM 288 as measured by 4 different laboratories. The bars show standard deviations calculated from n measurements; both sides of the sample are shown separately. The rightmost pair of bars shows the data obtained on an adjacent sample at 5 different depths (data from paragraph 4.3.)
220 fig/g Bi
210
200
190
180
170
n=9 n=10
n=8
n=20
(data from different aeoths in adjacent sample)
Lab H Lab M Lab 4 Lab E Lab H

16
Table 4.5
Investigation of one Sample of Each RM by Spark Emission
Spectroscopy by different laboratories
Sample of RM 286 Bismuth ( ig/g)
| Lab H
| Lab M
| Lab 4
| Lab E
FACE
1 2 1 2 1 2 1 2
MEAN VALUE
21,0
20,3
20,3
20,5
19,5
18,7
22,3
22,2
s
1,1 2,2 0,8 0,6 0,5 0,8 0,5 0,3
η I
4 I
4 I 8 I 8 I 10 |
10 |
9 ¡ 9 I
Sample of RM 287
¡ Lab H
| Lab M
I Lab 4
| Lab E
FACE
1 2 1 2 1 2 1 2
BISMUTH
MEAN VALUE
67,1
66,3
64,3
65,1
60,2
60,8
64,9
66,4
^jg/g
s
5,3
5,1 0,8
1,4 2,3
0,9 1,0 1,4
SILVER
MEAN VALUE
13,1
12,1
13,4
14,2
12,8
12,9
13,8
15,2
ug/g
s
0,7
1,9 0,4
2,1 1,8 1,1
0,4 1,1
η I
4 J 4 I 8 I 8 I
10 ¡ io ¡ 9 j 9
Sample of RM 288
¡ Lab H
| Lab M
I Lab 4
I Lab E
FACE
1 2 1 2 1 2 1 2
BISMUTH
MEAN VALUE
196,5
199,0
198 202 209,5
214,1
208,2
209,0
>jg/g
s
20 14,5
1,8 6,3 2,0
3,1 1,2 0,8
SILVER yug/g
MEAN VALUE
25,8
24,9
28,8
29,6
27,8
28,3
30,9
30,7
s
3,0
2,1 0,6 0,9 0,6 0,7
0,5 0,1
COPPER
MEAN VALUE
19,3
19,1
19,5
20,3
17,9
18,0
21,1
21,1
Aig/g
I s
I 2,2 I 1,3
I 1,0
I 1,8
I 0,3
I 0,5
I 0,2
I 0,1
n I
4 I 4 i 8 I 8 I 10 |
10 ¡
9 I 9 I

- 17
5. ANALYTICAL METHODS
5.1 Description of Analytical Procedures
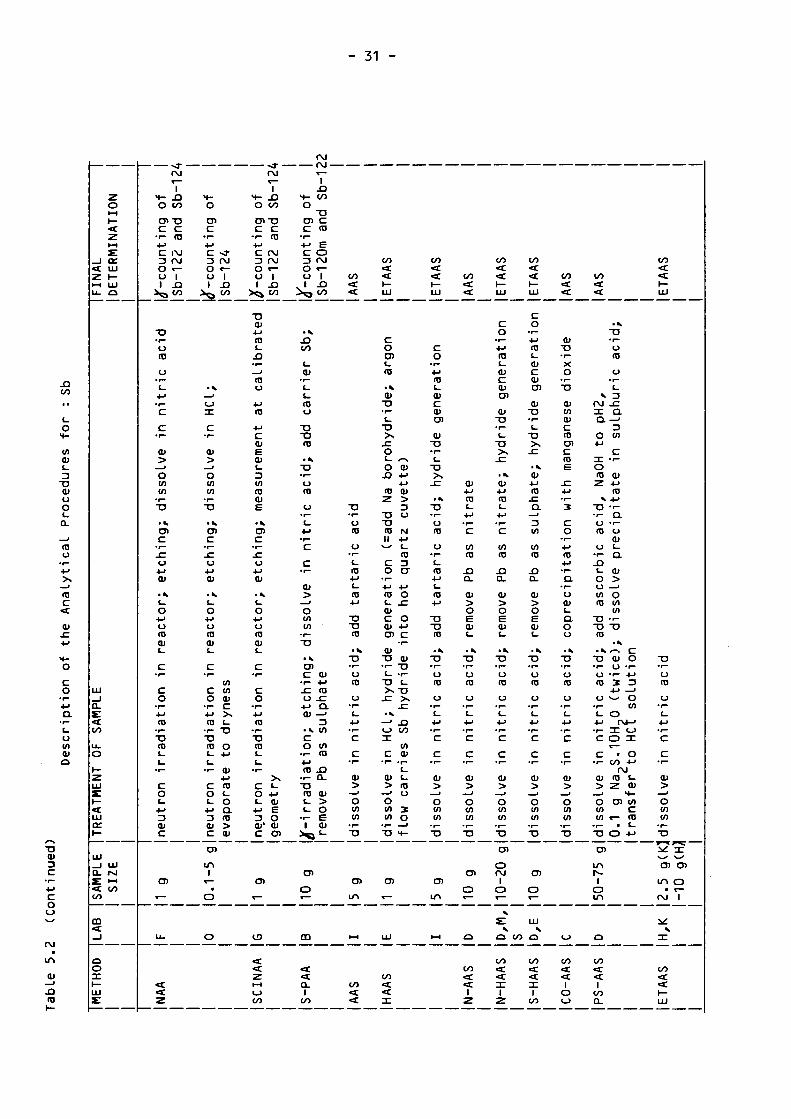
Throughout the presentation and discussion of the results, the analytical procedures are identified by codes, the first part of which represents the separation techniques (if any) while the second identifies the method of final analysis). These codes are explained in table 5.1; in a method called N-AAS, for example, the lead matrix has been removed by crystallisation of lead nitrate and the element to be analysed has been determined by flame atomic absorption spectrometry. Long combinations may have been contracted in order to be acceptable to the computer (max. 6 characters); for example, CEXCOL should be read as CO-EX-COL.
Table 5.2 lists the analytical procedures used for each element and describes them in some detaiI.
5.2 Calibration
5.2.1. Nuclear Activation Techniques
In photon and neutron activation analysis, the total amount of the searched element is found from the measured signal divided by the irradiation dose, provided the geometry is known. This principle is fully exploited in the SCINAA method of lab G, where only one standard (acting as a dosimeter) is used along with the sample in a multi-element analysis. The method is based on the use of a constant geometry of sample irradiation and measurement, which is reproduced in every analysis.
Most laboratories prefer, however, to use calibration standards in each analysis. The known amounts of elements used in the standards must be very small to avoid excessive activities when they are irradiated in the same circumstances as the samples. Therefore, use has been made of calibration solutions in most cases : standards in the ng/g - /jg/g range can easily be prepared in solution. The undissolved sample and the standards or a support containing standard solution are irradiated simultaneously; for each type of sample, a geometry correction factor has to be determined to account for the different shape and size. For the counting part of the analytical procedure, the sample is measured in solution in most cases to eliminate further geometry considerations. A correction factor can be used, however, if it is preferred to count on a solid sample (to avoid volatilisation problems, for example).
The calibration standards have in all cases been prepared from the pure elements by weighing and dissolving into a known volume. Lead of very high purity (>99.9999 %) was added in some cases to simulate the sample matrix; where the lead matrix was not removed from the sample and no lead was added to the reference solutions, a correction had to be made for the different density (and thus y absorption) of sample and standard solution.

- 18 -
5.2.2 Other Techniques
All the other methods use the sample in solution for at least part of the analytical procedure and calibration was always done with solutions prepared by weighing small known amounts into a calibrated volume. Three calibration methods can be used :
1) The ratio (sample - blank) to (known value - blank) is determined with a single standard solution.
2) Several standard solutions are used to establish a calibration curve, the range of which covers the sample to be analysed.
3) The standard addition method.
Most laboratories using methods of calibration of type 1 or 2, have simulated the matrix by adding pure lead to the reference solutions (standards and blanks); some laboratories even simulated the contents of other trace elements in order to take into account possible interferences. Lead of 99,999 % to 99,9999 % purity was used in most cases. When the purity of the lead was doubtful the data were discarded. There is no comparable problem in the standard addition method; here care was taken to avoid that the standard additions would change the chemistry of the sample solution (pH, ionic strength,—) significantly. Some laboratories have used two methods of calibrations, i.e. method 3 and method 1 or 2; they found the same results. No overall disagreement between the different calibration techniques was detectable.
Table 5.1 Explanation of codes used for analytical procedures
Codes for Separations
CL- Pb removed by crystallisation of PbCl-
C0- Coprecipitation
CUP- Cupellation (docimasy)
EX- Solvent extraction
IE- Ion exchange
N- Pb removed by crystallisation of Pb(N0,)p
PS- Precipitation as sulphide
S- Pb removed by crystallisation of PbSO,

- 19 -
Table 5.1 (Continued)
Codes for Analytical Methods
AAS Flame atomic absorption spectrometry
AMP Amperometry
ARF Atomic resonance fluorescence spectrometry
COL Spectrophotometry
DCP Direct current plasma emission spectrometry
ES Emission spectrometry
ETAAS Electrothermal atomic absorption spectrometry
GRAV Gravimetry
HAAS Hydride formation + AAS
ICP Inductively coupled plasma emission spectrometry
NAA Neutron activation analysis
OGS Optogalvanic spectrometry (laser enhanced ionisation)
PAA Photon activation analysis
SCINAA "Single comparator instrumental neutron activation analysis" (NAA method without a standard for each element)
SES Spark emission spectrometry
SPEC Spectrophotometry
SSMS Spark source mass spectrometry
Note : Codes printed by computer may have been contracted as they are limited to 6 characters.

20
σι «t
co Φ
C
■ο αι υ Ο C
Ci
ra ci
(0
c « t
c o
u in (U
O
Φ
Χ) ra
Ζ
o H H
t—
< t
Ζ I Η
Σ
_ ) o : «Χ LU
Ζ h
ll LU IJ O
L U
_ l 0
Σ
«X C O
LL.
O
I— ζ
LU
ε ι— < t L U
C X
h
LU _ | LU
0_ M
ε »ι « ï CO
CO
CD <t _J
α o ζ
1—
LU
ε
> «* cc t o
3
«* T3
C
(Ό
CT «£
(U +J (0 t_
ra Q. Φ to
• κ ( 0
c ■ ι—
ra ι_ σι
3
<C 1
O)
<c
- C
σ> ■f—
QJ
3
• K T D C - ί -Ο o
• r - ra 4-> ra υ
— ' ·Γ-> ι_
ω 4-1 Q . T -3 C Ο
C > * · ■
χ»
σι Χ ) C 0 · ι
—J
QJ r
> O
O Χ ι
E
0» >« c X l
σ>
o o «
ε
> ι «χ
0 CC
Z> C3 C J
4
O
σι c
■ r
■M ε
C NO
D o
O τ Ο ι
ι Ο)
> ^ < t
• ν
σ ι
< ι
c
αι ■ r
C
ί .
ra υ
Χ χ
ro ■ ν
■ Ό ■ι—
υ
ro ο
■r—
U
■ Μ
• r -
C
c • ί
α» > ι ο Ι Λ ιη
•ι— Χ
■ ν
σ> c Φ
•r 4>
. c ro
ο . c ■u α
α) —>
D
■ ν tn C O CO
• i ro
■ M
ra . Q • i Ο
Χ
ra tu
t > t O
• ί- ε 1 Φ
^ = , t -
σ> o «-
m
< < Q. 1
C O
>+-O
en c
■ r ~
■μ ε
c o 3 «
o «υ ι ι en
V a <C
"D • r
U
ra o
• r
c 4>
• r
C
C ■r—
Φ
> _; Ο ιη
to • r
"D
• ν
σι c
• ι —
C
u
41
O l
■ v
L· O
41
u
ra tu l _
C •r—
C
o •τ—
M
<U •r—
X
ra C
L .
• r
c o C
41
3
O)
c
σ>
<r"
e i V
LL .
«X
« t Ζ
« ί -Ο
O) c
■f—
•Μ ε c o 3 τ
Ο τ Ο ι
ν ' °> ^ > «
Οι
*-> ra Ι
Ο
CL
ra > α>
• ν 1
(_> Χ
C • Ι
Ο)
> — J
o tn
to ■r—
Χ )
• ν
σι c
■π
SZ
υ ■ Μ
0)
■ κ
L .
Ο 4>
( J
ra αι ι_
C * Γ —
c ο
r—
Μ
ω ■r—
Ό
ra ι_ ι_ to
• ι - tO α*
c c O >s ι - ι_ *-> χ 3 o· o C 4->
σ> ι η Ι
-• Ο
Ο
Η -
ο σ ι c
•r-
■Μ ε
c ο 3 « Ο τ
ο ι . ι σι ^ 3 « Ι
Χ OJ
■ Μ
ra ι_
Χ ■r—
—' ra u
4>
ra + j
c Φ
ε Φ C .
3
LO
ro Φ
E
• ν
σ» c
■τ—
C
o 41
φ
■ ν Ι
Ο 4>
Ο
(0 Φ C .
C ■ ρ
c ο
't—
4J
ra • ι
■ Ό
ra ι_ c
■r—
> Ν
C Ι Ο 41
c φ
t" ε
3 Ο Φ Φ
c σι
σι
<
CD
« «Χ
Ζ ι—ι ( J
co
Φ
ο
c ro C Φ
Ο u to C
φ φ
ι u to
u Φ • ι Ι
Ε Ο
Ο 3 4> —>
ra Η
Φ
ο
ι_ 3 Ο
to
4>
C
σι •r—
— ι
Q. C J
H H
V
e
φ
10 • f
ε ο
4"
ra X I
Ο c
C Q
O 1 _
ra u
• v TJ • r
υ
ra o
" I —
C
4 · • r
C
c • r
Φ
> —t
O to
in • P "
T3
σ>
i n
ι—I
L i
CC:
«*
t o
< I
<c
*~\ 4>
to
>. — » ra 4 J
ro CJ
<> 1—1
I Η
> σι nr
+ ■ ■
i ¿
X I
ra _ j
' w '
• v X ) • ι
Ο
ro o
• r
l _
4 J
•r—
C
c ■ r
φ
> —' o LO
to • i—
X I
σι
i n
1
f N J
V V
O lH Ζ t— V V V V
« t X JZ 0£
CO
<c < C
C O
« Ï
<t
ζ
CO
X )
ra —' > s
Χ » '"Ν 4>
Φ to 4> > .
Φ — ' —t ra
α 4>
ε ro O o
o
C ^ ■f h-t
l l
CO ·*>
ra σι X
X I
φ + • Γ
Η . ·
• r <J 1 φ
Q. χ
co ra Ν — ' — J
\~* C
o -> ■ I <_1
4J X
ra ^ C _ J * r
Φ
α Φ 3 > U — '
o >N CO
S3 CO ■f—
Χ ) χ û
• V
QJ / >
> Ι Ο
E Χ Φ C t . ra
~ ε ζ ^
^ σ> σι
o ι η O
ro ro
v
Ζ
v
ε ι
co
< < I
0
Z3
<_>
C O
<t « t
in
ra σι < 4 J
O
ra t _
4>
X
Φ
■ V
« t
1— Q
L U
C
41
• i —
3
X
• r
C
4 J
ra E
X
Φ
— » α E O CJ 4 J
CJ
• v ra
χ c • r 41
<J X
ra Φ
Φ υ L.
•r—
L . V
4> Φ • r 41
c ra c
c ra •r X I
C
Φ ra > u
— ' O Ο · Γ
to ^ tn 41
■r · Γ
X Χ
C J
C O
< I «a:
I X
L U
C O
« t < I
C Φ
O 4·
X ) D C — ι
ro ' ί ο χ
O ν 4-1 Χ C ·π-
• i - <J
ra Φ c o o ·■ Ν C
■■ D
JZ Χ 41 Q . • Γ
—*
X D
tn JZ
4 J —»
•r E
3
i n C v
o o
41 O CJ 41
ra c t · ι
4 1
x c Φ o
•r—
• V 4 J
Χ O ■ ι ra O C
ra 4 J X
υ Φ
• ι φ c
e c o 41 · Γ
■ i · ν 4 J
C Φ 3 Χ —>
c ·<- Ο
• ι t tO
o φ —ι —' > C <_>
—ι α χ Ο ra
to ι — c
tO 41 4J • ι Φ ■«
Χ 41 3
σ>
Ο
«
Ci

- 21 -
σ ι «χ
tn Φ c_ 3
Χ Φ ο Ο ία.
ra ο
ra c
<χ
c o
•r-4-1 α. • C U en φ
o
LU _ l U-ε «x co
Ι Ι -Ο
Χ φ C
C O
CJ
X ro
o I—I h-
<X LU Ζ h -I—I LU Li- O
< CO CO
CO co «X <x
CO «X <x «X h- h-«X LU LU
0_ CJ a.
CJ 0 - Q-CJ CJ
φ 4-J ro
co ra
χ 0-Φ > o E Φ l_
Φ 4-1 ra ra
Φ > o co co
to ro x o. Φ
> O E Φ l_
to ro
χ Ο-
Φ
> ο Ε Φ Ι -
■ ν
Χ • ι— Ο
ro CJ
• ι—
1_
41 •ι—
C
c • ι—
φ
> —ι
O co co
r—
Χ
σ>
ο ( Μ
Χ ■ Ι
Ο
ra υ
• r
C
4> • f —
C
c • ι—
φ
> — > O to tn
■ ι —
Χ
σι
ι η
ι ιη
c Ο
•Γ
41
ra ι
φ
α 3 υ
> s
Χ
Χ Ο
Φ
> ο Ε Φ c
ο
ra ο ι—
c 41
r—
C
C r
Φ
> O CO
to
o
ro u
•r— C
41
■r
C
c ■r
Φ
> ~t
O to to
o
ra o
• r C
41
• r
C
c • i —
φ
> _ _ i
o tn to
o
ra u
•τ— t_
41
■■
C
c • r
Φ
> _ _ J
O CO
to
CD
in
σι
O
en
O
co V
co t o «x «x <x < t
CO <£
I < t O \-3 LU CJ
O. CJ
0 CJ
CL CJ O
0 CJ O

22
to «χ
co φ l_ 3
Χ φ ci o
ra o
ra C
c o
Cl in Φ o
X Φ 3 C
C O CJ
X
ra
ζ
o ι—I
1 —
<x ζ
ι—I
ε _ l C£ <X LU
Ζ H 1—1 LU
l i O
L U
_ l
0_
ε . <c C O
LL
C l
hζ
L U
ε ι— «χ L U
O C
I —
L U
_ l LU
0 M
ε ι· «X CO co
ω « _ι
ο ο χ
ι— L U
ε
Η
ο
σι C
•r—
4 J
C 3 O o r>CJ I
ι tn ia «X
X • r
C l
ra
o • i —
l _
4 · • i —
C
c • Γ
φ
> — I
O co tn
• r
Χ
• ν
σι c
• ι —
C
CJ
41
Φ
■ ν Ι
Ο 41
CJ
ra Φ
ι_
c • ι
c ο
• Γ "
+ J
( Ό • Γ -
χ ra C
ι_ • ι "
C ο C
4-1 3 Φ C
σι
l i -
«X <Χ Ζ
S -
ο σ> c
■ Γ
41
C 3 Ο Ο Γ>υ Ι ι co
> ο < £
Φ 41
ro Ι
Ο
α ra > Φ
■ ν
— » C J
Χ
C • r
Φ
> "
Ο ι η
to • ι —
χ
«ν
σι c
■ r
C
C l
41
Φ
• V
Ι
Ο 41
CJ
ra Φ
ι_
c •r—
c o
■ ι —
41
ro ■ Γ "
χ
ro C
c CO • i CO
φ
c c O > s i c
41 X
3 Φ O C 41
σ>
i n 1
O
s O
σι c
•r—
4 1
C 3 Ό o r-CJ 1 1 CO
s « <■
X φ
41
ra L
X • I —
— i
ra u
4 J
ra
4J
c φ E φ
L .
3 to
ra Φ
ε
* ν
σι c
• ι —
C
C J
41
Φ
• V Ι
Ο 4>
CJ
ra Φ Ι
Ε • Γ —
C Ο
• f—
4J
ra • r
Χ
ra c_ c
• r~
>> C Ι Ο 4 J l _ φ
■Μ ε 3 O φ Φ
c σι
en
co
< χ
<: ζ
ι—ι C J
co
S
ο
σι c
• r
41
c D Τ O 1^u I ι to
V a « *
• ν t o
« χ
L .
φ • r
ί _ 1 _
ro o
χ χ ra • κ
Χ ■ ρ
C l
ra
u • r
C
4 J
I —
c
c •r—
Φ ■ >
— ι
o CO
i n
• r
X
> V
σι C Φ
■ ι 4J
j r ra
O C
41 α
Φ —· 3
■ Κ co
c Ο CO
■r ro
41
ra .o • ι Ο
Χ ra Φ c >
c o • ι ε
Ι Φ
^ ο1
σ>
ο
m
«χ ■ χ
α | co
Μ
Ο
σι c
•r—
4 1
C 3 νΟ Ο (ΝC1 Ι
I to *>«3 «Χ
■ V
Χ • ι—
C l
ra
o ■ r —
C
41
• Ρ "
c
X
c ■ r —
Φ
> ■
o to to
•r—
X
• V
σι c
■ r
C Φ
O 4 J
+> ro Φ c
4J • V I
L C
o 41 tO
o ra
ro Φ _o
c o.
C Φ
·> > o
c ε O φ
• f c
41
ro ν • i t o
X «X
ro 1 c
C φ
• ι — · Γ
Ι
Ο ι ό ra t - CJ
4 J 3 X Φ χ c ro
σι
C O
«X « ζ 1
ζ
co « χ <χ
χ • ι -Ο (0
u • r -
1 _
• Γ " C
C
Φ > — ι
Ο to co
• ι — Χ
σι
or
C O « χ «χ
■
co « χ
<
φ
41
ro ι_
41
• ι —
C
t o
ro
χ
α.
Φ
> Ο
ε Φ C
• κ Χ • ι
Ο
ro
u • r
C
• Γ
C
C
Φ
> — ι
o to t o
•r—
X
σ>
o ΓΜ I
O
o
CO
« t
<r I
ζ
to
<x « χ
h
L U
C
o σι t _
ra
• ν φ
Χ • ι — L .
Χ > s
χ :
ο ^ c φ Ο 41
Χ 41
Φ
ra > Ζ 3
ο Χ Χ Ν ra 41
II <\s (U
C 3
o σ • ι —
41 4 J
ra o C C
φ
c o Φ 4 J
σι c •r—
Φ Χ Φ • r Χ L. · ι
X <>> χ
χ : > .
C
• ν
C J «Χ
Χ
ι η
C Φ
ι_ Φ C
> ra —· ο Ο 10 3 to Ο
• Γ —J
Χ *
σ>
L U
C O
< χ
<. χ
co < χ
« t
ι— L U
c o
■ Γ
41
ra l _
Φ
c φ σ>
Φ
χ •r—
C
X > Ν
s:
■ ν
Χ • ι
Ο
ra
U
• r
C
ro 41 l_
ro 41
x x ro
• V
X ■ ι
Ο
ro
C l
•r—
L .
■ r
C
C
Φ
> ·
o to to
• ι —
X
t n
1—I
C O
<x <t 1 —
L U
C
o • ι —
41
ro L
Φ C φ
co
Φ
χ •r—
L
X > N
C
• ν Χ • ι
Ο
ra
c i
• ι —
L_
■ r
C
C
Φ
> — ι
o to to
• r
χ
σι
o
co
co
<x «£ r
L U
C
o ■π
4 J
ra e Φ C Φ
en
Φ χ • ι —
ι_ X > s
_ C
• ν φ
41
ra C
41
• Γ
C
ιη
ro
Χ
ο.
Φ
> Ο
ε Φ
ι_
■ V
Χ ■ r
CJ
ra
CJ
• π
1 .
•r—
C
c
φ
> — ι
o co co
■ r —
χ
σι
ο ( Μ
Ι
ο
ε ν
ο co
co <χ «χ χ Ι
ζ
to « χ
<t
ι— L U
c o
• ι —
41
ra L .
Φ
c φ
en
Φ
χ ■rC
Χ > Ν
. C
ν φ
41
ra C
α. — J
13 to
co
ra
χ 0
Φ
> ο ε Φ ι_
V
Χ ■ ι
Ο
ro
u ■ Γ "
1
41
•r—
C
c ■ r
φ
> — ι
ο to to
• r
Χ
en
O
L U
co <t
<x X 1
t o
co «X «X Ι Ο Ι
φ — ι
• r
41
ro —1
o > ~ φ IO L.
W 3 φ 41
—> ra l _
ra Φ α
ε ε C Φ O 4 J
4
c o o 41 · ι v ^ 4 J
ro ε to D · ι
. ε χ ο Φ 41
ε ro
φ . Ι
4> Φ
ro .c c σ> 41 · ι
■ ι C
c C
• r 41
Ζ ·■" ^ . 3 Χ • ι Χ
ο C ro 3
O
ο α • ι ε
c o 4 J O
• i —
C O •r—
c —> • ρ — ι
ro Φ 41
> φ —> Ε ο <-LO Φ
tO 41
• ι C Χ τ
Ο»
ι η ν
<NJ
J
to « t < t 1 —
L U
I

- 23 -
to
in ω ι_ 3
Χ Φ ο O ι_
CL
ra υ
ra c
<χ
Φ
c ο
ο ιη φ ο
Χ Φ
C
c o CJ
OJ
in
Φ
χ ra
ζ
ο ►Η
r
<χ ζ
r l
ε _ ι α : 4 LU Ζ Γ
Ι—Ι L U
l i O
L U
_ l 0 .
ε <x co
U _
O
I— ζ
L U
ε r
<t LU OC
r
LU _ l LU 0_ M
ε >ι «X co co
m <x —1
α o χ ρ
ω ε
C J
LU
Cc
I to perchloric|S
molybden blue)
t ε Φ l_
·* o to Μα II
ro ^ l _
4· X • r
V CJ
Φ ra X ■ ι o
Χ Τ
Ο X I C l _
Φ O
o. υ to
c ra Φ
σ ι χ
o c t ra
X > s Φ
SZ 4J
ra + X
X X >s • r _ J
o O
ra ε
o ε · 3 4J · Γ
Φ C O O
ra ε ε
c ro •r—
X Φ X
> ra —t
O v to Q t o ■ !
• i U χ ra
,—Ν
i en
\> corvi
« I
rl Ην v
X _ l
_ l
o C J
CJ
LU
ci
rate, add Kl
|S
act into waterj
O c Q . 4 1
ra χ
> Φ Φ Φ
L
• V
Φ ν 41 Jφ ra — j 4 i
. c c j ro
α e j χ —> χ 3 Ο > , CO 4 J — ι
C O to ·Γ ε
ra χ ε X l Φ 3 α . —' τ
α c Φ ε ο > ο ε Ο CJ Ε
ε ra Φ —' L U O
Ι C • V r * ro
Χ Μ • ι - 11 φ
Ο r l 41
ra ν> ra to . C
o <t O. • Γ
— '
c 4J D
f J U I I I
• i ra
c c Φ 41 c
c χ ·■•r- Φ Ν
ra φ v c > -> X
— ' C J > s
O X C ( 0
to X X • i C X χ ra ra
en
i n
_ l v
Χ Γ
Ι X _ l
L U O
1 C J
Ι Λ
C J
L U
Q. CO
φ 41
ro c 4 1
■ n ·
C
CO
ro X 0
Φ
> o E Φ t_
•v X ■ r —
O
ra U
•t—
C
4 J
■ r
C
c • r
Φ
> — i
o CO
to •τ—
X
Ζ v
CJ
| X LU
1
Ζ
Φ C Φ D
— ι
Ο 41
O 41
C ■ r —
41
U
ra l _
4 J
X
Φ
■ v
C O
•τ—
+J
3 — ι
o in
t _
oo X
o 4J
L.
Φ M
to C
ra c 41
» ■
CJ
X
ra _ l
_ l
o CJ
o 41 C
• i —
+ J
C l
ra l _
4J
X φ φ l _
• V
T — i
CJ CJ
o 4 J
C •r—
4> CJ
ra c 4J
X φ
• V
C
o ■ r
4 J
3
—' o CO
— i
CJ
X
O 4J
(Φ
■4
m C
ra c 41
• ■
Ζ t-Φ
X ! 4J
ra ro _1 3
Φ 3
— t
X
C φ
X X
> s
_ J
o ε
ε Ι
Ο H
■ ·
C
41
O
m

24
CD
en Φ c 3
Χ Φ ci O Ευ
ro Cl
ro c
c o
Cl en Φ
X Φ 3 C
C O
CJ
Φ
X ro
ζ
o r1
1—
<t ζ
r l
ε _ l Oí <X LU Ζ p l—1 LU
u Ω
LU
_ J 0
ε «X
CO
U _
O
I— ζ
LU
ε I—
«X LU
or r
L U
_ J LU O IVI
ε rH « I CO CO
ω < _ 1
o o X ρ
ω ε
4
O
σι c
• p
4 1
C o 3 O
o OJ CJ 1
I · Γ
>^ ω
• V ■ ρ
m
c φ
• p
l _
l _
ra C l
X X
ra • V
X • r
CJ
ro C l
■ p
L
4 J
•r—
c
c •r—
φ
> —' o to to
• p
X
• V
σι C Φ
•P 41
c ro Cl C
*■> o . Φ —»
3 • ν to C O co
•p ra
4 1
10 X I • ι ΟΧ ra Φ
« > c O
■r ε I Φ
> o «
σι
o τ
ω
«χ <χ ΟΙ
co
co «χ < t
ι—ι ι—ι Ν—·
σι χ
+ > ■
i ¿
χ
ra _ι
• ν Χ • ρ
Ο
ra C l
■ ρ
ι_
ra 41
ι_
ra 4J
+
• · I—I
Χ
ra _ ι
^ X • p
C l
ra C l
• r
l _
41
• r
C
c • p
<PN
Φ 4J
> to — ' >N
O -> to ra CO 41
■ρ ra
X ci
σ>
i n I
OJ
V V
LU r l Ζ V V V
«O X i ¿
co «χ «χ
co ■χ
<c
φ 41
ro c 4J
•r—
C
to
ro χ
o.
Φ
> ο Ε Φ L
• V
Χ • ρ "
C1
ro CJ
•r-
C
4J
■ r
C
C • r
Φ
> — i
O to to
r
X
σι
o «—
v LU CO
V v
o ε
CO
<x <x 1
ζ
C O
<x «X
X
c ro c O t
c Φ
4
α 3 O
X X
ro • v
i n
• t—
X
Q. >-> Φ
O C 41 O
4J
ra Φ ■r _i¿
c —· O >s ε 4> ε 3 ro χ
o X tn Χ ΓΙΟ
— J
■ ν > ,
Χ SZ •ρ 4_ι
Cl φ
ra ε > CJ
•ρ N¿
ι_ co 41 I-t ■ρ ε
c ο
C 4J
·> C • ρ
φ > 41
— ' Cl
ο ra to C_ tO 4J
• r X
Χ Φ
σ ι
O J
<x
CO
< ■X
I X
LU
to
ra en
«X
4J
C l
ro c. 41
X
Φ
• v «X Ι
Ο LU
C
4J
T
3
X •f—
c 4J
ra E
X
Φ 1
Q .
ε o Cl 4J
C l
• κ ra X L. • r 41
cj x
ra Φ Φ
CJ L■ r
C V
4J Φ
• r 4J
c ra ε
c ra •r χ
ι_ φ (0 > ο
< O Ο 1
to SZ CO 4J
■r Ρ"
X Χ
C J
co «Χ
«χ
en c o
4J
tn
E O t _
4
C
Φ
α α. o o
SZ
41
• i—
3
C O
• p
4J
ra 4J
■ r
α • p
C l
Φ Ι
Ο. O CJ
■ V
X • r
CJ
ra CJ
• p
C 4J ε •ρ 3 C · Γ
X C Φ
• ι E
Φ en > c
— ι · ρ
O U to 3 tO "O
•r φ Χ C
C J
to < t «χ I
O C J
co «χ «t I— LU
>> Χ
c O ■ p
4J
ra t _
Φ
c Φ en
Φ X • r
l _
X > s
C
v X • p
C l
ra C l
• Ρ
Ι
Ο ]
4 1
l _
ro 41
X X
ro v
X C ■ρ O
CJ Ρ
ΙΟ 41 • r
O X •r X c ro
4J
■ρ Φ
C X • r
C <-•p X
>> Φ JO
> o _< ι Ο O CO X CO
• r ra
χ ζ
en
i n
1—1
C O
<x <x X
co «X
<t p
LU
X • p
CJ
ro CJ
• r
l _
4J
T
C
C • p
Φ
> — i
O to to
• p
X
en
o *—
X
to
>x «t
και
C O
ω 1
α. C J
P H
X • r
CJ
ro o
■ r
l _
4J
•r—
C
c • Γ "
φ
> —' O to to
• r
X
en
i n
X
0 C J
p H
C O
ω I
Ο
υ 1—I
φ 4J
ra l _
4J ■ p
c
to
ra X
α
φ
> o E Φ L .
V
Χ • p
O
ra o
• p
1
4>
■i—
C
c • r
Φ
> —i
o to to
• p
X
cn
O
<
ω
0 C J
t—1
1 Ζ
C O
ω 1
Q . C J
C
O 4J X C c
■p ro
41 O Cl ρ
10 t_ L. 3
4 J . C
χ α Φ —>
3 ■ v to C Ο v c α C Γ
Φ (4 4J
Q . P
3 C C l
J =
X 41
C Ρ
Ι Ο 3
ra Φ
•r to C τ Ο —'
E ro ε L. ra Φ
c Χ τ χ ε
ra χ • ν c Φ
χ ro 4J
•ρ 3 Ο φ — ι
ro 4J ρ
ίο χ υ <_
τ - Ο · ν L α Μ 4-1 ro χ •ρ- ■> τ
α Φ ο ΙΟ
C ν •ρ ε υ
t ·ρ
Φ Ο (> 4 Ο
—' Ο —' O e r to Ο ci CO — ι l _
•r SI Φ X Cl Q.
en
O
*""
Ζ )
Ου o I
χ
ω
C J
L U
Cit o
ra Φ l _
3 O
• p
J C
4 J
X X
ra • v
X • i—
CJ
ro CJ
• Ρ
Ι
Ο —t
sz o l _
Φ Q .
+ CJ
• p
c 4J
• p
C
c •r—
Φ
> — » O to in
■ p *
X
y»N
X v /
σι
i n
P H
v X
_ l
o o

- 25 -
m
ί-Ο
co φ L. 3
Χ Φ CJ O
ro υ
ra c <x
c o
CJ co φ o
X φ 3 C C o
C J
O J ■
in
Φ — j
χ ra
ζ
o pl
1—
<x ζ pl
ε _ l Oí
«χ ω Ζ p p1 ω
u . o
ω _ ι 0 .
ε «χ co
υ_ Ο
ι— ζ
ω ε ρ
«χ LU
OC
ι
ω _ι ω α . Μ
ε Μ <c co co
m «χ _ J
α o χ
ι ω ε
CJ
ω 0 . CO
ι
ω χ
c •ρ
φ
c τ
ε ο ι_
X
Ï S
ι η
4
ο
c ο
•ρ
41
3 — J
Ο to
ra
c •Ρ"
φ
> —J
o tn tn
• r
X
σι
τ
ο :
_ ι
o CJ
C J
ω LiCO
Φ Φ > 4J
—J «r
O sz CO Q .
to to •ρ O
X SZ
α ■ ν O
ra ο. • r > s
c sz o ε ra Ε Ζ
ra X
x c c ro ro
1—1
^ i ¿ pl
M TJ r l T 3
s^ CO
Φ l i · v
X X T
X ci
ra ra
V O
X P•p t_
o 3 ra . c
α CJ —1
·■ 3 c to
4J
• r C c τ
α Φ •ρ 41
ra Φ 41 > r
—> α Ο · ρ to O tO φ
τ I
X Ο.
σ>
0 0
«χ
_ ι
ο CJ
Ι
ο CJ
C J
ω LÌCO
/Ν
pl Ο
Η D · Ρ
W ( Λ L
c ro CO 4 4 J
O c
x ro C Φ +J IO to
ro χ ζ ο χ C J ro
ro c Ζ τ . v
X V X Ρ
X Φ Cl
o τ ro ro 4
Z · ρ Cl
X T
v O c x ε ii •ρ ·ρ
ϋ Φ c to c
3 C O Χ · Ρ -
•ρ- Φ c υ Φ ro o 4 J 4-J c ro t - Q . 4-J ro -P-4-J · ν Ο
Χ Ι ·ρ -X CO Cl Χ Φ ro 4 - ί
ο α. • κ
Χ Ο Φ •ρ - tO > CJ — ' — ι ro ro ο
to Ο 4-J to
•ρ- 3 -ρ- ( 0 c S3 Χ Φ 4-1 C •ρ- τ - . ν 3 C O " ο
φ τ -C 4 - CJ - C
τ - Ο C 4-J φ
φ C ι - χ > 4 J φ C
—· Q. 4 - ro O O- c. to O Φ χ CO O 4-1 · r-
τ - I I C CI " o ^ ^ ·ρ" ro
en o O J
N¿
CJ
ω 0co
■ v
φ Χ • r
X
O •t—
Χ
φ to φ χ
C φ ro —> σι α c ε ro ο ε ο
.JZ 10 41 α ι •ρ C
3 3 Ο
C τ Ο SZ
•ρ 4J
41 Ι
( 0 τ
4J CO •ρ
Ο. Ε •ρ C
CJ ο
Φ 4 1
Q. · ν Ο Χ CJ ρ
υ • ν ro
Χ •ρ ο
U Ρ
ΙΟ ι
Ο CJ — ·
•ρ . c t Ο
4· 1_ •ρ Φ
c α
c ο •ρ 41
Φ !_ > Φ
— ' 4
Ο CO
to c to ro
τ C
Χ 41
σι
ι η
ι—
CJ
LU LÌCO
ε ι Ο
Ο 4
4J
C · ν •ρ tO
Χ Χ · Ρ
Φ CJ
—· ro α. Ε u ο - ί ο Ι
Ο c —> Ο -CT t - CJ L. C-φ φ
4 - Q . Q. 3 Χ CJ C
ro co ra c i
τ -4-1 C CJ 4-1 ra · ρ -c- C 4-1 X - C Φ 4-J
•ρ -■ v 3
Χ • r φ
CJ CO
to · ρ —1
c j ra •ρ l_
l_ Φ X
4J C Φ •r— · ρ —J
c ε o_ ε
C · ν o •ρ ε o
l_
Φ o ro > 4 φ
—J O ι
Ο « 3 CO O O CO — ι · Ρ
•p C C
X CJ 4J
en —. O J i n ■**. · ι η o
_ l
_ l
o CJ
1 X
ω

26
χ CJ
to Φ c 3
Χ Φ o O
ra u
ra c «t
c o
o to Φ O
χ φ 3
c
c o
CJ
O J
in
φ
Χ ra
Ζ
ο ι—ι ρ
<χ
ζ
ιι ε
_ι cr <χ ω ζ ι— ιι ω u ο
ω _ι α, ε < co
υ
Ο
I—
Ζ
ω ε ρ
<χ
ω or ι
ω _ι ω 0 lv i
ε r l
<Χ t O
co
m «χ
_ι
ο ο χ
ι ω ε
4
Ο Χ
en c c ra
• Γ "
pj ε
c τ ι η
3 « »
Ο * « CJ ι ι
ι χ χ ^ > C J CJ
χ • Ρ "
ο
ra U
• ρ
ι_ + J • r
C
c 'l
φ
> — J
o to to
• ρ
χ
• ν σι c
• ρ
SZ
υ 4J
Φ
■V
ς. Ο
4-J Cl
ro Φ ί
α • r -
C O
• p -
4-J
ro • p -
X ro c c
• i —
C o c
4-1 3 Φ c
cn
*-
Li
s t «X ζ
4 -o σι c
• i —
4-J c i n 3 « -O «-u 1
v 1 Ό > ^ C J
■ v — 1
C J
X
C • r—
φ
> — J
o to
to
• ρ -
Χ
>v en c
τ -
j r
o 4->
Φ
• V
ι-Ο
4-J O
ra Φ ί
α • ρ -
ΙΟ C tO Ο φ
•ρ- C 4-1 > . ra c
-Ρ- - o X ro o C +J l_
•ρ- φ +J
c ro O ι-ι- O 4-j α 3 ro φ > c Φ en
i n
1
«~
O
4 -O
σ> c
■ i—
4J
C i n
3 «
O «
υ ι J ~° > < 3 U
• V
X Τ
Ο
ro Cl
• p
L_
4J
τ
α
c ■ r
Φ
> o to to
•t—
X
• v cn c
• p
C φ
U 4J
41 ra
Φ «
41 ■ V τ
t C
O 41 tO
c i ra
ra Φ X C 0
C Φ • ρ >
O c ε O Φ
•ρ L.
4J
ra ·ν •ρ χ Χ CJ
10
ι_ ι_ C Φ
• ρ · ρ
ι_ C ιΟ ra C Cl
41
3 Χ φ χ
c ra
σι
«
e>
< t < t
ζ
ι ζ
4
ο
σι χ c c
• ρ ra
■u ε c i n in 3 « τ
Ο « ι
Ο ι ι ι χ c
Ì Q U H
• ν Χ CJ
ι_ φ
• ρ
|_ C
10
ο
χ Χ to
■ ν
Χ ρ
Ο
(0
CI • Γ
C
4J • ρ
α
c τ
φ
> — ι
Ο en en
τ
χ
• ν σ> C Φ
• ι 4 J
C «0
υ C ■pj α
Φ —· 3
• ν «η
C
Ο ι η
• ρ ra
41
ro χ τ Ο
Χ ro Φ
< > c ο
·> ε Ι Φ
ν » «
σι
ο *~
m
«χ « χ
Ο
Ι
co
. co « t « χ
/■ν
4J
co
>. — J
ro 4J
ro CJ
IΗ
pH
^ σι χ
C
41 • p
3
■ ·
i ¿
X>
ro _ l
*—* Φ
X • Ρ
Ι
Ο 3
Χ —· τ 4
Cl
ra ε 3
CJ ·ρ
τ C
t o 41 ε
•r ε c ro
c χ •ρ χ
ro Φ
> ■ · —* —i
O t o S3
t o ro
•P _ 1
Χ v '
σι
i n
ι i n
■
O J
v v P H i ¿ 1—
V V V
Χ 5 Ζ
t o
«χ
«Χ
co
< < t
Φ 41
ro ι_ 4J
•ρ
α
co
ro χ Q
Φ
> o E Φ
c
• V
Χ Τ
Ο
ra CJ
•τ—
C
41 • ρ
c
c •r
φ
> — » ο co co
■ ρ
Χ
σι
ο O J
ι ο
ν ν ο co
ν ν u ε
co «Χ «χ
Ι Ζ
co «Χ
<χ
ρ
ω
*ν
ζ
χ α 10
3
to
χ 10
— ι ν ^
• ν
φ
41
10
C
α — J
3 to
to
ra χ α
Φ
> o E Φ C
•v C X O •ρ τ
ο 41
ro 3 — i
o O •p CO
c • pJ — '
■p C J
C X
C o •p 4J
Φ <-
> Φ —» 4
O to tO C
to ro
■p t
X 4 J
Ρ — \
cn ζ v
O ï τ— v ^
v ζ
v j o r
CO
<x <x | e/o
t o
«X
<c πω
X Τ
Ο
10
o • ρ
C
4J • ρ
C
C • r
0P
> — » o en CO
■ p
X
σι
o OJ
I
i n
pH
V
X
t o
«X «X
ι ω
Φ
υ C
ra C Φ o O to c Φ Φ
c o to
O Φ
•ρ ι
έ o O 3 +J —J ra 4 -
Φ o L. 3 O en
4-1 SZ σι
• Ρ "
—' a. CJ pH
V l_ φ to
• ρ -
ε o 4-J
ra χ o ί-
c O
χ c 10 o ■V
X ■ ρ
O
ra O
T
C
41 • p
C
c • Γ
α. > —* o to
en • ρ
Χ
en
m
PH
Li
or «χ
α CJ
pH
Χ • p *
u
ra υ
•t—
L.
41
• ρ
α
c • r
0)
> — » o en en
τ
X
σι
i n
P H
0CJ
P H
Q. C J
PH
Φ 4J
ra t
+ J
•ρ
α
t o
ra ' X
0
Φ
> o E Φ L,
• V
Χ ■ p
O
ro O
τ
Ι .
41
• p
α
α •ρ
φ
> —ι
ο to to
• ρ
χ
σ>
ο r -
ω
0C J
pH
Ι ζ

- 27 -
χ CJ
ί-Ο
LO Φ C 3
Χ Φ ο Ο
ro ο
10 c «χ
α ο
ο to φ c
χ φ 3 α c ο CJ
Χ ra
ζ ο ΡΗ ρ -«Χ Ζ ΡΗ
ε _ι or <χ ω Ζ ρ-ΡΗ ω υ- α
ω _ ι 0 -ε « co
ΙΛΟ
Ι— ζ ω ε ι— <χ ω or ι -
ω - ι ω 0- ινι ε Μ < co co
m <χ _ ι
α ο χ ι-ω ε
Ο-CJ p H
Φ 4-1
ra ι_ +J • ρ -
c to ra
χ ο_ Φ
> ο ε Φ ι_
• V Χ " Ρ -
Ο
ro Ο
τ -ι_
4-1 • ρ -
α α • Γ -
Φ
> —J ο to to
• r -Χ
C0
ο «~
co
ο_ CJ ο Ι
ζ
0 -C J α
C J Χ
ο 4-1
C Φ
4 -to C ro ι_
4-1
• V φ 4-1
ro sz Q.
— i 3 10
to ro
X αφ > O E Φ L-
• V X • r -O
ra O
• p -1_
4-1 τ
α α
■r—
Φ C
> o —» «rO 41 to 3 tO —I
•p O X en
Oi
i n OJ
X
0 CJ
o
| t o

- 28 -
o 1-4 I — «t
_ ] or <: ω
σι C
• ρ-4-1 α 3 νΤ ο ο υ ι Ι 3
^ ^
σι α
τ -4-J α 3 vT Ο -Ο υ ι Ι 3
^ o t J
σι α
• ρ -4-J α 3 vT Ο Ό υ ι Ι 3
^ < - > co <χ «χ
t o ■χ
«χ
co
<χ
co «χ
co <χ <χ Ο.
CJ ο. CJ ο
0 CJ Li
t o CLCO
3 CJ
to φ
c 3
χ φ ο
ο L
0
(0 ο
ro c «t
φ C
c o
• p
4J
α • Ρ
ί ο to Φ a
LU _ l 0 -ε «χ t o
l i . O
X φ 3 α c o
CJ
O J ■
i n
Φ
X ro
«x ω or
α . M
«x co co
o ra
c
c
Φ
> o CO
CO
■ v cn c
o 4J
Φ
• V
ιΟ 4J O ra Φ
α o
χ ro ί
α o
3 Φ C
o ro
c
α
Φ > Ο to to
■ ν cn C
• p
sz φ O 4J
41 ro Φ c
41
■ V Τ Ι C
o 41 CO
o ra ro Φ χ
c θ
α Φ
•r > o
α ε ο Φ
τ C 41 10 ' V
τ 3 Χ CJ 10 L. ί_ L- Φ α ίο ro c o
4-> 3 Χ φ Χ c ra
χ Φ
ra Χ
ra ο
α Φ Ε Φ C 3 to ro Φ
σι α
ο + J φ
ο ra Φ ία ο
χ ra
C L-- Ο 4-< C φ
■ Μ ε
3 ο Φ Φ
c Oi
o ra
c
c
φ
> o to to
φ 4-J
ra
en ro
Χ 0-
Φ > Ο Ε Φ
Ο
(Ο
ο •r— ί
α c Φ
> o en en
σ> ι η
σ> Ο
φ 4 -C0 C ro ι_
X ro
Φ 4 J ra
cn ro χ
Φ > o
• ν Χ O
ra
to ra
o ra
χ Φ
' V «t
3
Χ • p -l_
+ J
ra χ Φ Q. E O O 4-1
O • v ra
X c •p - 4-1 O X ra Φ
Φ o Ι
Ο
ro
ra ι_
to ra χ αφ > o ε Φ c
■ V X • p
C l
ra
ra
CO
ra
χ
0Φ > o ε Φ
L
• V
Χ ■ ρ
Ο
ra
CJ
χ
in
C
ro
■ V
φ 41
ro C
a.
3 to
en ro
X I
α
Φ
> O ε Φ L.
■ V X • ρ
Ο
ro o
• r t
C C
C o
Φ 3 > —'
J O O tO cn to —>
■I- C J
X X
c ra ε
c ra • i S3
t_ Φ ra > o
—' o O Ρ t o SZ cn 4J
•ρ r—
X X
C
c
φ
> o to en
c
c
φ
> o cn en
c
c
φ
> o en en
v
r■
o
X Q.
O 4J
ro T
c O
ε t
ra
v X • ρ
Ο
ra o
• r
V
i n
» t >
X Q.
O 4J
ra • ρ
α o F ε ro
v c Φ
4 4 3
X
Φ 4J
ro
X X
ra ■ v
X • ρ Ο
ra
X X
ra • v
X • ρ
Ο
ra
c
c
Φ c
> o —■ » Γ
Ο 4J
to 3 CO — J
• p O
χ cn
c
c
c
c
φ C Φ o >
J Ν — '
o ra o to c to tO Q . tO r 3 Ρ
x o x
c o Ν
ro ί-Ο. 3 O
or \_¿
σι
σι
o σ>
o
σ>
o
σ>
i n O J
σι
i n
o σι
i n
m <c
CD CD
or V
α o
«X
<x <x
«X «X
C J CO
CO
< «X
CO
«X
<x I
CO
«X
CO
«X
<x CO
<x «X κω
ου PH
I ζ
Lie j
o I
Ζ
Ου O I
co O CJ

- 29 -
CJ
ι-Ο
to φ ί-3 Χ Φ o O C
ro o
ra c <t
c o
ίο co φ
X φ C
C O υ
Φ Χ ra
ζ o pH I— •χ ζ PH ε _ ι or
<χ ω Ζ ρ-ΡΗ ω υ - α
ω _ ι α. ε «χ co
LL. O
r-Z ω ε r -«X ω or ι -
ω _ ι ω 0 - lvi ε PH <t t o CO
m <x _1
o o X ρ
ω ε
CJ ω ΟΙΟ
c o Ν
Χ 10 C C ra α. 3 φ o 4-J ro 4 -c- O o o . C ra o > - P -Φ 4-J
3 ■ V —ι Φ o 4j en
ra C V U N
—i · 3 O en
X en Οίο
O X I 4-1 Ο
ΙΟ Φ ·ρ-> c o o ε ε Φ ε c ra
• ν ν Χ Χ • ρ - · ι —
Ο Ο ra ra o o
• ρ - · ρ -(_ l_ 4-1 4-J
• ρ - » Ρ Ε O
C χ •r- "O —J
ra o Φ SZ > · ν O
_ 1 φ CJ O 4-J —J to 3 ra en —i
•ρ- ·ρ- c χ χ - ί
σι
ο «~
<χ
—ι Ο υ Ι
co
υ ω Li-CO
ν ι η
■ 4
χ α .
ο ε 41 Ι Ο
10 4 τ Ο C ι Ο ο ε —ι ε sz ra ο
ν ο C 4J Φ c
4 r4 3 U
Χ Ο 10
Φ C 4J 4J ra χ 41 φ φ ο · ν 10 φ
c Χ τ X Ο ra ί
α • κ 3
χ ο •ρ- Ο Ο Φ 10 C
Ο Χ •ρ- C c ra 4-J •r- Χ C -Ρ-
Ο c ra
• ρ -
Ο 01 τ -> Χ
—t ι -Ο o tn o to to
τ - ra· χ —
t . ο >~· O 4 - CO
ν 00 CO OJ
σ> co
ο Φ ε , 1 or
ν ΡΗ Η
ν V Χ - J
_ ι ο υ Ι
χ ω

30
Ι
Ο
en Φ
ι_
χ φ ο ο
10
ο
ro c «χ
φ
c ο
ο to φ ο
χ Φ
c
c O
CJ
Χ
ro
ζ
o l H
ρ
«Χ Ζ p H
ε —Ι αζ «χ ω Ζ Η14 ω l i £3
LU
_ι α. ε «χ t o
L U
O
f
z ω
ε ι— «χ ω or ι
ω _ j ω α . ivi ε ιΗ «Χ CO co
ω «χ —Ι
α
ο χ ρ
LU
ε
4
ο
οι c
• ρ ·
4 1
C 3 CO ο i n
ο ι ι ο
■ ^ > < >
χ • ρ
Ο
ro
ο τ
C
4J
• ρ
C
C •ΐ-
ΟΙ
> — J
o to en
τ -X
■ ν
οι c
•τ—
J Z
Ο
4J
Φ
• V
Ι
Ο 41
Ο
ro Φ
ί
α • ρ -
α ο
* Γ -
+J CD
• r -χ ro ι_ ι_
■ ρ
c ο C
41
3 Φ
α
σι
«
L J
CC
<χ ζ
4
ο
σι
α • ρ
4J
c 3 00 O LO ο Ι Ι Ο
^ > υ
• ν — j
υ Χ
α • ρ
φ
> —J
ο to to
■ ρ
Χ
• ν
σι c
• ι —
C
ο 41
Φ
■ V
Ι
Ο 4J
Ο
ro Φ ί
α - Ρ
ΙΟ c to Ο Φ
• ρ - C 4 J > s ro u.
■p X
X
ra o C 41
c •r Φ
4 1
c ra O ι
ι o •»J α 3 ra Φ > C Φ
o
4
o
cn c
■r—
+J C 3 (V. O i n o I
J ·■^ > Z
■ K
• r™
ζ
u. Φ
■ r
£_
ί-ΓΟ O
X X ra • V
X ■ ρ
Ο
ra
o • p
c_ 4J
• r
C
c • p
Φ
> — I
O en CO
• r
X
■ V
Ol C Φ
τ 41 SZ IO O C t· α Φ — J
3 • ν to C Ο m
• ρ ra
4 1
ra S3 ■t Ο
Χ ra Φ
« > t o
•ρ ε Ι Φ
>«=» <
en
ο «~
m
«χ "Χ ΟΙ
t o
co «χ <χ
χ • ρ
Ο
10
ο •r—
ι_
'ΐ—
c c
τ -
Φ > — J
Ο en en
τ -Χ
*-*. Ι— \~* σι ι η
ι— ν
Ζ
co «χ <
co «χ «χ
φ ■ Μ
ra U .
4-J
• ρ -
C
co 10
χ ο-
Φ
> ο ε Φ
ι_
• ν Χ • ι —
Ο
ra
Ο
•r—
ί-
τ -C
C • ρ -
φ > — ι
ο co co
■ ρ
χ
σι
ο OJ
ι ο «
ν ν ο t o
ν ν
υ ε
co
< <χ Ι
Ζ
co
<c «χ
— J
υ χ
ο 41
L
Φ 4 C0
c 10 1
41
■ ν
φ 41
10
SZ
Q — ι
3 CO
co
ra
Χ 0
Φ
> Ο
ε Φ
ί .
• V Χ • ρ -
Ο 10
ο • ρ -
L -
• ρ -
C
c ■ r
Φ C > O
— ' ' Γ
O 41 to 3 en —J
•p o x to
ζ
co «Χ < I I
t o
co <x «χ
ι ω
χ • ρ
Ο
ra
Ο
■ Ρ "
L
• Γ —
c
c • r
Φ
> — ι
Ο to to
• ρ
Χ
^ν ^ν Ν/Τ χ ν ^ ν ^
σι σ> ι η
• ο O J
ν P H
V
Χ i ¿
CO
«χ «χ ρ
ω
Ου Ρ Η
φ 4J
10
C
41
τ
C
co 10
χ Ο
Φ
> ο ε Φ
ί-
• V Χ ■ ρ
Ο
(0
ο • ρ
1_
• ρ
C
c ■ Γ "
Φ
> — ι
O CO
CO
• ρ
Χ
σ ι
o '
ω
Ου P H
I ζ
«
Ου ο
Φ
4 J
ra ί -
4-1 • ρ -
α CO
ro χ 0-
Φ > ο ε Φ ί-
■ V
Χ ■ ρ -
Ο
10
ο ■ Ρ "
ί-
• ρ -
c c
• ρ -
φ > — ι Ο to to
•f—
Χ
en O t —
co
Ου o I
ζ
Ου α
— ι υ Χ
Ο 4-1
ί-φ
Η βη C ro u.
4-J
■ V
Φ 4 J
ro C
α — I
D 10
CO
ro
X Ο
Φ
> o ε Φ
ι_
• V
X • ρ
Ο
ro
O
• p
t
• p
c
c • p
Φ c
> o — ' »r—
O 41 tO 3 en —J
τ O χ to
cn
i n OJ
X
Ου o 1
t o
C J
ω ΟΙ Ο
χ v c
Φ ro C ' V
τ ε Φ
J t c u. 10 O τ Φ
* 4 ε 41
—J ο o ro ra c í 3
o X O —' X 41 JZ χ c
o χ ra ra ra
•p O Φ
c υ ·ν ε o c —· ρε τ υ χ ε χ ο ra 41 > »
ο χ —ι ν ra c σ>
χ t ro —> •Ρ" 41 >Ν
ο χ χ SZ 10 Φ Ρ 4J
ο Φ
ο ·ν ro ε •Ρ Φ · ·Ρ" ι ε ο χ
4J τ · ρ
•ρ Χ ί_ Χ O O 4-· Χ
> Ν · Ρ - (0 Χ —> Ο χ σ> · ν ra —J 4 - ra
>s O τ -. ν j = c
X 4-> c o τ - Φ o ε ο ε τ - ε ra τ - 4-1 ra
Χ 3 Ο —J SZ
•ρ- Χ O 4-1 u. C co ·ρ-
•p- O c Φ 4-1 ί
α c 3 C -ρ- -ρ- O
•r- ε -> ro 4-J o
Φ —J o o > > s ra
—" X C φ Ο Ο 4-1 > to ι - χ o to χ Φ ε
-Ρ - >N Φ Φ Ό £ L L
en o *""
i ¿
_ι o υ I
χ ω
- 31 -
χ co
ΙΟ
co Φ L· 3 Χ Φ ο Ο
10 ο
•τ— 4-J > Ν
(Ο c «χ
φ SZ
c ο
ΙΟ 10 φ Ω
χ φ 3 C
C O υ
OJ a
m Φ χ ra
Ζ ο Ρ Η 1— «χ ζ p H
ε —Ι or «χ ω Ζ h-Ρ Η ω L U Ω
ω _ι α. ε •χ t o
υ . Ο
Ι— Ζ ω ε ι— «χ ω or ι -
ω _ι ω 0 - I V I
ε «-ι <x to co
m <χ _ι
ο ο χ ι -ω ε
O J
γ 4 - X I Ο t o
c n x c c
• ρ - ro 4-J C OJ 3 OJ O « Τ Ο 1 I X
Ju^ tO
X • ρ -
Ο
ra o
•r— l_
4-J • p -
c c
• ί
α. > _. O CO to
• p -
X
• v σι c
• p -
J Z O
4-J Φ
• V ί -Ο
4-1 O
ra Φ ί
α •r—
c o
•r— + J 0 3
■r—
χ
ra c
c • ρ
c o l_
41
3 Φ C
Oi
*""
L U
<x «X ζ
4
o
t n C
•r4 J
C vT 3 OJ Ο Τ
Ο 1 I X
^ t o
• v 1
υ X
c • r
Φ
> — j
o to to
•t—
X
• v
cn C
• p
J Z
O
41
Φ
• V
ί -Ο
4-1 U 10 Φ l _
c • ρ -
Ι Ο C tO O Φ
• ρ - C 4 J > s ra i -
• p - X X ra o U . 4 J l_
• ρ - φ 4-J
c ra O ι -ι - o
■υ α 3 ra Φ > C Φ
cn
i n I
τ
ι
O
o
O J
y 4 X I O CO
c n x c c
• r ra
41
C OJ 3 OJ O τ Ο 1 1 X I
> v i CO
X Φ
41
ro L_
X • p
1
ra o
4J
ra
4J
C φ
ε Φ
ι_ 3 to
ra Φ
ε
• ν
en c
• ρ
J Z
O
4J
Φ
• V
ί -Ο
4-J O 10 Φ l_
c • π -
c o
• ι —
+-» ίΌ
•r— χ ra c. ι .
• r—
> s C ι -Ο 4 -J l _ φ
4 - j ε 3 O φ ' φ C en
en
*-
C 3
< >x ζ P H
υ co
O J
*— I X l
4 - C O O
χ en c c ra •t—
■υ ε
c o 3 r o o τ ο I
v ' ° i>s, to
■ v
X C O
c φ
•t—
l_ c
ro O
X X
ra
• v X • ρ
Ο
ro
o ■ p
l_ 4J
• ρ
α
c • p
Φ
> — 1
O en en
■ p
X
■ v
cn C Φ
• r 4 1
J Z ro
O J Z
41 Ο
Φ —> 3
• v to
c O to
• p ro
4 1
ra χ • ρ Ο
Χ ra Φ
c > C O
•ρ ε Ι Φ
i * «1
cn
O
*—
CO
<x <x ΟΙ
C O
t o
>x <x
X • ρ
Ο
ra
O
• i —
C
10
4J
c
ra 41
X X
ra
• v X • ρ
Ο
ra
o • p
c 4J
• p
c
c ■ p
Φ
> — J
o to en
• p
X
cn
i n
P H
to
<x «X
t o "X
« ι ω
c o Oi u. 10
■ v φ
X ■ ρ *
X > N
J Z
o C Λ
O Φ X f·
4J
ra Φ ζ >
3 Χ o Χ ro Ν
Il 41 v ^ l _
ra C 3
o cr •r—
4J 41
ra o C J Z
φ
c o Φ 4J
en c • p
Φ Χ φ • ρ " Ο
C P
X i_ > s X
J Z > · .
J Z
■ V
—' X u co X
en C Φ
c Φ c
> ra —J o
O to 3 to o
• ρ — J
Χ 4
σι
**"
ω
CO
<χ
< χ
co •Χ «χ ρ
ω
C Ο
• ρ
4J
ro ι_ φ
c Φ σι
Φ χ • ρ
Ι _
X
>> J Z
• ν Χ • ι —
Ο
ra
ο •τ—
ι_
ra 41
C
10
41
Χ Χ
10
• V
Χ • Γ
ο (0
ο
C
4J
C
c
φ
> — ι
ο to en
Χ
σι
L O
P H
C O
«χ «χ
φ 41
ro ι_
4J
• ρ
C
co
ra
χ
α.
Φ
> ο ε Φ 1
• V
Χ • ρ
Ο
1 0
Ο
1 _
4J
C
c
φ
> — ι
ο to co
χ
en
O
'—
o
co «χ •χ I
ζ
t o <χ t. ρ
ω
c o
• p
4J
ra l_ Φ
c Φ
en
φ χ • ρ
ι_ χ
> Ν
J Z
• ν φ
4J
ro C
4J
•τ
α
CO
ra
χ 0
Φ
> ο ε Φ C
• V
Χ Τ
Ο
(0
Ο
ι_ 4J
C
C
φ
> — ι
o co co
Χ
en
O O J
ι o <~
V
ε ν
Q C O
C O
"Χ
<x X 1
ζ
to «χ
< ρ
ω
C o
• r
4J
10
l_
Φ C φ
en
Φ
χ • Γ
1 _
X
>. J C
■ ν
Φ 4J
10
SZ
ο. —' 3 ιη
to
ro
Χ Ο
Φ
> Ο
ε Φ
ι_
• ν Χ • ρ
Ο
ro
ο
C
41
C
c
φ
> — J
o to en
Χ
en
Ο
<~
ω ν
ο
co
< «χ χ Ι
co
to «χ <χ
φ χ • ρ
X
ο * ι
χ
φ LO
φ
c ra en c ra ε
J Z
4J
• i —
3
C O
■ i—
J J
ra 4J ■ ρ
Ο • ρ
Ο
Φ ί
α o u
- ν Χ • ρ -
Ο
ra o
c 4-J
C
c
φ > — 1
o en en
X
u
co <x <x | o u
to <t «X
• V X ■ ρ
Ο
ro
O
• ι —
L
ν 3 O J SZ
X O.
a.—> 3
O to 4J
C Χ ρ
Ο
ra Φ Z 4 1
ra V 4 J
Χ Ρ
■ p α
O Ρ
ΙΟ o φ
o c T α X C φ
o > o — i to O ra to
en Χ ΡX X
ra ■ v
. f c ^ c Χ Φ O T o ρ
ο Ρ 4J
ra 3 3 4J — i
Cl v^ o • p t O
c O 4J O J "
C O X
— c ■ o
OJ
Φ ra (> Ζ Φ
— ι 4
o σι to en c en i— ro
• ρ · L
X O +J
σι
i n
rv. 1
O i n
o
t o
<: «X
| C O
Li
tO «X
<x ι ω
X • ρ
Ο
ra
o ■ i —
l_ 4J
•r—
C
c • p
Φ
> — i
o to to
•t—
X
i ¿ X v * v ^
σι σ>
ιη o ■ χ—
OJ ι
i ¿ ν
Χ
C O
<χ < t
ι ω

32
χ co
ιΟ
to φ ι_ 3
Χ Φ υ Ο C Q
10 Ο
10 C
<Χ
C Ο
ο LO
Φ
Ω
Χ Φ
C
C O u
OJ ■
in
φ
x ra
Ζ
o PH
ρ
«Χ Ζ PH
ε _ι ατ < χ L U
Ζ ρ
ΡΗ ω
u α
ω _ι 0 .
ε «χ t o
LU
O
ρ
ζ
ω ε ι— «χ
ω or ρ
ω _ι ω o. rvi ε ιι <χ t o t o
m <χ J
Ω O Χ
ι ω ε Ι
co < t «χ
ι ω
Φ χ • ρ
X
Ο • Ι "
χ
φ
co Φ C
ra σι c ra ε
J Z
41 • ρ
3
C O
• p
41
ra 4 J • r —
O• ρ
Ο
Φ ί -
Ο. o o
■ V X • ρ
Ο
ra o
• p
l _
4 1
τ
α
C • r
a> >
—* o co en
• r
X
CJ
CO
<c «X
Ι ρ
Ο LU U
Ου
α
Φ χ • ρ
Ι
Ο — ι
J Z
Ο
en
ra Χ Φ
> Ο
ε Φ
ι_
X Ο
• V Χ • ρ
Ο
ra ο
•ι—
1
4J •r—
α
c ■ Γ
Φ
> — » ο en to
• ρ
Χ
σι
ο χ—
t o
Ου Ω
Ι
_ι υ
Ου Ω
— ι
υ Φ Χ
Χ τ Ο Χ 41
ο • ρ C
X Φ 4
Φ en en c Φ ra C c 10 41
cn C v ra en
ε χ ■ r ·
jz υ
+ (u • i —
3 o • t
C ι Ο 3
• ρ C
41 a. ra —■
4 J 3
• p CO
a. ■<- +
O
Φ O c . ρ
α ιΟ 4J O · ρ
C • v
X C τ Τ
Ο
ra Φ 4 J
o ra • r 4 1
C . · ρ
41 Ω. • ρ 't—
C O Φ
C c. ■ p O.
φ Φ c > > O
—J — J ρ
Ο O 4J tO tO 3 cn to —ι
■ ρ ρ O
X X en
Oi
i n
O
Ου Ω
I O
υ
CJ
ω ΟΟΟ
— J y \
> s · ■ Φ
O O
O _! c ί- φ Q U L o ra Φ t o — ■ 4 -
• r - w ς . Φ
ο α 4-1 4 - 1 O C C τ - τ -
τ - 4 - J
3 —J 4 J — J ρ -Ο Ο ΙΟ to ί-ΐ - Ο 4-1 00 4 -X Φ Φ 4-J
α ο ■ V P - φ
Φ ε C χ ra ι_ •ρ- χ ο
χ ο ο o sz ι_ ι_ ·■ φ ο χ ζ
χ
α ra χ ι Φ 10
σι ·ν—ι ο y-> ί_ Χ . ν
χ Φ Φ > Η 4 - J α
J Z ro · ρ -1 _ Ι -
+ 3 Ο 4 -J — ι
Χ 10 JZ •ρ- co Ο Ο ^ ν
1 0 > 4 -ρ - ι Ο
Ο ν -
•ρ- Φ α 4-1 U Ο Φ · ρ -
Ο ■ · 4 J
1 0 1 0
Ι C α ·ρ
•ρ χ ι ε ( 0 · ρ
φ — ι _ J
> ν^ αι — ι
O l ■ co Φ ro CO J Z 4 J
• ρ 4 J O
Χ Φ 4 J
_ι w
en σι
i n • i n
Ο ι ν
_ι ν
IΗ Ζ
_ι ο υ Ι
χ
ω
υ ω ΟΙ Ο
■ ν
φ 41
3 1
•τ—
χ χ α
ν (0 Φ
4J Φ ro 4 1
t . to Ο ι Ο 4 1
ro · ι
> c Φ
c ■ • • ε Φ
χ χ •r Χ Χ (0
ο ^ Ι
φ φ
ο χ • ρ
α χ
Φ ο σ>·ρ
ο Χ ι_
Χ Φ > ν C0
SZ φ
α + 10
en χ α ■ ρ ro
ο ε ro
sz O 41
•Ρ ' Ρ
4J 3 φ Ο C
ro o • r *
4J
c ro • ρ 4 1
• p
Φ O > T
—· O O Φ CO t
co o τ O X O
| y \
vr v^ O)
σ> o
<— « v
l H
V
X i ¿
1 X _ l
ω o 1 CJ
o υ
Φ
C φ Φ c
• v Ν · ρ
> c ε υ Φ ro x x χ
ο e r o JZ
• ρ Ι
Ο Φ 4 J χ
4J C Χ
ro ρ ro
4 J
• ρ y v V
Q H C• ρ p H · V φ
Ο ΡΗ Χ SZ φ ν ν ρ 4 J
L Χ Ο Φ
ο co ro —· > s
Φ 4 1 O O
> O ρ o
— i ro c ι
Ο i ro o CO 4 1 4 1 O
CO X í CO
• Ρ Φ t O Ρ
Ω 4 J
■V Ο Φ Χ 41
• 41 C C y v ro ro Ρ
C JZ
o t i o o ^ ·■ ' >
41 3 Φ v v
3 CO c Χ — ι τ C O
ο Φ ε co c ro 4j
•ρ "O o σ ι N o ro c ro j z t
• p C C 4 J
—' χ X τ > N X Φ
O JZ X χ ro · ν
+ yv O · « ■ > 4 J · · Φ P H
C v y
Φ l H 3 Φ
41 4J CJ
ro Χ x c c ρ π
ιο ro ε en C X vr;
ro m vr ε CO p H
c. χ ε S3
Φ ro ro o. _i + _i
y \
PH V
X ^ p *

33
Φ
co
co
φ
c
3 χ φ
o
O
c
0
ra o
ra c <x
c o
o en Φ
Ω
Χ Φ 3 C
C O
υ
Χ ra
Ζ
ο ΡΗ
ρ
<Χ
Ζ pH
ε _ι or <χ ω
ζ ι—
ΡΗ ω LU Ω
ω
_ j 0
ε <χ
t o
L i .
O
r
Z
ω ε ι— <£ ω or ρ
ω
_ j ω 0 . iv i
ε Μ «Χ LO CO
CO
«χ _ l
Ω
O
Χ
ι ω ε
4
ο
en c
• ρ
41
C
3 ι η Ο IV
ο Ι Ι Φ
X a to
Χ • ρ
Ο
(0
Ο •τ—
C
41 • ρ
C
c • ρ
φ
> — ι
ο to
10 ι —
Χ
■ ν
en c
• ρ
J Z
Ο 41
Φ
■V ί-Ο
4-1 Ο «0 φ ί-
Ο • ι—
c ο •1—
4-J (0
• Γ -χ 10 ι_ ι_
-Γ-
c Ο ι_
4-1 3 Φ C
σ>
*—
U -
«X « χ ζ
4 -Ο
en e
■ r —
4J
C
3 m O rv. o I
J "» >saco
X
Φ 41
ra l_
X •p
1
ra o
41
ra 4J
c Φ
ε Φ t_
3 to
ra Φ
ε
■ ν
en c
• ι—
sz
o
4J Φ
* V Ι
Ο 4J O
ra Φ l_
C •r—
c o
•r—
■M ίΌ
't—
χ
ra Ι -Ι -
τ—
>> C ι-Ο - M C φ •u· ε 3 O φ φ
• c σι
σι τ
ο
«χ «χ ζ ΡΗ υ CO
CO < t <χ ι -ω Φ
χ • ρ -
C X
>-J Z
ο 4-J
C O
't—
4-J O 3
X Φ t -
■V
Φ
4J
ra l_
4J ■ p
C
CO
10
X 0
Φ
> o ε Φ
t C
O • V · ρ
X 41 τ « ρ
Ο χ
ro χ (0
Ο •ρ φ
ί- Χ 4-1 ·Ρ" •ρ- ί α χ
Í N
c j z •ρ O
ι_
Φ ο > χ
—J
ο ιο co ζ ιη
• ρ > Ν
Χ χ
en ο OJ
ι ο «—
co
ν Ω
CO
<χ «Χ
Χ Ι
Ζ
co
< <t
ι ω
ο 41
C 4
■ρ Ο
Χ Μ
C c 3 3 O O
o ε ε ro o o —>
— ι
Φ ro
c ε ■ρ CO
ε ro χ
• ι Χ
χ ro φ
c ν Φ χ
— J ρ
> s Ο
c ro Φ
C O
0 1 t
tO 41
(0 · ι
c 4J O J Z
ID 4J C P
■pJ 3 X
Φ C O
• V P
X 4J • p ro
o en ro T
— i
o ro •p í C φ
4 J C τ ρ
c ε
c »· ρ ε
ι_
φ Ο > 4
—' Ο ιΟ < φ to Ο Ο co —ι Ο.
τ J Z Ο
Χ ο ο
υ
co «χ
«χ
ι ι— χ ω ω
■
c — ι
c co
1
υ
χ
o c 4J O
• ρ
u . 4J
Φ 3
4 · tO O
C tO
ro c L
4J CO
X
• v X o •p 4J
O
ra t Φ
O 4
■r CO
u. C o ra
i l _
J Z 4 J
o i_ < v
Φ X
O , τ ο
+ ra o o
• ρ Ρ
Í l_
41 4J • p T
c c
c c τ Ρ
φ Φ
> > .»
o o CO 10
t » ΙΑ
•P ' P
X X
• ■ ■ ·
ε ζ
X> X l ra ra —' —'
y »
ε w
en
i n
ζ
ν
ε
l i
or χ
ι ο υ
l i
or χ
■ ν
Χ • ρ
Ο
ro ιη
3
Ο
ι Ο
C
ο co
Ο J Z
α ο α. Φ yV. c
J Z ra c
X X
c ε ra Φ
ε c o c
τ O
41
3 c. —J Φ
O 41 CO —>
•t—
en 4
<c ■ v
X y *
Χ Φ ra X I I Ρ
w C
cn o «X —J
J Z J Z o
41 T y s
3 P H
PH C v y
O C • ρ Ρ
4· 4J
IO
4» O •p CO
Q — J ρ ra
o
Φ ε ί-o x o ra
CJ —J
Lice X
c o
• p -
4-J
ro 4-J ■ p -
O • ρ -
Ο
Φ ί α ο o
■ ν
φ
41
10 C
41 • ρ
C
CO
ra χ 0
Φ
> ο ε Φ
ι_
• ν
Χ Τ
Ο
10
Ο • ρ
Ι_
41 • ρ
C
c • ρ
Φ
> ·
ο co
co τ
Χ
σι
ο <
ω
ι ο υ
Ι ζ
φ
c ra t
X
ε Φ
ε
c ο
ι_
Φ 4>
ι
• ρ
■4
• V
CO
« t
XT
4J • ρ
3
LU
or χ
• ν
φ
Χ • ρ
Ι
Ο — ι
J Z Ο
co
ro χ
Ο
Φ
> Ο
ε Φ
ι_
• V
Χ • ρ
Ο
10
ο • ρ
Ι
Ο — ι
C
Ο
ι_ Φ L0
α «χ
+ J Z
•ui Ο ·ρ
τ 3 Ι
■pJ C
τ Ο
C τ 4J
C «0 •ρ +J
•r—
Φ Q .
> τ —J Ο
Ο Φ to C
υ
ω LiCO
Φ ν 41 1 4 1 10 Ο
■ρ ra ρ 4 ra
Ο 4J C O L.
■p Φ O 41
o o Φ ε c χ Φ ra c ε o Φ ι . Ο Φ ra ρο t 3 41 · ν
o O —J ν Zi OJ
O — i O Φ — ' ■
J Z 4j c o o 41 o τ tn
ro o o ε χ Φ C 41 O v O
o o c ι m Φ ε ρ χ ■ ο t V O J 4J
3 41 Χ • ν Ο Ο Χ Χ 10
χ —' ra ra ο ι •ρ —J t c
Ο Φ 41 · ν O O
ra >s χ c 4J ε Φ ο ε
ο ο ρ ra ra ■ ρ 4J . I k 4J ·ρ
c Φ 3 c s O Χ 3 —> O Φ —i o J o ε ι· J Z ra JD en E ra o ζ ra t
ι_ o — ' 4J Φ v 4J U V ' Ρ
Ο Φ X pH O
3 t 0 P H
C — ' τ C H E
•ρ X C τ 3
ο c · ι Φ —J ε Φ o c 4J Ο ε 4J X o ra ε ra ra Φ ε 4 J > v 4J J ε
•ρ sz Φ ρ o r a o 4J c ο ε
•ρ ρ τ O *
Ο Χ χ Ο Ο Φ φ Χ · ρ Φ C L ( 0 Ν L V Ρ
Ο C O t Χ • V φ φ ·ρ
φ Φ Χ φ 41 IM
> > ο > ro c —J — · c — ' 3 Φ
O O r O X in cn ε to ν o Φ in ιη ra to χ C c
• ρ T · Ρ " t— Ρ " Τ φ
x x x x ο ε 3 roro — ι
■ ■ · ν ν · · ρ Ο C i - Ο Χ 41
Χ Ο φ i i ·ρ
•ρ 4 4J Ο tn Ω. S3 4J 4 Χ Φ Γ 0 4 1
•ρ Ο
Χ ο
en
ο *
v¿
ν χ
_ 1
ι ο Ο υ U Ι
ι χ _ ι ω υ
ro ro 3 ro ο ι c j +j Ό J ro ro -ρ-

34
c co
co φ c
Χ Φ o O l_
0
ro o
ro c <x
c o
co φ Ω
χ φ
sz •ρ
41
C o υ
χ ro
ζ
o p H
I—
<x ζ
p H
ε _ι or «χ ω ζ ι— pH LU
LU Ω
ω _ι α. ε «χ co
L U
O
I— ζ
ω ε ρ
«χ
ω or ι
ω _ι ω 0 . ΓνΙ
ε ·· <χ co co
ω «χ
_ι
Ω
Ο Χ
ι ω ε
Η
Ο
σ> c
• ρ
4 1
c ro 3 OJ O r O 1
J c J * » C O
X • ρ
Ο
ro
o " P
t 41
• p
c
c • r
φ
> —J
o en en
• p
X
■ V
Oi C
■ r
J Z
O
4J
Φ
• V ί -
Ο 4 -J O 1 0 Φ ί
α • ι —
c o
• p -
4-J
ro T -
X ro i_ C-
• p -
c o c
4 - 1 3 Φ C
cn
*-
L i
e t < Ζ
4 -
o cn C
• r -
4-J
c ro 3 « -Ο ί ο I ι c
>^> t o
• v C o
• p-4-1 3
1
o CO
—J
u X
c • r -
CL) > I o co CO
■ p -
X
• v
cn C
• p -
J Z
o 4-1
Φ
• V
ί-Ο
4-1 O
ro Φ c
C - p -
to C tO O Φ
•r- C 4-1 >N 10 t -
■p X
X
ro o C 41
C
ρ Φ
4 J
c ra o ιι o 4-> α 3 ro Φ > C Φ
cn
i n I
r—
■
O
o
ro κ—
*4 ε O M
c n x c c
• p ro
4 J
c ro 3 < O τ ο 1
v ' e X a co
X Φ
4J
ro t_
X • p
— i
ra o
4 J
ra
4>
c Φ
ε Φ
u. 3 co
ro φ
ε
• ν Oi C
» ρ
X o 41
Φ
• V
ι Ο
4J
O
ro φ ι
Ο •r—
c o
•r—
4J
ro •r—
X
ro l_ t
• p
> s
C ί-Ο 4-1 l_ φ 4-1 ε 3 O φ φ C Oi
σι
<-
13
<X < Ζ P H
υ to
4 -
ο en c
•ψ—
4-1 C « -3 « -Ο ί ο I
v ' c
> 0 PH
• V C
co
l _
φ 'r—
l _ t _
ra o
x x ra • V
X • p -O
ra o
'r— L -
4 J • ρ
ε c
• p -
Φ > 1
o en co
• p -X
• s cn C Φ
• p - 4 J J Z ra O J Z 4-j α Φ — J
3 • ν to C O tO
•ρ - ra 4-1
ra JD • ρ - Ο Χ ra Φ c. > t - O
•ρ- ε I Φ
J ^ C
σι ο «~
m
< <χ ΟΙ
t o
co «χ «χ
ν — ι Ο Ν C φ
χ
ο 4-J
c •r—
■ M
O
ra t- χ
4-1 · Ρ -
X o Φ ra
ν o PH · Ρ -
X ί -Ο
Χ J Z Χ Ο ro to
o ν JZ
c α o
τ - χ 4-1 χ 3 ro
— ι Ο ν tO C
O Φ · ρ -C 4-1
•ρ - 3 ε —ι ο ο c tn
χ 1
+ υ Χ
ι_ ω ο Χ 4-1
C C · Ρ -
• ι —
4-J Φ Ο > ro
— · ί -Ο 4-1 tO χ to φ
• ρ - φ Χ C
cn Ο *—
ω
co < <£ Ι
Χ ω
co <χ «χ
χ c ra
—t
χ υ c •r- χ o Ο Τ Α Ο 4-»
•U 3 co C —■ 3 τ - Ο Ο to ί - 4-1 Ο ο ->
JZ ro υ Ω. c. χ tO 4-J Ο Χ Χ
JZ φ Χ ο οι ra ο ίο. ν y V V φ
J Z — ' 4-1 Ο 10
Χ 3 ι_ X —' ο ra ο ο
4 -J ra ν >
C Ο Φ Ο 4J
τ - C ν 4-J τ - φ 3 Χ
— ι 4-1 τ -Ο ο Χ to ra ο
C ί_ φ 4-J Φ c χ ο
■ρ φ
ε c ο * Φ
c c σι Ο ο ο
•Ρ U.
+ 4J Χ 3 >ν
ι ' JZ
m ο Ι « Ι Ό
Χ C Φ ra
T - C •Ρ- ν
Φ Χ C > ο ο
—-* ·Γ— "Γ" O 4-J to + 3 en —ι
■ρ PH O Χ χ en
en
i n
ε
to «χ «χ
Φ
4J
ra c
4 J
• ρ
c
to
ra
χ
α
Φ
> ο ε Φ C
■ ν
Χ • ρ
Ο
ro
Ο
• ρ
1
41
• ρ
C
c • Γ "
φ
> —J
ο to to
• ρ *
Χ
en
Ο O J
ι Ο
«""
Ω
C O
« Χ
«χ Ι
ζ
co «χ <χ
|_ φ φ 4
X en •ρ C
χ 10 O t
• ρ 4J
Χ ν
Φ Χ to ΡΦ ο
c ro ro οι o C · ΓΙΟ ι έ 3
sz sz o 4-J —> τ - 3 3 tn
C + O
• ρ - o ■Μ τ
10 u. 4J 4 J •r— ρ
α c • r *
o C φ ρ Ι
Ο Φ O 4J
ο (0 41
• V τ
X ο • ρ »ρ
Ο ο 10 φ
Ι
Ο Ο •r—
C φ 41 > C
, I O
C Ο τ CO 41
C CO 3 • r · Γ — i
X o Φ to
> ·· —1 — J
O " 5 C J
to X CO X
•p ro o X _ l 4J
y ^
—3
v y
cn
O
«—
—> V
C J
t o <X «X I
O C J
to «X «t
ι ω
o 41
C
o •p
41
O
3 X Φ l _
• V
φ 4J
ro c
41
• r
c
to
ra
χ c 0. o
τ
Ο) 4J
> 3 O —>
ε o Φ LO l_
Φ ■ v X
X T • p Ι
Ο X
(0 yV. J Z
o O • ρ Ι
Ι O 41 X
•r~
c ra ζ
c T " >N
Q Φ > Φ
—J Χ
Ο τ 10 L
cn Χ τ yV
Χ JZ
σ>
Ο O J
Ι Ο
«
t o ν
Ω
to
<c <χ χ
ι ζ
t o e t «Χ ρ
ω
χ 'r—
ο 1 0
ο • ρ
ι_ ra 4 J
ι_
ra +J
Χ χ
ra
■ ■
_ j
χ
ro ι
• V
Χ • ρ
Ο
1 0
Ο ■ ρ
U .
4J
»ρ
C ^> 00
C 00 τ OJ
Φ ε > or
— ι
O U. C0 ο C0 4
■ι—
χ en
i n
cn OJ
^ i n ■· ι _ l
OJ vv
_ l v
vr
C O
«X «X
ι ω
C O
< t «X
ι ω
φ χ ■ι—
Χ
O • f *
χ
φ co Φ C
ra οι c ra ε
J Z
■ M
• p
3
C O
• p
4J
ro 41
■i—
α • ρ
Ο
Φ C
a. o o
• V
X • ρ
Ο
ra
O
•r—
í
4J ■ ρ *
C
c i p
Φ
> — i
o to en
•t—
X
υ
C O
<x <X ρ
Ι LU
o · υ

- 35 -
c co
ί-Ο
co φ !_ 3
Χ Φ ο Ο
10 ο
10 c
<χ φ
SZ
c ο
Ι Ο co φ
Ω
Χ φ 3 C C O υ
Χ ra
ζ
ο Ρ Η Ι— «χ ζ Ρ Η
ε _ ) or «χ ω Ζ ρ -ΡΗ ω LU Ω
ω _ ι 0 .
ε « t o
L U O
h-Ζ ω ε ρ -«X ω or ρ
ω _ ι ω Ο- Μ ε ι-ι «χ co CO
m <χ _ ι
Ω Ο χ ι -ω ε
Ου p H
χ • ρ -Ο «0
ο • ρ -
ί -
Ο) 4-J ι_ (0
4 - 1
Χ Χ ra " V
Χ • ρ -
Ο «0
Ο • ρ -
ί -4-J
• ρ -
α c ■ ρ "
φ
> — J
ο to CO
■ ρ
Χ
ο ι
ι η
ι—ι
ου Ρ Η
Ο
υ ο
φ χ ■ ρ
Ι
Ο — J
J Z
o
C l
ra χ Ο
Φ
> Ο
ε Φ C
■ V
Χ • ρ
Ο
(0
Ο • ρ
1
4J
• ρ
α c
• ρ
φ
> — J
Ο to to
• ρ
χ
σ ι
ο *
ι η
Ο
υ Ω
Ι
_ ι υ
υ ω 0
oxide,
|S
en
I
acid
I
•ρ cn o Χ Ο τ
ι Χ Φ Χ C ιη >ν Ο Φ JZ ο C en ra χ ra σ ι χ c ra ν
ra ro ε ν Φ
Φ C JZ Μ 3 4J ro ο τ Ι τ
3 O JZ O 4J
c ro o > χ
τ φ χ 41 ra
ra ν 4J χ ν τ ρ c Ο ο Ο vy
•ρ 10 τ 0 0 O 4J ΡΗ
Φ ο 3 ε L. ρ — ι
Ο ι Ο Ο Ο 3 en 4J o J Z α
Ο —J τ • V —J CJ
Χ 3 Χ 41 •ρ en ο ο ο ra ra + 4J ι_
41
Ο Ο t Χ
τ τ Φ φ Ι Ι 4
41 41 en ν τ τ α φ
c c ro c C p
C C 41 41 τ τ φ
V O
Φ φ Φ L. > > Χ Φ
—J — J τ 3
O O X O" co en O en en c x
τ τ Φ C χ χ ο ro
Oi Λ
i n >v t o 1 t o
C O J Ζ o
v w ε χ ι or
ι χ ω _ ι Ι Ο
Ο υ υ
υ ω 0 .
(add Be |S
in
I
Φ Χ Φ
yV. Μ
x ro O M l_ τ
ution,
|
t into
|
ol and
|
— i O J Z
o ra o LO t O
41 — '
—J x ra υ Φ
X ο Χ Φ —> y V T
SZ O Φ
Φ c
m o JZ Φ 4J > ■r** — '
3 O CO
C tO
O τ •p Χ 4J
ro · ν 4 J " ν
τ i n
o · •ρ O
o Φ χ ι O O O O O 4J
• v ro X T T c o O
ro ε ε
o ro • p
t + 41
•p «X
C ΗΩ
c ω • r *
+ Φ > Φ
—J 41
Ο ro to u. en 41
■r · ρ
X c
cn
i n
vr
t > s
o c 41 V p
L > t Φ yV.
φ J Z —I
4 4J O
CO Φ O c ro —■ v C > s C
41 O Φ
O 4 V C 4
φ O 3 X O X ■t- en
Χ τ Φ
O 4J ι O ro Φ 4J 4J
O C Φ τ O
c ro Φ 4J Oi o v o ro χ t t T
X 4J O
> . χ ro J Z Φ
o " O * T
X χ c ra τ 3
O JZ v ro o
X —J
•p o 3 CJ T " CO
ro L
3 χ O JZ χ
τ o ra l_ — i
3 3 v JZ to Ι Ο φ
— ι X 4J
3 X ra to ra 3
Φ
c o Ι
Ο
3
—* 4 — ι
yV.
C φ
sz
a.
υ ω LiCO
Φ
CO
s: 4J ■ p
3
C
O •τ—
4J
10 41
• p
α ■ ρ
Ο
Φ ί -Ο
o o
■ ν
<t Ι -
Ω
ω
χ χ
ra • ν
Χ ■ι—
Ο
(0
Ο
•ί— U .
4-1 ■ ρ
C
c τ
Φ
> — ι
Ο to to
• ρ
Χ
ο 0 0
O J
ε or v y
ρ
• V
Χ • ρ
Ο
(0
Ο • ρ
C
3 J Z
Ο — J
3 to
Ι
ο • ρ
ι_ 41
τ
α c
•r—
Φ
41
ra 4J
• ρ
o •ρΟ
Φ ί -Ο
φ > — ι Ο ω co
• ρ -χ
• ν φ
Χ • ι—
χ
ο ι_ Χ >ν
JZ
οι ο f—
y - \ rv. co OJ
χ c ra
Φ J Z 4-J
C ■ p
X
Φ — i
α e o o
Φ C
't—
4J
Φ
O
c φ 3
οι C
co
ε ι Ο
4
• V
C O
• p
4J
3 — i
O
en
— J
υ X
o 4J
t _
Φ
4
co C
ra c
4J
vr
m p H
ε
o 4J
C • p
4J
O
ra l_
41
X
Φ
• V
ra Φ
c 3
O • p
J Z
4J
4
O
Φ O
C φ to φ ι Ο

- 36
o H H ρ -«χ
_ι or <χ ω
Ο ro « - χ οι ι α c Φ ro
c o * -3 O J r o O r- r-0 I I 1 Φ Φ
> θ > - ί
α» c
c 3 τ -Ο ro o τ -Ι ι
V a PH
cn c
c 3 * -o ro O τ -Ι I
X a PH
cn c
c « -3 OJ 0 ί ο I 1 Φ or
X or χ
CO < «X
CO «X «X
CO < «X
to «X <r
CO «X «X
CO
φ l _ 3
X Φ o O
ro o
ro c >x Φ
sz
c O •p-4-J O •P-ί-Ο en Φ Ω
ω _1 α. ε <χ co Liei
o ro υ
• t— ι_
c c
φ > o co co
• ν en C
o 4-1 φ
ί -Ο
4-1 O ra Φ ι_
c o
ra χ ro l_
C O i_
4-J 3 Φ C
Φ 4-J ro ί-Ο o ra > Φ
Φ
> o to en
• ν en c υ
4-1 Φ
o ra Φ
C o
χ ra ι_ l_ co
• p - tO φ c c
O vV C c
■pJ X
3 Φ O C 41
C φ E Φ u, 3 CO yN
ra χ Φ ρε L.
• ν ra σι ε c
•r Χ JZ 0 Ο
•UI yV.
Φ Χ
• ν C y v O
CO Τ
Ι 4 J
3 O O c
sz O CO
fv. X r ra
ί- ι-Ο o
4-1 4 -O
ra c Φ o c o
•ρ- φ l_
C ί-Ο o
T - o 4-J v y 10 Φ
X o. ra ε c ra t_ co
T -χ
C τ -Ο —■ i- o
41 CO
3
Φ C C O
c Φ
l _
ra o
χ χ ra
o ro
o •t—
t_ 41 •r—
C
c
φ
> o to to
en c Φ
■ I 41
j z ro o sz
■pJ o
Φ —> 3
• v to C O tO
• ρ ro
4J
ro S3 •ρ ΟΧ
ro Φ
ι > t- O
τ ε ι Φ
> o f-
c O
X 3 C —' ro o
to
ε en
en <x X ra X
—■ X ra
X cn Φ
•ρ «χ c o ra ro J Z t
4J X I
o ρ ε •r 3 Φ c ε o c —· o Χ Τ
Ο 41 t_ ra t Φ 4J Φ O T 4J
α — i + τ Τ
Ο 4 . . QJ
C .V ε Oy*
O Φ X U 41 ra T
—i JZ vy · O
c cn X o o •ρ ρ J Z
O 4J O
ra 3 o —· a
O O yV
•p tO J Z
c O
c o
o φ ί-Ο o o
ra c
to ra
x Ο-
Φ > O ε Φ I -
C Ο
•ρ- U C Χ Φ
χ C Ο τ -
■ r 41 Ι
Ο
m ι 1 > Φ JZ
—ι 4 Ο ο to to c c to ra co
•ρ t X 41 +
. ν ro χ t . τ 4J υ —ι ro τ
4 ο
ι Φ c C 4J ro •ρ t
c χ ε
c Φ
τ ε φ . ν > to
—> <χ Ο en J Z
en 4J • ρ τ X 3
Φ Χ
Ο
C O
ra +
χ ra
o
ra o
•τ—
U.
4 J
• ρ
α
c
Φ
> o to co
φ 4J
ro
co ro
x
Ο
Φ
O
■ ν
Χ •r—
υ ro o
•τ—
C
41
•τ—
C
C
φ
> o co LO
Φ
4J
ro J Z
o
3 en
co ro
Χ
Ο
Φ > Ο ε Φ Ι
Ο
ro ο
• ι —
C
4J
• ι —
C
c
φ
> ο tn co
co —J 3 u o χ ι
Ο O JZ 4 J Ο
CO
c O Φ χ
4 Ο co Ο c ο ro >, u. JZ
■ν O φ
φ ο α
Ο, Φ -> co 3 φ co Ι
Ο
(Ο
en (0
•ρ
χ O. en
«χ Φ
> SZ Ο 41
ε ΙΦ 3 ί
α •ν Ο
Χ τ-• ρ - 4-J υ ro ro 4-1 o
τ ι .
4-1 •ι—
C
C
Φ >
o φ ί-Ω O o
Ο 4-1 to 3 Χ en —J τ -
•ρ- O o Χ en ro
φ Χ
Χ
c o o
Χ φ
ro C -
w ro X
Ο-
Φ > o ε Φ ι- C
O • v τ -
X 4-J τ - -ρ-Ο χ ro χ ro o
τ - Q) t . χ c χ
yV. C JZ
τ - O t -
Φ o > X o co to
T - yV X S3
ro
χ Φ 3 C
C O u
O J
m Φ
χ ra
ω o. M <x co co
Oi σι σι
ο
en σι ι η
• ι η ο ι σι
ο οι
ι η
ο OJ ι
ο en
ιη
σι Ο OJ ι
ο
m to
ν Ω
«Χ «Χ
«χ «χ
<χ «χ ΟΙ
t o
or χ
ι ο u
Ι LU ο or u χ ι ζ
LO «χ «χ
to <χ «χ ι ζ
co «Χ >χ ι CO
ι co Ο <t u «χ ι to
co «χ

37
ιΟ
co φ c Ζ3
Χ Φ ο Ο c Ο
ΙΟ
ο
ra c «χ
c o
Ι
Ο
to Φ Ω
Χ Φ 3 α
τ
41
C
ο υ
OJ ■
ιη
Φ
χ ro
ζ
ο ΡΗ
ρ
<Χ
Ζ pH
ε _ι or <χ ω ζ ι— PH LU LU Ω
ω _ι 0
ε < co
LU
O
ρ
Ζ ω ε ι— <χ ω or ρ
ω _ι ω 0 rvi ε »ι ^ to co
m <χ _ 1
Ω Ο
Χ
ι ω ε
co <χ <χ ρ
ω
χ • ρ
Ο
ra Ο
■ι—
1
4 J • ρ
α
α •ρ
φ
> — ι
Ο LO
to • ρ
Χ
en ο
*— ι ι η
■
O J
N¿ V
Χ
CO
«χ «χ ι ω
co «Χ <χ ι ω
ν χ • ρ
Ο
10
Ο • Ρ
CO ί-<Χ 4-1
■r"
J Z c 41
τ C
3 τ
C φ O >
• t— — J
4J O
ra co 4J co Τ · ρ
o x • ρ
Ο · ν
Φ ro u. χ
o o o O 41
ra Φ
U LL
X J Z ra 4J
—ι ' P
3 • V
X C τ O O Γ
ΙΟ 4J
10
O 41 τ ·ρ
t O
4J T
■p O
C Φ ί
α o τ - O o
Φ > ■■
—ι O NZ in en s¡
τ ro
Χ —■
V v
CJ
CO
«X
< I ι Ο ω υ
—ι
e_J
Χ
C • p
Φ
> — 1
O CO
CO
•t—
X
• v C O
•r—
4J
ra 4J • p
α • ρ
Ο
Φ ί
α o o 4-1
ro Φ o Φ ί-
Ο-υ 1-Η
Χ • ρ -
Ο 10
Ο •τ— C (0 4-J 1 -10 4-1
Χ Χ ra • ν
Χ • ρ -
Ο 10
ο ■ ρ
1
4J ■ ρ
C
c τ
φ
> — J
ο ιη co
» · Γ
χ
οι
ι η
ΡΗ
Ο
υ ΡΗ
Ο
υ 1Η
Φ 4J
ra sz o
— J
3 co
co
ra χ Ο
Φ
> Ο
ε Φ
ι_
• V
Χ • ρ
Ο
(0
Ο •r—
U.
4J • ρ
C
α • Γ "
φ
> — J
Ο en en
• ρ
Χ
χ
Ο
υ ΡΗ
Ι
co
Ο
υ Ω
Φ 4J
ra sz O
— t
3 to
to
ro χ 0
Φ
> ο ε Φ
ι_
■V
Χ • ρ
Ο
10
ο • ρ
ι_ 41 •τ—
C
c •ρ
φ
> — ι
ο co co
• t—
Χ
Oi
in
to
Ο
υ Ω Ι
co
ο ω LiCO
—■
υ Χ C
Φ ΙΟ σι
4J Ο C. U. CO
ι Χ Χ Φ Ss J
4 J Z 4 Ο
en Ο JZ C + o ra φ o t i t ι
λ-> υ 3 ro Χ 4 J
• V Χ — ·
Φ C τ > s
41 τ Ε J Z
(0 41 J Z φ (0 Φ
Ο > —■ —J C Χ
3 Ο τ C co en ro
en φ CO ·ρ > yx
ro χ — J Φ
O C Χ · ν CO Φ
o. en en Ν «Χ τ c
Φ Χ Φ
> SZ S3 Ο 4J · ν
Ε τ Φ J Z
Φ 3 4J 4J
c ro τ α ι 3
■ ν Ο Ο χ τ ο χ τ 4J 10 Φ
ο ra > J Z ra 41 Φ co
τ ra
ο Ο ·ν 3 •Ρ ρ C VV
t O O
41 Φ τ Χ •ρ C 4J τ
α O 3 o o —■ ra
c o o τ CO o
■ V T
Φ C Φ t
> o x o — · ρ ρ J Z
o 41 χ α co 3 O en to —t c o
τ O Φ J Z
X en o o
O i
o Γ
Ι
OJ
v
v <X _ l
ι _ι
o o CJ CJ
I to
υ ω Ο Ι Ο
χ φ
J Z
to ■ ν ra
■ ν U 3 φ (Ο v y
Χ Φ
•ρ α χ C. Φ ρ
Ο υ. ο —■ 10
J Z ·ν ο χ ο
τ · ρ
ιιι υ c ra ra o
J Z
Χ o o 0 τ CO
t- o Φ o J Z > —J α O SZ
ε o + Φ ιι . Φ ί
α m ■ ν χ
χ C • ρ τ 4—
Ο Ο 10 Φ
> Φ Ο —J Ι ι
τ Ο 3 Ο u. tO 4J Χ
Ο to χ Ο — ι ·ρ · ρ υ
J Z χ ε —· ο ra c ·ν ra Φ to — ι
ο « χ α >Ν τ J Z
+ J = Μ 41 Φ Φ
Ο τ >
ρ 3 —> Χ ι O C
4J c tn ra • ρ O en
C τ τ y ^ 41 Χ Φ
era c ■p + J . V Φ
τ Φ Ν
Φ α 41 c > τ ra Φ
ν υ ι_ χ Ο Φ Ο co ι_ α J Z C0 α 10 41
•ρ ο > ■<-
Χ ο φ 3
σι
ο
χ
ι Ο _1 u Ο Ι u
_ ι u

- 38 -
ί-Ο
to Φ C 3
Χ Φ Ο Ο ι-Ο.
ra ο
ro C
<χ
φ
ο ΡΗ Η-"Χ Ζ ΡΗ ε
_ι or <χ ω ζ ι -ι—ι ω lu Ω
C ο • ρ -
4-1
α • ρ -Ι Ο LO Φ Ω
ω _ι α_ ε < t o
υ -ο
yv Χ φ 3 C
C O υ
v y
Χ ro
O. rvi
<X t o co
cn c
C OJ 3 O o OJ O I to
<r «X
CO «X
co «x <C t-•χ ω
to
<x
φ
c 10 o
X X y-< ra Φ
o ■ v C
Χ Φ τ l _
o Φ ra 4
L_
O Φ • ρ 41
t C 4J T
T 1
C X θ
α τ Ι
Ο Φ 4
> — J 4 1
O o cn Φ
en t_ p l _
X O o
• V v v
O í
α Φ τ 41
J Z ra O J Z ■pj α
Φ —> 3
• ν to
C O CO
• ρ ra
4 J
ra χ τ Ο
Χ ra Φ
ι > c O
■< ε I φ
χ • ρ
Ο
ra O
■ Γ
Ι
41
• ι —
C
C • ρ "
φ
> — ι
O CO
en •τ—
φ 41
ro ι_ 41
• ρ
C
CO
IO
χ 0
Φ
> o E Φ l_
v X • ι —
O
ro O
•t—
l _
41
•r—
C
C T
Φ
> — i
O en en
• p
X • ρ
Ο
ro O
·.— 1
41
τ
r
c • p
Φ
> I O CO
en τ
vr
ω
o 4J
C
O
ro L
41
X
Φ
u X
X X ro
o ro
Φ
> o in en
Ο
υ P H
Φ +J
ro t_
41
'T—
C
co
ro X 0
Φ
> o ε Φ
!_ • V
X • ι —
O
ro O
• p
L
41
■i—
C
c •r—
Φ
> — i
O in to
• r
X
Ου Ω
Φ 4 V
ro C
41
•t—
c
to
ro X Ο
Φ
> o E Φ L
• V
X • i —
O
ro o
• r
t_
41
• i —
C
C • ι
Ο.
> — » O to
CO
• p
X
Q
ε •X
4
o
—' Φ
> ev —'
Ι
Ο)
α α 3
L10
Ο 4>
C
o ■ p
41
IU +J
• ι
Ο
X
φ
l_
Φ
0 )
ra — J
v
φ
E
ro — i
H
o 41
C • ί
α o
• p -
4-J
3 — i
o en
X ro ί α to
X C ra L_ Φ C c 3
X
<L· J Z 4-1
C φ φ 3
4-1 Φ
Χ
Χ φ
4 - 1 10 1 -Φ α Φ en
4 - 1
α Φ ί_ C 3 Ο
υ Ω
4 -
ο 4-1 C φ Ε Φ ι_ 3 en <0 Φ Ε
• ν y V Ο Ι L-Φ α Φ
1 m
■ρ
4J
α Φ
4 J
Ο
α
Φ
> •τ—
41
ro οι Φ
α
ro 41
ro χ — ι
φ
SZ
Χ
α ro Φ Ε
ra — ι
4
Φ
SZ
4J
C • Ι
χ φ
ο
ro _ _ j y s
α χ Φ
χ
ο 1 _
41
Ο
Φ 1
Φ
C
ra
C
3
Ο Ι
Ο Ι
II l _
φ
C
ι_ 3
X ^ y
LU
Llt O
0 0
Φ
C • t
E
ra X —J o U J Z Χ ί-
Ο J Z 4-1 4-1
• i — c- 3 Φ
4 - C en O C τ -ΙΟ 4-J c ra
4-1 X Φ
· · . __l Φ Q Χ E τ - O X o O c · ν Φ L.
α Φ χ C '-· φ φ Ο Ι —' Ο >Ν
ι- α χ ο > Ν L. J Z α
ο + C0
• ι — χ τ - Ο Ο 4-1 ra c o
τ - 4-1 4-J O Φ ra o c ra -pj
X C Φ
■ p
• V
Φ C
> O
— > ... O 41 to 3 en — i
τ O X en
cn
o
cn
o
en
o cn
i n
cn
O
cn
O cn
oo
Ω v
υ ε χ
"Χ <x Ο ΙΟ
«χ ■χ
to co <χ «χ <χ «χ
t o «χ <χ Ο
υ ι
χ
Ου Ω co
13 Ο
ο υ ι
χ

39
c ivi ■■
ι -Ο
4 -
tn Φ ί-3
Χ Φ ο Ο L-
0 -
— ι (0 ο
• ι— 4-J y V
—ι ΙΟ C «χ
φ J Z 4 - 1
4 -Ο
C ο
'ι— 4-1
α ' Ρ
Ι Ο ιη Φ
Ω
y - \
Χ φ 3 C
't—
4-J C o
C J V V
O J
i n
Φ — J S3 ra ι—
_ι «χ ζ P H L U
ω _ l 0 . ε < to
L U O
I — ζ ω ε ι— «χ ω or ρ
ω _ ι 0-ε < to
00 <χ _ι
Ω Ο ZC ι -ω ε
ζ
ο ι—ι ι— «C Ζ Ρ Η
ε □τ ω ι -ω Ω
ω I V I
Ρ Η
co
4 -
Ο
σι c
- ρ -
4-J
α 3
ο ο
yvL.
Χ - ρ -
υ
ra
ο - ρ -
1 _
4 - 1
- ρ -
c
c • Γ "
φ
> — ι
ο tn co
- ρ -
χ
• ν O i
c • ρ -
J Z
ο 4-1
Φ
• V
ί-Ο
4-1 Ο
ra φ ί -
Ο " Γ "
c ο
• Ρ "
4-J 10
• ρ -
χ <ο 1 -C
• ρ -
C ο ι_
4-J 3 Φ C
οι
*—
l i
et «Χ ζ
σο ι C
Μ
Χ c ra
i n νΟ I C
lv i
4 -O
O i C
τ -4-1 C 3 m O O o I
> - - tvl
X • ρ -
Ο
ra o
• p -
l_ 4-1
• i — C
c -r" Φ
> — i
O to to
• ρ -
χ
• ν en c
• Ρ "
J Z O
4-1 Φ
• V ί-Ο
4-J O
ra Φ l _
C • p -
c O
• p -
4-J
ro 't—
X ro l_
• ρ -
α O e_
4-1 3 Φ C
Oi
*—
cn
4 -
o cn C
• r -4-1 C 3 O o
>L-■ v C O
• r
41
3
O CO
— i
u X
C ■Γ™
φ
> — i
o CO
co • i—
X
• v
cn c
• p
J Z
u 41
Φ
• V
Ι
Ο 4J
O
ra Φ
c
C • ρ
α o
• r■ M
(Ό ■ r -
X
ra t_
L· • p -
C
o [_
4-J
zz φ
c
cn r—
1 t —
• O
O
m O I C
rvi
CO
CO
αϊ C y V
l_ X
o 4-1
Φ 4-1
ra ί-Ο α ra > Φ
4 -
o en c
• p -
4-1 C 3 O o 1
> r .
X Φ
4 J
ro l_ X ■ p -
1
ra o
4-J
ro
4-1
c φ
ε Φ
s_ 3 en
ra φ
ε
• ν O i
C τ -
J Z
o 4-1
Φ
■ V
ι -Ο
4-J
O
ro Φ ί
α " Γ "
c o
•r~ ■ M
ίΌ • ι -χ 10 ι_ ι_
• ρ -
C ο ι_
4-J 3 Φ
■ C
Oi
r—
ca
«χ «χ ζ
Ρ Η
u co
ε ο ο
Ι C
Μ
Χ
c ro
i n
>ο I C
lv i
y V
C
41
Φ
ε o Φ
οι
4
ο
O i
C • ι—
4J
C 3 O o
vL
• V
C rv!
l_
φ • p
t_
t
ro o
X X ro
V
X • ρ
Ο
ro
o ■ p
l_
41
•r—
c
c 't—
φ
> — ι
O co LO
■ ρ
Χ
■ ν Oi
c • p
J Z
O
4J
Φ
■ V
C O
• p
41
ro • i —
X
ro i_
c ■i—
1 S o
Oi
o —
m
<r « X
Ο
Ι
t o
rv.
o 1 3
u
y >
Φ O
C Φ l_
Φ 4 l_ Φ
41
C • p
• p
00
X
c ro
Oi «X
ί-Ο
4 -
4-J O
Φ L-l_ O o
^ y
Φ 4-1
ra J Z
α — J 3 en
in ra
X 0 -
Φ > O ε Φ l_
t o < <x
y - »
Φ X • ρ -ί -
Ο 3
—ι 4 -
ε 3
• ρ -
c o E E ra + ■ ·
—3
S3
ra 1
v y
X ■ι—
o
ra
O
T "
t
4J
• p
C
C •t—
Φ
> 1
O to to
T
X
cn
i n
ι *—
v v j or
v v lH Ζ
CO
< «X
C O
«X
<
Φ 4J
ro l_
41
• ρ
α
CO
ra
X 0
Φ
> o ε Φ
ι_
V
X • ρ
Ο
ro
υ ■ r
!_ 4 J
• ρ
α
c • p
Φ
> 1
o en co
• p
X
Oi
o O J
1
o r—
v Ω ρ
V v
u ε
C O
< "X
| Ζ
C O
«X < t
—i
u X
o 41
c Φ
4
to C ra C
41
■ V
Φ 4J
ra J Z
α — « 3 en
en
ra
X Ο
Φ
> O E Φ
c_
• V
X • ρ
Ο
ro
O
•t—
c 41
• ρ
α
C •t—
Φ
> 1
o CO
CO
•t—
X
y \
—i
v y
Oi
o Γ —
ζ v
—3
co
<r «t 1
t o
c o
• p
4J
3 — ι
O en
C O
«X «X
ι ω
X • ρ
Ο
ro
O
• p
L
41
• p
C
c ■ p
Φ
> — i
O cn CO
• p
X
Oi
o r—
X
co
<c <x ι ω
Ου P H
Φ 4J
ro c
41
• p
c
to
ro
X 0
Φ
> O
ε Φ
ί-
" V Χ • ρ -
Ο
ro O
• ρ -
ι_ 4-1
• ρ -
C
α • Γ "
φ > — ι ο en en
• ρ -
Χ
σι ο τ
ω
ου Ρ Η Ι
ζ
Ου Ω
Φ 4-J
ra ι_
4-1 • ρ -
α to 10
χ Ο-
Φ > ο ε Φ ί .
■ V
Χ • ρ
Ο
ro
ο • ρ
L
4>
• ρ
C
C τ
Φ
> — ι
Ο en co
τ
χ
en
ο τ—
CO
ου Ω
| Ζ
Ο
υ Ω
— J
C J
Χ
Ο 4J
ι_ φ
4
ιη C (0 u.
4J
■ V
φ 41
( 0
J Z
α — J
3 10
co
ro
Χ 0
Φ
> Ο
ε Φ
ι_
■ V
Χ τ
Ο
ro
ο • ρ "
Ι 4 J
ρ
α
c • r
Φ c > Ο
1 · Γ —
Ο 41 to 3 en —J
τ o χ to
en
i n I M
o
Ου Ω
I co

- 40
6. PRESENTATION OF THE REPORTED RESULTS
6.1 Tabulated Data
The analytical results for each element in each RM are presented in the
appendix (tables A.1a to A.36a).
Two types of tables wi11 be found :
a) Tables containing'predominantly measured"values - here the results not
accepted for certification are listed separately; the reasons for
rejecting these data are discussed in chapter 7. Some laboratories
have produced on request two series of results; however, whenever a
laboratory proposed additional results after the mean value was known,
these results have not been accepted.
b) Tables containing a majority of upper limits - during the course of the
campaign, one or two laboratories were asked to produce estimates by
SSMS (spark source mass spectrometry). These estimates were rounded
off to one significant digit even where more than one digit is printed.
6.2 Omitted Data
For one laboratory, a large fraction of the data was discarded as, with the
methods used, poor performance was observed i.e. large standard deviations as
well as large deviations from the other laboratories.
Some other results have been omitted from this report because they were ■
obviously erroneous (not seldom by an order of magnitude), most probably as a
consequence of contamination problems in the laboratory.

41
7. TECHNICAL DISCUSSION OF THE RESULTS
The materials were initially investigated with classical chemical methods and
with nuclear activation methods. In fact RM 286 and 287 had impurity contents
much lower than expected as was already mentioned before. A posteriori the
use of AAS and colorimetry therefore appears quite inappropriate. Before the
results were made known to the participants spine of them were requested to
continue the work with more appropriate methodology. The investigation was
not conducted in a thorough manner as we were discouraged to certify low
contents of no interest to industry, at least in the present state of the art.
After the additional determinations were made, all the results were discussed
at a meeting of experts from the participating laboratories.
The results of detailed technical examination are given here. Concentrations
and uncertainties shown are the mean value of the means of the data sets and
its 95 % confidence interval, respectively. The statistical calculations and
tests are explained in Chapter 8.
Ag in RM 286
The data are presented in table A.1a.
At these low concentration levels, the risks for contamination were believed
to be too high with cupellation to be sure of the results; in fact, lab Τ has
checked its results using ETAAS and found 10 15 ng/g. The CUPresults are
therefore not used.
The ETAAS result from lab I is an outlier and was rejected by the meeting of
the participants.
Considering the very low concentration level, a rather consistent picture is
obtained from the remaining data. The calculated mean value from the
remaining data with its uncertainty, 15 +/ 6 ng/g, is certified.
As in RM 286
The data are presented in table A.2a.
Only the nuclear activation techniques are believed to be reliable at the
concentration level found here.
Three of the five nuclear·activât ion results, including one set of actually
measured values, show the concentration to be below 2 ng/g.
Bi in RM 286
The data are presented in table A.3a.
The results are very consistent. A bismuth content of 21.5 +/ 0.5 yg/g is
calculated and certified.

- 42 -
Cd in RM 286
The data are presented in table A.4a.
Lab F withdrew its NAA results, although it could not explain why the mean value was so high; the variance was felt to be rather large as well.
The S-PAA result from lab Β is an outlier; it was withdrawn and the lab reported later on a somewhat lower value.
The S-AAS result from lab Ν is an outlier with respect to the other S-AAS and N-AAS results and was also rejected by the meeting of the participants.
From the remaining data, 125 +/- 12 ng/g is calculated and certified.
Cu in RM 286
The data are presented in table A.5a.
The lab G representative explained that, in their whole series of NAA measurements, insufficient attention had been paid to the duration of the etching step in their analysis procedure. They have found, later on, that too long etching times lead to redeposition in the case of noble metals (including copper). All G NAA results for Cu and Ag are suspected to be too high and have been withdrawn.
The EX-COL result from lab I is lower than that of three other labs using the same method. Lab I itself also found a higher value using ETAAS. Their'EX-COL result is rejected.
On the basis of the remaining results, 1.49 +/- 0.04 ug/g is calculated and certi fi ed.
Ni in RM 286
The data are presented in table A.6a.
The colorimetrie value of lab Κ was calculated from very low absorb^nces and was withdrawn in favour of their ETAAS result.
The S-AAS result of lab Ν was rejected as the method used was believed to be inappropriate for this analysis.
The ETAAS result from lab I is a significant outlier and was rejected by the meeting of the participants.
The S-PAA result of lab Β is still high and was withdrawn; the laboratory reported later a somewhat lower value.
A nickel content of 41 +/- 6 nj/g is calculated and certified from the accepted data.

- 43 -
Sb in RM 286
The data are presented in table A.7a.
The content is known to be well below 1 jjg/g, as otherwise the surface of the samples would have turned blue by oxidation of the trace of antimony at the surface.
Lab L withdrew its result because the method with rhodamine Β is susceptible to Tl interference. They did not determine the Tl content, which is certainly not negligible.
Colorimetry was considered to be inappropriate for the low contents. Lab Κ explained in particular that their colorimetrie determination was based on absorbance readings of some 0.02, which is below the quantification limit. The colorimetrie results will not be used.
The original data contained three low (labs C,D,M) and one high (lab E) data sets obtained with AAS techniques. The experts from the participating laboratories suspected an influence of the separation technique used and then lab D performed three series of control analyses using three different separation techniques. The results did not show significant differences between N-, S- and PS- separations, but they did show poor precision of each one of the techniques. The values obtained are very near the detection limit.
At the low concentrations where even the AAS techniques fail, only the nuclear activation techniques and ETAAS are considered reliable enough for a certification; a content of 99 +/- 21 ng/g was calculated from the data obtained with these methods and 0.10 +/- 0.02 ig/g is certified.
Se in RM 286
The data are presented in table A.8a.
A method using ion exchange as separation technique yielded spurious results on all occasions and its results have been omitted. From the data given in table A.8a, the SSMS estimates and the upper limits set by the NAA, C0-XRF and EX-ETAAS methods of labs F,N and C are sufficient evidence for an Se content below 50 ng/g.
Sn in RM 286
The data are presented in-table A.9a.
From the two sets of measured values obtained with methods considered as dependable and from the upper limits sets by the first NAA measurements of lab 0, the EX-AAS results of lab M and the C0-ETAAS results of lab C, the Sn content is concluded to be below 50 ng/g, although it can be as low as 2 ng/g.
Te in RM 286
The data are presented in table A.10a.
The high NAA result of lab F was withdrawn because the trace of uranium in the sample may have caused interference.

- 44 -
The result of lab N was withdrawn because the method used was adapted, with
very little experience, from a method applicable to a zinc matrix and because
it is in conflict with two XRF upper limits.
The colorimetrie results were rejected because the limit of detection of the
method is estimated at 0.5 yglg.
No value can be certified as a consequence of the order of magnitude spread in
the data, even in the nuclear activation data, but there is ample evidence for
an upper limit of 100 ng/g.
Tl in RM 286
The data are presented in table A.11a.
Although the results are very satisfactory, the statistical treatment is,
however, not straightforward. The mean value of the 9 laboratories is 2.50
ug/g but the distribution of the means is not normal. This is due to the fact
that too many values are concentrated at the same point and only a few
laboratories reported values that are far away from that point.
There was no clear technical indication that any data should be discarded.
However, a Youden plot constructed for the results in RM 286 and 288 indicated
that laboratory H proposed a high result in both cases and would therefore
have a slight positive bias. In fact laboratory H had previously submitted
even higher results and subsequently replaced them by the values given in this
report.
When the calculations are done without laboratory H, the distribution is
almost normal, i.e. the normality hypothesis is rejected at the 0.05 level of
significance but is not rejected at the 0.01 Level. The mean value of the 8
remaining means is 2.47 /jg/g and the 95 % confidence interval is +/- 0.07
■ug/g. It is, however, more logical to certify the value at 2.5 +/- 0.1 jjg/g.
Zn in RM 286
The data are presented in table A.12a.
For contents as low as this, the experts from the participating laboratories
felt that the most reliable method is NAA, the results of which are sound
evidence for an upper limit of 60 ng/g.
Allowance is made for 3 more or less consistent sets of N-AAS results with
readings in the 50 to 90 ng/g range, although two of these sets are below the
estimated quantification limit of 100 ng/g.
An upper limit of 100 ng/g is certified.

- 45 -
Ag in RM 287
The data are presented i n t a b l e A.13a.
The NAA r e s u l t of lab G was withdrawn (see Cu in RM 286) .
The AAS r e s u l t of lab N was wi thdrawn i n favour of t h e i r more recent CUP-AAS r e s u l t .
The N-ICP r e s u l t of lab E was w i thd rawn, as the lab r e c e n t l y found 15.7 + / -0.3 μglg w i t h ICP w i thou t N-separa t ion .
A concen t ra t i on of 15.2 + / - 0.2 / j g /g i s c a l c u l a t e d and c e r t i f i e d from the accepted da ta .
As i n RM 287
The data are presented in table A.14a.
Just as for As in RM 286, only the nuclear activation techniques are believed to be dependable at the concentration level found here and a colorimetrie result has been discarded.
Three of the five nuclear activation results, including one set of actually measured values, show the concentration to be below 3 ng/g.
Bi in RM 287
The data are presented in table A.15a.
The results from the participating laboratories are very consistent.
A value of 67.3 +/- 1.2^ig/g is calculated and certified.
Cd in RM 287
The data are presented in table A.16a.
The S-AAS result of lab N was rejected because of its unacceptable variance.
The NAA result of lab F was withdrawn as they suspected an unidentified interference problem.
From the other data, a value of 0.36 +/- 0.03 ng/g is calculated and certified.
Cu in RM 287
The data are presented in table A.17a.
The NAA result of lab G was withdrawn for the same reason already explained for Cu in RM 286. From the other data, 0.98 +/- 0.05 |ig/g is calculated and certified.

46 -
Ni in RM 287
The data are presented in table A.18a.
The colorimetrie value from lab K was below the practical detection limit and has been withdrawn in favour of their ETAAS value.
The ETAAS value from lab I is in conflict with another ETAAS measurement, backed by an NAA determination and with several upper limits. It was therefore rejected.
From the remaining data, 24 +/- 12 ng is calculated. The large confidence interval is acceptable at this very low concentration level and the calculated values are used for certification.
Sb in RM 287
The data are presented in table A.19a.
All colorimetrie data have been rejected, as lab L withdrew its value because of Tl interference and the other results were below the quantification limits.
From the remaining data, 40 +/- 15 ng/g is calculated. The data spread is very large and the NAA determinations alone show only 28 +/- 16 ng/g, but at this very low concentration level, such an uncertainty is acceptable and 40 +/- 15 ng/g is certified.
Se in RM 287
The data are presented in table A.20a.
The NAA determinations by lab F, the low readings of the AAS techniques, the upper limit set by the CO-XRF method of lab N and the SSMS estimates indicate a value of less than 50 ng/g.
Sn in RM 287
The data are presented in table A.21a.
Laboratory K has done the analyses by two methods, colorimetry and ETAAS and withdrew the colorimetrie result since the practical detection limit was too high for the very low content. The two remaining actual determinations and two of the reported upper limits indicated a Sn content of less than 50 ng/g.
Te in RM 287
The data are presented in table A.22a.
As with Te in RM 286, the NAA result of lab F was withdrawn since it was suspected of interference and the colorimetrie results were rejected since they were below the practical detection limit. The lab Τ result is also too close to the detection limit.

47
There is plenty of evidence that the Te content is below 200 ng/g, but the limit cannot be set much lower because of the high S-PAA results of lab B. However, the two other sets of measured values and 6 of the upper limits would indicate the concentration to be below 100 ng/g.
Tl in RM 287
The data are presented in table A.23a.
The results are satisfactory and the content of 0.73 +/- 0.04 yg/g is certi fied.
Zn in RM 287
The data are presented in table A.24a.
As with Zn in RM 286, the participants considered NAA to be the most reliable method at these low concentration levels. This method shows that the Zn content is below 100 ng/g and the high AAS results from labs J, N and Τ are rejected. The results from lab J and especially from lab Ν would have been rejected anyhow because of their unacceptable variance.
Two NAA results, three AAS results, one DCP and one ICP result are sufficient evidence to certify a Zn content below 100 ng/g.

48
Ag in RM 288
The data are presented in table A.25a.
The NAA result of lab G was withdrawn (see Cu in RM 286); the lab Β result is
clearly an outlier and was also withdrawn. (This lab later reported a
somewhat higher value.)
From the remaining data, 30.5 +/ 0.5 jjg/g is calculated and certified.
As in RM 288
The data are presented in table A.26a.
55.7 +/ 1.6 jug/g is calculated and certified.
Bi in RM 288
The data are presented in table A.27a.
The value from lab R was withdrawn as the method was found to produce
inaccurate results on all occasions.
Some apparent differences between laboratories have been investigated, as the
high precision that could be obtained with this relatively high level of
bismuth allows a further demonstration of the good homogeneity.
Values of 226 resp. 224 jjg/g were reported by labs A and C. Their samples
were reanalysed by lab K and results of about 211212 Aig/g were obtained. Lab
A later used another method and found 220 jug/g.
Lab E found 184, 192 and 196 jug/g using 3 different methods on the same
sample. A double control was performed :
The sample was sent to lab C, where 219 /ug/g was found.
Three new samples were sent to lab E, where 213 +/ 4 ¿ig/g was found.
It was concluded :
That all samples were of the same composition and that each laboratory
tends to find about its same value on all samples.
That the three low results from lab E must be in error and are therefore
rejected.
From the accepted data, a value of 215.8 +/ 2.4jjg/g is calculated and
certified.

- 49 -
Cd in RM 288
The data are presented in table A.28a.
Lab N has done 2 series of AAS measurements; the means 31.7 and 37.0jug/g were obtained. Such a difference cannot be accepted and the data are rejected.
The value 33.3 +/- 0.9 jug/g is calculated and certified from the other data.
Cu in RM 288
The data are presented in table A.29a.
The NAA result from lab G was withdrawn as with Cu in RM 286.
From the other data, the value 19.3 +/- 0.4 jug/g is calculated and certified.
Ni in RM 288
The data are presented in table A.30a.
Two outlying results have been rejected by the meeting of participants :
the low N-ICP value from lab E;
the high (and unprecise) AAS value from lab N.
From the remaining data, the value 4.57 +/- 0.11 A-ig/g is calculated and certi fi ed.
Sb in RM 288
The data are presented in table A.31a.
The colorimetrie result of lab K was withdrawn and only their ETAAS value was kept. The S-PAA result of lab Β is a significant outlier and was withdrawn. (This lab later reported a somewhat higher value.)
From the accepted data, a value 32.5 +/- 0.9 >ug/g is calculated and certified.
Se in RM 288
The data are presented in table A.32a.
The series of upper limits and the SSMS estimates suggest a very low concentration, but a high NAA result has been reported and this method has been considered as dependable throughout this report.
All available data back a certified upper limit of 200 ng/g.

- 50 -
Sn in RM 288
The data are presented in table A.33a.
Both the mean value and the variance of the SCINAA results from lab G are regrettably affected by one or two low individual measured data. The spread of values in the NAA results from lab 0 is even greater, however, and the mean value and confidence interval are much better there only because of the very large number of measurements. The laboratories believed this to be due to their very low sample sizes (always below 1 g and often as low as 0.1 g). Lab L, also using very small samples (125 mg), does not show excellent performance either. These effects should not introduce any error on average and none of these results were rejected.
The CO-AAS value of lab J is an outlier and was rejected by the meeting of the participants.
A Sn content of 30.6 +/- 1.5 jjg/g is certified.
Te in RM 288
The data are presented in table A.34a.
Lab F obtained rather poor NAA data when the counting was done on solutions; amongst other problems, redeposition of Te or I after the etching step and volatilisation of I were suspected. Much better data were obtained by measuring on a solid sample; the other data were withdrawn.
A tellurium content of 32.8 +/- 1.3 ug/g is calculated and certified.
Tl in RM 288
The data are presented in table A.35a.
With all results (9 laboratories) the mean value is 2.28 jug/g and the confidence interval 0.08 jug/g. The distribution in this case is normal. If for the same reason as explained for CRM 286, laboratory H is left aside, the mean value is 2.26 with a confidence interval of +/- 0.08 jjg/g.
The Tl content is certified as 2.3 +/- 0.1 /jg/g.
Zn in RM 288
The data are presented in table A.36a.
Of the three reported values that fell outside the range of most results, the one from lab J was withdrawn by the laboratory. The others were kept as no technical reasons were found for their elimination. The mean value 8.20 +/-0.27 /ug/g found without the lab F and Τ values is nearly the same as the 8.20 +/- 0.40 ug/g found when they are included.
The zinc content of 8.2 +/- 0.4 jug/g is certified.

- 51 -
8. CALCULATIONS
8.1 Statistical analysis
Statistical analysis of the data included :
a) Calculation of means, standard deviations and 95 % confidence limits :
Let ρ be the number of data sets
n. the number of data in the i th set
χ., the j th value in the i th set. i) The mean value found by a laboratory is
r. = y ; n t x . . /n . 1 -A 1 ] ι i=i n
The data obtained by the same method and the same laboratory have nowhere been considered as independent estimates of the true concentration; the best estimate of the true concentration is in all cases believed to be the mean value of the means of the data sets. The value used for certification is thus :
M = y ~ P x"./p
The uncertainty interval is taken as the two-sided 95 % confidence interval of this mean value
M +/- (-P~1 . S/l/p 0.975 v
where S is the standard deviation of the means of data sets :
S = = \/TP (M-x.)2/(p-1) V i = 1 η
and t p is the value of the Student's distribution for p-1 degrees 0.975
of freedom and a significance level of 0.05.
b) Normality tests ': - Lilliefors version of the Kolmogorov-Smirnov test - acceptability tests of skewness anc curtosis of
the normalised frequency distribution
Outlier tests : - Nalimov t-test - Dixon test (in some cases)
Except for the Dixon test, these tests were applied wherever the number of data is sufficient, on each data set, on the collection of all individual measurements and on the collection of means of data sets.

- 52 -
c) Oneway analysis of variance : - calculation of the within-laboratories and between-laboratories standard deviations : Let N be the total number of individual measurements : N = J~ n.
i = 1 and X their mean value : X = y ¿2 ^ X--/N
j=1 ilue : X = H P £ ; n i x--.
i = 1 i = 1 1 ]
The within-labs and between-labs standard deviations are then defined, respectively, as :
S = \ ¡V9 Y~ n ( x " . - x . . ) 2 / (N -p ) and » y%i V i i i ]
SB =
- Snedecor F-test (to assess what was the major source of variance).
d) Bartlett's test (to verify the homogeneity of the variances) and Cochran's test (to detect outlying variances).
After the technical discussion (cf. Chapter 7 ) , no more data were removed on statistical grounds and no outliers will be reported here. In cases where all individual measurements can be considered as independent,S must be small compared to S ; S u is then called the repeatability and the reproducibility is then defined as S = y S ¿ + Sjf , which is about equal to the standard deviation of the collection of all individual data. Differences between laboratories were the major source of variance in nearly all cases, however; the data from a given set can therefore not be treated as independent estimates of the true concentration.
8.2 Graphical Presentation of Accepted Results For each certified element in each reference material, a diagram showing the mean values and the 95 % confidence intervals of all accepted data sets is presented in the appendix (tables A.1b to A.36b). The mean value ΊΓ. of each data set is shown as * and the error bars (dashed lines) show their two-sided 95 % confidence interval :
τ . +/- tn~l- s. / fir. where h is the value of the Student's distribution for n.-1 degrees
0.975 Ί
of freedom and a significance level of 0.05 and s. is the standard deviation :

53 -
s =
The dotted lines show M, the mean value of the means of all data sets on a diagram.
8.3 Certified values and upper limits - data summary
In a third series of tables in the appendix (table A.1c to A.36c), a few summary data for each of the certifications are given.
For each case where a certain value is certified, these data are :
the number of data sets (p) and of individual data (N)
the result of the Kolmogorov-Smirnov test on the distribution of the means of data sets : Normal-About normal-not normal respectively mean that the hypothesis, that the set means are normally distributed, is acceptable at the 5 % level -is acceptable at the 1 % but not at the 5 % level - is not acceptable at the 1 % level of risk (the risk being to reject this hypothesis when it is true).
the mean value M, the within-labs and between-labs standard deviations S and SR, the standard deviation of the distribution of the means S and the 95 % confidence interval of M. In several cases, the standard deviation was apparently zero for some laboratories and simplifications had to be made so that only approximative S and S. values were obtained.
Β W
In cases where an upper limit is certified instead of a concentration value, some of these statistical data are of little use, but the number of reported upper limits, which are actually supporting the certified upper limit, is shown instead.

- 54 -
9. INSTRUCTIONS FOR USE
The reference materials can be used both as calibrants or for the verification of analytical methods.
The uncertainty reported for each certified value is valid for calibration purposes only. If the reference materials are used for checking the performance of an analytical procedure, the user can refer to the results of this certification campaign in so far as he can ascertain that his repeatability is compatible with that of the certification analysis. Let n, x" and s be the number of determinations done using the method to be tested, the mean value of the results and their standard deviation, respectively, then the standard error of the mean of these results is s/\jn and should be smaller than the standard deviation S reported in Chapter 8.
The method will then be considered to perform well if the mean value χ found with it lies within the limits :
M-2S < "x < M + 2S
where M is the certified mean value.

55 -
APPENDIX : TABLES OF RESULTS; DIAGRAMS; STATISTICAL DATA
This appendix gives, in most cases, three tables for each element in each material :
"a" tables for each of the 36 combinations of one RM and one element, these tables give all reported results (used as well as rejected) except for a few cases as mentioned in paragraph 6.2
"b" tables for each case where a certain value is certified, a diagram showing the 95 % confidence interval of each accepted data set is given (cf. paragraph 8.2)
"c" tables for each case where a certain value or an upper limit is certified, a few summary data are listed as discussed in paragraph 8.3. For the elements for which no concentration value or maximum is certified, the same type of data are available and are given here for information :
i CRM
I 286
1 286
286 I 286
I 287
I 287
1 287
No. ELEMENT
As Se Sn Te As Se Te
Accepte measur
NUMBER d sets of ed values
1 0 2 4 1 2 3
OF : | Used upper | limits
I 2
I 5
I 3
I 4
I 2
I 3
| 7
INDK UPPEF
< 2
< 50
< 50
<100
< 3
< 50
<200
ATIVE | ! LIMIT |
ng/g I ng/g I ng/g I ng/g I ng/g I ng/g
ng/g I

56
TABLE A.1a RM286 S I L V E R , NG/G
Β SPAA
F NAA
0 NAA
K ETAAS
REPLICATES
1 8 . 0 0 0 1 9 . 0 0 0 1 9 . 0 0 0 1 0 . 0 0 0 2 1 . 0 0 0
1 8 . 0 0 0
1 7 . 0 0 0 1 9 . 0 0 0 1 7 . 0 0 0
1 3 . 3 0 0 1 3 . 2 0 0 1 4 . 6 0 0 1 2 . 9 0 0 l a . I C O
1 3 . 1 0 0 1 2 . 7 0 0 1 3 . 3 0 0 1 2 . 7 0 0 1 3 . 9 0 0
9 . 0 0 0 1 0 . 0 0 0 1 0 . 0 0 0
MEAN
1 8 . 1 6 6 7
1 7 . 6 6 6 7
1 3 . 3 6 0 0
9 . 6 6 6 7
"! 1
S T . C E V . ι 1
|
2 . 3 1 7
1 . 1 5 5
i
0 . 6 2 9
0 . 5 7 7
Rejected values and upper l i m i t s
Lab
G
G
M
H
C
D
H
S
U
Method
NAA
SCINAA
CUPGRAV
CUPAAS
EXAAS
NAAS
+ EXAAS
ETAAS
NDCP
DCP
Limit
<20
¿30
<10
¿20
<25
<25
' 5 0
ν 10
<500
Lab Method Mean + / s t .dev .
M
H
Ν
Ν
Τ
Ι
CUPAAS
CUPETAAS
CUPAAS
CUPAAS
CUPAAS
ETAAS
29.3 + / 0.6
20 + / 3
17 + / 6
25.3 + / 0.6 34 + / 4
43.7 + / 0.6

57
TABLE Α.1b RM286 SILVER, NG/G
o • +
ru
o o
• ■*■
α 'M
O
α =0
o o
• ■»·
^
o o
o o AJ
O
o
o o o
· · ■ · . · . .
I I
*
I
X φ
l_
Φ
o
oí
oí
c
<3
I
«ï
a. ι
CO
«ï
<
LX

- 58 -
Table Α.1c
Summary of Statistical Data
CRM No. : 286 Element : Ag
Number of accepted sets of results ρ = 4 Number of accepted individual results Ν = 22
Mean of data set (*) means M = 14.7 ng/g
Standard deviation of the distribution of the means S = 4.0 ng/g
Normality of the distribution of the means Normal
Within labs st.dev. S = 1.4 ng/g w
Between labs st.dev. SD = 3.4 ng/g D
95 % confidence interval of the mean of means : 14.7 +/- 6.4 ng/g
Certified value : 15 +/- 6 ng/g
(*) The data in one set were obtained with the same method in the same laboratory.

59
Table A.2a
Arsenic in RM 286 all values in ng/g
Measured values
Lab Method Replicates Mean St.dev.
0 NAA 1.9 1.5 1.5 1.9
1.8 1.4 1.7 0.2
Used upper limits
Lab Method Limit
G NAA 4.1
G SCINAA <0.7
Unused upper limits
Lab
Β
F
C
H
Τ
D
E
M
S
I
L
Method
SPAA
NAA
NEXCOL
SEXCOL
SEXCOL
NHAAS
NHAAS
NHAAS
NHAAS
HAAS
ETAAS
L i m i t
<100
<20
<50
<200
< 250
<100
<50
<50
¿100
ν 1000
<200
Estimates by SSMS
10 and

60
TABLE Α.3a RM286 BISMUTH, UG/G
Β SPAA
Ü EXDCP
E NICP
C EXAAS
E NAAS
Ν NAAS
S NAAS
0 (N)AAS
I HAAS
N AAS
Η ETAAS
A COCOL
K COCCL
Τ COCOL
Η COL
Η COL
I COL
L fcXCCL
REFLICATE
20.700
21.COO
2C.70C
19.100
23.000
20.200
20.000
22.000
22.600
21.000
2C.200
21.COQ
22.COO
21.COC
21.COC
22.500
21.000
25.COC
21.800
20.300
22.100
20.000
23.000
19.900
20.000
22.OCO
21.700
22.100
21.900
21.000
22.OCO
22.OCO
21.000
21.800
23.000
20.OCO
21.SCO
19.600
16.200
19.¿JOO
22.000
20.000
20.000
22.000
24.600
21.900
22.900
20.000
24.COO
22.000
22.000
22.000
22.000
23.000
21.9U0
■ t
19.900 20.200,
22.700 22.500 '
19.«00
¿2.COO
MEAN
20.3167
20.8100
19.5C00
22.6667
19.8750
20.0000
¿2.COCO
22.9667
21.6667
21.6667
20.6667
22.500Ü
21.6667
21.3333
22.1000
22.0CCÛ
¿2.6667
21.8333
ST.OEV.
0.462
2.709
0.456
0.577
0.340
O.OCO
0.000
1.484
0.5e6
1.365
0.577
1.000
0.577
0.577
0.361
1.000
2.517
0.O58

61
TABLE A . 3 b « Μ 2 8 6 B I S M U T H , JJG/G
2 1 . 5 + / 0 . 5 pg/g c e r t i f i e d
θ S PAA
U E X D C P
E N I C F
C E X A A S
E N AAS
M NAAS
S NAAS
D ( N ) A A S
I HAAS
N AAS
H ETAAS
A COCOL
Κ COCCL
Τ COCOL
Η COL
Η COL
I COL
L E X C O U
ÜO 18.00 20.00
* ,
*
22.00 24.00 26.00 28.00
. ""
t *

- 62 -
Table Α.3c
Summary of Statistical Data
CRM No. : 286 Element : Bi
Number of accepted sets of results ρ = 18 Number of accepted individual results Ν = 61
Mean of data set (*) means M = 21.5 jug/g
Standard deviation of the distribution of the means S = 1.0 ug/g
Normality of the distribution of the means Normal
Within labs st.dev. S = 1.2 yg/g
Between labs st.dev. S = 0.8 )jg/g
95 % confidence interval of the mean of means : 21.5 +/- 0.5 |ig/g
(this value is certified)
(*) The data in one set were obtained with the same method in the same laboratory.

63
TABLE A.4a RM286 CADMIUM, pG/G
; G NAA
0 NAA
C NAAS
D NAAS
M NAAS
Τ NAAS
J SAAS
Η ETAAS
I ETAAS
: E NICP
1
¡ S NDCP
U SDCP
REPLICATE;
0.1200
0.1100
0.1100
O.11O0
0.0800
0.1200
0.1600
0.140C
0.1600
0.1460
0.110C
0.1 IOC
0.140C
0.1100
0.1000
0.1100
0.1100
C.1200
C.1200
0.15CO
0.1300
C.1500
0.143U
0.1100
C.1200
0.1500
0.1000
0.0900
0.1200
0.1100
0.1100
0.1500
0.1400
0.15Û0
0.1440
o.iooo
U.110C
0.1400
0.1300
0.120C 0.1100
0.1300 0.1200
MEAN
C. 11500
0.10714
0.11333
0.10333
0.11667
0.15333
0.13667
0.15333
0.14133
0.10667
0.11333
0.1360U
ST.DEV.
0 . 013
0.010
■ 0.006
0.021
O.0C6
U.006
0.006
Ü.006
0.002
0.006
0.0C6
0.011
Rejected values :' Lab Method Mean + / s t .dev.
Β
F
Ν
SPAA
NAA
SAAS
0.35 + / 0.01
0.27 + / 0.04
0.18 + / 0.10

64 -
TABLE Α.4b KM286 - CADMIUM, UG/G
0.04C
G NAA
0 NAA
C N-AAS
0 N-AAS
M N-AAS
Τ N-AAS
J S-AAS
h ETAAS
I ETAAS
E N-ICF
S N-UCP
U S-DCF
0.060 0.080 O.IOU 0.120 0.140 0.160
0.125 + / - 0.012 yg/g c e r t i f i e d

- 65 -
Table Α.4c
Summary of Statistical Data
CRM No. : 286 Element : Cd
Number of accepted sets of results ρ = 12 Number of accepted individual results Ν = 43
Mean of data set (*) means M = 125 ng/g
Standard deviation of the distribution of the means S = 19 ng/g
Normality of the distribution of the means About normal
Within labs st.dev. S = 10 ng/g w
Between labs st.dev. SD = 17 ng/g D
95 % confidence interval of the mean of means : 125 +/- 12 ng/g
(this value is certified)
(*) The data in one set were obtained with the same method in the same laboratory.

- 66 -
TABLE Α.5a RM 286 - COPPER, >JG/G
REPLICATES MEAN S T . D E V .
F NAA
G SCINAA
C EX-AAS
D N-AAS
M N-AAS
Ν S-AAS
Η ETAAS
I ETAAS
E N- ICP
S N-DCP
U S-DCP
A S-COL
H EX-CCL
L EX-COL
Τ EX-COL
H COL
1 .390C 1 .40C0 1 . 7 2 0 0 1 . 6 1 0 0
1 .700C 1 . 3 0 0 0 1 . 8 0 0 0 1 . 2 0 0 0
1 . 5 0 0 0 1 . 5 0 0 0 1 . 5 0 0 0
1 . 4 3 0 0 1 . 4 6 0 0 1 .440C
1 . 4 0 0 0 1 . 3 0 0 0 1 . 4 0 0 0
1.4C0C 1 . 6 0 0 0 1 . 5 0 0 0
1.5C0C 1 . 4 0 0 0 1 . 4 0 0 0
1 . 6 3 0 0 1 . 5 8 0 0 1 . 6 2 0 0
1 . 3 4 0 0 1 . 3 6 0 0 1 .310C
1 . 5 0 0 0 1 . 5 5 0 0 1 . 4 5 0 0
1 . 4 9 0 0 1 .50C0 1 .490C
1 . 6 0 0 0 1 . 6 0 0 0 1.6G0C 1 . 6 0 0 0
1 . 4 6 0 0 1 . 4 6 0 0 1 . 5 8 0 0
1 . 4 5 0 0 1 . 4 6 0 0 1 . 4 2 0 0
1 . 6 0 0 0 1 . 7 0 0 0 1 . 6 5 0 0
1 .500C 1 . 4 4 0 0
1 . 5 3 0 0 0
1 . 5 0 0 0 0
1 . 5 0 0 0 0
1 . 4 4 3 3 3
1 . 3 6 6 6 7
1 . 5 0 0 0 0
1 . 4 3 3 3 3
1 . 6 1 0 0 0
1 . 3 3 6 6 7
1 . 5 0 0 0 0
1 . 4 9 3 3 3
1 . 6 0 0 0 0
1 . 5 0 0 0 0
1 . 4 4 3 3 3
1 . 6 5 0 0 0
1.47U0C
0 . 1 6 2
0 . 2 9 4
0 . 0 0 0
0 . 0 1 5
0 . 0 5 8
0 . 1 0 0
0 . 0 5 8
0 . 0 2 6
0 . 0 2 5
0 . 0 5 0
0 . 0 0 6
O.OCO
0 . C 6 9
0 . 0 2 1
0 . 0 5 0
0 . 0 4 2
Rejected va lues :
Lab Method Mean va lue + / - s t . d e v .
NAA EX-COL
2.06 + / - 0.13 1.23 + / - 0.06

67
TABLE Α . 5 b R M
286 COPPER, jJG/G
1 . 0 0 0 1 . 1 0 0 1 . 2 0 0 1 . 3 0 0 1 . 4 0 0 1 . 5 0 0 1 . 6 0 0 1 . 7 0 0 1 . 8 0 0 1 . 9 0 0 ♦...... + + . . · . . . + .... . . 4 . . . . . . + .·.··· + . . . . · . + . ..... + . . . . · . + ...
F NAA
G SCINAA
C E X A A S
O NAAS
M NAAS
Ν SAAS
Η ETAAS
I ETAAS
E N1CP
S NOCP
U SDCF
A SC OL
Η E X C O L
L E X C O L
Τ E X C O L
Η COL
1.49 + / 0.04 >jg/g c e r t i f i e d

- 68 -
Table Α.5c
Summary of Statistical Data
CRM No. : 286 Element : Cu
Number of accepted sets of results ρ = 16 Number of accepted individual results Ν = 50
Mean of data set (*) means M = 1.49 >jg/g
Standard deviation of the distribution of the means S = 0.08 yg/g
Normality of the distribution of the means Normal
Within labs st.dev. S = 0.11 ug/g w
Between labs st.dev. S = 0.05 iug/g
95 % confidence interval of the mean of means : 1.49 +/- 0.04 yg/g
(this value is certified)
(*) The data in one set were obtained with the same method in the same laboratory.

- 69 -
TABLE A.6a RM286 - NICKEL, NG/G
0 NAA
C N-AAS
D N-AAS
M N-AAS
S N-AAS
Κ ETAAS
4 5 . 0 0 0 45.COO
6 0 . 0 0 0 4 0 . 0 0 0
60.COO 4 0 . 0 0 0
4 0 . 0 0 0 4 0 . 0 0 0
2 9 . 0 0 0 3 4 . 0 0 0
4 1 . 0 0 0 4 0 . 0 0 0
3 7 . 0 0 0 43.COO 4 1 . 0 0 0
4 0 . 0 0 0
3 0 . 0 0 0
6 0 . 0 0 0
3 4 . 0 0 0
2 9 . 0 0 0
MEAN
4 2 . 2 0 0 0
4 6 . 6 6 6 7
4 3 . 3 3 3 3
4 6 . 6 6 6 7
3 2 . 3 3 3 3
3 6 . 6 6 6 7
, _ S T . D E V .
3 . 3 4 7
1 1 . 5 4 7
1 5 . 2 7 5
1 1 . 5 4 7
2 . 6 8 7
6 . 6 5 8
Rejected values and upper l imits
Lab Method Mean + / - st.dev.
105 + / - 8 600 + / - 0 227 + / - 15 367 + / - 58
Limit
340 100
50 70
500
Β Ν I Κ
Lab
F H E U Τ
S-PAA S-AAS ETAAS EX-COL
Method
NAA ETAAS N-ICP
'S-DCP N-AAS

70
TABLE A.ob RM286 NICKEL, NG/G
o o
• 4>
O
ON
o σ
• ■«■
o CO
O
σ
o fv.
• 4
σ
o α
• ♦ o in
o α
o
o CJ
O
o o
α ru
o o
¿J
o o
I
• 4C
I » I
X
φ
φ o
oí
oí
c MO
I
< < t
ζ
CO
<a <t
I
Z .
CO < I
< 1
ζ
LO
< I
« t
1
ζ
tO
< t
« t
1
ζ
CO
< <. ¡—
LUI

71
Table Α.6c
Summary of Statistical Data
CRM No. : 286 Element : Ni
Number of accepted sets of results ρ = 6 Number of accepted individual results Ν = 20
Mean of data set (*) means M = 41 ng/g
Standard deviation of the distribution of the means S = 6 ng/g
Normality of the distribution of the means Normal
Within labs st.dev. S = 9 ng/g w a M
Between labs st.dev. SB = 2 ng/g
95 % confidence interval of the mean of means 41 +/- 6 ng/g
(this value is certified)
(*) The data in one set were obtained with the same method in the same laboratory.
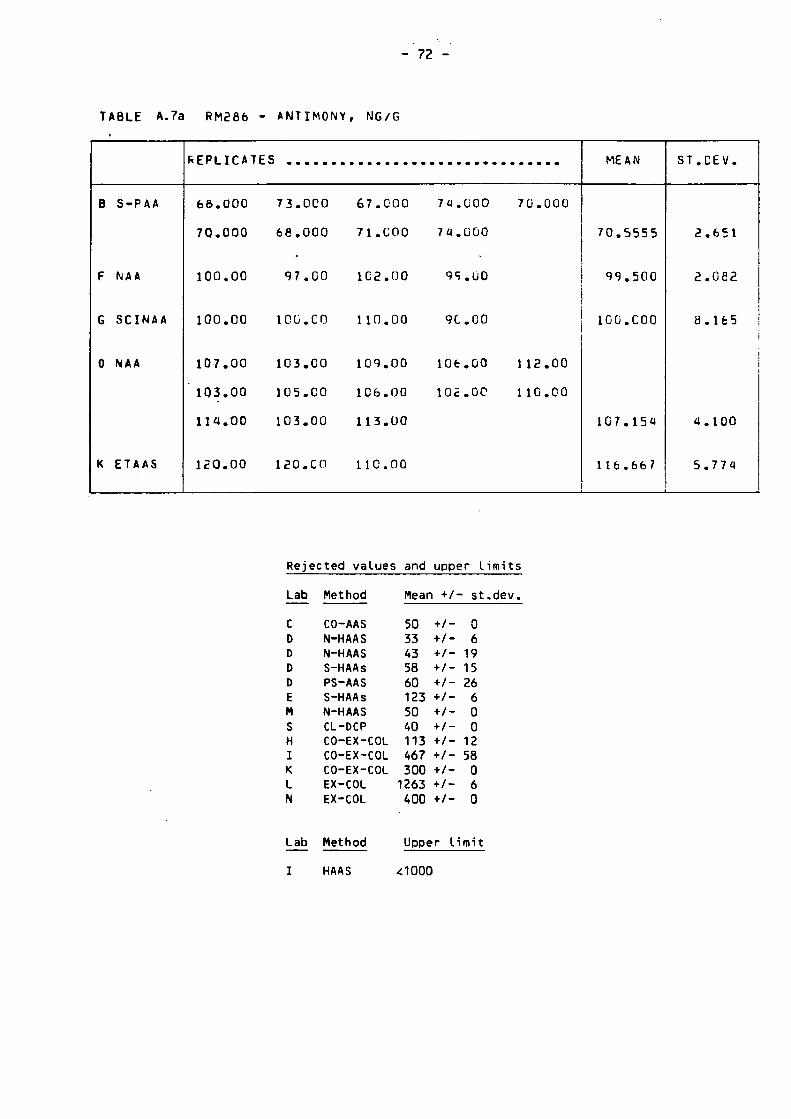
- 72 -
TABLE Α.7a RM286 - ANTIMONY, NG/G
Β S-PAA
F NAA
G SCINAA
0 NAA
Κ ETAAS
REPLICATES
6 8 . 0 0 0 7 3 . 0 0 0 6 7 . 0 0 0 7 4 . 0 0 0 7 0 . 0 0 0
7 0 . 0 0 0 6 8 . 0 0 0 71.COO 7 4 . 0 0 0
1 0 0 . 0 0 9 7 . 0 0 1 C 2 . 0 0 9 9 . 0 0
1 0 0 . 0 0 ICO.CO 1 1 0 . 0 0 9 C . 0 0
1 0 7 . 0 0 1 0 3 . 0 0 1 0 9 . 0 0 1 0 6 . 0 0 1 1 2 . 0 0
1 0 3 . 0 0 1 0 5 . 0 0 1 0 6 . 0 0 102 .OC 1 1 0 . 0 0
1 1 4 . 0 0 1 0 3 . 0 0 1 1 3 . 0 0
1 2 0 . 0 0 120 .CO 1 1 0 . 0 0
MEAN
7 0 . 5 5 5 5
9 9 . 5 0 0
100.COO
1 0 7 . 1 5 4
1 1 6 . 6 6 7
S T . D E V .
2 . 6 5 1
2 . 0 8 2
8 . 1 6 5
4 . 1 0 0
5 . 7 7 4
Rejected values and upper l i m i t s
Lab
C D D D D E M S H I Κ L N
Lab
I
Method
CO-AAS N-HAAS N-HAAS S-HAAs PS-AAS S-HAAs N-HAAS CL-OCP CO-EX-COL CO-EX-COL CO-EX-COL EX-COL EX-COL
Method
HAAS
Mean +/-
50 33 43 58 60 123 50 40 113 467 300
1263 400
+ / -+/ -+ / -+ / -+ / -+/ -+/-+ / -+/ -+ / -+/ -+ / -+/ -
- s t .dev .
0 6
19 15 26
6 0 0
12 58
0 6 0
Upper l i m i t
41000

73
TABLE Α.7b RM2Ö6 ANTIMONY, NG/G
o vT
o
o
o ru
o
o
o o
o o
o CT
o o
• ♦ α CO
O O
• 4>
o
o o
I
I I « I
X φ
¡_ φ o
OÍ \ σι
r\i O
■ O
I
~v
ΊΟ
I I
* I I
o LO
ΟΙ
to < 2
Ζ
u CO
to
LG O

- 74 -
Table Α.7c
Summary of Statistical Data
CRM No. : 286 Element : Sb
Number of accepted sets of results ρ = 5 Number of accepted individual results Ν = 33
Mean of data set (*) means M = 99 ng/g
Standard deviation of the distribution of the means S = 17 ng/g
Normality of the distribution of the means Normal
Within labs st.dev. S = 4 ng/g w
Between labs st.dev. SD = 18 ng/g a
95 % confidence interval of the mean of means : 99 +/- 21 ng/g
Certified value : 0.10 +/- 0.02 yg/g
(*) The data in one set were obtained with the same method in the same laboratory.

75
Table A.8a
Selenium in RM 286 all values in ng/g
Estimates by SSMS :
20 and < 50
Used upper limits
F
Ν
C
D
S
NAA
COXRF
EXETAAS
NHAAS
NHAAS
¿ 10
< 50
< 1
< 50
<· 50
Unused Upper Limits
Lab
G
E
M
H
Κ
Method
SCINAA
NCOXRF
COXRF
CLCEXCOL
CLCEXC0L
Limit
< 70
¿. 150
C 100
< 100
o oo

76
Table A.9a
Tin in RM 286 all values in ng/g
Measured values
Lab Method Replicates Mean St.dev
0 NAA 1.7 17
(single value obtained under extreme experimental conditions)
Κ ETAAS 30; 34; 47 37 9
Estimates by SSMS :
30 and < 50
Used upper limits
Lab Method Limit
0 NAA < 50
M EXAAS <£ 10
C C0ETAAS ¿ 50
Unused Upper Limits
Lab Method Limit
Β
F
G
D
E
S
J
L
H C0EXC0L < 500
Κ C0EXC0L< 1000
Τ C0EXC0L <1 500
I ICP < 2000
SPAA
NAA
SCINAA
NHAAS
EXAAS
NHAAS C0AAS
ETAAS
C
<t
C
c
c
<
c
<
103
7.103
4.103
100
500
100 200
200

- 77 -
Table A.10a
Tellurium in RM 286 - all values in ng/g
Accepted Measured values
Lab Method
0 NAA Β N-PAA and
S-PAA C CO-ETAAS Κ CO-ETAAS
Estimates by SSMS :
c 50 and 6
Used Upper Limits
Lab Method
D N-HAAS S N-HAAS E N-CO-XRF M CO-XRF
Replicates
7.3; 8.8; 6.7; 7.4 64; 64; 64; 59; 60; 61 80; 70; 80 25; 30; 25
Limit
ν 100 ν 100 < 50 ν 100
Mean
7.6 62
77 27
St.dev
0.9 2
6 3
Unused upper limits and Rejected values
Lab Method Limit
J AAS < 2000 Τ S-CO-AAS c 200 I I CP C 2000
Lab Method ' Mean +/- St.dev
Ν A Η Κ F
CO-XRF S-CO-COL CL-C0-C0L S-C0-C0L NAA
300 200 383 133 950
+/- 0 +/- 0 +/- 29 +/- 58 +/- 240

- 78
TABLE Α.11a RM2e6 - THALL IUM, JUG/G
Β S-PAA
C N - A A S
0 N - A A S
M N - A A S
Κ E X - E T A
E N - I C P
S N - D C P
I OGS
2.4000 2.4000 2.4C0C
2.6CO0 2.6000
2.4100 2.4900
2 . 4 C 0 C: 2 . 4 U C ί J
2.5GCC 2.70CO
2.4500 C.52CÍ'
2.4C.0C c.SOLO
2.55Ü0 C.26LÜ
2.700G 2.4000 2.3U0O
2.500C
2.420C
2.4QOC
¿.7C0C
2.3800
2.4000
2.340c
MEAN
2.43333
2.56667
2.44000
¿.40000
2.63333
2.45000
2.43333
2.38333
ST.CEV.
0.127
0.058 j
i
0 . C 4 4
o.ooo
0 . 1 1 5
i I
0.070 !
0.058
0.150 I
l
Rejected va lues Lab
Η
Method Mean S t . d e v .
ETAAS 2.73 0.06

79
TABLE A.11b RM286 T H A L L I U M , >JG/G
o o σ
o o σ> +
o o CD
α o
o o
*
o o LO
o O
O o ro
m
OJ
o α ro
o o
«M
O C
o
χ αι
Oi
s.
o I
in
(M
ru
tí. tí Ο
Ι
ιΛ
LO
< tí I
2
tf j
« I
< I
2
LD
tí. tí 1
,2
♦—
JJ
1
>C
LU
Q.
CJ H
I
2
X
CJ
Q
1
2
LO
' J O

-80 -
Table A.11c
Summary of Statistical Data
CRM No. : 286 Element : Tl
Number of accepted sets of results ρ = 8 Number of accepted individual results Ν = 27
Mean of data set (*) means M = 2.47 /jg/g
Standard deviation of the distribution of the means S = 0.09 ug/g
Normality of the distribution of the means Normal
Within labs st.dev. S = 0.10 ug/g
Between labs st.dev. SB = 0.06 ug/g
95 % confidence interval of the mean of means : 2.47 +/- 0.07 fig/g
Certified value : 2.5 +/- 0.1 yg/g
(*) The data in one set were obtained with the same method in the same laboratory.

81
Table Α.12a Zinc i n RM 286 a l l va lues i n ng/g
Accepted measured va
Lab Method
0 NAA
E NICP
M NAAS
lues
Repli cates
34; 23; 35; 33; 46
54; 37; 26; 32; 35
30; 10; 10
50; 50; 60
Mean
36
17
53
Used upper l i m i t s
Lab
F
G
C
D
S
Method
NAA
NAA
NAAS
NAAS
NDCP
Limit
C 60
< 40
< 100
¿ 100
¿,100
Unused upper l i m i t s and r e j e c t e d values
Lab
Β
G
I
H
Method
SPAA
SCINAA
AAS
ETAAS
Limit
< 1000
< 200
< 1000
< 200
Lab Method Mean + / s t . d e v .
J SAAS 637 + / 55
Ν SAAS 400 + / 265
Τ NAAS 360 + / 36
St .dev.
12
6

- 82 -
Table A.12c
Data Summary
CRM No. : 286 Element : Zn
Number of accepted
sets of measured values ρ = 3 individual measured values Ν = 16
Number of used upper limits
Certified upper limit : <100 ng/g

83
TABLh Α.13a RM287 SILVER, pG/G
REPLICATES MEAN ST.DEV.
F NAA
G SCINAA
O NAA
Β SPAA
M CUPAAS
Ν CUPAAS
C EXAAS
D ¡MA AS
S NAAS
A AAS
H AAS
I AAS
K AAS
Τ AAS
U DCP
15.300 14.700 14.600 15.100
14.160 15.060 15.280 16.310
14.800 14.900 15.900 14.900 15.900
15.200 15.500 14.800 15.600 15.500
14.600 15.700
15.600 15.500 14.700 15.300 15.200
15.000
15.000 15.COO 14.000
15.100 15.100 15.COO
15.OCO 16.000 16.000
15.400 15.900 15.100
15.000 15.000 15.000
14.COO 14.800 14.900 14.500
15.300 15.500 15.600
15.200 15.100 15.300
14.800 15.100 15.100
15.000 16.000 15.000
16.200 15.700 16.000 16.000
14.9250
15.2025
15.2750
15.2167
14.6667
15.0667
15.6667
15.4667
15.000U
14.5500
15.4667
15.2000
15.0000
15.3333
15.975U
0.330
0.883
0.463
0.331
0.577
0.058
0.577
0.4C4
0.000
0.404
0.153
0.100
0.173
0.577
0.2Q6
Rejected values : Lab Method Mean +/ st.dev.
G
Ν
E
NAA
AAS
NICP
17.0 + / 0.5
16.3 + / 0.5 13.7 + / 0.4

84
TABLE Α.13b RM287 S I L V E R , pG/G
1 3 . 0 0 1 3 . 5 0 1 4 . 0 0 1 4 . 5 0 1 5 . 0 0 1 5 . 5 0 1 6 . 0 0 1 6 . 5 0 17.OÙ
UNIT ♦ ♦ + + + . . + + + ♦ . . .
F NAA
G SCINAA
0 NAA
Β SPAA
M CUPAAS
Ν CUPAAS
C EXAAS
D NAAS
· * <
S NAAS
A AAS
H AAS
I AAS
K AAS
Τ AAS
U DCP
15.2 + / 0 .2 ug/g c e r t i f i e d

- 85 -
Table A.13c
Summary of Statistical Data
CRM No. : 287 Element : Ag
Number of accepted sets of results ρ = 15 Number of accepted individual results Ν = 61
Mean of data set (*) means M = 15.2 yg/g
Standard deviation of the distribution of the means S = 0.4 yg/g
Normality of the distribution of the means Norma I
Within labs st.dev. Sw = 0.4 ^g/g
Between labs st.dev. SB = 0.3 pg/g
95 % confidence interval of the mean of means 15.2 +/- 0.2 yg/g
(this value is certified)
(*) The data in one set were obtained with the same method in the same laboratory.

- 86 -
Table A.14a
Arsenic in RM 287 - all values in ng/g
Measured values
Lab Method Replicates Mean St.dev
0 NAA 1.1; 0.7; 1.1; 1.4; 1.1 1.1 0.3
Used upper limits Estimate by SSMS
Lab Method Limit 10
G NAA < 3 G SCINAA < 1
Unused Upper limits
Lab
Β
F
C
H
L
Τ
D
E
M
S
I
L
Method
S-PAA
NAA
N-EX-COL
S-EX-COL
S-EX-COL
S-EX-COL
N-HAAS
N-HAAS
N-HAAS
N-HAAS
HAAS
ETAAS
L i m i t
< 100
< 40
< 50
< 200
C 200
< 250
< 100
< 50
< 50
< 100
< 1000
< 200

87
TABLE A.15a HM287 BISMUTH, pG/G
I
'. Β SPAA
1 C EXAAS
E NAAS
M NAAS
S NAAS
D AAS
ι
; ι AAS
N AAS
Η ETAAS
E NICP
U EXDCP
A COCCL
Κ COCOL
L EXCOL
Τ CÜCCL
Η COL
Η COL
I COL
REPLICATE
70.200
69.100
71.000
62.900
68.000
65.000
71.000
67.700
66.COO
65.000
61.400
68.300
70.000
66.000
67.600
65.000
67.000
66.COO
64.COO
69.800
70.000
6 1.300
67.000
66.000
68.000
67 .600
69.000
65.000
65.600
69.300
72.OCO
69.000
68.100
66.000
67.000
66.OCO
70.000
68.000
72.00C
63.600
67.000
66.000
64.000
68.500
67.000
67.000
60.900
70.400
74.000
67.000
67.900
66.000
67.400
68.000
70.000
70.300 70.000
64.500
70.800 65.200
71.000
MEAN
69.5666
71.0000
63.0750
67.3333
65.6667
67.6667
67.9333
68.0000
65.6667
62.6333
68.7999
71.7500
67.3333
67.8667
65.6667
67.1333
66.6667
68.0UÛU
ST.DEV.
0.878
1.000
1.352
0.577
0.577
3.512
0.493
LOCO
1.155
2.581
2.237
1.7C8
1.528
0.252
0.577
0.231
1 .155
3.464

88
TABLE Α.15b RM287 BISMUTH, UG/G
55.00
+ ...
60.00 65.00 70.00 75.00 ,.. + f + + ..,
Β SPAA
C EXAAS
E NAAS
M WAAS
S NAAS
D AAS
I AAS
N AAS
Η ETAAS
E NICF
U EXUCP
A COCOL
Κ COCOL
L EXCOL
Τ COCCL
Η COL
Η COL
I LDL
80.00
. . .♦
· * —
* «
*

- 89 -
Table A.15c
Summary of Statistical Data
CRM No. : 287 Element : Bi
Number of accepted sets of results ρ = 18 Number of accepted individual results Ν = 61
Mean of data set (*) means
Standard deviation of the distribution of the means
M = 67.3 yg/g
S = 2.3 jjg/g
Normality of the distribution of the means Normal
Within labs st.dev.
Between labs st.dev.
95 % confidence interval of the mean of means
Sw = 1.6 jjg/g
SB = 2.2 jjg/g
67.3 +/" 1 ijg/g
(this value is certified)
(*) The data in one set were obtained with the same method in the same laboratory.

90 -
TABLE Α.16a RM287 - CADMIUM, JJG/G
Β S-PAA
G NAA
0 NAA
C N-AAS
D N-AAS
M N-AAS
S N-AAS
Τ N-AAS
J S-AAS
Η ETAAS
I ETAAS
E N - I C P
U S-DCP
REPLICATE
0 . 4 0 0 0
0 . 3 0 0 0
0 . 3 5 0 0
0 . 3 1 0 0
0 . 3 0 0 0
0 . 3 4 0 0
0 . 3 3 0 0
0 . 3 5 0 0
0 . 3 5 0 0
0 . 3 5 0 0
0 . 3 4 0 0
0 . 4 3 0 0
0 . 4 2 0 0
0 . 3 1 0 0
0 . 3 6 0 0
S
0 . 3 8 0 0
0 .4O0O
0 . 3 1 0 0
0 . 3 4 0 O
0 . 3 4 U 0
0 . 3 5 0 0
0 . 3 5 0 0
0 . 4 0 0 0
0 . 2 8 0 0
0 . 4 5 0 0
0 . 4 2 0 0
0 .34CO
0 . 3 7 0 0
0 . 4 0 0 0
0 . 3 2 0 0
0 . 3 1 0 0
0 . 3 5 0 0
0 . 3 0 0 0
0 . 3 4 0 0
0 . 3 5 0 0
0 . 3 8 0 0
0 . 3 4 0 0
0 . 4 5 0 0
0 . 4 2 0 0
0 . 3 1 0 0
Q . 4 0 0 0
0 . 4 2 0 C 0 . 3 8 0 0
0 . 2 3 0 0
0 . 3 0 0 0 0 . 2 7 0 0
0 . 4 1 0 0 0 . 3 9 0 O
MEAN
0 . 3 8 0 0 0
0 . 3 2 5 0 0
0 . 3 0 0 0 0
0 . 3 4 3 3 3
0 . 3 2 3 3 3
0 . 3 4 6 6 7
0 . 3 5 0 0 0
0 . 3 7 6 6 7
0 . 3 2 0 0 0
0 . 4 4 3 3 3
0 . 4 2 0 0 0
0 . 3 2 0 0 0
0 . 3 8 6 0 0
S T . D F V .
0 . 0 4 2
0 . 0 7 1
0 . 0 1 5
0 . 0 0 6
0 . 0 2 1
0 . 0 0 6
0 . 0 0 0
0 . 0 2 5
0 . 0 3 5
0 . 0 1 2
o.ooo
0 . 0 1 7
0 . 0 2 1
Rejected values
Lab
F Ν
Method
NAA S-AAS
Mean + / - s t . d e v .
0.62 + / - 0.11 0.43 + / - 0.15

91 -
TABLE Α.16b RM287 - CADMIUM, pG/G
0 . 2 0 0 * . . .
β S - P A A
G NAA
0 NAA
C N - A A S
D N - A A S
M N - A A S
S N - A A S
Τ N - A A S
J S - A A S
Η ETAAS
1 ETAAS
E N - I C P
U S-OCP
0.250 0 . 3 0 0 0 . 3 5 0 O .40O 0 . 4 5 0
0.36 + / - 0.03 yg/g c e r t i f i e d

- 92 -
Table A.16c
Summary of Statistical Data
CRM No. : 287 Element : Cd
Number of accepted sets of results ρ = 13 Number of accepted individual results Ν = 48
Mean of data set (*) means M = 0.36 |ig/g
Standard deviation of the distribution of the means S = 0.04 ug/g
Normality of the distribution of the means Normal
Within labs st.dev. S = 0.03 ug/g w /
Between labs st.dev. SB = 0.04 ug/g
95 % confidence interval of the mean of means 0.36 +/- 0.03 pg/g
(this value is certified)
(*) The data in one set were obtained with the same method in the same laboratory.

93
TABLE A.17a RM287 COPPER, ¿¡G/G
F NAA
G SCINAA
C EXAAS
D NAAS
M NAAS
N SAAS
Η ETAAS
I ETAAS
E NICF
S NDCP
U SÙCF
A SCOL
H EXCCL
I EXCOL
L EXCOL
Τ EXCOL
Η COL
REFLICATEÍ
0.9C00
0.8980
0.9000
0.9700
0.8600
l.OCOO
1.1 COO
1.Ü4O0
0.8000
1.0000
0.8600
l.OCOO
1.20O0
0.80ÛO
0.9200
1.0000
1.1300
0.9800
0.9340
0.9000
J.0000
0.8600
l.OOCO
l.COOO
1.04C0
0.84Q0
1.0000
0.9400
1.1000
1.1300
1.0000
O..9 40O
1.1O00
1.1500
0.9300 0.9400
0.9300 1.0240
0.9000
1.0200
0.8500
l.OCOO
1.1000
1.0700
Û.8000
0.9000
0.9700
1.0000 l.COOO
1.0600
1.0000
0.8800
1.0000
MEAN
0.93750
0.94650
0.9OO00
0.99667
0.85667
l.OOOOC
1.06667
1.05000
0.81331
0.96667
0.92333
1.O250O
1.13000
0.93333
0.91333
1.03333
1.14000
ST.DEV.
0.033
0.054
0.000
0.025
0.006
0.000
0.056
O.017
0.023
0.058
0.057
0.050
0.070
0.115
0.031
0.058
0.014
Rejected values :
Lab Method Mean
G NAA 1.19
St.dev.
0.20

94
TABLE A.17b RM2B7 - COPPER, pG/G
0.98 + / - 0.05 ug/g c e r t i f i e d
0 . 6 0 0 0 . 7 0 0 0 . 8 0 0 0 . 9 0 0 1 .000 1 . 1 0 0 1 . 2 0 0 1.30O , . . + 4 + -r + . .
F NAA
G SCINAA
C EX-AAS
D N-AAS
M N-AAS
N S-AAS
H ETAAS
I ETAAS
E N-ICP
S N-DCP
0 S-DCP
A S-COL
H EX-COL
1 EX-COL
L EX-COL
Τ EX-COL
H COL

- 95 -
Table A.17c
Summary of Statistical Data
CRM No. : 287 Element : Cu
Number of accepted sets of results ρ = 17 Number of accepted individual results Ν = 53
Mean of data set (*) means M = 0.98 yg/g
Standard d e v i a t i o n of the d i s t r i b u t i o n of the means S = 0.09 yg/g
Normality of the distribution of the means Normal
Within labs st.dev. S = 0.05 yg/g
Between labs st.dev. SB = 0.08 yg/g
95 % conf idence i n t e r v a l of the mean of means 0.98 +/- 0.05 yg/g
(this value is certified)
(*) The data in one set were obtained with the same method in the same laboratory.

- 96 -
TABLE Α.18a RM287 - N I C K E L , NG/G
0 NAA
C N-AAS
D N-AAS
M N-AAS
Κ ETAAS
22.OOG 23.000 25.00C 29.000 22.000
10.COO 2C.C00 20.COO
20.COC 10.000 10.COO
40.COC 40.000 30.COC
30.COO 33.000 27.000
ΝΈΑΝ
24.2000
16.6667
13.3333
36.6667
30.0000
ST.LEV.
2.950
5.774
5.774
5.774
3.000
Est imates by SSMS : 70
Upper l i m i t s and r e j e c t e d va lues :
Lab Method L i m i t
F Β Τ Η E U
NAA S-PAA AAS ETAAS N-ICP S-DCP
¿27 .10"
<50 <500 <100
<50 <70
Lab Method Mean + / s t . d e v .
I
Κ
ETAAS
EXCOL
213 + / 21
300 + / 0

97 -
TABLE A.18b RM287 - N I C K E L , NR/G
o o
α CD
α o in
o α o
o o o
X Φ
Φ υ
σι σι c
o α
o (M
I —, + viru
C3 O
c—i O O
<r
Ζ < I Ζ
Vi
< I
ζ
< I
Ji «t «t

- 98 -
Table A.18c
Summary of Statistical Data
CRM No, : 287 Element : Ni
Number of accepted sets of results ρ = 5 Number of accepted individual results Ν = 17
Mean of data set (*) means M = 24 ng/g
Standard deviation of the distribution of the means S = 10 ng/g
Normality of the distribution of the means Normal
Within labs st.dev. Sw = 5 ng/g
Between Labs st.dev. SB = 9 ng/g
95 % confidence interval of the mean of means 24 +/- 12 ng/g
(this value is certified)
(*) The data in one set were obtained with the same method in the same laboratory.

- 99 -
TABLE A.19a RM287 - ANTIMONY, NG/G
F NAA
G SCINAA
0 NAA
Β S-PAA
E S-HAAS
Κ ETAAS
2 8 . 0 0 0 2 8 . 0 0 0 25.GOO 2 5 . 0 0 0
2 1 . 0 0 0 2 3 . 0 0 0 2 3 . 0 0 0 2 5 . 0 0 0
3 3 . 5 0 0 3 8 . 5 0 0 3 7 . 3 0 0 3 6 . 4 0 0 3 8 . 5 0 0
3 5 . 2 0 0 3 5 . 3 0 0 3 3 . 6 0 0 3 3 . 8 0 0 3 4 . 9 0 0
6 2 . 0 0 0 58.COO 5 0 . 0 0 0 5 6 . 0 0 C 5 8 . 0 0 0
50.COO
4 0 . 0 0 0 5 0 . 0 0 0 5 0 . 0 0 0
4 2 . 0 0 0 64.COO 5 6 . 0 0 0
MEAN
2 6 . 5 0 0 0
23 .0UCU
3 5 . 7 0 0 0
5 5 . 6 6 6 7
4 6 . 6 6 6 7
5 4 . 0 0 0 0
S T . D E V .
1 . 7 3 2
1 . 6 3 3
1 .9C4
4 . 8 C 3
5 . 7 7 4
1 1 . 1 3 6
Upper l i m i t s (unused)
Lab Method Limit
D M S I C H
N-AAS <.100 N-HAAS < 50 N-HAAS <1007 HAAS < 10" CO-ETAAS < 50 CO-EX-COL <100
Rejected values
Lab
I Κ L N
Method
CO-EX-COL CO-EX-COL EX-COL EX-COL
Mean + / - s t .dev .
433 + / - 58 200 + / - 0 483 + / - 12 167 + / - 58

100
TABLE A.19b RM287 ANTIMONY, NG/G
α o • ♦ o CT
α o
• ΙΟ cc
O
o
o CJ • +
c vO
o o
o in
o o
o vT
o o
o
o o
» 4
o ru
o o
I I « I
I I I « t
I
* I I
X φ
φ o
oí —, cn c
LO
o v í
« <t Η ►Η U to
«ι <t ζ
< ■
«I ΟΙ CO
to «a «X X 1 to
to <£ «ï p
LU
O χ

- 101 -
Table A.19c
Summary of Statistical Data
CRM No. : 287 Element : Sb
Number of accepted sets of results ρ = 6 Number of accepted individual results Ν = 30
Mean of data set (*) means M = 40 ng/g
Standard deviation of the distribution of the means S = 14 ng/g
Normality of the distribution of the means Norma I
Within labs st.dev. Sw = 4 ng/g
Between labs st.dev. SB = 13 ng/g
95 % confidence interval of the mean of means 40 +/- 15 ng/g
(this value is certified)
(*) The data in one set were obtained with the same method in the same laboratory.

- 102
Table 20a Selenium in RM 287 - all values in ng/g
Measured values :
Lab Method Replicates Mean St.dev.
F NAA 40;30;40;30 35 6 C EX-ETAAS 16;16;17 16 0.6
Used upper limits
Lab Method Limit
D S N
N-HAAS N-HAAS CO-XRF
< 50 < 50 < 50
Est imate by SSMS
C 50
Unused upper l i m i t s
Lab G E M H K
Method
SCINAA N-CO-XRF CO-XRF CL-CEXC0L CL-CEXC0L
Limit
ν 100 < 150 < 100 < 100 < 100

103
Table A.21a
Tin in RM 287 all values in ng/g
Accepted Measured va
Lab Method
0 NAA
Κ ETAAS
lues
Replicates
5; 6
25; 30; 25
Used upper limits
Lab Method Limit
M EXAAS <10
C COETAAS < 50
Estimate by SSMS :
< 50
Unused Upper limits
Lab Method Limit
Β
I
F
D
G
S
E
H
J
Τ
Rejected values
Lab Method Mean +/ St.dev
Κ C0EXC0L 600 +/ 100
SPAA
ICP
NAA
NHAAS
SCINAA
NHAAS
EXAAS
C0EXC0L
C0AAS
COEXCOL
¿ 1000
C 2000
C 12000
C 100
< 5000
< 100
< 500
¿ 500
. <. 200
< 500
Mean St.dev
5.5 0.7
27 3

- 104 -
Table A.21c
Data Summary
CRM No. : 287 Element : Sn
Number of accepted
sets of measured values ρ = 2
individual measures values Ν = 5
Number of useful upper limits 2
Certified upper limit : < 50 ng/g

- 105 -
Table A.22a
Tellurium in RM 287 - all values in ng/g
Accepted Measured values
Lab Method Replicates Mean St.dev
0 NAA 9.4; 7.1; 8.8; 7.4 8.2 1.1 Β S-PAA 140; 130; 140; 180; 140
140; 130; 129; 139 141 15 (136 +/- 5 without outlier 180)
C CO-ETAAS 70; 90; 90 83 12
Used Upper limits :
Lab
E
M
Ν
D
S
H
Κ
Method
N-CO-XRF
CO-XRF
CO-XRF
N-HAAS
N-HAAS
S-ETAAS
CO-ETAAS
Limit
< 50
<100
< 50
< 100
< 100
< 200
< 10
Rejected values and unused upper limits :
Lab
F
A
H
Τ
Method
NAA
S-C0-C0L
S-CO-COL
S-CO-AAS
Mean
975
100
. 267
100
+/ -
+/ -+ / -+/ -+ / -
st.dev
150
0
29
0
Lab Method Limit
I ICP < 2000 J AAS ν 2000 Κ S-CO-COL <- 500

- 106 -
TABLE Α.23a RM287 - THALLIUM, UG/G
Β S-PAA
C N-AAS
0 N-AAS
M N-AAS
Κ EX-ETA
Η ETAAS
E N-ICP
S N-DCP
I OGS
0.600C 0.9000 0.7000 0.50O0 0.7000
0.6C0C
0.780C C.8000 0.7800
0.7700 0.8000 0.7300
0.6800 C.6300 0.6800
0.7000 C.70C0 0.8000
0.7C0O 0.70CO 0.7400
0.7100 C.74CO 0.6900
0.7900 0.7500 0.7700
0.7500 0.850O 0.7300
MEAN
0.66667
0.78667
0.76667
0.66333
0.73333
0.71333
0.71333
0.77000
0.77667
ST.DEV.
0.137
0.012
0.035
0.029
0.058
0.023
0.025
0.020
0.064

107
TABLE A.23b RM287 THALLIUM, UG/G
o in cr ♦
o o cr f
o i n «J Ί
Ο O 00 4-
O i n
o o
o LO
>o + o o o S3 +·
o m m
o o in
χ Φ
Φ o
01
σ> 3v vt O
I —, + ro (V-
<t ΟΙ
LO
to ■α
I
to «s •a. I
LO
< ■
ζ
OJ
χ
UI α. o.
Q I
to o o
CX o cu to

108
Table A.23c
Summary of Statistical Data
CRM No. : 287
Element : Tl
Number of accepted sets of results ρ = 9
Number of accepted individual results Ν = 30
Mean of data set (*) means
Standard deviation of the
distribution of the means
M = 0.73 ¿jg/g
S = 0.05 yg/g
Normality of the distribution
of the means Normal
Within labs st.dev. S = 0.07 μg/g
Between labs st.dev, SB = 0.03 yg/g
95 % confidence interval
of the mean of means 0.73 +/ 0.04 yg/g
(this value is certified)
(*) The data in one set were obtained with the same method in the same
laboratory.

- 109 -
Table A.24a Zinc in RM 287 - all data in ng/g
Accepted measured values
Lab 0 M E
Method
NAA N-AAS N-ICP
Replicates
18; 19 90; 80; 80 50; 20; 50
Mean St.dev.
18.5 83 40
0.7 6 17
Used upper limits :
Lab F C D S
Method
NAA N-AAS N-AAS N-DCP
Limit
ν 100 < 100 < 100 v. 100
Unused upper limits
Lab
Β I Η
Method Limit
S-PAA AAS ETAAS
< 1000 C 1000 c 200
Rejected values :
Lab
J
Ν
Τ
Method
S-AAS
S-AAS
N-AAS
Mean +/- st.dev.
427 +/- 102 ' 367 +/- 306
327 +/- 25

- 110 -
Table A.24c
Data Summary
CRM No. : 287 Element : Zn
Number of accepted
sets of measured values ρ = 3
individual measured values Ν = 8
Number of useful upper limits 4
Certified upper limit : < 100 ng/g

I l l -
TABLE A.25o RM288 - SILVER, pK/C,
V CUP-GR
F NAA
G SCINAA
0 NAA
N CUPAAS
C EX-AAS
S N-AAS
A AAS
D (N)AAS
H AAS
I AAS
K AAS
R AAS
Τ AAS
I ARF
E N-ICP
I ICP
U OCP
Rejected ν
REPLICATE
30 .000
2 9 . 6 0 0
2 8 . 7 0 0
3 0 . 2 0 0
3 2 . 3 0 0
2 9 . 9 0 0
31.80C
2 6 . 4 0 0
30 .900
3 1 . 0 0 0
32 .000
3 1 . 0 0 0
30 .400
30 .200
3 1 . 5 0 0
3 1 . 1 0 0
3 1 . 0 0 0
2 9 . 1 0 0
2 9 . 0 0 0
3 0 . 2 0 0
2 9 . 0 0 0
3 3 . 3 0 0
3 1 . 9 0 0
a Lues :
30 .0U0
2 7 . 2 0 0
2 8 . 4 0 0
3 1 . 4 0 0
2 9 . 8 0 0
3 1 . 2 0 0
2 8 . 7 0 0
3 3 . 1 0 0
2 9 . 7 0 0
3 1 . 0 0 0
3 1 . 0 0 0
3 1 . 5 0 0
3 0 . 8 0 0
3 1 . 3 0 0
3 1 . 2 0 0
3 1 . 2 0 0
■51.000
2 9 . 3 0 0
2 9 . 5 0 0
3 0 . 4 0 0
2 9 . 1 0 0
3 1 . 4 0 0
3 2 . 6 0 0
Lab
G
Β
29.CU0
2 9 . 2 0 0
2 9 . 5 0 0
3 1 . 1 0 0
31 .300
3 1 . 8 0 0
3 0 . 9 0 0
30.COO
2 9 . 0 0 0
33 .000
3 0 . 5 0 0
3 0 . 7 0 0
3 0 . 6 0 0
3 1 . 6 0 0
3 1 . 4 00
3 0 . 6 0 0
2 9 . 6 0 0
3 0 . 0 0 0
3 1 . 6 0 0
2 9 . 1 0 0
3 0 . 0 0 0
3 2 . 2 0 0
Method
NAA
S-PAA
2 8 . 4 0 0
2 9.50C
30 .500 3 0 . 9 0 0
30.10U 3 2 . 4 0 0
32 .000 31 .90U
29 .500 2 9 . 7 0 0
2 9 . 4 0 0 2 9 . 5 0 0
30.6UO
3 3 . 7 0 0
Bean +/-st .dev
34.0 + / - 0.7
25.0 + / - 0.5
Γ
1- b A lv
2 9 . 6 6 6 7
2 8 . 6 0 0 0
2 9 . 0 2 5 0
3 0 . 6 8 1 4
3 0 . 3 3 3 3
2 2 . 0 0 0 0
31 .0U00
3 0 . 6 2 5 0
3 0 . 7 0 0 0
3 1 . 4 3 3 3
3 1 . 3 3 3 3
30 .8667
2 9 . 4 3 3 3
2 9 . 5 0 0 0
3 0 . 7 3 3 3
2 9 . 0 6 6 7
31 .5667
3 2 . 6 0 0 0
.
ST.CEV.
0 . 5 7 7
1.058
0 . 5 6 2
1.166
1.155
1 .000
0 . 5 0 0
0 . 1 7 1
0 . 5 5 7
0 . 2 0 6
0 . 1 1 5
0 . 2 3 1
0 . 1 5 3
0 .5C0
0 . 7 5 7
0 . 0 5 6
1.656
0 .767

- 112 -
TABLE Α.25b RM288 - SILVER, ^G/G
y CUP-GR
27.00 28.00 29.00 30.CO 31.00 32.00 33.00 34.00 35.00 .. + . .... + ..... + ...... + ..... + ......+ ..... + .....-t-.·....t..
F NAA
G SCINAA
C NAA
N CUPAAS
C EX-AAS
S N-AAS
A AAS
D (N)AAS
H AAS
I AAS
K AAS
R AAS
T AAS
I ARF
E N-ICP
I ICP
30.5 + / - 0.5j jg/g cert i f ied
U DCP

- 113 -
Table A.25c
Summary of Statistical Data
CRM No. : 288 Element : Ag
Number of accepted sets of results ρ = 18 Number of accepted individual results Ν = 82
Mean of data set (*) means M = 30.5 >jg/g
Standard deviation of the distribution of the means S = 1.1 yg/g
Normality of the distribution of the means Normal
Within labs st.dev. S = 0.9 Mg/g w
Between labs st.dev. SB = 0.9 Mg/g
95 % confidence interval of the mean of means 30.5 +/- 0.5 yg/g
(this value is certified)
(*) The data in one set were obtained with the same method in the same laboratory.

114
TABLE A .26a RM288 ARSENIC, ¿JG/G
F NAA
0 NAA
G NAA
G SCINAA
Β SPAA
D NAAS
•R SAAS
M NHAAS
E HAAS
I HAAS
S HAAS
C NEXCCL
Ν NEXCOL
Η COL
I COL
L COL
Τ COL
REPLICAT
60.200
52.COO
56.000
59.300
57.300
52.000
55.000
56.500
57.COO
49.000
55.600
57.200
49.000
52.000
59.000
56.000
61.000
54.900
60.COO
56.700
53.GOO
57.OCO
5«.100
56.800
53.000
52.000
55.200
61.000
50.000
55.100
50.300
49.000
55.000
60.000
57.000
59.000
55.600
57.000
62.100
56.000
59.000
61.500
56.700
50.000
54.000
54.000
54.000
52.000
55.000
58.200
48.000
54.000
58.000
57.000
54.500
57.COD
57.900
57.COO 5«.0O0
58.300
55.300
51.000 50.000
54.100
CEAIV.
59.2250
55.5000
58.3000
56.5250
52.3444
55.2333
57.3333
50.3333
55.2333
55.2333
48.6667
53.6667
59.0000
56.6667
60.0000
55.OCC0
58.0000
ST.CEV.
2.405
2.330
3.103
0.858
1.815
1.250
3.512
1.528
0.321
4.302
0.577
1 .528
l.OOO
0.577
1.414
0.557
1.732

115
TABLE A.26b RM288 ARSENIC, JJG/G
55.7 + / 1.6 ug/g c e r t i f i e d
40 .00 45 .00 50 .00 5 5 . 0 0 6 0 . 0 0 65 .00 7 0 . 0 0 75 .00
+ . . . . . . . + ♦ ♦ + + + . · . · · . * . + '
F NAA
0 NAA
G NAA
G SCINAA
Β SPAA
Ü NAAS
R SAAS
M NHAAS
E HAAS
1 HAAS
S HAAS
C NEXCCL
Ν NEXCCL
H COL
I COL
L COL
Τ COL
*
·*

- 116 -
Table A.26c
Summary of Statistical Data
CRM No. : 288 Element : As
Number of accepted sets of results ρ = 17 Number of accepted individual results Ν = 64
Mean of data set (*) means
Standard deviation of the distribution of the means
M = 55.7 yg/g
S = 3.1 jjg/g
Normality of the distribution of the means Norma I
Within labs st.dev. Sw = 2.1 jjg/g
Between labs st.dev. S = 2.7 >ig/g
95 % conf idence i n t e r v a l of the mean of means 55.7 +/- 1.6 ug/g
(this value is certified)
(*) The data in one set were obtained with the same method in the same laboratory.

117
TABLE A.27a RM28e B I S M U T H , UG/G
Β SPAA
D AAS
E AAS
H AAS
I AAS
K AAS
K AAS
K AAS
A EXAAS
C EXAAS
C COAAS
f NAAS
S NAAS
H ICP
L ΕΧ1'.ΓΡ
A COCCL
K COCOL
K COCOL
Τ COCOL
Η COL
Ι COL
L EXCOL
R t P L I C A T
2 1 5 . 0 0
¿ 1 3 . Π ϋ
2 1 6 . O C
2 C 9 . 0 C
2 1 7 . 0 0
2 2 1 . 0 0
22 1 . 0 0
2 1 2 . U O
2 1 7 . 0 0
2 1 0 . 0 0
2 1 0 . 0 0
2 1 5 . 0 0
2 2 0 . 0 0
2 2 3 . 0 0
2 2 0 . Ü O
2 2 3 . 0 0
2 1 0 . 0 0
2 1 0 . 3 0
2 1 0 . 0 0
2 2 3 . 0 0
2 1 8 . 0 0
225 .011
2 1 6 . 0 0
2 1 0 . Ό C
2 1 1 . 0 0
2 1 5 . 0 0
¿ 2 1 . 0 0
2 1 2 . 0 0
2 1 3 . 3 0
FS
2 0 1 . 0 0
2 1 1 . 0 0
2 C 8 . C 0
2 1 2 . 0 0
2 1 9 . 0 0
2 1 6 . 3 0
2 1 5 . 0 0
2 1 6 . 0 0
2 1 2 . 0 0
2 0 6 . D O
2 2 1 . 0 0
2 2 3 . 0 0
2 1 5 . 0 0
2 2 2 . 0 0
2 0 S . 0 0
2 1 1 . 1 0
2 1 6 . 0 0
2 2 3 . 0 0
2 1 1 . 0 0
2 2 5 . 0 0
2 1<I .00
2 1 1 . U O
2 1 0 . 0 0
2 2 1 . 0 0
2 0 6 . 0 0
2 1 1 . 9 0
2 1 9 . 0 0
2 1 1 . 0 0
2 1 2 . U O
2 1 1 . 0 0
2 1 8 . 0 0
2 2 9 . 0 0
2 1 5 . 0 0
2 1 6 . 0 0
2 1 2 . 0 0
2 0 5 . 0 0
2 1 8 . 0 0
2 2 5 . 0 0
2 2 2 . 0 0
2 2 2 . 0 0
2 1 0 . 0 0
2 1 1 . 3 0
2 1 5 . 0 0
2 2 5 . 0 0
2 0 7 . O U
2 2 7 . 0 0
2 1 3 . 0 0
2 1 1 . 0 0
2 1 5 . 0 0
2 2 2 . 0 0
2 0 0 . 0 0
2 1 1 . 7 0
2 1 6 . 0 0
2 1 8 . 0 0
2 1 1 . 0 0
2 1 1 . 0 0
2 1 0 . 0 0
2 2 2 . 0 0
2 2 2 . OU
2 2 0 . 0 0
2 1 2 . 3 0
2 1 2 . O U
2 1 6 . 0 0
2 2 6 . 0 0
2 1 2 . 0 0
2 0 9 . 0 0
2 1 7 . 0 0
2 1 2 . 0 0
2 1 1 . 0 0
2 2 0 . O U
2 1 1 . 8 0
2 1 1 . 0 0
MEAN
2 1 2 . 1 6 7
2 1 3 . 6 6 7
2 1 2 . 7 7 8
2 1 9 . 3 3 3
2 2 2 . 1 0 0
2 1 1 . 2 5 0
2 1 0 . 8 3 3
2 0 8 . 6 6 7
2 2 0 . 2 5 0
2 2 1 . 1 1 1
2 2 2 . 3 3 3
2 1 0 . 8 6 7
2 1 5 . 6 6 7
2 2 3 . 6 6 7
2 1 3 . 0 0 0
2 2 5 . 7 5 0
2 1 4 . 3 3 3
2 1 2 . 5 0 0
2 1 3 . 3 3 3
2 2 1 . 3 3 3
2 0 6 . 0 0 0
2 1 3 . 3 0 0
S T . D E V .
6 . 1 0 1
2 . 5 1 7
3 . 6 6 7
1 . 5 2 8
6 . 1 2 1
2 . 2 5 2
0 . 9 8 3
5 . 5 0 8
1 . 7 0 8
2 . 8 1 8
0 . 5 7 7
1 . 1 0 5
0 . 5 7 i
1 . 1 5 5
1 . 9 6 7
0 . 9 5 7
1 . 5 2 H
1 . 7 6 1
2 . 8 8 7
0 . 5 7 7
6 . 0 0 0
1 . 6 0 0
Rejected values : Lab
E
E
E R
Method
AAS
N-AAS
N-ICP COL
Mean + / - s t . d e v .
184 + / - 3
192 + / - 3
196 + / - 3 191 + / - 11

118
TABLfc Α.27b &M288 UISNUTH, UG/*
190 .0 195 .n 2U0 .0 2 0 5 . 0 2 1 0 . 0 2 1 5 . 0 2 2 0 . 0 2 2 5 . 0 2 3 0 . 0 2 3 5 . 0 2 4 0 . 0 + + . . . . . 4 + . . . . . . 4 . . . . . + . . . . . . 4 . . . . . . . . . . . ♦ . . . . . . + . . . . . ♦
Β SPAA ·
D AAS *
E AAS « '
H AAS *
Ι AAS *
K AAS — *
Κ AAS *
^ A A S *
A EXAAS . *
* C EXAAS . *
*
C COAAS . *
f NAAS *
S NAAS * —
H ICP . *
U EXDCP *
A COCOL . *
Κ COCOL *
Κ COCOL * \
m
Τ COCOL *
Η COL . — *
Ι COL *
L EXCOL * ! —
215.8 + / 2.4 ug/g cer t i f ied

- 119 -
Table A.27c
Summary of Statistical Data
CRM No. : 288 Element : Bi
Number of accepted sets of results ρ = 22 Number of accepted individual results Ν = 101
Mean of data set (*) means
Standard deviation of the distribution of the means
M = 215.8 yg/g
S = 5.3 yg/g
Normality of the distribution of the means About normal
Within labs st.dev.
Between labs st.dev.
95 % confidence interval of the mean of means
Sw = 3-2./J9/9
SB = 4.7 jjg/g
215.8 +/- 2.4 ug/g
(this value is certified)
(*) The data in one set were obtained with the same method in the same laboratory.

120
T A B L E A 2 8 a
RM?8fi CADMUK, pG/l
0 NAA
F NAA
G NAA
Β SPAA
C NAAS
0 NAAS
M NAAS
Ν SAAS
R SAAS
S NAAS
H AAS
I AAS
J AAS
K AAS
Τ AAS
I AUF
E NICP
J SOCP
I ICP
REPLICAI
33.èO0
33.900
32.600
2«.300
29.000
31.COO
32.000
31.800
32.000
32.OOC
32.000
31.000
31.900
35.800
32.COG
31.800
32.OOC
36.100
33.200
35.eoo
35.700
ES
29.700
33.5CO
32.100
31.500
29.500
30.300
32.000
31.700
32.000
35.000
32.100
35.000
35.100
35.700
33.000
32.100
31.000
36.eoo
33.700
35.200
31.800
35.6.00
31.600
32.900
50.900
28.300
29.100
32.000
31. ¿00
32.000
31.000
32.700
35.000
35.600
36.100
30.000
32.100
33.COO
35.900
32.900
35.100
35.100
33.600 30.900
30.900
33.1U0
29.500 31.000
31 .900
MEAN
32.750U
3¿.1250
31.0250
29.9889
32.0000
31.5667
32.0000
33.6667
32.3667
31.6667
35.3000
35.8667
31 .6667
32.0U0Ü
32.0000
36.2667
33.2667
35.3667
35.2000
ST.DEV.
1.689
o.eei
2.1C6
1.113
0.000
0.321
0.000
1.528
0.351
0.577
0.361
0.208
1.528
0.173
1.000 ,
0.173
0.101
0.379
0.158
Rejected values Lab
Ν
Ν
Method
AAS
AAS
Mean +/ st.dev.
31.7 +/ 0.6 (first series)
37.0 +/ 1.0 (second series)

121
TABLE A.28b RM288 CADMIUM, UG/G
26.00 27.00 28.0029.00 30.00 31.00 32.00 33.00 31.0035.OL' 36.00 37.00 38.00
♦ . ....+ ..... + .... + ..... + . . . . . 4 . . . . .+ . ............... + ... . . 4 . . . . .+ ... ..♦
0 NAA
F NAA
G NAA
Β SPAA
C NAAS
D NAAS
Η NAAS
Ν SAAS
Η SAAS
S NAAS
H AAS
1 AAS
J AAS
K AAS
Τ AAS
I ABF
E NICP
U SOCP
I ICP
33.3 +7 0.9 ug/g certified

- 122 -
Table A.28c
Summary of Statistical Data
CRM No. : 288
Element : Cd
Number of accepted sets of results ρ = 19
Number of accepted individual results Ν = 70
Mean of data set (*) means M = 33.3 ^g/g
Standard deviation of the
distribution of the means S = 1.8 |ig/g
Normality of the distribution
of the means About normal
Within labs st.dev.
Between labs s t . dev .
Sw = 1.1 yg/g
SB = 1 .8^ ig /g
95 % conf idence i n t e r v a l
of the mean of means 33.3 +/- 0.9^ig/g
(this value is certified)
(*) The data in one set were obtained with the síjme method in the same
laboratory.

123
TABLE A 29a RM288 COPPER, UG/G
F NAA
G SCINAA
C EXAAS
0 NAAS
M NAAS
N SAAS
R SAAS
S NAAS
H AAS
I AAS
N AAS
E NICH
U SDCP
H EXCOL
I EXCOL
L EXCOL
Τ EXCOL
A COL
H COL
17.200 17.200
IB.900 17.800
20.000 20.000
20.300 21.200
18.000 18.000
19.800 19.600
17.600 18.6C0
19.000 20.000
19.900 20.000
18.500 .18.800
18.700 19.200
18.600 18.100
20.100 19.900
19.600 20.50(1
19.000 18.000
19.700 19.70(1
19.500 19.500
19.OOC 20.000
20.200 20.100
18.100 17.800
16.700 19.5*00
20.000
20.700
18.000
19.800
19.100
20.000
20.100
18.900
19.000
18.900
19.600
20.300
20.000
19.100
20.000
19.000 19.000
MEAN
17.5750
18.8250
20.0000
20.7333
18.0000
19.7333
lä.1333
19.6667
20.0000
18.7333
18.9667
18.6333
19.9667
20.2000
19.0000
19.6000
19.6667
19.2500
20.3000
ST.DEV.
0.150
0.862
O.OCO
0.151
0.000
0.115'
0.761
0.577
0.100
0.208
0.252
0.252
0.101
0.361
1.000
0.173
0.289
0.500
0.111
Rejected values :
Lab . Method
G NAA
Mean + / st.dev.
21.6 + / 1.7

124
TAbLE Α.29b RH268 COPPER, UG/G
19.3 + / Ο.ι» jjg/g c e r t i f i e d
16.OC
♦ .. · .
17.00 ie.00 19.00 20.00 21.00 22.00
,..+ + + .......... . + . ...... . . .*. ........ ..+
F NAA
G SCINAA
C EXAAS
D NAAS
Κ NAAS
N SAAS
R SAAS
S NAAS
H AAS
I AAS
N AAS
E NICP
U SDCP
H EXCCL
I EXCOL
L EXCOL
Τ EXCOL
A COL
Η COL

- 125 -
Table A.29c
Summary of Statistical Data
CRM No. : 288 Element : Cu
Number of accepted sets of results ρ = 19 Number of accepted individual results Ν = 59
Mean of data set (*) means
Standard deviation of the distribution of the means
M = 19.3 yg/g
S = 0.8 jug/g
Normality of the distribution of the means Normal
Within labs st.dev.
Between labs st.dev.
95 % confidence interval of the mean of means
Sw = 0.5^ig/g
SB = 0.8 jjg/g
19.3 +/- 0.4 jjg/g
(this value is certified)
(*) The data in one set were obtained with the same method in the same laboratory.

126
TABLE A.30a RM288 N I C K E L , JJG/G
REPLICATES VEAN ST.CEV,
0 NAA
Β SPAA
C NAAS
D NAAS
M NAAS
Ν SAAS
S NAAS
Τ AAS
Η ETAAS
I ETAAS
Κ EXCOL
U SOCF
4.8000 «.3000 5.6000 3.8000 4.1000
α.βοοο 4.8000 α.8000 4.90oo 4.9000
5 . 0 0 0 0
4 . 3 C 0 0 4 . « 0 0 0 4 . 3 0 0 0
4 . 8 0 0 0 4 . 8 0 0 0 5 . 0 0 0 0
4 . 4 0 0 0 4 . 3 0 0 0 4 . 4 0 Û 0
4 . 7 0 0 0 4 . 4 0 0 0 4 . 6 0 0 C
4 . fa0n0 4 . 7 0 0 0 4 . 5 0 0 0
4 . 7 C 0 0 4 . 8 0 0 0 í l . f tCÜC
4.4OO0 «.«(JOD 4 . 6 0 0 0
4 . 5 0 0 0 4 . 2 7 0 0 4 . 8 0 0 0
4 . 5 0 0 0 4 . 7 C 0 0 4 . 6 C 0 0
4 . 2 9 0 0 4 . 1 8 0 0 4 . 5 2 0 0 4 . 5 3 0 0 4 . 4 3 0 0
ή . 6 4 0 0
i l . 5 2 0 0 0
4 . 6 6 6 6 6
4 . 3 3 3 3 3
4 . 6 6 6 6 7
4 . 3 6 6 6 7
4 . 5 6 6 6 7
4 . 6 0 0 0 0
4 . 7 0 0 0 0
4 . 4 6 ö h 7
4 . 5 2 3 3 3
4 . 6 0 0 0 0
4 . 4 3 1 6 6
0 . 7 0 5
0 . 0 8 2
0 . 0 5 8
0 . 1 1 5
0 . 0 5 8
0 . 1 5 3
0 . 1 0 0
0 . 1 0 0
0 . 1 1 5
0 . 2 6 6
0 . 1 0 0
0 . 1 7 0
Upper l i m i t s and r e j e c t e d va lues
Lab
F
Ν
E
Method Value
NAA
AAS
NICP
<48
5.4 + / 0 .4
4.08 + / 0.04

127
TABLE A
3 0 b
RM288 N ICKEL , >JG/G
4.57 +/ 0.11 )jg/g certified
α ♦ ■
LT»
O
ru ♦
in
o 3 3 •
m
o o
o o XI ·»
I
I
* I
I
α
o l\J
«
o
3 Ι
Ο O 00
O 3 X>
O O 3
<t
< 2
O
<t
<t
Ο
Ι IO
CO
LO
<l ■«ï
1
ζ
>_1
J~)
< «I
I 2
Q
LO
<; «ί I 2 Σ
to <t < ι LO
2
LO «* <t I 2 LO
CO <s <t Ρ-
ΙΟ <s. <. p-LU
X
(Λ <t «ï Ι
ί^ •—I
o CJ 1 X LU
*:
Ου Q 1 (O 3

- 128 -
Table A.30c
Summary of Statistical Data
CRM No. : 288 Element : Ni
Number of accepted sets of results ρ = 12 Number of accepted individual results Ν = 44
Mean of data set (*) means M = 4.57 yg/g
Standard deviation of the distribution of the means S = 0.17 yg/g
Normality of the distribution of the means Normal
Within labs st.dev. S = 0.28 ug/g
Between labs st.dev. SB = 0.11 pg/g
95 % confidence interval of the mean of means 4.57 +/- 0.11 ug/g
(this value is certified)
(*) The data in one set were obtained with the same method in the same laboratory.

129 ~
T A b L t Α.31a RM¿Hf A N I I M I l N Y , UG/C
F ΜΔΛ
G SCI.VAA
0 ΝΛΛ
C COAAS
M NHAAS
D NAAS
E HAAS
I HAAS
I AAS
H ETAAS
Κ ETAAS
S CLOCP
U CODCP
H CEXCCL
I EXCOL
N EXCOL
L EXCOL
30.600
30.100
33.90U
35.600
31.100
36.100
35.100
31.1O0
32.000
33.000
32.200
37 .100
30.600
33.200
31 .000
30.100
33.000
31.500
32.000
31.000
32.000
33.500
30.000
30.800
35.COO
33.700
35.000
33.200
38.100
35.200
32.000
33.000
32.800
3 7.100
33.100
30.1UO
32.000
30.300
35.000
33.000
31.000
31.000
33.000
33.300
31.300
30.600
31.70C
33.500
35.100
35.100
36.900
32.100
31 .000
31.000
32.90C
35.000
il.600
33.000
30.000
35.000
33.600
29.000
30.000
33.000
33.600
31.1U0
30.100
33.700
33.100
35.300
31.900
36.700
31.600
31.900
37.300
35.600
32.000
MEAN
30.8250
30.1000
31.8199
31.6667
33.3333
32.6333
36.5000
32.0667
31.6500
32.0000
30.1333
31.3333
33.7000
30.6667
30.6667
32.6667
33.1667
ST.OEV.
0.655
0.356
1.399
0.577
0.577
0.379
1.308
2.053
1.550
1.000
0.153
1.155
0.755
1.528
0.577
0.577
0.153
Rejected values
Lab
Β
Κ
Method
SPAA
COEXCOL
Mean 47 st.dev.
2.54 +/ 0.5
27.7 +/ 0.6

130
TABLE A
3 1 b
RM288 ANTIMONY, UG/G
32.5 + / 0 .9 j ig /g c e r t i f i e d
F NAA
2 8 . 0 0 3 0 . 0 0 3 2 . 0 0 3 4 . 0 0 3 6 . ü O 3 6 . 0 0 4 0 .
, . . + ♦ . . . . . · . . + . . ; . . . . . ♦ + + ■»
G SCINAA
0 I AA
C C O A A S
I" N HAAS
Ü N A A S ■ * ·
E HAAS
I HAAS
I AAS
H ETAAS
K ETAAS
S C L D C P
Ü C O D C P
H CEXCOL
I E X C O L
N E X C O L
L E X C O L * ·

- 131 -
Table A.31c
Summary of Statistical Data
CRM No. : 288 Element : Sb
Number of accepted sets of results ρ = 17 Number of accepted individual results Ν = 77
Mean of data set (*) means
Standard deviation of the distribution of the means
M = 32.5 jjg/g
S = 1.8 >ig/g
Normality of the distribution of the means Normal
Within labs st.dev,
Between labs st.dev.
95 % confidence interval of the mean of means
Sw = 1.2 >jg/g
SB = 1.8 yg/g
32.5 +/- 0.9 jjg/g
(this value is certified)
(*) The data in one set were obtained with the same method in the same laboratory.

- 132 -
Table 32a
Selenium in RM 288 - all values in ug/g
Measured values
Lab
F C
Method
NAA EX-ETAAS
Repli cates Mean
θ.18; 0.10; 0.10; Ό.16 0.135 0.005; 0.005; 0.005 0.005
St.dev
0.041 0.000
Esimate by SSMS :
¿ 0.05
Upper limits :
Lab
G
E
M
Ν
Η
Κ
D
S
Method
SCINAA
NCOXRF
COXRF
COXRF
CLCEXCOL
CLCEXCOL
NHAAS
NHAAS
Limit
< 0.2
< 0.15
< 0.1
C 0.05
< 0.1
< 0.1
¿ 0.05
< 0.05
CRM No.
Element
288
Se
Table A.32c
Summary of Statistical Data
Number of accepted
sets of measured values
individual measured values
Number of useful upper limits
2
7
Certified upper limits < 200 ng/g

133
TABLE Α.33a RM288 T I N , JUG/G
REPLICATES MEAN ST.OEV.
F NAA
6 SCINAA
O NAA
Β SPAA
C COAAS
D NAAS
E EXAAS
M EXAAS
L ETAAS
I ICP
H CEXCCL
K CEXCOL
32.800 31.300 28.600 34.400
28.300 29.700 23.600 20.700
24.000
28.000
32.000
41.000
29.COO
26.000
33.000
24.000
32.000
21.000
32.000
25.000
31.000
29.000
28.000
35.000
26.000
33.000
31.000
20.000
31.000
28.000
29.000 30.000 30.COO
35.500 36.700 33.000
S CLOCP 30.000 31.000 31.000
28.300 31.600 31.300
32.000 34.000 32.000
27.000 28.000 28.000
31.7750
25.5750
41.000
34.000
30.000
25.000
31.000
30.200 27.300 29.000 28.900 29.000
29,500
33.000 32.OCO 32.000
28.700 28.100 29.000
30.400 29.800 29.600
Τ CEXCCL 34.000 35.000 35.500
29.6296
28.9833
32.3333
28.6000
29.9333
29.6667
35.0667
30.6667
30.4000
32.6667
27.6667
2.466
4.168
5.047
0.95Ô
0.577
0.456
0.416
0.577
1 .888
0.577
1.825
1.155
0.577
34.8333 0.764
Rejected values : Lab
J
Method
COAAS
Mean +/ st.dev.
38.7 +/ 1.5

134
TABLE Α.33b RM286 TIN, JJG/G
20.00 25.00 30.00 35.00
..+....
F NAA
G SCINAA
0 NAA
Β SPAA
C COAAS
D NAAS
E EXAAS
M EXAAS
L ETAAS
S CLDCP
1 ICP
H CEXCÜl
K CEXCCL
Τ CEXCOL
*
« 0 . . . ♦
30.6 + / 1.5 j jg /g c e r t i f i e d

- 135 -
Table A.33c
Summary of Statistical Data
CRM No. : 288 Element : Sn
Number of accepted sets of results ρ = 14 Number of accepted individual results Ν = 71
Mean of data set (*) means
Standard deviation of the distribution of the means
M = 30.6 |ig/g
S = 2.6 ^g/g
Normality of the distribution of the means Normal
Within labs st.dev.
Between labs st.dev.
95 % confidence interval of the mean of means
Sw = 3.6 yg/g
SB = 1.4 yg/g
30.6 +/- 1.5 yg/g
(this value is certified)
(*) The data in one set were obtained with the same method in the same laboratory.

136
TABLE A.34a RM288 TELLURIUM, UG/b
F NAAC2)
0 NAA
Β SPAA
E COXRF
Κ COXRF
S NHAAS
0 NAAS
H SAAS
J AAS
Τ AAS
C COETA
Η ETAAS
Κ ETAAS
Η SICP
I ICH
S SOCF
A SCOCOL
H CLCOCO
K SCOCCL
L SCOCCL
■
REPLICAÍ
31.100
30.000
33.100
33.000
33.800
31.000
30.000
35.600
33.100
36.000
35.000
29.000
35.000
33.100
32.600
28.700
32.000
28.000
35.000
36.000
30.200
30.700
ts
31.800
27.000
30.500
32.100
31.500
31.000
36.600
32.000
36.000
35.000
30.000
36.000
33.000
32.100
25.900
31.000
28.000
35.000
37.000
30.800
30.500
3U.0U0 3 1.O0I) 28.000
32.200 33.OOC 33.100
32.100
33.500
30.000
37.800
33.000
36.000
36.000
29.000
36.000
32.900
32.700
29.900
32.OOC
28.000 28.00Γ
36.000
36.000
31.500 31.60U 31.300
HtArt
34.6000
29.2000
32.1833
32.8667
31.0000
30.33 33
36.6667
32.7000
36.0000
35.3333
29.3333
35.6667
33.0000
32.5667
28. 1667
31.6667
28.0000
35.3333
36.5333
30.9129
SI .LEV.
0.283
1.613
1.030
0.808
0.500
0.577
1.102
0.608
0.000
0.577
0.577
0.577
0.100
0.153
2.053
0.577
0.000
0.577
0.577
0.532
Rejected values : Lab Method Mean St.dev.
AAS 6.53 0.75

137
TABLF Α.34b RM288 T E L L U R I U I " , UG/G
2 1 . 0 0 2 6 . 0 0 2 « . 0 0 3 0 . C C 3 2 . 0 0 3 1 . 0 0 3 6 . 0 0 3 8 . 0 0 1 0 .
. . · ♦ . . . . . . * . . . . . . 4 . . . . . . 4 . . . · . . 4 · . . . . . . + . . . . . . 4 · . . . . . . + . . . . . . ♦
F N A A ( 2 )
0 MAA
Β SΡΑΛ
E CDXhF
I" COXRF
S NHAAS
D NAAS
H SAAS
J AAS
Τ AAS
C COETA
H ETAAS
K ETAAS
H S I C F
1 ICP
S SOCP
A SCOCCL
H CLCUCO
K SC OC (¡L
L SCOCOL
32 .8 + / 1.3 ug/g c e r t i f i e d

- 138 -
Table A.34c
Summary of Statistical Data
CRM No. : 288 Element : Te
Number of accepted sets of results ρ = 20 Number of accepted individual results Ν = 69
Mean of data set (*) means
Standard deviation of the distribution of the means
Normality of the distribution of the means
M = 32.8 ug/g
S = 2.8 jjg/g
Normal
Within labs st.dev.
Between labs st.dev.
95 % confidence interval of the mean of means
Sw = 0.9 yg/g
SB = 2.7 ^g/g
32.8 +/- 1.3 jjg/g
(this value is certified)
(*) The data in one set were obtained with the same method in the same laboratory.

139
TABLE A
35a RM288
UNIT
Β SPAA
Κ EXETA
C NAAS
0 NAAS
y NAAS
E N ICP
S NOCP
I OGS
KEPLICATEÍ
2 . 1 0 0 C
2 . 1 C 0 0
2 . 2 C 0 0
2 . 2 0 0 0
2 . 3 4 0 0
2 . 3 0 0 0
2 . 0 7 0 0
¿. iOOC
2 . 4 3 0 0
THALL IUM,
2 . 2 0 0 0
2 .20CO
2 . 2 0 0 0
2 . 2 5 Ü U
2 . 3 0 0 0
2 . 1 5 0 0
c.bOOO
2 . 1 4 0 0
pG/V,
2 . 5 0 0 0 2 . 4 0 0 0 2 . 1 0 0 0
2 . 2 0 0 0
2 . 2 0 O 0
2 . 3 4 O 0
2 . 3 0 0 0
2 . 0 5 0 0
2 . 4 0 0 0
2 . 4 1 0 0
MEAN
2 . 2 3 3 3 3
2 . 2 0 0 0 0
2 . 2 0 0 0 0
2 . 31 UDO
2.30COÜ
2.C9CC0
2 . 4 0 0 0 0
2 .32b fc7
S T . L E V .
0 . 1 7 5
o.nco
o.coo
0 . 0 5 2
0 . 0 0 0
0 . 0 5 3
0 .1CO
0 . 1 6 2
Rejected va lues
Lab
H
Method
ETAAS
Mean + / s t . d e v .
2.43 1 / 0.12

140
TABLE A.35b RM288 THALLIUM, pG/G
α o 00
ru
O 3
. (\J
O O VO ♦
• ru
o o iP +
O
o
ru
C_)
3
» ru
o o C\l 4>
O
ru
o o o
• ru
O
o
o <S3 ■*■
· · · · · · · ·
ω
0J CJ
σι
σι 3 ,
O
I '— + κι
■ (NI
«t < CL
I
co
CO
•«I
I χ
LU
CO
< I
2
CO
<r ι
£ 3
I co LD O
LU co

141
Table A.35c
Summary of Statistical Data
CRM No. : 288
Element : Tl
Number of accepted sets of results ρ = 8
Number of accepted individual results Ν = 27
Mean of data set (*) means M = 2.26 ug/g
Standard deviation of the
distribution of the means S = 0.10 ug/g
Normality of the distribution
of the means Normal
Within labs st.dev. S = 0.11 ug/g
w '
Between labs st.dev. Sß = 0.07 jjg/g
95 % confidence interval
of the mean of means : 2.26 +/ 0.08 yg/g
Certified value :
2.3 +/ 0.1 fig/g

142
TABLE A.36a Rr2B8 Z IKC, fJG/O
F NAA
G NAA
G SCINAA
C NAA
Β SPAA
C NAAS
0 NAAS
f NAAS
Κ SAAS
S NAAS
H AAS
I AAS
K AAS
R AAS
Τ AAS
E N I C F
R E P L I C A I
6 . 3 0 0 0
7 . 7 7 00
8 . 0 3 0 C
7 . 8 0 0 0
9 . 1 0 0 0
9 .3COC
8 . 2 0 O C
9 . 3 C 0 C
8 . 6 0 0 0
8 . 7 0 0 C
7 . 7 C O 0
e.bunc
8 . 2 C 0 0
8 . 6 C U 0
7.<JC0C
8 . 2 0 O C
8 . 0 7 0 0
9 . 0 0 0 0
8 . 2 0 0 0
9 . 6 0 0
7 . 7 6 0 0
6 . 1 0 0 0
7 . 3 7 C O
7 . 9 5 0 O
8 . 5 0 0 0
8 . 0 0 Π 0
8 . 2 0 0 0
9 . 6 0 0 0
8 . 1 0 0 O
9 . 0 0 0 0
7 . 8 0 0 O
e . 8 0 0 0
& . 0 0 0 0
9 . 1 0 0 0
9 . 0 0 C O
8 . 1 0 0 0
8 . 3 0 0 0
8 . 1 0 0 0
7 . 8 0 0 O
1 0 . 0 0 0
7.920C1
6 .OUO0
7 . 3 1 0 1
6 . 3 1 0 0
8 . 6 Ü 0 L
7 .5GOL
8 . 0 0 0 1 .
9 . 8 0 0 C
9 . 8 0 0 C
8 . 0 0 0 0
8 . 6 0 0 0
7 . 8 0 0 0
9 . 1 0 0 0
8 . 1 0 0 0
8 . 2 U 0 0
8 . 5 1 0 0
8 . 5 0 U 0
B.nuoo
9 . 8 U 0
7 . 8 P 0 O
6 . 5 0 0 0
7 . 8 7 0 0
7 . 0 0 0 0
8 . £ 0 0 0
7 . 6 U 0 C
7 . 5 0 0 0
8 . 6 0 0 0
8 . 2 0 0 0
8 . 0 0 0 0
8 . 1 0 0 0
7.6unu
9 . 7 U 0 O
p.eono
MEAN
6 . 5 2 5 0 0
7 . 5 8 0 0 0
7 . 3 2 2 5 0
f . 1 3 6 3 6
8 . 8 6 6 6 6
7 . 8 3 3 3 3
8 . 6 3 3 3 3
7 . 9 9 4 9 9
8 . 9 3 3 3 3
B . 3 3 3 3 3
8 . 1 6 6 6 6
8 . 2 9 3 3 3
8 . 6 3 3 3 3
8 . 0 0 0 0 0
9 . 8 0 0 0
7 . 8 3 3 3 3
ST . O h V .
0 . 2 6 3
0 . 2 8 1
0 . 8 2 1
0 . 7 3 1
0 . 5 1 3
0 . 1 5 3
0 . 1 5 3
0 . 2 0 0
0 . 2 8 9
0 . 5 8 6
0 . 0 5 8
0 . 2 2 0
0 . 3 2 1
0 . 2 0 0
0 . 2 0 0
0 . 0 8 1
Rejected values : Lab Method Mean St.dev.
AAS 6.53 0.75

- 143 -
TABLE A-36b PM288 - Z I N C , JJG/G
6.COO 6 . 5 0 0 7 . 0 0 0 7 . 5 0 0 8 . 0 0 0 . 8 . 5 0 0 9 . 0 0 0 9 . 5 0 0 1 0 . 0 0 1
F NAA
G NAA
G SCINAA
O NAA
B S-PAA
C N-AAS
U N-AAS
M N-AAS
N S - A A :
S N-AAS
H AAS
I AAS
K AAS
R AAS
T AAS
E N - I CP
8.2 + / - 0.4 yg/g c e r t i f i e d

- 144 -
Table A.36c
Summary of Statistical Data
CRM No. : 288 Element : Zn
Number of accepted sets of results ρ = 16 Number of accepted individual results Ν = 73
Mean of data set (*) means M = 8.2 yg/g
Standard deviation of the distribution of the means S = 0.7 yg/g
Normality of the distribution of the means Normal
Within labs st.dev.
Between labs st.dev.
Sw = 0.5 ug/g
SB = 0.6 jg/g
95 % confidence interval of the mean of means 8.2 +/- 0.4 yg/g
(this value is certified)
(*) The data in one set were obtained with the same method in the same laboratory.


CDNA09665ENC