UNCLIlSSIFIED SEP Bi WES/NP/EL-Bi-5 - dtic.mil
72
7 D-R120 408 ECOLOGICAL INVESTIGATION OF A GREENTREE RESERVOIR IN i/i JS4(8 THE DELTA NATIONAL F..(U) ARMY ENGINEER UATERNAYS EXPERIMENT STATION VICKSBURG MS ENYIR. C J NEWLING UNCLIlSSIFIED SEP Bi WES/NP/EL-Bi-5 F/G 2/6 N IND
-
Upload
khangminh22 -
Category
Documents
-
view
2 -
download
0
Transcript of UNCLIlSSIFIED SEP Bi WES/NP/EL-Bi-5 - dtic.mil

7 D-R120 408 ECOLOGICAL INVESTIGATION OF A GREENTREE RESERVOIR IN i/i
JS4(8 THE DELTA NATIONAL F..(U) ARMY ENGINEER UATERNAYS
EXPERIMENT STATION VICKSBURG MS ENYIR. C J NEWLING
UNCLIlSSIFIED SEP Bi WES/NP/EL-Bi-5 F/G 2/6 N
IND

1111 10 ~ 128 1112L611=0 111112.2
11111- lll111 ____
MICROCOPY RESOLUTION TEST CHARTNATIONAL BUREAU OF STANDARDS- 1963-A

MISCELLANEOUS PAPER EL-81-5
' ~' ECOLOGICAL INVESTIGATION OF AGREENTREE RESERVOIR IN THE DELTA
NATIONAL FOREST, MISSISSIPPIq by
Charles J. NewlingEnvironmental Laboratory
U. S. Army Engineer Waterways Experiment StationP. 0. Box 631, Vicksburg, Miss. 39180
September 1981-Final Report
0
Approved For Public Release: Distribution Unlimited
I
• ]
Prepared for Assistant Secretary of the Army (R&D)Department of the ArmyWashington, D. C. 20310
FILEI
18 125
I8 ni10I

i0
Destroy this report when no longer needed. Do not return 0it to the originator.
The findings in this report are not to be construed as on officialDepartment of the Army position unless so designated.
by other authorized documents.
The contents of this report are not to be used foradvertising, publication, or promotional purposes.Citation of trade names does not constitute anofficial endorsement or approval of the use of
such commercial products.
v0

UnclassifiedSECURITY CLASSIFICATION OF THIS PAGE (When Date Entered)
REPORT DOCUMENTATION PAGE READ INSTRUCTIONSREPORT__ DOCUMENTATIONPAGE_ BEFORE COMPLETING FORM
,. REPORT NUM1ER j1. GOVT ACCESSION NO. 3. RECIPIENT'S CATALOG NUMBER
Miscellaneous Paper EL-81-5 AD-IO - -02'4. TITLE (and Subtitle) 5. TYPE OF REPORT & PERIOD COVERED
ECOLOGICAL INVESTIGATION OF A GREENTREE Final report
RESERVOIR IN THE DELTA NATIONAL FOREST, 6. PERFORMINGORG. REPORT NUMBERMISSISSIPPI
7. AUTHOR(.) 8. CONTRACT OR GRANT NUMBER(&)
Charles J. Newling
9. PERFORMING ORGANIZATION NAME AND ADDRESS 10. PROGRAM ELEMENT. PROJECT. TASKAREA & WORK UNIT NUMBERS
U. S. Army Engineer Waterways Experiment Station
Environmental LaboratoryP. 0. Box 631, Vicksburg, Miss. 39180 .
11. CONTROLLING OFFICE NAME AND ADDRESS 12. REPORT DATE
Assistant Secretary of the Army (R&D) September 1981Department of the Army 13. NUMBER OF PAGES
Washington, D. C. 20310 6514. MONITORING AGENCY NAME & ADDRESS(f different from Controlling Office) IS. SECURITY CLASS. (of this report)
UnclassifiedfSa. DECLASSIFICATON/DOWNGRAOING
SCHEDULE
16. DISTRIBUTION STATEMENT (of thi. Report)
Approved for public release; distribution unlimited.
17. DISTRIBUTION STATEMENT (of the abstract entered in Block 20, If different from Report)
IS. SUPPLEMENTARY NOTES
Available from National Technical Information Service, 5285 Port Rwral Road,Springfield, Va. 22151.
19. KEY WORDS (Continue on reveree side It necessary and Identify by block number)
Delta National ForestEcological successionFloodingReservoirs
20. ABST RACT rcsntnue enrer sidw if rvceeeY and Idewify by block number)
*- A greentree reservoir under continuous dormant season flooding for18 years was compared with an adjacent reference area to determine the effectsof this type of flooding management on the plant community, soils, and birdpopulations of the area. Continuous greentree management over 18 yearsappeared to cause a predictable shift to more water-tolerant plant. commnitiesin the woody and herbaceous understory strata of the greentree reservoir.cause the design of the greentree reservoir resulted in slowcr drainage of
(Continued) •
DI JAM 473 EDITIO6 OF INOV 65 IS OBSOLETE Unclassified
SECURITY CLASSIFICATION OF THIS PAGE (When D# a Fnered)
- - i - -----

UnclassifiedSECURITY CLASSIFICATION OF THIS PAGE(IWan Data nifed)
20. ABSTRACT (Continued)
water ponded on the reservoir by rain or backwater flooding during the growingseason, neither dormant season flooding, growing season flooding, nor theinteraction of both was identified as the sole cause of the community shift.Soils were very similar on both sites. Winter flooding of the greentreereservoir made it more attractive than the reference area to common grackles(Quiscalus quiscula) and highly attractive to waterfowl, but less attractive 0to the white-throated sparrow (Zonotrichia albicollis), a ground dweller.For other bird species, however, greentree reservoir management appearedto have very little effect on species richness or mean population sizes.
0- "•
u0
-nclassifie
SSTD
-."t b t ). "--
UnclassifiedSECURITY CLASSIFICATION OF THIS PIACErIThn Data Enited) !
S S S - - - - - - - -I

[
PREFACE
This report was prepared under the In-House Laboratory Independent
Research Program of the U. S. Army Engineer Waterways Experiment Station
(WES).
This report was written by Mr. Charles J. Newling, Biologist,
Environmental Laboratory (EL), WES, who performed and/or directed all S
phases of the field work and data analysis with assistance as follows.
Most of the bird censusing was conducted by Mr. Michael Buchanan, EL.
Plant and soils data were collected with the assistance of Mr. Buchanan,
Mr. E. Harris Applewhite, EL, Ms. Jennifer Ficken Buchanan, EL, S
Mr. C. Stuart Patterson, EL, Mr. William E. Jabour, EL, and Ms. Mary
Berndt, EL. Increment coring data were gathered with the aid of Mr.
Jabour, Ms. Ramona A. Warren, EL, and Mr. Harvey L. Jones, EL. Consul-
tation in sampling methods and ecological interpretation was provided S
throughout the study by Mr. Charles V. Klimas, EL. Statistical design
and analysis were provided by Mr. David Carlile, Louisiana State Univer-
sity, Department of Experimental Statistics, Baton Rouge. Manuscript
review was provided by Dr. Kenneth T. Ridlehuber, Texas A&M University, S
College Station, Mr. Klimas, EL, Mr. Hollis H. Allen, EL, and
Dr. Hanley K. Smith, EL.
Work was performed under the technical leadership and supervision
of Or. Hollis H. Allen, Team Leader, Revegetation and Habitat Develop- S
ment Team, EL; and under the general supervision of Dr. Hanley K. Smith,
Ecologist, Wetland and Terrestrial Habitat Group, EL, Dr. Conrad J.
Kirby, Chief, Environmental Resources Division, EL, and Dr. John
Harrison, Chief, EL. •
Commanders and Directors of WES during the preparation and publi-
cation of this report were COL Nelson P. Conover, CE, and COL Tilford C.
Creel, CE. Technical Director was Mr. Fred Brown.
1-
- - e - - - - - - -

This report should be cited as follows:
Newling, C. J. 1981. "Ecological Investigation of
a Greentree Reservoir in the Delta National Forest,
Mississippi." Miscellaneous Paper EL-81-5. U. S.
Army Engineer Waterways Experiment Station, CE, )Vicksburg, Miss. i
21
o 0 - - - - - - - -- O '

CONTENTS
PageItPREFACE. .. ............ ................. 1PART I: INTRODUCTION. .. ........... .......... 4
Greentree Reservoirs. ...... ............... 4
The Study Area. ...... .................. 5
*PART II: METHODS. .. ............ ............ 11
Study Site Selection .. ............ ....... 11Vegetation and Soil Sampling .. ............ ... 12Bird Census. .. ............ ............ 15
*PART III: RESULTS .. ............ ............ 18
Vegetation. ..... ................ .... 18Soils .. .......................... 25Bird Populations .. ............. ........ 25
PART IV: DISCUSSION. ..... ............... ... 33
PART V: CONCLUSIONS .. ............ .......... 39
REFERENCES. ...... ............... ....... 41-0
TABLES i-li .. ...... ................ ..... 45
APPENDIX A: RANDOM NUMBERS FOR VEGETATION SAMPLINGON THE STUDY AREA .. ............ ..... Al
APPENDIX B: DEFINITIONS OF TERMS. .. ............ ... BI
APPENDIX C: SCIENTIFIC AND COMMON NAMES OF PLANTS .. ....... Cl
3

ECOLOGICAL INVESTIGATION OF A GREENTREE RESERVOIR
IN THE DELTA NATIONAL FOREST, MISSISSIPPI
PART I: INTRODUCTION
Greentree Reservoirs
1. Greentree reservoirs are areas developed in bottomland hard-
wood forests for the dual purpose of providing wintering habitat for
waterfowl and enhancing timber production. They are artificially
flooded to a shallow depth during the late fall when trees begin dor-
mancy 4nd are drained in early spring before the trees break dormancy.
Food (primarily acorns) and habitat are made available to waterfowl by
winter impoundment. When the timing of flooding and draining is managed 0
carefully, it is generally believed that increased soil moisture carried
into the growing season increases mast production, improves tree growth,
and reduces fire hazards. In theory, a correctly managed greentree res-
ervoir should enhance both waterfowl and timber resources (Rudolph and .
Hunter 1964). Greentree reservoirs have been used within recent years
to mitigate the loss of waterfowl habitat incurred through the con-
struction of flood control projects (U. S. Army Engineer District,
Vicksburg 1976). -.
2. Although greentree reservoirs have been in operation since the
late 1930's (Rudolph and Hunter 1964), few studies have been published
that quantify the ecological characteristics of these man-made ecosys-
tems. Documentation of waterfowl populations on greentree reservoirs
and increases in those populations have have been reported (Hall 1962,
Kerz and Brakhage 1964, Rudolph and Hunter 1964, Brakhage 1966, Thompson
et al. 1968, Cowardin 1969, Sweet 1976). Availability of potential food
items was studied by Sweet (1976), Krull (1969), and Hubert and Krull S
(1973). Hanson (1978) studied incidence of lead shot potentially avail-
able to foraging waterfowl at a southern Illinois greentree reservoir.
McCracken and Solomon (1980) briefly discussed insect and disease
47
w - -
problems in these reservoirs. Existing information also indicates that
failure to drain greentree reservoirs at the prescribed time in the
spring may damage or kill trees (Rudolph and Hunter 1964).
3. It has been reported that bottomland hardwood tree species
have differential tolerance to flooding. Comprehensive reviews are pro-
vided by Gill 1970, Tattar 1972, Teskey and Hinkley 1977, Whitlow and
Harris 1979, and Klimas et al. 1981. With respect to greentree reser-
voirs, short-term studies have reported growth benefits in commercially
valuable tree species (Broadfoot 1958, 1964, 1967, 1973; Broadfoot and
Williston 1973). However, at least one study (Fredrickson 1979) indi-
cated improved growth may not always occur in greentree reservoirs for
all species. Likewise, short-term studies on a particular greentree
reservoir in southeast Missouri indicated improved acorn production
(Minkler and McDermott 1960, Merz and Brakhage 1964, Minkler and Janes
1965), but a later study covering a longer period on the same site
failed to substantiate the earlier findings (McQuilkin and Musbach 1977).
Ecological overviews of greentree reservoirs in southern Illinois
(Thompson 1971, Thompson and Anderson 1976) and in southeast Missouri
(Fredrickson 1979) have illustrated the complexity of these habitats.
4. The purpose of this study was to improve the understanding of
the long-term ecological effects of greentree reservoir operation by
collecting quantitative data on the overall plant community, soils, hy-
drology, and nonwaterfowl wildlife component on an area under annual 0
greentree management.
The Study Area
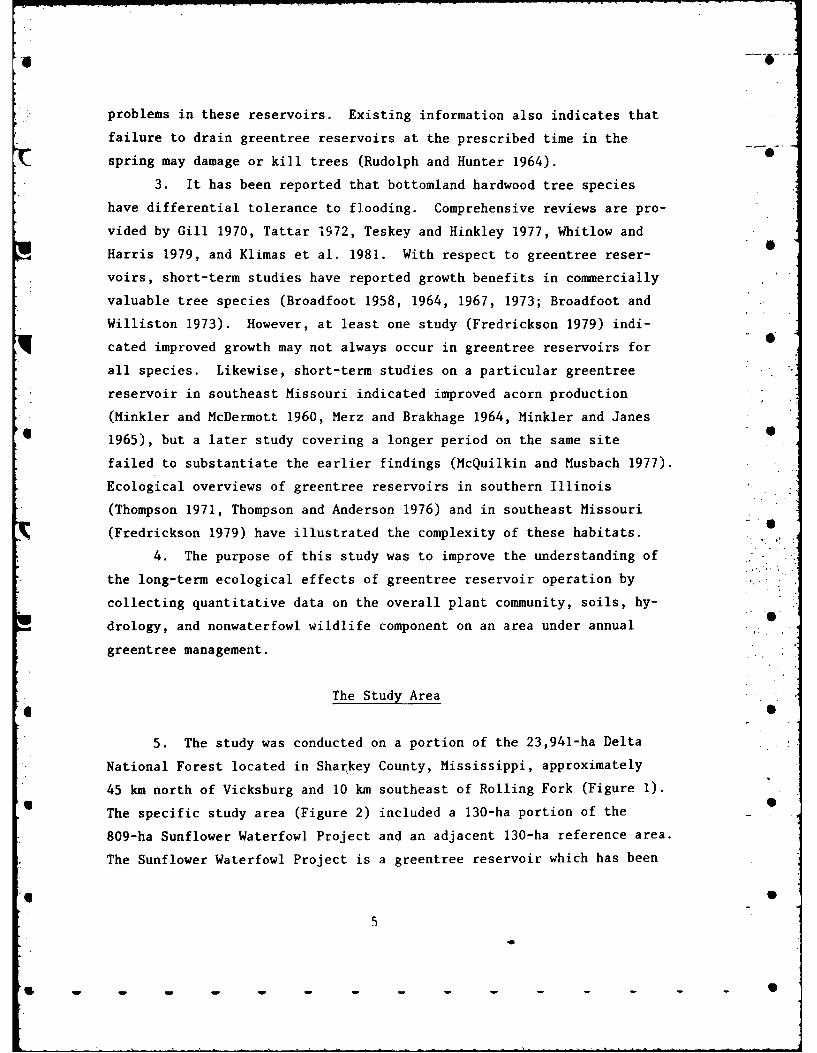
5. The study was conducted on a portion of the 23,941-ha Delta
National Forest located in Sharkey County, Mississippi, approximately
45 km north of Vicksburg and 10 km southeast of Rolling Fork (Figure 1).
The specific study area (Figure 2) included a 130-ha portion of the
809-ha Sunflower Waterfowl Project and an adjacent 130-ha reference area.
The Sunflower Waterfowl Project is a greentree reservoir which has been
5U, w • ----- ]

MISSISSIPPI
STE
146 -------
........ LOCATION MAP
-0 1 23,2
%0
25 3 28 7 2630 -
6
*5 ~ S 5 5 5 - -- --
Iw. '10

-N-
t.GE
RERESERVOI NO.13
60 I 0I4JR
REFERENCE AREAI
ccS
4 57 EEVI O
- - - - - -- - -

operated jointly by the Mississippi Department of Conservation and the
U. S. Forest Service since 1960.*
6. The study area is located on the expansive alluvial floodplain
of the Mississippi River and its tributaries commonly referred to as
"the Mississippi Delta" (Carter 1978). It is part of the Mississippi
Alluvial Floodplain physiographic region that is located in the northern
extension of the Gulf Coastal Plain called the Mississippi Embayment
(Carter 1978, Brown 1947).
7. All of the land surface of Sharkey County is of alluvial
origin deposited by the Mississippi and Yazoo Rivers (Scott et al. 1962).
The greentree reservoir and reference area are composed of flats and de- 0
pressions formed in slack water areas (Johnson and Price 1959). Flats
range from approximately 25.89 m to 27.72 m above mean sea level (msl),
while depressions have elevations less than 25.89 m msl (U. S. Army Engi-
neer District, Vicksburg 1964). The soils of the study site are of the 0
Sharkey-Alligator-Dowling association which are level to nearly level
with a normal slope of less than 2 percent. Some areas of these poorly
drained, fine-textured soils, especially those found along long, narrow
depressions, are subject to annual backwater flooding (Scott et al.
1962).
8. Braun (1950) placed the bottomland hardwood forest of the
Mississippi River alluvial floodplain in the Southeastern Evergreen
Forest Region of the Deciduous Forest Formation although Lhf. Delta 0
National Forest completely lacks the evergreen component of this classi-
fication (Carter 1978). The climate of the area has been described as
temperate with mild, wet winters; hot, humid summers; and fairly con-
stant rainfall throughout the year except in late summer and early fall 0
(Carter 1978). Mean yearly precipitation is 130.53 cm, with the driest
month, October, having 6.48 cm and the wettest month, March, 14.45 cm
(National Oceanic and Atmospheric Admini 5ration (NOAA) 1973). Sleet
and snowfall are generally light, and accumulation averages 5.84 cm,
Personal communication, John Kerr, 10 April 1981, Division of Wild-
life and Fisheries, Mississippi Department of Conservation, Jackson,Mississippi.
8

most of which occurs in January (NOAA 1975). Mean yearly temperature in
the lower Delta is 180C (NOAA 1973), with an absolute maximum of 41*C
and an absolute minimum of -21C (NOAA 1975). The mean length of the
growing season in the area is 225 days (Johnson and Price 1959), with
the last spring freeze occurring on approximately 21 March and the first
fall freeze approximately 1 November (McWhorter 1962).
9. The lower Yazoo Basin, including the Delta National Forest, 0
is very susceptible to annual spring flooding (Carter 1978). Except
during extremely dry years, parts of the Delta National Forest are
flooded every year. Water levels of at least 27.41 m for 3 to 4 weeks
duration have been recorded at the Big Sunflower River gauging station 0
at nearby Holly Bluff in 55 of the 66 years from 1912 through 1977.
During these years, depressions and extensive low-lying flat areas in-
cluding most of the study area were inundated. During the same 66-year
period, water levels of at least 28.02 m (inundating all of the study 0
area) occurred 41 times, and water levels greater than 28.93 m occurred
18 times flooding all but the highest natural levee ridges along the Big
Sunflower and Yazoo Rivers. The highest level recorded on the Holly
Bluff gauge, 33.66 m, occurred during the 1927 flood (U. S. Army Engi- S
neer District, Vicksburg 1981). The highest site in the Delta National
Forest is 30.46 m msl (Carter 1978).
10. The Delta region was totally open to annual spring flooding
of the Mississippi River and inundation of the entire area was common
prior to 1879 when construction of an extensive levee system was autho-
rized (Carter 1978). The entire Delta National Forest was flooded 22
times from 1828 through 1927. Since the completion of an extensive
Mississippi River levee system, however, flooding occurs only in high- S
water years and with less severity. With the exception of the devasting
flood of 1927, flooding on the study area has been due primarily to back-
water flooding by the Yazoo and Sunflower Rivers (Johnson and Price
1959). Upon completion, the Yazoo Backwater Project, which is presently S
under construction, will greatly reduce flooding on the Delta National
Forest (U. S. Army Engineer District, Vicksburg 1976). This project
could have a profound effect on the species composition of the Delta
9

National Forest, causing a gradual shift to a more xeric forest type
(Carter 1978).
100

PART II: METHODS
Study Site Selection 6
11. The Sunflower Waterfowl Project was selected as the greentree
site (Figure 2) because it was typical of greentree reservoir habitat in
the lower Delta and because a very similar reference area could be lo-
cated nearby. The south half (130 ha) of Reservoir No. 3 within the Sun-
flower Waterfowl Project was selected as the experimental site. The
reference site selected was a 130-ha tract of forest adjacent and imme-
diately south of Reservoir No. 3. Both sites compared favorably on -
several criteria. Both were composed of SAF forest Type 93 (Society of
American Foresters 1975). A brief field survey revealed similar stock-
ing rates on both sites.* The overstory** component of Reservoir No. 3
and the reference area matched well, suggesting the preimpoundment cover
types were similar on both sites. The elevations, topography (U. S.
Army Engineer District, Vicksburg 1964), and the soils (Scott et al.
1962) of the two sites were very similar. Table 1 presents a comparison
of characteristics of the two sites identified prior to data collection. 0
12. The greentree site has been flooded by pumping from the Big
Sunflower River every winter since 1962.t The reference site was
flooded naturally by backwater inundation from Howlett Bayou and the
Little Sunflower River, with general flooding occurring as previously
described for elevations above 27.41 m (Figure 1). With the exception
of the winter management season, the greentree site was flooded with
the same frequency as the reference area by water which entered through
the open weir in the southwest corner of the site. During some years
* Personal communication, Tom Coppinger, 29 February 1980, USDA
Forest Service, Delta National Forest Headquarters, Rolling Fork,Mississippi.Complete definitions for technical terms used throughout this report
are listed in Appendix B.t Personal communication, John Kerr, 10 April 1981, Division of
Wildlife and Fisheries, Mississippi Department of Conservation,Jackson, Mississippi.
q S
11

the reference site remained relatively dry, while the greentree reser-
voir was flooded every winter and emptied rather slowly because its
levees and weirs provide only limited rates of drainage. During the .
growing season, water from a heavy rainfall or backwater flooding ponded
on it considerably longer than on the reference site, making the green-
tree reservoir the wetter of the two sites.
Vegetation and Soil Sampling
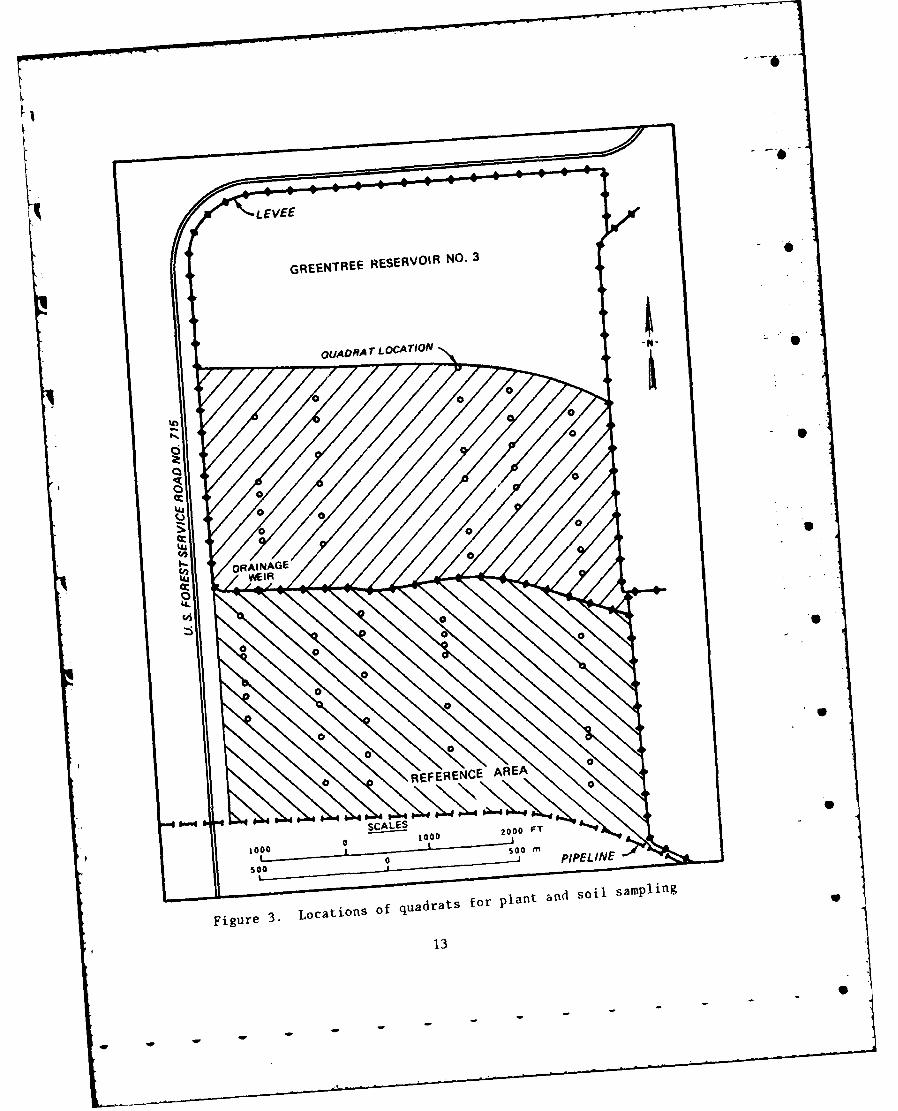
13. A randomized block sampling design employing nested circular
q plots was used to gather vegetation and soil data. Thirty locations com- iprising five transects with six plots each were sampled on each 130-ha
site (Figure 3). Both transects and plot positions were located using
a grid system and random numbers (Appendix A).
14. Vegetation sampling was conducted within nested circular 0
plots located relative to a center stake. The overstory or canopy
trees (diameter at breast height (dbh) >6.6 cm) were tallied by species
and diameter (to the nearest 0.1 cm) in circular 0.04-ha (11.2-m radius)
plots. Dead trees, both standing and fallen, were recorded separately, 0
noting species (if possible), dbh of standing dead, and length and diam-
eter at the middle of all down stems (diameter >10 cm). Finally, a
count was made of all visible tree cavities within the plot which had
potential use to wildlife species; the tree species in which the cavity S
occurred was also recorded.
15. The understory was sampled using nested 0.004-ha (3.6-m ra-
dius) circular plots. Living shrubs, vines, and saplings >1 m in length
with dbh less than 6.6 cm were tallied by species. Diameter to the near- S
est 0.1 cm was recorded for all specimens >1.0 cm dbh (1.5 m from their
rooting point). Height to the nearest 0.5 m was recorded for shrubs and
saplings.
16. The herbaceous stratum was sampled using the same 0.004-ha 0
circular plots used to sample the understory. Number of living plants
by species was recorded for seedlings (woody plants <1 m in height or
length) and herbaceous vascular plants.
12
0-
0
0S
0 0 S
0S
AINAGE
LL-IFigre .ocai~n o qudras or lan ~d sil amlifg0
01
SCALES

17. Overstory and understory data were summarized by stratum
for density, relative density, dominance (basal area), relative domi-
nance, frequency, relative frequency, and importance values (Cox 1967).
Herbaceous stratum data were summarized for density, relative density,
frequency, relative frequency, and importance values. Data were ana-
lyzed using, as appropriate, the parametric t-test (Sokal and Rohlf
1969), or the nonparametric Mann-Whitney U-test (Siegel 1956). The 0
Mann-Whitney U-test was used in those instances where the sample size
proved too small to attain a desired level of power and/or because the
random variable was measured at an ordinal level. A probability level
of 0.10 was used to determine statistical significance. Data analysis 0
and statistical testing were performed using procedures of the Statisti-
cal Analysis System (SAS) (Helwig 1978, SAS Institute 1979).
18. In order to detect possible differences between the two sites
(reference versus greentree) in mean tree growth rate, increment borings 0
were taken on each site from six unsuppressed trees of each of the fol-
lowing species: water hickory*, sugarberry, green ash, overcup oak, and
Nuttall oak. Unsuppressed trees were selected to minimize the growth
effects of all environmental factors except inundation. The dbh of each S
tree was recorded, and then an increment core was obtained using a 41-cm
Swedish increment corer. Increment cores were mounted and examined
under a dissecting microscope. The width of each ring was recorded for
the preceding 36 years (1945 through 1980). This covered the 18-year S
period of greentree reservoir operation and the preceding 18-year period.
The randomization test for independent samples, a nonparametric counter-
part of a t-test (Siegel 1956), was used to test for differences in
growth between the greentree reservoir and the reference. The random 5
variable used for the test was the difference between a tree's total
diameter growth for 18 years prior to flooding and its total diameter
growth for 18 years after flooding. The randomization test was used
* Appendix C lists all scientific and common names of plants used in
this report. Scientific nomenclature follows Radford et al. (1968).Where possible common names were taken from Scott and Wasser (1980);otherwise, Radford et al. (1968) or Fernald (1970) were the sources.
14

because of the interval level of measurement for the random variable and
because of the small sample size (n = 6 trees/species/site).
19. A composite soil sample was obtained near the center of each -
0.004-ha understory plot. Twelve to eighteen randomly selected 2.5-cm
cores were taken to a depth of 15 cm with a split-spoon sampler; com-
bined in a single sample bag; and later subsampled for analysis of grain
size, pH, total kjeldahl nitrogen (TKN), total carbon (TC), phosphorus - 0
(soluble in dilute acid-fluoride), and exchangable cations (Ca, Mg, K).
Test methods for chemical analysis were taken from Black et al. (1965).
Analyses were performed by the Geotechnical and Structures Laboratories
of the U. S. Army Engineer Waterways Experiment Station. 0
Bird Census
20. Bird populations in the greentree reservoir and reference S
site were estimated from counts taken along 0.8-km transects established
in each site (Figure 4). To provide comparability with Dickson's (1978)
study of a bottomland hardwood forest in south-central Louisiana, simi-
lar methods were employed. Multiple-width strips were Lsed to calculate S
population size; these strips differed in width for each species as did
effective detection distances (EDD). An EDD was determined for each
species after each count, based on the distribution of detection points
perpendicular to the transect center line. It was assumed that all S
species were detected effectively to a minimum of 12.5 m laterally from
the transect center line. Beyond this point, the EDD for each species
was the distance beyond which the number of birds per unit area in a
strip dropped below 75 percent of the number of birds per unit area for S
all strips nearer the transect center line (Dickson 1978). Dickson's
(1978) EDD corresponds closely with the inflection point that Emlen
(1971) used in determining the level of detection for various species.
Multiple-width strip distance categories of 6.4, 12.5, 18.9, 25.0, 31.4, S
62.8, 125.6, and 251.5 m were selected for easy conversion to area
(Emlen 1971, Dickson 1978).
21. A total of 41 counts were made, 3 to 4 each month, from June
15

POND 3
W 0 0
CIEEERENCE ARE
'U1
UU
a
SCLE
Figure 4. Location of transects for sampling bird populations
161

1980 to May 1981. The two tran.±cts were traversed within 3.5 hr after
sunrise, alternating directions on each successive count. Counts were
not made during moderate periods of rainfall or high winds (>30 kph).
Visual and audial observations were recorded separately; if both types
of observation were made for the same species on a given day, the count
which yielded the greater calculated population density was reported
(Emlen 1971, 1977). Although no distinction was made between male and
female birds in recording data, the population figures of permanent and
summer residents for this period more accurately represent territorial
males (Dickson 1978). This was because from April through July when
visual detections were limited by foliage, most of the permanent and
summer residents were detected audibly; and as reported by Dickson
(1978) the rate of male bird singing is at its highest during this
period. Confidence limits cl for mean monthly populations were calcu-
lated as cl = x ± t N nS where x is the monthly mean, n is the S
number of counts, s is the standard deviation, and t is the value
from a two-tailed t-table in which I-u is the proportion expressing
confidence and n-l is the degree of freedom.
22. Using bird species richness or number of species observed S
S , bird species diversity H' (Lloyd and Ghelardi 1964) and distribu-
tion of bird numbers among species or "equitability" J were determined
as in Dickson's (1979) study. Species diversity was calculated as H' -thIpjlog epi where p. is the proportion of individuals in the i.t
species and i = 1, 2,...S (Shannon 1948). Equitability was calculated
as J' = H'/H' where H' or equal distribution of individualsmax max
among a given number of species equals log e S
23. After vegetation data and one month of bird data had been
collected, a prescribed thinning cut was conducted on portions of the
greentree reservoir. Since some of the cuts would occur on part of the
original bird observation transect (labelled "former" in Figure 4),
the transect was changed to an undisturbed area of similar habitat
(labelled "relocated"). Data from June 1981 are from the original
transect; the remainder of the data are from the relocated transect.
17

PART III: RESULTS
Vegetation
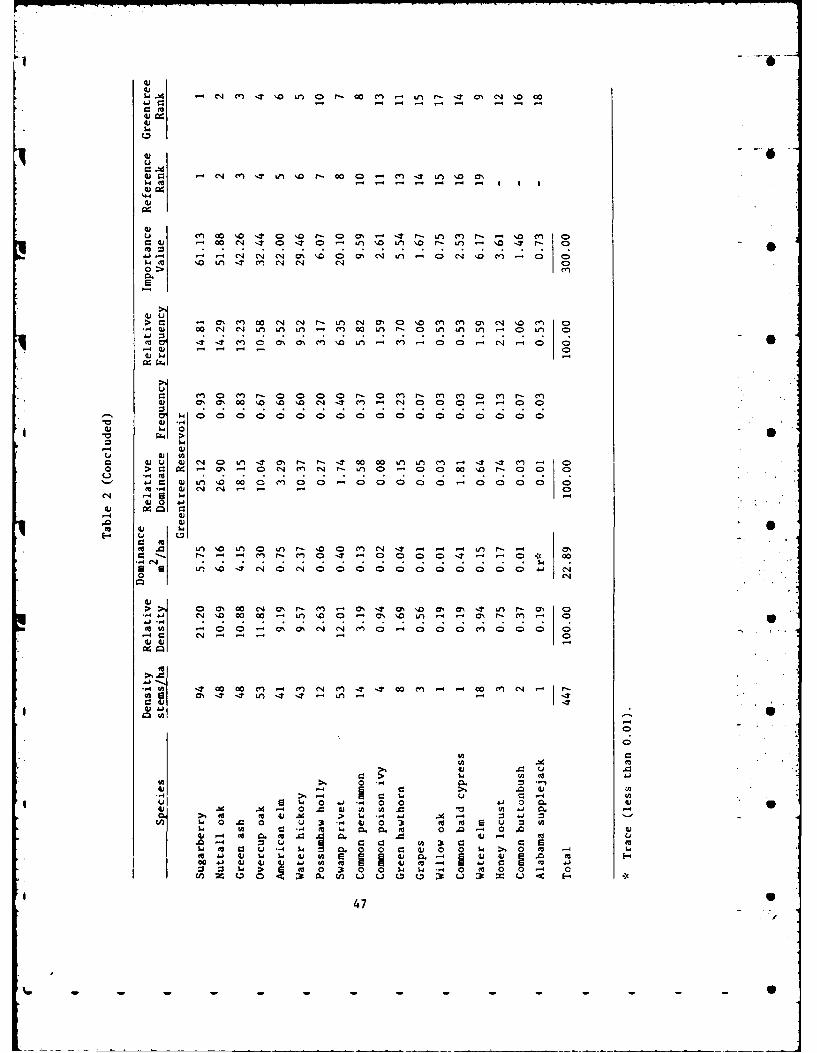
24. Vegetation data are summarized by stratum and site. Table 2
presents overstory composition. Based on importance value, sugarberry,
Nuttall oak, green ash, and overcup oak ranked first through fourth, re-
spectively, on both areas (see Appendix C for nomenclature). American
elm* and water hickory ranked fifth and sixth in importance on the ref-
erence area but reversed order on the greentree reservoir.
25. There was no significant difference between the areas with re-
spect to mean number of species per quadrat in the overstory. Included
in this group were individuals of vine species and species typically
found in the understory, such as common poison ivy, grapes, possumhaw
holly, and swamp privet, which met the size class criterion (>6.6 cm
dbh). There was also no significant difference between areas for stem
density of all overstory species combined; however, there were excep-
tions among individual species. Stem densities of overstory water hick-
ory and green ash were significantly greater on the greentree reservoir 0
(p < 0.0386 and p < 0.0711 , respectively). Overstory common poison
* ivy had a significantly lower stem density (p < 0.0804) on the greentree
reservoir. Basal areas of green ash and overcup oak were significantly
lower on the greentree reservoir (p < 0.0320 and p < 0.0675
respectively).
26. Table 3 presents tree occurrence by diameter class in 5.1-cm
increments. A relatively even distribution of diameter classes greater
than 21.9 cm was observed. These data imply similarity of past treat- •
ment on the two sites.
27. Increment cores were analyzed for sugarberry, green ash,
overcup oak, and Nuttall oak. Because of difficulty in determining ring
* Both American elm (Ulmus americana) and slippery elm (U. rubra) oc-
curred in the study area, with American elm the more abundant species.No distinction was made between these two species; the label "Americanelm" includes data for both.
18

boundaries, water hickory increment cores were not analyzed. Table 4
lists the mean diameter growth for the 18 years prior to greentree reser-
voir management (1945 through 1962), for the 18 years since management
has been implemented (1963 through 1980), and for the 36 years combined.
28. Figure 5 illustrates the differences in total diameter growth
of the sampled trees before and after flooding management on the two
areas. There was no statistical difference in total diameter growth for
sugarberry or Nuttall oak. Rates of growth over the two periods of time
were almost identical for sugarberry on both sites. Nuttall oak de-
creased growth substantially on both sites; however, the difference in
total growth between the two areas was not significantly different. The 0
difference in total growth between the two areas was significant for
green ash (p < 0.0465) and overcup oak (p < 0.0855). Total diameter
growth for reference area green ash increased slightly during the most
4 qrecent 18 years, while it slowed substantially on the greentree reser-
voir. Total diameter growth for overcup oak slowed for both sites over
the most recent 18 years, but to a lesser degree on the greentree
reservoir.
29. Data for dead trees, both standing and down, are summarized '
in Tables 5 and 6, respectively. When calculated with data for living
trees, standing dead of all species combined rank fifth in importance
value (24.89) on the reference site and fourth in importance (37.06) on
the greentree reservoir. Many of the standing dead trees were unidenti- S
fiable, and this group accounted for the greatest importance value among
standing dead trees on both sites. Standing dead of overcup oak and
sugarberry were second and third in importance for standing dead trees
on the reference site. Sugarberry was second and water hickory third in S
importance for standing dead trees on the greentree reservoir. There
was no significant difference between total numbers of standing dead
trees on the two sites. There was a somewhat greater density of down
dead stems on the greentree reservoir but a greater mean volume on the
reference site.
30. Data on densities and relative densities of cavity trees and
number of cavities per hectare are summarized in Table 7. The density
19

PRE-FLOODING POST-FLOODING(1945- 1962) (1963- 1900)
MEAN DIFFERENCE IN ANNUAL DIAMETER, mm
80 60 40 20 0 20 40 60 80
I I I I I I I
SUGARBERRY
6.25
LEGEND 3A7
REFERENCE AREA
. GREE4TREE RESERVOIR
GREEN ASH
0.82 (P < 0.046)
28.32
-S
OVERCUP OAK
19.67 (P < 0.06612.086
NUTTALL OAK
87.5
74.5
Figure 5. Difference in total annual diameter growth
before and after initiation of greentree reservoirmanagement for four tree species
20
- - - -- - - - - - A

of cavity trees was slightly greater on the reference site, but the
total number of cavities per hectare was somewhat greater on the green-
tree reservoir. On both sites, sugarberry was the most important cavity-- 0
bearing species, with green ash a distant second.
31. Table 8 summarizes understory data for shrubs, vines, and
* saplings. Based on importance value, there was a substantial difference
in the composition and relative importance of the five most important0
understory plants on the two sites. On the reference site, possumhaw
holly, sugarberry, grapes, common poison ivy, and Carolina snailseed
ranked first through fifth, respectively, in importance value. On the
greentree reservoir, water hickory, swamp privet, overcup oak, sugar-0
berry, and possumhaw holly ranked first through fifth, respectively.
Figure 6 is a graphic comparison of the importance values for understory
species illustrating differences between the two sites.
32. Stem densities of understory species were significantly0
greater (p < 0.0013) on the greentree reservoir (638 stems/ha) than on
the reference site (448 stems/ha). Fewer species (25) were sampled on
the greentree reservoir than on the reference site (28), but the differ-
ence was not significant. The following species had significantly
higher stem densities on the greentree reservoir: water hickory
(p < 0.0003), overcup oak (p < 0.0208), Alabama supplejack (p < 0.0822),
* and common buttonbush (p < 0.0490). On the reference site the following
species had significantly higher stem densities: Carolina snailseed0
(p < 0.0002), vine starjessamine (p < 0.0139), trumpet creeper
(p < 0.0170), and saw greenbriar (p < 0.0472).
33. The mean height of shrubs and saplings was lower on the
greentree reservoir (3.3 m) than on the reference site (3.6 in), but the
difference was not significant. There was no statistical difference for
mean height by species on the two sites except for sugarberry, which had
a lower mean height (p < 0.0618) on the greentree reservoir (3.2 m) as
compared with the reference site (4.2 in).
34. The dbh's of shrubs, vines, and saplings were smaller on the
* greentree reservoir (2.5 cm) than on the reference site (2.9 cm), but
the difference was not significant. The diameter of pepper-vine was
S
21
- - -

0
45
(U
30
V)25 4) . u-, IJ
30
AA d I2u
25 - 4.402 0
-~~$ c4.4Q
2~ ~ - S41CCO~c Q 4
it 2
0 LV
4 4z-z V
cV m
22

1
significantly greater (p < 0.0476) on the greentree reservoir. The diam-
eter of sugarberry was significantly less (p < 0.0049) on the greentree
reservoir. Differences between sites for other species were not .
significant.
35. Herbaceous layer data are summarized in Table 9. Seedlings
of woody species were the primary component of the herbaceous layer.
Based on importance value, there were substantial differences in com-
position and species rank between the two sites. In descending order,
the ten most important herbaceous layer species on the reference site
were vine starjessamine, common poison ivy, sugarberry, Carolina snail-
q seed, American buckwheat vine, pepper-vine, trumpet creeper, saw green-
briar, swamp privet, and American snowbell. In descending order, the
ten most important herbaceous layer species on the greentree reservoir
were common poison ivy, vine starjessamine, pepper-vine, American buck-
wheat vine, swamp privet, sugarberry, water hickory, overcup oak, S
Carolina snailseed, and American snowbell. Figure 7 is a graphic com-
parison of the importance values for herbaceous layer species.
36. Stem density for herbaceous layer species was significantly
less (p < 0.0001) on the greentree reservoir (30,568 stems/ha) than on S
the reference site (68,808 stems/ha). A significantly lower number of
herbaceous layer species (p < 0.0001) was sampled on the greentree
reservoir (27) than on the reference area (52). It should be noted that
19 of the species that did not occur in greentree reservoir sample plots 0
were found in only one sample plot on the reference area. Based on
t-test results, the following species had significantly lower stem
densities on the greentree reservoir: vine starjessamine (p < 0.0008),
sugarberry (p < 0.0001), Carolina snailseed (p < 0.0001), American S
buckwheat vine (p < 0.0249), trumpet creeper (p < 0.0001), saw
greenbriar (p < 0.0001), and green hawthorn (p < 0.0118). Using the
Mann-Whitney U-test the following additional species also had
significantly lower stem density on the greentree reservoir: common S
poison ivy (p < 0.0624), smallspike false nettle (p < 0.0056), and
Nuttall oak (p < 0.0176). On the greentree reservoir, only Alabama
supplejack (p < 0.0254; t-test) and water hickory (p < 0.0374;
23
e - - -

> 335 &
4-00 0
a V4 .u
10-
L!i05
4) 0 ~00
Sl 0 0 1-a *0
4 - 1
0~~~~ 2 . 2 -4:t 1? 2? t 22:2 :to
3 1.r4 r4P4 to
d. 4
24i

[ Mann-Whitney U-test) had significantly greater stem density.
Soils 437. A comparison of mean values calculated from data on physical
and chemical analyses of soils is presented in Table 10. Although
slight differences occurred in the physical character of the soil, mean
values for the other parameters measured were very similar for both
sites. These results indicate normal variability for Sharkey soils
which usually exhibit a high degree of similarity among nearby sites.*
Soil characteristics were sufficiently uniform that no further discus- 0'
sion will be presented in this report.
Bird Populations
38. Bird census results closely paralleled the findings of Dick-
son (1978). Effective detection distances ranged from 12.5 m for the
less conspicuous species to 251.5 m for those more easily seen or heard.
Species detected within the shortest distances were primarily weak- S
voiced or nonvocal. Censusing results were more consistent with the con-
spicuous birds. Individual transect counts fluctuated the least on both
sites during the spring and summer breeding season when confidence
limits reached seasonal lows (Figures 8 and 9). These results agreed O
closely with the findings of Dickson (1978) that more uniform detect-
ability of singing male birds and reduced mobility apparently produced
lower variances in counts. Trends were similar on both sites, but
winter peaks were magnified on the greentree reservoir. High monthly S
variances during the winter were due primarily to wandering bird flocks.
39. Nonvocal birds, difficult to census when trees were in leaf,
included migrants and juveniles, particularly in those species which
were sedentary or frequented high canopy habitat. The pattern described 0
Personal communication, B. R. Wells, 19 June 1981, University ofArkansas, Rice Experiment Station, Stuttgart, Arkansas.
25

"I - --- --
3 500-
20
~2000
1500
I I' I l-44 s A,1 0 1 M A M
15000s
Figure 8. Means and 95 percent confidence limits of monthly birdpopulations determined from transect counts on the reference site(One-half of the March and all of the April through July figures
represent territorial males.)
4351.1
3500-
3000
2250-0
200
I
z 100L.
10 1 lost
1 I 1661
Figure 9. Means and 95 percent confidence limits of monthly birdpopulations determined from transect counts on the greentreereservoir (One-half of the March and all of the April through
July figures represent territorial males.)
2626
- -

by Dickson (1978) was observed for most species of breeding birds.
Higher numbers were censused during the peak calling period in spring,
rather than in the summer when birds were seasonally abundant but less
vocal.
40. Both the reference area and the greentree reservoir provided
suitable habitat for large numbers of both permanent residents and
wintering species that breed at more northerly latitudes. Winter bird 0
population means on the reference area ranged from 1041 to 1972 per km2
2On the greentree reservoir they ranged from 966 to 3244 per km . The
winter populations on both sites were the highest for any season. These
winter densities were comparable to but somewhat higher than those found S
by Dickson (1978) in a south-central Louisiana bottomland hardwood
forest where bird densities ranged from 1235 to 2035 per km2 . The win-
ter bird community was dominated on both sites by the common grackle.
Wood ducks and mallards were the second largest component of the winter S
community of the (flooded) greentree reservoir but were absent on the
reference site. Likewise, white-throated sparrows added substantially
to the winter population of the reference site but were virtually absent
on the greentree reservoir. American robins and yellow-rumped warblers S
contributed to the enlarged winter populations of both sites. The resi-
dency statuses of bird populations on the reference site and greentree
reservoir are illustrated in Figures 10 and 11, respectively. The resi-
dency statuses of the bird species on the reference site and greentree S
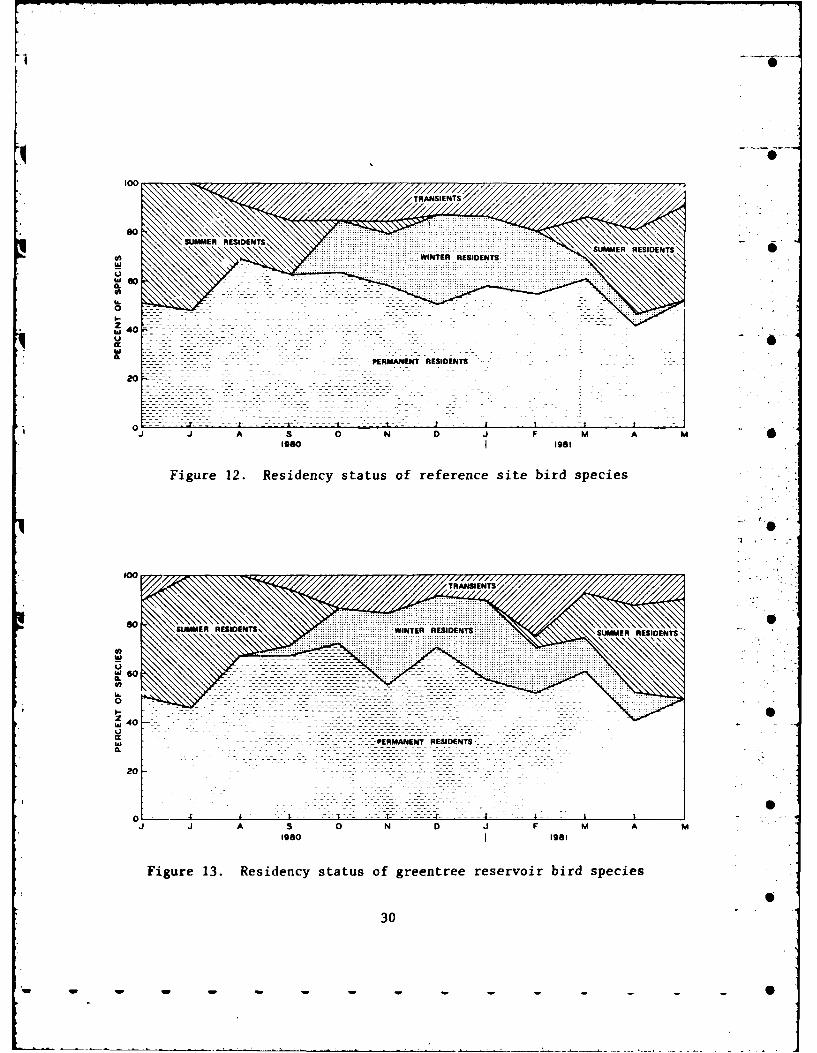
reservoir are illustrated in Figures 12 and 13, respectively.
41. No peaks were noticed on either site during spring, although
populations remained relatively high due to the lingering of winter res-
idents and the influx of summer residents. Low bird numbers were re- S
corded during July and August on both the reference area (392 and 422
per km 2) and on the greentree reservoir (443 and 430 per km 2). Both
sites showed a slight peak during October (Figures 8 and 9), which ap-
peared to be the result of influxes of American robins, yellow-rumped S
warblers, and common grackles.
42. With the exception of enhanced peaks on the flooded greentree
reservoir during the winter, total bird populations on both sites were
27

3500
3000-
2500
wj 2000CLU) LEGEND
IZTRANSIENTS
0 EDSUMMER RESIDENTSwU 1500- 00. WINTER RESIDENTS
PERMANENT RESIDENTS ............
1000-
.....................
- --- - -- - - - -
-------------------------------------------------------------------------
-- - -----------------------------------
1980 1981
Figure 10. Residency status of reference site bird populations
28
%w w w w w- - - - - - - - S

3500-
LEGEND
TRANSIENTS
3000 _____SUMMER RESIDENTS .
WINTER RESIDENTS
PERMANENT RESIDENTS
2500-
hi 2000-C.
go
In
1 00
.. .... .. ..
... ... .. ... .. ----- - ----
-- -t - -- - --- -
-96 - -1981 6..... - - - -- -- - ---
- -- ------------- - - - -- - - - - -
- - - - - - - - - - - - - - - - - - - - - - - - -
10
TRRRESIDENT
SUMMEER RESIDENTS
0
0
Z 0
PEMANENT RESIDENTS
-I ------ ---
Figure 12. Residency status of reference site bird species
100
.. . ... . .. ....
so SI MRU D N U M R R S D N S
.0 ..... ......
0
0.
1980 I1981
Figure 13. Residency status of greentree reservoir bird species
30

A
highly consistent throughout the year. Mean monthly population esti-
mates are summarized by species in Table 11.
43. A total of 48 species of birds representing 19 families were
identified and censused on the two sites. On the reference site, 43 spe-
cies of 17 families were censused. Red-tailed hawk, yellow-bellied
sapsucker, golden-crowned kinglet, black and white warbler, rufous-sided
towhee, and song sparrow were censused only from the reference site. On
the greentree reservoir, 39 species of 19 families were censused. Wood
duck and mallard were censused only from the greentree reservoir.
44. Species richness (i.e., number of species), species diversity,
and species equitability are illustrated for the reference site and the
greentree reservoir in Figures 14 and 15, respectively. Patterns simi-
lar to those documented by Dickson (1978) were observed. There was
little relationship between species richness and species diversity for
either site. Species diversities for both sites were more closely asso-
ciated with species equitability.
31
a - -- . •- .|

-0.
a.
0,44o
4-4 CS
o0 0 41>.1-I $4
z U
-0 0~ 4)
cc4~ 4)
0 4 $4
LOI 4
2~~~~ 0A Wq1 ~ f
4
S 4)0(
1.4 t-I
on. 0
z w
o ) 0"4.)
~n ~ 4J
4- ca 4-04.) 4),H4
0 - 4
-)4-44141 )1.4 -H
2 0 ~ q I) N0 H f .~
23123dg .40 MI3flN AIIS3AIC S3I33dS Al.lIv±iinO3
32

PART IV: DISCUSSION
45. The strong agreement in overstory data between the two sites
supports the premise that there was probably no difference in vegetation
between them prior to the initiation of greentree reservoir management.
The lower basal area of green ash and overcup oak in the greentree reser-
voir may be due to differences in past selective harvesting practices.
It is unlikely that any timber harvest has taken place on the greentree
reservoir since its construction; however, no written records exist
which can verify past cutting practices.* Thus care must be exercised
in interpreting these results. The increased stem density of water hick-
ory and green ash occurred in the smallest size classes (Table 3) which
have developed since initiation of the greentree reservoir, indicating
increased germination and/or survival of these species under the green-
tree management.
46. As noted in the preceding section, there was no evidence that
greentree reservoir management enhanced or reduced growth rate for sugar-
berry and Nuttall oak. However, the evidence indicated that on the
greentree reservoir there was both a slower rate of growth for green
ash and a reduced rate of growth decline for overcup oak. This con-
trasts with early studies of greentree reservoirs and other dormant
season impoundments that frequently reported improved tree growth
(Broadfoot 1958, 1967, Broadfoot and Williston 1973) and better produc-
tion of sound, fully developed acorns (Minckler and McDermott 1960)
which may be an indication of tree vigor. It agrees with more recent
studies which indicate that long-term response may not be so universally4 !improved as was earlier thought. Studying a 20-year-old greentree reser-
voir in southeastern Missouri, Fredrickson (1979) found that tree growth
improved for pin (Quercus palustris), willow, and overcup oaks, but was
reduced for red maple, Shumark oak (Q. shumardii), and sweetgum. Rogers
(1981) reported that pin oak growth had not improved and may have been
somewhat reduced after 20 years of dormant season impoundment. McQuilkin
* Personal communication, Tom Coppinger, 29 February 1980, USDA Forest
Service, Delta National Forest Headquarters, Rolling Fork, Mississippi.
33
-6

and Kusbach (1977) found no increase in sound, fully developed acorns
produced on a greentree reservoir after 14 years of data had been col-
lected. This is in contrast with increased production reported for the
same site after a shorter period of study (4 years) by Minckler and
McDermott (1960). This discussion illustrates that increases in growth
and vigor frequently reported in the period immediately following flood-
ing changes may, in some cases, be short-lived and do not preclude 0
eventual water-induced decline or mortality. Beneficial growth effects
may have been overstated in the past; they probably do occur, but are
more species and site specific than was previously thought (Klimas
et al. 1981). 0
47. Most of the large green ash specimens encountered on the
study area showed signs of heart rot and other evidence of disease,
which may be the mechanism by which growth rate is slowed. No obvious
conditions were observed that might relate to the difference in decline 0
of growth rate between the sites for overcup oak. However, the reduced
rate of growth decline coupled with increased reproduction, as evidenced
by increased stem density in the understory and herbaceous layer of the
greentree reservoir, suggests that greentree reservoir management is S
improving site conditions for overcup oak.
48. Characteristics of the standing and fallen dead tree material
on the two sites were similar. Dead tree material in bottomland hard-
wood forests is important to wildlife for denning and/or locating food. •
49. Numbers of tree cavities of potential use to wildlife and
density of cavity trees were similar on both sites (Table 7). These
data included cavities which ranged in size from the smallest, which
would be of potential use to a small cavity-nesting bird such as a
prothonotary warbler, to any larger sized cavity that could provide a
sheltered den. The search for cavities was not exhaustive, and many
cavities were probably overlooked or hidden by foliage. Therefore, the
data in Table 7 are conservative, most likely underestimating the true 0
numbers of cavities.
50. The substantial differences between the two sites in under-
story and herbaceous layer forest components suggest changes induced by
34

[ - -
annual reservoir management. The significantly higher stem densities of
water hickory, overcup oak, and buttonbush on the greentree reservoir
(Table 8 and Figure 6) indicate that a shift to a wetter forest commu-
nity is occurring. The significantly lower stem densities for Carolina
snailseed, vine starjessamine, trumpet creeper, and saw greenbriar in
the greentree reservoir indicate lesser tolerance of these species to
the increase in flooding.
51. The differences in many understory importance value ranks be-
tween the two sites (Figure 6) appear to be in response to long-term
greentree reservoir management (Table 8). For example, swamp privet,
water hickory, overcup oak, green ash, green hawthorn, Alabama supple- 0 0
jack, American snowbell, Nuttall oak, and common buttonbush were sub-
stantially higher in their relative ranks on the greentree reservoir,
suggesting they prospered under greentree management. Possumhaw holly,
sugarberry, grapes, common poison ivy, Carolina snailseed, vine star-
jessamine, trumpet creeper, American elm, saw greenbriar, and common
greenbriar were substantially lower in rank on the greentree reservoir,
suggesting they declined under greentree management. Southern swamp dog-
wood is a species that appears to be intolerant of the added moisture of •
the greentree management regime. It was relatively abundant in the
understory of the reference site (83 stems/ha) but was absent in the
greentree reservoir.
52. The vast majority of the stems sampled in the herbaceous 0
layer were seedlings or sprouts of woody species with the potential of
ascending to the understory or overstory. Stem densities of seedlings
and sproutf were significantly lower on the greentree site herbaceous
layer. Reduced species diversity on the greentree reservoir is also in- S
dicative of more extreme conditions there. Not all species reduced
their stem densities on the greentree reservoir, however. Water-
tolerant species such as water hickory and Alabama supplejack (Whitlow
and Harris 1979) had signifi-antly greater stem densities. Overcup oak,common poison ivy, swamp privet, and common buttonbush had greater stem
densities in the herbaceous layer of the greentree reservoir, but the
differences were not statistically significant. Significantly lower
35 1'S. - -- - - - - - - - -

I
stem densities on the greentree reservoir were found for vine starjessa-
mine, sugarberry, Carolina snailseed, American buckwheat vine, trumpet
creeper, saw greenbriar, and green hawthorn. Differences were found for
other species but they were not statistically significant. The large
difference in herbaceous layer species diversity between the reference
and the greentree areas makes direct comparison of the lower ranked
species less meaningful than it was for the understory species, which
had approximately equal species diversity in both areas.
53. The total number of birds was greater but the total number of
species was lower on the Delta National Forest study sites than those re-
ported in a south-central Louisiana bottomland hardwood forest by Dick-
q son (1978). Two factors may account for these differences. First,
while both study areas were bottomland hardwood forest types, the habi-
tats were not identical. For example, Dickson (1978) reported on a
study area consisting of water oak (Q. nigra), sweetgum, sugarberry,
cherrybark oak (Q. falcata var. pagodaefolia), cow oak (Q. michauxii),
giant cane (Arundinaria gigantea), palmetto (Sabal minor), and ironwood
(Carpinus caroliniana), with a basal area of 28.2 m /ha. This forest
composition appears to indicate a much drier site than that used in the
present study, according to the cover types/moisture regime classifica-
tion presented by Huffman and Forsythe (1981). Second, Dickson (1978)
sampled approximately eight times per month, while in the present study,
sampling was limited to only three or four times per month. Because of
the reduced number of samples, some of the transient species passing
through the study site during migration seasons were probably missed.
However, the consistency found between sites from one count to the next
for permanent resident species indicates that these data are reliable.
54. There was great consistency in numbers of species and total
population found on the two sites, with the obvious exception of the
waterfowl that used the flooded greentree reservoir. During the study
period June 1980 to May 1981, the Mississippi Delta experienced rather
dry weather conditions. Flooding did not occur on the reference site
except for very short periods of time in the deeper sloughs after ex-
tremely heavy, but short-lived, rainfalls. It is probable that if
36 S
, - -

standing water had been present during the winter the reference site may
also have attracted waterfowl. In its dry condition, however, no water-
fowl were censused there. - -
55. Common grackles were a notable exception to the consistency
noted between the two sites. The extremely large winter populations of
grackles on both sites were similar to the large population documented
by Dickson (1978). Further, the common grackles appeared to have a
decided affinity for the flooded site. Not only were winter populations
much higher on the greentree reservoir when it was flooded, but also
large numbers of common grackles were drawn to the greentree reservoir
whenever it ponded water, such as after heavy rainstorms. Large groups
of common grackles were almost always censused in close proximity to the
standing watet.
56. Despite the presence of water on the greentree site, popu-
lations of other bird species tended to be remarkably stable between 0
sites Monthly variation in numbers of species and mean populations for
most species did not appear to be affected by differential flooding.
There were exceptions such as the white-throated sparrow which, during
flooding, almost disappeared from the greentree reservoir and was cen-
sused there only on an occasional hummock of land too high in elevation
to be inundated. For the majority of bird species, however, differences
between sites were subtle and did not appear to be due to inundation of
the greentree reservoir. O
57. Oak mast was produced on both sites. Casual observations in-
dicated it was attractive to birds and other wildlife and consumed by
them on both sites. The fruit of sugarberry was heavily used by birdspecies during the fall. One plant species, common mistletoe 6
(Phoradendzon serotinum), not sampled because of its parasitic growth
habit high in the canopy, produced large amounts of fruit that did not
appear particularly attractive to birds until the coldest days of winter
when it was used heavily.
58. Vines also produced a substantial amount of fruit and have
been overlooked generally as a potentially significanit source of wild-
life food in bottomland hardwood forests. Much of the fruit produced is
37

4I
readily available high in the canopy where it is easily overlooked by
observers on the ground. Common poison ivy, Carolina snailseed, pepper-
vine, and American buckwheat vine all produced heavy crops of fruit dur-
ing the period of this study. Much of the fruit was retained on these
vines well into the winter where it remained available to wildlife.
This study documents the relative importance of vine species as compo-
nents of the bottomland hardwood plant community. This importanceshould also be emphasized in relation to the value of many of the vine
species as sources of wildlife food.
38|
S
0
0 ]
0
S
1
38 5
0

K
PART V: CONCLUSIONS
59. Continuous greentree reservoir management over 18 years ap-
pears to be causing a predictable shift on the study site to a more
water-tolerant plant community. Composition of the overstory was simi-
lar on both sites, but the understory and herbaceous layer were differ-
ent on the greentree reservoir. In the understory, survival was greater
for the more water-tolerant species, water hickory, overcup oak, and
common buttonbush; there was lower survival for Carolina snailseed, vine
starjessamine, trumpet creeper, and saw greenbriar. Total stem density
in the herbaceous layer of the greentree reservoir was significantly
lower and was greater only in the cases of the most water-tolerant
species such as water hickory, overcup oak, swamp privet, and common
buttonbush.
60. Winter flooding of the greentree reservoir makes it more at-
tractive to common grackles and highly attractive to waterfowl, but less
attractive to white-throated sparrows. For other species, however,
greentree reservoir management appears to have very little effect on
species richness or mean populations. 0
61. The overstory, topography, and soils were very similar at
both sites; however, the hydrology was very different between them. The
greentree site was inundated during the dormant season but also ponded
water during the year. While it can be concluded that the species
shifts observed in the understory and herbaceous layers were caused by
greentree reservoir management, neither dormant season flooding, growing
season flooding, nor the interaction of both can be singled out as the
sole cause.
62. The reported observations indicate that under the current
management scheme, a shift in the composition of the forest community is
likely to occur. If the expected shift is undesirable, the changes can
be reduced by several methods. The drainage system of the Sunflower
Waterfowl Project requires an improved design to remove water more
quickly from the greentree reservoir and reduce the amount of ponding
during the growing season. The greentree reservoir could be flooded
3939
0 - - - - - - - - - -

only every second or third winter to permit thorough drying and soil
aeration. Finally, the duration of flooding could be further reduced
and timed so that no chance existed for overlap into the growing season.
40

REFERENCES
Black, C. A., D. D. Evans, J. L. White, L. E. Ensminger, and F. E. Clark(eds.). 1965. Methods of soil analysis, Part 2. Agronomy No. 9.American Society of Agronomy, Inc. Madison, Wisconsin. pp. 771-1572.
Brakhage, C. K. 1966. Management of mast crops for wood ducks.Pages 75-80 in: J. B. Trefethen ed. Wood Duck Management and Research:A Symposium. Wildlife Manage. Inst., Washington, D. C. 212 pp.
Braun, E. L. 1950. Deciduous Forests of Eastern North America. HafnerPress, New York. 596 pp.
Broadfoot, W. M. 1958. Reaction of hardwood timber to shallow-waterimpoundments. Miss. Agric. Exp. Stn. Info. Sheet 595. Stoneville.
__ _ 1964. Hardwoods respond to irrigation. J. For. 62:579. 0
1967. Shallow water impoundment increases soil moisture
and growth of hardwoods. Proc. Soil Sci. Am. 31:562-564.
_ _ 1973. Water table depth and growth of young cottonwood.
U. S. Dep. Agri., For. Serv. Res. Note SO-167. 4 pp.4 0Broadfoot, W. M., and H. L. Williston. 1973. Flooding effects onsouthern forests. J. For. 71:584-587.
Brown, G. F. 1947. Geology and artesian water of the alluvial plainin northwestern Mississippi. Geol. Surv. Bull. 65. Mississippi StateUniv., Mississippi State. 424 pp.
Carter, J. R., Jr. 1978. A floristic study of the Delta NationalForest and adjacent areas. M.S. Thesis, Mississippi State Univ.,Mississippi State. 79 pp.
Cowardin, L. M. 1969. Use of flooded timber by waterfowl at theMontezuma National Wildlife Refuge. J. Wildl. Manage. 33(4):829-842.
Cox, G. W. 1967. Laboratory manual of general ecology. Brown CompanyPublishers, Dubuque, Iowa, 165 pp.
Dickson, J. G. 1978. Seasonal bird populations in a south centralLouisiana bottomland hardwood forest. J. Wildl. Manage. 42(4):875-883.
Emlen, J. T. 1971. Population density of birds derived from transectcounts, Auk 88:323-342.
1977. Estimating breeding season bird densities fromtransect counts. Auk 94:455-468.
Fernald, M. L. 1970. Gray's manual of botany, 8th ed. Van Nostrand Co.q New York. 1632 pp.
Fredrickson, L. H. 1979. Floral and faunal changes in lowland hardwoodforests in Missouri resulting from channelization, drainage and impound-ment. U. S. Dep. Tnt., Fish Widl. Ser./OBS/-78/91. 130 pp.
41
A

Gill, C. J. 1970. The flooding tolerance of woody species--a review.For. Abstracts 3:671-688.
Hall, D. L. 1962. Food utilization by waterfowl in green timber reser-voirs at Noxubee National Wildlife Refuge. Proc. Southeastern Assoc.Game and Fish Comm. 16:184-199.
Hanson, G. A. 1978. Lead shot incidence at Oakwood Bottoms GreentreeReservoir and its management implications. M.A. Thesis, SouthernIllinois University, Carbondale. 37 pp.
Helwig, J. T. 1978. SAS introductory guide. SAS Institute, Inc.,Raleigh, North Carolina. 83 pp.
Hubert, W. A., and J. N. Krull. 1973. Seasonal fluctuations of aquaticmacroinvertebrates in Oakwood Bottoms Greentre Reservoir. Am. Midl.Nat. 90:177-185.
Huffman, R. T., and S. W. Forsythe. 1981. Bottomland hardwood forestcommunities and their relation to aerobic soil conditions. In press.in: J. W. Clark and J. Benforado, eds. Bottomland Hardwood Workshop.National Wetlands Tc-hnical Council, Washington, D. C.
Johnson, R. L., and Price, T. L. 1959. F iiial report--resume of 20 yearsof hardwood management on the Delta P'urchase Unit. Unpublished, Stone-ville Research Center, Stoneville, Mississippi. 77 pp. •
Klimas, C. V., C. 0. Martin, and J. W. Teatord. 1981. Impacts of flood-ing regime modification on wildlife habitats ot bottomland hardwoodforests in the Lower Mississippi Valley. U. S. Army Engineer WaterwaysExperiment Station Tech. Rept. El-81-13, Vicksburg, Miss. 137 pp.
Krull, J. N. 1969. Seasonal occurrence of macroinvertebrates in a Sgreentree reservoir. New York Fish & Game J. 16(1):119-124.
Lloyd, M., and R. J. Ghelardi. 1964. A table for calculating the "equi-tability" component of species diversity. J. Animal Ecol. 33(2):217-225.
McCracken, F. I., and J. D. Solomon. 1980. Insect and disease problemsin greentree reservoirs. Page 34 in: Southern Forest Soils Council, 'Soils and Hardwoods of the Lower Mississippi Valley: Field Tour Guide;Eighth Council Workshop. 50 pp.
McQuilkin, R. A., and R. A. Musbach. 1977. Pin oak acorn production ongreentree reservoirs iii southeastern Missouri. J. Wildl. Manage.41:218-225. (Erratum: J. Wildl. Manage. 41:597).
McWhorter, J. C. 1962. Climatic patterns of Mississippi. Agric. Exp.Stn. Mississippi State, Mississippi.
Merz, R. W., and G. K. Brakhage. 1964. The management of pin oak in aduck shooting area. J. Wildl. Manage. 28(2):233-239.
Minkler, L. S., and D. Janes. 1965. Pin oak acorn production on normal Sand flooded areas. Univ. Missouri Agric. Exp. Stn. Res. Bull. 898.15 pp.
42 5

Minkler, L. S., and R. E. McDermott. 1960. Pin oak acorn productionand regeneration as affected by stand density, structure and flooding.Univ. Missouri, College of Agri., Agri. Exp. Stn. Res. Bull. 750. 21 pp.
National Oceanic and Atmospheric Administration. 1973. Monthly averagesof temperature and precipitation for state climatic divisions, 1941-1970.Climatography of the United States No. 85 (Mississippi), Asheville,North Carolina.
1975. Climate of the Stoneville Experiment Station, Missis-sippi. Climatography of the United States No. 20, Ashville, North 0Carolina.
Radford, A. E., H. E. Ahles, and C. R. Bell. 1968. Manual of theVascular Flora of the Carolinas. Univ. of North Carolina Press. ChapelHill. 1183 pp.
Rogers, R. 1981. Flooding, stand structure, and stand density affect Spin oak growth in southeastern Missouri. Draft submitted to the So. J.Applied Forest. 21 pp.
Rudolph, R. R., and C. G. Hunter. 1964. Green trees and greenheads.Pages 611-618. in: J. P. Linduska, ed. Waterfowl Tomorrow. U. S. Dept.Interior. Washington, D. C. 770 pp.
SAS Institute, Inc. 1979. SAS User's guide. Cary, North Carolina.494 pp.
Scott, F. T., L. P. Walton, and R. C. Carter. 1962. Soil survey ofSharkey County, Mississippi. Series 1959, No. 2, U. S. Dept. Agric.,Soil Conservation Serv. in cooperation with the Mississippi Agric. Exp.Stn. Washington, D. C. 36 pp.
Scott, T. G., and C. H. Wasser. 1980. Checklist of North Americanplants for wildlife biologists. The Wildl. Soc. Washington, D. C. 58 pp.
Shannon, C. E. 1948. A mathematic theory of communications. BellSystems Tech. J. 27:379-423, 623-656.
Siegel, S. 1956. Nonparametric statistics for the behavioral sciences.McGraw-Hill. New York. 312 pp.
Society of American Foresters. 1975. Forest cover types of NorthAmerica (Exclusive of Mexico). Soc. Am. Forerters. Bethesda, Maryland.67 pp.
Sokal, R. R., and F. J. Rohlf. 1969. Biometry. Freeman and Co.San Francisco. 776 pp.
Sweet, M. J. 1976. Mallard and wood duck utilization of Oakwood BottomsGreentree Reservoir. M.A. Thesis, Southern Illinois Univ., Carbondale.110 pp.
Tatter, T. A. 1972. Effects of inundation on trees. USDA For. Serv.,N. E. Area State and Private For. P-72-4. 6 pp.
43

t0
Teskey, R. 0., and T. M. Hinkley. 1977. Impact of water-level changeson woody riparian habitat and wetland communities. 6 volumes. U. S.Fish and Wildl. Serv. Office of Biol. Serv. 77/58, 77/59, 77/60, 78/87,78/88, 78/89.
Thompson, P. 1971. An ecological investigation of Oakwood BottomsGreentree Reservoir in Illinois. M.A. Thesis, Southern Illinois Univ.Carbondale. 74 pp.
Thompson, P. M., and R. C. Anderson. 1976. An ecological investigationof the Oakwood Bottoms Greentree Reservoir in Illinois. Pages 45-64 in:J. S. Fralish, G. T. Weaver, and R. C. Schlesinger, eds. Proc. of the -First Central Hardwood Forest Conference, Southern Illinois Univ.Carbondale. 484 pp.
Thompson, D. Q., P. B. Reed, Jr., G. E. Cummings, and E. Kivisalu. 1968.Muck hardwoods as green-timber impoundments for waterfowl. Trans. N. Am.Wildl and Nat. Resourc. Conf. 33:142-159. 0
U. S. Army Engineer District, Vicksburg. 1964. Lorenzen Quadrangle,Mississippi. Vicksburg, Mississippi.
1976. Flood control, Mississippi River and tributaries,Yazoo Basin, Yazoo Backwater Area--Fish and Wildlife Mitigation Plan.Vicksburg, Mississippi. 13 pp. plus appendices.
1981. Sunflower River stages, Holly Bluff, Mississippi.Vicksburg, Mississippi.
Whitlow, T. H., and R. Harris. 1979. Flood tolerance in plants: astate-of-the-art review. U. S. Army Engineer Waterways Exp. Stn. Tech.Rept. E-79-2. Vicksburg, Mississippi. 161 pp. I
44 0
S

Table 1
Characteristics of the Greentree and Reference Sites
Identified Prior to Field Data Collection
Parameter Greentree Reference Comments
Overstory Cover type 93 Cover type 93 Identical
Topography Relatively flat, low- Relatively flat, low- Virtually l
lying land with lying land with identicaldepressional depressionaldrainage drainage
Soils Sharkey series Sharkey series Virtually ]identical
Hydrology Natural flooding Artificial impound- Dissimilarment during winterand naturalflooding
4
S 1
1 • !
S
45i
S - S -S - S - - - S -

%. 0n0ML - T 1 0
41
4)
(U
44
'0 c' U C4 0 "t 0 .TLf 0'. C4 0 - r o 0 0LM 0m ~ -41 O-T . C.o I-. 0 0 0 00 r-4 00 'D - 0 0 0r (7
41 -4 Cl -
.0 c7% 0n w ~ tn a' a' N' m c-i 0'o f 0 L ~ 0 0
C: 0n (10 C -- r - c
41 4 1
C 41w
4) -- M1 41 : , r ; C
r= 00 0
4))
000.40
a) 10 .0CY M - 0n mC 41 (7 U) .4?A 0 -- ( 0 4 ~ ~ U) 1 4 1 4 M -
0 a r, .4 410 a (0o D0 (0 41r
) C41-4(00 9 r- .n 0 oo T~ r-0.o41a4mNO 0
-4 (04 1 U *, . . . 2 -4 0 0 *1
(: 0 4) 41 14 1 4 0 %D Un 41 -4 .CDoc 14 -=
4, 46
w - w - - - - - - -to
4)
C,
4)
.4-4c)
u m w . -oI 0 '.0?'- 00' m IT r- 41' m')?' - %'0 cn' 00 4) - wc N~ It0 IT 0 - in '0 Ln \0 r- Ln ' ~?a-4 - C") C') CN 0' '.0 0' C') V') 0 C') ' " 0 0
M.( '0 sf' IT m" N' C14 N'0 >06e
> ' CP ) c c 00 ) C4) !- L') N' 0ON 40 .0 c") C") 0.C ') N . m" 0
cc C" C") C ) - C ") cc 41' ) 1 0 C I) ) - 0 f 0
W4 -CIN C 0% 0' 0' N" -. 4t m N C") 0 0 C'0 0
- --
4) W 0
-4 a
(1 4) 0 l
ol >- m r- m 0' IT) C) - a 00 0c IT C 0 0
C") .'4 1-
0 a
.m 4(4 4 -M C 1 9 9-.9 9 19 L
to U C.
-(A 4 m I 1 n C4(4 . r It' '0 IT) 0 ? sf ' 0 " " n- - f '
u . F.- - C)I- ' 0 -1 - 0 0 0 - 1- 0 m.c c
0 1- = ( 0 L j 0
0 0 cc ')0' U' C") 0 - 0 ' '0 0' m' - - 04" 0 c ')Q.0 0 ' f IV S-4 M" -
w1 cc0 0 - .4 w' 1' C"6 0" 0 0 0 0 we' 0 0 0 04
m%- 1 f) w.. W 0 ' - u -) 44)a41
> to 0 3t 0 0 w 0 m 0 -40
Cl) z% 0'4 0. cn C) u C x u 3
47Z~ d

00 00
0
Al
4 00 0 0
N in
Al V14
Al l
o 0oA V~
C4
A, V
00
11114 I E J 1 1 E l E E i I EE 1 I
A; V
.0
Al V
El Efg 'hEl o I*n.ln
I
El O.1 Ill El IEE I I I I 1 I li 1 .71 EEII 10
ElZ 0
0l 0l 0
0 C:L An 4 0. 0.a00OEl El
El~~1 N A- *-3l N N 1 1 r 1 El u 1 1 I I N 0 I .Z~~~ 44 II i I i i 11 1 LAil I l I
0- EN El II I III IVI E I I II I ElV0- N ll1 I
l V

Table 4Mean Diameter Growth (inm/yr) for Unsuppressed Trees
Species Reference GreentreeSugarberry
1945-1962 3.12 2.691963- 1980 3.47 2.89
1945-1980 3.29 2.79
Green ash
1945-1962 7.57 6.361963-1980 7.78 4.83
1945-1980 7.67 5.59
Overcup oak
1945-1962 6.16 4.431963-1980 5.06 4.31
1945-1980 5.61 4.37
Nuttall oak
1945-1962 13.24 11.591963-1980 8.38 7.45
1945-1980 10.81 9.52
49

"-
0
Table 5
Summary of Data Analysis for Standing Dead Trees
DominanceDensity Relative 2 Relative Reltive ImportanceSpecies stems/ha Density m /ha Dominance Frequency eKn _ Value
Reference Site .
Unidentified 9.06 28.95 0.44 15.12 0.17 23.82 67.89
Overcup oak 6.59 21.06 1.57 54.06 0.13 19.05 94.17
Sugarberry 8.24 26.33 0.41 14.21 0.17 23.82 64.36
Green ash 2.47 7.89 0.25 8.55 0.07 9.53 25.97
Water hickory 1.65 5.27 0.10 3.33 0.03 4.76 13.36
Common bald cypress 0.82 2.62 0.10 3.55 0.03 4.76 10.93
American elm 0.82 2.62 0.02 0.84 0.03 4.76 8.22
Green hawthorn 0.82 2.62 0.01 0.31 0.03 4.76 7.69
Swamp privet 0.82 2.62 tr* 0.03 0.03 4.76 7.41 S
Nuttall oak 0 0 0 0 0 0 0
Oaks 0 0 0 0 0 0 0
Total 31.29 99.98 2.90 100.00 0.69 100.02 300.00
Greentree Reservoir
Unidentified 12.35 34.88 1.32 27.81 0.23 25.92 88.61
Sugarberry 10.71 30.25 1.25 26.24 0.23 25.92 82.41
Water hickory 3.29 9.29 0.68 14.28 0.13 14.81 38.38
Overcup oak 2.47 6.98 0.47 9.87 0.07 7.41 24.26
Green ash 1.65 4.66 0.53 11.07 0.07 7.41 23.14
Nuttall oak 2.47 6.98 0.06 1.21 0.07 7.41 15.60
Oaks 0.82 2.32 0.44 9.34 0.03 3.70 15.36 S
Swamp privet 1.65 4.66 0.01 0.19 0.07 7.41 12.26
Common bald cypress 0 0 0 0 0 0 0
American elm 0 0 0 0 0 0 0
Green hawthorn 0 0 0 0 0 0 0 0
Total 35.41 100.02 4.76 100.01 0.90 99.99 300.02
* Trace (less than 0.01).
50

69 m ~ 00 tr- cn - \.o a0 104 ( C14 \. 00 C)=6 u m~ "N r-- 0 N 'T Ln 0nO T m C
G.-4 -. -r.- 1
>2
E
s: \10 0 cn t- C- -r r- Cl - m C -mv o N cq " N 'T- . ~~. N (
Al
4 E
6m 0 00) 0 0 0 0 n c D0 Cl) 00 L12 Cl 0
C .0 Cl r- C' ( -'T, CCl -7 - Cl '. -7 -
00 r4
00 r-40 0
o>
-4 2 U0 .) 44 c (N
S0a) tfl - Cl .0 0 ' Lf 4.J 4 - -n 0 ' 0 a
En C', N \.o '.0 C60N 'T0 ( -~( .-4 E-' Va0 a"), 0 (7 V ', ' na
0 H0
CV)
>4 1a (N (N 04 r- - 0u. -1-
>a 0 0 wam1.4:C c 1.4
51 0

00
0- (4& r4 r! f -t -
4.w, , - z-,), C , C C
-4.
0- (n
- -4 EnIj uc , C C l-4 = : a) 4 C2
rn 62-4, W~ M O i& -4 - .1 LlL4Lt~L& C.41'- to- -
4) 4; Q)412 C 62cq>. -4M$
-4 -H 4
o uu
-. 4 . 4 6 >
4j 4.4. c
-.4 Q;
4) 621 - 4) m t-4 31 62 62 C) - ' C ') 4 (1) CO CO VO N. 009 0241 4 )) U 4 I It '" 6q2 O
62 ~ ~ ~ ~ Q 41O..~-Cv~
W 4 4) 6 2C
$4 44( 14(641 .) m .2 4
1 .0 4. 41(n 62 - -' n r- o o o c
4- 4 Z-. 0A ON I cv) 0, '0 C1 C) C) C' I a
CO -624-4~ 0 (U
0.
41.
U) o SU-. -4 14 -4
.0 0 -1 U H
0 4 w 4 0
tn w i 41.4 U 4 - 4 -4U '
-'$4 4J -4 -4) p- -4 ,0 0
1.4 ~ U 6 - 41 0 19
> m. '~ ~ U 3 ( 0 0 mU
- ~52 -- --

4w
0(4 U~-*0' r r- U 40 (N-4 ri l -00 '0'0 '- 70 ~ ~ (
Q1 C14 -4 CN- - - - - - I ( N -4(
414
41o -o (N m In mf 't mN In0 0 (N ( -t I - -0 - - N - -? cD 0 N
4)
> 4)
U U(v LA ., D -A( -A 0c> -n -D (N (N (N 00 o' o00 0 ( N ( N ( N
m4 m. co oo (N 0o' . n o o o o aw 4(o -)
0 n 4
a, 4
C2m41411 e Lm C o n o n c
(N 00. c00 ( 0 N0 N ~ '00 .~0. N'000 '0'000 o(0 000 C4 N0 ~~ 0r f ~ 0 '~ ((( N( ~ 0
'01~~ ~ 'D C, Go00 (o (N -t lo( tC N -7- - - - 0 0 1In0.0a c o l
CC
U 41 0
41. C1 41
a0 > 4. . . . . . . . . . . . . . . . . . . . . . . .
cU .- 3 1 0' o U 1o
I 4104-06 00) 41W w 41 -o 3 e
W41 . l 3 w uz cA w u Q u o x c - 4
V5

41
.2
04 0 m c C 4 -~.)~ 4 0 0 ' . f C In. 0 a ' 741 0
q,
41 .240 > ' 4 - N - . . C') C'). NO C') 40 -C - --D 0. NO
U4 t M N - -4 - - - N
4
C3
04
0~C. m' Cl N c.0 aCC N N N 00 C- 'C m.7 CIA O
Mc -t 1 1') N N 0 C C ?" ?00 m . do .co '0% -7 m '. C 0 C .2 'C 4 N -./ 0 7 0 a 0 a 0 'o CC) C: 0
v' CC)' 0l' aC C~U- . .74 ~ . C 0 0 0090
Q Q 0 0 0 0 0 0 0 0 0 0 CD0
0
IQ 40D 41I 41 A 1 ,C1 1..1
'o c % n 0 W t m m -
41
q"041.4
u- C ' C - 0 'a0 0
Q U 00 0 000000000 6 w600 . 0
41, 0~- 7 C ) C ) C C NE.O O 03 0
454

Table 9
Summary of Vegetation Analysis of Herbaceous Layer
SpcisDensity Relative Relative Importance Reference Greentree . ..
Species Stems/ha Density Frequency Frequenc Value Rank Rank
Reference Site
Vine starjessamine 18,192 26.44 1.00 6.46 32.90 1 2
Common poison ivy 10,933 15.89 0.90 5.82 21.71 2 1
Sugarberry 6,575 9.56 0.97 6.27 15.83 3 6
Carolina snailseed 5,567 8.09 0.93 6.01 14.10 4 9
American buckwheat vine 4,733 6.88 0.90 5.82 12.70 5 4 0Pepper-vine 3,792 5.51 0.97 6.27 11.78 6 3
Trumpet creeper 3,900 5.67 0.77 4.98 10.65 7 15
Saw greenbrier 2,133 3.10 0.90 5.82 8.92 8 16
Swamp privet 1,617 2.35 0.67 4.33 6.68 9 5
American snowbell 592 0.86 0.73 4.72 5.58 10 10
Southern dewberry 1,992 2.89 0.40 2.59 5.48 11 --
Grapes 583 0.85 0.60 3.88 4.73 12 12
Smallspike false nettle 892 1.30 0.47 3.04 4.34 13 25
Knot root bristlegrass 442 0.64 0.50 3.23 3.87 14 --
Overcup oak 650 0.94 0.43 2.78 3.72 15 8
Green ash 633 0.92 0.33 2.13 3.05 16 18
Water hickory 283 0.41 0.40 2.59 3.00 17 7
Green hawthorn 242 0.35 0.40 2.59 2.94 18 21
Possuhaw holly 192 0.28 0.40 2.59 2.87 19 17
Common buttonbush 625 0.91 0.30 1.94 2.85 20 13
Common persimmon 167 0.24 0.30 1.94 2.18 21 19
Aimania 1,292 1.88 0.03 0.19 2.07 22 --
American elm 125 0.18 0.27 1.75 1.93 23 --
Nuttall oak 792 1.15 0.10 0.65 1.80 24 14
Alabama supplejack 175 0.25 0.23 1.49 1.74 25 11
Common greenbrier 75 0.11 0.23 1.49 1.60 26 20
Wisteria 200 0.29 0.20 1.29 1.58 27 26
Greenbriers 125 0.18 0.13 0.84 1.02 28 22
Unknown 1 550 0.80 0.03 0.19 0.99 29 --
Willow oak 58 0.08 0.10 0.65 0.73 30 -
Common bald cypress 58 0.08 0.10 0.65 0.73 31 --
Turnsole 33 0.05 0.10 0.65 0.70 32 --
Slender copperleaf 25 0.06 0.07 0.45 0.51 33 --
Butterweed 17 0.02 0.07 0.45 0.47 34 --
Creeping spot flower 133 0.19 0.03 0.19 0.38 35 --
Water purslane 83 0.12 0.03 0.19 0.31 36 --
Common pokeberry 83 0.12 0.03 0.19 0.31 37 --
Buttonweed 42 0.06 0.03 0.19 0.25 38 --
Climbing hempweed 33 0.05 0.03 0.19 0.24 39 --
Smooth buttonweed 33 0.05 0.03 0.19 0.24 40 --
Mistflower 25 0.04 0.03 0.19 0.23 41 --
Indigobush amorpha 17 0.02 0.03 0.19 0.21 42 23
Water hemp 17 0.02 0.03 0.19 0.21 43 --
Common cocklebur 17 0.02 0.03 0.19 0.21 44 --
Sedge 8 0.01 0.03 0.19 0.20 45 --
(Continued)
55
- -- - -- --
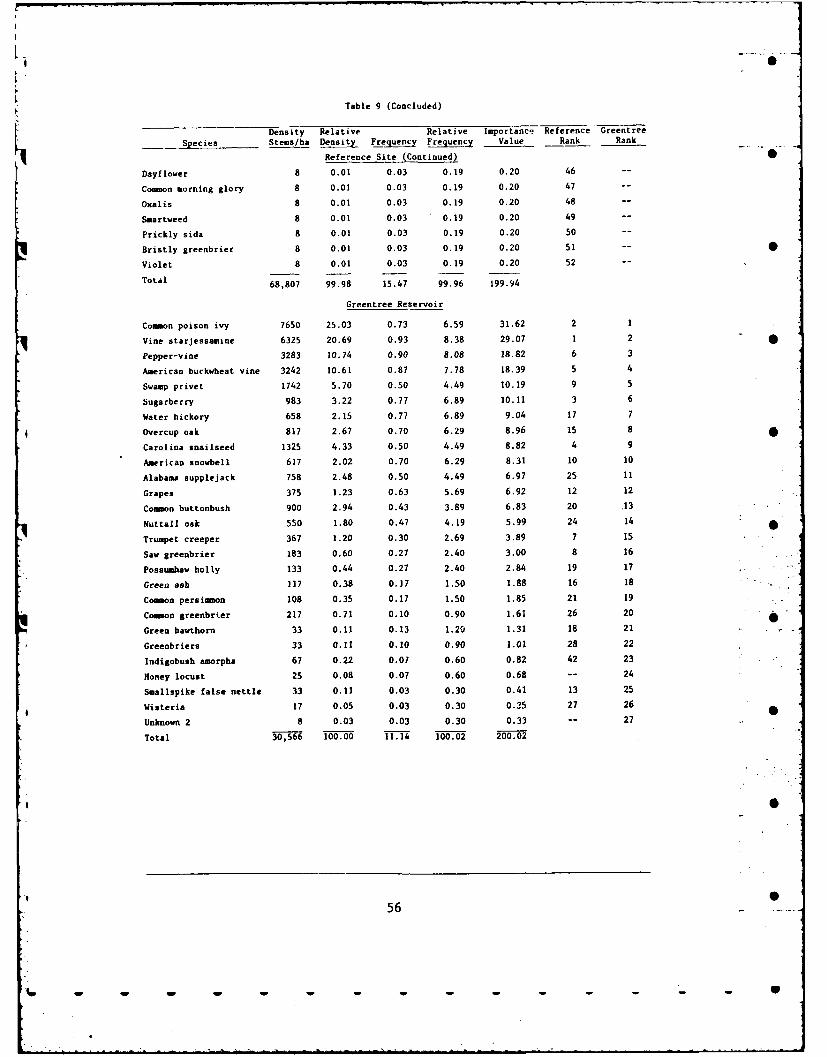
Table 9 (Concluded)
-Density Relative Relative Importance Reference Greentree
Species Stems/ha Density Frequenc Frequency Value Rank Rank
Reference Site (Continued) .
Dayflower 8 0.01 0.03 0.19 0.20 46 --
Cocoon morning glory 8 0.01 0.03 0.19 0.20 47 --
Oxalis 8 0.01 0.03 0.19 0.20 48 --
Smartweed 8 0.01 0.03 0.19 0.20 49 --
Prickly sida 8 0.01 0.03 0.19 0.20 50 --
Bristly greenbrier 8 0.01 0.03 0.19 0.20 51 --
Violet 8 0.01 0.03 0.19 0.20 52
Total 68,807 99.98 15.47 99.96 199.94
Greentree Reservoir
Common poison ivy 7650 25.03 0.73 6.59 31.62 2 1
Vine starjessamine 6325 20.69 0.93 8.38 29.07 1 2
Pepper-vine 3283 10.74 0.90 8.08 18.82 6 3
American buckwheat vine 3242 10.61 0.87 7.78 18.39 5 4
Swamp privet 1742 5.70 0.50 4.49 10.19 9 5
Sugarberry 983 3.22 0.77 6.89 10.11 3 6
Water hickory 658 2.15 0.77 6.89 9.04 17 7
[ Overcup oak 817 2.67 0.70 6.29 8.96 15 8
Carolina snailseed 1325 4.33 0.50 4.49 8.82 4 9
American snowbell 617 2.02 0.70 6.29 8.31 10 10
Alabama supplejack 758 2.48 0.50 4.49 6.97 25 11
Grapes 375 1.23 0.63 5.69 6.92 12 12
Common buttonbush 900 2.94 0.43 3.89 6.83 20 .13
Nuttall oak 550 1.80 0.47 4.19 5.99 24 14
Trumpet creeper 367 1.20 0.30 2.69 3.89 7 15
Saw greenbrier 183 0.60 0.27 2.40 3.00 8 16
Possumbaw holly 133 0.44 0.27 2.40 2.84 19 17
Green ash 117 0.38 0.17 1.50 1.88 16 18
Common persimmon 108 0.35 0.17 1.50 1.85 21 19
Common greenbrier 217 0.71 0.10 0.90 1.61 26 20
Green hawthorn 33 0.11 0.13 I.2 1.31 18 21
Greenbriers 33 0.11 0.10 0.90 1.01 28 22
Indigobush amorpha 67 0.22 0.07 0.60 0.82 42 23
Honey locust 25 0.08 0.07 0.60 0.68 -- 24
Smallspike false nettle 33 0.11 0.03 0.30 0.41 13 25
Wisteria 17 0.05 0.03 0.30 0.35 27 26
Unknown 2 8 0.03 0.03 0.30 0.33 -- 27
Total 30,566 100.00 11.14 100.02 200.02
56
- - - -

Table 10
Mean Values for Physical and Chemical Soil Characteristics
on the Reference Site and Greentree Reservoir
Parameter Reference Site Greentree Reservoir
Percent sand 9.30 5.95
Percent silt 33.75 33.95
Percent clay 56.95 60.10
pH 5.25 5.11
TKN,* mg/kg 1822 1803
TC,* mg/kg 17019 18774
P, mg/kg 12.9 13.6
Ca, meqt/100 g 25.1 26.5
Mg, meq/100 g 8.7 9.6
, K, meq/100 g 1.0 1.0
* Total Kjeldahl nitrogen.Total carbon.
t Nilliequivalent.
57
S

I
IA: : : ::: N - : - 4 N : :- N N 4 :
K I
4,2,, , *7o.,, ,
* 4 C N C 0 4I
4> .....i :
.. . ' ,. 4 4 0 4 N . . ..C
IIC N N C 0 Ni 4+ .N"+t+ N -' N -" + ' 4 .
0 2

-
U *-~ U U ~ - U U U U
- .,
S 44 A
*4 - - 0' 4 - - 0'
- ..... ~. ~
* ~ , ~
.- C - ., C OO~~a
~ 0* ,,',,-,,,,,-.,4,.,-.
- * aa - C - -, C'-
I~0~ - 5 *..-.~* 44
Kj:2 22.
~ ::::~:: : -
* I, "~ - 4 ~~'-2>I2'
o a .n CH:4 - -
o a
-1~ *
* '2:::::
a
4 U, 4
- 4 - 40.I~
'S
4 4 0 4 C C
4 4 *0 4 4 4 4
~, ~ 0Ci. * * * * C C a a
- ~' - ' ~ -
0 4 C 4 0 a C
- * 0 1
00~0 4 C - - - 0L.I ~I 00 ~ ~ **~ f.~ ~ '2
*~ 0. 0 C., 0 b. 00 I. CO *.J 4- -. ~ 41 -o *o .. ~ ~
~. ~ Se -~ - - --
£11. .1 a Uk ~ ~ . CO C
S
59
a. S 0 - S 5 0 5 - - - - - - - - S

I
APPENDIX A: RANDOM NUMBERS FOR VEGETATION SAMPLINGON THE STUDY AREA
The tabulation below presents the random numbers drawn to establish
a randomized block experimental design for vegetation sampling on the
study area.
Greentree Reservoir Reference SiteT6 T7 T3 T4 T5 T6 T7 T3 T4 T5
Plot Transect (199) (437) (979) (1163) (1397) (94) (368) (550) (855) (1373)
QL 160 143 83 292 107 87 171 87 143 133
Q2 270 215 173 368 200 214 234 163 206 246
Q3 393 292 374 438 296 246 391 319 242 489
Q4 501 359 487 528 479 343 432 494 279 514
Q5 635 408 677 630 643 393 562 623 472 609
Q6 715 654 795 737 718 479 732 730 636 698
The baseline of the coordinate grid is the line along the north edge of •
the top of the south levee bounding Reservoir No. 3. The numbers repre-
sent distance in meters. The transect positions (T) are measured in an
easterly direction from the zero point, or origin: the midpoint between
two steel gate posts at the west end of the south levee. Quadrat loca-
. tions (Q) in the greentree reservoir are measured from zero at the base-
" line along a magnetic north (3600) azimuth. Quadrat locations on the
reference site are measured from zero at the baseline along a magnetic
south (1800) azimuth. At the center of each plot location, a 1.3- by S
40-cm section of steel reinforcing rod was driven into the ground flush
with the surface to permanently mark the position and facilitate reloca-
tion by use of a metal detector.
Al

APPENDIX B: DEFINITIONS OF TERMS
Basal area: The area of a circle calculated from the diameter or 0circumference of a tree at breast height.
Cavity tree: Any tree class plant specimen (alive or dead) having atleast one visible cavity of potential use to a resident or nestingwildlife species (e.g., as a nesting cavity for a Carolina wren, foxsquirrel, racoon, or wood duck).
Density: Number of individuals (or stems) per unit area.
Diameter breast height (dbh): Diameter of a tree, shrub, vine, orsapling measured at breast height, or 1.5 m from the ground.
Dominance: Total of basal area for a species per unit area.
Down dead: Fallen dead logs or branches in the tree diameter class(>6.6 cm). In this study, length (to the nearest m) and diameter atthe middle (to the nearest cm) were measured, and the species wasnoted if it could be identified.
Frequency: Number of quadrats in which a species occurs/total numberof quadrats Fampled. •
Importance value: A synthetic approximation of a species' significancein the plant community calculated by summing relative density, relativedominance, and relative frequency. Since the sum of all importancevalues for a set of plant community data equals 300, this measure isalso called "Importance Value 300," or "I.V. 300." (In some cases,importance value is based on the sum of only two of the relativizedmeasures, such as relative density and relative frequency, and is thenreferred to as "Importance Value 200," or "I.V. 200.")
Litter layer: The blanket of organic material composed of matterrecognizable as plant parts which commonly covers the soil on theforest floor. S
Overstory (or canopy): That layer of vegetation formed by the crownsof mature and nearly mature, dominant forest trees such as oaks(Quercus spp.), bitter pecan (Carya aquatica), sugarberry (Celtislaevigata), and green ash (Fraxinus pennsylvanica var. subintegerrima).
Percent cover: That percentage of area within a measured quadrat that
is either covered by litter or would be covered should the livingleaves and stems of seedlings and herbaceous plants fall vertically tothe ground. The cover classes used in this study were: 0-1, 1-5,5-10, 10-25, 25-50, 50-75, 75-95, and 95-100 percent.
Quadrat: A sampling plot of a specified shape and dimension.
Relative density: (Density for a species/total density for all species)- -
x 100.
Relative dominance: (Dominance for a species/total dominance for allspecies) x 100.
Bi|i. .- B- -

Relative frequency: (Frequency value for a species/total of frequencyvalues for all species) x 100.
Saplings: Younger individuals of woody plant species that can attainthe stature of canopy trees when mature. For this study, individuals 0of all woody species >1.0 m in length and <6.6 cm dbh were classifiedas shrub/vine/sapling. The dbh >1.0 cm (to the nearest 0.1 cm) andheight (to the nearest 0.5 m) were recorded for each sapling.
Seedling: Any individual of a woody species <1 m in height.
Shrubs: Individuals of woody plant species common to the understory Swhich normally do not reach canopy tree stature when mature. Forthis study, all individuals of woody species >1.0 m in length and<6.6-cm dbh were classified as shrub/vine/sapling. Shrubs oftenhave more than one primary stem (i.e., a stem rising from ground levelat the base of the plant). For each primary stem, dbh >1.0 cm (tothe nearest 0.1 cm) and height (to the nearest 0.5 m) were recorded. 0
Standing dead: A class of vegetation which includes all dead trees thatare upright or standing. For this study, the dbh of these trees wasmeasured to the nearest centimeter. If the specimen was a stump, itstop diameter and height were measured to the nearest centimeter. Ifthey could be identified, the species of standing dead trees were re-corded; if not, they were labelled as "unknown."
Unsuppressed: Refers to a tree that is uncrowded by neighboring trees(i.e., has no nearby stumps or other evidences of tree removal) whichwould compete for light, that has a broad crown relative to its height(as compared with other trees of the same species in the stand), andthat has virtually no dead branches or signs of disease. 0
Vines: For this study a vine was defined as any individual of the fol-lowing species >1.0 m in length and <6.6-m dbh: Ampelopsis arborea,Berchemia scandens, Brunnichia cirrhosa, Cocculus carolinus, Rhusradicans, Trachelospermum difforme, Smilax spp., and Vitis spp. Thedbh >1.0 cm (to the nearest 0.1 cm) was recorded for vines.
B2

APPENDIX C: SCIENTIFIC AND COMMON NAMES OF PLANTS
Plants Alphabetized by Scientific Name 0
Scientific Name* Common Name
Acalypha gracilens Slender copperleafAcer rubrum Red mapleAmaranthus tamariscinus Water hempAmmannia coccinea Ammannia 0Amorpha fruticosa Indigobush amorphaAmpelopsis arborea Pepper-vineBerchemia scandens Alabama supplejackBoehmeria cylindrica Smallspike false nettleBrunnichia cirrhosa American buckwheat vineCampsis radicans Trumpet creeper 0Carex sp. SedgeCarya aquatica Water hickoryCeltis laevigata SugarberryCephalanthus occidentalis Common buttonbushCocculus carolin, Carolina snailseedCommelina diffusa Dayflower 0Cornus foemina Southern swamp dogwoodCrataegus viridus Green hawthornDiodia virginiana ButtonweedDiospyros virginiana Common persimmonEupatorium coelestinum MistflowerForestiera acuminata Swamp privetFraxinus pennsylvanica var. subintegerrima Green ashGleditsia triacanthos Honey locustHeliotropium indicum Turnsoleflex decidua Possumhaw hollyIpomea purpurea Common morning gloryLiquidambar styraciflua American sweetgum 0Ludwigia glandulosa Water purslaneMikania scandens Climbing hempweedOxalis spp. OxalisPhytolacca americana Common pokeberryPlanera aquatica Water elmPolygonum spp. SmartweedQuercus lyrata Overcup oakQuercus nuttallii Nuttall oakQuercus phellos Willow oakQuercus spp. OaksRhus radicans Common poison ivy
* Scientific nomenclature follows Radford et al. (1968). Where pos-sible common names were taken from Scott and Wasser (1980); otherwise,Radford et al. (1968) or Fernald (1970) were the sources.
Cl
0 0 0 C1- "

t0
Plants Alphabetized by Scientific Name (Continued)
Scientific Name Common Name
Rubus trivialis Southern dewberrySenecio glabellus ButterweedSetaria geniculata Knotroot bristlegrassSicyos angulatus Bur cucumberSida spinosa Prickly sidaSmilax bona-nox Saw greenbrierSmilax hispida Bristly greenbrier 0Smilax rotundifolia Common greenbrierSmilax spp. GreenbrierSpermacoce glabra Smooth buttonweedSpilanthes americana Creeping spot flowerStyrax americana American snowbellTaxodium distichum Common bald cypress STrachelospermum difforme Vine starjessamineUlmus americana American elmUlmus crassifolia Cedar elmViola sp. VioletVitis, spp. Grapes
4 Wisteria macrostachya WisteriaXanthium sturmarium Common cocklebur
Plants Alphabetized by Common Name
Common Name Scientific Name
Alabama supplejack Berchemia scandens •American buckwheat vine Brunnichia cirrhosaAmerican elm Ulmus americanaAmerican snowbell Styrax americanaAmerican sweetgum Liquidambar styracifluaAmmania Ammania coccineaBristly greenbrier Smilax hispidaBur cucumber Sicyos angulatusButterweed Senecio glabellusButtonweed Diodia virginianaCarolina snailseed Cocculus carolinusCedar elm Ulmus crassifoliaClimbing hempweed Mikania scandensCommon bald cypress Taxodium distichumCommon buttonbush Cephalanthus occidentalisCommon cocklebur Xanthium sturmariumCommon greenbrier Smilax rotundifoliaCommon morning glory Ipomea purpureaCommon persimmon Diospyros virginianaCommon poison ivy Rhus radicans
(Continued)
C2

Plants Alphabetized by Common Name (Concluded)
Common Name ___Scientific Name
Common pokeberry Phytolacca americanaCreeping spot flower Spilanthes americanaDayflower Commelina dii fusaGrapes Vitis spp.Green ash Fraxinus pennsylvanica var. subintegerrimaGreen hawthorn Crataegus viridusGreenbrier Smilax spp.Honey locust Gleditsia triacanthosIndigobush amorpha Amorpha fruticosaKnotroot bristlegrass Setaria geniculataMist flower Eupatorium coelestinumNuttall oak Quercus nuttalliiOaks Quercus spp.Overcup oak Quercus lyrata
*Oxalis oxalis spp.Pepper-vine Ampelopsis arboreaPossumhaw holly hlex deciduaPrickly sida Sida spinosaRed maple Acer rubrumSaw greenbrier Smilax bona-noxSedge Carex spp.Slender copperleaf Acalypha gracilensSmallspike false nettle Boehmeria cylindricaSmartweed Polygonum spp.Smooth buttonweed Spermacoce glabraSouthern dewberry Rubus trivialisSouthern swamp dogwood Cornus foeminaSugarberry Celtis laevigataSwamp privet Forestiera acuminata
* Trumpet creeper Camps is radicansTurnsole Heliotropium indicumVine starjessamine Trachelospermum dii formneViolet viola sp.Water elm Planera aquaticaWater hemp Ama ran thus tamariscinusWater hickory Carya aquaticaWater purslane Ludwigia glandulosaWillow oak Quercus phellosWisteria Wisteria macrostachya
C 3

_. - •
In accordance with letter from DAIEN-RDC, DAEN-ASI dated22 July 1977, Subject: Facsimile Catalog Cards forLaboratory Technical Publications, a facsimile catalogcard in Library of Congress MARC format is reproducedbelow.
Newling, Charles J.Ecological investigation of a greentree reservoir
in the Delta National Forest, Mississippi / by CharlesJ. Newling (Environment.,l Laboratory, U.S. ArmyEngineer Waterways Experiment Station). -- Vicksburg,Miss. : The Station ; Springfield, Va. ; availablefrom NTIS, 1982.
65 p. in various pagings : ill. ; 27 cm. -- S(Miscellaneous paper ; EL-81-S)Cover title."September 1981."Final report."Prepared for Assistant Secretary of the Army (R&D),
Department of the Army."Bibliography: p. 41-44.
1. Delta National Forest (Miss.) 2. Ecologicalsuccession. 3. Floods. 4. Forests and forestry.S. Reservoirs. 1. United States. Assistant Secretaryof the Army (R&D). II. U.S. Army Engineer Waterways
Newling, Charles J.Ecological investigation of a greentree reservoir : ... 1982.
(Card 2)
Experiment Station. Environmental Laboratory. III. TitleIV. Series: Miscellaneous paper (U.S. Army EngineerWaterways Experiment Station) ; EL-81-5.TA7.W34m no.EI.-81-5
mS