measurement setup consideration and implementation ... - arXiv
Upload
khangminh22Category
view
4download
0
NAVAL
POSTGRADUATE
SCHOOL
MONTEREY, CALIFORNIA
THESIS
Approved for public release; distribution is unlimited
DESIGN AND ANALYSIS OF AN EXPERIMENTAL
SETUP FOR DETERMINING THE BURST STRENGTH
AND MATERIAL PROPERTIES OF HOLLOW
CYLINDERS
by
Timothy D. Ponshock
December 2015
Thesis Advisor: Young W. Kwon
Co-Advisor: John D. Molitoris

THIS PAGE INTENTIONALLY LEFT BLANK

i
REPORT DOCUMENTATION PAGE Form Approved OMB No. 0704–0188
Public reporting burden for this collection of information is estimated to average 1 hour per response, including the time for reviewing instruction,
searching existing data sources, gathering and maintaining the data needed, and completing and reviewing the collection of information. Send comments regarding this burden estimate or any other aspect of this collection of information, including suggestions for reducing this burden, to
Washington headquarters Services, Directorate for Information Operations and Reports, 1215 Jefferson Davis Highway, Suite 1204, Arlington, VA
22202-4302, and to the Office of Management and Budget, Paperwork Reduction Project (0704-0188) Washington, DC 20503.
1. AGENCY USE ONLY (Leave blank) 2. REPORT DATE
December 20153. REPORT TYPE AND DATES COVERED
Master’s Thesis
4. TITLE AND SUBTITLE
DESIGN AND ANALYSIS OF AN EXPERIMENTAL SETUP FOR
DETERMINING THE BURST STRENGTH AND MATERIAL PROPERTIES OF
HOLLOW CYLINDERS
5. FUNDING NUMBERS
6. AUTHOR(S) Timothy D. Ponshock
7. PERFORMING ORGANIZATION NAME(S) AND ADDRESS(ES)
Naval Postgraduate School
Monterey, CA 93943-5000
8. PERFORMING ORGANIZATION
REPORT NUMBER
9. SPONSORING /MONITORING AGENCY NAME(S) AND ADDRESS(ES)
Lawrence Livermore National Laboratory 10. SPONSORING/MONITORING
AGENCY REPORT NUMBER
11. SUPPLEMENTARY NOTES The views expressed in this thesis are those of the author and do not reflect the official policy
or position of the Department of Defense or the U.S. Government. IRB Protocol number ____N/A____.
12a. DISTRIBUTION / AVAILABILITY STATEMENT Approved for public release; distribution is unlimited
12b. DISTRIBUTION CODE
13. ABSTRACT (maximum 200 words)
A mechanical device and associated testing procedure were developed to apply internal pressure to open-ended
cylinders for determination of various properties, including burst pressure, elastic modulus, and Poisson’s ratio.
ANSYS finite element analysis software was used to model the operation of the device with aluminum cylinders.
Analytic equations for thin and thick cylinders were used to validate the computer model results. Initial mechanical
testing was performed with aluminum cylinders to verify results against the finite element model. Glass and carbon
fiber composite cylinders were fabricated and tested to failure with the device and the aforementioned properties were
found. Finally, carbon fiber composite tensile specimens of the dog-bone shape were tested to failure to compare
material properties with those found from the cylinder tests. The test device and methods developed in this research
support Lawrence Livermore National Laboratory and the Defense Threat Reduction Agency in the development of
the Agent Defeat Penetrator, a next-generation agent defeat weapon.
14. SUBJECT TERMS
carbon fiber composite, glass fiber composite, pressure testing, composite cylinder 15. NUMBER OF
PAGES 101
16. PRICE CODE
17. SECURITY
CLASSIFICATION OF
REPORT Unclassified
18. SECURITY
CLASSIFICATION OF THIS
PAGE
Unclassified
19. SECURITY
CLASSIFICATION OF
ABSTRACT
Unclassified
20. LIMITATION OF
ABSTRACT
UU
NSN 7540–01-280-5500 Standard Form 298 (Rev. 2–89) Prescribed by ANSI Std. 239–18

ii
THIS PAGE INTENTIONALLY LEFT BLANK

iii
Approved for public release; distribution is unlimited
DESIGN AND ANALYSIS OF AN EXPERIMENTAL SETUP FOR
DETERMINING THE BURST STRENGTH AND MATERIAL PROPERTIES OF
HOLLOW CYLINDERS
Timothy D. Ponshock
Lieutenant, United States Navy
B.S., University of Wisconsin, 2008
Submitted in partial fulfillment of the
requirements for the degree of
MASTER OF SCIENCE IN MECHANICAL ENGINEERING
from the
NAVAL POSTGRADUATE SCHOOL
December 2015
Author: Timothy D. Ponshock
Approved by: Young W. Kwon
Thesis Advisor
John D. Molitoris
Co-Advisor
Garth V. Hobson
Chair, Department of Mechanical and Aerospace Engineering

iv
THIS PAGE INTENTIONALLY LEFT BLANK

v
ABSTRACT
A mechanical device and associated testing procedure were developed to apply
internal pressure to open-ended cylinders for determination of various properties,
including burst pressure, elastic modulus, and Poisson’s ratio. ANSYS finite element
analysis software was used to model the operation of the device with aluminum cylinders.
Analytic equations for thin and thick cylinders were used to validate the computer model
results. Initial mechanical testing was performed with aluminum cylinders to verify
results against the finite element model. Glass and carbon fiber composite cylinders were
fabricated and tested to failure with the device, and the aforementioned properties were
found. Finally, carbon fiber composite tensile specimens of the dog-bone shape were
tested to failure to compare material properties with those found from the cylinder tests.
The test device and methods developed in this research support Lawrence Livermore
National Laboratory and the Defense Threat Reduction Agency in the development of the
Agent Defeat Penetrator, a next-generation agent defeat weapon.

vi
THIS PAGE INTENTIONALLY LEFT BLANK

vii
TABLE OF CONTENTS
I. INTRODUCTION........................................................................................................1 A. MOTIVATION ................................................................................................1 B. OBJECTIVE ....................................................................................................3 C. EXPERIMENTAL OVERVIEW ...................................................................4
D. PRIOR RESEARCH .......................................................................................4
II. TEST DEVICE DEVELOPMENT ............................................................................7 A. TEST DEVICE DESIGNS ..............................................................................7 B. COMPUTER MODELING AND FINITE ELEMENT ANALYSIS ..........9
1. Baseline Setup.....................................................................................10
2. Baseline Results ..................................................................................11 3. Varying Friction Results ...................................................................19
III. EXPERIMENT ..........................................................................................................21 A. COMPOSITE CYLINDER FABRICATION .............................................21
1. Mold Setup ..........................................................................................21 2. Composite Layup ...............................................................................22
3. Cylinder Finishing .............................................................................26 B. COMPOSITE TENSILE SPECIMEN FABRICATION ...........................29
1. Composite Layup ...............................................................................29
2. Tensile Specimen Finishing ...............................................................30 C. STRAIN GAGES ...........................................................................................30
1. Application of Strain Gages ..............................................................31
D. TESTING PLAN ............................................................................................32
E. PROCEDURE ................................................................................................33
IV. RESULTS ...................................................................................................................37
A. THIN ALUMINUM CYLINDER .................................................................37 1. Results .................................................................................................37 2. Calculation of Friction Coefficient and Burst Pressure .................45
B. THICK ALUMINUM CYLINDER..............................................................48 C. GLASS FIBER COMPOSITE CYLINDER ...............................................49
1. Results .................................................................................................49 2. Elastic Modulus and Burst Pressure ................................................55
D. CARBON FIBER COMPOSITE..................................................................56
1. Cylinder Results .................................................................................56 2. Tensile Specimen Results ..................................................................64 3. Elastic Modulus and Burst Pressure ................................................66
E. SUMMARY OF RESULTS ..........................................................................67
V. CONCLUSIONS, RECOMMENDATIONS AND FUTURE WORK ..................71 A. CONCLUSIONS AND RECOMMENDATIONS .......................................71 B. FUTURE WORK ...........................................................................................72
APPENDIX A. MATLAB SCRIPT ......................................................................................73

viii
APPENDIX B. SUPPLEMENTARY ANSYS SETTINGS AND RESULTS ...................77
LIST OF REFERENCES ......................................................................................................81
INITIAL DISTRIBUTION LIST .........................................................................................83

ix
LIST OF FIGURES
Agent Defeat Penetrator Concept, from [3]. ......................................................2 Carbon Fiber Composite Case Prior to Testing at Lawrence Livermore
National Laboratory Energetic Materials Center, from [3]. ..............................3 Cutaway View of Pin and Rod Design. .............................................................7 Wedge and Ram Design.....................................................................................8
45 Degree Wedges as Fabricated, from [3]. ......................................................9 Final Mesh Used for All Simulations Shown on the Thin Cylinder Model. ...11 Maximum Equivalent Stress in the Wedge for Thin and Thick Aluminum
Cylinders. .........................................................................................................12
Maximum Equivalent Stress in the Ram for Thin and Thick Aluminum
Cylinders. .........................................................................................................12
Thin Cylinder Strain versus Target Cylinder Hoop Strain. .............................13 Thick Cylinder Strain versus Target Cylinder Hoop Strain.............................14 Required Compressive Machine Force Versus Target Cylinder Hoop
Strain. ...............................................................................................................15 Equivalent Stress on the Outer Surface of the Thin Aluminum Cylinder at a
Target Hoop Strain of 0.001. ...........................................................................15 Hoop Strain versus Location Relative to Wedge for the Thin Cylinder. .........16 Hoop Strain versus Location Relative to Wedge for Thick Cylinder. .............16
Free Body Diagram for a Ram. ........................................................................17 Free Body Diagram for a Wedge. ....................................................................18
Machine Force versus Target Hoop Strain for Various Coefficients of
Friction .............................................................................................................19
Cylinder Mold Prior to Preparation for Composite Layup. .............................21 Cylinder Mold Prepared for Composite Cylinder Layup. ...............................22
Composite Layup Supplies. .............................................................................23 Additional Composite Layup Supplies ............................................................23 Carbon Fiber Composite Cylinder Immediately after Wrapping. ...................24 Composite Mold Wrapped with Breather Cloth and Vacuum Line
Attached. ..........................................................................................................25 Cylinder Mold Removed from Base and Placed Under 508-635 mm Hg
(20–25 in Hg) Vacuum. ...................................................................................25 Carbon Fiber Composite Cylinder Following Initial 1.25-1.5 Hour Cure. ......26 Cured Composite Cylinder with PVC Removal Ram......................................27
Rough Carbon Fiber Composite Cylinder after Removal from Mold. ............27 Typical Finished Glass Fiber Composite Cylinder. .........................................28
Typical Finished Carbon Fiber Composite Cylinder. ......................................28 Carbon Fiber Composite Sheet Layup Prior to Applying Vacuum. ................30 Carbon Fiber Composite Tensile Specimen. ...................................................30 Aluminum Cylinder Shown with Two 90-degree Strain Gage Rosettes
Wired for Testing. ............................................................................................32 Test Device and Cylinder Assembly Prepared For Test Run. .........................34

x
Thin Aluminum #1 Test Results. .....................................................................38
Failure of Thin Aluminum #1 Near Hoop Strain Channel 1. ..........................38 Thin Aluminum #4 Test Results. .....................................................................39 Failure Location of Thin Aluminum #4 Near Strain Channel 2. .....................40
Thin Aluminum #5 Test Results. .....................................................................41 Failure Location of Thin Aluminum #5 Near Strain Channel 2. .....................42 Thin Aluminum #6 Test Results. .....................................................................43 Failure Location of Thin Aluminum #6 Near Strain Channel 1. .....................43 Averaged Results from Thin Aluminum 4–6...................................................44
Averaged Results for Thin Aluminum 4–6 and Finite Element Model for
Friction Coefficient Equal to 0.12. ..................................................................46 Thick Aluminum #1 Test Results. ...................................................................48 7Glass Fiber Composite #1 Test Results. ........................................................50
Glass Fiber Composite #1 Failure Location. ...................................................50 Glass Fiber Composite #2 Test Results. ..........................................................51
Glass Fiber Composite #2 Failure Location. ...................................................52 Glass Fiber Composite #3 Test Results. ..........................................................53
Glass Fiber Composite #3 Failure Location. ...................................................54 Screen Shot of High Speed Video Taken at 750 Frames per Second. .............54 Averaged Results from GFC 1, 2, and 3 ..........................................................55
Carbon Fiber Composite #1 Test Results. .......................................................57 Carbon Fiber Composite #1 Failure Location. ................................................58
Carbon Fiber Composite #2 Test Results. .......................................................59 Carbon Fiber Composite #2 Failure Location. ................................................59 Carbon Fiber Composite #3 Test Results. .......................................................60
Carbon Fiber Composite #3 Failure Location. ................................................61
Carbon Fiber Composite #4 Test Results. .......................................................62 Carbon Fiber Composite #4 Failure Location. ................................................63 Carbon Fiber Composite 1–4 Averaged Results. .............................................64
Carbon Fiber Composite Tensile Test Results.................................................65 Tensile Specimens after Testing. .....................................................................65
Tensile Specimen Stress-Strain Curves. ..........................................................66 ANSYS Mesh Controls. ...................................................................................79
ANSYS Nonlinear Controls. ............................................................................80 ANSYS Step Controls......................................................................................80

xi
LIST OF TABLES
Table 1. Thin Cylinder Finite Element Analysis Results...............................................13 Table 2. Thick Cylinder Finite Element Analysis Results. ............................................14 Table 3. Finite Element and Analytic Hoop Strain. .......................................................19 Table 4. Complete Test Plan. .........................................................................................33 Table 5. Tabulated and Averaged Results for Thin Aluminum 4 through 6 at
Failure. .............................................................................................................45 Table 6. Experimentally Determined Friction Coefficients Using Thin and Thick
Cylinder Assumptions. .....................................................................................46 Table 7. Experimental, Analytic and Finite Element Burst Pressures for Thin
Aluminum Cylinders. .......................................................................................47 Table 8. Glass Fiber Composite Calculated Young’s Modulus and Burst Pressure. .....56
Table 9. Carbon Fiber Composite Calculated Young’s Modulus and Burst Pressure. ..67 Table 10. Experimental and Analysis Result Summary. .................................................70 Table 11. Baseline Results for Thin Aluminum Cylinder. ..............................................77
Table 12. Baseline Results for Thick Aluminum Cylinder. .............................................77 Table 13. Thin Cylinder Results with Friction Coefficient of 0.05. ................................78
Table 14. Thin Cylinder Results with Friction Coefficient of 0.01. ................................78 Table 15. Thin Cylinder Results with Friction Coefficient of 0.12. ................................79

xii
THIS PAGE INTENTIONALLY LEFT BLANK

xiii
LIST OF ACRONYMS AND ABBREVIATIONS
ADP Agent Defeat Penetrator
ADW Agent Defeat Weapon
AGM air-to-ground missile
BLU bomb live unit
CBU cluster bomb unit
CFC carbon fiber composite
DTRA Defense Threat Reduction Agency
FEA finite element analysis
GFC glass fiber composite
EMC Energetic Materials Center
LLNL Lawrence Livermore National Laboratory
WMD weapons of mass destruction

xiv
THIS PAGE INTENTIONALLY LEFT BLANK

xv
ACKNOWLEDGMENTS
I would like to thank Young W. Kwon, my advisor, for using his significant
experience in the field to guide me throughout this research. I would also like to thank
Dr. John D. Molitoris, my co-advisor, and the Lawrence Livermore National Laboratory
Energetics Materials Center for providing the topic, direction, as well as fabrication
services with quick turnaround times. I would like to acknowledge the Lawrence
Livermore National Laboratory National Security Office for its support of our
collaboration and the Advanced Materials for Energetic Applications Initiative that made
this work possible. Finally, I would like to thank DTRA Eglin AFB for its support of the
LLNL NPS collaboration through the ADP Project, and in particular, Capt. Chris Vergien
and Mr. Frank Fairchild.

xvi
THIS PAGE INTENTIONALLY LEFT BLANK

1
I. INTRODUCTION
A. MOTIVATION
The U.S. Defense Threat Reduction Agency (DTRA) was created with two
primary purposes: to support combatant commanders in their response to threats related
to weapons of mass destruction and to foster research and development as ways and
means of countering the WMD threat around the world [1]. Typical high explosive
weapons are incapable of producing the extremely high and sustained temperatures
required to destroy chemical and biological weapons, so specialized Agent Defeat
Weapons (ADW) were developed to reliably destroy such weapons while minimizing the
risk of releasing the agent to the environment [2]. Current weapons include the BLU-
118/B Thermobaric Weapon, Bomb Live Unit (BLU) -119/B Crash Prompt Agent Defeat
Weapon, Cluster Bomb Unit (CBU)-107 Passive Attack Weapon, and High Temperature
Incendiary J-1000 [2]. The ADW systems typically consist of a high-temperature
incendiary payload on a standard weapon body, such as the Guided Bomb Unit (GBU)-
15, GBU-24, GBU-27, GBU-28, GBU-31, or Air-to-Ground Missile (AGM)-130 [2].
The Energetic Materials Center (EMC) at Lawrence Livermore National
Laboratory (LLNL) is conducting research and development with DTRA in support of a
future ADW known as the Agent Defeat Penetrator (ADP). The ADP concept is shown in
Figure 1 and consists of a BLU-109 for hard target penetration and a proprietary thermal
filler material developed by LLNL and DTRA.

2
Agent Defeat Penetrator Concept, from [3].
The LLNL Agent Defeat Program under Dr. John Molitoris is developing a
weaponized payload for the ADP based on cast curable cobalt thermite. This fill is known
as CTP-W. The research and development necessary for this agent defeat payload relies
heavily on the use of carbon fiber composite (CFC) cases. These CFC cases need to have
sufficient strength for compression of the thermite and long confinement times prior to
case release. In principle, the strength of the CFC case used for testing should be
comparable to steel. In practice, the CFC test cases need to be as strong as possible and
have well understood properties. CFC is used for ADP payload testing and development
as upon explosive initiation and dispersion there are no high velocity metal fragments
created that would damage diagnostic equipment. As a result, the highest fidelity data can
be taken by utilizing CFC cases in the dynamic test phase. A typical CFC test cylinder
prepared for dynamic testing is shown in Figure 2.

3
Carbon Fiber Composite Case Prior to Testing at Lawrence
Livermore National Laboratory Energetic Materials Center, from [3].
Another benefit of CFC cases is the possibility for use in future ADW cases. CFC
allows for higher-strength-to-weight ratios as well as alteration of the case properties by
small adjustments in the fabrication process such as epoxy formulation or filament
winding angle. This could result in a lighter weapon with a case designed for a specified
containment time during the fabrication process.
B. OBJECTIVE
This research strongly supports LLNL/DTRA research on next and future
generation weapons for agent defeat, specifically development of the ADP. The primary
objective was the development a purely mechanical device capable of testing hollow
cylinders to failure without modification to the cylinder. Data recorded during the tests
will allow for directly determining the elastic modulus, Poisson’s ratio, and burst pressure
of the cylinder. Ultimately, this test device will be used to determine the material
properties used in the composite cases used for explosive testing by LLNL as well as
validation of finite element models of the composite cases.

4
C. EXPERIMENTAL OVERVIEW
Six 3.172 mm (0.125 in) thick aluminum, two 6.35 mm (0.25 in) thick aluminum,
three glass fiber composite (GFC), and four CFC cylinders were prepared for testing with
the test device fabricated for this project. The thick aluminum and two thin aluminum
cylinders were machined on a lathe to the proper dimension and were analyzed separately
from the remaining aluminum cylinders due to changes in material properties from the
machining process. Additionally, three CFC tensile specimens were fabricated for
comparison with the results from the CFC cylinders.
All composite cylinders were fabricated by hand by wrapping a strip of composite
mesh around a mold to achieve a nominal thickness of 3.172 mm (0.125 in). Several
strain gages were attached to the midline of each cylinder to measure hoop and axial
strains during the test. A single 90-degree strain gage rosette was attached to each CFC
tensile specimen to collect longitudinal and transverse strain data.
All tests were performed at a quasi-static extension rate of 2 mm/min to failure or
until the test device reached its limit, whichever occurred first. The data from the
aluminum cylinders was used to determine the friction coefficient of the test device. With
known friction, the results from the composite cylinder tests were used to determine the
burst pressure of all cylinders and the unknown material properties of the composite
cylinders such as elastic modulus and Poisson’s ratio. The data from the CFC tensile tests
was used to validate the capability of the test device to allow for accurate determination
of the unknown material properties previously mentioned.
D. PRIOR RESEARCH
A large body of prior work has been completed on both the analytic and
experimental analysis of composite pipes and pressure vessels [4-8]. Research conducted
by Onder et al. [4] and Xia et al. [5] determined an elastic solution for the burst pressure
of thick-walled composite pressure vessels with an internal pressure. Xing et al. [6]
examined the effects of various filament-winding angles to optimize composite filament-
wound pressure vessel properties and found an optimum winding angle of greater than 55
degrees and nearly 90 degrees for CFC and GFC, respectively. Hwang et al. [7]

5
investigated a novel approach for evaluating the material properties of filament-wound
composite vessels with good results.
With the exception of the research by Hwang et al., much of the existing research
uses current standard test methods including the unidirectional plate test (ASTM D3039),
split disk method (ASTM D2290), and the hydraulic pressure test of filament-wound
pressure vessels (ASTM D2585). For the testing of open-ended composite cylinders, all
of these test methods have shortcomings that either introduce errors or make the testing
more complicated and expensive. The unidirectional plate test uses composite fiber
filaments wound around a flat plate mandrel to fabricate the test specimen and errors are
inserted due to varying geometry and residual stresses compared to the actual cylinder
whose properties are desired [7]. The split ring method introduces errors due to loading
not being purely tensile during the test [7]. Although the hydraulic pressure test gives
excellent results for pressure vessels, testing of the composite cylinders used for ADP
testing would require capping the ends to allow pressurization with from an external
source.
Horide et al. [8] successfully tested multi-ply GFC under internal pressure using a
modified ring burst test that removed much of the errors seen with ASTM D2290.
However, their test method requires a thin composite ring similar to the ASTM split ring
specimen for testing. A patent search revealed several design for applying internal
pressure to a cylinder [9-11]. All devices are similar in that they require a fluid to
pressurize the test cylinder using either a high-pressure hydraulic pump or through
application of a compressive force to a piston. These designs essentially cap the ends of
the cylinder and require sometimes complex equipment to conduct testing. This study
differs from prior research in that it explores a method to determine the material
properties of a composite cylinder by directly testing the actual cylinder to failure without
modification. This should remove errors due to uneven loading and scaling effects seen in
prior research and testing standards.

6
THIS PAGE INTENTIONALLY LEFT BLANK

7
II. TEST DEVICE DEVELOPMENT
A. TEST DEVICE DESIGNS
In order to overcome the issues related to current systems designed to test hollow
composite cylinders, two requirements for a new device were set. First, the device must
be purely mechanical, requiring only a uniaxial testing machine for its use. Second, the
device must be capable of testing cylinders without modification (i.e., capping the ends).
These requirements result in an expansion device that converts the linear motion of a
uniaxial testing machine to an expanding motion about the device’s diameter to apply an
internal pressure to the test cylinder.
Based on the aforementioned requirements for the test device, two designs were
created. The first consists of a series of cylindrical segments connected by pins and rods
to an upper and lower ram as shown in Figure 3. The test cylinder is placed around the
device and coincident with the cylindrical segments. Each ram is then connected to the
uniaxial testing machine, which, depending on the configuration of the device, applies
either a tensile or compressive force to press the cylindrical wedges out against the test
cylinder, thus applying the desired hoop stress.
Cutaway View of Pin and Rod Design.

8
The second design, referred to as wedge and ram, created as a simpler alternative
to minimize fabrication cost and difficulty. It consists of a series of cylindrical wedges
with the inner faces cut at an angle of 80 degrees surrounded by an optional shim that
acts as a spacer inside the test cylinder. Two rams with matching 80 degree conical
surfaces mate with the inner surface of the wedges and a small guide rod is inserted in
holes drilled on the facing surfaces of the rams to ensure proper alignment as shown in
Figure 4 and Figure 5. As with the first design, the test cylinder is placed around the
wedges and each ram is connected to a uniaxial test machine, which compresses the
device. As the rams slide against the wedges, the angled inner surfaces force the wedges
out and apply the desired internal pressure to the test cylinder.
Wedge and Ram Design.

9
45 Degree Wedges as Fabricated, from [3].
The first design was determined to be impractical due to the size of the cylinders,
7.62cm (3in) diameter, to be tested. The relatively small inner diameter would lead to
difficulties in fabrication and assembly of the device. Furthermore, due to stress
concentrations at the pin connections, larger cross-sections than possible would be
required in all parts to support the required loads. The second design, with its thicker
cross-sections, is inherently stronger and simpler to fabricate and assemble due to its lack
of moving parts. Based on this analysis, it was determined to continue with the second
design for further testing.
B. COMPUTER MODELING AND FINITE ELEMENT ANALYSIS
To validate functionality of the ram and wedge design, select an appropriate
material, and for comparison with experimental testing, a computer model of the device
was created and imported to ANSYS Mechanical Workbench for Finite Element Analysis
(FEA). Simulations of two 6061 T6 aluminum cylinders with the following parameters
were conducted:

10
7.62 cm (3 in) height
7.62 cm (3 in) inside diameter
0.3175 cm (0.125 in) and 0.635 cm (0.25 in) wall thickness hereafter
referred to as thin and thick cylinders, respectively.
Target hoop strains ranging from 0.001 to 0.01
Friction coefficients of 0.01 (baseline), 0.05, and 0.1
1. Baseline Setup
After importing the test device and cylinder assembly, all contact areas between
parts were defined as frictional surfaces with a friction coefficient of 0.01. The test
cylinder was defined as 6061 T6 aluminum alloy [12] with constant strain hardening
enabled to be more consistent with the nonlinear behavior of the experimental aluminum
test cylinders while minimizing computation time. All test device components were
initially defined as a general stainless steel. The assembly was then meshed using
standard mesh controls with the exception of the cylinder and two wedges. For these
components, the mesh was refined using a sweep method with 50 divisions and a face
sizing refinement with five divisions. These modifications gave a more uniform and
refined mesh throughout the thickness of the cylinder and wedges. The final mesh used
for all simulations is shown in Figure 6. The various hoop strains to be modeled were
defined with a vertical ramp displacement based on geometry on the top ram and a fixed
support on the bottom ram to create the desired expansion of the wedges. The shim, tangs
on the rams, and guide rod were removed from the simulation for simplicity since motion
of the device was constrained to only the vertical axis as explained above.

11
Final Mesh Used for All Simulations Shown on the Thin Cylinder
Model.
2. Baseline Results
The baseline results were initially used for checking functionality of the test
device as well as for material selection. Based on a stress analysis of the test device
components, 17–4 PH stainless steel in the annealed condition with a minimum yield
strength of 1 GPa [13] was selected to prevent yield up to a minimum cylinder hoop
strain of 0.01. The computer model stress versus target strain results for the wedge and
ram are shown in Figure 7 and Figure 8, respectively. The target strain was computed
from the geometry of the rams and wedges while neglecting their deformation. Maximum
stress in both are well below the yield point of 17–4 PH stainless steel providing a factor
of safety and allowing for future testing of stronger cylinders. Based on equivalent stress
and maximum shear stress failure theories, the FEA model predicts failure at a cylinder
hoop strains between 0.004 and 0.005. More detailed tabulated results from the FEA are
available in Appendix B.

12
Maximum Equivalent Stress in the Wedge for Thin and Thick
Aluminum Cylinders.
Maximum Equivalent Stress in the Ram for Thin and Thick
Aluminum Cylinders.
Following material selection, the FEA hoop strain in the cylinder and maximum
equivalent strain in the test device components were plotted against the target hoop strain
for the thin cylinder as shown in Figure 9. The plot shows that the strains in the test
device components when used with the thin aluminum cylinder are negligible and that the
actual hoop strain in the test cylinder checks with the target value up to approximately
0.005 hoop strain where the model predicts plastic deformation leading to failure of the
test cylinder. Error between target and actual hoop strain is less than 7.5% at target hoop

13
strains of 0.004 and below as shown in Table 1. Since strain gages will be used to
measure actual hoop strain during the experimental tests, any difference between the
target hoop strain based on ram motion and the cylinder’s actual hoop strain are not
important.
Thin Cylinder Strain versus Target Cylinder Hoop Strain.
Table 1. Thin Cylinder Finite Element Analysis Results.
Target Hoop Strain 0.001 0.002 0.003 0.004 0.005
FEA Hoop Strain 0.000931 0.001855 0.002779 0.003706 0.004024
Error -6.92% -7.28% -7.37% -7.36% -19.53%
The above analysis was repeated for the thick aluminum cylinder and the FEA
strain versus target strain results are shown in Figure 10 with a predicted hoop strain at
failure of approximately 0.007. From this, it is immediately apparent that the strain in the
ram and wedge of the test device are more significant than when testing the thin
aluminum cylinder. As a result, the error in actual versus target hoop strain is higher at
approximately 35% as shown in Table 2. Although the error between target and actual
hoop strains is unimportant since strain gages will record the hoop strain for future
calculations, the more significant strains in the test components may have a detrimental

14
effect on the capability of the test device to apply sufficient internal pressure to cause
failure prior to reaching the limits of the device.
Thick Cylinder Strain versus Target Cylinder Hoop Strain.
Table 2. Thick Cylinder Finite Element Analysis Results.
Target Hoop Strain 0.001 0.002 0.003 0.004 0.005
FEA Hoop Strain 0.000647 0.001292 0.001938 0.002584 0.003288
Error -35.33% -35.39% -35.40% -35.39% -34.24%
A Satec uniaxial compression-testing machine of model MII-20UD with a 200 kN
load capacity was to be used for all cylinder tests. To ensure that the Satec machine had
sufficient capacity for achieving the desired hoop strains, the required compressive
machine force was plotted against each target cylinder hoop strain value in Figure 11. As
expected, the compressive force required for a given hoop strain significantly higher for
the thick cylinder however with a maximum required compressive force of less than 150
kN, all target strains are within the capacity of the Satec testing equipment.

15
Required Compressive Machine Force Versus Target Cylinder Hoop
Strain.
Due to the segmented design of the wedges, consisting of eight 45 degree wedges,
there will exist some non-uniformity of stress applied to the cylinder, especially at the
interface between wedges. Figure 12 shows the degree of non-uniformity with a fairly
constant stress across each wedge and lower stress at each wedge interface.
Equivalent Stress on the Outer Surface of the Thin Aluminum
Cylinder at a Target Hoop Strain of 0.001.

16
To understand the degree of non-uniformity across the wedge better, the hoop
strain was plotted against the location relative to a wedge for the thin and thick cylinders
in Figure 13 and Figure 14. While the strain distribution for the thin cylinder is fairly
uniform except for the five degrees on either side of the wedge, the thick cylinder shows
more variation across the entire wedge.
Hoop Strain versus Location Relative to Wedge for the Thin
Cylinder.
Hoop Strain versus Location Relative to Wedge for Thick Cylinder.

17
As a final validation of the FEA results, thin and thick cylinder equations were
used for comparison with the FEA results for the thin aluminum cylinder. Thin-walled
assumptions are considered valid when the ratio of radius to thickness is greater than 10.
The thin aluminum cylinders and composite cylinders have a ratio of approximately 12
while the thick aluminum cylinder has a ratio of six. To derive the equations, it was
necessary to determine equations for the cylinder inner pressure and hoop strain as a
function of the friction coefficient and applied machine force. Two free body diagrams
were created representing a ram and a wedge as shown in Figure 15 and Figure 16. From
the two free body diagrams, a force balance was calculated resulting in thin and thick
cylinder equations for cylinder hoop strain at the outer surface as a function of an
assumed friction factor and applied machine force.
Free Body Diagram for a Ram.

18
Free Body Diagram for a Wedge.
Equation 1 uses thin cylinder assumptions while Equation 2 uses thick cylinder
assumptions to relate the applied machine force and friction coefficient to the cylinder
hoop strain. In Equation 1, L and t are the cylinder length and wall thickness respectively.
In Equation 2; a, b, and L are the inner radius, outer radius, and cylinder length,
respectively.
tan
1 tan
F
ELt
(1)
2
2 2
2 tan
( ) 1 tan
a F
RLE b a
(2)
A MATLAB script was developed to perform the above calculations for the thin
aluminum cylinder and is available in Appendix A. The average hoop strain across the
wedge from the finite element analysis was then compared to the analytic values in Table
3. The FEA results correspond well with the analytical results, providing a final
validation of the finite element analysis predictions.

19
Table 3. Finite Element and Analytic Hoop Strain.
Target Hoop Strain 0.001 0.002 0.003 0.004 0.005
FEA 0.000824 0.001646 0.002469 0.003292825 0.003927
Analytic thin cyl equations 0.0009 0.0018 0.0026 0.0035 0.0039
Error -8.47% -8.55% -5.03% -5.92% 0.68%
Analytic thick cyl equations 0.0008 0.0016 0.0023 0.0031 0.0035
Error 2.97% 2.89% 7.36% 6.22% 12.19%
3. Varying Friction Results
An important part of the experimental analysis will be accurately determining the
friction coefficient between the rams and wedges. To determine the effect of varying
levels of friction on the test device as well for comparison with experimental results, the
baseline finite element analysis was repeated with three different friction coefficients
ranging from baseline to 0.1. The only significant different between the various
simulations was the required compressive machine force at a given target hoop strain.
Since friction tends to oppose the compressive force applied by the machine, any increase
in friction will result in a larger compressive force required for a given hoop strain as
shown in Figure 17.
Machine Force versus Target Hoop Strain for Various Coefficients
of Friction

20
THIS PAGE INTENTIONALLY LEFT BLANK

21
III. EXPERIMENT
A. COMPOSITE CYLINDER FABRICATION
Composite cylinders were made with continuously wound strips of both glass
fiber and carbon fiber woven fabrics, epoxy resin, and hardener. For consistency between
cylinders, a mold was designed to ensure a consistent inner diameter of 7.62 cm (3 in).
For testing, the Glass Fiber Composite (GFC) and Carbon Fiber Composite (CFC)
cylinders were fabricated with a nominal wall thickness of 0.3175 cm (0.12 in)
corresponding to approximately five and six layers of wrapping, respectively.
1. Mold Setup
The mold was created entirely from off-the-shelf parts. The cylinder form around
which the fabric strips will be wound consists of a 30.48 cm (12 in) long hollow
aluminum tube. Two standard metal shelf supports were mounted to a sheet of wood to
create a support base for the cylinder form. A large wood dowel was then inserted into
the aluminum tube and screws were used to connect the cylinder form to the support base
as shown in Figure 18.
Cylinder Mold Prior to Preparation for Composite Layup.

22
To prepare the mold for composite layup, a layer of release ply paper followed by
a layer of Teflon sheet were wrapped around the aluminum cylinder form. The two layers
prevent any epoxy from sticking to the form and ensuring an easy release following
curing. Next, two rubber drain pipe couplers were used to create top and bottom guides
for composite strip alignment as well as an outer surface forms for the composite
cylinders. The top and bottom guides were made by cutting the rubber coupler into two
narrow strips of the correct diameter and then wrapping them around the mold cylinder to
contain the fiber fabric during wrapping. The second coupler was left at its original
length of 10.16 cm (4 in) but cut to a circumference of 25.9 cm (10.2 in) to match the
outer circumference of the cylinders to be fabricated. A mold prepared for cylinder layup
is shown in Figure 19.
Cylinder Mold Prepared for Composite Cylinder Layup.
2. Composite Layup
To prepare for layup, the needed supplies were first gathered. These include PRO-
SET M1002 resin, PRO-SET M2043-1 hardener, mixing cup, scale, stir stick, brush and
roller as shown in Figure 20. For use following composite wrapping, 10.16 cm (4 in)
wide strips of perforated release ply and breather cloth, two vacuum bags, and double
sided tape were prepared as shown in Figure 21.

23
Composite Layup Supplies.
Additional Composite Layup Supplies
To begin layup, the resin and hardener were thoroughly mixed in a 4.17 by weight
ratio. For both glass and carbon fiber composites, 80 and 19.18 grams of resin and
hardener, respectively, provided the correct amount of epoxy while to provide full

24
coverage while minimizing waste. Following mixing, the epoxy was applied to either side
of the first 25 cm (9.84 in) of the strip as well as the mold rig. This initial application
ensures compete epoxy coverage for the first wrap of the fiber strip to minimize voids
during the curing process. Next, the strip was hand-wrapped around the mold cylinder
between the two rubber guides. Additional epoxy was applied between each layer of the
wrap using the brush and spread evenly with the roller. Maintaining tension on the fiber
strip during the wrapping process is key to fabricating a uniformly thick cylinder with
minimal voids. Figure 22 shows a carbon fiber composite cylinder just after wrapping
and prior to vacuum bagging.
Carbon Fiber Composite Cylinder Immediately after Wrapping.
The next step in fabrication was wrapping the composite cylinder with the pre-
prepared strip of perforated release ply and breather cloth. The breather cloth absorbs any
excess epoxy that is pressed through the perforated release ply. A spiral-wound line
connected to a vacuum pump was then taped to the mold cylinder as shown in Figure 23.
The entire mold cylinder was then removed from the base and wrapped in breather cloth
to absorb excess resin and prevent the edges of the aluminum mold cylinder from cutting
into the vacuum bag. Finally, the mold cylinder was placed in a vacuum bag and under
20–25 in hg vacuum as in Figure 24 for 1.25-1.5 hours to allow the curing process to
begin.

25
Composite Mold Wrapped with Breather Cloth and Vacuum Line
Attached.
Cylinder Mold Removed from Base and Placed Under 508-635 mm
Hg (20–25 in Hg) Vacuum.
Following the initial cure time, the vacuum bag, breather cloth, and perforated
peal ply were removed from the composite cylinder and mold allowing for inspection of
the partially-cured cylinder seen in Figure 25. A roller was used to smooth the outer
surface before placing the rubber outer form around the composite cylinder and wrapping
tightly with electrical tape. The mold was then again wrapped with perforated release ply
and breather cloth and placed in a vacuum bag for an additional three hours under 508-
635 mm Hg (20–25 in Hg) vacuum to allow for complete curing of the epoxy resin.

26
Carbon Fiber Composite Cylinder Following Initial 1.25-1.5 Hour
Cure.
3. Cylinder Finishing
Following the final cure, the composite cylinder and the mold were removed from
the vacuum bag, breather cloth, and perforated peel ply. A section of PVC pipe was then
used as a ram to remove the composite cylinder from the mold as shown in Figure 26.
Following removal from the mold, the top and bottom guide and the outer surface form
were removed from the composite cylinder resulted in the rough cylinder in Figure 27.
27
Cured Composite Cylinder with PVC Removal Ram.
Rough Carbon Fiber Composite Cylinder after Removal from Mold.

28
As a final step to create uniform cylinders, a rotary cutting tool was used to trim
the top and bottom of each rough composite cylinder to create nominal finished
composite cylinders 7.62 cm (3in) tall, with a 7.62 cm (3 in) inside diameter, wall
thickness of 0.316 cm (0.125 in) for testing. Figure 28 and Figure 29 show typical
finished glass and carbon fiber composite cylinders.
Typical Finished Glass Fiber Composite Cylinder.
Typical Finished Carbon Fiber Composite Cylinder.

29
B. COMPOSITE TENSILE SPECIMEN FABRICATION
Square CFC composite sheets were prepared for fabrication of tensile specimens
of the dog-bone shape. For comparison purposes, the sheets were fabricated to have a
nominal thickness of 0.3175 cm (0.12 in) by using six layers of composite to match the
CFC cylinders previously discussed.
1. Composite Layup
To prepare for layup, the needed supplies were first gathered as with the
composite cylinder fabrication except instead of strips of composite weave, six 47 cm by
47 cm squares of CFC were cut to create a six-ply CFC plate.
To begin layup, the resin and hardener were thoroughly mixed in a 4.17 by weight
ratio as with the composite cylinder layup. Following mixing, the epoxy was applied to
either side of the first CFC square to ensure complete coverage for the first ply. The
remaining CFC squares were applied one at a time with epoxy spread and rolled between
each layer to adequately spread the epoxy and remove air bubbles.
The completed six-ply sheet was then covered with a layer of perforated release
ply and breather cloth to absorb excess epoxy. A spiral-wound line connected to a
vacuum pump was routed along the edge of the CFC sheet and taped to the table. Double-
sided tape was used to frame the spiral-wound line and a layer of vacuum bag was placed
over the CFC sheet and attached to the double-sided tape as shown in Figure 30. The
vacuum pump was energized and the system was maintained at 508-635 mm Hg (20–25
in Hg) vacuum for 4.5-5 hours for a complete cure.

30
Carbon Fiber Composite Sheet Layup Prior to Applying Vacuum.
2. Tensile Specimen Finishing
After curing, the CFC sheet was cut into coupons in preparation for tensile
testing. Although composite tensile testing typically uses a specimen with a rectangular
profile [14], it was decided to use the more smoothly curved tensile specimen profile
prescribed for plastics [15] in an attempt to prevent failure of at the grip of the testing
machine. A typical CFC tensile specimen is shown in Figure 31.
Carbon Fiber Composite Tensile Specimen.
C. STRAIN GAGES
Strain gages were used to measure the hoop and longitudinal strain of the test
cylinders at various locations on the cylinder and for the CFC tensile specimens. The first
set of tests consisted of one of each type of cylinder: thin aluminum, thick aluminum,
fiberglass, and carbon fiber composite. To determine the uniformity of the applied hoop

31
stress, four uniaxial strain gages were applied in the hoop direction at each wedge
interface and centered on each wedge. The remaining cylinders utilized two 90 degree
strain gage rosettes and a single uniaxial strain gage in the hoop direction. For the tensile
specimens, a single 90 degree rosette was placed on the gage length. Although testing
standards call for strain gages mounted on either side of the specimen when determining
Young’s modulus [14], only a single rosette was used due to strain gage supply
limitations. The 90 degree rosette strain gages were Micro-Measurements part number
CEA-13-125WT-350. The uniaxial strain gages were Omega part number SGD-7/350-
LY4.
1. Application of Strain Gages
The following procedure was used to apply strain gages to all test cylinders.
1. Prepare Surface: The location for each strain gage was smoothed with a
fine grit sand paper to remove imperfections. Following sanding, the
surface was cleaned using a gauze pad soaked with ethanol followed by
another gauze pad soaked with methanol.
2. Place Strain Gage: A small piece of cellophane tape was applied to the
strain gage location and the used to hold the strain gage in place during
curing.
3. Apply Bonding Agent: A Micro-Measurements M-Bond AE-10 Adhesive
kit containing a two-part epoxy, dropper, and stir stick was used to bond
the strain gages to the cylinder. The dropper was used to measure the
appropriate amount of hardener for mixing with the resin for the
designated five minutes. Following mixing, the stir stick was used to apply
a small amount of epoxy to the strain gage. The strain gage and tape were
then firmly pressed onto the cylinder.
4. Wire leads: Following a 48 hour cure, the tape was removed and a dental
tool was used to remove an excess resin from the solder pads on the strain
gage. The lead wires were then soldered to the pads on the strain gages.
Figure 32 shows a cylinder with wired strain gages attached.

32
Aluminum Cylinder Shown with Two 90-degree Strain Gage
Rosettes Wired for Testing.
D. TESTING PLAN
The initial goal of the experiment was to validate the test device’s capability to
apply an internal pressure to various hollow cylinders to failure. Once validated, the
remaining cylinders were tested to determine the coefficient of friction between the ram
and wedge and to experimentally determine the elastic modulus and burst pressure of the
GFC and CFC cylinders. Finally, several CFC tensile specimens were tested to provide a
second means of determining the CFC’s elastic modulus as a check against the value
found using the test device. The complete testing plan with specific strain gage setup is
shown in Table 4.

33
Table 4. Complete Test Plan.
Run Description Data Strain Gage Rate
Thin Al 1 Machined Aluminum Cylinder
Force Strain
1
2 mm/min extension
Thin Al 2
Thin Al 3 As Received Aluminum Cylinder
2 Thin Al 4
Thin Al 5
Thin Al 6
Thick Al 1 Machined Aluminum Cylinder
1 Thick Al 2
GFC 1
GFC Cylinder
2
GFC 2 1
GFC 3 2
CFC 1
CFC Cylinder
1
CFC 2 2
CFC 3 2
CFC 4 2
CFC T1 CFC Tensile Specimen
3
CFC T2 3
CFC T3 3
*1 4 x uniaxial in hoop direction
*2 2 x 90 deg rosette and 1 x uniaxial in hoop direction
*3 1 x 90 deg rosette
E. PROCEDURE
Before each test run, the wedge and ram contact surfaces were coated with a thin
coat of high pressure Lithium-Moly grease to minimize friction and minimize variation
between test runs. The test cylinder was then placed around the device and the entire
assembly placed between the pads of the 200 kN Satec uniaxial testing machine. The
strain gages were then connected to the data acquisition system as shown in Figure 33.

34
Test Device and Cylinder Assembly Prepared For Test Run.
After lowering the crosshead of the uniaxial testing machine until contact with the
test device was achieved, the machine’s extension was zeroed and its force balanced.
Next, the gage factor of the strain gage was entered into the data acquisition system and
each gage was calibrated. With the setup complete, the test was initiated by starting the
testing machine and data acquisition software. The test was complete after cylinder
failure or when the test device reached maximum expansion, whichever occurred first.
The log files from both the data acquisition system and testing machine, consisting of
strain and force data, were then exported for analysis.
Test setup for the CFC tensile specimens was similar to that for the cylinders. The
tensile specimen was placed in an Instron model 4507 uniaxial testing machine and
attached with grips at the top and bottom. The machine’s crosshead extension was then

35
zeroed and its force balanced. After connecting the strain gages to the data acquisition
system, their gage factor was entered and the gages were calibrated. As with the cylinder
tests, the tensile test runs were initiated by starting the testing machine and data
acquisition software. The test was complete once the tensile specimen failed. The log
files containing strain and force data were then exported for analysis.

36
THIS PAGE INTENTIONALLY LEFT BLANK

37
IV. RESULTS
A. THIN ALUMINUM CYLINDER
Six thin aluminum cylinders were prepared for testing by attaching strain gages.
All were successfully tested to failure using the test device however, data for thin
aluminum cylinders #2 and #3 were corrupted by the data acquisition system. Thin
aluminum #1 was machined to the proper test cylinder dimensions so its results are not
compared to thin aluminum #4-6 since they were tested as-received by the manufacturer.
1. Results
The machine force versus strain curves for the two functioning channels for run
#1 are shown in Figure 34. The other two hoop strain gages became disconnected due to
poor solder joints early in the test and their data was discarded. The negative hoop strains
below approximately 10 kN of machine force were attributed to poor alignment of the
strain gages with both being off the hoop axis by approximately 10 degrees. Above that
point, the curves are as expected for an aluminum cylinder and show a fairly linear elastic
region with a smooth transition to the plastic region as expected for aluminum. The larger
strain observed in channel one is due to its location nearer the failure point along with it
being centered on a wedge. Channel 1 was opposite the failure location, centered on a
gap, and recorded about half the strain as channel 2 throughout the test. This corresponds
with the finite element analysis that predicted a lower hoop strain at wedge interfaces
although the difference was larger than expected. Small variations in the cylinder wall
thickness as well as strain gage misalignment could be a contributing factor to the
difference recorded by both channels. The average hoop strain at failure was 0.00616 and
was higher than that predicted by the finite element model. The difference between the
observed failure strain and the predicted 0.005 failure hoop strain was attributed to an
insufficient number of channels recorded for averaging as well as the misalignment of the
strain gages that did record.

38
Thin Aluminum #1 Test Results.
Figure 35 shows the test cylinder failure location along with the strain gage
corresponding to hoop 1. While the failure was vertical as expected due to hoop stress
applied, it did not travel the entire length of the cylinder. Uneven insertion of the rams to a
small degree was attributed as the cause of the asymmetric failure line.
Failure of Thin Aluminum #1 Near Hoop Strain Channel 1.
Thin aluminum #4 was successfully tested to failure and the results are shown in
Figure 36. All measured channels showed good correlation with less spread than was
observed during the testing of thin aluminum #1. Hoop 2 was nearest the failure location,

39
centered on a wedge, and had the highest recorded strains throughout the test as predicted
by finite element analysis. Hoop 3 was centered on a gap and displayed the lowest hoop
strains throughout the test as predicted. Furthermore, all channels show a very linear
elastic response up to hoop strains of 0.002 with a smooth transition to the plastic region
as expected for aluminum. Additionally, the hoop and axial strain channels were both
averaged to determine a Poisson’s ratio equal to 0.33 for this test cylinder which matches
the expected value for 6061 T6 aluminum used for the cylinder.
Thin Aluminum #4 Test Results.
The failure of thin aluminum #4 was similar in appearance to that oberved with
thin aluminum #1 as shown in Figure 37. As before, the failure is vertical however it does
not travel the entire height of the cylinder. Additionally, some necking is visible at the
top of the cylinder centered on the failure location. Along with the crack being wider at
one end, these observations are indicative of some asymmetry in the motion of the upper
and lower rams causing more expansion on one end of the cylinder than the other.
Additionally, variation in wall thickness and material properties throughout the cylinder
could contribute to the asymmetric failure.

40
Failure Location of Thin Aluminum #4 Near Strain Channel 2.
Thin aluminum #5 was successfully tested to failure and the results are shown in
Figure 38. Strain channels 2 and 3 show a good correlation and correspond to locations
centered on wedges. Additionally, hoop 2 was closest to the failure location and shows
the highest strain throughout the majority of the test. Hoop channel 1 recorded lower
strains throughout the test however this was expected since it was centered on a gap.
While a transition from linear elastic response to nonlinear plastic response is still
apparent for channels 1 and 2 above hoop strains of 0.002, the transition is not as clear as
that observed for thin aluminum #4 in Figure 36. An average Poisson’s ratio of 0.43 was
calculated by averaging all strain channels. This is higher than the expected value of 0.33
and the difference is likely due to the lower strain recorded by channel 1. Removing hoop
1 from the calculation brings the experimentally found Poisson’s ratio to 0.36
corresponding to a 9% error from expected.

41
Thin Aluminum #5 Test Results.
Thin aluminum #5 and its failure location are shown in Figure 39. As with the
previous thin aluminum cylinders, the crack did not travel the entire length of the
cylinder. The shape of the crack indicates that it initiated at the top of the test cylinder
and traveled downwards from there. As was observed with the previous thin aluminum
tests, this indicates that there is a level of asymmetry in the movement of the rams
resulting in more expansion at one end of the cylinder than the other. Hoop 1 recorded
strains smaller by a factor of two throughout the test compared to the other strain
channels. While it was centered on a wedge gap, the difference is larger than predicted by
FEA. As with thin Aluminum #1, variation in wall thickness and material properties
likely contributed to the small measured hoop strain on channel 1.

42
Failure Location of Thin Aluminum #5 Near Strain Channel 2.
Thin aluminum #6 was successfully tested to failure and the results are shown in
Figure 40. The hoop strains for this test run showed more spread than was observed with
thin aluminum #4 and #5 although the results still correlate qualitatively with expected
values. Channel 1 was nearest the failure location as well as centered on a wedge and
recorded the highest hoop strain throughout the test. Channel 3 on the other hand, was
furthest from the failure location as well as centered on a gap and recorded the lowest
hoop strains. As with the previous thin aluminum tests, the highest recorded strain was
near the failure location and centered on a wedge while the lowest strains were further
from the crack location and centered on a gap between the interfaces of two wedges as
predicted by finite element analysis. Calculation of Poisson’s ratio by averaging the hoop
and axial strains returned 0.39, a 19% error from the expected value of 0.33.
43
Thin Aluminum #6 Test Results.
Thin aluminum #6 after testing is shown in Figure 41. In this case, the crack did
progogate the entire length of the cylinder. However it is clear that the crack initiated at
the top of the cylinder and progogated down towards the bottom. As with previous
cylinders, a small amount of necking was observed centered on the crack on the bottom
end of the cylinder oppposite from where the crack initiated. This was again determined
to be caused by a small non-uniformtiy in the motion of the rams resulting in more
internal pressure being applied on one end of the cylinder than the other.
Failure Location of Thin Aluminum #6 Near Strain Channel 1.

44
To compare the results from thin aluminum #4 through #6, which were all made
of 6061 T6 aluminum and tested cut to length in the as-received condition with no
machining, the results for all strain channels of each run were averaged and plotted in
Figure 42. The averaged results show excellent repeatability with a machine force at
failure of approximately 50 kN and a failure hoop strain of approximately 0.005.
Furthermore, the hoop strain response is linear up to 0.002 where a transition to nonlinear
plastic behavior is observed as expected with aluminum. The tabulated averaged values
for thin aluminum #4 through #6 at failure are shown in Table 5. Of particular interest is
the similarity of the machine force at failure, which varies by less than 5% between the
three runs. As a result, it was determined that the recorded data from thin aluminum #4
through #6 could be used to accurately determine the coefficient of friction between the
ram and wedges and is discussed in the following section.
Averaged Results from Thin Aluminum 4–6

45
Table 5. Tabulated and Averaged Results for Thin Aluminum 4 through 6 at
Failure.
Run Force Hoop Strain
Axial Strain Poisson
Units [KN] [m/m] [m/m]
Thin Al 4 49.75 0.0054954 -0.0018943 0.33
Thin Al 5 50.24 0.0046754 -0.0015527 0.36
Thin Al 6 51.94 0.004829 -0.001811 0.39
Average 50.64333 0.00499993 -0.0017527 0.36
2. Calculation of Friction Coefficient and Burst Pressure
Prior to using the test device for determining the properties of an unknown
material, the coefficient of friction between the ram and wedges must be determined.
Equations 1 and 2 were solved for the friction coefficient as shown in Equations 3 and 4
for thin and thick cylinder assumptions, respectively. Using the known Young’s Modulus
of the 6061 T6 aluminum along with the machine force at a measured hoop strain of
0.002 corresponding to the end of the elastic region, an experimental friction coefficient
was found for thick and thin cylinders.
tan
tan
F ELt
ELt F
(3)
2 2 2
2 2 2
2 tan ( )
( ) tan 2
a F RLE b a
RLE b a a F
(4)
The MATLAB script in Appendix A was used to solve for a thin and thick
cylinder friction coefficient using the experimental data as explained above. The values
determined by averaging the results from each strain gage on thin aluminum cylinders #4
through #6 are shown in Table 6. Since the thin aluminum cylinder meets the
requirements to use thin cylinder assumptions, the friction coefficients calculated using
both thin and thick cylinder equations are similar. The calculated friction coefficients
show variation by just under a factor of two between runs and this is likely due to
differences in lubrication between trials. The average coefficient of friction calculated
with thick cylinder equations of 0.12 will be used for all future calculations.

46
Table 6. Experimentally Determined Friction Coefficients Using Thin and
Thick Cylinder Assumptions.
Run 4 5 6 Average
mu thin cyl equations 0.09 0.17 0.13 0.13
mu thick cyl equations 0.08 0.15 0.12 0.12
As a further verification of both the finite element model and the experimentally
determined friction coefficient, the averaged results from thin aluminum cylinders 4
through 6 were plotted along with the ANSYS model results with friction set to 0.12 to
match the experimental value in Figure 43. The experimental and finite element results
for the 0.12 friction coefficient match well in the elastic region. Above that point, the
finite element model over-estimates the required force for a given hoop strain. This
difference was attributed to the constant linear strain hardening model used for the FEA
vice the non-linear response of experimental cylinders. This is supported by the good
correlation between the experimental and finite element results in the elastic region.
Averaged Results for Thin Aluminum 4–6 and Finite Element Model
for Friction Coefficient Equal to 0.12.

47
As a final comparison, the observed burst pressures for thin aluminum cylinders
#4 through #6 were compared to the burst pressure predicted by the finite element model
as well as an analytic model based on the internal pressure recorded at an external
cylinder hoop strain of 0.002 corresponding to the assumed yield point. The FEA models
were computed at intervals of target hoop strains resulting in a small failure range vice a
specific point. The finite element model predicted failure between hoop strains of 0.04
and 0.05 so the machine force at those strains was averaged in the calculations. Equation
5 [16] was used to determine the fully plastic (burst) pressure from the pressure at yield.
2
2 2
2lnP Y
b bP P
b a a
(5)
The experimental, analytic, and finite element model burst pressures are
summarized in Table 7. The analytic burst pressures underestimate the observed burst
pressures by an average of approximately 27%. Equation 6 used to calculate the analytic
burst pressure assumed a perfectly plastic material without strain hardening and this
accounts for the lower burst pressures found using the analytic method. The finite
element model overestimates the burst pressure by an average of approximately 24%.
The FEA used a linear-plastic model with constant strain hardening using the system
default value for aluminum alloys in ANSYS. Differences between this assumption and
the truly nonlinear response of the test cylinders account for the difference. Interestingly,
averaging the burst pressures from the analytic and finite element methods give a result
near the observed burst pressures in each test run.
Table 7. Experimental, Analytic and Finite Element Burst Pressures for
Thin Aluminum Cylinders.
Run 4 5 6 Average
Obs. Burst P [Pa] 1.81E+07 1.82E+07 1.88E+07 1.84E+07
Analytic Burst P [Pa] 1.17E+07 1.50E+07 1.35E+07 1.34E+07
Error -35.41% -17.65% -28.41% -27.15%
ANSYS Burst P [Pa] 2.27E+07
Error P [Pa] 25.89% 24.69% 20.61% 23.69%

48
B. THICK ALUMINUM CYLINDER
Thick aluminum #1 was tested to the limit of the test device without failing. The
machine force vs strain results are shown in Figure 44. While 4 uniaxial strain gages were
connected for this test, two of the solder joints broke during the test and their results were
discarded. The two functioning channels showed excellent correlation throughout the
duration of the test. A clear transition from linear elastic to non-linear behavior is
observable at 0.002 hoop strain as expected for aluminum. While these results support
validation of the test device, larger hoop strains with significant plastic deformation allow
for more non-uniformities as the device expands. Additionally, while the finite element
model predicted significant variation in hoop strain with location relative to a wedge, the
two functioning channels for thin aluminum 1 were both centered on a wedge so it was
not possible to validate that prediction for the thick cylinder. Due to the inability of the
test device to provide sufficient expansion for failure of the thick cylinder and the risk of
getting the test device stuck inside the test cylinder, thick aluminum #2 was not tested.
Thick Aluminum #1 Test Results.

49
C. GLASS FIBER COMPOSITE CYLINDER
Three GFC cylinders were fabricated and strain gages were attached in
preparation for experimental testing. All three were successfully tested to failure with
valid data logging. Results from the testing are discussed below.
1. Results
GFC #1 was successfully tested to failure and the results are shown in Figure 45.
The good correlation between the three hoop channels is attributed to good alignment of
the GFC strands during fabrication, good alignment of the strain gages in the hoop and
axial direction, and good alignment of strain gages to individual strands of the composite
material. Channel 1 was centered on a wedge recorded the highest strain throughout the
test as expected based on the finite element analysis performed for the aluminum
cylinders. Channel 3 was centered on a gap and recorded the lowest strain during the test
as expected. The force versus strain response was essentially linear all the way to failure
indicating a brittle material consistent with GFC. The recorded hoop strain at failure was
between 0.01 and 0.015 with a machine force of just under 60 kN. Averaging the three
hoop channels and single functioning axial channel allowed for calculating a Poisson’s
ratio of 0.19.

50
7Glass Fiber Composite #1 Test Results.
The failure location of GFC #1 is shown in Figure 46. The failure is primarily
axial and aligned with the axial strands of the GFC weave. While the actual rupture
location is relatively clean, there was significant delamination of the composite on either
side of the failure line with a minimum near the midlength of the cylinder and becoming
larger at the top and bottom of the cylinder.
Glass Fiber Composite #1 Failure Location.

51
GFC #2 was successfully tested to failure and the results are shown in Figure 47.
As with GFC #1, there is good correlation in the data from all four strain gages. Again,
the data shows an essentially linear response through failure which is expected for a
brittle material. Furthermore, the machine force at failure is well matched with that
observed during the test of GFC #1 at just over 60 kN. Failure strain was also consistent
at values near 0.015 for all channels.
Glass Fiber Composite #2 Test Results.
The failure location of GFC #2 is shown in Figure 48. Unlike GFC #1, the rupture
is not purely in the axial location and shows a discontinuity at the midlength of the
cylinder. Below the midlength, the failure is axial while above the midlength, the rupture
was tripped and began spreading in the hoop dirction with a gradual return to the axial
direction at the top of the cylinder. Based on the sharp angle of the discontinuity, there
was something internal to the cylinder causing the discontinuity. Visual inspection of the
failed cylinder fdid not show an obvious cause. However, it is likely that something
during the fabrication process was the proximate cause of the unexpected failure
appearance.

52
Glass Fiber Composite #2 Failure Location.
GFC #3 was successfully tested to failure and the results are shown in Figure 49.
The failure force of approximately 60 kN correlates well with the previous GFC cylinders
although there is more significant spread in the recorded hoop strains than previously
seen. While the results were still linear to failure, the variation between channels was not
expected for a brittle material. Furthermore, the two axial strain channels showed positive
strain throughout the test and axial channel 1 recorded a nonlinear response with
increasing then decreasing axial strains. The unexpected results were determined to be
the result of poor alignment of strain gages both on the hoop axis and to individual
composite strands. The channel 1 rosette was off axis by approximately 10 degrees as
well as being poorly aligned with an axial strand leading to the results observed on
channel 1. Channel 2 was poorly aligned with an axial strand and channel 3 was poorly
aligned with a hoop strand resulting in the unexpected positive axial strain in channel 2
and the lower-than-expected hoop strain in channel 3.

53
Glass Fiber Composite #3 Test Results.
The failure location of GFC #3 is shown in Figure 50 and appears very similar to
the failure location of GFC #1. The failure line is essentially axial with delamination
spreading in the circumferential direction as the rupture approaches either end of the
cylinder. Examination of high speed video showed that the failure initiates near the
cylinder midlength and spreads to either end as shown in the screenshot in Figure 51. The
rupture initation at midlength and spreading to either end is the likely cause of the wider
delaminated areas seen at the ends of GFC #1 and #3 compared to midlength.
Furthermore, the failure was observed to initiate internal to the cylinder as expected due
to to maximum hoop stress being present at the inner surface.

54
Glass Fiber Composite #3 Failure Location.
Screen Shot of High Speed Video Taken at 750 Frames per Second.

55
To check for repeatability among the results of all three GFC cylinders tested,
their average machine force and hoop strains were plotted in Figure 52. Even with the
abnormalities observed in GFC #3 due to strain gage alignment, when averaged, the
results for all GFC cylinders are consistent. Due to this repeatability, the results of GFC
#1 through #3 were used to determine the elastic modulus of the GFC cylinder as
described in the following section.
Averaged Results from GFC 1, 2, and 3
2. Elastic Modulus and Burst Pressure
To determine the elastic modulus from experimental data, Equation 2 was solved
for “E” as shown in Equation 6. The strain, machine force, and angle are known values
and the friction coefficient was 0.12 as determined by previous tests with thin aluminum
cylinders #4 through #6. Additionally, an equation for the internal pressure applied to the
test cylinder was derived using the free body diagrams in Figure 15 and Figure 16,
resulting in Equation 7.

56
2
2 2)
2 tan
( 1 tan
a FE
RLE b a
(6)
(3)
tan
1 tan
FP
RL
(7)
The MATLAB script in appendix A was created to perform the calculations in
Equations 7 and 8 quickly with the results summarized in Table 8. Burst pressure was
determined to be between 10.4 and 11.6 MPa with an average of 11.1 MPa. Since
Equation 8 does not utilize strain measurements, these calculations are not affected by the
poor strain gage alignment of GFC #2 and show good correlation. The calculated
Young’s modulus shows somewhat more variation with values ranging from 16 GPa to
20.2 GPa. This larger variation is due to the calculations using measured strain values
which were influenced on GFC #2 by poor strain gage alignment. Removing the Young’s
modulus determined from GFC #2 data reduced the variation by a factor of two.
Table 8. Glass Fiber Composite Calculated Young’s Modulus and Burst
Pressure.
Run 1 2 3 Average
Force [KN] 57.41 63.82 60.61 60.61
Obs. Burst P [Pa] 1.04E+07 1.16E+07 1.10E+07 1.10E+07
E Cylinder [Pa] 1.91E+10 1.64E+10 2.06E+10 1.87E+10
D. CARBON FIBER COMPOSITE
Four CFC cylinders were fabricated and prepared for testing by attaching strain
gages. Valid data was obtained during the testing of each CFC to failure and the results
are detailed below.
1. Cylinder Results
CFC #1 was successfully tested to failure and the results are shown in Figure 53.
One of the four uniaxial strain gages attached to the cylinder became detached during the

57
test and its measurements are not included. The hoop strain measured by the three
functioning channels varied significantly in both magnitude and slope. Contrary to
expectations for a brittle material such as CFC, the measured hoop strain was not
primarily linear. Furthermore, hoop channel 3 showed an initial negative hoop strain until
the applied machine force exceeded 25 kN. Examination of the cylinder and strain gages
following the test revealed that while all gages were aligned to a composite strand, they
were attached off the hoop axis by 5–10 degrees. Additionally, the axial composite
strands of the cylinder were tilted by as much as 10 degrees throughout the thickness of
the cylinder. These two effects combined were determined to be the cause of the
nonlinear strain response as well as the negative hoop strain recorded on channel 3.
Carbon Fiber Composite #1 Test Results.
The failure location for CFC #1 is shown in Figure 54 and is in the axial direction
as expected. The rupture line was very clean with no observable delamination or
spreading throughout the length of the cylinder. Obervation of the cylinder prior to
testing revealed an axial defect running the length of the cylinder from the final step of
the fabrication process. This failure line followed this defect since it provided a stress
concentration point to assist in initiating failure.
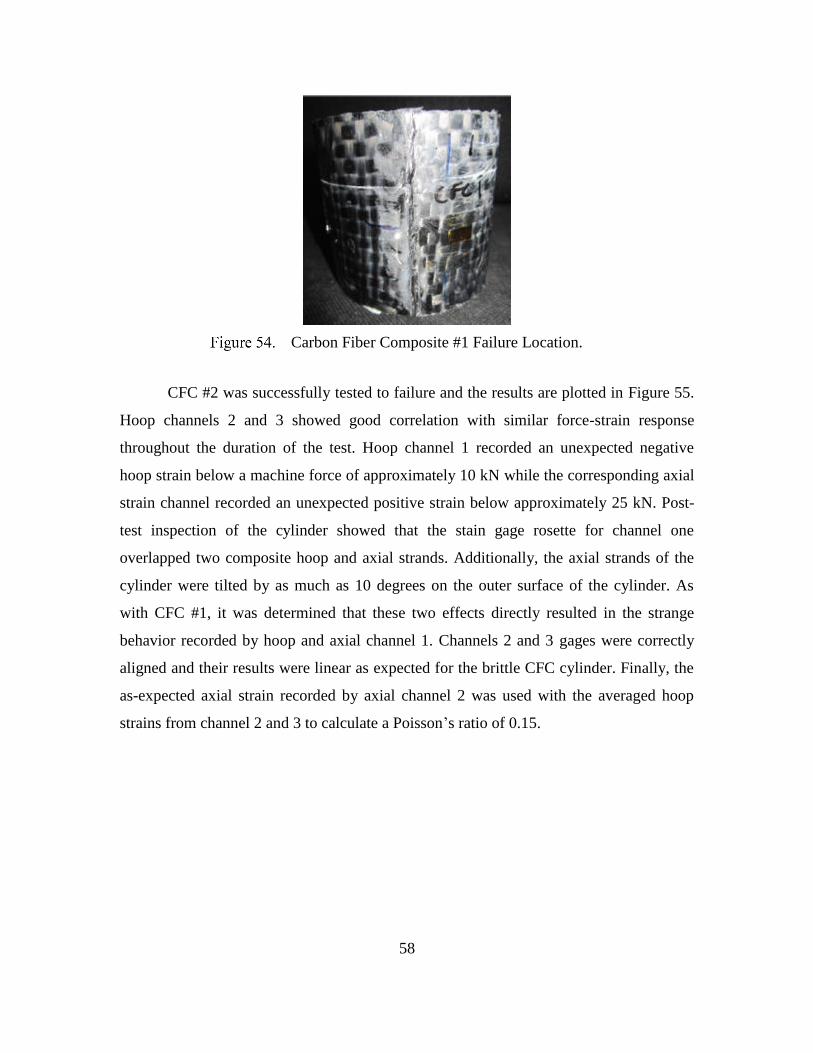
58
Carbon Fiber Composite #1 Failure Location.
CFC #2 was successfully tested to failure and the results are plotted in Figure 55.
Hoop channels 2 and 3 showed good correlation with similar force-strain response
throughout the duration of the test. Hoop channel 1 recorded an unexpected negative
hoop strain below a machine force of approximately 10 kN while the corresponding axial
strain channel recorded an unexpected positive strain below approximately 25 kN. Post-
test inspection of the cylinder showed that the stain gage rosette for channel one
overlapped two composite hoop and axial strands. Additionally, the axial strands of the
cylinder were tilted by as much as 10 degrees on the outer surface of the cylinder. As
with CFC #1, it was determined that these two effects directly resulted in the strange
behavior recorded by hoop and axial channel 1. Channels 2 and 3 gages were correctly
aligned and their results were linear as expected for the brittle CFC cylinder. Finally, the
as-expected axial strain recorded by axial channel 2 was used with the averaged hoop
strains from channel 2 and 3 to calculate a Poisson’s ratio of 0.15.

59
Carbon Fiber Composite #2 Test Results.
The failure location of CFC #2 is shown in Figure 56. The rupture line was in the
axial direction as expected and shows a less-clean failure than was observed with CFC
#1. Inspection of the test cylinder prior to testing revealed an axial defect in the outer
surface created during the fabrication process. The defect was less severe than that
observed in CFC #1. However, as the failure line again corresponded to the defect
location, it was determined to be a sufficient stress concentrator to initiate failure.
Carbon Fiber Composite #2 Failure Location.

60
CFC #3 was successfully tested to failure and the results are shown in Figure 57.
The measured response from all channels was well-correlated and linear as expected for
the brittle CFC cylinder. Post-test observation showed that unlike the previous CFC
cylinders, all channels were well-aligned in the hoop and axial directions as well as being
centered on composite strands. Furthermore, while axial composite strains showed some
tilting on the inner layers of the cylinder, they were well-aligned on the outer layer. The
correct alignment and improved fabrication made possible the better results seen with
CFC #3.
Hoop channel 1 measured a lower strain during the majority of the test run and
was centered on a gap. This result was predicted by finite element analysis and observed
in testing of the thin aluminum and GFC cylinders. Hoop channels 2 and 3 were both
centered on wedges so their overlapping results were also expected. The axial and hoop
strains were averaged to determine a Poisson’s ratio of 0.09.
Carbon Fiber Composite #3 Test Results.
The failure location of CFC #3 is shown in Figure 58 and is primarily in the axial
direction with some tilting. The tilting was observed to correspond with the off-axis
tilting of the CFC strands on the inner layer of the cylinder. Additionally, the failure was
not as clean and the previously tested CFC cylinders. Pre-test inspection of CFC #3

61
showed no axial defect as was observed on CFC #1 and #2. The lack of a major axial
defect along with the improved alignment of axial strands allowed for the higher 70 kN
machine force at failure compared to the 35 kN and 50 kN observed during testing of
CFC #1 and #2.
Carbon Fiber Composite #3 Failure Location.
CFC #4 was successfully tested to failure and the results are plotted in Figure 59.
Hoop channels 2 and 3 are well-matched while the hoop strain recorded by channel 1 is
approximately three times higher throughout the test. Variations in wall thickness by as
much as 0.5 mm along with fabrication defects such as voids and were determined to be
the cause of the large variation. All channels show a linear response as expected for a
brittle material. Conversely, both axial channels were non-linear with axial channel 1
showing a positive strain above 30 kN machine force. Also contrary to expectations, axial
channel 2 measured a positive hoop strain below approximately 30 kN machine force.
Inspection of CFC #4 following the test revealed the axial strands of the cylinder were
tilted by as much as 15 degrees throughout the wall thickness. This fabrication flaw was
determined to be the cause of the unexpected observed axial strains. Hoop channel 1
showed good alignment in the hoop direction and was properly aligned with a hoop

62
composite strand while hoop channels 2 and 3 had overlap with two separate hoop
strands. The CFC #4 failure hoop strain recorded by channel 1 checks with the failure
hoop strains observed for CFC #3. For this reason, the variation in hoop strains for CFC
#4 was determined to be caused by the overlap of composite strands in hoop channels 2
and 3.
Carbon Fiber Composite #4 Test Results.
The failure location of CFC #4 is shown in Figure 60. The failure line aligned
with the tilted axial strands. A small surface defect from the fabrication process
corresponds to the failure line at the bottom of the cylinder indicating the initation point
of rupture. Unlike CFC #1 and #2, the failure line does not follow the defect line through
the length of the cylinder.

63
Carbon Fiber Composite #4 Failure Location.
To check for repeatability and validate the results prior to performing calculations
to determine the elastic modulus of the CFC cylinders, the hoop strain results from each
CFC cylinder test were averaged and plotted in Figure 61. Even though the hoop strains
from CFC #1, #2, and #4 showed more variation that was recorded for CFC #3, the
averaged results are similar in slope. Although the machine force and hoop strain at
failure shows variation, the slope of the force-strain curve for each test run are similar.
The relationship between machine force and hoop strain is used in Equation 7 to
determine the Young’s modulus and the similarity in this relationship between all CFC
cylinder tests indicate they can be trusted for the calculation. The variation in failure
strength was determined to be caused primarily by surface defects from the
manufacturing process. CFC #1, #2, and #4 all had this defect to a degree and showed a
lower machine force at failure than CFC #3, which had no significant surface defects.
The variation in hoop strain at failure was again due to the presence of surface defects in
CFC #1, #2, and #4 as well as poor alignment of several strain gages as discussed in the
individual cylinder results above.

64
Carbon Fiber Composite 1–4 Averaged Results.
2. Tensile Specimen Results
To provide a reliable check of the elastic modulus to be determined from the
cylinder test device results, three CFC tensile specimens were tested to failure. Data from
the third specimen was corrupted and is not included in this analysis. The force versus
strain results from the tests are shown in Figure 62 and exhibit linear response through
failure as expected for brittle materials. The machine force at failure is well-matched
between the two runs although test 2 showed somewhat larger longitudinal and transverse
strains at failure. The variation in results was attributed to alignment of the strain gage
rosettes to the axial and transverse strands of the tensile specimens. Small overlaps of
both strands were observed to varying levels in all tensile specimens. Using averaged
results from the hoop and axial strain gages, the Poisson’s ratio was found to be 0.16.
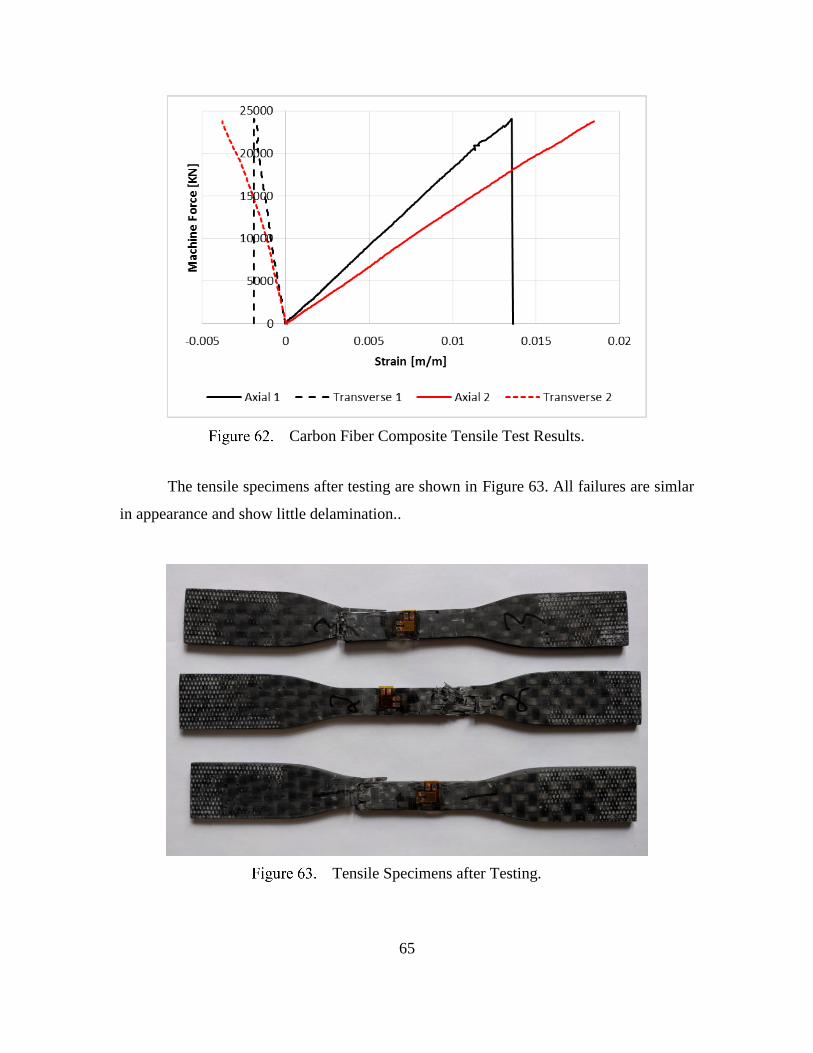
65
Carbon Fiber Composite Tensile Test Results.
The tensile specimens after testing are shown in Figure 63. All failures are simlar
in appearance and show little delamination..
Tensile Specimens after Testing.

66
3. Elastic Modulus and Burst Pressure
As with the GFC cylinders, the elastic modulus of the CFC cylinders was
determined using Equation 7 with the machine force and strain values measured during
testing of CFC #1 through CFC #4. The friction coefficient of 0.12 determined from the
thin aluminum cylinder tests was used as with the GFC calculations. The burst pressure
for each was similarly determined using Equation 8.
To determine the elastic modulus of the CFC tensile specimens, the area of the
gage section was used to determine the axial stress from the machine force recorded
during the tests. The stress-strain curves were then plotted in Figure 64 and a linear trend
line used to determine the elastic modulus. The variation between the two cylinders was
attributed to difference in the amount and alignment of longitudinal composite strands
relative to the gage section of the specimen.
Tensile Specimen Stress-Strain Curves.
The tabulated results from the CFC cylinder and tensile specimen are shown in
Table 9. The observed burst pressure shows significant variation between test runs and
E = 4E+10xR² = 0.9719
E = 3E+10xR² = 0.9992
0.E+00
1.E+08
2.E+08
3.E+08
4.E+08
5.E+08
6.E+08
0 0.005 0.01 0.015 0.02
Stre
ss [
Pa]
Strain [m/m]
Specimen 1 Specimen 2

67
was expected due to the variation in machine force at failure. The variation was
previously determined to be primarily due to axial surface defects created during the
fabrication process. The average elastic modulus derived from the cylinder testing was
51.1 GPa compared to an average of 35 GPa from the tensile specimens, a relative error
of 46%. Of the CFC cylinders tested, only CFC 3 had overlapping data from all hoop
strain channels as well as no significant surface defect. Comparing the elastic modulus of
CFC #3 to the average from the tensile tests results in a smaller relative error of 9.4%.
Table 9. Carbon Fiber Composite Calculated Young’s Modulus and Burst
Pressure.
Run 1 2 3 4 Average
Force [kN] 32.42 48.05 70.64 57.27 52.095
Obs. Burst P [Pa] 5.88E+06 8.40E+06 1.28E+07 1.04E+07 9.37E+06
E Cylinder [Pa] 2.69E+10 4.04E+10 3.67E+10 9.35E+10 4.94E+10
E Tensile [Pa] 4.00E+10 3.00E+10 No data 3.50E+10
E. SUMMARY OF RESULTS
After validation of the cylinder test device functionality the experimental testing
had two primary purposes. First, the machine force and hoop strains recorded during
several thin aluminum cylinders were used to calculate the friction coefficient of the test
device. With the coefficient of friction between the ram and wedges known, the measured
force and hoop strains for the remaining cylinder tests could be used to determine the
burst pressure and elastic modulus of the composite cylinder. Additionally, runs with
valid axial and hoop strain data were used to determine the Poisson’s ratio of the cylinder
material. To validate the CFC cylinder results, data from two CFC tensile specimens
were also used to provide a second means of determining the elastic modulus and
Poisson’s ratio of the CFC.
The combined experimental and analysis results for all runs with data used in
calculations and analysis are shown in Table 10. Adequate repeatability was an important
factor during the testing and an effort was made to collect data for a sufficient number of

68
tests to show sufficient repeatability. Since the experimentally determined friction
coefficient is used in all calculations for burst pressure and Young’s modulus, its accurate
determination was vital. Three thin aluminum trials 4 through 6 were used and while the
calculated friction coefficient varied from 0.08 to 0.15, the three data sets were
determined to be sufficient for averaging for a final value of 0.12. Additional tests of
cylinders with known properties would be useful for better determination of the
variability of the coefficient of friction between test runs.
Determination of the elastic modulus and burst pressure of a composite cylinder were
the primary motivations for this research. The GFC cylinders showed good repeatability with
moduli ranging from 16.04 to 20.18 GPa. The GFC cylinders did not present any significant
strand alignment issues or other fabrication defects so the variation was attributed to
alignment errors on individual strain gages as discussed previously.
Due to strain gage alignment issues with GFC #3 and failure of an axial channel
during GFC 1, there was only one valid axial strain data set available for computation of
the Poisson’s ratio of the GFC cylinders. The Poisson’s ratio was determined to be 0.19
using the averaged hoop strains and single axial strain recorded for GFC. Additional GFC
cylinder tests and GFC tensile tests would be useful for validating this result.
The experimental burst pressure for the three GFC cylinders showed good
correlation as expected based on the similar machine force at failure. Burst pressures
ranged from 10.42 to 11.58 MPa with an average of 11 MPa. The burst pressure
calculations show less variation than seen with the GFC elastic moduli since they use
only the machine force at rupture and errors introduced due to strain gage alignment do
not affect the result.
The Young’s moduli determined from the CFC cylinder tests in Table 9 showed
significantly more variation than was observed with the GFC cylinders with values
ranging from 28.08 to 97.58 GPa. This variation resulted in a higher test device-
determined modulus of elasticity of 51.08 GPa compared to the average 35 GPa
calculated from the CFC tensile tests, an error of nearly 46%. Inspection of the CFC
cylinders revealed strain gage alignment issues and axial surface defects of CFC #1, #2,

69
and #4 as well as varying levels of axial composite strand tilting on all CFC cylinders.
These effects directly resulted in the large variation in results for the four CFC cylinders.
CFC #3 had no significant surface defect and better strain gauge alignment. The elastic
modulus of CFC #3 of 38.26 GPa compares more favorably to the average 35 GPa
calculated from the tensile tests with a relative error of 9.3%.
The Poisson’s ratio of the CFC was determined using data from CFC #2, CFC #3,
and the two CFC tensile specimens. As with the Young’s Modulus, the CFC cylinder
Poisson’s ratio showed a relatively large variation ranging from 0.089 to 0.15 while the
tensile specimens were more consistent ranging from 0.158 to 0.166. As before, the large
variation in the CFC cylinder results was likely due to axial strand errors during
fabrication as well as strain gage alignment problems.
The experimental burst pressure for all four CFC cylinders showed significant
variation, ranging from 5.88 to 12.82 MPa. This is primarily due to the presence of axial
surface defects on CFC #1, #2, and #4 acting as stress concentrators and initiating early
rupture. CFC #3 had no significant axial surface defect and presented the highest rupture
pressure supporting this argument.

70
Table 10. Experimental and Analysis Result Summary.
mu E Poisson Experimental
Burst Pressure Finite Element Burst Pressure
Analytic Burst Pressure
Run [GPa] [MPa] [MPa] [MPa]
Thin Al 4 0.08 0.33 18.06 11.66
22.7 Thin Al 5 0.15 0.36 18.23 15.01
Thin Al 6 0.12 0.39 18.84 13.49
Thin Al avg 0.12 0.36 18.38 13.39
GFC 1 19.12 0.19 10.42
GFC 2 16.35 11.58
GFC 3 20.58 10.99
GFC avg 18.68 11.00
CFC 1 26.91 5.88
CFC 2 40.36 0.15 8.4
CFC 3 36.68 0.089 12.82
CFC 4 93.53 10.39
CFC avg 49.37 0.12 9.37
CFC T1 40 0.166
CFC T2 30 0.158
CFC T avg 35 0.162
The experimental results from this research showed that the proper alignment of
strain gages are critical to achieving accurate and reliable results during a test. The strain
gages must be correctly aligned in the hoop and axial direction as well as centered on a
single composite strand for accurate and repeatable results. Furthermore, fabrication
defects resulting in twisting of axial composite strands as was seen in the CFC cylinders
results in a “virtual” misalignment of the axial strain gages and preventing the collection
of valid data.

71
V. CONCLUSIONS, RECOMMENDATIONS AND FUTURE
WORK
A. CONCLUSIONS AND RECOMMENDATIONS
During this research, a purely mechanical device capable of applying an internal
pressure to an open-ended cylinder was designed, fabricated, and tested. FEA was
performed prior to fabrication to validate the design and was later used for comparison to
analytic and experimental results. Following validation, a test procedure was created to
allow determination of the cylinder’s burst pressure, elastic modulus, and Poisson’s ratio.
Several thin aluminum cylinders were tested first to determine the friction
coefficient of the device and to provide a comparison to FEA and analytical models with
good results. GFC and CFC cylinders were then tested to determine their unknown
properties. Finally, CFC tensile specimens were tested to failure to allow for comparison
of the elastic modulus and Poisson’s ratio determined from the test cylinders.
During the testing, it was discovered that the composite cylinder results were
highly dependent on the alignment of the composite strands to the axial and hoop
directions of the cylinder. Ensuring the strain gages were aligned to a single axial and
hoop strand was also of great importance for valid results. Any deviation from ideal
alignment inserted large errors resulting in either unexpected positive axial strains or non-
linear responses. To minimize errors in future testing, greater care should be taken during
the fabrication and preparation steps to ensure that the strands making up the cylinder are
properly aligned both geometrically. Prior to strain gage attachment, the cylinders should
be marked in the hoop and axial directions to ensure proper alignment.
This work is a vital step in fabrication CFC cylinders for dynamic testing by
LLNL that have comparable properties to the steel cases to be used in the finished ADP.
The test device provides a means of quickly testing cylinders at low-cost providing
economical experimentation prior to the more costly instrumented dynamic testing
performed by the EMC at LLNL.

72
B. FUTURE WORK
During this research, valid data for calculations was collected from three thin
aluminum cylinders, three GFC cylinders, four CFC cylinders, and two CFC tensile
specimens. The aluminum and GFC cylinders as well as the CFC tensile specimens
showed good correlation. Due to fabrication defects and strain gage alignment problems,
the four CFC cylinders showed significant variation in test results. While the current data
set is sufficient for a proof of concept, additional testing of CFC cylinders with the same
test parameters would be useful. Additionally, future tests could be run with CFC
cylinders fabricated with carbon nanotubes mixed in with the epoxy to determine the
effect of alterations to the epoxy formulation.
All tests during this research were performed at a quasi-static extension rate of 2
mm/min. Conducting tests at higher extension rates would be useful for comparison with
these results. Since determining the properties of the CFC cylinders used by LLNL
during explosive testing is desired, differences between the static and dynamic results are
important and tests at higher extension rates would help to better estimate the dynamic
properties of the CFC cylinders.
All composite cylinders tested were fabricated by hand using a continuous wrap
of a composite weave. This method was selected because the same material could be
easily used to fabricate composite tensile specimens for comparison to the test device-
determined material properties and allow for easy variation in the fabrication process.
Unfortunately, manual fabrication inserts a degree of variation in each cylinder and was
this especially noticeable with the testing of the CFC cylinders. The actual test cylinders
used by LLNL for energetic testing are created using a continuous filament-wound
process that creates a more uniform cylinder. Due to process limitations, 7.62 cm (3 in)
inside-diameter continuous fiber-wound cylinders for use with the current test device
were not available. Efforts are currently in progress to fabricate a test device capable of
testing the smaller 5.08 cm (2 in) CFC cylinders used by LLNL for testing.

73
APPENDIX A. MATLAB SCRIPT
%% Compare thin-walled cylinder to computer model
clear all close all clc
E_AL=71e9; L=3*2.54/100; t=0.125*2.54/100; R = 1.5*2.54/100; a = R; % inner radius b = R+t; % outer radius mu=0.01; theta=80/90*pi/2;
target_strain = [0.001 0.002 0.003 0.004 0.005];
F = [8871.1 17765 26621 35436 39504];
% Thin Cylinder predicted strain at modeled force for target strain strain_thin = F/(E_AL*L*t*pi)*(tan(theta)-mu)/(1+mu*tan(theta))
% Thick Cylinder predicted strain at modeled force for target strain den = b^2-a^2; strain_thick = 2*a^2/E_AL/den*F/pi/b/L*(tan(theta)-
mu)/(1+mu*tan(theta))
%% Determine friction factor based on thin Al experiment data and
determine internal pressure at yield e_el = 0.002;
% Data from mechanical testing at hoop strain = 0.002 for runs 4-6 F4 = [29.9313 23.11358 36.23686]*1000; F5 =[49.6358 29.53219 35.51614] *1000; F6 =[17.97607 35.61633 49.47684] *1000;
% Friction coefficient with thin cylinder assumptions mu_thin = [mean((F4.*tan(theta) - e_el*pi*E_AL*L*t)
./(e_el*pi*E_AL*L*t*tan(theta) + F4))... mean((F5.*tan(theta) - e_el*pi*E_AL*L*t)
./(e_el*pi*E_AL*L*t*tan(theta) + F5))... mean((F6.*tan(theta) - e_el*pi*E_AL*L*t)
./(e_el*pi*E_AL*L*t*tan(theta) + F6))]
mu = mean(mu_thin) %Friction factor averaged across three runs and 9
hoop strain gages
% Friction coefficient with thick cylinder equations

74
mu_thick_comb = [mean((2*a^2*F4*tan(theta)-
pi*R*L*E_AL*den*e_el)./(pi*R*L*E_AL*den*e_el*tan(theta) + 2*a^2*F4))... mean((2*a^2*F5*tan(theta)-
pi*R*L*E_AL*den*e_el)./(pi*R*L*E_AL*den*e_el*tan(theta) + 2*a^2*F5))... mean((2*a^2*F6*tan(theta)-
pi*R*L*E_AL*den*e_el)./(pi*R*L*E_AL*den*e_el*tan(theta) + 2*a^2*F6))]
mu_thick = mean(mu_thick_comb) % Friction factor averaged across three
runs and 9 hoop strain gages
% Calculate Pi at 0.002 hoop strain Py_AL = [mean(F4./pi/R/L.*((tan(theta)-
mu_thick)/(1+mu_thick*tan(theta))))... mean(F5./pi/R/L.*((tan(theta)-
mu_thick)/(1+mu_thick*tan(theta))))... mean(F6./pi/R/L.*((tan(theta)-mu_thick)/(1+mu_thick*tan(theta))))]
Py_Al_avg = mean(Py_AL)
%% Determine E and burst pressure for GFC cylinders
% Input data aGFC = 3*2.54/100 % Inner radius [m] bGFC = aGFC + 3.3/1000 % Outer radious [m] den = bGFC^2-aGFC^2;
F_GFC1 = 57405.82; e_GFC1 = [0.014473 0.013227 0.010604]; F_GFC2 = 63820; e_GFC2 = [0.014178 0.013364 0.01678 0.024894]; F_GFC3 = 60606.44; e_GFC3 = [.016215 .02232 .007293];
% Calculate Young's Modulus based on above data and assumed mu E_GFC_thin = [mean(F_GFC1./(pi.*e_GFC1*L*t) .* (tan(theta)-
mu)/(1+mu*tan(theta)))... mean(F_GFC2./(pi.*e_GFC2*L*t) .* (tan(theta)-
mu)/(1+mu*tan(theta)))... mean(F_GFC3./(pi.*e_GFC3*L*t) .* (tan(theta)-
mu)/(1+mu*tan(theta)))]
E_GFC_thick = [mean(2*aGFC^2*F_GFC1./(pi*bGFC*L.*e_GFC1*den) .*
(tan(theta)-mu_thick)/(1+mu_thick*tan(theta)))... mean(2*aGFC^2*F_GFC2./(pi*bGFC*L.*e_GFC2*den) .* (tan(theta)-
mu_thick)/(1+mu_thick*tan(theta)))... mean(2*aGFC^2*F_GFC3./(pi*bGFC*L.*e_GFC3*den) .* (tan(theta)-
mu_thick)/(1+mu_thick*tan(theta)))]
% E for the two best GFC cylinders based on 7 hoop strain gages E_GFC_thin_avg = mean(E_GFC_thin) E_GFC_thick_avg = mean(E_GFC_thick)
% Experimental Burst Pressure

75
P_GFC = [mean(F_GFC1./pi/aGFC/L.*((tan(theta)-
mu_thick)/(1+mu_thick*tan(theta))))... mean(F_GFC2./pi/aGFC/L.*((tan(theta)-
mu_thick)/(1+mu_thick*tan(theta))))... mean(F_GFC3./pi/aGFC/L.*((tan(theta)-
mu_thick)/(1+mu_thick*tan(theta))))] P_GFC_avg = mean(P_GFC)
%% Determine E and burst pressure for CFC cylinders
% Input Data aCFC = 3*2.54/100 % Inner radius [m] bCFC = aCFC + 2.7/1000 % Outer radious [m] den = bCFC^2-aCFC^2;; % Geometry-based constant F_CFC1 = 32424.66; e_CFC1 = [0.00501 0.0069175]; F_CFC2 = 48048.9; e_CFC2 = [0.0070467 0.0053568 0.005159]; F_CFC3 = 70637.48; e_CFC3 = [0.0081403 0.0097439 0.010259]; F_CFC4 = 57266.58; e_CFC4 = [.010464 .001734 .00291];
% Calculate Young's Modulus based on above data and assumed mu E_CFC_thin = [mean(F_CFC1./(pi.*e_CFC1*L*t) .* (tan(theta)-
mu)/(1+mu*tan(theta)))... mean(F_CFC2./(pi.*e_CFC2*L*t) .* (tan(theta)-
mu)/(1+mu*tan(theta)))... mean(F_CFC3./(pi.*e_CFC3*L*t) .* (tan(theta)-
mu)/(1+mu*tan(theta)))... mean(F_CFC4./(pi.*e_CFC4*L*t) .* (tan(theta)-
mu)/(1+mu*tan(theta)))]
E_CFC_thick = [mean(2*aGFC^2*F_CFC1./(pi*bGFC*L.*e_CFC1*den) .*
(tan(theta)-mu_thick)/(1+mu_thick*tan(theta))) ... mean(2*aGFC^2*F_CFC2./(pi*bGFC*L.*e_CFC2*den) .* (tan(theta)-
mu_thick)/(1+mu_thick*tan(theta)))... mean(2*aGFC^2*F_CFC3./(pi*bGFC*L.*e_CFC3*den) .* (tan(theta)-
mu_thick)/(1+mu_thick*tan(theta)))... mean(2*aGFC^2*F_CFC4./(pi*bGFC*L.*e_CFC4*den) .* (tan(theta)-
mu_thick)/(1+mu_thick*tan(theta)))]
% E for the two best CFC cylinders based on 6 hoop strain gages E_CFC_thin_avg = mean(E_CFC_thin); E_CFC_thick_avg = mean(E_CFC_thick);
% Eperimental Burst Pressure P_CFC = [mean(F_CFC1./pi/aCFC/L.*((tan(theta)-
mu_thick)/(1+mu_thick*tan(theta))))... mean(F_CFC2./pi/aCFC/L.*((tan(theta)-
mu_thick)/(1+mu_thick*tan(theta))))... mean(F_CFC3./pi/aCFC/L.*((tan(theta)-
mu_thick)/(1+mu_thick*tan(theta))))...

76
mean(F_CFC4./pi/aCFC/L.*((tan(theta)-
mu_thick)/(1+mu_thick*tan(theta))))]
P_CFC_avg = mean(P_CFC);
%% Experimental and expected Burst Pressure for thin Aluminum cylinders
4-6 % Input Data Fex_Al_burst = [49.75729 50.23574 51.93548]*1000;
% Experimental Burst pressure based on machine force and calculated mu Pbex_AL_burst = Fex_Al_burst./pi/R/L.*((tan(theta)-
mu_thick)/(1+mu_thick*tan(theta)))
% Expected Burst Pressure from Borewsi et al Pp_al = Py_AL.*2.*b^2./(b^2-a^2).*log(b/a) Pp_al_avg = mean(Pp_al)
% Expected machine force at failure Fp_al = Pp_al*pi*R*L*(1+mu_thick*tan(theta))/(tan(theta)-mu_thick)
% ANSY predicted burst pressure Pbex_ANSYS = 62639/pi/R/L*((tan(theta)-
mu_thick)/(1+mu_thick*tan(theta)))

77
APPENDIX B. SUPPLEMENTARY ANSYS SETTINGS AND
RESULTS
Table 11. Baseline Results for Thin Aluminum Cylinder.
Table 12. Baseline Results for Thick Aluminum Cylinder.
Target Strain 0 0.001 0.002 0.003 0.004 0.005 0.007
Wedge Stress 0 64.484 115.95 167.83 220.55 243.79 280.28
Wedge Strain 0 0.000329 0.000592 0.0008586 0.0011297 0.00122 0.001412
Wedge FOS 0 >15 10.406 7.1 5.47 4.9 4.3
Ram Stress 0 28.181 58.239 86.077 110.05 147.81 213.04
Ram Strain 0 0.000181 0.000311 0.0004602 0.0005933 0.00083 0.001174
Ram FOS 0 >15 >15 14 10.87 8.1 5.6
Cyl eq. Stress 0 64.141 127.85 191.57 255.5 276.11 277.09
Cyl Hoop Stress 0 64.03 127.63 191.24 254.99 279.88 281.46
Cyl eq. Strain 0 0.000931 0.001856 0.0027805 0.0037083 0.00472 0.006758
Cyl Hoop Strain 0 0.000931 0.001855 0.0027788 0.0037057 0.00402 0.00404
Cyl Axial Strain 0 -0.000307 -0.000613 -0.000918 -0.001225 -0.00121 -0.001744
Cylinder FOS 0 3.4 1.7 1.16 0.99 0.99 0.99
Target Strain 0 0.001 0.002 0.003 0.004 0.005 0.007
Wedge Stress 0 96.773 180.49 266.34 354.57 378.15 448.41
Wedge Strain 0 0.00049509 0.000925 0.001367 0.001821 0.001892 0.002264
Wedge FOS 0 12.47 6.6 4.5 3.4 3.2 2.7
Ram Stress 0 74.785 144.63 209.25 268.98 376.28 430.83
Ram Strain 0 0.0003759 0.000727 0.001052 0.001352 0.001882 0.002288
Ram FOS 0 >15 8.3 5.7 4.4 3.2 2.8
Cyl eq. Stress 0 44.563 89.053 133.56 178.09 226.56 276.33
Cyl Hoop Stress 0 44.545 89.016 133.5 178.01 226.48 279.57
Cyl eq. Strain 0 0.00064679 0.001293 0.001938 0.002585 0.003288 0.005213
Cyl Hoop Strain 0 0.00064669 0.001292 0.001938 0.002584 0.003288 0.004023
Cyl Axial Strain 0 -0.00022873 -0.00046 -0.00068 -0.00091 -0.00111 -0.0016
Cylinder FOS 0 3.9 1.9 1.3 0.97 0.99 0.99

78
Table 13. Thin Cylinder Results with Friction Coefficient of 0.05.
Target Strain 0.001 0.002 0.003 0.004 0.005
Wedge Stress 64.887 116.31 168.18 220.74 244.46
Wedge Strain 0.0003309 0.000594 0.00086 0.00113 0.0012237
Ram Stress 28.592 59.273 87.677 113.21 146.54
Ram Strain 0.00018108 0.000315 0.000467 0.000603 0.0008339
Cyl eq. Stress 64.135 127.82 191.54 255.45 276.12
Cyl Hoop Stress 64.022 127.59 191.2 255.05 283.2
Cyl eq. Strain 0.00093086 0.001852 0.00278 0.003708 0.004766
Cyl Hoop Strain 0.00093028 0.001854 0.002778 0.003706 0.0040384
Al Strain 2.07793E-
05 4.16E-05 6.23E-05 8.32E-05
9.2938E-05
Machine Force 10.946 21.888 32.817 43.841 48.957
Table 14. Thin Cylinder Results with Friction Coefficient of 0.01.
Target Strain 0.001 0.002 0.003 0.004 0.005
Wedge Stress 65.507 117.14 169.25 222.33 246.39
Wedge Strain 0.00033378 0.00059777 0.0008647 0.001137 0.0012336
Ram Stress 29.672 61.428 90.891 117.11 144.59
Ram Strain 0.00018176 0.00032521 0.00048253 0.000622 0.00083312
Cyl eq. Stress 64.112 127.78 191.49 255.89 276.16
Cyl Hoop Stress 63.993 127.54 191.13 255.43 287.01
Cyl eq. Strain 0.00093052 0.0018546 0.0027792 0.003714 0.0048718
Cyl Hoop Strain 0.0009267 0.0018534 0.0027774 0.003712 0.0040529
Al Strain 2.59694E-
05 5.17832E-
05 7.7616E-05 0.000103 0.00011674
Machine Force 13.68 27.278 40.886 54.368 61.497

79
Table 15. Thin Cylinder Results with Friction Coefficient of 0.12.
Target Strain 0.001 0.002 0.003 0.004 0.005 0.01
inner max shear
41.533 82.6 123.72 150.37 152.83 154.97
Cyl eq. Stress 64.117 127.74 191.46 255.94 276.16 278.68
Cyl Hoop Stress
63.997 127.5 191.1 255.5 288.59 293.83
Cyl eq. Strain 0.00093061 0.001854 0.002779 0.003715 0.004875 0.009874
Cyl Hoop Strain
0.00092999 0.001853 0.002777 0.003713 0.004058 0.004102
Al Strain 2.81582E-
05 5.59E-05 8.39E-05 0.000112 0.000125 0.000129
Machine Force 14.833 29.469 44.213 59.185 66.093 67.967
ANSYS Mesh Controls.

80
ANSYS Nonlinear Controls.
ANSYS Step Controls.

81
LIST OF REFERENCES
[1] Defense Threat Reduction Agency & USSSTRATCOM Center for Combating
WMD & Standing Joint Force Headquarters-Elimination. (n.d.). Who we are.
[Online]. Available: http://www.dtra.mil/About/WhoWeAre.aspx. Accessed Nov.
5, 2015.
[2] Agent Defeat Weapon—NAVY/DTRA. (n.d) GlobalSecurity.org. [Online].
Available: http://www.globalsecurity.org/military/systems/munitions/adw.htm.
Accessed Nov. 5, 2015
[3] J. Molitoris, Image courtesy of LLNL EMC, Livermore, CA: Lawrence Livermore
National Laboratory, 2015.
[4] A. Onder, O. Sayman, T. Dogan, and N. Tarakcioglu, “Burst failure load of
composite pressure vessels,” Composite Structures, vol. 89, no. 1, pp. 159–166,
Jun. 2009.
[5] M. Xia, H. Takayanagi, and K. Kemmochi, “Analysis of multi-layered filament-
wound composite pipes under internal pressure,” Composite Structures, vol. 53,
no. 4, pp. 483–491, Sep. 2001.
[6] J. Xing, P. Geng, and T. Yang, “Stress and deformation of multiple winding angle
hybrid filament-wound thick cylinder under axial loading and internal and
external pressure,” Composite Structures, vol. 131, no. 4, pp. 866–877, Nov.
2015.
[7] T. Hwang, J. Park, and H. Kim, “Evaluation of fiber material properties in
filament-wound composite pressure vessels,” Composites: Part A, vol. 43, no. 9,
pp. 1467–1475, Apr. 2012.
[8] A. Horide, S. Wakayama, and M. Kawahara, “Characterization of fracture process
during ring burst test of FW-FRP composites with damage,” Advanced Composite
Materials, vol. 8, no. 2, pp. 139–151, Jun. 1999.
[9] E. Brovold and W. Buttlar, “Compact hollow cylinder tensile tester,” U.S. Patent
20,010,037,687 A1, Nov. 8, 201.
[10] P. Rigaud, “Test machine to apply a uniform internal pressure to a tube,” U.S.
Patent 8,353,217 B2, Jan. 15, 2013.
[11] E. Fleischlauer, “Pressure fluid ram,” U.S. Patent 3044289 A, Jul. 17, 1962.

82
[12] Alclad Aluminum 6061-T6, T651. (n.d.). MatWeb Material Property Data.
[Online]. Available:
http://www.matweb.com/search/DataSheet.aspx?MatGUID=3a2e111b27ef4e5d81
3bad6044b3f318. Accessed Apr. 18, 2015.
[13] AK Steel 17–4 PH Precipiation Hardening Stainless Steel, Condition A. (n.d.).
MatWeb Material Property Data. [Online]. Available:
http://www.matweb.com/search/DataSheet.aspx?MatGUID=20362bbf0a7f45b8ae
59b19a9425239e. Accessed Apr. 18, 2015.
[14] Standard Test Method for Tensile Properties of Polymer Matrix Composite
Materials, ASTM Standard D 3039/D 3039M, 2008.
[15] Standard Test Method for Tensile Properties of Platics, ASTM Standard D638,
2010.
[16] A. Boresi, R. Schmidt, and O. Sidebottom, Advanced Mechanics of Materials, 5
ed. New York: Wiley, 1993, p. 459.

83
INITIAL DISTRIBUTION LIST
1. Defense Technical Information Center
Ft. Belvoir, Virginia
2. Dudley Knox Library
Naval Postgraduate School
Monterey, California
Copyright © 2022 FDOKUMEN