Abstraction Techniques for Parameterized Verification - dtic.mil
Upload
khangminh22Category
view
3download
0
7 0-R:194 111 LINEAR THYRATRON(U) SPECTRA TECHNOLOGY INC BELLEVUE MA 1/3 \CUSHNER ET AL. 31 JUL 67 RFUiRL-TR-87-2090
F33615-64-C-2474UNCLASSIFIED F/0 9/1 ML
eEEEHlellelWe
E.EEEEEEEEEEEEEEEimmEmmEEEEEEE-E.EE|EEEEEEEEBIEEEEEEEEEE

95 I V. 9
3.6III-
-11125L4
",Oy R -- l TEST CHART%0 0AA. OUWE A OF SrAN(0AW0g-9, -
p lv -V , -1. %.V~' 'w %
~\ 0 * U~ ~%

.- FILE CP a
AFWAL-TR-87-2080
LINEAR THYRATRON
'a" Mark J. Kushner/M. von Dadelszen
' Principle Investigators DTICAPR 2 6 1988
SPECTRA TECHNOLOGY, INC. S2755 Northup Way L::
Bellevue. Washington 98004
31 July 1987
Final Report for Period 1984 to 1987
Approved for public release; distibution unlimited
AERO PROPULSION LABORATORYAir Force Wright Aeronautical LaboratoriesAir Force Systems CommandWright-Patterson Air Force Base. Ohio 45433-6563
88 4 2 024 5
S ~ ' ~ * ~ ,*P** ~ . *'-'-.*. =% P,.

SK 1 V
NOTICE
When Government drawings, specifications, or other data are used for any
purpose other than in connection with a definitely related Government procurementoperation, the United States Government thereby incurs no responsibility nor anyobligation whatsoever; and the fact that the Government may have formulated,furnished, or in any way supplied the said drawings, specifications, or otherdata, is not to be regarded by implication or otherwise as in any manner licensing
the holder or any other person or corporation, or conveying any rights orpermission to manufacture, use, or sell any patented invention that may in anyway be related thereto.
This report has been reviewed by the Information Office and is releasable to
the National Technical Information Service (NTIS). At NTIS, it will be available
to the general public, including foreign nations.
This technical report has been reviewed and is approved for publication.
f-pTER BLETZINGER V AUL R. BERTHEAUD, Chief-Power Components Branch Power Components BranchAerospace Power Division Aerospace Power DivisionAero Propulsion Laboratory Aero Propulsion Laboratory
FOR THE COMMANDER
WILLIAM A. SEWARD, Lt Col, USAF.
Deputy DirectorAerospace Power DivisionAero Propulsion Laboratory
"If your address has changed, if you wish to be removed from our mailing list,
or if the addressee is no longer employed by your organization please notifyAFWAL/POOC, WPAFF, OH 45433-6563 to help us maintain a current mailing list."
Copies of this report should not be returned unless return is required by security
considerations, contractual obligations, or notice on a specific document.
F. 'T ',.' " "w - ' -;."€ -';' x >

'%X~rr- 7 T 7%-J 791 X YK-A 6K61
UNCLASSIFIEDSICUAITY CLASSIF ICATION OF THIS PAGE
REPORT DOCUMENTATION PAGEIs REPORT BLCURITY CLASSIFICAl ION 11b. RESTRICTIVE MARKINGS
UNCLASS IFIED N/A2. S CURIPTY CLASSIFICATION AUTHORITY 3. DISTRIBUTION/AVAILABILITY OF REPORT
N/A Approved for puzblic release; Distribution2b DECLASSIF ICATION/DOWNGRADING SCHEDULE umlwumted
N/A _ _ _ _ _ _ _ _ _ _ _ _ _ _ _ _ _ _ _ _ _ _
A PIRF9ORMING ORGANIZATION REPORT NUMBER(S) S. MONITORING ORGANIZATION REPORT NUMBER(S)
__________________________________AFWAL-'I'-87-2080
6. NAME OF PERFORMING ORGANIZATION b. OFFICE SYMBOL 7~NAME OF MONITORING ORGANIZATION1i1'applica 61.) Aero Propusionui aboratory (AFlN4tP0OC)
Spprt___TechnologyAM' Wright. Aeronautical labs.Sc. ADDRESS (City. State and ZIP Code) 7 b. ADDRESS (City. State and ZIP Code)
2755 Northup WayBellevue WA 98004 rgtPtesnM CH43-63
11a NAME OF FUNDING/SPONSORING Sti OFFICE SYMBOL 9. PROCURE9MENT INSTRUMENT IDENTIFICATION NUMBERORGANIZATION Of( apicable i
AruAl 1POOC-3 F33615-84-C-2474B& ADDRESS /City. State end ZIP Code) 10. SOURCE OF FUNDING NOS
Wright-Patterson AEB Cli 45433-6563 ELEMENT NO, NO. NO.N
COA1 CODES (icld ScurECT TEMSlanahee rif fnscpaOdadntion lchnmbr
Liea Thyratro, High 1 Power Dichrg 0ode
19 ABSTRA CTDE 19n SUBJEC TERM (Continu on neeeaaer andc r andtt idnyf btyc bloc nuber
A linear cxnf iguration thyratron was UIvestigated experimntally and theoretically.Advantages of this omrfiguraticxl are lower inductance and] the capability of increasingcurrent capability by increasing the length of the device without increasing currentdensity or inductance. 7Ite experimental deviice used a lO-cm-long dispenser type cathodea baf fled grid and] an auxiliary grid. Several modifications mere mae& improving vacuumnquality, voltage-standoff or switching speed. Thle discharge volue coud be analyzedusing several viewing ports. Using the auxiliary grid, the discharge ignited uniformlyav~er the Wil eghof the dvcpricving the linear concept. The distribuition of
eletrn dnstywasmesurd im reoledusing Ho&k peto y. The data were ingood agreement with a nwverical code using a spatial grid and tine resolved solutionsof the Poisson equation. The elctras wee represented with normalized spatialdensities ("acro-electrons") and their umtiom calculated using Monte Carlotechniques and the appropriate elastic and inelastic collision~ cross sectionxs.-
20 DISTRIBUTION/AVAILABILITY OF ABSTRACT 21. ABSTRACT SECURITY CLASSIFICATION
UNCL.ASSIFIED,UNLIMITED R SAME AS APT 0 OTIC USERS 0UNCLASSIFIED22a NAME Of RESPONSIBLE INDIVIDUAL 22b TELEPHONE NUMBER 22c OFFICE SYMBOL
(includeI Air* Codri
PETER BLETZINGER 1513 255-2923 1AFWAL/POOC-3DD FORM 1473,83 APR- EDITION OF I JAN 72IS OSOLETE, UNCLASSIFIED
SECURITY CLASSIFICATION OF THIS PAGE

TABLE OF CONTENTS
Section Page
1 INTRODUCTION 1-1
2 SUMMARY OF PHASE I LINEAR THYRATRON CHARACTERIZATION 2-1
3 PHASE II: LINEAR THYRATRON ELECTRICAL CHARACTERIZATION 3-1
3.1 Introduction 3-1
3.2 Electrical Drive Equipment 3-1
3.3 General Discussion of Thyratron Performance 3-2
3.4 Discharge Simultaneity 3-6
3.5 Electrical Characterisation 3-14
3.6 Auxiliary Grid Modifications 3-20
4 LINEAR THYRATRON OPTICAL CHARACTERIZATION 4-1
4.1 Introduction 4-1
4.2 Description of Hook Method Interferometer 4-1
4.3 Excited State Densities in the Linear Thyratron 4-5With 'Non-Optimum' Grids and Comparison withTheory
4.4 Excited State Densities in the Linear Thyratron 4-15With *Optimum' Grids
5 CURRENT DENSITY MEASUREMENTS 5-1
5.1 Introduction 5-1
5.2 Current Density Measurements 5-1
5.3 Emission Mechanisms 5-13
6 DESIGN OF THE 100 kV MODIFIED LINEAR THYRATRON 6-1CONCEPTUAL DESIGN OF THE SCALED-UP 100 kV THYRATRON
6.1 Introduction 6-1
6.2 Cathode Sizing 6-3
6.3 High-Voltage Insulator 6-3
6.4 The Control Grid Slot Region 6-9 0
6.5 Thermal Considerations 6-18
"": c J orL

S.-
-, - -a ~ '.~~S* ,?V'.~ V~? ~ ~ ~ S- *~..... a'

TABLE OF CONTENTS (CONTINUED)
Section Page
7 LINEAR THYRATRON PLASMA SIMULATION CODE: LINTHY2D 7-1
7.1 Introduction 7-1
7.2 Macroelectrons and Renormalization 7-2
7.3 Extended Null Cross-Section Technique 7-4
7.4 Excitation Processes and Cross Sections 7-9
7.5 Heavy Particle Conservation Equations 7-16
7.6 Solution of Poisson's Equation 7-19
7.7 Circuit Model 7-23
7.8 Input of Geometry, Material Properties, and 7-27Resistance Paths
7.9 Comparison of Plasma Simulation Results with 7-29Experiment
7.10 The Tradeoff Between Holdoff and Switching Speed 7-35
7.11 Scale-Up of the Linear Thyratron to 100 kY 7-43
8 HIGH-VOLTAGE OPERATION WITH THE MODIFIED LINEAR THYRATRON 8-1
8.1 Introduction 8-1
8.2 High-Voltage Pulser 8-1
8.3 Linear Thyratron and Laboratory Modifications 8-38.4 Preliminary Switching Trails with the Modified 8-8
Linear Thyratron
8.5 High-Voltage Operation of the Modified 8-12Linear Thyratron
8.6 Dual Pulse High-Voltage Operation 8-19
8.7 Burst Mode High-Voltage Operation 8-27
9 HIGH REPETITION RATE AND SWITCHING RATE OPERATION WITH THEFINAL LINEAR THYRATRON MODIFICATION 9-1
9.1 Introduction 9-1
9.2 Linear Thyratron Modifications 9-1
9.2.1 Modulator Modifications 9-3
U'
Jv

TABLE OF CONTENTS (CONTINUED)
Section Page
9.3 Experimental Results 9-6
9.2.1 Voltage Holdoff 9-6
9.3.2 Paschen Breakdown 9-7
9.3.3 Switching Rates 9-9
9.3.4 Rep Rate and Switching Power 9-12
9.4 A Radial Discharge Linear Thyratron Conceptual Design 9-14
9-5 Summary 9-5
.1i

LIST OF FIGURES
Figure Page
1-1 Schematic of Example Large-Scale Discharge 1-3Laser Assembly Using New Linear Thyratron Switch.
1-2 Schematic of Prototype Linear Thyratron. 1-4
1-3 Photograph of the Prototype Linear Thyratron as 1-5Delivered to STI by Impulse Electronics.
1-4 Modified Linear Thyratron Showing Large Viewing 1-7Windows.
1-5 Final Modified Linear Thyratron. 1-9
2-1 Schematic of Gas Handling System. 2-2
2-2 Schematic of Linear Thyratron Electrical System. 2-3
2-3 Control Grid Breakdown Voltage vs. Tube Pressure 2-4for Different Auxiliary Grid Current Settings.
2-4 Typical Control Grid Voltage and Current 2-4
2-5 Anode-Insulator-Ground Triple Point 2-5Where Flashover was Initiated.
2-6 Thyratron Commutation Waveforms with a Cold Cathode. 2-7
3-1 Schematic and I-V Trace for Pulse Charge 3-3Power Supply.
3-2 Current and Voltage for the Linear Thyratron 3-5Operating in He at 1.2 Torr.
3-3 PUT Signals from Different Locations in Thyratron 3-7for Auxiliary Grid Breakdown in H2 (a) 420 pms,(b) 600 ms.
3-4 Time Delay for Emission from Opposite 3-8Ends of Cathode (ns).
3-5 Cathode-Grid Emission Delay Time (ns) 3-10
3-6 Time Delay for Plasma Emission from Opposite 3-11Ends of the Grid Anode Gap (a) Hydrogen (b) Helium.
3-7 Relationship Between Anode Delay Grid-Anode 3-13Simultaneity and Cathode-Grid Simultaneity forOperation in H2 (a) and (b) and He (c)
. 3-8 Holdoff Voltage for the Linear Thyratron in He and H2 . 3-15
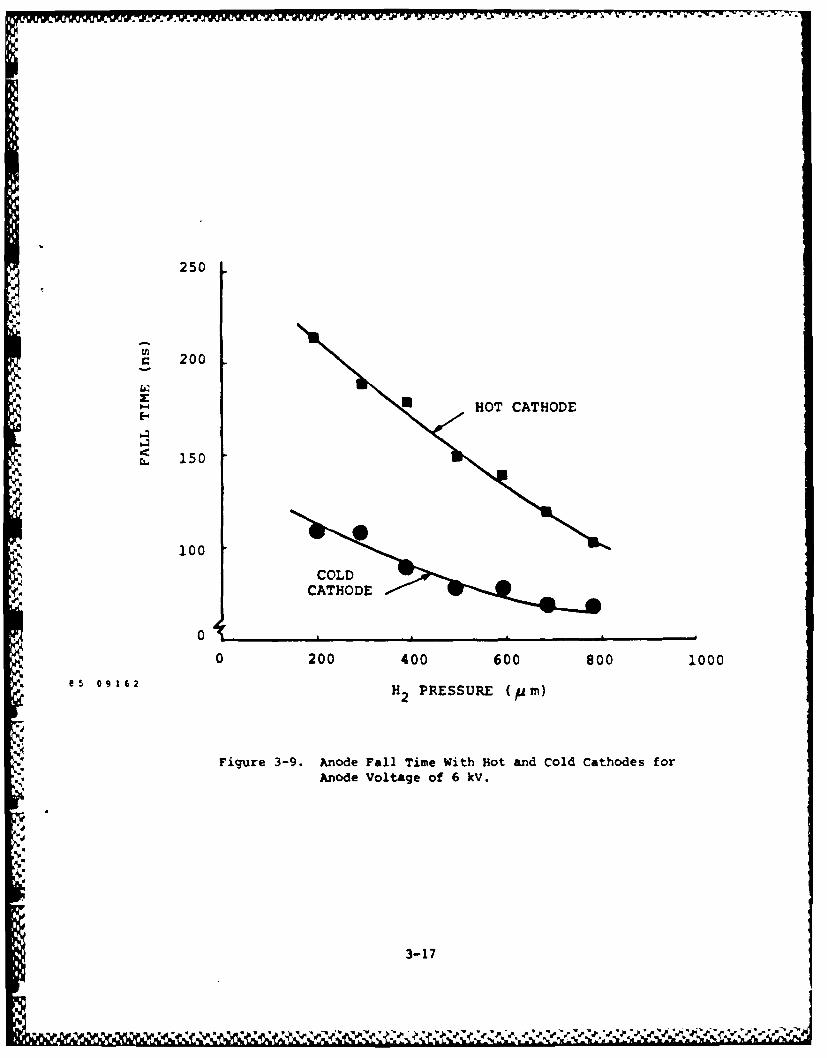
3-9 Anode Fall Time with Hot and Cold Cathodes 3-17for Anode voltage of 8 kV.
3-10 Typical Voltage Traces (H2 500 pm) Indicating 3-18Large Voltage Drop Between Control Grid and Cathode.
3-11 Voltage 20 ns After Breakdown. 3-19
vii
I,

LIST OF FIGURES
Figure Page
3-12 Open Shutter Photographs of Emission from Linear 3-22Thyratron (Hot Cathode, He, 2000 pm).
3-13 Photograph Showing Arcing on the Thyratron Sidewall. 3-24
3-14 Comparison of the Old Auxiliary Grid Geometry 3-25with the New, Modified Version.
3-15 Field of View of New Viewport Compared to the Old One. 3-26
3-16 Linear Thyratron with Large Viewports Installed. 3-27
3-17 Open-Shutter Picture of Linear Thyratrons 3-28Operating in Helium.
3-18 Linear Thyratron Voltage and Current Waveforms for 3-30High Inductance and Low Inductance Geometries ofOperation in He at 1.2 Torr with an Unheated Cathode.
3-19 Linear Thyratron commutation Waveforms with 3-31Shorted Load Register for Operation in Heat 1.5 Torr with an Unheated Cathode.
4-1 Schematic of Hook Method. 4-2
4-2 Experiment Apparatus Showing Lasers, Hook 4-3Interferometer, and Spectrometer.
4-3 Current and Voltage Waveforms for Conditions 4-6of Hook Spectroscopy Results (He 900 pm).
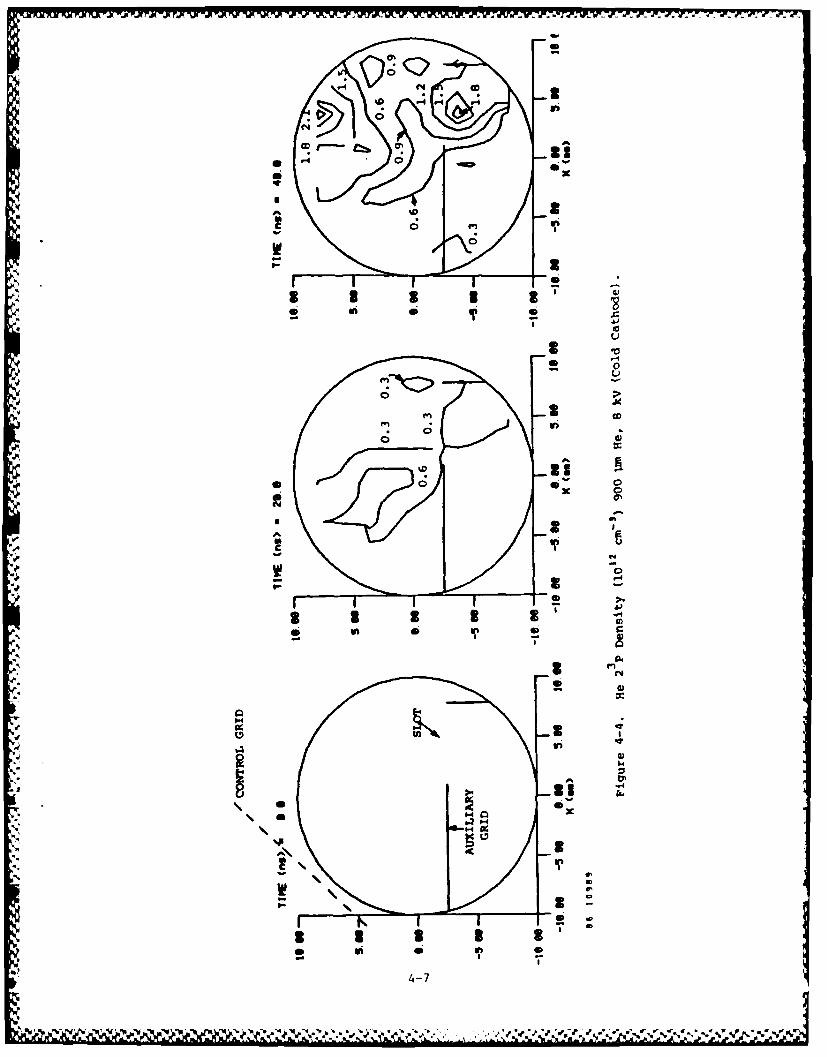
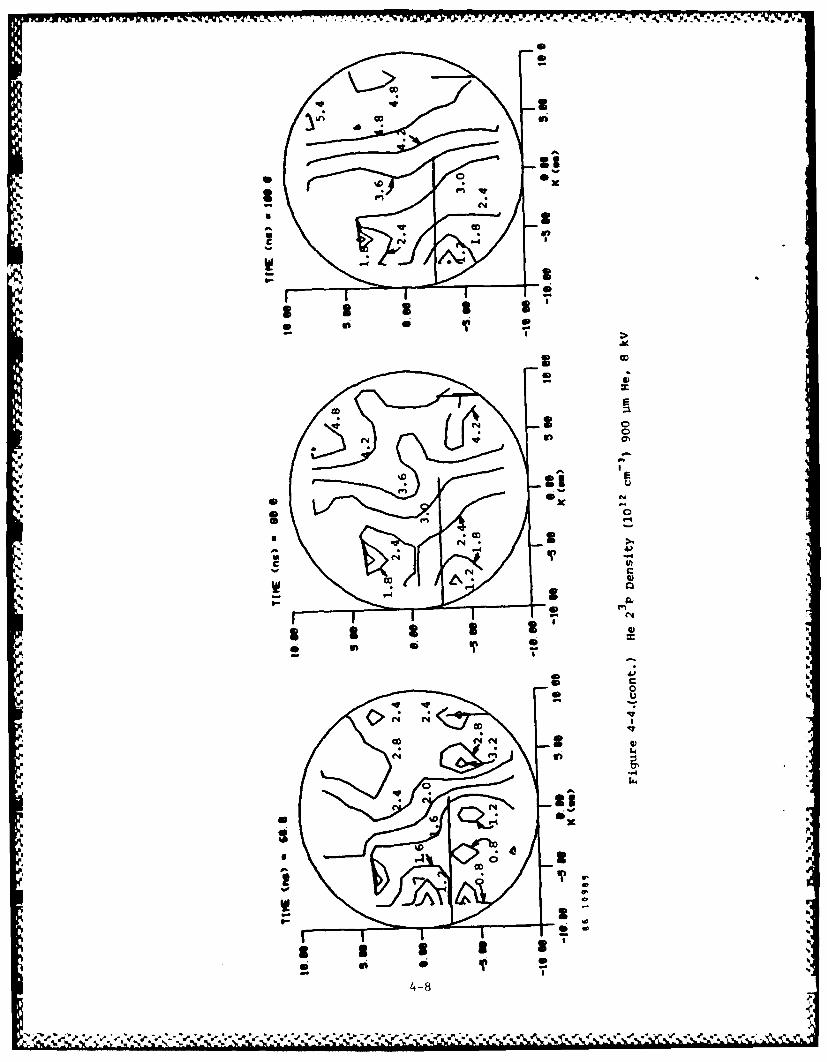
3P 12 -34-4 He 2 Density (10 cm ) 900 pm He, 4-7
8 kV (Cold Cathode).
4-5 Hook Method Spectroscopic Measurements for He23 4-12Density.
4-6 LINTHY2D Results for Electron Density. 4-16
4-7 LINTHY2D Results for He* Excited State Density. 4-17
4-8 He 23P Density for the Low Inductance Geometry. 4-18
4-9 He 23P Density at Locations Adjacent and 0.5 cm 4-20from the Control Grid.
4-10 Time Dependent He 2 Densities in the High 4-21Inductance Geometry.
4-11 H(2S) Excited State Density and Current Pulse in 4-24Linear Thyratron.
5-1 (a) Framing Camera Photograph of Cathode Arc. 5-3(b) Control Grid Voltage Showing Discontinuity
of Onset of Arc.
5-2 Framing Camera Photographs Confirm Cathode Arc. 5-4
viii
%

- -. WIN. Vjh.V.W"WV -N1% 1R. K I WIF-W
LIST OF FIGURES
Figure Page
5-3 Current Waveforms for current Density Measurements. 5-5
5-4 Cathode Arcing Current vs. Temperature in Hydrogen 5-6(300 pm) for Different Levels of dI/dt.
5-5 Time to Cathode Arcing (H2 , 300 pm). 5-8
5-6 Cathode Arcing Current for Constant H2 Gas Density. 5-10
5-7 Arcing Current vs. Cathode Temperature for 5-11300 pm Neon.
5-8 Arcing Current vs. Cathode Temperature for 5-121 Torr Helium.
5-9 Calculated Dendrite Temperature at End of 2 ps 5-15Current Pulse. (100 A/cm )
5-10 SEM Photographs of Dispenser Cathode Material. 5-17
6-1 Conventional Insulator Geometries. 6-4
6-2 Orientation Sketch for Critical Dimensions for the 6-6Rectangular Geometry Insulator.
6-3 Potential Contours for the Rectangular High- 6-7Voltage Insulator.
6-4 Maximum Electric Field on the Surface of the High 6-8Voltage Insulator for gap Height (h) and Anode-Insulator Distance (t).
6-5 Long Cylindrical Thyratron Design Concept Where 6-10Insulator Tube Contains Anode, Cathode and Grids.
6-6 Electric Potential contours in the Control Grid 6-14Gap Region for Various Baffle Configurations.
6-7 Schematic of High-Voltage Section and Legend for 6-15ikodified Linear Thyratron Dimensions.
6-8 Electric Field Penetration Attenuation Factor as a 6-16Function of Baffle Overlay (do) and Control GridThickness (t).
6-9 Electric Field Penetration Attenuation Factor as a 6-17Function of Slot Size (s) and Distance BetweenControl Grid and Baffle (b).
" 6-10 Schematic of Anode and High-Voltage Section for 6-19the CCLT Showing Current Paths Through the Control Grid.
6-11 Anode Thickness as a Function of Anode Diameter 6-21Diameter for N Control Grid Slots.
7-1 Schematic of Electron Multiplication and Renormalization.7-3
ix

q*A WVW. k . z~v ;.v N
LIST OF FIGURES (CONTINUED)
Figure Page
7-2 Schematic of Conventional Null Cross-Section Technique. 7-6
7-3 Schematic of Extended Null Cross-Section. 7-7
7-4 Schematic of Electron Impact Processes in Model. 7-10
7-5 Electron Impact Cross-Sections for He Used in the 7-13Simulation
7-6 Fraction of Electrons Scattering into Polar Angle 8 7-14for Different Isotrophy Factors m.
7-7 Verification of Cross Sections by Comparing Computed 7-17Ionization Coefficient and Drift Velocity to Experiment.
7-8 Geometry and Electric Potential for Modified Linear 7-24Thyratron.
7-9 Schematic of the Circuit Model for the Auxiliary Grid (AG),7-25Control Grid (CG) and Switching (s) Circuits.
7-10 Input File Used to Generate the Geometry Shown 7-28in Figure 7-8.
7-11 Voltage and Current Waveforms. 7-30
7-12 Electron Density for the High Inductance Geometry. 7-31
7-13 Simulation of Electron Energy Distribution for t = 100ns.7-33
7-14 Comparison of Theory and Experiment for the Distribution 7-24of Excited He States.
7-15 Geometry for Model Thyratron Used in Holdoff Study. 7-37
7 "1 Fractional Leakage Current for Geometry in Fig. 7-14 7-39for Various Anode Voltages and Gap Sizes (d isNoted in Legend in Upper Right). cg
7-17 Fringing Electric Potentials for a Selection of Gap 7-40Sizes and Control Grid Bias.
7-18 Probability Density for Electrons Escaping from 7-41the Cathode for VANODE = 100 kV.
7-19 Control Grid Bias Required for No Leakage Current 7-42for the Geometry of Figure A (He, 250 #m).
7-20 Absolute Switching Speed. (AI = 2 kA) 7-44
7-21 Normalized Switching Time as a Function of Gap 7-45Size and Anode Voltage.
7-22 Geometries LT-1 and LT-2 as Simulated in LINTHY2D. 7-47
7-23 Electron Density as Simulated by LINTHY2D 7-48for the Two Proposed Geometries.
x
-. 0 C-e- A ' A

jr -_J -j-i -Y- N, F~ AF -
LIST OF FIGURES (CONTINUED)
Figure Page
7-24 Predicted Current and Voltage Characteristics and Jitter 7-49for the Two Proposed Geometries LT-1 and LT-2.
7-25 Electron Distribution Functions at t = 15 ns 7-50for the Geometries LT-1 and LT-2.
7-26 Comparison of Theory and Experiment for Voltage 7-51Waveform with Geometry LT-1.
8-1 Schematic of High-Voltage Modulator and It's 8-2Associated Waveforms.
8-2 Schematic of the Modified Linear Thyratron. 8-4
8-3 Linear Thyratron Grid and Anode Components. 8-5
8-4 Details for the Control Grid 8-7
8-5 Laboratory Setup Showing the Modified Linear 8-9Thyratron Mount in the Oil Tank.
8-6 Typical V-I Traces for High Voltage Operation 8-10of Modified Linear Thyratron.
8-7 Maximum Switching Voltage and I-V Characteristics 8-14for Operation in H2.
8-8 Voltage Fall Time as a Function of Switching Voltage 8-15for Operation in H2 .
8-9 I-V Characteristics for Switching in H2 Showing 8-16(a) Fast and (b) Slow Behavior.
8-10 Maximum Switching Voltage and Voltage Waveform 8-20for Operation with He.
8-11 Dual Pulse Operation Showing (a) Successful Recovery 8-21at 51-ns Pulse Separation and (b) Unsuccessful Recoveryat 2-ns Separation.
8-12 Recovery Voltage as a Fraction of Charging Voltage 8-22as a Function of Pulse Separation for Operation in H2.
8-13 Electron and Ion Densities in the Absence of Diffusion 8-25in a Thyratron Plasma Afterglow.
8-14 Thyratron Recovery Time as a Function of Wall Separation.8-268-15 Electric Field Required to Obtain an Ionization Rate 8-28
(Rion) that is a Specified Fraction of the RateS of Diffusion (R Diffusion).
8-16 Post Discharge Voltage Spikes Impressed Across 8-29S the Linear Thyratron.
p.
xi
.. .-.. :.-..3....-...;.?; .- .£.-. . ......--... & .. ... ;,.;

LIST OF FIGURES (CONTINUED)
Figure Page
8-17 Burst Mode Switching at 60 kV in 180 pm Hz. 8-30
9-1 Schematic Final Linear Thyratron 4eometry. 9-2
9-2 Modulator Circuit for (a) 0-120 kV, (b) 0-3 kHz Testing 9-5
9-3 LT Holdoff Voltage as a Function of Gas Pressure 9-8for the Modified LT's.
9-4 VI Switching Characteristics. 9-10
9-5 Startup Switching Characteristics. 9-10
9-6 VI Traces for a Burst of 5 Pulses at 3 kHz in 800# He. 9-13
9-7 Conceptual Design of a Radial Discharge Linear Thyratron.9-15
9-8 Conceptual Scheme to Terminate RDLT. 9-18
xii
.'~ ~S S * V~ S

LIST OF TABLES
Table Page
2-1 Phase I LT Switching Characteristics for Hot Cathode. 2-8
2-2 Phase I LT Switching Characteristics for Cold Cathode. 2-8
6-1 Surface Flashover Strength (ky/cm). 6-11
6-2 Baffle Attenuation Coefficient and Voltage Holdoff. 6-13
8-1 Reactions anbd Rate Constants for Recovery in an H2 8-23Plasma.
xiii

-a a- a. b - - ~qa ~.....4 ~M.. - - - A
*3
.1.;
S
'I
a'
4-
-4
4.
-a
a,
-w
S
-~ -~ .' ~ -S -~ *, ~ .* V~ a~ f *~ i~~* ~SS5~SJS~ ~ S ~.d ~ ~ 5' 5'

Section 1
INTRODUCTION
Future electrical pulse power systems for civilian and military
applications have requirements that exceed our present technology,
particularly as pertains to high repetition rate, high-voltage, and
high-current switches. Although the details of those requirements vary over a
large parameter space, a large fraction of the requirements would be met by an
electrical switch operating at k100 kV, k100 kA, 1012A-s- 1 , and with a
repetition rate of >100 Hz. The linear thyratron is a candidate to satisfy
these requirements. As its name implies, the Linear Thyratron (LT) is a gas
discharge switch built in a linear geometry as opposed to the cylindrical
geometry used with commercially available devices. Scaling cylindrical
thyratrons to higher currents by increasing the diameter of the cathode has
had limited success because of the inability to uniformly utilize the entire
cathode surface. Scaling cylindrical thyratrons in this manner increases
their inductance (thereby decreasing dI/dt) and increases the geometrical
mismatch between the switch and stripline modulators. The LT, though, is
conceptually scalable to arbitrarily large currents by lengthening the
thyratron in the axial dimension while not changing the characteristic gap
dimensions or the distance between any spot on the cathode and the control
grid slot, the critical dimensions which determine the switching properties.
The inherently low inductance of the linear geometry also makes the LT more
attractive to obtain high values of dI/dt. The LT has been developed with the
goal to demonstrate proof of principle, high-voltage scaling, and the ability
to scale in length (i.e., scale in current).
The concept of the linear thyratron resulted from inadequacies of
commercial cylindrical thyratrons. These inadequacies became apparent when
switching fast discharge excimer lasers. These lasers typically have pulse
power requirements of 10-50 kV and 10-50 kA. The pulse widths are typically
100-300 ns and rate of current rise M1O1 2A-s-1 . These parameters equal or
exceed the specifications of commercial thyratrons and, therefore, demanded a
1-1
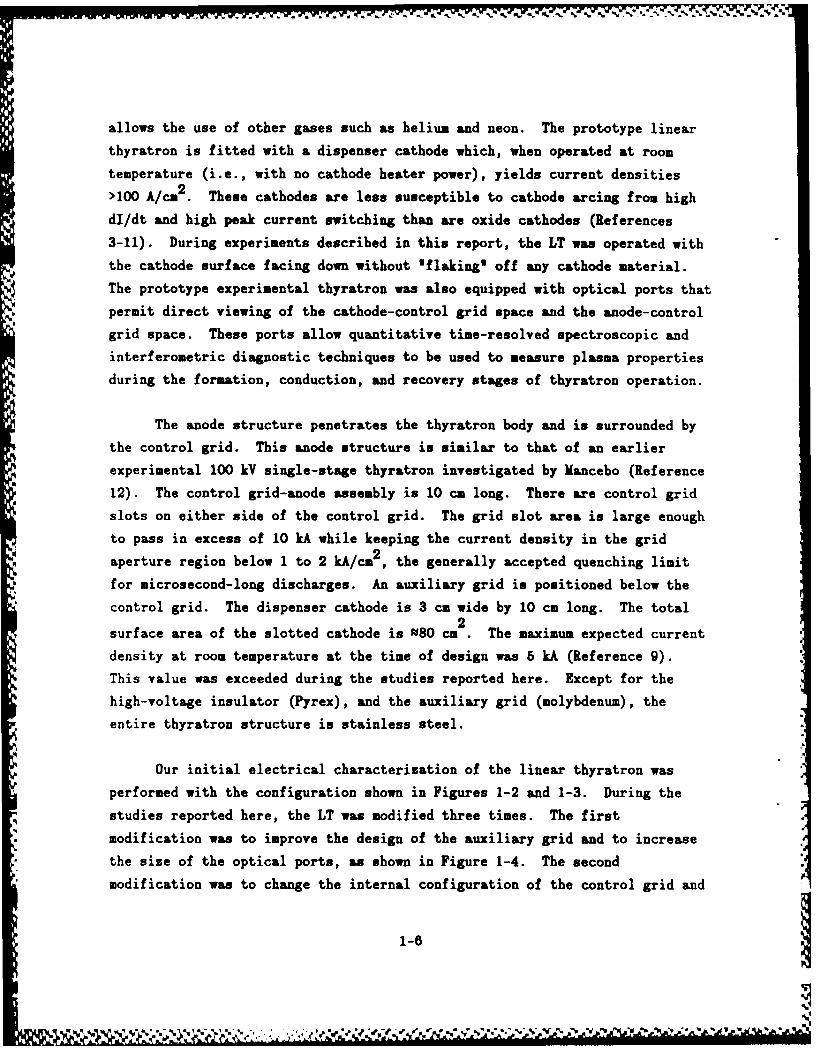
new switch. Discharge excimer lasers and their pulse forming networks are
also built in a linear geometry. A low inductance switch which mates these
two linear components should also have a linear geometry, as shown in
Figure 1-1. These performance and geometrical considerations led to the
development of the linear thyratron.
An additional consideration is thyratron lifetime. When used as a
switch for excimer lasers, conventional cylindrical thyratrons equipped with7
oxide cathodes have a lifetime of 010 pulses. Autopsies of failed thyratrons
showed that arcing had occurred and that most of the oxide cathode material
had eroded from the cathode vanes. To increase the lifetime of commercial
thyratrons, we must reduce the value of dI/dt and peak current that the
thyratron must switch. Magnetic pulse compression is a technique that can
limit dI/dt in the switch, and its use has extended thyratron life for these
conditions to 108 shots (References 1,2). However, magnetic pulse compression
addresses only the symptoms and not the limitations of thyratrons in fast,
high current discharge circuits. Therefore, the LT must not only improve upon
the single pulse and geometrical specifications cited above but it must also
have long lifetimes. Therefore, the LT must use a cathode that is less
susceptible to damage from the higher performance specifications.
In 1981, Spectra Technology, Inc. (STI) and Impulse Engineering began a
joint effort to develop the linear thyratron. Impulse Engineering fabricated
the prototype experimental linear thyratron and delivered it to STI in May
1983. Figure 1-2 shows a schematic of the prototype linear thyratron, and a
photograph of the prototype device appears in Figure 1-3. Our design was
based on a structural concept that can be linearly scaled and that does not
involve oven-fired, sealed-off fabrication methods. Permanent
ceramic-to-metal seals in thyratron construction are subject to thermally
induced stress, which restricts the maximum scale dimensions of the tube and
, prevents the use of an elongated (linear) geometry. High vacuum is obtained
in the prototype LT by using an O-ring sealed chamber that incorporates either
Pyrex or ceramic insulators for high-voltage holdoff. A gas flow supply and
exhaust system is used, which eliminates the need for a hydrogen reservoir and
1-2

-4
z 6
(A
IA
0 6w
'41
40..
K0
1-3

T- .OPTICAL PORT
GRID BAFFLE
ELECTRICALI FEEDTHROUGH
CONTROL GRID
- OPTICAL PORT
AUXILIARY GRID
FEEDTHROUGH
cmnp IS 09442
Figure 1-2. Schiatic of Prototype Linear 7Ihyratron.
1-4

41 0
0 &
la
-4)
N 4
a,4
1.
$4
allows the use of other gases such as helium and neon. The prototype linear
thyratron is fitted with a dispenser cathode which, when operated at room
temperature (i.e., with no cathode heater power), yields current densities
>100 A/cm2 . These cathodes are less susceptible to cathode arcing from high
dI/dt and high peak current switching than are oxide cathodes (References
3-11). During experiments described in this report, the LT wa operated with
the cathode surface facing down without 'flaking' off any cathode material.
The prototype experimental thyratron was also equipped with optical ports that
permit direct viewing of the cathode-control grid space and the anode-control
grid space. These ports allow quantitative time-resolved spectroscopic and
interferometric diagnostic techniques to be used to measure plasma properties
during the formation, conduction, and recovery stages of thyratron operation.
The anode structure penetrates the thyratron body and is surrounded by
the control grid. This anode structure is similar to that of an earlier
experimental 100 kY single-stage thyratron investigated by Mancebo (Reference
12). The control grid-anode assembly is 10 cm long. There are control grid
slots on either side of the control grid. The grid slot area is large enough
to pass in excess of 10 kA while keeping the current density in the grid
aperture region below 1 to 2 kA/cm2 , the generally accepted quenching limit
for microsecond-long discharges. An auxiliary grid is positioned below the
control grid. The dispenser cathode is 3 cm wide by 10 cm long. The total2
surface area of the slotted cathode is 080 cm . The maximum expected current
density at room temperature at the time of design was 5 kA (Reference 9).
This value was exceeded during the studies reported here. Except for the
high-voltage insulator (Pyrex), and the auxiliary grid (molybdenum), the
entire thyratron structure is stainless steel.
Our initial electrical characterization of the linear thyratron was
performed with the configuration shown in Figures 1-2 and 1-3. During the
studies reported here, the LT was modified three times. The first
modification was to improve the design of the auxiliary grid and to increase
the size of the optical ports, as shown in Figure 1-4. The second
modification was to change the internal configuration of the control grid and
1-8
.1 IV

~1-

anode in order to improve its high-voltage performance. The final external
modifications of the LT are shown in Figure 1-5.
The linear thyratron research and development program performed by STI
and summarised in this report is called the Phase II program. The intent of
the program was to further our fundamental understanding of the plasma
processes and scaling potential of the LT and to demonstrate that improved
understanding by modifying the LT to operate at voltages of 5100 kV. The
investigations consisted of electrically and spectroscopically characterizing
the LT, and developing a first-principles plasma simulation model for the LT
to apply to subsequent design tasks. In brief summary, the following program
goals were met:
o The LT was electrically characterized by measuring the pertinent
voltage, current, and timing parameters.
o The operating requirement to obtain uniform and simultaneous
cathode coverage was confirmed by observing plasma emission.
o Excited state densities in the thyratron plasma were measured
using hook spectroscopy. The measurements were used to guide
subsequent modifications of the LT.
o A plasma simulation model was developed, validated, and applied to
the design of modifications of the LT.
o The maximum current capacity of the dispenser cathode was measured
over a wide parameter space.
o The design requirements for a 100-kY linear thyratron were defined
and two designs of an advanced linear thyratron were performed.
o The LT was modified to switch higher voltages and was successfully
operated at voltages 595 kV.
o Further modifications allowed simultaneous switching of 60 kV at
3kHz with dI/dt >10' A/s.
V

-1S9

REFBRENCBS
1. I. Smilanski, S. Byron, and T. Burkes, 'Electrical Excitation of an XeCl
Laser Using Magnetic Pulse Compression,' Appl. Phys. Lett. 40: XXX,
(1982)
2. R. Petr, J. Zudieck, J. Demboski, I. Smilanski, J. Ewing, and
R. Center, 'Magnetic Pulse Compression for Copper Vapor Lasers,' 4th
IEEE Pulsed Power Conference, IEEE Cat. 83CH1908-3, New York, 1983,
pp. 236-241,
3. MSNW and Impulse Electronics, Long-Life High-Current Thyratrons for Fast
Discharge Lasers, Final Report, Contract AFWAL-TR-84-2003, March 1984.
4. D. Turnquist, T. Lynch, S. Mers, and N. Reinhardt, 'Development of
Instant-Start Thyratrons,' IEEE 14th Pulse Power Modulatcr Symposium,
New York, 1980, pp. 48-53.
5. D. Fleisher, D. Turnquist, S. Goldberg, and N. Reinhardt, 'The
Plasma-Heated Thyratron,' IEEE Trans. Electron Devices ED-26: 1444
(1979)
6. S. Friedman, R. Petr, J. McGowan, and J. O'Connell, 'Instant-Start
Cathodes for High Average Power Hydrogen Thyratrons,' IEEE 15th Pulse
Power Modulator Symposium, New York, 1982, pp. 127-132.
% 7. EG&G, LANL Laser Isotope Seperation Program and NSWC High Voltage-Low41 Inductance Hydrogen Thyratron Program, Final Report, DOE Contract
EN-77-C-04-4047, 1982.
8. EG&G, Research Studies for Cathode and Grid Elements for Superpower
Switches, Final Report, DOD Contract DA 36-039-SC-85338, 1962.
1-10 I

-a£ 9. R. Petr and if. Gundersen, 'Field Emission Cathodes for High Power
Beams,' Lasers and Particle Beams 1: 207 (1983)
10. S. Schneider, private communication, 1984.
11. J.L. Cronin, 'Modern Dispenser Cathodes,' IEE Proc. 128: 19 (1981)
12. L. Mancebo, '100-kV Thyratron Without Gradient Grids,' IEEE Trans.
Elect. Dev. ED-18: 920 (1971)

Section 2
SUMMRY OF PHASE I LINEAR TITRATION CIAIACTERIZATION
In this section, the electrical characterization of the prototype linear
thyratron during Phase I will be summarized. These activities are discussed
in detail in the Phase I Final Report (Reference 1).
The linear thyratron tube was connected to a gas handling system, shown
schematically in Figure 2-1. During a test, the thyratron was backfilled with
the operating gas to the desired pressure through a cold trap and valved off.
It was not necessary to flow gas if the thyratron was operated with its
dispenser cathode at room temperature; however, with a hot cathode (900*C) the
gas purity degraded, resulting in the high-voltage holdoff of the thyratron
decreasing. A flow rate of a few sccm was sufficient to maintain the maximum
high- voltage holdoff. The test circuit used for the Phase I measurements is
shown schematically in Figure 2-2. The control grid breakdown voltage versus
tube pressure for different values of the auxiliary grid current is shown in
Figure 2-3. Typical voltage and current waveforms for the control grid are
shown in Figure 2-4.
The performance specifications obtained for the prototype linear
thyratron during Phase I are summarized in Table 2-1. The results in this
table are for operation with a hot cathode (900*C). The working gas during
Phase I was neon. At a pressure of 100 pm (0.1 Torr), the thyratron could be
operated with anode voltages up to 15 kV at a gas pressure of 100 #m and with
an anode voltage fall time of 0200 ns. At the high gas pressure of 500 #m
(0.5 Torr), the anode voltage fall time decreased to 100 ns, but high-voltage
holdoff also decreased to 5 kY. Generally the tube pre-fired by flashing
along the insulator from the thyratron body-insulator-control grid triple
point illustrated in Figure 2-5. The flashover propapagated to the top
section of the anode.
2-1

OPTICAL PO/Z
ION PUMP AND 3AIU.JALETHY RATRON PORTION OFPRESSURE GAUE YSE
AND"
PUMP IG PURITY
GA1S SUPPLY
FORE PUMP
Figure 2-1. Schematic of Gas Handling System.
2-2
), U
~~2-2 '

-4
0 U,
t 10z
-.
imi
r
0u
E
04,
........
b3w
2-3

Volts7
5000-
Awiliary Grid Currento 100 *A
42000-
3000-20mCONTROL GRID
BEACDO1% VOLTAGE
2000-300 Wk
1000
Figu.re 2-3. Control Grid greakdown Voltage Vs. rube Pressure tor Different
Awuliazy Grid Current Settings. 30apidaoevlae
Figure 2-4. Typical Control Grid Voltage and Current
Umps Grid voltage I ky/divDOM=-: Grid current 10 A/divAborisontals 100 nsec/fivno applied anode voltage.-
2-~4

FLASHOVERALONG THEINSULATOR
I / INSULATOR
ANODE
i THYRATRON
BODY (GROUND)
TRIPLE POINT IWHERE FLASHOVERWAS INITIATED
CONTROL'GRID
Figure 2-5. Anode-Insulator-Ground Triple Point where Flashover wasInitiated.
10962
2-5
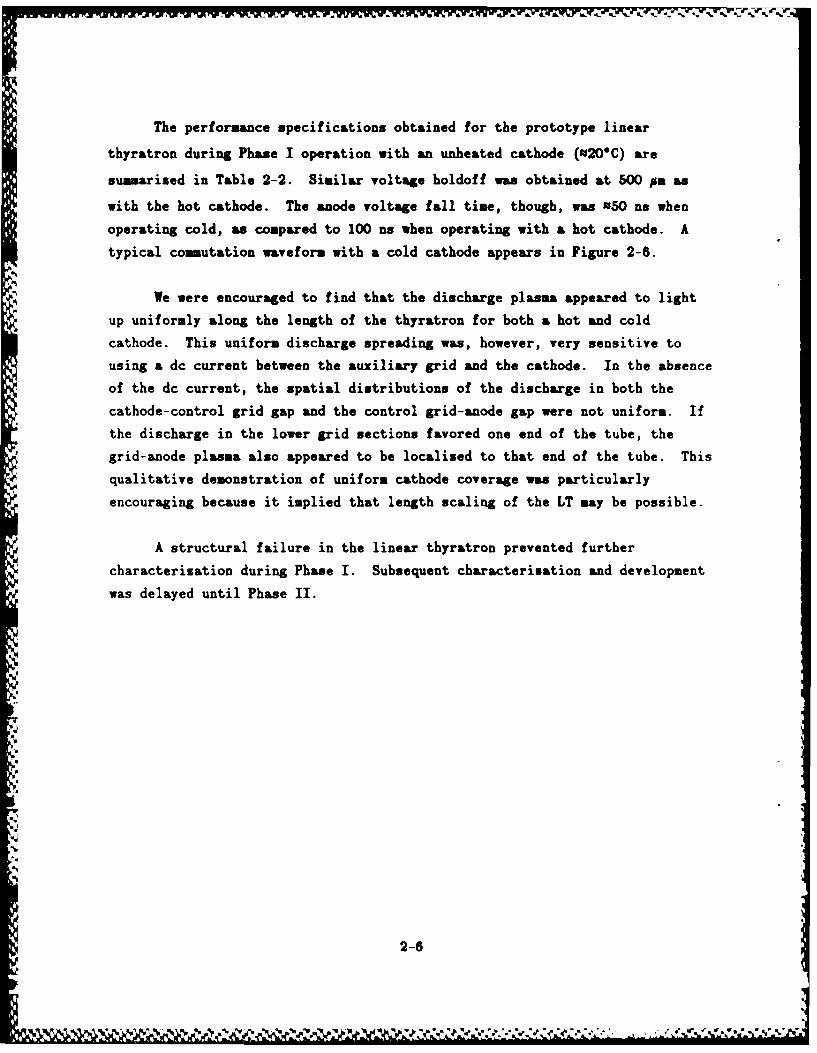
The performance specifications obtained for the prototype linear
thyratron during Phase I operation with an unheated cathode (020"C) are
summarized in Table 2-2. Similar voltage holdoff was obtained at 500 #n as
with the hot cathode. The anode voltage fall time, though, was 0so ns when
operating cold, as compared to 100 ns when operating with a hot cathode. A
typical commutation waveform with a cold cathode appears in Figure 2-6.
We were encouraged to find that the discharge plasma appeared to light
up uniformly along the length of the thyratron for both a hot and cold
cathode. This uniform discharge spreading was, however, very sensitive to
using a dc current between the auxiliary grid and the cathode. In the absence
of the dc current, the spatial distributions of the discharge in both the
cathode-control grid gap and the control grid-anode gap were not uniform. If
the discharge in the lower grid sections favored one end of the tube, the
grid-anode plasma also appeared to be localized to that end of the tube. This
qualitative demonstration of uniform cathode coverage was particularly
encouraging because it implied that length scaling of the LT may be possible.
A structural failure in the linear thyratron prevented further
characterization during Phase I. Subsequent characterization and development
was delayed until Phase II.
2-6
.........

Wft, Anade Voltage kV/dGivRights Anode current 200 A/dIv*orimota1s 50 nsec/diV
CAM pressures SW0 microns noonCathode temperatures 200C
ee I oo Auxiliazy grid currents 100 lh
Figure 2-6. Thyratron Commutation Waveforms with a Cold Cathode.
'
4...I> .,;-,-,.;,,..,, ",. ,,.? -€ .; ;,;,. . ,:,,.: . .... i.. .: :. :,.-...:.,.. ....,. ..... .. ,;..?

Table 2-1PEASE I LT SWITCHING CHARACTERISTICS FOR HOT CATIODB
Gas Neon
Pressure 100 #m
Cathode Temperature 9000 C
Peak Anode Voltage 15 kV
Peak Discharge Current 2 kA
Discharge Current Duration 120 ns FWlL
Anode Fall Time 200 ns
Auxiliary Grid Current 100 mA
Table 2-2
PEASE I LT SWITCHING CMAACTERISTICS FOR COLD CATHODE
Gas Neon
Pressure 500 #s.Cathode Temperature 200C
Peak Anode Voltage 5SkV
Peak Discharge Current 700 A
Discharge Current Duration 120 us FWlL
Anode Fall Time (50 ns
Auxiliary Grid Current 100 mA
2-8

REFIBNCBS
1. Spectra Technology and Impulse Electronics, Long-Life Bigh-Current
Thyratrons for Fast Discharge Lasers, Final Report, Contract
AFWAL-TR-84-2003, March 1984.
42-
, 2-9 '
-. '-- . 5 *'*S .4..*~*'4 ~~4 J'. ~ 4 '~~44 ~ 'p.. >-: : '

Section S
PEASB II LINEAR TI RATION ELECTRICAL CIAIACTBRIZATION
3.1 INTRODUCTION
A critical requirement for the development of the linear thyratron is
the necessity that the discharge cover the cathode uniformly and
simultaneously. We qualitatively observed during Phase I that the thyratron
appeared to turn on uniformly along its entire length. An objective of
Phase II was to confirm this through unambiguous measurements. In Phase II,
we also desired to study the effects of different gases on thyratron operation
and to determine the performance characteristics of a cold dispenser cathode.
Since the diagnostic ports in the linear thyratron permit direct observation
of the temporal and spatial behavior of the plasma, optical diagnostics could
be applied to the thyratron to achieve these ends.
In this section, the electrical characterization of the prototype linear
thyratron will be discussed. The grid drivers and pulse charging circuits
will be briefly described. This description is followed by a discussion of
measurements of the uniformity of cathode coverage and of the uniformity of
the discharge within the grid-anode gap. Various other electrical parameters
were also measured, such as anode delay time and voltage delay time.
3.2 ELECTRICAL DIV EQUIPMENT
The electrical drivers for the linear thyratron were upgraded for
Phase II from those used in Phase I. This equipment included an auxiliary
grid driver, a control grid driver, and a pulse charging power supply. The
two grid drivers are separate to allow them to be independently timed. The
charging supply is pulsed in order to reduce the time the thyratron must hold
off high voltage. This reduces the likelihood of pre-fires, insulation
failure, corona, and other problems associated with high-voltage holdoff.
3-1

Both the control grid and auxiliary grid drivers provide a maximum of
5 kV open circuit and 20 A short circuit in 5 ps pulses at 5 Hs. This peak
power amplitude can be adjusted with a variac controller. We have provided
the ability to pulse the auxiliary grid (in addition to having.a dc simmer
current) because pulsing appears to enhance cathode utilisation, especially
with cold dispenser cathodes (Reference 1). The pulse charging power supply
charges a 20-nF storage bank up to 25 kV in 3 #s at a maximum repetition rate
of 5 Hz. Figure 3-1 shows a schematic and V-I trace for the pulse charge
power supply.
3.3 GBNBAL DISCUSSION OF TKYKATRON PIRFOlRANCB
The prototype linear thyratron is a tetrode and has a slotted, sintered
barium titanate dispenser cathode with dimensions 3 cm X 10 cm (see
Figure 1-2). The cathode was furnished by Sprectramat, Inc. The effective
surface area of the slotted cathode is approximately 80 cm2 . The thyratron
body is made of stainless steel and is sealed with fluorocarbon 0-rings. An-8
external gas handling system is used (base pressure 5 X 10 Torr), thereby
enabling the use of a variety of gases at a selection of gas pressures. The
high-voltage insulator is made of Pyrex in a racetrack configuration and is
3.4 cm high. The auxiliary grid is made of molybdenum, and the control grid
and anode are made of stainless steel. The thyratron is equipped with a pair
of 2.5-cm-diameter optical ports on either side of the cathode looking
perpendicularly into the cathode-control grid space, and a pair viewing the
control grid-anode gap. There are also optical ports on either end of the
thyratron. These ports originally had a viewing diameter of 2 cm (see
Figure 1-3). The windows were later enlarged to provide a viewing diameter of
6 cm, which provided optical access to the entire cathode-control grid space
(see Figure 1-4).
The thyratron is typically operated in either hydrogen or helium. The
performance of the thyratron was qualitatively the same when using either of
the gases; voltage fall time, maximum cathode current, and dI/dt were
similar. The exception was with high-voltage holdoff and maximum switching
3-2
L , , W.¢ . .E € ~ r.,'.V o.C " ' " " " ' . " "" . " '-"." " -" '-"-' "".-".". .. "".. . . . . . . -" """ "" . " -

1 (L(LOADI
85 0910E
TOP TRACE: V UCN5 kV/DIV
BOTTOF TRACE: I (LA)100 A/DIV
3 vis/DIv
Figu~re 3-1. Schematic and I-V Trace for Pulse ChargePower Supply.
1 3-3

voltage. At a given gas pressure, the maximum holdoff and switching voltage
was higher in helium than in hydrogen, a consequence of the more favorable
Paschen curve for helium compared to hydrogen. Holdoff in the linear
thyratron was limited to 25 kV by field emission at a gas-metal-insulator
triple point, resulting in insulator flashover. This limiting voltage
occurred at 1.5 Torr in He and 0.6 Torr in H2 . The field emission problem was
subsequently corrected during modification of the linear thyratron. Holdoff
and switching at 95 kV were obtained with the modified thyratron, as described
in Section 8.
The prototype linear thyratron has separately switched 25 kV, 10 kA, and11 -1
a maximum dI/dt of 1.3 X 10 A-s . The latter two values were obtained at
different pulse lengths, although we did not attempt to optimize all
parameters at all pulse lengths. The high current limit was obtained with a
pulse duration of 040 #s with a dI/dt of 2 X 10 A-s-1 , while the high dI/dt
limit was obtained with a pulse duration of 0120 ns and a maximum current of
4.8 kA. These parameters equal or exceed those for commercially available
thyratrons (Reference 2). The cited current ratings will increase in
proportion to an increase in the length of the cathode.
The cathode was typically operated without auxiliary heating. We
obtained nearly the same performance when operating the cathode hot (800°C) or
at room temperature. Current densities in excess of 150 A-cm-2 were obtained
with both a hot and cold cathode, indicating that the emission mechanism for
this cathode is not dominantly thermal (Reference 3). When operating with a
hot cathode, the anode voltage fall time is longer and the jitter is worse
than when operating with a cold cathode. The jitter, normally about 5 ns when
operating cold, increased to 20-30 ns when operating with a hot cathode.
The current and voltage traces for the thyratron operating in 1.8 Torr
of helium appear in Figure 3-2. The inductive component of the voltage has
been removed by computer processing (Reference 4). The thyratron switched
20 nF charged to 9 kV into a 0.5 0 load. The cathode was not heated. The11 -
peak current was 4.8 kA with a maximum dI/dt = 1.3 X 10 A-s. The
3-4
N' -Z, ',K< ';-:-, -.. ..i,", . .'', '. ." ".- - . ' . . .-' -, , . ..... ..... . " d& -'" "" " "" "' "" "" "" k ~u um """ " "' " "-

10 I-5
8 AMPS 4
u 6 - -3
0 z< I.U-J 4- -20
> ,VOLTS
2-
0-, 00 0 25 50 75 100 125
TIME (ns)86 10739
Figure 3-2. Current and Voltage for the Linear Thyratrmnoperating in He at 1.2 !rrr. The inductivecomponent of voltage has been reroved fromthe trace.
I 3-5
4,N:,

thyratron commutation appears to occur in two stages: 0-25 ns and 25-75 ns.
The thyratron resistance at the end of the first stage is 0.2 0 and after the
second stage is 0.025 0. These parameters represent the best short-pulse
performance.
3.4 DISCIAIGB SIMULTANEITY
Parameters of interest to scaling the linear thyratron are (1) whether
the discharge spreads uniformly across the cathode and (2) length of time
required for the discharge to fill the cathode space. To determine the
uniformity of the spread of the discharge across the cathode, the following
method was used. Two shielded photo-multiplier tubes (PUT) were set up to
view the cathode-grid space through separate view ports at far ends of the
cathode (see Figure 1-4). Black tubes approximately 50 cm long were installed
between the observation ports and the PUTs to insure that the PUTs viewed
separate regions of the discharge. In this configuration, the PMTs viewed a
region approximately 1.5 cm wide, separated by about 10 cm. Emission from the
discharge was viewed while using only a neutral density filtering. Therefore,
the wavelength response of the measurement was that of the photomultiplier
tube (1P28). Simultaneity of discharge coverage was correlated with the
simultaneity of the pulsed plasma emission. The rise time of the PUT was less
than 5 ns, and the responses of the two PUTs were calibrated relative to each
other by viewing the same portion of the discharge from opposite sides of the
thyratron.
The uniformity of the spread of the discharge was determined by the time
delay and magnitude of tha pulsed plasma emission viewed by the PUTs.
Examples of the emission measured by the PUTs are shown in the data presented
in Figure 3-3. For these examples, both the auxiliary grid (Qi) and the
control grid (G2) were simultaneously pulsed and the cathode was unheated. No
voltage was applied to the anode nor was there a simmer current sustained
between the auxiliary grid and the cathode. Emission from the discharge in H2
at a pressure of 420 pm appears in Figure 3-3a and shows a significant delay
between opposite ends of the cathode. The emission in Figure 3-2b for OW #m
3-6
--------------------------------------------

(a ) 4 ?'C iw .;
,.
(b) 600 0ms
a" 85 09212 (--r ns/,iik')
Figure 3-3. PMT Signals fron Cifferent Locations inThyratron for Auxiliary Grid Breakdown in
H2 (a) 420 rmns, (b) 600 jms.
.3a',
aa.

H2 shows almost no delay. These results are summarized in Figure 3-4. For
pressures greater than W0O pm, discharge coverage is simultaneous. For
pressures less than 500 pm, there is a transition region where the delay
increases with decreasing pressure. This transition region is only about
100 pm wide. For pressures less than 400 pm, the grid-cathode region appears
to randomly light up along the length of the cathode. Improvements for the
simultaneity of discharge coverage were obtained when a dc simmer current was
sustained between the cathode and auxiliary grid. The simmer current was
$100 mA (a few mA/cm2 of cathode area). As shown in Figure 3-4, with the dc
simmer current, the simultaneity of discharge coverage over the cathode
remained at its minimum value (approximately 5 ns) to the lowest pressure
examined (200 pm).
Similar measurements for discharge simultaneity were performed when
using helium as the working gas. The time delay between pulse plasma emission
from opposite ends of the grid-cathode region is plotted in Figure 3-5. For
these measurements 5 kV was applied to the anode and was switched by the
thyratron. When using a cold cathode and a dc simmer current (20 mA,
$ 0.4 mA/cm2), the discharge over the cathode was both uniform and simultaneous
for the pressure range 750 pa - 3 Torr. When operating without a dc simmer
current and with a hot cathode, simultaneity was not obtained over the same
pressure range. A dc simmer current could not be used simultaneously with a
heated cathode because of the tendency to pre-fire. Pre-firing was not a
problem when using a heated cathode or a dc simmer current separately.
Having confirmed that the discharge covers the cathode simultaneously, a
similar study was performed for the discharge between the control grid and
anode. The emission from the discharge in this region was observed through
the two optical ports in the top of the linear thyratron. These results are
plotted in Figures 3-6a and 3-6b for H2 and He, respectively. With H2,
simultaneity of the discharge between opposite ends of the anode improves with
increasing operating pressure. Above 600 #m, with either hot or cold
cathodes, the discharge is uniform and simultaneous. This simultaneity
extends to 400 pm when operating with a cold cathode and with a dc simmer
3-8
W-1 'j

100•* NO dc PRIME
ZLL A WITH dc PRIME(O() 80o
co o 8wz
06
0 40
LLJQ0 3 4
a 0-- 20- @
-4-A--- ! A-AP - -P-A
00 200 400 600 800 1000
H2 PRESSURE (Pm)
66 10738 Figure 3-4. Time Delay for Plasma Emission from Opposite Ends of theCathode with and without a dc Simmer Current as a Functionof Hydrogen Pressure.
3-9

-- c W- W.. -- ~ s. .
120
A COLD CATHODEWITH dc PRIME
. HOT CATHODE _100 WITHOUT dc PRIME
80
z
Cn a
0
460
20
-A-A- A-A-A-A-A-A- A-A--
0 I -
0 1
0 500 1000 1500 2000 2500 3000
He PRESSURE (am)
Figure 3-5. Time Delay for Plasma Emission from Opposite Ends of theCathode for Operation in Helium for an Unheated Cathode witha dc Simmer Current and a Hot Cathode Without a dc SimmerCurrent. The Anode was charged to 5 kY.
3-10~ ~ ./..J X/ ./. ~ .. \*~bs 4~%~ '.~f .~~ ~ *'* * % -%

60 a) ICOLD CATHODEA WITH dc PRIME
HOT CATHODEWITHOUT dc PRIME
ou 40 0
20ra 20
A I - I I09
0 200 400 600 800 1000
H2 PRESSURE (em)
60 b)
Az
0
20 A
0
0 I I I I I0 500 1000 1500 2000 2500
He PRESSURE (jim)
Figure 3-6. Time Delay for Plasma Emission from Opposite Ends of theGrid Anode Gap (a) Hydrogen, (b) Helium.
"cm 4o"v 4 4 3-1.
w-" . ,,,,,r ,, q - - ,.,'% , .. % - . .. % % - -. - -% , ,, . ,. .. ,. , .. .- . .. . -. - . . -. -. - -. , .- . . . . • , -.r

current of 100 mA. Unlike the data obtained for simultaneity in the cathode
region, which is maintained to pressures below 200 pm, the simultaneity
between the control grid and anode is lost at pressures lower than 400 pm for
the cold cathode and 600 pa for the hot cathode. Note, however, that the dc
simmer on the auxiliary grid became erratic at these low pressures. For He,
there is no differentiation in the simultaneity between hot and cold
cathodes. In each case, simultaneity is obtained for pressures greater or
equal to 1100 pm.
Another parameter of interest is the delay between discharge formation
for the grid-cathode region as compared to the control grid-anode region,
generally referred to as the anode delay time. This delay was measured by
observing emission from both a side window and a window on top of the linear
thyratron. These results are plotted in Figure 3-7 for He and R2 with both a
hot and cold cathode. The turn-on delay between opposite ends of the
thyratron for the grid-cathode space and the grid-anode space also are
plotted. The hot cathode measurements were made without a dc simmer current,
due to the tendency towards pre-fire for those conditions, while the cold
cathode measurements were made with 100 mA of dc simmer current. For helium,
the anode delay time decreases from 250 no at 500 pm to 80 ns at 2500 pm. For
hydrogen, the anode delay time decreases from 120 ns at 300 pm to 50 ns at
800 pm. At the higher pressures, the residual anode delay times for hydrogen
and helium are approximately 50 ns and 80 ns, respectively. Figure 3-7 shows
that the grid-anode discharge simultaneity for both R2 and He is within 10 ns
when the anode delay time is minimum, which also corresponds to the minimum
delay in grid-cathode discharge simultaneity.
From the results plotted in Figure 3-7, we can correlate the
simultaneity of anode discharge spreading with the anode delay time. For
operation with H2, the anode delay (unheated cathode) is less than 50 no
except for pressures 9300 pm when the dc simmer current becomes erratic. Whenoperating with a heated cathode, however, the anode delay time is less than 50
ns only at pressures above 500 pm. The grid-cathode space takes more than
50 ns to uniformly break down only for pressures below 500 pm, which is the
3-12

120 COLD CATHODE* If OT CATHODE WITH dc PRIME
10 WITHOUT dc PRIME
80 CATHODE-GRID
SIMULTANEITY
60 0 ANODE DELAY
GRID-ANODEDSIMULTANEITY. T
40
20 £ GRID-ANODEI ~NC~JSIMULTANEITY
0 1 CATHODE-GRID SIMUTANEITY
200 400 600 800 0 200 400 600 800
240
'¢ 200
20 0ANODE DELAY
160 -CATHODE-GRID
- SIMULTANEITY
120
80 A
40 -GRID-ANODE A
SIMULTANEITY -(X2)
09 500 1000 1500 2000 2500He PRESSURE (Mm)
Figure 3-7. Relationship Between Anode Delay Grid-Anode Simultaneity andCathode-Grid Simultaneity for Operation in H2 (a) and (b)and He (c). i1
,.1
.; - %~ W ~.....%~ %r , * %~*'* % N "-

point where the anode turn-on time exceeds a nominal 10-ns delay time. It
appears that if the time required for the discharge to uniformly cover the
cathode exceeds the anode delay time (the time between triggering and anode
voltage collapse), the grid-anode space will not fill with discharge
simultaneously.
A similar correlation applies to helium. At high pressure (2500 pm),
the anode delay time is nominally 80-100 ns. Below 1250 pm, the time required
for the cathode region to uniformly light exceeds 100 ns. This pressure is
the transition point below which anode simultaneity exceeds the nominal 10 ns
delay time. From these observations, we can again conclude that the
grid-anode space will fill with discharge simultaneously (within 10 as) if the
time required for the discharge to completely fill the grid-cathode space does
not exceed the anode delay. The dc simer current minimises the time for the
grid-cathode region to uniformly fill (with high density pulsed plasma),
thereby insuring that the grid-anode turn-on delay will also be a minimum.
3.5 ELECTRICAL CHARACTERIZATION
High-voltage holdoff capability of the linear thyratron was measured by
applying a half-sinusoidal voltage, measuring 2 #s FWHf, to the anode for a
variety of pressures in H2 and He. For these measurements, the grids were not
driven and the cathode was cold. The results are plotted in Figure 3-8. The
holdoff voltage increased with decreasing pressure (i.e., P*D product) as
expected since we are operating on the left-hand side of the Paschen curve.
Breakdown for these conditions occurred in the control grid-cathode gap and
presumably through the control grid slot, although the slot could not be
directly observed during breakdown. The same upper limit in holdoff voltage,
25 kV, was measured in both H2 and He. Breakdown at these points did not
occur in the gap as with the Paschen-like data, but rather as flashover across
the Pyrex high voltage insulator. This breakdown could be visually observed
through the translucent insulator. We interpret these data as having reached
a field emission limit at the triple point between the gas, insulator, and
metal body of the thyratron. Electric field enhancement is sufficiently high
3-14

100kV I I
40
4D 0 LIMI
EMISPESSURLIM2
0
U. 8-£1.0o 6 H2 PRESSURE00- 4
2-
%1kV I0 500 1000 1500 2000 2500 3000
85 04 14PRESSURE:pm
Figure 3-8. Holdoff Voltage for the Linear Thyratron inHe and H 2 '
3-15

that field emission of electron occurs, thereby inducing breakdown. This
effect is a function predominately of geometry and is to first order
independent of the operating gas, as confirmed by our measurements.
The upper limit to holdoff voltage in the linear thyratron can, in
principle, be extended. Mancebo demonstrated that holdoff in thyratrons is
dominately limited by field emission (Reference 5). By paying careful
attention to the shape of the electrodes in his device, making sure to round
edges to limit local electrode fields to less than 106 V/cm, Mancebo
demonstrated reliable holdoff to 100 kY. The holdoff voltage data in
Figure 3-8 is interesting when it is extrapolated beyond the field-emission
limit for a thyratron in which field emission had been eliminated by careful
contouring of all edges. The extrapolation indicates that for our present gap
spacing of 200 oil and a pressure of 0100 #m, the holdoff voltage would be
z100 kV in He and N70 kV in H2 . By reducing the gap to 075 mils, we could
expect to operate at 100 kV with a 300-pm pressure in helium, and possibly
that high in voltage with hydrogen at a lower pressure.
Anode voltage fall time in the linear thyratron was measured as a
function of H2 pressure and is plotted for operation with hot and cold
cathodes in Figure 3-9. When operating with an unheated cathode, a dc simmer
current was used to reduce jitter, whereas the hot cathode results were
obtained without a dc simmer current. When operating with a hot cathode, the
anode fall time is longer than when operating with a cold cathode, an effect
we attribute to the absence of the dc simmer current. The minimum current
rise time for the thyratron in this configuration is approximately 80 ns. Thecircuit inductance is M180 nH, making this current rise time the inductively
limited value.
The voltage fall time is longer than desired and indicates that the
resistance of the thyratron is relatively high. To determine the source of
the high impedance, we compared the relative voltage drops between the anode
and cathode and between the grids and the cathode. These results are
summarised in Figures 3-10 and 3-11. Figure 3-10 is a typical trace for
3-16
d,
250
I 200
HOT CATHODEE-
S150
100COLD .
CATHODE
0 200 400 600 800 1000
e5 09162H2 PRESSURE (inm)
Figure 3-9. Anode Fall Time With Hot and Cold Cathodes forAnode Voltage of 6 kV.
3-17

8
6
-4-E-- 4
O IANODE-CONTROL GRID0:>
2 ANODE-CATHODE
IDEAL-" CONTROL GRID-CATHODEK0
'..0 --
" -".. I i
-20 0 20 40 60 80 100 120
85 o9 64 TIME(ns)
Figure 3-10. Typical Voltage Traces (H2 500 #m) Indicating Large VoltageDrop Between Control Grid and Cathode.
-3-18
%
44
P4 . . " : < ., ...,.,,......" n' 4- I d- - " ' I - ' d i ' "

4
ANODE
3I
' 2
AUXILIARYAND CONTROL
1- GRID
0
0
0 200 400 600 g00
12 PRESSURE (pm)
Figure 3-11. Voltage 20 ns After Breakdown.
66 109 C7
3-19
4.,. ,;'<',.: ' ,4', '. . , .e .. , '. ..- - '..'-.- .. .... %..q

voltage between (a) the anode and cathode and (b) the control grid and
cathode, showing that approximately half the tube voltage during the first
80 ns of conduction is dropped between the control grid and the cathode. The
anode and control grid voltages 20 no after breakdown are plotted in
Figure 3-11 as a function of gas pressure in H2 . The control grid and
auxiliary grid voltages are nearly equal at this time, indicating that the
large voltage drop discussed above is between the auxiliary grid and cathode.
The large voltage drop between the auxiliary grid and cathode during
commutation, and the relatively poor high-voltage holdoff with a hot cathode
can be attributed to the control and auxiliary grid designs. The grid
configurations are shown schematically in Figure 1-2. The auxiliary grid slot
is relatively narrow. Once breakdown occurs, the small auxiliary grid slot
restricts the flow of current, perhaps even quenching in the slot, thereby
requiring higher voltages to sustain current to the anode. The consequences
of this 'first iteration' design are discussed further below.
3.6 AUXILIAIT GRID MODIFICATIONS
In the design of the auxiliary grid in the prototye linear thyratron,
most of the cathode was shielded from the control grid. Two narrow slots
directly below the control grid slots provided the conduction path from the
cathode. The flow of current was restricted and, as a result, the plasma
appeared resistive. This configuration proved unacceptable because the high
voltage sustained between the control grid and cathode during conduction
promoted discharge attachment to the thyratron sidewalls, conductors at the
cathode potential. Discharge flowing in this manner increased the difficulty
of interpreting experimental results and led to inconsistencies between
experiment and theory.
The first indication that electron emission was not limited to the
cathode was obtained from measurements of excited-atom densities in the
discharge plasma (see Section 4). We found that highest excited-state
densities were located near the thyratron walls rather than at the cathode.
3-20
;ww ~ ~ ~ IO w6 . .......................... .~ . .. . ..

Open shutter photographs of the discharge through the end vieports
collaborated the spectroscopic measurements. Photographs illustrating this
errant plasma emission appear in Figure 3-12. In the first sequence of photos
(Figures 3-12ab,c), emission is recorded from a discharge in 2000 pm of He
operating with a hot cathode. In Figure 3-12a, only the auxiliary grid was
pulsed with no anode voltage; in Figure 3-12b, the auxiliary and control grids
were pulsed with no anode voltage; and in Figure 3-12c, only the control grid
was pulsed with no anode voltage. When only the auxiliary grid is pulsed, or
when both the auxiliary and control grids are pulsed, it appears that the
discharge is emanating from the sidewalls of the thyratron. Relatively little
emission appears to come directly from the cathode. (Remember that the
stainless steel sidewalls are at cathode potential.) When only the control
grid is pulsed, the discharge appears to flow dominantly from the cathode and
through the slot in the auxiliary grid. These results demonstrate that the
anomalous emission from the sidewalls is not a result of cathode material
having been deposited there. These conditions were modeled with the plasma
simulation code LINTHY2D to determine whether electron emission from the
sidewalls would account for our observations. In summary, results from the
calculations confirmed our hypothesis. The calculations are discussed in
detail in Section 4.
More evidence for the anomalous electron emission described above
appears in Figures 3-12d,e. These are open shutter photographs of emission
from the discharge with voltage on the anode. In Figure 3-12d, both the
auxiliary and control grids are pulsed, whereas in Figure 3-12e only the
control grid is pulsed. When both grids are pulsed, emission appears to come
dominantly from the auxiliary grid-control grid gap, indicating that current
is not preferentially coming from the cathode. More emission is observed in
the auxiliary grid-cathode space only for the case where the control grid
alone is pulsed. Thus, even with anode potential present, the location where
the 'cathode' discharge strikes is determined by the P*D product of the
initial conditions.
3-21

S LCT
~~CONTROL GRID G2
lhLI SH IELD/CATH-ODE
(a) Gi PULSED
V =0ANODE
(d)
Gi, G2 PULSED Gi, G2 PULSED
(b) V AODE = 0 V AOE= 8kV
(e)
G2 PULSED G2 PULSED
*(c) V AOE= 0 vANODE 8k
8 5 0 94 15
Figure 3-12. Open Shutter Photographs of Emissionfrom Linear Thyratron (hot cathode,He, 2000 pmn)
3-22
*~ ~ ~ ~ ~ ~ ~ ~~~~~l' x-- AA -SS ~ ~ - **~ *~~~~*5~~****S5~S* .~ % ~

When the linear thyratron was opened for physical examination of the
internal surfaces, additional evidence of errant discharge behavior was
obtained. It was apparent that the discharge had attached to the thyratron
sidewall by the presence of arc marks on the steel. These arc marks are shown
in Figure 3-13. Pitting occurred on the cathode heat shield as well.
Based on the discussion above, we would argue that 'better' operation is
obtained when only the control grid is pulsed. This argument is based on the
fact that current appears to flow from the correct surfaces when only the
control grid is pulsed. However, we have already shown that uniform and
simultaneous discharge formation over the length of the thyratron, as well as
low jitter, can only be obtained by pulsing the auxiliary grid. These
observations motivated us to consider modification of the grid structures.
Various auxiliary grid configurations were considered and modeled. We decided
to bend the auxiliary grid vertically away from the cathode, thereby exposing
more cathode to the control grid. This modification was designed to steer the
discharge to the cathode and keep it from attaching to the body of the
thyratron. Figure 3-14 shows the old auxiliary grid geometry and the modified
version that we incorporated.
During this modification, the thyratron body also was modified to accept
larger end flanges, which enables mounting of larger windows to view the
entire cathode-control grid gap. Figure 3-15 indicates the field of view with
the new windows compared to that of the old ones. A photograph of the linear
thyratron with the larger viewports appears as Figure 3-16. Figure 3-17 is an
open-shutter picture of the discharge with the new arrangement, confirming
that the new auxiliary grid successfully shielded the sidewall from the
discharge, and the cathode is being fully utilized.
With the larger viewports and modified auxiliary grids, framing camera
photography of the plasma emission was repeated and we confirmed that the
walls of the thyratron were no longer acting as a cathode. Once this physical
modification in the thyratron was made and verified, the pulse forming
network (PFN) was modified. This modification was intended to allow an
3-23

Iy
Evd nc , O
of
Si.dewall Cathode
P 6 1I 99 7
Figure 3-13. Photograph Showing Arcing on the Thyratron Sidewall and on theCathode Heat Shield.
3-2
VV

OPTICA POO"OTCAL PRTO
ELECTRICA ELECTRICALPREETHROUGN FEEO1HROUG4
ANODEE ANODE
AUILAR amcmIIY01
OPICL ONEld AuiirCrdGomtyoiidAuxlirHGiODoetyGrid OD ShieldedA th-ahd rd hed hiELECsCAFECathode is now xposed
Figure 3-14. Comparison of the Old Auxiliary Gird Geometry with the New,Modified Version.
3-25

ww- . 4 - . 4 4 6. wa . a
OPTICAL PORT
NEW NODJINSULATOR
FEED THROUGH
* '-'CONTROL GRID
4 AUXILIARY GRID
- .POR FEEDTHROUGH
3-2
*4.4 saa%

4
4
,-to4
3-27

CONTROL GRID
CONTROL GRIDBAFFLE
AUXILIARY GRID
Figu.re 3-17. Open-Shutter Picture of Linear ThyratronsOperating in Helium.
3-2

increase in both the current and the dI/dt obtained from the thyratron and to
confirm that the previously measured values were, in fact, inductively
limited. The physical layout of the PFN current return path was made more
compact and the current transformer that had previously been used to measure
current was replaced with an in-line current viewing resistor (CYR). These
modifications reduced the inductance of the thyratron discharge circuit by
greater than half (180 nE 4 75 nf). Concurrent with these modifications, the
load resistor in the PFN was reduced from 2 0 to 0.5 0. Current and voltage
traces with the old high inductance and the new low inductance geometries are
shown in Figure 3-18. The peak current is approxmiately 3200 A with an10
initial dI/dt of 8 X 10 A/s. This is an improvement over the values obtained10
in the high inductance geometry of 1200 A and 1.2 X 10 A/s, also shown in
Figure 3-18 for otherwise identical conditions. The dimensions of the slotted
cathode are 3 X 10 cm, yielding an effective current density of 100 A/c: in
the low inductance geometry. Taking into consideration the addition area of
the slots, the normalized current density is approximately 50 A/ca2 . Anode
voltage initially falls rapidly from its 8 kV peak value to 04 kY in about
10 ns, then decays to a few hundred volts in 60 ns. The shorter voltage fall
time indicates a lower plasma resistance plasma with the new grid
configuration.
Due to the low switching voltage in the previous examples, we felt that
the current was still inductively limited, and that the cold emission
capability of the cathode had not been reached. To further increase the
current, the load resistor was shorted out. The current and voltage traces
for operation with the shorted load resistor are shown in Figure 3-19. The11
peak current is 5000 A with a dI/dt of 1.25 X 10 A/s. The effective current2density of the cathode is 160 A/cm
3-29

w 0
,~cr.
-4
-Z 01
LN 61 4 0 t
0 0.
I0 4"4-06 0)
zN 0 > V14.)
0)60w 00:0 c
0 1.40 -4.) r_ ia)c
E --:
FU - 4Ito to UO+
W C4
.5
00
m C00
LogCY'.1
>zo.
3-30)1

WMWu~~.u -u 1 . g ~ !X ~ ~ ~ * V . . ... . .T . •* , *. o N .
0
86 10991
Left: ANODE VOLTAGE 2 kV/div
Right: CURRENT Boo A/divHorizontal: 20 ns/divCold Cathode (20 *C)1.5 Torr Helium
Figure 3-19. Linear Thyratron Comutation Waveforms with
Shorted Load Resistor for Operation in He
at 1.5 Torr with an Unheated Cathode.
"S
3-3
'
w
? 3-31
' N~*.~*%.,..55** ..~.%~~ . .*5S

Rp- -7.
RtFEiBNCBS
1. Private conversation, R. Petr (STI) with S. Levy and S. Schneider
(ERADCOM), June 1984.
2. D. Turnquist, R. Caristi, S. Friedman, S. Merz, R. Plante, and
N. Reinhardt, IEEE Trans. Plasma Sci. PS-8: 185 (1980)
3. R.A. Petr and V. Gundersen, Lasers and Particle Beams 1: 207 (1983)
4. M.J. Kushner, W.D. Kimura, and S.R. Byron, J. Appi. Phys. 58: 1744
(1985)
5. L. Mancebo, 100-kY Thyratron Without Gradient Grids,' IEEE Trans.
Elect. Dev. ED-18: 920-924, October 1971.
,3
" 3-32

Section 4
LINEAR THYRATRON OPTICAL CHARACTERIZATION
4.1 INTRODUCTION
The physical configuration of the linear thyratron (LT) is amenable to
optical characterization by using laser interferometry. The linear geometry
provides a long pathlength, and the large optical ports allow viewing of the
entire cathode-control grid region. Hook method spectroscopy was applied to
the study of excited state densities on the linear thyratron. The detection
limit for the density of excited states using this method for our conditions11 -3
is Z10 cm . In Section 4.2, the experimental apparatus used to make excited
state measurements in the linear thyratron and the hook method are described.
Excited state densities for discharges in He and H2 are presented and
discussed in Section 4.3.
4.2 DESCRIPTION OF HOOK METHOD INTEREROMETBR
The hook method interferometer and experimental set-up are sketched in
Figure 4-1. A photograph of the experimental apparatus appears in
Figure 4-2. The thyratron was mounted on an x-y translation stage in one leg
of a Michaelson interferometer. The thyratron could be repositioned with an
accuracy of NO.5 mm. A Michaelson interferometer was chosen in order to
increase the pathlength of the probe through the plasma. An optical element
to compensate for the windows of the thyratron and to provide a method of
tilting the fringes was placed in the other leg of the inteferometer. The
interferometer was illuminated by a wide band (AX z8 A) nitrogen pumped dye
laser (pulse duration A2 ns) collimated to a spot size of 1 mm using a
two-element telescope. The N2 laser produced 150 #J of energy. The resulting
fringe pattern was dispersed by a 1-a spectrometer with a 1200 Z/mm grating
operated in second order. We used an RCA TC2011 vidicon camera as a
two-dimensional detector and recorded the fringe patterns on videotape for
later
4-1
-. , • .. .\.. .. .' : :,* .'* ,**;* .',,, ,'

U,
I0Z
z0
-J 0
0 u
- 30
U 4-2

A. ~.. *~ ~-*~ - A. - ~ = - -. - -
I.'4,4361
4'U6)
In
a
1A96)436)
~ii1 / 6)lb.
S4'Ft *
U
6,Ill
I UU
4)3~~~
4)
(~*4
V
6)
I.'
'p
I
3.,

analysis. A 1.0-1.5 neutral density filter was required before the
spectrometer to avoid saturation of the vidicon.
The duration of the dye laser is sufficiently short that the
interferometer records an 'instantaneousO value of the excited state density
(actually averaged over 2 ns). A time resolved measurement is obtained by
delaying the dye laser with respect to the current pulse on successive firings
of the thyratron. The system jitter is at best 5-10 ns, largely due to the
jitter of the thyratron. The first indication of the thyratron acting'poorly' is for the jitter to grow to many tens of nanoseconds. When this
occurred, the thyratron was flushed a few times with fresh gas, and jitter
returned to its lower value. Time and spatial resolution is obtained by
setting at a particular spatial location and obtaining interferograms at many
delay times, changing the spatial location, and repeating the process. An'x-y' map of excited states for time to is obtained by interpolating the time
resolved measurements.
A typical fringe pattern obtained from the interferometer is shown in
Figure 4-1 and is obtained by tuning the wide band dye laser to overlap the
transition of interest. An excited state density is obtained from the fringe
pattern by measuring the distance (in wavelength) A between the extrema of the
'hooks" in the interferograms and applying the relation (Reference 1)
N [4.1]3r
where N is the number density of the excited state, f is the oscillator
strength of the transition, ro is the Bohr radius, P is the pathlength, X is
the wavelength of the transition, and k is the order of the interferogram.
This order is obtained from k = pX/AX, where AX is the wavelength separation
between p fringes.
4-4

V" - L, . a a a -
4.3 BXCITBD STATB DENSITIES IN THE LINBAR TIRATIONWITH *NON-OPTIMUM' GRIDS AND COMPARISON WITH THEORY
Excited state densities during a discharge pulse were first measured in
the prototype thyratron equipped with the small windows. Even though the viewof the plasma was somewhat limited (see Figure 3-15), quite useful information
was obtained, which was later used to modify the grids of the thyratron. The
first measurements were of the 23 P state in helium at a pressure of 900 #m
with the thyratron switching 8 kV. The auxiliary and control grids were
pulsed, and a dc simmer current was used with an unheated cathode to minimize
jitter. The dye laser was tuned to 5876 A, and the spectrometer was operated
in second order.
Current and voltage waveforms for the experimental conditions appear in
Figure 4-3. Contour maps of the density of the He 23P excited state appear in
Figure 4-4. Since the effective lifetime of this state may be long compared
to the duration of the current pulse, due in part to radiation trapping, the
measured densities are an indication of the time integral of the local
excitation rate for populating that state and, by inference, of the current
density. In Figure 4-4 at 20 nas, the current appears to flow through the
auxiliary grid slot and is directed towards the control grid, but not in the
direction of the control grid slot. By 40 ns, current is dominantly directed
towards the control grid slot. Note that there are two local regions of
excited state maxima: in the auxiliary grid slot and below the control grid
slot. In the frames for 60, 80, and 100 ns, we see a widening of the current
density and a relatively large current density to the left of the auxiliary
grid slot, indicating that a large fraction of the current flowing to the
control grid and control grid slot is not originating through the auxiliary
grid slot. The peak of the current occurs at 0100 ns. During the fall of the
current, the local maximum in excited state density returns to the region just
above the auxiliary grid slot.
We attempted to repeat the measurements for the same conditions while
operating with a hot cathode. When operating with a hot cathode, however,
4-5
%4.

= vl~ vv w- -I -.P.r =-IW P. 777 7 =a
CURRENT -
(100 A/6)
VOLTAGE(2 kV/div)
- S0 nsf6
@E 220.06
Figure 4-3. Current and Voltage Waveforms for Conditionsof Hook Spectroscopy Results (He 900 um).
4-6
fn M
3v
44
U - a
4-7
CC
04 N
S 1 4
S S N
*4-8

N q0C L0
x
* 0
CC
%no CC
44-9

- - 4 4 CC)
c Ix
1 rm
-2-q
ex
ID
4-10

jitter was too large to obtain meaningful data. To reduce the jitter to
acceptable values (<5-10 ns), we had to raise the helium pressure to
M800 pm. The hook spectroscopy measurements were repeated at this pressure
with a hot cathode. The experimental setup and operating conditions were
otherwise identical to those described above, except that no dc simmer current
was used.
Contours of the He 23p excited state density for the linear thyratron
operating in helium at 1800 pm pressure with a hot cathode appear inFigure 4-5. The density of excited states is approximately equal to those
measured with the cold cathode, having a maximum value of approximately12 -3
5 X 10 cm . Unlike operating with a cold cathode, there does not appear to
be a 'striker' between the cathode and control grid that would indicate a
breakdown initially in that direction. Breakdown appears to be fairly uniform
(t = 20 ns) with some higher density of excited states near the control grid
slot. As time progresses (t = 60 ns), regions of higher density appear near
the auxiliary grid slot, but in a direction close to the wall of the linear
thyratron and not towards the control grid slot. At progressively later
times, the density of excited states becomes more uniform and does not display
the type of gradients observed with the cold cathode.
The excited state densities plotted in Figures 4-4 and 4-5 are
disturbing with respect to the unexpected unformity of the excited states as a
function of position within the LT. We would expect a great differentiation
in the spatial dependence of the excited states as a consequence of the
directed flow of current from the cathode through the control grid slot. This
pattern of current flow was not observed. The evidence of anomalous electron
emission suggested that additional information could be obtained by using aframing camera to examine plasma emission. That study was described in
Section 3.4. The results of that study, combined with the results of the
spectroscopic measurements described above, motivated us to change the
configuration of the auxiliary grid. It was during this modification that
larger windows were installed on the linear thyratron (see Figure 3-16).
4-11
: . .fA~s , %. % .-. .. -. . ,-.. % f .. t .. -%.ft N *, ,.-,. .. "..

raw it r~lw. IF mp 'IF "Ul l -.- 0
0
NJo
In
0 D 0 0
0;u0.10 1CD~~ C4-.
64016
41L uu u
c C0 Aj
ofm -4 w-
0
x I.D
3, re..
x U
4W
'3S
41 3
4-12 0

- tk tt~~bK-
2A
C4
0
%D4
. WI
C> 1aE- el
ini
Waa
4-13

CI
o
0
3
44
a 'I
C4 co S 4
%D
exA
41
4-1~4

tS -z W. Ir. -. W. V%.---.W-1 ' - -. a
One conclusion of the study was that electron emission was occurring
from the sidewalls of the thyratron. This possibility was investigated by
using the linear thyratron simulation code LINTHY2D. In the model, the
sidewalls are treated as a conductor at the cathode potential; however, no
electron emission is usually allowed to occur there. The effect of electron
emission from the sidewalls on the electron density and distribution of
excited states was investigated with the model by allowing some fraction of
the 'cathode' emission to emanate from the sidewalls. For purposes of
demonstration, this fraction was arbitrarily chosen to be 0.5. The location
for this electron emission from the sidewalls was randomly chosen between the
cathode and control grid planes. Electron density without and with electron
emission from the sidewalls appears in Figure 4-6, and the He excited state
density for the same conditions appears in Figure 4-7. The approximate field
of view of the experimental measurements is indicated. The model results with
electron emission from the sidewalls are in much better agreement with the
experimental measurements than otherwise identical conditions without sidewall
emission.
4.4 EICITED STATE DENSITIES IN THE LINEAl TIATRON
zWITH NOPTIMUM' GRIDS
With the new larger windows on the LT, virtually the ENTIRE plasma
region could be observed. Measurements of the density of the He 23P excited
states as a function of time and position were repeated with the low
inductance geometry. These results are shown in Figure 4-8. The current and
a voltage characteristics for these conditions are shown in Figure 3-18 for the
low inductance geometry. The maximum excited state density is approximately12 -3
6 X 10 cm and occurs within the baffled region near the control grid slot.
The local current density at this time is 900-1000 A-cm-2 . Excited state
densities behind the auxiliary grid were barely at the detection limit11-3
(<10 1cm maximum value). This indicates that there is no significant amount
of current flowing between the wall of the linear thyratron (a conductor at
the cathode potential) and the auxiliary grid. Excited state densities are
small immediately adjacent to both the lower portion of the control grid and
4-15
.a,

3St 101 3/cm 3
0
S
SI 2.14 1 2.9.
"99
OBSERVATION PORT
38 10~ 3/cm3
0
~s7iN CONTROL GRI i0 r 3
0e
e e 07 1 4 2 1 2 8 3,5
AUXILIARY GRID
* 85 094 19
WITH SIDEWALL EMlSSION
Figure 4-6. LINTHY2D Results for Electron Density.
4-16

3 so- 2.5 x 10 1 2 /cm 3
0
N
C
I0
o Be 6 76 1.48 216e 2.88 3 58POSITION (CM)
WITHOUT SIDEWALL EMISSION
3 2.5 x 10'2/crn~
0
I .. I
00
POSITION (CM)
85 094.20 WITH SIDEWALL EMISSION
Fiqure 4-7. LINTHY2D Results for He* Excited State Density
4-17

A~ - - -
-0
E))
e
8 E)
0000
0 07
ID W W W CDCD 44
_ _ _ _ _ _ _ _ ~ K _ _ _ _
I~r CL I IVE a - E) E) N
u (1) CD
9 E)
0,-a , _E)
4-1

near the auxiliary grid. A line of high density of excited states sits above
the cathode a distance that approximately corresponds to the negative glow as
observed with the framing camera. Since the cathode is operating cold,
electron emission is not dominantly thermal and, therefore, one would expect a
sheath and negative glow near the cathode. Other than the baffled region near
the control grid, the highest density of excited states was observed near the
vertex of the control grid, extending down from the baffled region. Results
from our plasma simulation model indicate this is a region of locally high
space charge.
The delineation between the highly excited region and the relatively
lowly excited region is quite sharp, and the time dependence of the excitedstate densities in the two regions is different. In Figure 4-9, excited state
densities are plotted as functions of time for two locations: adjacent to the
control grid and 00.5 cm away from the control grid (in the direction of the
auxiliary grid). The excited state density adjacent to the grid has a higher
maximum value and has a time dependence similar to the total current. The
offset between the extrema of the excited state density and current is due to
the finite lifetime of the excited state. The excited state density further
from the grid increases only during the first few tens of nanoseconds. We
interpret these results as indicating that the current flows nearly uniformly
through the region in front of the control grid slot early during the current
pulse when the grid voltages are high. Later during the current pulse when
the anode and grid voltages are lower, current flows dominantly near the
control grid. Only qualitatively similar results for the time dependence of
the excited state density were obtained with the lower current density, high
inductance geometry. These results are shown in Figure 4-10. The peak
current is 1200 A maximum at 100 ns. There appears to be a more rapid decline
from the maximum for the more highly excited region as compared to the less
excited region, although the difference is minimal. The effective lifetime of
the excited states is longer for the case with lower peak current, implying
that the dominant quenching mechanism is by electron collisions.
4-19

,,,.,BAFFLE4-
3- CONTROLGRID )
2-
CATHODEJ
POSITION (cm)
4000E
04 CURRENT 3200
z 3- / 2400 ;.w z
0 i 0
w cc2- / 1600
0 0 40 60 8 -0 100 0
TIME (ns)
Figure 4-9. Hie 23P) Density at Locations Adjacent and 0.5 cm from the
Control Grid.
4-20
MAN,"

0AjU
0 .
N, 04 Aj
10 C14 -.
0
I 0v r_
00 0 0Go
U' @0
II 0
0 t-E-0
0 (4)
0- 000
ODo*0' 5~
4-214

The radiative lifetime of the transition examined is 15 ns; however, it
terminates on a metastable level, making it susceptible to radiation
trapping. Locations immediately adjacent to a surface will be less likely to
be radiation trapped than in the center of a large volume. This effect,
however, does not explain the behavior observed in the high inductance
geometry where both locations are far from a wall. The second possibility is
that either the radiating level or the metastable level participating in the
radiation trapping are being quenched in a non-radiative fashion more quickly
in the high current density region as compared to the low current density
region. Quenching by electrons can occur by either superelastic collisions or
by excitation (or ionization) out of the state. To account for our
observations, the rate of quenching must be on the order of7 -l
ner = 1/50 ns = 2 X O1s . For a typical electron quenching rate constant of-8 3 -I i14 -3
5 X 10 cm s , the electron density would need to be 5 X 10 cm , which
qualitatively agrees with theory.
If we assume that the rate of excitation of the state is proportional to
the current, we can show that the effective lifetime of the state is equal to
the offset in time between the maximum of the current and the maximum in the
density of the excited state (see below). The effective lifetime 7 is given
by 1/ = 1/Tr + 1/Tc, where the subscripts denote the radiative and
collisional lifetimes. The 23P state in He is radiatively coupled only to the
23S state with a lifetime of 100 ns. The effective lifetime given by the
expression above for the location near the grid is 020 ns. Therefore,
quenching of the state must be dominantly non-radiative. Away from the grid,
the lifetime of the state is 070 ns, close to the radiative lifetime.
*- Assuming non-radiative quenching is dominated by electron collisions, the
* longer lifetime and lower maximum excited state density away from the grid
implies a lower current density.
Hook spectroscopy measurements of excited state densities with the
thyratron operating in hydrogen were performed. The density of the 2S excited
state of atomic hydrogen was measured by operating the interferometer at
4-22

t.
6562 A, the B transition. This state, denoted B*, is most likely populated
by one of three mechanisms:
e + H2 H + H* + e Dissociative Excitation [4.2]
e + H H* + e Direct Excitation [4.3]
H 4 H + h P Radiative (or Collisional) Cascade [4.4]
Due to the finite lifetime of the excited state, the instantaneous density of
the state is a function of the time integral of the instantaneous rate of
excitation. To first order, the instantaneous rate of excitation is
proportional to the local current density. However, any analysis is
complicated by the fact that the two dominant rates of excitation,
dissociative excitation of B2 and direct electron impact of H, are linearly
proportional and quadratically proportional to the local current density,
respectively.
Experimentally measured H 2S excited state densities measured with our
hook interferometer are shown in Figure 4-11. Results are plotted as a
function of time at three points in the thyratron. The locations of these
three points are shown in the schematic at the top right corner. Also plottedin Figure 4-11 is the absolute value of the current through the thyratron.
The excited state densities are in the mid-101 2 cm 3 . The excited state
density near the control grid slot has the larger value, an indication of the
current density being higher there as the plasma begins to constrict toward
the slot. As the plasma becomes more diffuse nearer the cathode, the excited
state density decreases. Note that the excited state densities 'rebound' as
the current rings after 110 ns. Measurements were also made at a third point,
shown by the triangle in the schematic, a few millimeters above the cathode.
The excited state density at this point was generally below the detection
limit of the interferometer for this transition (0.1 X 10 12cm-3 ). Only asingle measurement above the detection limit could be made at this location.
4-23
a. ". ., . .. .,,W, ,. -

~wy~~w -~ ~w~iwiw j -j "YW. ~.PV J.F FW7.7 .* Y- Z
00
('A v N 4
4W
.6 00-
0*0
CD.
U)
I- CD
4) laic
0 is
>4
00, -
U)
"4
IA I'~ 4 '--
(v-wZ1) IISlZ3
4-24

The peak in the measured excited state densities lags behind the peak in
the current by approximately 20 ns. A similar time lag was observed in
excited state measurements in He. This lag can be understood and predicted
with a simple model for the time dependence of the excited state density.
Assume that the rate of excitation of the excited state is proportional to the
total current and that the excited state has an average lifetime r. For the
first half-cycle of the current pulse, we can approximate that the current
I(t) i Iosin(ut - At), where At is an offset from zero, obvious fromFigure 4-11. The time rate of change in the density of an excited state N is
then
dli Ndt AoI sin(wt - At) - N [4.5]0
where A is constant of proportionality between current and excitation rate.
Solving Equation [4.5] for N(t) and setting N(t < At) = 0 we obtain
AIN(t) = o [4.6]
[sin(wt - At) -wecos(wt - At) + Weexp, -At
For a half-sine period of 100 ns (w = 3.14 X 10 7s - ) and 7. = 22 ns (radiative
lifetime), the excited state density as given in Equation [4.6] has a maximum
value at t = 82 ns. This time, shown in Figure 4-11 with arrows, is in good
agreement with the experimentally measured time at maximum. This simple model
shows that the lag in excited state density with respect to the current pulse
is simply a result of the integrating effect of the finite lifetime of the
state.
-..
'.
~4-25

UFEUMRCRS
1. W.C. Marlov, Appi. Opt. 6: 1715 (1967)
4-26

Section 5
CURRLBNT DENSITY MEASUREMENTS
5.1 INTIODUCTION
In its present configuration, the linear thyratron (LT) is an excellent
test stand to measure the electron emission capability of dispenser cathodes.
We define the maximum current available from a cathode of the type employed
here as that current when the discharge makes the transition from a glow to an
arc. The evidence of this transition is a sudden drop in the voltage across
the control grid-cathode gap. Since the thyratron has numerous optical
viewports, it is possible to visually monitor the onset of arcing and thereby
unambiguously determine the current density at which arcing occurs by
correlating the observation of arcing with the simultaneously measured V-I
characteristic. In the past, arcing was determined only by monitoring the
control grid voltage during commutation; if the grid voltage dropped suddenly,
an arc was said to have occurred. This detection scheme was suspected since
an independent (i,e., visual) verification that arcing had occurred could not
be made. In these studies, it was not entirely clear that the suddenly
observed voltage drop was due to a cathode arc. For example, the voltage drop
could have been caused by an arc to a grid or to a heat shield. Having the
ability to visually observe the arc enables us to measure when and where an
arc forms and to correlate the observation with changes in the V-Icharacteristics.
5.2 CURRENT DENSITY MEASUREMENTS
To make the current density measurements, the configuration of the LT
was not physically changed from that of previous studies. However, the energy
storage pulse forming line was replaced with a two- or three-stage PFN with
nominal characteristics of C = 70 #F and r = 50 #s. The additional
capacitance was added to the PFN in order to insure sufficient current to
reach the arcing limit. A framing camera, observing through one of the large
5-1
* -1.--.-'.,.-..-.- - - -.. - -. -.. ;. . . .-. . . . -. -..-. . , . , . . .

end windows, was employed to visually record the onset of an arc and to
confirm that the arc took place at the cathode surface. The framing camera
rate was adjustable and the duration of a single exposure was typically
200-400 ns, depending upon the emission intensity. Once a reliable
correlation between visually observed arcing and the simultaneous V-Icharacteristics was made, a set of framing camera photographs was not taken
for every voltage trace recorded. In this manner, the rate of data
acquisition was increased. Periodically, upon recording a "suspect' V-I
trace, the framing camera was employed to confirm that an arc had taken
place.
A framing camera photograph of the control grid-cathode space during a
discharge pulse in the LT is shown in Figure 5-1. A hot spot is visible
emanating from the center of the cathode. Simultaneously, the voltage across
the control grid-cathode space showed a large drop, which we believe confirms
that a cathode arc has taken place. A sequence of two framing camera
photographs, their timing pulses, and the cathode-grid voltage are shown in
Figure 5-2. The top trace of the oscillogram is the grid voltage and the
bottom trace shows the timing marks of the camcra. The bottom camera exposure
corresponds to the leading timing mark and shows a diffuse discharge. In the
second camera exposure, taken after the drop in grid voltage, an arc on the
cathode can be clearly seen. Thus, we conclude that the grid voltage
discontinuity indicates a cathode arc.
After establishing the onset of cathode arcing, we measured the emission
capability of our dispenser cathode for different temperatures, gases, and
rates of current rise. The current pulse for the higher rate of current rise
*trials (1 X 10 9and 2 X 10 9A-s- ) was sinusoidal; the current waveform for
8l-
the lowest rate of current rise (5 X 10 A-s ) was made more rectangular byemploying a two-section, pulse-forming network. The shapes of the two current
waveforms used are shown in Figure 5-3.
Using the method described above, the currents and current densities at
which we observed arcing at the cathode as a function of cathode temperature
5-2
NO taken
for veryvoltge t~ce ecored. n ths maner th r *eofdt

.4,
-s
' I
pi 85 09921
' Figure 5-1. (a) Framing Camera Photograph of Cathode Arc." (b)rcControl Grid Voltage Showing discontinuity of Onset of
5'5-
1%

A"-194 L11 LINEAR THYRATRON(U) SPECTRA TECHNOLOGY INC PELLEYUE 10 2/3CUSHNER ET AL. 31 JUL 87 AFWAL-TR-97-20S0
F33615-64-C-2474UNCLASIFIED F/ 9/1 "L
EEuhEEnnilEiiumEhEEE/BhEB|hEIEIIIEEEEEEEEEEllllEEEEEEEllEEEEIIEEEEEEEEEImE/lEEE/llEEE/

LI.23 2236
1111M-
:1111.251111. 16
OyRF A-" 'N? TEST CHAR1T
NA-OAL SUA(Au. OF STADO&S-.q&3-
%
. ~ :; , C. % %
U ~ VV.4/~'~ d~ ?A% a' \~,. ~~"" * ~*

Frame 2(Arc)
Frame I(Dif fuse)
Framing Camera Photographs
85 09922
Top: Control Grid Voltage (50 V/div)
Bottom: Timing Pulses for FramingCamera Photographs.
Figure 5-2. Framing Camera Photographs Confirm Cathode Arc.
5-4

waveform for 1 x 10⁹, 2 x 10⁹ A/S
Waveform for !L e5 x 108 A/S
Top: V GRID (50YV/DIV)
I.85 09923 Bottom: CURRENT
Figure 5-3. Current Waveforms for Current Density Measurements.
5-5
* ~ ~ i W .* ~ - ~ (rf I **r ol r %% ~

in hydrogen are plotted in Figure 5-4. These measurements were made at
constant pressure. Therefore, the gas density decreases approximately as
1/Tcathode . The current density of the cathode is based on an effective area
of 60 cm for our cathode, including the area of the slots. The current
density based on the transverse dimensions of the cathode would be twice as
large. The arcing current was found to be a function of the rate of rise of
the current pulse. In general, the dispenser cathode can support higher peak
currents before arcing with higher rates of current rise. A weak temperature
dependence was measured, at most a factor of two between 300 K and 1300 K.
The lower rates of current rise had a large temperature dependence. The
time-to-arcing for the cathode as a function of temperature and rate of
current rise is shown in Figure 5-5. For the indicated rates of current rise,
the cathode diffusely supports current for 15 ps at most.
The weak temperature dependence of the arcing current implies that
thermal electron emission is responsible for only a small fraction of the
observed current; that is, a non-thermal mechanism is responsible for a major
fraction of the electron emission. The most likely candidate is field
emission. However, because the time scale of interest (many microseconds) is
long enough for ions to transit the sheath, we cannot currently rule out
secondary emission mechanisms. Assume that the non-thermal and thermal
emission contributions to the current are additive and that the non-thermal
contribution to the current is independent of temperature. Doing so, one can
compute an effective 'work function' cw for the cathode by solving
w
I(T) = I NT + IT e
where INT is the non-thermal contribution to the current and IT is the thermal
contribution. Since there is a different slope for I(T) for each rate of
current rise, there is a different 'work function' for each rate of current
rise. Using the data for dI/dt = 109 A-s-1, we obtain INT = 75 A/cm2
IT = 167 A/cm2 and ew = 0.18 eV. The fact that the arcing current is
sensitive to the rate of current rise implies that there may be some
5-8

A/cm2 kA
10.. 150
15005o
2x10 9 A/S
-Z o 6 100
w"w 1xIo 9 A/sU4
50 6-- U - ~ 02 m 202- dI 5x0 8 A/S
dt
0) - 0 - -
0 400 600 800 1000 1200 1400
CATHODE TEMPERATURE (K)
05 09924
Figure 5-4. Cathode Arcing Current vs. Temperature in Hydrogen (300 sm)for Different Levels of dI/dt.
5-7

I
15 dl 1X0 9, 5XI08 A/S
- 0
x - -.11 -1- - - n
Hd - 2 x 10⁹ A/S
0 - A- - ' I I I I
0 400 600 800 1000 1200 1400
CATHODE TEMPERATURE (K)4 85 09925
Figure 5-5. Time to Cathode Arcing (H2, 300 pm).
5-8
I I p , IV % ---- ....... . .V V .~ I~%* % % ~ j

time-dependent heating mechanism of the cathode that also must be considered.
To determine whether the arcing limit of the dispenser cathode is
sensitive to gas density in hydrogen, the measurements shown in Figure 5-4
(constant pressure) were repeated at constant gas density. For these trials,
it was assumed that the gas temperature was approximately equal to the cathode
temperature. The gas pressure of the LT was adjusted to keep gas density
constant according to the ideal gas law. The arcing current as a function of
cathode temperature at constant gas density is shown in Figure 5-8 for
dI/dt " 5 X 10⁸ A-s-1 . The results are nearly identical to the data in
Figure 5-4 for constant pressure. For constant voltage and current, the
electron temperature is most likely inversely proportional to gas density.
The fact that we obtained a null result for the change of arcing current as
the gas density changes (constant pressure vs. constant density) appears to
rule out an electron temperature dependence on arcing current.
The cathode arcing limits in helium and neon also were measured for
dI/dt N 5 X 10⁸ A-s-1 and are presented in Figures 5-7 and 5-8. The slopes of
these curves are steeper than the hydrogen data, implying that when operating
in helium and neon, there is a larger effect of cathode temperature on the
arcing current. To the extent that heavier atoms heat (damage, sputter, or
otherwise react) with the cathode to a greater degree than do light atoms
(provided the ion transit time through the sheath is short compared to the
time of interest), then these results are consistent with the transient
heating mechanism suggested above. Further analysis must clearly be performed
to delineate what emission mechanism is consistent with our data. Clearly,
the surface morphology of the cathode will be an important consideration.
In their work on oxide cathodes, the Russian researchers have noted that
the level of sparking current is dependent on the potential drop in the
cathode region (Reference 1). They argued that arcing current varies directly
with cathode potential, so lower voltage drops across the grid-cathode region
result in lower arcing current limits. They also noted that arcing was more
frequent at the end of the current pulse when dI/dt was a minimum or negative,

A/cm2 kA
100- 6
b4
S so-- -II
22
o o--/, I I i I0 400 600 800 1000 1200 1400
CATHODE TEMPERATURE (K)
450 600 750 900 1050
8£ 09926 GAS PRESSURE (Oim)
Figure 5-6. Cathode Arcing Current for Constant H2 Gas Density.
%
5-10
~ .. ~ -~~- ~- .-

ARCING CURRENT
A/CM kA300 Unn Ne
167 - 10 -
150
133 - 8
116
100 6
83
66 4
50
33 2
16 1..
200 400 600 800 1000
CATHODE TEMPERATURE -C
% 85 09927
Figure 5-7. Arcing Current vs. Cathode Temperature for 300 #sm Neon.
5-11
A~v' S' s.' 'S .%'"S%

ARCING CURRENT
A/cmA2 kA 1 Torr He
167 - 10 -
150
133- 8
116
100 - 6
83-
66 - 4
33 - 2
16 1-
200 400 600 800 1000
CATHODE TEMPERATURE 0 0C
* 85 09928
Figure 5-8. Arcing Current vs. Cathode Temperature for 1 Torr Helium.
5-1.2

and grid-cathode potential also was a minimum. A similar trend is observed
here for dispenser cathodes. The grid-cathode voltage when arcing occurs for
different cathode temperatures is noted in Figure 5-4.
Goldberg et al. reported similar results, as cited in the Russian works
for cathode arcing (Reference 2). Cathode arcs were not observed during the
rising portion of the current pulse, which implied that field emission or ion
bombardment mechanism contributed heavily to the current. Goldberg summarized
the work of other investigators by reporting that the rate of current rise is
relatively unimportant to the cathode. This conclusion conflicts with our
data. Although we have no viable model for low temperature cathode emission
at the present time, it appears that dI/dt, cathode potential, and cathode
temperature are all related to low-temperature electron emission.
5.3 EMISSION IBCIANISKS
From the results discussed above, we found that there is at best a weak
dependence on initial cathode temperature for the maximum glow current density
sustained by our dispenser cathode. There was, however, a dependence on therate of current rise. We suggested that the emission mechanism may be
initially by field emission and subsequently by thermal emission as
dendritic-like structures on the surface were heated by ion bombardment. This
suggestion was based on the hypothesized existence of similar dendritic
structures on the surface of our cathode, as had been observed on other aged
dispenser cathodes (Reference 3).
An estimate can be made for the required size of the dendrites on the
surface in order for the transient field emission to thermal emission
mechanism to be valid. For field emission of electrons, an electric fieldemission of a1 MV/cm is required, which for our voltages requires a featuresize of 10 pa. Assume that the surface of the cathode is covered by
cylindrical dendrites of radius rd, height hd, and surface density Pe. Also
assume that the average current density is j, the voltage drop at the cathode
is Vc, the heat capacity of the surface material is x, and current is carried
5-13
SV

only by the dendrites. The rate of temperature rise of a dendrite is then
______ 2or(T -_ ) _ _ _ _pJVrc T rd (T - T)adt wr r d 2
Ps rdhd 2h 2
where a is the thermal conductivity of the dendrite, a is the Stefan-Boltzmann
constant, and T. is the ambient surface temperature. The thermal constants
for tungsten are 9 0 2.6 J-cu -K and a P 1.64 cm -s . For purposes ofdiscussion, choose j = 100 A/cm2 , Vc = 50 V, and hd/rd = B. The dendrite
temperature at the end of a 5-ps current pulse ( j(t) = j IR(t/2ps) ) as a
function of rd and fractional surface coverage is shown in Figure 5-9. The
results are scaled by the parameter (x/xc)f where xc is the heat capacity of
crystalline tungsten and f is the fractional surface coverage of the
dendrites. The heat capacity of polycrystalline materials is generally lower
than crystalline materials. The structure of the dendrite-like material found
on aged dispenser cathodes may not be single crystals and, therefore, would
have a reduced heat capacity (and thermal conductivity) from their single
crystal counterparts. The size of dendrites as measured from the work of Petr
and Gundersen (3) is indicated. A final temperature of "800 K would be
required for significant thermal emission. For these conditions, (x/Xc) 1%
is required for transient heating to be important during a single current
pulse. If 9 0 Xc, then the surface coverage is 51% and the subsequent current
density violates the Child-Langmuir criteria. Therefore, if transient heating
is important, x must be less than sc. These results are for a single shot and
for a cold cathode. Obviously, high repetition rate operation and a heated
cathode will result in higher dendrite temperatures.
The next logical step would be to make scanning electron
microscope (SEM) photographs of our cathode to determine dendrite size andcoverage. This procedure would require demounting the cathode or chipping off
a, a piece of it, and both options were deemed too risky (with respect to
damaging the cathode) at this time. Therefore, SEW photographs were not
obtained for our cathode. However, we did obtain a piece of similar cathode
5-14 -,
% Z&_- /I IdL

2000 HI
0,1600 K
1200
E-4
z BO
4001 LPETR GUNDERSEN4
DENDRITE RADIUS (imn)
p. 6 0 3 3 9F q - . C a l c u l a t e d D e n d r i t e T e m 3e r t u r e a t E n d o f 2 s
cur en Pulse (100 A l c
5-.15
.4,'#

material from the cathode vendor (Spectramat) and took SEM photographs of the
surfare. This cathode material was not activated nor aged. The surface
morphology is the 'before' conditions of our cathode and would not be expected
to have large dendrite formations. The SEL photographs are shown in
Figure 5-10. As expected, there are no dendrites on the surface, as observed
by Petr and Gundersen, but there are some surface features. Figure 5-10a
shows a typical surface feature with sise of 1-2 pm. The surface coverage of
these features, as shown in Figure 5-lOb, is quite low (05%). The surface
features consist of both 'spikes' and Iholes.' An enlargement of a 'holel
between grains is shown in Figure 5-10c. The diameter of this 'holes is02 pm. SEL examination of our cathode must wait for the end of this program
when an autopsy of the tube will be performed.
4-16
:%*

* -. .. -
a) 4050x
b* St.~P SL84
-'r
W
c) ~I~ 8400x
Figure 5-10. SEM Photographs of Dispenser Cathode
Material
J 5-17

REFERENCES
1. Fogelson, Breusova, and Vagin, Pulse Hydrogen Thyratrons, pp. 81-89,
translated by SCITRAN, 1482 E. Valley Road, Suite 15, Santa Barbara,
California 93108.
2. S. Goldberg et al., Hydrogen Thyratrons, Final Report, Signal Corps
Contract DA36-039 SC-15372, p. 164, March 1951.
3. R. Petr and M. Cundersen, 'Field Emission Cathode for High Power Beams,'
Laser and Particle Beams 1: 207 (1983)
5-18
r -* , .... .~ "* * - -':, -. . . .. .. . . .d l.mtmm m lmnmm m m m m m

Section 6
DESIGN OF TIE 100 k MODIFIED LINEAl TUIATIONCONCEPTUAL DESIGN OF TIN SCALED-UP 100 kY TTITRiON
6.1 INTRODUCTION
The motivation for developing the linear thyratron (LT) is, in part, to
be able to scale thyratrons to higher currents by simple length scaling. The
prototype linear thyratron has provided encouraging results with respect to
this scaling. By operating the auxiliary grid with approximately 2 mA/cm2 of
dc current, the cathode-control grid gap will fill with high density plasma
along its entire length when pulsed simultaneously (to within 5 ns).
Simultaneous and uniform cathode coverage has been obtained in both hydrogen
and helium at pressures between 0.3 and 2.0 Torr. The assurance of cathode
current uniformity is important since non-uniform coverage may result in local
values of current density that exceed the glow-arc transition. These findings
indicate that it may be possible to build a significantly longer device with
the ability to switch hundreds of kilomperes.
Future switch requirements specify operating voltages of approximately
100 kV per gap. Commercial thyratrons are available which operate at these
voltages; however, they employ gradient grids that divide the total potential
across several gaps. Each gap supports 40 kV, a generally accepted upperholdoff limit for commercial tubes. The use of gradient grids has certain
disadvantages: multiple grids increase the length of the thyratron envelope
housing, thereby increasing the inductance of the tube; multiple gaps
dissipate more energy during comutation than do single gaps; and tube
fabrication is greatly complicated when using more than a single gap.
The relatively low value of holdoff per gap (<40 kV) found in commercial
tubes does not necessarily result from violations of Paschen's law but results
primarily from other material and structural causes. Commercial manufacturers
........ .

aM'rrW.W W WV
-
.~ 7 a a = V S t S~ * .
often use stamped metal parts in the high voltage region, which may or may nothave been deburred. This results in sites where local electric field
enhancement is excessively high and electron field emission is a problem.
Recognising that commercial manufacturers do not tailor electrode edges to
avoid excessive electric field enhancement, Mancebo hypothesised that higher
holdoff voltages could be obtained by careful contouring of parts in the high-
voltage section (Reference 1). Subsequently, Mancebo built several triode
thyratrons, taking care to round electrode edges to keep electric field
enhancement to less than 10' V/ca, and successfully operated his prototype
devices at 0100 kV.
The work of Mancebo demonstrated that single-gap thyratrons can operate
reliably at high voltages if design and thyratron manufacturing techniques are
adhered to. This philosophy has been applied to a conceputal design for a
linear thyratron that will switch voltages of approximately 100 kV and
currents of approximately 50-100 kA. Future pulse power requirements are
unclear at this time, but it is known that those requirements will exceed the
specifications of currently available thyratrons. To establish a set of
criteria for this design study, we have selected the following parameters as
design goals:
1. Anode Voltage 100 kV
2. Anode Current 100 kA
3. Pulse Width (r p) 0.3#s < T < 3#s
4. Burst-mode Repetition Rate 100 Ha-lO kHs
5. Anode Delay Time Drift (Arad) 50 ns
6. Jitter 5 ns
A conceptual design for a modification of the prototype LT and for a scaled-up
LT that will meet these requirements is summarized in the following sections.
6-2
b ! .~TiZQ.-y'

6.2 CATIODB SIZING
The conceptual design for the scaled-up linear thyratron calls for use
of an unheated dispenser cathode similar to that in our 10-ca-long prototype
device, which has been used unheated in several other experimental tubes
(References 2,3). Our measurements have shown that unheated cathodes of this
type can conservatively support, without arcing, 150 A/cut during microsecond
discharge pulse duration. However, lifetime data are lacking. The longest
lifetime test for a dispenser cathode has been conducted with a modified
ECBG HY-7 thyratron. During this life test, the thyratron has switched up to
40 kV and 40 kA, with a 10-ps pulse length at 100 Es. The thyratron has been
in the field for over 4 years and there is no sign of cathode failure or
degradation (Reference 4).
To supply 100 kA of current, the cathode area of the scaled-up linear
thyratron must have an effective area of approximately 650 cm. The word'effective' is used to distinguish the surface area of a slotted cathode from
the product of its transverse dimensions. For a 1-m-long device using a
slotted cathode, this implies an active cathode width of W6.5 ca/a, where a is
the fractional increase in surface area due to the slots. This dimension is
consistent with the approximately 8-cm-diameter anode/insulator specified
below by thermal considerations. Vendors are able to supply dispenser cathode
assemblies of these widths with lengths up to 20 cm. Approximately five such
assemblies would be required for the 100-cu device supporting 1 ka/ca.
8.3 NIGH-VOLTAGE INSULATOR
One practical difficulty in fabricating a meter-long thyratron is thehigh- voltage insulator. Conventional thyratrons use cylindrical insulators
whose axis is perpendicular to the cathode emitting surface. The insulator
for the present linear thyratron uses a similar geometry where the insulator
is a 'stretched cylinder' or hollow rectangle (see Figure 6-1). STI has
developed techniques to fabricate large ceramic vessels for the walls of the
LSX fusion reactor facility at STI by fritting together large pieces of
6-3
. . .

85 0964.9
*Figure 6-1. Conventional Insulator Geometries.
6-4

ceramic or glass (Reference 5). The frit material is electrically and
mechanically similar to the host materials being joined so, in principle, it
should not degrade the voltage standoff of the insulator. A design
verification test of such an insulator has yet to be performed and
conventional materials must be considered first. Generally quarts, ceramic,
and Pyrex glass can support an electric field at the surface in air of
20 kV/ca and many times that in vacuum (see below).
A schematic of the high-voltage section for a conventional rectangular
insulator appears in Figure 6-2. Due to imposed constraints, we will use this
geometry for the high-voltage modification of the prototype LT. The electric
potential between control grid and anode for a conventional rectangular
insulator having a dielectric constant C = 5 is plotted in Figure 6-3. A
well-designed high-voltage section will minimize the electric field parallel
to and at the surface of the insulator in order to minimise the probability of
surface flashover. The parameters that can be varied to minimise the surface
electric field are listed in Figure 6-2. We have already discussed the
importance of rounding the edges of the control grid and anode to minimise the
probability of field emission leading to surface flashover. We specify a
*. minimum radius of curvature of 0.15 cm (60 mil) for the edges of the control
grid and anode to insure that the electric field at the edges is <106 Y/cm.
The remaining parameters that can be varied to minimise the electric field
stress on the insulator are insulator dielectric constant, thickness, gap
height (above ground plane), and insulator-anode gap. Parameterizing these
values, we found that the surface electric field stress was relatively
insensitive to the dielectric thickness and to values of the dielectric
constant C greater than 3.0. However, the field stress is sensitive to both
the insulator-anode gap (d) and the gap height (h), as shown in Figure 6-4.
The field stress increases when the gap approaches either the ground plane
(H = 0 cm) or the high-voltage plane (H = 8 cm) due to compression of the
a.' lines of electric potential near those planes. The design point for the
modified high voltage thyratron is shown in Figure 6-4 as the open circle.
-A 6-5
.5 5 * 5 *!.* . . .

ANODE
- INSULATOR
d d ANODE-INSULATOR GAP
U. eg ANODE-CONTROL GRID GAP
tH t INSULATOR THICKNESS
-- h GAP HEIGHT (ABOVE GROUND PLANE)
H INSULATOR HEIGHT
h ~ R aEDGE RADIUS OF CURVATURE.
CONTROLGRID
Figure 6-2. Orientation Sketch for Critical Dimension for theRectangular Geometry Insulator.
8 6 109 7 7
6-6

44
0 4 a86 10986
C
3.6-
41
1.8
0 183.6cm
Figure 6-3. Potential Contours for the Rectangular High-VoltageInsulator.
6-7

INSULATOR GRID/ANODE DISTANCE (cm)
900 0.1 0.2 0.3 0.4 0.5E F
~80-
70
60-w
00'
I-I460(0w
06 1123042%
Figure 8-4. Maximum Electric Field on the Surface of the High-VoltageInsulator f or Gap Height (h) and Anode-Insulator Distance
6-8

.p4- . V. - S w*%
A new thyratron configuration is required that will minimise the
probability for flashover across the high voltage insulator and reduce
fabrication costs. A schematic of such a design is shown in Figure 6-5. In
this design, the longitudinal axis of the cathode, grids, and anode are
aligned coaxially within a cylindrical insulator. In conventional thyratrons
that use a cylindrical insulator, the cathode surface is usually perpendicular
to the axis of the cylinder. Therefore, to increase the current rating of the
thyratron, the diameter of the insulator must be increased. To increase the
current rating of the Collinear Cylindrical Linear Thyratron (CCLT), only the
height (length) of the cylindrical insulator must be increased. Quarts,
Pyrex, and ceramic cylinders measuring up to 20 cm in diameter and 3 m in
length are commercially available and minimise fabrication costs and
complexity, particularly when compared to the racetrack insulator. Class- or
ceramic-to-metal feedthroughs penetrating both the dorsal and ventral surfaces
of the insulator are used to gain electrical access to the cathode, grids, and
anodes. For current conduction of 01 kA/ca of length, the diameter of the
anode will be approximately 8 cm and the insulator will be approximately
8.5 cm in diameter. These dimensions are largely determined by thermal
dissipation requirements (see Section 6.5).
A similar analysis as undertaken for the rectangular geometry will be
required to optimize the potential distributions in the CCLT. Due to the
relatively large diameter of the insulator tube,-the optimuL spacings and
radii will be similar. The most important parameter will be the dielectric
constant of the chosen insulator. Typical values of the surface flashover
strength (pulsed) in air and vacuum for a variety of candidate insulator
materials are listed in Table 6-1.
6.4 TIE CONTROL GRID SLOT REGION
The design of the control grid baffle region is particularly difficult
p.. to optimize. The goals of the control baffle optimization are to maximize
-: holdoff, dI/dt, and 1switchability while minimizing switching losses.
Unfortunately, these are contradictory goals. The former goal is obtained by
C" or If d-- '- ".

ANODE FEEDTHROUGHS
ANODE
END PLATES
SEALTHYRATRON
CONTROLGRID
INSULATORTUBE
85 09651
CATHODECATHODE FEEDTHROUGHS
Figure 6-5. Long Cylindrical Thyratron Design Concept Where InsulatorTube Contains Anode, Cathode and Grids.
6-10
. t..-..,. -. % "j*% -..%.N% % '.j.* '. .- 4, .X . <,, ., .- ' ' .. ................. d, , , ' " la .~~~5 5,...- .*. 4% i

Table 6-1
SURFACE FLASHOVER STRENGTH (ky/cm) t
Material Dielectric Constant Strength
Vacuum Air (1 atm)
Teflon 2.1 103.3 25.0
Plexiglass 3.2 123.0 23.7
Quartz 3.8 86.0 29.0
Pyrex 4.8 111.0 24.5
Jacor 5.8 125.0 24.5
Sapphire 12.0 84.0 18.7
%
a..
..
a- .

tight baffling while the latter goals are obtained by loose baffling. The
purpose of tight baffling is to reduce, to an acceptable value, the
penetration of the anode potential through the control grid slot. The degree
of penetration of the electric field is denoted by 7 = VA/VB, where VB is the
potential at the edge of the baffle. A minimum requirement is 7 = 10. An
optimum baffle design is one that obtains this attenuation while maximizing
the smallest gap (either the control grid slot or the baffle-control grid)1%J
dimension. It is the smallest gap dimension that will in large part determine
the resistivity of the control grid-anode gap. In Figure 6-6, we have plotted
the electric potential for three baffle configurations: conventional
(Figures 6-6a) and modified (Figures 6-6b and c). The contour corresponding
to the lowest electric potential corresponds to an anode attenuation of
7 = 106. The modified baffle arrangements maintain the necessary attenuation
while increasing the minimum gap size.
The attentuation coefficients of several comercial thyratrons and
Mancebo's device are listed in Table 6-2 with their maximum holdoff voltage.
A lower coefficient means that more of the anode field penetrates into the
grid-cathode space, which should result in lower holdoff voltage. The
attenuation coefficient for Mancebo's thyratron is significantly lower than
the HY-5 (i.e., more field penetration) but it holds off more voltage. The
conclusion is that field emission is responsible for the lower voltage holdoff
in the HY-5. A tube with careful control of field emission can be more
loosely baffled, yet hold off higher voltages than one more tightly baffled
but not having adequate electrode contouring.
The proposed high voltage section for the modified high-voltage linear
thyratron is sketched in Figure 6-7. The anode attenuation factor was
parametrically computed for this configuration to bound an acceptable range of
dimensions which yield 7 10. The design point dimensions determined from6.5
this survey also are listed in Figure 6-7. A conservative value of 7 = 10
was chosen for the design. A sample of the parametric results appears in
Figures 6-8 and 6-9. The attenuation factor increases linearly proportional
to increases in either the baffle overlap or the control grid thickness. The
6-12

Table 6-2
BAFFLE ATTENUATION COEFFICIENT AND VOLTAGE HOLDOFF
Tube I Holdoff Voltage
HY-7t 3 x 10 20 kV
4HY-1802 5 X 10 35 kY
fy-5 7 x 10 65 kV
Mancebo 2 x 10 100 kV
t Lower Section
36-13
%- A
II

C.)
Ur)
C) 0
0
tb4
00
W44ko 0
A. 4r -I,
40 C
ot
£00
S. aa
I._ _ _ANODE Dc0;
U 4pP0 .4
P4 14 b0
43944
to .R- a, O-
CD. CD
CY CD
6-14
P5

2Control 1Gridb
d 0
2
Point Design Dimensions
Symbol item cm
9 Anode-control 0.25Grid Gap
a Slot 0.25t Control Grid 0.5
Thicknessb Baffle Setback 0.21 Chaninel Width 1.6d 0 Baffle Overlap 0.33
Figure 6-7. Schematic of High-Voltage Section and Legend for ModifiedLinear Thyratron Dimensions.
6-15

ts Control Grid 7hickness
0.2 0.3 0.4 0.5 0.6 0.7
Design Point
0
00
Fiur 8-.Eeti il eerto AtnainFcosaFnto
of~~d Baffle Overlap (ca) onrlGi hikes()
6-16

BAFFLE GRID DISTANCE (cm)0 0.1 0.2 0.3 0.4
109
108-Z SLOT0
7-o DESIGN POINT
110
5-00
q0
10
130 0.1 0.2 0.3 0.4 0.5SLOT SIZE (cm)
06 1962%
Figure 6-9. Electric Field Penetration Attenuation Factor as a Functionof Slot Size (s) and Distance Between Control Grid andBaf fle (b).
6-1

attenuation factor decreases with increasing baffle offset or slot size,
though less than linearly. When the baffle offset or slot size become
sufficiently large, field penetration is limited by the baffle overlap.
6.5 URNAL CONSIDSIATIOS
The degree of sophistication of the design for thermal control of the
CCLT depends in large part on the average power the device is expected to
switch. At this time, we envision the tube operating at 200 Es for a short
burst of many tens of pulses with a repetition rate of a few Ns. Assuming the
switching of 100 kV at 100 kA and that the thyratron is 95 percent efficient
during commutation, the waste heat in the thyratron will be approximately
30 kW or 300 W/ca. Water-cooling the electrodes should suffice (see below).
Both anode delay time drift and jitter are largely a result of anode heating,
which changes the local gas pressure in the control grid-anode gap.
Generally, the anode delay time Arad can be kept to less than 50 no if the
variation in anode temperature is <200 K. By operating with an unheated
cathode, both hrad and jitter are minimised, since the thyratron envelope and
grid structures are not additionally heated from this source. (Thyratrons
fitted with cold dispenser cathodes and operating with Arad of 40 ns and a
jitter of 2 ns (Reference 2) have been reported.)
To determine the cooling requirements for the CCLT, we used the geometry
in Figure 6-10. The anode is constructed of flat stainless steel plate of
thickness ts welded to a half cylinder of stainless steel with a diameter d
tubing forming the IDI shape shown in the figure. The center of the 'Do forms
a flow channel for cooling water. The control grid has N slots of width s
separated by a distance C. We assume that the anode is uniformly heated in the
region illuminated by the control grid slots and that both ts and w are <<P.
To insure that the thermal stress on the anode is a minimum, the local
surface temperature is a minimum, and that the coolant contact area is amaximum, the face of the anode must be isothermal. This condition is met if
the time required to locally heat the metal is less than the characteristic
6-18
-A A

d
IMod
Pathi (typical)
Figure 6-10. Schematic of Anode and High-Voltage Section for the CCLTShowing Current Paths Through the Control Grid.
* 6-19

thermal conduction time; that is
2t wt c(AT)
where a is the thermal diffusivity, c is the heat capacity, AT is the
temperature rise, and P is the linear heating rate of the anode (W/ca). The
thermal diffusivity of stainless steel is 0.04 cm'/s and its heat capacity is
03.6 J/cmO -K. Using as a maximum value AT = 200 K and P = 300 W/ca and noting
that N = D/w and E = D/N, then we must have 2.5 << Dts/w2. The limiting
dimensions are approximately given by Dts/wt = 25. We can further set an
limit on w by requiring that the maximum current density through the slots be
approximately 1-2 ka/ca'. For our example, w A (0.5-1.0)/N cm and we choose a
mid-range value for our calculations. A scaling map for anode thickness tsresulting from these specifications is shown in Figure 6-11 where anode
thickness is plotted as a function of anode diameter D and number of control
grid slots N. Desirable ranges for D and ts are indicated by the dashed lines,
showing that two control grid slots are required. To insure that the flat
portion of the anode is isothermal, we choose ts = 4 mm and D = 8 ca. These
parameters yield w = 4-5 -m and E = 4 ca.
We now estimate the flow of water required to limit the temperature rise
of the anode to 200 K from ambient, or 500 K. Since the anode is isothermal,
we can specify that the inside surface of the flat portion of the anode is at
this temperature. The heat flux that must be transferred through this surface
is P/D W/cma. The heat transfer coefficient for a fluid over a surface is
approximately hc = Nu 0 k/D where N-i is the Nusselt number and k is thethermal conductivity of the fluid. Assuming laminar flow over a flat plate,
Nu 0 0.66 RePrO05Pr0 .3 where Re is the Reynolds number based on length and Pr
is the Prandtl number. Assuming an inlet temperature of 290 K and an outlet
temperature of 350 K, the average Prandtl and Reynolds numbers for water are
Pr M 4.0 and Re a 135 uL where u is the flow velocity (cm/s) and L is the flow
length (L = 100 ca). With k = 0.0064 W/cm-K and u = 200 f/Dt ca/s (f is the
water flow rate in gallons/minute), we have hc 10 •f /D2 W/cmt -K.
6-20
-P % ooW W
:W . , ' , . ... ,'5 € r. .. 'wL .',. ' "_" "_ . '." ". . kbii k-k , mlhll li msm s d m% - " ' " - "' " "" *1) ' ""

2.5
2.0-
g W-°2
,I *~1.5 =
N= 1
i.0 N3N 3
5o.
.
Iq I00 8 12 13 20
Anode Diameter
Figure 6-11. Anode Thickness as a Function of Anode Diameter for NControl Grid Slots.
6-21
.pa,' ,,. ,*.-,?- ,': .",- *. ,..".'. ,.,-; '''- .r; v,, . .. .,:. -.. .. ..... ;..,...-...... . ... ?......

Therefore, the rate of heat transfer yields
_ h(T aye) 2'05(To - T v)[.2D D D 62
where T 8 is the surface temperature (500 K) and T ave is the average water
temperature (320 K). With P = 300 W/cm and D = 8 cm, f $3 30 gal/minute, a
large but not unreasonable value. Note that f a P' so that increasing the
efficiency of the thyratron greatly reduces the coolant flow rate.
* -22

IEFJnNCBS
1. L. Mancebo, 100-kY Hydrogen Thyratron Without Gradient Grids,' IEEE
Trans. Elect. Devices ED-18: 920-924 (1971)
2. Long-Life Nigh-Current Thyratrons for Fast Discharge Lasers, Spectra
Technology and Impulse Electronics, Final Report, Contract
AFWAL-TR-84-2003, March 1984.
3. S. Friedman, R. Petr, J. O'Connell, and J. McGowan, "Instant-Start
Cathodes for High Average Power Hydrogen Thyratrons,l IEEE 15th Pulse
Power Modulator Symposium, pp. 127-132 (IEEE, New York, 1982)
4. S. Schneider, Final Report on Delivery Order No. 0715 between Battelle
S" Columbus Laboratories and S. Schneider, Prepared for Pulse PowerTechnology Branch, U.S. Army Electronics Technology and Devices
Laboratory, Ft. Monmouth, New Jersey, November 1984.
5. Spectra Technology, Inc., 'FRC High Flux Formation and Large S Physics
Studies: TRX/LSX,' Submitted to DOE Office of Fusion Energy, Div. APP,
Advanced Fusion Concepts Branch, 28 February 1985.
N
.g
6-2

I.
S.
.4
* ,US
- : ~V~~~%N' ~ ~ ~-~U-~'.~w.5
::..v -IgS...-.. U- S -S -, *4 '

Section 7
LINE.AX TKYiATION PLASMA SIMULATION CODE: LINTIY2D
7.1 INTRODUCTION
The rapid development of thyratrons has traditionally suffered from lack
of design and analysis tools. Three phases during thyratron switching require
analytical or computational support: holdoff, commutation, and conduction.
Computer codes that solve for the electric field exist for analysing
conditions during holdoff, (Reference 1) and recently published discharge
kinetics models describe thyratron characteristics during conduction
(Reference 2,3). Models previously have not been available to analyze the
commutation phase of thyratron switching. This deficiency results from the
fact that during commutation the gas pressure ( 1 Torr), voltage ( 50-100 kV),
and electrode spacing (51 cm) are in a parameter space in which traditional
methods of analysis cannot be applied. For example, the geometry is
complicated (i.e., non-planar), resulting in a nonuniform electric field; the
mean free path of electrons is sometimes comparable to electrode separations;
and the relative rate of change in the electric field can be comparable to the
rate of plasma formation.
A plasma simulation code has been developed to model the linear
thyratron during the holdoff and commutation phases of switching. The purpose
of the model is to aid in the analysis of experimental data and to provide a
design tool for modifying the linear thyratron and for designing new
thyratrons. The plasma simulation code, named LINTHY2D, is a self-consistent
2-1/2-dimensional, time-dependent treatment that is capable of modeling
electron avalanche in an arbitrary gas and in an arbitrary geometry. LINTHY2D
uses a Monte Carlo particle simulation to model electron transport, and a
continuum formulation to model heavy particle transport. An electron
multiplication and renormalization technique is used to explicitly model
electron avalanche using the particle simulation. A modified null
7-1

cross-section technique is used to allow collisions with excited states, ions,
and electrons during the avalanche when these densities may change by many
orders of magnitude. Poisson's equation is solved to obtain the spatially
dependent electric potential. Current and voltage characteristics are
obtained by integrating with the plasma simulation models for the external
circuits for the auxiliary grid, control grid, and energy storage circuit.
In Sections 7.2-7.8, the plasma simulation model LINTHY2D will be
described. The model has been validated by comparison to the experimental
current and voltage characteristics for the prototype linear thyratron, and to
the distribution of excited states measured by hook spectroscopy. These
comparisons will be discussed in Section 7.9. Scaling laws and a discussion
of tradeoffs of operating characteristics of thyratrons generated with the
results from LINTHY2D are discussed in Sections 7.10-7.11.
7.2 NACROELECTRONS AND IHNORMALIZATION
The goal of the plasma simulation is to model the electron avalanche and
current flow through a linear thyratron while using a reasonable amount of
computing resources. The change in current density during the electron
avalanche implies a change in electron density of 105-101 4c -3 . To model this
process using Monte-Carlo techniques, particles used in the simulation have an
assigned weight corresponding to a specified number of electrons and are
called macroelectrons. As the electron avalanche develops, the weights of the
macroparticles are renormalized to keep the number of macroelectrons in the
simulation to a manageable sie. This renormalization procedure, similar to
that used by Kline, (Reference 4) is described below.
The simulation begins with N0 macroelectrons released from the cathode,
each having a weight Wo (see Figure 7-1). The weights of the electrons are
I/(eN0 At) where I is the instantaneous current and At is the length of time
over which the No electrons are released from the cathode. Trajectories and
collisions for these macroelectrons are computed. When an ionization occurs,
another macroelectron is added to the simulation with a weight equal to the
7-2

V.)
39
+ +
U) 0
Z~ ~ N .4
-4 '-4
33
6- 1. W V' 'A 441 44b ~ 'I
N ++00
3
00
00 113 2
7-

weight of the macroelectron that had the ionizing collision. Periodically
macroelectrons are released from the cathode, not necessarily having weight
W0 , thereby increasing the number of mscroelectrons in the simulation. If a
macroelectron is collected by a grid or electrode, its weight is summed to
obtain the grid or electrode current, and the collected macroelectron is
removed from the simulation. When the total number of mscroelectrons exceeds
a pre-selected value N am, the simulation is interrupted for renormalisation.
The total weight of the macroelectrons is summed. N macroelectrons are then0
randomly selected and their weights are summed. The unselected macroelectrons
are removed from the simulation. The ratio of total weight to the weight of
the selected electrons yields a renormalization factor. The weight of the
selected macroparticles is multiplied by this factor, thereby insuring
conservation of charge. The simulation then proceeds with fewer but heavier
macroelectrons. The normalisation procedure is separately performed within
different regions of the thyratron to insure that the distribution of total
charge in each region is not significantly perturbed by the renormalisation
process. The number of macroelectrons fluctuates between N and N during0 max
the simulation. Typically these values are 4,000 and 12,000, respectively.
The electron density is obtained by summing the weights of the
macroelectrons within a given computational cell. The electron density is
then EWi/AV, where AV is the volume of the cell. To improve upon statistics
and smooth the electron density, the macroelectrons are assumed to have a
finite size and shape (Reference 5). The contribution of a macroelectron to
the electron density in a particular cell is proportional to the fractional
overlap of the finite particle into that cell. The macroelectron is typically
a parallelepiped having dimensions equal in size to the computational cell.
7.3 BXTENDED NULL CROSS-SBCTION TBCHNIQUB
During Monte Carlo simulations of electron collisions in electric
discharges, it is often convenient for all electrons to appear to have the
same collision frequency. This is accomplished by use of a null cross section
(Reference 6). In using the null cross-section technique, the maximum
7-4
% % % %N N "N

electron collision frequency for the energy range of interest, va, is
determined (see Figure 7-2). For each electron energy, a null cross section
is calculated such that when this cross section is added to the real collision
cross sections, the resulting collision frequency is equal to V." During
the simulation, a collision is said to occur during a time At if for a random
number r1 (0 < r1 < 1), At k -P.n(rl)/Omax. If this inequality holds, another
random number r2 is selected. A real collision is said to occur if
r2 I /v, where va is the real collision frequency; that is, the electron
collision frequency in the absence of the null cross section. However, if
r2 > ma/mmax, a null collision has occurred and the particle proceeds
unhindered. If the collision is real, the specific type of collision (e.g.,
elastic collision, electronic excitation) is determined by selection of a
third random number, r3 . The ith collision is said to occur if
Vi1 < r3*z'a Svi, where Pi is the collision frequency associated with the ith
possible collision at the energy of interest.
During an electron avalanche in a device such an the linear thyratron,
the relative densities of the species with which the electrons collide can
change significantly as a function of either position or time. This change in
density results from electron collisions exciting or ionising the gas.
Therefore, the electron collision frequency and the type and number of
possible collisions also change an a function of position and time. For
example, near the slot in the control grid of the thyratron, the fractional
excitation and ionisation can approach 0.1, making collisions with excited
states, ions, and electrons important processes. When initially calculating
the Yj and Ymax, the densities of excited states and ions are zero. As the
density of collision partners changes, many evaluations of cross sections
might be required to revise the Yj and Pmax appropriately. To circumvent this
problem, a new extended null-cross section technique was developed.
The extended null cross-section technique is implemented by including
cross sections for collisions with all anticipated collision partners in the
* initial computation of the Yj and max (see Figure 7-3). To do so, we must
estimate the maximum possible density that each of the collision partners
7-5
. ~ ~ ~ ~ ~~ ~ ~~~~.V 1. 9 - - ., - ,--- ,-----

"max YES NO
r DISREGARD2 No
V~e DISREGARD'max COLLIDE
8 5 0 94.5 1
Figure 7-2. Schematic of Conventional Null Cross-Section Technique. ris a random number (O<r>l) and v is an electron collisionfrequency.
7-

0
U)
z E-0z
0z U
W0 d
0 0 U)
00
00 >4) w 21.-*4 P-4
aa . 00
en 0
go 0 *-I
A .,4 0-'-44
x 00
E 14h 2h
0
z. 0-,4
ob
0-4
7-70
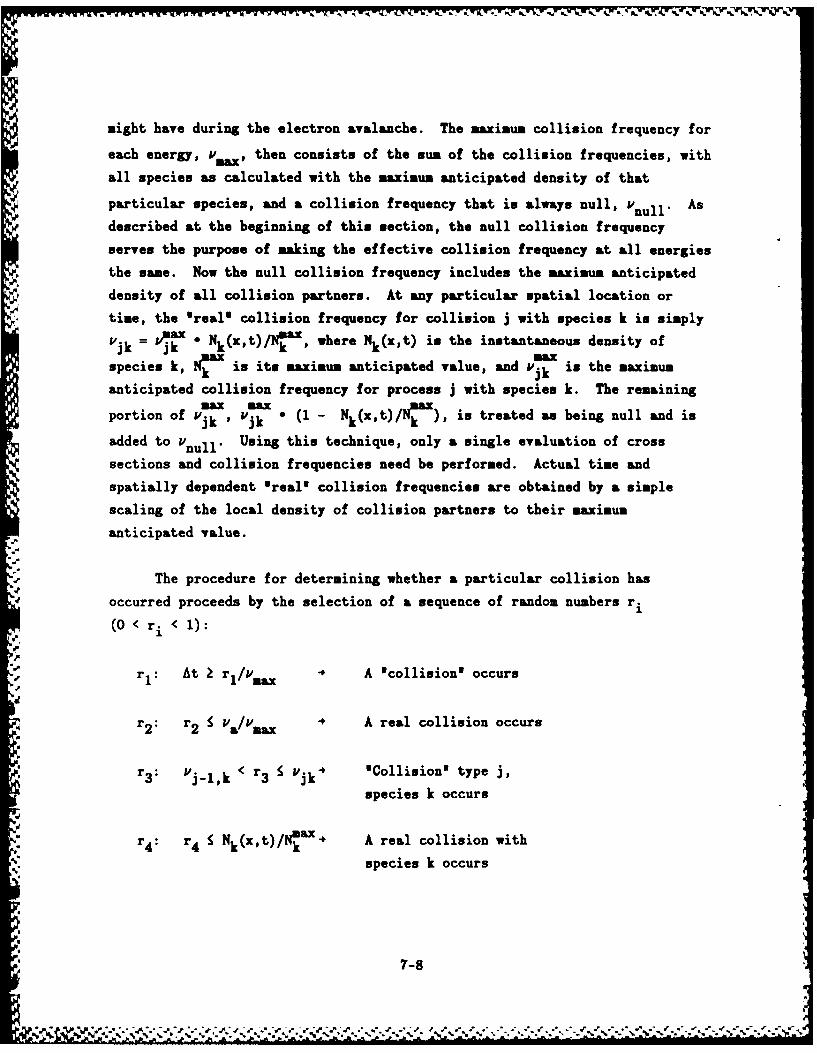
might have during the electron avalanche. The maximum collision frequency for
each energy, PMax, then consists of the sum of the collision frequencies, with
all species as calculated with the maximum anticipated density of that
particular species, and a collision frequency that is always null, vnull" As
described at the beginning of this section, the null collision frequency
serves the purpose of making the effective collision frequency at all energies
the same. Now the null collision frequency includes the maximum anticipated
density of all collision partners. At any particular spatial location or
time, the 'real' collision frequency for collision j with species k is simply
P = x * Nk(x,t)/Nax, where Nk(x,t) is the instantaneous density of
species k, N" is its maximum anticipated value, and Pik is the maximum
anticipated collision frequency for process j with species k. The remaining
portion of Pjk jk (1 - Nk(x,t)/N .), is treated as being null and is
added to Ynull" Using this technique, only a single evaluation of cross
sections and collision frequencies need be performed. Actual time and
spatially dependent 'real' collision frequencies are obtained by a simple
scaling of the local density of collision partners to their maximum
anticipated value.
The procedure for determining whether a particular collision has
occurred proceeds by the selection of a sequence of random numbers ri
(0 < ri < 1):
r1: At rl/v max A 'collision' occurs
r2 : r2 Pa&/max * A real collision occurs
r3 : Pj-l,k < r3 S ik 'Collision' type j,
species k occurs
r : r4 Nk(x,t)/NOx4 A real collision with
species k occurs
* 7-8

-.--- -b~
By appropriate normalization of the collision frequencies and number
densities, we can use a single random r for all the r, through r4 described
above.
7.4 EXCITATION PROCESSES AND CROSS SECTIONS
In the simulation of electron avalanches in noble gases, four states of
the gas were included: the ground state, a single total excited state, and
singly and doubly ionized atoms (see Figure 7-4). The following electron
impact excitation reactions were used:
e + M (* ) 4 M (* ) + e electron-neutral elastic scattering
e + V 4 M+ e electron-ion elastic scattering
e + eae 4 e aye e electron-electron scattering
e + M 4 M * + e electronic excitation
e + V M + e electronic superelastic relaxation
e + if M + ionization
e + U 4 M 2+ e +2e double ionization
e + M if+ e *e excitated state ionizationS
e+ H i* radiative recombinationM++ M+
e+U K
2e + If+ if* + e collisional radiative recombination
2e + M++ + i+ + e
In the reactions above, i is the ground state of the noble gas, M* is the
7-9

M + +S - -- - - ~ .,2es-'.. ..-
M+
e S
M (TOTAL EXCITATION)
e
e
777 177777 4---
85 09 450
Figure 7-4. Schematic of Electron Impact Processes in Model.
7-10 1k

total excited state, and M+ and M2 + are the singly and doubly iouised atom,
respectively. The subscripted electron, ea, denotes the secondary electron in
an ionisation. The $average' electron is denoted by eave and will be
discussed below. The inclusion of charged particle collisions is particularly
important because the plasma can become highly ionized (00.1) near the control
grid slot during conduction. At such times, the current density is locally
constrained by electron-ion collisions.
Calculations were performed for electron avalanche through helium.
Neutral elastic scattering cross sections for Be were obtained from the
compilation by Hayashi (Reference 7). The cross sections for elasticscattering from charged species, both electrons and ions, were obtained in
analytic form from Uitchner and Kruger (Reference 8).
aee = a ei = 41b0 n 1 + [7-1]
where the subscripts ee and el are for electron-electron and electron-ion
collisions, respectively. XD is the Debye length and b0 is the impact
parameter for 90* collisions
1/2 e2
VD n ee2 b m a y4 2 [7-2]
The electron mass and velocity are m. and ye, respectively. To evaluate this
cross section and the collision frequency with charged particles, the electron
temperature (Te), electron density (ne), and ion density are required. The
ion density is obtained from solution of the heavy particle conservation
equations, discussed in Section 7.5. The electron density and temperature are
obtained in the following manner. During the simulation, the spatially
dependent electron density is periodically calculated by summing a sequence of'snapshots' of the location of the macroelectrons taken at pre-set intervals.
An effective electron temperature also is computed in this manner by setting
Te = 2e/3k where e is the average electron energy. The most recently summed
7-11

U!
values for electron density and temperature are then used to calculate ae and
aei. A range of ne and Te must be estimated before the simulation in order to
provide sufficient working null space in the ee and el collision frequencies.
When an ee collision occurs, the collision partner is assumed to be the
average electron; that is, an electron with a velocity randomly selected from
a Maxwellian with temperature Te. In this manner, the electron distribution,
in the absence of other collisions, will relax to a Maxwellian.
When available, the total excitation cross section of the atom was used
to compute the rate of excitation of the lumped excited state M*. The sum of
the 21P and 31P excitation cross sections was used for helium (References 9,10). The superelastic cross section was calculated from the excitation cross
section by detailed balance. Cross sections for ionization of the ground
state atoms for electron energy S 1000 eV were obtained from Rapp and
Englander-Golden (Reference 11). The fraction of the ground state ionization
cross section attributable to double ionization was obtained from Stephens
et al. for helium (Reference 12). The semi-empirical cross sections of Vriens
were used for ionization of the excitated state (Reference 13). Cross
sections used for these calculations for helium appear in Figure 7-5.
Each cross section was assigned a degree of anisotropy with respect to
the angular distribution of the scattered electron. The electron was assumed
to scatter isotropically in the azimuthal direction. That is, the azimuthal
scattering angle is 0 = r * 2r, 0 < r < 1. The probability for scattering
through the polar angle 0 was assumed to have the form
p(O) a rom .) [7-3]
When m = 0, the scattering is isotropic; when >> 1, the scattering is
dominantly forward. A plot of p(O)dO appears in Figure 7-6 for different
values of m. The randomly distributed scattering angle 0s is obtained from
Equation [7-3] by normalizing the differential scattering probability to unity
for scattering in the range 0 Os x, and inverting the integral (Reference
14). The scattering angle is then given by
7-12
46 V 4...
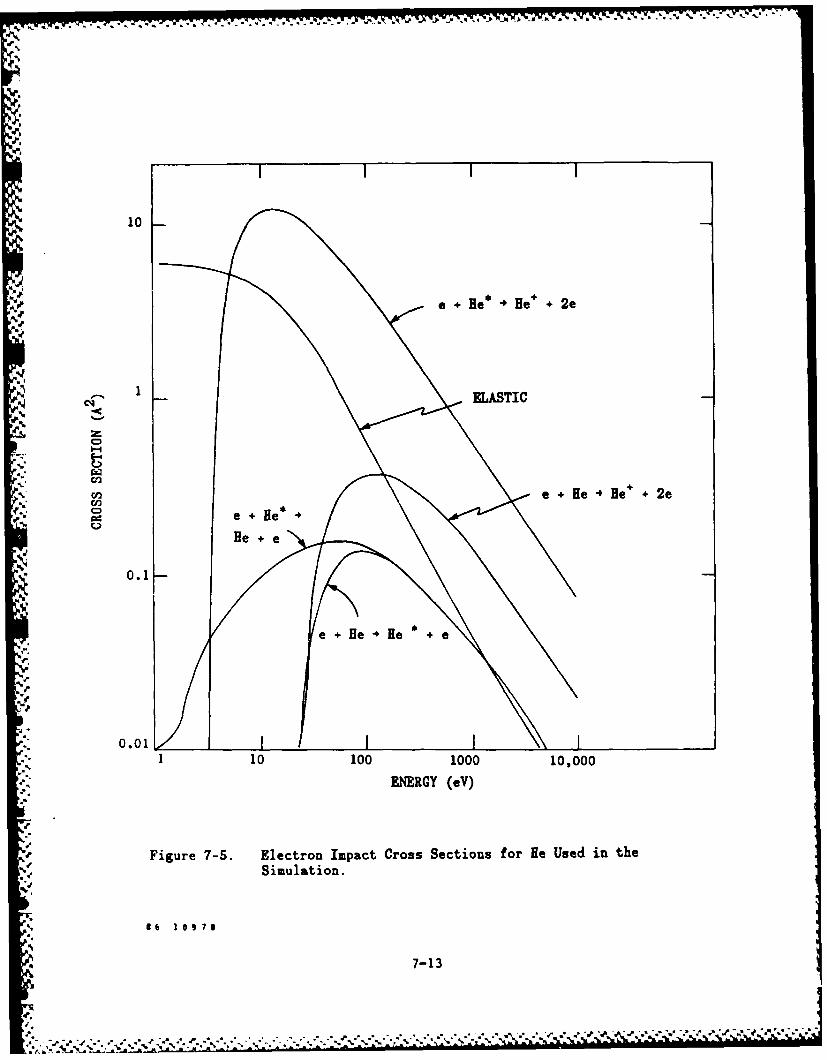
10
I I
'e He* B+e+ +2e
N" M-EASTIC
W", e H e He+" 2e
N e + He*-,rBe ++
ee+He He +2e0.1
1 10 100 1000 10,000
S ENERGY (eV)
Figure 7-5. Electron Impact Cross Sections for He Used in the.5
Simulation.
8 6 1 0 7S
7-13

4',
1.0
.h4
., 0.6-EgMao
U
0.5E
o.2.0.0C:
0 0.2 0.4 0.6 0.8 1.0
SCATTER ANGLE (6/r)
Figure 7-6. Fraction of Electrons Scattering into Polar Angle 0 forDifferent Isotrophy Factors m (m = Isostropic, m>>1 ForwardScattered).•
Sm
The quantity plotted is o(6Wd. (M+)cosm (2)sined
r(e) sin~de4
7-1
. .. A/ + I + ! '

- -- - - ,. F~p.A~p -' - --.. - . - . . . . . . .
2 =2cos-1 [ - r)(m + 2 (7-4]
where r is a random number between 0 and 1. The value of m t 3 was typically
used when information on the differential form of the cross section was not
available. Otherwise, an approximation to the experimental value was used;
that is, a is energy dependent. Adjustment of m was used in order to convert
from 'momentum transfer* cross sections to the 'elastic' cross sections
required for Monte Carlo simulations and to match computed swarm data to
experiment. This conversion is accomplished by
a T = 2 [1 - ( in + 21) [7 -5 )
To obtain the velocity components of the scattered particle, we choose a
coordinate system whose z-axis is aligned with the direction of propagation of
the particle, ll = (0,O,V). Call this coordinate system the collision
system and call the coordinate system used for the simulation the basis
system. The velocity components of the scattered particle in the collision
system are simply (V'cososin6, V'sinosinO, V'cos9), where V' is the speed of
the particle after the collision; that is, after the energy loss (or gain)
/ experienced by the particle is accounted for. The polar and azimuthal
scattering angles 0 and 0 are defined above. To obtain the coordinates of the
scattered particle in the basis system, we must first obtain the Eularian
angles a and P of the initial velocity IVi in the basis system and compute the
transformation matrix which yields the coordinates in the system to which one
is transforming. Doing so, the velocity components of the scattered particle
are
Y'= V"(-cosassin6osino + cosp.sinaosin ocoso + sinp.sinaocosB) [7-6]x- V' = V'e(sinaosinOesino + cospocosaosin6.coso)
-1 V V'o(-sinesinG'cos# + cospecos6)
.
J
, 7-15
-A

27
To verify the selection of cross sections, ionization coefficients and
drift velocities were computed with the plasma simulation code for constant
E/N and compared to experimental data. An example of this verification for
helium appears in Figure 7-7.
7.5 HBAVY PAITICLB CONSBIVATION ZQUATIONS
The time duration for voltage collapse and electron avalanche in the
devices of interest is MlO ns. During this short time, heavy particles (ions
and excited neutral atoms) do not move appreciable distances, even in the
regions of intense electric fields. The mobility of ions is reduced by
resonant charge exchange reactions, thereby limiting their drift velocity to
moderate values. Given these conditions, the motion of the ions and excited
states of the neutral gas can be described by continuum transport equations.
The density of ions and excited states obtained in this fashion are coupled to
the particle simulation for the electrons through the change in collision
frequency of electrons for a particular process resulting from changes in the
density of collision partners, through the charge density appearing in
Poisson's equation, and through the rate constant for collisions appearing as
the source term in the ion and excited state conservation equations.
The conservation equations solved for heavy particle type j having
number density N., mass Uj and charge Zj are
aru.N.) Z. eBMomentum: -V*u.u.N. + . - Njujvc [7-7)
ON N.%2
Continuity: - -Vu.N. + S.(x,t) + D.V - - [7-8]
where u. is the velocity of particle type j, E is the local electric field, Dj3uj
is the diffusion constant, S. is the source function for electron impact
collisions exciting species j, vCB is the collision frequency for charge
exchange, and r is an effective lifetime, applicable only to excited states ofneutral atoms. Since we are considering only a single mono-atomic gas, charge
7-16
4 " "" . . . '" "-" -

.... .... . . . . . . . ....
- .
U -17
S10
-10
o 19
~ 10
10 1 1 15 i 10-1
B/N (Vcm2)
101
UZ

exchange is resonant and, therefore, appears only as a momentum daipingmechanism and not in the source term for ions. We assumed the momentum kept
by the neutral particle after a charge exchange is isotropically distributed
in the bath of neutral particles. Therefore, the momentum conservation
equation is not applied to neutral particles. The conservation equations for
neutral excited states consist only of the source, diffusion, and lifetime
terms of Eq. 7-8.
The resonant charge exchange cross section for collisions between He+-He
were obtained from the semi-emperical calculations of Duman and Sairnov
(Reference 15). Diffusion constants for charged particles were derived from
the mobility of the particles obtained from the compilation of Ellis, Pai, and
McDaniel.(16) An effective ion temperature, required to compute the mobility,
is defined as Teff : T + M luil2/3k, where T is the actual gas temperature and
* k is Boltzmann's constant.
* The source function Sj(x,y,t) is the net rate of formation of species j
resulting from electron collisions. This rate is obtained directly from the
electron particle simulation in the following manner. The heavy particle
conservation equations are updated only after time intervals AtH, which are
long compared to 1/ymax; typically AtB 0 0.5 ns. During each interval AtH,
the number of electron collisions are summed for each type of collision at
every spatial point of interest. At the end of the interval AtH, the source
term for electron collisions of type k with species j at location (x,y) is
Wi
SkLXyt+At [7-g]h) AtV
where the sum is for macroelectrons i with weight Wi having had collisions of
type k during At1 in the volume element AV centered on (x,y). By using the
sum of collisions as the source term, charge is conserved since the ion
density is incremented only if an actual electron impact ionizatioa collision
has occurred. An alternative method for determining the source term is to
7-18

directly compute the rate coefficient from the instantaneously derived
electron distribution function, as summed over the interval Atg. The latter
method only conserves charge in the limit of very large numbers of
macroelectrons; that is, in the continuum limit.
The boundary conditions for the momentum and continuity equations are
that the ion momentum and density are zero at all solid boundaries. The flux
of ions colliding with the cathode is summed over At1 and secondary electrons
are released from the cathode consistent with the flux of ions and a specified
secondary emission coefficient. Similarly, the flux of electrons colliding
with, for example, the anode is summed and secondary electron emission is
included by releasing electrons from that surface. For secondary electron
emission by electrons, emission is modeled by having the impinging electron
reflect from the surface with a lower weight than when incident. The weight
of the reflecting electron is w = w.6, where 6 is the energy dependent
secondary electron coefficient and wo is the weight of the incident electron.
6 may be replaced by the probability density distribution for secondary
emission if it is known.
7.6 SOLUTION OF POISSON'S BqUATION
The local electric potential 4 and electric field B within the plasma is
obtained by solution of Poisson's equation
-V-eB = V-V= [7-10]
0
where e is the local dielectric constant, p is the local charge density and 7
is a factor discussed below. When c is constant and spatially uniform, the
left-hand side of Eq. 7-10 reduces to eV 2. We use this form of Eq. 7-10
except as discussed below. The charge density is obtained directly from the
simulation. The electron density is obtained by summing the local density of
macroparticles during a series of 'snapshots' of the particle distribution.
The ion density is obtained from the solution of the ion continuity equation.
During the simulation poisson's equation is solved every time interval At
7-19

after updating of the circuit equations. The boundary conditions for solution
of Poisson's equation at the surfaces of the auxiliary grid, control grid, and
anode are given by the values of the electric potential of those surfaces
obtained from the circuit equations.
The method used for solution of Poisson's equation is Successive Over
Relaxation (SOR) (Reference 17). The SOR method is a discrete iterative
numerical technique for solving second order partial differential equations.
A simple one-dimensional example will be discussed and the extension to a
two-dimensional unequal mesh outlined.
Define the value of variable u at mesh point j as uj. In discrete
notation,a2 U. =U.+ - 2u. + u._ 7-12 2
where Ax is the distance between equally spaced mesh points. Using this form
in Poisson's equation and solving for uk3 we obtain
u k =1 [(uk +j - Ax2 S.) [7-12]
where S. is the effective source function (i.e. pleo) and the superscript
denotes the value of u for the kth iteration. The current value of uj may not
satisfy Eq. 12. The correction to uj is the difference between its current
value and its value as given by Eq. 7-12.
j k+1 k k - Ax2S [7-13]
j 2 =x++ uj1 J - xk)
X k I -do)+ w((uk +U k Ax2S]= xj(1 - ) j-1
where w is the weight of the correction. The term SOR comes from the fact4,
that w > 1; that is, we overcorrect the solution. Typically w 0 1.75.
*Poisson's equation is solved by successively iterating Eq. 7-13 using the most
recently updated values of u. on the right-hand side.
C 7-20

The method can be generally extended to a two-dimensional rectangular
mesh using either nearest neighbors (5-point kernal) or next nearest neighbors
(9-point kernal) when calculating the 2-D equivalent to Eq. 7-13. We define
ui as the value of u at the ith grid point in the x direction having gridspacing Ax and the jth grid point in the y direction having grid spacing hy.
* " Further, we define a and P and the relative weights of the next nearest
neighbors in the x and y directions, respectively; that is, a = = 0 means
that we use only a 5-point kernal while a = = 1 means we use a full 9-point
kernal. The 2-D analogy to Eq. 7-13 is then
k+1 ku =xi(l + 2 2 )y [7-14]
i7j j i1, 2 L ...1i + A~ ~ 1 +u~ 1
1 + J i~~ i-Ilij I + P i,j+l .Ijl-I
1 k k k k 1Ui+l,j+l + Uil,j-1 + u. _ + .i-l,j+ 1
SAx - Ax Ay s
(1 +) (1 + p)
When practical, we attempted to use a square mesh (Ax = Ay). Typical values
for the weighting factors were a = = 0.25. The application of Eq. 7-14 to
solution of Poisson's Equation (Eq. 10) is obtained by setting uij 7 Oij and
Sij = 7Pij/(6o6ij).
In Eq. 7-10, the charge density is multiplied by the factor 7. Due to
the statistical nature of the Monte-Carlo method, there are fluctuations in
the charge density p that are unphysical. These fluctuations are reduced by
numerically smoothing the computed charge density. However, further
reductions in p, were found to be necessary. The factor 7 < 1 accomplishes
this reduction. Typical values of 7 are 0.01-0.1. Thus, the solution
obtained is not an exact solution of Poisson's equation for the electric
potential, rather the solution is *pushed' in the correct direction by the
sign and magnitude of the charge density.
7-21

When dielectrics are present within the thyratron, the dielectric
constant in Eq. 7-10 iu no longer uniform. For these conditions, e must beexplicitly included in Eq. 7-10, which can also be written an
ev 2* + VCOV# = A [7-15]0
The additional term in Eq. 7-15 (the second term on the left-hand side) is
incorporated into Eq. 7-14 by adding the following expression (uj ij):
,k+l -..-. + (&x2AY 2) [7-16]
For a 9-point numerical molecule, the partial derivative for a variable A is
written as
ax 2Ax(1 + a) (Ai+1,j -i,jJ [7-171a ((A + A l +
2Ax(1 + a) L{'i+l,j+l i+lj-JI 8A..
8A - 2y= 1 * - Amj-l] +
y 2Ay(m( 1 ,
P, (A + A- A+ A2Ay(1 + ( i j+l i-(j+l Ai+l'j-l A -11]
, The components of the local electric field at the center of the computational
cells are obtained from the values of the potentials at the cell vertices from
*: the following expressions:
.x = I1 + 7ij 2Ax ilj+l i j,j ,j
E ij = My ' ((i+1,j+l + *i,j+l (i.+,j +
7-22

An example of the electric potential computed in the fashion described above
for a geometry considered for the 100-k¥ scale-up of the prototype linear
thyratron is shown in Figure 7-8. Note the penetration of potential lines
from the anode through the control grid slot.
7.7 CIRCUIT NI LD
The linear thyratron, having a tetrode geometry, utilises three
electrical circuits: one each to drive the auxiliary and control grids, and
the energy storage circuit, which is the circuit being switched by the
thyratron. Typical thyratron operation might have a dc priming current
between the cathode and auxiliary grid. Upon a trigger signal, the auxiliary
grid is pulsed to a few kilovolts to breakdown the control grid-auxiliary grid
region and fill it with plasma. The control grid may be initially at a
negative voltage to prevent pre-fire. Coincident to or at some time delay
after triggering of the auxiliary grid, the control grid is also pulsed to a
few kilovolts (positive), thereby breaking down the cathode-control grid gap
and drawing plasma into the vicinity of the control grid slot. As the voltage
collapses between the control grid and cathode, potential lines from the anode
penetrate through the control grid slot, attracting electrons from out of the
cathode-control grid region into the control grid-anode gap. Current flows
through the control grid slot, closing the switch.
In conventional discharge models, the plasma is treated as simply a
time-dependent resistor within the circuit. The resistance of the plasma is
obtained by R = L/(oA), where a is the conductivity of the plasma, L is theseries length of the plasma, and A is its cross-sectional area. This
definition of resistance is not easily applied to a thyratron because there
are no unambiguous definitions of a, L, or A. As a result, two models for the
resistance of the plasma as a circuit element were used: a 'conventionall
resistor and a resistive current source.
The circuit model used in the simulation is shown schematically in
Figure 7-9. Conventional rate equations are used to describe the flow of
7-23
&,~~~~~~ ~ ~~~~ ',. V/'~*~.'-ja ~ N './ 1 ~ - -

3 5 - WALL.4
d . . * .
WALL
GRE INSUOR
CATHODE INSULATOR
0 CONTROLAND
0 00 n GRID WL
000 GEOMETRY 65;0
000
0 00 POTENTIAL o-300V 6 503 50-
350-
0
0 0 POTENTIAL 0-60kV 6 50gPOSITION (CM)
Figure 7-8. Geometry and Electric Potential for Modified LinearThyratron. Auxiliary grid potential = 100V, control gridpotential = 200V, anode potential = 60kV.
7-24
* * *~.4~,4
"* . 4.4 % . .' ., , . ,% .. S a .. . % % % " " ."4,. , ,f, ,p, , " '4 ", ".'* "*",-" * .*.. .. -- , - ,,,,.44* 4.*~ ~ 4.4/

f.1
'I iL,°.
L 5 L
T-G
THYRATRON "
Figure 7-g. Schematic of the Circuit Model for the Auxiliary Grid (AG),Control Grid (CG) ad Switching (s) Circuits. RL is theload (resistor).
7-25
'4.

current and change of voltage in the discrete or lumped circuit elements in
each of the three external circuits. The simulation begins by having the
anode at the maximum hold-off voltage. The auxiliary and control grids are
either pulsed in some programmed manner or are specified to be at some maximum
voltage. Macroelectrons are released from the cathode having a weight that
corresponds to a current density of a few milliamps-cm-2 . The simulation
proceeds for a time At. When treating the plasma as a current source, during
At the weights of all the macroelectrons collected by a particular grid or
electrode are summed. After At the current flowing through, for example, the
control grid circuit, is ICG = (EeWi)/At, where the sum is overall
macroelectrons collected by the control grid. Given that this current is now
flowing through the control grid circuit, the change in voltage across each of
the circuit elements can be computed. With these changes in voltage, the
potential of the control grid can be computed using Kirchoff's Law. The
current through each of the three discharge circuits is summed, yielding the
total cathode current IC. This value is then used to specify the weight of
the macroelectrons released from the cathode during the next time interval,
W = ICAt/(eNo), where No is the number of macroelectrons released.
When treating the plasma as a 'conventional' resistor, one or more
current paths from cathode to anode are specified. During the calculation for
each time interval At, the electron density and electron collisions along the
paths are summed. The resistance for current flow along the chosen paths is
then computed from the integral
mL'R f e c -dl [-9e ne
Using this method requires at least one iteration of the calculation to
confirm that the chosen current paths are indeed the most probable.
Certain 'real-time' adjustments must be made in the currents computed in
this fashion due to the discrete incremental changes made in voltages. One
must insure that the current flowing through a particular circuit is less than
7-26
Np
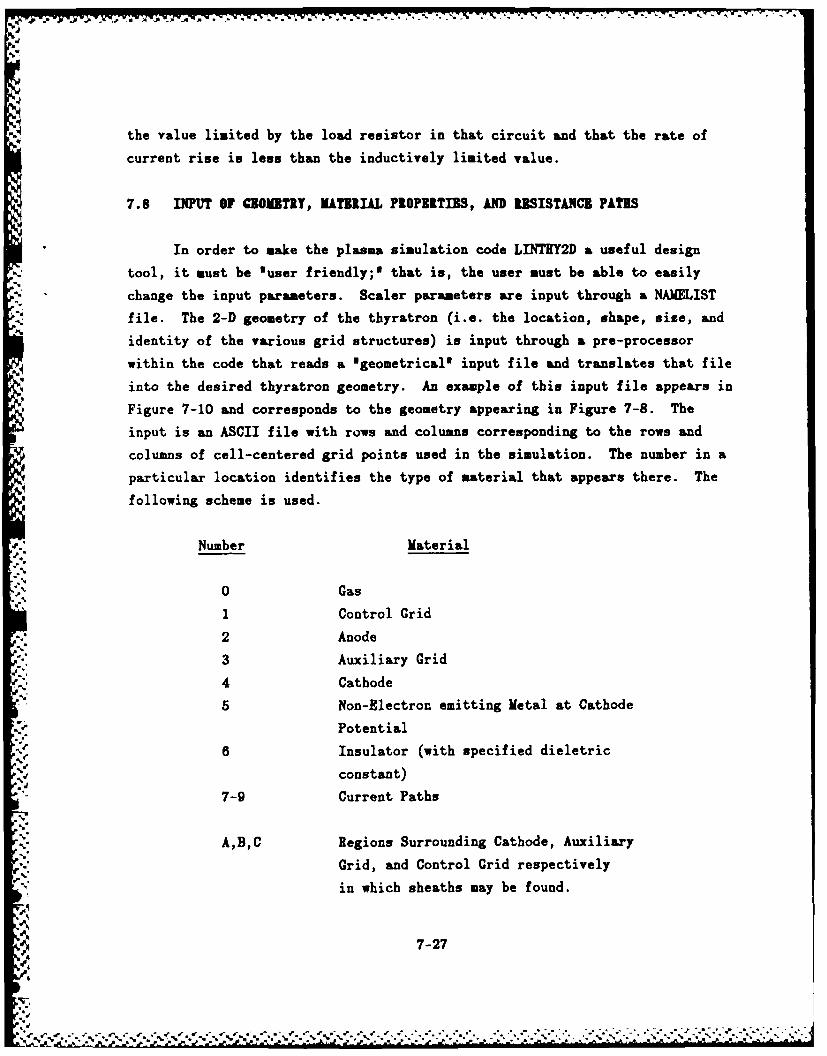
the value limited by the load resistor in that circuit and that the rate of
current rise is less than the inductively limited value.
7.8 DIPUT OF GBOMBTRY, MATBRIAL PROPIRTIBS, AND RBSISTkNCB PATIS
In order to make the plasma simulation code LINTHY2D a useful design
tool, it must be luser friendly;' that is, the user must be able to easily
change the input parameters. Scaler parameters are input through a NAMELIST
file. The 2-D geometry of the thyratron (i.e. the location, shape, size, and
identity of the various grid structures) is input through a pre-processor
within the code that reads a 'geometrical' input file and translates that file
into the desired thyratron geometry. An example of this input file appears in
Figure 7-10 and corresponds to the geometry appearing in Figure 7-8. The
input is an ASCII file with rows and columns corresponding to the rows and
columns of cell-centered grid points used in the simulation. The number in a
particular location identifies the type of material that appears there. The
following scheme is used.
Number Material
0 Gas
1 Control Grid
2 Anode
3 Auxiliary Grid
.* 4 Cathode
5 Non-Electron emitting Metal at Cathode
Potential
0 6 Insulator (with specified dieletric
Of constant)
7-9 Current Paths
0%-
, A,B,C Regions Surrounding Cathode, Auxiliary
Grid, and Control Grid respectively0'' in which sheaths may be found.
7-27
d. , ... .. ., . .,. ,. .. .,, . . . .-. ... , . . .. ; .,i,-, -- ",.. ..-.-- --- -.

- - S . . - - --
'. . . . .- V -.. . . , . . . S -
55555555555566666655555555550000000000000000 CONTROL GRID=00000000000000660000000000550O ANODE=2000000000000006600000000005500 AUXILIARY GRID=3000000000000006600000000005500OOCOOOOOOOOOO CATHODE=43333333333000066000000000055000000000000000000 GROUND PLANE=50000000003000066000000000055(OOOOOOOOOOOOOOO2 INSULATOR=60000000003000066666666666055000000000000000002 RESISTANCE PATHS=7-90000000003000066666666666055666666666666666662 SHEATHS=A,B,C
S0000000000000000000000066055666666666666666662
00000000000000000066055666666666666666662 10- 0000000000000000000000066055666666666666666662
000000000300000000000006605566666666666666666240000000030000000000000660556666666666666666624000000003000000000000066055666666666666666662400700000000000000000006605566666666666666666240007777700000000000000660556666666666666666624000000007777770000000066000000000000000000002400000000300000777000001111111111111111111002240000000030000000077700000000000000000000100224008888803000000000007777777777777777770010022 2040000000888888888888888888888888888888870100224000000000000000000000000009999999999998710022400000099999999999999999999000000000001000002240099990030000000000000000000000001000002240000000030000000000000000000000000010000022 25I I I I I I1 10 20 30 40 46
Figure 7-10. Input File Used to Generate the Geometry Shown in Figure 7-8.
7-28

7.9 COMPAIISON OF PLASMA SIMULATION RESULTS WITH KIPBUIMBNT
Validation of the plasma simulation code LINTHY2D was performed by
comparing computed results with experimental data for both 'macroscopic'
(e.g. voltage and current waveforms) and 'microscopic' (e.g. distribution of
excited states) quantities.
Comparison of the results from LINTHY2D for voltage and current with
experiment is shown in Figure 7-11 for the low and high inductance geometries
used in the experiment. In both cases, the initial anode voltage is 8 kV and
the gas pressure is 1.2 Torr He. The agreement is qualitatively good. The
oscillations in the theoretical voltage in Figure 7-11b result from
oscillations in the resistance of the plasma combined with having the current
be inductively limited. The sudden decrease in plasma impedance that occurs
upon switching results in a lowering of the B/N in the cathode-grid space.
The lowering of B/N manifests a decrease in the rate of gas phase ionization,
although the loss rate of electrons, does not change proportionally. Since
the current is inductively limited and will not change as rapidly as does the
voltage, to maintain current continuity the voltage drop across the thyratron
plasma must increase in order to increase the rate of ionization. Ionization
in the thyratron during commutation occurs largely between the cathode and
control grid. Therefore the oscillation in voltage occurs largely between the
cathode and control grid.
The computed electron density for the conditions of Figure 7-11b is
shown in Figure 7-12 for a selection of times during the current pulse. As
expected, the electron density increases with increasing current. The
distribution of electrons is quite non-uniform. A large density of electrons
occurs in the vicinity of the vertex of the control grid and near the slot and
baffle. This is a region of relatively high space charge and high potential
due, in part, to the penetration of potential lines through the control grid
slot after the breakdown of the cathode-grid space.
7-29
%_..-....'. - .,....w3 ? ,' - - . .'." , -" '1 " ... i'i"- . ": , ,: = . . '.' ' - r' °* . .. 1 '

- V, - v*. Va a A . *
(V3[) 3J4mlun
CD a/ -4
0
Go - 1 163 v
0V
-. 4
I p.4.r,' -CIA 4D
ZDY~qiA
0 '0 7-300
i~~e W.s 4

C) C)- 00
004
CD)
C) C)a
('4
Lrk r- r
C)'
C>
C) C) C
*10 r-4 (N $C )C .J( J C )
C c;
13 4J
C) CD ~ C)
(NJ C4 .- 0
C)) &*,4
.) C) :
r-4 -1 . .tU1 *
-~~C E- I 41*0*.*
C) C) ()C C ) C C )C
--I 0j -- 0 v 4 )(N (I )C) D4 NJ.4 )
-4
U, (NICC
.44
*~~~~1 C;*..*-.-..-.....
*0 N.~*.' * "* - ~ . . .
-Ln~V~

The distribution of electron energies for the case at t=lO0 no is shown
in Figure 7-13. The two regions where the density of electrons in the lowest
energy group (0-30 eV) is high are near the cathode and in the approach to the
control grid slot. The low-energy electrons near the cathode are simply
thermal electrons which have only recently been emitted and which have not yet
been accelerated. Note that the model assumes that electron emission from the
cathode is thermal. The cathode *surface' is, therefore, the extent of the
virtual cathode. The high density of thermal electrons near the control grid
vertex and near the slot result from a number of causes such as emission or
reflection of electrons from the control grid; a high rate of ionization
resulting in a large density of low energy secondary electrons; and a high
density of ions, which increase the electron collision frequency. The next
group of electrons with higher energy (30-100 eV) represent those electrons
accelerated away from the cathode and electrons accelerated from the thermal
group near the vertex and into the control grid slot. Finally, the last two
high energy groups of electrons are found only in the control grid slot and in
the anode-grid gap where the electric potential is high. Note that current to
the anode (i.e., electrons which traverse the control grid-anode) gap is
almost entirely due to electrons attracted through the control grid slot by
penetration of the anode potential through the slot. The amount of ionization
that occurs in the control grid-anode slot is minimal.
A comparison between experiment and theory for the distribution of
excited states in the linear thyratron is shown in Figure 7-14. The
conditions are for the low inductance geometry at 60 ns. The qualitative
agreement is good, showing a maximum in excited state density in the slot,
near the vertex, and just above the cathode. Further discussion on the
distribution of excited states appears in Section 4.
7-32
A'.A

8 0O
0 &
4)0 0
Cl04
-4 4
o~ -W
.4~~ 0SIii4
0W
0 -v
-r 0 -
o 4 C; C
'-4 0 0 C)
01.
co0
7-33*

'V7.
Ur4 2m 4)
LA =L
0 C) w
C:)co r' LiLJC14)
0
4
C))
V
0.
CD .44.
0 #
00 x
V)t
. .- .,1,i ;.' . . 0 I'- 'L
4i4
7-34-

7.10 THE TADBOFF BETE N NOLDOFF AND SWITCHING SPEED
In this section, we will demonstrate the use of the plasma simulation
code LINTY 2D for designing thyratrons and defining their operating
characteristics. This demonstration will consist of using LINTEY2D in
evaluating the design tradeoff between high-voltage holdoff and switching
speed.
Since thyratrons operate on the near side of the Paschen curve, high-
voltage holdoff is increased by decreasing the product P°D, where P is the gas
pressure and D is the separation between the electrodes of interest, typically
the control grid and the anode. Pre-fire can occur by either exceeding the
voltage specified by P-D, by field emission at sharp edges, or by leakage
current from the cathode. Field emission becomes increasingly more important
as the dimension D becomes smaller because structural components near the
cathode slot and baffle must become thinner, thereby reducing the radius of
curvature at the edges of the baffle or slot. For sufficiently high holdoff
voltages, this reduction in radius of curvature can lead to electric field
enhancement and subsequent field emission of electrons.
Leakage current is a statistically occurring short between the cathode
and anode, resulting from a random flux of electrons originating near the
cathode. Most thyratrons operate with a hot thermionically emitting cathode,
and many operate with a dc simmer current between the cathode and an auxiliary
grid. In either case, there is a copious supply of electrons that must be
confined to a region close to the cathode and away from the control grid slot
prior to triggering. When operating without a dc simmer current the negative
space charge field at the surface of the cathode is sufficient to confine the
majority of emitted electrons. However, statistically there will be somesmall fraction of electrons energetic enough to penetrate the local space
charge field at the cathode surface, or from the cathode auxiliary grid space
in the case of a dc simmer current, and drift towards the control grid slot.
These electrons can then be drawn to the anode through the control grid slot
by fringing electric fields which penetrate through the control grid slot from
7-35

the high potential anode.
To prevent electrons from entering the control grid-anode gap, the
control grid slot should be tightly baffled with a shield (having the control
grid potential) placed in front of the control grid slot. The shield, or
baffle, prevents anode potential from penetrating into the cathode-control
grid gap. A negative bias can be applied to the control grid to achieve the
same goal. Both of these remedies decrease the speed at which the thyratron
can subsequently be switched. To minimize the switching time, the control
grid slot should be loosely baffled to allow the anode potential to penetrate
the slot, and the control grid should be at the maximum possible voltage (that
is, at a voltage just below the cathode-control grid gap breakdown voltage).
Both of these criteria are inconsistent with high-voltage holdoff. Clearly, a
tradeoff must be performed between voltage holdoff (preventing pre-fire) and
switching speed.
To examine the tradeoff between holdoff and switching speed, LINTHY2D
was used in two modes. In the first mode, we calculated the value of the
negative (dc) control grid bias necessary to insure that there is no leakage
current to the anode. The value was examined as a function of the degree of
baffling of the control grid slot and the anode voltage. The leakage current
was computed by *releasing' electrons from the cathode and following their
trajectories. The control grid bias for which none of the electrons released
from the cathode are collected by the anode is defined as the bias for which
pre-fire is prevented. In the second mode, LINTHY2D was used to fully
simulate the electron avalanche during breakdown of the cathode-control grid
slot. A switching time was calculated by determining the time required for
the current to obtain the specified value AL.
The thyratron geometry for which this tradeoff was performed is shown in
Figure 7-15. The thyratron was operated with 250 pm of helium, uses the
linear geometry 10 cm in depth, and is symmetric across the lower plane of the
figure. The model thyratron is a tetrode having a screen auxiliary grid. The
single control grid slot is shielded by the baffle as shown. The variable for
7-36
%

0S COMTOL
I AUX. GRID
T2000 cN CATHODE
1.00 - 0
M ANODE
o. e ioe .ee 3.00 4.00 5.00POSITION (CM)
85 09930
Figure 7-15. Geometry for Model Thyratron Used in Holdof I Study.
7-37

this exercise is the separation between the control grid and the baffle,
defined as the gap size d cg. The smaller this dimension, the more tightly the
control grid slot is baffled.
The computed leakage current is the fraction of the electrons released
at the cathode that are collected by the anode. These currents are plotted in
Figure 7-16 as a function of negative dc control grid bias dc) for three
* values of d cg. The anode voltage is 100 kY. The fringing electric potential
penetrating the control grid slot for a selection of dcg and Vdc is shown in
Figure 7-17. Plots of the probability density for electrons escaping from the
cathode for Vdc = -150 V and three values of gap size d appear in
Figure 7-18. Clearly, the more tightly baffled geometry requires a smaller
value of Vdc to insure there is no leakage current to the anode, a consequence
of the smaller penetrating electric potential through the slot from the anode
with the tight baffle. In the absence of a dc bias, the fringing fields from
the anode attract a significant fraction of the electrons even under tightly
baffled conditions. The value of Vdc required to insure no leakage current as
a function of gap size and anode voltage is shown in Figure 7-19. At high
holdoff voltages and as the gap size increases, a larger than linear increase
in Vdc is required to insure there is no leakage current.
The trade-off between gap size and switching speed is next discussed.
We define the absolute switching speed, Ta' as the time after pulsing the
control grid at which a specified current is reached. Since the rate of
current rise may be inductively limited, Ta contains a contribution from both
the holdoff voltage and the geometrical inductance. To normalize these
contributions, a reduced dimensionless switching speed Tr is defined as'VU
= a tdJ = [7-20]
L g
where AI is the specified current denoting switching, VH is the holdoff
voltage, L is the geometrical inductance, and (dI/dt)L is the inductively
7-38
U U. \.4 . ~ .,~.*~* ~ ~ ' ~ -,-. N U ~ ' . % % ,NU' U

A4-
00.
_4
iNuuI /1V3" :1-0 Z /
.b 0M
-14 f
to w .c0 0
00 Ew
>U O.3g
0s
3.) en C4; -
C; C /LN3"n:)~~ 30X 0lN~-M
7-390

-WW -U -71-f no -w -a -i -W A..' "-Plar-.6P -" -'-
p 3 000S v1- ANE w 100 V
T 200V 100V v -I AUX
15 0
0 00 100200 3 00 400 5 00: POSITION (CM)
p 3 00-0SIT 2 00 100V d ,31 0 1o-V Cg0 50" 50V V -150 VN 50V50 -50 cg
~100 0CM 350V
0 00-
0 00 1 00 2 00 3 00 4 00 500ePOSITION (CM)
p 3.00-', S XII \,, , ,
I S -50
T 2._ oo V1 0 -
iU -100 doto Cg -is 6
0-40cg
N 50V 50v1.0--50y V - -150 V
C 50Vy 350V
0.00 1.00 2.00 3.00 4.00 5.0085 09932 POSITION (CM)
Figure 7-17. Fringing Electric Potentials for a Selection of Gap Sizes4. and Control Grid Bias.
7-40

3 80-
2 88- d =9mmCg
2 88-
000
3 SO
d 3mncg
S 880 1880 2860 3880 4880 5880POSITION (CM)
85 09933
Figure 7-18. Probability Density for Elctrons Escaping from the Cathodefor V ANODE =100 kV. The control gird bias is -iSOY.
7-41

>, -375.
ru V 100OVow ALIX0 -300 ANODE 10k
0
0w. i~ 225
M 50 kV
20 kV0
z0U 0-
0 2 4 6 8 10 12
GAP SIZE (mr)
Figure 7-19. Control Grid Bias Required for no Leakage Current for theGeometry of Figure A (He, 250 pLm).
7-4

limited rate of current rise. 7r is the factor by which the inductivelylimited rate of current rise must be multiplied to yield the actual switching
time. For the discussion below, AI 2 kA and L = 75 nH.g
Absolute switching time, ra for VH = 65 kV is plotted in Figure 7-20 as
a function of gap size. The switching time decreases with increasing gap
size. The actual points computed with LINTHY2D are plotted in this figure and
show the statistical scatter of the method. The results shown in other
figures are hand-drawn smoothed lines through a similar distribution of
individual simulation points. The dimensionless switching speed rr for a
selection of gap sizes as a function of holdoff voltage V1 is shown in
Figure 7-21. For these conditions, the relative change in switching speed
between gaps of different sizes is approximately constant. rr decreases with
decreasing VH; however, for sufficiently small VE, Tr reaches a constant
value. This implies that the non-inductive component to the switching speed
(e.g. avalanche and plasma spreading time) is relatively constant for
( <40 kV. The decrease in rr is largely a function of the increase in the
inductive rate of current rise as VH decreases. For sufficiently low VH
(< 40 kV), the rate of avalanche and plasma spreading also decreases as VH
decreases, and does so in such a manner as to keep Tr nearly constant.
7.11 SCALB UP OF TIB LINEL TIT TRON TO 100 kY
The prototype linear thyratron was modified to operate at 100 kV.
These modifications and the performance of the modified LT are discussed in
Section 8. LINTHY2D was used to investigate the operating characteristics ofthe modified linear thyratron. For the prototype LT to operate at 100 kV, the
control grid-anode gap must be isolated within an insulted region in order to
reduce the possibility of insulator flashover and field emission. The
circumstances of the existing LT geometry require that the feedthroughs to the
control grid remain in their present location. The result is that the control
grid slot is immersed in a region of near equipotential. An alternate, butmechanically more complex geometry requires additional modification of the
control grid to increase the electric field in the approach to the control
7-43
5-"S .*. ?'. . ~ ?: V" ' -' . . * S. .* , -'* ,
'.*.. ' '
P . 'P -5-? S".- .. ... . .P' S.

40
30
tJv -65 kVz 20 anode
6 He 250 innE-
10
4 ~0 I
0 2 4 6 8 10 12
GAP SIZE (mmn)
O5 OV996
Figure 7-20. Absolute Switching Speed (&1 2 WA
7-44

I I I I
20d gap 3 mm%
p '15 -
:.-,,,,-
10 6m
'55
0 20 40 60 8085 O991k. VANODE (kV)
Figure 7-21. Normalized Switching Time as a Function of Gap Size andAnode Voltage. Control grid is pulsed to 20oV.
7-45
p.

grid slots. These two geometries are called LT-1 and LT-2 respectively (see
Figure 7-22). In geometry LT-2, the supporting structure for the control
grid, a conductor in LT-1, is replaced by an insulator. The auxiliary grid is
widened to include a mesh covering the cathode. By virture of these
modifications, the current drawn by the control grid is channeled towards the
control grid slot instead of being preferentially collected by the supporting
structure.
Performance of the modified linear thyratron using the two geometries
discussed above was simulated using LINTH2D. Results from those simulations
are shown in Figure 7-23 where plots of the electron density appear as a
function of position and time. The design modification in LT-2 succeeds in
channeling current in the desired direction. As a result, the switching speed
is increased as shown in the simulated voltage and current characteristics
appearing in Figure 7-24. Since the control grid area is reduced and the
cathode-control grid distance is effectively increased in LT-2, the control
grid voltage is also higher. This results in a hotter plasma, as shown by the
electron distribution functions in Figure 7-25. The hotter plasma contributes
to a faster switching speed by increasing the rate of electron avalanche. The
jitter is also lower with LT-2. A comparison between experiment and theory
for current in the LT-1 geometry appears in Figure 7-26.
7-46

70W
_
0~0
Cc
oV
In 0~
- Ea
FE 0CL
S .04
NU,
CL
I --
0 W.
94-
-7-4

V-4 f)
0
00
E -40
a 4 u 0-
0
E .4 .4(WO H, -S'
QE
LI,
.IjU .4) 4.
-.-
.1p
7-4

3 so
- -- VOLTS
/4 AMPS% e
60
I LT-12 (+12 ns)
40
LT-21(13 ns) 4
2 0
0 0'
020 40 60 so 100
TIE(ns)
as 09911
Figure 7-24. Predicted Current and Voltage Characteristics and Jitter forthe Two Proposed Geometries LT-1 and LT-2.
7-49

N. ~ ~ ~ ~ ~ ~ ~ ~ ~ ~ W V -. W-. -i 'a.W- -, ~.~- _-~ :.fw r
LT- 1
10-2 LT-2
I 11 30 4 8 12
10-4LT-1 CcT- 17 eV)
10-5
0 40 so 120
ENERGY (eV)
85 09912
Figure 7-25. Electron Distribution Functions at t = 15 ns for theGeometries LT-1 and LT-2. The geometries LT-2 results in ahotter plasma due primarily to a higher control gridvoltage.
7-50

80
60>X
- 40-
JITTER0
>20 _
'THEORY
--- EXPERIMENT
0 1 1 1 10 20 40 60 80 100
TIME (ns)
816 1 082 Figure 7-26. Comparison of Theory and Experiment for Voltage Waveform
with Geometry LT-1. (Charging voltage 75 kV, 250 pm He.)
7-51
J! "p " " ' 'e H '. '' " , " ," - ," . , " o , " ." -.. " ,% " " ," .. " . , , " . - ," . " ," ." . . .- . -- '

REFERENCES
1. P.J. Roach, S. Steinberg, H.J. Happ, and W.M. Moeny, '3-D Electric Field
Solutions in Boundary-Fitted Coordinates,' Proceedings of 4th IEEE Pulsed
Power Conference, T.H. Martin and M.F. Rose, eds., (Texas Tech Press,
Lubbock, Texas, 1983), pgs. 465-466.
2. B.M. Penetrante and E.E. Kunhardt, J. Appl. Phys. 59, 3383 (1986).
3. J.A. Kunc, and M.A. Gundersen, IEEE Trans. Plasma Sci. PS-10, 315
(1982).
4. L.E. Kline and J.G. Siambis, Phys. Rev. A 5, 794 (1972).
5. C.K. Birdsall and A.B. Langdon, Plasma Physics via Computer Simulation,
(McGraw Hill, New York, 1985), pgs. 19-22.
6. S.L. Lin and J.N. Bardsley, J. Chem. Phys. 66, 435 (1977).
7. M. Hayashi, 'Recommended Values of Transport Cross Sections for Elastic
and Total Collision Cross Section for Electrons in Atomic and Molecular
Gases," Nagoya Institute of Technology, IPPJ-AM-19, 1981.
8. M. Mitchner and C.H. Kruger, Partially Ionized Gases (Wiley, New York,
1973), pgs. 54-62.
9. W.C. Fon, K.A. Barrington, P.G. Burke and A.E. Kingston, J. Phys. B. 14,
2921 (1981).
10. F.G. Donaldson, M.A. Bender, and J.W. McConkey, J. Phys. B. 5, 1482
(1972).
11. D. Rapp and P. Englander-Golden, J. Chem. Phys. 43, 1464 (1965).
12. K. Stephens, H. Helm, T.D. Mark, J. Chem. Phys. 73, 3763 (1980).
13. L. Vriens, Phys. Lett. 8, 260 (1964).
14. G.L. Graglia, Physica 92C, 91 (1977).
15. E.L. Duman and B.L. Smirnov, High Temperature 12, 431 (1974).
16. H.W. Ellis, R.Y. Pai, and E.W. McDaniel, At. Nuc. Data Tables 17, 177-210
(1976).
17. W.F. Ames, Numerical Methods for Partial Differential Equations
(Academic, New York, 1977), pgs. 119-125.
7-52
II~~~~VW Ir 0' W-10 %: % .V11P.J ~ .d

Section 8
HIGH-VOLTAGB OPERATION WITH TIE MODIFIED LINEAR TTIATION
8.1 INTRODUCTION
The purpose of the experimental, theoretical, and design studies of
the linear thyratron described in previous sections has been to increase
our understanding of thyratron operation in order to improve its
performance. In this section, we describe modifications mude to the linear
thyratron to maximize its high-voltage holdoff, and we describe its high-
voltage performance. The goals of these modifications were to operate the
linear thyratron at 100 kY, and in a burst mode at 200 Hs. This goal was
essentially met by demonstrating performance at 095 kV, with bursts of
5 pulses at 200 Hz, and by demonstrating recovery with a pulse separation
of 3.5 is.
The modifications and performance of the linear thyratron described
in this section should not be considered the optimum performance
specifications for the linear concept. The performance specifications
obtained with the modified linear thyratron were limited by design
constraints resulting from the original configuration of the thyratron. As
discussed in previous sections, there exist alternate geometries for which
linear thyratron performance could exceed that described below.
8.2 HIGH-VOLTAGE PULSER
-:. A 100 kV power supply was designed and built to pulse charge the
pulse forming line (PFN) that was switched by the modified linear
thyratron. An electrical schematic of the 100-kV power supply and
schematics of the voltage and current waveforms at various points in the
circuit appear in Figure 8-1. A capacitor bank (Cl) is dc charged to a
maximum of 10 k. This capacitor is charged in a few seconds and therefore
must be sized large enough to supply current for many successive charges of
the PFN during burst mode operation. Upon triggering an F-195 thyratron,
8-1

0 0 >
2: E4
In
I w'
00
00
E- W 0
-4.1-4
In
* '~ 0< bo
*4a 00
-4 Ln n u-e
U) -
'a VC% %*%d1
o*
.1
% * ~ ~ ~
%~
,~.-

capacitor C1 is partially discharged through an inductor Li (doubling the
voltage), and a 1:6 iron core transformer thereby pulse charges the 3-stage
7 nF PFN up to 100 k. The charging time to maximum voltage is
approximately 15 ps. Therefore, the thyratron must hold off N0% of the
maximum charging voltage for >5 #s. The PFN is subsequently switched by
the modified linear thyratron and discharged through a 10-100 0 load
resistor.
The charging and switching voltage of the thyratron is monitored with
a 50-k0 resistive voltage divider which bleeds off approximately 10 percent
of the charging current during the charging cycle. A capacitive voltage
divider was initially used and later abandoned due to excessive noise. A
Pearson current transformer monitors the current through the thyratron.
8.3 LINAR TIflATRON AND LABOlATORT MODIFICATIONS
In accordance with the design criteria described in preceeding
sections, the existing linear thyratron was modified for operation at
higher voltages with a goal of 100 k. A scheuatic of the modified linear
thyratron appears in Figure 8-2. Photographs of the subassemblies for the
linear thyratron appear in Figure 8-3. The control grid assembly is shown
in Figure 8-3a. The parts are (from left to right) the control grid, a
plug for the control grid slot, the control grid baffle, and a mounting
collar. The anode is shown in Figure 8-3b and the teflon high-voltage
insulator is shown in Figure 8-3c. A partial assembly photograph of the
linear thyratron is shown in Figure 8-3d. This sub-assembly of the linear
thyratron excludes the lower flange upon which the cathode assembly is
mounted. The windows, insulator, and anode are not in place. The control
grid is shown protruding from the case of the thyratron. A teflon mounting
collar is shown at the base of the control grid. The purpose of the
mounting collar is to insure proper spacing between the control grid and
the insulator. The top four feedthroughs are for the control grid.
Schematics of the parts for the -ontrol grid appear in Figure 8-4. The
fully assembled linear thyratron is shown in Figure 1-5.
8-3

OPTICAL PORT
ANODE
.---------- INSULATOR
-,GRID BAFFLE
ELECTRICALFEEDTHROUGH
- C"ONTROL GRID
-- OPTICAL PORT' ---HEAT SHIELD
-AUXILIARY GRIDCATHODE CTRICAL
FEEDTHROUGH
~BASE
FLANGEi,.
00 1 2 3 4 5
Figure 8-2. Schematic of the Modified Linear Thyratron.
8-4
'da m P/a.Ia .laaji~ I~.~a %~f \J ~ ~ . %,'fa,\ ~ ~ S . --- --- ---

SC)@c a lechnology n
a) Left to F-Ight) C-ontrol Grid, Crntro' 6rid ziot Ii~Control Grid Slot Baffle and Pounting Collar
%,
b)AndeAse'l
LierTyaro 'i n noeCmoet
a8-5
R-A194 111 LINEAR THYRATRON(U) SPECTRA TECHNOLOGY INC BELLEVUE MA 3/3N J KCUSHNER ET AL. 31 JUL 87 RFNRL-TR-97-2090F33615-84-C-2474
UN~tiFEEE/hhEE1g.Iiiim EE1hE

IL
:11~1.25 111 .4 11111 1.6
-"Dy R- nl "-Ir TEST CHARTk. OAL 9UE~ OF ST&NANwS, 196,1
16
A%
%14.

,44K~j~UW RTXV -kuk l. I -wdV
c) Hiah Voltage insulator
d)PrilAsebyo iea hrto
d),pt Partil insembl.o Linear Thyratron IsltradPrilAsml
Photoq rayhs
8-6

r4~
-. 44
Qc
o od
N 0W
CDC
I 8-7

The laboratory setup is shown in Figure 8-5. The oil tank is
internally separated into two sections; one for the 100-kV step-up
transformer and one for the pulse forming line. The compartments can be
separately filled with oil. A cover for the oil tank (not shown) vacuum
seals the tank to enable the interior to be evacuated. The transformer and
oil were separately Idegassed' by evacuating the tank to a pressure of
<100 mTorr for >72 hours. The oil was then backfilled into the transformer
compartment. The transformer was subsequently kept under oil for the
remainder of the study. The linear thyratron is mounted upside down to
enable the high voltage section to be immersed in oil without also
immersing the electrical feedthroughs, windows, and vacuum connections.
Metallic cups were built to fit around the large end windows to enable oil
immersion to approximately half the window height while still allowing one
to view the interior. The linear thyratron is connected to a 10-ca
diffusion pump by the 5-cm tubing approximately 1.5 m in length. The
diffusion pump is continuously cold trapped to -50 C. The background
pressure, as measured by an ion gauge located on the pump side of the 5-cm-8
tubing is typically 4 X 10 Torr.
8.4 PRBLIMINAlY SWITCHING TIALS WITH TED MODIFIED LINBAR TRIRATION
Initial testing of the modified linear thyratron was performed in
hydrogen and consisted of charging the PFN, switching the thyratron, and
checking for pre-fires at a repetition rate of 01 Hz. The thyratron was
operated while simultaneously pulsing the auxiliary and control grids
(voltage 2-4 kV) and without a dc auxiliary grid current. For these
*trials, the high-voltage insulator was made of Teflon. Triggering occurred
at the peak of the PFN charging cycle (N15 /s). Typical traces of thecharging and switching cycles for the modified linear thyratron is shown in
Figure 8-6. The left trace (5'kV/div, 5 /s/div) is of the anode voltage of
the thyratron. The right trace (100 A/div, 500 ns/div) is of the current
through the load.
8-8

64
0
0
..4
8-9a
oz,

610992-
Left: Anode Charging Voltage Right: Current(5 kV/djv, 5 Ijs/div) (100 A/div, 500 ns/div)
Figure 8-6. Typical V-I Traces for High-Voltage Operation of ModifiedILinear Thyratron. (30 kV max, H 2 ' 150 asm)
8-10
'r JON.N5

Initial trials with the modified linear thyratron were only
marginally successful. The maximum holdoff voltage in hydrogen (150 #n)
was 017.5 kV. Prefiring was observed to consist of arcing at the outer
edge of the control grid-anode gap and preferentially on one side of the
thyratron. We measured the holdoff voltage in vacuum and obtained nearly
identical results, leading us to suspect field emission as the source of
prefiring. The thyratron was disassembled and examined. The control grid
showed evidence of arcing only along its edges. A small amount of damage
was noted on the insulator adjacent to the arc spots. Upon measuring the
dimensions of the grid parts, we found that the edges of the control grid
and anode had not been machined to specified radii. The measured radii
were <10 ail; the specified radii were 60 il. The control grid-anode gap
was measured to be 60 * 10 ails, also below specifications (100 * 5 mils).
The small edge radii for the control grid and anode resulted in excessive
field enhancement. The gap being too narrow resulted in excessive electric
field penetration through the control grid slot. Both effects contributed
to prefiring. The thyratron parts were returned to the machine shop. The
edges of the control grid and anode were machined to radii of 60 ail andthe control grid-anode gap was widened to 100 ails. The thyratron was
reassembled. The orientation of the insulator was turned by 180* to move
the damaged portion away from the control grid-anode gap.
Subsequent testing of the thyratron hydrogen was initially more
successful. A dc simmer current was used between the auxiliary grid and
the cathode for these trials. Without further conditioning, we switched
48 kV (H2, 150 #m) at a repetition rate of 1 Hs. After accumulating M100
shots, though, the holdoff voltage of the thyratron monotonically
decreased. Attempts to further condition the thyratron by purposely
operating at low voltage failed. When holdoff voltage fell to below 20 kV,
the thyratron was disassembled and examined. There appeared to be no
physical damage to either the control grid or the insulator, although the
",. insulator was slightly discolored at the level of the control grid-anode
gap. The anode had isolated arc spots. The surfaces of the control grid
and anode were wiped with a white cloth and were clean with the exception
~8-11

of the surface of the anode facing the control grid. This surface was
covered with a thin film, which appeared black on the cloth. The film was
not analysed; however, we found the film only on the anode. Thus, we felt
this resulted from negatively charged fluorocarbon ions generated from
outgassing or plasma induced desorption from the Teflon insulator. The
Teflon insulator was replaced with one identically shaped made of Macor
ceramic.
8.5 IIGH-VOLTAGB OPERATION OF THB MODIFIED LINEAl TRIMATION
The results for high-voltage operation of the modified linear
thyratron reported here will be exclusively for operation in hydrogen and
helium. In general, holdoff in helium was superior to that in hydrogen for
a given pressure; however, we were able to reliably switch the thyratron in
helium only at relatively high pressures ( 500 #n) and corresponding low
holdoff voltages (< 50 kV) with the standard control grid pulser. For
example, holdoff and switching at 35 kV in helium was obtained at the
Paschen limited pressure of 550 pm. For operation in hydrogen, the same
performance required a pressure of 225 pa. The inability to switch in He
at low pressure was circumvented by building a second control grid pulser
operating at 515 kV. Switching could then be obtain in He at pressures
200 mu\n at voltages of 85 kY. The higher control grid pulser voltage
was necessary due to the large cathode-control grid gap. This is, in
principle, a problem solved by modifying the cathode-control grid region to
operate on a more favorable portion of Paschen's curve.
Thyratron operation was evaluated by the ability to both holdoff and
reliably switch a desired voltage. No attempt was made to maximize dI/dt
switched by the thyratron. Unsuccessful operation occured when the
thyratron prefired at a voltage less than the peak of the charging cycle or
the thyratron could not be switched on command. The former is a 'failure'
because the tube did not hold off voltage for the entire charging cycle but
could conceivably be a 'success' for a shorter charging period. Unless
otherwise noted, the auxiliary grid was operated with a reverse dc simmer
8-12
------

current. That is, the dc voltage on the auxiliary grid was negative with
respect to the cathode. This mode of operation was required for dc
discharge stability by having the auxiliary grid act as a hollow cathode.
The control and auxiliary grids were simultaneously pulsed with voltages of
2.5-5.0 kV in hydrogen. The control grid was operated at 5-15 kV in
helium.
The maximum switching voltage for operation in R2 is shown in
Figure 8-7 as a function of gas pressure. Current and voltage waveforms
for operation at 80 kV are also shown in Figure 8-7. The thyratron was
reliably operated in the 90-95 kV range. The maximum dI/dt was 1.8X10 A-
s although we did not attempt to maximise this value by minimizing
inductance in the discharge circuit. The voltage fall time for this range
of switching voltage is shown in Figure 8-8. The voltage fall time for gas
discharge switches operating on the near side of Paschen's curve typically
increases with increasing holdoff voltage. This trend is qualitatively
followed in these results; however, there appears to be a fast and a slow
branch for the voltage fall time. The separate branches indicate some type
of bimodal switching behavior. Examples of voltage waveforms for the fast
and slow branches are shown in Figure 8-9. The current rise times are also
a., short and long respectively. This behavior cannot presently be explained,
but may result from fluctuations observed in the spatial distribution of
the dc simmer discharge. The fast branch could also be a 'switched'
prefire; that is, a discharge which resembles an arc more than a glow and
therefore is more rapid. We assume that a prefire is more like an arc than
a glow. At sufficiently high voltage where the prefire becomes more
probable, it may be possible to 'trigger' a prefire in the same fashion
that one triggers a glow discharge.
The failure mode for switching at high voltages and low pressures
(<150 #m H2) was both from prefire and the inability to switch the tube on
command. To obtain reliable switching a dc simer current between the
auxiliary grid and the cathode was required. To obtain a reliable dc
simmer current, the auxiliary grid had to be negative with respect to the
8-13

0
0
/ E)
0
U, 0
0 0
.NP.
E R WPde 4)UM
B rz.
9V-% V-
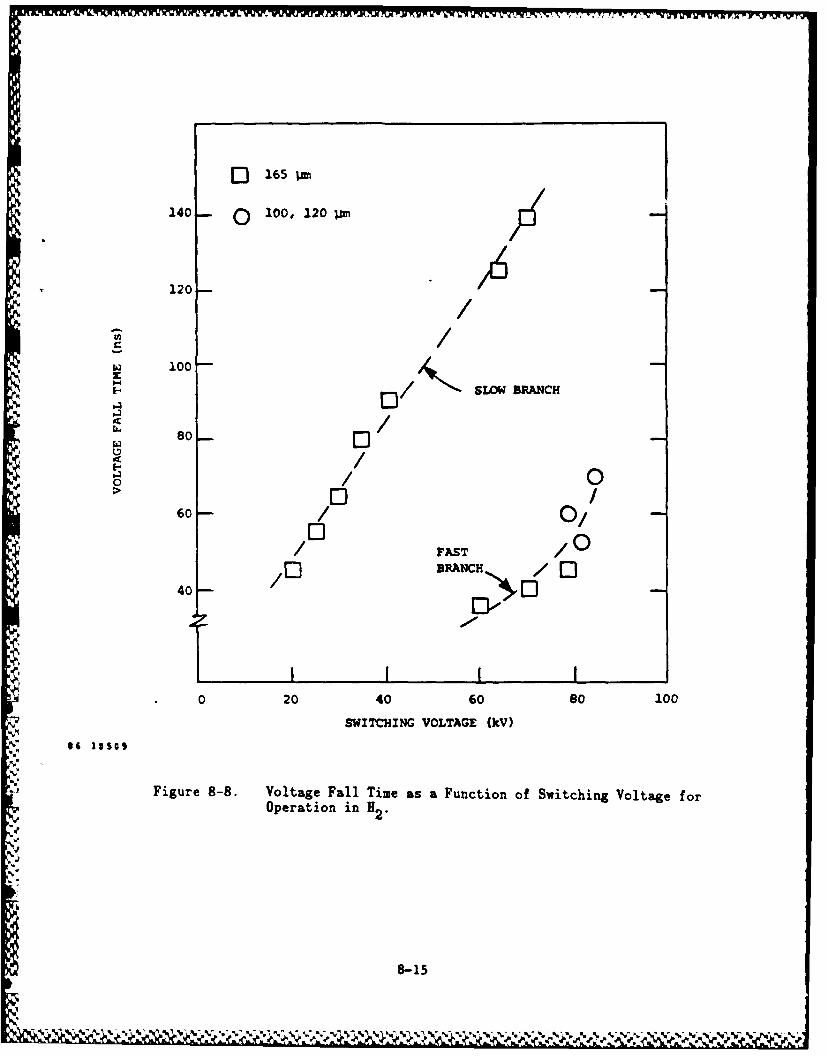
Q ) 165 im
140 0 100, 120 .m'
120 -/Z
//
100 -
ASLOW BRANCH
80 /
0I 060/ 0
/ FAST / 0BRANCH /0
400 D
0 20 40 60 80 100
SWITCHING VOLTAGE (MV)
S6 135012
Figure 8-8. Voltage Fall Time as a Function of Switching Voltage forOperation in H2.
8-15

(a) 120 umH
(b) 167 pm~ H 2
Figure 8-9. I-V Characteristics for Switching in H 2 Showing (a) Fast and(b) Slow Behavior. (Voltage left trace, current righttrace; 20 kV/div, 250A/div, 100 ns/div.)
8-16

'cathode,' thereby acting like a hollow cathode. The thickness of the
cathode dark space for each of the parallel opposing auxiliary grids
increased with decreasing gas pressure. At sufficiently low pressure the
opposing cathode dark spaces met and the dc discharge could no longer be
sustained. At this time triggering became sore difficult.
Holdoff failure due to prefire results from exceeding the Paschen
breakdown voltage for a given pod product. When prefire occurs at a given
voltage, the gas pressure must be reduced. This mode of operation was
pursued until the dc simer current could no longer be sustained. In the
absence of triggering, pulsed holdoff for the duration of the charging
cycle could not be obtained at voltages greater than 95 kY in hydrogen. We
operated the control grid with a negative dc bias of -200 V to determine
whether prefire was a result of potential penetration through the control
grid slot or as a result of exceeding the Paschen limit. We did not
increase holdoff voltage with the negative dc bias, thereby suggesting that
prefire is a result of exceeding the Paschen limit.
Similar high-voltage switching performance was obtained when
operating in helium. The maximum switching voltage for operation in He isshown in Figure 8-10 as a function of gas pressure. A voltage waveforms
for operation at 75 kY is also shown in Figure 8-10. The thyratron was
reliably operated only in the 75-85 kV range, less than in hydrogen.
The gas pressure for a given switching voltage is higher when using
helium than when operating in H2 , thereby suggesting that higher voltage
operation could be ultimately achieved in helium. The voltage trials in He
were conducted chronologically after those in hydrogen and therefore we
suspected that we had accumulated damage to the thyratron. The linear
thyratron was disassembled and inspected. Arc marks were found on the
edges of the control grid however damage was minimal. We did, however,
measure the control-grid anode gap and found that it was 150 mills compared
to the 100 mills measured during the hydrogen trials. We determined that
the control grid had slipped in the teflon mounting collar at some previous
8-17
.

* .J ~- - -. J~ .. ~ ..CD
00
,/ 0
0
0 C0/ CC.
Go'4-4
0K,>
(A 1) 3OV110A EDNIHOIJMS vdlfnvixvy~i
E to
0 ~c'~
0 Wa
NJ > 0 C* O
8-18
*..~*'" % N' - -. ~ ................ V

time, thereby increasing the control grid-anode gap, and reducing the
holdoff voltage. Upon inspection of the data, this slipping must have
occured near the end of our hydrogen trials and certainly before the helium
trials. In subsequent modifications of the linear thyratron we will
redesign the mounting collar to prevent such slipping.
8.8 DUAL PULSB NIC-VOLTAGB OPSIATION
High repetition rate operation of the linear thyratron requires the
thyratron to recover to its prepulse nonconducting condition during the
interpulse afterglow period and to holdoff the desired charging voltage
until switched by command. The voltage drop across a well behaved
recovered thyratron prior to switching is the open circuit voltage across
the load and equal to the charging voltage of the PFN. If the thyratron
fails to recover in the desired time, then the FFN is terminated by a
finite resistance during the charging period and the voltage drop acrossthe thyratron is less than the open circuit voltage. An indication of the
recovery of the thyratron is therefore YH/C, where VH is the 'holdoff'
voltage across the thyratron on a subsequent charging cycle at the desired
triggering time, and VC is the charging voltage of the initial pulse. A
qualitative requisite for recovery is that VH/VC > 0.95. The typical
failure mode for the modified linear thyratron during repetitive pulse
operation is to have YH/VC < 1.0. Inadequate recovery may also result from
prefiring of the thyratron on subsequent charging cycles. This type of
recovery failure was not observed with the modified linear thyratron.
Voltage waveforms demonstrating successful and unsuccessful recovery
of the thyratron for a pulse separations of 5 ms (200 Hs) and 2 as (500 Hs)
respectively are shown in Figure 8-11. The conditions are VC = 45 kV for
H2 at 100 pm. The first pulse is that shown being switched at the peak ofthe charging cycle. The second pulse is not switched and shows damped LC
ringing at the resonant frequency of the charging circuit.
8-19
Se . " :." .: ."."."..-. . .; .. / . % ''_'. .:%,',,. . . , .,,: '. . . , '¢ ¢ ,. - .", ". : -'

5-ms Pulse Separation(a)
2-ms Pulse Separation(b)
(5 Us/DI, 1CkV,/div)
Figure 8-11. Dual Pulse Operation Showing (a) Successful Recovery at 5-ms
Pulse Separation and (b) Unsuccessful Recovery at 2-msSeparation.
1"
8-20
,Y

Note that the second charging cycle for the fully recovered case in
Figure 8-11 has a peak voltage approximately 10 percent higher than the
first. The higher voltage on the second charging cycle is logically a
result of there being charge left on the PFN from the first pulse when the
second pulse begins to charge. In this case, the initial voltage should
register as an offset in the base line of the voltage at the start of the
charging cycle, which is not the case. The resistive damping of the
charging voltage has an e-folding period of 025 ps which, for a 5-ms pulse
separation, would also imply a negligible voltage left on the PFN. The
origin of the higher second pulse voltage is therefore presently
unexplained. This voltage could detrimentally impact the recovery of the
thyratron, an will be discussed below.
Recovery with VH/VC = 1.0 was obtained in hydrogen for pulse
separations of ? 5-ms (equivalent repetition rates of 5 200 Is) for all
combinations of voltages and pressures investigated (30-80 k, 85-200 #m).
Recovery began to degrade for pulse separations of less than 5 ms as shown
in Figure 8-12. The degradation in recovery with decreasing pulse
separation is the same for a large range of charging voltage and pressure.The limit for recovery (VH/VC ? 0.95) in the present device is for a pulse
separation of 03.5-ms (0300 Hs).
Recovery is obtained by the gas relaxing to its predischarge state.
By relaxing we mean that the plasma has recombined and that the gas
density, perturbed due to gas heating, has returned to its prepulse value.
If the gas density does not not uniformly return to its prepulse condition,
then recovery can degrade by a violation of Paschen's law. If the plasma
remains hot, recovery can degrade by a reduction in recombination rates.
(Two body recombination has a temperature dependence of T 0 5 whereas threeee
body recombination has a dependence of Te4 "5 .) Recombination can also
proceed by diffusion and heterogeneous processes at the wall.
A simple set of rate equations can be written for recovery in
hydrogen plasmas based on the processes listed in Table 8-1. Since the
8-21
.,,.

PE Nil RV M It W TVAi--
Table 8-1U1ACTIONS AND DATB CONSTANTS FOR RECOVERY IN AN 12 PLASMA
Reaction lat. Contaatt
e + H 4 + 12+ 2.5(-8)
e + H + H 4.2(-12)
ee + H 4 1 + 2.0(-1)
e + H+ 4 2H+ 2.0(-B)
H + +4H, 2.0(-2g)
2' + 0.H2 O.-(lD Hi3~f)
B + 1 [ 1440/(P(f + 4(- )2 2 D D)+18500f1)
H+ 1.5012 11BO/(P(fD + O.S*(l-fD + 2 f )
Rate constants are in units of 238-1 and cms- at room temperature.
I denotes heterogeneous recombination at the wall with diffusion
constant (cm2s1I), as noted, where P is the gas pressure (Torr), fD is
* - the fractional dissociation and f1 is the fractional ionization.
8-22
5, '5 '5 -- r - '5W5

1.0 _-
0.8
0.6 0
0.4
0.2 Q
0 __j0 12 3 4 5
PULSE SEPARATION (as)
Figure B-12. Recovery Voltage as a Faction of Charging Voltage as aFunction of Pulse Separation for Operation in K2
.4.66 109 7 6
8-23

cooling rate for electrons in a hydrogen afterglow is on the order of
MeV/s, the electrons thermalise to the gas temperature within tens of
microseconds. The rates in the table are therefore for room temperature.
In the absence of diffusion, the densities of charged species in a
hydrogen afterglow, as computed for the processes in Table 8-1, are plotted
in Figure 8-13. The gas pressure is 0.150 Torr, and the initial conditions
are a fractional ionization of 0.001 and a fraction dissociation of 0.1.
Late in the afterglow the positive ion is exclusively Hj+. Significant
recovery is obtained only for times >10 ms. Clearly, recombination by
diffusion is required for rapid recovery. To this extent, the rapid
conversion of positive ions to H+ is beneficial since the diffusion
constant for H+, in the absence of charge exchange collisions, is higher
than either H or H.
Now including diffusion, the recovery time is plotted in Figure 8-14
as a function of wall separation. Recovery time is defined as the time
required for the electron density to fall below 105cm-3 . Recovery is less
than 1 ms requires a wall separation of <3 ca. The control grid-anode gap
is 2.5 = whereas the wall separation in the cathode-control grid gap is
1.5-4 cm. Although the plasma within the control grid-anode gap may be
fully recovered in tens of microseconds, it is possible that the plasma
within the control grid is not fully recovered for many milliseconds. The
penetration of electric potential through the control grid slot when
voltage is applied to the anode may then draw plasma from within the
control grid into the gap, thereby preventing holdoff.
We mentioned above that the charging voltage on the second pulse is
always 10 percent higher than on the first. The origin of this additional
voltage is presently unknown. If a voltage is dropped across the thyratron
for a substantial fraction of the interpulse period, the plasma temperature
may remain high and recombination processes could be impeded. To the
extent that recovery is dominated by diffusion, an elevated temperature
should not degrade recovery unless the temperature is high enough to
8-24

I' 1013
103
10 11
HS +
10 8
106
105
10~ 106 10~ 101 102
TINE (ns)
Figure 8-13. Electron and Ion Densities in the Absence of Diffusion in aThyratron Plasma Afterglow.
4'
8-25

10-2I
10- 3 -
10- 4
10- 51% 11 10 100
WALL SEPARATION (cm)
Figure 8-14. Thyratron Recovery Time as a Function of Wall Separation.
66 1 0 6-
i 8-26
:, .P v " 'Ve "%' . , . i ' a . . ' ," -. , - . ," . . ._ ,- ,- - ,,..- -. ," , ." . - . . - . . - .. . - . - _

sustain ionization. We have determined the electron temperature and
applied electric field required to sustain ionization equal to a specified
fraction of the rate of diffusion for a 1-cm wall separation (P = 0.15
Torr). This electric field is plotted in Figure 8-15. We have assumed an
ambipolar enhanced rate of diffusion for the electron temperature. To
significantly lengthen the recovery time (i.e. RIonisation/RDiffusion l*O)
the voltage drop need only be 50 V/cm. Therefore a small residual
potential on the PFN could be responsible for the long recovery time
measured for the modified thyratron.
Given the figures in the preceding paragraph, we remeasured the
voltage across the thyratron with a long time base, looking for voltages of
tens to hundreds of volts to determine whether high repetition rate
operation was being degraded by residual voltage across the thyratron. A
sample of the results is plotted in Figure 8-16 where we see voltage spikes
of a few hundred volts occurring up to 3 as after triggering. The origin
of these voltage spikes is energy stored in the large step-up transformer
which then Ileaks' out with the appropriate LC time constant long after the
discharge pulse is over. Voltage of this magnitude impressed across the
thyratron is sufficient to slow down recovery in the manner described
above. Note that the degradation in recovery at a pulse separation of 3 ms
(see Figure 8-12) corresponds to the cessation of voltage spikes at 3 ms
shown in Figure 8-16.
8.7 BURST MODB HIGI-VOLTAGB OPBIATION
The modified linear thyratron was operated with a burst of five
pulses to examine its recovery capability. For all conditions for which
recovery and triggering were obtained for two pulses, recovery and
switching could be obtained for five pulses; that is, five pulse burst mode
performance was obtained for pulse separation down to 5 s (200 Hz). An
example of switching a burst of five pulses appears in Figure 8-17. The
charging voltage is 60 kV, H2 pressure is 180 pm, and the pulse separation
is 10 is. The drop in voltage on successive pulses is not related to
8-27

50 1000
5_ 100
0.5 10 I I I I I10" 10- 10- 10- 10- 1
RIO/RDIFFUSION
Figure 8-15. Electric Field Required to Obtain an Ionization Rate (R ion)
that is a Specified Fraction of the Rate of Diffusion (R
diffusion).
8-28

86 10981
Figure 8-16. Post Discharge Voltage Spikes ImpressedAcross the Linear Thyratron.
(200V/DIV, I ms/DIV).
8-29

I,

ILI IM -V X7Wb. - - -, XI-.w -v "
recovery but is a result of a decreasing voltage on the pulser storage
capacitor.
71
8-3

Section 9
HIGH REPETITION RATE AND SWITCHING RATE OPERATION WITH TH FINAL LINEAR
THTMATRON MODIFICATION
9.1 INTRODUCTION
This section describes the final modifications made to the linear
thyratron and the results achieved. Also, a conceptual design for a radial
discharge linear thyratron is presented. The goals of this final phase were
to achieve, simultaneously, the switching of 100 kV with dI/dt > 1011 A/s in a
burst mode at > 2 kHs. Apart from the switching voltage, which was limited to
60 kV, these goals were met.
The modifications to the modulator circuit required to meet the desired
2-kHz rep rate were greater than originally anticipated and became a
substantial drain on the program. Consequently, the experimental scope of
this phase was limited and it was not possible to perform an 'autopsy' of the
thyratron, including the dispenser cathode, at the end of the program.
9.2 LINEAR TIRATRON MODIFICATIONS
Figure 9-1 shows the final linear thyratron modification. The most
obvious modification is the lower location of the anode-control grid gap in
the insulator. The intention is to decrease the length of the low field drift
region in the control grid and improve the switching time. Lowering the gaphas the disadvantage of raising electric field stresses across the dielectric
surface and at the triple point where the insulator rests on the LT body.
These regions were carefully modeled with the PANDIRA electro-magnetostatic
codes to limit the field stresses across dielectric surfaces to <100 kV/cm and
on conductor surfaces to <1 MV/cm.
Further modifications increased the slot width to 0.15 inch, radiused
the slot corners with a 0.03 inch radius. The baffling was reduced by
9-1' 4
= -. ~ ~ V V V % V % % U ~ - U v~ %-.w.-.. %..-U

ANODE STEM BASE PURGE GAS INLET
-Y INSULATOR
ANODE FLANGE
CONTROL GRID
*BORON NITRIDE ISOLATORAND
CONTROL GRIDFEE DTHROUGH
LOCK NUTGRID BAFFLE
CATHODE
FEEDTROUGHAUXILIARY GRID
Figure 9-i. Schematic Final Linear Thyratron Geometry.
9-2

increasing the baffle-slot gap to 0.18 inch while maintaining the relative
position of the lower side of the baffle (ie. making the baffle thinner). The
side wall of the control grid was also thinned to 0.03 inch to further reduce
both the baffling and the extent of the drift region. The analysis predicted
that a negative bias voltage of 200-400 V on the control grid would be
necessary to reduce high voltage field penetration into the baffle-slot region
because of the looser baffling. Otherwise the high-voltage hold-off would be
impaired. These modifications are intended to improve switching time, while
maintaining voltage holdoff. The anode stem is split to allow shimming and
enable the anode and control grid faces to be aligned to better than 0.002
inch, or 2 percent of the gap. The anode flange has been stiffened and the
top portion of the anode stem is hand finished to give a slip fit into the
insulator. This ensures a uniform anode-dielectric gap around the anode
stem. The final modification added a 0.025 inch radius diamond pinhole to the
anode to allow purging of the anode-control grid-slot-insulator regions at a
few sccm. Gas is fed to the pinhole through a coiled glass tube for
high-voltage holdoff.
Assembly begins with accurately locating the control grid and bafflewithin the LT body and then placing the insulator around the control grid.
When the control grid-insulator spacing is set, the anode flange is attached
to hold the insulator in place, and the anode stem is attached through the
flange. The whole assembly is then attached to the cathode flange. This
procedure allows tight tolerances to be held for all critical dimensions, with
emphasis on parallelism rather than absolute dimensions.
All the internal metal pieces are stainless steel. While this isadequate for most purposes, a molybdenum plated anode tip and, perhaps,
control grid would be preferable, as damage to both these surfaces was
observed in the previously modified LT.
9.2.1 Modulator Modifications
9-3
.. % f#. %%%fd .~~a a

In order to meet the goals of this phase it was necessary to rebuild the
modulator and grid trigger circuits. The previous modulator was designed for
5200 Hs operation at <100 kV compared with >2 kHs at 1100 kV in this phase.
Figure 9.2 shows the modified modulator circuit in its high rep rate and
high-voltage configurations. The pulse transformer from the previous phase
was designed for 200 Us and could not be replaced. The control grid and
auxiliary grid trigger circuits were modified for 15 kV output at up to 5 kHs
for the desired burst of 5 pulses.
It was necessary to add the saturable inductor to enable the modulator
thyratron to recover and yet operate at high rep rate. Even with the
saturable inductor, the modulator is limited to 1 kHs in its standard
configuration (Figure 9-2a). For higher rep rates the modulator switch hangs
up and dumps the storage capacitor. This configuration is capable of
delivering up to 120 kV to the LT circuit, however.
In order to improve the rep rate the circuit was modified to that shown
in Figure 9-2b. This configuration uses the transformer to help the modulator
switch recover and enables operation to slightly greater than 3 kHs.
Unfortunately, this configuration floats the primary of the pulse transformer
at high voltage and requires reversal of either the primary or secondary leads
to maintain the correct output polarity to the LT circuit. This places high
and low-voltage windings in close proximity to each other and to the
transformer core and breakdown occurs at any output greater than 60kV. This
breakdown hangs up the switch and dumps the storage capacitor through the
shorted transformer. Large negative voltage transients are observed in the
secondary.
It was while inadvertently discovering this failure mode that the LT may
have been damaged, as discussed later. The LT circuit is a RLC circuit with
the inductor winding removed from the circuit to reduce circuit limitations on
both current switching times and peak currents. The stray inductance is still
significant and the circuit is slightly underdamped.
9-4
-.- L- .. . .S. .. . ..- J.

CONSTANTCURRENTCORERESET
120oV 6.7 Ioo a LINEAR THYRATRON
.39 jf5.4 nF10 KVZ..I
CIRCUIT GRIDT1RIGGER
6.3 E:CIRCUITS_*1_1l ®ELINEAR THYRATRON
4cnANODE PULSE SUPPLY
CONSTANTCURRENTCORE
RESET
20 KV 8 UNEAR THYRATRON
5.4 nF
10 KV .7 IT 10 MF a
ANODE won,MODULATOR F-195 QJ
ORCUIT
6.3 TRIGGER
ANODE LINEAR THYRATRON1TRIGGERORCUIT ANODE PULSE SUPPLY
Figure 9-2. Modulator Circuit for (a) 0-120 kY, (b) 0-3 kHz Testing.
9-5

0.3 IXPBIInnwTAL LBSULTS
0.3.1 Voltage loldoff
The modified LT was first tested up to 50 kV in air to ensure that the
system was completely vacuum tight and operational. This was when the rep
rate limit of the circuit of Figure 9-2A was discovered and modified to that
of Figure 9-2b. The LT was then immersed in oil and tested at higher
voltage. At 80 kV the LT appeared to be prefiring, independent of gas type or
pressure. Every time this apparent prefire occurred, however, the modulator
switch would hang up, as previously mentioned. A prefiring LT would not cause
this to happen and it was discovered that the pulse transformer was breaking
down internally. The LT is not designed for the large negative voltage and
current transients which occurred and may have been damaged. Even when the
modulator was reconfigured for high-voltage operation, the LT would not hold
off more than 60 kV.
There is another possible explanation for the lower than expected
voltage capability of the LT. Windows at the ends of the LT body allow
observation and diagnosis of the cathode-control grid region. When LT prefire
is due to Paschen breakdown, a discharge is observed in the cathode-control
grid region. At the 60 kV breakdown limit, this discharge is not seen. Light
is observed from the side of the control grid, indicating that the breakdown
path is down the control grid-insulator gap to the LT body. The breakdown
occurs at the same location every time.
The machined hole in the macor insulator is not completely symmetrical,
and varies in width by as much as 0.01 inch. This, coupled with the
possibility that the insulator may not have been accurately placed around the
control grid, may lead to regions of the control grid-insulator gap being
significantly wider than the 0.030 inch design, which was also the valueassumed in the modeling. A wider gap would allow the high field region to
penetrate further down the gap than designed, decreasing the holdoff
capability.
-17s
! ,.. 9-8* 4 ~ rvW ;%

A combination of reverse current damage and field penetration into the
control grid-insulator gap would explain a large part of the limited holdoff
capability. The stainless steel anode and control grid are particularly prone
to arc damage and sputtering under these conditions. If the anode-control
grid gap were deeper into the insulator, this problem would be decreased, at
the expense of switching rate.
Once the LT has been immersed in oil, it is a delicate and time
consuming procedure to dismantle it without risking serious poisoning of the
dispenser cathode. The program expired before an 'autopsy' could be
performed. Until this can be done, the preceding observations must be
considered conjecture, and the LT to be a 60 kV switch until proven
otherwise.
9.3.2 Paschen Breakdown
Figure 9-3 shows the measured voltage holdoff limits as a function of
gas pressure for H2 , He and a mixture of 60 percent 12 and 40 percent He. The
pure gas data were obtained with the purge flow on. This was not possible
with the mixture and limited the number of shots which could be taken. These
data are compared with the results from the previous phase. For voltages
below 60 kV,the new LT performs better than the previous device. This is due
to the care taken in holding critical dimensions as closely as possible, and
to the radiusing of the control grid slot corners.
The addition of even small amounts of 12 into He appears to degrade theholdoff capabilities of the LT below the He values. No 'magic' mixture was
observed to yield superior performance. This is not totally conclusive since
mixtures were only investigated in a cursory manner and in non-optimum
conditions.
The data shown in Figure 9-3 required a 300-V negative grid bias because
of the wide slot and loose baffling. Flow of a few scca greatly improved shot
to shot repeatability, and allowed the data to be acquired on a more or less
9-7

871 54.68
* H2. PHASE 3* H2 , PHASE 2
D He, PHASE 3 _______
*0 He. PHASE 2
x 60% H2. 40% He
100-
80-
LL
0 60- 00
-40
40
0 200 400 600 S00 1000
PRESSURE (millitorr)
Figure 9-3. LT loldoff Voltage as a Function of Gas Pressure for theModified LT's.
9-8

continuous basis, rather than the frequent flush and fill required in the
previous Phase.
9.3.3 Switching Rates
One of the major goals of this phase was to demonstrate respectable
current and voltage switching rates, even for this highly non-optimum
geometry. Firgure 9-4 shows current and voltage traces in 100 mTorr He with a
negative 300-V grid bias and 50-kY charge voltage. The leading edges of the
traces were difficult to resolve due to the writing speed of the oscilloscope,
but showed more clearly on the Polaroid negative. The current trace rises to
1 kA in 10 ns for a dI/dt of 1011 A/s. The current monitor is a Pearson
probe, model 100. The specifications for this probe give a rise time of 20 us
for a square wave pulse. Furthermore, the same minimum rise time is observed
in both H2 and He for a range of pressures. The value of 1011 A/s is
therefore diagnostically limited and is a lower bound for the maximum dI/dt.
The voltage trace drops to 7 kV in 40 ns for a dV/dt of 1012 V/s. As
the voltage is decreased further below the holdoff limit the switching rates
decrease. The highest switching rates are only observed after the LT has beenrun for a while. When the system is first turned on the switching rates are
very low. Figure 9-5 shows an exaiple when the device is first turned on with
100 mTorr H2 and 44 k. In this case dI/dt = 7M10O A s and dV/dt = 5X10¹¹
V/s.
The dispenser cathode has been removed at least 10 times from the
*various versions of the LT and has been run cold for many thousands of shots.
• 'The likelihood of poisoning and/or depletion of the cathode is high. If the
* LT is run at about 1 Hz for a few minutes with a gas purge flow and the
voltage gradually increased, then it operates repeatably and reliably.
9-9

CURRENT 500 A/DIV
410
/-- VOLTAGE 20 KV/DIVJ/
- - -4V =0
- 100 ns/DIV
Figure 9-4. VI Switching Characteristics.
CURRENT 500 A/DIV
--. VOLTAGE 20 KV/DIV
\0-- 4V= 0
100 ns/DIV
8715469
Figure 9-5. Startup Switching Characteristics.
9-10
3 ,Zr,.,'' ..' ''*''''''" "''''"" ". s -. j"" . ". "# ,' .., .. . . . - -. -. ,_- -. •. .. .

9.3.4 Rep late and Switching Power
The LT was tested up to 60 kY to over 3 kls. Figure 9-6 shows a burst
of 5 shots at 3 kls with a 34-kV charge. the variation in voltage is due to
both droop in the storage capacitor and partial saturation of the pulse
transformer core. At rep rates slightly greater than 3 kHs, the modulator
switch hangs up. The first shot is at higher voltage and its current trace
does not appear. The current traces show 0100 ns jitter between the second
and last shots, with the middle two almost indistinguishable. The jitter is
mostly due to the different voltages at which each pulse was switched.
The same rep rate limit was observed up to 60 k, but the jitter becomes
much worse and saturation of the transformer core leads to erratic traces
making clean data difficult to obtain. These limits are modulator governed,
and the rep rate capability of the LT has not been fully tested or
demonstrated.
With a 5.4-nF capacitance at 80 kY, the switched energy is 9.7 J/pulse
and at a 3-kHs the mean switched power is 29 kW. These values could be raised
by increasing the capacitance. The energy per pulse and pulse length limits
of the LT are unknown.
The highest switched current was 2.25 KA at 60 kV in 100 mTorr He. This
corresponds to a peak instantaneous switching power of 135 MW. There are no
signs of saturation by either the cathode or the control grid slot in either
He or H2 and the ultimate current capability of the LT has not been reached.
9.4 A RADIAL DISCHAIGE LINEAR THYIRATION CONCEPTUAL DESIGN
The Radial Discharge Linear Thyratron (RDLT) is a novel concept for a
high current, high voltage, linear thyratron. The RDLT uses the linear
thyratron approach of increasing current switching capability by increasing
length, but has several advantages over the existing rectangular geometry.
The radial geometry allows several thyratrons to be placed in parallel in a
9-11

CURRENT 500 A/DIVII
-/ - -VOLTAGE 10 KV/DIV
,\V = 0100 ns/DIV CURRENT
8715467 5 ps/DIV VOLTAGE
Figure g-8. VI Traces for a Burst of 5 Pulses at 3 kHz in 800#Thyratron.
9-12
- ---, . ,."* :_,. ' * ,;, A W . ,.,,V,. -. : V , ,,,,A,, , ,,..,, .-,,,, *,, ,. . - . -. _. . - ., -. .. ! ~ ' . ~ .*

volume similar to that occupied by one rectangular thyratron. This yields a
several-fold increase in switching current capability. The electric field
distributions in a radial geometry allow for looser baffling of the control
grid slot and lower surface field enhancements due to the corners in the slot,
enabling faster switching times and higher switching voltages. The radial
geometry also yields a larger cathode surface area than anode surface area,making efficient use of the high anode current densities. The result is a
compact switch with higher switching current (lower impedance), higher
switching voltage, lower inductance and faster switching times than can be
achieved in a rectangular geometry for the same switch length.
Figure 9-7 is a schematic illustration of the RDLT concept. The use of
four separate discharge regions are a suggestion. It may only be reasonable
to use three, or it may be possible to use five or more or to have a
continuous discharge. This will depend on the overall dimensions chosen. The
concept, however, remains unaltered. It should be possible to run the
dispenser cathodes cold, and there will be no problem related to having some
of them 'upside down'. From a design and fabrication point of view, an
end-fed geometry would be preferable, but the resultant inductance penalty is
too great.
The baffle profiles and simmer current geometry shown are suggestions to
help the switching time by bringing the simmer current close to, but still
shielding, the control grid slot - baffle region (COSB). The simmer cathode
is effectively an auxiliary grid. It will probably be necessary to bias the
control grid to ensure adequate sWelding of the CGBS. When the control grid
iis triggered, the sharp baffle corners will focus the discharge towards the
CGSB and help reduce the switching time. The inverse radius dependence of the
electric field in the radial geometry of the cathode - control grid region
will enhance this effect. The control grid vanes ensure that each CGSB 'sees'
only its own cathode. If this approach does not work, it may be necersary to
use a more conventional baffling and auxiliary grid system.
9-13
'I%

DISPENSER
CATHODES(COLD)
.4.O TR RC N UC O
AN~X)EE ANOETrFn
86 10855
5CAS
(CNUCO
Figure 1. Conceptual Design of a Radial Discharge Linear* Thyratron
9-14
P OFW W,% ..- %
it-I

The inverse radius e-field dependence in that anode - control grid
region can be used for two purposes. The field penetration into the CGSB is
significantly lowered, allowing for looser baffling of the slot. Looser
baffling will decrease switching time and switch impedance and inductance.
This is a further reason for the suggested baffle profile. When a constant
potential surface is rounded towards a greater radius in a radial geometry,
the resultant e-field enhancements are lower than would occur when the same
rounding is done in a rectangular geometry. Consequently, the field
enhancements at the slot corners are lower in a radial geometry than in a
rectangular geometry. This will reduce problems due to field emission from
the control grid slot corners and improve switching voltage.
The edge fed geometry enables easy attachment to transmission lines and
the stacking of several RDLT's in series. The case is at cathode potential,
enabling the RDLT to be mounted close to the experiment for most applications,
or even directly to the experiment for some applications.
Because of its higher volume and area efficiencies, the RDLT will have
significantly lower inductance per unit length than the rectangular geometry
and much lower inductance per amp switched. The ability to use looser
baffling will also help reduce the inductance and increase switching current
capability. Some of the current paths in the RDLT will have slightly higher
inductance than others, and it may be necessary to baffle some slots more
tightly than others to compensate for this in very high dI/dt applications.
Cooling both the case (cathodes) and the anode will be relatively
simple. Gas can be fed into the control grid - anode gap to purge this region
and help lifetime issues. The mechanics of the edge feedthrough will take
considerable thought, but termination in the axial direction will not be too
difficult, as illustrated in Figure 9-8.
9-15

END FLANGE
CASE
DISPENSERCATHODE
CONTROLGRID
ANDE E U
i
DIELECTRIC
ANODE EDGE CONNECTION
86 10056
Figure 9-8. Conceptual Scheme to Terminate RDLT.
9-1

4V -- JW 77 . 77 VU-Z. -w r_<wP %* ItK .t *b.S
9.5 SUNMA T
This phase of the LT program has demonstrated the value of electrode and
grid profiling and field modeling in optimizing thyratron performance. The
linear geometry has some intrinsic advantages which have been discussed
previously. It also has the benefit of being truly two dimensional in
geometry, lending itself to easy diagnosis. The knowledge learned over the
phases of this program is equally applicable to conventional geometries.
Even though the desired holdoff of 100 kV was not reached, the goals of
>2 kHs with dI/dt >1011 A/9 and dV/dt >1012 V/s were achieved in a very
non-optimum geometry with switching voltages up to 60 kY and a single gap.
The low holdoff voltage is probably due to both damage caused by modulator
failure in early testing and an uneven control grid-insulator gap.
An obvious extension of this program is to build a thyratron for optimum
compactness and performance rather than ease of diagnosis, using the results
of the LT program. The switch may have a rectangular, conventional, CCLT or
RDLT geometry, depending upon the desired performance characteristics.
9-17
U.S.(Govern-ent Pyinting (Offie: 1c)88 548-O54180804

- a - - a-- - a" -- a-a a C.= t.~ - a a A. a~ a .~s ~ ~ ~ ...
9%
C
.4
.J.
-a
.1
-.4
a.4.'a
9-
ii- -a a a a a a a -

........ . ..... ......
p
170
U..
,- L(.
N N %~ 'S % C .%C C fa .p
Copyright © 2022 FDOKUMEN