Flow sensor instrumentation employing differential pressure reading

Frank Steiner1*Anis Mahsunah1*Frank Arnold2
Thomas Piecha2
Christian G. Huber1
1Department of Chemistry,Instrumental Analysis andBioanalysis, Saarland University,Saarbr�cken, Germany
2Dionex Softron GmbH,Germering, Germany
Original Paper
Automated semipreparative purification with massspectrometric fraction collection trigger: Modelingand experimental evaluation of a setup employingpassive splitting
A semipreparative HPLC setup was evaluated for automated fractionation with bothphotometric- and mass spectrometric trigger. The goals of the work were to systema-tically study and optimize the flow-splitting setup for mass-directed purifications bymathematical modeling and experimental verification. The system comprised a pas-sive splitting device with make-up flow capability, which directed a small fractionof the column effluent to the mass spectrometer and the remainder to the fractioncollector. Tubing lengths and diameters of the splitter as well as make-up flow rateswere varied in order to address and optimize peak dispersion, delay times betweenmass detector and fraction collector, and mass spectrometric signal quality. A para-ben standard mixture was analyzed and purified on both microparticulate andmonolithic columns with 10 mm inner diameter and at typical flow rates of 5–10 mL/min. Fraction purities and recoveries close to 100% were achieved. The systemallowed mass-triggered fractionations on a 1 mg scale at flow rates of 10 mL/min incombination with monolithic columns in less than 2 min. Finally, the system wassuccessfully applied to the fully automated isolation of milligram quantities ofdegradation products in a pharmaceutical preparation to successfully allow forstructure elucidation with NMR spectroscopy.
Keywords: Column liquid chromatography / Fast automated purification / Make-up flow / Mass se-lective trigger / Monolithic semipreparative column / Parabens / Passive splitter design /
Received: February 7, 2007; revised: March 30, 2007; accepted: March 30, 2007
DOI 10.1002/jssc.200700059
1 Introduction
Both pharmaceutical and biotechnological industrieshave raised the demand for the development of novel,faster, and more efficient ways to discover and isolatepharmacologically active compounds [1]. The purifica-tion of natural and synthetic compounds by fully auto-mated preparative HPLC using gradient elution and real-time, data-dependent fractionation triggering is becom-ing an increasingly important and useful technology inchemical and pharmaceutical development [2–6]. Typi-cal applications include the high-throughput purifica-tion of products from combinatorial syntheses [7] or evenmanual single compound synthesis [4] for further struc-ture elucidation and activity screening as well as the frac-
tionation of extracts of active ingredients from medici-nal plants [8].
A variety of instrumental solutions, which are in manycases equipped with dedicated software control, is com-mercially available and frequently termed “automatedpurification systems” (APS). The most commonlyemployed chromatographic modes include normalphase- [4], RP- [6, 7], or supercritical-fluid chromatogra-phy [3]. The elution of the separated components may bemonitored by a photometric detector and, alternativelyor additionally, by a mass spectrometer, usually inter-faced by means of an electrospray- or atmospheric pres-sure chemical ionization interface. A further widelyspread detection method is evaporative light scattering.This detection technique is a useful supplement for ana-lytes that do not contain chromophores or are difficultto ionize in atmospheric pressure sources for mass selec-tive detection. Unattended fraction collection based onreal-time photometric- [4] or mass-selective triggering [2]
Correspondence: Prof. Dr. Christian G. Huber, Department ofChemistry, Instrumental Analysis and Bioanalysis, Building B22, Saarland University, 66123 Saarbr�cken, GermanyE-mail: [email protected]: +49-681-302-2963 * Both the authors contributed equally to this work.
i 2007 WILEY-VCH Verlag GmbH & Co. KGaA, Weinheim www.jss-journal.com
1496 F. Steiner et al. J. Sep. Sci. 2007, 30, 1496 – 1508

J. Sep. Sci. 2007, 30, 1496 –1508 Liquid Chromatography 1497
has considerably increased the productivity of prepara-tive fractionation, facilitating full automation of theprocess of compound separation and targeted fractioncollection. High-speed and throughput are realized bymeans of a combination of automation [2], paralleliza-tion [5, 9], and rapid separations in short columns packedwith small particles [10, 11]. The latter approach is, how-ever, frequently compromised by the pressure limita-tions of several preparative HPLC pumping systems. Thecommon solution is either the use of short columnspacked with larger 5–10 lm particles at the cost of lowercolumn efficiency [12] or of highly permeable monolithiccolumns that provide high efficiency at fast linear veloc-ities and very moderate column backpressures [13].
General issues in the implementation of automatictriggers for fractionation are proper synchronization ofpeak detection and peak collection as well as minimiza-tion of band dispersion in the connecting tubingbetween detector(s) and fraction collector. Since MS is adestructive detection technique, a selective mass spectro-metric fraction collection trigger requires splitting ofthe column effluent between mass spectrometer andfraction collector. Moreover, ion sources are easily fouledby large amounts of analyte, necessitating a substantialreduction and dilution of the column effluent flow tothe mass spectrometer. In passive splitting devices, theflows of column effluent to the fraction collector andmass spectrometer, respectively, are regulated by the per-meabilities of suitably dimensioned flow restrictors [14].A supplementary Tee-piece may be implemented into thestream flowing to the mass spectrometer to accommo-date the addition of make-up flow for dilution. This con-figuration results in two parallel liquid paths flowingeither from column outlet to fraction collector or frommake-up pump to mass spectrometer. Both flows are
interconnected by means of the two Tee-pieces, allowingthe transfer of solution from one flow to the other (seeFig. 1).
Active splitters on the other hand, based upon a rap-idly switched valve that transfers a small portion of thecolumn effluent to a second flow of solvent directed tothe mass spectrometer, have been shown to offer highflexibility and a broad range of splitting ratios independ-ently of column permeability. Both active and passivesplitting devices have been successfully incorporatedinto instrumental setups for mass-triggered fractiona-tion [3, 12, 15, 16]. A comparison of active and passivesplitters for preparative HPLC has shown that active split-ting devices (also called mass rate attenuators) offer min-imal peak broadening and easy adaptation to a broadrange of flow rates, split ratios, and make-up flows [17].Nevertheless, due to abrasion of the rapidly movingparts, rotor seals have to be exchanged on a regular basis.Besides the maintenance aspect, the employment ofactive splitters adds additional acoustic noise exposureto working environments. Moreover, peak profiles needto be smoothed by suitable averaging because of the dis-continuous transfer of liquid between the donor andacceptor stream [17]. Passive splitters, on the other hand,are more difficult to optimize but hold the advantage ofnull maintenance and noise level, and continuous trans-fer of liquid from one effluent stream to the other.
Optimization of the split ratios, the time delaysbetween the analytes passing the detector(s) and fractioncollector, and the tubing dimensions in passive splittingdevices is considerably complex on an empirical basis. Areview of the current literature on automatic purifica-tion systems reveals that detailed descriptions of thesetup of passive splitting devices and synchronizationare usually not given. Although the optimal settings are
i 2007 WILEY-VCH Verlag GmbH & Co. KGaA, Weinheim www.jss-journal.com
Figure 1. Schematic diagram of the opti-mized instrumental setup for photometric-and mass spectrometric trigger. Capillary 1(PTFE) 1000060.5 mm id, UV detectorpositioned at 4000 mm from T1, capillary 2(fused silica) 40060.05 mm id, and capil-lary 3 (PEEK) 30060.13 mm id.

1498 F. Steiner et al. J. Sep. Sci. 2007, 30, 1496 – 1508
usually preinstalled from the factory, changes in columndimensions and/or flow rates may require modificationof preset parameters. In this communication, we there-fore report on the theoretical modeling and step-by-stepexperimental evaluation of a splitter setup for both pho-tometric and mass spectrometric fraction collection trig-ger. The system is assessed with 100610 mm id columnspacked with a microparticulate 5 lm octadecyl-station-ary phase. Moreover, an octadecylated silica-monolith ofthe same dimensions, which became only recently avail-able, is utilized for the first time in a semipreparativesetup to investigate the performance of the setup underhigh-throughput conditions. Particular focus is laid onminimized peak dispersion and compatibility with arange of flow rates from 5 to 10 mL/min.
2 Experimental
2.1 Chemicals and materials
All the reagents used were of analytical grade. TFA,hydrochloric acid, methyl paraben, ethyl paraben,propyl paraben, and butyl paraben were purchased fromFluka (Buchs, Switzerland), uracil from Serva (Heidel-berg, Germany), and ACN and methanol from Sigma-Aldrich (Steinheim, Germany). High-purity water wasobtained from a Purelab Ultra system (ELGA, Celle, Ger-many). Thermally stressed transdermal delivery system(TDS) drugs containing the two active ingredients A andB were from Novosis (Munich, Germany). PreparativeHPLC separations were performed either in a Luna C18(2)microparticulate column (100 �, 5 lm, 100610 mm id,Phenomenex, Torrance, CA, column #1), or a silica-based,C18-derivatized monolithic research column (100610mm id, Merck, Darmstadt, Germany, column #2). A Syn-ergi RP-Polar column (80 �, 4 lm, 150610 mm id, Phe-nomenex) was utilized for fractionation of three decom-position products from the TDS preparations. AnalyticalHPLC separations were carried out on a Luna C18(2) col-umn (100 �, 5 lm column 15064.6 mm id, Phenom-enex) or a Synergi RP-Polar column (80 �, 4 lm,15064.6 mm id, Phenomenex).
2.2 Instrumental setups
Preparative HPLC–MS separations and fractionationswere performed using a preparative HPLC system (Dio-nex Summit, Dionex, Germering, Germany) consisting ofa binary semipreparative high-pressure gradient pump(Model P680P HPG-2), a helium degassing unit, a semipre-parative autosampler (Model ASI-100P), a diode arraydetector (Model UVD340U PDA) with a semipreparativedetector cell (6 lL cell volume, 2 mm path length), aquadrupole mass spectrometer with an electrosprayinterface (Model MSQ), a high-pressure pump for deliver-
ing make-up flow (Model AXP-MS), and a fraction collec-tor holding 7 mL tubes (Model Foxy Jr., Isco, Los Angeles,CA, USA). The fraction collector features a switchingvalve, which can be set to either direct the column efflu-ent to an array of 144 sampling tubes or to a waste reser-voir. The splitting system was assembled from Tee-piecesand capillary tubing from Valco (Houston, TX) orUpchurch (Oak Harbor, WA) and polyimide-coated fusedsilica capillaries of different inner diameters (PolymicroTechnologies, Phoenix, AZ). The system was fully con-trolled through the Chromeleon Chromatography Man-agement System (Dionex, Germering, Germany). Figure 1shows a schematic representation of the setup of thepurification system incorporating the customized split-ting assembly. In the optimized setup, the dimensions ofthe capillaries were as follows: capillary 1 (PTFE)10 00060.50 mm id, capillary 2 (fused silica) 40060.05mm id, and capillary 3 (PEEK) 30060.13 mm id.
Analytical HPLC separations were performed on a sys-tem comprising a binary analytical high-pressure gra-dient pump (Model Summit P680A HPG-2, Dionex), adegassing unit (Model Degasys DG-1210, Dionex), an ana-lytical autosampler with integrated temperature control(Model Summit ASI-100T, Dionex), and a dual wave-length UV detector (Model 2487, Waters, Milford, MA).The analytical system was also fully controlled by Chro-meleon software.
2.3 Determination of peak dispersion
Peak dispersion was determined by analyzing a solutionof methyl-, ethyl-, propyl-, and butylparaben, 100 mg/Leach, dissolved in mobile phase using column #1. Elu-tion was accomplished with ACN/water (60:40, v/v) at aflow rate of 5 mL/min. The injection volume was 100 lLand the detection wavelength was 254 nm. The disper-sion was measured directly behind the column, at theend of a 250061.0 mm id delay capillary, and at the endof a 10 00060.50 mm id delay capillary. In order to keepthe volumes constant when the detector was installed atthe end of the delay capillaries, a dummy detection cellwas mounted in place of the original detector position.The peak widths at half height were calculated by Chro-meleon chromatography data system version 6.70.
2.4 Determination of the delay times at differentmake-up flows and synchronization
The delay times at different make-up flows were deter-mined by injecting 100 lL of a solution containingmethyl-, propyl-, and butylparaben, 1 g/L each, dissolvedin mobile phase using column #1. Mobile phase andmake-up solvent were ACN/water (60:40 v/v). The systemwas characterized and synchronized by injection of50 lL of a solution containing methyl-, propyl-, and
i 2007 WILEY-VCH Verlag GmbH & Co. KGaA, Weinheim www.jss-journal.com
J. Sep. Sci. 2007, 30, 1496 –1508 Liquid Chromatography 1499
butylparaben, 1 g/L each. The mobile phase and make-upsolvent were ACN/water (60:40 v/v) for the microparticu-late column (column #1) and ACN/water (50:50 v/v) forthe monolithic column (column #2). The flow ratesthrough the columns were 5 mL/min for column #1 and10 mL/min for the column #2. The make-up flow was200 lL/min in both cases. UV detection was performed at254 nm, and MS conditions are given in Section 2.6.
2.5 Determination of fraction purity andcompound recovery
The recovery was evaluated by injecting a solution con-taining methyl-, propyl-, and butylparaben, 1 g/L eachdissolved in mobile phase, onto the 10 mm id columns(#1 and #2). The injection volume was 50 lL and the mix-ture was separated under the chromatographic condi-tions given in Section 2.4. Fractions were automaticallycollected and subsequently diluted to 5.00 mL with elu-ent. A second 50 lL-aliquot of the original paraben solu-tion was diluted to 5.00 mL as well. Aliquots of 10 lL ofboth solutions were analyzed on the analytical HPLC-UVsystem at a flow rate of 2 mL/min with an eluent compris-ing ACN/water (60:40, v/v). The ratio of areas from thesetwo analyses was utilized to calculate the recovery of par-abens from the 10 mm id columns during automatedfractionation.
Peak purity was calculated by area percent in the well-resolved chromatograms from reinjections of the col-lected fractions into an analytical HPLC system equippedwith a microparticulate column (Luna C18(2), 5 lm,same stationary phase as used in semipreparative col-umn #1).
2.6 Mass spectrometric conditions and mass-directed fraction collection settings
The electrospray source was operated at 3 kV needle volt-age and 3008C probe temperature. The cone voltage was–50 V (negative mode). Full scan data acquisitionbetween m/z 100–250 with a scan time of 0.5 s was per-formed. Mass traces were online extracted for m/z151 € 0.5 (methyl paraben), 179 € 0.5 (propyl paraben),and 193 € 0.5 (butyl paraben) and used as data for peakdetection and automated triggering. The peak start andpeak end threshold settings for the fraction collectionwere 20000 counts for column #1 and 35 000 counts forcolumn #2.
2.7 Purification of degradation products of activeingredients from a TDS
Ten TDS samples, containing 0.4 and 11% of active ingre-dients A and B, respectively, were extracted in 250 mL ofACN/0.10% hydrochloric acid by slow shaking overnight
followed by 4 h sonication. This stock solution contained0.17 mg/mL of active ingredient A and 4.62 mg/mL ofactive ingredient B. For HPLC injections, 12 mL of this sol-ution were diluted with 88 mL of water containing0.025% TFA and then filtered through a 0.45 lm Teflonfilter. The injection volume was 1000 lL. Purificationusing the 150610 mm id Synergy RP-polar column wasperformed by isocratic elution at 12% ACN in 0.025%aqueous TFA for 5 min, followed by a gradient of 12–23%ACN in 7 min, and finally 23–50% ACN in 1.5 min at aflow rate of 5.7 mL/min and 258C. Diode array spectrawere recorded and the elution profile was monitored at205 nm. The settings for mass spectrometric detectionwere as follows: block source temperature, 3008C; needlevoltage 2 kV; cone voltage 30 V (positive mode); scantime: 1 s; make-up flow, 200 lL/min, except from 9–11 min, 300 lL/min; make-up eluent, 79.98% water/0.02% TFA/20% ACN. The settings for fraction collectionwith photometric trigger were as follows: peak startthreshold, 4 mAU; peak end threshold, 2 mAU; peak startslope, 3 mAU/s; peak end slope, 2 mAU/s. The settings forMS trigger were: online extracted mass traces for m/z 218l 0.5, 332 l 0.5, and 291 l 0.5; peak start threshold,250000 counts; peak end threshold, 150000 counts. Theconditions for analytical rechromatography on the15064.6 mm Synergy column were the same as for frac-tionation, except for the flow rate, which was 1.2 mL/min and the injection volume, which was 50 lL.
3 Results and discussion
3.1 Optimization of delay capillary dimensions forminimal dispersion
A sufficient delay volume is generally required in a pas-sive flow splitting setup between the point where theflow is split to the mass spectrometer and the fractioncollector. It serves to compensate for the time delay dueto the transfer of components from the splitting Tee-piece to the mass spectrometer. Moreover, it must allowfor sufficient computation time for data handling andprocessing before data-dependent instrument controlcan make a decision to collect a fraction or to send thecolumn effluent to waste. A delay time of at least 8 s wasmandatory to guarantee uncompromised fraction collec-tion in our instrumental and computational setups. Fig-ure 1 gives an overview of the APS used in this study. Themajor part of the column effluent, pumped at a flow rateof 5–10 mL/min, is directed through the UV detector tothe fraction collector. The delay capillary is referred to ascapillary 1 (actually a combination of capillary 1a and1b, tubing of the UV detection is included in capillary 1aand 1b, respectively) in Fig. 1. Its volume determines thetime delay at a given flow rate, while its length and innerdiameter control the generated zone dispersion and
i 2007 WILEY-VCH Verlag GmbH & Co. KGaA, Weinheim www.jss-journal.com

1500 F. Steiner et al. J. Sep. Sci. 2007, 30, 1496 – 1508
backpressure. A continuous solvent flow is directedthrough capillary 3 to the mass spectrometer by a make-up pump. A transfer of sample components from the col-umn effluent to the mass spectrometer is effected by twoTee-pieces and a fused silica capillary (capillary 2), whichinterconnects both flows to fraction collector and massspectrometer, respectively.
The delay volume necessary to adequately synchronizethe mass spectrometric trigger was estimated based onthe following assumptions. A delay volume of 670–1340 lL is required to generate an 8 s time delay at flowrates of 5–10 mL/min. Moreover, the volume of the delaycapillary in front of the fraction collector has to compen-sate for any time delay generated in the split connectionin front of the mass spectrometer. For these reasons, wedecided to implement a delay volume of approximately2000 lL between splitting point and fraction collector.Such a volume is generated by a 2.5 m piece of a 1.0 mmid capillary or a 10 m piece of a 0.50 mm id capillary.Smaller capillary ids cause lower peak dispersion, sincethe parabolic zone profile generated in all open tubeswill be more rapidly counterbalanced by diffusion. How-ever, to create the same volume the capillary lengthmust be increased to the power of 2 with decreasingcapillary id, generating considerably high backpressures,which influence the split ratio and limit the availablecolumn inlet pressure.
Band dispersion in both capillaries of 1.0 and 0.50 mmid was evaluated by using the microparticulate columnoperated at 5.0 mL/min and placing the detector celldirectly behind the column outlet or at the end of therespective delay capillaries. Figure 2 overlays the chroma-tograms of the standard mixture of alkyl parabens meas-ured directly behind the separation column (Fig. 2a) andat the outlet of delay capillaries of 250061.0 mm id (Fig.2b) or 1000060.5 mm id (Fig. 2c). Both delay capillariesfeatured identical delay volumes (1960 lL). As expected,the 1.0 mm id capillary caused markedly more pro-nounced band broadening relative to that with 0.50 mmid. From Table 1 can be deduced that the averageincreases in peak widths with the 1.0 and 0.50 mm iddelay capillaries were 129 and 75%, respectively. Pressure
drops of 12 and 50 bar were generated with the 1.0 and0.50 mm id delay capillaries, which prevented the use ofeven smaller id capillaries to further reduce band disper-sion. A capillary having an inner diameter of 0.50 mmwas taken as a base for optimization of splitter design.
3.2 Theoretical modeling and experimentalevaluation of splitter setup for mass directedfraction collection
Four requirements were defined for splitter setup: (i) suit-ability for operation at 5–10 mL/min column flow, (ii)band dispersion between trigger detector (either photo-meter or mass spectrometer) and fraction collectorbelow 30%, (iii) split ratio between 1:400 and 1:1000, and(iv) minimum delay time of 8 s for mass spectrometrictrigger. The column flow was selected for optimized flow
i 2007 WILEY-VCH Verlag GmbH & Co. KGaA, Weinheim www.jss-journal.com
Table 1. Peak widths at half height directly behind column #1 and behind two different delay capillaries of the same volume(1960 lL)
Substance w0.5 (s)
Behindcolumn
Behind tubing250061.0 mm
Behind tubing1000060.05 mm
Methyl paraben 3.8 9.8 7.4Ethyl paraben 4.1 10.6 7.7Propyl paraben 4.7 10.4 8.0Butyl paraben 5.6 10.9 8.6Average 4.55 10.43 7.93
Figure 2. Chromatograms for determination of peak disper-sion using the microparticulate column operated at 5 mL/min. Detection cell installed (a) behind the separation col-umn, (b) behind the delay capillary 250061.0 mm id, (c)behind the delay capillary 1000060.50 mm id; sample, mix-ture of methyl-, ethyl-, propyl-, and butyl paraben; chromato-graphic conditions are given in Section 2.3.

J. Sep. Sci. 2007, 30, 1496 –1508 Liquid Chromatography 1501
rates with both the microparticulate (column #1) andmonolithic (column #2) columns. A realistic maximumband broadening requirement was based on the resultsobtained with capillary 1 having an id of 0.50 mm. Theselected range of split ratios was considered to be a goodcompromise between minimum loss of substance to themass spectrometer and sufficient ESI–MS detection per-formance under the make-up flow rates suitable for thegiven instrument. The system delay time was defined bythe utilized software control. The setup was based on twoTee-pieces (T1 and T2) connected by a flow bridge (capil-lary 2). Inlet and outlet of the first Tee were connected tothe column outlet and delay capillary 1, whereas the sec-ond Tee accommodated the connections to the pumpdelivering make-up flow and to the mass spectrometer,respectively (see Fig. 1).
Aim of the optimization was to determine the bestcombination of capillary dimensions in the configura-tion depicted in Fig. 1. The pressure gradient between T1and T2 and the dimension of capillary 2 (between bothTee-pieces) control the split flow and split ratio. Anotherimportant aspect of this part of the setup is the influenceof both length and linear velocity in capillary 2, sincethey mainly determine the time required to transfer acompound from T1 to the mass spectrometer. The muchhigher linear velocity in capillary 3, which is predomi-nantly controlled by the magnitude of make-up flow,results in a minor contribution of this second part to thetotal transfer time to the mass spectrometer. To calculatethe system delay time for mass spectrometric trigger, thetime to transport the detection zone from T1 to the massspectrometer has to be subtracted from the time takenfor the main peak zone to travel from T1 to the fractioncollector valve.
As all of the parameters discussed above (capillarydimensions and magnitude of make-up flow) are strictlyinterrelated, optimization by empirical design is very dif-ficult. Therefore, the influence of the different param-eters on theoretical split ratio and system delay time wasmodeled. All calculations were based on the assumptionthat the pressure at T1 is determined by the column flowrate and the permeability of capillary 1 (sum of 1a and 1bin Fig. 1), while the pressure at T2 is solely controlled bythe make-up flow and the permeability of capillary 3.The flow through capillary 2 (only 5–20 lL/min) was con-sidered negligible for the calculation of the pressuredrop between T1 and T2.
The pressure drop in all the capillaries was calculatedby using the integrated Hagen–Poiseuille equation forlaminar flow following Eqs. (1) and (2). Considering thepressures at the fraction collector valve and at thesprayer of the electrospray ion source to be zero, p(T1)and p(T2) directly refer to the pressures at T1 and T2,while F1 and F3 indicate column flow rate and make-upflow rate, � the viscosity, R1 and R3 the tubing radii of
capillary 1 and 3, and L1 and L3 the lengths of capillary 1and 3.
pðT1Þ ¼ 8gp
NF1L1
R41
ð1Þ
pðT2Þ ¼ 8gp
NF3L3
R43
ð2Þ
The split flow between T1 and T2 was calculated fromthe pressure difference p(T1)–p(T2) according to Eq. (3),where F2 indicates the split flow rate; g the viscosity; R2
the tubing radius of capillary 2; and L2 the length of capil-lary 2:
F2 ¼p
8gN
pðT1Þ � pðT2ÞL2
NR42 ð3Þ
Dividing the column flow rate by the split flow rate,the split ratio was calculated. The theoretical delay timeDt was calculated by means of Eq. (4) which is based onthe information obtained from Eqs. (1)– (3) (V1, V2, and V3
indicate the volumes of capillary 1, 2, and 3, respectively,calculated from their nominal dimensions):
Dt ¼ V1=F1 � V2=F2 � V3=ðF2=F3Þ ð4ÞThe optimized setup was developed in a step-by-step
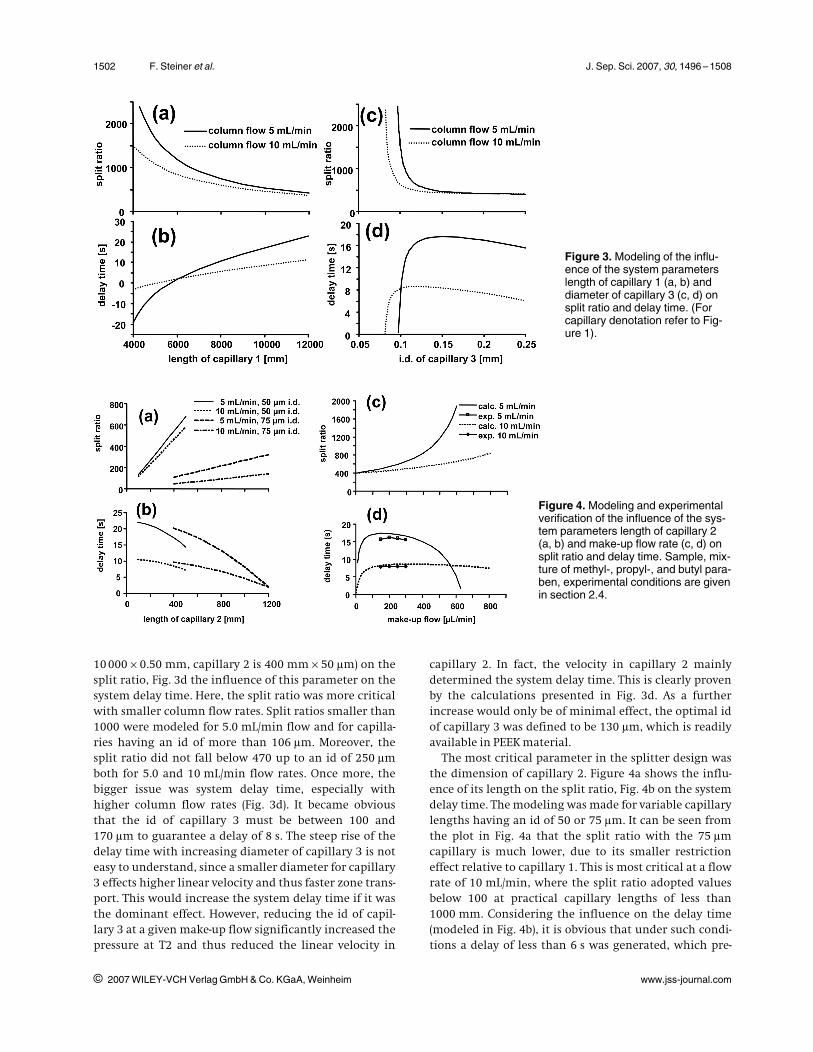
variation of the four parameters length of capillary 1 (idis already defined to be 0.50 mm), length of capillary 2(considering standardized available narrow bore diame-ters of fused silica like 75 and 50 lm), id of capillary 3(minimum length was determined by instrument designto be 300 mm), and the magnitude of the make-up flow.The influence of these four important system param-eters, both on split ratio and system delay time, is illus-trated in Figs. 3 and 4. All modeling was performed forcolumn flow rates of 5.0 mL/min (column #1) and 10 mL/min (column #2).
With a make-up flow of 200 lL/min and using the pre-defined parameters for capillary 2 (400 mm650 lm) andcapillary 3 (300 mm6130 lm) the influence of thelength of capillary 1 considering an id of 0.5 mm wasmodeled for the split ratio (Fig. 3a) and for the systemdelay time (Fig. 3b). From Fig. 3a, it can be deduced thatthe length must be between 6600 and 11000 mm to ful-fill the requirement of a split ratio between 400 and1000 with both flow rates. Figure 3b shows that an 8 sdelay time was generated at 5.0 mL/min with a 7600 mmlong capillary 1. The curve for 10 mL/min showed a muchshallower slope and reached the required 8 s level at acapillary length of approximately 9700 mm. In conse-quence, it is advisable to adjust a relatively low split ratioof approximately 500, because the setup generated suffi-cient time delay at higher column flow rates. In order tohave a little reserve in the delay time, a length of10000 mm was considered as optimal for capillary 1.
Figure 3c shows the influence of the id of capillary 3 ata fixed length of 300 mm (capillary 1 is
i 2007 WILEY-VCH Verlag GmbH & Co. KGaA, Weinheim www.jss-journal.com
1502 F. Steiner et al. J. Sep. Sci. 2007, 30, 1496 – 1508
10 00060.50 mm, capillary 2 is 400 mm650 lm) on thesplit ratio, Fig. 3d the influence of this parameter on thesystem delay time. Here, the split ratio was more criticalwith smaller column flow rates. Split ratios smaller than1000 were modeled for 5.0 mL/min flow and for capilla-ries having an id of more than 106 lm. Moreover, thesplit ratio did not fall below 470 up to an id of 250 lmboth for 5.0 and 10 mL/min flow rates. Once more, thebigger issue was system delay time, especially withhigher column flow rates (Fig. 3d). It became obviousthat the id of capillary 3 must be between 100 and170 lm to guarantee a delay of 8 s. The steep rise of thedelay time with increasing diameter of capillary 3 is noteasy to understand, since a smaller diameter for capillary3 effects higher linear velocity and thus faster zone trans-port. This would increase the system delay time if it wasthe dominant effect. However, reducing the id of capil-lary 3 at a given make-up flow significantly increased thepressure at T2 and thus reduced the linear velocity in
capillary 2. In fact, the velocity in capillary 2 mainlydetermined the system delay time. This is clearly provenby the calculations presented in Fig. 3d. As a furtherincrease would only be of minimal effect, the optimal idof capillary 3 was defined to be 130 lm, which is readilyavailable in PEEK material.
The most critical parameter in the splitter design wasthe dimension of capillary 2. Figure 4a shows the influ-ence of its length on the split ratio, Fig. 4b on the systemdelay time. The modeling was made for variable capillarylengths having an id of 50 or 75 lm. It can be seen fromthe plot in Fig. 4a that the split ratio with the 75 lmcapillary is much lower, due to its smaller restrictioneffect relative to capillary 1. This is most critical at a flowrate of 10 mL/min, where the split ratio adopted valuesbelow 100 at practical capillary lengths of less than1000 mm. Considering the influence on the delay time(modeled in Fig. 4b), it is obvious that under such condi-tions a delay of less than 6 s was generated, which pre-
i 2007 WILEY-VCH Verlag GmbH & Co. KGaA, Weinheim www.jss-journal.com
Figure 3. Modeling of the influ-ence of the system parameterslength of capillary 1 (a, b) anddiameter of capillary 3 (c, d) onsplit ratio and delay time. (Forcapillary denotation refer to Fig-ure 1).
Figure 4. Modeling and experimentalverification of the influence of the sys-tem parameters length of capillary 2(a, b) and make-up flow rate (c, d) onsplit ratio and delay time. Sample, mix-ture of methyl-, propyl-, and butyl para-ben, experimental conditions are givenin section 2.4.

J. Sep. Sci. 2007, 30, 1496 –1508 Liquid Chromatography 1503
vents the applicability of 75 lm id tubing for capillary 2.For a 50 lm id capillary, a length of more than 350 mmresulted in split ratios greater than 400 for both 5.0 and10 mL/min column flow rates. Figure 4b shows, however,that a length of 420 mm must not be exceeded to guaran-tee at least 8 s delay time for the more critical flow rateof 10 mL/min. Hence, a length of 400 mm and an id of50 lm were defined as optimal for capillary 2. The model-ing of capillary dimensions as presented above resultedin the following capillary dimensions for an optimalsplitter setup: capillary 1, 1000060.5 mm; capillary 2,40060.050 mm; capillary 3, 30060.13 mm.
Finally, the influence of make-up flow on split ratioand system delay time was modeled. In Fig. 4c the splitratio in the optimized setup is shown as a function ofmake-up flow. When the make-up flow was increased,the pressure at T2 increased linearly and thus the splitflow decreased linearly. This induced a hyperbolicincrease in the split ratio with increasing make-up flow.The split ratio rose above 1000 when the make-up flowexceeded 450 lL/min for a column flow of 5.0 mL/min.
The dependence of delay time on make-up flow rateturned out to be rather complex, as can be seen in Fig.4d. Up to a make-up flow rate of approximately 50 lL/min, the increase in linear velocity through capillary 3mainly determined the time elapsing for a zone migrat-ing from T1 to the mass spectrometer. As this time wasreduced, the delay time increased. At higher flow rates,however, a marked backpressure was generated at T2which dramatically decreased the linear velocity in capil-lary 2. This was the reason for the plateau at make-upflow rates larger than 100 lL/min, as the opposite effectson the flow through capillary 2 and capillary 3 were com-pensated. The plateau was largely extended at a columnflow rate of 10 mL/min, as can be deduced from the dot-ted line in Fig. 4d. At a column flow rate of 5.0 mL/min, alower pressure was built up at T1. Hence, the pressuregenerated at T2 by the make-up flow contributed morestrongly to the pressure difference between T1 and T2(see solid line in Fig. 4d). For this reason, the system delaytime showed a pronounced decrease when the make-upflow rate exceeded 400 lL/min. It was derived from themodeling that a make-up flow rate between 150 and450 lL/min is compatible with the required minimumsystem delay time of 8 s and split ratio smaller than1:1000 for both 5 and 10 mL/min column flow rates.
The optimal splitter setup as derived above wasassembled and the experimental delay times were meas-ured for different make-up flow rates. For this experi-ment, the UV detector was positioned at the outlet ofcapillary 1 in order to detect the effective arrival of thepeak zone at the fraction collector switching valve. Theobtained experimental delay times for both column flowrates are included in Fig. 4d together with the modeledcurves. The deviations from the theoretical values were
minimal and can be explained by deviations of the effec-tive capillary ids from the specified values. The plateau-like behavior for the delay time within a certain range ofmake-up flow rates could be experimentally verified, sothat make-up flow rates of 150 to 300 lL/min were com-patible with our optimized splitting system.
3.3 Influence of the make-up flow rate on massspectrometric signal quality
According to the supplier’s specifications, the linearquadrupole mass spectrometer applied in this study isoptimized for robust, routine operation at flow ratesbetween 0.2 and 1 mL/min. Before connecting the massspectrometer to the split system, it was tuned by directinfusion of a solution of parabens (10 ng/lL) at a flowrate of 200 lL/min. Using the optimized tuning param-eters and the instrumental setup described above (Fig. 1),the separation and detection of a mixture of methyl-,propyl-, and butyl paraben (1.0 g/L each, 100 lL injected)were evaluated with the microparticulate column (col-umn #1) operated at a flow rate of 5 mL/min. Figure 5illustrates an overlay of the reconstructed total ion cur-rent chromatograms obtained with different make-upflow rates without any smoothing of the signal to crit-ically assess signal stability. With make-up flows in therange of 100–300 lL/min, the elution times of all para-bens matched almost perfectly, which is a clear proof ofthe independence of delay time on make-up flow in thisrange.
At a make-up flow of 100 lL/min, the observed signalswere unstable and noisy, indicating unstable electro-spray. Lacking the possibility to adjust the dry gas andspray gas flows independently, it was not possible to opti-mize the electrospray conditions for that flow rate range.
i 2007 WILEY-VCH Verlag GmbH & Co. KGaA, Weinheim www.jss-journal.com
Figure 5. Influence of the make-up flow rate on the massspectrometric signal quality. Experimental conditions aregiven in Sections 2.4 and 2.6.

1504 F. Steiner et al. J. Sep. Sci. 2007, 30, 1496 – 1508
At make-up flow rates of 150 lL/min or higher, stableand well-shaped signals were observed. Due to the dilu-tion of the peak zones, a decrease in the peak intensitieswas observed with increase in make-up flow rates. Dilu-tion is not only a consequence of the larger volume ofmake-up flow added to the column effluent, but also dueto a reduction in the flow through capillary 2 because ofa higher backpressure at T2 (see Fig. 4c). Adjustable dilu-tion and the minor influence on system delay make themagnitude of make-up flow an ideal variable to controlthe concentration of the detection zones at the massspectrometer without the need to correct system syn-chronization. A make-up flow of 200 lL/min proved to besuited for most of the applications and was selected forsystem characterization as described below.
3.4 Synchronization for UV- and massspectrometric trigger
The UV detector was placed inline between Tee 1 andfraction collector, as depicted in Fig. 1. To record the rele-vant chromatograms, the UV detector was also posi-tioned at the outlet of capillary 1 in order to determinepeak arrival time and peak shape at the fraction collec-tor, while a dummy detection cell was mounted at theoriginal detection position in order to keep the delay vol-ume constant. Figure 6 depicts the separation of threeparabens in the microparticulate column at a flow rateof 5.0 mL/min. The uppermost and middle trace showthe signal at the synchronized UV detector (Fig. 6a) andat the mass spectrometer (Fig. 6b), respectively. The lowertrace represents the compound zones arriving at the frac-tion collector. In order to measure the time delays, thezone dispersion in the connecting capillaries, and thesynchronization of the band widths between the detec-tors and the fraction collector, the elution times andpeak widths at half height were extracted from the chro-matograms (Table 2). It can be seen that the peak zonespass both detectors simultaneously, while they arrive atthe fraction collector with a delay of 16 s, offering suffi-cient time for real-time peak detection and valve switch-ing. Because of the additional connecting capillarybetween UV detector and fraction collector, the bandwidths at the fraction collector were slightly higher thanthose at the UV detector. Moreover, peak widths recordedby the mass spectrometer were larger because of the com-paratively large time constant of mass spectrometricdetection (2 spectra per s). Synchronization was com-pleted by entering the time delays and signal thresholdfor collection as parameters into the software for correctpeak collection.
The synchronization of the purification system with asemipreparative monolithic column operated at a flowrate of 10 mL/min is illustrated in Fig. 7. Although themonolithic column was eluted with a weaker eluent, the
generated retention factors were 2–3-fold smaller thanthose with the microparticulate column. Compared tothe microparticulate column, the resolution was lowerwith the monolithic column, which enabled the separa-tion of the paraben mixture exactly with baseline resolu-tion. This decrease in resolution is mostly due to lowerphase ratio and a slight peak tailing in the monolithiccolumn. The elution profiles recorded by the mass spec-trometer even showed partial peak overlap. Nevertheless,the parameters derived from this experiment were suit-able for proper synchronization of the system andenabled the fractionation of the paraben mixture at thefraction collector with resolution to baseline. It can beseen from the time shift in the elution profiles at thedetectors and the fraction collectors that the delay timedecreased to 8 s with a column flow rate of 10 mL/min.
3.5 Evaluation of fraction purity and recovery withthe optimized system
The mixture of parabens was utilized to evaluate the per-formance of fractionation with the optimized setup forboth the microparticulate and the monolithic column.Only the fractionation with the monolithic column is
i 2007 WILEY-VCH Verlag GmbH & Co. KGaA, Weinheim www.jss-journal.com
Figure 6. Synchronization and characterization of the opti-mized setup with the microparticulate column operated at5 mL/min. Chromatograms recorded at the following posi-tions: (a) at the synchronized UV detector, (b) at the massspectrometer, (c) at the fraction collector. Sample, mixture ofmethyl-, propyl-, and butyl paraben, experimental conditionsare given in Section 2.4.

J. Sep. Sci. 2007, 30, 1496 –1508 Liquid Chromatography 1505
shown in Fig. 8, as this fractionation was more challeng-ing than that with the packed column. Figure 8a showsthe UV chromatogram, which served as a control in thisexperiment but not as a trigger for fractionation. Theexpected m/z values of the three parabens were enteredas target values for mass spectrometric fraction trigger.Figure 8b depicts the chromatographic traces of thethree channels, on which single-ion monitoring was per-formed to detect the three parabens. Begin and end of
the eluting bands were defined when the signal passed agiven threshold value and those parts of the peak profilethat were selected for collection by the software are indi-cated in Fig. 8b by solid rectangles. Moreover, grid linesindicate the corresponding time intervals, shifted by the
i 2007 WILEY-VCH Verlag GmbH & Co. KGaA, Weinheim www.jss-journal.com
Figure 7. Synchronization and characterization of the opti-mized setup with the monolithic column operated at 10 mL/min. Chromatograms were recorded at the following posi-tions: (a) at the synchronized UV detector, (b) at the massspectrometer, and (c) at the fraction collector. Sample, mix-ture of methyl-, propyl-, and butyl paraben, experimentalconditions are given in Section 2.4.
Table 2. Peak widths at half height w0.5 and elution times tR in the optimized system at both trigger detectors and at the fractioncollector for column #1 and column #2
Substance UV detector MS detector Fraction collector UV detector MS detector Fraction collector
w0.5, Column #1 (s) tR, Column #1 (min)
Methyl paraben 6.0 8.3 7.6 1.62 1.62 1.88Propyl paraben 6.6 9.0 8.2 2.36 2.35 2.62Butyl paraben 7.5 9.5 8.9 3.09 3.09 3.35
w0.5, Column #2 (s) tR, Column #2 (min)
Methyl paraben 3.1 4.9 3.8 0.83 0.83 0.96Propyl paraben 3.2 4.9 3.9 0.98 0.98 1.11Butyl paraben 3.4 5.2 4.1 1.12 1.12 1.25
Figure 8. Semipreparative fractionation with mass spectro-metric fractionation trigger and reanalysis of the fractionsusing an analytical column. The chromatograms recorded at(a) 254 nm and (b) at m/z 150.5–151.5 for methyl paraben(1), m/z 178.5–179.5 for propyl paraben (2), and m/z192.5–193.5 for butyl paraben (3) are shown. The chroma-tograms of the reinjected fractions are illustrated in (c);arrows indicate slight carryover from previous fractions.Experimental conditions are given in Sections 2.5 and 2.6.

1506 F. Steiner et al. J. Sep. Sci. 2007, 30, 1496 – 1508
delay time, during which the eluting compounds werecollected in the fraction collector.
Reinjections of the fractions into an analytical HPLCsystem equipped with a microparticulate column (LunaC18(2), 5 lm) were carried out to assess fractionationquality by quantifying the recovered amount of sub-stance and its purity. The chromatograms of these rein-jections are depicted in Fig. 8c. Peak purity was calcu-lated as area% in the chromatograms. To determinerecovery, a differential quantification was carried out, asdescribed in Section 2. The obtained purity and recoveryvalues for both the microparticulate and monolithic col-umn are summarized in Table 3. With both columns thepurities for the methyl paraben-peak are 100%. Slightcarryover in the following fractions stems from a tinyvolume of previous fraction stored in a short piece of tub-ing between the switching valve and the outlet or therobotic arm used to fill the fraction tubes (see arrows inFig. 8c). This problem could be readily alleviated by usinga fraction collector having a minimal dead volumebetween switching valve and capillary outlet or by anadditional feature allowing the purging of the tubing inbetween the fractionation intervals. The recoveriesobtained with the microparticulate column were closeto 100%, demonstrating the high yield of pure fractionfeasible with very well-resolved compounds. In the caseof the more critical separation on the monolithic col-umn, the recovery was around 95%, reflecting the loss ofmaterial due to decreased peak resolution in the veryfast fractionation.
3.6 Application to the automated purification ofdegradation products from a pharmaceuticalformulation
This study was designed to implement automated frac-tionation of degradation products from the active ingre-dients present in a transdermal drug delivery system(TDS). The TDS contained two active ingredients at mark-edly different concentrations. The related degradationproducts were formed during 13 months of storage ofthis formulation at 408C. In order to identify the struc-tures of the related degradation products by NMR, it wasnecessary to obtain a sufficient quantity of highly purefractions of each substance.
To separate the substances in the TDS containing thetwo active ingredients as well as the degradation prod-
ucts, a semipreparative polar RP column was selected.The separation was carried out using the instrumentalsetup described above with an ACN gradient in watercontaining 0.025% TFA. Preliminary mass and volumeoverloading experiments revealed that 1.0 mL of a sam-ple solution containing 0.020 mg of active ingredient Aand 0.554 mg of active ingredient B loaded onto the col-umn facilitated baseline resolution of all the elutingcomponents within 16 min. Fraction collection was per-formed with mass spectrometric and photometric trig-ger using two detection channels. Fractions were col-lected only when a peak higher than the threshold valuewas observed in the UV-trace and when ions of the appro-priate m/z were detected. Hence, only the desired degra-dation products 1, 2, and 3 were automatically collected.Figure 9 shows the UV chromatogram and the onlinemass chromatograms for the three collected substances.As can be seen, the separation was excellent (R A1.6 forthe critical peak pairs 1, 2 and 4, 5) and the peaks of thethree substances of interest were completely collected.The purity of the fractions was determined by analyticalHPLC to be 100% for degradation product 1 and 2, and98.7% for degradation product 3. The latter was contami-nated with a small amount of active ingredient B. Therecovery of desired compounds was calculated by com-parison of the peak areas obtained in the UV chromato-
i 2007 WILEY-VCH Verlag GmbH & Co. KGaA, Weinheim www.jss-journal.com
Table 3. Recovery and purity of the fractions determined with analytical HPLC
Substance Column #1 recovery (%) Column #1 purity (%) Column #2 recovery (%) Column #2 purity (%)
Methyl paraben 104 100 97 100Propyl paraben 102 99.3 92 99.1Butyl paraben 101 99.3 95 99.1
Figure 9. UV chromatogram (a) and online extracted masschromatograms (b) for the fractionation of degradation prod-ucts formed in the TDS sample with simultaneous photomet-ric and mass spectrometric trigger. Peak assignment, 1, deg-radation product 1 (m/z 219); 2, degradation product 2(m/z 333); 3, active ingredient A; 4, active ingredient B; 5,degradation product 3 (m/z 292). Collected fractions are indi-cated by gray rectangles.

J. Sep. Sci. 2007, 30, 1496 –1508 Liquid Chromatography 1507
grams of the original sample and the reinjected fractionsto be 99.6% for degradation product 1, 100% for degrada-tion product 2 and 97.8% for degradation product 3.
Isolation of degradation products in at least 1 mgamounts was necessary in order to enable structure eluci-dation by NMR spectroscopy. From the similarity of theUV spectra of peaks of the active ingredients and the deg-radation products (see Fig. 10), it was concluded that DP1and DP3 originated from active ingredient B. Thisassumption was applied for the prediction of therequired number of preparative chromatographic runs.Table 4 describes how many injections were needed con-sidering the smallest peak (DP1) and assuming a UVresponse factor for DP1 equivalent to that of active ingre-dient B. Taking the relative peak areas of active ingre-dient B and the DP1 into account at least 1 mg of eachdegradation product was collected from 153 injectionsfor DP1 and from only 44 injections for DP3. Thisrequired unattended operation of the APS for 7 dayswith 22 injections per day. The collected fractions of allthree degradation products from 154 runs were shipped
to the collaborating company and enabled a successfulstructure elucidation employing NMR spectroscopy.
4 Concluding remarks
Mathematical modeling of the critical parameters of apassive splitting device facilitates the efficient optimiza-tion of tubing dimensions suitable for automated photo-metric and mass spectrometric triggering of peak fractio-nation in semipreparative HPLC with good predictiveaccuracy. Using a standard mixture of parabens, peak dis-persion, and synchronization may be experimentallyevaluated in order to validate system performance. Bothmodeling and experiment show that compound transferin the capillary connecting flow to fraction collector andmass spectrometer is the most critical parameter in theadjustment of delay time.
In standard mode, operation of a 100610 mm id col-umn packed with 5 lm particles at a pressure of 60–70 bar with water/ACN eluents generates 2500–3500 the-
i 2007 WILEY-VCH Verlag GmbH & Co. KGaA, Weinheim www.jss-journal.com
Figure 10. UV spectra extracted from the chromatogram of the separation as shown in Fig. 9 for two active ingredients A and Band three degradation products (DP1, DP2, and DP3) formed in TDS sample.
Table 4. Calculation of needed chromatographic runs to collect at least 1 mg of each degradation product. Injection of 1000 lLsample contained 554 lg of active ingredient B
% Area Substanceper run (lg)
Injectionsfor 1 mg substance
Average fractionvolume (mL)
Pooled fractionvolume (mL)
Active ingredient B 93.0 554 – – –Degradation product 1 1.1 6.6 153 2.0 305Degradation product 2 1.1 6.6 153 2.7 412Degradation product 3 3.8 22.6 44 4.3 190

1508 F. Steiner et al. J. Sep. Sci. 2007, 30, 1496 – 1508
oretical plates. Adjusting a gradient volume of 5 columnflow through volumes, purification in gradient modeincluding column regeneration using this setup takes5–6 min per run. A silica-based monolithic C18-columnof the same dimensions operated at 10 mL/min is suit-able for further increasing the speed of fractionation. Inspite of the higher flow rate utilized with the monolithiccolumn, only 35–40 bar operating pressure is required.The separation efficiency is slightly lower but in thesame order of magnitude as with the packed column(1500 –2500 theoretical plates). Additionally, the plateswere generated in less than half the time and at one quar-ter of the backpressure. The fast mode enables gradientpurification in 2–2.5 min per run at the cost of a decreasein resolution. Since the fast mode can be accomplishedon exactly the same instrumental setup, it represents anideal alternative to the standard mode for high through-put purification of simple crude mixtures. A clearadvantage of the packed over the monolithic column isthe higher active surface area resulting in higher loadingcapacity, higher selectivity, and markedly higher reten-tion at a given mobile phase composition.
We thank K. Cabrera (Merck KGaA, Darmstadt, Germany) forkindly providing the monolithic 100610 mm id research column.The thermally stressed TDS samples were kindly provided by Novo-sis AG (Miesbach, Germany).
5 References
[1] Ripka, W. C., Barker, G., Krakover, J., Drug Discov. Today 2001, 6,471 – 477.
[2] Zeng, L., Wang, X., Wang, T., Kassel, D. B., Comb. Chem. HighThroughput Screen 1998, 1, 101 – 111.
[3] Wang, T., Barber, M., Hardt, I., Kassel, D. B., Rapid Commun. MassSpectrom. 2001, 15, 2067 – 2075.
[4] Renold, P., Madero, E., Maetzke, T., J. Chromatogr. A. 2001, 908,143 – 148.
[5] Fang, L., Cournoyer, J., Demee, M., Zhao, J., Tokushige, D., Yan,B., Rapid Commun. Mass Spectrom. 2002, 16, 1440 – 1447.
[6] Goetzinger, W., Zhang, X., Bi, G., Towle, M., Cherrak, D., Kyra-nos, J. N., Jnt. J. Mass Spectrom. 2004, 238, 153 – 162.
[7] Zeng, L., Burton, L., Yung, K., Shushan, B., Kassel, D. B., J. Chroma-togr. A. 1998, 794, 3 – 13.
[8] Wolfender, J. L., Terreaux, C., Hostettmann, K., Pharm. Biol. 1999,38, 41 – 57.
[9] Edwards, C., Liu, J., Smith, T. J., Brooke, D., Hunter, D. J., Organ,A., Coffey, P., Rapid Commun. Mass Spectrom. 2003, 17, 2027 – 2033.
[10] Heinig, K., Henion, J., J. Chromatogr. B 1999, 732, 445 – 458.
[11] Leroy, F., Presle, B., Verillon, F., Verette, E., J. Chromatogr. Sci.2001, 39, 487 – 490.
[12] Bauser, M., J. Chromatogr. Sci. 2002, 40, 292 – 296.
[13] Svec, F., Huber, C. G., Anal. Chem. 2006, 78, 2100 – 2107.
[14] Eur. Patent 0495255A1 (1991), invs.: Chervet, J. P.
[15] Leister, W., Strauss, K., Wisnoski, D., Zhao, Z., Lindsley, C., J.Comb. Chem. 2003, 5, 322 – 329.
[16] Moritz, R., O'Reilly, N., J. Biomol. Technol. 2003, 14, 136 – 142.
[17] Cai, H., Kiplinger, J. P., Goetzinger, W. K., Cole, R. O., Laws, K. A.,Foster, M., Schrock, A., Rapid Commun. Mass Spectrom. 2002, 16,544 – 554.
i 2007 WILEY-VCH Verlag GmbH & Co. KGaA, Weinheim www.jss-journal.com
Copyright © 2022 FDOKUMEN