Section 10 for CD - CiteSeerX
156
2440 Criteria for Performance Evaluation of Offshore Projects – The Changing Dimensions Vasanthi Srinivasan, [email protected] Vishnuprasad Nagadevara, [email protected] Indian Institute of Management Bangalore, India Abstract As the outsourcing industry matures, there is a growing recognition that a more holistic evaluation of outsourcing performance is required. The parameters and the criteria for evaluation would change in a long-term strategic oriented outsourcing partnership. This paper attempts to examine how performance measures used by customers change during a long-term partnership. It is an exploratory study to understand the evolution of metrics in a long-term partnership from a vendor perspective. In-depth interviews were conducted with key managers from vendor organizations in India who have been in the business of outsourcing for over 20 years. The findings indicate that there has been a change in the performance metrics and evaluation criteria over the period. While these changes in criteria have evolved over time in mature partnerships, many new partners are attempting to introduce the metrics into projects at an early stage resulting in a more holistic evaluation of outsourcing. Introduction Much has been written about the phenomenal growth of the software services sector in India and its contribution to the national and the international economy. A Nasscom-Mckinsey study cites a 34% increase in software and services export from 2004-05 from $12.8 billion to $17.2 billion (Nasscom Mckinsey, 2005). This study also predicts that by 2010, the US IT and BPO off shoring market will be $ 110 billion. It is also being recognized that Offshoring and outsourcing have been a source of competitive advantage for organizations (DiRomaualdo and Gurbaxani, 1998). The theoretical justification for outsourcing initially has been the transaction cost theory. The goal of an organization is to reduce cost and achieve efficiency. In the initial stages of outsourcing, labour cost arbitrage appears to have played a significant role to propel the growth of outsourcing (Arora and Athreya, 2002). It was also found that organizations would outsource non-core, low value, routine and highly modularized activities in the initial stages. These have typically been “lift and drop” processes—simple tasks with defined interfaces that can easily be taken from one location to another. However as firms look to extract more value from outsourcing, they will need to outsource more complex processes. These processes are more likely to be more deeply embedded in organizations and may be touching up on many other internal processes and relying on multiple IT systems (Chevalier and Robertson, 2005). Evidence from research studies suggests that it is often more profitable from the client perspective to outsource projects that are more complex and strategic in nature (Gopal, Sivaramakrishnan et al, 2003). Some authors have posited through simulations that, a significant value can be gained by off shoring tasks with an “optimal level of complexity that maximizes the return from off shoring at any given time period or experience level under given situation (Gupta, Seshasai and Mukherji, 2007). This will mean that outsourcing will need to be more strategic in nature and will have to build value drivers. Given the time differences, the concept of a 24-hour knowledge factory that attempts to establish a virtually seamless relationship between the vendor and the client is a growing reality. This would necessitate high interdependencies in processes and would require fostering a climate of long-term partnership between the client and the vendor instead of maintaining an arm’s length contractual relationship between them. The relationship between the client and vendor is going beyond simple contractual obligations and deliverables. Both parties have started to invest in time, efforts and money in managing and maintaining relationships. In a study on managing outsourcing relationships dealing with essential practices for buyers and sellers, a survey of both buyers and providers of outsourcing services was done in April 2006 to better analyze the
-
Upload
khangminh22 -
Category
Documents
-
view
0 -
download
0
Transcript of Section 10 for CD - CiteSeerX
2440
Criteria for Performance Evaluation of Offshore Projects – The Changing Dimensions
Vasanthi Srinivasan, [email protected] Vishnuprasad Nagadevara, [email protected] Indian Institute of Management Bangalore, India
Abstract As the outsourcing industry matures, there is a growing recognition that a more holistic evaluation of outsourcing performance is required. The parameters and the criteria for evaluation would change in a long-term strategic oriented outsourcing partnership. This paper attempts to examine how performance measures used by customers change during a long-term partnership. It is an exploratory study to understand the evolution of metrics in a long-term partnership from a vendor perspective. In-depth interviews were conducted with key managers from vendor organizations in India who have been in the business of outsourcing for over 20 years. The findings indicate that there has been a change in the performance metrics and evaluation criteria over the period. While these changes in criteria have evolved over time in mature partnerships, many new partners are attempting to introduce the metrics into projects at an early stage resulting in a more holistic evaluation of outsourcing. Introduction Much has been written about the phenomenal growth of the software services sector in India and its contribution to the national and the international economy. A Nasscom-Mckinsey study cites a 34% increase in software and services export from 2004-05 from $12.8 billion to $17.2 billion (Nasscom Mckinsey, 2005). This study also predicts that by 2010, the US IT and BPO off shoring market will be $ 110 billion. It is also being recognized that Offshoring and outsourcing have been a source of competitive advantage for organizations (DiRomaualdo and Gurbaxani, 1998).
The theoretical justification for outsourcing initially has been the transaction cost theory. The goal of an organization is to reduce cost and achieve efficiency. In the initial stages of outsourcing, labour cost arbitrage appears to have played a significant role to propel the growth of outsourcing (Arora and Athreya, 2002). It was also found that organizations would outsource non-core, low value, routine and highly modularized activities in the initial stages. These have typically been “lift and drop” processes—simple tasks with defined interfaces that can easily be taken from one location to another. However as firms look to extract more value from outsourcing, they will need to outsource more complex processes. These processes are more likely to be more deeply embedded in organizations and may be touching up on many other internal processes and relying on multiple IT systems (Chevalier and Robertson, 2005). Evidence from research studies suggests that it is often more profitable from the client perspective to outsource projects that are more complex and strategic in nature (Gopal, Sivaramakrishnan et al, 2003). Some authors have posited through simulations that, a significant value can be gained by off shoring tasks with an “optimal level of complexity that maximizes the return from off shoring at any given time period or experience level under given situation (Gupta, Seshasai and Mukherji, 2007). This will mean that outsourcing will need to be more strategic in nature and will have to build value drivers. Given the time differences, the concept of a 24-hour knowledge factory that attempts to establish a virtually seamless relationship between the vendor and the client is a growing reality. This would necessitate high interdependencies in processes and would require fostering a climate of long-term partnership between the client and the vendor instead of maintaining an arm’s length contractual relationship between them.
The relationship between the client and vendor is going beyond simple contractual obligations and deliverables. Both parties have started to invest in time, efforts and money in managing and maintaining relationships. In a study on managing outsourcing relationships dealing with essential practices for buyers and sellers, a survey of both buyers and providers of outsourcing services was done in April 2006 to better analyze the
2441
link between the value achieved through outsourcing and the effective management of the outsourcing relationship. Out of surveys of nearly 200 experienced buyers, providers and influencers of outsourcing, nearly all of them agreed that at least 10% of the annual contract value of outsourcing deals is at stake when it comes to effective relationship management. 80% of buyers and 60% of providers said that relationship management can account for 30% or more of annual contract value. Effective relationship management creates increased customer satisfaction, delivery of value added projects on time and on budget, quick response time to requests, greater innovation and thought leadership and resources freed internally to do other work. The study quotes "In fact, our study found that buyers and providers alike realized that managing complex outsourcing relationships effectively - both between the buyer and the provider, and among myriad internal stakeholders on both sides - enhances the value to both organizations. But perhaps most importantly, good relationships don't happen by goodwill alone: they require good governance structures, effective relationship management processes, skilled individuals, and more." Some authors (Goles, 2001) propose that a high vendor-client alignment, teamwork, balance of control and process agility in the relationship will lead to more successful outcomes.
The outsourcing activities, which started out of labour cost arbitrage and cost reduction, have slowly started to mature into informal strategic alliances. Drawing on the body of existing literature on outsourcing, conceptualizing it as a strategic alliance between two or more partners would provide scope for examining the nature and role of performance objectives, parameters, criteria and metrics differently. Field of Performance Management Performance management as an area of serious academic study at the firm level has gained recognition. It is often described as the “process of quantifying the efficiency and effectiveness of past actions through acquisition, collation, sorting, analysis, interpretation and dissemination of appropriate data” (Neely, 1998). Over time, the field of performance management has evolved from a measurement focus to a management focus (Otley, 1999). With the shift towards management focus, performance measurement systems based primarily on financial performance measures lack the focus and robustness needed for internal management and control (Atkinson, Waterhouse & Wells, 1997). With this changed emphasis, organizations are looking at measures that “effect positive change in organizational culture, systems and processes, by helping to set agreed upon performance goals, allocating and prioritizing resources, informing managers to either confirm or change current policy or programme directions to meet those goals and sharing results of performance in pursuing those goals “ (Amaratunga & Baldry, 2002). In the context of manufacturing outsourcing, Lee et al (2003) point out that “unlike the past the performance of an enterprise now depends much on the performance of its partners in the value chain”. We believe this comment is relevant in the context of outsourced environment, be it in manufacturing or services.
Some authors therefore propose that collaborative performance management may be the right direction in the realm of performance management (Busi and Bititchi, 2006). The outsourced environment is a “complex web of contracts, both explicit and implicit between two organizations”. The explicit contracts are often market based, short term and financial in nature, but the implicit contracts tend to rely on trust, motivation and a learning relationship to deliver intangibles such as service, flexibility and innovation (Atkinson, Waterhouse &Wells, 1997). The contracts are executed through a plethora of relationships across two organizations. These relationships are at multiple hierarchical levels and often call for planning, designing, implementing and operating structures and process which would allow for effective managing. Performance measurement in such a context is therefore not only a function of evaluation of outputs (financial and material) but also the process of collaboration. Collaborative performance according to the authors (Busi & Bititchi, 2006) would consist of the use of the following measures:
a. Extended process measures: How is the extended process performing? b. Collaborating measures: Are the enterprises able to work as a single unit? c. Collaboration management measures: Is the management of the companies providing and creating an
environment to allow collaboration to flourish?
2442
Such set of measures pose fundamental challenges for organizations: they require a deeper understanding of each other’s future strategies and plans, greater and open sharing of information and finally an understanding of the range of qualitative and quantitative measurements that would be required. Objectives of the Study As has been discussed earlier, conceptualizing outsourcing from a “strategic value adding alliance perspective”, allows an opportunity to look at collaborative performance measures to assess the efficiency and effectiveness of an outsourcing partnership. The recent literature on outsourcing has greatly hyped the role of “strategic long term value added outsourcing “. If this is the reality, then there is a need to examine whether the performance metrics have changed over time. Prior literature on control of outsourced projects (Choudhury and Sabherwal, 2003) suggests that in the initial stages of outsourcing, outcome controls and in particular output and scheduling of outputs are adopted. As the project progressed, behavior controls were introduced. Very few organizations use the self-control or clan control in the project performance assessment. While this is already happening at the level of the project, one would expect a similar trend to continue at the level of the strategic alliance.
To explore this relationship, it was decided to do in-depth interviews with heads of Quality and Customer Relationship Management in a vendor organization in India. The organization is one of the oldest IT services organizations in India and has experience of managing projects, which were as recent as a few months and also project relationships for over 20 years. The interviews focused on the following aspects:
a. What is the nature of the kinds of outsourcing relationships? What have been the dynamics? How has the relationship between the vendor and the client changed?
b. How did the projects evolve over a period in time with the long-term clients? c. What kind of metrics was being used to evaluate the effectiveness of the organization, in the initial stages
of outsourcing and now? Each interview conducted was for two hours and the above-mentioned themes were explored in an unstructured manner. The key aspects that emerged from the interviews are given below: Characteristics of the Industry Have Changed Since the early days of outsourcing, five significant shifts have happened in the industry: The shifts collectively can be described as three generations1
Characteristics First generation Second generation Third generation Period 1980’s Early 1990’s Early 2000 onwards Key decision maker Chief Information
officer Chief Technology officer
Chief Executive officer
Role of the Vendor Code delivery Project manager Business value creator Expectation from outsourcing
Cost, quality, delivery Cost, quality, delivery and functionality
Cost, quality, delivery, functionality and value add
Key influencer IT and technology personnel in house
Internal IT and line managers, IT consultants
Management consultants
In the early days of the outsourcing industry, the key decision makers in the client organizations were usually the IT departments or the Chief Information Officer.
When multiple projects with differing technologies and platforms began to be offshored, the Chief Technology officers began to play a critical role in influencing decisions, which were based on compatibility and functionality. In the last few years, it appears that the CEO’s have become the drivers of outsourcing since IT has increasingly become a driver of strategic performance and a tool for effective management reporting and control.
2443
The vendors have had to move from a functionality driven orientation to a performance driven orientation to a Value creating orientation. As one our respondents mentioned, “Most clients today outsource different modules to different vendors. The challenge for all of us is to understand inter-operability. It is inter-operability that you can bring value. It is not about being good at what you can bring to the table, but it is about being able to integrate what some one else is bringing to the table with what you have to offer”. The challenges of the transition include viewing IT as an enabler of business rather than a technology tool. This calls for a significant mind set change in the vendor organizations.
There is a need for capabilities, which are not just in the realm of technology; there is a need for increasing domain specialists who can bring value to the client beyond technology. One of the outsourcing vendor organizations started to maintain a team of experts who regularly study the client’s operations and business opportunities and advise the client on possible business strategies. In the case of the large third party vendors, there is also an expectation that since they work for multiple clients, they would be able to bring in the industry best practices in their offering. Thus, client-vendor relationship is evolving from providing service into an advisory or even a consultant’s role. The Role of Changing Metrics in the Evaluation of Outsourcing Success Given the context, the first generation outsourcing metrics broadly consisted of the number of deliverables, like design specifications, test plans, software modules, functional requirements etc), time schedules, work effort, number of service requests handled, number of defects per line of code and broad overarching customer measures related to customer satisfaction.
The second generation outsourcing metrics consisted of usability of the software by non IT users, maintainability which focused on the level of difficulty in the maintenance and support of the software and availability or uptime of the system. The perceptible shift in measures is reflective of the phase when IT was seen as a tool to increase efficiency.
The third generation metrics include all the above metrics, which have become a part of the contractual obligation of a vendor. No vendor today can be happy at having delivered on these metrics and most mature clients treat these metrics as “Business As Usual’ metrics. These metrics are taken for granted by the clients. Some of the emerging metrics in this space include:
a. Interoperability of solutions: Most large complex outsourced projects have multiple vendors. Since most vendors have acquired capabilities in niche areas, it is in the interest of the client to bring in those vendors. In this context, most clients expect the vendors to not just understand their software delivery but also the requirements of the entire software and thereby incorporate features of compatibility with other vendor software. b. Understanding the client’s customers: In recent times, a number of clients have been investing in educating their vendors on the end customer. It has led the vendor to realize that what is of utmost importance is not the client’s immediate requirement but the needs of the end customer. This has provided opportunities for many vendors to build domain expertise in certain functional areas, which are relevant to the client. The belief is that a sound understanding of the customers of the client would enable the vendor to make innovations in service delivery. The increasing domain expertise of the vendors is enabling the client organizations to invite them in to strategic conversations, which otherwise would have been internal to the client. This is one of the key indicators of a collaborative performance c. Repository of best practices: The third party software vendors are increasingly being viewed as a repository of best practice. Their domain expertise, with an understanding of the client business has meant that they are often seen as possessing greater experience on an application than the client. It is believed that the knowledge and prior experience of the vendor will result in solutions that are state of the art and are best practices in the industry. There is also a belief that the vendors would bring in solutions that would allow productivity gains and mitigate both technical and managerial risks on projects. Increasingly, contracts with incentives for “gain sharing” have been entered into between vendors and clients. d. Influencers:
2444
Mature partnerships appear to have reached a stage where the client organization in its strategic planning process invites the vendor organization to act as a sounding board for its future policies. The vendor provides information related to their own partnership and also the possible opportunities for pilot testing, research and development. The percentage of investment on new areas for exploration is gradually increasing. This is believed to be the new wave in outsourcing management.
Summary and Conclusions This exploratory study indicates that the changes in the context have impacted the outsourcing relationships and this has resulted in differing shades of engagement between the vendor organization and the client. It also appears that increasingly vendor relationships are seen as platforms for collaboration and are viewed as strategic. This has resulted in changing metrics from delivery focus to functionality focus and finally business interest focus. The move to include many process metrics beyond output metrics appears It is expected that more sophisticated metrics will evolve for measuring collaborations. In mature relationships, the trend seems to be around more holistic measurements of the partnership. Some authors (Misra, 2004) have suggested a life cycle approach to the use of metrics in an outsourcing engagement. This is consistent with our understanding of the current phenomenon. Appropriate metrics allow the parties to create conditions for successful performance.
The dominant role of IT consultants who appear to push these collaborative measurements in to early stage projects requires further exploration. Most of the third generation collaboration measures are measures of trust and a growing recognition and respect for the distinctive competencies that each party brings to the relationship. There is a need for further research on this dimension
References [1] Amaratunga, D & Baldry, D. (2002) Moving from Performance Measurement to Performance Management
Facilities, Vol. 20(5/6) 217-223 as cited in Busi M and Bititchi, Umit S., Collaborative performance Management: present gaps and future research. International Journal of Productivity and Performance Management, Vol 55(1/2) 7-26 Umit S (2006): Collaborative performance Management: present gaps and future research. International Journal of Productivity and Performance Management. Vol 55(1/2) 7-26
[2] Arora, A. and S. Athreye (2002): The software industry and India’s economic development. Information Economics and Policy, Vol. 14(2): 253-273.
[3] Atkinson, A.A, Waterhouse, J H, Wells, R. B. (1997) A Stakeholder’s approach to strategic Performance Management. Sloan Management Review, Spring, 25-37
[4] Busi, M & Bititchi, Umit S (2006): Collaborative performance Management: present gaps and future research. International Journal of Productivity and Performance Management, Vol 55(1/2) 7-26
[5] Chevalier, J & Robertson, H (2005) Offshore business process outsourcing: strategies to minimize failure in Technology and Offshore Outsourcing strategies by Brudenall, P. Palgrave London
[6] Choudhury, V& Sabherwal, R (2003): Portfolios of Control in Outsourced Software Development Projects. Information Systems Research, Vol. 14(3):291-314
[7] CMA News Hamilton (2006) Relationships everything in outsourcing: A study, Vol 80 (2): 11 [8] DiRomaualdo, A & Gurbaxani, V (1998), Strategic Intent for IT outsourcing, Sloan Management Review
Summer Vol 39(4) [9] Goles, T (2001) The impact of client vendor relationship on outsourcing success, Unpublished dissertation
University of Houston as cited in Levina, N & Ross J W (2003) From the Vendor’s perspective: Exploring the value proposition in the Information Technology outsourcing, MIS Quarterly, Vol 27 (3) 331-354
[10] Gopal, A., Sivaramakrishnan, K., Krishnan, M.S. & Mukhopadhyay, T. (2003) Contracts in offshore software development: An empirical analysis, Management Science, Vol 49(12)
2445
[11] Gupta, A, Seshasai, S, Mukherji, S (2007) Offshoring: The Transition from Economic Drivers Toward Strategic Global Partnership and 24-Hour knowledge Factory. Journal of Electronic commerce in Organizations, Vol 5(2),1-23
[12] Misra, Ram B (2004) Global IT outsourcing: Metrics for Success of all parties. Journal of Information Technology Cases and applications, Vol 6(3) 21-35
[13] Nasscom Mckinsey Report (2005): Extending India’s leadership of the IT and BPO industries [14] Neely, A D (1998) Performance Measurement: Why, what and how, Economics Books, London [15] Otley, D (1999) Performance Management: A framework for management control systems research.
Management Accounting Research, Vol 10(4) 363-82
End Notes
1This concept was described to the authors by Mr. Jagadish Krishnaswamy of Wipro Technologies
2446
Aligning Supplier Integration Practices with Time-Based Performance: A Conceptual Framework
Ru-Jen Lin, [email protected]
Lunghwa University of Science and Technology, Taiwan Shih-Chia Chang, [email protected]
Li-Hua Huang, [email protected] National Taipei College of Business, Taiwan
Abstract In view of the market demand variations and technological revolution have triggered manufacturers to implement the practices of supplier integration. Supplier involvement and collaboration is considered as an imperative strategy to sustain competitive advantage. The works of manufacturing strategy have verifies the truth that the degree of supplier integration facilitate the buying firms to effectively enhance time-based capability. The present study offers a framework for conceptualizing the relationship between supplier integration practices and time-based capability (e.g., delivery promptness, new product development time, delivery reliability/dependability, and manufacturing cycle time). Some hypotheses referring to those two elements are provided based on previous literature. Moreover, several supplier integration practices are discussed such as the degree of supplier involvement, the design of component responsibility, supplier commitment, information sharing, and supplier base reduction. Our study not only serves as a guideline for firms to implement different supplier integration practices for promoting specific kinds of time-based performance, but also makes a theoretical contribution towards further empirical research. Keywords: supplier integration practices; time-based capabilities Introduction
In last decade, the shorter product life cycle, intensive technology innovation, and dynamic global competition, the time-based capability in terms of the rapid delivery, quick new product development (NPD), and reduced manufacturing cycle time have become market advantage creation and sustaining weapons (Jayaram et al., 1999). Obtaining the time-based capability is to strengthen the critical supplier integration relationship in the supply chain (Ragatz et al., 1997). The supplier integration practices include limiting the supplier to play a simple role of purchasing product design consulter transforming into an active participator in the NPD, even more delegating responsibility in the design in the supplier outsourcing parts and constructing the information sharing mechanism among suppliers. Based on the effective execution of the supplier integration practices, the time-based performance in terms of the rapid NPD and delivery would be improved (Ragatz et al., 2002).
The past studies related to the supplier integration practices and time-based capability only limited to the early involvement degree of the supplier in terms of purchasing NPD. They focus on the supplier integration practices to the effects in the NPD performance or business performance (Carr and Pearson, 2002; Ragatz et al., 2002; Petersen et al., 2003; Ragatz et al., 1997). The supplier integration practices and time-based capability both have multi-dimensional characteristics nature. There are five dimensions of the supplier integration practices including the degree of supplier involvement, the design of component responsibility, supplier commitment, information sharing, and supplier base reduction (Chen and Paulraj, 2004; McIvor and Humphreys, 2004). The measures of the time-based capability comprise of the delivery promptness, new product development time, delivery reliability/dependability, and manufacturing cycle time (Droge et al., 2004). If we only focus on one single or aggregate dimension to conduct research, we would forgo the clarification and identification of each supplier integration practice to different time-based capability. The managerial application and the scope of the related studies would be restricted. We thus integrate the supplier integration practices and time-based performance to construct their own conceptual framework of the one-to-one relationships.
2447
Practices of Supplier Integration
The supplier integration practices are various practices for the manufacturers and suppliers to maintain long-term reciprocal highly cooperation (Droge et al., 2004). In order to respond to the international operating competitive demands and global supply chain function, in the issue of the supplier relationship management, many manufacturing strategy scholars have turned the traditional short-term profit orientation into the long-term cooperation strategy partnership. The operating flexibility and fast responsiveness to the market changes would be thus strengthened. The conventional supplier management selection was based on the price rather than the quality. Therefore, under the mutual short-term profit superseding base, there was few interaction between the supplier and purchasing manufacturer (Liker et al., 1998). Since Toyota and most Japanese manufacturers aggressively establish the long-term partnership with their suppliers and effectively improve the manufacturing advantages including the product quality level, rapid delivery, and fast new product development. How to maintain the highly collaboration relationship between the manufacturer and the supplier has become one of the imperative study issue of the contemporary supply chain management.
Clark (1989) and Clark and Fujimoto (1991) examine the case studies of Japanese manufacturers. They find the supplier adopting the early participation in the NPD, aggressively involving various quality improvement management programs, and maintaining the bona fine cooperation relationship. Funk (1993), Newman (1989), and Hartely et al. (1997a; 1997b) suggest the manufacturer delegating higher responsibility in terms of the outsourcing parts and adopting supplier base reduction strategy both construct the closer trust relationship with the suppliers. Derocher and Kilpatrick (2000) and Evans and Wurster (1997) indicate that the purchasing manufacturer and the suppliers utilize the information sharing mechanism established by the network technology. They apply the necessary information communication and maintain appropriate mutual trust. Lee and Billington (1992) and Kumar (1996) define the supplier commitment is the willingness to conduct critical investment in accordance with the purchasing manufacturer strategic development intention. They also advocate the supplier highly commitment is one of unavoidable important dimension of the supplier integration practices. We summarize the above mentioned scholars and conclude five dimensions of the supplier integration practices including: the degree of supplier involvement; supplier responsibility of the component design; supplier base reduction; information sharing, and supplier commitment. Degree of Supplier Involvement The degree of supplier involvement indicates the aggregate participation level in terms of the new product development (product concept development, prototype design, pilot test, or production) and various quality improvement programs. Several studies advocate the early supplier aggressive participation in the purchasing manufacturer new product development would contribute positive shortening in the new product development cycle time (Takeishi, 2001; Swink, 1999). The aggressive involvement in various quality improvement programs would strengthen the time-based capability of the order manufacturing cycle (Liker et al., 1998). Narasimhan et al. (2004) suggest that the supplier involvement incorporating the early participation in the new product development procedure, various product development committees (such as design for manufacturability (DFM) or design for assembly (DFA)), and various quality management program. Design of Component Responsibility Asanuma (1989) and Helper (1991) suggest that there are four kinds of parts productions including: in-house design and production, in-house design/supplier production, design and production with suppliers, or fully delegation of the supplier design and production. Traditionally, the outsourcing parts were designed in-house and transformed the part specifications to supplier for production. But recent a lot of manufacturing management literatures support that the Japanese automobile manufacturers have delegated their suppliers in terms of outsourcing design responsibility. The overall supply chain in the automobile industry quality level and competition have been improved. Based on the supplier professional competency and the reciprocal trust establishment, the delegation of the design of component responsibility to the supplier has become a common strategy approach in terms of supplier integration practice.
2448
Supplier Base Reduction In the past due to the price competition and risk diversification, the manufacturer applied the multiple supplier strategy for purchasing parts (Newman, 1989; Shin et al., 2000). In recent practices, most manufacturers have turned from the traditional multiple supplier strategy into supplier base reduction. The major reason is the cost higher than the price benefit derived from the multiple supplier management. More importantly, the multiple supplier strategy won’t establish the long-term cooperation and trust with the suppliers (Gadde and Hakarsson, 1994). Besides the supplier base quantity reduction, the immediate tier reduction of the supply chain is an imperative task of the supplier base reduction. That is the manufacturer as possible as to purchase the assembled system rather than the individual parts in order to reduce the supply chain supplying levels. In this kind of practice, the first tier supplier should directly provide products to the purchasing manufacturer. Compared to the second or third tier suppliers, the first tier supplier has closer relationship with the purchasing manufacturer. The mutual partnership is easier to establish. Supplier Commitment The supplier commitment is the willingness and intention for the suppliers to match the operating strategy of downstream manufacturer. The suppliers devote their input resources continuously and maintain reciprocal long-term cooperation relationship (Dion et al., 1992). Lee and Billington (1992) find the effects derived from the overall supply chain performance or the operating advantage of the supply chain members most based on the highly trust and commitment. Several studies advocate that the purchasing manufacturer and their suppliers keep better reliability and commitment would construct the concrete supply chain integration practices (Heide and John, 1990; Handfield and Bechtel, 2002). Canon and Perreault (1999) measure the commitment based on the reciprocal technology investment level among the supply chain members. Prahinski and Benton (2004) apply the mutual trust, length of the long-term cooperation, and the willingness to solve the problems mutually to measure. Information Sharing The information sharing is defined as the mutual degree in terms of critical, core, or professional information to exchange and sharing between the purchasing manufacturer and supplier (Towill, 1997). Recent supply chain management advocate that if the upstream and downstream members could establish a sound information communication and sharing mechanism, the rapid responsiveness capability to the market demand would be improved (Sahin and Robinson, 2002). In respect of the information sharing content, Mentzer et al. (2000) indicate the mutual information contents include: strategic information (business strategy plan and product development plan); activity information (production schedule plan and quality management information); market and customer demand information, and distribution information. Prahinski and Benton (2004) and Ward and Zhou (2006) adopt the information sharing channel perspective and suggest that the manufacturer and supplier enable to share reciprocal information through multiple approaches in terms of face-to-face communication, telephone, fax, or internet information technology.
Time-Based Performance
As the highly dynamic customer demand change and shorter product life cycle, most manufacturers ponder how to apply time-based capability to improve their competitive advantage in the global or regional market (Stalk and Hout, 1990; Handfield and Pannesi, 1995). The Boston Consulting Group initially conceptualizes the time-based strategy and applies in the business practices. The strategy management of the time-based competition (TBC) is one of imperative issue for practitioners and academics. Several well-known case studies adopting the time-based capability strategy practices and result impressed performance. Jayaram et al. (1999) find 3M applying time-based strategy approach and shortened the new product development time from two years into two month. The time-based strategy application in Fuji Xeron has successfully reduced the R&D cycle time of the copier machine from four years into two years. Various time-based competition-oriented practices utilizing in Toyota have decreased the new car model R&D time to two years. Toyota has preceded the Big Three automobile manufacturers (GM, Ford, and Chrysler) in the new product development cycle time. Several successful business cases have substantially reduced the new product development time over 75 % (Trygg, 1993). Carter et al. (1995), Tunc and Gupta (1993), and Handfield (1993) find the well-know cellular phone maker- Motorola, the manufacturing cycle has dramatically
2449
reduced to four hours instead of previous several weeks. For Toyota to manufacture an automobile, it only takes two days, compared to their North American counterparts in less than three days. For Johnson and Johnson, their popular Acuvue only takes less than three days to deliver the order and 99.9% prompt delivery rate. This kind of prompt delivery capability results their leading position in the contact lens market.
Carter et al. (1995) and Tersine and Hummingbird (1995) demonstrate the time-based capability showing the multi-dimensional characteristics. Various manufacturing management programs result distinct time-based capability performance. Roth and Miller (1990) explore the relationship between the manufacturing strategy and business performance, they measure the time-based capability by the delivery promptness, delivery reliability/ dependability; and new product development time. Vickery et al. (1995) examine the determinants of business performance and suggest the manufacturers enabling to strengthen the time-based capability in terms of the new product development cycle time, the quantity of the new product introduction, manufacturing cycle time, and delivery time. Besides the delivery promptness, delivery reliability, delivery dependability, and new product development time to market, Roth and Maruchek (1993) and Safizadeh et al. (1995) also advocate that the responsiveness capability to the customer need or complaint should be included in the measures of the time-based capability. Therefore, the sound customer relationship would be maintained. When Jayaram et al. (1999) investigate the empirical study of the time-based capability in North American Automobile industry, they suggest that the manufacturing cycle time should be one of important indicator. The promptness of the manufacturing department upon receipt of order till the order completion should be honored. Droge et al. (2004) discuss the time-based capability to attribute the business performance in terms of the new product time to market, manufacturing time to product, and rapid responsiveness as measuring dimensions. The rapid responsiveness capability focuses on the strategy or approach to respond to the customer needs. We summarize the above mentioned scholars aspects and category the following time-based capabilities. (1) New Product Development Time: the capability which the manufacturer can quickly modify current product quality or develop a new product (Vickery et al. 1995). We measure the numbers of new product introductions or the time required for the new product development. (2) Manufacturing Cycle Time: the capability which the manufacturer can shorten the time upon receipt of customer’s order, placing the production request to the manufacturing department, and the order production completion (Handfield and Pannesi, 1995). This is to measure the promptness of manufacturing department. (3) Delivery Promptness: the capability which the manufacturer can shorten the time effectively in the receipt of customer order till the product delivery to the customer (Handfield, 1992; Droge et al. 2004). (4) Delivery Reliability/ Dependability: the capability which the manufacturer can follow the customer delivery time request and deliver the products to the customers punctually and correctly (Handfield and Pannesi, 1995; Roth and Miller, 1990). The delivery dependability indicates the manufacturer can satisfy the order request in terms of the product quantity, type, and specification. Proposition
Applied the related research of the supplier integration practices and time-based capability, we demonstrate the following research propositions. P1a: The degree of supplier involvement leads to positive new product development time. P1b: The degree of supplier involvement leads to positive manufacturing cycle time. P1c: The degree of supplier involvement leads to positive delivery promptness. P1d: The degree of supplier involvement leads to positive delivery reliability/dependability. P2a: The supplier design component responsibility leads to positive new product development time. P2b: The supplier design component responsibility leads to positive manufacturing cycle time. P2c: The supplier design component responsibility leads to positive delivery promptness. P3a: The supplier base reduction leads to positive new product development time. P3b: The supplier base reduction leads to positive manufacturing cycle time. P3c: The supplier base reduction leads to positive delivery promptness.
2450
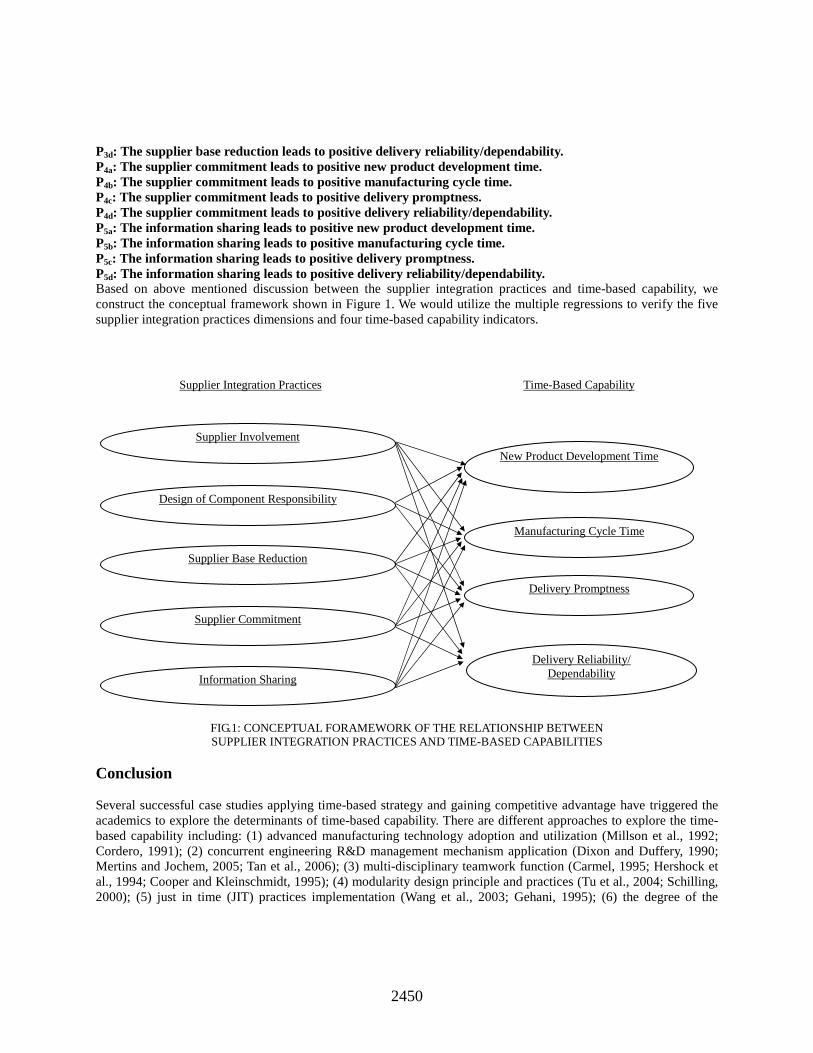
P3d: The supplier base reduction leads to positive delivery reliability/dependability. P4a: The supplier commitment leads to positive new product development time. P4b: The supplier commitment leads to positive manufacturing cycle time. P4c: The supplier commitment leads to positive delivery promptness. P4d: The supplier commitment leads to positive delivery reliability/dependability. P5a: The information sharing leads to positive new product development time. P5b: The information sharing leads to positive manufacturing cycle time. P5c: The information sharing leads to positive delivery promptness. P5d: The information sharing leads to positive delivery reliability/dependability. Based on above mentioned discussion between the supplier integration practices and time-based capability, we construct the conceptual framework shown in Figure 1. We would utilize the multiple regressions to verify the five supplier integration practices dimensions and four time-based capability indicators.
FIG.1: CONCEPTUAL FORAMEWORK OF THE RELATIONSHIP BETWEEN SUPPLIER INTEGRATION PRACTICES AND TIME-BASED CAPABILITIES
Conclusion
Several successful case studies applying time-based strategy and gaining competitive advantage have triggered the academics to explore the determinants of time-based capability. There are different approaches to explore the time-based capability including: (1) advanced manufacturing technology adoption and utilization (Millson et al., 1992; Cordero, 1991); (2) concurrent engineering R&D management mechanism application (Dixon and Duffery, 1990; Mertins and Jochem, 2005; Tan et al., 2006); (3) multi-disciplinary teamwork function (Carmel, 1995; Hershock et al., 1994; Cooper and Kleinschmidt, 1995); (4) modularity design principle and practices (Tu et al., 2004; Schilling, 2000); (5) just in time (JIT) practices implementation (Wang et al., 2003; Gehani, 1995); (6) the degree of the
Supplier Involvement
Design of Component Responsibility
Supplier Base Reduction
Supplier Commitment
Information Sharing
Supplier Integration Practices Time-Based Capability
New Product Development Time
Manufacturing Cycle Time
Delivery Promptness
Delivery Reliability/ Dependability
2451
supplier involvement in the new product development (Ragatz et al., 2002; Petersen et al., 2003). Therefore, the past literature focuses on the process technology, R&D management, cross-functional teamwork, modularity design, and JIT production practices perspectives to explore on how to improve the time-based capability. Therefore, our study proposes five dimensions of the supplier integration practices to affect four time-based capabilities. Our research has innovation and uniqueness compared to previous perspectives.
There were abundant studies regarding the supplier integration practices and time-based capability, but they only limited to the early involvement in the new product development, the effects to the new product development performance, or the business performance. There were scant studies related to the five supplier integration practices influence to the business performance. Obviously, the past research is not rigorous yet. Pertaining to the time-based capability determinants, most studies referring from the aspects of process technology, R&D management, cross-functional teamwork, modularity design, and JIT production practices on how to improve the time-based capability. There were few issues based on the supplier integration practices to conduct the influence to the time-based capability. In other words, we integrate the supplier integration practices and time-based capability to investigate their influential relationship exhibiting innovative and unique presentation.
There are multi-dimensional natures of the supplier integration practices and time-based capability. The past one single or aggregate indicator is not sufficient to delineate or discuss their insightful cause-and-effect relationship. In our study, we identify one-to-one perspectives from the five supplier integration practices to four time-based capabilities. We present a conceptual framework can serve a managerial decision direction. The manager can choose appropriate supplier integration practices for anticipated time-based capability improvement. Our study would be conducted in further investigation for related research.
References
[1] Asanuma, B. (1989). Manufacturer-supplier relationships in Japan and the concept of relation-specific skill. Journal of the Japanese and International Economies, 3, 1-30.
[2] Cannon, J.P., & Perreault, Jr. W.D. (1999). Buyer-seller relationships in business markets. Journal of Marketing Research, 36, 439-460.
[3] Carmel, E. (1995). Cycle time in packaged software firms. Journal of Product Innovation Management, 12, 110-123.
[4] Carr, A.S. & Pearson, J.N. (1999). Strategically managed buyer-supplier relationships and performance outcomes. Journal of Operations Management, 17, 497-519.
[5] Carr, A.S. & Pearson, J.N. (2002). The impact of purchasing and supplier involvement on strategic purchasing and its impact on firms’ performance. International Journal of Operations and Production Management, 22(9/10), 1032-1053.
[6] Carter, P. L., Melnyk, S.A., & Handfield, R.B. (1995). Identifying the basic process strategies for time-based competition. Production and Inventory Management Journal, 36(1), 65-70.
[7] Chen, I.J., & Paulraj, A. (2004). Understanding supply chain management: critical research and a theoretical framework. International Journal of Production Research, 42(1), 131-163.
[8] Clark, K.B. (1989). Project scope and project performance: the effect of parts strategy and supplier involvement on product development. Management Science, 35, 1247-1263.
[9] Clark, K.B. & Fujimoto, T. (1991). Product Development Performance: Strategy Organization and Management in the World Auto Industry, Harvard Business School Press, Boston, MA.
[10] Cooper, R.G. & Kleinschmidt, E.J. (1995). Benchmarking the firm’s critical success factors in new product development. Journal of Product Innovation Management, 12(5), 374-391.
[11] Cordero, R. (1991). Managing for speed to avoid product obsolescence: a survey of techniques. Journal of Product Innovation Management, 8(4), 283-294.
[12] Derocher, R.P. & Kilpatrick, J. (2000). Six supply chain lessons for the new millennium. Supply Chain Management Review, 3(4), 34-41.

2452
[13] Dion, J.R., Banting, P., Picard, S., & Blenkhorn, D. (1992). JIT implementation: a growth opportunity for purchasing. International Journal of Purchasing and Materials Management, 28, 33-.
[14] Dixon, D. & Duffey, M.R. (1999). The neglect of engineering design. California Management Review, Winter, 9-23.
[15] Droge, C., Jayaram, J., & Vickery, S.K. (2004). The effects of internal versus external integration practices on time-based performance and overall firm performance. Journal of Operations Management, 22, 557-573.
2453
Clusters and Cluster Performance Management
Drahomira Pavelkova, [email protected] Adriana Knapkova, [email protected]
Eva Jircikova, [email protected] Tomas Bata University in Zlin, Czech Republic
Abstract This contribution deals with some critical issues of cluster performance management. The first topic discussed is the use of clusters as a tool for increasing the performance of companies and regions in the conditions of globalization, followed by governmental and local policies and their impact on the development of clusters. Finally, some important factors of cluster performance management based on results obtained from surveys and structured interviews of managers of selected clusters are identified. Introduction There are a number of definitions of clusters in the literature. Cortright [3] concludes that one fixed definition of clusters cannot be made. It is necessary to modify one’s definition depending on the purpose of the given study. For the purpose of this paper we will use the definition proposed by Porter. Porter [8] defines a cluster as “a geographic concentration of mutually interconnected companies, specialized suppliers, providers of services, companies in similar fields and associated institutions, such as universities, agencies and associations of different orientations, which compete, but also cooperate.”
Clusters may represent forms of vertical as well as horizontal integration of companies. Debate is ongoing as to whether globalization will make clusters more or less important, with the literature
leaning towards greater regional importance. Some economists argue that regional specialization and clustering of related activities are becoming more important features of the world economy as a result of globalization. Clusters as a Tool for Increasing the Performance of Companies and Regions The development of clusters seems to promise an answer to the challenges created by increased international competition and the growing importance of innovation in the knowledge economy. Clusters of interrelated firms can be an important source of competitive advantage and active membership of cluster can lead to increased performance of individual firms. Let’s try to answer question what could be the reasons for that.
At the beginning, we have to identify possibilities for cooperation among members of cluster. There are several fields for cooperation, particularly:
� networking � human resource management � research and development, innovation processes � marketing, public relations � investments � lobbying, etc.
Networking represents the creation of conditions for formal and informal flow of information and knowledge within the cluster. It increases the availability and rate of transfer of information and technologies due to the proximity of the companies, strong ties between them and the highly competitive nature of the cluster. It can have the form of short meetings of representatives of individual cluster members, information support by common web site, newspaper, setup information center etc. The management of a cluster may arrange contacts not only among the members of the cluster, but also with suppliers, customers, providers of financial capital, with
2454
educational, research and other institutions, which are not members of the cluster. However, the creation of networks must not be an end in itself, it has to be useful for the companies and move them forward.
Human resources, their availability to the companies and the improvement of their qualifications, represent an important field for the cooperation within the clusters. This can be a common vocational guidance and education of employees by organizing courses, common seminars and conferences, by creation of educational centers. A cluster usually organizes these activities in cooperation with educational institutions; it can finance them from its own resources or can use financing from different supporting projects. Cooperation of the cluster with secondary schools, colleges and universities can be significant in creating cooperative networks, helpful in formulation of demands on graduates of these schools according to the needs of industrial practice (orientation of programs of studies, modification of curricula etc.). The presence of a strong cluster in a region may also attract talents from elsewhere.
The experience from the existence of clusters shows that for a dynamic growth of the cluster and of the companies in the cluster it is essential to pay attention to the sphere of research and innovation. Innovations maintain the viability and prosperity of companies in the marketplace; research and development create the condition for future growth. The support of innovation is directed towards the development of new products or the improvement of their properties or towards the process improvements. The support of research brings new know-how. These processes are interrelated even if they represent different activities of the cluster. The cooperation of the companies within the cluster may have the form of sharing information and ideas, mutual research projects, support of formation and expansion of spin-off companies etc. Companies may develop a mutual research infrastructure together or cooperate with research institutions (research institutes or universities), which have the necessary materials, technical facilities and equipments as well as properly trained personnel and which are often initiators and operators of „incubators“ and scientific and technical parks. Universities and research institutes can also greatly benefit from the cooperation with clusters - they can better move the results of their research into implementation in practice and commercialization. Skokan [9] shows in his publication that innovation processes are not perceived today as being linear, but as interactive, linked up, integrated and acting on a feedback. It is therefore absolutely essential to create a network environment for the cooperating subjects within the regional infrastructure, which allows the transfer of technologies and know-how to the environment of entrepreneurial subjects.
The field of business cooperation and promotion includes activities as joint purchasing and a possibility of a higher pressure on the quality of delivered goods and their pricing, or shared production. There is a possibility to fill large orders or possibility of greater specialization; a cluster may combine companies from different links of the value chain. This enables smaller companies to specialize and compete with larger, vertically linked companies. Additional benefits of cooperation are more effective logistic management; shared expenses for marketing research of trends and markets; joint participation in trade fairs; joint catalogue of products and services for the member of clusters; the possibility to utilize joint logo, trademark, advertisement etc.
Obtaining sources for financing of investment projects are very important for the strategic development of a cluster. Attracting investors with advantageous conditions of financing or joint financing can be a significant resource for reducing capital costs and risk. An access to financing can be easier for a cluster than for an individual company. Investors (often venture capital) may be attracted into the region due to positive image created by the presence of a strong cluster. Financing of necessary investment projects creates conditions for a further growth of the cluster.
Another no less important field useful for the growth of a cluster and its members is lobbing on behalf of building a necessary infrastructure, improvement of legislature, grant policy etc. A cluster magnifies the power and voice of smaller companies. They can urge the government or regional representation to make investments in specialized infrastructure. Thanks to the visibility of a cluster, cost effectiveness and higher return on investment represented by a cluster, its additional possible investments are more easily justifiable.
For the growth of a cluster, other supporting activities that the cluster management can offer to its members can be important. These activities can secure an effective collaboration in above-mentioned areas, such as help with preparation and management of projects; securing service in the form of accounting a legislative consulting; banking services; insurance; benchmarking etc.
2455
From the above it follows that there are many activities that can be implemented within the cluster, which can contribute to the increase of efficiency of individual companies.
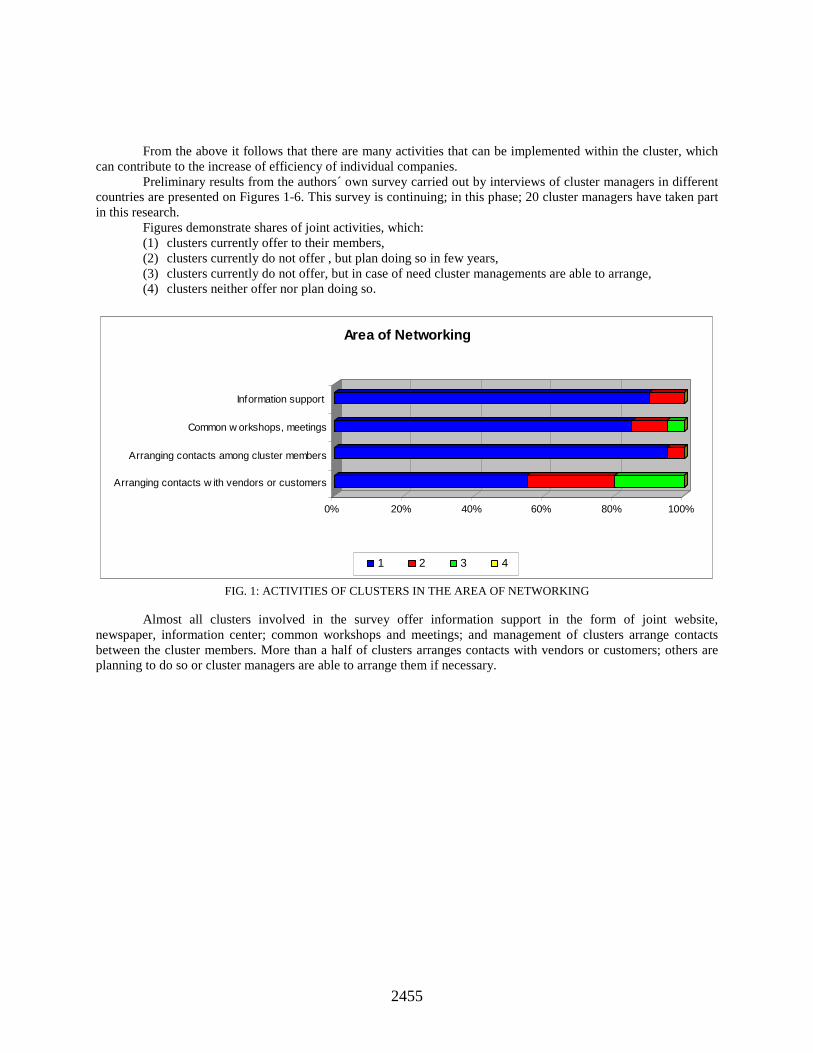
Preliminary results from the authors´ own survey carried out by interviews of cluster managers in different countries are presented on Figures 1-6. This survey is continuing; in this phase; 20 cluster managers have taken part in this research.
Figures demonstrate shares of joint activities, which: (1) clusters currently offer to their members, (2) clusters currently do not offer , but plan doing so in few years, (3) clusters currently do not offer, but in case of need cluster managements are able to arrange, (4) clusters neither offer nor plan doing so.
0% 20% 40% 60% 80% 100%
Information support
Common w orkshops, meetings
Arranging contacts among cluster members
Arranging contacts w ith vendors or customers
Area of Networking
1 2 3 4
FIG. 1: ACTIVITIES OF CLUSTERS IN THE AREA OF NETWORKING
Almost all clusters involved in the survey offer information support in the form of joint website,
newspaper, information center; common workshops and meetings; and management of clusters arrange contacts between the cluster members. More than a half of clusters arranges contacts with vendors or customers; others are planning to do so or cluster managers are able to arrange them if necessary.
2456
0% 20% 40% 60% 80% 100%
Organization of joint seminars and conferences
Training of employees
Cooperation with educational institutions
Area of Human Resources
1 2 3 4
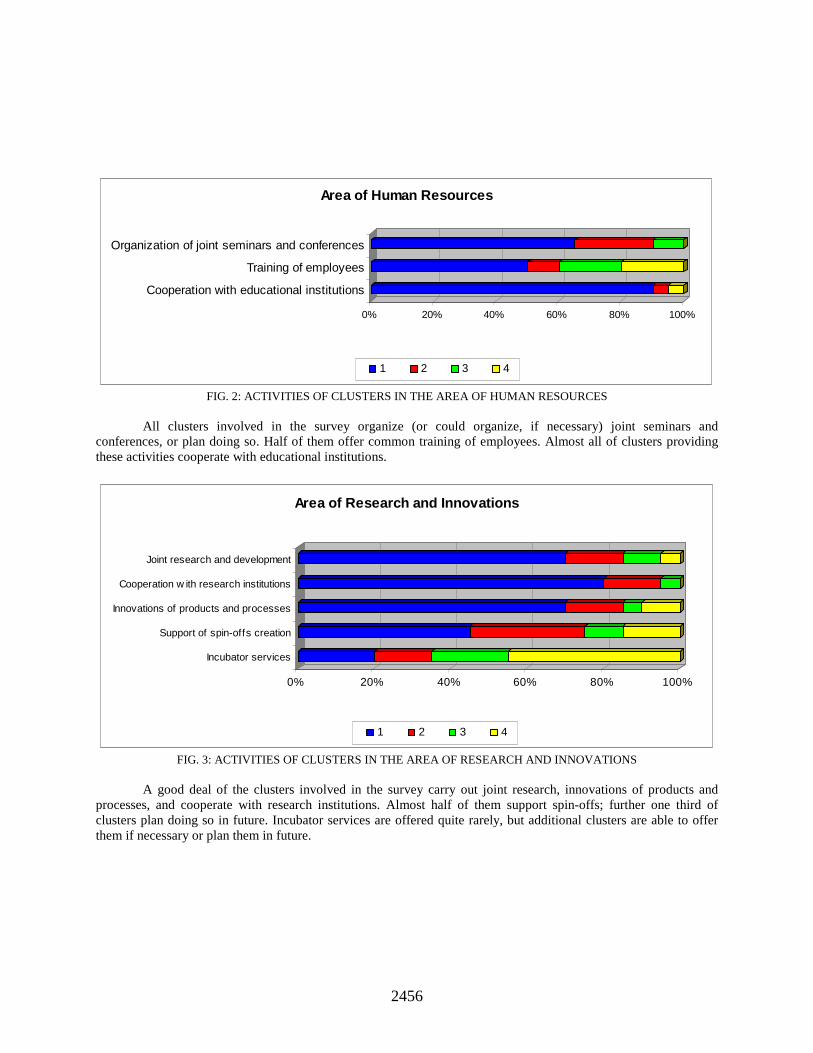
FIG. 2: ACTIVITIES OF CLUSTERS IN THE AREA OF HUMAN RESOURCES
All clusters involved in the survey organize (or could organize, if necessary) joint seminars and
conferences, or plan doing so. Half of them offer common training of employees. Almost all of clusters providing these activities cooperate with educational institutions.
0% 20% 40% 60% 80% 100%
Joint research and development
Cooperation w ith research institutions
Innovations of products and processes
Support of spin-offs creation
Incubator services
Area of Research and Innovations
1 2 3 4
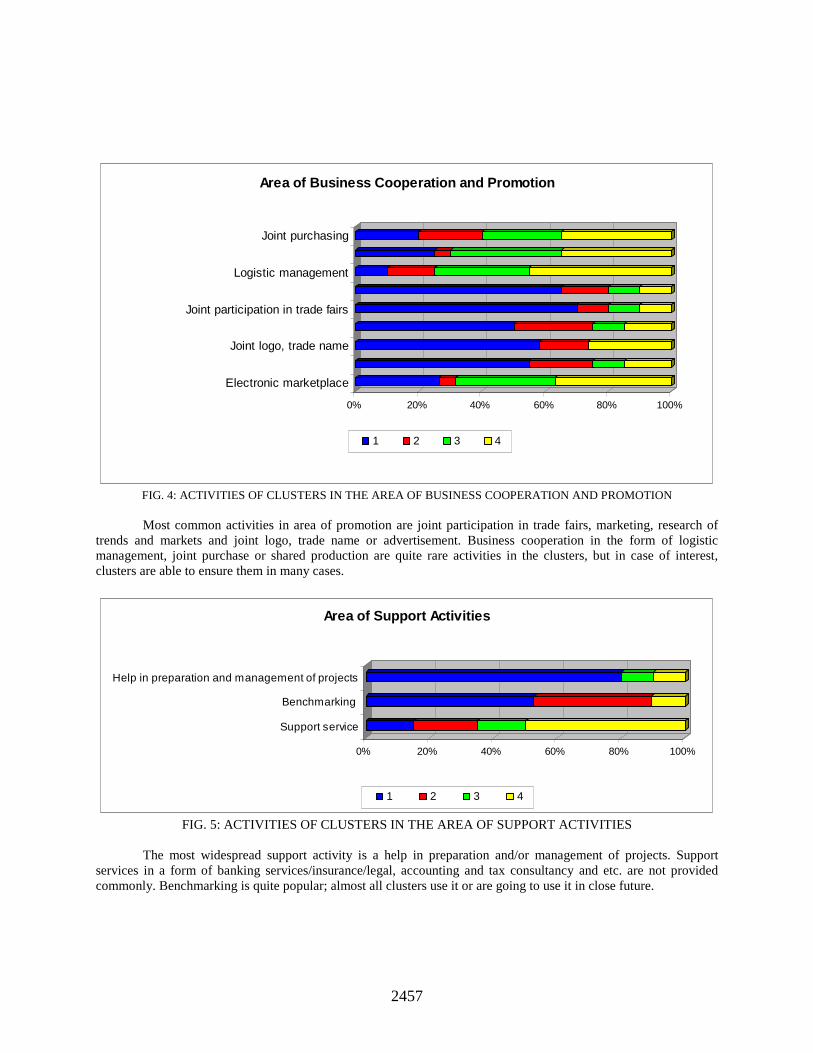
FIG. 3: ACTIVITIES OF CLUSTERS IN THE AREA OF RESEARCH AND INNOVATIONS
A good deal of the clusters involved in the survey carry out joint research, innovations of products and
processes, and cooperate with research institutions. Almost half of them support spin-offs; further one third of clusters plan doing so in future. Incubator services are offered quite rarely, but additional clusters are able to offer them if necessary or plan them in future.
2457
0% 20% 40% 60% 80% 100%
Joint purchasing
Logistic management
Joint participation in trade fairs
Joint logo, trade name
Electronic marketplace
Area of Business Cooperation and Promotion
1 2 3 4
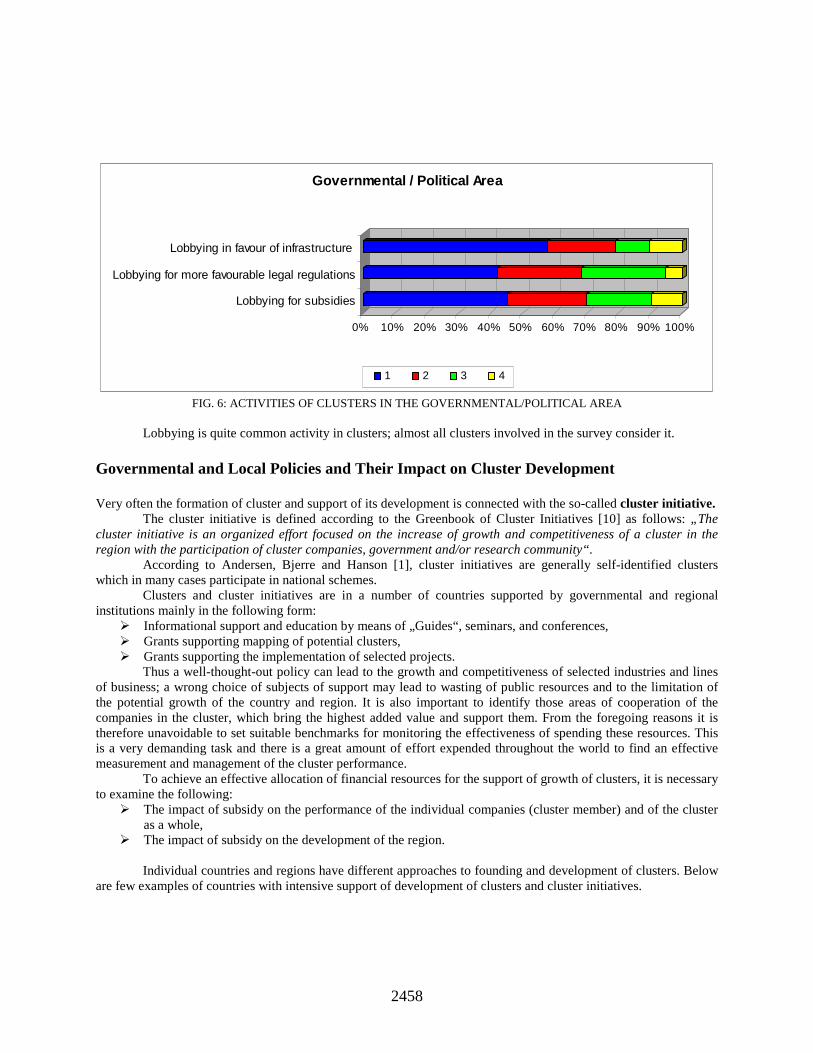
FIG. 4: ACTIVITIES OF CLUSTERS IN THE AREA OF BUSINESS COOPERATION AND PROMOTION
Most common activities in area of promotion are joint participation in trade fairs, marketing, research of
trends and markets and joint logo, trade name or advertisement. Business cooperation in the form of logistic management, joint purchase or shared production are quite rare activities in the clusters, but in case of interest, clusters are able to ensure them in many cases.
0% 20% 40% 60% 80% 100%
Help in preparation and management of projects
Benchmarking
Support service
Area of Support Activities
1 2 3 4
FIG. 5: ACTIVITIES OF CLUSTERS IN THE AREA OF SUPPORT ACTIVITIES
The most widespread support activity is a help in preparation and/or management of projects. Support
services in a form of banking services/insurance/legal, accounting and tax consultancy and etc. are not provided commonly. Benchmarking is quite popular; almost all clusters use it or are going to use it in close future.
2458
0% 10% 20% 30% 40% 50% 60% 70% 80% 90% 100%
Lobbying in favour of infrastructure
Lobbying for more favourable legal regulations
Lobbying for subsidies
Governmental / Political Area
1 2 3 4
FIG. 6: ACTIVITIES OF CLUSTERS IN THE GOVERNMENTAL/POLITICAL AREA
Lobbying is quite common activity in clusters; almost all clusters involved in the survey consider it.
Governmental and Local Policies and Their Impact on Cluster Development Very often the formation of cluster and support of its development is connected with the so-called cluster initiative.
The cluster initiative is defined according to the Greenbook of Cluster Initiatives [10] as follows: „The cluster initiative is an organized effort focused on the increase of growth and competitiveness of a cluster in the region with the participation of cluster companies, government and/or research community“.
According to Andersen, Bjerre and Hanson [1], cluster initiatives are generally self-identified clusters which in many cases participate in national schemes.
Clusters and cluster initiatives are in a number of countries supported by governmental and regional institutions mainly in the following form:
� Informational support and education by means of „Guides“, seminars, and conferences, � Grants supporting mapping of potential clusters, � Grants supporting the implementation of selected projects.
Thus a well-thought-out policy can lead to the growth and competitiveness of selected industries and lines of business; a wrong choice of subjects of support may lead to wasting of public resources and to the limitation of the potential growth of the country and region. It is also important to identify those areas of cooperation of the companies in the cluster, which bring the highest added value and support them. From the foregoing reasons it is therefore unavoidable to set suitable benchmarks for monitoring the effectiveness of spending these resources. This is a very demanding task and there is a great amount of effort expended throughout the world to find an effective measurement and management of the cluster performance.
To achieve an effective allocation of financial resources for the support of growth of clusters, it is necessary to examine the following:
� The impact of subsidy on the performance of the individual companies (cluster member) and of the cluster as a whole,
� The impact of subsidy on the development of the region.
Individual countries and regions have different approaches to founding and development of clusters. Below are few examples of countries with intensive support of development of clusters and cluster initiatives.
2459
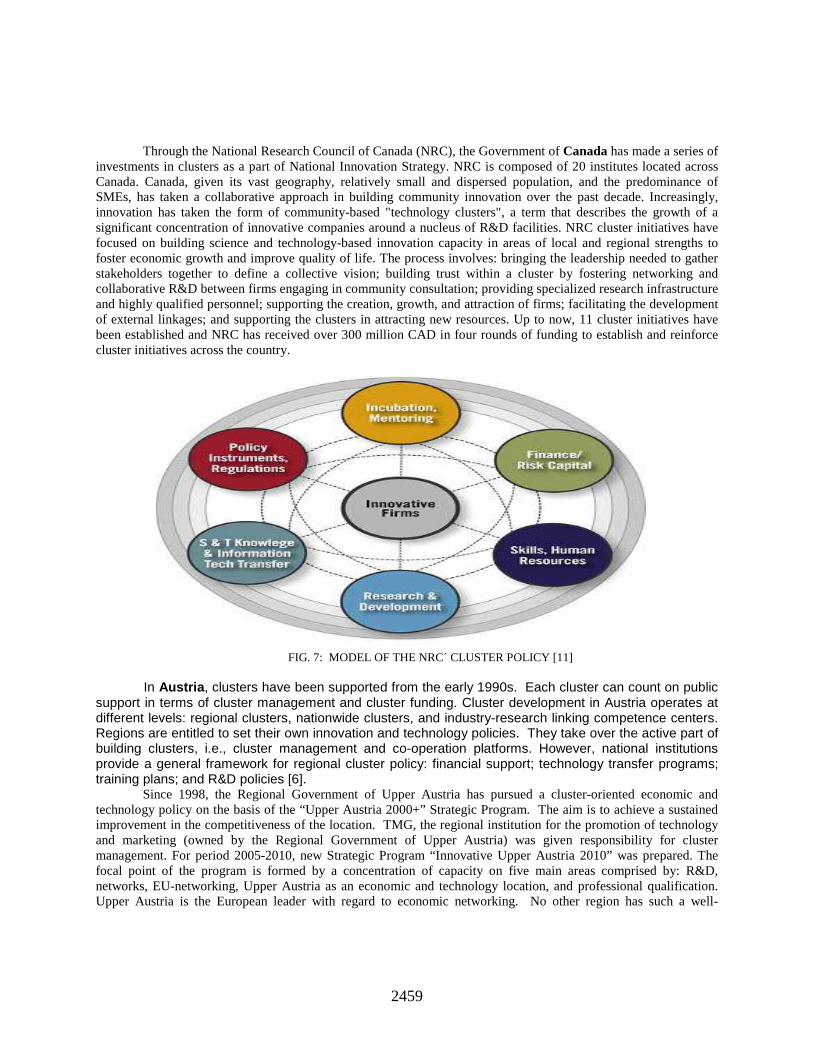
Through the National Research Council of Canada (NRC), the Government of Canada has made a series of investments in clusters as a part of National Innovation Strategy. NRC is composed of 20 institutes located across Canada. Canada, given its vast geography, relatively small and dispersed population, and the predominance of SMEs, has taken a collaborative approach in building community innovation over the past decade. Increasingly, innovation has taken the form of community-based "technology clusters", a term that describes the growth of a significant concentration of innovative companies around a nucleus of R&D facilities. NRC cluster initiatives have focused on building science and technology-based innovation capacity in areas of local and regional strengths to foster economic growth and improve quality of life. The process involves: bringing the leadership needed to gather stakeholders together to define a collective vision; building trust within a cluster by fostering networking and collaborative R&D between firms engaging in community consultation; providing specialized research infrastructure and highly qualified personnel; supporting the creation, growth, and attraction of firms; facilitating the development of external linkages; and supporting the clusters in attracting new resources. Up to now, 11 cluster initiatives have been established and NRC has received over 300 million CAD in four rounds of funding to establish and reinforce cluster initiatives across the country.
FIG. 7: MODEL OF THE NRC´ CLUSTER POLICY [11]
In Austria, clusters have been supported from the early 1990s. Each cluster can count on public support in terms of cluster management and cluster funding. Cluster development in Austria operates at different levels: regional clusters, nationwide clusters, and industry-research linking competence centers. Regions are entitled to set their own innovation and technology policies. They take over the active part of building clusters, i.e., cluster management and co-operation platforms. However, national institutions provide a general framework for regional cluster policy: financial support; technology transfer programs; training plans; and R&D policies [6].
Since 1998, the Regional Government of Upper Austria has pursued a cluster-oriented economic and technology policy on the basis of the “Upper Austria 2000+” Strategic Program. The aim is to achieve a sustained improvement in the competitiveness of the location. TMG, the regional institution for the promotion of technology and marketing (owned by the Regional Government of Upper Austria) was given responsibility for cluster management. For period 2005-2010, new Strategic Program “Innovative Upper Austria 2010” was prepared. The focal point of the program is formed by a concentration of capacity on five main areas comprised by: R&D, networks, EU-networking, Upper Austria as an economic and technology location, and professional qualification. Upper Austria is the European leader with regard to economic networking. No other region has such a well-
2460
established climate of cooperation. At present, approximately 1,200 companies, R&D bodies, and educational institutes are partners in the inter-branch network Clusterland Upper Austria, Ltd., as following: Automotive-Cluster, Health-Cluster, Plastics-Cluster, Furniture/Timber-Construction-Cluster, and Mechatronics-Cluster. Clusterland supports cluster and network initiatives. The Clusterland partners employ more than 219,000 people and have total annual sales of € 39.02 billion. The Clusterland sustained more than 220 co-operation projects and more than 500 training events.
Lower Austria’s cluster policy has become an important part of regional innovation and technology policy as well. The trend in Lower Austria has turned around from step by step increasing independency for cluster initiatives (as planned in 2001 when the first initiatives started) to a clear mandate for the Regional Development Agency (RDA) to run cluster initiatives as an economic policy instrument to strengthen SMEs. The regional government provides the main part of financial resources to operate the cluster managements for a limited short period of time (5 - 10 years). Companies’ financial participation in clusters should be generated from moderate membership fees, fees for workshops or events and sponsoring. Fees foster involvement of companies, but also a service orientation of the cluster team. The regional development agency Ecoplus explores and maps cluster potentials, implements cluster initiatives, provides the financial and information support and employs cluster managers. Ecoplus combines different economic instruments for a better cluster development like technology services, business location development, business parks, and support for start-ups, etc. Ecoplus has already established cluster initiatives in six next-generation sectors: timber, automotive, green building, wellbeing, plastics and food industry. 475 companies with more than 58,000 employees are already participating as partners in these clusters. Around 100 cooperation projects have already been completed, with more than 400 companies participating.
Cluster initiatives in the Czech Republic have been supported by the program “KLASTRY”, which began in 2004 and has enabled identification and support of new sectors and sub-sectors with potential to improve competitiveness through collaboration and innovation. The program focuses on the financial support to regions demonstrating commitment to innovative clusters. The KLASTRY program is managed by the CzechInvest, an agency of the Ministry of Industry and Trade. The total budget for the program over the years 2004-2006 was approximately 12 million EUR (average of 4 million EUR per year). The budget per cluster may reach up to € 33,000 for activities connected with the creation of a cluster, not to exceed 75% of eligible costs. Eligible costs include items such as studies, meetings, or workshops and associated materials. The budget for the development of the cluster may range from approx. € 100,000 to 1.6 million for management and development of clusters (for the total program period of up to three years). Reimbursement cannot exceed 50% of the total project cost based on the following schedule (maximum of 75% of eligible costs in year 1, 50% in year 2, and 25% in year 3). Eligible costs may include cluster staff, tangible and intangible assets for the cluster initiative, consulting services, benchmark studies, cluster promotion, evaluation of economic impact, and research (market, competition, and innovation). Supported clusters must be in the Czech Republic (but not in Prague), include at least 15 firms (min. 60% of members are SMEs), include at least one university or research institute. [5, 12]. Per CzechInvest, there are 51 different clusters or potential clusters across Czech regions. Prior to launching the program, CzechInvest offered a training and cluster awareness sessions to cluster facilitators, academics and regional government and private sector representatives. Periodic training sessions as well as the Annual National Cluster Conference are organized. CzechInvest also plans to develop a formal accreditation process for specific cluster facilitation skills. New program for supporting clusters, pole of excellence and networks – “Cooperation” (financed by EU funds) will be launched in the second half of the year 2007. Cluster Performance Management What can contribute greatly to the progress of clusters and to the support of their performance? Since cluster performance is not a single-dimensional concept, it is necessary to look at a range of factors influencing this performance.
2461
Generally, in order for a business to grow, it must be able to access the necessary external resources and operate within a supportive business environment. The macroeconomic framework for the growth of enterprise is the widest dimension influencing the performance of subjects acting here. Much innovation support focuses on individual or groups of companies, helping them address and improve internal competences, e.g. technology, skills, funding. Even if companies have addressed all their internal issues, but they cannot readily access finance to grow, or if there is a lack of suitably skilled staff available, this will limit their development.
National or regional policies can to a high degree contribute to the formation of clusters (mapping of potential grouping) and their growth, as has been mentioned and demonstrated in selected countries. However, clusters can be formed and developed even without a special set-up cluster policy of a government or region.
An organization of cluster activities and mutual communication between the members of clusters can be done by the professional management or by representatives of individual cluster members. The efficiency of cluster management may play a significant role in the development of a cluster and its members, as well as of cooperating institutions.
According to Breschi and Malerba [2], the key feature of successful clusters is related to the high level of embeddedness of local firms in a very thick network of knowledge sharing, which is supported by close social interactions and by institution building trust and encouraging informal relations among actors. The possibility for individual firms to tap into the body of localized knowledge and capabilities depends on the fundamental way on the ability to establish and maintain effective social links and lines of communication. Besides offering an industrial atmosphere favorable to innovation and entrepreneurship, and a social capital supporting trust and a cooperative relationships, the additional key feature of technology-intensive clusters is related to the availability of a common set of resources, some endogenously given, like universities and public research centers, and some others endogenous to the cluster development, like a pool of specialized and skilled labor.
These propositions have been preliminary confirmed by authors´ own survey carried out by interviews of cluster managers in different countries (as mentioned above). The following aspects were identified as being essential for the cluster development and cluster performance management:
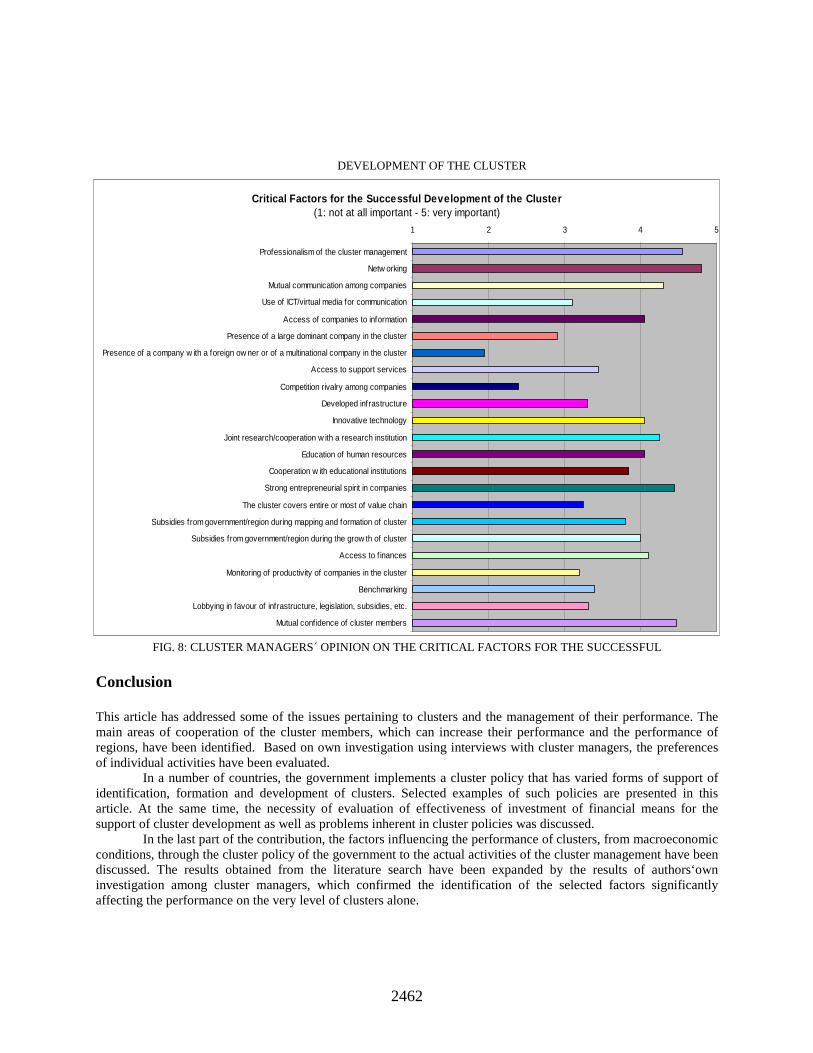
� Networking and mutual communication among cluster members; � Professionalism of the cluster management; � Mutual confidence and communication among cluster members; � Strong entrepreneurial spirit in companies; � Joint research or cooperation with a research institutions; � Access to finances; � Access of companies to information; � Cooperation with educational institutions; � Education of human resources; � Innovative technologies, � Subsidies from government/region during the growth of cluster.
Cluster managers do not consider a presence of a company with a foreign owner or of a multinational company and competition rivalry among companies in the cluster as very important factors for cluster development.
More detailed results of survey of cluster managers opinions can be seen in Fig. 8.
2462
DEVELOPMENT OF THE CLUSTER
FIG. 8: CLUSTER MANAGERS´ OPINION ON THE CRITICAL FACTORS FOR THE SUCCESSFUL
Conclusion This article has addressed some of the issues pertaining to clusters and the management of their performance. The main areas of cooperation of the cluster members, which can increase their performance and the performance of regions, have been identified. Based on own investigation using interviews with cluster managers, the preferences of individual activities have been evaluated.
In a number of countries, the government implements a cluster policy that has varied forms of support of identification, formation and development of clusters. Selected examples of such policies are presented in this article. At the same time, the necessity of evaluation of effectiveness of investment of financial means for the support of cluster development as well as problems inherent in cluster policies was discussed.
In the last part of the contribution, the factors influencing the performance of clusters, from macroeconomic conditions, through the cluster policy of the government to the actual activities of the cluster management have been discussed. The results obtained from the literature search have been expanded by the results of authors‘own investigation among cluster managers, which confirmed the identification of the selected factors significantly affecting the performance on the very level of clusters alone.
Critical Factors for the Successful Development of the Cluster (1: not at all important - 5: very important)
1 2 3 4 5
Professionalism of the cluster management
Netw orking
Mutual communication among companies
Use of ICT/virtual media for communication
Access of companies to information
Presence of a large dominant company in the cluster
Presence of a company w ith a foreign ow ner or of a multinational company in the cluster
Access to support services
Competition rivalry among companies
Developed infrastructure
Innovative technology
Joint research/cooperation w ith a research institution
Education of human resources
Cooperation w ith educational institutions
Strong entrepreneurial spirit in companies
The cluster covers entire or most of value chain
Subsidies from government/region during mapping and formation of cluster
Subsidies from government/region during the grow th of cluster
Access to f inances
Monitoring of productivity of companies in the cluster
Benchmarking
Lobbying in favour of infrastructure, legislation, subsidies, etc.
Mutual confidence of cluster members
2463
Acknowledgement
Authors are thankful to the Grant Agency in the Czech Republic (GA CR) No. 402/06/1526 for financial support to carry out this investigation.
References [1] Andersen, T., Bjerre, M. and Hanson, E.W. (2006). The Cluster Benchmarking Project. Nordic Innovation
Centre. [2] Breshi, S., Malerba, F. (2005). Clusters, Networks and INNOVATION. Oxford University Press. ISBN 0-
19-927555-6. [3] Cortright, J. (2006). Making Sense of Clusters: Regional Competitiveness and Economic Development,
Impresa, The Brooking Institution Metropolitan Policy Program. [4] Davis, CH.H., Arthur, D., Cassidy, E. and Wolfe, D. (2006). What Indicators for Cluster Policies in the
21th Century?, Blue Sky II 2006 Conference, Ottawa [5] European Commission, Enterprise Directorate-General (2005). Annual Innovation Policy Trends and
Appraisal Report: Czech Republic 2004-2005. [6] European Commission, Enterprise Directorate-General (2005). Final Report On The Expert Group On
Enterprise Clusters And Networks: Austria [7] Hynek, J., Janeček, V. (2006). Technological Competitiveness Measurement. In: Proceedings of the 2nd
International Conference on Business, Management and Economics, Yasar University, Izmir, Turkey, pp. 6. ISSN 1306-1089.
[8] Porter, M. E. (1990). The Competitive Advantage of Nations. New York: The Free Press. ISBN 0684841479.
[9] Skokan, K. (2004). Konkurenceschopnost, inovace a klastry a v regionálním rozvoji. Repronis Ostrava. ISBN 80-7329-059-6.
[10] Sölvell, Ö., Lindquist, G., Ketels, C. (2003). The Cluster Initiative Greenbook. Ivory Tower AB, Sweden. ISBN 91-974783-1-8.
[11] http://www.nrc-cnrc.gc.ca/clusters/innovation_e.html [12] http://www.czechinvest.org
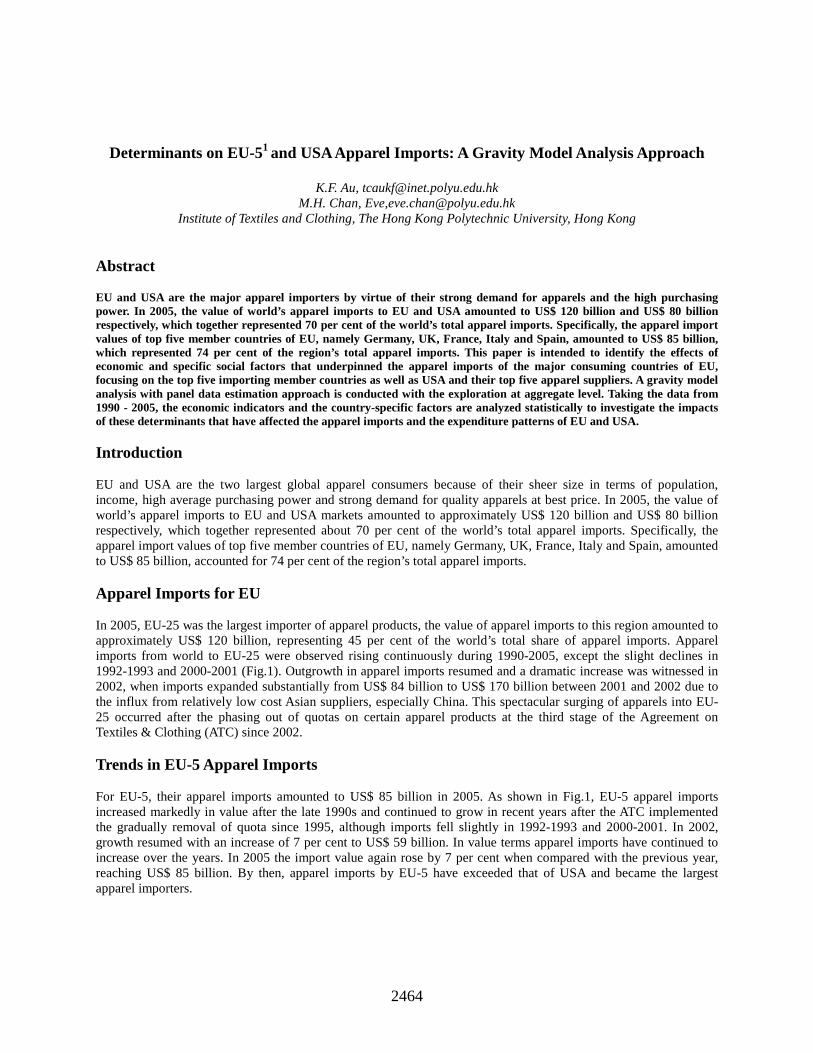
2464
Determinants on EU-51 and USA Apparel Imports: A Gravity Model Analysis Approach
K.F. Au, [email protected] M.H. Chan, Eve,[email protected]
Institute of Textiles and Clothing, The Hong Kong Polytechnic University, Hong Kong
Abstract EU and USA are the major apparel importers by virtue of their strong demand for apparels and the high purchasing power. In 2005, the value of world’s apparel imports to EU and USA amounted to US$ 120 billion and US$ 80 billion respectively, which together represented 70 per cent of the world’s total apparel imports. Specifically, the apparel import values of top five member countries of EU, namely Germany, UK, France, Italy and Spain, amounted to US$ 85 billion, which represented 74 per cent of the region’s total apparel imports. This paper is intended to identify the effects of economic and specific social factors that underpinned the apparel imports of the major consuming countries of EU, focusing on the top five importing member countries as well as USA and their top five apparel suppliers. A gravity model analysis with panel data estimation approach is conducted with the exploration at aggregate level. Taking the data from 1990 - 2005, the economic indicators and the country-specific factors are analyzed statistically to investigate the impacts of these determinants that have affected the apparel imports and the expenditure patterns of EU and USA. Introduction
EU and USA are the two largest global apparel consumers because of their sheer size in terms of population, income, high average purchasing power and strong demand for quality apparels at best price. In 2005, the value of world’s apparel imports to EU and USA markets amounted to approximately US$ 120 billion and US$ 80 billion respectively, which together represented about 70 per cent of the world’s total apparel imports. Specifically, the apparel import values of top five member countries of EU, namely Germany, UK, France, Italy and Spain, amounted to US$ 85 billion, accounted for 74 per cent of the region’s total apparel imports.
Apparel Imports for EU
In 2005, EU-25 was the largest importer of apparel products, the value of apparel imports to this region amounted to approximately US$ 120 billion, representing 45 per cent of the world’s total share of apparel imports. Apparel imports from world to EU-25 were observed rising continuously during 1990-2005, except the slight declines in 1992-1993 and 2000-2001 (Fig.1). Outgrowth in apparel imports resumed and a dramatic increase was witnessed in 2002, when imports expanded substantially from US$ 84 billion to US$ 170 billion between 2001 and 2002 due to the influx from relatively low cost Asian suppliers, especially China. This spectacular surging of apparels into EU-25 occurred after the phasing out of quotas on certain apparel products at the third stage of the Agreement on Textiles & Clothing (ATC) since 2002.
Trends in EU-5 Apparel Imports
For EU-5, their apparel imports amounted to US$ 85 billion in 2005. As shown in Fig.1, EU-5 apparel imports increased markedly in value after the late 1990s and continued to grow in recent years after the ATC implemented the gradually removal of quota since 1995, although imports fell slightly in 1992-1993 and 2000-2001. In 2002, growth resumed with an increase of 7 per cent to US$ 59 billion. In value terms apparel imports have continued to increase over the years. In 2005 the import value again rose by 7 per cent when compared with the previous year, reaching US$ 85 billion. By then, apparel imports by EU-5 have exceeded that of USA and became the largest apparel importers.
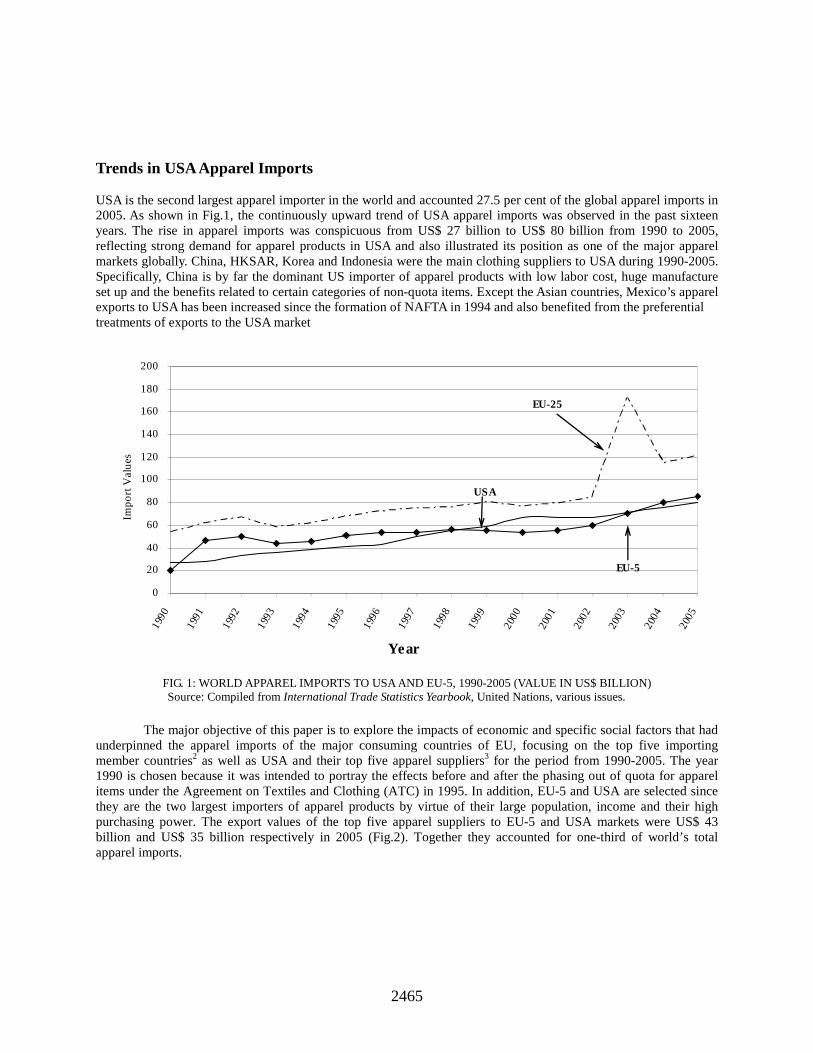
2465
Trends in USA Apparel Imports
USA is the second largest apparel importer in the world and accounted 27.5 per cent of the global apparel imports in 2005. As shown in Fig.1, the continuously upward trend of USA apparel imports was observed in the past sixteen years. The rise in apparel imports was conspicuous from US$ 27 billion to US$ 80 billion from 1990 to 2005, reflecting strong demand for apparel products in USA and also illustrated its position as one of the major apparel markets globally. China, HKSAR, Korea and Indonesia were the main clothing suppliers to USA during 1990-2005. Specifically, China is by far the dominant US importer of apparel products with low labor cost, huge manufacture set up and the benefits related to certain categories of non-quota items. Except the Asian countries, Mexico’s apparel exports to USA has been increased since the formation of NAFTA in 1994 and also benefited from the preferential treatments of exports to the USA market
0
20
40
60
80
100
120
140
160
180
200
1990
1991
1992
1993
1994
1995
1996
1997
1998
1999
2000
2001
2002
2003
2004
2005
Year
Imp
ort
Va
lue
s
EU-25
USA
EU-5
FIG. 1: WORLD APPAREL IMPORTS TO USA AND EU-5, 1990-2005 (VALUE IN US$ BILLION) Source: Compiled from International Trade Statistics Yearbook, United Nations, various issues.
The major objective of this paper is to explore the impacts of economic and specific social factors that had underpinned the apparel imports of the major consuming countries of EU, focusing on the top five importing member countries2 as well as USA and their top five apparel suppliers3 for the period from 1990-2005. The year 1990 is chosen because it was intended to portray the effects before and after the phasing out of quota for apparel items under the Agreement on Textiles and Clothing (ATC) in 1995. In addition, EU-5 and USA are selected since they are the two largest importers of apparel products by virtue of their large population, income and their high purchasing power. The export values of the top five apparel suppliers to EU-5 and USA markets were US$ 43 billion and US$ 35 billion respectively in 2005 (Fig.2). Together they accounted for one-third of world’s total apparel imports.
2466
0
10
20
30
40
50
1990
1991
1992
1993
1994
1995
1996
1997
1998
1999
2000
2001
2002
2003
2004
2005
Year
Imp
ort
ed
Va
lue
s
EU-5
USA
FIG. 2: VALUES OF APPARELS DELIVERED TO USA AND EU-5 BY TOP FIVE SUPPLIERS, 1990 -2005 (VALUE IN US$ BILLION)
Source: Compiled from International Trade Statistics Yearbook, United Nations, various issues. Empirical Analysis by the Gravity Model The gravity model has a long history in social science studies as well as in international trade research. The model has been used to provide empirical explanations for spatial interaction behaviors of human populations including migration, information and trade flows (Sen and Smith, 1995).
For empirical analysis and verification, the gravity model with the panel data estimation approach is used to determine whether EU-5 and USA apparel imports can be explained by certain economic indicators and the country-specific factors including GDP, per capita GDP, real exchange rate, labor wage, value added, geographical distance and population growth rate. These factors were analyzed statistically to investigate their impacts of principal economic and social determinants that have affected the apparel imports and consumers’ patterns of the EU-5 and USA.
Most of the previous trade analyses that employed the gravity trade model have only adopted a cross-section or time-series analytical technique (Matyas, 1997, Glick and Rose, 2002, Anderson and Van Wincoop, 2003). The use of panel data modeling estimation approach in this paper is intended to provide an extensive analysis and to obtain a meticulous study on apparel trading. Also, past investigations were generally related to the general trading scenarios and not clothing specific. Thus, this study aims to fill the research gap and provide insights for the major determinants that have driven major apparel suppliers’ exports to EU-5 and USA markets from 1990 to 2005.
2467
Theoretical Foundation for the Gravity Model of Trade
In the 1960s, the gravity model of trade was first introduced by Tinbergen (1962) and Poyhonen (1963) independently in the economic literature to analyze bilateral trade flows between countries in Europe and successfully proved that trade between two countries is proportional to the product of their masses (GDP) and inversely related to the distance between them. Later, Linnemann (1966) added more variables and explored a theoretical justification in terms of a general equilibrium. It was further adopted by Anderson (1979) and Bergstrand (1985 and 1989) together with Armington’s (1969) assumption for explaining international trade.
Moreover, Deardorff (1998) reconciled the gravity model with the classical theories of trade, the factor proportions model, which emphasizes differences in factor endowments across trading countries (Huang & Labys, 2001). Similarly, Eaton and Kortum (2002) derived the equation from random technological differences between countries in a Ricardian structure. Apart from these, Evenett & Keller (1998) showed that the gravity model can be adopted from the H-O model under both perfect and imperfect product specializations. They argued that the increasing return of scale model was more applicable than the perfect specialization version of H-O model to explain the success of the gravity equation. In 2002, Harrigan conducted a comprehensive review of the gravity model with reference to different major trade theories, including the Armington model, the monopolistic competition models and the general equilibrium model. Given its parsimony and the often acclaimed empirical robustness, the gravity model of trade has never lost its attractiveness over the past four decades in international trade analysis.
Panel Data Estimation with Fixed Effects
Although the gravity model was popularly used for bilateral trade analysis, Cheng and Wall (2005) indicated that the estimation of the gravity model by OLS has some disadvantages such as multicollinearity effect as well as it cannot detect the invisible factor which may bias the estimation. In order to avoid the weaknesses, the econometric test, the panel data estimation approach is applied in the following estimation.
To conduct the panel data analysis with fixed effects and by taking the difference between the subsequent years, the invisible effect can be eliminated prior to the estimation and any time-constant explanatory variables are also removed along with it (Wall, 2002 and 2003). While import, export and geographical factors are presented in the gravity equation but these factors are not random as they are associated with countries’ specific characteristics, the use of the fixed effects method can obtain a more reliable result (Egger, 2000).
Panel data estimation approach has become one of the rising topics of interest in the econometrics literature because of its advantages. It can explore the dynamics of change over time and to enlarge the quality and quantity of data (Gujarati, 2000). Furthermore, it also allows the capturing and disentangling of the time invariant country-specific effect (Egger, 2000) and to monitor the possible unobservable trading-partner-pair individual effects (Martinez-Zarzoso and Nowak-Lehmann, 2003).
Since the previous gravity model studies were concentrated on the general commodity but not specific for apparel trade. The use of panel data estimation approach in this paper is intended to extend an exhaustive analysis and provide an insight into the principal determinants that have affected EU-5 and USA apparel imports.
Econometric Analysis The initial estimation was analyzed by Best Linear Unbiased Estimator (BLUE) ordinary least-square (OLS) as it is the basic analytical technique and provides estimation about the different independent effect of each factor on the apparel import values (Hufbauer et al, 1997). Unfortunately, it yields a biased estimator because of the multicollinearity effect. In this case, the independent variables, importers’ GDP and their per capita GDP are highly correlated that violates the assumption of OLS.
Therefore, in order to get rid of the constraint of OLS estimator as well as to avoid the problem of high multicollinearity between independent variables and specially to negate the effect of unobserved variables, the panel data estimation approach with fixed effects is applied in this analysis.
2468
Standard Gravity Equation The gravity model with panel data estimation approach for the import function of apparel to EU-5 and USA can be modeled by the following equation. ln(IM ij ) = α + β1ln(GDPj)t+β2ln(GDPi)t+β3ln(PCGPDj)t+β4ln(PCGPDi)t+β5ln(Dij)+β6POPGRATEit+β7REXRATEijt+
β8WAGEjt+β9VALADDED jt+Uijt
Where, t (t=1…16) starting from the year 1990 to 2005 represent the time at which trading transaction took place; ln(IM ij) = Log of import value of apparel in million of US dollars from the top five suppliers to EU-5
and USA, i represents EU-5 and USA, j denotes the suppliers’ variables; α = unobserved effect or fixed effects and it does not change over time, it captures all
unobserved time-constant factors that affect IMij ; ln(GDPj) = Log of GDP of top five apparel suppliers in million of US dollars; ln(GDPi) = Log of GDP of EU-5 and USA in million of US dollars; ln(PCGDPj) = Log of per capita GDP of suppliers in million of US dollars; ln(PCGDPi) = Log of per capita GDP of EU-5 and USA in million of US dollars; ln(Dij) = Log of the geographical distance (in km) between Washington, the capital of USA, the individual
capitals of EU(5) and the capitals of their top five suppliers; POPGRATEi = the population growth rate of EU-5 and USA; REXRATEij = the real exchange rate of foreign currency per unit in US dollar; WAGE j = Log of the wage of top five apparel suppliers in million of US dollars; VALADDED j =Log of the value added amount in apparel industry of top five apparel suppliers in million of US
dollars; Uijt = the time-varying error, because is represents unobserved factors that changeover time, and affects IMij
In order to identify the major determinants of EU-5 and USA apparel imports from their top five apparel suppliers, various factors have been considered. The dependent variable is imported value of merchandise trade, in log form, between pairs of countries from 1990-2005. For the independent variables, based on the gravity principle, per capita GDP of the exporting country is a proxy of capital intensity, since apparel industry is a labor-oriented industry, per capita GDP (PCGDP j) of the top five suppliers is used to indicate the impact of monetary condition of the workforce in those countries on apparel exports. Additionally, the economic sizes of the exporting and importing countries are usually measured by gross domestic product, therefore the importing countries and their top five apparel suppliers’ GDP (GDP j) are considered in order to highlight the economic masses and the effect of apparel exports on the economy as well as the supply capability of labour-intensive products of those exporting countries. To satisfy the curiosity about the situation of EU-5 and USA economy on the apparel imports from those countries, per capita GDP (PCGDPi) of the importers are included in the list of independent variables.
According to Leamer and Levinsohn’s (1995) survey of the empirical evidence on international trade, the identification of distance effects on bilateral trade have been proved as one of the clearest and most robust empirical findings in economics. Thus, Distance (Dij) is considered in the equation. Population growth rates of EU-5 and USA would have a direct relationship with the consumption of manufactured commodities, therefore population growth rate (POPGRATEi) is taken into consideration so as to obtain a better understanding of this variable on apparel imports.
Apparel production is considered as a labor-intensive industry, a lot of manual handling is required for garment manufacturing. Moreover, the price competition among apparel suppliers has intensified nowadays as trade liberalization has progressed since the phase out of the ATC in 2005. Therefore, wage of workers (WAGE j ) in the
2469
top five suppliers is one of the decision factors to relate its importance to the whole apparel trade flow. Lastly, the value added variable refers to the additional value created at a particular stage of production. In modern neoclassical economics, especially in macroeconomics, it adverts to the contribution of the factors of production, i.e., land, labor, and capital goods, in enhancing the value of a product and corresponds to the incomes received by the owners of these factors. The factors of production provide "services" which raise the unit price of a product relative to the cost per unit of intermediate inputs used in the production. Therefore, value added (VALADDED j ) of apparel suppliers is used to examine whether the additional value of materials and supplies for apparel production has the contribution to the exports. Data Sources
The model is estimated with data for EU-5, USA and their top five apparel trading partners over the period 1990-2005. Since EU-5 is regarded as a group, we have considered the common apparel suppliers to these EU countries for a single time in the sample so as to avoid repetition. For example, China is the common apparel supplier to various EU countries, and the entire imports from China to EU-5 are counted once in the data. Therefore, in this analysis of EU-5, there are 192 observations (12 exporting suppliers x 16 years). For USA, the size of the sample is 80 observations (5 suppliers x 16 years). Trade data were obtained from UN COMTRADE (import values in US dollars). Data on real GDP, per capita GDP, real exchange rate and population size of countries were secured from International Financial Statistics (IFS) database. The value added and labour wage of top five apparel suppliers were extracted and compiled from the UNIDO Industrial Statistics Database. Finally, distance between countries was obtained from the web site: http://www.indo.com/distance/index.htm Empirical Findings
Gravity Equation with Panel Data Estimation The panel data estimation approach with fixed effects was applied and used to reduce the multicollinearity among explanatory variables and to improve the efficiency of econometric estimates. The fixed effect model is used because the import, export and geographical factors are not considered random but depended on the countries’ characteristics. Another advantage of using fixed effects model is that the error term which is correlated with the individual effects, unlike the OLS approach, would not bias the estimator.
The gravity equation with fixed effects method is a full model that include all the independent factors as discussed in the previous section. The estimation result (presented in Table 1) is more plausible and offers a better explanatory capacity because the R2 values are quite high which indicate that 80% and 85% of apparel imports to EU-5 and USA can be accounted for the independent variables. The variables tested are highly significant and all showed significance at 95% with many at 99% significance level.
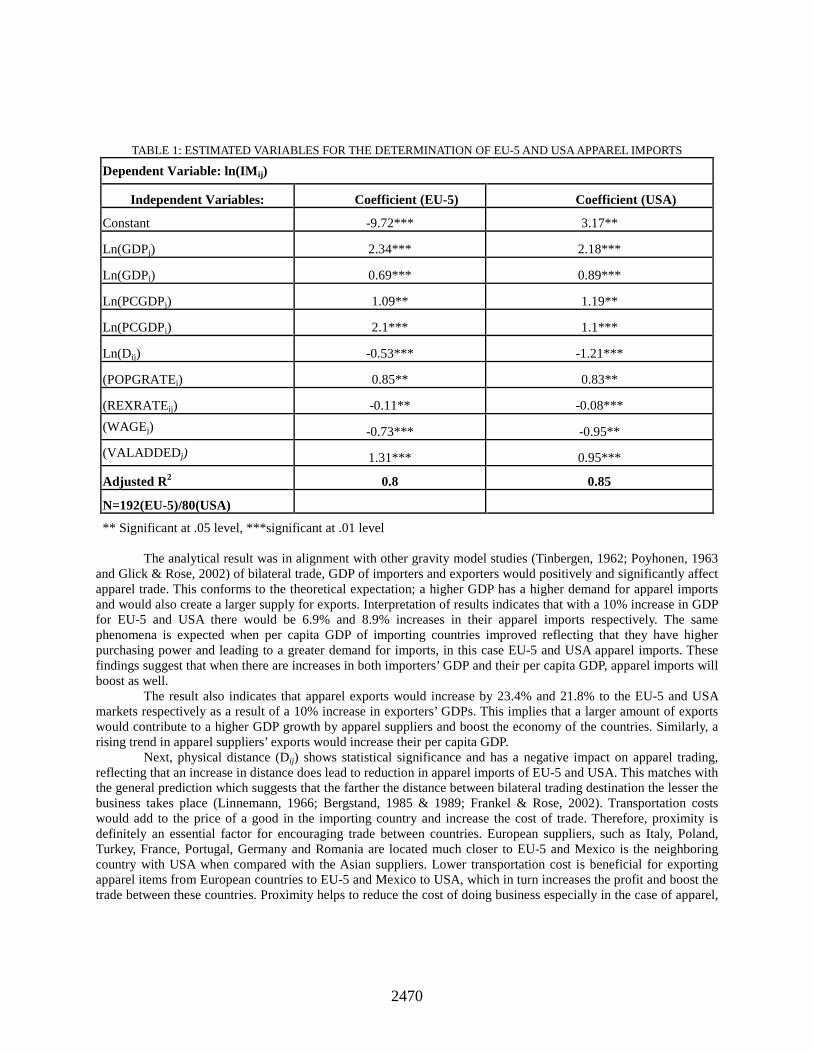
2470
TABLE 1: ESTIMATED VARIABLES FOR THE DETERMINATION OF EU-5 AND USA APPAREL IMPORTS
Dependent Variable: ln(IM ij)
Independent Variables: Coefficient (EU-5) Coefficient (USA)
Constant -9.72*** 3.17**
Ln(GDPj) 2.34*** 2.18***
Ln(GDPi) 0.69*** 0.89***
Ln(PCGDPj) 1.09** 1.19**
Ln(PCGDPi) 2.1*** 1.1***
Ln(Dij) -0.53*** -1.21***
(POPGRATEi) 0.85** 0.83**
(REXRATEij) -0.11** -0.08***
(WAGEj) -0.73*** -0.95**
(VALADDED j) 1.31*** 0.95***
Adjusted R2 0.8 0.85
N=192(EU-5)/80(USA)
** Significant at .05 level, ***significant at .01 level
The analytical result was in alignment with other gravity model studies (Tinbergen, 1962; Poyhonen, 1963
and Glick & Rose, 2002) of bilateral trade, GDP of importers and exporters would positively and significantly affect apparel trade. This conforms to the theoretical expectation; a higher GDP has a higher demand for apparel imports and would also create a larger supply for exports. Interpretation of results indicates that with a 10% increase in GDP for EU-5 and USA there would be 6.9% and 8.9% increases in their apparel imports respectively. The same phenomena is expected when per capita GDP of importing countries improved reflecting that they have higher purchasing power and leading to a greater demand for imports, in this case EU-5 and USA apparel imports. These findings suggest that when there are increases in both importers’ GDP and their per capita GDP, apparel imports will boost as well.
The result also indicates that apparel exports would increase by 23.4% and 21.8% to the EU-5 and USA markets respectively as a result of a 10% increase in exporters’ GDPs. This implies that a larger amount of exports would contribute to a higher GDP growth by apparel suppliers and boost the economy of the countries. Similarly, a rising trend in apparel suppliers’ exports would increase their per capita GDP.
Next, physical distance (Dij) shows statistical significance and has a negative impact on apparel trading, reflecting that an increase in distance does lead to reduction in apparel imports of EU-5 and USA. This matches with the general prediction which suggests that the farther the distance between bilateral trading destination the lesser the business takes place (Linnemann, 1966; Bergstand, 1985 & 1989; Frankel & Rose, 2002). Transportation costs would add to the price of a good in the importing country and increase the cost of trade. Therefore, proximity is definitely an essential factor for encouraging trade between countries. European suppliers, such as Italy, Poland, Turkey, France, Portugal, Germany and Romania are located much closer to EU-5 and Mexico is the neighboring country with USA when compared with the Asian suppliers. Lower transportation cost is beneficial for exporting apparel items from European countries to EU-5 and Mexico to USA, which in turn increases the profit and boost the trade between these countries. Proximity helps to reduce the cost of doing business especially in the case of apparel,
2471
since distance is correlated with time to market, as timeliness is also a significant determinant in the fashion retailing business. Garment manufacturers must be able to respond quickly to the change in demand of the consumers. Thus, for EU-5 and USA apparel markets, proximity still count as an important variable in the apparel trade.
The results reveal that real exchange rate plays a crucial role in determining the volume of EU-5 and USA apparel imports. Whenever a real depreciation/appreciation of foreign currencies against US dollars there would be an increase/decrease in apparel exports and vice versa. The population growth rate also demonstrates a positive effect on trade flow between countries. As shown in the analysis, apparel imports would be increased by 8.5% and 8.3% with a 10% increase in importers’ population growth rate. This supports the view of Brada & Mendex (1983) that the higher the population growth rate, a greater import value is anticipated.
For the wage variable (WAGE j), the coefficients showed negative signs indicating the variable is significant for apparel trade. This implies that the lower the labor cost with the apparel suppliers, the higher the attractiveness for EU-5 and USA to import apparel products from them. As the consumers always search for the quality apparel products at the best price, once they realize that the competitive advantage of certain countries is lost, the consumers will shift to another production site which provides lower cost and owns a productive workforce. Base on this, Asian countries such as China, India and Indonesia have become the leading and highly competitive suppliers to EU-5 and USA apparel markets. The reason is they possess productive and cheap labor force, a large stock of technical manpower and manufacturing base.
For the variable (VALADDED j), it presents a positive significant impact on the apparel import trends of EU-5 and USA. Result indicates that with a 10% increase in ‘VALADDED j’ of suppliers, there would be 13.1% and 9.5% increases in apparel exports to EU-5 and USA respectively. This shows that the customers are more willing to pay for the apparel items which possess extra value such as an established brand image or relationship marketing. Some Asian apparel suppliers, such as China and Korea have been improving the manufacturing and marketing power to produce higher value-added apparel products as well as investing in apparel production in Central America so as to compete with European and Mexico suppliers for quick response supply to the market.
Conclusion
This empirical study yields a number of noteworthy findings. The analysis result provides a vigorous support for the gravity model. The estimated coefficients for the variables, ln(GDPj), ln(GDPi), ln(PCGPDj) and ln(PCGPDi) are positive and statistically significant, indicating that positive GDP growth rate in EU-5 and USA would lead to a greater demand for apparel imports because of their higher purchasing power. Moreover, a greater amount of apparel exports would also contribute to a higher GDP for the suppliers and boost the economy of these countries. Similarly, a rising trend in apparel suppliers’ exports would increase their per capita GDP.
The result also suggests that the distance variable remains statistically significant and has a negative impact on apparel exports since the short lead time is the most determining factor in the fashion sector. The study also indicates that the devaluation of the US currency would reduce apparel imports due to the fact that the buyers have to pay higher price for apparel products. The analysis also shows that population growth rates of EU-5 and USA both have direct impact on the consumption of apparel items and trade flows. Moreover, the lower the wages of the apparel suppliers, the higher the attractiveness for EU-5 and USA to import apparel items from those countries because the products are cheaper. Thus, developing countries would be in a better position in the international free trade environment imputable to their asset of a large number of workers with comparatively lower labor cost.
Finally, the ‘VALADDED j’ factor presents a positive impact on the apparel import since the value added apparel products will increase the unit price through brand image or marketing or create innovative features for the apparel products. Thus value adding in apparel products would contribute to a rise in apparel exports.
2472
Acknowledgements The authors would like to thank The Hong Kong Polytechnic University in providing research studentship to fund this study and the financial support for the presentation at this Conference.
References [1] Armington, P.S. (1969). A Theory of Demand for Products Distinguished by Place of Production. IMF Staff
Papers 16(1):159-176. [2] Anderson, J.E. (1979). A theoretical foundation for the gravity equation, American Economic Review,
69(1), 106-116. [3] Anderson, J.E. & Van Wincoop, E. (2003). Gravity with gravitas: A solution to the border puzzle, American
Economic Review, 93(1), 170-192. [4] Bergstand, J. H. (1985). The Gravity Equation in International Trade: Some Microeconomic Foundations
and Empirical Evidence, The Review of Economics and Statistics, 67(3), 474-481. [5] Bergstrand, J. H. (1989). The Generalized Gravity Equation, Monopolistic Competition and the Factor-
Proportions Theory in International Trade? The Review of Economics and Statistics, 71(1), 143-153. [6] Brada, J.C. & Mendex, J.A. (1983). Regional economic integration and the volume of intra-regional trade,
a comparison of developed and developing country experience, KYKLOS, 36(4), 589-603. [7] Cheng, I.H. & Wall, H.J. (2005). Controlling for Heterogeneity in Gravity Models of Trade and Integration,
Federal Reserve Bank of St.Louis Review, 87(1), 49-63. [8] Deardorff, V.A. (1998). Determinants of Bilateral Trade: Does Gravity Work in a Neoclassical World? In
Jeffrey A. Frankel (ed.), The Regionalization of Economy. Chicago: University of Chicago Press. [9] Eaton, J. & Kortum, S. (2002). Technology, Geography and Trade, Econometrica, 70(5), 1741-1779. [10] Egger, P. (2000) A Note on the Proper Econometric Specification of the Gravity Equation, Economics
Letters, 66(1), 25-31 [11] Evenett, S & Keller, W. (1998). On Theories Explaining the Success of the Gravity Equation, National
Bureau of Economic Research, Working paper, No 6529, Cambridge, MA. [12] Frankel, J. & Rose, A. (2002, May). An Estimate of the Effect of Common Currencies on Trade and
Income, Quarterly Journal of Economics, 117(2), 437-466. [13] Glick, R. & Rose, A.K. (2002). Does a Currency Union affect Trade? The Time-Series Evidence, European
Economic Review, 46(6), 1125-1151. [14] Gujarati, D. (2000). Basic Econometrics, 4th edition, New York, McGraw Hill. [15] Harrigan, J. (2002). Specialization and the Volume of Trade: Do the Data Obey the Laws. In K. Choi and J.
Harrigan (eds.), The Handbook of International Trade, London: Basil Blackwell. Contact author(s) for the list of references.
End Notes 1 EU-5: EU has 27 member countries in 2007. The significant apparel importers are EU-5 including Germany,
United Kingdom, France, Italy and Spain. 2 The top five apparel consuming countries among EU-5 are including Germany, United Kingdom, France, Italy and
Spain. 3 The overall top five apparel suppliers to EU-5 from 1990-2005 included China, Italy, HKSAR, Poland, Turkey,
France, Portugal, Morocco, Tunisia, Germany, Romania and India. The overall top five apparel suppliers to USA from 1990-2005 were China, Mexico, HKSAR, Korea and Indonesia.
2473
Design and Analysis of Decision Support Systems
John Wang, [email protected] James Yao, [email protected]
Qiyang Chen, [email protected] Ruben Xing, [email protected]
Montclair State University, USA Abstract Since their creation in the early 1960’s, Decision Support Systems (DSSs) have evolved over the past four decades and continues to do so today. Although DSSs have grown substantially since its inception, improvements still need to be made. New technology has emerged and will continue to do so and, consequently, DSSs need to keep pace with it. Also, knowledge needs to play a bigger role in the form of decision making. We first discuss design and analysis methods/techniques/issues related to DSSs. Then, the three possible ways to enhance DSSs will be explored. Introduction Over the four decades of its history, decision support systems (DSSs) have moved from a radical movement that changed the way information systems were perceived in business, to a mainstream commercial information technology movement that all organizations engage. This interactive, flexible, and adaptable computer based information system derives from two main areas of research: the theoretical studies of organizational decision making done at the Carnegie Institute in the 1950’s and early 1960’s as well as the technical work on interactive computer systems which was mainly performed by the Massachusetts Institute of Technology (Keen & Morton, 1978). DSSs began due to the importance of formalizing a record of ideas, people, systems and technologies implicated in this sector of applied information technology. But the history of this system is not precise due to the many individuals involved in different stages of DSSs and various industries while claiming to be pioneers of the system (Power, 2003; Arnott & Pervan, 2005). DSSs have become very sophisticated and stylish since these pioneers began their research. Many new systems have expanded the frontiers established by these pioneers yet the core and basis of the system remains the same. Today, DSSs are used in the finance, accounting, marketing, medical, as well as many other fields. Background The basic ingredients of a DSS can be stated as follows: the data management system, the model management system, the knowledge engine, the user interface and the users (Donciulescu, Filip, & Filip, 2002). The database is a collection of current or historical data from a number of application groups. Databases can range in size from storing it in a PC that contains corporate data that has been downloaded, to a massive data warehouse that is continuously updated by major organizational transaction processing systems (TPSs). When referring to the model management system, it’s primarily a stand-alone system that uses some type of model to perform “what if” and other kinds of analysis. This model must be easy to use, and therefore the design of such model is based on a strong theory or model combined with a good user interface. A major component of a DSS is the knowledge engine. To develop an expert system requires input from one or more experts, this is where the knowledge engineers go to work, who can translate the knowledge as described by the expert into a set of rules. A knowledge engineer acts like a system analyst but has special expertise in eliciting information and expertise from other professionals (Laudon & Laudon, 2005).
2474
The user interface is the part of the information system through which the end user interacts with the system; type of hardware and the series of on-screen commands and responses required for a user to work with the system. An information system will be considered a failure if its design is not compatible with the structure, culture, and goals of the organization. Research must be conducted to design a close organizational fit, to create comfort and reliability between the system and user. In a DSS, the user is as much a part of the system as the hardware and software. The user can also take many roles such as decision maker, intermediary, maintainer, operator and feeder. A DSS may be the best one in its industry but it still requires a user to make the final decision. Power (2003) introduced a conceptual level of DSSs, which contains five different categories. These categories include model-driven DSS, communication-driven DSS, data-driven DSS, document-driven DSS, and knowledge-driven DSS. Defining DSS is not always an easy task due to the many definitions available. Much of this problem is attributed to the different ways a DSS can be classified. At the user level, a DSS can be classified as passive, active, or cooperative. Essentially, DSS is a computer-based system that provides help in the decision making process. However, this is a broad way of defining the subject. A better way of describing DSS is to say it is a flexible and interactive computer-based system that is developed for solving non-structured management problems. Basically, the system uses information inputted from the decision maker (data and parameters) to produce an output from the model that ultimately assists the decision maker in analyzing a situation. In the following sections, we first discuss design and analysis methods/techniques/issues related to DSSs. Then, the three possible ways to enhance DSSs will be explored. Design and Analysis Methods/Techniques/Issues Related to DSSs Design Methods Today, DSSs hold a primary position in an organization’s decision making by providing timely and relevant information to decision makers. It has become a key to the success or survival of many organizations. However, there is a high tally of failure in information systems development projects, even though they are a focal point of industrial concern (Goepp, Kiefer, & Geiskopf, 2006). Designing methods have become an important component that assures a successful information system design. This issue is in relevance to the design of a DSS. There have been many different strategies employed for the design of a DSS. Current research on DDS design has witnessed the rapid expanding of object-oriented (OO), knowledge management (KM), structured modeling (SM), and design science (DS) approaches. Object-Oriented approach. The characteristic of OO approach is to use object-oriented software engineering with unified modeling language (UML) in the design and implementation of a DSS. OO approach involves basically three major steps. The user’s requirements are first captured by using a set of use case diagrams. These diagrams indicate all the functionalities of the system from the user’s point of view. Then classes and their relationships are identified and described in class diagrams. Finally, sequence diagrams or collaboration diagrams are developed, which describe the interaction between objects (instances of classes). Tian, Ma, Liang, Kwok, & Liu (2005) designed a DSS with the OO approach for an organization, which was implemented successfully. Knowledge Management approach. In some environment (non-preprogrammed applications), end-users, especially the less experienced end-users, need to have certain knowledge guiding them how to use the system. The KM design approach supports end-users by embedding declarative and/or procedural knowledge in software agents. This approach provides better assistance to inexperienced users of spatial DSS, which requires a design approach that will prioritize knowledge support of the end-users’ decision making activities (West & Hess, 2002). Structured Modeling approach. SM approach “uses a hierarchically organized, partitioned, and attributed acyclic graph to represent models” (Srinivasan & Sundaram, 2000, p. 598). It is consisted of three levels: elemental structure, generic structure, and modular structure. The elemental structure intends to capture the details of a specific model instance. The generic structure targets at capturing the natural familial groupings of elements. The modular structure seeks to organize generic structure hierarchically according to commonality or semantic relatedness. The leveled structures allow the complexity of a model to be managed and ranked according to its hierarchies. The graph
2475
feature allows modelers and decision makers to understand the model better. A key advantage of SM is the ease with which structured models can be visualized. Design Science approach. The functionality of a DSS evolves over a series of development cycles where both the end-users and the systems analyst are active contributors to the shape, nature, and logic of the system (Arnott, 2004). Yet system developers have little guidance about how to proceed with evolutionary DSS development. DSS developers are facing the fact that insufficient knowledge exists for design purpose, and designers must rely on intuition, experience, and trial-and-error methods. Design science approach, on the other hand, can facilitate developers to create and evaluate information technology artifacts that are intended to solve identified organizational problems (Hevner, March, Park, & Ram, 2004). Vaishnavi and Kuechler (2006) proposed a design science methodology with the major process steps of awareness of problem, suggestion, development, evaluation, and conclusion. Arnott (2006) proposed a five steps approach, which was adapted from Vaishnavi and Kuechler, for designing evolutionary DSS: problem recognition, suggestion, artifact development, evaluation, and reflection. A research project by Arnott indicates that design science approach can tackle problems of both theoretical and practical importance. Design Techniques As we are advancing in information technologies, business decision makers can now have access to vast amount of information. On one hand they may gain necessary and important information for making informed decisions, but on the other hand they may also become overloaded by the information irrelevant to what they need. Thus, there is a pressing need for decision aiding tools that would effectively process, filter, and deliver the right information to the decision makers. Proper combination of DSSs and agent technologies could prove to be a very powerful tool for rendering decision support (Vahidov & Fazlollahi, 2003/2004). A software agent performs interactive tasks between the user and the system. The user instructs the system what he/she intends to accomplish. The software agent carries out the task. By analogy, a software agent mimics the role of an intelligent, dedicated and competent personal assistant in completing the user’s tasks (Bui & Lee, 1999). In the DSS environment, software agents have been more formally described as autonomous software implementations of a task or goal that work independently, on behalf of the user or another agent (Hess, Rees, & Rakes, 2000). As the traditional, direct manipulation interface of our computing environment is much limited (Maes, 1994), software agents would seem to be a suitable and most needed solution for providing procedural assistance to end-users (West & Hess, 2002). These ‘robots of cyberspace’ can be effectively utilized in automating many information processing tasks (Vahidov & Fazlollahi, 2003/2004). In some DSS environment, such as spatial DSS (Sikder & Gangopadhyay, 2002; West, & Hess, 2002), Internet-based DSS (Bui & Lee, 1999), and Web DSS (Vahidov & Fazlollahi, 2003/2004), a multi-agent system should be designed and implemented in the DSS to facilitate the decision makers since decision making involves complex set of tasks that requires integration of supporting agents (Bui & Lee, 1999), and these agents should have behaviors to work in team (Norman & Long, 1994). Vahidov and Fazlollahi (2003/2004) developed architecture of multi-agent DSS for e-commerce (MADEC), in which Intelligence Team (Agents); Design Team (Agents); and Choice Team (Agents) were composed. The multi-agent system was implemented in a prototype of MADEC, which received higher user satisfaction. Three Possible Ways to Enhance DSSs Creating Knowledge Warehouses (KW) Nemati (2002) proposed that a new generation of knowledge-enabled systems that provides the infrastructure required to capture, enhance, store, organize, leverage, analyze, and disseminate not only data and information but also knowledge (Nemati, 2002). Expanding data warehouses to encompass the knowledge needed in the decision making process is the creation of knowledge warehouses (KW). An important component of KW is a very complex process known as knowledge management. Knowledge management allows for knowledge to be converted from tacit to explicit through such processes as filtering, storing, retrieving, etc., thus allowing it to be utilized by decision makers.
2476
The goal of KW is to give the decision maker an intelligent analysis standpoint that enhances all aspects of the knowledge management process. The main drawbacks of KW are the amount of time and money that need to be invested as well as some of the same problems that are found in successfully implementing DSSs. Among these factors are the users’ involvement and participation, values and ethics, organization and political issues within the company, and other external issues. The development and implementation of KW still has much work to be done, however, DSSs seem to be headed toward knowledge enhancement in the future and KW looks to have a promising outlook in the upcoming years as a result. Focusing on Decision Support While knowledge management systems seem like a logical way to advance the shortcomings of DSSs, another view also exists. By removing the word “system” from DSSs and focusing on decision support, decision making might cause some interesting, new directions for research and practice. Decision support (DS) is the use of any plausible computerized or non-computerized means for improving sense making and/or decision making in a particular repetitive or non-repetitive business situation in a particular organization (Alter, 2004). DS embodies a broader perspective that seems logical in environments where the user does not necessarily need the technical aspects of DSSs. This is based on the belief that most work systems of any significance include some form of computerized support for sense making and decision making. The difference between DSSs and DS is not too drastic but DS is a sensible option for many companies due to the increase in technology since the creation of DSSs; DSSs may not fit the needs of a business as it had in the past. Integrating DSSs & KMSs In line with Bolloju (2002), integrating decision support and knowledge management may correct some of the deficiencies of DSSs. The decision-making process itself results in improved understanding of the problem and the process, and generates new knowledge. In other words, the decision-making and knowledge creation processes are interdependent. By integrating the two processes, the potential benefits that can be reaped make the concept seem more worthwhile. Integrating DSSs and KMSs seems to be the best choice out of the three possible ways to enhance DSS. The reasoning behind this selection is that integrating the two seems to provide a way for including both options without sacrificing one for the other. More importantly, while KW appears to have a very bright future, KW currently requires a great amount of time and money. The combination of both areas allows for a better overall utilization in the present. In time, KW may not be as time consuming and costly as it is now. However, to achieve a better balance of usefulness and efficiency, the integration of DSSs and KMSs appears to be the smartest choice. Future Trends The future of DSSs, Angus (2003) argued and supported by SAS (2004), is in the field of business analytics (BAs). BAs differ from that of the recently and previously more common business intelligence (BI). With the fast pace of business and life today it would only make sense for a shift to BA because it does focus on the many possibilities and the future outcomes for production and service. BAs focus on the future of operations. Opposed to that of BI where it focuses on the past and what can be done to change the past if things were done wrong or repeat if things were done right. However, BAs let managers center on what future trends are developing, which allows them not to accumulate a surplus of inventory of outdated products. It also enables managers to change their prices before the market does, or introduce their new product before anyone else gets the chance to. This is known as first-to-market (Gnatovich, 2006). BAs give the companies that use it a tremendous advantage over their competitors in the market place. Conclusion Since their creation in the early 1960’s, DSSs have evolved over the past four decades and continues to do so today. Although DSSs have grown substantially since its inception, improvements still need to be made. New technology

2477
has emerged and will continue to do so and, consequently, DSSs need to keep pace with it. Also, knowledge needs to play a bigger role in the form of decision making. Shim (2002) emphasized that DSSs researchers and developers should (i) identify areas where tools are needed to transform uncertain and incomplete data, along with qualitative insights, into useful knowledge, (ii) be more prescriptive about effective decision making by using intelligent systems and methods, (iii) exploit advancing software tools to improve the productivity of working and decision making time, and (iv) assist and guide DSSs practitioners in improving their core knowledge of effective decision support. The prior statement sums up the courses of action that need to be taken very well. The successful integration of DSSs and KMSs could revolutionize DSSs and propel it to even greater heights in the future. In closing, DSSs have a storied history that spans the course of four decades; however, the greatest mark may be made in the not so distant future as DSSs continue to evolve.
References Contact the authors for the list of references.
2478
Designing a Dynamic Buyer-Supplier Coordination Model in Electronic Markets Using Stochastic Petri Nets
Iraj Mahdavi, [email protected]
Meisam Aminzadeh, [email protected]
Shima Mohebbi, [email protected]
Mazandaran University of Science and Technology, Iran Namjae Cho, [email protected]
Hanyang University, Korea
Abstract
In the era of globalization and fierce competition, internet based market place has provided a coordination mechanism between two different business entities in supply chain activities. Functional relationship between supplier and buyer in an open market place, leads to investigate the role of both quantifiable and non-quantifiable parameters in coordination mechanism with the aim of achieving higher performance in supply chain activities. In this paper, we develop an e-based supply chain model and a new agent for designing mass-customized on-line services. A cooperative game theory framework is utilized between buyer and supplier in order to increase the supply chain performance. The supply chain is modeled with proposed method and its performance is evaluated by simulation using stochastic Petri nets (SPNs). The model provides a more realistic optimization process by taking into consideration the dynamic information flows in uncertainty environment. Key words: Supply chain coordination, e-SCM, Agent, Game theory, SPNs Introduction Globalization of market competition, reducing gap between product in terms of quality and performance are compelling the researchers to rethink about how to manage business operations more efficiently and effectively (Sarmah, acharya and goyal; 2006). Electronic market has added a whole new dimension to the investigation of the business relationship more meaningfully. Electronic markets are defined as a network information system that serve as enabling infrastructure for buyer and sellers to exchange information, transact and perform other activities related to transaction before, during and after transaction (Lancastre and Lages; 2006). The benefits of electrical environments motivate the researchers to align and coordinate the business processes and activities of the net members dynamically as well as to improve the overall performance of supply chain strategies. Threats from competition and other market forces are driving changes in supply chain management (Flynn and Flynn; 2005). A supply chain can be viewed as a network which the entities maybe owned to geographically diverse locations. Supply chain management (SCM) benefits from a variety of concepts that were developed in several different disciplines as marketing, information systems, economics, system dynamics, logistics, operational management and operation research. In the literature, supply chains are usually described as multi-echelon inventory systems. How ever, most existing model can only describe a restricted class of supply chains with simplifications (Chen, Amodeo, Chu and labadi; 2005). For instance, most multi-echelon inventory models don’t explicitly take account of transportation operations and capacity constraints in supply chain by simply assuming a constant lead time between any two adjacent stocking locations (Tayur et al.; 1998). These models lack flexibility and generality in describing real-life supply chains. The coordination, however, is quite difficult because of the inherent complexity and uncertainty of the supply chains. In fact the use of information systems to ensure visibility of item demand, location and status to all parts of the SC network was identified over a decade ago as an important attribute (Boyson, Corsi and Verbraeck; 2003).
There are large and growing numbers of research efforts on integration of SC since the business firms have commitment in cost reduction and timely response. García-Sánchez, Valencia-García and Martínez-Béjar (2005) applied a methodology that integrates different advanced information technologies with the aim of building a
2479
framework for developing e-commerce application in transaction process (buyer/seller). Thus, electronic exchanges of information lead to the reduction of errors and the increase in the efficiency of the processes involved. Additional challenges are presented by the availability of electronic links with a strong potential to improve the supply chain performance (Poulymenakou and Tsironis; 2003). García-Dastugue and Lambert (2003) survey the role of internet in an integration of business process across the supply chain by facilitating the information flows necessary for coordinating business activity. E-procurement also offers several new advantages to industrial buyers as many of them stem from the ability to reach a wider set of suppliers than before (Hazra and Mahadevan; 2006).
The goal of this study is to provide the mathematical model that can describe material, information and financial flows of a decentralized supply chain in an integrated way as well as provide a tool which can help industrial practitioners to model, evaluate performance and optimize operational policies of their supply chains. In the next section, we provide a brief literature review about coordination mechanism. Coordination Mechanism Several strategies such as credit option, buy/back return policies, quantity flexibility and commitment of purchase quantity are used to align the business process and activities of diverse members of supply chains in terms of cost, response time, timely supply and customer service (Sarmah, acharya and goyal; 2006). Supply chain coordination is concerned with the development and implementation of such strategies. There is no universal coordination strategy that will be efficient and effective for all supply chains as the performance of coordination strategy in SC characteristics is dependent (Sarmah, acharya and goyal; 2006). They particularly investigate SC coordination models that have used quantity discount as coordination tool under deterministic environment as well as some integrated buyer-vendor models that improves the performance of the SC.
The concept of dynamics of whole supply chain in order to propose some coordination mechanisms will reduce the bullwhip effect while taking into account operational constraints and maintaining service level. The advent of new information systems and technologies (IS and IT) such as electronic data interchange(EDI), Internet, Intranet, and Extranet, in particular, and inter-organizational communication and coordination mechanisms cast unprecedented opportunities for the integration of supply chains (Mahdavi, Cho and Mohebbi; 2007). Thus, Dynamic and timely information flows in uncertainty environment plays an important role in coordination mechanism. The interested reader may refer to Pant, Sethi and Bhandari (2003) to have better understanding of creation and implementation of e-supply chain systems. The authors draw on research in the areas such as web-based information systems and inter-organizational information systems. Averbakh, Xue (2006) also pointed to supply chain scheduling problems in off-line environment and proposed on-line environment, whose future is unknown.
An interesting development in the field of e-SCM is to exploit the benefits offered by coordination mechanism on functional relationship between buyer and supplier. The buyers in an electronic market fundamentally are faced with supplier selection. Moreover, the presence of multiple suppliers will require the buyer to set-up a competitive mechanism for capacity allocation among the selected suppliers (Hazra and Mahadevan; 2006). The supplier’s willing is also to maximize their profit among the net. In this case, a collaborative strategy that can allocate the benefits of coordination among the supply chain members should be applied to align their objectives of coordination. Such a system is regarded as a decentralized supply chain system.
Three dimensions are introduced by Li and Wang (2007) on which the operational activities of a supply chain can be coordinated in order to maximize system profits. First, order quantities that optimize individual performance are often not able to optimize system performance. There is a vast literature on discount policies that suppliers can use to entice buyers to increase their order quantities so as to improve profits (Wang; 2005). Second, orders can be synchronized to reduce system inventory. If the buyers are coordinated to place orders at the same point in time, the supplier may adopt a lot-for-lot policy and carry no inventory. If the buyers aren’t coordinated on the timing of their orders, the supplier inventory replenishment cost is double that under the lot-for-lot policy (Wang et al.; 2006). Finally, accurate, timely and easily accessible information can improve decisions. In the context of
2480
SCM, a supplier is able to better match inventory supply with demand when information is available on the buyers’ inventory status. Although, the benefits of information depends on how it’s used.
The literature on coordination of supply chain inventory systems exist under a framework that is based on supply chain decision structure and nature of demand. The literature in each category will be further reviewed based on time coordination and/or demand and information structure (Li and Wang; 2007). In the next section, we review the concept of centralized and decentralized supply chains as well as the role of supply chain coordination. Centralized Supply Chain A centralized supply chain system is viewed as one entity that aims to optimize system performance. Various production/inventory policies have been developed to optimize the performance of a centralized supply chain system. There are two main categories in centralized supply nets: a) deterministic systems b) stochastic systems. The objective of deterministic systems is to develop a production/inventory policy to minimize system cost. It’s typically assumed that demand occurs at a buyer/retailer continuously at a constant rate. Early studies have focused on the existence and development of optimal policies. However, such policies are usually difficult to implement. Comprehensive review of such models can be found in Li and Wang paper (2007).
In reality, a stochastic model that specifies demand as a stochastic process is often more accurate than its deterministic counterpart (Zheng, 1992). However, a barrier to the application of a stochastic model is that the optimal policy doesn’t have a simple structure. This implies that appropriate coordination mechanism are especially necessary (Li and Wang; 2007). Moreover, information sharing contributes another dimension for coordination when demand is stochastic. As the time and cost to process orders are substantially lowered, impressive improvements in supply chain performance have been obtained. It is now a common belief that capturing and sharing real-time demand and stock information is the key to improve supply chain performance (Li and Wang; 2007). Decentralized Supply Chain A decentralized supply chain differs from a centralized system in that members act independently to optimize their individual performance. Although more and more firms have realized that collaboration with their supply chain partners can significantly improve their profit, the centralization of inventory and production decisions for a decentralized is often unrealistic (Li and Wang; 2007). Therefore, the challenge is to devise coordination mechanisms that aren’t only able to coordinate the activities but also to align the objectives of independent supply chain members (Chen et al.; 2000). Previous research on the coordination of decentralized deterministic systems has focused on using quantity discount to induce independent buyers to increase their order quantity. Other researches investigate the case of single/heterogeneous retailers and suggest different nearly optimal solutions.
In view of the difficulties in managing centralized stochastic multi-echelon inventory systems, it’s an understatement that is a challenge to coordinate a decentralized supply chain with stochastic demand (Li and Wang; 2007). A few important studies fall into this category. Cheung and Lee (2002) discuss the value of sharing information about the retailers’ inventory positions which could be used to coordinate shipments from the supplier to enjoy economies of scale in shipments, and for eventual unloading of the shipments to retailers to rebalance their stocking positions. In view of previous studies, for a decentralized supply chain system which the members belong to different firms a coordination mechanism should include at least three components: (i) an operational plan to coordinate the decisions and activities of supply chain members, (ii) a structure to share information among the members, and (iii) an incentive scheme to allocate the benefits of coordination so as to entice the cooperation of all members (Li and Wang; 2007).
In this paper, we have introduced the concept of dynamic supply chain information flows. An agent is designed to analyze and simulate the players’ behavior in SC network. We consider price and quality jointly as coordination parameters of decentralized supply chain in order to obtain both the optimum supplier selection for individual buyers and to maximize supplier’s profit. We also show how non-quantifiable parameters can affect the price. A cooperative game theory framework is also utilized between the actors in order to increase the supply chain performance.
2481
Game Theory
Traditional research in operation management focused on providing tools in order to analyze corresponding problems. The tools relied largely upon dynamic programming and other optimization techniques. In the last several years, the evolution of SCM recognized that a business process consists of several decentralized firms and operational decisions of these different entities impact each other’s profit and thus the profit of the whole SC (Nagarajan and Sosˇic´;2006). In decentralized supply chain where the members belong to two different firms, the method of bargaining and negotiation solution which is dynamic in nature may result in a better coordination in SC as it compared to static coordination solution in a centralized supply chain. To effectively model and analyze decision-making in such multi-person situation where the outcome depends on the choice made by every party, game theory is a natural choice (Nagarajan and Sosˇic´; 2006). More comprehensive literature review on game theory among supply chain agents can be found on Nagarajan and Sosˇic´ paper (2006).
Game theory is a branch of mathematics devoted to the logic of decision-making in social interactions. The principle objective of game theory is to determine through formal reasoning alone, what strategies the player ought to choose in order to pursue their own interests rationally and what outcomes will result if they do so.
There is a broad division of game theory into two approaches: 1) cooperative 2) non-cooperative
In non-cooperative game, the intention of the players is to maximize their individual gain while, in a cooperative game both buyer/seller would consider maximizing system profit.
Different types of game models have different solution concept. The bargaining game in cooperative game theory addresses the problems in which a group of two or more agents faced with a set of feasible outcomes, any one of which will be the result if it’s specified by unanimous agreement of all participants. In the event that no unanimous agreement is reached, a given disagreement outcome is the result.
In the Stackelberge game, the player who holds more powerful position is called the leader and the other player who reacts to leader decision is called the follower and the solution obtained to this game is the Stackelberg solution (Sarmah, acharya and goyal; 2006). When two players negotiate, it’s reasonable to expect that the player with the higher bargaining power receives a larger share of the pie than his weaker counterparts.
Our model of supply chain is composed of three main players: a) supplier b) buyer c) control/optimization service agent. The word supplier is used to represent the upstream member in the supply chain who sells the items to the buyers. An agent facilitates the communication between customers and suppliers and allows us to design, simulate and analyze our collaborative strategies. The Proposed Model
Assume that suppliers are located in different nations with a vast network of clearing and forward agents. The integration of these geographically separated supplier locations and the fulfillment of demands of different customer centers are a big challenge. Indeed, Consider a family of products that a buyer would like to procure from an electronic market for which there are some pre-qualified suppliers available to supply as per specification. The information for a rough-cut capacity planning will be carried out at different supplier locations based on actual shift time, total actual time available during the planning period, and the average break-down by supplier-agent interaction. We assume the inventory system of supplier with periodic review (s, S) policy which the inventory replenishment decisions are based on position. The agent mediates the interaction between buyers and suppliers in an electronic marketplace. It computes the optimum solution by considering the whole SC profit under game theory frame work. Transaction Agent for Control and Optimization Agent technology provides the distributed environment and great promise of effective communication (Lee, Chang and Lee, 2000; Swaminathan, Smith and Sadeh; 1998). According to Wooldridge (2002) and García-Sánchez, Valencia-García and Martínez-Béjar (2005), agents make the second generation e-commerce systems possible, in
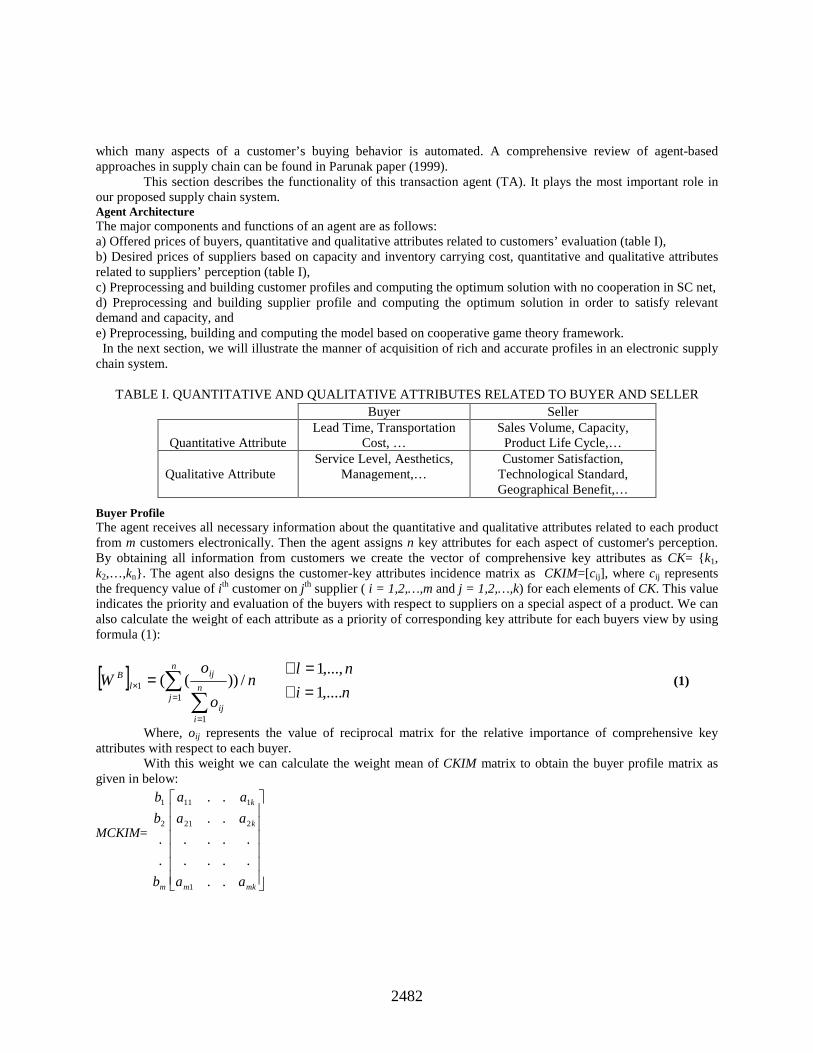
2482
which many aspects of a customer’s buying behavior is automated. A comprehensive review of agent-based approaches in supply chain can be found in Parunak paper (1999).
This section describes the functionality of this transaction agent (TA). It plays the most important role in our proposed supply chain system. Agent Architecture The major components and functions of an agent are as follows: a) Offered prices of buyers, quantitative and qualitative attributes related to customers’ evaluation (table I), b) Desired prices of suppliers based on capacity and inventory carrying cost, quantitative and qualitative attributes related to suppliers’ perception (table I), c) Preprocessing and building customer profiles and computing the optimum solution with no cooperation in SC net, d) Preprocessing and building supplier profile and computing the optimum solution in order to satisfy relevant demand and capacity, and e) Preprocessing, building and computing the model based on cooperative game theory framework. In the next section, we will illustrate the manner of acquisition of rich and accurate profiles in an electronic supply chain system.
TABLE I. QUANTITATIVE AND QUALITATIVE ATTRIBUTES RELATED TO BUYER AND SELLER Buyer Profile The agent receives all necessary information about the quantitative and qualitative attributes related to each product from m customers electronically. Then the agent assigns n key attributes for each aspect of customer's perception. By obtaining all information from customers we create the vector of comprehensive key attributes as CK= {k1, k2,…,kn}. The agent also designs the customer-key attributes incidence matrix as CKIM=[cij], where cij represents the frequency value of i th customer on j th supplier ( i = 1,2,…,m and j = 1,2,…,k) for each elements of CK. This value indicates the priority and evaluation of the buyers with respect to suppliers on a special aspect of a product. We can also calculate the weight of each attribute as a priority of corresponding key attribute for each buyers view by using formula (1):
[ ] no
oW
n
jn
iij
ijl
B /))((1
1
1 ∑∑=
=
× = ni
nl
,....1
,...,1
=∀=∀
(1)
Where, oij represents the value of reciprocal matrix for the relative importance of comprehensive key attributes with respect to each buyer.
With this weight we can calculate the weight mean of CKIM matrix to obtain the buyer profile matrix as given in below:
MCKIM=
mkm
k
k
m aa
aa
aa
b
b
b
..
....
....
..
..
.
.
1
221
111
2
1
Buyer Seller
Quantitative Attribute Lead Time, Transportation
Cost, … Sales Volume, Capacity, Product Life Cycle,…
Qualitative Attribute
Service Level, Aesthetics, Management,…
Customer Satisfaction, Technological Standard, Geographical Benefit,…
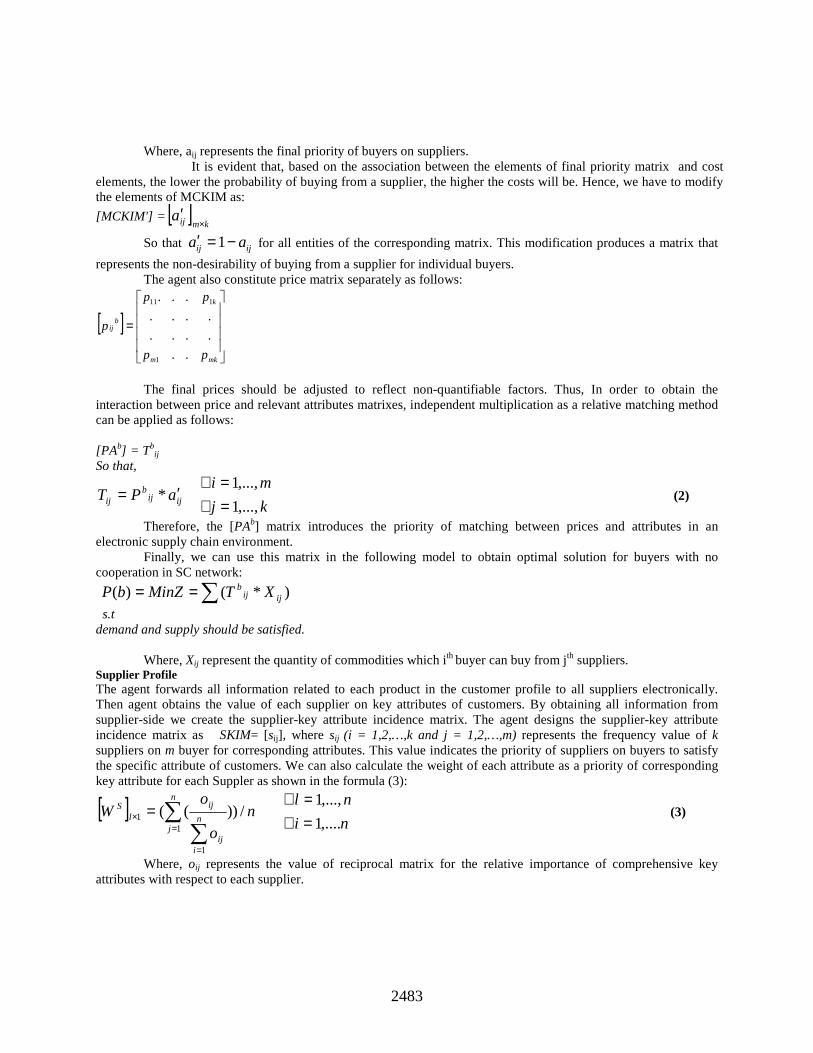
2483
Where, aij represents the final priority of buyers on suppliers. It is evident that, based on the association between the elements of final priority matrix and cost
elements, the lower the probability of buying from a supplier, the higher the costs will be. Hence, we have to modify the elements of MCKIM as:
[MCKIM'] = [ ]kmija
×′
So that 1ij ija a′ = − for all entities of the corresponding matrix. This modification produces a matrix that
represents the non-desirability of buying from a supplier for individual buyers. The agent also constitute price matrix separately as follows:
[ ]
=
mkm
k
bij
pp
pp
p
..
....
....
...
1
111
The final prices should be adjusted to reflect non-quantifiable factors. Thus, In order to obtain the
interaction between price and relevant attributes matrixes, independent multiplication as a relative matching method can be applied as follows: [PAb] = Tb
ij
So that,
ijijb
ij aPT ′= * kj
mi
,...,1
,...,1
=∀=∀
(2)
Therefore, the [PAb] matrix introduces the priority of matching between prices and attributes in an electronic supply chain environment.
Finally, we can use this matrix in the following model to obtain optimal solution for buyers with no cooperation in SC network:
)*()( ijijb XTMinZbP ∑==
s.t demand and supply should be satisfied.
Where, Xij represent the quantity of commodities which ith buyer can buy from jth suppliers. Supplier Profile The agent forwards all information related to each product in the customer profile to all suppliers electronically. Then agent obtains the value of each supplier on key attributes of customers. By obtaining all information from supplier-side we create the supplier-key attribute incidence matrix. The agent designs the supplier-key attribute incidence matrix as SKIM= [sij], where sij (i = 1,2,…,k and j = 1,2,…,m) represents the frequency value of k suppliers on m buyer for corresponding attributes. This value indicates the priority of suppliers on buyers to satisfy the specific attribute of customers. We can also calculate the weight of each attribute as a priority of corresponding key attribute for each Suppler as shown in the formula (3):
[ ] no
oW
n
jn
iij
ijl
S /))((1
1
1 ∑∑=
=
× = ni
nl
,....1
,...,1
=∀=∀
(3)
Where, oij represents the value of reciprocal matrix for the relative importance of comprehensive key attributes with respect to each supplier.
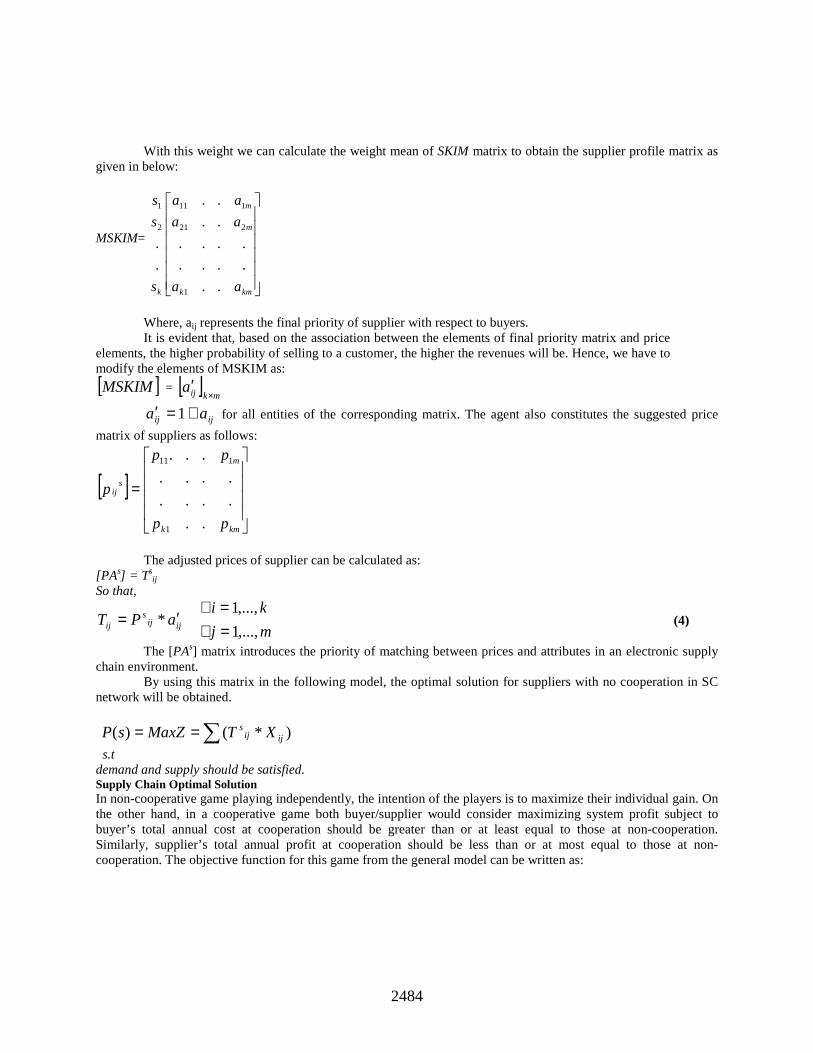
2484
With this weight we can calculate the weight mean of SKIM matrix to obtain the supplier profile matrix as given in below:
MSKIM=
kmk
m
m
k aa
aa
aa
s
s
s
..
....
....
..
..
.
.
1
221
111
2
1
Where, aij represents the final priority of supplier with respect to buyers.
It is evident that, based on the association between the elements of final priority matrix and price elements, the higher probability of selling to a customer, the higher the revenues will be. Hence, we have to modify the elements of MSKIM as:
[ ]MSKIM = [ ]mkija
×′
ijij aa +=′ 1 for all entities of the corresponding matrix. The agent also constitutes the suggested price
matrix of suppliers as follows:
[ ]
=
kmk
m
sij
pp
pp
p
..
....
....
...
1
111
The adjusted prices of supplier can be calculated as:
[PAs] = Tsij
So that,
ijijs
ij aPT ′= * mj
ki
,...,1
,...,1
=∀=∀
(4)
The [PAs] matrix introduces the priority of matching between prices and attributes in an electronic supply chain environment.
By using this matrix in the following model, the optimal solution for suppliers with no cooperation in SC network will be obtained.
)*()( ijijs XTMaxZsP ∑==
s.t demand and supply should be satisfied. Supply Chain Optimal Solution In non-cooperative game playing independently, the intention of the players is to maximize their individual gain. On the other hand, in a cooperative game both buyer/supplier would consider maximizing system profit subject to buyer’s total annual cost at cooperation should be greater than or at least equal to those at non-cooperation. Similarly, supplier’s total annual profit at cooperation should be less than or at most equal to those at non-cooperation. The objective function for this game from the general model can be written as:
2485
)()(
)()(
..
)(*)1()(*
*
*
spsp
bpbp
ts
sPbPMax
≤
≥
−+−= λλ
and demand and supply should be satisfied.
Where )(* bp and )(* sp represent the cost and revenue of buyer and supplier before cooperation.
Depending upon the bargaining power of supplier and the buyer the value of λ varies between 0 and 1. Simulation and Performance Evaluation of an Industrial Supply Chain Petri nets are a powerful tool for modeling and analysis of discrete event systems such as manufacturing systems (Wang; 1998). Since supply chains are also discrete event systems from a high level of abstraction, it’s possible to develop a Petri net tool for modeling and analysis of supply chains (Chen, Amodeo, Chu and labadi; 2005). Although the literature of Petri nets is comprehensive, very little work applied Petri net to modeling of supply chains. Supply chains are modeled by using colored Petri net, where each supply chain entity is modeled as a block with action, resource and control which is a subnet of colored Petri net model (Chen, Amodeo, Chu and labadi; 2005). Supply chains are also modeled by using generalized stochastic Petri nets (GSPNs) (Viswanadham and Raghavan; 2000). For inventory systems with independent demand, a basic supply chain entity, they are modeled by using first-order hybrid Petri nets that combine fluid and discrete event dynamics (Furcas et al.; 2001). Implications for Practice In the present study, we first apply proposed model to an industrial supply chain and then evaluate its performance through simulation which is based on stochastic Petri net (Java program). The Java script and HTML programs can be used to implement our model on web pages in order to process large amount of information. Fig.1 shows the Petri net model of the SC. The interpretation of the places and the transitions in the model are given by table II and table III, respectively. In the model, the material flow is represented by timed transition t1, t2 (inventory replenishment of suppliers), t3 (delivery preparation) and their associated places and arcs. The information flow is represented by immediate transition t4, t6, t7, t9, t11, their associated places and arcs. The financial flow is represented by transition t10 and their associated places and arcs. For simplicity’s sake, we assume a scenario in which supply net is composed of two different suppliers and special family of product will be dealt on supply chain net. We also consider the inventory system of suppliers with periodic review (s, S) policy in which the inventory replenishment decisions are based on position. The inventory carrying cost for each part of family is deterministic for suppliers and is based on historical data.
Buyers demand is assumed to be poison process with ( 2500=α ) whose firing time is subject to an exponential distribution with mean value 0.0355. The demands will be filled if there is sufficient on-hand inventory. Otherwise, the demand will be removed. The inventory policy parameters of two suppliers are taken as (S1=5000, s1=2000) and (S2=5500, s2=2300). For financial flow, buyers pay to suppliers within a given time period after receiving finished products. We run the model under this strategy that buyer has more bargaining power than supplier by taking 6.0=λ in SC model.
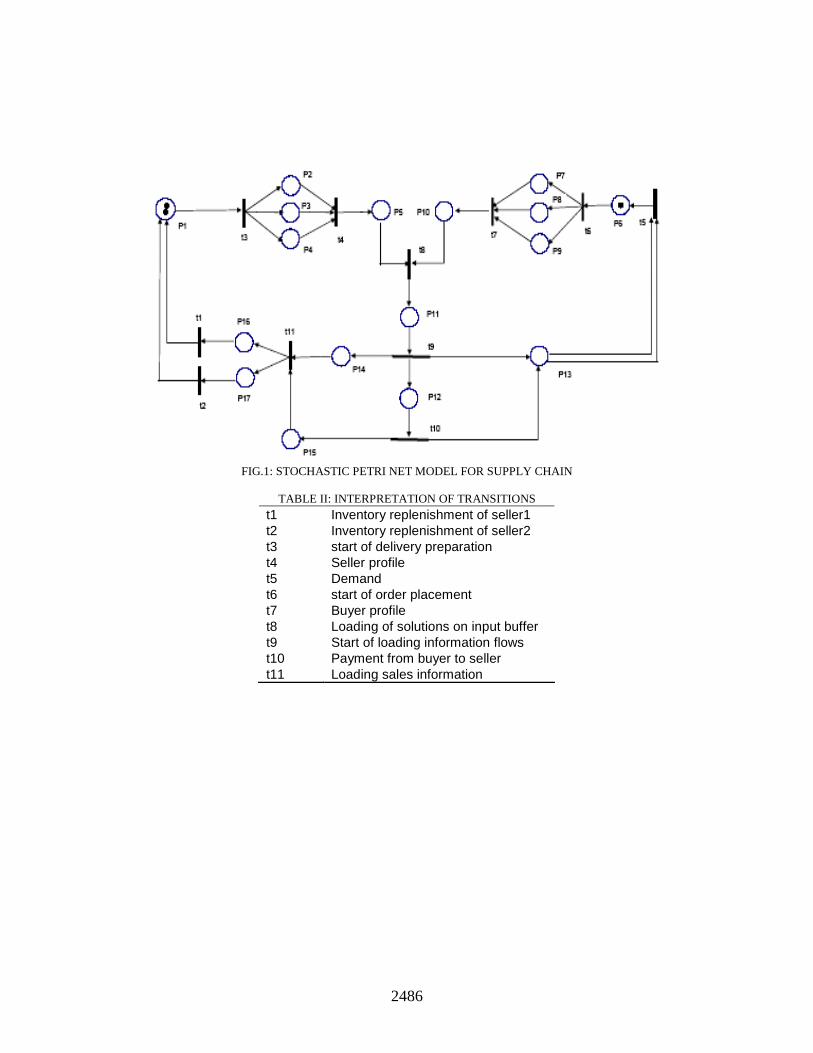
2486
FIG.1: STOCHASTIC PETRI NET MODEL FOR SUPPLY CHAIN
TABLE II: INTERPRETATION OF TRANSITIONS
t1 Inventory replenishment of seller1 t2 Inventory replenishment of seller2 t3 start of delivery preparation t4 Seller profile t5 Demand t6 start of order placement t7 Buyer profile t8 Loading of solutions on input buffer t9 Start of loading information flows t10 Payment from buyer to seller t11 Loading sales information
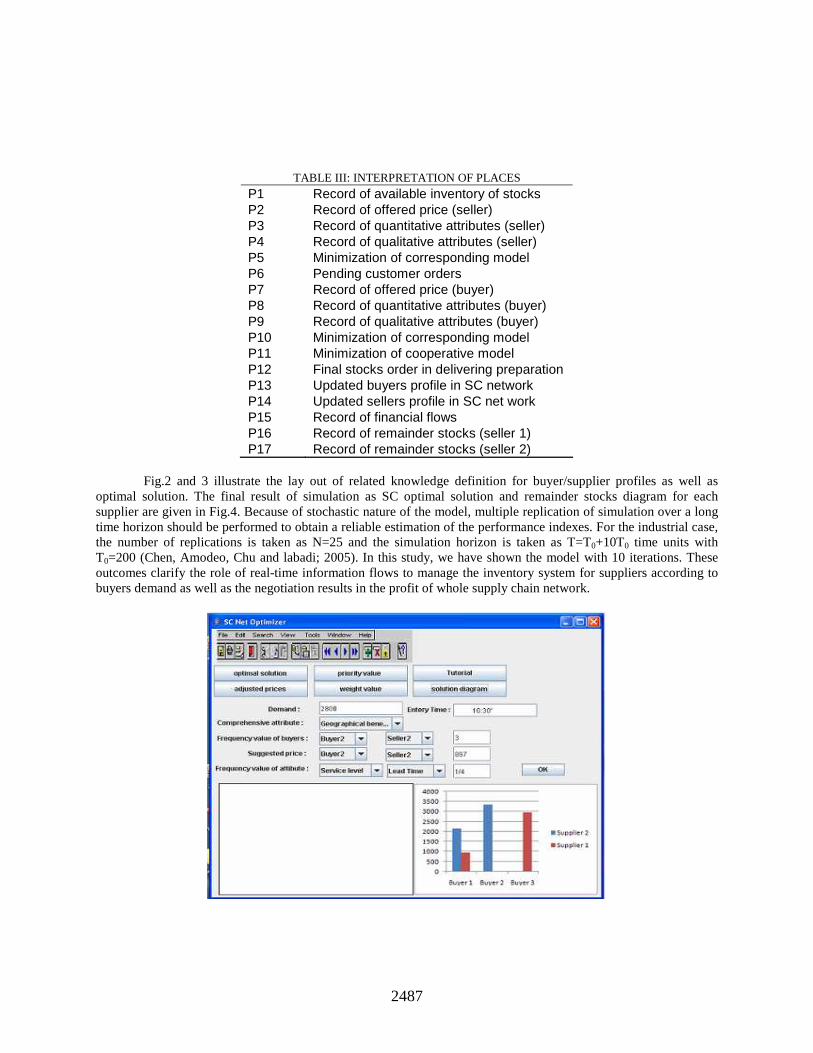
2487
TABLE III: INTERPRETATION OF PLACES P1 Record of available inventory of stocks P2 Record of offered price (seller) P3 Record of quantitative attributes (seller) P4 Record of qualitative attributes (seller) P5 Minimization of corresponding model P6 Pending customer orders P7 Record of offered price (buyer) P8 Record of quantitative attributes (buyer) P9 Record of qualitative attributes (buyer) P10 Minimization of corresponding model P11 Minimization of cooperative model P12 Final stocks order in delivering preparation P13 Updated buyers profile in SC network P14 Updated sellers profile in SC net work P15 Record of financial flows P16 Record of remainder stocks (seller 1) P17 Record of remainder stocks (seller 2)
Fig.2 and 3 illustrate the lay out of related knowledge definition for buyer/supplier profiles as well as
optimal solution. The final result of simulation as SC optimal solution and remainder stocks diagram for each supplier are given in Fig.4. Because of stochastic nature of the model, multiple replication of simulation over a long time horizon should be performed to obtain a reliable estimation of the performance indexes. For the industrial case, the number of replications is taken as N=25 and the simulation horizon is taken as T=T0+10T0 time units with T0=200 (Chen, Amodeo, Chu and labadi; 2005). In this study, we have shown the model with 10 iterations. These outcomes clarify the role of real-time information flows to manage the inventory system for suppliers according to buyers demand as well as the negotiation results in the profit of whole supply chain network.

2488
FIG.2: BUYER PROFILE IN SC NET OPTIMIZER
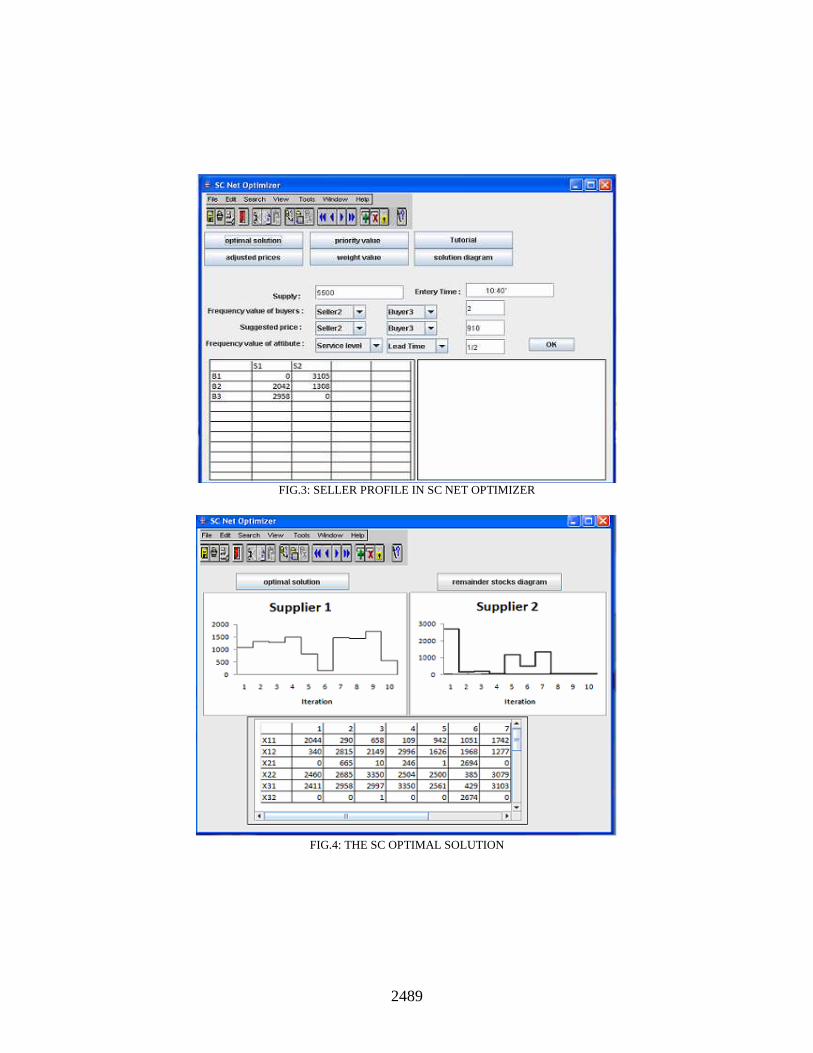
2489
FIG.3: SELLER PROFILE IN SC NET OPTIMIZER
FIG.4: THE SC OPTIMAL SOLUTION
2490
Performance Evaluation The performance criteria of the supply chain can include average inventory level and service level for each stock, where the service level is defined as probability that customer orders are filled on time. The first criterion is easy to obtain since it corresponds to average number of tokens in the discrete place representing the stock. For the evaluation of service level, we need to know the total time that the discrete place has no token while the place representing customer orders isn’t empty in each simulation. Our SC net simulator provides the graphical results for average inventory level of each supplier and also the visibility of orders for determining inventory policy. The point estimation of each performance index and the standard error of estimation obtained by the simulation can be calculated. Given the point estimation and the standard error, a confidence interval for each performance index can be calculated for any given level of confidence under the condition of the independence of replications (Chen, Amodeo, Chu and labadi; 2005). A )%1(100 α− confidence interval for performance index Ө, based on t-
distribution, is given as follows: NStNSt NN // 1,2/1,2/ −− +≤≤− αα θθθ
Where θ and S are the point estimation and the standard error of the estimation of Ө, respectively. N is the
number of independent replications, and 1,2/ −Ntα is the )2/1(100 α− percentage point of a t-distribution with N-1
degrees of freedom. Conclusions
The advent of internet based market places motivate the researchers to investigate the conceptual buyer/supplier coordination models to save the system costs and ultimately improves the performance of the supply chain. A coordination mechanism for decentralized supply chain whereby members are separate economic entities has to include a collaborative strategy to optimize system performance and incentive scheme to distribute the benefits of coordination so as to entice their cooperation. Moreover, the coordination of a supply chain also requires that accurate and timely information about their operational decisions and activities be shared among all members to reduce uncertainties.
Due to the complexity of supply chain systems, we have introduced the concept of dynamic supply chain information flows. An agent is designed to analyze and simulate the players’ behavior in SC network. The basic information is obtained in the form of customer-key attribute incidence matrix to achieve real-time customer profile. The supplier profile is designed to analyze the possibility of interaction between two main actors in SC, suppliers and buyers. The interaction between suggested price and comprehensive attributes in each profile is computationally derived to produce more realistic model. To improve the SC performance, these profiles are applied under cooperative game theory framework to give rise to the SC optimal solutions. This approach presents a great potential to resolve several problems in real-world SC systems which are in conflict with each other. The simulation-based approach to an industrial supply chain demonstrates that proposed model and associated methods can solve important supply chain issues such as evaluation of inventory policies and parameters. The use of our model for an extensive empirical analysis on web pages as well as extension of supply chain coordination model will lead to an interesting area of further research.
References
[1] Averbakh, I. and Xue, Z. (2006). On-line supply chain scheduling problems with preemption [Electronic version], European Journal of Operational Research, Article in press.
[2] Chen, H., Lionel, A., Chu, F. and Labadi, K. (2005). Modeling and performance evaluation of supply chains using batch deterministic and stochastic Petri nets, IEEE transactions automation science and engineering, Vol.2, No.2.
2491
[3] Chen, F., Drezner, Z., Ryan, J.K., Simchi-Levi, D.,( 2000). Quantifying the bullwhip effect in a simple supply chain: The impact of forecasting lead time and information, Management science, 46 (3), pp. 436-443.
[4] Cheung, K., Lee, H., (2002). The inventory benefit of shipment coordination and stock rebalancing in a supply chain, Management Science, 48 (2), pp. 300–306.
[5] Flynn, B.B. and Flynn, E.J. (2005). Synergies between supply chain management and quality management: emerging implications, International Journal of Production Research, 43(16), 3421-3436.
[6] Furcas, R. et al. (2001). Hybrid Petri net modeling of inventory management systems, journal of European system automation, Vol.35, pp.417-434.
[7] García-Dastugue, S.J.G. and Lambert, D.M. (2003). Internet-enabled coordination in the supply chain, Industrial Marketing Management, 32, 251– 263.
[8] García-Sánchez, F., Valencia-García, R. and Martínez-Béjar, R. (2005). An integrated approach for developing e-commerce applications, Expert systems with applications, 28(2), 223-235.
[9] Hazra, J. and Mahadevan, B. (2006), Impact of supply base heterogeneity in electronic markets, European journal of operational research, 174, 1580-1594.
[10] Lancastre, A. and Lages, L.F. (2006). The relationship between buyer and a B2B e-marketplace: Cooperation determinants in an electronic market context, Industrial Marketing Management, 35, 774 – 789.
[11] Lee, K.J., Chang, Y.S. and Lee, J.K. (2000). Time-bound negotiation framework for electronic commerce agents, Decision Support Systems, 28 (4), 319–331.
[12] Li. X. and Wang, Q. (2007). Coordination mechanisms of supply chain systems, European journal of operational research, Vol. 179, pp. 1-16.
[13] Mahdavi, I. Cho, N. and Mohebbi, S. (2007). A fuzzy-based analytical model of dynamic information flows in e-SCM; Contemporary management research, vol.3, No.4.
[14] Nagarajan, M. and Sosˇic´, G. (2006). Game-theoretic analysis of cooperation among supply chain agents: Review and extensions [Electronic version], European Journal of Operational Research, Article in press.
[15] Pant.S., Sethi, R. and Bhandari, M. (2003). Making sense of the e-supply chain landscape: an implementation framework, International Journal of Information Management, 23, 201-221.
Contact authors for full list of references.
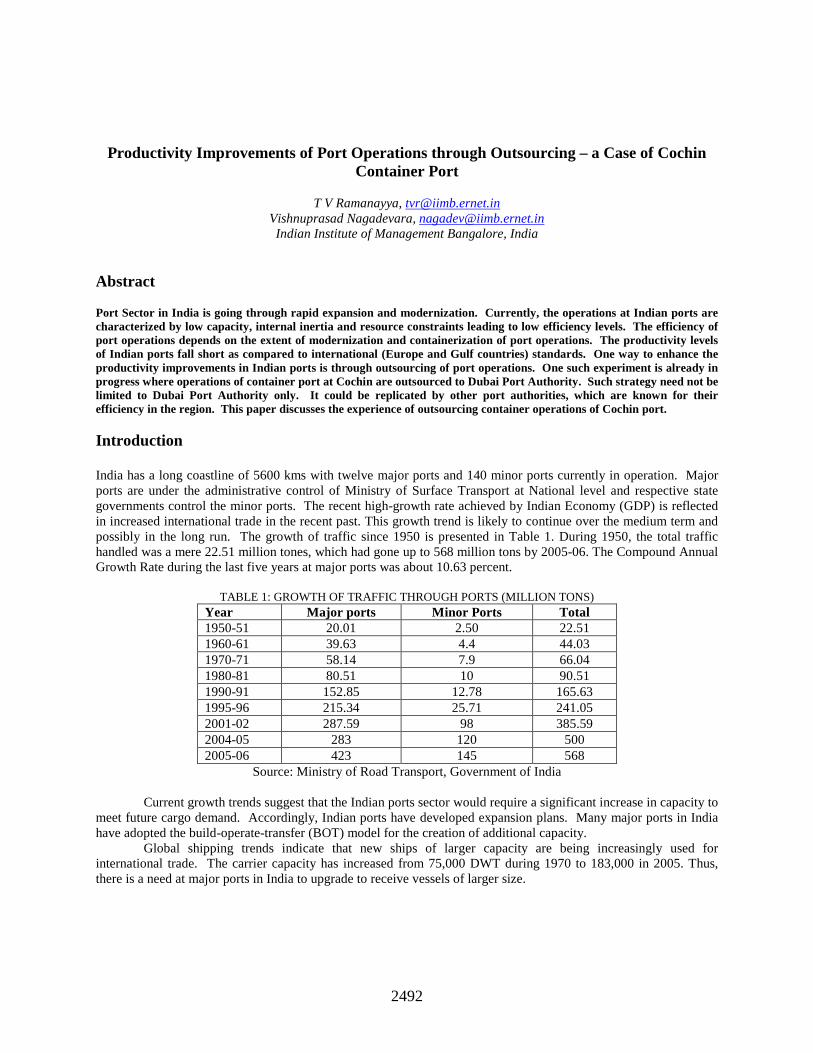
2492
Productivity Improvements of Port Operations through Outsourcing – a Case of Cochin Container Port
T V Ramanayya, [email protected]
Vishnuprasad Nagadevara, [email protected] Indian Institute of Management Bangalore, India
Abstract Port Sector in India is going through rapid expansion and modernization. Currently, the operations at Indian ports are characterized by low capacity, internal inertia and resource constraints leading to low efficiency levels. The efficiency of port operations depends on the extent of modernization and containerization of port operations. The productivity levels of Indian ports fall short as compared to international (Europe and Gulf countries) standards. One way to enhance the productivity improvements in Indian ports is through outsourcing of port operations. One such experiment is already in progress where operations of container port at Cochin are outsourced to Dubai Port Authority. Such strategy need not be limited to Dubai Port Authority only. It could be replicated by other port authorities, which are known for their efficiency in the region. This paper discusses the experience of outsourcing container operations of Cochin port. Introduction India has a long coastline of 5600 kms with twelve major ports and 140 minor ports currently in operation. Major ports are under the administrative control of Ministry of Surface Transport at National level and respective state governments control the minor ports. The recent high-growth rate achieved by Indian Economy (GDP) is reflected in increased international trade in the recent past. This growth trend is likely to continue over the medium term and possibly in the long run. The growth of traffic since 1950 is presented in Table 1. During 1950, the total traffic handled was a mere 22.51 million tones, which had gone up to 568 million tons by 2005-06. The Compound Annual Growth Rate during the last five years at major ports was about 10.63 percent.
TABLE 1: GROWTH OF TRAFFIC THROUGH PORTS (MILLION TONS) Year Major ports Minor Ports Total 1950-51 20.01 2.50 22.51 1960-61 39.63 4.4 44.03 1970-71 58.14 7.9 66.04 1980-81 80.51 10 90.51 1990-91 152.85 12.78 165.63 1995-96 215.34 25.71 241.05 2001-02 287.59 98 385.59 2004-05 283 120 500 2005-06 423 145 568
Source: Ministry of Road Transport, Government of India
Current growth trends suggest that the Indian ports sector would require a significant increase in capacity to meet future cargo demand. Accordingly, Indian ports have developed expansion plans. Many major ports in India have adopted the build-operate-transfer (BOT) model for the creation of additional capacity.
Global shipping trends indicate that new ships of larger capacity are being increasingly used for international trade. The carrier capacity has increased from 75,000 DWT during 1970 to 183,000 in 2005. Thus, there is a need at major ports in India to upgrade to receive vessels of larger size.
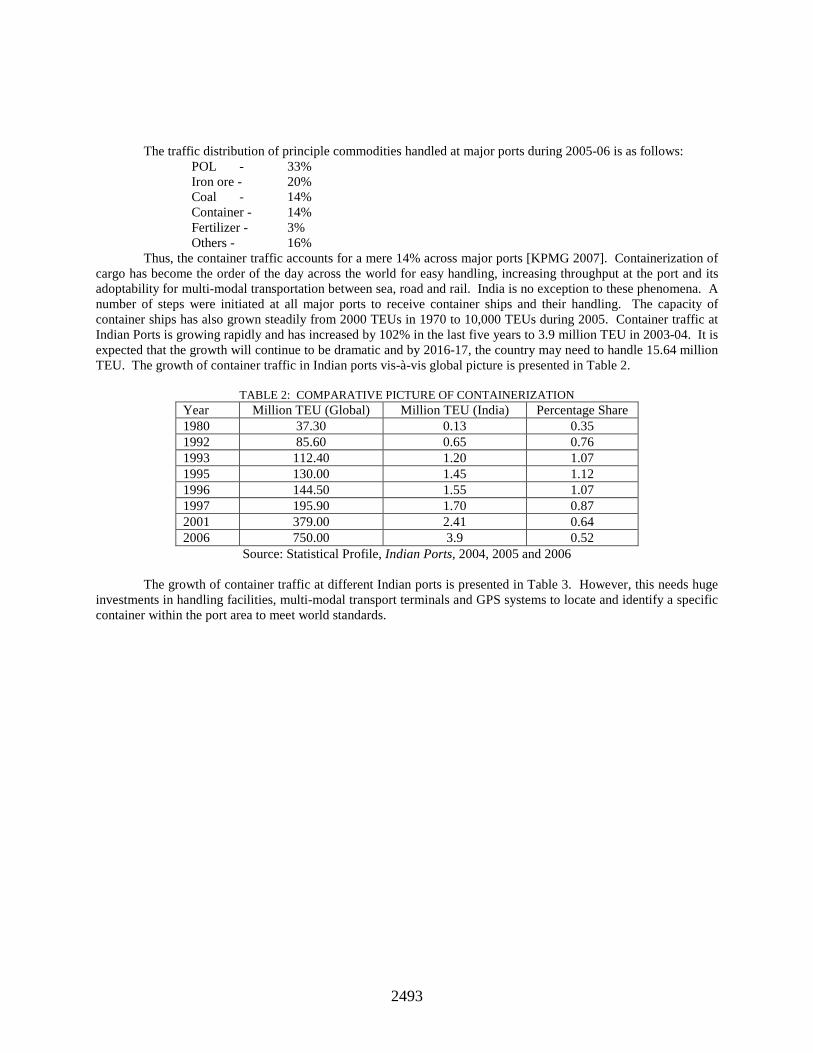
2493
The traffic distribution of principle commodities handled at major ports during 2005-06 is as follows: POL - 33% Iron ore - 20% Coal - 14% Container - 14% Fertilizer - 3% Others - 16%
Thus, the container traffic accounts for a mere 14% across major ports [KPMG 2007]. Containerization of cargo has become the order of the day across the world for easy handling, increasing throughput at the port and its adoptability for multi-modal transportation between sea, road and rail. India is no exception to these phenomena. A number of steps were initiated at all major ports to receive container ships and their handling. The capacity of container ships has also grown steadily from 2000 TEUs in 1970 to 10,000 TEUs during 2005. Container traffic at Indian Ports is growing rapidly and has increased by 102% in the last five years to 3.9 million TEU in 2003-04. It is expected that the growth will continue to be dramatic and by 2016-17, the country may need to handle 15.64 million TEU. The growth of container traffic in Indian ports vis-à-vis global picture is presented in Table 2.
TABLE 2: COMPARATIVE PICTURE OF CONTAINERIZATION Year Million TEU (Global) Million TEU (India) Percentage Share 1980 37.30 0.13 0.35 1992 85.60 0.65 0.76 1993 112.40 1.20 1.07 1995 130.00 1.45 1.12 1996 144.50 1.55 1.07 1997 195.90 1.70 0.87 2001 379.00 2.41 0.64 2006 750.00 3.9 0.52
Source: Statistical Profile, Indian Ports, 2004, 2005 and 2006 The growth of container traffic at different Indian ports is presented in Table 3. However, this needs huge
investments in handling facilities, multi-modal transport terminals and GPS systems to locate and identify a specific container within the port area to meet world standards.
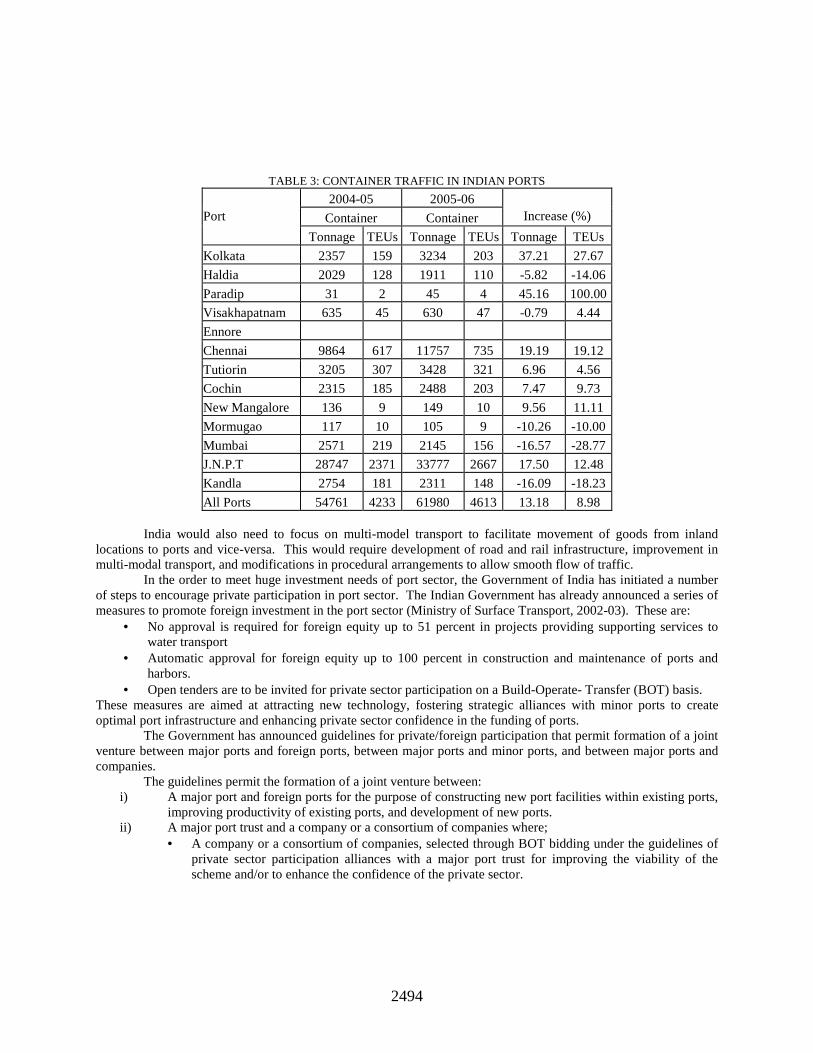
2494
TABLE 3: CONTAINER TRAFFIC IN INDIAN PORTS
2004-05 2005-06
Container Container Increase (%) Port
Tonnage TEUs Tonnage TEUs Tonnage TEUs
Kolkata 2357 159 3234 203 37.21 27.67
Haldia 2029 128 1911 110 -5.82 -14.06
Paradip 31 2 45 4 45.16 100.00
Visakhapatnam 635 45 630 47 -0.79 4.44
Ennore
Chennai 9864 617 11757 735 19.19 19.12
Tutiorin 3205 307 3428 321 6.96 4.56
Cochin 2315 185 2488 203 7.47 9.73
New Mangalore 136 9 149 10 9.56 11.11
Mormugao 117 10 105 9 -10.26 -10.00
Mumbai 2571 219 2145 156 -16.57 -28.77
J.N.P.T 28747 2371 33777 2667 17.50 12.48
Kandla 2754 181 2311 148 -16.09 -18.23
All Ports 54761 4233 61980 4613 13.18 8.98
India would also need to focus on multi-model transport to facilitate movement of goods from inland locations to ports and vice-versa. This would require development of road and rail infrastructure, improvement in multi-modal transport, and modifications in procedural arrangements to allow smooth flow of traffic.
In the order to meet huge investment needs of port sector, the Government of India has initiated a number of steps to encourage private participation in port sector. The Indian Government has already announced a series of measures to promote foreign investment in the port sector (Ministry of Surface Transport, 2002-03). These are:
• No approval is required for foreign equity up to 51 percent in projects providing supporting services to water transport
• Automatic approval for foreign equity up to 100 percent in construction and maintenance of ports and harbors.
• Open tenders are to be invited for private sector participation on a Build-Operate- Transfer (BOT) basis. These measures are aimed at attracting new technology, fostering strategic alliances with minor ports to create optimal port infrastructure and enhancing private sector confidence in the funding of ports.
The Government has announced guidelines for private/foreign participation that permit formation of a joint venture between major ports and foreign ports, between major ports and minor ports, and between major ports and companies.
The guidelines permit the formation of a joint venture between: i) A major port and foreign ports for the purpose of constructing new port facilities within existing ports,
improving productivity of existing ports, and development of new ports. ii) A major port trust and a company or a consortium of companies where;
• A company or a consortium of companies, selected through BOT bidding under the guidelines of private sector participation alliances with a major port trust for improving the viability of the scheme and/or to enhance the confidence of the private sector.
2495
• A company or a consortium of companies is selected under the scheme of innovative/ unsolicited proposals.
• Oil PSUs/a joint venture Company of oil PSUs are/is selected for oil related port facility as a port-based industry.
Through these policies and guidelines, private sector participation is made attractive in port expansion plans. History and Development of Cochin Port Cochin port is situated in Wellingdon island just 4 kms away from Cochin city. It is strategically located on the East-West trade route at Latitude 9 degrees 58’ north and longitude 76 degree 14’ East on route west coast of India. Cochin port is only 10 nautical miles away from the direct sea route to Australia and the Far East from Europe. No other Indian port enjoys this proximity to the maritime highway. This port is 930 km away from Bombay and 320 kms away from Kanyakumari.
The Cochin Container Terminal was in the making since 1990s. In order to expand and increase the operations through BOOT route, the first global bids were called in 2002-03, but only one bid from Peninsular and Oriental was received and hence the bid was not accepted. Subsequently, the bids were called again in 2004 and Dubai Port Authority (DPA) won the bid (DP World, 2007). The salient feature of the contract is that the DPA had agreed to share 1/3rd of the gross revenues with the government. The agreement was signed in Feb. 2005. On 1 April 2005, Dubai Port International has taken over the operations of Container berth at Cochin.
A separate SPV called India Gateway Terminal (IGT) was set up. The partners are DP World (76%), Container Corporation of India (15%), Chakiat Group (5%) and Transworld Shipping (4%). The concession agreement between Cochin Port Trust (COPT) and IGT has two parts.
The first part includes taking over the operations of existing container berth at Cochin Port, which is referred to as Rajiv Gandhi Container Terminal (RGCT) for 4 years. The second part involves the development of International Container Transshipment Terminal (ICTT) at Vallarpadam and operates the same for 34 years on BOT basis. It is estimated to cost about Rs.2400 crores. There are five conditions precedent to the construction of the ICTT at Vallarpadam.
1. Declaration of the project site as a Special Economic Zone (SEZ) 2. Environment clearance 3. Capital dredging for 14.5 meter draught 4. Rail connectivity to the main line 5. Road connectivity to the National Highway
The throughput of Cochin Container Port had shown significant change in its operations after the takeover by DPA where the throughput has increased from 185,000 TEUs in 2004-05 to 201,000 TEUs in 2005-06 and finally to 226,808 TEUs in 2006-07. Thus in two years, the productivity increased by was about 25%.
The future plans for the container terminal are as follows: - Plan to increase the throughput to 280,000 TEUs by 2007-08 and 350,000 by 2008-09 - Plan to achieve 1,000,000 TEUs within five years of moving to Vallarpadam island - April 2009 is the target date for moving to Vallarpadam
The current status of the project is as follows: 1. The project site has already been notified as a SEZ (Special Economic Zone) 2. Environmental clearance has been obtained 3. The first part of the capital dredging of RGCT has been completed 4. The rail alignment, funding and the agency have been finalized 5. The road alignment has been finalized and land acquisition is underway 6. The soil excavation survey and test piles at the project site have been completed 7. The project schedule will be structured as to complete the construction by December 2008.
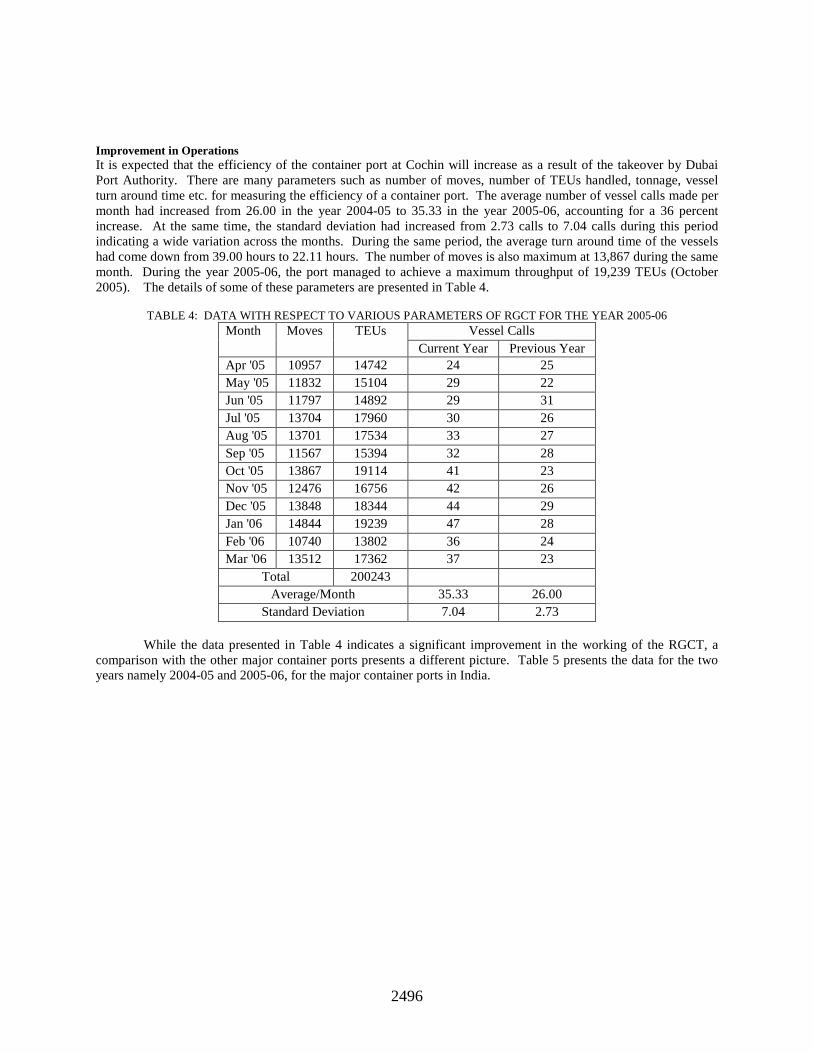
2496
Improvement in Operations It is expected that the efficiency of the container port at Cochin will increase as a result of the takeover by Dubai Port Authority. There are many parameters such as number of moves, number of TEUs handled, tonnage, vessel turn around time etc. for measuring the efficiency of a container port. The average number of vessel calls made per month had increased from 26.00 in the year 2004-05 to 35.33 in the year 2005-06, accounting for a 36 percent increase. At the same time, the standard deviation had increased from 2.73 calls to 7.04 calls during this period indicating a wide variation across the months. During the same period, the average turn around time of the vessels had come down from 39.00 hours to 22.11 hours. The number of moves is also maximum at 13,867 during the same month. During the year 2005-06, the port managed to achieve a maximum throughput of 19,239 TEUs (October 2005). The details of some of these parameters are presented in Table 4.
TABLE 4: DATA WITH RESPECT TO VARIOUS PARAMETERS OF RGCT FOR THE YEAR 2005-06
Vessel Calls Month Moves TEUs Current Year Previous Year
Apr '05 10957 14742 24 25 May '05 11832 15104 29 22 Jun '05 11797 14892 29 31 Jul '05 13704 17960 30 26 Aug '05 13701 17534 33 27 Sep '05 11567 15394 32 28 Oct '05 13867 19114 41 23 Nov '05 12476 16756 42 26 Dec '05 13848 18344 44 29 Jan '06 14844 19239 47 28 Feb '06 10740 13802 36 24 Mar '06 13512 17362 37 23
Total 200243 Average/Month 35.33 26.00
Standard Deviation 7.04 2.73
While the data presented in Table 4 indicates a significant improvement in the working of the RGCT, a comparison with the other major container ports presents a different picture. Table 5 presents the data for the two years namely 2004-05 and 2005-06, for the major container ports in India.

2497
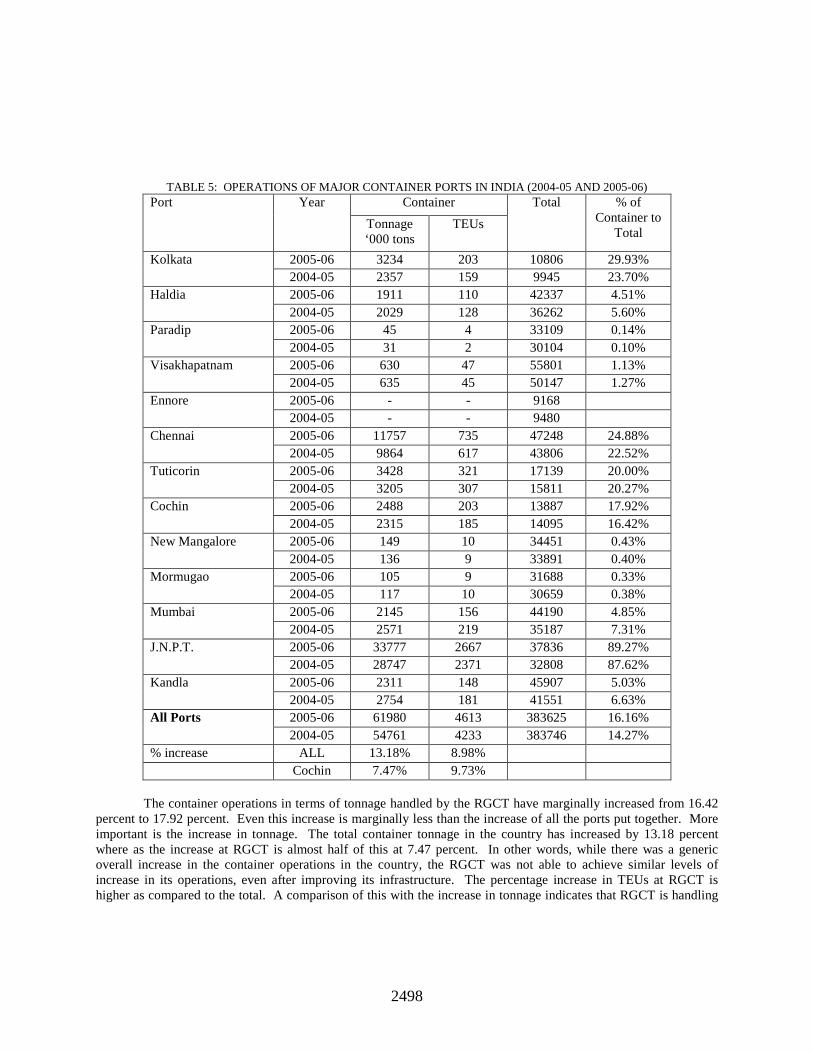
2498
TABLE 5: OPERATIONS OF MAJOR CONTAINER PORTS IN INDIA (2004-05 AND 2005-06) Container Port Year
Tonnage ‘000 tons
TEUs
Total % of Container to
Total
2005-06 3234 203 10806 29.93% Kolkata 2004-05 2357 159 9945 23.70% 2005-06 1911 110 42337 4.51% Haldia 2004-05 2029 128 36262 5.60% 2005-06 45 4 33109 0.14% Paradip 2004-05 31 2 30104 0.10% 2005-06 630 47 55801 1.13% Visakhapatnam 2004-05 635 45 50147 1.27% 2005-06 - - 9168 Ennore 2004-05 - - 9480 2005-06 11757 735 47248 24.88% Chennai 2004-05 9864 617 43806 22.52% 2005-06 3428 321 17139 20.00% Tuticorin 2004-05 3205 307 15811 20.27% 2005-06 2488 203 13887 17.92% Cochin 2004-05 2315 185 14095 16.42% 2005-06 149 10 34451 0.43% New Mangalore 2004-05 136 9 33891 0.40% 2005-06 105 9 31688 0.33% Mormugao 2004-05 117 10 30659 0.38% 2005-06 2145 156 44190 4.85% Mumbai 2004-05 2571 219 35187 7.31% 2005-06 33777 2667 37836 89.27% J.N.P.T. 2004-05 28747 2371 32808 87.62% 2005-06 2311 148 45907 5.03% Kandla 2004-05 2754 181 41551 6.63% 2005-06 61980 4613 383625 16.16% All Ports 2004-05 54761 4233 383746 14.27%
% increase ALL 13.18% 8.98% Cochin 7.47% 9.73%
The container operations in terms of tonnage handled by the RGCT have marginally increased from 16.42
percent to 17.92 percent. Even this increase is marginally less than the increase of all the ports put together. More important is the increase in tonnage. The total container tonnage in the country has increased by 13.18 percent where as the increase at RGCT is almost half of this at 7.47 percent. In other words, while there was a generic overall increase in the container operations in the country, the RGCT was not able to achieve similar levels of increase in its operations, even after improving its infrastructure. The percentage increase in TEUs at RGCT is higher as compared to the total. A comparison of this with the increase in tonnage indicates that RGCT is handling
2499
more TEUs but, achieving a lower tonnage. In other words, while the growth in the overall container traffic in the country was in the order of 7219 million tons, RGCT was able to attract only 173 million tons. As a matter of fact, RGCT’s proportion of container traffic (as a proportion to the total container traffic in the country) has actually come down from 4.22 percent in 2004-05 to 4.01 percent in 2005-06. In comparison, the JNPT accounted for more than 69 percent of the overall growth in the container traffic between 2004-05 and 2005-06. JNPT’s proportion of the total container traffic has increased from 52.5 percent in 2004-05 to 54.5 percent in 2005-06, implying that JNPT managed to attract a larger proportion of the growth than its average share of container traffic.
In order to estimate the relative efficiency of RGCT as compared to other major container ports, a simple data envelopment analysis (DEA) was carried out. Only five ports are considered for the analysis. These are JNPT, Visakhapatnam, Tuticoran, Chennai and RGCT. Two different measures of outputs, namely TEUs and Tonnage were considered for the analysis. The inputs considered were mainly related to infrastructure available at the ports such as cranes, trailers, forklifts, reefers etc. the data with respect to each of the ports is obtained from “Seaports of India (http://www.indiaseaports.com/isp/indexie.jsp)”. Generally, an analysis like DEA is not attempted with only five items and few outputs and inputs. The very nature of the DEA techniques will normally ensure that all the items (ports in this case) are on the boundary of the data envelop when the number of alternatives (items) considered are very few, especially as compared to the number of constraints (number of outputs and inputs). This is more likely to happen in this particular case because there are only two outputs under consideration. But, the analysis showed that the relative efficiency of RGCT is only 0.667 while all the remaining four container ports are on the boundary of the envelope. This actually indicates that the relative efficiency of RGCT is significantly lower than that of the other container ports.
One of the advantages of DEA is that it indicates the ports that are nearest to RGCT in terms of efficiency. In addition, it also provides the sensitivity analysis which in turn indicates the direction and quantities required to improve the efficiency levels of RGCT. The two ports that come nearest to RGCT in terms of efficiency are Visakhapatnam and Tuticoran. In order to reach the comparable efficiency levels of these two ports, RGCT will have to increase the tonnage by about 700 thousand tons or TEUs by about 100. This is based on the present infrastructure available at RGCT, since a considerable amount of investment had already gone into improving the infrastructure, Reasons for Low Levels of Efficiency There a number of factors which contribute to the low levels of efficiency, in spite of the significant increases in the infrastructure brought about by the Dubai Port Authority. The foremost reason is the culture of the businesses and shipping agents in Cochin. The RGCT has started operating 24 hours a day on all the 7 days of the week. This had improved the turnaround time for the vessels and also resulted in a significant increase in the number of vessels calling at the port. Unfortunately, the culture of the businesses in the Cochin area is that they operate only for 6 to 8 hours a day for 5 days a week. Consequently, there was no significant improvement in the throughput. Not only there was no significant improvement, the mismatch in vessel handling and movement of containers in and out of the storage yard has created a situation of overcrowding in the storage area.
As a part of the agreement with the Cochin Port Authority, all the employees working in the container port earlier are made to join RGCT. This is the first time it has happened where neither the employees nor the organization had any choice. There are 352 employees who are transferred to RGCT. Only after migration to the Vallarpadam terminal, these employees as well as IGT, which is the SPV for RGCT and Vallarpadam terminal, will have the right to continue or discontinue their services. At present IGT has no control over the service conditions of these employees. The work culture in Kerala is very different and the most difficult part for the RGCT is to change the work culture.
The existing hinterland of the Cochin port is not conducive to strong economic growth. The hinterland of Kerala consists of a predominantly consumer society. There is a decline in the trade of commodities such as cashew, coir, and other agricultural products. Even the neighboring districts of Tamilnadu (industrial areas such as Coimbatore and Tiruppur) prefer Tuticoran or Chennai even though the distance is longer to these ports as compared
2500
to Cochin. The main reason is the uncertainty involved with Cochin port (Kerala state in particular) based on the work culture, militancy of the workforce etc.
Quick delivery (especially delivery outside the port) is important in the container terminal. At Cochin, even today, the delivery is being made inside the terminal premises. The delivery time in Cochin is 10 days at resent as compared to 5 days in Tuticoran, one day in Chennai, ½ a day in JNPT. Strategies for the Future Various strategies are being put in place to improve the efficiency and viability of RGCT. Some of them are already working. These strategies are aimed at (i) increasing the throughput at RGCT in the short run and (ii) increasing the effectiveness of Vallarpadam in the long run.
The first an most important short run strategy is the redeployment as well as re-skilling of the legacy employees who were earlier with Cochin Port was carried out. The objective is to change the work culture. Training programmes which were specially designed for this purpose were organized. A total of 6800 hours of training was given to 410 employees. The new management has largely succeeded in sending right signals that pressure tactics by the unions will not work. They managed to create an open culture where the employees are encouraged to carry a dialogue rather than resorting to strikes or go slow tactics. There had been not a single instance of loss of day’s work due to industrial unrest in the past one year.
The management IGT is trying hard to send signals to the customers (clients) that things are different now. Implementation of a queue system for the clients is very important. Show that first-come-first-served will always work.
A number of initiatives are put in place in order to overcome congestion at the terminal. Some of these are: * Dis-incentivizing longer stay of container inside the port. * Reduce the number of “Free Days” * Incentives for clearing the container in “off-peak” hours * Developing holding area outside the port * The Container Freight Terminal to develop additional area for holding * Developing a separate Container freight Station RGCT is in the process of creating a single window Customer Support System. The client can send the
“complaints” through any route, namely, through SMS, telephone, e-mail, internet etc. It will be handled within a stipulated time with appropriate escalations to higher levels already built in. The client will be able to trace the status of the complaint through the web itself.
Steps have been initiated by IGT for ISO 27000 certification. The initial processing is completed and the award is expected in matter of few days.
RGCT has leveraged IT to improve its efficiency. It has implemented special software called “NAVIS”. The software takes care of the entire container operations both on the shipside and shore-side. The data with respect to the ships calling and the cargo is uploaded directly through EDI. Similarly, the data on containers to be loaded into the ships is also uploaded into the software. The software keeps track of the containers and their destinations. The allocation on the ground is still done manually. The software helps in identifying the available slots and the destinations of the existing containers so that a better match could be made and the number of moves and shuffles could be minimized. The entire container operations are paperless completely. Only paper is what are required statutorily. It used to take 2 to 3 days for the billing to reach the client. Now it is done immediately on loading.
At present, Indian exports are transshipped mainly through Singapore or Colombo. The strategy is to take the transshipment business at the new container port at Vallarpadam. It can happen if larger vessels that go directly to US or China start calling at IGT. This will save additional handling at transshipment locations as well as time to reach the destination. IGT can also function as transshipment port for cargoes moving in the Indian Ocean shipping lines.
The low productivity and relative inefficiencies of RGCT are not unexpected. At the same time, for the success of the experiment of outsourcing the port operations in India, it is imperative that the Vallarpadam terminal
2501
has to become commercially viable. The following factors are likely to work in favor of the new Vallarpadam terminal.
1. After the completion of the proposed container port at Vallarpadam, its proximity to international east-west sea routes and the deep draft available at the port, saving in total Origin-Destination cost of movement of containers to/from foreign destinations can be achieved in several cases if containers move through this port. The hinterland of the port may thus be said to extend to not only the southern India but also western and even northern India. This will considerably increase the potential for traffic at the Port.
2. The strategic location of the new terminal will make it an ideal transshipment port for inter-coastal movement of domestic Indian containers through coastal shipping. The volumes derived from such transshipment will augment the volumes projected based on export/import trade along.
3. It is estimated that total container traffic at this terminal may reach 3.5 to 4 million TEUs per annum. Thus it will be the largest container terminal in the country.
References
[1] DP World, http://portal.pohub.com/pls/pogprtl/docs/page/dp_world_website/ dp_world_about_page/
about_dp_world_overview/overview_dp_world_brochure/brochure%2023%20jan.pdf, last accessed on 15th Apr 2007
[2] EXIM India Shipping Times, “India Gateway Terminal, 1st Anniversary Special”, EXIM India, Chennai, 2006.
[3] Government of Kerala, Development of Deepwater International Container Transshipment Terminal at Vizhinjam with Private Sector Participation, prepared by IL&FS and Hauer Associates, 2004
[4] KPMG, India Maritime Landscape, India Maritime Summit, 2006, available at http://www.kpmg.de/library/pdf/Shipping_Report.pdf , last accessed on 15th April 2007.
[5] Ministry of Surface Transport, Policy Circulars on Private Participation in Ports, 2002-03 [6] Sea Ports of India, http://www.indiaseaports.com/isp/indexie.jsp, last accessed on 15th April 2007 [7] Statistical Profile, Indian Ports, Vol. 36, No. 4, Apr 2005, pp 69-73 [8] Statistical Profile, Indian Ports, Vol. 37, No. 1, Jul 2005, pp 43-47 [9] Statistical Profile, Indian Ports, Vol. 38, No. 2, Oct 2006, pp 55-60
2502
Outsourcing and Global Supply Chain Management
Kwok Hung Lau, [email protected] Royal Melbourne Institute of Technology University, Australia
Abstract As a result of globalisation, supply chains of many large business organizations nowadays tend to become very long and complex. The traditional simple linear supply chains are quickly replaced by extended supply chain networks comprising not only suppliers, manufacturers, distributors, and end customers, but also service providers. With the increasing use of third-party logistics (3PL) service by international firms, many global 3PL providers are forming partnerships with large corporations to take care of the latter’s logistics operations in different regions. The management of global supply chains therefore involves not only the maintenance of relationships with suppliers and distributors but also third-party logistics providers. This paper investigates the role of 3PL providers in global supply chain management and proposes a framework for evaluation of 3PL providers as global logistics partners for international firms. The framework focuses on the core competencies of the 3PL provider and its abilities to achieve economies of scale for its users so as to assist them to achieve their outsourcing goals and objectives. Introduction Rapid advancements in information and communication technology (ICT) in recent years, coupled with the collapse of entry-to-market and other trading barriers, have changed significantly the way organizations operate in terms of business model and operating scale [32]. Globalisation, lead-time reduction, customer orientation, and outsourcing are some major changes contributing to an increasing interest in advanced logistics services and global supply chain management [16]. Successful global logistics depends heavily on communication and transportation. Improved communication between different business partners through the use and sharing of real-time information facilitates the logistics of production and inventory over wider geographic areas. Efficient transport arrangement such as volume consolidation and cross docking makes possible the actual transactions between nodes [8]. Owing to the increased levels of resource requirement, complexity, and risk in running global logistics, many firms tend to outsource their logistics operations to third-party logistics (3PL) providers and focus on their core businesses. Successful management of global supply chains therefore requires radical changes in supply chain structure, business processes, and relationships with business partners particularly logistics service providers.
Traditionally, supply chain is relatively linear in structure (Fig.1). A typical manufacturing supply chain involves a few tiers of suppliers, the manufacturer (the focal company), a few tiers of distributors (including wholesalers and retailers), and finally the end customers. Materials mainly flow from upstream to downstream (i.e., from suppliers to end customers) with a small reverse flow of returns while information tends to flow in both directions. Transportation is provided either in-house by the different parties separately or outsourced to different 3PL providers [37]. With globalisation and disintermediation as a result of advancement in ICT, the linear supply chain model and the associated uncoordinated logistics operations can no longer meet the demand of customers for higher efficiency, shorter lead time, and wider geographic coverage. The supply chain tends to become networked (Fig.2) with the focal company as the hub and a major 3PL provider looking after the logistics operations of the whole supply chain for the focal company in different regions [32, 36].
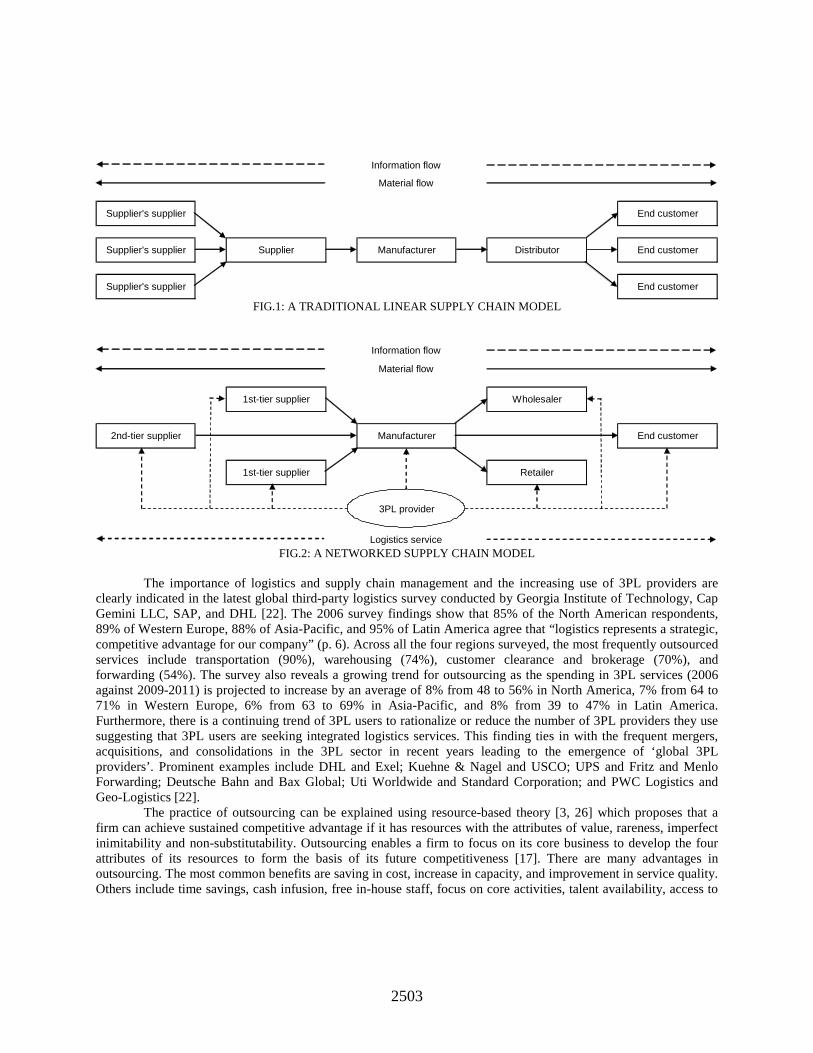
2503
Information flow
Material flow
Supplier Manufacturer
Supplier's supplier
Supplier's supplier
Supplier's supplier
Distributor
End customer
End customer
End customer
FIG.1: A TRADITIONAL LINEAR SUPPLY CHAIN MODEL
Information flow
Material flow
Logistics service
Retailer
1st-tier supplier
2nd-tier supplier
1st-tier supplier
3PL provider
Manufacturer
Wholesaler
End customer
FIG.2: A NETWORKED SUPPLY CHAIN MODEL
The importance of logistics and supply chain management and the increasing use of 3PL providers are
clearly indicated in the latest global third-party logistics survey conducted by Georgia Institute of Technology, Cap Gemini LLC, SAP, and DHL [22]. The 2006 survey findings show that 85% of the North American respondents, 89% of Western Europe, 88% of Asia-Pacific, and 95% of Latin America agree that “logistics represents a strategic, competitive advantage for our company” (p. 6). Across all the four regions surveyed, the most frequently outsourced services include transportation (90%), warehousing (74%), customer clearance and brokerage (70%), and forwarding (54%). The survey also reveals a growing trend for outsourcing as the spending in 3PL services (2006 against 2009-2011) is projected to increase by an average of 8% from 48 to 56% in North America, 7% from 64 to 71% in Western Europe, 6% from 63 to 69% in Asia-Pacific, and 8% from 39 to 47% in Latin America. Furthermore, there is a continuing trend of 3PL users to rationalize or reduce the number of 3PL providers they use suggesting that 3PL users are seeking integrated logistics services. This finding ties in with the frequent mergers, acquisitions, and consolidations in the 3PL sector in recent years leading to the emergence of ‘global 3PL providers’. Prominent examples include DHL and Exel; Kuehne & Nagel and USCO; UPS and Fritz and Menlo Forwarding; Deutsche Bahn and Bax Global; Uti Worldwide and Standard Corporation; and PWC Logistics and Geo-Logistics [22].
The practice of outsourcing can be explained using resource-based theory [3, 26] which proposes that a firm can achieve sustained competitive advantage if it has resources with the attributes of value, rareness, imperfect inimitability and non-substitutability. Outsourcing enables a firm to focus on its core business to develop the four attributes of its resources to form the basis of its future competitiveness [17]. There are many advantages in outsourcing. The most common benefits are saving in cost, increase in capacity, and improvement in service quality. Others include time savings, cash infusion, free in-house staff, focus on core activities, talent availability, access to
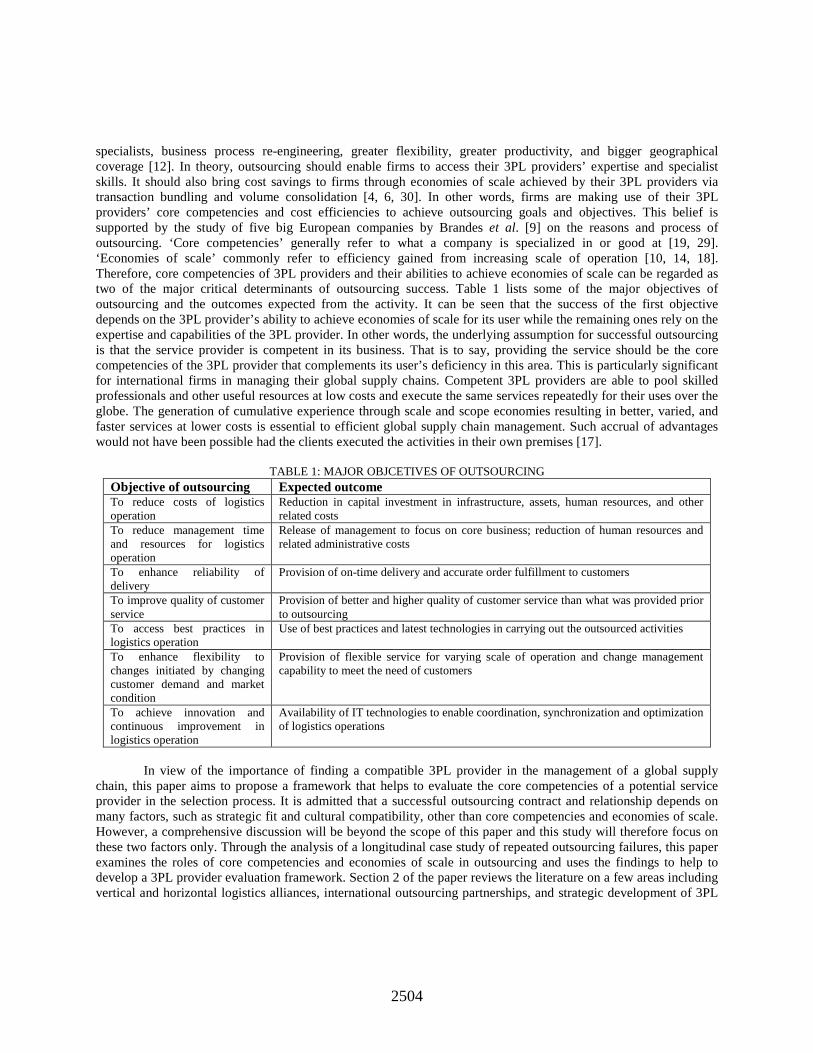
2504
specialists, business process re-engineering, greater flexibility, greater productivity, and bigger geographical coverage [12]. In theory, outsourcing should enable firms to access their 3PL providers’ expertise and specialist skills. It should also bring cost savings to firms through economies of scale achieved by their 3PL providers via transaction bundling and volume consolidation [4, 6, 30]. In other words, firms are making use of their 3PL providers’ core competencies and cost efficiencies to achieve outsourcing goals and objectives. This belief is supported by the study of five big European companies by Brandes et al. [9] on the reasons and process of outsourcing. ‘Core competencies’ generally refer to what a company is specialized in or good at [19, 29]. ‘Economies of scale’ commonly refer to efficiency gained from increasing scale of operation [10, 14, 18]. Therefore, core competencies of 3PL providers and their abilities to achieve economies of scale can be regarded as two of the major critical determinants of outsourcing success. Table 1 lists some of the major objectives of outsourcing and the outcomes expected from the activity. It can be seen that the success of the first objective depends on the 3PL provider’s ability to achieve economies of scale for its user while the remaining ones rely on the expertise and capabilities of the 3PL provider. In other words, the underlying assumption for successful outsourcing is that the service provider is competent in its business. That is to say, providing the service should be the core competencies of the 3PL provider that complements its user’s deficiency in this area. This is particularly significant for international firms in managing their global supply chains. Competent 3PL providers are able to pool skilled professionals and other useful resources at low costs and execute the same services repeatedly for their uses over the globe. The generation of cumulative experience through scale and scope economies resulting in better, varied, and faster services at lower costs is essential to efficient global supply chain management. Such accrual of advantages would not have been possible had the clients executed the activities in their own premises [17].
TABLE 1: MAJOR OBJCETIVES OF OUTSOURCING
In view of the importance of finding a compatible 3PL provider in the management of a global supply
chain, this paper aims to propose a framework that helps to evaluate the core competencies of a potential service provider in the selection process. It is admitted that a successful outsourcing contract and relationship depends on many factors, such as strategic fit and cultural compatibility, other than core competencies and economies of scale. However, a comprehensive discussion will be beyond the scope of this paper and this study will therefore focus on these two factors only. Through the analysis of a longitudinal case study of repeated outsourcing failures, this paper examines the roles of core competencies and economies of scale in outsourcing and uses the findings to help to develop a 3PL provider evaluation framework. Section 2 of the paper reviews the literature on a few areas including vertical and horizontal logistics alliances, international outsourcing partnerships, and strategic development of 3PL
Objective of outsourcing Expected outcome To reduce costs of logistics operation
Reduction in capital investment in infrastructure, assets, human resources, and other related costs
To reduce management time and resources for logistics operation
Release of management to focus on core business; reduction of human resources and related administrative costs
To enhance reliability of delivery
Provision of on-time delivery and accurate order fulfillment to customers
To improve quality of customer service
Provision of better and higher quality of customer service than what was provided prior to outsourcing
To access best practices in logistics operation
Use of best practices and latest technologies in carrying out the outsourced activities
To enhance flexibility to changes initiated by changing customer demand and market condition
Provision of flexible service for varying scale of operation and change management capability to meet the need of customers
To achieve innovation and continuous improvement in logistics operation
Availability of IT technologies to enable coordination, synchronization and optimization of logistics operations
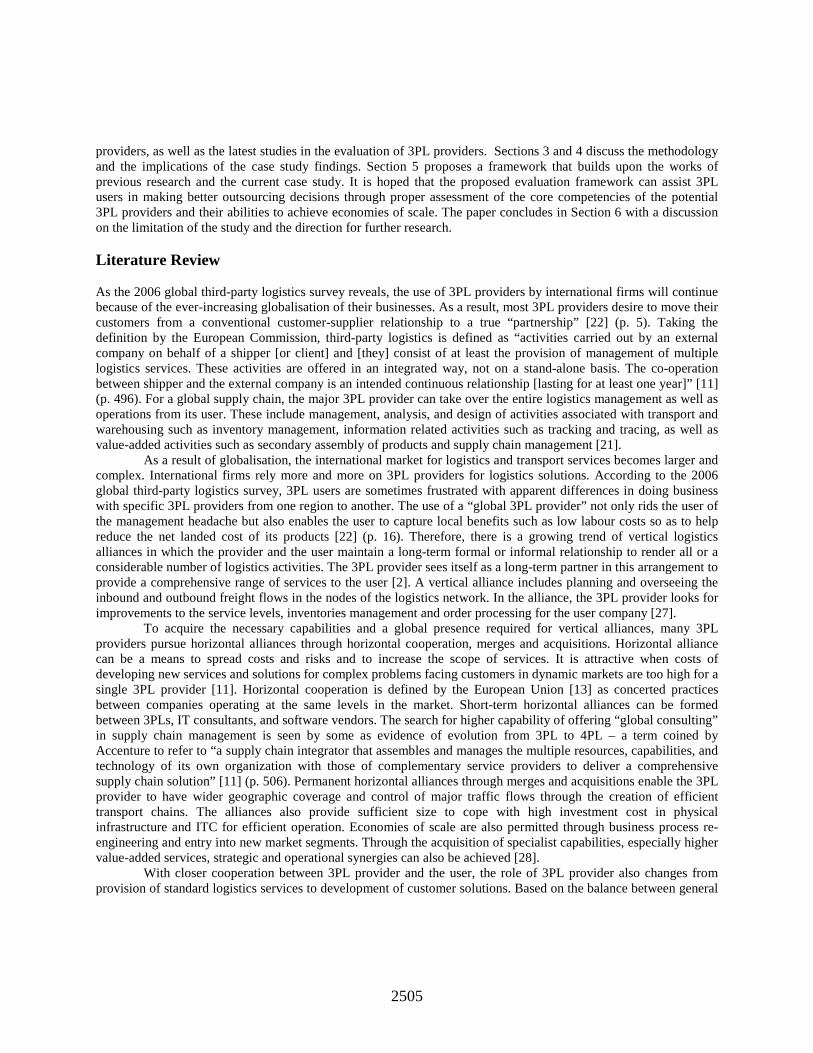
2505
providers, as well as the latest studies in the evaluation of 3PL providers. Sections 3 and 4 discuss the methodology and the implications of the case study findings. Section 5 proposes a framework that builds upon the works of previous research and the current case study. It is hoped that the proposed evaluation framework can assist 3PL users in making better outsourcing decisions through proper assessment of the core competencies of the potential 3PL providers and their abilities to achieve economies of scale. The paper concludes in Section 6 with a discussion on the limitation of the study and the direction for further research. Literature Review As the 2006 global third-party logistics survey reveals, the use of 3PL providers by international firms will continue because of the ever-increasing globalisation of their businesses. As a result, most 3PL providers desire to move their customers from a conventional customer-supplier relationship to a true “partnership” [22] (p. 5). Taking the definition by the European Commission, third-party logistics is defined as “activities carried out by an external company on behalf of a shipper [or client] and [they] consist of at least the provision of management of multiple logistics services. These activities are offered in an integrated way, not on a stand-alone basis. The co-operation between shipper and the external company is an intended continuous relationship [lasting for at least one year]” [11] (p. 496). For a global supply chain, the major 3PL provider can take over the entire logistics management as well as operations from its user. These include management, analysis, and design of activities associated with transport and warehousing such as inventory management, information related activities such as tracking and tracing, as well as value-added activities such as secondary assembly of products and supply chain management [21].
As a result of globalisation, the international market for logistics and transport services becomes larger and complex. International firms rely more and more on 3PL providers for logistics solutions. According to the 2006 global third-party logistics survey, 3PL users are sometimes frustrated with apparent differences in doing business with specific 3PL providers from one region to another. The use of a “global 3PL provider” not only rids the user of the management headache but also enables the user to capture local benefits such as low labour costs so as to help reduce the net landed cost of its products [22] (p. 16). Therefore, there is a growing trend of vertical logistics alliances in which the provider and the user maintain a long-term formal or informal relationship to render all or a considerable number of logistics activities. The 3PL provider sees itself as a long-term partner in this arrangement to provide a comprehensive range of services to the user [2]. A vertical alliance includes planning and overseeing the inbound and outbound freight flows in the nodes of the logistics network. In the alliance, the 3PL provider looks for improvements to the service levels, inventories management and order processing for the user company [27]. To acquire the necessary capabilities and a global presence required for vertical alliances, many 3PL providers pursue horizontal alliances through horizontal cooperation, merges and acquisitions. Horizontal alliance can be a means to spread costs and risks and to increase the scope of services. It is attractive when costs of developing new services and solutions for complex problems facing customers in dynamic markets are too high for a single 3PL provider [11]. Horizontal cooperation is defined by the European Union [13] as concerted practices between companies operating at the same levels in the market. Short-term horizontal alliances can be formed between 3PLs, IT consultants, and software vendors. The search for higher capability of offering “global consulting” in supply chain management is seen by some as evidence of evolution from 3PL to 4PL – a term coined by Accenture to refer to “a supply chain integrator that assembles and manages the multiple resources, capabilities, and technology of its own organization with those of complementary service providers to deliver a comprehensive supply chain solution” [11] (p. 506). Permanent horizontal alliances through merges and acquisitions enable the 3PL provider to have wider geographic coverage and control of major traffic flows through the creation of efficient transport chains. The alliances also provide sufficient size to cope with high investment cost in physical infrastructure and ITC for efficient operation. Economies of scale are also permitted through business process re-engineering and entry into new market segments. Through the acquisition of specialist capabilities, especially higher value-added services, strategic and operational synergies can also be achieved [28]. With closer cooperation between 3PL provider and the user, the role of 3PL provider also changes from provision of standard logistics services to development of customer solutions. Based on the balance between general
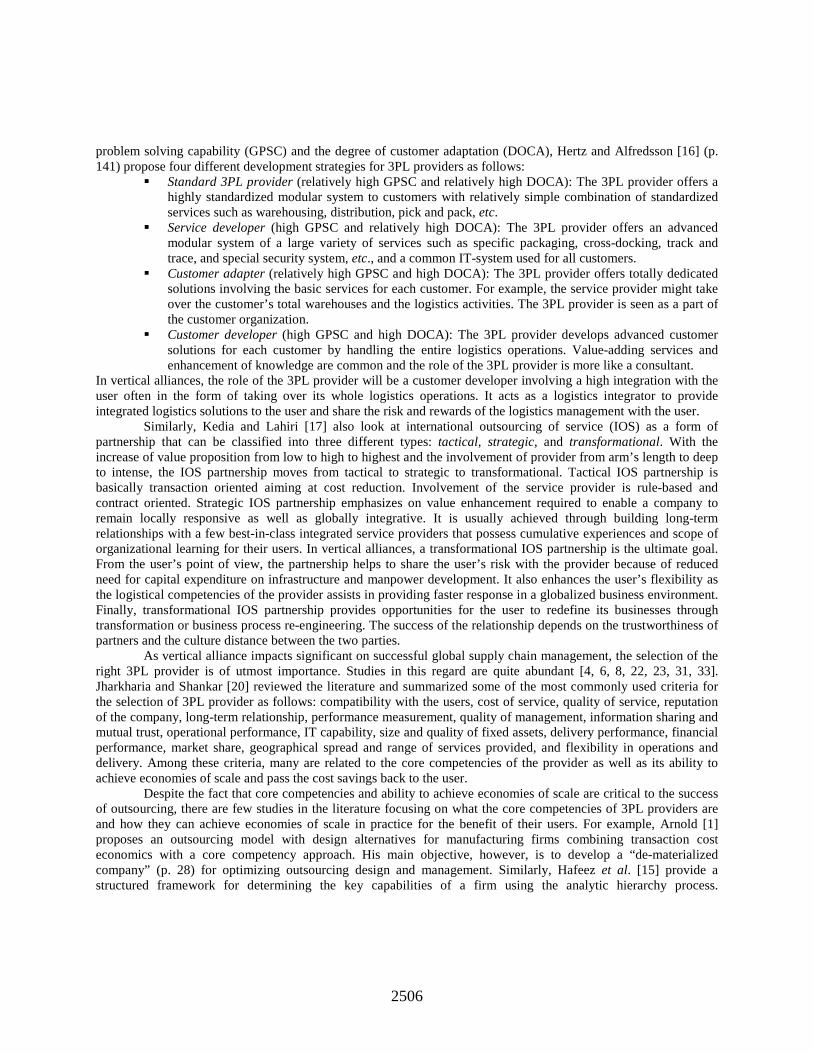
2506
problem solving capability (GPSC) and the degree of customer adaptation (DOCA), Hertz and Alfredsson [16] (p. 141) propose four different development strategies for 3PL providers as follows:
� Standard 3PL provider (relatively high GPSC and relatively high DOCA): The 3PL provider offers a highly standardized modular system to customers with relatively simple combination of standardized services such as warehousing, distribution, pick and pack, etc.
� Service developer (high GPSC and relatively high DOCA): The 3PL provider offers an advanced modular system of a large variety of services such as specific packaging, cross-docking, track and trace, and special security system, etc., and a common IT-system used for all customers.
� Customer adapter (relatively high GPSC and high DOCA): The 3PL provider offers totally dedicated solutions involving the basic services for each customer. For example, the service provider might take over the customer’s total warehouses and the logistics activities. The 3PL provider is seen as a part of the customer organization.
� Customer developer (high GPSC and high DOCA): The 3PL provider develops advanced customer solutions for each customer by handling the entire logistics operations. Value-adding services and enhancement of knowledge are common and the role of the 3PL provider is more like a consultant.
In vertical alliances, the role of the 3PL provider will be a customer developer involving a high integration with the user often in the form of taking over its whole logistics operations. It acts as a logistics integrator to provide integrated logistics solutions to the user and share the risk and rewards of the logistics management with the user. Similarly, Kedia and Lahiri [17] also look at international outsourcing of service (IOS) as a form of partnership that can be classified into three different types: tactical, strategic, and transformational. With the increase of value proposition from low to high to highest and the involvement of provider from arm’s length to deep to intense, the IOS partnership moves from tactical to strategic to transformational. Tactical IOS partnership is basically transaction oriented aiming at cost reduction. Involvement of the service provider is rule-based and contract oriented. Strategic IOS partnership emphasizes on value enhancement required to enable a company to remain locally responsive as well as globally integrative. It is usually achieved through building long-term relationships with a few best-in-class integrated service providers that possess cumulative experiences and scope of organizational learning for their users. In vertical alliances, a transformational IOS partnership is the ultimate goal. From the user’s point of view, the partnership helps to share the user’s risk with the provider because of reduced need for capital expenditure on infrastructure and manpower development. It also enhances the user’s flexibility as the logistical competencies of the provider assists in providing faster response in a globalized business environment. Finally, transformational IOS partnership provides opportunities for the user to redefine its businesses through transformation or business process re-engineering. The success of the relationship depends on the trustworthiness of partners and the culture distance between the two parties.
As vertical alliance impacts significant on successful global supply chain management, the selection of the right 3PL provider is of utmost importance. Studies in this regard are quite abundant [4, 6, 8, 22, 23, 31, 33]. Jharkharia and Shankar [20] reviewed the literature and summarized some of the most commonly used criteria for the selection of 3PL provider as follows: compatibility with the users, cost of service, quality of service, reputation of the company, long-term relationship, performance measurement, quality of management, information sharing and mutual trust, operational performance, IT capability, size and quality of fixed assets, delivery performance, financial performance, market share, geographical spread and range of services provided, and flexibility in operations and delivery. Among these criteria, many are related to the core competencies of the provider as well as its ability to achieve economies of scale and pass the cost savings back to the user.
Despite the fact that core competencies and ability to achieve economies of scale are critical to the success of outsourcing, there are few studies in the literature focusing on what the core competencies of 3PL providers are and how they can achieve economies of scale in practice for the benefit of their users. For example, Arnold [1] proposes an outsourcing model with design alternatives for manufacturing firms combining transaction cost economics with a core competency approach. His main objective, however, is to develop a “de-materialized company” (p. 28) for optimizing outsourcing design and management. Similarly, Hafeez et al. [15] provide a structured framework for determining the key capabilities of a firm using the analytic hierarchy process.
2507
Nevertheless, the framework is used mainly for identifying competency gaps within the firm with a view that the result might facilitate the making of outsourcing decisions.
Momme [24] proposes a framework for outsourcing manufacturing in which competence analysis is the first of the six phases outlined. However, the analysis focuses more on identifying the client’s own core activities than that of the supplier’s. It appears that there is little attempt to explore the core competencies of the supplier, which are supposed to complement the client’s non-core business skills. Also, the issue of economies of scale has not been addressed in the proposed framework. It has yet to be proven that economies of scale achieved by the supplier, if any, would bring cost savings to its client. Similarly, Vaidyanathan [34] recommends a framework to establish a set of criteria for the selection of 3PL provider using IT as the focus to peruse the core functionalities of 3PL provider such as inventory management, transportation, and warehousing. Nonetheless, core competencies and economies of scale are again not the centerpiece of discussion. In view of the above inadequacy, this research aims to fulfil the existing gap by evaluating and assessing the significance of the two foregoing critical factors in their contribution to the success of the logistics service outsourcing. Methodology This research is founded on a longitudinal case study of the outsourcing experiences of a global company focusing on the service providers’ core competencies and abilities to achieve economies of scale. In general, case studies are less vigorous than empirical studies. Furthermore, because of the use of small sample, the case study approach also faces a limitation in generalizing the findings to reflect the situation of the whole industry. Nevertheless, the approach is suitable for exploratory and explanatory research like the one described in this paper to provide a preliminary in-depth investigation of a problem [5, 35, 38]. The intention is not to generalize the findings but to use them to better understand the crux of a problem and to propose recommendations for solution as well as directions for further research.
The case in this study is a global company providing information services to clients all over the world. As the core activity of the company is information gathering and dissemination, it relies on outsourcing to handle its non-core activities such as logistics operations. Between 1989 and 1999, the company changed three 3PL providers. Through the logistics manager of the company who oversaw the entire outsourcing process and managed the three 3PL providers during the period, detailed first-hand information about the case was collected for analysis which helps to determine if core competencies of the 3PL providers and any achievement of economies of scale existed. The information comes from the company’s outsourcing analysis reports, proposals submitted by the 3PL providers for the outsourcing contracts, performance records of the 3PL providers during their respective contract periods, cost figures and other statistics provided by the 3PL providers, and performance evaluation reports at the end of the contract periods.
To facilitate analysis, an ideal situation of outsourcing, i.e., the 3PL provider being a customer developer [16] and the outsourcing relationship being transformational [17], is used as a basis for comparison to gauge the performance of the three 3PL providers in the case. It is assumed that logistics functions such as transportation, inventory management; capacity planning, etc. should be coordinated and managed by the 3PL provider with logistical competency. Information and material flows should be streamlined and integrated by the 3PL provider to achieve economies of scale through consolidation of transactional and physical movement activities. Furthermore, the 3PL providers should be able to develop unique customer solutions and redefine business processes for its user through transformation or business process re-engineering so as to help its user to gain efficiency and cost effectiveness. Through the comparison, it can be established whether core competencies of the 3PL providers and their abilities to achieve economies of scale for user existed.
The parties involved in the case study are the user company X and its three logistics service providers (A, B, and C). For reason of commercial confidentiality, pseudonymous names are used. X is a leading international information service provider supplying news and financial information to its clients worldwide. The company installs computers and terminals at clients’ premises to provide the subscribed data and information. With regional headquarters set up in Singapore, X has outsourced its logistics operations to freight forwarders since 1989. In the
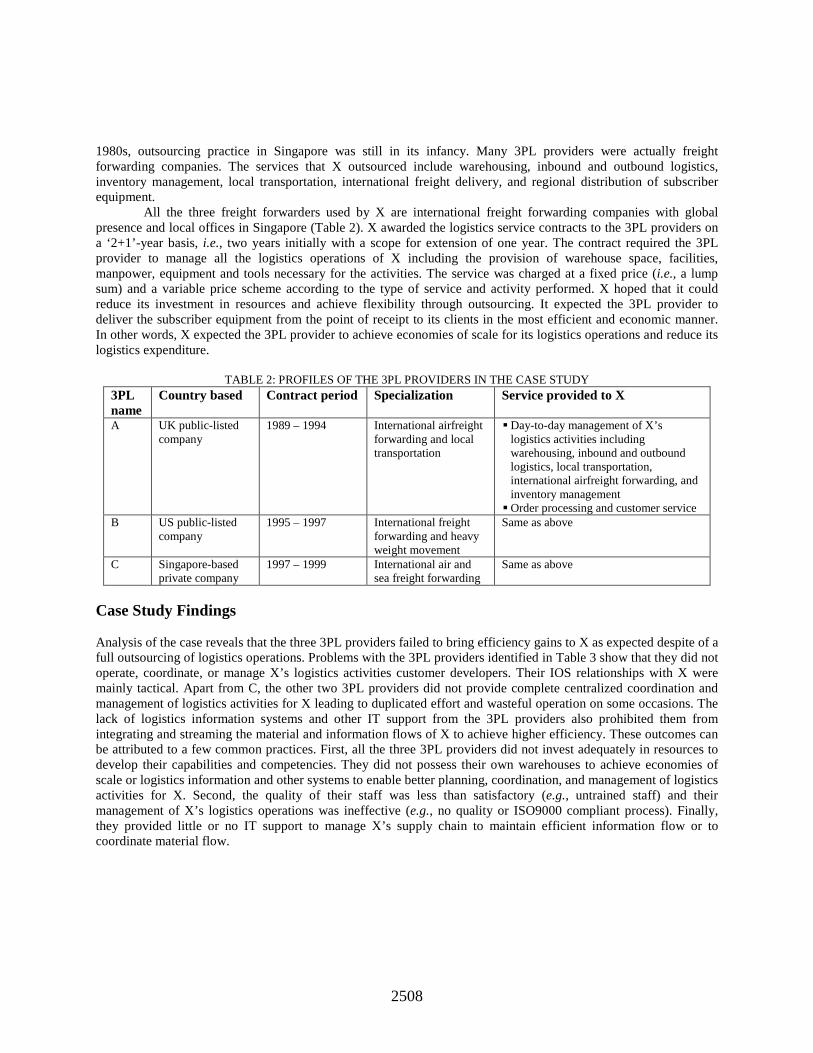
2508
1980s, outsourcing practice in Singapore was still in its infancy. Many 3PL providers were actually freight forwarding companies. The services that X outsourced include warehousing, inbound and outbound logistics, inventory management, local transportation, international freight delivery, and regional distribution of subscriber equipment.
All the three freight forwarders used by X are international freight forwarding companies with global presence and local offices in Singapore (Table 2). X awarded the logistics service contracts to the 3PL providers on a ‘2+1’-year basis, i.e., two years initially with a scope for extension of one year. The contract required the 3PL provider to manage all the logistics operations of X including the provision of warehouse space, facilities, manpower, equipment and tools necessary for the activities. The service was charged at a fixed price (i.e., a lump sum) and a variable price scheme according to the type of service and activity performed. X hoped that it could reduce its investment in resources and achieve flexibility through outsourcing. It expected the 3PL provider to deliver the subscriber equipment from the point of receipt to its clients in the most efficient and economic manner. In other words, X expected the 3PL provider to achieve economies of scale for its logistics operations and reduce its logistics expenditure.
TABLE 2: PROFILES OF THE 3PL PROVIDERS IN THE CASE STUDY 3PL name
Country based Contract period Specialization Service provided to X
A UK public-listed company
1989 – 1994 International airfreight forwarding and local transportation
� Day-to-day management of X’s logistics activities including warehousing, inbound and outbound logistics, local transportation, international airfreight forwarding, and inventory management
� Order processing and customer service B US public-listed
company 1995 – 1997 International freight
forwarding and heavy weight movement
Same as above
C Singapore-based private company
1997 – 1999 International air and sea freight forwarding
Same as above
Case Study Findings Analysis of the case reveals that the three 3PL providers failed to bring efficiency gains to X as expected despite of a full outsourcing of logistics operations. Problems with the 3PL providers identified in Table 3 show that they did not operate, coordinate, or manage X’s logistics activities customer developers. Their IOS relationships with X were mainly tactical. Apart from C, the other two 3PL providers did not provide complete centralized coordination and management of logistics activities for X leading to duplicated effort and wasteful operation on some occasions. The lack of logistics information systems and other IT support from the 3PL providers also prohibited them from integrating and streaming the material and information flows of X to achieve higher efficiency. These outcomes can be attributed to a few common practices. First, all the three 3PL providers did not invest adequately in resources to develop their capabilities and competencies. They did not possess their own warehouses to achieve economies of scale or logistics information and other systems to enable better planning, coordination, and management of logistics activities for X. Second, the quality of their staff was less than satisfactory (e.g., untrained staff) and their management of X’s logistics operations was ineffective (e.g., no quality or ISO9000 compliant process). Finally, they provided little or no IT support to manage X’s supply chain to maintain efficient information flow or to coordinate material flow.
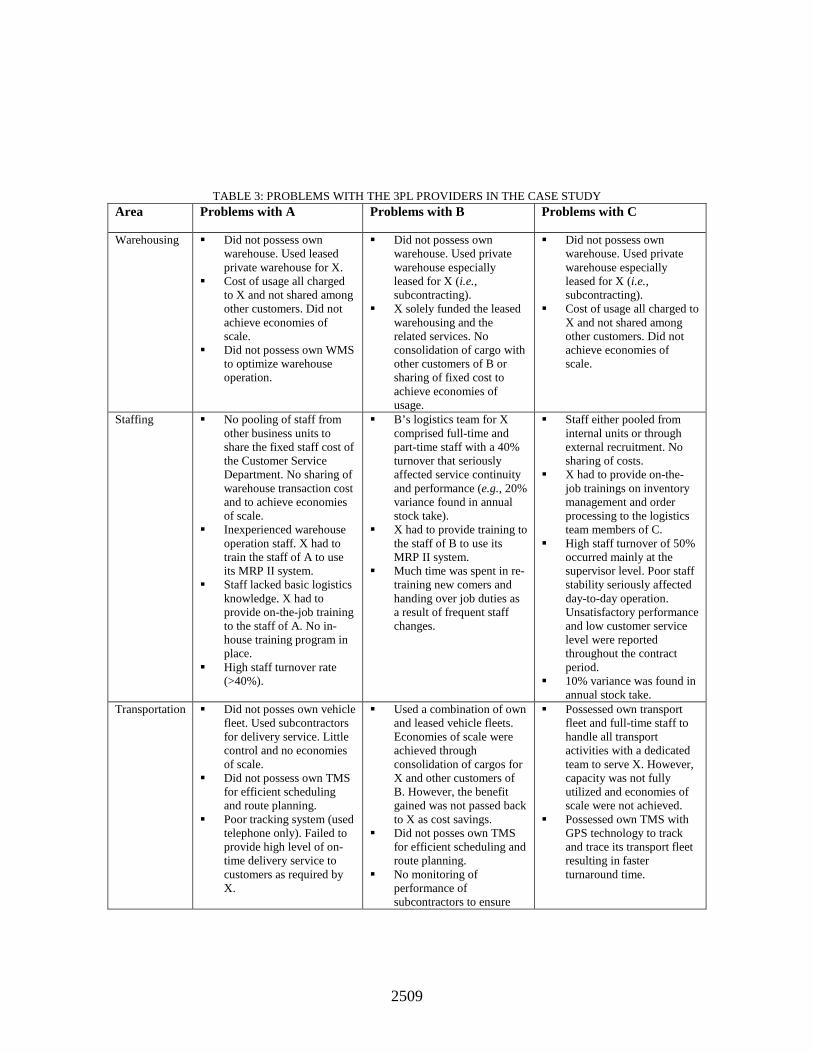
2509
TABLE 3: PROBLEMS WITH THE 3PL PROVIDERS IN THE CASE STUDY Area Problems with A Problems with B Problems with C
Warehousing � Did not possess own warehouse. Used leased private warehouse for X.
� Cost of usage all charged to X and not shared among other customers. Did not achieve economies of scale.
� Did not possess own WMS to optimize warehouse operation.
� Did not possess own warehouse. Used private warehouse especially leased for X (i.e., subcontracting).
� X solely funded the leased warehousing and the related services. No consolidation of cargo with other customers of B or sharing of fixed cost to achieve economies of usage.
� Did not possess own warehouse. Used private warehouse especially leased for X (i.e., subcontracting).
� Cost of usage all charged to X and not shared among other customers. Did not achieve economies of scale.
Staffing � No pooling of staff from other business units to share the fixed staff cost of the Customer Service Department. No sharing of warehouse transaction cost and to achieve economies of scale.
� Inexperienced warehouse operation staff. X had to train the staff of A to use its MRP II system.
� Staff lacked basic logistics knowledge. X had to provide on-the-job training to the staff of A. No in-house training program in place.
� High staff turnover rate (>40%).
� B’s logistics team for X comprised full-time and part-time staff with a 40% turnover that seriously affected service continuity and performance (e.g., 20% variance found in annual stock take).
� X had to provide training to the staff of B to use its MRP II system.
� Much time was spent in re-training new comers and handing over job duties as a result of frequent staff changes.
� Staff either pooled from internal units or through external recruitment. No sharing of costs.
� X had to provide on-the-job trainings on inventory management and order processing to the logistics team members of C.
� High staff turnover of 50% occurred mainly at the supervisor level. Poor staff stability seriously affected day-to-day operation. Unsatisfactory performance and low customer service level were reported throughout the contract period.
� 10% variance was found in annual stock take.
Transportation � Did not posses own vehicle fleet. Used subcontractors for delivery service. Little control and no economies of scale.
� Did not possess own TMS for efficient scheduling and route planning.
� Poor tracking system (used telephone only). Failed to provide high level of on-time delivery service to customers as required by X.
� Used a combination of own and leased vehicle fleets. Economies of scale were achieved through consolidation of cargos for X and other customers of B. However, the benefit gained was not passed back to X as cost savings.
� Did not posses own TMS for efficient scheduling and route planning.
� No monitoring of performance of subcontractors to ensure
� Possessed own transport fleet and full-time staff to handle all transport activities with a dedicated team to serve X. However, capacity was not fully utilized and economies of scale were not achieved.
� Possessed own TMS with GPS technology to track and trace its transport fleet resulting in faster turnaround time.
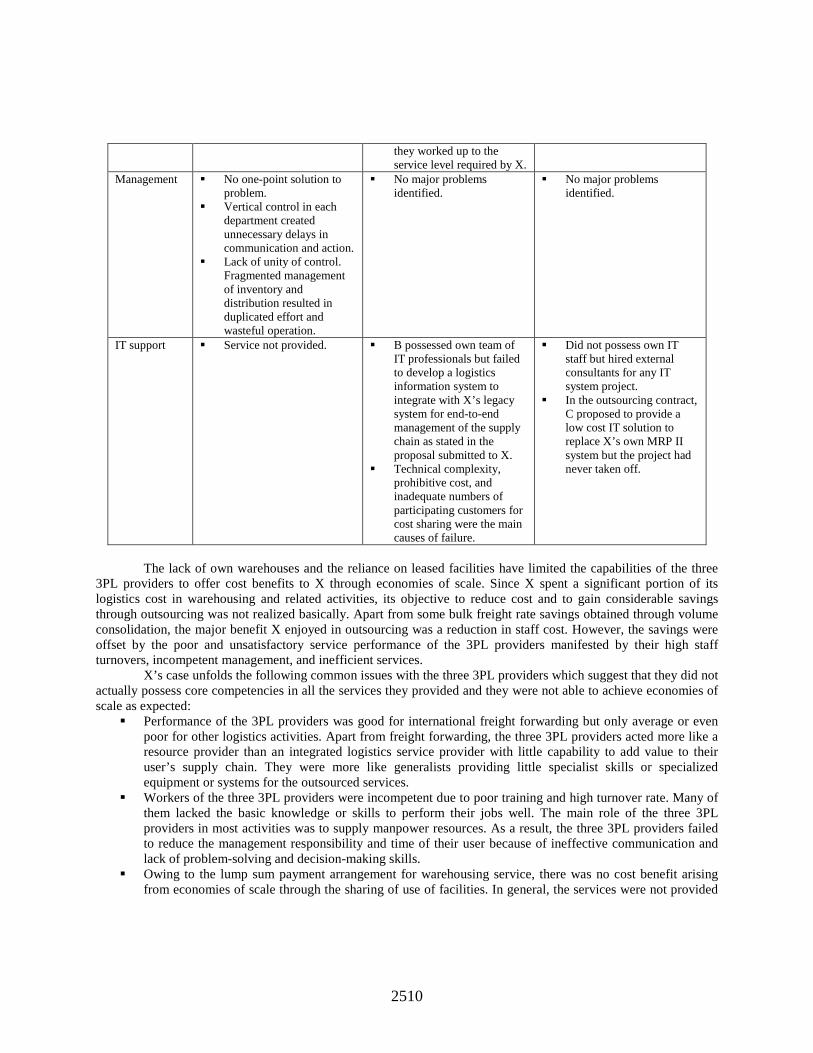
2510
they worked up to the service level required by X.
Management � No one-point solution to problem.
� Vertical control in each department created unnecessary delays in communication and action.
� Lack of unity of control. Fragmented management of inventory and distribution resulted in duplicated effort and wasteful operation.
� No major problems identified.
� No major problems identified.
IT support � Service not provided. � B possessed own team of IT professionals but failed to develop a logistics information system to integrate with X’s legacy system for end-to-end management of the supply chain as stated in the proposal submitted to X.
� Technical complexity, prohibitive cost, and inadequate numbers of participating customers for cost sharing were the main causes of failure.
� Did not possess own IT staff but hired external consultants for any IT system project.
� In the outsourcing contract, C proposed to provide a low cost IT solution to replace X’s own MRP II system but the project had never taken off.
The lack of own warehouses and the reliance on leased facilities have limited the capabilities of the three
3PL providers to offer cost benefits to X through economies of scale. Since X spent a significant portion of its logistics cost in warehousing and related activities, its objective to reduce cost and to gain considerable savings through outsourcing was not realized basically. Apart from some bulk freight rate savings obtained through volume consolidation, the major benefit X enjoyed in outsourcing was a reduction in staff cost. However, the savings were offset by the poor and unsatisfactory service performance of the 3PL providers manifested by their high staff turnovers, incompetent management, and inefficient services.
X’s case unfolds the following common issues with the three 3PL providers which suggest that they did not actually possess core competencies in all the services they provided and they were not able to achieve economies of scale as expected:
� Performance of the 3PL providers was good for international freight forwarding but only average or even poor for other logistics activities. Apart from freight forwarding, the three 3PL providers acted more like a resource provider than an integrated logistics service provider with little capability to add value to their user’s supply chain. They were more like generalists providing little specialist skills or specialized equipment or systems for the outsourced services.
� Workers of the three 3PL providers were incompetent due to poor training and high turnover rate. Many of them lacked the basic knowledge or skills to perform their jobs well. The main role of the three 3PL providers in most activities was to supply manpower resources. As a result, the three 3PL providers failed to reduce the management responsibility and time of their user because of ineffective communication and lack of problem-solving and decision-making skills.
� Owing to the lump sum payment arrangement for warehousing service, there was no cost benefit arising from economies of scale through the sharing of use of facilities. In general, the services were not provided
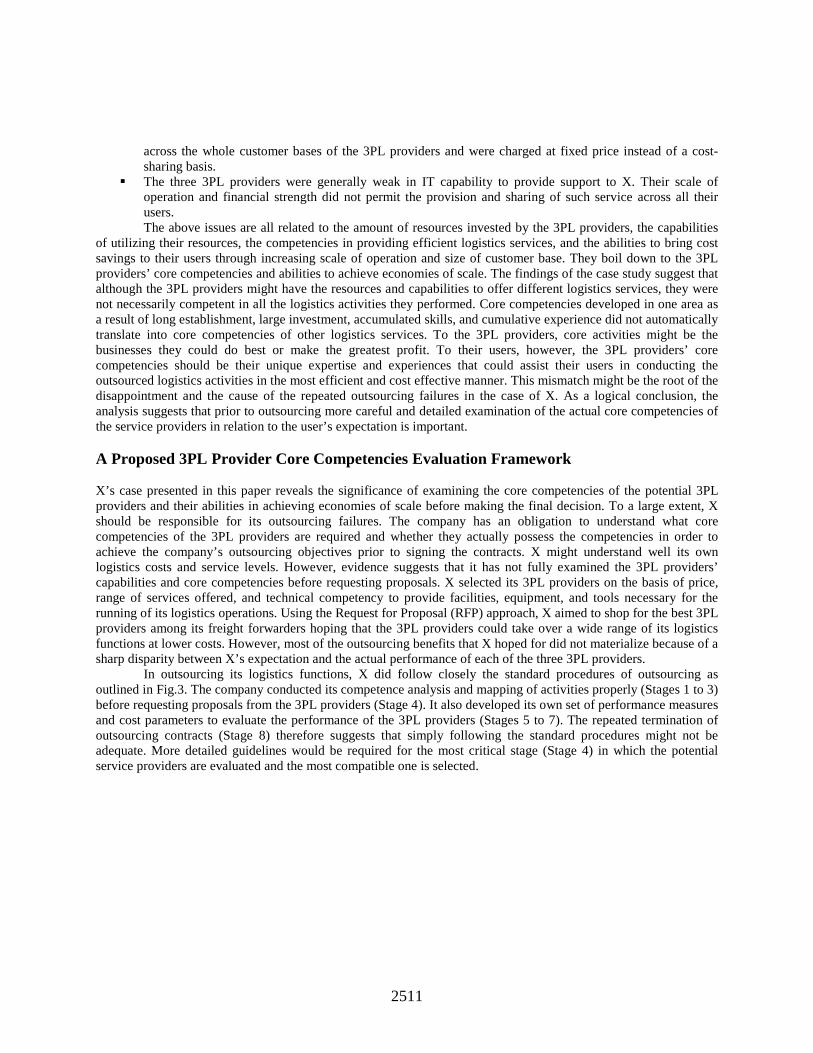
2511
across the whole customer bases of the 3PL providers and were charged at fixed price instead of a cost-sharing basis.
� The three 3PL providers were generally weak in IT capability to provide support to X. Their scale of operation and financial strength did not permit the provision and sharing of such service across all their users. The above issues are all related to the amount of resources invested by the 3PL providers, the capabilities
of utilizing their resources, the competencies in providing efficient logistics services, and the abilities to bring cost savings to their users through increasing scale of operation and size of customer base. They boil down to the 3PL providers’ core competencies and abilities to achieve economies of scale. The findings of the case study suggest that although the 3PL providers might have the resources and capabilities to offer different logistics services, they were not necessarily competent in all the logistics activities they performed. Core competencies developed in one area as a result of long establishment, large investment, accumulated skills, and cumulative experience did not automatically translate into core competencies of other logistics services. To the 3PL providers, core activities might be the businesses they could do best or make the greatest profit. To their users, however, the 3PL providers’ core competencies should be their unique expertise and experiences that could assist their users in conducting the outsourced logistics activities in the most efficient and cost effective manner. This mismatch might be the root of the disappointment and the cause of the repeated outsourcing failures in the case of X. As a logical conclusion, the analysis suggests that prior to outsourcing more careful and detailed examination of the actual core competencies of the service providers in relation to the user’s expectation is important. A Proposed 3PL Provider Core Competencies Evaluation Framework X’s case presented in this paper reveals the significance of examining the core competencies of the potential 3PL providers and their abilities in achieving economies of scale before making the final decision. To a large extent, X should be responsible for its outsourcing failures. The company has an obligation to understand what core competencies of the 3PL providers are required and whether they actually possess the competencies in order to achieve the company’s outsourcing objectives prior to signing the contracts. X might understand well its own logistics costs and service levels. However, evidence suggests that it has not fully examined the 3PL providers’ capabilities and core competencies before requesting proposals. X selected its 3PL providers on the basis of price, range of services offered, and technical competency to provide facilities, equipment, and tools necessary for the running of its logistics operations. Using the Request for Proposal (RFP) approach, X aimed to shop for the best 3PL providers among its freight forwarders hoping that the 3PL providers could take over a wide range of its logistics functions at lower costs. However, most of the outsourcing benefits that X hoped for did not materialize because of a sharp disparity between X’s expectation and the actual performance of each of the three 3PL providers.
In outsourcing its logistics functions, X did follow closely the standard procedures of outsourcing as outlined in Fig.3. The company conducted its competence analysis and mapping of activities properly (Stages 1 to 3) before requesting proposals from the 3PL providers (Stage 4). It also developed its own set of performance measures and cost parameters to evaluate the performance of the 3PL providers (Stages 5 to 7). The repeated termination of outsourcing contracts (Stage 8) therefore suggests that simply following the standard procedures might not be adequate. More detailed guidelines would be required for the most critical stage (Stage 4) in which the potential service providers are evaluated and the most compatible one is selected.
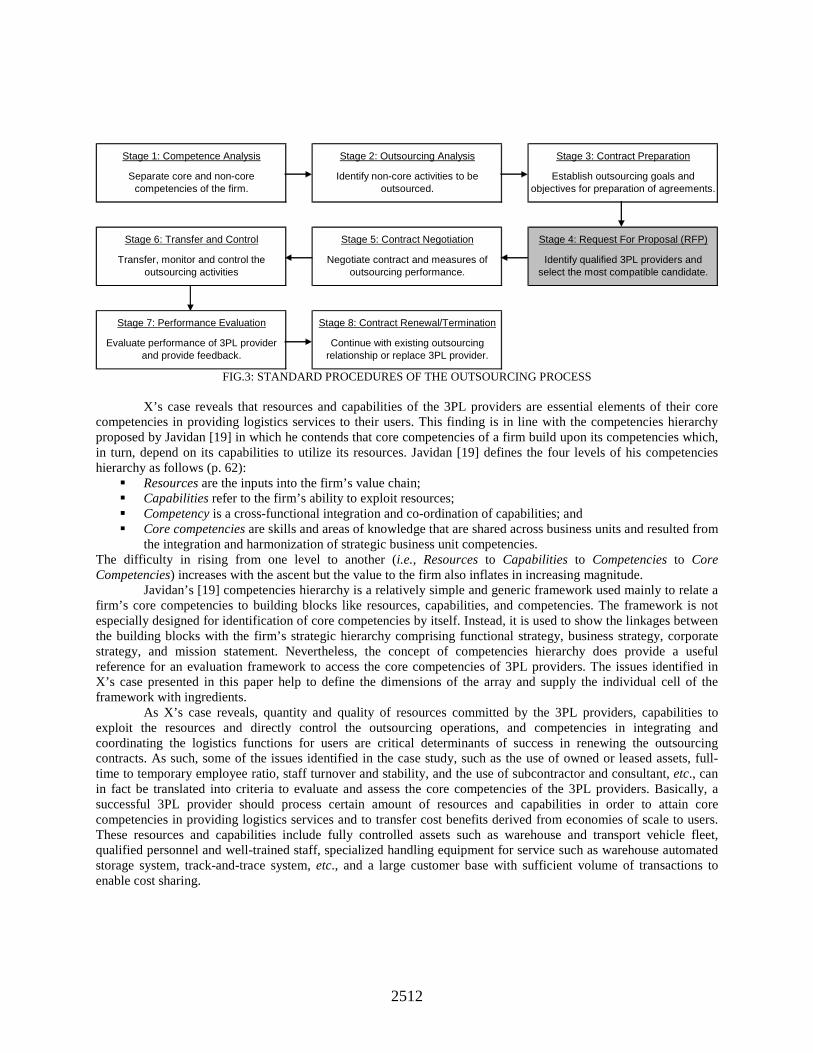
2512
Stage 1: Competence Analysis Stage 2: Outsourcing Analysis Stage 3: Contract Preparation
Separate core and non-core competencies of the firm.
Identify non-core activities to be outsourced.
Establish outsourcing goals and objectives for preparation of agreements.
Stage 6: Transfer and Control Stage 5: Contract Negotiation Stage 4: Request For Proposal (RFP)
Transfer, monitor and control the outsourcing activities
Negotiate contract and measures of outsourcing performance.
Identify qualified 3PL providers and select the most compatible candidate.
Stage 7: Performance Evaluation Stage 8: Contract Renewal/Termination
Evaluate performance of 3PL provider and provide feedback.
Continue with existing outsourcing relationship or replace 3PL provider.
FIG.3: STANDARD PROCEDURES OF THE OUTSOURCING PROCESS
X’s case reveals that resources and capabilities of the 3PL providers are essential elements of their core
competencies in providing logistics services to their users. This finding is in line with the competencies hierarchy proposed by Javidan [19] in which he contends that core competencies of a firm build upon its competencies which, in turn, depend on its capabilities to utilize its resources. Javidan [19] defines the four levels of his competencies hierarchy as follows (p. 62):
� Resources are the inputs into the firm’s value chain; � Capabilities refer to the firm’s ability to exploit resources; � Competency is a cross-functional integration and co-ordination of capabilities; and � Core competencies are skills and areas of knowledge that are shared across business units and resulted from
the integration and harmonization of strategic business unit competencies. The difficulty in rising from one level to another (i.e., Resources to Capabilities to Competencies to Core Competencies) increases with the ascent but the value to the firm also inflates in increasing magnitude.
Javidan’s [19] competencies hierarchy is a relatively simple and generic framework used mainly to relate a firm’s core competencies to building blocks like resources, capabilities, and competencies. The framework is not especially designed for identification of core competencies by itself. Instead, it is used to show the linkages between the building blocks with the firm’s strategic hierarchy comprising functional strategy, business strategy, corporate strategy, and mission statement. Nevertheless, the concept of competencies hierarchy does provide a useful reference for an evaluation framework to access the core competencies of 3PL providers. The issues identified in X’s case presented in this paper help to define the dimensions of the array and supply the individual cell of the framework with ingredients.
As X’s case reveals, quantity and quality of resources committed by the 3PL providers, capabilities to exploit the resources and directly control the outsourcing operations, and competencies in integrating and coordinating the logistics functions for users are critical determinants of success in renewing the outsourcing contracts. As such, some of the issues identified in the case study, such as the use of owned or leased assets, full-time to temporary employee ratio, staff turnover and stability, and the use of subcontractor and consultant, etc., can in fact be translated into criteria to evaluate and assess the core competencies of the 3PL providers. Basically, a successful 3PL provider should process certain amount of resources and capabilities in order to attain core competencies in providing logistics services and to transfer cost benefits derived from economies of scale to users. These resources and capabilities include fully controlled assets such as warehouse and transport vehicle fleet, qualified personnel and well-trained staff, specialized handling equipment for service such as warehouse automated storage system, track-and-trace system, etc., and a large customer base with sufficient volume of transactions to enable cost sharing.
2513
Based on the above discussion, this paper proposes a 3PL provider core competencies evaluation framework as shown in Fig.4. The framework makes use of the findings of the case study to develop a list of evaluation items grouped under ‘resources’, ‘capabilities’ and ‘processes’ – the building blocks of core competencies – and use them to examine if the 3PL provider’s core competencies are present. The ‘processes’ building block in the proposed evaluation framework is akin to the ‘competency’ building block in Javidan’s [19] competencies hierarchy. While ‘competency’ in Javidan’s [19] hierarchy refers to a cross-functional integration and coordination of capabilities (p. 62), the ‘processes’ building block in the proposed evaluation framework focuses on the availability of processes that show the presence of certain capabilities of the 3PL provider. The proposed framework is not meant to replace any existing 3PL provider evaluation models such as the ones proposed by Momme and Hvolby [25] and Vaidyanathan [34]. In making outsourcing decisions, there are many factors such as cost, quality, service, and performance to consider and different aspects such as strategic fit, compatibility of organization culture, and financial stability to look at other than core competencies and ability to achieve economies of scale [4, 34]. Therefore, the proposed framework only attempts to supplement the evaluation process upon the completion of the normal assessment procedure in the RFP stage.
In using the proposed framework to evaluate the available resources of a 3PL provider, it is recommended that staff qualification, staff turnover and stability, ratio of full-time to temporary staff, percentage of assets owned or leased, etc. should be examined. Similarly, to evaluate the service provider’s capabilities, it is necessary to consider whether the 3PL provider has IT capabilities developed in-house or by consultants, whether logistics is truly its core business or just the main source of revenue, and whether the 3PL provider is a recognized leader in the industry, etc. To evaluate the 3PL provider’s ability to achieve economies scale and to pass the benefits back to its users, the presence of flexible price models should be examined. Scale of operation and size of customer base usually affect a 3PL provider’s ability to help its user to cut cost through economies of scale. Although cost savings can be achieved through multiple offering of services to different users, order consolidation hence volume discount, and sharing of usage of resources and assets, users will not be benefited if the costs of usage of facilities are not shared across the 3PL provider’s customer base. Therefore, the availability of variable price models that permit the spreading of fixed costs across multiple users forms another evaluation criterion under the proposed framework.
It is believed that the categorical item-by-item evaluation under the proposed framework should help to identify the 3PL provider as a resource owner or a resource provider, a specialist or a generalist, and a problem solver or only a process provider. This will enable the 3PL user firm to better understand what outsourcing relationship (i.e., tactical, strategic, or transformational) and what role the 3PL provider will play in the outsourced activities (i.e., a standard 3PL provider, a service developer, a customer adaptor, or a customer developer). The categorization also helps to determine the strengths and weaknesses of the 3PL provider in terms of its investment in resources and innovation, proven skills and knowledge, and ability to coordinate and integrate logistics processes. This will facilitate the 3PL user firm in checking whether the 3PL provider has the capabilities and competencies to actually meet its user’s outsourcing needs as well as the cumulative experience and scope for organizational learning that are necessary for forming vertical logistics alliance. Despite the fact that logistics is usually not the core business of 3PL user firms, the step-by-step approach proposed in the framework should enable the recognition of the 3PL provider’s core competencies in a more systematic and objective manner. By applying the proposed evaluation framework in the RFP stage together with other evaluation processes to all the potential 3PL providers, the outsourcing firm would be able to determine which 3PL provider could help the company to achieve its outsourcing goals and objectives and provide the best scope for long-term transformational IOS partnership through vertical logistics alliance.
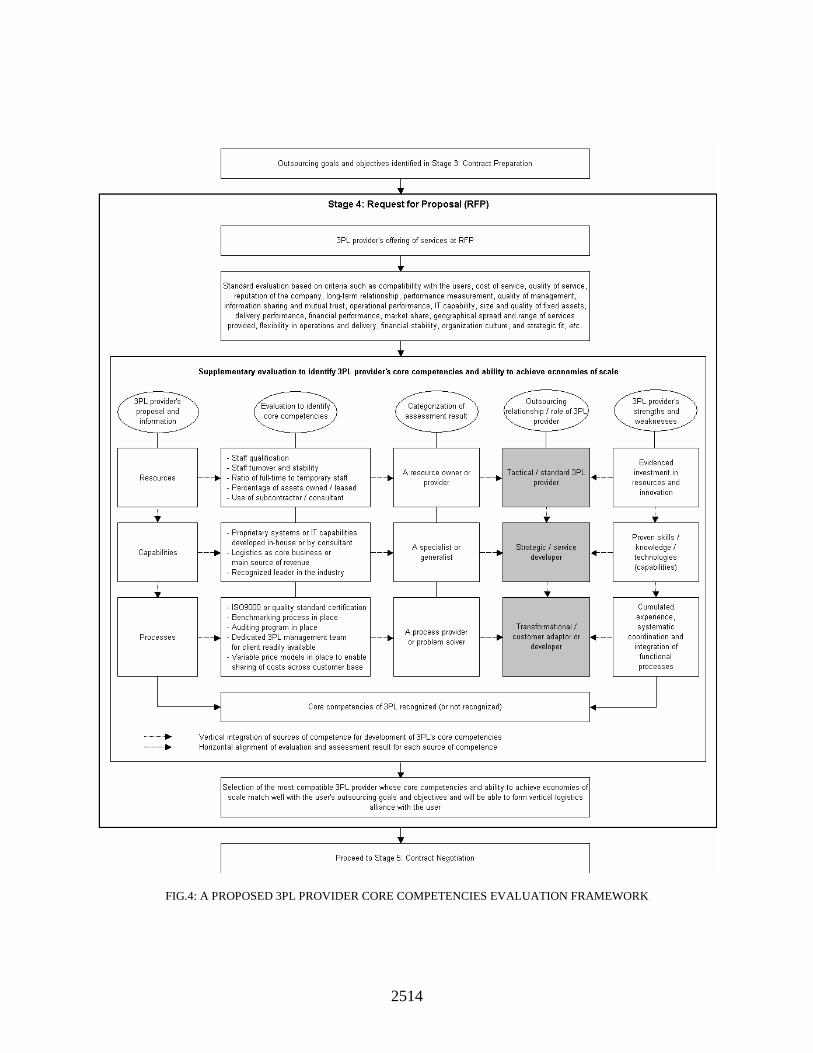
2514
FIG.4: A PROPOSED 3PL PROVIDER CORE COMPETENCIES EVALUATION FRAMEWORK
2515
Conclusion This paper argues that ‘core competencies’ and ‘economies of scale’ are two critical factors, among others, that contribute to the success or failure of outsourcing which is paramount to modern-day global supply chain management. Core competencies of a 3PL provider build on the amount of resources it possesses, its capabilities to fully exploit these resources, and its competencies in utilizing the capabilities to provide efficient and cost effective integrated logistics services to users.
The proposed evaluation framework presented in this paper can assist outsourcing firms to assess the core competencies of potential 3PL providers in the RFP stage. The framework is meant to supplement the standard evaluation process instead of replacing any procedure. It provides a systematic method to determine if core competencies of a 3PL provider are present and whether they match with the firm’s outsourcing needs. Through a categorical item-by-item evaluation process, the framework could assist outsourcing firms in determining what outsourcing relationship would be formed and what role the 3PL provider would play in the partnership. The evaluation would not only help to determine whether the 3PL provider could achieve the outsourcing goals and objectives of its user but also reveal if there is scope for vertical logistics alliance that is critical for successful global supply chain management.
As this study involves only one case with three 3PL providers, the findings might not be entirely representative although they have helped to establish parameters for the proposed evaluation framework. To fully investigate the impact of core competencies and economies of scale on outsourcing success, more studies are needed to explore the current practices of 3PL providers in different industries and regions for comparison. This might be incorporated into annual global outsourcing surveys like the one currently conducted by Georgia Institute of Technology, Cap Gemini LLC, SAP, and DHL [22]. The findings would be useful in improving the proposed evaluation framework to extend its applicability to the practitioner community.
References [1] Arnold, U. (2000). New dimensions of outsourcing: a combination of transaction cost economics and the
core competencies concept. European Journal of Purchasing & Supply Chain Management, 6, 23-29 [2] Bagchi, P.K., & Virum, H. (1998). Logistical alliances: trends and prospects in integrated Europe. Journal
of Business Logistics, 19, 191-213. [3] Barney, J.B. (1996). The resource-based theory of the firm. Organization Science, 7, 469. [4] Beaumont, N., & Sohal, A. (2004). Outsourcing in Australia. International Journal of Operations &
Production Management, 24, 688-700. [5] Benbasat, I., Goldstein, D.K., & Mead, M. (1987). The case study research strategy in studies of
information systems. MIS Quarterly, 11, 369-386. [6] Bhatnagar, R., Sohal, A.S., & Millen, R. (1999). Third party logistics services: a Singapore perspective.
International Journal of Physical Distribution & Logistics Management, 29, 569-587. [7] Bookbinder, J.H. (2005). Global logistics. Editorial. Transportation Research Part E: Logistics &
Transportation Review, 41, 461-466. [8] Boyson, S., Corsi, T., Dresner, M., & Rabinovich, E. (1999). Managing third party logistics relationships:
what does it take. Journal of Business Logistics, 20, 73-100. [9] Brandes, H., Lilliecreutz, J., & Brege, S. (1997). Outsourcing – success or failure?: Findings from five case
studies. European Journal of Purchasing & Supply Management, 33, 63-75. [10] Campbell, J.F. (1990). Freight consolidation and routing with transport economies of scale. Transportation
Research Part B: Methodological, 24, 345-361. [11] Carbone, V., & Stone, M.A. (2005). Growth and relational strategies used by the European logistics service
providers: Rationale and outcomes. Transportation Research Part E: Logistics & Transportation Review, 41, 495-510.
2516
[12] Embleton, P.R., & Wright, P.C. (1998). A practical guide to successful outsourcing. Empowerment in Organizations, 6, 94-106.
[13] European Commission (2001). Protrans: analysis of European logistics regions. Deliverable No. 2, November, Competitive and Sustainable Growth Programme of the 5th Framework programme.
[14] Fleischmann, B. (1993). Designing distribution systems with transport economies of scale. European Journal of Operational Research, 70, 31-42.
[15] Hafeez, K., Zhang, Y., & Malak, N. (2002). Determining key capabilities of a firm using analytic hierarchy process. International Journal of Production Economics, 76, 39-51.
Contact author for the full list of references
2517
Global Supply Chain Management: An Analytical Framework
Yue Wang, [email protected] University of New South Wales, Australia
Abstract Research on international subcontracting has been policy-oriented and industry-focused. There is a lack of understanding of the phenomenon from management and organization perspectives. This paper conceptualises international subcontracting as a type of relational contract formed by buyers and suppliers from different countries, sitting between arm’s length outsourcing arrangement and vertically integrated multinational enterprises (MNEs). It builds a transaction cost model for studying the choice of international subcontracting and for examining the complex nature of subcontracting relationships. The conceptual model provides an analytical framework for supply chain managers to choose strategically between outsourcing, subcontracting and vertical integration with overseas suppliers. Introduction International subcontracting has been an effective means of accelerating industrial development since 1960s, fostering the specialisation among countries that reflects comparative advantages (Germidis 1980). Through such measures as the establishment of free trade zones, developing countries encourage local firms to undertake subcontracting jobs for foreign firms to earn hard currency and to accumulate technological know-how (Hamada 1974). Firms from developed countries are frequently attracted into subcontracting arrangements to exploit low labour and production costs in developing countries. The studies of international subcontracting are mainly policy-oriented (Cohen 1975, Riedel 1975, Sengenberger & Pyke, 1991) and geography or industry-focused (Lawson 1992, Kashyap 1992, Rogerson 1995). Few have examined why firms from developed countries choose to use subcontracting arrangements in the first place. Moreover, despite some classifications of international subcontracting activities according to functional or market criteria (Holmes 1986, Gereffi 1993), the nature of subcontracting relationships remains unexplored due to the lack of theoretical underpinning of international subcontracting as a form of investment. Grounded on transaction cost economics (Williamson 1975, 1979, 1985; Buckley & Casson 1976; Rugman 1981; Hennart 1982), this paper aims to provide a firm-level analytical framework for analysing the subcontracting choice and the nature of subcontracting relationships, complementing the existing literature’s emphasis on studying international subcontracting as a macro-economic phenomenon. The Concept of International Subcontracting There is no generally accepted definition of subcontracting in the existing literature (Hovi 1994). However, there are some essential features about the international subcontracting as a form of investment. First, international subcontracting involves two independent units located in different countries, reflecting a type of cross-border inter-firm relationship. But the fact that a firm is legally independent does not necessarily mean that it will be economically independent. The relationship between subcontracting parties is defined as ‘quasi-integration’, in which subcontractors from less developed countries are often dependent on principals from developed countries, where the demand of subcontracting is derived (Germidis 1980). Second, in a subcontracting arrangement, the subcontractor provides the principal with products or services on agreed terms and conditions set by the principal, where certain business activities such as marketing or product design may not be carried out by the subcontractor (Halbach 1989). The goods produced are required to conform to specifications intended for a definite principal, making it impossible or very difficult to sell them to other customers (Germidis 1980). Third, the principal usually
2518
provides specialised physical equipment and/or ongoing technical assistance to the subcontractor to assure product specifications and quality (Sharpston 1977). The enforcement mechanisms are usually between principals and subcontractors themselves and no third party oversees the execution of the contract. The bond linking them together is thus out of market (Germidis 1980). Consequently, a significant level of transaction-specific investment has to be undertaken both by subcontractors to meet the specifications set by principals and by principals to ensure the performance of subcontractors. These basic characteristics reveal that the nature of international subcontracting conforms to Williamson’s (1979, 1985) notion of a relational contract with a bilateral governance structure. Casson (1987) identified subcontracting as a distinctive type of intermediate contractual arrangement, an alternative to the vertically integrated multinational enterprises (MNEs). The Choice of International Subcontracting The above conceptualisation allows us to examine the choice of international subcontracting as an intermediate relational contract, lying between market outsourcing arrangement and internalised MNEs. Subcontracting vs. Outsourcing In transaction cost framework, the choice of a relational contracting form is made when transactions between buyers and suppliers are characterised by mixed asset specificity, recurrent exchange and a low degree of uncertainty (Williamson 1979, 1985). Central to the framework is the concept of asset specificity, which refers to durable human and physical investments undertaken to support particular transactions (Williamson 1985), the value of which will be lost in alternative uses. The requirement for specific assets creates potential costs in the market execution of transactions. When the asset specific feature involved in business transactions is low, buyers and suppliers keep their relationship at arm’s length.
A common industrial outsourcing activity refers to market transaction of standard products or components, with both buyers and suppliers capitalising on their comparative advantages of trading and realising economies of specialization. While outsourcing may involve a long-term relationship between buyers and suppliers, it does not require the support of long-term contract. The products and components in common outsourcing activities are non-specific and there are many buyers and sellers. Some buyers and suppliers may be engaged in the trading of standard goods for a long time. But they are not bonded by contracts requirement and each side can switch to other trading parties easily due to the low asset specific investment in their trading relationship.
When products or components contain some degree of product specifications and are not ‘off the shelf’, they can no longer be bought on spot market. Buyers look for long-term contractual arrangements to assure the supply of the specialised inputs and products. Subcontracting is a kind of long-term contract that aims to facilitate the sourcing of products or components with buyer-specific requirements. This clarification is important because the term ‘subcontracting’ is often misunderstood as an exclusive portrait of buyer-supplier relationship and therefore the distinction between common outsourcing and subcontracting is blurred. As such, asset specificity is an important reason for making long-term contracts (Kay 1995), explaining the choice of subcontracting over outsourcing. To protect themselves from exposure to transaction costs arising from making asset-specific investments, both parties involved in subcontracting relations have incentives to form a long-term relational contract. Subcontracting vs. Vertical Integration The economic rationale of international subcontracting is to realise economies of specialisation through externalising non-core production activities (Sharpston 1977) to achieve cost advantage. But firms can acquire existing low-cost suppliers in developing countries as their subsidiaries or set up plants in low-cost regions and relocate non-core activities to the new ventures. On the other hand, if the aim is to access technology expertise or other proprietary know-how held by suppliers, the buyer firm could still acquire them through equity integration with suppliers. Therefore, other than achieving production cost economies and acquiring complementary assets, there must be additional reasons for firms to choose subcontracting rather than vertical integration through acquisitions or greenfields.
2519
Engaging vertical integration to exploit low production costs or to access complementary assets overseas would entail significant transaction and information costs, which justify the choice of subcontracting. First, the desired assets of the acquied firm are hard to disentangle from the non-desired ones, which impose a high cost on acquiring suppliers (Hennart 1988). Under this circumstance, purchasing the target overseas firm would force the buyer to enter unrelated fields or to expand suddenly in size, with the attendant management problems. This cost is particularly high for firms that rely mostly on cost rather than differentation to survive. Second, management costs after the acquistion make subcontracting preferrable. Acquisition of a foreign supplier means the buyer also takes over an existing labor force and a well-established administrative structure. Considerable difficulties might be expected by the buyer in managing the foreign supplier firm that has cultivated its own organizational routines and corporate culture, in addition to the nationial culture distance. Hence, a subcontracting arrangement may be desirable as it avoids the post-acquisition management costs by leaving the management of supplier firm to the overseas subcontractor itself.
Third, information costs in assessing the value of the target firm inhibit the acquisition. Buyers may not acquire overseas suppliers for the purpose of establishing low-cost supply bases but for the potential gain from complementary assets held by suppliers. But it may be difficult to assess the true value of these complementary assets due to the intrinsic bounded rationality constraint and the expectation that overseas suppliers may opportunistically exagerate the value of their assets. A subcontracting arrangement retains the possibility for principals to gather information on the value of overseas subcontractors’ complementary assets without financial exposure in an equity relationship, and may be used as a transitional arrangement for future acquisition of the overseas supplier.
Fourth, high exit barriers in an equity relationship may jepodize the flexibility valued by the buyer firms. In contrast, a subcontracting arrangement allows buyers to rescind the contractual relationship with suppliers at a relatively low exit cost. Finally, impediments to acquistions arise from governmental and institutional barriers. Many developing countries discourage and restrict the foreign equity control of local companies while the pervasive anti-trust legislation in developed countries also acts against acquisitions.
When making the choice between subcontracting and building new plants (greenfield) in low-cost countries, the following factors need to be considered. First, relocating low value-added operations to newly established greenfield plants may achieve a similar level of cost reduction in labor and other production factors. But relocation to another country through greenfields requires additional knowledge in managing labor and production in an unfamilar environment, and becoming acquainted with the specific local cultures and environment is a time-consuming process. Greenfield investments may be necessary for companies that aim to develop foreign markets for their products, but not for firms that simply seek a low cost supply base overseas.
Second, even when the buyer firm plans to develop the foreign market in the future, subcontracting may still be a preferred entry mode as it allows the firm to acquire knowledge of local market before the subcontracting arrangement is replaced by a wholly-owned subsidiary (Kogut 1988). In this case, the choice of subcontracting economises on the cost of acquiring local knowledge, allowing the prospective entrant to test the potential of the local market while exploiting the foreign country as a low cost supply base in the mean time. The Nature of Subcontracting Relationship Transaction-specific investments bond principals and subcontractors in a relational long term supply arrangement, but it also leaves room for parties to bargain, shirk or break the relationship for short-term gains. Whether such a contractual arrangement can be preserved is primarily a matter of the nature of the subcontracting relationship concerned.
There is a whole range of international subcontracting relationships in terms of the degree of interdependence and bargaining power between principals and subcontractors. The perceived dependence and bargaining power are the function of the combination of many factors, including the degree of asset-specific investments, frequency of transactions and uncertainty between parties (Williamson 1979, 1985). Variations along
2520
those transactional dimensions determine the degree of interdependence and bargaining power between subcontracting parties, which in turn constitute a variety of subcontracting relationships.
A loose subcontracting relationship denotes a low interdependence degree between principals and subcontractors, the switching cost for both parties is low as neither side makes significant asset-specific investments. The principal does not rely on a particular subcontractor or subcontractors for supply and the subcontractor also has a broad customer base. The principal only need to provide minimal technical assistance to the subcontractor and the subcontractor does not need sophisticated machinery and skills to perform subcontracting jobs. The frequency of orders has little impact on the relationship since both sides are loosely tied to each other and the exit costs are low for both sides when facing market demand fluctuations. Examples abound in commercial subcontracting (Gereffi 1993).
A subcontractor is more dependent when the principal has stronger bargaining power. This occurs when asset-specific investments made by the parties are asymmetric. The buyer commitments are usually confined to specific physical capital, including specific dies, moulds and tooling for the manufacture of a contracted product (Nishiguchi 1994). The subcontractor, on the other hand, has to invest in special-purpose equipment, employ skilled workers and engineers who are devoted to customer-specific operation; expand production capacity to meet the principal’s requirement. The industry structure is such that many suppliers from developing countries are competing for relatively few buyers from developed countries. It is difficult for a subcontractor to diversify its customer-base and its sales revenue. However, such an unbalanced subcontracting relationship may not be unstable. Although buyers from developed countries have much leverage among many suppliers in developing countries, stable long-term relationships with their suppliers can enhance performance certainty by reducing the costs in seeking suitable overseas suppliers, in drawing up multiple contracts, and in monitoring multiple suppliers in different countries. All of these benefits would be lost in a frequent shift of suppliers. These are also the reasons why arm’s length outsourcing may involve a long-term relationship. But the higher degree of asset specificity points to a more inter-locked pattern of relationship in subcontracting than in outsourcing.
The situations where a principal is more dependent on a subcontractor are less common. They happen when the overseas subcontractor holds know-how crucial to the principal’s production cycle. Some once-off and occasional large purchasing orders that involve sophisticated work such as in aerospace (Esposite & Storto 1994) and shipbuilding industries (Smitka 1991) might qualify as examples, since they require highly specialized expertise and more importantly there are more buyers than suppliers in the global market. Subcontractors enjoy stronger bargaining power when they are not merely producing certain products or components, but serve as intermediates for transferring knowledge of the local market to foreign buyer firms. In this case, a local subcontractor’s bargaining power stem not from the transaction characteristics, but from the foreign buyer’s strategic purpose in developing the local market with the help of the local supplier. Nevertheless, the subcontractor may be unaware of the principal’s strategic motive and fail to materialise its power advantage in dealing with the foreign principal firm.
When the principal and the subcontractor are mutually and heavily dependent on each other, the demand for equal collaboration is high. Subcontracting of this type requires highly specialized investments from both sides and the relationship is balanced. In such a subcontracting relationship, the principal typically contracts out the assembly of a final product. The principal commitments contain a high degree of asset specificity since complete assembly requires the highest integration of contract-specific physical facilities, including dedicated assembly lines, tooling and testing equipment (Nishiguchi 1994). Moreover, the principal will incur human asset-specific investments in the form of managerial training and technical assistance to the overseas subcontractor to attain the production specifications (Sharpston 1977). For subcontractors, end-product assembly for a particular overseas buyer will require specific investments both in human capital (e.g. employ highly skilled workers or provide special training) and in physical assets (e.g. purchase specialised machinery and equipment). Therefore, principals and subcontractors commit a similar level of asset-specific investments, which support an equal collaborative relationship characterised by common interest, mutual obligations and trust (Smitka 1991, Morris & Imrie 1992).
2521
Conclusion International subcontracting is often studied as an important instrument for industrial development at the policy level. Few studies have looked at the phenomenon from a management perspective. The paper does not attempt to provide a precise definition of international subcontracting. Rather, building rigorously on the transaction cost economics, the paper conceptualises international subcontracting as a relational contract between buyers and suppliers from different countries, sitting between arm’s length outsourcing arrangement and vertical integrated MNEs.
A transaction cost analytical framework is proposed for investigating the choice of international subcontracting over its market and hierarchy alternatives. The framework also allows us to examine the specific nature of a range of subcontracting relationships. Theoretically, the paper offers a conceptually coherent foundation for future research to analyse international subcontracting as a form of international business organization at the firm level. Empirically, the paper provides an analytical framework to help international firms’ managers to make strategic choice between outsourcing, long term subcontracting and vertical integration with overseas suppliers for their companies’ supply chain management across borders.
References [1] Buckley, PJ & Casson, M 1976, The future of the multinational enterprise, Macmillan, London. [2] Casson, M 1987, The firm and the market, Basil Blackwell, Oxford. [3] Cohen, B 1975, Multinational firms and Asian exports, Yale University Press, New Haven. [4] Germidis, D 1980, International subcontracting: a new form of investment, OECD, Paris. [5] Halbach, AJ 1989, Multinational enterprises and subcontracting in the third world: a study of inter-
industry linkages, International Labour Office, Geneva. [6] Hamada, K 1974, ‘An economic analysis of the duty free zone’, Journal of International Economics,
August, pp. 225-41. [7] Hennart, JF 1982, A theory of multinational enterprise, University of Michigan Press, Ann Arbor. [8] Hennart, JF 1988, ‘A transaction cost theory of equity joint ventures’, Strategic Management Journal, vol.
9, no. 4, pp. 361-74. [9] Holmes, J 1986, ‘The organization and locational structure of production subcontracting’, in AJ Scott & M
Storper (eds), Production, work, and territory: the geographical anatomy of industrial capitalism, Allen & Unwin, Boston, pp. 80-106.
[10] Hovi, N 1994, ‘Internationalising subcontractors: is co-operation an alternative?’, in Veciana, JM (ed), SMEs: internationalisation, networks and strategy, Aldershot, Avebury, pp. 359-79.
[11] Kashyap, SP 1992, Recent developments in the small enterprises sector in India: economic and social aspects, International Institute for Labour Studies, Geneva.
[12] Kay, NM 1995, Why firms succeed, Oxford University Press, New York. [13] Kogut, B 1988, ‘Joint ventures: theoretical and empirical perspectives’, Strategic Management Journal, vol. 9, pp. 319-32. [14] Lawson, V 1992, ‘Industrial subcontracting and employment forms in Latin America: a framework for
contextual analysis’, Progress in Human Geography, vol. 16, pp. 1-23. [15] Morris, J & Imrie, R 1992, Transforming buyer-supplier relations: Japanese-style industrial practices in
western context, Macmillan, London. Contact author for complete list of references
2522
Logistics and Supply Chain Management for Hungarian Mid-Size Companies: Effect on Competitiveness
Zoltan Szegedi, [email protected] Csaba Illes B., [email protected]
St. Stephen University, Hungary
Abstract An empirical survey of 117 SMEs (examining logistics practices and the relationship of information systems such as the existence and use of an ERP - or related logistics information systems) was carried out under the leadership of the author. Our goal was to prove the relationship between the quality of the logistics processes (functionality, agility, process measures) and their effect on the position of SMEs on the market. On the basis of the survey we have received detailed information on how logistics processes and information systems affect the competitiveness of these enterprises. While large (multinational) companies are better in terms of economic competitiveness due to their size and the financial benefits they enjoy as a result of the global market, this does not work for SMEs. The path to SME-competitiveness – even when fixing and streamlining their logistics processes and installing their logistics information systems – begins with flexibility and adoptability: they must meet the unique needs of their customers by constantly improving the quality of their customer service and by adapting to customer standards. Although the paper discusses the Hungarian case, the problems can be similar in the newly joined EU member countries as well. Introduction The aim of this paper is to highlight the logistics strategies and practices used by small enterprises in Hungary, with view through a “supply-chain-approach”, where it is usually a large firm as a “dominating” channel member. The need to survive and to grow forces SME-s to adapt to the rule of competition (which are changing rapidly).
We agree on the interpretation that logistics is defined as the process of controlling physical flow and connecting information flows (Colin-Fabbe-Costes, 1993). It is a major contributor to economic performance in large corporations, and it will be accepted as a tool for economic efficiency. [Kearney, (1984), Chow, G.-Heaver, T.-Henriksson. L. (1994)] The company gets efficient, if – together with its partners – it is able to reduce the costs of the logistics activities (procurement, warehousing, inventory management, transportation, distribution, etc.) and if it satisfies the customers.
Small enterprises – similarly – have and are able to implement logistics procedures to improve their performance. Despite of that, few researchers have considered logistics as a strategic tool in small firms. Researchers of this field in Hungary tend to look at SME-s as “logistics beneficiaries”, who are on the passive side, while large corporations do the majority of logistics works (within the supply chain).
We do not agree on that, because the percentage of jobs (of all competitive sectors) generated by SME-s cumulates to 51 %, and in manufacturing it is even higher (55 %).
Business interest in logistics began around 1950 and has developed since progressively. Researchers speak about stages, as the logistics functions have been integrated into the organizational structures of companies. [McGinnis, M.-Kochunny, C.M.-Ackermann, K.B. (1995); Inkalainen, A.-Vepsalainen, A. (2000)].
Figure 1 shows the development of logistics in firms by Inkalainen (2000)
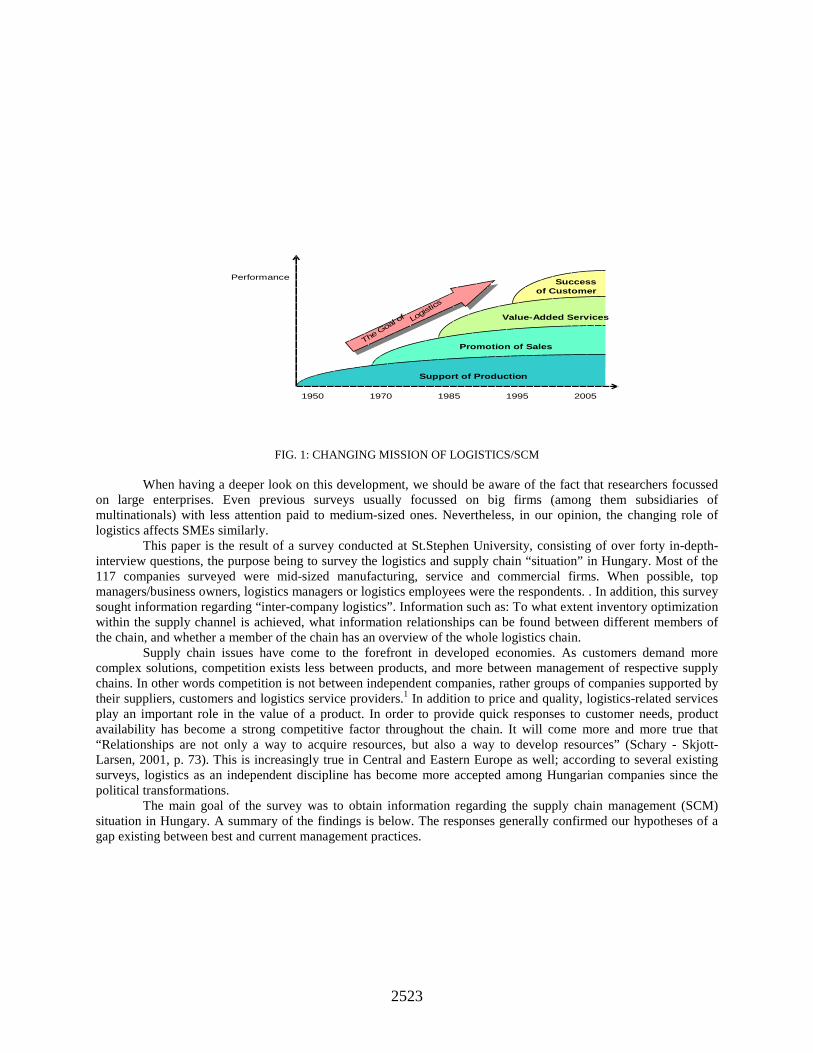
2523
1950 1970 1985 1995 2005
Performance
Support of Production
Promotion of Sales
Value-Added Services
Successof Customer
The Goal o
f Logistics
FIG. 1: CHANGING MISSION OF LOGISTICS/SCM
When having a deeper look on this development, we should be aware of the fact that researchers focussed
on large enterprises. Even previous surveys usually focussed on big firms (among them subsidiaries of multinationals) with less attention paid to medium-sized ones. Nevertheless, in our opinion, the changing role of logistics affects SMEs similarly.
This paper is the result of a survey conducted at St.Stephen University, consisting of over forty in-depth-interview questions, the purpose being to survey the logistics and supply chain “situation” in Hungary. Most of the 117 companies surveyed were mid-sized manufacturing, service and commercial firms. When possible, top managers/business owners, logistics managers or logistics employees were the respondents. . In addition, this survey sought information regarding “inter-company logistics”. Information such as: To what extent inventory optimization within the supply channel is achieved, what information relationships can be found between different members of the chain, and whether a member of the chain has an overview of the whole logistics chain.
Supply chain issues have come to the forefront in developed economies. As customers demand more complex solutions, competition exists less between products, and more between management of respective supply chains. In other words competition is not between independent companies, rather groups of companies supported by their suppliers, customers and logistics service providers.1 In addition to price and quality, logistics-related services play an important role in the value of a product. In order to provide quick responses to customer needs, product availability has become a strong competitive factor throughout the chain. It will come more and more true that “Relationships are not only a way to acquire resources, but also a way to develop resources” (Schary - Skjott-Larsen, 2001, p. 73). This is increasingly true in Central and Eastern Europe as well; according to several existing surveys, logistics as an independent discipline has become more accepted among Hungarian companies since the political transformations.
The main goal of the survey was to obtain information regarding the supply chain management (SCM) situation in Hungary. A summary of the findings is below. The responses generally confirmed our hypotheses of a gap existing between best and current management practices.
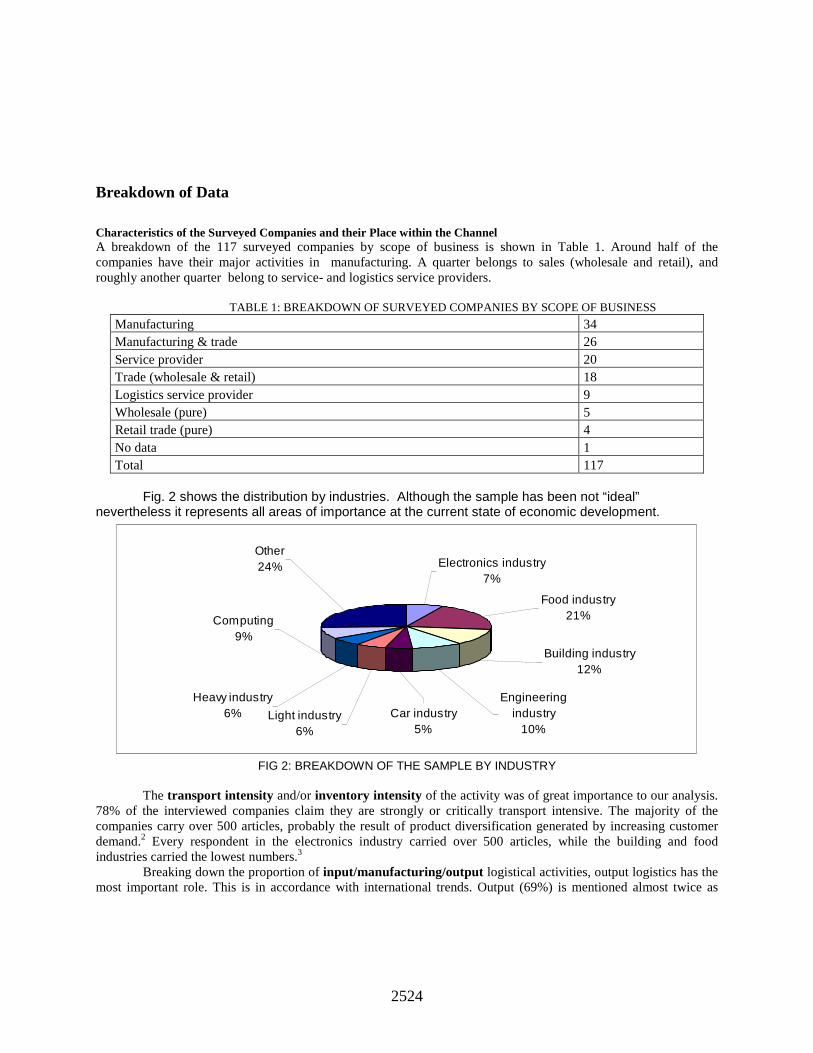
2524
Breakdown of Data
Characteristics of the Surveyed Companies and their Place within the Channel A breakdown of the 117 surveyed companies by scope of business is shown in Table 1. Around half of the companies have their major activities in manufacturing. A quarter belongs to sales (wholesale and retail), and roughly another quarter belong to service- and logistics service providers.
TABLE 1: BREAKDOWN OF SURVEYED COMPANIES BY SCOPE OF BUSINESS
Manufacturing 34 Manufacturing & trade 26 Service provider 20 Trade (wholesale & retail) 18 Logistics service provider 9 Wholesale (pure) 5 Retail trade (pure) 4 No data 1 Total 117
Fig. 2 shows the distribution by industries. Although the sample has been not “ideal”
nevertheless it represents all areas of importance at the current state of economic development.
Light industry6%
Electronics industry7%
Food industry21%
Building industry12%
Engineering industry
10%Car industry
5%
Heavy industry6%
Computing9%
Other24%
FIG 2: BREAKDOWN OF THE SAMPLE BY INDUSTRY
The transport intensity and/or inventory intensity of the activity was of great importance to our analysis.
78% of the interviewed companies claim they are strongly or critically transport intensive. The majority of the companies carry over 500 articles, probably the result of product diversification generated by increasing customer demand.2 Every respondent in the electronics industry carried over 500 articles, while the building and food industries carried the lowest numbers.3
Breaking down the proportion of input/manufacturing/output logistical activities, output logistics has the most important role. This is in accordance with international trends. Output (69%) is mentioned almost twice as
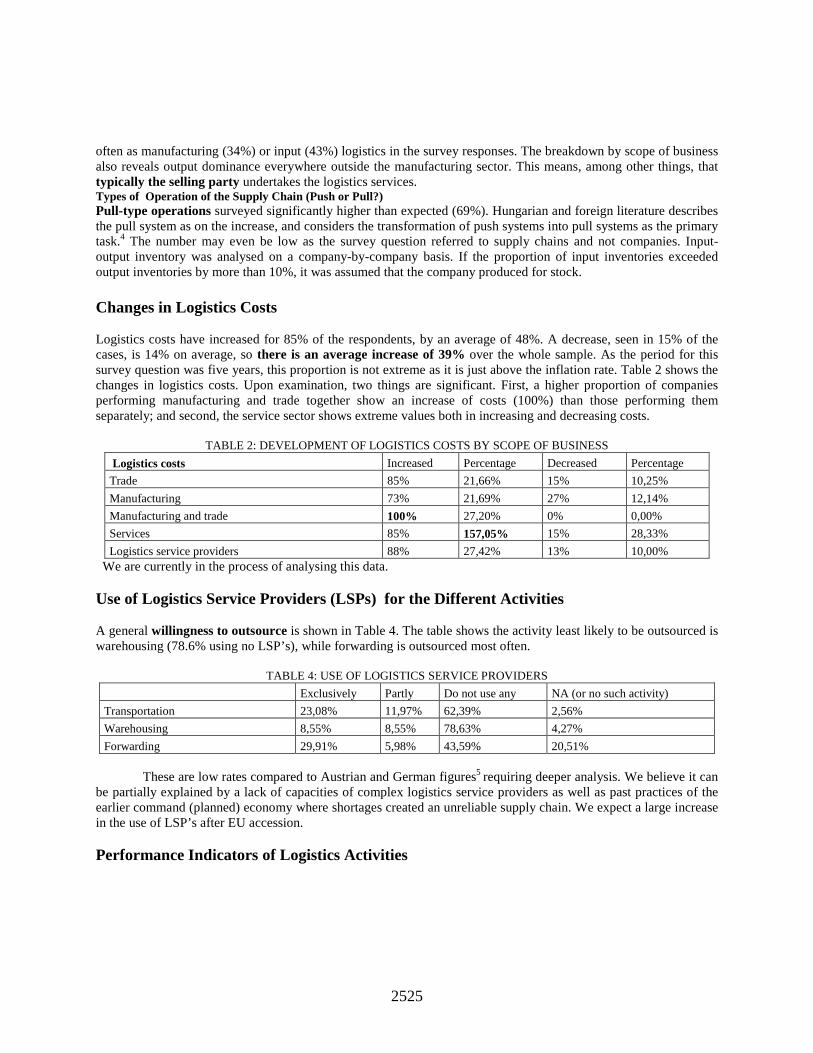
2525
often as manufacturing (34%) or input (43%) logistics in the survey responses. The breakdown by scope of business also reveals output dominance everywhere outside the manufacturing sector. This means, among other things, that typically the selling party undertakes the logistics services. Types of Operation of the Supply Chain (Push or Pull?) Pull-type operations surveyed significantly higher than expected (69%). Hungarian and foreign literature describes the pull system as on the increase, and considers the transformation of push systems into pull systems as the primary task.4 The number may even be low as the survey question referred to supply chains and not companies. Input-output inventory was analysed on a company-by-company basis. If the proportion of input inventories exceeded output inventories by more than 10%, it was assumed that the company produced for stock. Changes in Logistics Costs Logistics costs have increased for 85% of the respondents, by an average of 48%. A decrease, seen in 15% of the cases, is 14% on average, so there is an average increase of 39% over the whole sample. As the period for this survey question was five years, this proportion is not extreme as it is just above the inflation rate. Table 2 shows the changes in logistics costs. Upon examination, two things are significant. First, a higher proportion of companies performing manufacturing and trade together show an increase of costs (100%) than those performing them separately; and second, the service sector shows extreme values both in increasing and decreasing costs.
TABLE 2: DEVELOPMENT OF LOGISTICS COSTS BY SCOPE OF BUSINESS
Logistics costs Increased Percentage Decreased Percentage
Trade 85% 21,66% 15% 10,25%
Manufacturing 73% 21,69% 27% 12,14%
Manufacturing and trade 100% 27,20% 0% 0,00%
Services 85% 157,05% 15% 28,33%
Logistics service providers 88% 27,42% 13% 10,00% We are currently in the process of analysing this data. Use of Logistics Service Providers (LSPs) for the Different Activities A general willingness to outsource is shown in Table 4. The table shows the activity least likely to be outsourced is warehousing (78.6% using no LSP’s), while forwarding is outsourced most often.
TABLE 4: USE OF LOGISTICS SERVICE PROVIDERS
Exclusively Partly Do not use any NA (or no such activity)
Transportation 23,08% 11,97% 62,39% 2,56%
Warehousing 8,55% 8,55% 78,63% 4,27%
Forwarding 29,91% 5,98% 43,59% 20,51%
These are low rates compared to Austrian and German figures5 requiring deeper analysis. We believe it can be partially explained by a lack of capacities of complex logistics service providers as well as past practices of the earlier command (planned) economy where shortages created an unreliable supply chain. We expect a large increase in the use of LSP’s after EU accession. Performance Indicators of Logistics Activities

2526
Indicators for comparison with a survey performed five years ago were asked6. The open-ended questions resulted in a wide range of answers. In addition to the verbal and pre-printed answers, a range of answers are grouped below in Table 5:
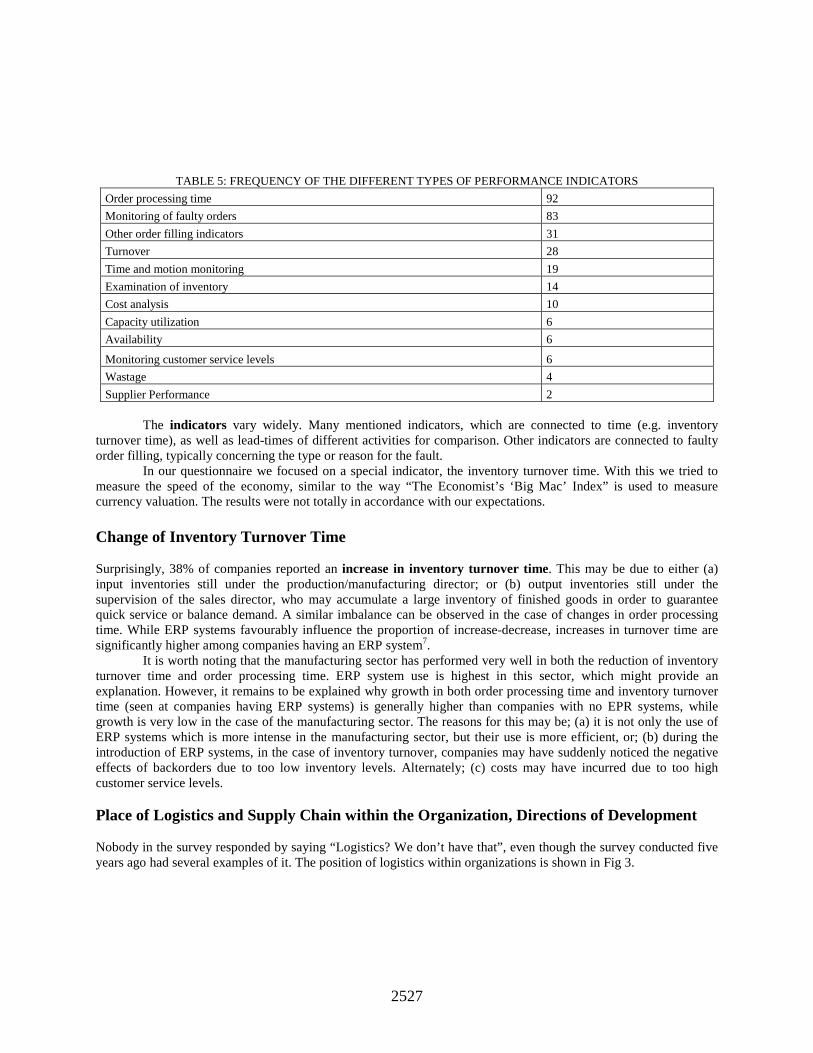
2527
TABLE 5: FREQUENCY OF THE DIFFERENT TYPES OF PERFORMANCE INDICATORS
Order processing time 92
Monitoring of faulty orders 83
Other order filling indicators 31
Turnover 28
Time and motion monitoring 19
Examination of inventory 14
Cost analysis 10
Capacity utilization 6
Availability 6
Monitoring customer service levels 6
Wastage 4
Supplier Performance 2
The indicators vary widely. Many mentioned indicators, which are connected to time (e.g. inventory turnover time), as well as lead-times of different activities for comparison. Other indicators are connected to faulty order filling, typically concerning the type or reason for the fault.
In our questionnaire we focused on a special indicator, the inventory turnover time. With this we tried to measure the speed of the economy, similar to the way “The Economist’s ‘Big Mac’ Index” is used to measure currency valuation. The results were not totally in accordance with our expectations. Change of Inventory Turnover Time Surprisingly, 38% of companies reported an increase in inventory turnover time. This may be due to either (a) input inventories still under the production/manufacturing director; or (b) output inventories still under the supervision of the sales director, who may accumulate a large inventory of finished goods in order to guarantee quick service or balance demand. A similar imbalance can be observed in the case of changes in order processing time. While ERP systems favourably influence the proportion of increase-decrease, increases in turnover time are significantly higher among companies having an ERP system7.
It is worth noting that the manufacturing sector has performed very well in both the reduction of inventory turnover time and order processing time. ERP system use is highest in this sector, which might provide an explanation. However, it remains to be explained why growth in both order processing time and inventory turnover time (seen at companies having ERP systems) is generally higher than companies with no EPR systems, while growth is very low in the case of the manufacturing sector. The reasons for this may be; (a) it is not only the use of ERP systems which is more intense in the manufacturing sector, but their use is more efficient, or; (b) during the introduction of ERP systems, in the case of inventory turnover, companies may have suddenly noticed the negative effects of backorders due to too low inventory levels. Alternately; (c) costs may have incurred due to too high customer service levels. Place of Logistics and Supply Chain within the Organization, Directions of Development Nobody in the survey responded by saying “Logistics? We don’t have that”, even though the survey conducted five years ago had several examples of it. The position of logistics within organizations is shown in Fig 3.
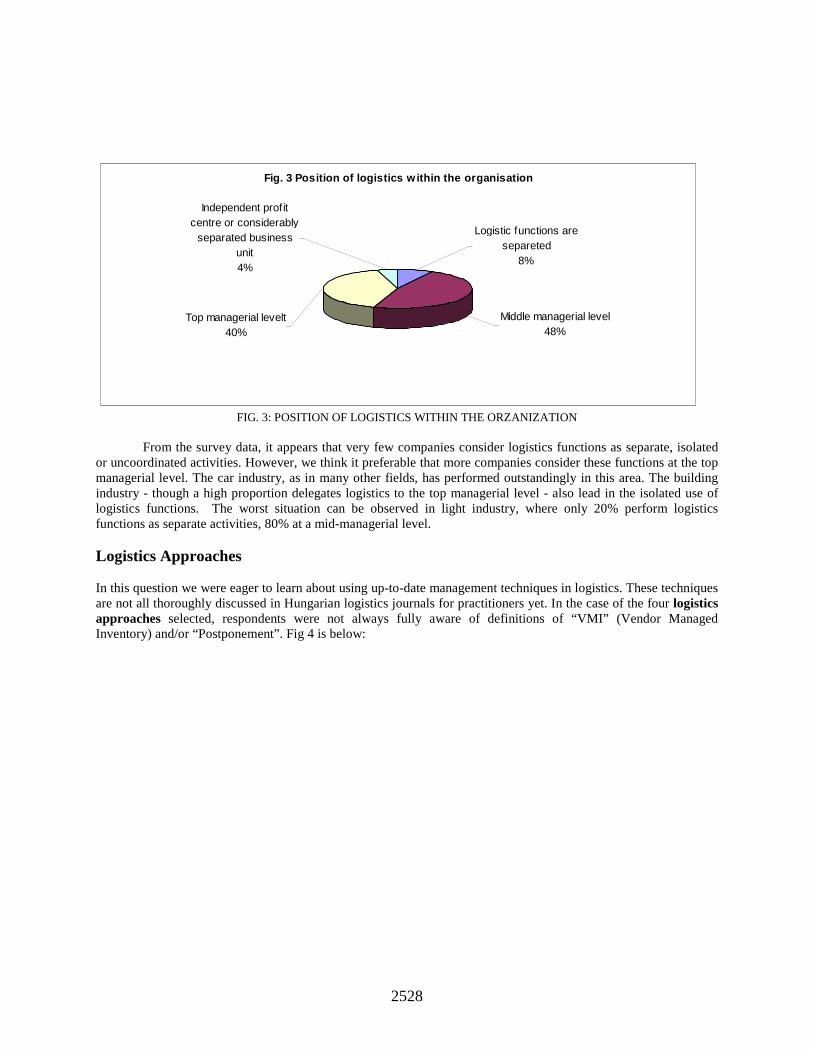
2528
Fig. 3 Position of logistics within the organisation
Middle managerial level48%
Logistic functions are separeted
8%
Independent profit centre or considerably
separated business unit4%
Top managerial levelt40%
FIG. 3: POSITION OF LOGISTICS WITHIN THE ORZANIZATION
From the survey data, it appears that very few companies consider logistics functions as separate, isolated
or uncoordinated activities. However, we think it preferable that more companies consider these functions at the top managerial level. The car industry, as in many other fields, has performed outstandingly in this area. The building industry - though a high proportion delegates logistics to the top managerial level - also lead in the isolated use of logistics functions. The worst situation can be observed in light industry, where only 20% perform logistics functions as separate activities, 80% at a mid-managerial level. Logistics Approaches In this question we were eager to learn about using up-to-date management techniques in logistics. These techniques are not all thoroughly discussed in Hungarian logistics journals for practitioners yet. In the case of the four logistics approaches selected, respondents were not always fully aware of definitions of “VMI” (Vendor Managed Inventory) and/or “Postponement”. Fig 4 is below:
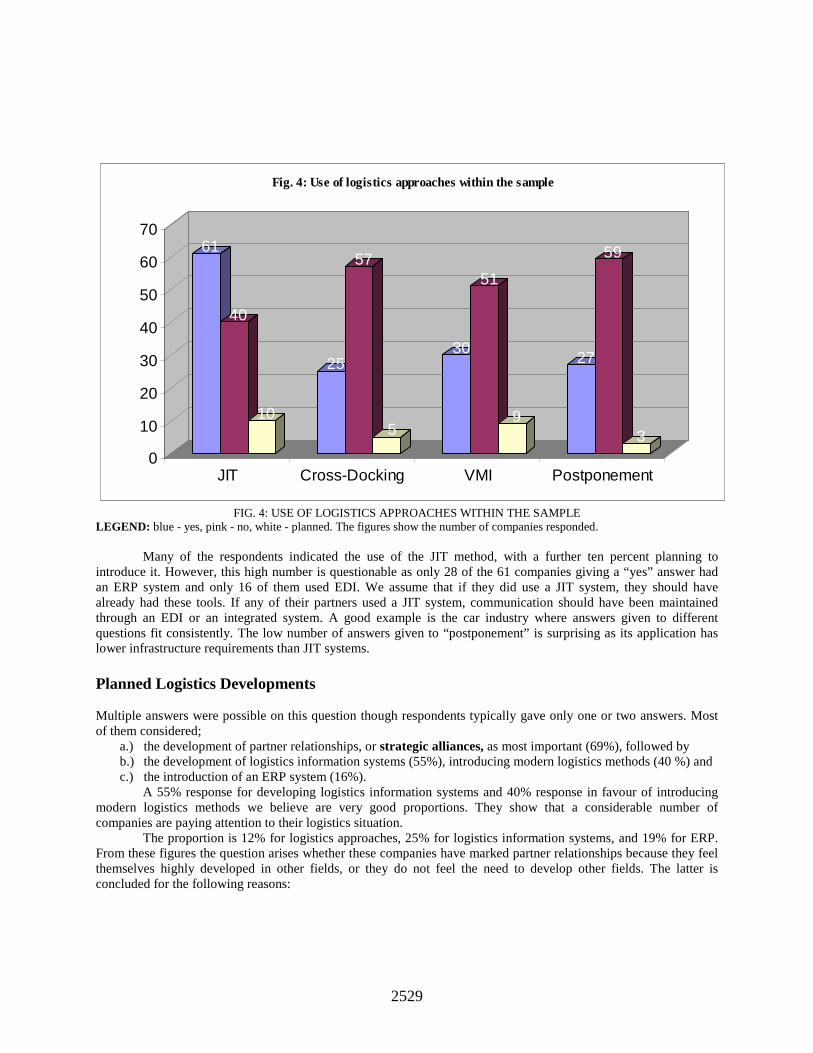
2529
61
40
10
25
57
5
30
51
9
27
59
30
10
20
30
40
50
60
70
JIT Cross-Docking VMI Postponement
Fig. 4: Use of logistics approaches within the sample
FIG. 4: USE OF LOGISTICS APPROACHES WITHIN THE SAMPLE LEGEND: blue - yes, pink - no, white - planned. The figures show the number of companies responded.
Many of the respondents indicated the use of the JIT method, with a further ten percent planning to introduce it. However, this high number is questionable as only 28 of the 61 companies giving a “yes” answer had an ERP system and only 16 of them used EDI. We assume that if they did use a JIT system, they should have already had these tools. If any of their partners used a JIT system, communication should have been maintained through an EDI or an integrated system. A good example is the car industry where answers given to different questions fit consistently. The low number of answers given to “postponement” is surprising as its application has lower infrastructure requirements than JIT systems. Planned Logistics Developments Multiple answers were possible on this question though respondents typically gave only one or two answers. Most of them considered;
a.) the development of partner relationships, or strategic alliances, as most important (69%), followed by b.) the development of logistics information systems (55%), introducing modern logistics methods (40 %) and c.) the introduction of an ERP system (16%).
A 55% response for developing logistics information systems and 40% response in favour of introducing modern logistics methods we believe are very good proportions. They show that a considerable number of companies are paying attention to their logistics situation.
The proportion is 12% for logistics approaches, 25% for logistics information systems, and 19% for ERP. From these figures the question arises whether these companies have marked partner relationships because they feel themselves highly developed in other fields, or they do not feel the need to develop other fields. The latter is concluded for the following reasons:
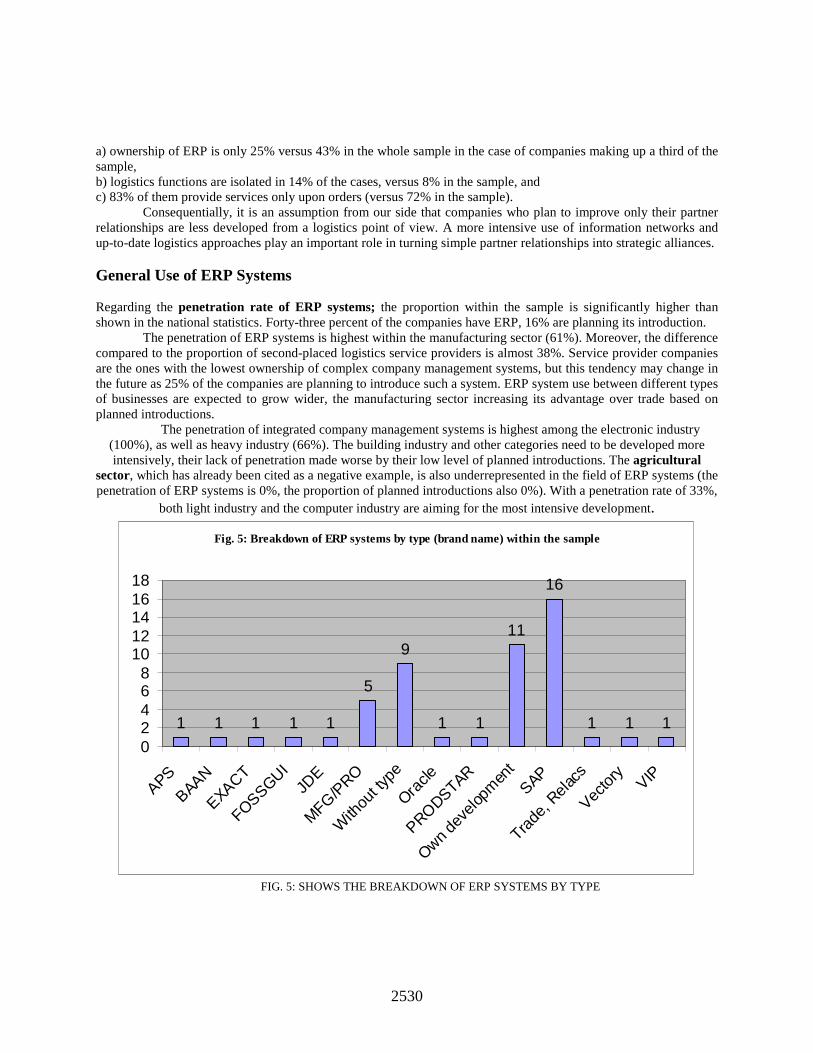
2530
a) ownership of ERP is only 25% versus 43% in the whole sample in the case of companies making up a third of the sample, b) logistics functions are isolated in 14% of the cases, versus 8% in the sample, and c) 83% of them provide services only upon orders (versus 72% in the sample).
Consequentially, it is an assumption from our side that companies who plan to improve only their partner relationships are less developed from a logistics point of view. A more intensive use of information networks and up-to-date logistics approaches play an important role in turning simple partner relationships into strategic alliances. General Use of ERP Systems Regarding the penetration rate of ERP systems; the proportion within the sample is significantly higher than shown in the national statistics. Forty-three percent of the companies have ERP, 16% are planning its introduction.
The penetration of ERP systems is highest within the manufacturing sector (61%). Moreover, the difference compared to the proportion of second-placed logistics service providers is almost 38%. Service provider companies are the ones with the lowest ownership of complex company management systems, but this tendency may change in the future as 25% of the companies are planning to introduce such a system. ERP system use between different types of businesses are expected to grow wider, the manufacturing sector increasing its advantage over trade based on planned introductions.
The penetration of integrated company management systems is highest among the electronic industry (100%), as well as heavy industry (66%). The building industry and other categories need to be developed more intensively, their lack of penetration made worse by their low level of planned introductions. The agricultural
sector, which has already been cited as a negative example, is also underrepresented in the field of ERP systems (the penetration of ERP systems is 0%, the proportion of planned introductions also 0%). With a penetration rate of 33%,
both light industry and the computer industry are aiming for the most intensive development.
Fig. 5: Breakdown of ERP systems by type (brand name) within the sample
1 1 1 1 1
5
9
1 1
11
16
1 1 1
02468
1012141618
APSBAAN
EXACT
FOSSGUIJD
E
MFG/P
RO
With
out ty
pe
Oracle
PRODSTAR
Own dev
elop
men
tSAP
Trade
, Rel
acs
Vector
yVIP
FIG. 5: SHOWS THE BREAKDOWN OF ERP SYSTEMS BY TYPE
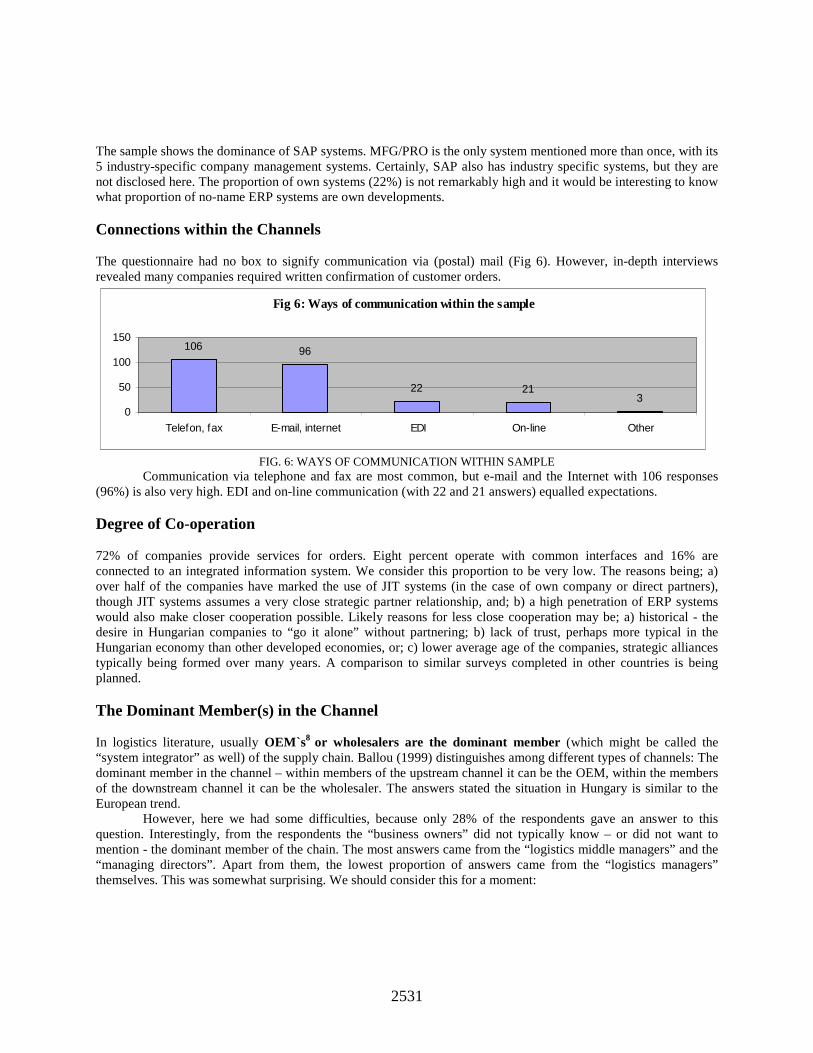
2531
The sample shows the dominance of SAP systems. MFG/PRO is the only system mentioned more than once, with its 5 industry-specific company management systems. Certainly, SAP also has industry specific systems, but they are not disclosed here. The proportion of own systems (22%) is not remarkably high and it would be interesting to know what proportion of no-name ERP systems are own developments. Connections within the Channels The questionnaire had no box to signify communication via (postal) mail (Fig 6). However, in-depth interviews revealed many companies required written confirmation of customer orders.
Fig 6: Ways of communication within the sample
106 96
22 213
0
50
100
150
Telefon, fax E-mail, internet EDI On-line Other
FIG. 6: WAYS OF COMMUNICATION WITHIN SAMPLE
Communication via telephone and fax are most common, but e-mail and the Internet with 106 responses (96%) is also very high. EDI and on-line communication (with 22 and 21 answers) equalled expectations. Degree of Co-operation 72% of companies provide services for orders. Eight percent operate with common interfaces and 16% are connected to an integrated information system. We consider this proportion to be very low. The reasons being; a) over half of the companies have marked the use of JIT systems (in the case of own company or direct partners), though JIT systems assumes a very close strategic partner relationship, and; b) a high penetration of ERP systems would also make closer cooperation possible. Likely reasons for less close cooperation may be; a) historical - the desire in Hungarian companies to “go it alone” without partnering; b) lack of trust, perhaps more typical in the Hungarian economy than other developed economies, or; c) lower average age of the companies, strategic alliances typically being formed over many years. A comparison to similar surveys completed in other countries is being planned. The Dominant Member(s) in the Channel In logistics literature, usually OEM`s8 or wholesalers are the dominant member (which might be called the “system integrator” as well) of the supply chain. Ballou (1999) distinguishes among different types of channels: The dominant member in the channel – within members of the upstream channel it can be the OEM, within the members of the downstream channel it can be the wholesaler. The answers stated the situation in Hungary is similar to the European trend.
However, here we had some difficulties, because only 28% of the respondents gave an answer to this question. Interestingly, from the respondents the “business owners” did not typically know – or did not want to mention - the dominant member of the chain. The most answers came from the “logistics middle managers” and the “managing directors”. Apart from them, the lowest proportion of answers came from the “logistics managers” themselves. This was somewhat surprising. We should consider this for a moment:
2532
There can be several possible explanations for this phenomenon: a) Development of the logistics-SCM strategy is performed mostly by parent companies of Hungarian subsidiaries of multinational companies; b) lack of a strategic approach by logistics managers. Hungarian companies that have by now secured a stable market position probably still handle logistics as a subsidiary activity. As a result, warehouse heads may have moved into logistics managerial positions, or; c) dealing with inventory may be a confidential activity, so in many cases a less skilled relative of the owner performs these tasks.
Based on the above we conclude that developing supply channel awareness will be a crucial task of Hungarian companies after EU accession. Summary of the Findings Below are findings, which show in nutshell the logistical situation of mid-size Hungarian companies.
• Logistics costs have mostly increased, the rate of growth not significantly exceeding the inflation rate. The respondents mentioned pull-type operations to a considerably higher degree, though the survey of inventory levels has not confirmed it in all cases. Inventory levels are not adjusted to the system operations in all cases.
• The dominant member can be a manufacturer (e.g. car industry), or a wholesaler/trader. The former is typical of production chains, the latter of sales chains (e.g. FMCG sector).
• The use of logistics service providers differs mainly by industry; the scope of business not being as significant. The use of LSPs differ in fields of different logistics activities. Nearly 50% of companies have no connection to a logistics service provider.
• Turnover time has increased significantly, the difference between industries and scopes of business being more significant than expected.
• In most cases logistics functions are done on a mid-managerial level. Few examples of separate management of logistics functions were found.
• A considerable shortage of logistics approaches can be seen compared to more developed economies. Some of the respondents presumably do not have accurate information about the exact definition and contents of different approaches.
• Planned logistics developments have shifted towards approaches, which, in the respondent’s calculations, do not involve considerable costs.
• The penetration of ERP systems is relatively high leading to the conclusion that Hungary is over the first big ERP wave, the life cycle of this product having passed its peak.
• The use of ERP systems does not necessarily result in positive changes in indicators. Rather, it helps system optimization through a higher-level planned information processing method. The influence of the German economy can also be seen on the use of ERP systems as well.
• Strategic partnerships do not constitute a considerable proportion of co-operation at present. The process has started, though behind the level expected.
Conclusions Supply chain management in Hungary can currently be divided into two levels; classic logistic systems and advanced supply chain management. Classic logistics systems, which aim to minimise costs and maximise customer service levels, are gaining in importance in Hungarian companies, mainly through exposure to multinational organizations as well as modern supply chain software and methods. Much work needs to be done to upgrade systems and educate professionals, particularly Managing Directors, of the importance of supply chain management. As more products reach the marketplace and consumers become more quality and service conscious, SCM will become an ever more important component of branding a product.
2533
The next and more challenging level will be that of integrating supply chains between companies; e.g. between manufacturing, distribution and retail outlets. This will by necessity include proprietary data being shared within companies inside the supply chain, including more information sharing, which may create some resistance from traditional Hungarian companies. While multinational companies have a considerable lead on development and maintenance of such systems, Hungarian mid-size companies have yet to realize the critical nature of such a strategy. This is in part an education process. It will be increasingly important to stress to Hungarian managers and directors the importance of strategic partnerships in distribution. If company executives fail to realize not only the advantages, but the necessity of such partnerships, they will find themselves at a considerable disadvantage when markets open following EU accession in May 2004. At that time companies may find themselves not only lagging behind but short of options for suitable supply chain partnerships.
We agree with Schary & Skjott-Larsen (2001), that competition in the future will be less between “product vs. product”, but more between “supply chain vs. supply chain”. As more products reach the marketplace, service and distribution become ever more critical to a product’s success. While some Hungarian companies are well on their way in the development of both classic logistics systems and even integrated systems, others have yet to even see the importance of such systems. Companies who fail to familiarize themselves with modern integrated supply chain systems do so at their peril.
Finally, a macro-logistics phenomena outside of the scope of this survey should be mentioned. While Hungary’s accession to the EU means considerable challenges, it also presents great opportunities. After accession, Hungary will be at the eastern (Schengen) border of the EU. Because duties paid by non-EU member companies remain in the very EU-member country that collects it, an excellent opportunity exists to create freight villages for trade flowing from both the East and the Southeast. This is a one-time opportunity for Hungary (and other Central-Eastern countries as well). Failure to take advantage of this opportunity would be a loss for the Hungarian economy.
References [1] Ballou, R.H. (1999) : Business Logistics Management, 4th Edition, Prentice Hall [2] Baumgarten H. – Wolff S. (1999): The Next Wave of Logistics: Global Supply Chain e-fficiency, BVL,
Berlin/Boston [3] Chow, G.-Heaver, T.-Henriksson. L. (1994): Logistics Performance Definition and Measurement,
International Journal of Physical Distribution and Logistics Management, Vol. 24 No 1. [4] Christopher, M. (2002): Presentation at the Logistics Conference of the Hungarian Post in November 29 [5] Colin, J. and Fabbe-Costes, N. (1993) Formulation des stratégies Logistiques, in: Logistic and Distribution
Planning: Strategies for Management, Kogan Page, London [6] Fodor, Z. (2005): The Effect of Applying Logistics Information Systems on the Competitiveness of Small
and Medium-sized Enterprises, PhD-Thesis at Corvinus University, Budapest [7] Inkalainen, A.- Vepsalainen, A. (2000): SCM-Redesign, in: Global Supply Chain Management (interim coursebook of
the Council of European Management Schools) [8] Kearney, A.T. (1984) Measuring and Improving Productivity in Physical Distribution, National Council of Physical
Distribution Management, Chicago [9] McGinnis, M.-Kochunny, C.M.-Ackermann, K.B. (1995): Third Party Logistics Choice, The International
Journal of Logistics Management, Vol. 6 No. 2 [10] Schary, P.B. – Skjott-Larsen, T. (2001): Managing the Global Supply Chain, 2nd Edition, Copenhagen
Business –School Press [11] Simchi-Levi, D. - Kaminsky, P. - Simchi-Levi, E. (2000): Designing and managing the Supply Chain,
Irwin McGraw-Hill [12] Szegedi, Z. (1998): Logisztika Menedzsereknek, Kossuth, Budapest, 1998 [13] Szegedi, Z. – Prezenszki, J. (2003): Logisztika-menedzsment (Logistics Management), Kossuth, Budapest,
www.logisztikamendzsment.hu
2534
End Notes
1 “Management Attention has moved from competition between firms to competition between supply chains, encompassing all firms from raw materials to the end customer” Schary, P.B. – Skjott-Larsen, T. (2001), p. 73 2 Number of articles: 0-50 17%, 51-500 30%, 500≤ 53%. 3 Martin Christopher speaks about an upcoming „logistical chaos” because of the diversity and the complexity on this field (Christopher, 2002) 4 For details see: Simchi-Levi – Kaminsky – Simchi-Levi, 2000, and Szegedi-Prezenszki, 2003. 5 e.g. Baumgarten-Wolff, 1998 6 An earlier survey conducted 1998 at Budapest University of Economic Sciences. (Szegedi, 1998) 7 with other words, the flow of the materials at the company will be slower(!) after the introduction on an SAP-system 8 Original Equipment Manufacturer
2535
A Conceptual Framework of Factors Affecting Collaborative Supply Chain Management for Agricultural Produce between Thailand and China
Jongkol Saengadsapaviriya, [email protected]
Maejo University, Thailand Chamnong Jungthirapanich
Assumption University, Thailand
Abstract China and ASEAN countries established ASEAN – CHINA Free Trade Agreement in December 2002. After that Thailand and China established an agreement on accelerated tariff elimination under the early harvest program of the framework on comprehensive agreement in June 2003 in Beijing. And then, the two countries started an FTA program on all vegetable and fruit products on October 1, 2003. The main objectives of this studying are to present the literature reviews of fresh fruits export process, especially the current longan export of Thailand to China , and to propose the conceptual framework of factors affecting collaborative supply chain management of agricultural produce. From the report of Department of Trade Negotiation of Thailand on the international trade between Thailand and China, we found that Thailand has a surplus trade volume to China in agricultural produce from 2004 to 2006. It is increasing every year during 2004 to 2006 (38.5%, 44.14%, and 49.6%). Introduction The world economy is gradually becoming globalized, fueled by the World Trade Organization’s support on the establishment of free trade areas. As a consequence, numerous trade sanctions and constraints in taxes have been deregulated. The change of business environment affects business processes in various dimensions. This necessitates firms to adjust their business processes appropriately to the altered environment, for example, outsourcing of production, outsourcing of distribution, and transformation to high value-added economy. Collaborative alliance among businesses, such as collaborative supply chain management, represents an increasingly-important and favorable alternative for all affected by globalization.
China possesses a mega-scale market. Many countries, including Thailand, are interested in expanding their trade volumes with this country. In 2003, Thailand and China established agreements on accelerated tariff elimination in accordance with the framework on comprehensive economic cooperation. There are two main agreements as follows:
(1) The parties shall eliminate tariffs on all vegetable and fruit produce as soon as possible, and in any
case, no later 1 October 2003. (2) The parties shall apply the rules of the origin and establish a close cooperative mechanism between
the concerned authorities responsible for customs administration and supervision. As necessitated by this bilateral agreements, China and Thailand need to comply with the mutual agreements. Numerous questions on who gains or loses, what industries are favorably or adversely affected from the agreements arise. A study on collaborative supply chain management is thus conceived to shed lights on how the two nations may promote trade and collaboration in both public and private sectors. Research findings may bring about knowledge for improving the collaborative supply chain management of agricultural produce between the two countries under the FTA framework. Objectives of Research This paper is aimed at fulfilling the following:
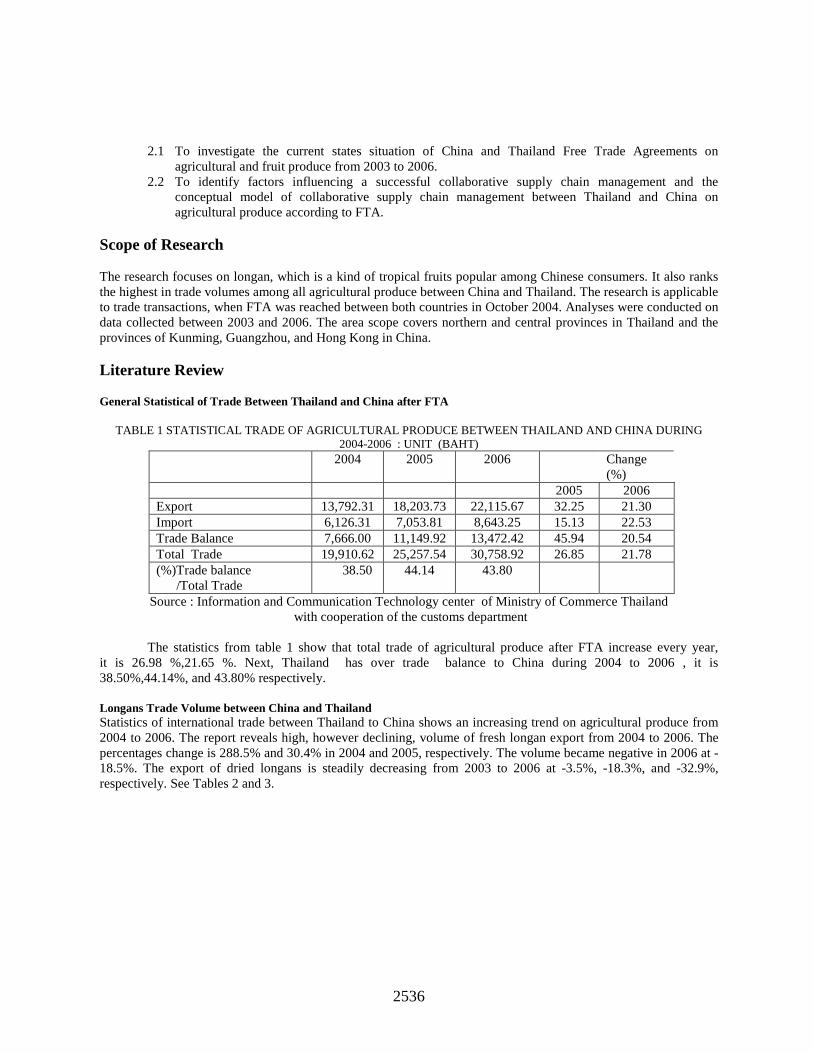
2536
2.1 To investigate the current states situation of China and Thailand Free Trade Agreements on agricultural and fruit produce from 2003 to 2006.
2.2 To identify factors influencing a successful collaborative supply chain management and the conceptual model of collaborative supply chain management between Thailand and China on agricultural produce according to FTA.
Scope of Research
The research focuses on longan, which is a kind of tropical fruits popular among Chinese consumers. It also ranks the highest in trade volumes among all agricultural produce between China and Thailand. The research is applicable to trade transactions, when FTA was reached between both countries in October 2004. Analyses were conducted on data collected between 2003 and 2006. The area scope covers northern and central provinces in Thailand and the provinces of Kunming, Guangzhou, and Hong Kong in China.
Literature Review General Statistical of Trade Between Thailand and China after FTA
TABLE 1 STATISTICAL TRADE OF AGRICULTURAL PRODUCE BETWEEN THAILAND AND CHINA DURING
2004-2006 : UNIT (BAHT) 2004 2005 2006 Change
(%) 2005 2006 Export 13,792.31 18,203.73 22,115.67 32.25 21.30 Import 6,126.31 7,053.81 8,643.25 15.13 22.53 Trade Balance 7,666.00 11,149.92 13,472.42 45.94 20.54 Total Trade 19,910.62 25,257.54 30,758.92 26.85 21.78 (%)Trade balance /Total Trade
38.50 44.14 43.80
Source : Information and Communication Technology center of Ministry of Commerce Thailand with cooperation of the customs department
The statistics from table 1 show that total trade of agricultural produce after FTA increase every year,
it is 26.98 %,21.65 %. Next, Thailand has over trade balance to China during 2004 to 2006 , it is 38.50%,44.14%, and 43.80% respectively. Longans Trade Volume between China and Thailand Statistics of international trade between Thailand to China shows an increasing trend on agricultural produce from 2004 to 2006. The report reveals high, however declining, volume of fresh longan export from 2004 to 2006. The percentages change is 288.5% and 30.4% in 2004 and 2005, respectively. The volume became negative in 2006 at -18.5%. The export of dried longans is steadily decreasing from 2003 to 2006 at -3.5%, -18.3%, and -32.9%, respectively. See Tables 2 and 3.
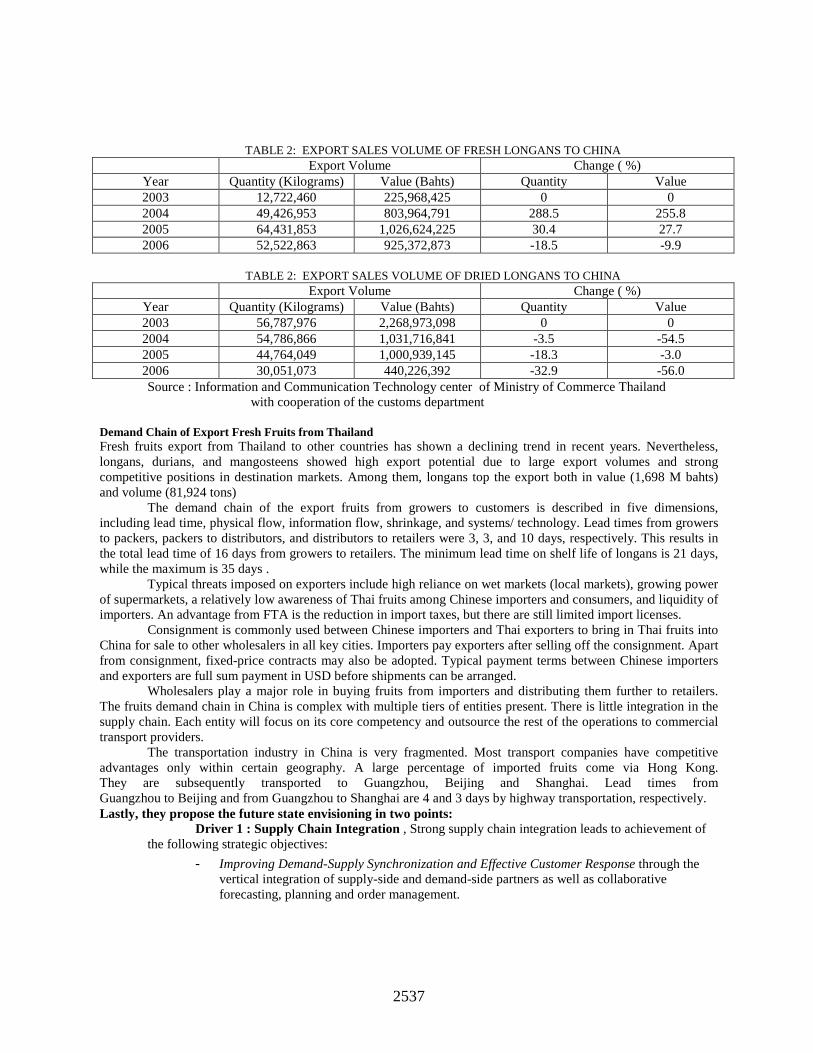
2537
TABLE 2: EXPORT SALES VOLUME OF FRESH LONGANS TO CHINA Export Volume Change ( %)
Year Quantity (Kilograms) Value (Bahts) Quantity Value 2003 12,722,460 225,968,425 0 0 2004 49,426,953 803,964,791 288.5 255.8 2005 64,431,853 1,026,624,225 30.4 27.7 2006 52,522,863 925,372,873 -18.5 -9.9
TABLE 2: EXPORT SALES VOLUME OF DRIED LONGANS TO CHINA
Export Volume Change ( %) Year Quantity (Kilograms) Value (Bahts) Quantity Value 2003 56,787,976 2,268,973,098 0 0 2004 54,786,866 1,031,716,841 -3.5 -54.5 2005 44,764,049 1,000,939,145 -18.3 -3.0 2006 30,051,073 440,226,392 -32.9 -56.0 Source : Information and Communication Technology center of Ministry of Commerce Thailand with cooperation of the customs department
Demand Chain of Export Fresh Fruits from Thailand Fresh fruits export from Thailand to other countries has shown a declining trend in recent years. Nevertheless, longans, durians, and mangosteens showed high export potential due to large export volumes and strong competitive positions in destination markets. Among them, longans top the export both in value (1,698 M bahts) and volume (81,924 tons)
The demand chain of the export fruits from growers to customers is described in five dimensions, including lead time, physical flow, information flow, shrinkage, and systems/ technology. Lead times from growers to packers, packers to distributors, and distributors to retailers were 3, 3, and 10 days, respectively. This results in the total lead time of 16 days from growers to retailers. The minimum lead time on shelf life of longans is 21 days, while the maximum is 35 days .
Typical threats imposed on exporters include high reliance on wet markets (local markets), growing power of supermarkets, a relatively low awareness of Thai fruits among Chinese importers and consumers, and liquidity of importers. An advantage from FTA is the reduction in import taxes, but there are still limited import licenses.
Consignment is commonly used between Chinese importers and Thai exporters to bring in Thai fruits into China for sale to other wholesalers in all key cities. Importers pay exporters after selling off the consignment. Apart from consignment, fixed-price contracts may also be adopted. Typical payment terms between Chinese importers and exporters are full sum payment in USD before shipments can be arranged.
Wholesalers play a major role in buying fruits from importers and distributing them further to retailers. The fruits demand chain in China is complex with multiple tiers of entities present. There is little integration in the supply chain. Each entity will focus on its core competency and outsource the rest of the operations to commercial transport providers.
The transportation industry in China is very fragmented. Most transport companies have competitive advantages only within certain geography. A large percentage of imported fruits come via Hong Kong. They are subsequently transported to Guangzhou, Beijing and Shanghai. Lead times from Guangzhou to Beijing and from Guangzhou to Shanghai are 4 and 3 days by highway transportation, respectively. Lastly, they propose the future state envisioning in two points:
Driver 1 : Supply Chain Integration , Strong supply chain integration leads to achievement of the following strategic objectives:
- Improving Demand-Supply Synchronization and Effective Customer Response through the vertical integration of supply-side and demand-side partners as well as collaborative forecasting, planning and order management.
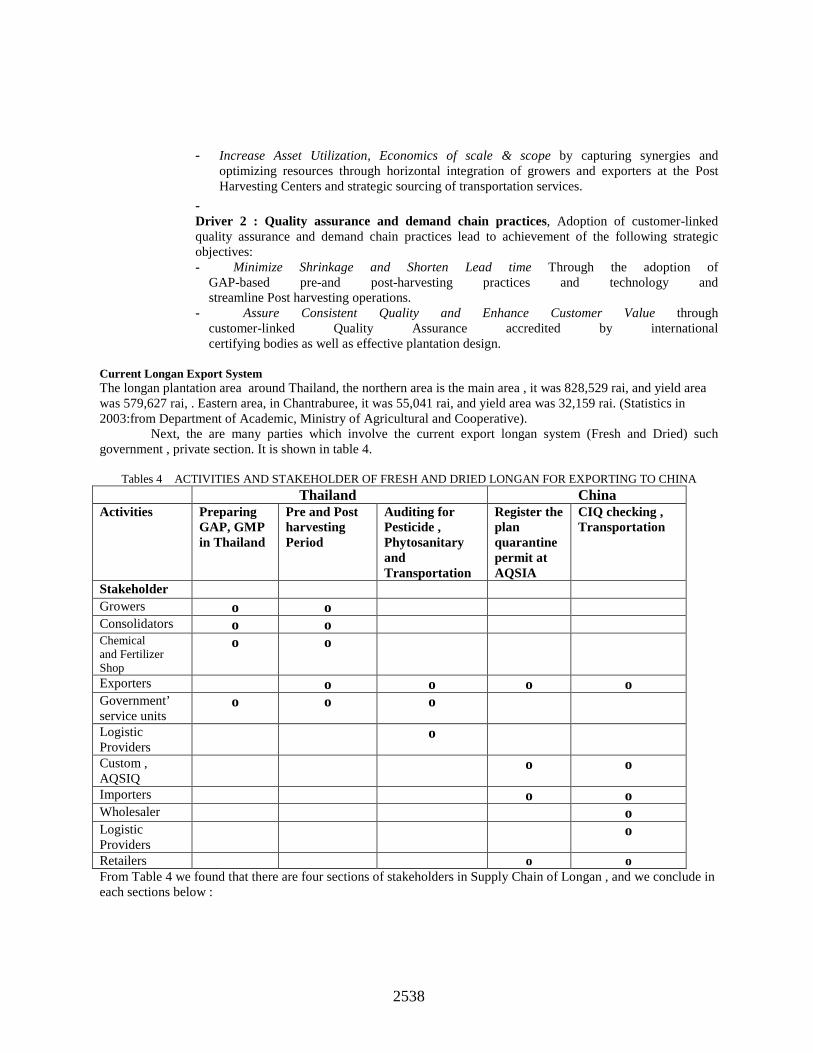
2538
- Increase Asset Utilization, Economics of scale & scope by capturing synergies and optimizing resources through horizontal integration of growers and exporters at the Post Harvesting Centers and strategic sourcing of transportation services.
- Driver 2 : Quality assurance and demand chain practices, Adoption of customer-linked quality assurance and demand chain practices lead to achievement of the following strategic objectives: - Minimize Shrinkage and Shorten Lead time Through the adoption of GAP-based pre-and post-harvesting practices and technology and streamline Post harvesting operations. - Assure Consistent Quality and Enhance Customer Value through customer-linked Quality Assurance accredited by international certifying bodies as well as effective plantation design.
Current Longan Export System The longan plantation area around Thailand, the northern area is the main area , it was 828,529 rai, and yield area was 579,627 rai, . Eastern area, in Chantraburee, it was 55,041 rai, and yield area was 32,159 rai. (Statistics in 2003:from Department of Academic, Ministry of Agricultural and Cooperative).
Next, the are many parties which involve the current export longan system (Fresh and Dried) such government , private section. It is shown in table 4.
Tables 4 ACTIVITIES AND STAKEHOLDER OF FRESH AND DRIED LONGAN FOR EXPORTING TO CHINA
Thailand China Activities Preparing
GAP, GMP in Thailand
Pre and Post harvesting Period
Auditing for Pesticide , Phytosanitary and Transportation
Register the plan quarantine permit at AQSIA
CIQ checking , Transportation
Stakeholder Growers o o Consolidators o o Chemical and Fertilizer Shop
o o
Exporters o o o o Government’ service units
o o o
Logistic Providers
o
Custom , AQSIQ
o o
Importers o o Wholesaler o Logistic Providers
o
Retailers o o From Table 4 we found that there are four sections of stakeholders in Supply Chain of Longan , and we conclude in each sections below :
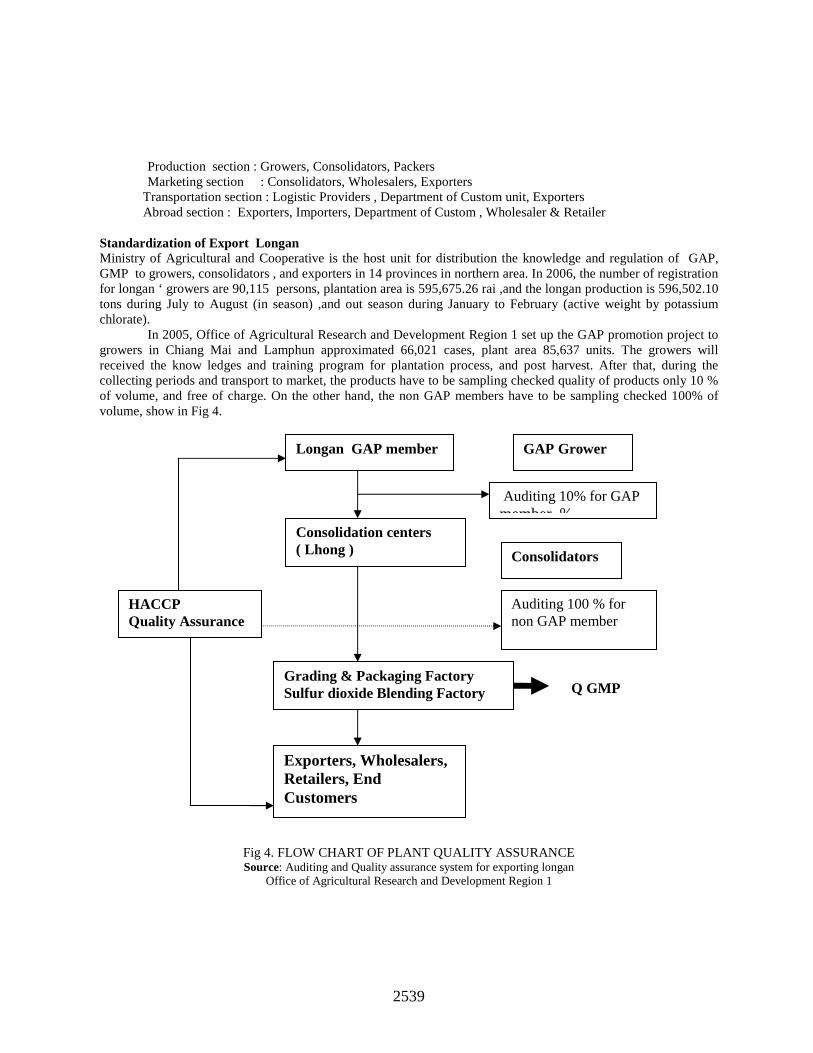
2539
Production section : Growers, Consolidators, Packers
Marketing section : Consolidators, Wholesalers, Exporters Transportation section : Logistic Providers , Department of Custom unit, Exporters Abroad section : Exporters, Importers, Department of Custom , Wholesaler & Retailer Standardization of Export Longan Ministry of Agricultural and Cooperative is the host unit for distribution the knowledge and regulation of GAP, GMP to growers, consolidators , and exporters in 14 provinces in northern area. In 2006, the number of registration for longan ‘ growers are 90,115 persons, plantation area is 595,675.26 rai ,and the longan production is 596,502.10 tons during July to August (in season) ,and out season during January to February (active weight by potassium chlorate). In 2005, Office of Agricultural Research and Development Region 1 set up the GAP promotion project to growers in Chiang Mai and Lamphun approximated 66,021 cases, plant area 85,637 units. The growers will received the know ledges and training program for plantation process, and post harvest. After that, during the collecting periods and transport to market, the products have to be sampling checked quality of products only 10 % of volume, and free of charge. On the other hand, the non GAP members have to be sampling checked 100% of volume, show in Fig 4.
Fig 4. FLOW CHART OF PLANT QUALITY ASSURANCE Source: Auditing and Quality assurance system for exporting longan
Office of Agricultural Research and Development Region 1
Longan GAP member
Consolidation centers ( Lhong )
Grading & Packaging Factory Sulfur dioxide Blending Factory
Exporters, Wholesalers, Retailers, End Customers
HACCP Quality Assurance
Q GMP
Consolidators
GAP Grower
Auditing 100 % for non GAP member
Auditing 10% for GAP member %
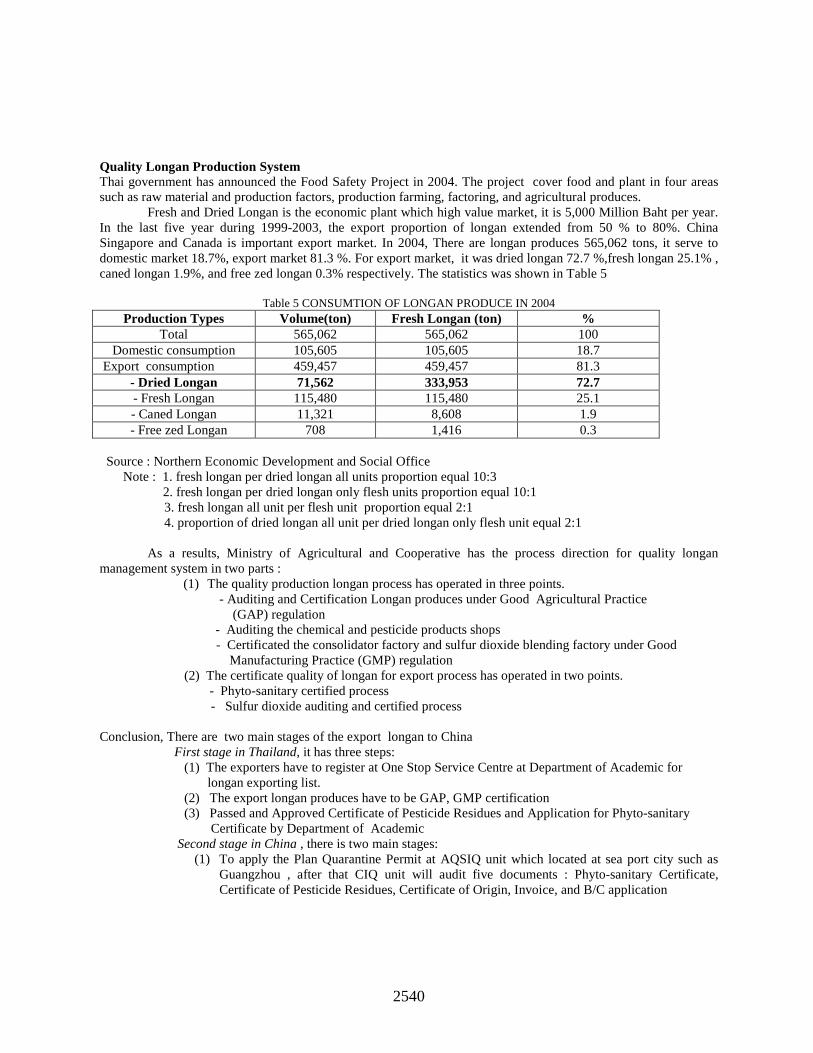
2540
Quality Longan Production System Thai government has announced the Food Safety Project in 2004. The project cover food and plant in four areas such as raw material and production factors, production farming, factoring, and agricultural produces.
Fresh and Dried Longan is the economic plant which high value market, it is 5,000 Million Baht per year. In the last five year during 1999-2003, the export proportion of longan extended from 50 % to 80%. China Singapore and Canada is important export market. In 2004, There are longan produces 565,062 tons, it serve to domestic market 18.7%, export market 81.3 %. For export market, it was dried longan 72.7 %,fresh longan 25.1% , caned longan 1.9%, and free zed longan 0.3% respectively. The statistics was shown in Table 5
Table 5 CONSUMTION OF LONGAN PRODUCE IN 2004
Production Types Volume(ton) Fresh Longan (ton) % Total 565,062 565,062 100
Domestic consumption 105,605 105,605 18.7 Export consumption 459,457 459,457 81.3
- Dried Longan 71,562 333,953 72.7 - Fresh Longan 115,480 115,480 25.1 - Caned Longan 11,321 8,608 1.9
- Free zed Longan 708 1,416 0.3 Source : Northern Economic Development and Social Office Note : 1. fresh longan per dried longan all units proportion equal 10:3 2. fresh longan per dried longan only flesh units proportion equal 10:1
3. fresh longan all unit per flesh unit proportion equal 2:1 4. proportion of dried longan all unit per dried longan only flesh unit equal 2:1
As a results, Ministry of Agricultural and Cooperative has the process direction for quality longan
management system in two parts : (1) The quality production longan process has operated in three points.
- Auditing and Certification Longan produces under Good Agricultural Practice (GAP) regulation
- Auditing the chemical and pesticide products shops - Certificated the consolidator factory and sulfur dioxide blending factory under Good Manufacturing Practice (GMP) regulation (2) The certificate quality of longan for export process has operated in two points. - Phyto-sanitary certified process
- Sulfur dioxide auditing and certified process
Conclusion, There are two main stages of the export longan to China First stage in Thailand, it has three steps: (1) The exporters have to register at One Stop Service Centre at Department of Academic for longan exporting list. (2) The export longan produces have to be GAP, GMP certification (3) Passed and Approved Certificate of Pesticide Residues and Application for Phyto-sanitary Certificate by Department of Academic Second stage in China , there is two main stages:
(1) To apply the Plan Quarantine Permit at AQSIQ unit which located at sea port city such as Guangzhou , after that CIQ unit will audit five documents : Phyto-sanitary Certificate, Certificate of Pesticide Residues, Certificate of Origin, Invoice, and B/C application
2541
(2) CIQ will check volume and quality of products by sampling check, waiting the result from laboratory 1-4 days, but it takes time only one day in normal case. If it does not approve, it may be rechecked again or destroy pass, it depend on the regulation of each city.
Supply Chain Management and Collaborative Supply Chain Concepts Supply Chain Management (SCM) has been a major component of competitive strategy to enhance organizational productivity and profitability( A. Gunasekaran et al, 2004). Jame R Stock Douglas M. Lambert (2001) describe the meaning of SCM is the integration of key business processes from end user though suppliers that provides products, services, and information that add value for customers and other stakeholders. Next, SCM aims to increase sales, reduce costs and make full use of assets by streamlining the interaction and communication of all participants along the supply chain . And SCM solutions use networking technology to link suppliers, distributors, and business (Sarika Kulkarni and Ashok Sharma, 2005).
Supply Chain collaboration facilitate the cooperation of participating members along the supply chain to improve performance (Togar M et al,2005;Bowersox,1990). Micael Dell, and CEO of Dell Computer and Industry Week’s CEO of the Year for 1998 declare “ Collaboration is the new imperative”. Collaborative and alliance relationships for the procurement of noncommodity items and services tend to result in the lower total costs than do transactional relationships for several reasons. Then, Stanley and Person found the three most important factors in a successful buyer-supplier relationship are (1) two-way communication, (2) the supplier’s responsiveness to supply management’s needs, and (3) clear product specification. Both collaborative and alliance relationships require a quality of management not common in the 1990s.(David N . Burt et al.2004)
Collaborative Supply Chain (CSC) has purposed to gain competitive advantage ,by improving overall performance through taking a holistic perspective of the supply chain. The model of CSC has six constituents: stakeholders, processes, business strategy, enabling technology, level of collaboration, technology. The four core supply chain processes are plan, source, make, deliver , their performance influences the performance of the whole collaborative supply chain. And each of the four core processes is influenced by the changes in the other constituents as well. For example better collaboration may improve information visibility and effect the core processes. Then, collaborative supply chain performance will depend on the nature of the specific CSC by selecting variables which affect in any of the six constituents such as cost, capacity utilization, customer demand customer satisfaction, time to market etc.(Berhard J. Angerhofer al et, 2005). Moreover, Ponchai(2002) find that Information technology(IT) , information sharing and trust are positive related to effective collaboration.
In addition, there are two main factors which affect to CSC, it is trust and communication. Trust is the degree to which partners perceive each other as credible and benevolent and is expected to have a positive effect on the degree of collaboration in supply chain relationships( Niklas Myhr et al.,2005;Doney and Cannon,1997;Ganesan,1994;Kumar et al.,1995). Communication between partners help boost mutual understand and trust. So , The excellent communication quality and frequent communication help improve mutual understanding , and also increase trust.And then affect to Cooperative supply chain relationships. (Yin-Pin Yeh,2005; Kumar,1996).
Finally, we present a potential conceptual framework for collaborative supply chain performance measurement by developing from the previously conceptual framework in Fig 2 and purposed conceptual framework in Fig 3.
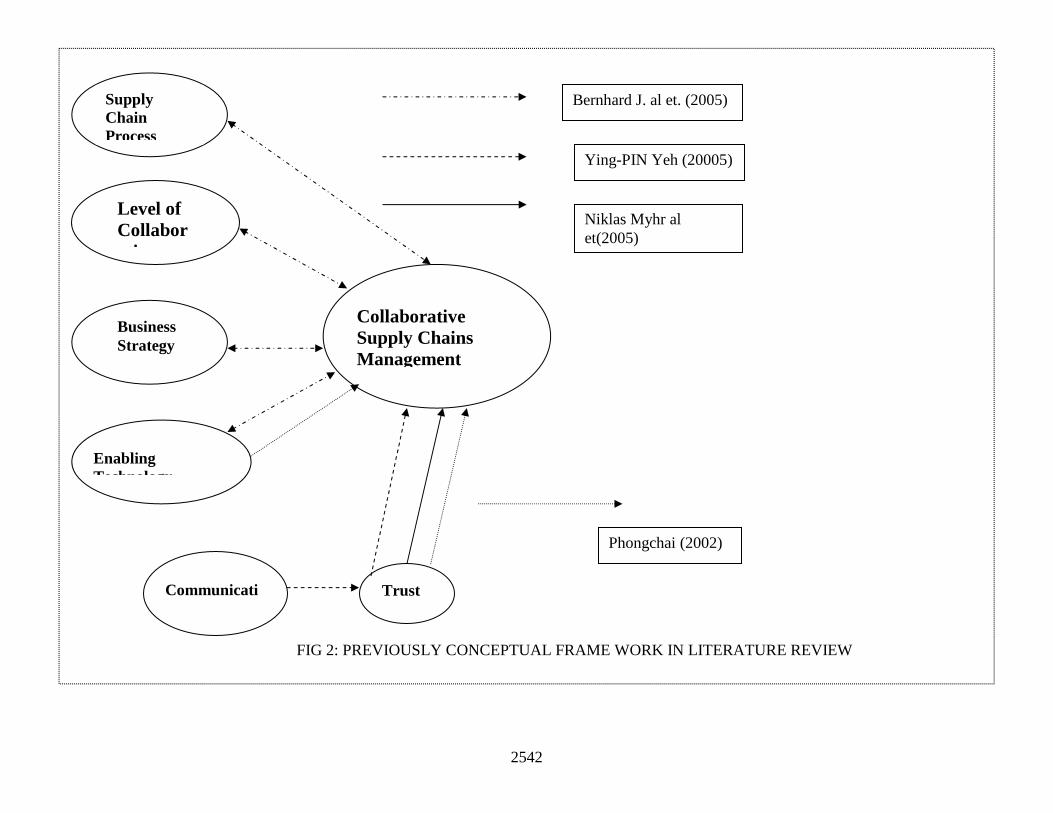
2542
Collaborative Supply Chains Management
Enabling Technology
Trust
Business Strategy
Supply Chain Process
Level of Collaboration
FIG 2: PREVIOUSLY CONCEPTUAL FRAME WORK IN LITERATURE REVIEW
Communication
Ying-PIN Yeh (20005)
Bernhard J. al et. (2005)
Phongchai (2002)
Niklas Myhr al et(2005)
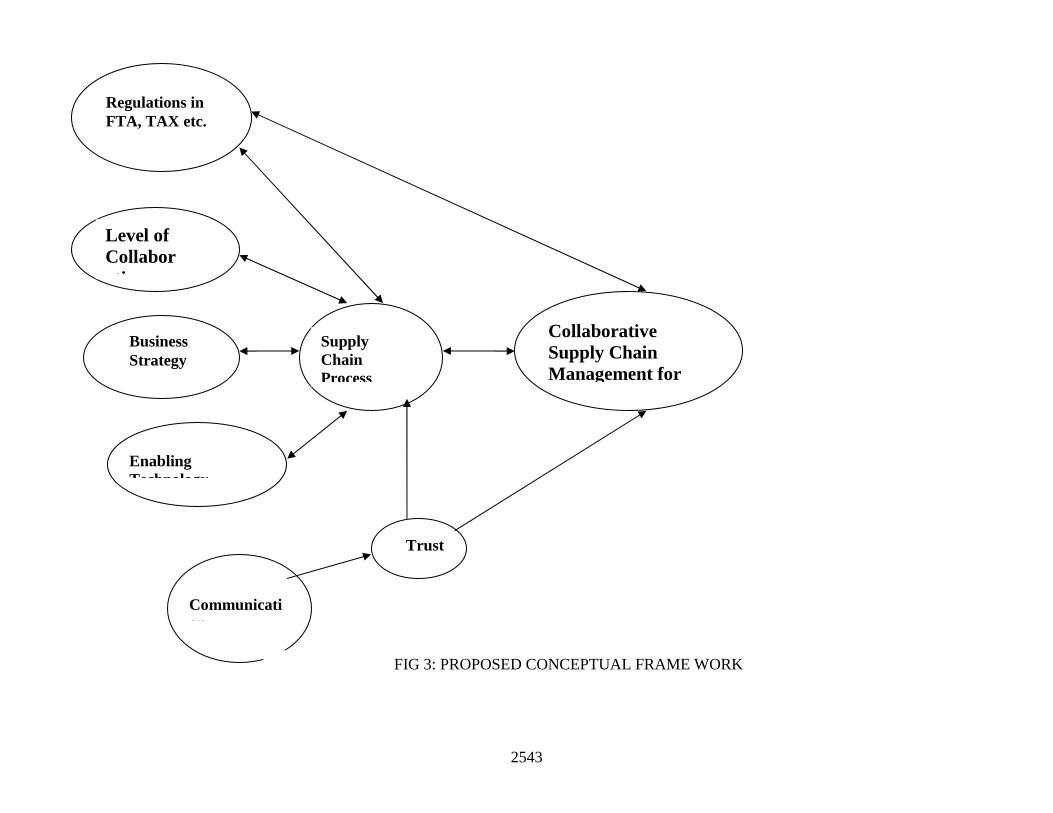
2543
Collaborative Supply Chain Management for
Enabling Technology
Trust
Regulations in FTA, TAX etc.
Business Strategy
Supply Chain Process
Level of Collaboration
Communication
FIG 3: PROPOSED CONCEPTUAL FRAME WORK

2544
Research Methodology in the future From literature review above , we follow the objectives of research by working on process below : (1) Define the target of study and searching secondary data of exporter database from private sectors, and
government sectors likewise. (2) To analyze secondary data and set up the process flow analysis and build a model
collaborative supply chain (CSC) and derive the suitable performance indicator for measurement.
(3) Auditing the model of CSC and performance indicators with academic experts and field experts for approving the suitable model and then pretest by pilot study.
(4) Collecting data by questionnaire survey , interview personnel from stakeholder (5) Analyze data and Testing model by Structural Equation Model (SEM) (6) Validation test the CSC model, conclusion, implication and reporting. Expected results We hope that the results of study will bring the high benefits conducive for two countries in three points: (1) A strategy to make the collaborative supply chain work for expansion of export market and decrease the
problems in each process. And also, this strategy is applicable to other products under FTA module. (2) To upgrade the standardization of agricultural produces of Thailand and China for competition in the world
class agricultural business, such as, USA or European countries in the future. (3) The government organization such as Ministry of Agriculture and Cooperatives , Ministry of Commerce,
Ministry of Industry, Ministry of Education, and Ministry of Transportation, etc. will use the results of studied for set up the cooperate plan , and strategy for development countries simultaneously.
Conclusion From the general information of FTA situation above, in the review literature part 4.1 to 4.4 , we find that Thailand and China have expanded the trade volume every year, approximately 20% per year . Although there are not any tariff barriers, there are still other barriers such as marketing system, transportation system, auditing product system , payment system etc. However, Thai government announced a food safety policy in 2004 , especially the food for export product. Therefore, the stakeholders of agricultural produce exporting in Thailand are interested to follow the GAP , GMP and HACCP programs . As a result, the current longan export of Thailand is qualified product for international markets , and it makes importers in China more confident. But, Thailand has to consider the cooperate plan for all stakeholder in Thailand and China by selecting optimal exporting plan and business strategy for exporting longan because longan’s yield are over supply in domestic markets , 80% of longan’s yield per year are export product, and China is the biggest international market. In addition, the study of demand chain of fresh fruits export from Thailand suggests the future state for development of fresh fruits export system for competition in global market in two points : supply chain integration method, and quality assurance and demand chain practices. Therefore, the supply chain technique should be applied to fit developing export systems. We find that the collaborative supply chain concept is a new business strategy in 2000s , and there are many factors which affect collaborative supply chain . In addition, from the review literatures of supply chain management practices only business sectors such as retail hyper market, and E-commerce. Therefore, we should study how to apply the technique in agricultural produce , especially the international trade under the FTA condition. We expect that the results of this study will highly benefit all stakeholders of Thailand and China, and also other countries which are in the process of similar FTA program.
2545
References
[1] A. Gunasekaran ., C. Patel., Ronald E. McGaughey. (2004) . A framework for supply chain performance
measurement International Journal of Production Economics 87 (2004) 333 - 347. [2] Berbhard J. Angerhofer, Marios C. Angleides (2005). A model and performance measurement system for
collaborative supply chain. Decision Support Systems xx (2005) xxx-xxx. [3] David N.Burt, Donald W.Dobler, Stephen L.Staring(2004). World Class Supply Management :The Key to
Supply Chain Management , Seventh Ed, Mc Graw Hill.,2004. [4] Information and communication technology center with cooperative of the Customs Department and
Ministry of Commerce,2006. [5] Kumar , N., Scheer,L.K and Steenkamo, J.B.E.(1995), The effects of Perceived Interdependence on Dealer
Attitudes.Journal of Marketing Research.Vol 32,No. 3, pp 348-356. [6] Niklas Myhr, Robert E. Spekman(2005). Collaborative supply chain partnerships built upon trust and
electrically mediated exchange. Journal of Business & Industrial Marketing. 20/4/5, 179-180. [7] Office of Agricultural Research and Development Region 1, Department of Agricultural Academic
Ministry of Agricultural and Cooperate. Auditing and Quality Assurance System for Exporting logan, September, 2003.
[8] Pongchai Sirinaruemitr(2002) , The Enablers of Effective Supply Chain Collaboration. Thai Retailing : A Case Study ,Dissertation American University of Hawaii.
[9] Sasin Institute & Bearing Point (2005). Feasibility Study for Investment to Improve the Demand Chain Supporting the Export of Fresh Fruits in Thailand, Chulalongkong University, Bangkok.
[10] Sarika Kulkarni & Ashok Sharma(2005) . Supply Chain Management. 1st ed. Tata McGraw-Hill ,New Delhi.
[11] Togar M., Ramaswamit(2005). The Collaboration index:a measure for supply chain collaboration. International Journal of Physical Distribution& Ligistic Management. Vol 35,No. 1, pp 44-62.
[12] Ying-Pin Yeh(2005). Identification of factors affecting continuity of cooperative electronic supply chain relationships:empirical case of the Taiwanese motor industry. Supply Chain Management: An International Journal. 10/14 (2005) 327- 335.
[13] www.nesdb.go.th/national/competitivenesss/attach/MasterPlan-Draf.pdf. [14] www.thaifta.com/thaifta/Portals/english/eng_ascn_fa..pdf [15] www.thaifta.co/thaifta/Portals/0/file/storyboard/ascn_fathcn.pdf.
2546
Supply Chain Collaboration in a Vendor Managed Inventory Environment
Booi Hon Kam, [email protected] Ramaswami Sridharan
RMIT University Paul Yang
Integrated Logistics Berhad
Abstract Simatupang and Sridharan (2005) contend that a collaborative supply chain requires a reciprocal approach to capture five interacting features: a collaborative performance system, information sharing, decision synchronization, incentive alignment, and integrated supply chain processes. They argue that chain members need to educate each other about their needs in the joint development of a mutually beneficial collaborative process. This paper furthers that thesis by asserting that the extent to which the reciprocal approach could effectively contribute to heightening the interactions of the five key features is, in turn, dependent on the power regime in the supply chain. It will demonstrate how a reciprocal approach could be facilitated in practice in a Vendor Managed Inventory (VMI) environment by citing the case of PCM, a computer manufacturer, which utilized the services of a third party logistics service provider to successfully manage its VMI operations. Introduction Vendor managed inventory (VMI) is one of many forms of strategic supply chain collaboration. Its main benefits can be generalized into reduced inventory costs and improved customer services (Yao et al., 2005). Though it has been demonstrated that VMI is beneficial for both the buying and selling parties (Dong and Xu, 2001), there are limitations to this form of supply chain collaboration. One of the most common concerns is the uneven distribution of the beneficial spin-offs resulting from inventory reduction among buyers and suppliers (Yao et al. 2000). There is also the risk that the total supply chain cost is never reduced, as the powerful buyers could have pushed the cost to the upstream parties. Dong and Xu (2001) reaffirm this risk, stating categorically that there must be lower overall inventory levels before the benefits of VMI could be dispersed to all parties involved in the arrangement.
Power plays and opportunistic behavior emerge in situations where either suppliers participate out of lack of choice, putting the VMI sponsor in a position of power in the relationship (Kumar, 1996), or material shortages occur, giving suppliers little incentive to participate in a VMI system (Wright, 2002). The former is especially prevalent in a depressed economy when demand is low and supply runs high. The latter is typically the case in a burgeoning economy. Other things being equal, the buyer or manufacturer, through its dominant position, would usually be the sole beneficiary in the short term, and all other parties involved would bear the costs (Dong and Xu, 2001).
A supply chain in which the benefits are not “equitably” distributed cannot be sustained in the long term. To ensure that a VMI arrangement could be sustained sufficiently long to disseminate its benefits to all parties involved, suppliers must be given the necessary inducement to entice them to participate in a VMI program regardless of economic outlook. Yao et al. (2005) note that in some operations extra or additional side incentives are dispensed to appease the suppliers and to garner their cooperation. In addition, some suppliers are also allowed or encouraged to leverage their inventory positions at the VMI hub to explore alternative benefits. The limitations of a VMI program are not insurmountable. They can be mitigated if the factors underpinning supply chain collaborations are understood. For instance, suppliers do stand to benefit from a VMI program if their original holding costs are high. Because VMI requires the participation of external parties, the key challenge is to ensure that all parties derive benefits from this arrangement. The key issue is whether the VMI program sponsor has the
2547
tenacity and the will to implement all the processes and changes necessary to bring benefits to all parties of the supply chain at the outset.
Simatupang and Sridharan (2005) contend that a collaborative supply chain requires a reciprocal approach to capture five interacting features of collaboration: collaborative performance system, information sharing, decision synchronization, incentive alignment, and integrated supply chain processes. They argue that chain members need to engage each other in a dialogue about these key collaborative features and to educate each other about their needs in the joint development of a mutually beneficial collaborative process. This paper furthers that thesis by asserting that the extent to which the reciprocal approach could effectively contribute to heightening the interactions of the five key features is, in turn, dependent on the power regime in the supply chain. It will demonstrate how a reciprocal approach could be facilitated in practice in a VMI environment by citing the case of PCM1 a computer manufacturer, which utilized the services of a third party logistics service provider (3PL) to successfully manage its VMI operations.
The next section will discuss the five key features of supply chain collaboration based on the framework of Simatupang and Sridharan (2005) and why the reciprocal approach needs to be juxtaposed in the context of the supply chain power regime. This will be followed by the presentation of PCM’s VMI program drawn from Yang (2006). The paper will conclude by examining the implications of supply chain collaboration in a VMI environment. Collaboration and Power Regimes in Supply Chain Operations Collaboration has been hailed as the driving force of effective supply chain management (Horvath, 2001). Barratt (2004) notes that supply chain collaboration can be divided into two main categories: vertical and horizontal. The former refers to collaboration with suppliers, between different internal divisions of the organization (across functions), and with customers. The latter signifies collaboration with competitors, between internal organizational divisions, and with non-competitors. Simatupang et al., (2002) provides an even simpler viewpoint, suggesting that supply chain collaboration means two or more chain members working together to accomplish some specific tasks. Since supply chain activities involve the participation of multiple parties, all supply chain operations, in a sense, would require some forms of collaboration.
The basic premise of supply chain collaboration is that chain members could effectively fulfill customer demand at less cost (Simatupang and Sridharan, 2002). To ensure the success of their collaborative efforts, collaborating chain members would typically create a common strategic objective, followed by building commitment to, and maintaining alignment of, their interface processes with the strategic objective (Simatupang and Sridharan, 2002). Invariably referred to as integrated supply chain process, this is one of the five features in the supply chain collaborative framework of Simatupang and Sridharan (2005). Business process improvement, for instance, is one key element of collaboration to deal with the bullwhip effect (Lee et al. 1997). Building process alignment to reduce uncertainty and variability of supply chain processes requires two closely interwoven ingredients: information sharing and joint decision making (i.e., the allocation of decision rights) in managing supply chain activities, which include demand forecasting, order batching, product rationing, and product pricing.
Information sharing, which refers to the ability to mutually access data among chain members’ systems, enables the tracking of products as they pass through the supply chain (Simatupang and Sridharan, 2002). This activity, which constitutes one of the five features of the Simatupang and Sridharan’s framework (2005), covers data acquisition, processing, representation, storage, and dissemination of demand conditions, end-to-end inventory status and locations, order status, cost-related data, and performance status. Data visibility, be it key performance metrics or process data, is critical to the decision process: it enables participating members to purview the bigger picture of situations to ensure that important factors could be taken into account in decision making (Simatupang and Sridharan, 2005).
Simatupang and Sridharan (2005) further argue that information sharing is glue that integrates other features into a whole. If supply chain operations are the outcomes of informed decisions, action becomes visible too when chain members understand and appreciate the underlying principles that drive performance. Information sharing thus facilitates decision synchronization, another of the five key features identified by Simatupang and Sridharan (2005), through providing relevant, timely, and accurate data for supply chain planning and execution. Relying on demand and inventory visibility to eliminate stock-outs by accurately replenishing hot products exemplifies the role of information sharing in synchronizing decisions (Fisher, 1997). Likewise, noted supply chain
2548
initiatives, such as the Quick Response Programme (QRP), Continuous Replenishment (CR), Efficient Consumer Response (ECR), and Collaborative Planning, Forecasting and Replenishment (CPFR), are outcomes of informed joint decision making in process improvements to minimise variability, waste, and costs along the supply chain (Barratt and Oliveira, 2001; Frankel et al., 2002; Ireland and Bruce, 2000).
Like all outcomes of decision processes, the effects of supply chain collaboration require tangible appraisals. Because supply chain performance relates to intercompany, rather than individual organizational, performance (Lambert and Pohlen, 2001), collaboration in developing a common performance metric system, e.g., process metrics like perfect order, cash-to-cash cycle, and new product development which span the supply chain (Lapide, 2000), is the fourth key feature propounded in Simatupang and Sridharan’s (2005) framework. Since performance metrics drive behaviour, a collaborative performance system could thus direct chain members to take actions that complement each other’s role, thereby contributing to mutually beneficial outcomes.
While performance metrics may drive behaviour, an incentive mechanism is needed among chain members to reward the attainment, and punish non-conformance, of agreed-upon performance targets (Narayanan and Raman, 2004). Corbett et al. (1999) empirically illustrated that process improvement, such as inventory management and order fulfilment, has a higher probability of success when chain members become involved in aligning joint optimisation rules with logistics and commercial benefits. On the strength of these findings, Simatupang and Sridharan (2002) argue that incentive alignment, which includes cost, risk, as well as benefit sharing amongst participating members, is the fifth key element for successful collaboration. Incentive alignment motivates chain members to act in a manner consistent with their mutual strategic objectives, and to make decisions optimal for the overall supply chain. According to Simatupang and Sridharan (2005), the above five features - a collaborative performance system, information sharing, decision synchronization, incentive alignment, and integrated supply chain processes - underpin the core of a collaborative supply chain. Each feature is an enabling factor that facilitates collaborative actions. It is the interactions of the five features that create the synergy that contribute to successful supply chain collaboration, which Simatupang and Sridharan (2002, 2005) term the reciprocal approach. For instance, monitoring and regular evaluation of collaborative performance determines what must be changed in the features of information sharing, decision synchronization, and incentive alignment in an attempt to enable chain members to continuously create or re-create integrated supply chain processes. Likewise, incentive alignment, which links collaborative performance systems to incentives, could motivate chain members to ally their actions, including the willingness to share critical information and synchronizing decisions to the mutual purpose of collaboration, further reinforcing the desired level of performance. The merit of Simatupang and Sridharan’s framework (2005), as distinct from other models of supply chain collaboration, is that it promotes reciprocal linkages among the five features, as outlined earlier. The reciprocal approach captures the interacting effects of the five elements in ways that contribute to the achievement of collaborative performance. It is the thermostat in the collaborative supply chain, identifying and regulating enablers that facilitate collaborative actions. The reciprocal approach, unfortunately, is not an organically evolving and adapting agent. Its prowess in effectively orchestrating the interacting process required of the five features to produce the synergy needs facilitation in the first instance. This is because all supply chains, which involve the contribution of multiple team members, are underscored by specific power regimes (Cox et al., 2000; Cox et al., 2001).
Power regimes exist in supply chains because the relationships between participating members in a supply chain are not necessarily always interdependent in their business dealings. The possibility that any one member may dominate over other members as well as members may have come together merely because of a convenient arrangement could give rise to a complex web of power relationships between participating members in a multiple dyadic exchange scenario. As illustrated by Cox et al., (2001) in a dyadic exchange scenario between two members (A and B) in a supply relationship, there are four plausible regimes: A dominates over B; B dominates over A; A and B are interdependent; and A and B are independent of one another.
The structure of the power regimes existing within a supply chain dictates the ownership and control structures of the chain, carrying significant implications for its operations. This is because organizations do not participate in supply chain operations to create products and services to provide value to customers, but to make
2549
money for themselves and for those involved in the chain through production and delivery (Cox et al., 2001). Cox et al. (2001) contend that there are three sets of value in the context of supply chain operations:
� customer's value proposition: this refers to the utility that customers derive from acquiring the products or services rendered by members of the chain;
� value-adding process: this refers to the transformation process that takes place within member organizations as they convert less valuable supply inputs and into more valuable supply outputs; and
� value appropriation: this refers to the amount of money extracted by each member organization from participating at a particular stage in the supply chain. Inevitably, the manner in which value is appropriated among supply chain members in their attempts to add
value to supply inputs to meet customer value propositions would be linked to the structure of the power regime existing within the chain. A supply relationship in which one member dominates over another is likely to lead to an inequitable distribution of benefits, or incentive misalignment as per one of the five features of Simatupang and Sridharan’s framework (2005). If incentive alignment is an enabling factor that supports the promulgation of the other features (Simatupang and Sridharan, 2005), incentive misalignment would not, in all likelihood, lead to information sharing and decision synchronization. The collaboration, in short, is less likely to survive.
Understanding the extent to which the enabling effect of the reciprocal approach could be manifested would, therefore, require an appreciation of the ownership and control structures of particular supply chain resources, including the relationship between physical properties and the flow of value that occurs in the chain (Cox et al., 2001). In short, supply chain collaboration must further incorporate a holistic and inclusive understanding of the financial, in addition to physical, properties of supply chain networks based on the structure of the power regimes existing within it: how all participating members could derive sufficient benefits from their contribution to sustain their continual participation. The existence of alternative power regimes suggests that, for the five features that underpin the supply chain collaboration architecture discussed in Simatupang and Sridharan (2005) to work, a supply chain needs to be grounded within the context of its power relationship. This point will be illustrated in the case of PCM, which follows. The PCM’s VMI Program (based on Yang 2006) PCM, a leading computer manufacturer, implemented a VMI program involving over 12,000 active parts at its operations base in an economic free zone in the Peoples Republic of China in 2000. Over 220 plus suppliers were involved in the program. Though the 220 plus suppliers dealt with different parts, they assumed similar roles and responsibilities. By collectively referring them as the vendors, the VMI operations of PCM would comprise three parties: PCM (the manufacturer), the vendors (220 suppliers), and a third party logistics provider (the 3PL). One of the distinctive features of PCM’s VMI program, therefore, was the presence of a 3PL, which is not usually the case in a conventional VMI model. Contractual Relationships The triadic relationship was bounded by three separate sets of contractual agreements. These agreements defined the objectives and responsibilities upfront of the parties involved in supporting PCM’s round-the-clock production activities.
PCM had a warehouse service agreement with the 3PL governing the production space rental from the 3PL and also the picking and delivery-to-production services. The agreement between PCM and each of the 220 suppliers covered the ‘Statement of Works’ concerning the availability of the raw materials for production. Based on this statement, the suppliers would compute the required production and send their raw materials and parts to PCM, according to the production requirements and the rules stipulated in the statement. Inventory management was under the responsibility of the 3PL, which was to ensure the integrity of the cargo information.
Between the 3PL and the suppliers was a standard agreement for warehouse storage, handling charges and use of the warehouse management system (WMS) operated by the 3PL for inventory management and supply chain visibility. Once the suppliers signed up for the VMI operations, they would bear the logistics costs as they arose in accordance with their usage. The billing function, receiving of cargo, quality checking, repackaging (certain parts)
2550
and remarking of cartons were done by the 3PL on behalf of the suppliers. The VMI Flow Process PCM’s VMI program supporting its 24 hours a day, 7 days a week production line can be divided into two flow processes: operations flow and commercial flow. The former involved information flow and physical cargo movements and the latter, the financial responsibilities of the parties involved.
PCM’s VMI operations flow can be explained in the following sequenced process: 1. Flow 1 – Based on the online customer demand information, PCM would compute a rolling 12-month
production forecast on all its products. This production forecast would be updated and transmitted to suppliers every two days. In each production forecast released, it would confirm the 2-day forecast, and indicate that the 2-week forecast would most likely be confirmed unless notified otherwise.
2. Flow 2 – This forecast would be shared instantaneously with both local and overseas suppliers. Based on this forecast, suppliers would send the required parts to the VMI warehouse (also known as the VMI hub).
3. Flow 3 – At the commencement of the production assembly lines, PCM, through its enterprise resource planning (ERP) system, would issue a pull ticket to the VMI hub for the picking process to begin.
4. Flow 4 - Warehouse personnel would pick and pack the parts into specific product kitting boxes and would send them up to the production line via an automated conveyor system.
5. Flow 5 – The inbound and picking information of the parts would be updated instantly into the warehouse management system (WMS) run by the 3PL. Both suppliers and PCM would be alerted on all inbound and outbound parts and could check inventory levels at any time.
Lastly, suppliers would then compare production forecast with actual usage, plus existing inventory levels – to make replenishment orders into the VMI hub. Information on the physical movement of inventory would be captured by the 3PL’s WMS and then updated to the PCM’s ERP. PCM’s VMI commercial flow operated on a consignment stock basis. All suppliers would place their stock at the VMI hub on consignment. Only when PCM took physical receipt of the parts at the production assembly line was the ownership of the parts transferred from the suppliers to PCM. Suppliers were required to underwrite the following costs:
� VMI hub (i.e., warehouse) storage charges, which included warehouse inbound loading and handling charges;
� transportation charges from their factories to the hub; and � all logistics costs incurred by the parts before arriving at the production or assembly line.
PCM would only pay for picking and special kiting services, plus any logistics costs incurred in the production or assembly process. The costs of the IT systems were borne jointly by the suppliers and PCM, based on a cubic meter unit rate on the parts throughput via the VMI hub.
Under the consignment stock arrangement, PCM was not obligated to pay its suppliers until the part was consumed during production. In addition, suppliers would usually extend a credit term of 30 – 45 days to PCM. Most of PCM’s products were sold freight on board. Therefore at the time when PCM recognized its supplier’s liability, it would have already collected money from its end customers and have a positive cash flow of 30 to 45 days before having to pay its suppliers. Information Systems Central to the flow of information in PCM’s VMI operation were the ERP system and the WMS. The ERP system was owned and managed by PCM and was used to administer the production function. The WMS was owned and managed by the 3PL. The WMS managed the entire physical movement of the operation and also all information flows related to logistics activities. Both the ERP and WMS were connected via a set of communication protocols to ensure inventory balances were identical in both systems.
The WMS stood at the core of the VMI operation. It was the ‘command center’, issuing all instructions that triggered the activities in the VMI operation. The system performed three major functions: maintaining inventory visibility; issuing operation signals; and managing billing processes. By maintaining inventory visibility, the WMS ensured that the supply chain was visible to the manufacturer and all suppliers. It supplied information, such as current inventory status, receiving reports, and parts picked to all concerned parties.
2551
The WMS also managed the pick and replenishment signals. When the PCM production line required the parts, its ERP system would issue a pull signal to the 3PL’s WMS. The WMS would then issue a pick list for the warehouse staff to pick the cargo and place them into a kitting box, which was designed ergonomically to ensure that the production line could use the parts in sequence for assembly. In turn, when the inventory level in the warehouse was below the pre-determined threshold, the WMS would also transmit replenishment signals to the suppliers. As its third major function, the WMS managed the billing aspect of the VMI program, assuring all transactions to be paid according to the contractual rules set up in the triadic relationship.
In addition to the ERP and WMS housed in the same physical facility, PCM’s VMI operation also used an Internet web portal provided by the 3PL to act as an information consolidator, extracting information from the WMS and offering instant visibility to all parties, facilitating communication and information sharing with the multiple suppliers.
Due to a variety of reasons, not all suppliers were able to interact with the Internet portal. This was especially true for suppliers of low value items, such as plastic cases and parts, who might not have the communications technology infrastructure but nevertheless supply quality products at low prices. There were, however, also suppliers more advanced in their technology uptake, and would require dedicated line access to the WMS and automated push-pull signaling of information. PCM allowed information connectivity with the suppliers at three levels:
i. A premium dedicated line access interface; ii. Internet portal access (used by most suppliers); and iii. Conventional telephone line access via fax and human interface, accessible by non-critical, lower value suppliers.
Centralized Production and Warehouse Facility Another distinctive feature of PCM’s VMI program was that it did not own any physical facilities. The entire facility, comprising the warehouses and the production lines, were housed in three buildings located within the same compound provided by the 3PL. Besides warehouse storage and production line activities, the facilities were also used for modular assembling. Some minor assembly activities were required for some of the parts. The warehouse facilities also provided the space needed for some suppliers to finish their products before entering the production line. This was particularly popular among suppliers who required external parts to be attached to their products. These suppliers would arrange for the external parts to be delivered to the VMI warehouse where minor assembly or packing was done to finish the product. Examples included attaching power cables to disk drives.
Once the products were assembled at the production line, they would be routed to the quality control section on the production floor. After quality checks, they would be immediately brought to the loading bay to be loaded directly onto waiting trucks for shipment. Finished goods thus required no post-production storage at the VMI hub. Roles of the 3PL The 3PL was the linchpin of the entire VMI operation. At the operational level, the 3PL carried out the physical logistics activities of the VMI program. At a functional level, it managed and controlled both the information and physical flows. At the strategic level, the 3PL was responsible for overseeing the continuous supply of parts to the production line to ensure that it would not be disrupted due to unavailability of stock. This means that the 3PL was fully responsible for ensuring suppliers’ participation meet all targets of customer fulfillment.
The 3PL was also tasked with managing and implementing minor assembly and quality checks, such as finishing works on computer keyboards and assembly of computer cases. For pre-production quality checking, the 3PL was tasked with ensuring the quality of memory chips, processor chips, and hard disk drives. Prior to delivery of parts to the production line, the 3PL would ascertain the quality of these parts to avoid production stoppages due to quality issues. Benefits to PCM The VMI program was launched to enable PCM to embrace a full postponement strategy for its manufacturing activities. Because of the VMI program, PCM would only take parts or raw material ownership when it was used for production. This allowed PCM to only commence production when it received confirmed orders. Because of the involvement of over 220 plus suppliers, assuring the receipt of quality parts on-time and in-full would be extremely
2552
difficult, if not impossible, without the engagement of the 3PL. The engagement of a 3PL had also indirectly helped PCM to adopt a limited logistics speculation strategy (Pagh and Cooper, 1998) for its finished goods logistics activities in its distribution channels.
For PCM, after the manufacturing process, the finished goods were not stored in the VMI facility but immediately shipped out to its extensive network of product retailers and resellers. The resellers and retailers were retained mainly to serve PCM’s main business servers and industrial computing division. PCM would keep its inventory at geographically dispersed reseller and retailer locations only to a level sufficient to serve as a temporary buffer for short-term availability to customers. This limited logistics speculation strategy required the support of a well-coordinated production line where the production of goods was demand-driven. Benefits to Suppliers One of the critical pre-requisites for a successful VMI operation is to maintain the dedicated participation of suppliers. Suppliers, which agree to put raw materials on consignment to manage inventory on behalf of the manufacturer, need to benefit from their efforts.
Under the PCM’s VMI program, all storage costs were paid by the supplier themselves. This provided the suppliers with the contractual rights to utilize the VMI hub to store their goods, including the raw materials intended for other manufacturers. PCM’s hub location, being located in the Free Zone where other manufacturers had also embarked on their own VMI program, also offered PCM’s suppliers, who also counted on other manufacturers as their clients, to mitigate the costs that had been pushed to them. Besides costs savings, suppliers could also put more stock in the VMI hub for multiple customers, thus improving inventory availability for PCM’s production. The VMI hub might be a convenient storage place for some suppliers. Certain suppliers, primarily those supplying ‘proprietary’ parts such as processor chips, Liquid Crystal Display (LCD) screens, and hard disks had little or no incentive to participate. To maintain a 100% supplier participation, PCM engaged the 3PL to be a temporary buyer. The 3PL would buy from these ‘proprietary’ suppliers and would re-supply to PCM on a VMI basis, with commercial payment made based on the open book cost-plus model. As a result, PCM mitigated the problem of non-supplier participation and was able to be assured of 100% supplier participation in its VMI program.
Interpretation and Conclusion The PCM’s VMI program has presented a case in which the power relationship is one of dominance. A big manufacturer, like PCM, typically has the leverage to persuade its suppliers into accepting the terms of its contract due to its immense purchasing power and the intense competition the suppliers face. Under situations in which one of the participating members is able to leverage on the assets of others, there is always the tacit understanding that the dependent members participating in the supply chain operations would stand to become preferential suppliers for future contracts issued by the dominant member. Suppliers in the PCM’s VMI program were no different. By satisfying the requirements of PCM, PCM’s suppliers were hopeful of developing a stronger relationship with PCM in the long run. This, however, would not be feasible if the current collaboration did not provide sufficient incentives for them to cultivate such plausible future relationships. As has been noted in the case of PCM’s VMI program, the collaborative arrangement would not have enabled the suppliers to derive any special incentives without the 3PL involvement: providing the physical facilities to serve as the VMI hub and playing the role of a temporary buyer. In turn, PCM had been able to embark upon a postponement strategy for its manufacturing operations at very competitive terms.
In terms of reflecting the five features of Simatupang and Sridharan’s (2005) supply chain collaboration framework, PCM’s VMI program had shown no collaborative performance system in which the performance of all participating members could be gauged according to some mutually agreed objectives. However, the program did enjoy a high degree of information sharing through the ERP, WMS, and Internet portal communication system, which facilitated the synchronization of decisions between PCM and its 220 plus suppliers. It constituted a key element in ensuring appropriate decisions were made at the supplier locations, 3PL, and PCM. Most importantly, the case has demonstrated that incentive alignment is feasible, so long as the VMI program sponsor has the tenacity and
2553
the will to implement all the processes and changes necessary to bring benefits to all parties of the supply chain at the outset.
Another aspect of the VMI implementation that enabled a more equitable sharing of benefits was that suppliers could use the warehousing facilities to supply to other manufacturers within the region, thereby benefiting from storage scale economies. While it is not common to see a more equitable sharing of incentives in a VMI program, this PCM case has been unique. The PCM’s VMI program also ensured that suppliers and the 3PL streamlined their inventory management processes until the materials were used in production at PCM. Again, without the participation of the 3PL, this would not have been feasible.
The PCM’s VMI case has revealed that the 3PL’s role was pivotal in sustaining a VMI operation. It strongly supports the view that supply chain collaboration must start from an understanding of the bases of the power relationships that exists in the supply chain. This would enable the VMI sponsor to appreciate the circumstances it is in and the scope that exists for it to augment its power relative to suppliers. It also reinforces the importance of the reciprocal approach in facilitating the interactions of the features advanced by Simatupang and Sridharan (2005).
References [1] Barratt, M. (2004) ‘Understanding the meaning of collaboration in the supply chain’, Supply Chain
Management: An International Journal, Vol. 9 No. 1, pp. 30-42. [2] Barratt, M. and Oliveira, A. (2001) ‘Exploring the Experiences of Collaborative Planning Initiatives’,
International Journal of Physical Distribution & Logistics Management, Vol. 31, No. 4, pp. 266-289. [3] Corbett, C.J., Joseph, D.B. and van Wassenhove, L.N. (1999) ‘Partnerships to Improve Supply Chains’,
Sloan Management Review, Vol. 40, No. 4, pp. 71-82. [4] Cox, A., Sanderson, J., and Watson, G. (2001) ‘Supply chains and power regimes: Toward an analytic
framework for managing extended networks of buyer and supplier relationships’ Journal of Supply Chain Management, Vol. 37, No. 2, pp. 28-35.
[5] Cox, A., Sanderson, J. and Watson, G. (2000) Power Regimes, Earlsgate Press, Boston. Dong, Y and Xu, K 2001, A supply chain model of the vendor managed inventory, Transportation Research. Part E : Logistics and Transportation Review, pg 75-95.
[6] Fisher, M.L. (1997) ‘What is the Right Supply Chain for Your Product?’, Harvard Business Review, Vol. 75, No. 2, pp. 105-116.
[7] Frankel, R., Goldsby, T.J. and Whipple, J.M. (2002) ‘Grocery Industry Collaboration in the Wake of ECR’, The International Journal of Logistics Management, Vol. 13, No. 1, pp. 57-72.
[8] Horvath, L. (2001) ‘Collaboration: Key to Value Creation in Supply Chain Management’, Supply Chain Management: An International Journal, Vol. 6, No. 5, pp. 205-207.
[9] Kumar, N. (1996) ‘The Power of Trust in Manufacturer-Retailer Relationships’, Harvard Business Review, Nov/Dec.
[10] Ireland, R. and Bruce, R. (2000) ‘CPFR only the Beginning of Collaboration’, Supply Chain Management Review, Vol. 4, No. 4, pp. 80-88.
[11] Lambert, D.M. and Terrance L.P. (2001) ‘Supply Chain Metrics’, The International Journal of Logistics Management, Vol. 12, No. 1, pp. 1-19.
[12] Lapide, L. (2000) ‘True Measures of Supply Chain Performance’, Supply Chain Management Review, Vol. 4, No. 3, pp. 25-58.
[13] Lee, H.L., Padmanabhan, V. and Whang, S. (1997) ‘The Bullwhip Effect in Supply Chains’, Sloan Management Review, Vol. 38, No. 3, pp. 93-102.
[14] Narayanan, V.G. and Raman, A. (2004) ‘Aligning incentives in supply chains’, Harvard Business Review, Vol. 82, No. 11, pp. 94-102.
[15] Pagh, J.D. and Cooper, M.C. (1998) ‘Supply chain postponement and speculation strategies: how to choose the right strategy’, Journal of Logistics Management, Vol. 19, No. 2, pp. 13-33.

2554
Contact authors for complete list of references.
End Notes
1 For reason of confidentiality, the true name of the company has been disguised.
2555
Green Supply Chain Management System Complying with European Union Environment Law
Hee Kyung An, [email protected]
Teruyoshi Amano, [email protected] Shimadzu Corporation, Japan
Abstracts
Considering the future implications of EU environmental laws such as REACH (Registration, Evaluation, Authorization and Restriction of Chemicals) and EuP (Directive on Eco-Design of Energy-using Products) as well as RoHS (Restrictions of the Use of Certain Hazardous Substances in electrical and electronic equipment) Directive, they have been acquired to advance GSCM (Green Supply Chain Management) more and more. The aim of this paper is to introduce the construction of GSCM system that improves collaborative relationships between an EEE manufacturer and its suppliers. The study is conducted in three steps. Firstly, the four elements, which are necessities to form collaborative relationships between an EEE manufacturer and its suppliers, are described. Secondly, the condition and construction of GSCM system including the four elements is proposed. Finally, we presented the method that the GSCM system is constructed as a practicable tool in the initial stage by a case study held in Shimadzu Corporation.
Introduction
The RoHS (Restrictions of the Use of Certain Hazardous Substances in electrical and electronic equipment) has driven the implementation and development of GSCM (Green Supply Chain Management) for Japanese EEE manufacturers who produce EEE products that are exported to the EU market. The EEE manufacturers have pressed their parts suppliers to participate in various activities for compliance with the directive and for meeting the demands of EU market. The three common environmental activities are; (1) obtaining certification of EMS (Environmental Management System), (2) sharing knowledge of substances presence in EEE parts, and (3) warranting RoHS substances not included in EEE parts. However, the activities are likely to have been promoted without suppliers’ sufficient acknowledgement and abilities. Moreover, many Japanese parts suppliers do not directly face with EU market. It is necessary that the demands of an EEE manufacturer to its suppliers should be balanced with suppliers’ capacities for an effective advancement of the GSCM. The suppliers’ capacities for complying with EEE manufacturer’s demand depends on their acknowledgement on RoHS directive and environmental problems, financial status, technical and human resources. Therefore, the EEE manufacturers have been faced with the fact that they must form collaborative relationships between the EEE manufacturer and the parts supplier to improve GSCM performance.
This research presents the construction of GSCM system to promote collaborative relationships between an EEE manufacturer and its parts suppliers. The GSCM system is also a standard to organize and systemically operate environmental activities. In this paper, we described the construction of the GSCM system including the four elements to form collaboration and introduced the method to apply the GSCM at the initial stage in the case study of Shimadzu Corporation. The Four Elements for Forming Collaborative Relationships To correspond to environmental problems related to end-products, EEE manufacturers implement GSCM for the next three stages. To improve environmental problems related to the product, EEE manufacturers set the GSCM policy and purpose as the first stage. Then EEE manufacturers set the environmental requirement based on the GSCM policy and purpose as a second stage. As the third stage, EEE manufacturers promote the supplier's cooperation to cope with the environmental requirement in the GSCM implementation. Here, to promote the
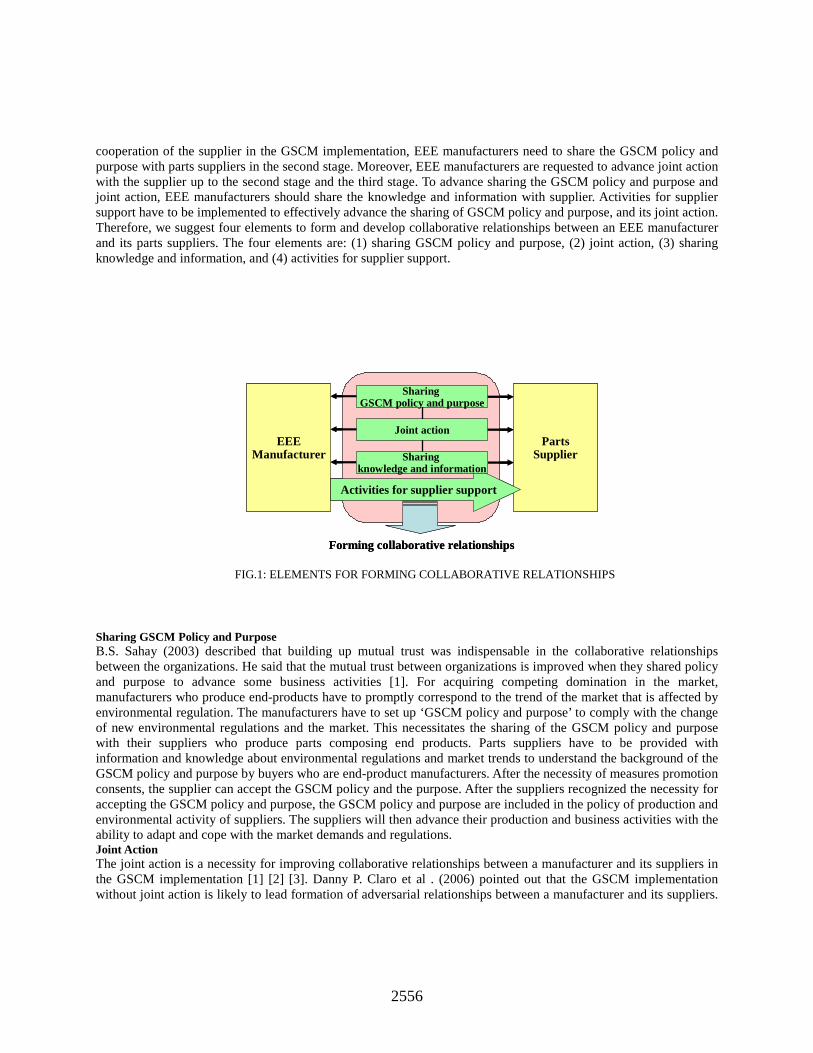
2556
cooperation of the supplier in the GSCM implementation, EEE manufacturers need to share the GSCM policy and purpose with parts suppliers in the second stage. Moreover, EEE manufacturers are requested to advance joint action with the supplier up to the second stage and the third stage. To advance sharing the GSCM policy and purpose and joint action, EEE manufacturers should share the knowledge and information with supplier. Activities for supplier support have to be implemented to effectively advance the sharing of GSCM policy and purpose, and its joint action. Therefore, we suggest four elements to form and develop collaborative relationships between an EEE manufacturer and its parts suppliers. The four elements are: (1) sharing GSCM policy and purpose, (2) joint action, (3) sharing knowledge and information, and (4) activities for supplier support. Sharing GSCM Policy and Purpose B.S. Sahay (2003) described that building up mutual trust was indispensable in the collaborative relationships between the organizations. He said that the mutual trust between organizations is improved when they shared policy and purpose to advance some business activities [1]. For acquiring competing domination in the market, manufacturers who produce end-products have to promptly correspond to the trend of the market that is affected by environmental regulation. The manufacturers have to set up ‘GSCM policy and purpose’ to comply with the change of new environmental regulations and the market. This necessitates the sharing of the GSCM policy and purpose with their suppliers who produce parts composing end products. Parts suppliers have to be provided with information and knowledge about environmental regulations and market trends to understand the background of the GSCM policy and purpose by buyers who are end-product manufacturers. After the necessity of measures promotion consents, the supplier can accept the GSCM policy and the purpose. After the suppliers recognized the necessity for accepting the GSCM policy and purpose, the GSCM policy and purpose are included in the policy of production and environmental activity of suppliers. The suppliers will then advance their production and business activities with the ability to adapt and cope with the market demands and regulations. Joint Action The joint action is a necessity for improving collaborative relationships between a manufacturer and its suppliers in the GSCM implementation [1] [2] [3]. Danny P. Claro et al . (2006) pointed out that the GSCM implementation without joint action is likely to lead formation of adversarial relationships between a manufacturer and its suppliers.
EEEManufacturer
PartsSupplier
Sharing GSCM policy and purpose
Joint action
Forming collaborative relationships
Activities for supplier support
Sharing knowledge and information
EEEManufacturer
PartsSupplier
Sharing GSCM policy and purpose
Joint action
Forming collaborative relationships
Activities for supplier support
Sharing knowledge and information
FIG.1: ELEMENTS FOR FORMING COLLABORATIVE RELATIONSHIPS
2557
He introduced that joint action should be consisted of joint planning and joint doing [4]. Tage Skjoett-Larsen(2000) described that joint action was operated through the process of joint planning, joint doing and joint monitoring [5]. The joint monitoring checks the status of implementing joint action. In this study, joint reviewing is included in the process of the joint action. Joint reviewing is a necessity for applying the result of joint monitoring to improve continuous performance of the whole joint action. Therefore, the joint action is implemented through a continuous cycle process of joint planning, joint doing, joint monitoring and joint reviewing. Sharing Knowledge and Information Louise Canning et al., (2001) identified the uncertainties on environmental aspect, the method of improving environmental performance, the capacity of resource or technology for advancing environmental activities in GSCM implementation [6]. Many suppliers have a lack of information about what kind of hazardous substances are in their products, whether such substances restricted by RoHS are in their products or not, because of uncertainty on environmental aspect. They do not have any idea how to solve or improve the environmental problem even though they understand the environmental aspect in their production and business due to the uncertainty on the method of improving environmental performance and the capacity of resource or technology for advancing environmental activities. The uncertainty between a manufacturer and its suppliers has to be lessened to improve the mutual trusts among organizations and to promote the formation of collaborative relationships between them. Sharing knowledge and information is an essential element to decrease the uncertainty between a manufacturer and its suppliers. EEE manufacturer should share knowledge and information for GSCM implementation with its suppliers to lessen various uncertainties which are obstacles in GSCM implementation.
In this research, sharing knowledge and information between an EEE manufacturer and its supplier for GSCM implementation are classified into sharing knowledge and information: (1) for sharing GSCM policy and purpose, (2) for process of joint planning, (3) process of joint doing and joint monitoring, and (4) process of joint reviewing. Activities for Supplier Support Many suppliers have suffered from the difficulties coping with environmental requirement from manufacturers because of lack of environmental knowledge, environmental consideration and financial or technological resources [2] [7]. The problem in these suppliers causes the supplier's cooperation in the GSCM implementation to be obstructed. In this research, therefore, activity for supporting suppliers by manufacturers who try to improve GSCM performance is classified into three; (1) providing knowledge and information on the trend of environmental regulations and the market, (2) technical assistance, and (2) providing human and financial resources. The Construction of GSCM System Requirement for Systematic Management Systematic management for GSCM implementation means that a manufacturer works together with its suppliers to advance the activities for GSCM on a standardized tool in this study. The standardized tool is based on the concept of PDCA cycle, which flows the four-step process of ‘Plan’, ‘Do’, ‘Check’ and ‘Act’ to improve GSCM performance continuously. The details of each process have to be documented or recorded in order to share and confirm the process and the result of GSCM implementation. Application of Environmental Management System Standard ISO 14001 which is the international standard of environmental management system satisfies the two requirements of systematic management operated by PDCA cycle and documentation. It has become as one of the worldwide accredited EMS certification of organizations because “it is intended to apply to all types and sizes of organization and to accommodate diverse geographical, cultural and social conditions”. Table 1 and Figure 2 show the situations of the acquisition number of ISO 14001 in the world from December 2001 to December 2005. The cases of organization obtaining the certification of ISO 14001 have totaled to 111,162 in December 2005. And there is a continuous increase in acquisition counts all over the world. The widely used ISO 14001 was applied to the construction of GSCM system used by both manufacturer and supplier in this study [8].
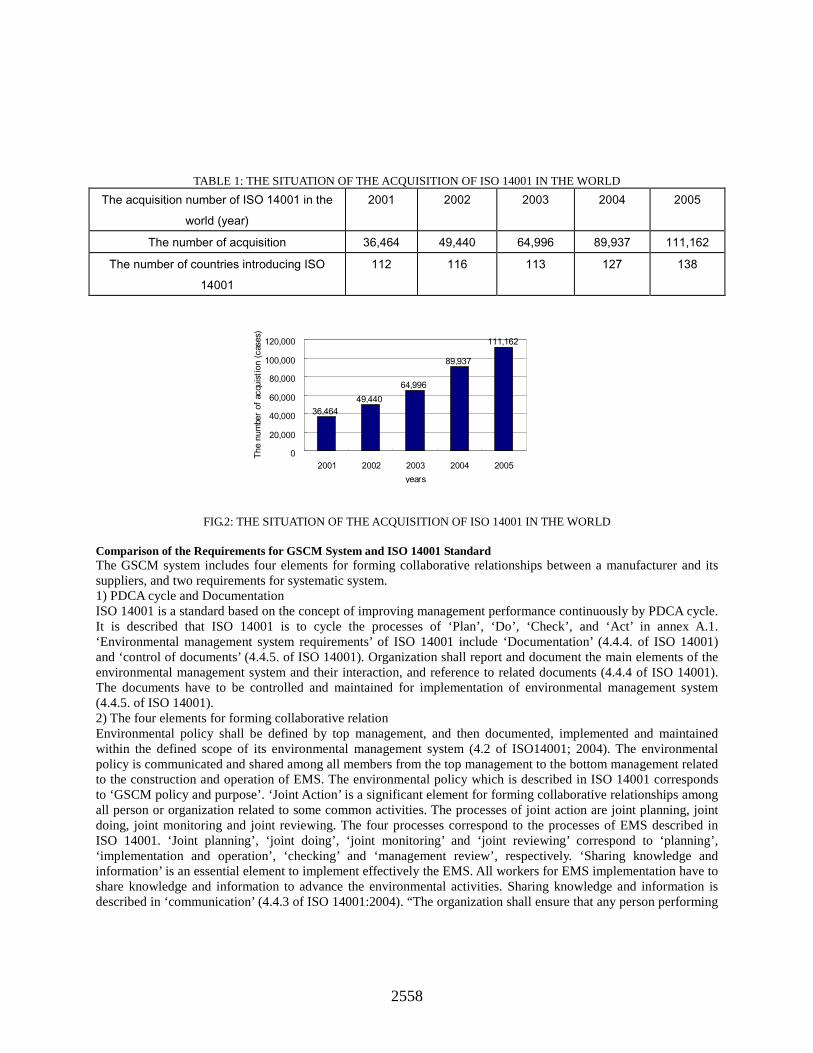
2558
TABLE 1: THE SITUATION OF THE ACQUISITION OF ISO 14001 IN THE WORLD
The acquisition number of ISO 14001 in the world (year)
2001 2002 2003 2004 2005
The number of acquisition 36,464 49,440 64,996 89,937 111,162
The number of countries introducing ISO 14001
112 116 113 127 138
FIG.2: THE SITUATION OF THE ACQUISITION OF ISO 14001 IN THE WORLD Comparison of the Requirements for GSCM System and ISO 14001 Standard The GSCM system includes four elements for forming collaborative relationships between a manufacturer and its suppliers, and two requirements for systematic system. 1) PDCA cycle and Documentation ISO 14001 is a standard based on the concept of improving management performance continuously by PDCA cycle. It is described that ISO 14001 is to cycle the processes of ‘Plan’, ‘Do’, ‘Check’, and ‘Act’ in annex A.1. ‘Environmental management system requirements’ of ISO 14001 include ‘Documentation’ (4.4.4. of ISO 14001) and ‘control of documents’ (4.4.5. of ISO 14001). Organization shall report and document the main elements of the environmental management system and their interaction, and reference to related documents (4.4.4 of ISO 14001). The documents have to be controlled and maintained for implementation of environmental management system (4.4.5. of ISO 14001). 2) The four elements for forming collaborative relation Environmental policy shall be defined by top management, and then documented, implemented and maintained within the defined scope of its environmental management system (4.2 of ISO14001; 2004). The environmental policy is communicated and shared among all members from the top management to the bottom management related to the construction and operation of EMS. The environmental policy which is described in ISO 14001 corresponds to ‘GSCM policy and purpose’. ‘Joint Action’ is a significant element for forming collaborative relationships among all person or organization related to some common activities. The processes of joint action are joint planning, joint doing, joint monitoring and joint reviewing. The four processes correspond to the processes of EMS described in ISO 14001. ‘Joint planning’, ‘joint doing’, ‘joint monitoring’ and ‘joint reviewing’ correspond to ‘planning’, ‘implementation and operation’, ‘checking’ and ‘management review’, respectively. ‘Sharing knowledge and information’ is an essential element to implement effectively the EMS. All workers for EMS implementation have to share knowledge and information to advance the environmental activities. Sharing knowledge and information is described in ‘communication’ (4.4.3 of ISO 14001:2004). “The organization shall ensure that any person performing
36,46449,440
64,996
89,937
111,162
0
20,000
40,000
60,000
80,000
100,000
120,000
2001 2002 2003 2004 2005years
The
num
ber o
f acq
uist
ion
(cas
es)
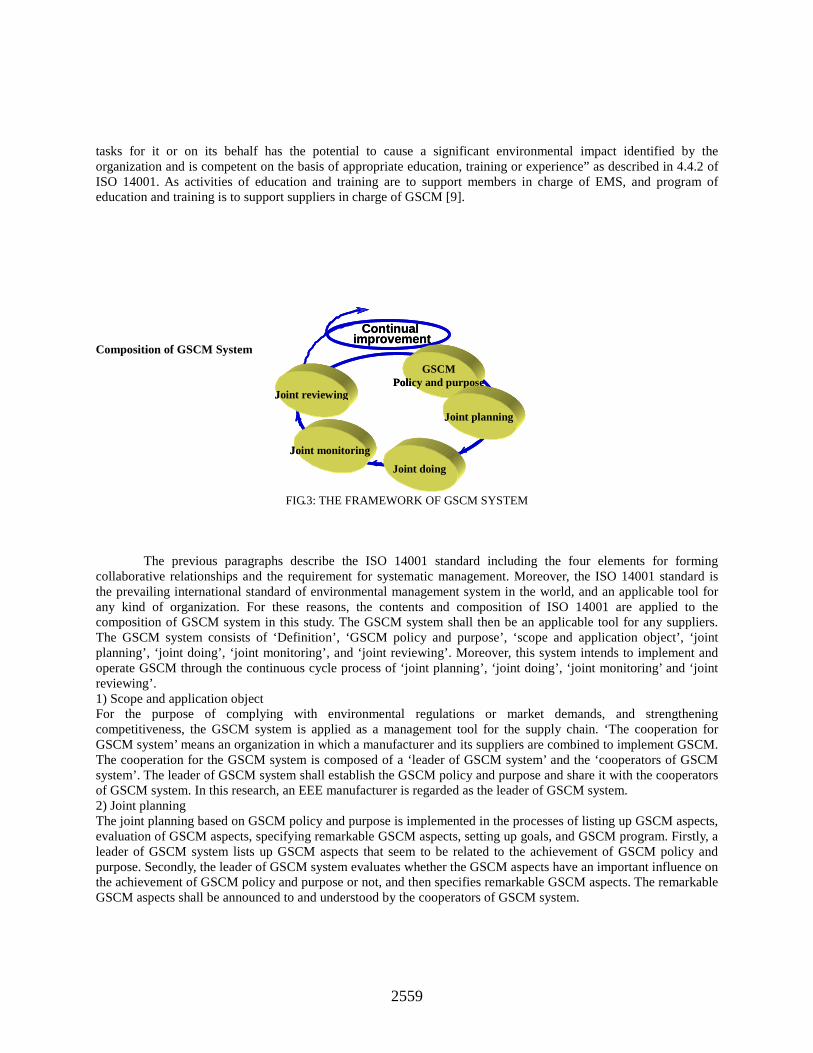
2559
tasks for it or on its behalf has the potential to cause a significant environmental impact identified by the organization and is competent on the basis of appropriate education, training or experience” as described in 4.4.2 of ISO 14001. As activities of education and training are to support members in charge of EMS, and program of education and training is to support suppliers in charge of GSCM [9]. Composition of GSCM System
FIG.3: THE FRAMEWORK OF GSCM SYSTEM
The previous paragraphs describe the ISO 14001 standard including the four elements for forming collaborative relationships and the requirement for systematic management. Moreover, the ISO 14001 standard is the prevailing international standard of environmental management system in the world, and an applicable tool for any kind of organization. For these reasons, the contents and composition of ISO 14001 are applied to the composition of GSCM system in this study. The GSCM system shall then be an applicable tool for any suppliers. The GSCM system consists of ‘Definition’, ‘GSCM policy and purpose’, ‘scope and application object’, ‘joint planning’, ‘joint doing’, ‘joint monitoring’, and ‘joint reviewing’. Moreover, this system intends to implement and operate GSCM through the continuous cycle process of ‘joint planning’, ‘joint doing’, ‘joint monitoring’ and ‘joint reviewing’. 1) Scope and application object For the purpose of complying with environmental regulations or market demands, and strengthening competitiveness, the GSCM system is applied as a management tool for the supply chain. ‘The cooperation for GSCM system’ means an organization in which a manufacturer and its suppliers are combined to implement GSCM. The cooperation for the GSCM system is composed of a ‘leader of GSCM system’ and the ‘cooperators of GSCM system’. The leader of GSCM system shall establish the GSCM policy and purpose and share it with the cooperators of GSCM system. In this research, an EEE manufacturer is regarded as the leader of GSCM system. 2) Joint planning The joint planning based on GSCM policy and purpose is implemented in the processes of listing up GSCM aspects, evaluation of GSCM aspects, specifying remarkable GSCM aspects, setting up goals, and GSCM program. Firstly, a leader of GSCM system lists up GSCM aspects that seem to be related to the achievement of GSCM policy and purpose. Secondly, the leader of GSCM system evaluates whether the GSCM aspects have an important influence on the achievement of GSCM policy and purpose or not, and then specifies remarkable GSCM aspects. The remarkable GSCM aspects shall be announced to and understood by the cooperators of GSCM system.
Continual improvement
Joint reviewing
Joint monitoring
GSCMPolicy and purpose
Joint planning
Continual improvement
Joint reviewing
Joint monitoring
GSCMPolicy and purpose
Joint planning
Joint doing

2560
Thirdly, the GSCM goals are set up to improve the remarkable GSCM aspects. The GSCM goals are set up for long-term achievement. The GSCM detail/ (or SPECIFIC?) goals are for short terms. These goals are expressed numerically as much as possible for the quantitative evaluation, and documented to be maintained and controlled. Furthermore, the goals shall be set up as practicable as possible through evaluating the capability of cooperators of GSCM system to achieve such goals. Finally, the GSCM program should be settled to achieve the GSCM goals and specific goals. The Measurement Survey for Understanding the Situation of Cooperators It is significant that joint planning is practically established to achieve the GSCM goals and improve the GSCM performance. Understanding the situations such as how much capacity does cooperators have for complying with GSCM system is needed to set up GSCM goals and GSCM program in the stage of joint planning. The Measurement Survey for Understanding the Situation of cooperators (MSUS) is to be carried out in the stage of joint planning, and then the result of MSUS is to be reflected for setting the GSCM goals, GSCM specific goal and then overall GSCM program. Therefore, MSUS is presented as a method for constructing practical GSCM system in this chapter. The MSUS was conducted for Shimadzu Cooperation Assembly that is organized by Shimadzu Corporation itself and its 115 suppliers providing EEE parts to Shimadzu Cooperation from the period of August 29, 2006 to October 1, 2006. Shimadzu Corporation and 115 suppliers correspond to ‘leader of GSCM system’ and ‘cooperators of GSCM system’, respectively. The method of MSUS was through the development of questionnaire for the 115 ‘cooperators of the GSCM system’. The respondents were 63 among 115. The questionnaire aimed to grasp the conditions of GSCM policy and purpose shared with supplier, and the GSCM aspect as understood by the suppliers. Furthermore, the questionnaire also tried to estimate the practicality of the GSCM goals and to set up a practical GSCM program. The Situation of Sharing ‘GSCM Policy and Purpose’ and ‘GSCM Aspect’
TABLE 2: THE SITUATION OF SHARING GSCM POLICY AND PURPOSE
The table 2 shows the situation of ‘GSCM policy and purpose’ expressed in number of notified
‘cooperators of the GSCM system’. (i.e., 53 among 63 companies). On the other hand, eight cooperators answered they have no experience or any sort of idea whether they have been informed about the ‘GSCM policy and purpose’. Moreover, two cooperators answered that the explanation of ‘GSCM policy and purpose’ had not been informed to them. From this result, it is clear that there are cooperators who lack understanding of the ‘GSCM policy and purpose’. The cooperators who do not understand the ‘GSCM policy and purpose’ need to be provided with information and knowledge and repeatedly done by the leader of GSCM system to achieve the GSCM goals.
The situation of sharing GSCM policy and purpose Answered cooperators
Notified 53Not notified 2No memory 8
Total 63
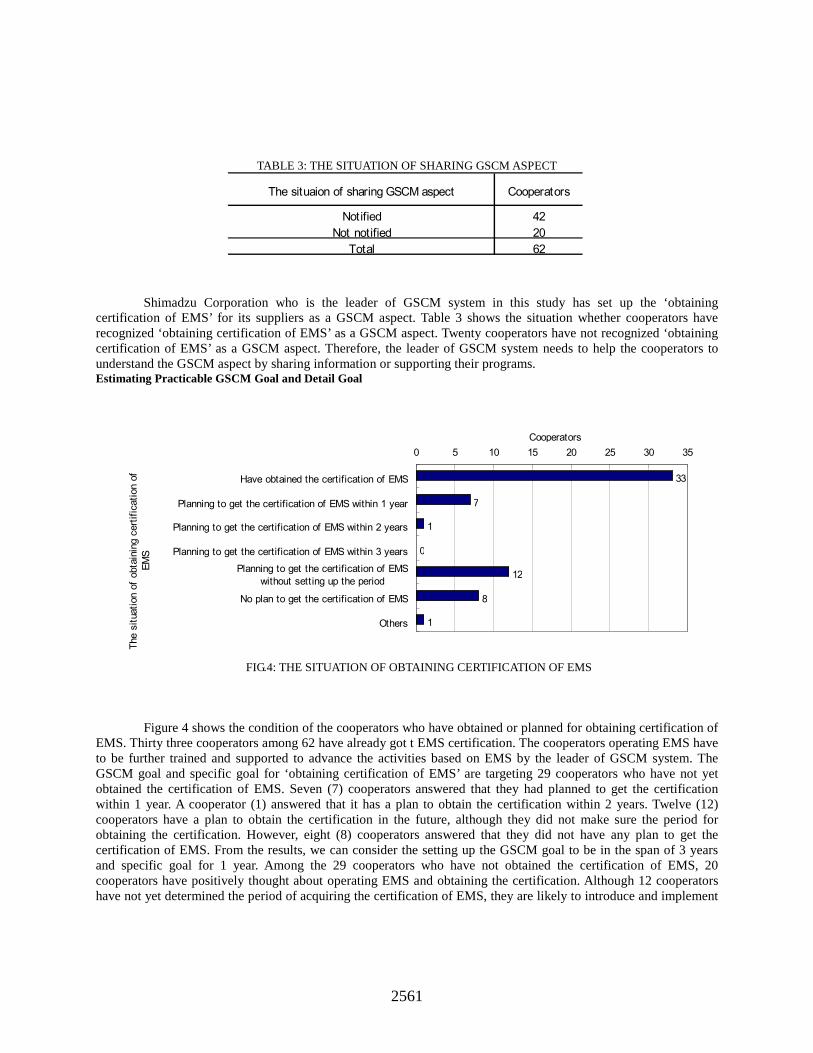
2561
TABLE 3: THE SITUATION OF SHARING GSCM ASPECT
Shimadzu Corporation who is the leader of GSCM system in this study has set up the ‘obtaining certification of EMS’ for its suppliers as a GSCM aspect. Table 3 shows the situation whether cooperators have recognized ‘obtaining certification of EMS’ as a GSCM aspect. Twenty cooperators have not recognized ‘obtaining certification of EMS’ as a GSCM aspect. Therefore, the leader of GSCM system needs to help the cooperators to understand the GSCM aspect by sharing information or supporting their programs. Estimating Practicable GSCM Goal and Detail Goal
FIG.4: THE SITUATION OF OBTAINING CERTIFICATION OF EMS Figure 4 shows the condition of the cooperators who have obtained or planned for obtaining certification of
EMS. Thirty three cooperators among 62 have already got t EMS certification. The cooperators operating EMS have to be further trained and supported to advance the activities based on EMS by the leader of GSCM system. The GSCM goal and specific goal for ‘obtaining certification of EMS’ are targeting 29 cooperators who have not yet obtained the certification of EMS. Seven (7) cooperators answered that they had planned to get the certification within 1 year. A cooperator (1) answered that it has a plan to obtain the certification within 2 years. Twelve (12) cooperators have a plan to obtain the certification in the future, although they did not make sure the period for obtaining the certification. However, eight (8) cooperators answered that they did not have any plan to get the certification of EMS. From the results, we can consider the setting up the GSCM goal to be in the span of 3 years and specific goal for 1 year. Among the 29 cooperators who have not obtained the certification of EMS, 20 cooperators have positively thought about operating EMS and obtaining the certification. Although 12 cooperators have not yet determined the period of acquiring the certification of EMS, they are likely to introduce and implement
Notified 42Not notified 20
Total 62
The situaion of sharing GSCM aspect Cooperators
33
7
1
0
12
8
1
0 5 10 15 20 25 30 35
Have obtained the certification of EMS
Planning to get the certification of EMS within 1 year
Planning to get the certification of EMS within 2 years
Planning to get the certification of EMS within 3 yearsPlanning to get the certification of EMS
without setting up the periodNo plan to get the certification of EMS
Others
The
situ
atio
n of
obt
aini
ng c
ertif
icat
ion
ofEM
S
Cooperators
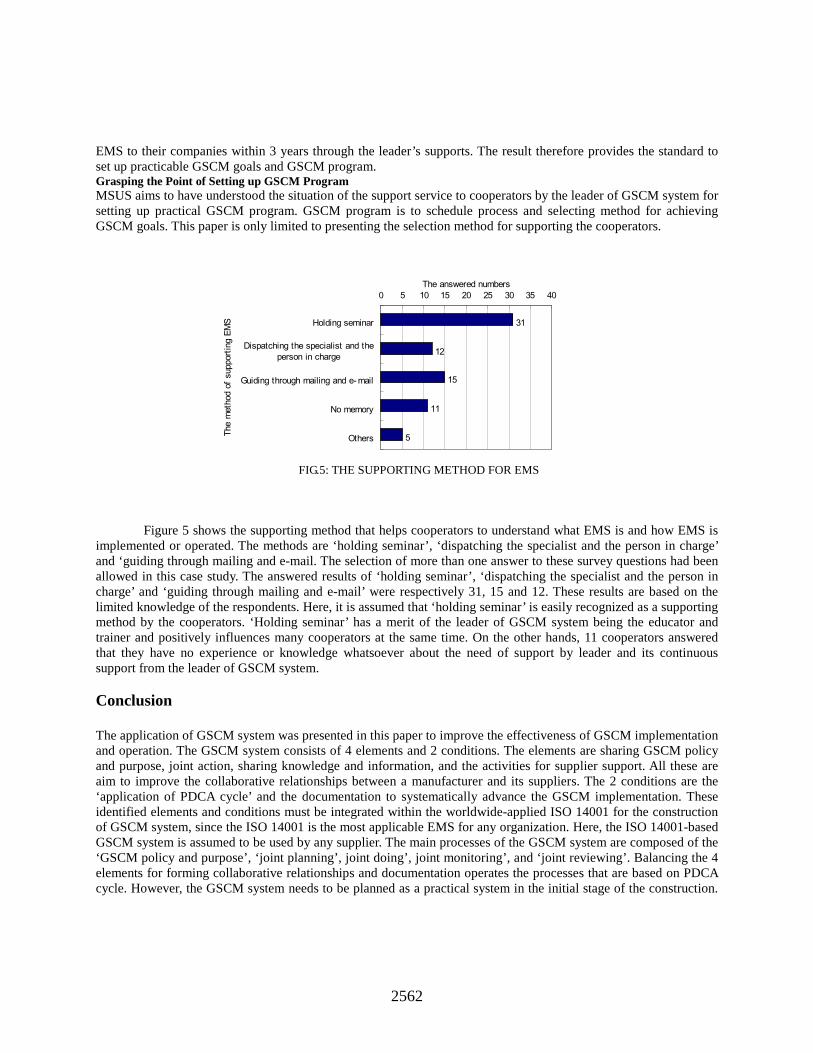
2562
EMS to their companies within 3 years through the leader’s supports. The result therefore provides the standard to set up practicable GSCM goals and GSCM program. Grasping the Point of Setting up GSCM Program MSUS aims to have understood the situation of the support service to cooperators by the leader of GSCM system for setting up practical GSCM program. GSCM program is to schedule process and selecting method for achieving GSCM goals. This paper is only limited to presenting the selection method for supporting the cooperators.
FIG.5: THE SUPPORTING METHOD FOR EMS
Figure 5 shows the supporting method that helps cooperators to understand what EMS is and how EMS is implemented or operated. The methods are ‘holding seminar’, ‘dispatching the specialist and the person in charge’ and ‘guiding through mailing and e-mail. The selection of more than one answer to these survey questions had been allowed in this case study. The answered results of ‘holding seminar’, ‘dispatching the specialist and the person in charge’ and ‘guiding through mailing and e-mail’ were respectively 31, 15 and 12. These results are based on the limited knowledge of the respondents. Here, it is assumed that ‘holding seminar’ is easily recognized as a supporting method by the cooperators. ‘Holding seminar’ has a merit of the leader of GSCM system being the educator and trainer and positively influences many cooperators at the same time. On the other hands, 11 cooperators answered that they have no experience or knowledge whatsoever about the need of support by leader and its continuous support from the leader of GSCM system. Conclusion The application of GSCM system was presented in this paper to improve the effectiveness of GSCM implementation and operation. The GSCM system consists of 4 elements and 2 conditions. The elements are sharing GSCM policy and purpose, joint action, sharing knowledge and information, and the activities for supplier support. All these are aim to improve the collaborative relationships between a manufacturer and its suppliers. The 2 conditions are the ‘application of PDCA cycle’ and the documentation to systematically advance the GSCM implementation. These identified elements and conditions must be integrated within the worldwide-applied ISO 14001 for the construction of GSCM system, since the ISO 14001 is the most applicable EMS for any organization. Here, the ISO 14001-based GSCM system is assumed to be used by any supplier. The main processes of the GSCM system are composed of the ‘GSCM policy and purpose’, ‘joint planning’, joint doing’, joint monitoring’, and ‘joint reviewing’. Balancing the 4 elements for forming collaborative relationships and documentation operates the processes that are based on PDCA cycle. However, the GSCM system needs to be planned as a practical system in the initial stage of the construction.
31
12
15
11
5
0 5 10 15 20 25 30 35 40
Holding seminar
Dispatching the specialist and theperson in charge
Guiding through mailing and e- mail
No memory
OthersThe
met
hod
of s
uppo
rting
EM
S
The answered numbers

2563
Therefore, we considered the method for establishing GSCM goals and program in the process of ‘joint planning’. The measurement survey for understanding the situation of cooperators (MSUS) was presented as a simple and useful method for setting up practicable GSCM goals and program. The MSUS has to be further developed and utilized for a continuous and practical operation of the GSCM in the future.
2564
References
[1] Danny P. C., Priscila B. O. & Geoffrey H. (2006). Coordination collaborative joint efforts with suppliers: the effects of trust, transaction specific investment and information network in the Dutch flower industry. Supply Chain Management: An International Journal, 11, 3, 216-224
[2] International Organization for Standardization (2005). The ISO survey-2005. 9-25 [3] Japanese Standards Association (2004). Environmental management systems-Requirements with guidance
for use. ISO 14001:2004 1-18 [4] Louise C. & Stuart H. L. (2001). Managing the environmental adaptation process in supplier-customer
relationships. Business Strategy and the Environment, 10, 225-237 [5] Richard L. & Jon H. (1996). The environment as a supply chain management issue. British Journal of
Management, 7, 45-62 [6] Thomas R. & Oliver N. Components supplier patterns in the UK Motor Industry. OMEGA, 19, 6, 609-616 [7] Tage S. L. (2000). European logistics beyond 2000. International Journal of Physical Distribution &
Logistics Management, 30, 5, 377-387 [8] Sahay, B.S. (2003). Understanding trust in supply chain relationships. Industrial Management & Data
Systems, 103, 8, 553-563 [9] Ypatia T., Katerina G. & George T. (2006). Supplier management and its relationship to buyers.
International Journal of Production Economics, 101, 99-108
2565
Effects of Supplier-Buyer's Inter-organizational Characteristics and EDI Utilization on SCM Performance
Namjae Cho, [email protected] Jinkwan Jung, [email protected]
Jaewhan Yoon, [email protected] Hanyang University, South Korea
Abstract The purpose of this study is to identify the inter-organizational factors that influence both the supplier-buyer's EDI utilization and the business performance in domestic retail industry. In terms of successful supply chain implementation and operation, we deduced the structural factors in the context of the inter-organizational characteristics between mass merchandisers and vendors. This study therefore focused on suggesting the ways of managing the partnership in supply chain and conceptualizing the big picture of EDI development model in the scope of a retailer's IT strategy. The results implicate that it is important to leverage the level of organizational capabilities for the success of supply chain adoption and operation. In the stream of SCM initiatives from the manufacturing industry, retailers should concentrate on improving the inter-organizational environment and implementing the effective information technology for supporting business strategy. Introduction These days, business environment is changed radically because of information technology development, globalization, customer needs diversification, and so on. So there are many companies that would like to promote innovation through IT tools such as SCM(Supply Chain Management) for development of business efficiency and cost reduction.
So in this study, we verify a relation model between suppliers and buyers by inter-organizational characteristics, and suggest how companies should use EDI based SCM for level-up usability and company performance by there characteristics. Related Researches There are many studies about the EDI usage level and performance. The usage level is about EDI adoption effectiveness, adoption attitude, and transaction degree, and so on(Noh at al, 2001; Lee, 2001; Kim et al, 2002; Sokol, 1989; Emmelhainz, 1990; Mansseti, 1991). Researches about the performance of EDI usage analyzed cost reduction, business improvement, competitive advantage attainment, financial outcome increase, level-up system usage and satisfaction, and so on.(Kim et al, 1999; Yang et al, 2001; Sokol, 1989; Brian, 1990; Emmelhainz, 1990; Hwang, 1991; Mansseti, 1991). This study reviews the relationship between EDI usage level and effectiveness, and suggests a model which organizational characteristics affect this relationship. EDI usage level Massetti(1991) and Hwang(1991) explained the relationship between EDI usage level and EDI usage effect, and classified EDI usage level into usage integration, usage diversity, usage width, and usage quantity. Usage integration meant the degree of coordination between EDI system and legacy information system. Usage diversity meant the
2566
types of document that is transmitted with EDI, and usage width meant the ratio of EDI using business partners of whole of business partners. Usage quantity meant the ratio of transaction quantity used by EDI of total transaction quantity. Park(1998) divided EDI usage level into usage quantity and usage scope, and verified the organizational differences between high usage level groups and low groups. And Kim at al(2002) defined EDI usage width into EDI using partner companies, and measured diffusion degree of business environments.
These studies measured supplier-buyer EDI usage level based on M:M cooperation relationship. The role of EDI is different according to relation types with partner companies. Because EDI is one of enterprise information system, usage level should be measured by two-way. So this study analyzes EDI integration, usage width, usage quantity, and suggest a relationship of usage diversity and usage scope that is showed by transaction relationship with suppliers. EDI performance The researches about organizational performance with information technology focused in strategic, managerial, operational, and financial areas. The studies for EDI system usage performance analyzed effects through communication and information sharing in B2B transaction. Clemons(1986) classified usage performance into order cost reduction, increasing order times, lead-time reduce, stock cost reduction, and managerial support.
Sokol(1989) analyzed performance in organizational efficiency, and the affecting factors to performance were transaction cost reduction, material and service cost reduction, ordering process shortening, customer service improvement, internal business process reformation, and so on. These studies suggested EDI performance in operational and managerial side. Brian(1990) divided EDI performance into direct and indirect factors. Direct factors were transmission efficiency improvement of electronic documents, manpower reduction, and efficient usage, and strategic factors were improvement of long-term competitiveness in long-term, long-term strategic planning, improvement relationship within partners and customer satisfaction.
This study focuses on operational and managerial performance factors such as reduction of business transaction cost and time, business process improvement, stock reduction, and strategic factors such as customer service improvement, transaction relationship improvement, competitive advantage, business innovation, etc. EDI usage level and performance Massetti(1996) and Noh at al(2001) classified determinant factors for EDI usage level and performance into technological organizational and managerial factors. And they studied about the effect of EDI determinant factors for EDI performance in organizational and managerial sides. Relationship characteristics EDI affects various inter-organizational relationships as Inter-Organizational Systems (IOS) (Noh et al, 2001). The researches about the characteristics of inter-organizational relationship were developed mainly in marketing areas, core concepts are trust, relationship absorption, relationship solidarity, open communication, cooperation, reliance, and conflict resolution (Wilson, 1995). These concepts explain the qualitative characteristic of inter-organizational relationships. Research Model and Hypothesis This study is about use of information technology for successful SCM in retail industry of Korea. The critical factors for SCM success are information sharing and easy communication between partners. So, we set a model to explain the relationship between inter-organizational characteristics, EDI usage level and SCM performance.
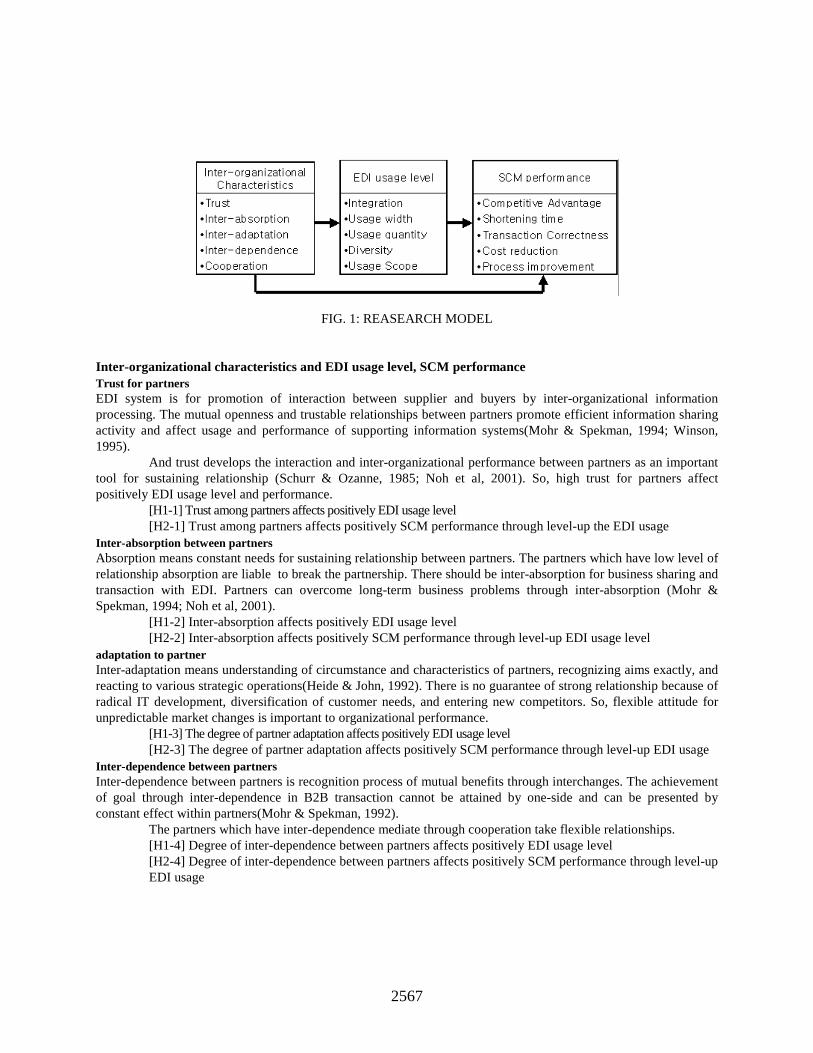
2567
FIG. 1: REASEARCH MODEL Inter-organizational characteristics and EDI usage level, SCM performance Trust for partners EDI system is for promotion of interaction between supplier and buyers by inter-organizational information processing. The mutual openness and trustable relationships between partners promote efficient information sharing activity and affect usage and performance of supporting information systems(Mohr & Spekman, 1994; Winson, 1995).
And trust develops the interaction and inter-organizational performance between partners as an important tool for sustaining relationship (Schurr & Ozanne, 1985; Noh et al, 2001). So, high trust for partners affect positively EDI usage level and performance.
[H1-1] Trust among partners affects positively EDI usage level [H2-1] Trust among partners affects positively SCM performance through level-up the EDI usage
Inter-absorption between partners Absorption means constant needs for sustaining relationship between partners. The partners which have low level of relationship absorption are liable to break the partnership. There should be inter-absorption for business sharing and transaction with EDI. Partners can overcome long-term business problems through inter-absorption (Mohr & Spekman, 1994; Noh et al, 2001).
[H1-2] Inter-absorption affects positively EDI usage level [H2-2] Inter-absorption affects positively SCM performance through level-up EDI usage level
adaptation to partner Inter-adaptation means understanding of circumstance and characteristics of partners, recognizing aims exactly, and reacting to various strategic operations(Heide & John, 1992). There is no guarantee of strong relationship because of radical IT development, diversification of customer needs, and entering new competitors. So, flexible attitude for unpredictable market changes is important to organizational performance.
[H1-3] The degree of partner adaptation affects positively EDI usage level [H2-3] The degree of partner adaptation affects positively SCM performance through level-up EDI usage
Inter-dependence between partners Inter-dependence between partners is recognition process of mutual benefits through interchanges. The achievement of goal through inter-dependence in B2B transaction cannot be attained by one-side and can be presented by constant effect within partners(Mohr & Spekman, 1992).
The partners which have inter-dependence mediate through cooperation take flexible relationships. [H1-4] Degree of inter-dependence between partners affects positively EDI usage level [H2-4] Degree of inter-dependence between partners affects positively SCM performance through level-up EDI usage
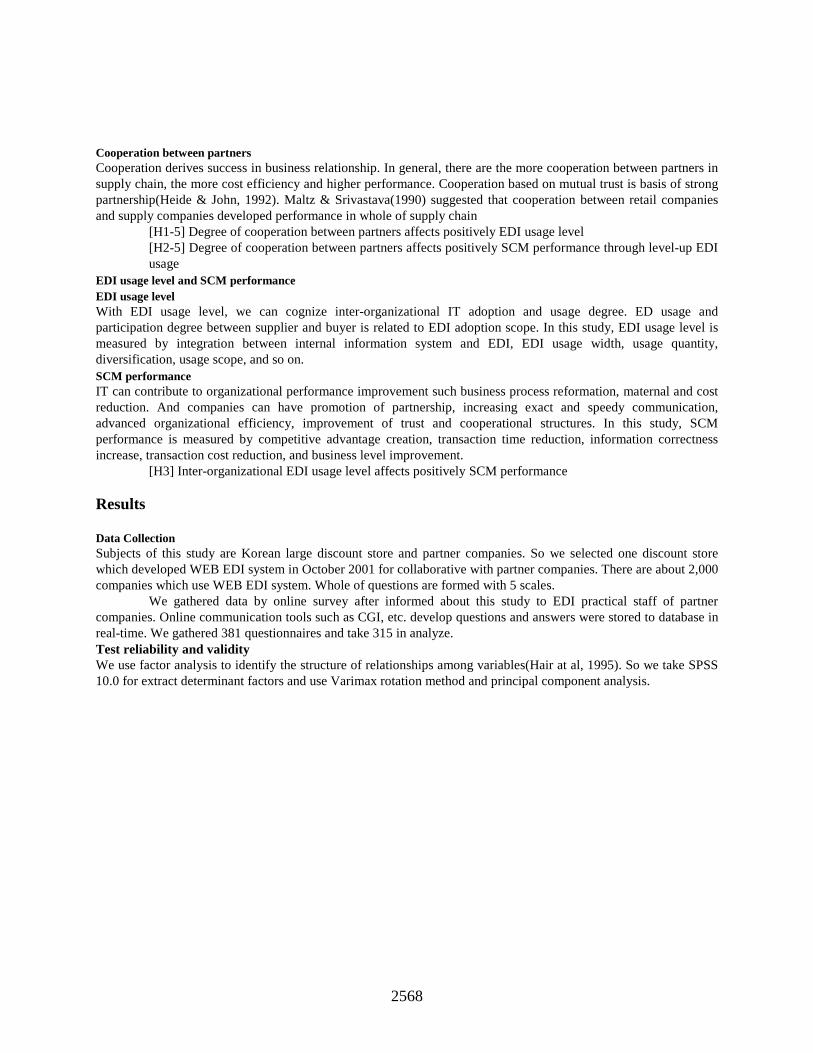
2568
Cooperation between partners Cooperation derives success in business relationship. In general, there are the more cooperation between partners in supply chain, the more cost efficiency and higher performance. Cooperation based on mutual trust is basis of strong partnership(Heide & John, 1992). Maltz & Srivastava(1990) suggested that cooperation between retail companies and supply companies developed performance in whole of supply chain
[H1-5] Degree of cooperation between partners affects positively EDI usage level [H2-5] Degree of cooperation between partners affects positively SCM performance through level-up EDI usage
EDI usage level and SCM performance EDI usage level With EDI usage level, we can cognize inter-organizational IT adoption and usage degree. ED usage and participation degree between supplier and buyer is related to EDI adoption scope. In this study, EDI usage level is measured by integration between internal information system and EDI, EDI usage width, usage quantity, diversification, usage scope, and so on. SCM performance IT can contribute to organizational performance improvement such business process reformation, maternal and cost reduction. And companies can have promotion of partnership, increasing exact and speedy communication, advanced organizational efficiency, improvement of trust and cooperational structures. In this study, SCM performance is measured by competitive advantage creation, transaction time reduction, information correctness increase, transaction cost reduction, and business level improvement.
[H3] Inter-organizational EDI usage level affects positively SCM performance Results Data Collection Subjects of this study are Korean large discount store and partner companies. So we selected one discount store which developed WEB EDI system in October 2001 for collaborative with partner companies. There are about 2,000 companies which use WEB EDI system. Whole of questions are formed with 5 scales.
We gathered data by online survey after informed about this study to EDI practical staff of partner companies. Online communication tools such as CGI, etc. develop questions and answers were stored to database in real-time. We gathered 381 questionnaires and take 315 in analyze. Test reliability and validity We use factor analysis to identify the structure of relationships among variables(Hair at al, 1995). So we take SPSS 10.0 for extract determinant factors and use Varimax rotation method and principal component analysis.
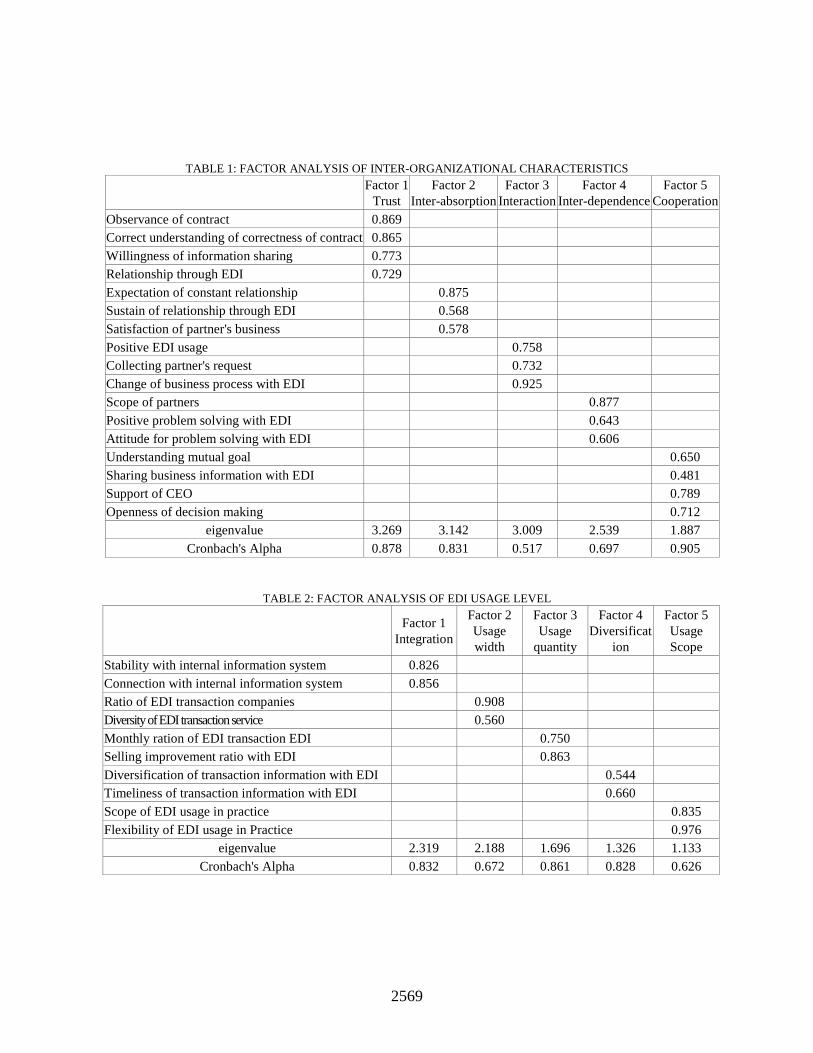
2569
TABLE 1: FACTOR ANALYSIS OF INTER-ORGANIZATIONAL CHARACTERISTICS
Factor 1
Trust Factor 2
Inter-absorption Factor 3
Interaction Factor 4
Inter-dependence Factor 5
Cooperation Observance of contract 0.869 Correct understanding of correctness of contract 0.865 Willingness of information sharing 0.773 Relationship through EDI 0.729 Expectation of constant relationship 0.875 Sustain of relationship through EDI 0.568 Satisfaction of partner's business 0.578 Positive EDI usage 0.758 Collecting partner's request 0.732 Change of business process with EDI 0.925 Scope of partners 0.877 Positive problem solving with EDI 0.643 Attitude for problem solving with EDI 0.606 Understanding mutual goal 0.650 Sharing business information with EDI 0.481 Support of CEO 0.789 Openness of decision making 0.712
eigenvalue 3.269 3.142 3.009 2.539 1.887 Cronbach's Alpha 0.878 0.831 0.517 0.697 0.905
TABLE 2: FACTOR ANALYSIS OF EDI USAGE LEVEL
Factor 1
Integration
Factor 2 Usage width
Factor 3 Usage
quantity
Factor 4 Diversificat
ion
Factor 5 Usage Scope
Stability with internal information system 0.826 Connection with internal information system 0.856 Ratio of EDI transaction companies 0.908 Diversity of EDI transaction service 0.560 Monthly ration of EDI transaction EDI 0.750 Selling improvement ratio with EDI 0.863 Diversification of transaction information with EDI 0.544 Timeliness of transaction information with EDI 0.660 Scope of EDI usage in practice 0.835 Flexibility of EDI usage in Practice 0.976
eigenvalue 2.319 2.188 1.696 1.326 1.133 Cronbach's Alpha 0.832 0.672 0.861 0.828 0.626
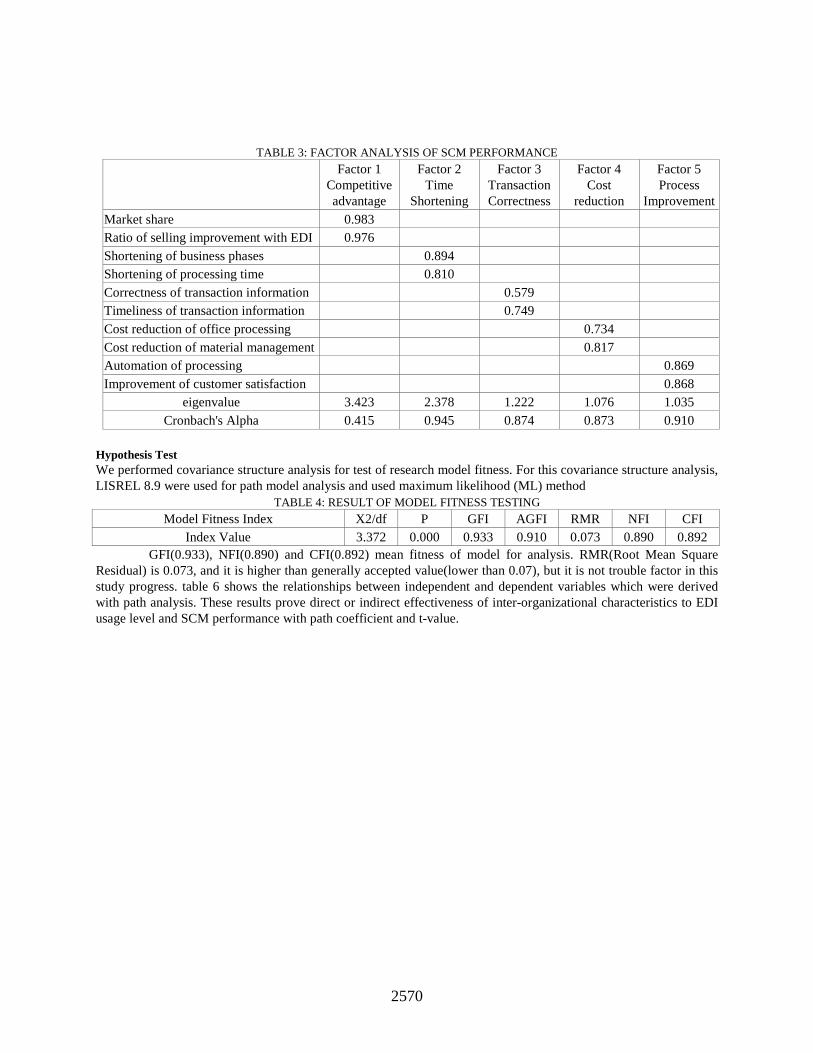
2570
TABLE 3: FACTOR ANALYSIS OF SCM PERFORMANCE
Factor 1
Competitive advantage
Factor 2 Time
Shortening
Factor 3 Transaction Correctness
Factor 4 Cost
reduction
Factor 5 Process
Improvement Market share 0.983 Ratio of selling improvement with EDI 0.976 Shortening of business phases 0.894 Shortening of processing time 0.810 Correctness of transaction information 0.579 Timeliness of transaction information 0.749 Cost reduction of office processing 0.734 Cost reduction of material management 0.817 Automation of processing 0.869 Improvement of customer satisfaction 0.868
eigenvalue 3.423 2.378 1.222 1.076 1.035 Cronbach's Alpha 0.415 0.945 0.874 0.873 0.910
Hypothesis Test We performed covariance structure analysis for test of research model fitness. For this covariance structure analysis, LISREL 8.9 were used for path model analysis and used maximum likelihood (ML) method
TABLE 4: RESULT OF MODEL FITNESS TESTING
Model Fitness Index X2/df P GFI AGFI RMR NFI CFI Index Value 3.372 0.000 0.933 0.910 0.073 0.890 0.892
GFI(0.933), NFI(0.890) and CFI(0.892) mean fitness of model for analysis. RMR(Root Mean Square Residual) is 0.073, and it is higher than generally accepted value(lower than 0.07), but it is not trouble factor in this study progress. table 6 shows the relationships between independent and dependent variables which were derived with path analysis. These results prove direct or indirect effectiveness of inter-organizational characteristics to EDI usage level and SCM performance with path coefficient and t-value.
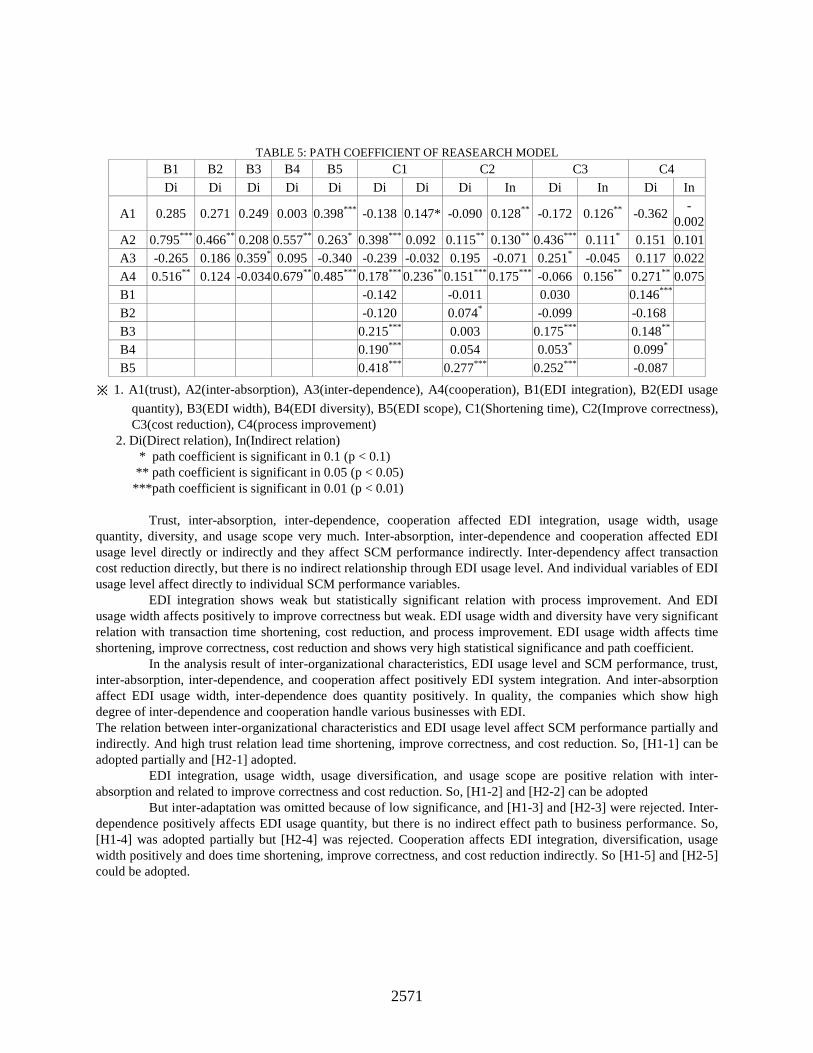
2571
TABLE 5: PATH COEFFICIENT OF REASEARCH MODEL
B1 B2 B3 B4 B5 C1 C2 C3 C4
Di Di Di Di Di Di Di Di In Di In Di In
A1 0.285 0.271 0.249 0.003 0.398*** -0.138 0.147* -0.090 0.128** -0.172 0.126** -0.362 -
0.002 A2 0.795*** 0.466** 0.208 0.557** 0.263* 0.398*** 0.092 0.115** 0.130** 0.436*** 0.111* 0.151 0.101 A3 -0.265 0.186 0.359* 0.095 -0.340 -0.239 -0.032 0.195 -0.071 0.251* -0.045 0.117 0.022 A4 0.516** 0.124 -0.034 0.679** 0.485*** 0.178*** 0.236** 0.151*** 0.175*** -0.066 0.156** 0.271** 0.075 B1 -0.142 -0.011 0.030 0.146*** B2 -0.120 0.074* -0.099 -0.168 B3 0.215*** 0.003 0.175*** 0.148** B4 0.190*** 0.054 0.053* 0.099* B5 0.418*** 0.277*** 0.252*** -0.087
※ 1. A1(trust), A2(inter-absorption), A3(inter-dependence), A4(cooperation), B1(EDI integration), B2(EDI usage
quantity), B3(EDI width), B4(EDI diversity), B5(EDI scope), C1(Shortening time), C2(Improve correctness), C3(cost reduction), C4(process improvement)
2. Di(Direct relation), In(Indirect relation) * path coefficient is significant in 0.1 (p < 0.1) ** path coefficient is significant in 0.05 (p < 0.05) ***path coefficient is significant in 0.01 (p < 0.01)
Trust, inter-absorption, inter-dependence, cooperation affected EDI integration, usage width, usage quantity, diversity, and usage scope very much. Inter-absorption, inter-dependence and cooperation affected EDI usage level directly or indirectly and they affect SCM performance indirectly. Inter-dependency affect transaction cost reduction directly, but there is no indirect relationship through EDI usage level. And individual variables of EDI usage level affect directly to individual SCM performance variables.
EDI integration shows weak but statistically significant relation with process improvement. And EDI usage width affects positively to improve correctness but weak. EDI usage width and diversity have very significant relation with transaction time shortening, cost reduction, and process improvement. EDI usage width affects time shortening, improve correctness, cost reduction and shows very high statistical significance and path coefficient.
In the analysis result of inter-organizational characteristics, EDI usage level and SCM performance, trust, inter-absorption, inter-dependence, and cooperation affect positively EDI system integration. And inter-absorption affect EDI usage width, inter-dependence does quantity positively. In quality, the companies which show high degree of inter-dependence and cooperation handle various businesses with EDI. The relation between inter-organizational characteristics and EDI usage level affect SCM performance partially and indirectly. And high trust relation lead time shortening, improve correctness, and cost reduction. So, [H1-1] can be adopted partially and [H2-1] adopted.
EDI integration, usage width, usage diversification, and usage scope are positive relation with inter-absorption and related to improve correctness and cost reduction. So, [H1-2] and [H2-2] can be adopted
But inter-adaptation was omitted because of low significance, and [H1-3] and [H2-3] were rejected. Inter-dependence positively affects EDI usage quantity, but there is no indirect effect path to business performance. So, [H1-4] was adopted partially but [H2-4] was rejected. Cooperation affects EDI integration, diversification, usage width positively and does time shortening, improve correctness, and cost reduction indirectly. So [H1-5] and [H2-5] could be adopted.
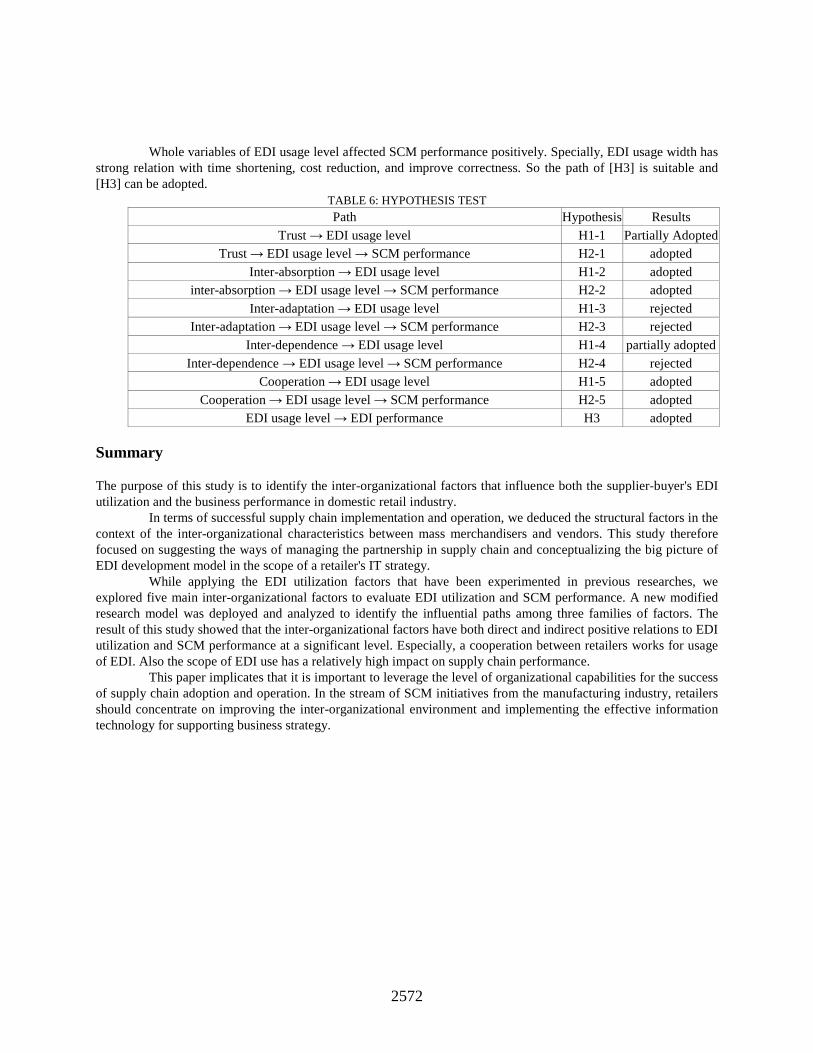
2572
Whole variables of EDI usage level affected SCM performance positively. Specially, EDI usage width has strong relation with time shortening, cost reduction, and improve correctness. So the path of [H3] is suitable and [H3] can be adopted.
TABLE 6: HYPOTHESIS TEST
Path Hypothesis Results Trust → EDI usage level H1-1 Partially Adopted
Trust → EDI usage level → SCM performance H2-1 adopted Inter-absorption → EDI usage level H1-2 adopted
inter-absorption → EDI usage level → SCM performance H2-2 adopted Inter-adaptation → EDI usage level H1-3 rejected
Inter-adaptation → EDI usage level → SCM performance H2-3 rejected Inter-dependence → EDI usage level H1-4 partially adopted
Inter-dependence → EDI usage level → SCM performance H2-4 rejected Cooperation → EDI usage level H1-5 adopted
Cooperation → EDI usage level → SCM performance H2-5 adopted EDI usage level → EDI performance H3 adopted
Summary The purpose of this study is to identify the inter-organizational factors that influence both the supplier-buyer's EDI utilization and the business performance in domestic retail industry.
In terms of successful supply chain implementation and operation, we deduced the structural factors in the context of the inter-organizational characteristics between mass merchandisers and vendors. This study therefore focused on suggesting the ways of managing the partnership in supply chain and conceptualizing the big picture of EDI development model in the scope of a retailer's IT strategy.
While applying the EDI utilization factors that have been experimented in previous researches, we explored five main inter-organizational factors to evaluate EDI utilization and SCM performance. A new modified research model was deployed and analyzed to identify the influential paths among three families of factors. The result of this study showed that the inter-organizational factors have both direct and indirect positive relations to EDI utilization and SCM performance at a significant level. Especially, a cooperation between retailers works for usage of EDI. Also the scope of EDI use has a relatively high impact on supply chain performance.
This paper implicates that it is important to leverage the level of organizational capabilities for the success of supply chain adoption and operation. In the stream of SCM initiatives from the manufacturing industry, retailers should concentrate on improving the inter-organizational environment and implementing the effective information technology for supporting business strategy.
2573
References
[1] Brian D., "The Strategic Benefits of EDI", The Journal of Business Strategy, January-February, 1990, p. 4
- 8. [2] Clemons, E. K., "Mckesson Drug Company: A Case Study of ECONOMIST", Journal of MIS, Vol. 5.,
Summer 1988. [3] Emmelhainz, Margaret. A., "Strategic Issues of EDI Implementation", Journal of Business Logistics, Vol.
9, No. 2, 1988, pp. 55 - 70. [4] Hair, Joseph, Rolph Anderson, Ronald Tatham, William Black, "Multivariate Data Analysis with
Readings", Prentice Hall, 4th edition, 1995, pp. 368 - 370 [5] Heide, J. B. & John, G., "Do Norms Matter in Marketing Relationship?", Journal of Marketing, Vol. 56,
No. 2, 1992, pp. 32 - 44. [6] Hwang, K. T., Pagels, C. C., Pao, Raghav & Vijay., "Evaluation the Implement Success and Competitive
Impact of EDI System", Ph. D. Dissertation State University New York at Buffalo, August, 1991, pp. 12 - 15.
[7] Kim, Byung Gon, Jong Uk Kim, “An Empirical Study on the Development of a Hierarchical Model for
Effects Factors of EDI systems”, Journal of Korea Society of Management Information System, Vol. 9, No.
3, 1999, pp. 169 - 175. [8] Kim, Jae Kyeong, Sang Chul Lee, Jung Eun Lee, Jae Kwang Lee, “Partnership and EDI Adoption Attitude
affecting on EDI Implementation Success”, Journal of Korea Society of Management Information System,
Vol. 12, No 4, 2002, pp. 1 - 19.
[9] Lee, Seok In, “The Impact of the Level of EDI Use on Reduction of Transaction Cost and Improvement”, Journal of Korea Institute of Information Technology and Innovation, Vol. 4, No. 2, 2001, pp. 95 - 116.
[10] Maltz, E. and Srivastava, R. K., "Managing Retailer-Supplier Partnerships with EDI: Evaluation and Implementation", Long Range Planning, Vol. 30, No. 6, pp. 862 - 876.
[11] Massetti, B. L., "The Effects of Electronic Data Interchange on Corporate Organization", Unpublished Ph. D. Dissertation, Florida State University, 1991.
[12] Mohr, J. and R. Spekman(1994), "Characteristics of Partnership Success : Partnership Attributes, Communication Behavior and Conflict Resolution Techniques", Strategic Management Journal, 15, 135-152.
[13] Noh, Young, Yoon Chung, “A Study on Factors Influencing the Usage level and Performance of EDI”, Journal of Korea Society of Management Information System, Vol. 11, No. 3, 2001, pp. 105 - 126.
[14] Park, Joon Chul, "Factors Affecting Organizational Performance through the Mediating Role of EDI Usage Level", Master Thesis of Korean University of Foreign Studies, 1998.
[15] Shurr, P. H. & Ozanne, J. K., "Influence on Exchange Processes: Buyer's Preconceptions of a Seller's Trustworthiness and Bargaining Toughness", Journal of consumer Research, Vol. 11, No. 4, 1995, pp. 939 - 953.
Please contact the author for a complete list of references.
2574
Offshoring of IT and IT-enabled Services: How Far Does India Benefit From Its
Outsourcing Industry?
Anindya Bhattacharya, [email protected] Brooklyn College, City University of New York, USA
Abstract The literature on services offshoring typically focuses on the extent of job losses in the home country. The impact on recipient countries is rarely examined in the debate on offshore outsourcing. The purpose of this paper is to analyze the impact of offshoring in information technology (IT) and IT-enabled services (ITES), including business process outsourcing (BPO), on employment creation and technology diffusion/innovation gap in India. The paper concludes that being a service industry, the IT/ITES sector cannot be expected to solve India’s massive unemployment problem. India needs to build labor-intensive, manufactured products, not just services, in order to create jobs for millions of educated but unemployed young Indians. Concerning technology diffusion/innovation gap, in spite of impressive progress achieved by Indian service providers, they continue to lag behind in high-end areas that call for creativity and innovation such as inventing innovative business products, and creating new global markets for such products. Introduction A by-product of the “flattening of the earth” has been the freedom of global businesses to engage in “offshore outsourcing” – which is the business practice of relocating labor-intensive manufacturing or service functions from an internal to an external source anywhere in the world. From the business viewpoint, offshore outsourcing can provide dramatic cost savings, permit the fragmentation of the value chain, enable a company to concentrate on its core competence, and leverage resources to higher-value-added products and services in order to create sustainable competitive advantage (Brown and Wilson, 2005; Prahald and Krishnan, 2004.) Although offshore outsourcing has been going on for a long time in countries like Ireland, Israel and Turkey, recently it has attracted a great deal of political attention recently due to the alleged “loss of domestic jobs” in the United States, Europe and elsewhere to China in the manufacturing sector and to India in the services sector.
A review of the literature reveals that a great deal has been written in the west on the economic and technological issues involved in offshore outsourcing of services, but such writings have focused exclusively on the pros and of “global labor arbitrage”, the extent of job losses in the home (exporting) country, and the plight of the workers whose jobs have been ‘Bangalored” (Simpson, 2004.) The development impact of offshore outsourcing of services in the host (recipient) countries is rarely examined in the ongoing western debate on outsourcing.
The purpose of this paper is to examine some of the economic and technological issues pertaining to offshore outsourcing in the IT/ITES-BPO service industry in India. Specifically, the paper examines the impact of offshore outsourcing on (a) employment creation in India, and (b) technology diffusion/innovation gap in India. An Overview of the IT/ITES-BPO Industry in India
India’s $30 billion plus export industry of IT/ITES-BPO has been growing at an impressive annual average rate of around 35 percent since FY 2002-03. The Tier I Indian companies (Tata Consultancy Services, Infosys, Wipro and HCL Technologies) regularly report double-digit growth in client base, sales revenue, and net profit. They rank among the top 14 largest IT companies in the world in terms of manpower, profitability, and stock market capitalization. These top four Indian companies register annual revenues of more than $1 billion each, and together with Satyam, are also India’s leading IT exporters. [ 1] (NASSCOM, Strategic Review 2005, and 2006.)
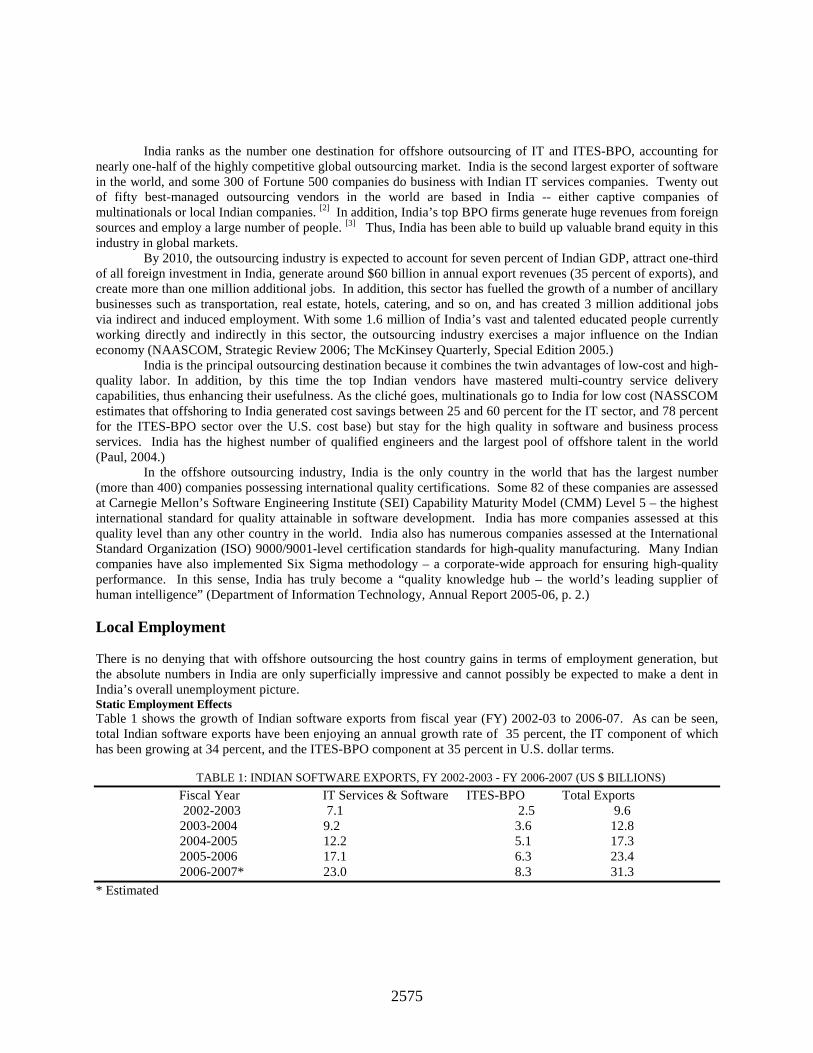
2575
India ranks as the number one destination for offshore outsourcing of IT and ITES-BPO, accounting for nearly one-half of the highly competitive global outsourcing market. India is the second largest exporter of software in the world, and some 300 of Fortune 500 companies do business with Indian IT services companies. Twenty out of fifty best-managed outsourcing vendors in the world are based in India -- either captive companies of multinationals or local Indian companies. [2] In addition, India’s top BPO firms generate huge revenues from foreign sources and employ a large number of people. [3] Thus, India has been able to build up valuable brand equity in this industry in global markets.
By 2010, the outsourcing industry is expected to account for seven percent of Indian GDP, attract one-third of all foreign investment in India, generate around $60 billion in annual export revenues (35 percent of exports), and create more than one million additional jobs. In addition, this sector has fuelled the growth of a number of ancillary businesses such as transportation, real estate, hotels, catering, and so on, and has created 3 million additional jobs via indirect and induced employment. With some 1.6 million of India’s vast and talented educated people currently working directly and indirectly in this sector, the outsourcing industry exercises a major influence on the Indian economy (NAASCOM, Strategic Review 2006; The McKinsey Quarterly, Special Edition 2005.)
India is the principal outsourcing destination because it combines the twin advantages of low-cost and high-quality labor. In addition, by this time the top Indian vendors have mastered multi-country service delivery capabilities, thus enhancing their usefulness. As the cliché goes, multinationals go to India for low cost (NASSCOM estimates that offshoring to India generated cost savings between 25 and 60 percent for the IT sector, and 78 percent for the ITES-BPO sector over the U.S. cost base) but stay for the high quality in software and business process services. India has the highest number of qualified engineers and the largest pool of offshore talent in the world (Paul, 2004.)
In the offshore outsourcing industry, India is the only country in the world that has the largest number (more than 400) companies possessing international quality certifications. Some 82 of these companies are assessed at Carnegie Mellon’s Software Engineering Institute (SEI) Capability Maturity Model (CMM) Level 5 – the highest international standard for quality attainable in software development. India has more companies assessed at this quality level than any other country in the world. India also has numerous companies assessed at the International Standard Organization (ISO) 9000/9001-level certification standards for high-quality manufacturing. Many Indian companies have also implemented Six Sigma methodology – a corporate-wide approach for ensuring high-quality performance. In this sense, India has truly become a “quality knowledge hub – the world’s leading supplier of human intelligence” (Department of Information Technology, Annual Report 2005-06, p. 2.) Local Employment There is no denying that with offshore outsourcing the host country gains in terms of employment generation, but the absolute numbers in India are only superficially impressive and cannot possibly be expected to make a dent in India’s overall unemployment picture. Static Employment Effects Table 1 shows the growth of Indian software exports from fiscal year (FY) 2002-03 to 2006-07. As can be seen, total Indian software exports have been enjoying an annual growth rate of 35 percent, the IT component of which has been growing at 34 percent, and the ITES-BPO component at 35 percent in U.S. dollar terms.
TABLE 1: INDIAN SOFTWARE EXPORTS, FY 2002-2003 - FY 2006-2007 (US $ BILLIONS)
Fiscal Year IT Services & Software ITES-BPO Total Exports 2002-2003 7.1 2.5 9.6 2003-2004 9.2 3.6 12.8 2004-2005 12.2 5.1 17.3 2005-2006 17.1 6.3 23.4 2006-2007* 23.0 8.3 31.3
* Estimated
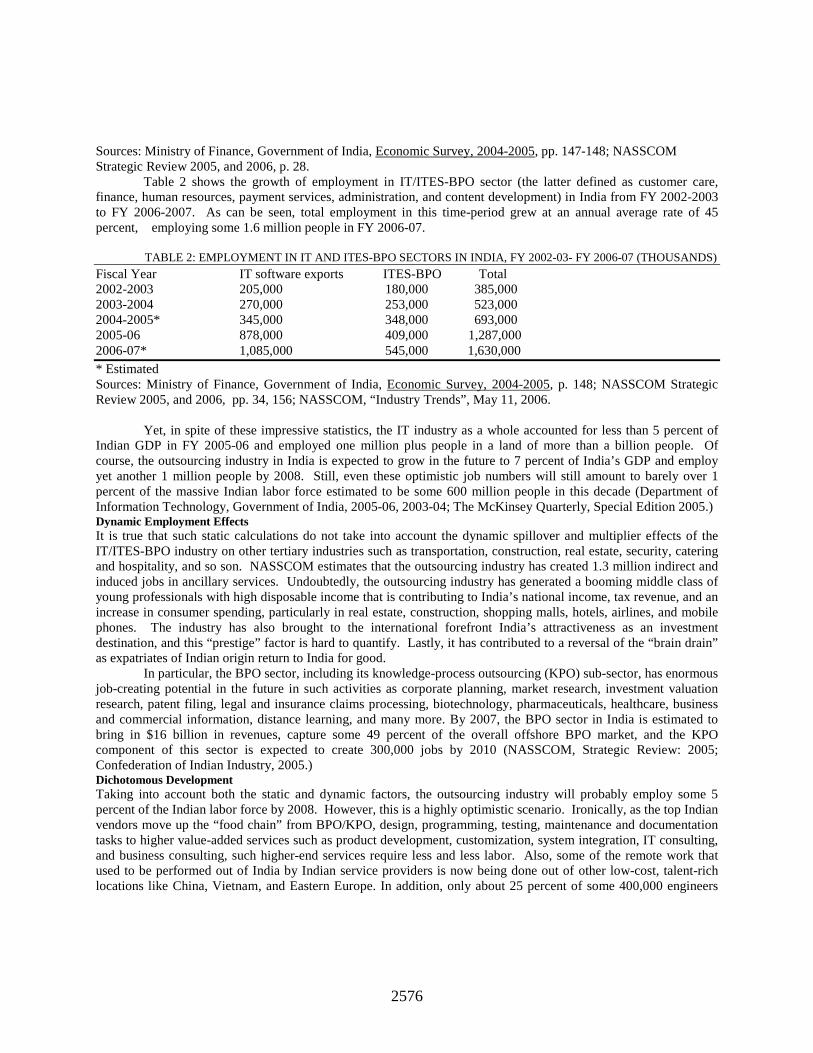
2576
Sources: Ministry of Finance, Government of India, Economic Survey, 2004-2005, pp. 147-148; NASSCOM Strategic Review 2005, and 2006, p. 28.
Table 2 shows the growth of employment in IT/ITES-BPO sector (the latter defined as customer care, finance, human resources, payment services, administration, and content development) in India from FY 2002-2003 to FY 2006-2007. As can be seen, total employment in this time-period grew at an annual average rate of 45 percent, employing some 1.6 million people in FY 2006-07.
TABLE 2: EMPLOYMENT IN IT AND ITES-BPO SECTORS IN INDIA, FY 2002-03- FY 2006-07 (THOUSANDS)
Fiscal Year IT software exports ITES-BPO Total 2002-2003 205,000 180,000 385,000 2003-2004 270,000 253,000 523,000 2004-2005* 345,000 348,000 693,000 2005-06 878,000 409,000 1,287,000 2006-07* 1,085,000 545,000 1,630,000 * Estimated Sources: Ministry of Finance, Government of India, Economic Survey, 2004-2005, p. 148; NASSCOM Strategic Review 2005, and 2006, pp. 34, 156; NASSCOM, “Industry Trends”, May 11, 2006.
Yet, in spite of these impressive statistics, the IT industry as a whole accounted for less than 5 percent of Indian GDP in FY 2005-06 and employed one million plus people in a land of more than a billion people. Of course, the outsourcing industry in India is expected to grow in the future to 7 percent of India’s GDP and employ yet another 1 million people by 2008. Still, even these optimistic job numbers will still amount to barely over 1 percent of the massive Indian labor force estimated to be some 600 million people in this decade (Department of Information Technology, Government of India, 2005-06, 2003-04; The McKinsey Quarterly, Special Edition 2005.) Dynamic Employment Effects It is true that such static calculations do not take into account the dynamic spillover and multiplier effects of the IT/ITES-BPO industry on other tertiary industries such as transportation, construction, real estate, security, catering and hospitality, and so son. NASSCOM estimates that the outsourcing industry has created 1.3 million indirect and induced jobs in ancillary services. Undoubtedly, the outsourcing industry has generated a booming middle class of young professionals with high disposable income that is contributing to India’s national income, tax revenue, and an increase in consumer spending, particularly in real estate, construction, shopping malls, hotels, airlines, and mobile phones. The industry has also brought to the international forefront India’s attractiveness as an investment destination, and this “prestige” factor is hard to quantify. Lastly, it has contributed to a reversal of the “brain drain” as expatriates of Indian origin return to India for good.
In particular, the BPO sector, including its knowledge-process outsourcing (KPO) sub-sector, has enormous job-creating potential in the future in such activities as corporate planning, market research, investment valuation research, patent filing, legal and insurance claims processing, biotechnology, pharmaceuticals, healthcare, business and commercial information, distance learning, and many more. By 2007, the BPO sector in India is estimated to bring in $16 billion in revenues, capture some 49 percent of the overall offshore BPO market, and the KPO component of this sector is expected to create 300,000 jobs by 2010 (NASSCOM, Strategic Review: 2005; Confederation of Indian Industry, 2005.) Dichotomous Development Taking into account both the static and dynamic factors, the outsourcing industry will probably employ some 5 percent of the Indian labor force by 2008. However, this is a highly optimistic scenario. Ironically, as the top Indian vendors move up the “food chain” from BPO/KPO, design, programming, testing, maintenance and documentation tasks to higher value-added services such as product development, customization, system integration, IT consulting, and business consulting, such higher-end services require less and less labor. Also, some of the remote work that used to be performed out of India by Indian service providers is now being done out of other low-cost, talent-rich locations like China, Vietnam, and Eastern Europe. In addition, only about 25 percent of some 400,000 engineers
2577
graduating annually in India are suitable for offshoring jobs at multinational corporations, and the top Indian companies recruit only about 1 percent of job seekers (The McKinsey Quarterly, 2005: 3.)
India has more than 40 million people looking for work, and an additional 35 million will join the labor force by 2008. The vast majority of educated young people in India, numbering some 200 million, are outside the elite loop of outsourcing since they are not employable in the industry due to lower-quality educational institutions they graduate from. In fact, the educated youth would probably comprise more than half of India’s unemployed within the next decade and could constitute a “ticking bomb” for India if the economy does not create enough jobs for them (Basu, 2004; The McKinsey Quarterly, 2005: 3.)
Creating jobs for all these millions of unemployed Indians will require more than nurturing the outsourcing service industry alone. Only labor-intensive manufacturing can provide jobs on such a scale. India may have “missed the boat” with respect to Chinese- style low-cost, labor-intensive manufacturing, but India may have some advantages over China in “discreet” manufacturing or manufacturing activities that requires engineering skills (Joshi, 2004; India Abroad, February 16, 2007.) Without this job-creating possibility, however, as the “enclave” thesis maintains, the outsourcing industry in India will probably end up by creating “pockets of affluence” in sumptuous suburban campuses, leading to a highly dichotomous development process (Asian Development Bank, 2004; Joshi, 2004.) Technology Diffusion/Innovation Gap In spite of impressive progress made by top Indian software companies in moving up the value chain to higher-level, sophisticated services, the fact remains that so far they still operate as “low-cost/high value” service providers. They have not yet reached the stage where they are able to manufacture, commercialize, market, and export a technological final product. Hitherto, the elite Indian companies have shown few signs of causing “new market disruptions” and are quite content to be “low-end disrupters” rather than innovators. Thus, even though India has gained by way of technology diffusion from western multinational companies, the innovation gap continues to persist.
Certainly, the more advanced Indian companies today have gone far beyond the traditional “hub-and spoke” model in which strategic functions (such as innovation, business consulting, IT consulting, defining requirements, etc.) are generally retained in the home country, while non-strategic, labor-intensive activities (such as design, programming, testing, documentation, maintenance, etc.) are typically outsourced (Simpson, 2004.) These sophisticated Indian companies have moved up the value chain by going beyond the traditional project-oriented, technology-specific outsourcing contracts to an integrated “global onshore-offshore delivery model.” This model involves “cross-selling and up-selling” a broader range of complex and higher value-added, domain-focused, services and solutions (such as business portfolio analysis, change management, sales and marketing relationship management, supply chain management, defining the client’s market in relation to competition, packaged applications implementation, custom application, IT consulting, R&D, product design and development, remote network management, and systems integration.)
The Indian service providers are acutely aware of the fact that in this era of globalization of the services industry (particularly financial services), an outsourcing partner must provide services on the business and process side (such as time to market, customer relationship management, operations management, and the like), not just on the technology side. Therefore, top Indian companies are delivering domain knowledge in key verticals (industry-specific) such as financial services, health care, manufacturing, retail, life sciences, telecom, media, and so on. They have developed cost-effective processes for managing large-scale projects in distributed locations combining customer-side activities with development activities (Murthy.)
The BPO industry too is moving up the value ladder from providing horizontal low value/high volume communication and data-driven activities to delivering vertical high value/low volume analytics-based, knowledge-processing services (such as clinical data management, biometrics, market research, financial research, securities processing and lending, risk management, real estate management, fund management, actuarial modeling, insurance claims processing and underwriting, medical, accounting, legal work, and so on.)
2578
Thus, the top Indian companies have been able to put together multicultural teams consisting of IT specialists, management specialists, domain experts, and behavioral experts from multiple countries in order to deliver customer-focused consulting and technology package deals to multinational clients (NASSCOM, Strategic Review, 2005.)
Today, India has emerged as a major global design center for higher-end technological tasks that were not outsourced before. In particular, Bangalore has been able to attract several creative/planning jobs, including high-tech product development, product design, software architecture, content development and design, and R&D. Multinational companies like IBM, General Electric, Motorola, Intel, and Microsoft have opened cutting-edge R& D and technology design centers in Bangalore and elsewhere. Famous Indian companies can deliver some very advanced engineering design and development work in large-scale projects (including aerospace) in distributed locations anywhere in the world (NAASCOM, Annual Report 2004-05; NASSCOM, Strategic Review 2005.) Role of the Indian Government The Indian government’s support of the software industry, coupled with economic liberalization measures, has certainly been conducive to the success of the Indian outsourcing industry. [4] The overall result of the government-supported free environment for the high-tech sector was to create a highly competitive environment for the Indian firms, which were forced to adopt world-class infrastructure, quality control processes, and human resource management practices. Now the Indian government needs to introduce “second-generation” reforms in the field of education by privatizing higher education institutions, enlarging the number of engineering Ph. D candidates, introducing meritocracy in the academic labor market, and increasing faculty salaries to industry level. The issue of the quality of training of workers in the outsourcing industry, particularly in managerial and marketing skills, is going to be problematic for India in view of poor faculty salaries and deteriorating physical infrastructure, even in elite universities and technical institutes (Murthy, 2004; Singh, 2004.) Looming Problems on the Horizon The conventional wisdom concerning India’s strong fundamentals in offshore outsourcing stresses the level of government support, quality of the labor force, proficiency in English, entrepreneurial culture, project management skills, and exposure to new technologies (Department of Information Technology, Government of India, 2003-04.) Such a rosy picture explains only part of the story. The so-called Indian advantages mentioned above might dissipate over time due to a variety of reasons over which the Indian companies may not have much control.
First, offshore outsourcing is a part of the strategic planning process of a multinational company in which a host of variables (including relative labor costs, logistics costs, customer requirements, time to market, skill levels and business experience, size of the local market, infrastructure facilities, and political and currency risks) enter into management calculations concerning the choice of an outsourcing location. The “portfolio approach” to offshoring maintains that spreading outsourcing relationships across a basket of low-cost regions and countries reduces risk and increases potential reward for a multinational company. Recent trends in outsourcing show a shift away from the client’s reliance on a single vendor to provide end-to-end services (or the entire spectrum of outsourcing services including IT consulting, application outsourcing, BPO, and infrastructure outsourcing) to “unbundling” requirements, and opting for “hybrid structures” or “extended organizational forms.” The latter involve partnering with a network of multiple “best-of-breed” service providers in specific areas of their strengths such as application development or industry-specific expertise. These relationship-seeking, rather than transaction-focused, customers expect vendors to simultaneously bring to bear technical knowledge, industry knowledge, knowledge of competitors and market trends (Vestring, Rouse & Reinert, 2005; NASSCOM, Strategic Review: 2005.)
Secondly, India’s current cost/quality advantage faces serious competition from rival locations such as China, Vietnam, the Philippines, South Africa, Russia, the Czech Republic, Hungary, Poland, and Canada. This competition will be particularly problematic if wage pressures continue to build up in India, attrition rates (currently ranging from 35 to 45 percent in call centers) in the ITES sector continue to skyrocket, and faculty shortages at the post-graduate level continue to mount. If multinationals are flocking to India now to set up captive units (they have 40 percent share of the BPO market in India), they are doing so to fill a particular gap (e.g., labor-cost gap, talent supply gap, etc.) at a particular point in time. History has taught us that one can never be sure that multinationals will remain in one particular location such as India (or any other place for that matter) over the long haul.
2579
Already, there are signs that India’s labor advantage is dwindling due to rising wages, high turnover rates, and a shortage of skilled manpower. It is estimated that demand for qualified IT professionals will outstrip supply in India soon, resulting in further wage pressures and higher attrition rates (ranging from 15 to 30 percent) in the near term. India’s cost advantage may be cut in half by 2007, and the current wage differential of 35 percent for higher-end services might shrink to 9-to-18 percent. It remains to be seen whether the elite Indian educational institutions (seven Indian Institutes of Technology and six Indian Institutes of Management) will be able to produce sufficient trained professionals to meet increased demand, and even if they do, quality of training might suffer due to heightened pressure to meet this demand (NASSCOM, 2006; McKinsey, 2005 Special Edition.) Interestingly, due to acute competition for this limited pool of talent, high-prestige Indian companies like Infosys that used to recruit only from the top engineering and management colleges in India are now hiring graduates from lesser-known educational institutions and offering them lower salaries.
Concerns over heightened competition, rising labor costs, high attrition rates, and future growth prospects are reflected in the generally declining prices of stocks (American Depository Receipts) traded on Wall Street of the top Indian vendors – Wipro, Infosys, Satyam, TCS, and HCL. Further, until recently, India attracted only 5 percent of the total venture capital/private equity invested in Asia, as compared to 40 percent for China including Hong Kong. And over 90 percent of these so-called “risky” investments in India were in fact made only in existing, profitable, top Indian companies. Only now private equity capital is pouring into India in a big way.
Yet, Wall Street analysts are puzzled by the ability of these Indian companies to generate double-digit (in the range of 30-40 percent) revenue growth, deliver high profit margins (earnings before interest, tax, depreciation and amortization/revenue) of about 30 percent, maintain high price-earnings ratios at more than 20 on average for the top companies, and ensure stability in client billing rates despite rising wage pressures in the Indian labor market (Pradhan, 2003; NASSCOM, Strategic Review: 2005.)
While the concerns of Wall Street analysts about long-term growth prospects for these companies may be legitimate, it appears that in the near term (over the next 2 to 3 years) there is enough room for these world-class Indian companies to grow in attracting clients from Fortune 500 and Fortune 1,000 companies. While salaries and bonuses of IT professionals have been increasing at a rate of about 10 to15 percent annually, billing rates vis-à-vis large clients have been remarkably stable, going up by one-half the rate of growth in salary cost. Indian vendors have managed to withstand higher cost pressures due to declining telecom and infrastructure costs, moving to higher-yield services such as consulting, package implementation, running thinner but more efficient operations, and achieving improvements in scale economies and productivity. Competition from China In the long run, however, of all the possible competitors to India in offshore outsourcing, it is China that poses the gravest threat. China is investing heavily in producing English-speaking engineering graduates and software professionals, and these investments are expected to bear fruit in about a decade’s time. However, as of now, China’s IT services industry remains highly fragmented, consisting of multiple players (some15, 000 service providers), the majority of which are small players based in one particular city or province with less than 15 employees doing basic programming and niche applications. Chinese IT firms do not yet possess the size and expertise needed to attract large international clients. [5]
The current Chinese situation is subject to dramatic change with time. With greater consolidation under government pressure, improved talent base, tax incentives, “single window” processing, and lower power costs, the fragmented IT industry in China will in all likelihood regroup fast, posing a serious threat in the future to India’s dominant position in the outsourcing industry. China outbids India by at least a 5:1 factor in attracting foreign direct investment, accompanied by a great deal of technology transfer and R&D placement, some of which will most likely spill over into the IT sector. Already, clusters of excellence are emerging in northeastern China, attracting multinational companies like IBM, General Electric, and Accenture.
The major Chinese weaknesses are lack of intellectual property rights protection, and low level of innovation. In addition, India has certain highly visible weaknesses, such as deteriorating physical infrastructure, perpetual power blackouts, and the like that China does not have, at least to that extent. The so-called Indian advantage over China in the English language may not be material in the outsourcing industry, except in call centers and transaction processing. In any case, since 1992, English has replaced Russian as the main foreign language
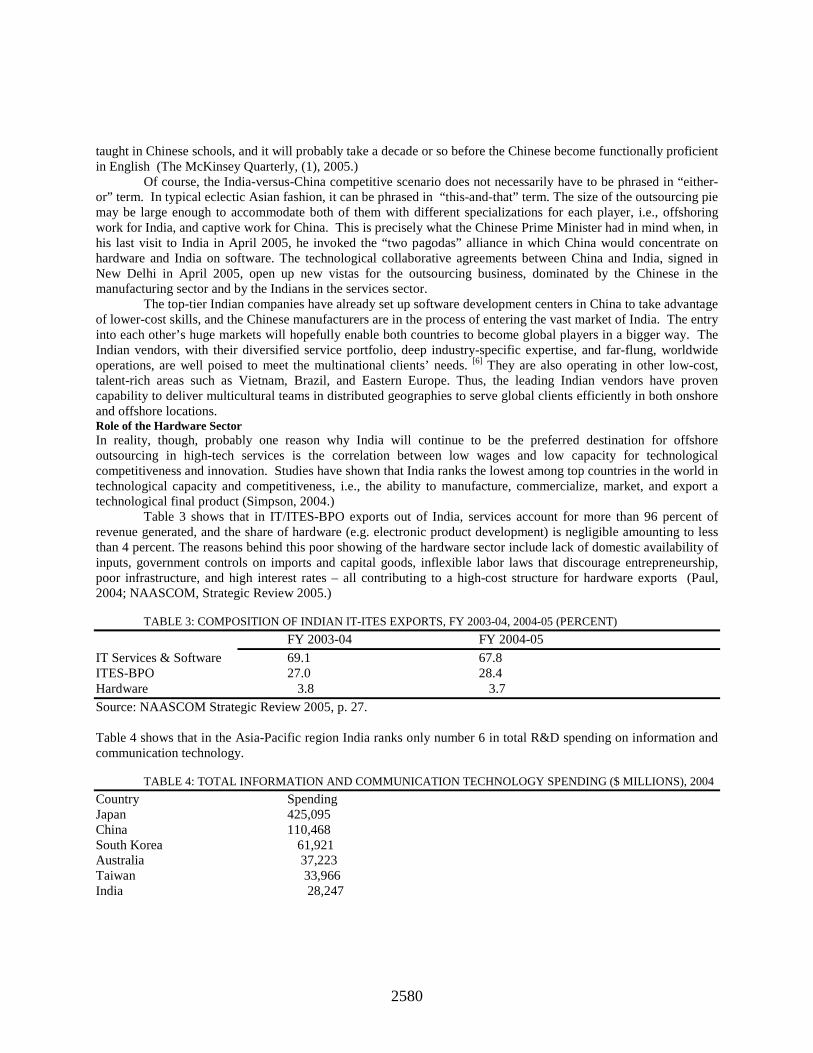
2580
taught in Chinese schools, and it will probably take a decade or so before the Chinese become functionally proficient in English (The McKinsey Quarterly, (1), 2005.)
Of course, the India-versus-China competitive scenario does not necessarily have to be phrased in “either-or” term. In typical eclectic Asian fashion, it can be phrased in “this-and-that” term. The size of the outsourcing pie may be large enough to accommodate both of them with different specializations for each player, i.e., offshoring work for India, and captive work for China. This is precisely what the Chinese Prime Minister had in mind when, in his last visit to India in April 2005, he invoked the “two pagodas” alliance in which China would concentrate on hardware and India on software. The technological collaborative agreements between China and India, signed in New Delhi in April 2005, open up new vistas for the outsourcing business, dominated by the Chinese in the manufacturing sector and by the Indians in the services sector.
The top-tier Indian companies have already set up software development centers in China to take advantage of lower-cost skills, and the Chinese manufacturers are in the process of entering the vast market of India. The entry into each other’s huge markets will hopefully enable both countries to become global players in a bigger way. The Indian vendors, with their diversified service portfolio, deep industry-specific expertise, and far-flung, worldwide operations, are well poised to meet the multinational clients’ needs. [6] They are also operating in other low-cost, talent-rich areas such as Vietnam, Brazil, and Eastern Europe. Thus, the leading Indian vendors have proven capability to deliver multicultural teams in distributed geographies to serve global clients efficiently in both onshore and offshore locations. Role of the Hardware Sector In reality, though, probably one reason why India will continue to be the preferred destination for offshore outsourcing in high-tech services is the correlation between low wages and low capacity for technological competitiveness and innovation. Studies have shown that India ranks the lowest among top countries in the world in technological capacity and competitiveness, i.e., the ability to manufacture, commercialize, market, and export a technological final product (Simpson, 2004.)
Table 3 shows that in IT/ITES-BPO exports out of India, services account for more than 96 percent of revenue generated, and the share of hardware (e.g. electronic product development) is negligible amounting to less than 4 percent. The reasons behind this poor showing of the hardware sector include lack of domestic availability of inputs, government controls on imports and capital goods, inflexible labor laws that discourage entrepreneurship, poor infrastructure, and high interest rates – all contributing to a high-cost structure for hardware exports (Paul, 2004; NAASCOM, Strategic Review 2005.)
TABLE 3: COMPOSITION OF INDIAN IT-ITES EXPORTS, FY 2003-04, 2004-05 (PERCENT)
FY 2003-04 FY 2004-05
IT Services & Software 69.1 67.8 ITES-BPO 27.0 28.4 Hardware 3.8 3.7 Source: NAASCOM Strategic Review 2005, p. 27. Table 4 shows that in the Asia-Pacific region India ranks only number 6 in total R&D spending on information and communication technology.
TABLE 4: TOTAL INFORMATION AND COMMUNICATION TECHNOLOGY SPENDING ($ MILLIONS), 2004
Country Spending Japan 425,095 China 110,468 South Korea 61,921 Australia 37,223 Taiwan 33,966 India 28,247
2581
___________________________________________________________________________________________ Source: NAASCOM Newsline: 2004 (32).
The manufacturing of electronic hardware (such as semiconductors and other components) is characterized by high fixed costs and calls for large-scale investments in R&D and infrastructure that are not in the cards in India. Neither does India possess global product marketing skills on a big scale. Unlike East Asia, India’s development policies have not supported the emergence of an export-led, world-class manufacturing industry. The “triple disconnect” in the Indian outsourcing industry between hardware and software, foreign and domestic markets, and services and products is a matter for concern (D’Costa, 2004.) Shortcomings of the Indian Service Providers Generally, only the leading Indian software service companies are able to offer a wide-ranging bouquet of global services ranging from IT infrastructure, and software testing to BPO, IT architecture, and IT consulting. But even they do not have the global reach of western multinationals like IBM, Accenture, and EDS
Only a few elite Indian companies such as Wipro and Satyam have engaged in “big leaps” such as “string-of-pearls acquisitions” of major western companies. Probably out of fear of depressing the high price of their stocks, other Indian companies have undertaken joint ventures, strategic alliances, and relatively small, “tuck-under acquisitions” in niche areas across geographies to broaden their capabilities in setting up “near-shoring” facilities (local centers for clients that are not ready yet to outsource to distant locations) to serve their clients in the West. The presence of Indian companies in strategic consulting (management consulting or business process re-engineering) is negligible largely due to perceived inadequate intellectual property protection laws in India. [7] (Pradhan, 2004.)
Generally, Indian software companies have a long way to go before they can arrive at the product development, commercialization, and marketing stage. They continue to remain masters of processes involved in managing distributed work across geographies in a “flat” world, usually on a point-to-point basis. Achieving global status in hardware assembly work will call for substantial investments in physical infrastructure, which are not forthcoming in view of the large fiscal deficit and public debt in India. Currently, infrastructure investment in India amounts to only 6 percent of GDP or half of the Asian average and will continue to pose a serious bottleneck problem in the future (IMF Survey, 2005.)
By far the most important challenge that Indian software companies face in becoming truly global players is changing the mindset away from sustaining their cost/quality advantage via the “average revenue realized per employee” route to becoming “disruptive innovators” or “leapfrogging the competition and dislodging the entrenched market leaders.” The leading Indian software companies have succeeded in becoming “low-end disrupters” based on their low-cost/high quality business models such as the Global Delivery Model. However, in order for them to remain competitive in the global market place in the long run, they need to move into “new market disruptions” or create new markets for their patentable innovative products where no such markets currently exist. [8]
So far, even the elite Indian software companies have shown few signs of becoming new market innovators and are quite content to be order-takers rather than innovators. They have focused on global service delivery models that emphasize delivery client value via integrating “packaged software’ created initially by western multinationals. These “service-only” Indian companies have done very little software product innovation and have yet to develop software products that could sell in global markets. They have indeed developed “incremental” process innovations that are tailored to delivering low-cost services to local customers, particularly in the rural areas of India. However, breakthrough “disruptive” innovations with a global impact are still missing (Pradhan, 2003.) Conclusions India’s number one priority is to create employment for its unemployed educated youth. In the short run, there is no denying that the IT/ITES-BPO industry has created an employment base in India, with all its spillover benefits, that did not exist before. However, the outsourcing industry cannot possibly be expected to be a panacea for India’s massive unemployment problem. In fact, this industry is caught in a “Catch 22” situation with respect to creating employment. The employment-creation prospects are the highest at the bottom of the “food chain”, that is in the
2582
BPO/KPO segments. However, in order to satisfy client demands, as the Indian software vendors move up the value ladder to higher value-added services such as consulting, application management, networking, and the like, the need for labor in these higher-end services becomes less and less.
India needs export-led, labor-intensive manufacturing to create jobs for its vast masses of unemployed but educated people. In other words, India needs to build products, not just deliver services. The Indian strategy of “leapfrogging” into the big league of advanced nations by exporting high-tech services without first going through the manufacturing export stage is unprecedented in history. But its long-term success remains to be seen in view of acute competition stemming particularly from China, and the fact that the industry will reach its maturity stage in the not-so-distant future. So far, even the elite Indian software companies have succeeded only in becoming masters of “incremental” process innovation and “low-end disrupters” based on their low-cost/high quality business models such as the Global Delivery Model. They have not been able to become masters of product innovation or “new market innovators” in creating new global markets for innovative products.
The high-end technological work being done out of India is essentially tailored to fit the needs of distant users implying little interaction with India’s domestic economy. Still, there is no question that the organizational capabilities developed by the IT/ITES-BPO services sector can serve as a model for the rest of the Indian economy. The high-tech services sector has been less regulated and taxed than other sectors. This, coupled with liberalization and the consequent unleashing of the power of human capital, has catapulted India as one of the leading economic forces in the world, and certainly as the undisputed leader in services outsourcing. Thus, the success of the software industry has had a profound “demonstration effect” on the whole of India.
The challenge for India now is how to extend the global success of the outsourcing industry to the manufacturing, construction, real estate, retail, tourism, and infrastructure sectors of the economy, all of which are labor-intensive. In a nutshell, the challenge for India is to make high technology work for millions of unemployed yet educated Indians. Short of this, the contribution of this industry towards promoting economic development in India will remain questionable, and the industry will probably remain yet another elite enclave (with limited linkages to the rest of the domestic economy) enhancing the existing pervasive inequality in India.
References
[1] Asian Development Bank. (May 2004). Basic statistics: developing member countries., Economic Research
Department. Manila, The Philippines. [2] Basu, K. (2004). The Indian economy: up to 1991 and since in Basu, K. (Ed.), India’s Emerging Economy,
The MIT Press, Cambridge: Mass., 23-24. [3] Brown, D. & Wilson, S. (2005). The black book of outsourcing: how to manage the changes, challenges,
and opportunities, John Wiley & Sons, New York. [4] Confederation of Indian Industry (May 9, 2005). India in the new knowledge economy, New Delhi, India. [5] D’Costa, A.P. (2004). The Indian software industry in global division of labor” in D’Costa, A. P. and
Sridharan, Eds.). India in the global software industry, Palgrave McMillan, New York, Chapter 1. [6] Department of Information Technology, Ministry of Communications & Information Technology,
Government of India (2003-04; 2005-06). Annual Report, New Delhi, India. [7] IMF Survey (February 21, 2005)., 40-41. [8] India Abroad, February 16, 2007. [9] Joshi,V. (November 16, 2004)., Myth of India’s outsourcing boom”, Financial Times., 21. [10] The McKinsey Quarterly (2005). Can China compete in IT services?, 1. [11] The McKinsey Quarterly (2005). Sizing the emerging global labor market., 3. [12] The McKinsey Quarterly (2005). Fulfilling India’s Promise, Special Edition. [13] Ministry of Finance, Government of India (2004-05, and 2005-06). Economic Survey, pp. 140-148. [14] Murthy, N.R.N. (2004). The impact of economic reforms on industry in India” in Basu, K. (Ed.), India’s
Emerging Economy, The MIT Press, Cambridge. Mass., 217-222. [15] Murthy, N.R.N. (2004). Interview. The McKinsey Quarterly, Special Edition, 2004.
2583
Please contact author for the list of references End Notes
[1].The tier-1 Indian companies include Tata Consultancy Services, Wipro, Infosys, and HCL Technologies , while the tier-2 companies include companies like Satyam. Cognizant Technology Solutions is excluded from this analysis since it is a U.S.-based company with development centers in India. [2].These companies are: IBM Global/Daksh, Accenture, Hewlett Packard, MphasiS, Wipro Spectramind, ICICI OneSource, Sutherland Technologies, Hewitt Exult, HCL Technologies, Satyam, Northrop Grumman Information Technology, Infosys, Getronics, Spherion, i-Flex, Siemens Business Services, Datamatics, i-Gate, Perot, and Patni Computer. See Brown and Wilson, 2005, 159-163. [3].In terms of full-time employees hired in FY 2005-06, the top 10 BPO vendors in India were: Wipro BPO, Genpact, IBM Daksh, WNS, Mphasis BPO, HCL BPO Services, ICICI OneSource, Progeon, and ExI Service Holdings. See NASSCOM, “ITES-BPO Market: Facts and Figures”, June 6, 2006. [4].The first-generation economic reforms, initiated in 1991, decentralized decision-making authority from the central government to regional and state governments, allowed software companies to raise capital through the equity market, introduced current account convertibility of the rupee, made access to foreign currencies easier (thereby promoting overseas travel, establishment of overseas sales offices, and hiring of foreign consultants), and allowed 100 percent foreign ownership of Indian subsidiaries (thus facilitating the entry into India of multinational companies.) Most software imports were brought under the Open General License Scheme, and the duty on software imports was eliminated. The corporate tax rate was reduced, and estate tax was abolished. The government also allowed Indian companies to list on foreign stock exchanges such as NASDAQ. Finally, the IT sector was exempted from labor regulations concerning working hours, and overtime pay. See Murthy, 2004. [5].The top 10 service providers in China control only 15 percent of the regional outsourcing market, compared with 45 percent market share for India’s top 10 suppliers. China does not have brand names in the outsourcing industry whereas India has several, i.e., the top-tier Indian companies. Only 6 of China’s 30 largest software companies are certified at levels four or five of CMM, while all of the 30 top Indian companies are certified at these levels. India’s IT and ITES-BPO exports are generally double the amount exported by China. See The McKinsey Quarterly, 2005:1. [6].See comments made by Nandan M. Nilekani, Managing Director of Infosys, in interview with a New York Times columnist in www. Infosys.com/media/playing_field.asp. Satyam maintains an overseas presence in 46 countries, Wipro in 35 countries, Tata Consultancy Services in 33 countries, Infosys in 17 countries, and HCL Technologies in 15 countries. See www.tcs.com, www.wipro.com, www.infosys.com, www.satyam.com, and www.hcltech.com [7].Computer software is protected by the Indian Copyright Act, which did not prohibit reverse engineering, thereby causing a great deal of anxiety to the outsourcing industry concerning piracy of intellectual products. Recently, an amendment to the Indian Patent Act has been proposed to protect software product. However, neither the Indian Penal Code nor the IT Act of 2000 deals adequately with emerging cyber crimes. See NASSCOM, Strategic Review 2005, pp. 172-173, and CNET News.com, June 29, 2005. [8].See the interviews with Clayton M. Christensen of Harvard Business School, and N.R. Narayana Murthy, Chairman and Chief Mentor of Infosys, in “Can Infosys be a Disruptive Innovator?” Business Standard, January 20, 2004.
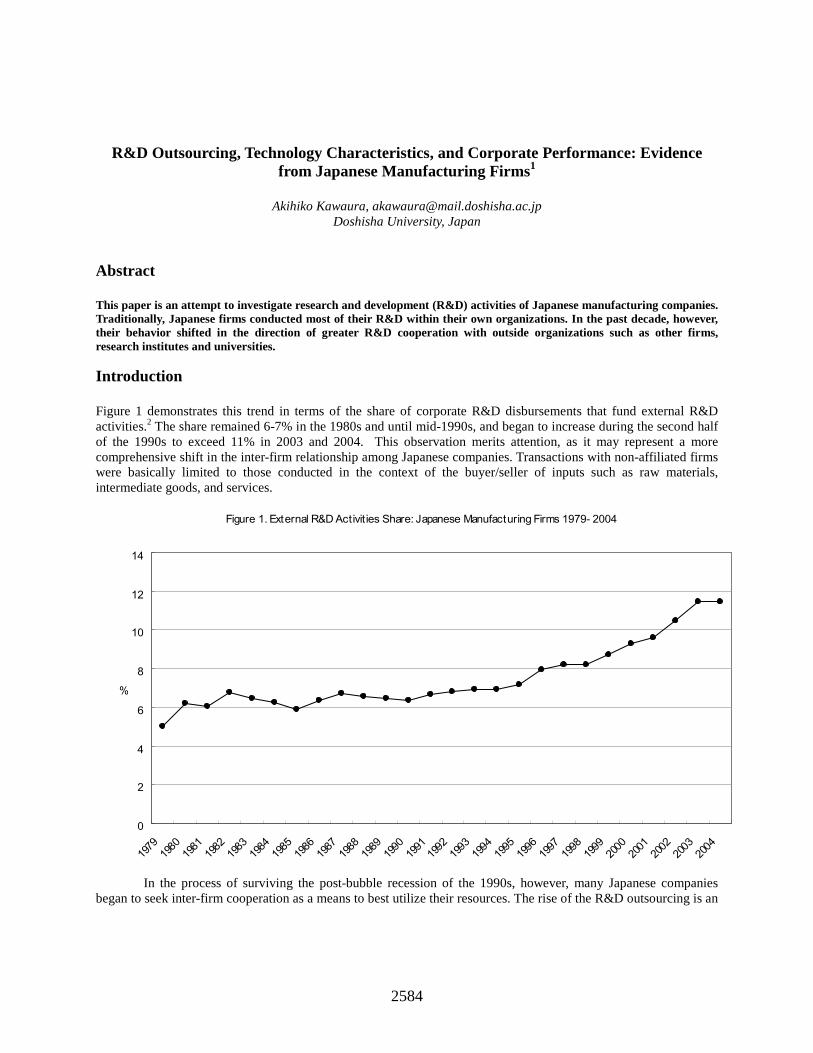
2584
R&D Outsourcing, Technology Characteristics, and Corporate Performance: Evidence from Japanese Manufacturing Firms1
Akihiko Kawaura, [email protected]
Doshisha University, Japan Abstract This paper is an attempt to investigate research and development (R&D) activities of Japanese manufacturing companies. Traditionally, Japanese firms conducted most of their R&D within their own organizations. In the past decade, however, their behavior shifted in the direction of greater R&D cooperation with outside organizations such as other firms, research institutes and universities. Introduction Figure 1 demonstrates this trend in terms of the share of corporate R&D disbursements that fund external R&D activities.2 The share remained 6-7% in the 1980s and until mid-1990s, and began to increase during the second half of the 1990s to exceed 11% in 2003 and 2004. This observation merits attention, as it may represent a more comprehensive shift in the inter-firm relationship among Japanese companies. Transactions with non-affiliated firms were basically limited to those conducted in the context of the buyer/seller of inputs such as raw materials, intermediate goods, and services.
Figure 1. External R&D Activit ies Share: Japanese Manufacturing Firms 1979- 2004
0
2
4
6
8
10
12
14
1979
1980
1981
1982
1983
1984
1985
1986
1987
1988
1989
1990
1991
1992
1993
1994
1995
1996
1997
1998
1999
2000
2001
2002
2003
2004
%
In the process of surviving the post-bubble recession of the 1990s, however, many Japanese companies began to seek inter-firm cooperation as a means to best utilize their resources. The rise of the R&D outsourcing is an
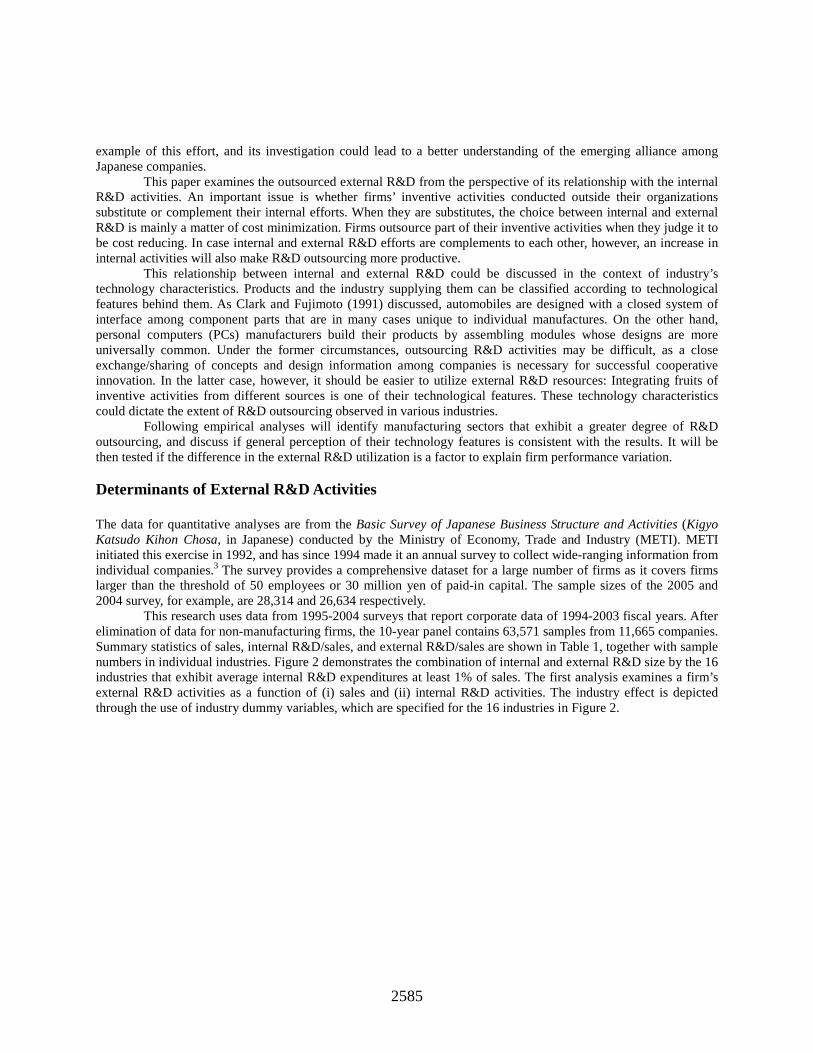
2585
example of this effort, and its investigation could lead to a better understanding of the emerging alliance among Japanese companies.
This paper examines the outsourced external R&D from the perspective of its relationship with the internal R&D activities. An important issue is whether firms’ inventive activities conducted outside their organizations substitute or complement their internal efforts. When they are substitutes, the choice between internal and external R&D is mainly a matter of cost minimization. Firms outsource part of their inventive activities when they judge it to be cost reducing. In case internal and external R&D efforts are complements to each other, however, an increase in internal activities will also make R&D outsourcing more productive.
This relationship between internal and external R&D could be discussed in the context of industry’s technology characteristics. Products and the industry supplying them can be classified according to technological features behind them. As Clark and Fujimoto (1991) discussed, automobiles are designed with a closed system of interface among component parts that are in many cases unique to individual manufactures. On the other hand, personal computers (PCs) manufacturers build their products by assembling modules whose designs are more universally common. Under the former circumstances, outsourcing R&D activities may be difficult, as a close exchange/sharing of concepts and design information among companies is necessary for successful cooperative innovation. In the latter case, however, it should be easier to utilize external R&D resources: Integrating fruits of inventive activities from different sources is one of their technological features. These technology characteristics could dictate the extent of R&D outsourcing observed in various industries.
Following empirical analyses will identify manufacturing sectors that exhibit a greater degree of R&D outsourcing, and discuss if general perception of their technology features is consistent with the results. It will be then tested if the difference in the external R&D utilization is a factor to explain firm performance variation. Determinants of External R&D Activities The data for quantitative analyses are from the Basic Survey of Japanese Business Structure and Activities (Kigyo Katsudo Kihon Chosa, in Japanese) conducted by the Ministry of Economy, Trade and Industry (METI). METI initiated this exercise in 1992, and has since 1994 made it an annual survey to collect wide-ranging information from individual companies.3 The survey provides a comprehensive dataset for a large number of firms as it covers firms larger than the threshold of 50 employees or 30 million yen of paid-in capital. The sample sizes of the 2005 and 2004 survey, for example, are 28,314 and 26,634 respectively.
This research uses data from 1995-2004 surveys that report corporate data of 1994-2003 fiscal years. After elimination of data for non-manufacturing firms, the 10-year panel contains 63,571 samples from 11,665 companies. Summary statistics of sales, internal R&D/sales, and external R&D/sales are shown in Table 1, together with sample numbers in individual industries. Figure 2 demonstrates the combination of internal and external R&D size by the 16 industries that exhibit average internal R&D expenditures at least 1% of sales. The first analysis examines a firm’s external R&D activities as a function of (i) sales and (ii) internal R&D activities. The industry effect is depicted through the use of industry dummy variables, which are specified for the 16 industries in Figure 2.
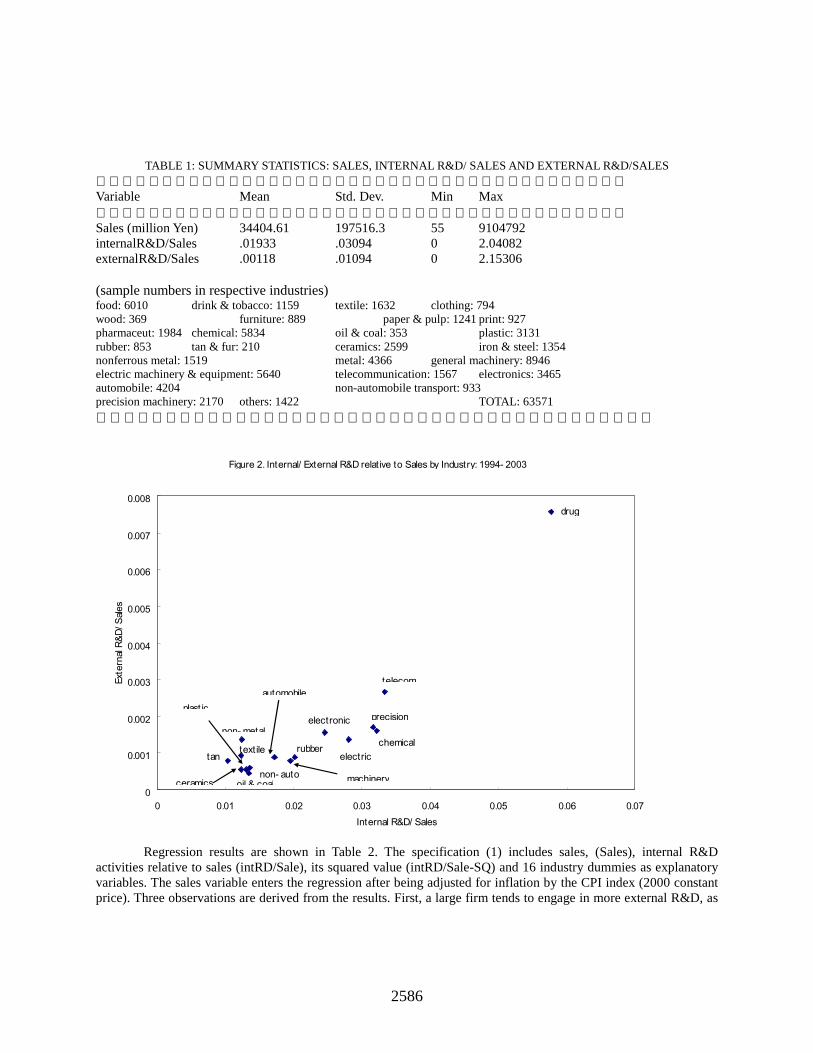
2586
TABLE 1: SUMMARY STATISTICS: SALES, INTERNAL R&D/ SALES AND EXTERNAL R&D/SALES
Variable Mean Std. Dev. Min Max Sales (million Yen) 34404.61 197516.3 55 9104792 internalR&D/Sales .01933 .03094 0 2.04082 externalR&D/Sales .00118 .01094 0 2.15306 (sample numbers in respective industries) food: 6010 drink & tobacco: 1159 textile: 1632 clothing: 794 wood: 369 furniture: 889 paper & pulp: 1241 print: 927 pharmaceut: 1984 chemical: 5834 oil & coal: 353 plastic: 3131 rubber: 853 tan & fur: 210 ceramics: 2599 iron & steel: 1354 nonferrous metal: 1519 metal: 4366 general machinery: 8946 electric machinery & equipment: 5640 telecommunication: 1567 electronics: 3465 automobile: 4204 non-automobile transport: 933 precision machinery: 2170 others: 1422 TOTAL: 63571
Figure 2. Internal/ External R&D relative to Sales by Industry: 1994- 2003
0
0.001
0.002
0.003
0.004
0.005
0.006
0.007
0.008
0 0.01 0.02 0.03 0.04 0.05 0.06 0.07Internal R&D/ Sales
Exte
rnal
R&D/
Sale
s
drug
telecom
chemical
precision
electric
electronics
machinery
rubber
automobile
oil & coalnon- auto
non- metal
textiletan
ceramics
plast ic
Regression results are shown in Table 2. The specification (1) includes sales, (Sales), internal R&D
activities relative to sales (intRD/Sale), its squared value (intRD/Sale-SQ) and 16 industry dummies as explanatory variables. The sales variable enters the regression after being adjusted for inflation by the CPI index (2000 constant price). Three observations are derived from the results. First, a large firm tends to engage in more external R&D, as
2587
implied by the positive and statistically significant coefficient of sales variable. Second, the coefficients combination of (intRD/Sale) and (intRD/Sale-SQ) indicates that the external R&D activities decrease until (intRD/Sale) reaches 0.125, from where external R&D increases. In view of the sample average internal R&D ratio of 0.019, it means that internal and external inventive efforts are substitutes for most of the firms. Third, firms in pharmaceutical, chemical, general machinery, electric machinery & equipment, telecommunication machinery & equipment, electronics machinery & equipment, and precision machinery industries exhibit external R&D activities that are relatively larger than other industries.
The specification (2) includes dummy-interactive variables in order to investigate the size effect as well as the relationship between external and internal R&D that are specific to individual industries. An interesting finding is that statistically significant coefficients of (intRD/Sale) and (intRD/Sale-SQ) that enter as dummy-interactive variables reveal that internal/external R&D relationship are not uniform across industries. In Table 3 is this R&D relationship categorized for 16 industries.4 In electronics industries, for example, the peak of external R&D takes place at (intRD/Sale) of 0.838, while the industry average (intRD/Sale) is 0.025. This implies that, for most electronics companies, external R&D rises at a decreasing rate as internal R&D activities increase. This complementality between two types of R&D activities is also observed for the electric machinery & equipment industry. In five industries, on the other hand, external R&D is characterized by a switch from substitutes to complements to internal R&D over the (intRD/Sale) range that covers three standard deviations from the industry average. They are pharmaceutical, ceramics, general machinery, telecommunications, and automobile industries.
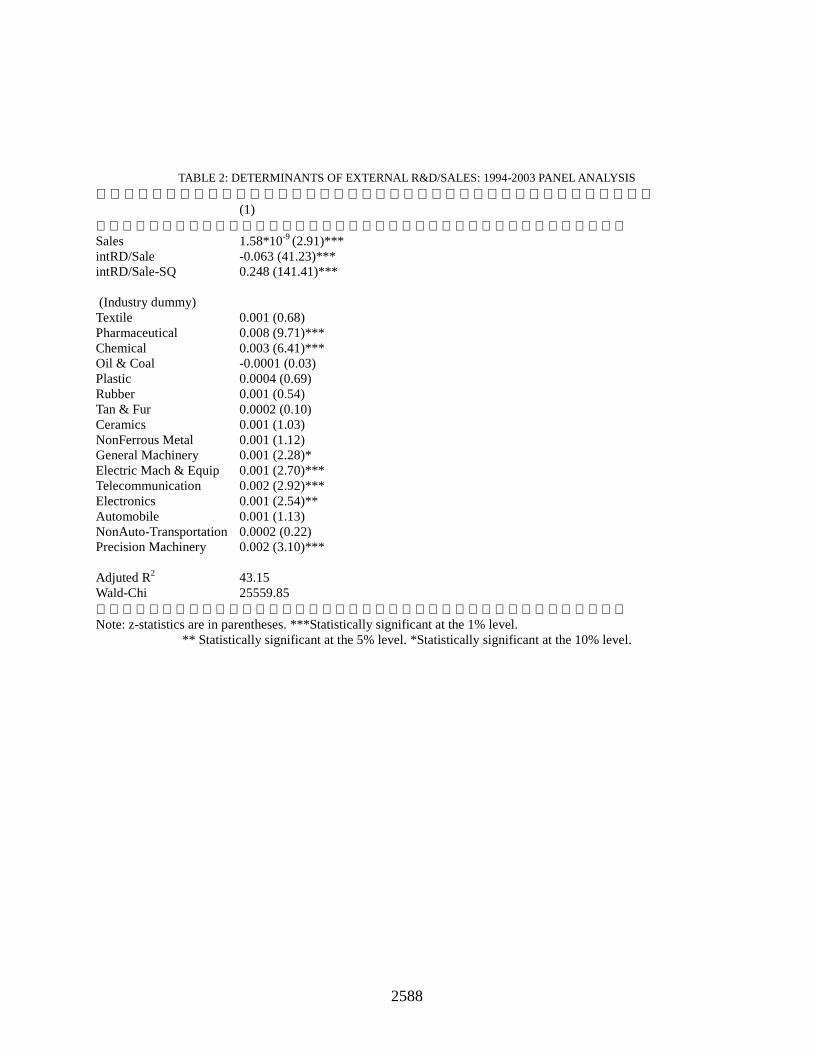
2588
TABLE 2: DETERMINANTS OF EXTERNAL R&D/SALES: 1994-2003 PANEL ANALYSIS
(1) Sales 1.58*10-9 (2.91)*** intRD/Sale -0.063 (41.23)*** intRD/Sale-SQ 0.248 (141.41)*** (Industry dummy) Textile 0.001 (0.68) Pharmaceutical 0.008 (9.71)*** Chemical 0.003 (6.41)*** Oil & Coal -0.0001 (0.03) Plastic 0.0004 (0.69) Rubber 0.001 (0.54) Tan & Fur 0.0002 (0.10) Ceramics 0.001 (1.03) NonFerrous Metal 0.001 (1.12) General Machinery 0.001 (2.28)* Electric Mach & Equip 0.001 (2.70)*** Telecommunication 0.002 (2.92)*** Electronics 0.001 (2.54)** Automobile 0.001 (1.13) NonAuto-Transportation 0.0002 (0.22) Precision Machinery 0.002 (3.10)*** Adjuted R2 43.15 Wald-Chi 25559.85 Note: z-statistics are in parentheses. ***Statistically significant at the 1% level.
** Statistically significant at the 5% level. *Statistically significant at the 10% level.
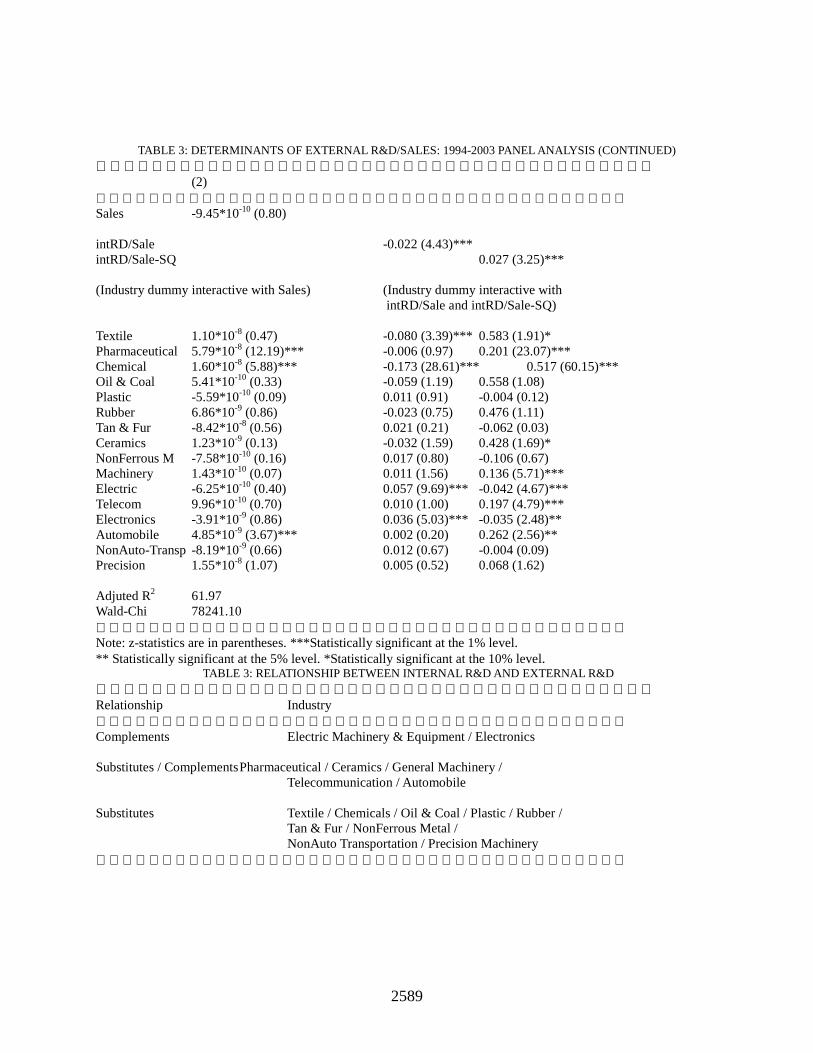
2589
TABLE 3: DETERMINANTS OF EXTERNAL R&D/SALES: 1994-2003 PANEL ANALYSIS (CONTINUED)
(2) Sales -9.45*10-10 (0.80) intRD/Sale -0.022 (4.43)*** intRD/Sale-SQ 0.027 (3.25)*** (Industry dummy interactive with Sales) (Industry dummy interactive with intRD/Sale and intRD/Sale-SQ) Textile 1.10*10-8 (0.47) -0.080 (3.39)*** 0.583 (1.91)* Pharmaceutical 5.79*10-8 (12.19)*** -0.006 (0.97) 0.201 (23.07)*** Chemical 1.60*10-8 (5.88)*** -0.173 (28.61)*** 0.517 (60.15)*** Oil & Coal 5.41*10-10 (0.33) -0.059 (1.19) 0.558 (1.08) Plastic -5.59*10-10 (0.09) 0.011 (0.91) -0.004 (0.12) Rubber 6.86*10-9 (0.86) -0.023 (0.75) 0.476 (1.11) Tan & Fur -8.42*10-8 (0.56) 0.021 (0.21) -0.062 (0.03) Ceramics 1.23*10-9 (0.13) -0.032 (1.59) 0.428 (1.69)* NonFerrous M -7.58*10-10 (0.16) 0.017 (0.80) -0.106 (0.67) Machinery 1.43*10-10 (0.07) 0.011 (1.56) 0.136 (5.71)*** Electric -6.25*10-10 (0.40) 0.057 (9.69)*** -0.042 (4.67)*** Telecom 9.96*10-10 (0.70) 0.010 (1.00) 0.197 (4.79)*** Electronics -3.91*10-9 (0.86) 0.036 (5.03)*** -0.035 (2.48)** Automobile 4.85*10-9 (3.67)*** 0.002 (0.20) 0.262 (2.56)** NonAuto-Transp -8.19*10-9 (0.66) 0.012 (0.67) -0.004 (0.09) Precision 1.55*10-8 (1.07) 0.005 (0.52) 0.068 (1.62) Adjuted R2 61.97 Wald-Chi 78241.10 Note: z-statistics are in parentheses. ***Statistically significant at the 1% level. ** Statistically significant at the 5% level. *Statistically significant at the 10% level.
TABLE 3: RELATIONSHIP BETWEEN INTERNAL R&D AND EXTERNAL R&D
Relationship Industry Complements Electric Machinery & Equipment / Electronics Substitutes / Complements Pharmaceutical / Ceramics / General Machinery / Telecommunication / Automobile Substitutes Textile / Chemicals / Oil & Coal / Plastic / Rubber / Tan & Fur / NonFerrous Metal / NonAuto Transportation / Precision Machinery
2590
In these seven industries where internal and external R&D activities could be complementary to each other, it is important for a company to develop in-house innovative capabilities for two reasons. First, integration of fruits of outsourced R&D activities into internal innovation requires substantial technological expertise. The second factor, which is related to the first, is the “learning” aspect of the internal R&D process.5 With accumulation of internal inventive efforts, a company is able to gain better assessment of various options of external R&D, and to identify the most suitable partners and projects.
Technological features of these industries demonstrate the importance of interface between internal and external innovations. Companies in electric machinery & equipment, telecommunications, and electronics industries compete in markets of high-technology products that combine frontier knowledge both in software and hardware. They allocate their own R&D resources to seek for the breakthrough core innovations while outsource inventive activities on the module part of the products. The internal R&D is important not only for its own sake, but also to create and maintain a promising pipeline of external R&D projects. The automobile industry, which is characterized by the “integral” technology, also shows complementarities between internal and external R&D, particularly for those firms with a high R&D intensity. Integrating innovative component parts to the entire automobile design system is a difficult task, which might be feasible only for companies with substantial internal technological capabilities. Once this option is available, however, new product development becomes more efficient by making use of the resources available outside. The drug industry is another industry where internal and external R&D activities are mutually enforcing. After chemical compounds are identified for the new drug, they have to be tested for clinical use. In both stages, a close R&D cooperation with universities and hospitals are crucial.
It is notable that the industries where internal and external R&D are substitutes include mature industries with a limited role of technological innovation, such as oil & coal, plastic, rubber, and tan & fur. The importance of maintaining internal inventive capacities could be lower for those industries where competition does not necessarily take place on the technological frontier. In this case, utilization of R&D outsourcing may lead to curtailment of internal innovative activities, hence substitutability between internal and external R&D. External R&D and Corporate Income This Section will extend the analysis of two types of R&D, and investigate the performance consequences of the R&D outsourcing. The corporate performance is gauged by the operating income, as this measure reflects effects of technological innovation both on sales (through product innovation) and costs (through process innovation) while excluding influences of peripheral factors for manufacturers such as returns on securities and sales of real estates. The dependent variable is the operating income relative to sales, and explanatory variables include sales, internal R&D relative to sales, external R&D relative to sales, and product of external R&D and internal R&D. Squared values of both internal R&D relative to sales and external R&D relative to sales enter the regression as well. Industry dummy interactive variables are also added in order to isolate industry effects.
The regression results are in Table 4. The coefficients combination of internal R&D relative to sales (2.063) and its squared value (-12.145) means that income increases as a company expands its internal R&D up to the point where it reaches 0.085 (8.50%) of sales. As the sample average of this ratio is 0.019 (with the standard deviation of 0.031) from Table 1, this result implies that innovative activities are performance enhancing options for most of the firms in the sample.
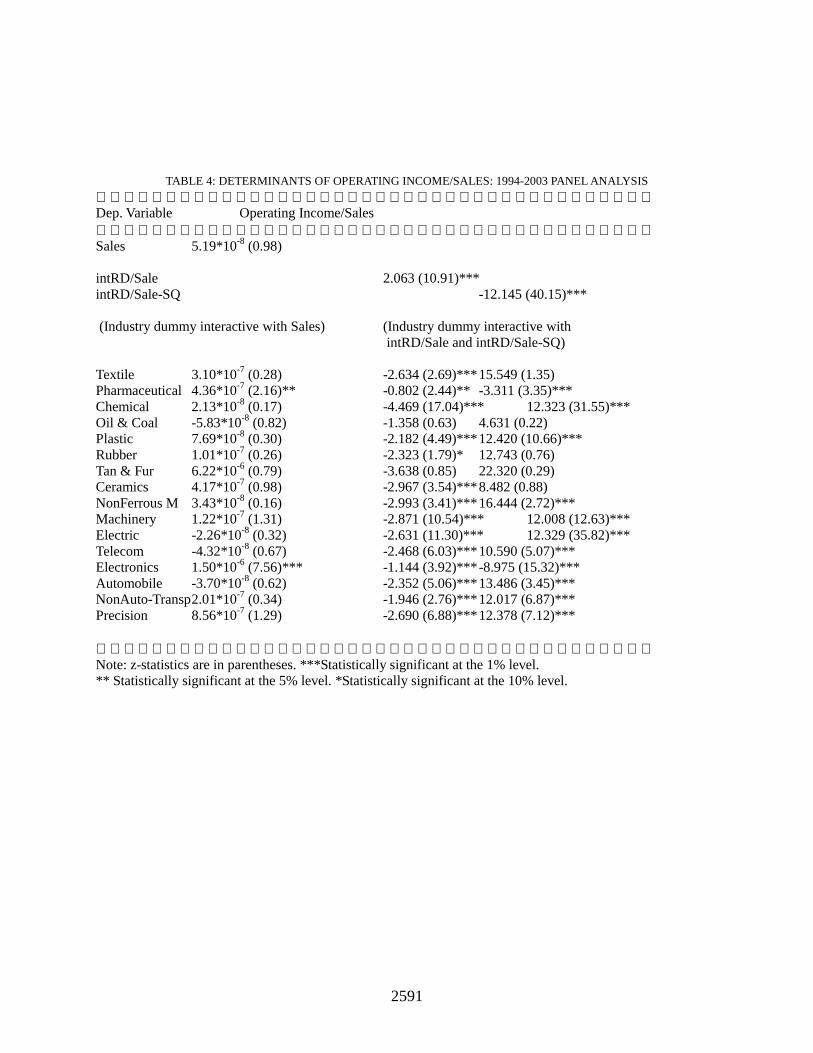
2591
TABLE 4: DETERMINANTS OF OPERATING INCOME/SALES: 1994-2003 PANEL ANALYSIS
Dep. Variable Operating Income/Sales Sales 5.19*10-8 (0.98) intRD/Sale 2.063 (10.91)*** intRD/Sale-SQ -12.145 (40.15)*** (Industry dummy interactive with Sales) (Industry dummy interactive with intRD/Sale and intRD/Sale-SQ) Textile 3.10*10-7 (0.28) -2.634 (2.69)*** 15.549 (1.35) Pharmaceutical 4.36*10-7 (2.16)** -0.802 (2.44)** -3.311 (3.35)*** Chemical 2.13*10-8 (0.17) -4.469 (17.04)*** 12.323 (31.55)*** Oil & Coal -5.83*10-8 (0.82) -1.358 (0.63) 4.631 (0.22) Plastic 7.69*10-8 (0.30) -2.182 (4.49)*** 12.420 (10.66)*** Rubber 1.01*10-7 (0.26) -2.323 (1.79)* 12.743 (0.76) Tan & Fur 6.22*10-6 (0.79) -3.638 (0.85) 22.320 (0.29) Ceramics 4.17*10-7 (0.98) -2.967 (3.54)*** 8.482 (0.88) NonFerrous M 3.43*10-8 (0.16) -2.993 (3.41)*** 16.444 (2.72)*** Machinery 1.22*10-7 (1.31) -2.871 (10.54)*** 12.008 (12.63)*** Electric -2.26*10-8 (0.32) -2.631 (11.30)*** 12.329 (35.82)*** Telecom -4.32*10-8 (0.67) -2.468 (6.03)*** 10.590 (5.07)*** Electronics 1.50*10-6 (7.56)*** -1.144 (3.92)*** -8.975 (15.32)*** Automobile -3.70*10-8 (0.62) -2.352 (5.06)*** 13.486 (3.45)*** NonAuto-Transp 2.01*10-7 (0.34) -1.946 (2.76)*** 12.017 (6.87)*** Precision 8.56*10-7 (1.29) -2.690 (6.88)*** 12.378 (7.12)*** Note: z-statistics are in parentheses. ***Statistically significant at the 1% level. ** Statistically significant at the 5% level. *Statistically significant at the 10% level.
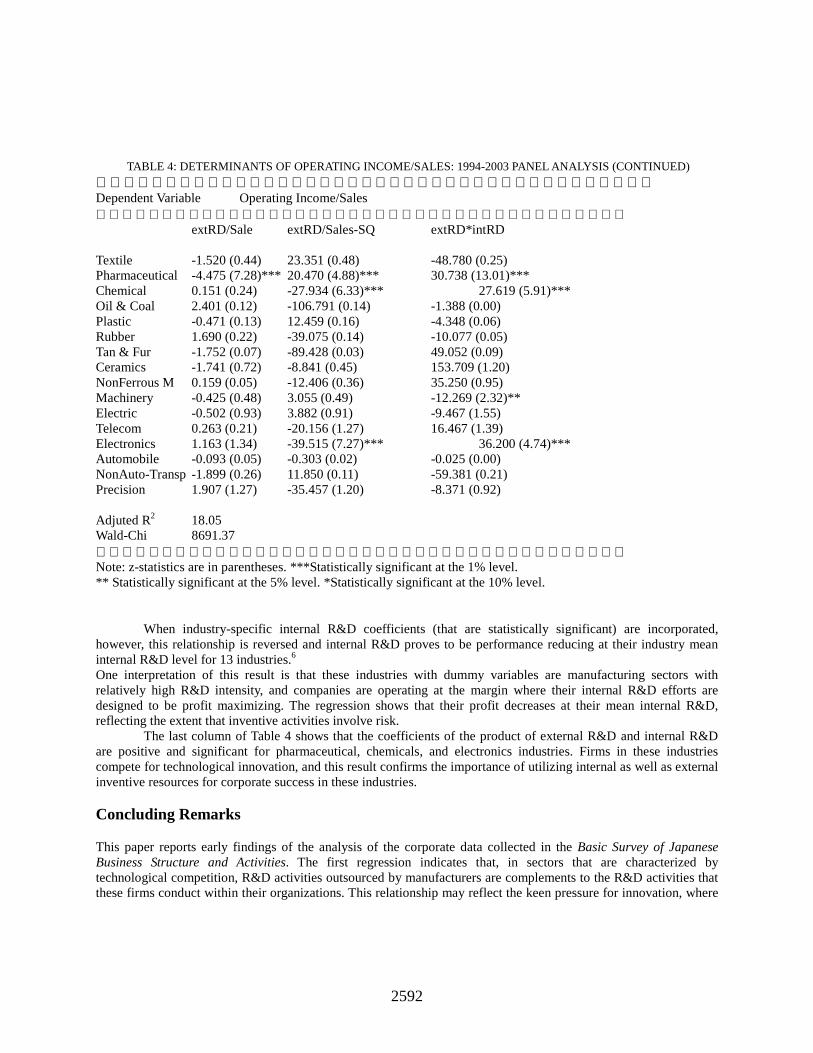
2592
TABLE 4: DETERMINANTS OF OPERATING INCOME/SALES: 1994-2003 PANEL ANALYSIS (CONTINUED)
Dependent Variable Operating Income/Sales extRD/Sale extRD/Sales-SQ extRD*intRD Textile -1.520 (0.44) 23.351 (0.48) -48.780 (0.25) Pharmaceutical -4.475 (7.28)*** 20.470 (4.88)*** 30.738 (13.01)*** Chemical 0.151 (0.24) -27.934 (6.33)*** 27.619 (5.91)*** Oil & Coal 2.401 (0.12) -106.791 (0.14) -1.388 (0.00) Plastic -0.471 (0.13) 12.459 (0.16) -4.348 (0.06) Rubber 1.690 (0.22) -39.075 (0.14) -10.077 (0.05) Tan & Fur -1.752 (0.07) -89.428 (0.03) 49.052 (0.09) Ceramics -1.741 (0.72) -8.841 (0.45) 153.709 (1.20) NonFerrous M 0.159 (0.05) -12.406 (0.36) 35.250 (0.95) Machinery -0.425 (0.48) 3.055 (0.49) -12.269 (2.32)** Electric -0.502 (0.93) 3.882 (0.91) -9.467 (1.55) Telecom 0.263 (0.21) -20.156 (1.27) 16.467 (1.39) Electronics 1.163 (1.34) -39.515 (7.27)*** 36.200 (4.74)*** Automobile -0.093 (0.05) -0.303 (0.02) -0.025 (0.00) NonAuto-Transp -1.899 (0.26) 11.850 (0.11) -59.381 (0.21) Precision 1.907 (1.27) -35.457 (1.20) -8.371 (0.92) Adjuted R2 18.05 Wald-Chi 8691.37 Note: z-statistics are in parentheses. ***Statistically significant at the 1% level. ** Statistically significant at the 5% level. *Statistically significant at the 10% level.
When industry-specific internal R&D coefficients (that are statistically significant) are incorporated, however, this relationship is reversed and internal R&D proves to be performance reducing at their industry mean internal R&D level for 13 industries.6 One interpretation of this result is that these industries with dummy variables are manufacturing sectors with relatively high R&D intensity, and companies are operating at the margin where their internal R&D efforts are designed to be profit maximizing. The regression shows that their profit decreases at their mean internal R&D, reflecting the extent that inventive activities involve risk.
The last column of Table 4 shows that the coefficients of the product of external R&D and internal R&D are positive and significant for pharmaceutical, chemicals, and electronics industries. Firms in these industries compete for technological innovation, and this result confirms the importance of utilizing internal as well as external inventive resources for corporate success in these industries. Concluding Remarks This paper reports early findings of the analysis of the corporate data collected in the Basic Survey of Japanese Business Structure and Activities. The first regression indicates that, in sectors that are characterized by technological competition, R&D activities outsourced by manufacturers are complements to the R&D activities that these firms conduct within their organizations. This relationship may reflect the keen pressure for innovation, where
2593
in-house R&D capabilities are crucial for companies’ own innovation as well as exploiting technological expertise available in the markets. The second analysis is an attempt to identify the corporate performance consequences of R&D activities, both internal and external. While a counter-intuitive observation is derived that internal R&D is not performance enhancing in many high R&D intensity sectors, it was demonstrated that combination of internal and external R&D would contribute to better corporate performance in drug, chemicals, and electronics industries. It is necessary to refine these analyses in order to investigate the factors behind firms’ decision to engage in R&D outsourcing. This would help our understanding of the link between innovation strategy, technology features and corporate strategy.
2594
References [1] Cohen, Wesley M., and Daniel A. Levinthal, “Innovation and learning: The two faces of R&D,” Economic
Journal, Vol. 99, September 1989, pp. 569-596. [2] Clark, Kim B., and Takahiro Fujimoto, Product Development Performance: Strategy, Organization, and
Management in the World Auto Industry, Boston: Harvard Business School Press, 1991 [3] Fukao, Kyoji, Keiko Ito, and Hyeong Ug Kwon, "Do out-in M&As bring higher TFP to Japan? An
empirical analysis based on micro-data on Japanese manufacturing firms" Journal of Japanese and International Economies, Vol. 19, 2005, pp. 272-301.
[4] Matsuura, Toshiyuki, and Kozo Kiyota, “Kigyo Katsudo Kihon Chosa Panel Data no Sakusei-Riyou ni Tsuite (in Japanese)”, Research Institute of Economy, Trade and Industry (RIETI) Policy Discussion Paper Series 04-P-004, March 2004.
End Notes
1This inquiry is part of a research project on “Reformed Japanese Innovation Model” organized at the Institute for Technology, Enterprises and Competitiveness (ITEC) of Doshisha University, funded under the Center of Excellence (COE) program of the Ministry of Education, Culture, Sports, Science and Technology. 2 The data source is Report on the Survey of Research and Development (various years) prepared by Statistics Bureau, Ministry of Internal Affairs and Communications. The documents report corporate R&D expenditures disbursed to finance internal as well as external R&D that are aggregated by industry. The share in Figure 1 is calculated as percentage share of external R&D in the total (internal and external) disbursements. 3 Matsuura and Kiyota (2004) provides a detailed description of the survey data. Fukao, Ito and Kwon (2005) presents a study of Japanese manufacturing firms based on the survey. 4 Derivation of the industry-specific R&D characteristics is based on the industry combination of (intRD/Sale) and (intRD/Sale-SQ) coefficients. This combination is obtained by adding, to the baseline (intRD/Sale) and (intRD/Sale-SQ) coefficients, coefficients of dummy interactive (intRD/Sale) and (intRD/Sale-SQ) variables when they are statistically significant at least at the 10% level. This re-evaluation is conducted for 9 industries, i.e., textile, pharmaceutical, chemical, ceramics, general machinery, electric machinery and equipment, telecommunications, electronics, and automobile. 5 Cohen and Levinthal (1989) investigate this issue, and write, “... while R&D obviously generates innovations, it also develops the firm’s ability to identify, assimilate, and exploit knowledge from the environment - what we call a firm’s ‘learning’ or ‘absorptive’ capacity.” (page 569). 6 They are textile, pharmaceutical, chemicals, plastic, rubber, ceramics, non-ferrous metals, general machinery, electric machinery & equipment, telecommunications, electronics, automobiles, and precision machinery industries.

2595