
Section 5 Updated FINAL - CiteSeerX
218
1289 International Marketing Communications in the Business-to-Business Market Bruno Završnik, [email protected] Maribor, Slovenia Damjana Jerman, [email protected] Intereuropa Ltd. Co., Koper, Slovenia Abstract This paper focuses on the business-to-business marketing communication of industrial firms in the Slovenian, Croatian, Bosnian, Serbian, and Montenegro markets. Marketing communications tools used to communicate offerings to consumers differ from those used to communicate offerings to business customers. A study explored the issues from a customer's perspective and surveyed industrial customers of logistical services regarding appropriate communication tools. It was found that logistics services are subject to several existing differences across the Former Yugoslavia and indicated a need to use different marketing communications tools for different logistics providers in these markets. The paper concludes with a discussion of results, implications, and directions for future research. Introduction The development of marketing communication in Former Yugoslavia countries is faced today with new opportunities and challenges. This process of transformation from underdeveloped to international competition resulted in overall economic liberalization and intensive growth of the logistics sector in these newly formed countries. Until 1991, Slovenia was part of Socialist Yugoslavia, together with the other republics of Bosnia and Herzegovina, Croatia, Macedonia and Serbia and Montenegro. The European Union marketplace has also driven companies in Balkan countries to look for new ways to be competitive. Stressing the competitive advantages offered by the suppliers of logistics is becoming increasingly important worldwide and also to Slovenia, Croatia, Bosnia and Herzegovina, Serbia and Montenegro, where a large number of logistics services suppliers currently operate. Strengthening the competitive position for companies in existing markets and entering new markets in the European Union and in South-Eastern Europe - these are the key strategies that characterized not only Slovenian companies, but also Croatian, Bosnian, Serbian, and Montenegro companies. These components are also the main levers that will balance out the changes expected when other transition countries join the European Union. Operating conditions in the logistics industry upon a country’s accession to European Union changed considerably. Slovenia has already joined to European Union, and other transition countries i.e. Croatia, Bosnia and Herzegovina and Serbia and Montenegro will face their time of accession to the European common market as well. For companies operating in those markets, the primary goal is to prepare extensively for the new business environment. They need to react to the strong competition in the logistics industry by becoming more involved in the supplier selection process and by becoming more critical, detailed, and comparative in their supplier evaluation. Logistics companies in the Former Yugoslavia countries are adapting to development guidelines at various levels. Like Mentzer, Myers, and Cheung (2004) also argued that logistics offerings are subject to differences across countries. Logistics service expectations differ across national and cultural boundaries, enhanced personal interaction frequently occurs in service settings, and service use patterns frequently differ across countries as well as differences in more traditional influences, such as timeliness and responsiveness. These differences increase the difficulty for a unified marketing communication strategy across those different market segments. The fact is that different marketing communications tools are required for those markets. Like most areas of marketing, business-to-business communication is undergoing new challenges and evolving through the development of emerging opportunities. In the domain of communication practices, industrial customers in particular must rely more heavily and more intensively on an accurate marketing communication to influence the buyer decision.
-
Upload
khangminh22 -
Category
Documents
-
view
2 -
download
0
Transcript of Section 5 Updated FINAL - CiteSeerX

1289
International Marketing Communications in the Business-to-Business Market
Bruno Završnik, [email protected] Maribor, Slovenia
Damjana Jerman, [email protected] Intereuropa Ltd. Co., Koper, Slovenia
Abstract This paper focuses on the business-to-business marketing communication of industrial firms in the Slovenian, Croatian, Bosnian, Serbian, and Montenegro markets. Marketing communications tools used to communicate offerings to consumers differ from those used to communicate offerings to business customers. A study explored the issues from a customer's perspective and surveyed industrial customers of logistical services regarding appropriate communication tools. It was found that logistics services are subject to several existing differences across the Former Yugoslavia and indicated a need to use different marketing communications tools for different logistics providers in these markets. The paper concludes with a discussion of results, implications, and directions for future research. Introduction The development of marketing communication in Former Yugoslavia countries is faced today with new opportunities and challenges. This process of transformation from underdeveloped to international competition resulted in overall economic liberalization and intensive growth of the logistics sector in these newly formed countries. Until 1991, Slovenia was part of Socialist Yugoslavia, together with the other republics of Bosnia and Herzegovina, Croatia, Macedonia and Serbia and Montenegro. The European Union marketplace has also driven companies in Balkan countries to look for new ways to be competitive. Stressing the competitive advantages offered by the suppliers of logistics is becoming increasingly important worldwide and also to Slovenia, Croatia, Bosnia and Herzegovina, Serbia and Montenegro, where a large number of logistics services suppliers currently operate. Strengthening the competitive position for companies in existing markets and entering new markets in the European Union and in South-Eastern Europe - these are the key strategies that characterized not only Slovenian companies, but also Croatian, Bosnian, Serbian, and Montenegro companies. These components are also the main levers that will balance out the changes expected when other transition countries join the European Union. Operating conditions in the logistics industry upon a country’s accession to European Union changed considerably. Slovenia has already joined to European Union, and other transition countries i.e. Croatia, Bosnia and Herzegovina and Serbia and Montenegro will face their time of accession to the European common market as well. For companies operating in those markets, the primary goal is to prepare extensively for the new business environment. They need to react to the strong competition in the logistics industry by becoming more involved in the supplier selection process and by becoming more critical, detailed, and comparative in their supplier evaluation. Logistics companies in the Former Yugoslavia countries are adapting to development guidelines at various levels. Like Mentzer, Myers, and Cheung (2004) also argued that logistics offerings are subject to differences across countries. Logistics service expectations differ across national and cultural boundaries, enhanced personal interaction frequently occurs in service settings, and service use patterns frequently differ across countries as well as differences in more traditional influences, such as timeliness and responsiveness. These differences increase the difficulty for a unified marketing communication strategy across those different market segments. The fact is that different marketing communications tools are required for those markets. Like most areas of marketing, business-to-business communication is undergoing new challenges and evolving through the development of emerging opportunities. In the domain of communication practices, industrial customers in particular must rely more heavily and more intensively on an accurate marketing communication to influence the buyer decision.

1290
Business-to-business marketing communications are an important marketing communications topic. However, there are a number of important differences between communications in a consumer environment and in a business environment. As a result, marketing communications will have to be adapted to these different circumstances, not only in terms of the communications strategies and tactics, but also regarding the instruments that are used or at least the relative emphasis that is put on some instruments at the expense of others. And also, the increasing rate of the globalization of markets makes business-to-business marketing communications an important issue in today’s uncertain and challenging economic environments. Company may rely on personal selling and other sales promotion tools to inform customers. These represent the worldwide basis for informing the customers. While several studies of marketing communications have selectively focused on consumer market, we restrict our research on business-to-business markets of the logistical services. Today, managing effective communications requires more skills in business-to-business marketing communications. Notwithstanding the apparent importance of marketing communication in today’s environment, surprisingly few empirical studies have been concerned about marketing communications in the business-to-business market (Gilliland and Johnston, 1997; Garber and Dotson, 2002; Borghini and Rinallo, 2003). We have examined logistical services particularly in terms of business-to-business services marketing communications. Green (1998) observed that business consumers have been characterized as being more technical and more information-seeking than the mass consumer; therefore, the business-to-business marketing communications generally places a higher level of importance on utilitarian factors like price, productivity, reliability of delivery, and superior quality. While these utilitarian factors have been considered important to business customers, there has been no empirical research examining how marketers of logistical services are communicating these factors to the segment of business customers. Thus, a gap exists in service marketers’ understanding of a particularly important business-to-business marketing communications. The paper consists of two parts: the theoretical foundation for the analysis of the business-to-business marketing communications and the empirical analysis, based on the primary data collected. An empirical investigation of respondents from four countries reveals the different attitudes of respondents towards various marketing communications tools. Literature Review From the review of the pertinent literature is clear that, although some research attempts have started to appear regarding the role and features of different marketing communications tool in the business-to-business market, very limited work has been done regarding the marketing communications tools that are important in the business-to-business market in the field of logistic industry. Further, although some of researchers have presented the different role of marketing communications in the business-to-business market mainly regarding different industrial products and none of them was concerned with logistical services, in the case of Slovenian, Croatian, Bosnian and Serbian markets. The increasing importance of communications in the industrial market was provided by Hart (1998), who presented different topics in the industrial marketing communications context. Thus, there is considerable evidence that the potential of business-to-business marketing communication is not yet fully exploited in business practice. Business-to-business marketing communications also represent a neglected area in academic research. It is also interesting to note that leading textbooks in industrial or business-to-business marketing (Bingham and Raffield, 1990; Hutt and Speh, 1998; Bingham, Gomes, and Knowles, 2005) typically devote limited space to business-to-business marketing communications. Also, reviews of contributions from journals specialized in the area reveal a very limited emphasis to communication in the business-to-business market (Smith, Gopalakrishna, and Smith, 2004; Cutler and Javalgi, 1994; Garber and Dotson, 2002; Rinallo and Borghini, 2003; Gilliland and Johnston, 1997, Homburg and Garbe, 1999; Brennan, 2003; Herrington and Lollar, 1996). This research gap may partly be attributed to an overemphasis on the business-to-consumer/business-to business dichotomy. As a result of further considerations emerging from literature analysis on the use of communication tools in the business-to-business markets, we hypothesize that customers interested in purchasing supplier’s logistical

1291
services will privilege those tools that allow a direct and interactive exchange with the supplier’s representatives, such as sales representatives visits, trade advertising, trade fairs, exhibitions during conferences and meetings, and so on. These communication tools are suitable for creating an experiential exchange of information. Borghini and Rinallo (2003) found in their paper the direct contacts let the sellers reduce the social and the technological distance from the buyers and give the customer the possibility to assess the supplier capabilities with direct questioning and tests. It has been posited that different instruments of marketing communications targeting business customers have more of an informational and supportive role than marketing communications targeting general consumers. Business customers have also been characterized as being more technical and more information-seeking than the mass consumers. For these reasons the business-to-business marketer generally places a higher level of importance on utilitarian factors like price, productivity, reliability of delivery, and superior quality (Green, 1998). The Role of Marketing Communications in the Business-to-Business Market Communication is the human activity that links people together and creates relationships. It serves as the way to develop, organize and disseminate knowledge (Duncan and Moriarty, 1998). Smith, Berry and Pulford (2002) reported that “communication is a constant activity. It is more than a marketing tool. It is a universal and essential feature of human expression and organization”. Communications in the marketing channel are important from both a theoretical and managerial perspective. They are “the glue that holds together a channel of distribution” as they serve not only as a process by which persuasion, decision making, coordination and power can occur, but as an avenue by which commitment and loyalty can be encouraged (Mohr and Nevin, 1990). Thus, how an organization communicates with customers is important as it affects whether or not the organization attracts new customers, as well as how existing customers experience both the company and its products or services. Business marketing communications refers to the use of the seller-generated promotional tools to deliver messages to business markets. Most basically, there are three purposes of marketing communication – to inform, to persuade, and to remind customers and potential customers about a product or a company. The promotional tools used in marketing communication – professional selling, advertising, public relations, sales promotion and direct marketing – are often referred to as promotional mix (Bingham, Gomes, and Knowles, 2005). Customers base their judgments of service and products in part on their perceptions of messages conveyed by organizations. Positive perceptions can increase an organization’s credibility in customers’ eyes. For organizations in the business-to-business market, there are several communication channels available. One important channel consists of intermediaries. Consequently, organizations need to provide support to their intermediaries such as providing them with free samples, free use of services, consultations, or personal selling. Through the communication efforts of its advertising and sales department, customers can also learn about an organization. Through public relations activities, organizations can transmit a positive image of their services. Examples of public relations activities include exhibitions, in-house journals, sponsorships, and campaigns for local communities (Aung and Heeler, 2001). Today, successful organizations use integrated marketing communications. Companies can better leverage value-chain benefits to their customers if they integrate their promotion tasks. Instead of optimizing individual elements of marketing communications (e.g. advertising or personal selling) one at a time, close coordination of a various promotion activities within the company helps companies to enhance overall promotional effectiveness. Integrated marketing communications is defined as a “strategic business process used to plan, develop, execute and evaluate coordinated, measurable, persuasive brand communication programs over time with consumers, customers, prospects and other targeted, relevant external and internal audiences« (Keller, 2001). Low reported (2000) that integrated marketing communications has been also defined as a “strategic combination of all messages and media used by an organization to influence its perceived brand value.”

1292
Research Methodology Sample and Response Our empirical research is based upon two different samples. One sample includes 400 companies from three different countries: Croatian, Bosnian-Herzegovina and Serbian-Montenegro companies. The second sample includes 850 Slovenian companies. The research was carried out in Croatia, Bosnia and Herzegovina and Serbia and Monte Negro in November 2006, the mailing in Slovenia was conducted in September 2006. In the first sample we were using the first sample of 400 companies. During the four-week period following the mailing, a total of 84 responses were received. Including the 21 undeliverable surveys (e.g., wrong address, the respondent not existing) and 4 incomplete surveys, a response rate of 21,0% was achieved (84/400). Thus, the 59 respondents in the sample may be somewhat unique in their characteristics. In this research, the response rate is defined as the percentage of total questionnaires returned by respondents. The second sample included 850 Slovene companies, logistical directors and other executives who purchase logistical services. Incorporating the 16 undeliverable surveys (e.g., wrong address) and 12 incomplete surveys, a response rate of 37,1% was achieved (315/850). The results presented in this paper are from these 287 respondents. The collected empirical data were processed with SPSS 10, where the emphasis was given to descriptive and inferential statistical analysis. Some of the possible limitations of the survey results should be noted. First, the low response rate might be considered a concern, but in fact, it is expected in organizational research as opposed to consumer research (Hansen, Swan and Powers, 1996). Second, the time-lag between the two mailing should be considered. Measures A number of measures were collected, including demographics, for each respondent. Multi-item scales based on the procedures outlined by Chirchill (1979) were developed. Most of the measures revolved around the two research issues, and as such, are discussed below. Having as a general guide previous work in the field by Garber and Dotson (2002) and MacLeod et al. (1999) in the field of American transport and logistic market, we selected 20 marketing communications tools to be measured. These tools fall into Kotler’s (2006) four major elements of the marketing communications mix, namely advertising, personal selling, public relations and sales promotion. Using a five-point scale, respondents were asked to indicate the importance of different tools importance (5=”extremely important” to 1= “of little importance”). These 20 marketing communications tools, together with descriptive statistics are provided in following Tables. Empirical Findings Company Profile In the first part of the questionnaire, the respondents were asked some basic facts about the company, its line of business, number of employees, its largest sales markets, and the respondent’s position in the company. The following five Tables show certain characteristics of the sample companies. We can see the respondent’s country of origin in the Table 1.
TABLE 1: RESPONDENTS COUNTRY OF ORIGIN Country Frequency Percent Croatia 33 9,54% Bosnia and Herzegovina 10 2,89% Serbia and Montenegro 16 4,62% Slovenia 287 82,95% Total 346 100,00%

1293
The returns were dominated by companies of production-oriented business, followed by commercial-
oriented business and service-oriented business, which is presented in the Table 2.
TABLE 2: MAIN ACTIVITY OF COMPANIES Main activity Frequency Percent
Production-oriented business 172 49,71% Service-oriented business 47 13,58% Commercial business 108 31,21% Other 19 5,49% Total 346 100,00%
The position of respondents in the companies shows the following structure in the Table 3. Forty-one percent
of the respondents were top executives, thirty-two percent of the respondents belong to middle management, and twenty-five percent of respondents belong to first line management. The remaining three percent of the respondents had different positions in the companies.
TABLE 3: RESPONDENTS’ POSITION IN THE COMPANY Position Frequency Percent Top management 140 40,46% Middle management 111 32,08% First line management 85 24,57% Other 10 2,89% Total 346 100,00%
The surveyed companies were next asked about their largest sales market. The respondents had the
possibility to choose from four different answers. The results in the Table 4 show that the largest respondent sales market is the market of commercial enterprises that is profit-motivated. This is followed by the consumer market, followed by the market of institutions (nonprofit-motivated organizations) and the government (national or local politically oriented organizations).
TABLE 4: RESPONDENTS’ SALES MARKET Sales market Frequency Percent Commercial enterprises 269 94,20% Government 58 16,80% Institutions 62 17,90% Final consumer 171 49,40%
A wide range of companies, classified according to their number of employees, are represented in this study. The returns were dominated by small companies, as we can see from the Table 5. In our sample we had 61,3 % of small companies, 20,8% large companies, and the remaining 17,9 % were middle-sized companies.
TABLE 5: SIZE OF THE RESPONDENTS COMPANIES Number of employees Frequency Percent
Small companies 212 61,27% Middle-size companies 62 17,92% Large companies 72 20,81% Total 346 100,00%

1294
Importance of Marketing Communications Tools We asked the managers to report on the importance of the twenty common marketing communications tools. In Table 6 below are listed the results of the importance of different marketing communications tools as viewed by the respondents. They were asked to indicate on a 5-point Likert scale, the importance (5=”extremely important” to 1=“of little importance”) of different marketing communications tools listed bellow.
The results show that there are small differences between the mean scores in importance of marketing communication tools. Respondents indicated advertising on the internet and catalogues and other presentation material as the most important communications tools, followed by direct mail and television advertising. Personal sales visits and participation in trade shows were given by respondents also a high importance. The findings are aligned with the practice of business-to-business marketing, which entails that advertising is necessary, but still not sufficient for the accomplishment of actual sale of services. It plays a supporting role to the personal selling to maintain and expand the sales.
Some forms of direct marketing, such as direct mail, it is also in an important way to reach customers in business market. For the customers of logistical company Intereuropa, attending the trade shows was more important than other forms of advertising, e.g. on transport vehicles, in newspapers and in trade journals. The public relations service was classified as a less important instrument of marketing communications. Respondents gave a low importance to various communication tools of public relations (e.g. sponsorship, donations, participation in charity events, house magazines, press conferences).
To understand the differences in the respondents’ view of the relevance of different marketing communications tools across the countries, we would like to find if there are some statistical differences between Slovenian, Croatian, Bosnian and Serbian companies. Assumptions to be met for ANOVA are that the population should be normally distributed, the groups should be independent of each other and the groups should be of equal variance (Taylor, 2001). We checked the distribution by carrying out a Kolmogorov-Smirnov test of normality and the results had been significant (p = 0,000) for all marketing communications tools. The four groups are also independent from each other and this was satisfied by the random selection of the samples.
The null hypothesis in one-way ANOVA assumes that all means are equivalent, while the alternative hypothesis states the variability or differences in the means being compared is greater than expected from a sampling error, that is, at least one of the means is significantly different from the others tested (Davis, 1997). Accordingly, we make the hypothesis as follows:
Null hypothesis, H0, is that all the group means are equal. Alternative hypothesis, H2, is that at least two of the means are different.

1295
TABLE 6: RESPONDENTS’ IMPORTANCE OF MARKETING COMMUNICATIONS TOOLS ACROSS THE COUNTRIES
Marketing communications tool Croatia
Bosnia and
Herzegovina
Serbia and Monte Negro Slovenia
Mean Mean Mean Mean Overall mean
Overall std.
deviation
Personal sales visits 4,23 4,40 3,69 4,09 4,11 0,30
Advertising on the internet 3,81 4,70 4,19 3,85 4,23 0,41
Television advertising 3,93 4,40 4,06 3,35 4,13 0,44 Catalogue and other presentation material 3,80 4,90 4,00 4,04 4,23 0,49
Direct mail 3,84 4,50 4,07 3,61 4,14 0,38
Participation in trade shows 3,83 4,50 3,94 3,61 4,09 0,38
Advertising in trade journals 4,10 4,00 3,63 3,87 3,91 0,20
Advertising on transport vehicles 3,70 4,10 3,31 3,55 3,70 0,33
Advertising in newspapers 3,42 4,30 3,38 3,40 3,70 0,45 Distributing goodwill gifts and new year greetings to clients 3,47 4,10 3,25 3,29 3,61 0,39
Shows on events and conferences 3,20 3,90 3,50 3,28 3,53 0,31
Press release 3,17 3,90 3,50 3,04 3,52 0,38
Events (sport, cultural, ...) 3,23 3,70 3,00 2,88 3,31 0,36 Advertising on CD (business directories) 3,07 4,10 3,06 2,79 3,41 0,58
Radio advertising 3,32 3,90 2,63 3,03 3,28 0,53
Sponsorship 3,07 3,50 3,06 2,88 3,21 0,26
Donations 2,87 3,60 2,75 2,82 3,07 0,40
Participation in charity events 2,97 3,40 2,88 2,60 3,08 0,33
House magazines 2,70 3,10 3,31 3,03 3,04 0,25
Press conferences 2,67 3,10 3,00 2,73 2,92 0,21
We compared these four groups with respect to their importance of different marketing communications tools to see whether this would yield different results. Using one-way analysis of variance (ANOVA), we found the statistical difference among these segments regarding advertising on the radio (F ratio = 2,988; p = 0,031), television advertising (F ratio = 5,867; p = 0,001), participation in trade shows (F ratio = 2,655; p = 0,049), distributing goodwill gifts and new year greetings to clients (F ratio = 4,048; p = 0,008), advertising on CD e.g. Kompass (F ratio = 2,979; p = 0,032), house magazines (F ratio = 2,687; p = 0,047), and direct mail (F ratio = 2,805; p = 0,040). So, we reject the null hypothesis and conclude that there is a significant difference among different countries regarding marketing communications tools mentioned above.
We also applied the ANOVA to compare the mean score of the importance of different marketing communications tools among the following independent groups: small companies, medium-sized, and large companies. When respondents were divided regardless of their size, a statistical difference was not observed in the importance attached to different marketing communications tools. The test statistic doesn’t exceed the critical value so we don’t reject the null hypothesis and conclude that the means of different groups regarding the size of the company are equal.

1296
Managerial Implications Findings from this study present an opportunity for future research by examining the most important marketing communication tools to use in the business-to-business market in the logistic industry. Marketing agencies and business organizations should use personal selling, trade shows and other tools of marketing communications with an emphasis on personal contact for effective marketing communication. The findings suggest that publicity can enhance the overall marketing communication effort. As business marketers focus on value and debate how to communicate value to their customers, many are rediscovering the strategic importance of public relations in their marketing communications mixture. The issue that is also important because revealing that there are major differences across the former Yugoslavia countries in how business-to-business marketers communicate their characteristics of logistical services to segments of business consumers. These differences are reflected in the use of different marketing communications tools. Conclusion The management of business-to-business marketing communications can be a competitive advantage in achieving the strategic company objectives. One difficult challenge for marketers is the large communication options that are available to support their brands (e.g. TV, print advertising, interactive advertising, trade promotion, press releases, sponsorship, event marketing, etc.). Marketers must understand that various marketing communications options have to offer and how they should be combined to optimize their marketing communications programs.
Our research explored the current attitudes of managers in the logistic industry. Specifically, we examined their evaluation of the importance of various promotional tools. We found evidence that a manager's perception is viewed differently by companies in the Former Yugoslavia countries. So, we are not able to make substantial generalizations about the marketing communication strategy. This finding would tend to indicate that each nation represents, in part, significantly different market segments. Thus while some of Western Europe is moving toward “one market,” the transitional Balkan nations still remain significantly different market segments.
There are several implications of these findings for logistics management. The results indicate that having different levels of importance for characteristics of a logistics provider across countries can contribute to the development of different marketing strategies for those market segments. Also, the effectiveness of marketing communication strategies depends upon which communication tool is used in different Balkan countries. The logistics marketplace is highly competitive, and thus managers have to be involved in the selection of a logistics provider. Further, marketing communication plays an essential role in the logistics industry. Personal selling and other personal contact promotions (direct mail, participation in trade shows, catalogs and other presentation material) are perceived to be the most important promotional tools in the logistic industry. Some forms of mass media, such as television advertising and Internet advertising, were also given a high importance by respondents. The relative importance of these tools varies with the stage of the relationship between buyer and supplier.
The results indicate that the structure of marketing communications mix in the sample of firms is aligned with the theory in the business-to-business market. The analysis of data on Slovenian, Croatian, Bosnian and Serbian and Montenegro consumers partly confirmed the differences in the marketing communications applied in those markets.
A better understanding of business-to-business marketing communications in Former Yugoslavian countries would contribute to business organizations in the field of logistic industry. It would enable marketers to create more effective marketing communications programs.
Because of the differences across in attribute importance and promotional tools across countries, we conclude that managers should develop different marketing strategies in transitional countries (i.e. Croatia, Bosnia and Herzegovina, Serbia and Montenegro). A better understanding of business-to-business marketing communications in the Former Yugoslavia countries would contribute to increased/stronger business organization in the logistic industry.

1297
References [1] Aung, M., & Heeler, R. (2001). Core Competencies of Service Firms: A Framework for Strategic Decisions
in International Markets. Journal of Marketing Management, 17, 619-643. [2] Bingham, F.G. Jr., & Raffield, B.T.III (1990). Business to Business Marketing Management. Homewood:
Irwin. [3] Bingham, F.G. Jr., Gomes, R., & Knowles, P.A. (2005). Business marketing (3rd ed). New York: McGraw–
Hill/Irwin. [4] Borghini, S., & Rinallo, D. (2003). Communicating competence in the medical diagnostic industry, A
customers’ view? Retrieved June 23, 2005, from http://www.impgroup.org/paper_view.php?viewPaper=4299 [5] Brennan, R. (2003). The Industrial/Consumer Marketing Dichotomy: A Re-Examination, 19th IMP-
conference. Retrieved June 23, 2005 from [Online] Available: http://www.impgroup.org/paper_view.php?viewPaper=4300
[6] Burnett, J., & Moriarty, S. (1998). Introduction to Marketing Communication: An Integrated Approach. New Jersey: Prentice Hall.
[7] Chirchill, G. A. (1979). A paradigm for developing better measures of marketing constructs [Electronic version]. Journal of Marketing Research, 16(1), 64-73.
[8] Cutler, B. D., & Javalgi, R. G. (1994). Comparison of Business-to-Business Advertising: The United States and the United Kingdom. Industrial Marketing Management, 23, 117-124.
[9] Davis, J. J. (1997). Advertising Research – theory and practice. New Jersey: Prentice Hall. [10] Duncan, T., &, Moriarty, S. (1998). A Communication-Based Marketing Model for Managing Relationships
[Electronic version]. Journal of Marketing, 62, 1-13. [11] Garber Jr., L., & Dotson, M. J. (2002). A method for the selection of appropriate business–to–business
integrated marketing communications mixes [Electronic version]. Journal of Marketing Communications, 8, 1-17.
[12] Gilliland, D.I., & Johnston, W. J. (1997). Toward a Model of Business–to–Business Marketing Communications Effects. Industrial Marketing Management, 26, 15 – 29.
[13] Green, C.L. (1998). Communicating service quality: are business–to–business ads different? The Journal of Service Marketing, 12, 165 – 176.
[14] Hansen, S.W., Swan, J.E., & Powers, T.L. (1996). The perceived effectiveness of marketer responses to industrial buyer complaints: suggestions for improved vendor performance and customer loyalty. Journal of Business & Industrial Marketing, 11(1), 77 – 89.
[15] Hart, N. (1998). Business–to–Business Marketing Communications. London: Kogan Page. Contact authors for complete list of references.

1298
Process-Centric Approach to Customer Relationship
Arpita Khare, [email protected] Indian Institute of Information Technology, India
Anshuman Khare, [email protected] Athabasca University, Canada
Abstract Today’s customer demands not only quality products and services but also looks for value in the transaction process itself. This paper explores the role and relevance of IT in creating sustainable relationships. The discussion focuses on the use of technology in the financial sector in India. It highlights how they are changing their business processes to provide better value to the customer during the interaction. The paper reiterates the growing relevance and demand for building relationships with customers and emphasizes the usage of information technology in creating better value for the end user. It also explores the practices being adopted in the financial sector organizations in India in redesigning their business processes to enhance their competitiveness through more meaningful interaction with customers. With information technology setting newer standards of performance, financial organizations that will be able to reorganize their business and services around core processes are the ones that stand to succeed. Introduction Organizations are adopting new technological imperatives in order to outperform their competitors. The emphases herein lie in identifying the critical value adding processes; and redesign them to become customer centric. In the recent years there have been increased role of IT in changing the business strategies and cutting operating costs. Increasingly it is revolutionizing the approach of companies towards their customers. IT is being adopted to redefine the customer service parameters and retaining customers. The ultimate objective of technology lies in its applicability in targeting right customers and catering efficiently to their needs.
In this perspective CRM cannot be treated merely as a technology; it also has implications in the strategy formulation for companies. The focus of the paper is to study the impact of CRM as a process which is enhancing the efficiency of the Indian financial sector. With huge amounts of money being invested in IT solutions to upgrade processes, CRM has acquired functional as well as strategic implications. No software can promise to improve the capability of the organization’s processes unless the strategic and tactical decisions are in the right place.
The paper first studies the implications of CRM as a process and then makes an attempt to study how applied in the financial sector it has improved the performance of organizations. The implications of adopting a relationship management approach is immense, as it enables organizations in developing not only better understanding of the customer but also helps it in streamlining its activities. The paper can be divided into the following heads:
• Relationship Marketing creating customer loyalty • CRM as a process management issue. • CRM driving Indian Financial sector. • Challenges for the future
Relationship Marketing in Creating Customer Loyalty It is not only technology that has strategically changed the organizations but also the growing realization that battles have to be fought over efficient service delivery alternatives. Relationship management not only looks on building relationships with customers but also with suppliers and partners. The redesigning of processes in the organizations is being done on the forethought that product delivery can only be improved if organizations are able to change their

1299
value chains according to market needs. The dynamic nature of markets and ever evolving technology perspectives are forcing companies to become flexible in their approach towards their customers. The traditional marketing strategies no longer provide any guarantee of success as the very nature of customer has changed. Access to information has opened new vistas of knowledge and their susceptibility to new products and services has increased manifold. Earlier it was not important to know the customer, or to really understand his mindset. These challenges are calling for adapting strategies that would unable companies to foster better relationships with the customers. Moving from the ‘product-centric approach’ to relationship marketing has meant finding the right techniques to reach to the customers. No advertising and personal selling budgets promise to give increased customer revenues as relationship marketing does. “Customers are lifeblood of any organization. Like many clichés, this one happens to be true. Without customers, a firm has no revenues, no profits, and therefore no market value” (Gupta & Lehmann, 2005; pp.2).
The customer is looking for value in all his transactions and is willing to pay for that value. In a way technology has brought the customer closer to the marketer. Knowledge about markets, segments and product usage can be easily available to the organizations. Many companies are thriving on this knowledge as it enables them in designing the right kind of marketing and promotional strategies to capture the attention of the customer. Even capturing the attention of the customer has become challenging as media proliferation has led to increase in competition. A better equipped customer with knowledge about various alternatives available in the market is difficult to convince. Companies have to be alert in their approach to understand his definition of ‘value’ and accordingly position themselves on quality, service, performance, and efficiency perspective. It becomes imperative to create value for him; a value that is able to bind him to the company and stop him from switching to another company’s product. Advertising and promotions can be instrumental in influencing the purchase decision the product has been launched in the market; but if the company has built a long term relationship with its customers; advertising and promotion can become more effective in delivering returns. Reducing costs, aggressive promotion and advertising necessarily did not bring revenues and loyal customers. The whole idea is to develop business models that would enhance the quality and improve interaction with their customers leading to greater satisfaction for him.
Companies in India are trying to build long lasting relationship with the customer by focusing more offerings that are relevant to consumer needs. The financial sector is also designing products/services are closely attuned to Indian aspirations. Relationship marketing has always existed in companies; the only change that has come is in its applicability to deliver results. It has always been understood that customer needs are important for companies in designing product and service offerings for the markets. Increased customer satisfaction would lead to increased customer loyalty. Customers are thus perceived as assets for companies and creating customer value essentially would lead to long term growth for the company. The companies unable to retain their customers are not likely to survive in the competitive environment. The thrust of strategy has shifted to maximizing customer value and involving customers in the companies’ value creating processes. In the manufacturing sector companies are creating greater information visibility so that the customer has better idea about the company from where he buys products. These interactive efforts are primarily designed to bring about greater participation between the company and its customers and create a sense of partnership.
Information technology has been instrumental in giving more power to the customers as now he not only demands greater information about the various products and services but also views himself as a change agent in the transaction process. In India the influx of new products has led to change in the expectations of the customers. Companies are no longer targeting to an uninformed confused customer, who was earlier dependent on the companies’ to cater to his needs; but to a customer who believes that selecting the best product is his prerogative. Relationship marketing looks not only towards building relationships but focuses also on managing and defining these relationships in the long term. It’s not only about having clarity about customer needs but also the capability to keep evolving the relationship so that the customer feels enriched by being served by the company.
In this perspective if sustaining relationships is important for companies; the management should develop systems that lead to building these relationships. The traditional organizational structures have to be redefined to cater efficiently to customer needs and also to make marketing cost effective. Confronted with the challenges of dynamically changing IT models and competition from foreign banks, Indian companies had to deploy technology

1300
to make their offerings more relevant. The paper focuses on the idea of building relationships by using CRM soft wares in defining strategies for Indian market. The paper tries to explore the globalization of Indian insurance sector by moving towards a more global IT strategy in targeting customers. “Enhancing customer value, delivering a higher level of service, and enriching the brand all play a critical role in a company’s ability to grow profitably and consistently outpace its competition” (Freeland, 2004 pp. 3) CRM as a Process Management Issue The role of organizational structure is to partition the organization into functional silos, so that each function independently enables the organization to attain the objectives. The primary goal is to enhance value creation process and bring about increased coordination across organizational hierarchy. More and more companies are moving towards a process approach as it has become imperative to relook at the organization’s traditional processes and identify their relevance and output towards customer satisfaction. This requires analyzing the relevance of the process from customer perspective, as it is ultimately the customer who is the prime beneficiary of the output.
There has been a growing emphasis on improving the productivity of the organization by focusing on aligning the processes of the organization to the organizational goals. In the 1980s-1990s the organizations were much taken up by the Reengineering philosophy propounded by Hammer (1990). Reengineering represents a move towards increased organization simplicity, and the rationale herein lies that organizations can be restructured along value delivery lines. Reengineering propagated a change in the philosophy of doing business. To improve performance cost reductions and service delivery standards had to be evaluated. Focus on quality and reducing inventory levels are one part of the effort. Hammer (1990) and Davenport (1993) laid stress on the idea of analyzing whether they were doing business in the right way. What may have been appropriate two to three decades earlier may not be viable in today’s business environment. “Stressing the comprehensive nature of business processes, BPR theorists urged companies to define all of their major processes and then focus on processes that offered the most return on improvement efforts” (Harmon, 2003; pp. 24)
The very genesis of transformation was corporate renewal; changing their way of doing business and discovering new capabilities. “In the mid 1980s, British Airways decided to differentiate itself by focusing on marketing and customer service. The employees had extensive training to change the way they performed their jobs” (Sethi & King, 2003; pp. 43). Competition has made organizations realize that to retain customers they must have the processes in place so that the customer is satisfied by his transaction. Transformation cannot be attained merely by deploying technology. To get substantial benefits from technology, the top management must develop right approach towards its important processes which add value to the company’s product or service.
“CRM appeared on the heels of big ticket Enterprise Resource Planning (ERP) initiatives as a big ticket item itself. But by the late 1990s, ERP was notable for problems that befit its size and its lack of identifiable ROI” (Greenberg, 2005; pp.6). The customer relationship management process provides the structure for how the relationship with the customer is developed and maintained. Management identifies key customers and customer groups to be targeted and then devises strategies to improve processes and remove non-valued added activities. At the heart of reengineering is to start thinking away from the traditional approach, look at the old assumptions of doing things and change it according to customer requirements. Reengineering has forced organizations to start looking at their processes according to the customer’s requirements. It is important to identify the core processes a company happens to be good at and then improve them, redefine their relationship with the output the company expects.
“The central concept in CRM is customer value creation. The aim is not to maximize the revenue from single transactions but rather to build a lasting relationship with the customer. The development of customer relationships demands a thorough familiarity with the process by which customers create value for themselves. When considering the entire process, the single transaction diminishes” (Storbacka & Lehtinen, 2001; pp.5).
The role of process management in customer relationship building cannot be underestimated. If we consider the ability of a particular process to deliver value and help the company in improving its performance; it would certainly have to relate ultimately to the customer. The whole endeavor of reengineering was to help

1301
companies perform in the markets. Cost is fast becoming less important for a customer as compared to quality and service. If the time taken by a company to process a customer’s order and delivery of the product is reduced, the satisfaction level of customer improves considerably. Most organizations were caught in the web of improving their productivity by cutting costs. Now the emphasis is on innovation and technology; in restructuring processes to keep pace with changes in technology.
The importance of CRM can be understood by realizing that if the value delivery processes are in place, there would be greater customer gratification. It means organizing important processes according to the customer; herein the company must identify the critical decision areas affecting its performance:
• Suitable and timely research or rather information flow would keep marketers well informed about the changing pattern of customer demographics. This would enable company to implement changes in its product and service offerings without any delay with accuracy. Earlier market research techniques that were employed by companies may not prove to be appropriate in implementing changes fast enough. Decreasing product lifecycles are forcing companies to be focused towards deciphering market trends.
• Information technology is being used in a big way to map the customer behavior patterns and their purchase preferences. What earlier had proved difficult for companies has become relatively easy; data can be continuously analyzed and used in marketing decisions. Technology has enabled companies to target the right customers with right kind of alternatives.
• Placing the order and tracking it across the various points in the supply chain has also become a reality for customers giving them greater accessibility to information. Building relationships with the customer increasingly means involving them in the value chain. Many automobile manufacturers like Ford and General Motors are having collaborative initiatives not only with their supply chain partners but also with their customers. Customers can actively participate in designing their vehicles and are also aware about the products’ delivery time status. Nike has launched an internet service which enables them to design their own shoes. Federal Express allows the customers to track their shipments through the company’s website. Blue Dart Express Limited has been exploring web-based solutions to extend the range of services available to its customers and integrate them into the core products it offers to customers. The basic tracking solution enables customers to track their shipments on-line. A mail-based solution allows the customers to make queries about the status of their shipments using e-mail. These kinds of endeavors lead to greater satisfaction for the customer.
• Whereas earlier reducing the inventory levels had been the prime concern area of reducing operating costs; process management enables organizations to reduce inventory and optimize the stock levels of the product by concentrating on their core competencies. Outsourcing the routine processes has led to reduction in cost across the value chain. Nortel Networks which specializes in manufacturing high performance Internet networks, in 1998 was facing a situation of high declining margins. It sold 15 of its manufacturing plants to its suppliers like Samnia, Solectron and SCI and thus could focus upon more technical core competency. It reduced its cost of manufacturing and enabled the company to keep a better track of changing manufacturing technologies. Purchasing products from the suppliers reduced costs as the company could take advantage of the bulk manufacturing capacities of its suppliers who also possessed the expertise. The company had only to coordinate across its various suppliers across the supply chain and was able to improve service levels by cutting down lead time.
• The value in the transaction is assessed by the company’s capability to handle customer requests and complaints on a timely basis. Cisco System has build world class customer service model using Internet as a facilitator. The customers have access to information and solutions to customers are customized according to individual customer needs. The system is called “Cisco Connection Online” and has an open forum which answers queries of customers on networking, it also has troubleshooting engine which guides the customer to get an answer to his specific problem by helping him through the instructor system. In the insurance sector in India, Life Insurance Company has introduced many customer driven IT initiatives. In HDFC India information technology forms the backbone and nervous system of the company. Through a host of IT initiatives all the customer support processes such as branch operations, ATM, telephone

1302
banking, Internet banking and mobile banking have been integrated in an online real time mode for customer convenience. The customer can make payments, purchase demand drafts and transfer funds without stepping into the bank. The challenge for the companies is to make the customer feel he is well looked after and all his concerns
regarding the product performance, installation and after sales support is taken care of. This requires possessing information regarding not only the different products but also the behavioral peculiarities of the customers. It also would require the sales force to have all the relevant information to provide to the customer regarding his/her product; therefore it would involve integrating the different functional processes of the organization to make information available for the company personnel dealing with the front end operations. CRM, as a process would deal with identifying the different aspects of business processes that are crucial for transferring value to the customer, making it possible to retrieve data easily regarding customers so as to take timely decisions. The use of CRM is relatively higher in the service sector as it offers direct contact points with the customers.
Applicability of CRM lies in being able to help marketing managers take decisions faster and enable them to manage campaigns more efficiently. Companies are able to categorize customers according to the revenues they generate and their loyalty for the company. CRM has always existed in organizations; they only change that has come is in its technological application and the facelift that it has received due to staggering amounts of money it involves. CRM cannot promise to deliver results till the organization is able to realign its processes according to the results it expects from the market. The data collection, analysis and processing can only be done if the objective behind relationship management is clearly comprehended and then translated into strategy for getting customers. CRM Driving Indian Financial Sector CRM adoption is in early stages of development in India, its applicability to translate results and revenues has still to be understood and adopted. Its usage is similar to the companies’ acceptability towards SCM. Most organizations have woken up to the realization that automation of processes does not merely mean implementing ERP modules to make business processes efficient. The benefits that can be attained by implementing CRM and SCM software are still unrealized. The awareness of benefits of CRM is still low outside certain industries. The financial services companies and telecommunication sector were the early adopters of the technology and still offer opportunities to CRM and SCM vendors. With increase in competition, companies are facing the pressure of creating processes that should enhance their productivity. Even though SCM has commonly found usage in automobile sector, FMCG and petroleum sectors; CRM would also find usage in hospitality, railways, retail and financial sector. These are some areas that have seen rapid growth in the past few years with liberalized policies of the government. However, the CRM has still not found usage in strategic segmenting and targeting decisions; its use remains limited to only operational purposes. “CRM is the infrastructure that enables the delineation of and increase in customer value, and the correct means by which to motivate valuable customers to remain loyal- indeed, to buy again” (Dyche, 2005; pp. 28).
With the change in the competitive scene by the entry of MNC players in sectors like telecom, banking and insurance, Indian enterprises had no option but to differentiate themselves and offer services to customers at par with the international standards. CRM can best give results if the enterprise changes its processes to make them compatible with the requirements of the software and the customer. CRM is a strategy rather than only being recognized as IT tool. So going for a CRM solution, the company must define the deliverables. In India even though CRM is considered as the most important challenge facing an enterprise, it is not as yet seen as the most urgent. Thus the focus remains tactical rather than strategic, leading to underutilization of the application. CRM involves collecting information regarding customers, collating and storing it and then finally using it for taking decisions.
The problem most organizations have to address is that they have been used to conducting marketing and business in a different setup. Information sharing had never been possible across various functional departments and the processes were created to meet the needs of a single user of department. Business processes have to be reorganized to span the whole organization so that are the information can be accessed by users at all points. The importance of information is supposed to lie in the idea that it should ideally remove the traditional silos and

1303
departmental distinctions and become an enterprise-wide phenomenon. Many companies are structured around product lines; and information needs are also organized around different product categories. Information is viewed by companies as fulfilling the requirements of different product categories separately. Marketing departments may possess their own aggregate databases, but they do not link into sales operations. The use of these databases remains restricted only to specific purpose; if this could be used for various marketing processes the results would be more cost efficient. Data is being maintained about the same customer at different points; so information becomes disintegrated when decision is supposed to be taken related to new product launches or customizing a service according to the specific requirements of the individuals. Probably centralizing the operation would make information readily available and accessible to not only the sales personnel but also service problems can be handled more efficiently without delay. IBM and Caterpillar have information systems that anticipate equipment failures and send alerts to the technicians in the field about the nature of the problem with the tools and parts required to fix it. Such kind centralized databases enable companies to manage the integral part of their marketing and production function. Linking data about customer’s past behavior and purchase patterns can make e targeting decisions more focused and effectively planned.
Most organizations are able to calculate the revenues generated by individual customers and also the cost of acquiring a customer. The importance given to customers has increased because companies are awakening to the notion that ultimately the business drivers are not cost-cutting production models but the philosophy to retain customers and provide them with improved quality and service.
As the role of CRM cannot be underestimated in marketing decisions ICICI Prudential and Life Insurance Company are adopting it to improve sales force automation. ICICI Prudential Life Insurance was earlier using GoldMines (a sales and marketing tool) and HEAT (an operational CRM solution) from FrontRange Solutions. It has taken the decision to invest in CM3 from Teradata which has enabled the company to increase its customer base exponentially. CRM has been used by the company to use effective event-based marketing and cross-selling its offerings (Jethwani, 2004). Many Insurance companies are still highly dependent on Business intelligence systems for data mining and analytical purposes. The initial investment of insurance sector is on operational CRM suite and then slowly they are integrating efforts towards data extraction and analysis for analytical CRM. In India the industry is still in the very early stages, so there is over-cautious approach towards use of CRM software as an application that coordinates across various branches.
Standard Chartered Bank was initially using a system called Online Transaction Processing (OLTP) which enabled the bank to manage its transaction applications. The system though reliable did not help the bank in fighting competition; the bank’s IT team looked into the bank’s requirements and felt that the bank needed a system that could analyze the data that was captured about customers through OLTP system. The bank with over 2.2 million retail customers and over 1.3 million credit card customers had to provide right information to right people in order to improve its operating efficiency. By implementing SAS Customizable CRM Solutions Standard Chartered could address to the needs of the changing banking scenario in the country (Das Gupta, 2003). This software helped Standard Chartered to provide customized solution to the customers and optimize the concept of customer lifetime value (CLV). The bank has also launched aXcess plus savings account for its customers. The customers can access cash at over 1800 ATMs worldwide through Visa card and also they can use the account for shopping at about 10 million outlets in the country. By providing value to their customers, Standard Chartered is not only able to increase customer loyalty but also maximize the shareholder value.
Increasingly in India banks are adopting core banking solutions, which enables to provide complete front and backend automation of banks and also lowers service costs. This helps the bank to provide 24 hours service to its customers making it possible to improve customer service levels. This was earlier not possible with the traditional banking setup. Information technology has become the business driver for the financial sector. No longer are banks focused only on meeting customer service requirements, cutting costs and managing competition; the thrust has now shifted towards developing solutions that would enable them to retain customers. The role of IT deployed in financial sector has shifted towards providing these benefits to the banks. Federal Bank, Bank of Baroda and UTI have all aligned their processes using technology to make customer interface and interaction efficient. The improved Internet connectivity and falling costs of leased lines and VSATs are major forces driving the change. Earlier banks had decentralized technology infrastructures; each branch having its own server and databases. This

1304
led to problems not only involving costs but also coordination. There were issues regarding updating and using the information across all the branches. Most of the banks realized that they hardly knew their customers and how the customer needs have undergone a change. CRM enabled the banks to relate to the specific requirements of the customer. Most of the banks in India are using operational CRM that provides customer support through information accessibility to the customer using phone line or e-mail. Operational CRM alerts the call center personnel about the details the customer requires about his bank account. Analytical CRM enables to analyze the information by understanding the nature of the account and transaction. In here tools such as data warehousing and data mining are prominently used. By using Analytical CRM the bank can offer the customer lower service rates thus enhancing his service encounter experiences. Other advantages that may be reaped are cross-selling and up-selling to the customers’ certain services. Data warehouse provides the bank with a single view of all the disparate data that may spread across the bank’s systems. Data mining helps to make meaning of the data and use it for positioning and targeting decisions.
Aviva was one the last entrants in the insurance sector in India in 2002. It had to clearly focus its strategy to know its customers and bring out products that were specific to their needs, or else there would very little chance of survival. Aviva therefore went for a complete enterprise wide launch of e-CRM before it started its operations. The CRM suite was deployed in marketing, sales and services and also to integrate the various partners of the organizations (BFSI, 2004). The CRM has enabled the organization to have real time information about their customers, track customer details and handle queries appropriately and further it has enabled quick analysis of the data and marketing initiatives taken by the company. Aviva can keep a track on the viability of its marketing campaigns and can monitor them at every stage. Based on the responses generated the customer service can be efficiently handled. The integration of marketing, customer service and backend processes have clearly enabled Aviva to provide superior service across varied channels. With timely help from CRM software insurance companies like Aviva can sell multiple insurance policies and pension plans to right customers.
“According to a report from Indian Infoline (2004), India has the highest number of life insurance policies in force in the world. The industry is pegged at Rs 400 billion in India. LIC dominated the Indian market largely with the help of its huge sales force” (Pasha, 2004). But as competition has increased and new companies are entering the market, LIC has upgraded its system to improve customer service levels by going for IT deployment. The LIC customer can check his account details through Internet banking and does not have to visit the bank. The upgraded WAN has streamlined processes, making it easier for customers and LIC personnel to have more visibility about policies (The Hindu Business Line, 2002). The LIC staff can efficiently handle grievances and queries of the customers. Transactions can be dealt through internet thus reducing not only operating costs but also improving the service standards
Insurers have added a plethora of products to lure the customers. Increased competition has led to insurance companies joining hands with banks to sell to customers. Such kinds of channel partnerships are designed to increase the coverage area and target all kinds of customers. In this CRM is helping insurance providers to have details about the banks valued and high net worth customers (Mishra, 2006). There has been an increased growth of different companies diversifying into insurance. Tata AIG‘s alliance with HSBC, Birla Sun Life’s with Citibank and IDBI and LIC ally with Corporation Bank, while Kotak Life Insurance has an arrangement with Kotak Bank. Challenges for the Future The central concept behind CRM is creating value for the customer. Most companies have realized that to stay in business it is not imperative to maximize revenue from single transaction but to build a lasting sustainable relationship with the customer. The development of customer relationships demands a thorough understanding about the customer and also with the process by which customers create value for themselves. While considering the entire process, the significance of single transaction focus diminishes. The new competitive advantage for organizations is based on the ability of the service provider to help customers create value for them. Involving customers in the transaction can lead to increased satisfaction levels in the service encounter.

1305
In the domain of services where the intangible element makes it difficult to differentiate across the service providers; CRM finds varied applications. In a country like India, where majority of customers are not fully aware about the desirable insurance and banking service levels; CRM can increase the service delivery and satisfaction levels (Trivedi, 2004) . One major problem that banks and insurance providers are facing is that CRM is just being viewed as a facilitating technology rather than being understood as a strategy that would enhance the productivity of the bank. This is the prime reason why CRM has still met with limited success even being around for about 5-6 years. It can also be instrumental in helping banks to exploit into new service options for customers. Also the results that CRM gets for the bank should be measurable; for this metrics have to be well in place before deploying CRM. So any improvement can be evaluated and quantified to analyze the utility of CRM. Other issues related to the implementation are change management, training the personnel regarding the enhanced service dimensions and IT usage. The older legacy systems of the banks also pose a challenge in the deployment of the CRM suite; it requires moving from the poor information systems towards a more customer-centric technology that makes capture and analysis of data easier.
If the front line personnel of the organization are not competent to handle the new technology, CRM initiatives fail. Also as CRM software is expensive, the top management is skeptical towards its results and applicability. It involves having a clear policy about what would be attained by integrating the business. Until the strategic approach is clearly defined and performance parameters laid down; CRM cannot translate results for the company. From the organizations point it would essentially require letting go of old approach of doing business and would mean integrating the data from various touch points into a single database.
Most of the banks are still in the Operational CRM stage (Network Magazine, 2003); to reap the benefit they need to utilize the data for planning marketing strategies. The organizations that have been able to identify the benefit IT can give to the operations will stand to gain. For this it is imperative to move away from the traditional approach of conducting business, maintaining information about the customers and suppliers. The Indian financial sector has a long way to go to come to the level of international standards.
References
[1] BFSI (2004). “Aviva uses CRM to insure success”. Express Computer - India’s number 1 IT business
weekly (Oct 11). Retrieved December 6th 2006 from http://www.expresscomputeronline.com/20041011/casestudies01.shtml.
[2] Das, Gupta Soutiman (2003). “Case Study: Standard Chartered CRM: Banking on customer relations”. Network Magazine India (February). Retrieved December 6th 2006 from http://www.networkmagazineindia.com/200302/case1.shtml.
[3] Davenport, T.H. (1993). Process Innovation, Harvard Business School Press, Boston, MA. [4] Dyche, Jill (2005). “The CRM Handbook- a business guide to customer relationship management” pp 28.
Pearson Education, New Delhi India. [5] Freeland, John G (2004). “The Ultimate CRM handbook” pp 3. Tata McGraw Hill, New Delhi India. [6] Gupta, Sunil & Lehmann, Donald R. (2005). “Managing Customers as investments- the strategic value of
customers in the long run” pp 2. Wharton School Publishing, Pearson Education, India. [7] Greenberg, Paul (2005). “CRM- at the speed of light” pp 6. Tata McGraw Hill, New Delhi India. [8] Hammer, M. (1990). "Reengineering Work: Don't Automate, Obliterate," Harvard Business Review (Jul-
Aug), pp. 104-112. [9] Harmon, Paul (2003). “Business Process Change - A Manger’s guide to improving, redesigning, and
automating processes” pp 24. Morgan Kaufmann Publications. [10] Jethwani, Hinesh (2004). “Prudential ICICI Powers CRM Drive With Talisma”. CXOtoday.com (June 14).
Retrieved July 15th 2006 from http://www.cxotoday.com/cxo/jsp/article.jsp?article_id=1054. [11] Mishra, Ashwani (2006). “Cabling the Connect in Insurance Business” Network Computing- Solutions for
connected enterprise; Jasubhai Digital Media (April 01). Retrieved August 18th 2006 from http://www.nc-india.com/casestudies/stories/63627.html.

1306
[12] Network Magazine (2003). “Enterprise Wide Applications- Greasing the Business Mechanism”. Network Magazine India (June). Retrieved September 14th 2006 from http://www.networkmagazineindia.com/200306/is08.shtml.
[13] Pasha, Akhtar (2004). “Insurance sector to drive Indian CRM market” Express Computer- India’s number 1 IT business weekly (February 16). Retrieved September 21st 2006 from http://www.expresscomputeronline.com/20040216/indiatrends02.shtml.
[14] The Hindu Business Line (2002). “Customer relations get face-lift at LIC”. The Hindu Business Line- online edition (January 12). Retrieved December 24th 2006 from http://www.thehindubusinessline.com/2002/01/12/stories/2002011202320900.htm.
[15] Trivedi, Gunjan (2004). “Bang on Time, Right on Target”. Network Computing- Solutions for connected enterprise; Jasubhai Digital Media (January 1). Retrieved September 21st 2006 from http://www.nc-india.com/casestudies/stories/48202.html.
[16] Sethi, Vikram & King, William R. (2003), “Organizational Transformation through Business Process Reengineering” pp 43. Pearson Education (Singapore).
[17] Storbacka, Kaj & Lehtinen, Jarmo R. (2001). “Customer Relationship Management- creating competitive advantage through win-win relationship strategies” pp 5. McGraw Hill, Singapore.

1307
Consumers’ Response to Cause-Related Marketing in Malaysia
Marhana M. Anuar, [email protected] University Malaysia Terengganu (UMT), Malaysia
Osman Mohamad, [email protected] University Sains Malaysia (USM), Malaysia
Abstract
With the globalization of market, companies face greater competition than ever before. Cause-related marketing (CRM) has increasingly becoming an important strategic tool that provides competitive advantage for companies all over the world. Consumers tend to have favorable attitudes toward businesses that support charities or causes. In Malaysia, some companies have employed this marketing strategy in order to support good causes, increase profits and enhance companies’ reputation. A number of charities have been benefited through their alliances with companies in conducting CRM campaigns. However, very little is known about how consumers’ response to CRM. This study examines: 1) consumers’ attitudes toward both sponsoring company and charity or cause supported and 2) the effect of CRM on purchase intentions. Results of the survey indicated that consumers have favorable attitudes toward both the sponsoring company and charity supported. In addition, CRM also influenced consumers’ purchase intentions. Keywords: cause-related marketing (CRM), Malaysia, consumers’ response, attitudes, company, charity Introduction
Cause-related marketing (CRM) has become a catchphrase among practitioners as well as academics. For over 20 years since American Express coined the term ‘cause-related marketing’ in 1983, the number of companies that conducted CRM programs has increased dramatically year by year. This is evidenced by the phenomenal growth of CRM’s expenditures year by year. The CRM expenditures has increased drastically from virtually zero in 1983 to approximately USD 991 million in 2004 (Berglind and Nakata, 2005). Meanwhile, CRM donations has also increased rapidly from USD 630 million in 2000 to USD 828 million in 2002, representing annual growth rate of 14% (Berglind and Nakata, 2005). On the other hand, academics interest on CRM is believed to stem from the seminal work by Varadarajan and Menon (1988) on CRM. Since then, research on CRM has gained its momentum. The essence of CRM is that it links purchases of products and services with donation to a cause or charity. CRM campaigns try to persuade consumers to buy a certain products or services to a specific cause by promising to donate something in return to a designated cause. Research indicates that CRM is a good way to raise funds for charity and increasing public awareness of good causes while at the same time benefiting sponsoring company by enhancing its image, increasing its product sales and thwarting negative publicity.
In today’s business environment, as it becomes more and more difficult for companies to obtain market share, differentiation and maintain competitive advantage, effective and strategic CRM would become a viable marketing strategy that offer solutions and gives competitive advantage for companies in the long-run. Few authors suggest that community investment can be considered as a source for gaining competitive advantage (Adkins, 1999; Varadarajan and Menon, 1988). Varadarajan and Menon (1988, p. 60) predicted that corporate philanthropy, in the form of CRM, can enhance a firm’s ‘corporate image, cultivate a favorable attitude in the minds of consumers, and or/realize incremental sales gains’. Furthermore, consumers have also increasingly pressurizing companies to become socially responsible. Hence, marketing programs with social dimensions are of managers’ interests as they respond to higher consumer expectations of corporate social responsibility (CSR). Past literatures indicate that CRM has gaining its popularity to other countries outside the US, such as the UK, Spain and New Zealand. A survey conducted in 1998 demonstrated that 70% of CEOs and marketing directors interviewed in the UK predicted continued growth in their CRM practices (Ellen, Mohr and Webb, 2000). In Spain, half of Spanish companies view their relationship with the community as a valuable part of their strategy (Valor, 2005). In New Zealand, a handful

1308
of New Zealand’s causes have been benefited from CRM campaigns conducted. Additionally, consumers in New Zealand expressed favorable attitudes to this type of marketing strategy (Chaney and Dolli, 2001).
Similarly in other part of the world such as in developing countries like Malaysia, CRM has also becoming an important marketing strategy that brings plethora of benefits to both sponsoring company and a cause or charity supported. According to The Liaison Combination (TLC), a private company specializing in connecting business and society, approximately RM2 million was spent for corporate social responsibilities (CSR) activities in Malaysia that involved 110 local and foreign companies (http://www.liaison-combination.com). In Malaysia as illustrated by the following CRM campaigns (refer Table 1), a number of charities as well as sponsoring companies have been benefited from their CRM programs endeavors. As shown in Table 1; companies support a multitude of worthwhile causes ranging from medical, children protection to violence prevention.
As CRM is a good way of giving something back to the community and as it is increasingly gaining its popularity in Malaysia it is high time to conduct this research in Malaysia. Furthermore, if this new type of philanthropy is going to move successfully in Malaysia, marketers will need to better understand how consumers response to this campaigns. Additionally, very little is known about how Malaysian consumers respond to CRM campaigns. The objectives of this study are two folds: 1) to examine consumers’ attitude toward both sponsoring company and charity or cause supported and 2) to examine the effect of CRM on consumers’ purchase intentions.

1309
TABLE 1: CRM CAMPAIGNS ENDEAVORS IN MALAYSIA Sponsoring Company
Cause Supported Details
Guardian Pharmacy
Majlis Kanser Nasional (MAKNA)
Guardian’s ‘Bringing wellness to the lives we touch’ campaign has been successful in raising funds for MAKNA. A total of RM200,000 had been raised from the campaign and had been donated to the charity supported. In the campaign, Guardian offered a 20 % saving card to customers, this savings card allowed customers to purchase products from any 22 participating brands at 20 % discounts. Throughout the campaign, for every usage of the saving card over the participating brands, a total of RM2.00 is contributed to MAKNA (http://www.guardian.com.my).
Watsons Pharmacy
All Women Action Society (AWAM)
Watsons conducted ‘Stop Violence Against Women’ campaign with the objectives of raising funds for the charity as well as to prevent violence against women. Watsons contributed to AWAM funds from the proceeds of selling sweaters (http://www.watsons.com.my).
L’Oreal Malaysian AIDS Foundation’s Paediatric AIDS Fund.
L’Oreal Professionals conducted ‘Color for Life’ campaign. The objectives of this campaign are to raise funds for the Malaysian AIDS Foundation’s Paediatric AIDS Fund, to enhance people awareness about HIV/AIDS and to prevent prejudice on the disease. Throughout the campaign, for every hair coloring session done at participating salons in Malaysia, L’Oreal Professional will contribute RM2.00 to the charity supported. Additionally, the salon will also contribute RM1.00 for the charity (http://thestar.com.my)
Truly Loving Company (TLC)
Hospis Malaysia Rumah Aman Shelter Handicapped and Mentally Disabled Children Association
This company offers 15 households and personal care products carrying the TLC brands and “All Quality, All for Charity” label. The company will contribute all the profits to the four charities supported after deducting costs (http://www.nst.com.my).

1310
CRM and Related Theoretical Construct There are many theories across disciplines that describe individual philanthropy behavior, for instance prosocial behavior theory and motivation theory. Consumers may view a purchase of CRM products as a purchase decision with some form of prosocial behavior (Ross, Patterson and Stutts, 1992). Instead of buying a product or service, consumer could also contribute to a charity at the same time. Prosocial behavior is generally considered to “designate helping, sharing, and other seemingly intentional and voluntary positive behavior for which the motive is unspecified, unknown, or not altruistic”. Prosocial behavior is also defined as “behavior that is valued by the individual’s society” (Burnett and Wood, 1988). In all cases of prosocial behavior, an individual action is toward the improvement of other people that are less fortunate. People help others because they conform to norms that prescribe helping (Burnett and Woods, 1988). Helping behavior is defined as “voluntary acts performed with the intent to provide some benefit to another person, that may or may not require personal contact with the recipient, and may not involve anticipation of external rewards” (Burnett and Woods, 1988). In the context of CRM, people buy CRM products or services because they want to fulfill their altruistic needs.
According to motivation theory, individual philanthropy is based on two basic motivations: altruistic and egoistic motivations. Altruistic motivation is based on the motivation to improve the welfare of the less fortunate and on the other note the egoistic motive is to improve the individuals own welfare (Luo, 2005). Hence, people are motivated to participate in CRM based on either altruistic or egoistic motivations. Individuals with altruistic motivation take donation as an end in itself that is to help improving the welfare of the needy whereas individuals with an egoistic motives take donation as a means to an ends such as to gain recognition and reward from their actions. As such, according to this theory, people motivations to participate in philanthropy are based on intangible benefits and psychological outcomes such as recognition, sense of pride, praise and less personal grief. In summary, these two theories provide a theoretical foundation for understanding why people exhibit prosocial and helping behaviors and why they are willing to help worthy causes by purchasing CRM products. Consumer Response toward Cause-Related Marketing Commercial research found out that in general consumers have favorable attitudes toward CRM. In a nationwide survey conducted by Cone Communications and Roper Starch Worldwide, social responsibility is a key factor in hiring and keeping good employees. The survey indicates that 78% of consumers reported that given price and quality are equal, they would choose to buy products linked with a cause they care about; 54% would willing to pay higher price for a product; 66% would switch brands in order to support a cause; 62% would switch retailers and 84% said that CRM helps create a positive company image (Gupta and Pirsch, 2006; Pringle and Thompson, 2001; Cone Roper 2000). Studies show that many consumers believe that after price and quality, social responsibility is the next most important business factor in deciding whether or not to buy a brand (Cone Roper, 2000).
Besides commercial research, academics research on CRM has also gaining momentum since the seminal piece of work by Varadarajan and Menon (1988). An extensive body of research has emerged investigating how consumers respond to CRM campaigns. Past consumer research examined the effects of CRM on a variety of factors such as attitudes toward the sponsoring company, attitudes toward charity and purchase intentions. Ross et al. (1992) study found that most of the respondents in their study felt that CRM was a good way to raise money for social causes and it also led to favorable attitude toward both the sponsoring company and the charity supported. Study on consumers’ attitudes toward CRM had been conducted by Barnes (1992), 90% of the respondents agreed that CRM were a good way for consumers to contribute to charities. Eighty-eight percent of the respondents in her study indicated that in order to buy products linked to charity; they need to be familiar with the quality of products involved in the CRM campaigns. She also found that females and younger consumers were more receptive to CRM compared to male and older consumers. The effect of CRM on consumers purchase intentions was studied by Cui, Trent, Sullivan and Matiru (2003). The results of their study showed that the structural elements of CRM offer did influenced consumers’ evaluation of CRM offers. Consumers with more positive evaluations of the CRM offer have been shown to have greater purchase intentions and vice-versa. Barone, Miyazaki and Taylor (2000) studied the

1311
effect of CRM on consumers’ brand choice. Barone et. al., (2000) concluded that consumers were more likely to choose brand associated with CRM if they did not have to make a trade-offs either in price or in quality. The effect of CRM on purchase decision had also been studied (Webb and Mohr, 1998). In their study, Webb and Mohr (1998) found that most of the respondents have favorable attitudes toward CRM but CRM had little influence on consumers’ purchase decision. Past research indicated that CRM has potential in influencing consumers’ purchase behavior (Cui et al., 2003; Barone et al., 2000; Webb and Mohr, 1998). Most of the past studies on CRM mainly focus on the effect of CRM on consumers’ attitudes (Ross et al.,1992; Barnes, 1992) and short-term measure such as purchase (Cui et al., 2003; Barone et al., 2000; Webb and Mohr, 1998). On the contrary, the more current studies on CRM have focused on the effect of CRM on a long-term measure that is consumers’ brand loyalty. Brink, Schroder and Pauwels (2006) studied the effect on CRM campaigns on consumers’ brand loyalty. They examined the effect of tactical and strategic CRM on consumers’ brand loyalty. The results of their study showed that customers’ brand loyalty can be enhanced by strategic CRM that is linked to low involvement product.
Another stream of research in CRM focuses on moderating variables that affect to what extend CRM campaigns influence the factors mentioned earlier. The moderating effects of the type of products being linked to CRM campaign has been examined by Subrahmanyan (2004) and Strahilevitz and Myers (1998). Strahilevitz and Myers (1998) found that CRM is more effective when associated with frivolous products. They suggested that CRM may offset the feeling of guilt experienced when purchasing luxury items. On the contrary, Subrahmanyan (2004) found that consumers prefer CRM that is linked with practical products. CRM that is linked to practical products enable consumers to donate more frequently. Ross et al., (1992) study the moderating effect of gender and proximity. They found that female were more favorable toward CRM than men and meanwhile the moderating effect of proximity was not significant in their study although they predicted that customer would more likely to support CRM linked to local cause rather then national cause. The effect of congruency or perceive link between the cause and the company was examined by Pracejus and Olsen (2004). The results of their study indicate that high-fit CRM programs can result in five to ten times greater than low-fit CRM campaigns. Ellen et al., (2000) study the moderating effect of donation situation, in their study they found that consumers’ evaluations were more positive for CRM campaigns that support disaster as compared to ongoing causes (Ellen et al., 2000). The moderating role of product involvement was studied by Brink et al., (2006). The results of their study indicate that strategic CRM that is link to low involvement products enhance brand loyalty whereas CRM campaigns that is linked to high involvements products do not impact customer brand loyalty (Brink et al., 2006). Barone et al., (2000) found that CRM effect on brand choice was moderated by perceived firms’ motivation underlying the CRM program.
In general, CRM results in favorable consumers’ attitudes toward the sponsoring company, the charity supported and the products involved as well as purchase intentions and brand loyalty (Brink et al., 2006; Cui et al., 2003; Ellen et al., 2000; Barnes, 1992; Ross et al., 1992). However, CRM has also been identified to run a risk of consumers’ backlash (Osterhus, 1997). Moreover, Varadarajan and Menon (1988) warned that companies may incur negative publicity and charges of cause exploitation if consumers perceive the companies underlying motive as self-interested rather than altruistic motives. Research Method Sample This study used convenience sample. The sample of this study came from two undergraduate classes at the University of Malaysia Terengganu (UMT). Questionnaires were distributed to two undergraduate classes ten to 15 minutes before the end of classes. A total of 63 students took part in the study. Of the 63 questionnaires distributed, 61 questionnaires were used for analysis as questionnaires that were partially completed or uniformly answered were eliminated from being analyzed in the current study. The Survey The survey consisted of four sections: (1) Definition of CRM and a CRM campaign advertisement, (2) statements measuring attitude toward the sponsoring retailer and the charity or cause supported, (3) respondents past experience with CRM. (4) statements measuring impact of CRM on customers purchase intentions and (5) demographic data of respondents. At the beginning of the survey, the respondents were asked to read the definition of CRM and view

1312
CRM campaign advertisement in which a retailer promises to donate a portion to the charitable organization. See Appendix A for the copy of the stimulus material. A non-existing company and charity were used in the ad in order to eliminate any associations with the consumers past experiences with both the sponsoring company and the charitable organization. After viewing the ad, the respondents’ were asked about their attitudes toward the sponsoring retailer and the charitable organization. The questionnaires were adapted from the Ross et al. (1992) study with the addition of purchase intention questions. All items on attitudes measurements employed five-point likert scales (5=Strongly Agree, 4=Agree, 3=Neither Agree nor Disagree, 2=Disagree, 1=Strongly Disagree). Three statements were used to measure respondents’ attitude toward the sponsoring retailer: (1) The ad makes me more willing to purchase products from the retailer. (2) The retailer is more interested in supporting rather than exploiting the charity or cause. (3) The retailer is acting in a socially responsible manner. Next, the respondents’ attitudes toward the cause were measured. Specifically, statements used to measure respondents attitudes toward the cause were: (1) Cause-related marketing (CRM) is a good way to raise money for this cause. (2) After reading the ad, I am more willing to support this cause in a more traditional manner (for example, donating cash or time toward the cause). (3) The directors of this cause are acting responsibly by using cause-related marketing to raise funds. Respondents were then questioned about their past experience with CRM. This part employs yes and no answer specifically 1=Yes and 2=No. The questions used were: (1) I have supported CRM before. (2) I am aware of CRM but not supporting it. (3) I have never heard of CRM. Respondents were also asked about the effect of CRM on their purchase intentions. Four statements were used to measure their purchase intentions: (1) I am more likely to purchase products that support charity or cause. (2) I am more likely to purchase products from a CRM campaign if familiar with quality of the products. (3) I am more likely to purchase products from a CRM campaign if favorite brands. (4) I am more likely to purchase products from a CRM campaign if familiar with charity supported.
All the items used to measure purchase intentions also employ five-point likert scale similar to the attitudes measurements stated earlier. The final section of the questionnaire was questions that collected demographic data of respondents: major, gender, and race. Results Characteristics of Respondents Characteristics of respondents are shown in Table 2. Majority of the respondents (73.8%) were marketing students whereas 26.2 % were students majoring in accounting. Eighty-two percent of the respondents were female and only 18% were male. Most of the respondents were Malay (85.2%), followed by Chinese (6.6%) and Indian (3.3%).
TABLE 2: CHARACTERISTICS OF RESPONDENTS (N=61) Frequency
n Percentage %
Major: Marketing Accounting Gender: Male Female Race: Malay Chinese Indian Other
45 16 11 50 52 4 3 2
73.8 26.2 18.0 82.0 85.2 6.6 4.9 3.3

1313
Respondents Past Experience with CRM Table 3 depicts that the majority of respondents (60.7%) have had past experience with CRM. Approximately 16% of the respondent indicated that they were aware of CRM but not supporting it. 22.9% percent stated that they have never heard of CRM before. Overall, 77.1% of the respondents were aware of CRM. Hence, the majority of the respondents were aware of CRM whereas 22.9% of the respondents were unaware of CRM.
TABLE 3: RESPONDENTS’ PAST EXPERIENCE WITH CRM Previous Experience with CRM Frequenc
y n
Percentage %
I have supported CRM before. I am aware of CRM but not supporting it. I have never heard of CRM.
37 10 14
60.7% 16.4% 22.9%
Total 61 100.0% Attitudes toward the Retailer and the Charity Supported Results on consumers’ attitudes toward the retailer that uses CRM and the cause are represented in Table 4. Approximately 60% of the respondents agreed that the ad made them more willing to buy products from the sponsoring retailer. More than half (57.4%) indicated that the retailer was more interested in supporting rather than exploiting the cause. The majority of the respondents (67.2%) were also agreed that the retailer is acting in a responsible manner. When questioned whether CRM is a good way to raise money for the cause, 61% of the respondents indicated that CRM is a good way to raise money for the cause. Sixty-one percent of the respondents also indicated that they were more willing to support the cause (HIV/AIDS Foundations) in a more traditional manner (i.e. to support a cause by contributing time or money). Less than half (44.3%) of the respondents agreed that the board of directors of this cause was acting responsibly by using CRM to raise funds for the charity.

1314
TABLE 4: ATTITUDES TOWARD THE SPONSORING RETAILER AND THE CHARITY Attitudinal statements Strongly
Agree Agree Neither
Agree Nor Disagree
Disagree Strongly Disagree
The ad makes me more willing to purchase products from the retailer. The retailer is more interested in supporting than exploiting the cause.
The retailer is acting in a socially responsible manner.
Cause-related marketing (CRM) is a good way to raise money for this cause.
After reading this ad, I am more willing to support the cause in a more traditional manner (for example, by donating your time or money for the cause).
The board of directors of this cause is acting responsibly by using CRM.
6 (9.8%) 5 (8.2%) 6 (9.8%) 4 (6.6%) 4 (6.6%) 5 (8.2%)
30 (49.2%) 30 (49.2%) 35 (57.4%) 33 (54.1%) 33 (54.1%) 22 (36.1%)
22 (36.1%) 18 (29.5) 13 (21.3%) 15 (24.6%) 17 (27.9%) 25 (41.0%)
3 (4.9%) 7 (11.5%) 7 (11.5%) 9 (14.8%) 7 (11.5%) 9 (14.8)
0 (0%) 1 (1.6%) 0 (0%) 0 (0%) 0 (0%) 0 (0%)
*1=Strongly Disagree 2=Disagree 3=Neither Agree nor Disagree 4=Agree 5=Strongly Agree
Impact of CRM on Purchase Intention Past literature indicates that one of the benefits of CRM is its potential to influence consumers purchase behavior. In this study, respondents were asked whether CRM influences their purchase intentions. Results presented in Table 5 indicated that 54% of the respondents in this study were more likely to purchase products from CRM campaigns. The majority of respondents (67.3%) agreed that in order to buy CRM products they need to be familiar with quality of the products involved. Additionally, 62.3% of the respondents also agreed that familiarity with charity supported and brands involved also influence their purchase intentions.

1315
TABLE 5: IMPACT OF CRM ON PURCHASE INTENTION Questions about purchase intentions
Strongly Agree
Agree Neither Agree Nor Disagree
Disagree Strongly Disagree
I am more likely to purchase products that support charity or cause. I am more likely to purchase products from a CRM campaign if familiar with the quality of the products. I am more likely to purchase products from a CRM campaign if favorite brands. I am more likely to purchase products from a CRM campaign if familiar with charity supported.
2 (3.3%) 9 (14.8%) 11 (18.0%) 5 (8.2%)
31 (50.8%) 32 (52.5%) 27 (44.3%) 33 (54.1%)
16 (26.2%) 14 (23.0%) 16 (26.2%) 14 (23.0%)
10 (16.4%) 6 (9.8%) 7 (11.5%) 9 (14.8%)
2 (3.3%) 0 (0%) 0 (0%) 0 (0%)
*1=Strongly Disagree 2=Disagree 3=Neither Agree nor Disagree 4=Agree 5=Strongly Agree
Discussion and Conclusions Prosocial and motivation theories describe individual philanthropy behavior. These theories explain why people involved in charitable giving. People help others by giving donation as they conform to norms that prescribe helping. Their underlying motives to donate are based on either altruistic or egoistic motives. According to motivation theory corporate philanthropy and CRM can also be based on two basic motivations: altruistic and egoistic motivations. Corporate philanthropy and CRM are conceived not only to benefits charitable causes, but also to improve a company’s profits, image and performance and in the long run provide a source for competitive advantage.
This study is conducted in Malaysia where to the knowledge of the authors the term CRM is still new to Malaysian consumers. Although it has gaining popularity among companies in Malaysia as evident by the examples of CRM endeavors conducted by several companies as shown in Table 1, however it is believed that some consumers are unaware of the term. Nevertheless, this study is conducted on undergraduate business students that are normally familiar with most of business and marketing terms. This study offers insight about how Malaysian responds to CRM. Generally, most of the respondents views CRM favorably. They have favorable attitudes toward both the sponsoring and the cause supported. As indicated by the results shown in Table 4. This is in line with past studies conducted in the western countries, past studies also shown that most of the respondents have favorable attitudes toward CRM, sponsoring company and charity supported (Cui et al., 2003; Barnes, 1992; Ross et al.,1992). Majority of the respondents in the current study also agreed that CRM is a good way to support charity. Sixty percent of the respondents indicated that CRM is a good way to raise funds for the cause supported in this study. Another important finding of the study is that the majority of the respondents also agreed that they were more

1316
willing to support the cause in a more traditional manner. The results proved that CRM does not affect the traditional way of donation giving. Even though, in CRM literature it is suggested that one of the advantages of CRM is its potential to impact the traditional philanthropy among consumers. The results found the contrary. Although, the findings of the study showed that most of the respondents have favorable attitudes toward CRM but less than half (44.3%) of the respondents agreed that the boards of directors of the cause is acting responsibly. One possible explanation for this is that some people are still skeptical about CRM. CRM is not like the traditional philanthropy whereby company contributes money or materials to specific cause. In CRM, donation is linked to product purchase. Hence, people might perceive the underlying motive of charity and company conducted CRM campaign is for their self-interested motive and not for altruistic motive.
CRM also influenced consumers’ purchase intentions. As shown in Table 5. Majority of the respondents agreed that they were more willing to buy products associated with cause. More than half of the respondents agreed that they were more likely to purchase products that support charity or cause. The respondents found it is important that CRM is linked to products that the quality is familiar to the consumers. The result showed that 67.3 % of the respondents agreed that in order for them to buy products from CRM campaigns, they must be familiar with the quality of the products. The majority of the respondents also indicated that CRM need to be linked to favorite brands and well-known charities.
The results of the current study differ from the study conducted by Kropp and Lavack (2003). Kropp and Lavack (2003) found that consumers’ attitudes toward CRM were less positive in countries where CRM was less established. They conducted a study on consumers’ attitudes toward CRM in four countries from four different continents: Canada (North America), Norway (Europe), Korea (Asia), and Australia. The results showed that respondents from Canada and Australia have more favorable attitudes toward CRM compared to respondents from Norway and Korea. Attitudes toward CRM were most favorable for Canadian and were least favorable for Korean. This is due to the fact that CRM is more advanced in the United States and Canada, followed by Australia, however, CRM received little attention in Norway and almost no attention in Korea (Lavack and Kropp, 2003). On the contrary, the current study found that even though CRM is relatively new in Malaysia, the majority of the respondents view CRM favorably. In addition, most of the respondents also have favorable attitudes toward both the sponsoring company and the charity supported. The rich tradition of giving and sharing among Malaysian contribute to the positive response toward CRM in Malaysia even though the term CRM is still relatively new to Malaysian. Charitable giving plays an important role in the society of Malaysia as is evident by the range of charities that depend on public donations both in terms of money and materials. In the event of natural disaster for example, Malaysians contribute generously. Malaysians contribute money, materials, time and voluntary services to relieve human sufferings from disasters causes such as Tsunami and flood both at the local and international level. In additions, Malaysians also contribute to ongoing causes such as preventing crime, AIDS and other diseases, and supporting education.
This study has important implications for marketers and charities. CRM campaigns are perceived favorably by the respondents in this study. Most of them have favorable attitude toward the sponsoring company as well as the cause supported. It can also be considered that CRM was not perceived as a substitute for the more traditional methods of fundraising since the majority of the respondents were still willing to support the cause involved in the more traditional manner. CRM may be a viable marketing strategy for both company and charity in realizing their businesses’ objectives in Malaysia. However, despite its popularity among companies, there were still a number of people that were skeptical and unaware of CRM. Therefore, companies would have to communicate to the public about their CRM endeavors. Additionally, companies need to communicate their CRM endeavors to consumers as well as demonstrate genuine support of the cause in order to reduce consumers’ skepticism level and to ensure the effectiveness of this strategy in the Malaysian market. Limitations The present study had several limitations: 1) small number of respondents reduces the ability to generalize the results to the larger populations, and 2) the use of students sample may not reflect the larger populations. Hence,

1317
results may be different if adult were use for the sample. Additionally, respondents were not asked to make an actual product purchase that would result in a direct contribution being made to HIV/AIDS Foundation. The association of CRM campaigns with other type of charities or causes such as violence and crime preventions, orphanage, and handicapped people may produce different results.
References [1] Adkins, S. (1999). Cause related marketing: Who cares wins. Burlington, MA: Elsevier. [2] Barnes, N.G. (1992). Determinants of consumer participation in cause-related marketing campaigns, American Business Review, June, 21-24. [3] Barone, M. J., Miyazaki, A. D. and Taylor, K. A. (2000). The influence of cause-related marketing on consumer choice: does one good turn deserve another?, Journal of the Academy of Marketing Science, 28, 248-262. [4] Berglind, M. and Nakata, C. (2005). Cause-related marketing: more buck than bang?, Business Horizons, 48, 443-453. [5] Brink, D.V.D, Schroder, G.O. and Pauwels, P. (2006). The effect of strategic and tactical CRM on consumers’ brand loyalty, Journal of Consumer Marketing, Vol. 23 No. 1, 15-25. [6] Burnett, J.J. and Wood, V.R. (1988). A proposed model of donation decision process, Research in Consumer Behavior, Greenwich, CT: JAI Press, 1-47. [7] Chaney, I. and Dolli, N. (2000). Cause related marketing in New Zealand, International Journal of Nonprofit and Voluntary Sector Marketing, Vol. 6 No. 2, 156-163. Contact authors for the list of references
Appendix Appendix A: Stimulus Ad Definition of Cause-related marketing (Varadarajan and Menon, 1988): Cause-related marketing is the process of formulating and implementing marketing activities that are characterized by an offer from the firm to contribute a specified amount to a designated cause when customers engage in revenue-providing exchanges that satisfy organizational and individual objectives.

1318
Stimulus Ads
There are about 40 million people worldwide living with HIV/AIDS.
You can help Bookstore A to support people with HIV/AIDS through your purchase of “Living with AIDS” range of books.
For every sale of “Living with AIDS’ range of books, Bookstore A
will donate to HIV/AIDS Fund.
“Buy books and help people with AIDS to live a better life”

1319
Differences in Online Buying Behaviour: Spain and Japan Compared
Sonia San Martín Gutiérrez, [email protected] Carlos Hernández Carrión, [email protected]
Universidad de Burgos, Spain Carmen Camarero Izquierdo, [email protected]
Universidad de Valladolid, Spain Lluís Valls Campà, [email protected] Kyoto University of Foreign Studies, Japan
Abstract Increased competitiveness in commercial distribution calls for a revision of the typical explanatory factors of consumers’ behaviour. One of the most significant changes has been the development of Communication and Information Technologies. Both enterprises and entrepreneurs are thus increasingly interested in adopting the resources provided by the CITs to improve their respective channels of product distribution. It is therefore relevant to analyze how loyalty within an online context is produced. Additionally, the context where consumers and markets interplay may also have a weight for understanding the patterns of online shopping (Burgmann et al., 2006; Tse et al., 1998). This study offers a comparative analysis of the two different contexts provided by the Spanish and Japanese cases. While both cases are developed economies, they may however display significant differences regarding perceived trust, motives and inhibitors for online buying and socio-demographic characteristics of online buyers in each country. The Context of Online Shopping in Spain and Japan Spain and Japan are currently two developed economies which are involved in deregulation and technological development processes. However, both countries present differences in many aspects, like consumers’ styles, distribution system, technological and Internet penetration, and usage of online shopping. Thus it is important to know if there are global groups of consumers or if nationally defined characteristics effects still remain strong in online buyers´ behaviour (Chai & Pavlou, 2004; Okada, 2006).
National differences could have some effects over the marketing decision-making process, especially in risky situations; on the other hand, such differences often disappear when two different cultures establish commercial contact (Tse et al., 1998).
Japan and Spain have a set of similarities and differences which could affect online buyers’ behaviour. In this situation, we wonder which are the drivers and impediments of buying online in each country and if there are differences according to buyer characteristics and perception of risk. The main contribution of this study is the comparison of two different countries –Spain and Japan- according to several buying variables: drivers and impediments, socio-demographic characteristics and perceived risk. In fact and following Van Herk et al. (2005), cross-cultural studies that contemplate the behaviour, attitude and reactions to marketing strategies in different countries and cultural countries are scarce. This situation is much more remarkable in the case of the comparison between Spain and Japan. Internet Usage and Technological Infrastructure in Japan and Spain In Spain and Japan internet has penetrated later than in other countries, being this delay larger in Spain. For example, in the year 2000 the proportion of population connected to internet in Japan was between 12.5% and 23%, while in Spain it was between 3.5% and 12.5%. In the same year, already more than 35% of the population in America, Australia and Scandinavia was connected to internet. However, in spite of the slowly introduction of internet in Japan, since the year 2000 this has been rising fast, reaching more than 35% of the Japanese population one year later, and approaching to the proportion of online users in the US (68.7%) in 2006 with 61% of its population online. In Spain, however, the penetration of internet has been more slowly, not reaching a proportion between 25% and 35% of its population until 2004, and just 38% in 2006 (Zooknic Internet Intelligence, 2004;

1320
AECEM-FECEMD, 2006; Internet World Stats, April 2006). In addition, if we consider the number of households connected to internet, the difference between Spain and Japan is also remarkable. In the year 2000, 34% of Japanese households were connected to internet, but it grew very fast reaching 81.4% in 2002, and later grew more slowly, reaching 87% of the households in 2005. Again, Spain shows a slower growth, being 17.4% of its households connected to internet in 2002, 25% in 2003, and just 41% in 2006 (INE, 2002, 2003, 2006; MIC, 2006).
Spain’s and Japan’s internet penetration also have some remarkable qualitative differences. Two main differences must be considered. The first one is the technology for internet connection. Japan shows a higher penetration of the most efficient connection type (broadband) than Spain, although in this last country recently broadband use has increased quite a lot. In 2002, Japanese and Spanish populations acceding to internet by broadband were 28.2% and 23.4% respectively, and they had increased to 52.2% and 44.7% in 2004. In the year 2005 the households connected to internet by broadband represented 65% in Japan and 59.3% in Spain. Thus, a larger proportion of Japanese population has been enjoying a better internet service than the Spanish population (INE, 2003, 2005, 2006; MIC, 2003, 2005).
The second qualitative difference is the spread of internet access from mobile phone in Japan. In 2005, the population using cellular phone to access internet was 81.2 % of the population using internet, while the population using PC was 77.4%, and the use of cellular phone for accessing internet is especially high among people under their 30s (MIC, 2006). Due to the Japanese lifestyle and the time spent in public transportation, many Japanese use their mobile communication devices (e.g. cellular phones, PDA, etc.) to connect to Internet. In addition, the Japanese can access internet from other devices, like ATM-like devices at convenience stores and from TV games at home. In contrast, Internet connections in Spain are mostly made through PC (Aoki, 2000; Pardo, 2004). Online Shopping, Delivery and Payment Systems in Japan and Spain Japanese also buy online more frequently than Spanish. 90% of Japanese internet users have online shopping experience, and almost 60% of them have made six or more purchases during 2004 (Center for Life Information, 2006). Only 17.5% of the total Spanish population has online shopping experience, and only 31.8% of Spanish population that used internet in the last 3 months (before the moment of INI’s survey in mid-2006) had purchased online in the last 12 months (INE, 2006). Although these data are not directly comparable to the Japanese data, we can presume a lower penetration of online shopping among Spanish population. The higher experience with internet and online shopping of the Japanese may be an important reason for having also a deeper involvement in online shopping. For example, individuals with longer internet experience, do online shopping more frequently, and spend more money, than individuals with less experience (Kashiwagi, 2004). Similarly, online shopping experience has a positive effect on online shopping activity: individuals with online shopping experience reported that their frequency of online shopping, the amount of money spend in online shopping, their degree of satisfaction with online shopping, and the search for product information online before purchasing, even when the purchase is at a store, has increased with their experience buying online (Center for Living Information, 2006).
Payment and delivery systems of online-purchased goods in Japan also differ from those in Spain. In Spain payment by credit card is extensively accepted by consumers and retailers, but it isn’t the case in Japan. In fact, in Japan the different alternatives for payment are larger, since it is possible pay with credit card, by cash on delivery, bank transfer, or even at a convenience store. As Aoki (2000) stats the most common method of online shopping payment used in Japan is cash payment upon the delivery/receipt of ordered goods. However, in Spain, credit card payment has a great acceptance among online buyers and the number of cases of fraud complaints over the last few years has been practically nil (Pardo, 2004). In Table 1 we can see the acceptance of those methods for pay online purchases.

1321
TABLE 1: ACCEPTANCE OF PAYMENT METHODS AMONG ONLINE SHOPPERS Source: Instituto Nacional de Estadística
(INE) (2006) Center for Life Information
(Seikatsu Jouhou Sentaa) (2006) METHOD OF PAYMENT SPAIN JAPAN
Credit card 70% 64,5% Bank transfer 32,6% 45,5%
Cash on delivery 20,4% 52,7% Conbini --- 39,9%
Regarding the delivery system, the role of convenience stores (“conbini”) is fundamental in Japan.
Convenience stores are placed close to the online buyer’s residence, train stations and work places, and provide consumers with many services, like delivery of online purchased products, cashing service, online shopping, etc. In a convenience store the online buyer is able to pick up and pay his online orders at any time of the day, every day of the year. Thus, convenience stores in Japan act as distribution points for other retailing companies which sell online, and make the online purchase much easier and safe for the buyer. Culture, Shopping Styles and Online Shopping The relationship between cultural factors and Internet usage has been broadly studied (Steenkamp et al., 1999; de Mooj, 2000; de Mooj, 2004; la Ferle et al., 2002; Yeniyurt & Towsend, 2003; Müller & Gelbrich, 2004). Most of the researches into this issue are based in some of the cultural dimensions developed by Hofstede (1980), Hofstede & Bond (1988). From these studies we can conclude that there is a negative correlation between cultures with high levels of “uncertainty avoidance” and Internet usage, and there is a positive correlation between “individualistic cultures” and Internet usage. In these dimensions, although there is not a radical difference between Japan and Spain, these countries show different characteristics: Japan’s culture promotes more uncertainty avoidance and less individualism than Spanish culture.
However, culture interacts with many other factors, and Hofstede’s dimensions are too general to analyze the perceptions that affect the real consumers´ behaviour in different countries. Thus, the social, economic, cultural contexts and the lifestyle determine the consumers´ behaviour, and each country’s distribution system reflects the consumers´ characteristics in order to satisfy their demands (Ishibuchi, 2003). Ishibuchi considers that consumers can be classified in different groups according to the different combinations of two dimensions. One dimension is rationality in the search of good price and quality versus behaving non-rationally, just following fashion. The other dimension is orientation to cooperation with other people versus individualistic orientation. According to Ishibuchi, the combination of these dimensions is the result of the life style and cultural and economic factors. The combination of those two dimensions determines the buying behaviour of consumers, who could search more or less information for making their decisions, be more or less influenced by publicity, look more or less intensively for cheap prices and/or good and reliable service, and so on. According to the results of Ishibuchi’s empirical research, the group oriented to price is dominant in the three countries he studied (US, Austria and Japan), however the proportion of individuals in each group is different among countries, and in the case of Japan there is a higher degree of heterogeneity than in the other countries.
Elaborating on Ishibuchi’s approach, we suggest that the characteristics of the Japanese distribution channel, like the large number of small stores selling fresh and cooked food, the large number of 24 hours open convenience stores providing with a great variety of products and services, the spread of the just-in-time provision system, the accurate treatment of the customer and so on, are an adaptation of the distribution system to the consumer’s shopping and lifestyle. Their lifestyle is characterized by little free time, limited space at home, frequent small quantities purchases, a great variety of goods available at any time, etc. And, when internet has been introduced in a society, we consider that consumers’ perceptions when shopping online are affected by their shopping style, which is the result of the consumers’ life style and other social and economic factors. Thus, consumers will prefer some shopping sites relative to others, and consequently distribution channels and production industries and their established standards would be related to those consumers´ preferences. To make clear how individuals perceive online shopping is the aim of our research. In addition to consider the effect of the technological development and environment, the delivery and payment systems, and the consumers´ online

1322
experience, which differs in Japan and Spain, we also consider the possibility of different buying styles in both of them. With our empirical research we will find out whether Japanese and Spanish consumers show heterogeneous perceptions about the key factors involved in online shopping process.
Key Variables in the Study: Drivers, Impediments, Perceived Risk and Socio-Demographic Characteristics in Online Shopping Drivers and Impediments to Online Shopping Internet has peculiar characteristics that differentiate it from other purchase means and areas. There are many studies that have dealt with the driving and inhibiting factors to initiate a B2C online relationship and have emphasized Internet’s benefits as a distribution channel and therefore are motivating (AECEM-FECEMD, 2006; Burke, 2002; Parsons, 2002; Rohm and Swaminathan, 2004; Ramus and Nielsen, 2005; Lin y Yu, 2006; Forsythe et al., 2006): among others, cost and time savings, a greater control on the service delivery, less waiting time, a greater level of customization, location convenience, efficiency and flexibility, ease of use, more convenience than other alternatives, lack of contact with salespeople, 24 hour availability, instant gratification as the information is available on the spot, and interactivity.
Nevertheless there are other factors which can mitigate or even eliminate the consumer’s willingness to purchase online (Anckar et al., 2002; AECEM-FECEMD, 2006; Ramus and Nielsen, 2005; Lin & Yu, 2006; Forsythe et al., 2006). As mentioned previously, in B2C relationships in an online context, there is information asymmetry in favour of the firm, which is the party that knows the true quality of its products. This fact is aggravated by consumer impossibility to estimate directly the product quality as they are not able to see, touch, smell or try the product before purchasing it, and by the lack of personal contact with a salesperson to advise them on the product. The characteristics of the product to be purchased may also act as an inhibitor for online buying as there are many products, like food, that are more sensitive to the absence of physical interaction. This lack of interaction prevents the consumer from distinguishing the quality of certain products, like food, due to the fact that the consumer’s perception of the quality of this type of product is complex and their evaluation is based on sensory properties like the product’s appearance, taste, smell and texture (Nazlin, 1999). Other impediments to online purchase are the costs of learning and training in how to use Internet and the change from other channels to the virtual one, the generation of anxiety and stress on the consumers who don’t feel comfortable when using Internet, the absence of interaction and social contact with other people, and the lack of perception of benefits in relation to traditional purchasing manners.
Regarding the drivers, Wolfinbarger and Gilly (2001) suggest that two behaviours can be identified in online customers: experience-based behaviour (those who buy for fun and enjoy) and goal-oriented or utilitarian shopping (which is task-oriented, efficient, rational, and deliberate). On this basis and other related works (Anderson y Srinivasan, 2003; Anckar et al., 2002), this paper proposal is as follows: on the one hand, as rational motives for online shopping, speed, convenience, range of products, access to a special selection differentiated in comparison with a traditional store, timetable flexibility, shortage of stores in the consumer’s residential area, less stress in the purchase, less impulsive purchases and an easier price comparison; on the other hand, as experience-based motives for online shopping, the search for original ideas and enjoyment.
Likewise, the most mentioned impediments for avoiding online shopping gathered in this study are the lack of personal relationship and advice from the salesperson, the lack of relationship with other people, the impossibility to see, touch or smell the product, the difficulty in refunds and claims, the high cost of the order’s handling and delivery, the need to make large orders to reduce delivery costs, the expiry date of certain products, technical problems in the Internet connection or browsing, excessive complication to surf on the Web or purchase on certain web pages, the need to plan the purchase, the lack of service customization, and the lack of security in payment. Perceived Risk Perceived risk is defined as an attribute of a decision alternative that reflects the variance of its possible outcomes (Gefen et al., 2002). This variance has two components: first, the uncertainty about whether some outcome will happen; and second, the consequences (usually harmful) of that outcome. In fact, online shopping means more

1323
possible negative outcomes than offline shopping (especially regarding to personal information privacy and security). Therefore regarding online shopping is very useful to conceptualize risk as the likelihood of getting a negative outcome.
The risk level that a customer associates to a buying decision is higher in online shopping than in traditional shopping (Akaah & Korgaonkar, 1988; Tan, 1999; Cunningham et al., 2005). Moreover the importance of perceived risk in online shopping means that only customers with low risk avoidance profiles prefer online shopping to traditional one (Juan, 1999). It is widely accepted that the higher the lever of risk, the lower the likelihood of transaction success. However the influence of perceived risk is not the same over the entire buying process, and is different within an online context than within an offline one: in e-commerce the effect of perceived risk is lower in the “alternative evaluation” stage, but higher in the “purchase decision” one; while in traditional retailing, the effect increases in the “alternative evaluation” stage, and decreases in the “purchase decision” and “post-purchase behaviour” stages (Cunnigham et al., 2005). Park and Jun (2003) state that there is a negative effect of perceived risk on privacy and security over online shopping, thereby reducing purchases frequency.
There are authors who find differences in variables like perceived risk according to buyer’s gender (Garbarino and Strahilevitz, 2004). Specifically, women perceive greater risks than men regarding online shopping. In addition, women give much greater importance to the loss of privacy than men. The greater difference between men and women is that women focus more on the loss of their privacy than on the likelihood of this loss. Personal recommendation is more efficient reducing perceived risk for women than for men. Although the women are more adverse to buy in absence of personal recommendations, when these exist the women significantly increase their desire of purchase. In men’s case, the recommendations do not have significant effects on the purchase desire. In addition, the women settle down quantitative differences according to the recommendation’s source ("friend" vs. "close friend"), whereas for men the effect is quite quantitative (depends on the number of recommendations).
In any case, there actually are differences between men and women regarding to their behaviour and attitudes towards Internet: the women seem to be interested in Internet less than men (Roper Center for Public Opinion Research, 1998), pass less time in Internet (Allen, 2001; Pastore, 2000a; Kehoe et al., 1998; Sheehan, 1999) and visits less pages (Allen, 2001) than men. As far as commerce online also differences have been founded: Although women are less prone to buy online (Allen, 2001; Pastore, 2000b; Sheehan, 1999; Briones, 1998) and spend less money online than men (Allen, 2001), women make 70% of the offline purchases.
Since previous research have proved that the perceived risk is negatively related to willingness to buy (Shimp and Bearden, 1982; White and Truly, 1989) and the women are less prone to online shopping, we could think that it can be explained because the women are less familiarized with Internet to have incorporated to its use later than men.
In short, differences between men and women have been founded in the following aspects: women have a greater risk avoidance (Brody, 1984; Gutteling and Wiegmam, 1993; Gwartey-Gibs and Lach, 1991; Steger and Witt, 1989; Stern et al., 1993; Slovic et al., 1997; Gardner and Gould, 1989; Barke et al., 1997), are more concern about the loss of their privacy (Sheehan, 1999; Kehoe et al., 1997), focus on relationship and communication, trends to communicate its experiences and their behaviour are more influenced by others recommendation as opposed to masculine individualism (Tannen, 1990; Brannon, 1999). Socio-Demographic Characteristics Online commerce development implies that companies are automatically involved in global markets (Wilson, 1999), and will need to deal with new clients who might be quite different from their traditional ones (Okada, 2006; Barnes et al., 2007). Thus, it is necessary to use new concepts of market segmentation which include consumers from different countries and cultures. To classify consumers in homogeneous clusters allows ecommerce retailers to be more efficient in the satisfaction of their customers´ needs and, hence, to increase their sales (Barnes et al., 2007).
Donthu and Garcia (1999) have studied the differences between online and non-online buyers, finding significant differences in terms of age, income, importance of convenience, risk aversion impulsiveness, variety seeking propensity, attitude towards marketing, and attitude toward advertising (Kau et al., 2003). Consumer characteristics are essential to adopt Internet as a buying channel and influence their loyalty and satisfaction (Ranaweera et al., 2005). Other authors have characterised online buyers by clustering them within several groups (Kau et al., 2003; Barnes et al., 2007). Research concerning online buyers from France, Germany and U.S., Barnes

1324
et al. (2007) has identified 3 typologies of online shoppers related to 7 variables: “extraversion”, “neuroticism”, “trust”, “attitude” (towards online shopping), “perceived risk”, “shopping enjoyment” and “willingness to buy”. Different levels of each variable are related to different countries, and this suggests that these socio-cultural differences may affect online shopping as well.
“Gender” and “age” have been the more studied variables regarding online shopping, but there is no clear evidence: though Zeffane and Cheek (1993) show a negative correlation between age and Internet usage, Teo (2001) suggests that age does not have a significant effect on online shopping. Neither is the role of gender clear: even though men tend to buy online more than women (Teo, 2001), this could be because men are more expert using Internet, having begun to use it earlier. In Japan, Women’s online shopping usage is lower than men’s for the population above 40 years old, but it is higher for younger people. For example, men in their 40s and 50s represent 21.9 of the total online buyers, and women of the same age represent 14.2%. However, men in their 20s and 30s represent 18.3% of the total online buyers, and women of the same age represent 26.8%. Considering only online shopping through mobile phone, the use by young women is remarkable (24% of online buyers though mobile phone are women in their 20s) (Center for Life Information, 2006). Thus, we see how in Japan there is a different online shopping behavior between men and women, with a growing participation of the young women. Buyer Expertise Regarding Internet Usage Internet usage is a determinant of online shopping (Bellman et al., 1999; Lohse et al., 2000; Citrin et al., 2000). Lohse et al. (2000) refers to “wired lifestyle” which involves issues as hours spent online per week (time), nº of months using Internet (experience), nº of hours working online, search for online information, the feeling of e-mail as an essential communication tool. These variables explain 79% of online shopping behaviour.
Park and Jun (2003) show that “nº of hours spent online” are positively related to online shopping. The degree of user expertise is a key variable when it comes to reduce perceived risk and develop loyalty to
a web site. In this sense, Park and Stoel (2005) demonstrate that previous experience of shopping online influence perceptions of risk when shopping online and intentions to purchase online. The study by Rodgers et al. (2005) indicates that firms may develop and provide differentiated services to high- and low- experience consumers because on-line experience influence on satisfaction, loyalty and their antecedents.
Although there are not many studies to date that analyze the influence of buyer characteristics on online shopping, Zhou et al. (2007) make a revision of some of them (Table 2).

1325
TABLE 2: ZHOU ET AL. REVISSION OF CONSUMER FACTORS RELATED TO ONLINE SHOPPING Source: Zhou et al. (2007)
Factor Types Individual
Factors Major Findings Surveyed Studies
Gender
Male consumers make more online purchases and spend more money online than females; they are equally or more likely to shop online in the future and are equally or more favourable of online shopping. Women have a higher-level of web apprehensiveness and are more sceptical of e-business than men
Alreck & Settle, 2002; Brown et al., 2003; Donthu & Garcia, 1999; Korgaonkar & Wolin, 1999; Levy, 1999; Li et al., 1999; Rodgers & Harris, 2003; Slyke et al., 2002; Stafford et al., 2004
Age There are mixed findings on the relationship between age and online shopping intention
Bellman et al., 1999; Bhatnagar & Ghose, 2004; Bhatnagar et al., 2000 ; Donthu & Garcia, 1999 ; Joines et al., 2003 ; Korgaonkar & Wollin, 1999 ; Li et al., 1999 ; Rohm & Swaminathan, 2004 ; Stafford et al., 2004
Income Income is positively related to online shopping tendency
Bagchi & Mahmood, 2004; Donthu & Garcia, 1999; Korgaonkar & Wolin, 1999; Li et al., 1999; Susskind, 2004
Demographics
Culture
Consumers from an individualistic culture are more likely to use the Internet for e-commerce than those from a collectivistic culture. A more masculine society has more predominant male shoppers and is more involved in online shopping
Chau et al., 2002; O´Keefe et al., 2000; Park & Jun, 2003; Park et al., 2004 ; Shiu & Dawson, 2002 ; Stafford et al., 2004
Internet experience
Frequency of Internet
usage
There are mixed results for the effects of Internet usage on online shopping intention. Internet usage is negatively related to perceived product risk
Bhatnagar & Ghose, 2004; Bhatnagar et al., 2000; Cho, 2004; Citrin et al., 2000; Jarvenpaa & Todd, 1997; Jarvenpaa & Tractinsky, 1999; Liao & Cheung, 2001; Nysveen & Pedersen, 2004; Park, 2002
Shopping motivation
----
Motivational factors play a key role in determining time spent on product searching and online shopping. Experimental (hedonic) shoppers always find more enjoyment in interactive environments than in the pure text environments
Childers et al., 2001; Joines et al., 2003; Johnson et al., 2004; Novak et al. 2000; Solomon, 1999 ; Wolfinbarger & Gilly, 2001
Psychological perception
Risk perception
Perceived risk is negatively related to online shopping intention
Bathnagar & Goose, 2004; Bathnagar et al., 2000; Featherman & Pavlou, 2003; Garbarino & Strahilevitz, 2004; Huang et al., 2004; Javenpaa & Todd, 1997; Jarvenpaa & Tractinsky, 1999; Jarvenpaa et al., 1999; Joines et al., 2003; Kolsaker et al., 2004; Liang & Jin-Shiang, 1998; Liao&Cheung, 2001; Park et al., 2004; Pavlou, 2003; Pires et al., 2004
Online Shopping experience
Frequency of online purchases
Frequency of purchases is positively related to online shopping tendency and negatively related to the likelihood to abort an online transaction
Brown et al., 2003; Cho, 2004; Foucault & Scheufele, 2002; Moe & Pader, 2004; Park & Jun, 2003; Yang & Lester, 2004
Method and Results Sample and Data Collection The empirical study conducted is based on information collected with the help of a questionnaire given to Internet users and online shoppers in Spain and in Japan. In order to reach these users in Spain, questionnaires were sent to several cyber-centres (public or private centres with Internet access). Several regional development agents and cyber-centre supervisors collaborated in the distribution and collection of questionnaires in several Spanish regions. The agents and supervisors were asked to deliver the questionnaires to those users of Internet in the cyber-centres who had previously stated that they at least once have bought products or services online. The data collection process took place in May, June and July 2006. A sample of 533 individuals were obtained. After an initial filter process where 26 questionnaires were eliminated due to incompleteness or wrong answers, the final sample included

1326
507 individuals. The same process was followed in Japan, but in this case native speakers helped us to correctly translate the questionnaire into Japanese language. The final sample in Japan was 210 (216 were collected and 6 were eliminated). Table 4 shows both samples divided by gender, age and location. Among Japanese interviewees there are more women and younger people than in the Spanish sample. As Aoki (2000) states, the number of women using the Internet is rapidly increasing in Japan and most Internet users in Japan are in their 20s and 30s. As Garbarino and Strahilevitz (2004) state, we can see that, in the early stages of Internet development, there are more men than women acquaint with this new technology (as we can see in the Spanish case) (Table 3).
TABLE 3: SAMPLE CHARACTERISTICS IN SPAIN AND JAPAN
Gender Age Home location Spain Japan Spain Japan Spain Japan
< 18 5.9% 1.9% 18-24 45.1% 75.6% Male 53.5% 36.8% 25-34 29.3% 10.5%
Near shopping centres 67.4% 79.2%
35-44 12.3% 5.7% 45-54 5.1% 4.8% 55-64 1.6% 1.0%
Female 46.5% 63.2%
> 64 0.6% 0.5%
Far away from commercial establishments
32.6% 20.8%
Results: Differences in Internet Usage Firstly, we have analysed the differences in the use of computers and Internet in both countries. We measured the frequency of Internet usage by means of five indicators: frequency in the use of computers, e-mail, Internet, chats and online buying. These items were measured in a five-point scale: 1: Every day; 2: Several ways a week; 3: Once a week; 4: Every 15 days; 5: From time to time (sporadically). The ANOVA analysis that appears in Table 4 shows some significant differences between Japan and Spain. The use of e-mail and chats is more frequent in Spain, whereas the general use of Internet is more frequent in Japan. However, there are not significant differences regarding the frequency of computer use and online buying. In this sense, we have to admit that all the individuals that answered the questionnaire have bought online at least once so that the rest of the questionnaire made sense.
TABLE 4: ANOVA: SPAIN VERSUS JAPAN (Frequency of Internet use)
Means (from 1 –more- to 5 –less-) Variables Spain Japan F-ratio Sign. level
Use of computer 1.34 1.43 1.779 0.183 Use of e-mail 1.56 1.87 11.268 0.001 Use of Internet 1.55 1.39 4.883 0.027 Use of chats 3.61 4.53 50.565 0.000 Use of online commerce 4.67 4.75 1.136 0.287
Results: Differences in Perceived Risk Secondly, the survey groups were asked to evaluate the risk they perceived when buying online, the motives behind their online shopping and the inhibitors they come across during such process. In the first place and in order to measure perceived risk, we followed the scales developed by Stone and Gronhaug (1993) and Laroche et al. (2005) and Cunningham et al. (2005), which comprise the five dimensions that have been used traditionally in risk literature: functional risk, financial or economic risk, physical risk, social risk and psychological risk (Jacoby and Kaplan, 1972). Nevertheless, our study focuses on functional, financial and physical risk because they are the most relevant ones in the online context. Table 5 comprises the Confirmatory Factor Analysis of the scale of perceived risk together with the ANOVA analysis that provides some differences between Japan and Spain. This analysis reflects differences in perceived risk, in a way that Spanish consumers exhibit higher levels of perceived risk when buying online than Japanese consumers.

1327
TABLE 5: PERCEIVED RISK ITEMS, CONFIRMATORY FACTOR ANALYSIS AND ANOVA
Perceived risk items Factor loadings Goodness of fit
Potential loss of money when buying a product or service online 0.831 Concern about the relation between benefits obtained and expense involved if buying online next months
0.916
Buying online can involve a waste of time 0.838 Concern about results not being as expected if buying online next month
0.677
Worry about the bad result of the product bought online 0.746
CFA
Lack of time implies stress because loss of time when buying online 0.690
χ2(8) = 59.79 (p = 0.000) GFI = 0.972
AGFI = 0.927 CFI = 0.988
RMSEA = 0.0967
Spain (mean) Japan (mean) F-Ratio Sign. level ANOVA
0.3414 -0.8281 272.659 0.000
Results: Online Shopping Drivers and Inhibitors In the third place and previous to the measurement of drivers and impediments and taken as a reference the motivations and barriers to online buying outlined in the study by AECEM-FECEMD (2006), authors maintained interviews with consumers and firms in order to make a brainstorming and revise the questionnaire.
Hence, in order to measure the drivers, 21 indicators were used, gathering the motives relevant to greater purchase convenience and speed, a greater variety of options (more products, more ideas, timetable flexibility) and the possibility of rationalizing the purchases (less stress and less impulsive purchases). Likewise, in order to measure the impediments, 13 indicators were used, referring to the lack of physical contact with the salesperson and the product, to the greater costs of the transaction (as a result of security problems, delivery costs or losses due to the expiry of the product), and the technical problems or the lack of adaptation to the online purchasing process. Five-point Likert scales were used, taking different literature projects as a reference and undertaking the necessary adaptation. Such indicators were subjected to two factor analyses, the results of which are shown in Table 6 and Table 7.

1328
TABLE 6: INTERNET SHOPPING DRIVERS (FACTOR LOADINGS) FACTORS 1 2 3 4 5
Payment security 0.830 Good post-purchase service 0.805 Firm’s reputation 0.657 Wide information about product/service 0.643 Quick web site 0.591 Interactivity between buyer and seller 0.536 Less stress while shopping 0.732 Few stores in area of residence 0.676 Less impulsive purchases (non-planned purchases) 0.637 Searching for ideas 0.671 Wide product range 0.655 Access to special products not available in a normal store 0.585 Enjoyment 0.434 Attractive web site 0.349 Convenience 0.726 Speed of purchase 0.693 Easy price comparison 0.549 Long shopping hours; no timetables 0.536 Easy shopping for handicapped people 0.450 Lower prices 0.675 Promotions 0.534
Explained percentage difference 26.1% 11.2% 7.5% 5.4% 5.1%
TABLE 7: INTERNET SHOPPING IMPEDIMENTS (FACTOR LOADINGS) FACTORS 1 2 3 Lack of Internet knowledge 0.752 Technical problems regarding Internet connection or browsing 0.707 Excessive complication while browsing and buying on many web pages 0.701 The need to plan the purchase 0.593 High postal and delivery costs 0.813 The need to obtain large orders to reduce delivery costs 0.730 Difficulty regarding claims and refunds 0.654 The impossibility to see, touch or smell the product 0.614 0.516 Lack of payment security 0.425 Short expiry date on certain products 0.417 Lack of personal contact and salesperson advice 0.835 Lack of relationships with other people 0.796 Lack of client service customization 0.512 0.472
Explained percentage difference 31.8% 11.8% 11.4% The factors obtained clearly reflect five types of drivers or driving factors:
• Factor 1. Search for a good online service. • Factor 2. Rationality when shopping and the need of shopping online. • Factor 3. Scope of possibilities. • Factor 4. Greater convenience and easiness when shopping. • Factor 5. Search for lower prices.
Likewise, three types of impediments have to be taken into consideration: • Factor 1. Technical difficulties, • Factor 2. Greater transaction costs.

1329
• Factor 3. Lack of physical contact. The next step was to compare the drivers and the impediments of online shopping in two different social
contexts, Japan and Spain. The two countries were compared using ANOVA. After calculating the factors, they were re-codified from 0 to 5 so that it would be possible to compare them. This analysis revealed some significant differences between Spain and Japan buyers on most of the factors tested. As summarized in Table 8, our results indicate significant variation in three Internet shopping drivers (search of a good online service, the scope of possibilities, and the greater convenience) and in the three impediments.
TABLE 8: ANOVA: SPAIN VERSUS JAPAN
Means Variables Spain Japan F-ratio Sign. level
Driver 1.Search for a good online service 3.2673 1.8852 442.150 0.000 Driver 2. Rationality when shopping 2.6275 2.5122 2.553 0.111 Driver 3. Scope of possibilities 3.0716 3.2849 11.289 0.001 Driver 4. Greater convenience 3.4706 3.6042 5.641 0.018 Driver 5. Search for lower prices 2.7987 2.8861 2.140 0.144 Impediment 1. Technical difficulties 2.6509 2.3086 19.229 0.000 Impediment 2. Greater transaction costs 2.7934 3.0750 17.490 0.000 Impediment 3. Lack of physical contact 2.3734 2.5546 6.399 0.012
Specifically, according to our ANOVA results, Spanish buyers consider the offer of a good online service a
more important reason for online buying than Japanese buyers. However, Japanese buyers give more importance to the scope of possibilities and the convenience as drivers of online buying. There are no differences about the rationality and the lower prices as drivers of online buying. As for the inhibitors, the technical difficulties are more relevant for Spanish than for Japanese buyers, maybe because Japanese people know more about new technologies and Japan is a country more advanced than Spain in new technologies, whereas transaction costs and the lack of physical contact are more relevant impediments for Japanese than for Spanish buyers. Results: Effects of Socio-Demographic and Internet Expertise Variables on the Drivers and Impediments After analyzing the differences between countries according to drivers and impediments, we considered the influence of socio-demographic buyer characteristics (gender, age and place of residence) and its interaction with the country existence of factors. Moreover, we considered the degree of buyers’ expertise on Internet as another influencing variable. Five indicators of expertise were used (I consider myself as an expert on online buying, I consider myself as an Internet expert, I am involved in the commercial style of the Internet, I usually buy products/services on the Internet, my level of expertise with computers is high) that were reduced to a single factor throughout a factorial analysis. Table 9 comprises the Confirmatory Factor Analysis of the scale of buyer expertise together with the ANOVA analysis that involves again differences between Japan and Spain. Concretely, Spanish consumers consider themselves as more experts in the use of Internet than Japanese consumers. Once the factor was created, we re-codified it into a dichotomical variable: low online buying expertise and high online buying expertise. Table 10 offers the results of two-factors ANOVAs and the interactions in the cases where significant effects were found.

1330
TABLE 9: BUYER EXPERTISE: ITEMS, CONFIRMATORY FACTOR ANALYSIS AND ANOVA) Expertise items Factor
loadings Goodness of fit
I consider myself as an expert on online buying 0.995
I consider myself as an Internet expert 0.679
I usually buy products/services on the Internet 0.711 CFA
My level of expertise with computers is high 0.419
χ2(2) = 8.114 (p = 0.017) GFI = 0.994
AGFI = 0.972 CFI = 0.996
RMSEA = 0.0651
Spain (mean) Japan (mean) F-Ratio Sign. level ANOVA
0.0868 -0.2209 13.951 0.000
TABLE 10: TWO-FACTOR ANOVAS
Models Dependent variable Source F-ratio Sign. level Country 1.333 0.454 Gender 0.011 0.932 Driver 3. Scope of possibilities Country*Gender 9.639 0.002 Country 214.118 0.043 Gender 54.846 0.085
Two-factor Anova Country*Gender
Impediment 2. Greater transaction costs Country*Gender .060 0.806 Country 292.827 0.000 Place 2.781 0.096 Driver 1.Search for a good online service Country*Place 0.358 0.550 Country 3.171 0.075 Place 3.650 0.057 Driver 2. Rationality when shopping Country*Place 1.973 0.161 Country 0.263 0.609 Place 3.284 0.070
Two-factor Anova Country*Place Of residence
Driver 4. Greater convenience Country*Place 5.222 0.023 Country 9.203 0.003 Age 4.219 0.000
Two-factor Anova Country*Age
Impediment 2. Greater transaction costs Country*Age 1.872 0.083 Country 1.818 0.178 Expertise 7.388 0.007 Driver 2. Rationality when shopping Country*Expertise 0.705 0.401 Country 4.482 0.035 Expertise 6.639 0.010
Two-factor Anova Country*Expertise
Driver 5. Search for lower prices Country*Expertise 3.987 0.046
The results of Table 10 show that the direct effect of gender is significant on the perception of greater
transaction costs as an impediment (XMale = -0.075 ; XFemale = 0.117); the direct effect of the place of residence is significant for the search of a good online service (XNear = -0.012 ; XFar = 0.000), the rationality when shopping (XNear = -0.075 ; XFar = 0.119) and the perception of greater convenience (XMale = -0.057 ; XFemale = 0.030); the direct effect of age is significant for the perception of greater transaction costs (X<18 = -0.208 ; X18-24 = 0.144; X25-34 = 0.058; X35-44 = -0,301; X45-54 = -0.592; X55-64 = -0,667; X>64 = -0,832), and the direct effect of expertise is significant for the rationality when shopping (XLow= -0,127; XHigh = 0.145) and for the search of low prices (XLow= -0,033; XHigh = 0.103).
Following these results, women perceive greater transaction costs in online shopping than men. Also, people between 18 and 34 perceive greater transaction costs in online shopping than the rest of people. As for the place of residence, people who do not live near commercial establishments consider the good online service that is offered in the virtual shops, the need of online buying, and the fact that Internet allows them an easier purchase as

1331
more important reasons to buy online. However, those who live near of shops think that convenience and easiness of shopping are more important drivers of online buying. Finally, for those who have more experience in online buying there are two drivers more relevant than for the less experienced: the need of online shopping and the search of low prices.
The interaction effects only are significant in four cases. Theses effects are represented in Figure 1. In these figures we observe the next results:
First, as regards online buying because of the scope of possibilities, as we said before, in Japan it is a more important motive for choosing online commerce than in Spain. However, it is a more important motive for Spanish women, whereas in Japan it is a greater motive for men.
Second, in Japan people who live near shopping places find greater convenience and easiness when buying online than people who live far away from commercial centres. The difference in this case is really significant. However in Spain there is not a big difference between these two groups.
Third, concerning the perception of transaction costs, minor differences are found between Japanese and Spanish people according to their age. Specifically, Japanese young people (less than 18) perceived greater transaction costs in online shopping than the Spanish young people. The same occurs for the oldest (more than 55): the perception of transaction costs in online shopping of Japanese is greater than that of Spanish.
Fourth, whereas in Spain there are not differences between low and high experience shoppers about the fact of online buying searching for lower prices; in Japan there are considerable differences. High experienced online buyers consider more important the searching for lower prices as a reason for online shopping whereas low experience buyers hardly value this motive.

1332
FIG. 1: INTERACTION EFFECTS
Discussion
The new Communication and Information Technologies have supported the development of business in a global and international market. This global and common market contrasts, however, with the existence of great differences in the adoption of e-commerce by the consumers of different societies. The heterogeneity in the behaviours and the attitudes towards e-commerce may imply different business strategies in order to increase the use of Internet as a commercial channel.
From our point of view, it is interesting to see how e-commerce in other countries is developed and the similarities and differences in shopping styles among countries, now that Internet has become more than a tool of global communication and become the place to conduct global businesses. In line with other studies that have emphasized the influence of social aspects in the consumer behaviour, this study analyses the differences in online buying behaviour between consumers from countries with different history, tradition, distribution systems, life styles, and that are geographically far away from each other, as is the case of Spain and Japan. Concretely, our study focused on the analysis of the degree of adoption of e-commerce, the risk perceived and the drivers and impediments that are considered by consumers in each country. In general, we can say that although there seems to be a “virtual
SPAINJAPAN
COUNTRY
0,40000
0,30000
0,20000
0,10000
0,00000
-0,10000
-0,20000
Est
imate
d m
arg
ina
l me
an
s
FemaleMaleSex
Estimated marginal means for Motive 3
SPAINJAPAN
COUNTRY
0,20000
0,00000
-0,20000
Est
imat
ed m
argi
nal m
eans
I have to travel for shopping
I live near of commercial centers
Place of residence:
Estimated marginal means for Motive 4
Older than 64
55-6445-5435-4425-3418-24Less than 18
Age
1,00000
0,50000
0,00000
-0,50000
-1,00000
-1,50000
Est
imat
ed m
argi
nal m
eans
SPAINJAPAN
COUNTRY
Estimated marginal means for Inhibitor 2
ESPAÑAJAPÓN
COUNTRY
0,40000
0,20000
0,00000
Est
imat
ed m
argi
nal m
eans
HighLow
Expertise
Estimated marginal means for Motive 5

1333
culture” shared by consumers everywhere (Johnston & Johal, 1999)., there are nuances that should be taken into account regarding drivers and impediments to adopt online buying, expertise and Internet usage or perceived risk.
The first result of our study is that there are not relevant differences as it regards the frequency of use of online commerce. Most surveyed online buyers make their online purchases just sporadically in both countries, although the use of e-mail and Internet is actually frequent. In spite of little but significant differences between the two countries in the use of e-mail, use of Internet and use of chats, those differences could be due to the greater possibilities of non-pc Internet connection (e.g. cellular phone) that Japanese can enjoy. However, the perception of risk is greater for the case of Spanish buyers than for Japanese buyers. Spanish buyers declare that they perceive more economic risks, less benefits, and more concerns about not obtaining the expected results in electronic commerce. This result can be due to the more recent incorporation of Spanish users to online shopping, to the systems of payment (more secure in Japan) or to the fact that Spanish are less confident than Japanese. Future studies should go deeper into this issue.
The second part of the analysis is about the drivers and impediments of online buying. We have found five types of Internet shopping drivers: the search for a good online service, the need of shopping online, the scope of possibilities, the greater convenience, and the search of lower prices. Such motives have been compared for the e-buyers of the two countries. Results indicate that both Japanese and Spanish buyers consider the greater convenience and the scope of possibilities as the main motives for buying online, but these motives are more important in Japan than in Spain. The more relevant difference between the two countries is about the search of a good online service, a more important motive in Spain than in Japan. It reveals that Japanese buyers value the e-commerce especially because of the easiness and the possibilities they find there, whereas Spanish buyers also value the good online service that is offered in the web sites they use. Finally, the rationality (less stress, less impulsive purchases) and search for lower prices are less important drivers, and there are not differences between Japanese and Spanish e-buyers.
Likewise, we have classified impediments into three groups: the technical difficulties, the greater transaction costs and the lack of physical contact. In this case, the transaction costs are the main impediment for buying online. These costs are perceived as greater by Japanese buyers than by Spanish buyers. This result may be associated to the fact that in the Japanese shopping style a good service, concept that includes reliability of the service (Ishibuchi, 2003), is quite important and that the Japanese culture shows a higher risk avoidance than the Spanish culture (Hofstede and Bond, 1988). Similarly, the lack of physical contact is a bigger barrier to online buying for Japanese than for Spanish buyers. This result confirms that in Japan, a country less individualist than Spain (Hofstede and Bond, 1988), consumers are more reticent to buy online as it does not allow a direct contact with salespeople or with other consumers. Besides, the use of conbinis in Japan as physical places to pay, pick up their products ordered online and buy some convenience goods, facilitates the contact among consumers. However, technical difficulties seems to be bigger in the case of Spain, probably because Spain is less advanced in Communication and Information Technologies (C.I.T.) and in delivery systems for ecommerce (e.g. conbini) in comparison with Japan.
Finally, the third part of our research has focused on the analysis of direct and indirect effects of socio-demographic variables on the perception of drivers and impediments of online buying. As for the direct effects, results indicate that female perceive transaction costs as a more important impediment to online buying than men. In fact, female usually perceived higher risks and are less prone to online buying than male (Allen, 2001; Garbarino and Strahilevitz, 2004). The same happens with young people (between 18 and 34 years old), who perceive higher costs than the rest of age groups. As regards home location, individuals who live far way from shops value more the customer service and perceive there is a need to buy online. In contrast, individuals who live near commercial establishments appreciate more the convenience deriving from online shopping. Consumers who define themselves as more expert in the use of electronic commerce especially value rationality when shopping and the possibility to obtain better prices online than offline. In relation to indirect effects, there are also some differences between Spain and Japan. Japanese male value more than Spanish male the wide range of shopping alternatives and varied assortment that Internet offers to the market. Moreover, Japanese male who live near shops appreciate more convenience than male who live further, whereas in Spain there is not really a difference. Finally, Japanese buyers that are more expert in the use of internet and in online buying evaluate higher than non-experts the possibility of

1334
finding good prices online, while in Spain there is not such a different between experts and non-experts. Perhaps we are facing some sort of Product Life Cycle (P.C.L.) regarding to ecommerce: at the first stages
placement (delivery systems), information and product quality (quality of the web, post-purchase service, payment systems, firm’s reputation) are more important (as Spanish buyers do) than afterwards, when the new product (ecommerce) is widely accepted and consumers focus on price (as Japanese online buyers do).
Managerial Implications
One of the managerial implications of this study concerns the higher perception of risk by Spanish consumers, who have accessed later than Japanese to the Internet and even perceived more technical impediments to online buying. That is why firms with a Spanish target audience should make an effort to promote the advantages of C.I.T. to do the shopping and must create consumer trust through adequate privacy and security policies, improving non-PC connection systems as cellular phones, and introducing some innovations in delivery systems (e.g. conbinis) and in Internet access systems (e.g. ATM-like devices), all this in order to foment the increase of Internet use as a shopping channel.
On the other hand, Japanese buyers feel themselves more limited to buy online due to transaction costs and lack of physical contact. In this case, firms should focus, not as much on security and easiness of surfing and buying on the Internet as trying to search a competitive advantage and differentiating element in the electronic channel in comparison with the traditional channel. This implies not only reducing costs, but also looking for new ways of interaction and contact that transmit consumers the same feelings of closeness and proximity that are the strengths of traditional commerce.
Limitations and Further Research
As limitations of the work it should be mentioned that different web sites have been considered in this research, which implies heterogeneity in results (Ribbink et al., 2004). Moreover, the collection procedures and the sample sizes are not exactly the same in Spain and in Japan, which has made the comparison difficult. From the results future lines of research may emerge. In the future we would like to analyze the Internet users who access the Internet through wireless phones, video game devices and Internet appliances because these type of users have increased in Japan because many business people and students commute every day and spend a number of hours in public transportation (Aoki, 2000; ECOM, 2002, 2006; Okada, 2006). In our Japanese sample, 10.7% of users have bough online mainly using their cellular phones or at least as equally as using computer. Besides, conbinis play an interesting role in promoting e-commerce among consumers in Japan as it tends to be the place where consumers go to pay in cash for merchandise ordered online and it is the place where some people go to shop online at the terminals and pay when they do not have Internet access at home. Another interesting issue regards the king of product bought. The most popular goods for Japanese online shoppers are computer-related products (Aoki, 2000; Okada, 2006), whereas Spanish people mainly buy travel tickets, books and show tickets (AECEM-FECEMD, 2006). Another interesting way to extend this study would be to develop a model of antecedents of online loyalty and compare it with the generation of offline loyalty.
References
Contact authors for the complete list of references.

1335
A Management Mystery: The Case of the Missing Customer
John Milton-Smith Curtin University, Australia
Abstract This paper addresses a remarkably enduring gap in the management literature. It traces the persistent neglect of the customer’s role in management theory and argues that one of the unfortunate side-effects of academic fragmentation has been the unchallenged appropriation of ‘the customer’ by the Marketing discipline. Although Peters and Waterman highlighted the inability of management theory to explain the success of America’s top-performing companies as far back as 1982, nothing has changed. Despite the intense focus on customer experience, as opposed to so-called ‘customer service’, by the new generation of successful global enterprises such as IKEA and Infosys, management theory continues to lag management best practice. This delinquency is especially remarkable given mounting evidence that customers are far from satisfied with the way they are treated. The serious deficiency in the literature stimulated the author to investigate more deeply the connection between customer experience, corporate reputation and business success. The resulting international survey, which is on-going, together with two mini-case studies, based on IKEA and Infosys, demonstrates huge untapped potential for enhancing corporate reputation by providing a more positive customer experience. It also reveals the critical importance of an integrated approach to organizational learning whereby corporate leaders leverage Knowledge Management (KM) systems to develop innovative, customer-centered business models and, as a result, create new market space. Different philosophies and concepts are incorporated into a new learning organization paradigm (INOVACC), which has been developed by the author as a tool for assisting organizations embarking upon customer-driven mindset and culture change programmes. The Myopia of Management Theory More than half-a-century ago, Peter Drucker, the father of modern management, emphasized the centrality of the customer in business enterprise. He stated it with classic simplicity; ‘there is only one valid definition of business purpose: to create a customer.’(1) Based on this definition, it is the core responsibility of managers to attract and retain customers. Of course, the means by which managers perform this responsibility requires considerable elaboration However, it is difficult to argue with Drucker’s key point, which makes it all the more extraordinary that subsequent generations of management theorists have paid very little attention to the significance and role of the customer in their work. In many ways it is another classic case of academics not seeing the wood for the trees. Although there has been a multitude of management frameworks including an emphasis on basic management functions, advocacy for various models of organizational design, the significance of situational and contingent factors, the importance of individual motivation and group behaviour, the distinction between management functions and leadership roles and (more recently) knowledge management, by and large the customer perspective has been abdicated to the Marketing discipline.
A classic example of continuing management myopia is the landmark project undertaken by Shell and the Tavistock Institute of Human Relations in the mid-1960s, which was a partnership between one of the world’s leading companies and one of the pre-eminent management research organizations at that time. Despite claiming to have produced “A New Philosophy of Management”, the project was totally preoccupied with an internal organizational perspective and dealt primarily with industrial unrest, trade unions, productivity bargaining and employee motivation. There was no direct reference to customers or service in the ‘Statement of Specific Objectives”, the resulting company development programme or the Index.(2)
As late as the early 1980s, Peters and Waterman, both prominent in academic and consulting circles, and seeking to explain the success of America’s top companies, emphasized once again the poverty of prevailing management theory:

1336
No existing theory helps much in explaining the role of the customer in the prototypical excellent company. At most recent theory talks about the importance of the external environment in influencing the institution. It misses by a mile, however, the intensity of customer orientation that exists within the top performers, and that intensity seems to be one of the best kept secrets in American business. (3)
About the same time, Moss Kanter highlighted the flaws in contemporary management theory and the problems encountered by companies dominated by functional specialization and segmented thinking. In a major research study she identified big performance differences between integrated and segmented cultures. She found that, in a segmented culture, problems are ‘left with specialists’ who have no incentive for cooperation. Such a culture ‘makes it harder for the organization to move beyond its existing capacity in order to innovate and improve’. By contrast, Moss Kanter concluded that highly-innovative, customer-focused organizations tend to treat problems as ‘wholes’ and are therefore strongly ‘team-oriented’. (4)
By the 1990s, the fragmentation of management practice and theory had spiraled out of control. The one contaminated the other. Over a thirty-year period it was estimated that there had been ‘fifteen major new ways of looking at organizational structure’. Railing against the rampant fashion for ‘gurus’, ‘fads’ and “quick fixes’ such as reengineering, flat structures and TQM, for example, Hilmer and Donaldson, two of Australia’s most respected management academics, put the case for a more holistic, professional management approach, including the recognition that corporate success is ‘not just one thing’ but many. However, among the multitude of variables, there are two which are indispensable: leadership and its commitment to the principle that ‘customers come first’.(5) Despite their compelling advocacy, there has been little change. It appears the myopia of management theorists and their students has degenerated into blindness. Almost a decade later, following a survey of customers of 862 leading companies, Bain and Company found that only 8% of customers described their experience as superior. (6) Globalization and its Implications for Management Theory Even though the environment in which managers operate is being transformed exponentially, management theory continues to lag management best practice at an accelerating rate. Over the past decade or so, information technology, economic integration, relentless innovation and change, combined with increasingly intense marketing, have changed the competitive rules of the game for organizations big and small. Customers and the community (that is, potential customers) have become much more powerful, influential and selective. Globalization now reaches into every aspect of human existence. At the broadest level it shapes trends in economics, finance, trade, manufacturing and employment markets; at the micro-level, it intrudes into daily life in the form of food, news, travel, religion, entertainment, clothing and the most basic shopping activities. Concurrently, a new generation of organizations has successfully interpreted, leveraged and learned from these trends to create truly global customers by inventing unique but universal sources of added value. Such organizations straddle industries and make redundant the old economist’s distinction between products and services. Examples of this phenomenon include Google, Zara, Dell, Harvard Business School, Citibank, Microsoft, IKEA and Infosys.
Until recently, in exploring and managing the possibilities and implications of globalization, the emphasis has been mainly on the economic and operational aspects. (7) However, the activities of consumers and world-wide lobby groups, including human rights and environmental movements and on-line bloggers and campaigners, have drawn attention to the collective failure of governments and corporations to address the dark side of globalization and the expectations of customers satisfactorily. Critics point to increases in poverty, disease, illegal and unethical behaviour by multinationals including corruption, workplace injustice, environmental degradation, quality and service deficiencies and cultural insensitivity as evidence. As a result, global brands have not only become more powerful but also more vulnerable. This huge management dilemma has been scarcely acknowledged by mainstream management theory.
In the global context, the massive equity in leading global brands is always at risk. The costly ethical and strategic failings of major enterprises in recent years such as Kmart, Arthur Andersen, Global Crossing, Mitsubishi, Citibank, Nestle, Shell, Bridgestone, Enron, Perrier, Ford, Nike, the Australian Wheat Board and IBM (8),to name

1337
only a few, provide strong evidence of the power and sensitivity of consumer values, expectations and sentiment. In various ways each of these companies, for some time at least, got out of touch with their customers and their communities. Given the constant potential for a consumer backlash and a generally more alert, volatile and competitive business environment, it is clear that, more than ever before, organizational leaders need to carefully monitor and learn from what is happening in the societies in which they operate and become more adaptive, flexible, innovative, values- driven and socially responsible. International Service Reputation Survey In view of the persistent neglect of the customer perspective in the management literature, and given mounting evidence of customer dissatisfaction with their service experience, the author began investigating the underlying issues in 2002. The resulting study includes an extensive review of corporate mission statements, and extensive and continuing international survey of service excellence and reputation, and a series of on-going focus groups designed to dig deeper into perceptions and expectations of service quality.
The examination of corporate documents has been extremely revealing. It emerges that, like quality, service has become a major priority of modern managers if corporate vision and mission statements are to be believed. The extraordinary success of Japanese companies in world markets during the 1970s and 1980s made ‘total quality management’ a strategic imperative for many organizations around the world. Inevitably, the initial emphasis upon product quality led to a greater concern for service quality. However, the resulting emphasis upon incremental service improvement led to superficial solutions. Instead of reviewing strategies, structures and systems in the light of customer needs and preferences, the main focus was upon the behaviour of frontline service delivery personnel. It was driven from marketing rather than a strategic management perspective. From the 1980s onwards, customer service became synonymous with excessive frills, familiarity and fuss, extravagant packaging, tempting bonus offers and hollow clichés such as “have a nice day” became standard practice. Instead of serving the customer which, in the case of budget airlines, may mean very little service, if that is the customer’s preference, terms such as “excellent customer service”, “customer relationship marketing” and “customer intimacy” have given managers a mandate to bombard their customers with often unwanted and invasive telemarketing calls, spam and junk mail.
Whereas many service marketing initiatives are designed to ensure that the provider is the dominant player in the proposed relationship, successful service providers increasingly invite the customer to enter into a partnership and even help design and customize the service experience.
The survey results and focus group meetings reveal a bleak picture. Despite the importance attached to so-called customer service in corporate mission statements and marketing material, this study reinforces previous research findings which indicate that very few organizations have succeeded in establishing a front-of-mind reputation for excellent service. This short-coming would appear to provide enormous scope for strategically-managed organizations to re-focus their knowledge management systems and to establish a major new source of competitive advantage based upon a unique capacity to serve customers. Between September 2002 and February 2007 the author randomly surveyed 482 adults in Perth, 446 in Singapore, 309 in Hong Kong, 117 in Lyon, France, 301 in Shanghai, 277 in Mumbai, India and 180 in Ho Chi Minh City, Vietnam. Participants were mainly mature-age post-graduate students, attendees of management short courses and low/middle level office staff. The survey was extremely simple and invited respondents to quickly write down examples of organizations which had given them consistently outstanding service over a period of at least two to three years. No discussion preceded the administration of the survey.
About` three minutes was allowed for the task in order to tap front-of-mind nominations as opposed to examples that required respondents to search their memories and took some time to recall. It was emphasized that there were no restrictions on the types or number of organizations which might be identified. The author has also conducted 15 focus groups, with a minimum of one in each country surveyed, in order to explore the views of customers about service providers in greater depth.
Of the survey respondents 18% in Perth, 21% in Singapore, 17% in Hong Kong, 13% in Lyon, 21% in Shanghai, 22% in Mumbai and 24% in Ho Chi Minh City failed to nominate even one organization. 60% of all

1338
respondents nominated only one organization and barely 6% nominated four or more. The organizations cited varied greatly from location to location. Most were small, local organizations including retail shops, hairdressers, tax agents, freight forwarders, mobile phone retailers and trades people. Among the most frequently mentioned large organizations were airlines, hotels, large department stores, banks, mobile phone manufacturers and car makers. It is noteworthy that, with only one or two exceptions, no professional firms, government departments, public utilities, universities or hospitals were named. The wide range of industries and firms nominated, and the variations between locations, reinforces the view that service is a very personal and subjective experience and there can be a large gap between the provider’s perception of the service offered and the customer’s perception of the service actually experienced.
The views emerging from the focus group discussions indicated that there is a major opportunity for organizations big and small to build a competitive edge and imprint a reputation by better managing service delivery in the eyes of the customer. It also became apparent that there has been a considerable blurring of the traditional distinction between goods/products and services. Customers increasingly look for comprehensive, integrated solutions and positive, productive experiences in exploring options and satisfying their needs. Strong visionary, ethical and purposeful leadership was continually highlighted as the reason why some organizations, especially those mentioned here, have a reputation for service excellence. The remarkable success of companies such as Starbucks, IKEA, Infosys, Virgin, Officeworks (Perth) and Carrefour was seen to be very much the result of leadership, which not only identified, learned from and leveraged trends in consumer preferences and behaviour, but also invented business models for delivering unprecedented and often previously unimagined benefits to customers.
The most frequently cited large organizations by questionnaire respondents and focus group participants in Singapore were Singapore Airlines, The Ritz Carlton Hotel, Federal Express, Robinson’s Department Store and DBS Bank. It is significant, however, that, according to a few Singaporean respondents, some local business class travelers on Singapore Airlines feel that ground staff and cabin attendants discriminate against Asian passengers and give preferential treatment to Westerners. In Perth the clear winners were Skippers (a local new and used car dealership specializing in Mitsubishi, Hyundai and Volkswagen) and Singapore Airlines, followed by IKEA, the Hyatt Hotel and the RAC, a road service club. Banks featured prominently in the Hong Kong survey with Hang Seng Bank and HSBC receiving the most mentions followed by IKEA. The two most popular large service providers nominated in the French survey were Carrefour and IKEA. In the case of Shanghai the leaders were China Telecommunications, Haier (white goods) and Volkswagen. The focus groups in India offered very high praise for Infosys, a software outsourcing consultancy that most participants had never dealt with. The other companies mentioned in very positive terms were India’a largest home-grown businesses, the Reliance Group (a diversified manufacturing business specializing in electronic security and facilities management) and the Tata Group (a diversified giant with 96 companies operating in seven different business sectors). Respondents in Ho Chi Minh City cited a number of mobile phone companies of which VNPT seems to be the most popular.
A prominent theme in most of the focus groups was that, just as service providers often fail to deliver the service their customers expect, just as often they attempt to provide service they don’t want. For example, a number of Perth participants commented critically about restaurants where the waiters hover around the table and are excessively solicitous. “Why is it that, when you’re in the middle of your first mouthful, a waiter will suddenly pounce and ask if everything is okay?”, complained one regular restaurant patron. It is possible that this sort of irritation is related to the more casual lifestyle and social habits which are characteristic of Western Australia. In more traditional and hierarchical societies, it is likely that a more attentive style of service would not only be expected but demanded. Cultural sensitivity and knowledge are essential elements in rolling out and implementing an international business strategy. One of the most striking themes to emerge from the focus groups is the blurring of any distinction between products and service. The emphasis on customer experience was consistent. As one participant put it:
I think customers to-day judge service on the whole package. It doesn’t matter whether you’re talking about mobile phones, restaurants or budget airlines. Look at the Hyundai Getz. Why is it such an incredible success story? It’s not just about persuasive salesmen and discounts. It’s much more than that. The car offers amazing style, great design, trendy colours, fantastic fuel economy and road handling – an unbelievable warranty – all at a very low price. How do they do it?

1339
In contrast, some of the groups were extremely vocal about their problems with digital cameras. The main source of the complaint related to warranties and the quality of service. Sony was a particular target of criticism and participants echoed many of the negative comments which have been appearing recently on web blogs. In comparison upstart challengers such as LG and Samsung received considerable praise for their warranties and follow-up service and these results would appear to mirror shifts in the relative international rankings of the respective brands. It is now sufficiently clear from the survey that managers take an excessively narrow view of service. The very concept of ‘customer service’ suggests that service is a specialized point-of-sale activity – the final element in the value chain. Indeed, ‘customer service’ and ‘customer relationship marketing/management’ are generally based on the company’s assumptions about what constitutes a positive service experience as opposed to what the customer needs, values or prefers. Knowledge Management (KM), Learning Culture and the Link with Strategic Leadership Perhaps the most striking insight from the survey is the fact that even the world’s most successful companies and valued brands have not even scratched the surface in building a reputation for providing a memorable service experience. Accordingly, there is a massive, untapped opportunity to enhance customer value and boost brand equity by looking beyond simplistic, narrow, marketing-driven notions of service. In order to put the survey results in context, it is important to give prior consideration to the processes and mechanisms used by organizations to shape their assumptions and strategies in connecting with customers. In particular, it is important to draw a distinction between KM and organizational learning and to explore the role of leaders in managing the strategy-making process. In this paper it is argued that the extraordinary spate of corporate crises and failures since the 1980s, despite massive investment in information and KM systems, suggests a serious shortage of corporate leaders with high-level strategic thinking skills and the ability to connect with the values and aspirations of their communities. Thus, while acknowledging the importance and widespread adoption of various forms of KM, it is also important to place it in a proper perspective (9). The problem with new management fads and systems is that they can quickly become ends in themselves. It is therefore important to remember that the purpose of KM is to create and apply knowledge as a strategic resource for defining future direction, building competencies and shaping culture. For example, a well-developed KM process is an essential pre-condition for constructing competitive advantage around a strategy of innovation. It provides the organizational resource which informs and drives the critical dimensions of innovation: that is, pro-activity by individuals and groups throughout the organization; the autonomy needed to experiment and collaborate across boundaries; the continuous flow of information and ideas which are indispensable to the process of creativity; and the necessary foundation for taking measured risks with confidence, trust and enthusiasm.
However, it is one thing to put in place the functions, structures and policies that encourage and support innovation. It is quite a different thing to create a learning culture. Managers need to make a clear distinction between the ‘enablers’ of KM, such as technology and systems, which have tended to become ends in themselves, and the ‘drivers’, such as leadership and strategy, which are much more important. KM does not automatically produce a learning culture. A learning culture is the product of inspiring, ambitious leadership, as opposed to operational management, which:
� Emphasizes resourceful, relentless environmental scanning; � Connects continuous learning with strategy-making processes � Aims to satisfy the needs and potential needs of both present and future customers � Creates mechanisms and rewards for teamwork, knowledge-sharing and innovation � Insists that a primary responsibility of managers is mentoring future leaders; � Invests in the building of unique competencies in an unswerving quest for excellence and; � Above all, regards constant adaptation and change as an opportunity to be leveraged rather than a threat to
be resisted. Unless leaders ensure that these values, attitudes and priorities are in place, KM will have limited strategic
impact and innovation will not flourish. One positive sign that a learning culture exists is the general attitude of

1340
employees towards inter-departmental cooperation and committee meetings. Employees in traditional organizations often engage in segmented thinking and give low priority to assisting colleagues in other areas to achieve their targets. In a learning organization, by contrast, people feel connected to broader strategic outcomes. Through their work on multi-discipline project teams, they feel empowered and supported. They enjoy coming together with their colleagues for the purpose of pooling, planning and proposing innovative initiatives, because there is a real sense of trust, sharing and mutual enlightenment, and, even more important, moving the organization forward to achieve its strategic goals.
To be a true learning organization, an organization must first be strategy-driven and customer-committed. It must have a powerful sense of mission and driving purpose. Furthermore, it must have the focus, energy and commitment that only an ambitious, widely-shared strategic goal can generate. From the time it begins to glimpse and define the future it aims to invent, the learning organization becomes aware of the integral relationship between its core competencies and the goal it seeks to achieve. In a world of turbulence, uncertainty and intense competition, strategy embraces the dynamic, constantly evolving relationship between means and ends. The textbook notion of strategy as the game plan, developed only after the goal has been firmly set in place, is the product of academic logic rather than a realistic understanding of how the business environment actually works. Given the contingencies of the contemporary operating environment, the only feasible competitive strategy is a strategy in organizational learning and partnership (10).
The learning organization imagines and then invents its own future. It does this by gaining an intimate knowledge of the context in which it operates, by identifying the critical forces shaping the emerging context, by learning from these insights and experience, and by developing, and then leveraging the unique competencies needed to create new sources of value that neither customers nor competitors could even visualize in advance. Such foresight, creativity and performance in serving customers can only be attained if the organization puts in place the people, processes and programs necessary for selecting, sharing and exploiting the tacit and explicit knowledge which underpins world-class service competencies. Learning Organizations in Action: Two Case Studies IKEA and Infosys Technologies have been selected for further consideration because, in both cases, the leadership of founders played a decisive and instructive part in leveraging deep industry and market knowledge to create innovative new business models and value propositions for their customers based upon superior service. Both organizations began as entrepreneurial SMEs, adapted to changing competitive environments, and grew to become global giants within a generation. Both companies provide valuable insights into the relationships between KM, organizational learning and strategic leadership. IKEA IKEA is one of the most revolutionary examples of a new business model based upon value-adding relationships and processes, is the Swedish home furnishing company IKEA. IKEA has created and maintained unique market space in a traditional industry by successfully leveraging global forces and creating a completely new set of core competencies unmatched by any of its competitors. IKEA’s central ‘business idea’ derives from its founder’s philosophy of ‘democratic design’. It is elaborated in the company’s vision statement as follows:
The IKEA business idea is to offer a wide range of home furnishings with good design and function at prices so low that as many people as possible will be able to afford them. And still have money left! (11)
Today IKEA’s ‘business idea’ is reflected in its network of over 150 stores, 1800 suppliers, 42 trading service offices and 25 regional distribution centers world-wide. It offers over 10,000 different products universally, which is clear evidence that it has a value proposition which crosses international boundaries, cultures and demography and that it is a company driven by will and vision. (12)
The effective implementation of the IKEA business model relies more upon integrated service management than upon traditional marketing techniques. The IKEA business model not only provides well-designed, cost-effective home furnishings by leveraging principles of global sourcing, self-service and do-it-yourself assembly but

1341
it also aims to make shopping an intimate and enjoyable experience by offering comprehensive product catalogues mailed directly to customers, modular in-store merchandising, customization of options and a range of family-oriented facilities. IKEA is a classic example of a company where service strategy is shaped by a deeply-internalized service culture that stems from the vision which its founder, Ingvar Kamprad, described as “the IKEA way” (13).
In every sense IKEA is a learning organization. It learns from its customers whom it describes as partners; it works with and benefits from world-class collaborators such as Fujitsu and Microsoft; it uses its trading service centers in 33 different countries as vital sources of local market intelligence; but, most of all, it draws on the ideas and input of its global workforce, described as ‘co-workers’, each of whom contributes to the ‘collective effort’, through their involvement in the ‘entire process’ – from market research, product development and production, right through to customer service and sales.
The key descriptors for the IKEA system are world-class design, global production and logistics, value-adding processes, total flexibility, employee empowerment and knowledge of the customer. It is the total customer value package – a fully integrated business model – which is the real innovation, rather than any particular aspect of strategy, product design or service delivery. It has been pointed out that to focus on IKEA’s low costs and low prices are to miss the true significance of the company’s business innovation.
Nevertheless, despite the universality of its basic value proposition, IKEA learned only gradually – and from bitter experience – the importance of adapting to local market preferences and conditions. Thus, for example, its parochial assumption that American consumers would not require home deliveries proved false. Similarly, failure to research the space limitations of a typical Japanese house or apartment, meant that most standard IKEA furniture items were far too large and were therefore reluctantly rejected by many shoppers in Japan. (14) IKEA demonstrates the importance and power of designing the organization around the customer. Instead of the traditional introverted hierarchy of management functions and reporting relationships, it concentrates on the management of knowledge, relationships, processes and competencies in order to keep inventing new and better sources of value to its customers. This case highlights the critical inter-play between the management and creation of knowledge, on the one hand, and a corporate culture which encourages and supports learning on the other. (15) Infosys Technologies Infosys Technologies is another strongly customer-centric company. In a well-developed learning organization, leaders see themselves primarily as mentors - developing, empowering and supporting talented people. At Infosys technologies, for example, the CEO, Narayana Murthy, describes himself as ‘Chief Mentor’. Over the past twenty-five years Infosys has become a world leader in providing consulting and IT services by pursuing a strategy of ‘innovation with speed and imagination’. It has been successful largely because of its recognition that excellence in innovation goes far beyond the possession of IT capability. Core competence in innovation requires very special management and leadership processes. Within a generation, Infosys has become India’s best-known and most-trusted brand in the global market. Its world-wide reputation for serving its software outsourcing clients with exceptional expertise, responsiveness and integrity is unmatched. According to Murthy, his company’s growth has been largely due to management’s ability to learn how ‘to manage rapid growth’ and, at the same time ‘to keep the soul of a small organization in the body of a large one’.
According to Dr. V.P. Kochikar, the Principal Knowledge Management Officer at Infosys, effective KM cannot be achieved apart from ‘significant process, mindset and culture change’. In the case of Infosys, this has been achieved by putting in place an integrated strategic management model emphasizing management and leadership excellence relating to critical corporate capabilities, cross-functional processes and quality standards. With over 10,000 employees world-wide, alliances with companies such as Microsoft, Oracle and Intel, and many clients among the ‘Fortune 500’, Infosys has appointed dedicated ‘thought leadership groups’. They provide the impetus for innovation in designing solutions and delivering service to clients. It is these mentoring groups that shape the knowledge-seeking agenda and, having done so, provide the conceptual frameworks upon which the core competencies of Infosys are built. Kochikar has proposed a five-level staged framework for KM. At Infosys it is known as ‘The Knowledge Management Maturity Model’. (16) It is clear that Infosys has already realized many of the characteristics of levels four and five which include:
� Enterprise-wide knowledge sharing systems � Lowering of organizational boundaries

1342
� Quantification of the benefits of knowledge sharing � Effective feedback loops � A culture of institutionalized knowledge sharing � The organization successfully shapes environmental change by using empowered project teams.
Wide multi-disciplinary involvement in the Infosys ‘ thought leadership groups’ ensures that there is a strong and pervasive culture of scanning, reflecting, learning and teaching throughout the organization. Managers, consultants and specialist staff are simultaneously both teachers and learners, especially in their on-going interactions with alliance partners, customers and supplier networks. The relentless search for knowledge, which can create new competencies as well as strengthen existing ones, is driven at every level by ambitious stretch goals and performance accountabilities. Which encourage both individuals and groups to seek resources and solutions from outside their current comfort zones and capabilities. INOVACC: A Model of a Learning Organization A number of common themes can be identified from this analysis of corporate success and failure. In order to develop the necessary capabilities of constant renewal and continuous innovation, organizations must first have the capacity to learn from their own experience as well as from the environment around them. What does this imply for organizational design and management?
Just as the environment has changed the strategic imperatives confronting organizations, it has also forced organizations to review their structural architecture in order to place much greater emphasis upon obtaining information creating knowledge and learning new competencies. Drawing on insights from the case studies previously discussed. INOVACC (See Figure1) portrays the organization as a learning and innovation engine rather than as a conventional pyramid of functional, geographic and product units. It is a prototype for a mindset and certainly not a prescription for an organizational structure. As an acronym for an ‘Interactive Network of Value-Adding Core Competencies’, INOVACC represents a dynamic amoeba, constantly transforming itself, open to the world, going out to the world, more resembling a series of integrated concentric circles than any other shape. Designed to optimize its relationship with the environment and connect with all its stakeholders, this new model is a value-adding machine in perpetual motion. Driven by an intelligent business brain (a kind of strategic ‘black-box’), INOVACC operates as an original business concept based upon unique core competencies, which are leveraged by business processes involving project/product teams. The project/product teams are multi-disciplinary, totally customer-focused and constantly drawing on diverse sources of potential knowledge and organizational learning. They are motivated to strive for excellence, share knowledge and collaborate effectively by a reward system designed to recognize both individual and group performance.
INOVACC is not intended to dispense with formal structure or hierarchy but it does clearly subordinate them to the primacy of strategic intent and organizational learning. It expands and strengthens individual and group motivation and accountability for customer-centered, value-adding innovation and reflects the need for an integrated approach to environmental scanning, continuous experimentation and learning from experience. The search for new ways to add value to the customer’s, and the potential customer’s experience is a paramount design principle.

1343
FMBlack BoxSTRATEGIC KNOWLEDGE
MANAGEMENT & DIRECTION
Business P
roce
ss
Incl. Mark
et Feedback
FM
FM
PM PM
The Black Box is the ‘intelligent business core’ or ‘strategic apex’ responsible for Strategy, Knowledge Management and Learning.The Core Business Management includes both functional (FM) and project managers (PM).The Business Process or ‘value chain’ converts strategies into core competencies and added value to the customer(= competitive advantage) and is led by a senior project manager.
<-- Core Competencies produceinnovation & add value toprograms, projects, products etc.,
Delivers Innovation & Added Valueto Customers
Delivers Innovation & Added Valueto Customers
Business Process
Incl. Market Feedback
Market Intelligenceand Input
Market Intelligenceand Input
CORPORATE CULTUREEMPHASIZES CREATIVITY, EXPERIMENTATION &TEAMWORK
FIGURE 1: THE NEW MODEL - INTERACTIVE NETWORK OF VALUE ADDING CORE COMPETENCIES (INOVACC)

1344
The purpose of the Black-Box is to provide strategic leadership: conceptualizing, communicating,
coordinating and developing. The most important roles of top management are to define the customer-centered values, stretch goal and strategy, align people to them and inspire and empower them to make it all happen. In its essence it is an integrated process of teaching, learning and creating, which eventually becomes a pervasive culture, shared and practiced by all of the organization’s stakeholders. Flexibility and adaptability are obvious distinguishing features of INOVACC. The project/product teams are constantly seeking to better align themselves with existing and potential customer bases. As part of the same process, they are also vigorously seeking out and forming networks to increase their knowledge and ability to serve future markets better. It is a dynamic not a static exercise, action rather than academic learning. Raw data, technical information and business knowledge are quickly absorbed into the organization’s individual and collective learning experiences in a culture which is led by, and characterized by, people who are committed to competency-building, experimentation and living in the future. (17) In all of this, the senior managers, in their Black Box capacity, illuminate and uncover the way forward. Although they could be described as teachers, they should not be thought of as traditional classroom teachers. Instead, their role is to stimulate, guide, mentor, influence and empower but, above all, to be tireless in their efforts to provide access to knowledge and new learning opportunities. It will not be easy to recruit managerial leaders like this from among the ranks of typical fast-track functional managers with degrees from traditional business schools. These are not jobs for people whose ambition exceeds their wisdom, whose immaturity preoccupies them with power, status and self-promotion and whose careers have been shaped by cleverly climbing the organizational hierarchy and who are primarily motivated by money. Finding the right people in the first place is the biggest challenge confronting organizations to-day; the second biggest challenge is to keep developing their leadership potential around an unswerving, customer-centered strategic focus. Towards a Learning Culture INOVACC is designed as a mental model to address the alarming findings regarding customer experience which have emerged from the survey and, in addition, draw from the lessons of successful organizations such as IKEA and Infosys. Its practical aim is to embed a deep, strategically-directed learning culture with five equally important and inter-dependent features:
� A top management team with highly developed leadership skills � Close alignment between customer-centered values and corporate goals, strategies and structures � Strategic architecture in place for simultaneously thinking about the future, reflecting on the past and
learning from the environment � Continuous investment in building core competencies by leveraging the organization’s knowledge
and skill base. � Uncompromising emphasis on accountability for performance outcomes
Not surprisingly, organization-wide and life-long learning is a driving philosophy in learning organizations. It applies with equal force at every level. At the corporate level there is a deep understanding of the need for constant re-invention and transformation; even Fortune 500 companies – the biggest and best in the world – only have a life expectancy of less than 40 years. At the group level there is a constant need to build and leverage organizational competencies in order to keep creating innovative new sources of value and at the individual level, personal growth and mastery are seen as ‘an essential cornerstone of the learning organization’.
As Senge has pointed out (18), organizations acquire their institutional learning and core competencies through the accumulation and transfer of individual and team learning. It is therefore incumbent upon top managers in their mentoring capacity, to initiate and support developmental learning projects on a continuing basis. While it is important to provide for both individual and team-based action learning, the strategic value of group projects cannot be under-estimated. There must be a direct connection to, and accountability for corporate performance targets Thus multi-disciplinary teams not only give individuals the opportunity to learn the disciplines of dialogue, reflection and

1345
constructive discussion, but they also provide direct involvement in innovative strategic projects with organization-wide significance and bottom-line outcomes. (19)
Strategy-driven organizations need to monitor and project market trends very closely. They need to be designed to do this effectively. If information is to be selectively gathered, processed and acted upon, an extremely well-constructed strategy process is required, with a clear focus on the strategic goal and the core competencies related to it. At the most basic level, the organization needs a constant flow of quality information relating to customers, suppliers and competitors. From this information it should be developing insights about future industry evolution, related economic and technological trends, the capabilities of competitors and emerging new arenas of opportunity. (20)
In conclusion, the first step towards future market leadership involves a collective commitment by the top management team to a radical new management theory which involves a middle-top-bottom approach rather than top-down or bottom-up. It is important that senior managers see this step as a major shift to a new ‘mental model’ such as INOVACC and ensure that it is presented to employees as a momentous opportunity and a watershed in the history of the organization . References [1] Bennis, Warren (1989), On Becoming a Leader, Addison-Wesley, Reading, Mass. [2] Carroll, Paul (1994). Big Blues. The Unmaking of IBM, Orion Books, London. [3] Drucker, Peter F. (1965), The Practice of Management, Heinemann, London. [4] Dussauge, Pierre and Bernard Garrette (1999). Cooperative Strategy. Competing Successfully through
Strategic Alliances, Wiley, West Sussex. [5] Edvardsson, Bo and Bo Enquist (2002), The IKEA Saga: How Service Culture Drives Service Strategy,
The Services Industry Journal, 22,. 4, October [6] Govindarajan, Vijay and Anil K. Gupta (2001), The Quest for Global Dominance, Jossey-Boss, San
Francisco. [7] Hamel, Gary and C.K. Prahalad (1994), Competing for the Future, Harvard Business School, Boston [8] Hansen, Morten T., Nitin Nohria and Thomas Tierney (1999), What’s Your Strategy for Managing
Knowledge? Harvard Business Review, March-April,. 107-109, 114. [9] Hill, Paul (1973). Towards a New Philosophy of Management. The Company Development Programme of
Shell UK Limited. Gower Press, Essex, England. [10] Hilmer, Frederick and Lex Donaldson (1996). Management Redeemed. The Free Press, Sydney. [11] Kanter, Rosabeth Moss (1983). The Change Masters. Corporate Entrepreneurs at Work. George Allen and
Unwin, London. [12] Kirkpatrick, David (2003), With Tech’s Eclipse, Its Time to Dream Again, Fortune, 3 March, 92. [13] Kochikar, V.P., The Knowledge Management Maturity Model – A Staged Framework for Leveraging
Knowledge, Infosys Technologies Website. [14] Meyer, Christopher and Andre Schwager (2007). Understanding Customer Experience, Harvard Business
Review, Feb., 117-126. [15] Nomaka, Ikujiro, Hirotaka Takeuchi, Hiro Takeuchi (1995), The Knowledge-Creating Company: How
Japanese Companies Create the Dynamics of Innovation. Oxford University Press, Oxford.
Contact author for complete list of references. End Notes
1. Drucker, 52 2. Hill, 51-60, 195 3. Peters and Waterman, 156-9

1346
4. Moss Kanter, 28-30 5. Hilmer and Donaldson, x-xi, 8-9 6. Meyer and Schwager, 118 7. Drucker, 37 8. Carroll, 341-6 9. Hansen, Nohria and Tierney, 107-9, 114 10. Dussauge and Garrette, passim 11. Edvardsson and Enquist, 153-186 12. Tellis and Golder, 47, 52-3, 139, 142 13. Edvardsson and Enquist, ibid 14. Norman and Ramiriz, 65 15. Govindarajan and Gupta, 113-4 16. Kochikar, passim 17. Hamel and Prahalad, passim 18. Senge, 7, 236-7 19. Kirkpatrick, 92 20. Schwartz, 32-4 21. Bennis, 95
Special Note: This research builds upon and extends a study published in Nankervis, Alan, Yuki Miyamoto, Ruth Taylor and John Milton-Smith (2006). Managing Services, Cambridge University Press, New York.
1347
Managing Marketing Spirit with Organizational Symbolism
Erik Pöntiskoski, [email protected] Joel Hietanen Jaakko Aspara
Henrikki Tikkanen Helsinki School of Economics, Finland
Abstract The purpose of this preliminary study is to begin the conceptualization and research of Marketing Spirit. It is our goal to introduce the concept and justify the need for it regarding contemporary research in organizational culture and the market orientation. Hitherto, the diversity of the field of market orientation has failed to establish any conclusive link between the market orientation of an organization and its performance in the marketplace. We adopt the “organizational symbolism” perspective of organizational culture regarding market orientation as first categorized by Smircich (1983) and later developed further by Deshpande & Webster (1989) and explore the need for a new component such as marketing spirit that could further explain the rel ationship of success in implementing a selected business strategy, market orientation, and business performance. The conceptualization of marketing spirit is carried out with an iterative process of literary review and fieldwork with companies. Research Setting, Goals and Methodology The theoretical foundation of this conference paper lies in the active discussion around the market orientation of organizations (Kohli & Jaworski, 1990; Narver & Slater, 1990; Day, 1994; Deshpande & Webster, 1989; Tuominen, Rajala and Möller, 2000). It is our goal to contribute to this discussion and further develop the concept by researching the issue of sustaining and developing a marketing oriented organizational culture in firms. The literary review was formed around the original mapping of research in market orientation and organizational cultures by Deshpande and Webster (1989). We selected some 30 articles quoting them as a reference and naturally added articles and books from other research streams as our knowledge and understanding of the problem grew.
The theory development in this paper is based on an abductive research approach, which is a combination of deductive and inductive research, to which a sequence of qualitative case studies is linked. The aim is to systematically intermix literary reviews for the development of a theoretical framework with empirical fieldwork consisting of case analysis in order to advance the research. The exploratory nature of this study supports our choice of a qualitative research approach. Within qualitative research we use a cultural approach (Moisander & Valtonen, 2006) as a means of understanding and investigating the dynamics between institutions and (organizational) social action. This combines interviews, reading various business texts and observation. The aim is to understand the mechanism behind how companies adopt a selected business strategy. On an individual level, the aim is understand how people make sense of their work life and act in a certain, hopefully desirable, way.
A first round of in-depth interviews was conducted in Australia and Japan in December 2006. These semi-structured interviews focused on what managers felt to be the driver of their business success and how they attempted to create an organizational culture that would support their business philosophy. The selected four firms had outperformed their competition in their respective markets in terms of growth, profitability, or market share. As they were all in the high-tech industry, we felt safe to assume to that in addition to their high-class technology, they were also examples of successful commercialization and marketing skills in general.

1348
Market Orientation Market orientation refers to the business philosophy where companies strive to understand the markets, both from a customer and competitor perspective, and align their operations in order to serve their customers. (Tuominen, Rajala and Möller, 2004) A market-oriented organization is one where the marketing concept is adopted in all actions (Kohli & Jaworski, 1990). The main argument of market orientation is that companies with higher levels of market orientation should reach better business performance.
The theoretical background of market orientation derives from the marketing concept (Drucker, 1954; McKitterick, 1958). Its main elements are customer orientation, interfunctional coordination, and profitability as seen in the following figure.
Interfunctionalcoordination
Profitability
Customerorientation
FIG.1: THE MARKETING CONCEPT
Customer orientation requires knowledge of customers. This knowledge or market intelligence acts as the
basis for creating value for customers (Narver & Slater, 1990). Organizational decision making is based on market intelligence, which also takes into consideration other exogenous factors, such as competition and regulation, in addition to customer information. These issues cannot be examined only as they are today, but possible future changes must be anticipated (Day & Wensley, 1988; Narver & Slater, 1990).
Customer orientation consists of (a) understanding internal customers’ requirements that affect external customer needs and preferences, (b) obtaining information about external customers’ needs and preferences through internal customers, and (c) creating additional buyer value by increasing internal customer benefits (Mohr-Jackson, 1991). Internal customers refer to the company’s own employees. They the actual creators of a firm’s offering and thus the producers of customer satisfaction Better customer service can be reached through clear and open communication of corporate values, norms and expected behaviors. This includes guidelines, process descriptions, and measurement of performance. The satisfaction that internal customers get from their work transfers through the organization finally producing better satisfaction among external customers. In market orientation employees are empowered to take any actions that may benefit the customer and improve the relationship. Profitability must also be maintained, at least in the long run. Companies value the work and input of personnel involved with serving customers. They can bring valuable information from the frontline of business. (Mohr-Jackson, 1991)
Interfunctional coordination is of great importance, since developing a market orientation requires the efforts of everyone in the organization from top management to employees in all departments and functions – not just marketing. Firstly, different marketing processes must be coordinated. This involves the work of the sales force,

1349
advertising, product management, marketing research, etc people. (Mohr-Jackson, 1991) Secondly, marketing must be coordinated with other organizational functions (Kotler, 1991). Creating superior value for customers requires the efforts of full-time and part-time marketers. It can be achieved when each employee on all organizational levels ask themselves, how do I contribute to excellence in customer relations and to revenue? (Gummesson, 1991) In order for all operations and activities to have synergy, employees must be entirely committed, well-trained, involved and motivated to create value for customers (Mohr-Jackson, 1991).
Naturally, profitability is the goal of any business. It can be seen as the result of market orientation (Kohli & Jaworski, 1990). This is the result of having a business that is customer oriented in the first place. Also, all operations are aligned to serving the customer and creating superior customer value. This is a shared, common goal, of both employees and management. Market Orientation in Organizations By definition, market orientation is “the organization-wide generation of market intelligence pertaining both to current and future customer needs, dissemination of the intelligence across departments, and organization-wide responsiveness to it” (Kohli & Jaworski, 1990). Mohr-Jackson (1991) found that market orientation leads to an improvement in a firm’s performance as a result of improved internal customer satisfaction. This is closely related to how much meaning people find in their work. This finding supports the discoveries of Kohli and Jaworski (1990), where market orientation was found to bring various psychological and social benefits to employees. In practice it can be found in increased employee morale, job satisfaction, organizational commitment, and a sense of pride in being a part of a firm where each individual, team and department are working towards the same goal – superior customer value. (Mohr-Jackson, 1991)
Furthermore, Mohr-Jackson’s interviews provided detailed evidence on positive results from market orientation. It effects several business performance indicators, such as ROI, ROE, productivity, costs, sales, volume, market share, sales growth, profits, and customer satisfaction. From the employee perspective, the research found positive effects on ownership, security, job satisfaction, full participation, involvement, motivation, enthusiasm, empowerment, absenteeism, accidents rate, productivity, and effectiveness. These all have an impact on the bottom line.
Market orientation has two primary schools - the functional and cultural view (Deshpande & Webster, 1989). These two approaches are described in more detail in the following sections. The Functional View on Market Orientation The traditional school of market orientation views business from a functional or structural stance. The focus is on performance and management structures aiming at monitoring and controlling behaviors of employees and business performance. (Deshpande & Webster, 1989). Market orientation comprises of three components: customer orientation, competitor orientation, and interfunctional coordination (Narver & Slater, 1990). Customer orientation is a constant process, where the firm makes every effort to understand both overt and latent customer needs, and aims at creating superior customer value by providing an offering that satisfies these needs. Similarly, the company must put an equal effort in to knowing both current and potential competitors, and spreading this information across the organization. Interfunctional coordination refers to the planned alignment of all organizational resources into working towards the common goal of creating superior value for the customer. It has proven perhaps easier to establish a link between the functional view and business performance, and this topic has been widely researched. The common consensus is that a strong market orientation leads to a better financial result. The Rise of the Cultural View in Market Orientation Deshpande and Webster (1989) defined market orientation as a cultural phenomenon. This cultural perspective refers to more fundamental characteristics of organizations (Kohli & Jaworski, 1990). Corporate culture has been defined as the pattern of shared values and beliefs that help individuals understand organizational functioning and thus provide them norms for behavior in the organization (Deshpande & Webster, 1989) Pettigrew (1979 as cited in Alvesson & Berg, 1992) defined corporate culture as an entity as follows

1350
TABLE 1: THE KEY ELEMENTS OF CULTURAL PHENOMENON
Artifacts: Physical and Visual
Collective Mental Frameworks
and Manifestations:
Sagas& epochs forming Legends
Myths forming Stories Corporate Culture as an entity:
Collective, Clan, Tribe
Collective Action Patterns: Rites, Rituals, Ceremonies,
Celebrations
The collective, clan and tribe act as metaphors trying to capture the essence of corporate culture. Artifacts
can be found physically in architecture and design, or more visually in graphical design such as logos. Furthermore, myths and stories strengthen the collective mental framework of an organization. Legends act as the living history of the firm. Both current and new employees are integrated and more deeply committed to the firm through collective action patters. For example, rites and celebration strengthen these feelings.
In the modern workplace employees are seeking a feeling of meaning and being a part of something larger and important. Naturally, if there is conflict between organizational and individual values, people perform poorly or leave the firm. A strong and shared corporate culture has a proven causal relationship to productivity and profitability. (Jurkiewicz & Giacalone 2004).
A market oriented culture is realized as a mentality or business philosophy that puts the customers’ interests first in everything that a firm does (Deshpande et al. 1993). All organizations are market oriented to some extent and market orientation can be seen as a continuum. In order to be successful and profitable, companies need to serve customers. The level of market orientation in a firm depends on how central clients and their needs are in the formulation of the company’s strategy and the running of its daily operations. (Harris, 1999) Therefore market orientation or culture is not created – it is not something that a firm has, but rather what it is. It can be managed, guided, steered, or manipulated. Nevertheless, culture is the result of a continuous negotiation between all members of an organization. Its members alter it in an evolutionary way. (Kohli & Jaworski, 1990; Narver & Slater, 1990; Harris & Ogbonna, 1999). As we see it, managers can encourage certain kind of behavior.
Developing market orientation centers on the management’s ability to steer the culture and work climate into a certain direction. Research has shown that it is a rather cumbersome task and market orientation cannot be easily implemented in any time and place. (Narver & Slater, 1998) It can be argued, that the failure or success of business is defined by the implementation of selected strategy, not in its selection. So it is all about people and what they do. (Mohr-Jackson, 1991) A research gap lies in the implementation of customer orientation in firms. (Kennedy et al., 2003)

1351
Sharedvalues
Norms forbehavior
Artifacts and symbolism
Behavior
FIG. 2: A FRAMEWORK FOR MARKET ORIENTED ORGANIZATIONAL CULTURE
The figure above presents a conceptualization of a market oriented organizational culture by Homburg &
Pflesser (2000). This framework is based on the work by Schein (1992) in the field of organizational culture. The four separate, but interrelated elements are shared basic values, behavioral norms, artifacts (and symbolism), and behaviors.
Values can be further described as “a conception, explicit or implicit, distinctive of an individual or characteristic of a group, of the desirable which influences the selection from available modes, means and ends of an action” (Kluckhohn, 1951; cf. Homburg & Pflesser, 2000). Norms are more specific and have more relevance for the members of the organization in guiding their behavior. Values act as the basis of the development of these norms that legitimize behavior in the organization defining expectations about behavior and its results. Artifacts include stories, arrangements, rituals and language that are created by an organization. They have strong symbolic meaning. Behaviors refer to organizational behavior patterns with an instrumental function. (Homburg & Pflesser, 2000). In that sense they relate to daily work routines and processes that manifest the values and norms of a firm.
The three levels differ by the degree of visibility, which high in the case of market-oriented behaviors and artifacts. In the case of norms visibility is medium, and low in the case of shared basic values (Schein, 1992). Deshpande’s 5 Types of Market Orientation To further elaborate on the categorizations of organizational culture first introduced by Smircich (1983) and later developed and utilized for the furthering of research in the field of organizational market orientation, explanations of the various perspectives are in order. Chronologically the locus of culture in an organization has migrated from being seen as an independent variable which could therefore be independently and directly affected by management intervention to being seen as a metaphor of the organization itself therefore assuming a more embedded and foundational organizational phenomenon which changes in an evolutionary sense as members of the organization gradually alter their behavior.
Degree of Visibility
Low
High

1352
The dichotomy of organizational culture paradigms as adopted from Deshpande & Webster (1989) is as follows. The “functionalist view” encompasses the first two perspectives of organizational culture: the comparative management and contingency management paradigms. The perspectives are “functionalist” because they view the culture as an independent variable, the former as exogenous and the latter as endogenous to the organization. Even as the locus of the culture varies from external to internal, both perspectives hold that culture can be observed and modified as a singular entity extractable form the whole of the organization.
The “cultural view” encompasses the three perspectives which treat the culture of the organization as a metaphor of the organization itself. These perspectives are organizational cognition, organizational symbolism, and structural/psychodynamic perspective. The first views the culture of the organization as a metaphor for organizational knowledge systems. The behavior of these systems is guided by shared “rules” that the members adopt. In other words the organization (now analogous to culture) can be guided by affecting how the members perceive the rules. The second perspective, organizational symbolism, adds a layer of complexity to how culture manifests. According to it, culture is seen as a metaphor for shared symbols and meanings. Therefore, the culture manifests in artifacts of the organization. These include such phenomena as stories, rituals, legends, ceremonies, and celebrations occurring in the organizational context. The way these artifacts manifest guide the values, norms and behavior of the members of the organization. The last perspective, the structural/psychodynamic perspective views the culture as the structural patterns that link the unconscious human mind with behavioral manifestations in social arrangements. This elevates the idea of the organization into a form of human expression rather than purposeful instruments. (Deshpande & Webster, 1989)
In this study we adopt the organizational symbolism perspective of the “cultural view”. In their study, Homburg & Pflesser (2000) concluded that artifacts were the sole direct drivers of the behavior of the members of an organization. If these artifacts contained market oriented content they would drive market oriented behavior. It was unclear however, would this behavior contribute to actual business performance. We wish to introduce the concept of MS that could develop to become a component of the organizational culture. It could be conveyed to the members of the organization through appropriate artifacts to aid in the transformation of market oriented behavior to business performance. Issues not Explained by Market Orientation Research regarding the manifestation and the outcomes of market orientation has constituted its own branch for close to 20 years. However, fundamental challenges persist to remain throughout the studies. This seems to be true due to the great degree of fragmentation in research methods, metrics, and even the fundamentals regarding the conceptualization of what market orientation is and how it manifests within an organization. For us, the most relevant issue is the inconclusiveness of results of studies attempting to establish a connection between an organization’s market orientation and its effects on business performance. Depending on the measures and determinations of the perspective of market orientation has been shown to be an inconclusive, scrappy, unconditioned field, riddled with ”measurement issues” (Deshpnadé & Farley, 1998; Kohli, Jaworski & Kumar, 1993; Narver & Slater, 1990). The assumption that greater market orientation will lead to better financial and market performance has had mixed support, and that the fundamental link between market orientation and performance has yet to be fully explored and supported (Noble, Sinha & Kumar, 2002; Jaworski & Kohli, 1993; Pelham & Wilson, 1995; Han, Kim, Srivastava 1998; Narver & Slater, 1990).
Even as this study must assume a very preliminary form, it is our goal to embark into research to find evidence that the component of marketing spirit exists and could through later studies emerge as what could explain the link of market orientation behavior and the business performance of the organization. Firms with high market orientation can be a financial hit or fiasco, and vice versa.

1353
Marketing Spirit
The term has been generated as a response to clear lack of consensus within the research of market orientation regarding what market orientation constitutes and what its link with business performance is. Furthermore, the focus of research should be in the implementation of market orientation, which is crucial for business success (Kennedy, Goolsby & Arnould, 2003). It is our view that the corporate culture and way of working in a firm should represent the management’s business philosophy. They are a manifestation of what the management sees as crucial for their business success. This business philosophy is presented as the first part of marketing spirit in the following figure. The roots of this business philosophy may lie in market orientation.
Secondly marketing spirit refers to the spirit management of the firm. Business success or failure is dependent on people – how is the selected strategy understood and adopted in the organization, thus becoming a joint way of working and culture. The management tries to actively create an environment that guides the organizational culture towards a certain state. This ideal state should supports business philosophy of the firm and thus steer the behavior of individuals towards this desired direction.
Marketing Spirit
Business Philosophy
Spirit Management
FIG.3: THE ELEMENTS OF MARKETING SPIRIT
The theoretical foundations for our research into business philosophies derive from the marketing concept
(Drucker, 1954), which still today clearly defines the three main pillars of business success: customer orientation, interfunctional coordination, and profitability. Companies exist to serve customers. The most successful firms can even anticipate changes in the market – needs of customers, actions by competitors, and regulators – and create an offering, which provides superior customer value. In order to successfully provide superior customer value, each and every individual, team, department, and function within the firms must be committed to this task. This is achieved through interfunctional coordination. Profitability is a necessity for the continuation of a business. The marketing concept emphasizes profitability through customer relationships in the long run.
The business philosophy of a firm, or rather its management, can be based on the marketing concept and market orientation. Further development of this concept has been done by Aspara, Pöntiskoski and Tikkanen (2007) through the notion of exploration and exploitation on product/technology and market/customer dimensions. The authors argue that it is marketing spirit - a refined market oriented philosophy. Finding the correct balance between dimensions can be the basis of sustained performance as companies are either market-driven or market-driving organizations – or combine elements from both strategies in different dimensions (product/technology and market/customer). Spirit management takes place through values, norms, and organizational symbolism. They

1354
provide the basis for a common understanding of how business should be done. How employees think about customers, each other, and their work.
The outcomes of marketing spirit in a firm can be found in the innovativeness it shows in serving customers. This can be achieved in a caring work environment, which allows employees to flourish. People can find meaning and the feeling of connectedness, being a part of some greater entity, in their work (Jurkiewicz & Giacalone, 2004). Most importantly, employees can and should demand results from their employees. Efficiency together with innovativeness and a caring work environment lead to profitability. This increases the wealth of all members and stakeholders of an organization.
TABLE 2: HOW MARKETING SPIRIT WORKS
MARKETING SPIRIT THE MARKETING CONCEPT TRANSLATED INTO A COMMON
WAY OF WORKING WITH DESIRED OUTCOME
Customer Orientation Selected business philosophy, such as a certain school of MOR
Innovativeness in serving customers
Interfunctional Coordination Spirit management and guiding behavior through values, norms, artifacts and symbolism
Creating a caring work environment where employees can flourish
Profitability Guiding behavior through daily processes, measuring, monitoring, tools, rewarding schemes, etc.
Maintaining efficiency, which leads to growth and increased wealth for all members of the organization
Four interviews with managing directors conducted in Australia and Japan helped us understand the
everyday challenges companies have in maintaining and developing certain kinds of organizational cultures supporting the vision of the managers – their business philosophy regarding how business should be done.
The managers spoke first about their business philosophy and business success. A clear link with market orientation theory and a marketing spirit mentality could be found. The basis of their success was in innovativeness in serving current and future customer needs.
…what we have done is we have identified a niche of the market, which hasn’t been serviced…[so it is] very much a blue ocean product, there was nothing there, which made it easy and difficult because it was a new concept. We had to almost create a new market. Respondent 2 in Australian firm
…it is crossfire, where we discuss ideas a thousand times, some ideas are gone, some ideas remain and survive, and eventually become our new business. Respondent 1 in Japanese firm
The example of the top management was found to be an actively used to tool to encourage certain kind of behavior. Leading with their own example, managers were involved in business development and sales. The interviewees told stories and legends of how managers gave direct sales leads to sales team members or encouraged employees to be proactive in thinking about new ways to make money. This could happen through existing contacts or coming up with new clients or services.
…every single managing director on the board is always trying to be creative in terms of clients, business models, products, how we should carry out our business…if I can spear my time for introducing business to the sales and marketing team…to create new business beyond our existing contacts. Respondent 1 in Japanese firm They really push you…you are out there, you can get involved. The managing director [brings] a newspaper article, drops it on your desk and says “go out there and make money from it”. It really encourages you to really be proactive. Respondent 2 in Australian firm

1355
In Japanese firms, managers were contemplating the benefits of traditional Japanese or more international management styles and structures. A clear emphasis was on a self-confident attitude towards work, getting people out on the market place and talking to existing as well as potential customers. Regarding sales, managers wanted their employees to understand that business is not something that should be taken personally. Rejection from clients doesn’t mean that you are incapable.
Our reward structure or promotions were based on very traditional Japanese values, which means the company regarded seniority as the most important factor…now we regard the experience and quality of work, discipline and punctuality, all those things, as very important factors when evaluating an individual. Respondent 1 in Japanese firm Until now they [employees] have been more like inward type of people rather than outward types. I would like them to become more sociable, outgoing, talk to everybody, don’t be shy, this is just business, [It is] strictly a professional thing not personal, just go ahead, and don’t be afraid of making mistakes because people make mistakes. Respondent 1 in Japanese firm
In respondent firms, sustaining and developing the organizational culture was an on-going process involving both top management and employees. Managers didn’t even expect their employees to remember all the core values of the firm. It was seen more as something that provided a framework for how work should be conducted. Especially in the Australian firms the empowerment of employees involved directly with clients was seen as important. The everyday contacts – discussions & telling stories - between employees and open communication regarding business goals and expected ways of working were considered important. They provided the examples that inexperienced or new employees could follow. They were found useful also for teaching existing employees what kind of behavior managers expect from them. This was backed with actually quite simple tools, such as CRM software and process descriptions. Joining values, norms, and artifacts with everyday processes and ways of working were found to be most effective.
…trying to produce the mission statement quite recently and a set of core values…trying to create alignment…I had a sample and put out …but the mission statement is actually more a goal…I suppose we have core values…but some people think differently [and it is about understanding] what we should be doing with the customers. I think it is becoming more and more important as we grow to say where we are going. Then look at everyone’s activities and say “Well you are not doing that. I’ll tell you what to do”, rather “if you want to deal with customers that way, it is your responsibility”. We have our values and everyone has the frames on how we work with our customers. Respondent 2 in Australian firm …one thing we have done really well is mouth-to-mouth sharing; we are a very open firm. For example, any employee can go the files, open it up and see a customer’s data. [We share] all exiting opportunities in just plain email, “Went to see this firm and they are interested in this and this”. “I heard this in the market” and so on. Then we have several internal systems just to help people manage their business…basic CRM and issue tracking systems. Respondent 2 in Australian firm Finally, the respondents were asked to describe what they considered marketing spirit to be. This was the
first time the term was mentioned in any interview and the interviewer had not defined the term in advance. The respondents associated it with understanding customers’ current and future needs – being in touch with the market. At this point, the concept of interfunctional coordination finally arose. Marketing spirit was seen as a sales orientation in a firm focusing more on the marketing and sales functions. Managers didn’t consider it a top level attitude towards business and how it should be run in general.
Marketing spirit? You can probably make things better with the customers, something that the customers are using, best solution for them and we could probably provide a better solution, better ideas from them...You get to know what people need, and if you understand that you can start expanding your mind [regarding] what sort of service we could possibly provide them to be more competitive than others or they would be willing to pay more for a service.

1356
Respondent 1 in Japanese firm …that the driver of the business would be active promotion, trusting the business world…in some
cases the development people could sit in [meetings with clients], because they are actually doing the work, listening to the customers....marketing spirit would be a kind of passionate desire to spread your products or services throughout the market. Respondent 2 in Australian firm
Sustaining and Developing Marketing Spirit We subscribe to the view that market orientation (Harris, 1999) and similarly marketing spirit can be viewed as a continuum. Thus managers should consider how they can sustain or develop marketing spirit in their organizations. It is our view that this not differ from other kinds of organizational development projects. However, there are considerable barriers to organizational development, and it can be said that the implementation of any selected strategy is the key to business success. (Mohr-Jackson, 1991) All organizational members must understand the implications and complexities of any selected orientation in a firm. They must believe in its worth and be committed to the selected strategy as a priority for the organization. (Harris, 1999)
Values
Norms
DesiredOrganizational
Behavior
Artifacts
Performance
?
FIG 4: A SIMPLIFIED MODEL OF FINDINGS ADAPTED FROM HOMBURG & PFLESSER (2000)
Content of artifacts define what organizational behavior is. Artifacts are affected directly by values and
norms. Artifacts were found to be the sole direct driver of behavior. Current research is not sufficient to justify marketing spirit and performance link.
Marketing spirit, as we define it, certainly is a component arising from the riddles of the cultural perspective of market orientation research. In this preliminary paper we link it as being the manifestation of successful symbolic management, whether incidental or purposeful. Smircich (1983) combines organizational symbolism from its underpinnings in both fields of anthropology and organization theory. The concept combines the anthropologist notion of “culture as a system of shared symbols and meanings” to “organizations are patterns of symbolic discourse. Organization is maintained through symbolic modes such as language that facilitate shared meanings and shared realities.” Furthermore, we, when defining MS, subscribe to her worldview of organizational culture as not something the organization has, but something the organization is (1983). Kohli & Jaworski have a similar outlook as their view of the cultural perspective relates to “the more fundamental characteristics of the organization” (1990). Additionally, as stated, the culture of an organization is not a fungible and cannot be readily changed, but a continuum that alters evolutionarily through the actions of its members (Kohli & Jaworski, 1990;

1357
Narver & Slater, 1990; Harris & Ogbonna, 1999). We follow this mindset in the development of marketing spirit. It is a component of the organizational culture in an organization and its evolution is most readily affected by communicating it through the tangible manifestations of organizational symbolism.
In a way, marketing spirit is the “drive” that the individuals of an organization exhibit in their actions. The manifestations of organizational symbolism are multiform, but they all contribute as integrators of the culture. As Pfeffer puts it (1981):
Organizations are viewed as systems of shared meanings and beliefs, in which critical administrative activity involves the construction and maintenance of belief systems which are continued compliance, commitment, and positive affect on the part of participants regardless of how they fare in the contest for resources. Language, symbolism, and ritual are important in this management activity which is effective in part because members find it difficult to precisely assess what they are obtaining from the organization.
Other studies have also concentrated in the symbolic aspects of an organization and their relation to organizational outcomes such as turnover, absenteeism, and commitment (Meyer, 1981; Kreps, 1981; Martin & Powers, 1983). This research strand argues that cultural artifacts, including the actions of management itself are powerful means of communication through symbols. They can build organizational commitment, rationalize the members’ activity, motivate members and facilitate socialization (Smircich, 1983). When successful, culture can even facilitate the generation of commitment to something larger than the self, and it can also guide and shape behavior (Meyer, 1981; Pfeffer, 1981; Peters & Waterman, 1982). When culture manifests in the individual actions of employees that have such characteristics as the expanded meaning and shared belief for the advancement of the organizations faring they exhibit spirit, when these actions take the manifest in ways of the cultural school of market orientation, they are marketing spirit or succinctly what makes the market orientation go. The evolution of this component of the organizational culture can be (at least subtly) affected by symbolic management, or the ways how organizational artifacts are exhibited or promoted within the organization.
Concluding Remarks and Suggestions for Further Research
As this study is the founding foray into what we hope to later emerge as what we call marketing spirit, it is still early to elaborate on the possible results in concrete. However, we do feel there to be a need for furthering the research in the field of market orientation, especially as the challenges in the predictive power in terms of company business performance seems compelling. We chose to adapt the organizational symbolism perspective due to its concentrating in the organizational culture as a fundamental element of the organization and because it better allows for the future testing of the implications of marketing spirit (Deshpnade & Webster, 1989). In accordance with organizational symbolism, it is our view, that meaning laden artifacts can encourage behavior in accordance with the meaning contained in the artifact (Smircich, 1983; Deshpande & Webster, 1989; Homburg & Pflesser, 2000). However, this behavior was not concluded to translate into business performance (Homburg & Pflesser, 2000). Marketing spirit, through further inquiry could emerge as the missing component not captured by the metrics of market orientation alone. It could also be fostered by appropriate artifacts to encourage marketing oriented behavior with the needed “drive” to better explain and predict business performance in the marketplace. Further research will include more work on the conceptualization of the concept and both qualitative and quantitative studies.

1358
References
[1] Aspara, J., Pöntiskoski, E. & Tikkanen, H. (2007). Marketing Spirit: Exploration and Exploitation on Two Dimensions. International Conference on Business and Information, July 11-13, 2007 Tokyo, Japan.
[2] Day, G.S. & Wensley, R. (1988). Assessing Advantage: A framework for diagnosing competitive advantage, Journal of Marketing
[3] Day, George S. (1994). The Capabilities of Market-Driven Organizations. Journal of Marketing, 58 (October), 37-52.
[4] Deshpande, R. & Webster, F. (1989). Organizational Culture and Marketing: Defining the Research Agenda. Journal of Marketing, 53 (January), 3-15.
[5] Deshpande, R., Farley, J. & Webster, Frederick E. Jr. (1993). Corporate Culture, Customer Orientation, and Innovativeness in Japanese Firms: A Quadrad Analysis. Journal of Marketing, Vol. 57 (January 1993), 23-27.
[6] Drucker, P. F. (1954). The Practice of Management. New York: Harper & Row. [7] Gummesson, E. (1991). Marketing-orientation Revisited: The Crucial Role of the Part-time Marketer.
European Journal of Marketing, Vol. 25 Issue 2, 1991, p60-75. [8] Han, J., Kim N., Srivastava, R. (1998). Market Orientation and Organizational Performance: Is Innovation
a Missing Link?, Journal of Marketing, Vol. 62, No. 4, 30-45. [9] Harris, C.L. & Ogbonna, E. (1999), Developing A Market Orientated Culture: A Critical Evaluation.
Journal of Management Studies, Vol. 32 (2), 177-196. [10] Harris, Lloyd C. (1999). Barriers to Developing Market Orientation. Journal of Applied Management
Studies, Vol. 8., No. 1, 1999. [11] Homburg, C. & Pflesser, C. (2000). Multiple Layer Model of Market Oriented Organizational Culture:
Measurement Issues and Performance Outcomes. Journal of Marketing Research, Vol. 37, 449-462. [12] Jaworski, B.J. & Kohli A.J. (1993), Market Orientation: Antecedents and Consequences. Journal of
Marketing, Vol. 57, No. 3, 53-70. [13] Jurkiewicz, Carole L. & Giacalone, Robert A. (2004). A Values Framework for Measuring the Impact of
Workplace Spirituality on Organizational Performance, Journal of Business Ethics, Vol. 49, Iss. 2, pg. 129. [14] Kennedy, K.N., Goolsby, J.R. & Arnould, E.J. (2003). Implementing a Customer Orientation: Extension of
Theory and Application. Journal of Marketing, Vol. 67 (October 2003), 67-81. [15] Kohli, A.J. & Jaworski, B.J. (1990). Market Orientation: The Construct, Research Propositions and
Managerial Implications. Journal of Marketing, vol. 54 (2), 1-18. Contact author for the full list of references.

1359
Consumer Resistance by Ordinary People: the Experience of the Italian Gruppi di Acquisto Solidale (Solidal Buying Groups)
Federico Brunetti, [email protected]
Elena Giaretta, [email protected] Università degli Studi di Verona, Italy
Abstract Consumer resistance is a subject which has not received a great deal of attention in the marketing literature. Various forms of consumer resistance practices are however observable in many countries. They vary in many respects, but may all be regarded as forms of behaviour that are essentially unconventional. Interestingly enough, in recent years Italy has been the cradle of a particular type of consumer resistance, in the form of the “Solidal Buying Groups” (SBG). Their main idea is to organize collective purchasing of consumer goods, based on the key principles of fairness and solidarity. This paper aims to present this experience on the basis of an empirical study carried out in 2005. The key point is that SBGs represent a unique form of consumer resistance through the behaviour of ordinary people, and a clear example of the “gift economy” in practice. Introduction: Consumer Resistance Naturally the buying attitudes and approach of different consumers vary widely. Purchasing choices, both in quantitative and qualitative terms, are not determined by purely, so-to-speak utilitarian or objective factors, but also by the space and importance goods and services occupy in the individual’s own life. Consumer spending is thus not only a product of a rational assessment of costs and benefits. Evaluations are also made that are not always outwardly visible and might indeed not even operate at the conscious level. To categorise schematically what is in reality a continuum, consumption can be viewed as positive, neutral or negative activity. There are those consumers who view the consumption of goods and services favourably and associate it with increasing prosperity, enhanced lifestyles and part of a satisfying and gratifying process. This group is probably still probably represents the majority of consumers. These have no problems, unease or hesitation of any kind in relation to consumption. Their slogan is “buying and consuming is great”. Their relationship with the goods themselves, the symbolic aspects of the brand and the practical business of shopping is positive and relaxed. There are then those consumers for whom consumption is a means to an end, a process that aims to meet the “technical” needs of living. It does not play such an important role as it does for the previous group. Those in this group have a disenchanted view of consumption. That is not of course to see that there may not be pleasure involved in the purchase of certain objects or, quite the contrary, but there is also an awareness of the more controversial aspects of consumption or consumerism. There may not however be any significant mental or emotional investment in these aspects. Finally there are those consumers who see consumption as a damaging process or, in other words, have a negative judgment of the apparatus that has been built up over time to satisfy people’s consumer needs. The object of their criticism is the logic behind such apparatus and its resulting manifestations. It should be noted that criticism of materialism and consumerism are certainly nothing new. It is also not the first time that there have been attempts to set up buyers’ groups, of varying size, aimed at defending the consumer from the sellers’ power by grouping together for greater contractual power. On the one hand, however, criticisms of a society based more and more on the possession of material things came mainly from intellectual and cultural elite. Such criticisms thus tended to circulate within the confines of an internal, if heated, debate that did not greatly affect the conduct of the mass of consumers. On the other hand all forms of consumer of solidarity or cooperative action that developed over time primarily sought to penalise the objects of criticism, without addressing the market’s general economic organisation. This paper deals with more recent forms of resistance instigated by consumers, especially the typically Italian form that seems to us of some importance, as represented by the Gruppi di Acquisto Solidale or “solidal

1360
buying groups” (SBGs). Consumer resistance may naturally assume a great many different forms, operating with varying degrees of intensity, of involvement and of effectiveness. Attention is at this point be drawn to a number of different initiatives at the heart of society or to persons coming together to form groups that may be regarded as, to a greater or lesser, extent as stable and structured. Each is different from the other but each feels it has had enough of the pressures exerted by business. Some groups are and some are not driven by ideological aims.
These are, in the opinion of the authors, highly interesting phenomena, even though not necessarily from a quantitative point of view. Despite the relatively modest scale, they should not be underestimated or overlooked either by academics or by the business community itself since they are indicative of a climate change that is taking place. It also represents a splitting up of the relationships of consumers with the world of goods. The list that follows is deliberately limited to those groups that relate directly to material objects, their purchase, their use and their disposal. It does not for example include the numerous movements that concentrate on the effects of publicity and business communication in general or other initiatives described in the literature, such as the Burning Man Festival (Kozinets, 2002), the online community (Hemetsberger, 2006) and the bookcrossing (Dalli, Corciolani). The list is also almost certainly incomplete insofar as initiatives are often limited in scope or short-lived and the list also purports to provide examples and not detailed analysis:
a. Freecycle; b. Dumpster Diving; c. Yo Mango; d. Spontis.
Freecycle Freecycle, which brings together the worlds “recycle” and “free”, is a sort of international federation of communities of persons that intend to reduce waste and believe in the re-use of any materials and objects. The web site www.freecycle.org tells us that this network was formed spontaneously in the United States in 2003 and memberships are purely voluntary and free. The individual local communities are run by volunteers and make up parts of a global network that has now spread all over the world. Freecycle works like this:- anyone wishing to literally donate a “second life” to an object he or she owns puts an ad online and anyone who wants to own it responds. This process may work in reverse where someone seeks an object he or she wishes to acquire. The only rules are that what is offered and exchanged is free, legal and suitable for all ages. This is in our view yet another interesting use of the Internet, which obviously greatly increases the potential of the concept and is a particularly intelligent and positive way of making a contribution to the environment, making use of the logic of the gift. In fact the mission of the movement is “to build a worldwide gifting movement that reduces waste, saves precious resources & eases the burden on our landfills while enabling our members to benefit from the strength of a larger community”. The absence of any form of financial consideration means that only those who are really have an ideal and shared interest in the environment enter the cycle and ensures the maintenance over time of the spirit of generosity that is essential to the survival of this type of initiative. Dumpster Diving Dumpster Diving is a broad term that brings together individual and group conduct aimed at finding the necessities for living in waste. According to the supporters of this action, there are enough useful things, food and other goods, to live on quite adequately, even if obviously to a standard of living not exactly in line with what is commonly regarded as normal. The group benefits its users with a whole range of advice and tips on how to make such activity more effective and less risky. No crimes are committed in dumpster diving as the only property taken is that which has been thrown away by others. This is tolerated by some and annoys others. There is an ecological aspect to the activity as well as an implicit attack on consumer society and a somewhat anarchic spirit of those wishing to be entirely self-sufficient without actually working. It is also a kind of game, where the players are involved in a sort of treasure hunt. Yo Mango Mango is the brand name for a popular Spanish retail clothing chain. In street slang “yo mango” means “I steal”: the Yo Mango movement offers garments specially made to encourage shoplifting. The essential aim is not however to incite theft as such, also because often the actions are symbolic and stolen goods are subsequently returned, perhaps

1361
to a different sales outlet. The main objective is to promote an alternative lifestyle and an attitude that would have it that happiness is not something to be found in material objects, not something that can be bought. The site www.yomango.net gives a complete overview of Yo Mango, which is presented as an open and complex collection of experiences, a brand that can be applied to any action, initiative, behaviour or thought inspired by the a rejection of private property and capitalist culture. With respect to the previous examples, this movement is more markedly antagonistic and, despite its actual declarations, justifications and suggestions, sometimes spills over into truly unlawful actions. Spontis There is a band of people with this name in Germany that turn up at downtown supermarkets and restaurants dressed as cartoon superheroes armed with knives and guns and who then steal products, preferably luxury foods, that are then distributed to poor people in the suburban districts of the town. The parallel with the legend of Robin Hood is obvious and in this case it is clear that the final action, though still not especially widespread, is symbolic in nature. Such actions have gone strangely unpunished, since the actions are not for profit and what once again emerges is an effort to find bizarre, non-conformist, extravagant and creative means of expressing the rejection of certain lifestyles. In the last few years consumer resistance has become of increasing interest to the academic world, though this attention has been mainly in the field of anthropology and less in that of marketing (Dobscha, 1998). Depending on the case, interest has been focussed on various aspects of the phenomenon, with a number of attempts being made to define and classify it (Peñaloza, Price, 1993; Fournier, 1998; de Luca, 2006). No real consensus has however yet been reached. One of the main areas of agreement regards just this variety of forms that consumer resistance takes, as well as the advisability of keeping “multiple conversations” open, as regards Consumer Culture Theory and hence consumer resistance – (Arnould, Thompson, 2005). Consumer resistance has thus been considered in terms of the day to day behaviour of the individual (Peñaloza, Price, 1993), as group action through boycotts and as the search for alternative providers (Herrmann, 1993), as the rejection of specific product or brand (Hogg, Banister, 2001) or as opposition in general terms to market culture, either as straight opposition to the market or as conduct in a dialectical relationship with the market while partially integrating with it (Peñaloza, Price, 1993; Carducci, 2006; Hemetsberger, 2006; Dalli, Coriolani). Some have argued that consumer resistance is not “destructive” and that it represents the emancipation of the consumer, stating that it “is actually a form of market-sanctioned cultural experimentation through which the market rejuvenates itself” (Holt, 2002: 89). It has also been affirmed that consumer movements have in fact transformed mainstream consumers from those who benefit from their actions into their adversaries (Kozinets, Handelman, 2004). Albeit from inevitably and even substantially differing viewpoints, the subject of consumer resistance seems of particular interest to studies in marketing and merits further investigation. This can be argued first and foremost because “we cannot consider consumer resistance as an interesting phenomenon marginal to our real concern of understanding those who want to consume. (…) We must understand consumption and resistance as co-constituting discourses that are inextricably linked: to understand one, we must understand discursive practices associated with the other” (Fischer, 2001: 123). Secondly, because it sheds light on the link in the production-distribution-consumption chain that has gained most importance in recent times, that is to say consumption. Marketing by business has, on the other hand, paid still less attention to these phenomena, although there are signs of a growing awareness of the issues of environmental, social and ethical aspects in general. It is not difficult to comprehend why most companies’ focus is on consumers rather than those who, for various reasons and in various ways, oppose consumption itself. Almost by definition they do not represent an particularly important target in marketing terms, though some enterprises have sought to turn the “opposition”, the “rebels” and the “resistance” into a distinct market segment worthy of a dedicated marketing mix (Rumbo, 2002). Although from the point of view of business such attitudes are not without certain logic, to turn the adversaries into customers would seem in the end to be a short term response rather than actually settling the issue. It would be desirable to see a more substantial rethink on the part of business to their approach to the market by sincerely embracing the logic of affiliation. It cannot however be denied that the actual and general application of such an approach will encounter numerous difficulties and obstacles in the current fiercely competitive market place aimed at obtaining short term performance.

1362
All forms of consumer resistance can be roughly interpreted at “folk” expressions, akin to the rebellious and provocative movements of the sixties. The attractions of an alternative lifestyle, non-conformity and action for effect, are sometimes more important than the actual substantial reasons for the action [1]. However fascinating and however powerful the symbolic impact, and whatever degree of reasonableness may or may not be attributed to these phenomena, it is unlikely that such conduct would have the strength to subvert a production, economic and social system that has been built up over what is now a long period. These are, furthermore, partial trends that will never regard all consumers. It is a well known fact that markets are made of individuals that are all different and that any segmentation is necessarily an approximate art. There will always therefore be bands of persons who for various reasons will be happy with an overabundance of choice, which enjoy or even intensely desire the search for the latest thing and enjoy shopping at all times and everywhere. There are many such people focussed on material things who love to follow fashion and to express themselves through the things that they possess (Belk, 1988; Hogg, Michell, 1996). In addition to the impact the above movements have at the concrete level, they also have value for the meaning they express. The movements summarily described above are among the most extravagant and radical forms of opposition to an economic and social model that they have for some time regarded as oppressive and wrong. Rather than be swept aside as being of little importance or for being wholly innocuous, they may also be seen as weak signs and small expressions of a growing unease and increasing intolerance of the system, capable over time of effecting much larger changes than might be expected. Less eye-catching, but certainly more important in terms of their growing influence on the current production-distribution-consumption system, are the groups that form the central subject matter of this paper. Giving Meaning to Consumption: the “Solidal Buying Groups” or “Gruppi di Acquisto Solidale” If such an investigation were to be carried out, it would probably be found that there is in every country some form of consumer resistance. It was essential for us to take a more detailed look at the situation of our own country of Italy. We therefore stumbled upon a wholly original phenomenon that seems typical to Italy and curiously confined within its borders, that is to say the Solidal Buying Groups (the SBGs). The idea at the root of these groupings is organise collective purchasing of commonly used products, adopting buying criteria based on principles of justice and social solidarity, the details of which will be explained below.
It is quite clear that the tendency for the consumer, as indeed the manufacturer or the seller, to form associations to remedy positions of contractual disadvantage vis à vis the counterparty is nothing new. These include for example buyers’ groups tout court, consumer co-ops and food buying clubs. In such cases, however, the aims and the decision-making processes have utilitarian and economic aims. The SBG groups on the other hand have an underlying philosophy which goes beyond making savings to embrace a different vision of consumption for that which is characteristic of traditional economics. What is new is the “S of SBG, translated as “solidal”, by which is intended to a crucially ethical and socially responsible aspect. A brief web search reveals the existence of similar groupings, particularly in Latin America [2]. It can also however be seen that these tend to be sporadic, transient and isolated phenomena. The Italian story is unique in terms of the numbers involved and the spread of the movement over the national area.
This phenomenon seems to the authors to be worthy of special study not only because of its extension, since while growing it is still a marginal movement, but also because of its importance and implications in terms of future distribution and production, with all entailed consequences for marketing strategies. The study, the Method and the Principal Results This study was carried out in the month of August 2005 in relation to all of the “solidal” buying groups in Italy, which at that time numbered 207. The interviewees were sent an email questionnaire made of 27 multiple choice questions. The reply rate obtained was 19%. Considering that almost 20% of the interviewees were unable to reply for various reasons (such as lack of an email address, incorrect email address, businesses closed during the summer vacation period etc.), this reply may be considered a quite satisfying redemption rate.

1363
To summarise greatly, the study provided the following profile: • there are in Italy today 287 SBGs variously distributed over the whole of the national area, though
heavily concentrated in the north; • it is a recent phenomenon that nevertheless has its own history with the first SBG arising in
Fidenza in the province of Parma (Northern Italy); • by “contagion”, by “splitting” from already established groups or by the “affiliation” of
organisations in defence of the environment or social centres, or parish facilities, growth has been exponential with a doubling of numbers every two years (Fig 1). The real boom was not however seen until 2001, at which stage 70% of the groups were established. The establishment of the SBG groups in that period was above favoured by the Internet that was then making strides into the Italian family home, encouraging the spread of information about the new forms of consumption as well helping with the actual functioning of such organisations, especially as regards the management of orders. The contradictions and ever more clear signs of crisis in the traditional economic development model certainly also played an important role particular over the last five years;
0
20
40
60
80
100
120
140
160
180
200
220
240
260
280
300
1994 1995 1996 1997 1998 1999 2000 2001 2002 2003 2004 2005 2006
FIG. 1: THE NUMBER OF SOLIDAL PURCHASING GROUPS RECORDED OVER THE YEARS
Source: processing of directly obtained data
• The groups analysed have an average of around twenty families each, involving a total expenditure
of a little fewer than 400 euros each. They are certainly therefore small but they wish to remain so in order to facilitate the relationships and the social entity of the group. While the rather limited budget can be justified by the limited range of goods and the fact that they buy through traditional supply channels;

1364
• From the point of view of the kinds of goods, the phenomenon is currently mainly restricted to convenience foods (Fig. 2), though it may be that in the future other more sophisticated products may be included. There is some movement towards the inclusion of clothing, electricity, natural remedies and telephone and insurance services. The fact is that to try out, test and change is part of their modus operandi, as they have not wish to remain imprisoned within rigid categories. There are indeed at the moment isolated attempts to extend the basic model also in the direction of own-production;
formaggioliodetersivi
pastamiele
fruttaortaggi
risofarinaconserve
marmellatecarne
vinouova
biscottisalumicosmetici
burrolatte
pannolinilegumi
libricaffè
0 5 10 15 20 25 30 35 40
prod
uct
n° of groups buying the product
FIG. 2: THE ASSORTMENT
Source: the authors’ own direct data
• Because it is impossible to cover all family needs with group buying, 45% of the families regularly use other shopping channels such as shops and supermarkets. The rest only occasionally have such recourse to such channels (47%) or even never do so (Fig. 3);
FIG. 3: SUPERMARKET AS A PURCHASING CHANNEL
45%
47%
5% 3%
spesso
saltuariamente
quasi mai
mai
often

1365
Source: the authors’ own direct data
• From the organisational viewpoint, most of the groups (68%) were set up spontaneously and
informally, with no particular type of legal personality, putting their trust simply in a set of internal rules for the group and sharing out their running costs equally between the members who act as equals on a good faith basis [3]. They are generally speaking non-organised organisations where however the enthusiasm of the people involved in a shared project makes up for any management or organisational shortcomings. The organisations walk a narrow line between the strictures of an organisation and the free choice of the individual;
• In terms of their impact on daily life, it would seem that they result in a reduction in time taken over shopping due to the organisational advantages of the division of tasks. Buying as a group is not however an immediate or natural activity. There are some down sides, including the need to schedule one’s purchases over the longer term, to have somewhere to store the goods, to have the time to take part in the choice of suppliers, attend meetings and take part in the purchasing logistics process [4] with the need for a spirit of participation and cooperation on the part of each and every member. These factors may in fact hinder satisfactory participation in the group and make collective buying that even worse than the usual shopping chore.
Alongside these so-to-speak external features, the study also looked at the more intimate aspect of the fundamental motives driving the establishment of the groups. Within a picture containing a variety of choices, experiences and at times quite unique processes, three principal animating principles were identified. These normally co-existed, albeit with different degrees of intensity, within the context of a single group:
• critical consumption (radical or pure GAS’s); • socialisation (relationship-based GAS’s); • savings (market or tout-court GAS’s).
When the group is established with the main aim of participating in critical consumption, we can describe it as a radical or pure SBG.
The critical consumer, in this sense, is one that carefully weighs consumption and considers its economic, environmental, socio-cultural and ethical implications (Centro Nuovo Modello di Sviluppo – New Development Model Centre, 2003). In the specific case it is a matter of making choices of products and manufacturers according to a series of criteria that reflect a more humane view of economics, consisting of various elements including respect for the environment, a return to natural rhythms, solidarity with small producers and with the members of the group, the safeguarding of local culture and traditions and the protection of consumers and workers with a view to controlling the social costs of production. In concrete terms such principles translate into the following choices:
• organic or in any case natural products that are in season and that may be recycled (or with little packaging, as well as being useful (in line with emerging trends of behaviour such as those known as voluntary simplicity (Etzioni, 1998));
• products from small and local businesses that not only supply products that meet the listed requirements but that are also respectful of working conditions.
• the payment of a fair price that assures small producers a decent living that repays the real costs of production and that takes account of the interiorisation of social costs (Panati, Golinelli, 1991);
These choices are aimed at realising in practical terms the concept of solidarity that gives us the “S” of SBG, setting the phenomenon apart from that of other buying groups. The concept is one which extends beyond producers and individual members of the group to embrace a concept almost of moral regeneration applicable to the whole of society.
The social and political spirit that animates the SBGs is a historical characteristic of the movement and is an essential aspect of 80% of the groups interviewed. The ethical connotation of such groups is not however their only important aspect. Each buying group also has a relational aspect that may in fact be predominant, giving

1366
essential to form to what the authors have decided to call the ‘relational SBGs’. In a society in which, even in the face of planet-wide interconnections, it becomes increasingly difficult to establish a community feeling, the solidal buying group has shown itself to be a useful instrument for the purposes of enjoying new experiences as a group. It should be pointed out that the SBGs also set out to stimulate reflection, cultural exchange and information that then goes on to encourage the spread of consumption behaviour based on awareness and proper evaluation of one’s actions. Participants are moved by a desire to share their experience. This frequently gives rise to the establishment of real friendships. The relationship with the producer also ends up by becoming a personal one. Members of the group go to the producer, meet him and study the production methods employed such that they become part of the production process themselves, thereby discouraging any opportunistic intent. In the so-called relational SBGs the relationship of trust built up between manufacturer and buyers overflows into what has been called a “culture of conviviality” (Saroldi, 2001) which has not infrequently also given rise to the encouragement of collective use of products such as cars, domestic appliances and books. The relational nature of the group also emerges in the value attributed to the meeting of members. While these take place on average on a monthly basis, there are groups that meet every week because of the importance they give to the social element [5]; there are on the other hand groups that meet just a few times a year because they are interested only in quality purchases or savings.
In this regard, though the SBG philosophy extends explicitly beyond the mere making of savings, there is a price benefit gained from the shortening of the supply chain and the scale of the purchases themselves. After the introduction of the Euro, the issue of saving money has become important to many families that are forced to consider the more economic aspects of the SBGs (‘market’ SBGs) (regarding only 15% of the groups interviewed, see Fig. 4). This has however gone on to favour the more personalist visions at the heart of the SBGs, including eating healthily and spending little. It remains true that “obtaining reasonable prices that can be afforded by everyone is an important requirement so that anyone can become a member of a solidal buying group, so that it does not become an elitist phenomenon” (Valera, 2005).
43%
15%2%
18%
22%
per comprare prodotti di qualità
per risparmiare
per ridurre i tempi necessari perfare la spesa
per dare la possibilità disopravvivere ai piccoli produttori
altro
FIG. 4: THE REASONS FOR JOINING IN AN SBG Source: the authors’ own direct data
Although the savings are important (see table 1), they are rarely a fundamental factor. If the price were to
be higher than that found at the supermarket the purchase may be made in any case (this was confirmed by 69% of the interviewed groups), especially if a supermarket purchase would be to the detriment of a small producer (Fig. 5).

1367
TABLE 1: SUPERMARKET VS GAS PRICES
PRODUST SUPERMARKET PRICE GAS PRICE DIFFERENCE % 5 kg of spaghetti 8.30 5.64 -32.05 three 340 g tins of tomatoes 2.37 3.21 35.44 2 kg of DOP grana padano cheese – similar to Parmesan
39.60 22.00 -44.44
900 g of fresh robiola cheese 9.00 6.90 -23.33 900 g of Emmental 11.07 7.80 -29.54 5 kg of Carnaroli rice 15.30 9.00 -41.18 5 l of extra-virgin olive oil 72.00 29.50 -59.03 640 g of apricot jam 4.00 4.30 +7.50 640 g of strawberry jam 4.20 4.96 +18.10 640 g of orange marmalade 3.20 4.40 +37.50 810 g of of aubergines in oil 8.97 6.93 -22.74 870 g of artichokes in oil 15.63 12.87 -17.66 1 kg of organic applies 12.45 6.89 -44.66 Transport costs 4% 5.20 +100 TOTAL 214.39 135.24 -36.92%
Source: the authors’ own direct data
3%28%
69%
rinunciamo all'acquisto in gruppo del prodotto
rinunciamo all'acquisto presso quel produttore e ne cerchiamo un altro chepratichi un prezzo inferiore
acquist iamo ugualmente il prodotto perché garantisce un guadagno dignitoso peril produttore
FIG. 5: IF THE PRICES WERE HIGHER THAN SUPERMARKET
Source: the authors’ own direct data
It is thus clear that the common and perhaps hasty description of the movement as a means for obtaining
savings would seem to be reductive and inaccurate in the case of the world of the SBGs. What finally emerges is a highly significant group philosophy where performance, benefits and savings certainly play a part but where the overriding aspects relate to a school of thought and convictions, particular views of the world and consumption choices that are not determined by material choices but are a response to intangible needs. Marginal Notes: from a Show of Resistance to a Push for Change Of the forms of consumer resistance referred to in this paper, special attention has been given to the SBGs and this is for the following reasons. First and foremost this is a new and original phenomenon. It may seem superficially

1368
like any other form of aggregation or cooperation between consumers, but on close examination it can be seen that these SBGs operate on a different level in the following ways: - They membership acts according to the dictates of principles of fairness, justice and solidarity; - They seek to extend their purchasing beyond foodstuffs and into services; - The savings aspect is not paramount. Even with respect to the many forms of consumer resistance there are significant differences that are worth highlighting: - They are the paradigmatic expression of active behaviour on the part of the consumer. The members of these groups engage in concrete action. They are not therefore movements proposing opinions or protest groups that to a greater or lesser manage to reach a public or demonstrations that cease to exist once the point has been made, i.e. forms of voice reaction (Hirschman, 1982). On the contrary, they act in first person committing themselves to a sequence of specific tasks: - not only is this active conduct but amounts even to a complication with respect to habitual buying, as a result of a series of self-imposed restrictions. This seems all the more surprising in that we are living in times when to ask someone to give up some of their time without offering something in return would appear almost to amount to sacrilege and when trends are towards simplification and the reduction of effort and thought (Borgmann, 2000); - they represent a return to a community dimension where this is currently in decline, where social life is organised in such a way as to increasingly lead to the isolation of the individual, even though there are numerous possibilities for online connections between persons; - they do not only respond to material needs (through savings), but also satisfy what could almost be regarded as spiritual needs. In the SBGs, however, the desire to know the history of the products being consumed, to feel a sense of belonging to a group, to improve one’s own life through encounters with other persons, to feel special, to feel free to make one’s own choices (Baccarani, 2001) and to “live one’s life differently” (Censis, 2004) are not so much expressed through the giving up of consumption or through any unwillingness to be sucked in by the allure of modernity, as through a revisiting of the concept of wealth and wellbeing in post-consumerist vein, as measured by the value given to relationships and the search for meaning in one’s actions (Rullani, 2004); - they may be seen as an application of the logic of the so-called gift economy: the individual can, through consumption, not only satisfy his or her legitimate egotistical needs but may also carry out undeniably altruistic actions, especially in relation to the, and this is perhaps the most surprising thing, the producer or manufacturer.
In addition to the above factors that help us understand the framework of the phenomenon, there other implications that should not be overlooked by business when it comes to their market research and their studies of consumer behaviour: - these are not bizarre social expressions but are part of a consolidated paradigm of exchange economics, while nevertheless creating a parallel market falling back on a parallel market through alternative supply, both as regards the type of goods purchased and in terms of the distribution channels engaged; - they are indicators of an individual unease that is not expressed in an extremist or antagonistic form but rather through the normal families in their ordinary daily tasks; - these are not flashes in the pan but are part of an organised phenomenon with what must now be regarded as having life cycles that are not over quickly.
In other words, if they have a lower profile than other forms of protest, they certainly would appear to be more relevant in terms of their influence. They may indeed, in future, be capable of significantly affecting the current production-distribution-consumption system. Naturally, despite the extreme optimism expressed by the majority of the SBGs, it is neither feasible nor even imaginable that we will see a complete revolution where supply is met entirely of small local businesses and demand made up wholly of the SBG system. This is also because for the above-described phenomenon to become more mainstream, not only would mass communication be necessary towards a society that has generally little awareness of its consumption, but also real large-scale “re-education” would be required in relation to buying, which would involve an expenditure in terms of time that would be unthinkable in society that runs at the pace modern society does. All this is quite apart from the material difficulties in expanding the purchasing range. While the mission for moral regeneration of society may be a Utopian dream, the
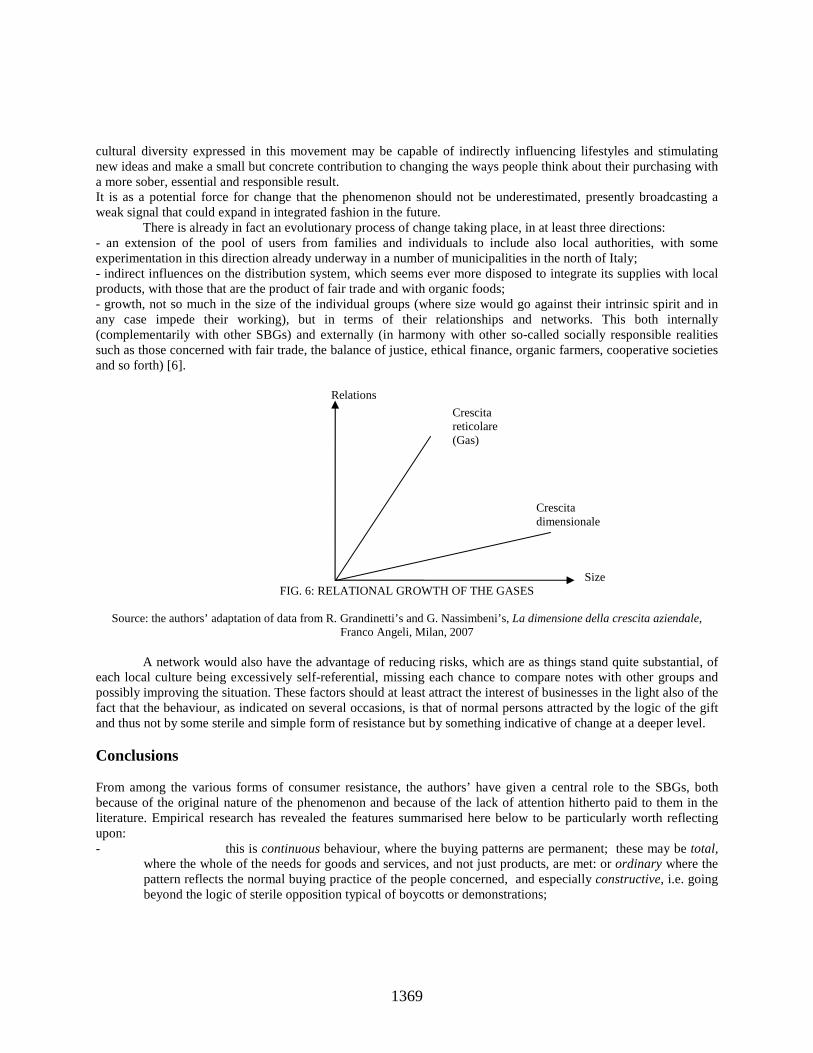
1369
Crescita dimensionale
Crescita reticolare (Gas)
cultural diversity expressed in this movement may be capable of indirectly influencing lifestyles and stimulating new ideas and make a small but concrete contribution to changing the ways people think about their purchasing with a more sober, essential and responsible result. It is as a potential force for change that the phenomenon should not be underestimated, presently broadcasting a weak signal that could expand in integrated fashion in the future.
There is already in fact an evolutionary process of change taking place, in at least three directions: - an extension of the pool of users from families and individuals to include also local authorities, with some experimentation in this direction already underway in a number of municipalities in the north of Italy; - indirect influences on the distribution system, which seems ever more disposed to integrate its supplies with local products, with those that are the product of fair trade and with organic foods; - growth, not so much in the size of the individual groups (where size would go against their intrinsic spirit and in any case impede their working), but in terms of their relationships and networks. This both internally (complementarily with other SBGs) and externally (in harmony with other so-called socially responsible realities such as those concerned with fair trade, the balance of justice, ethical finance, organic farmers, cooperative societies and so forth) [6].
Relations
Size FIG. 6: RELATIONAL GROWTH OF THE GASES
Source: the authors’ adaptation of data from R. Grandinetti’s and G. Nassimbeni’s, La dimensione della crescita aziendale,
Franco Angeli, Milan, 2007
A network would also have the advantage of reducing risks, which are as things stand quite substantial, of each local culture being excessively self-referential, missing each chance to compare notes with other groups and possibly improving the situation. These factors should at least attract the interest of businesses in the light also of the fact that the behaviour, as indicated on several occasions, is that of normal persons attracted by the logic of the gift and thus not by some sterile and simple form of resistance but by something indicative of change at a deeper level. Conclusions From among the various forms of consumer resistance, the authors’ have given a central role to the SBGs, both because of the original nature of the phenomenon and because of the lack of attention hitherto paid to them in the literature. Empirical research has revealed the features summarised here below to be particularly worth reflecting upon: - this is continuous behaviour, where the buying patterns are permanent; these may be total,
where the whole of the needs for goods and services, and not just products, are met: or ordinary where the pattern reflects the normal buying practice of the people concerned, and especially constructive, i.e. going beyond the logic of sterile opposition typical of boycotts or demonstrations;

1370
- it is an organised phenomenon with a life cycle that may no longer be regarded as brief, which creates a parallel system, falling back on supply methods that are different from what is regarded as “normal”, both in relation to the type of goods bought and with regard to the distribution channels. There are clear signs of growth in this area, especially as regards networks, with respect to other phenomena in the so-called socially responsible economy.
Exercising their preference for a clearly alternative model, the SBGs are indeed significant, given that they are increasingly having an impact on the traditional market system, though still for the moment to a limited extent. Studies may be carried out to investigate in further detail the responses given by the production and distribution system to emerging consumer forms such as those considered in this paper.
References
Contact authors for the list of references.
End Notes [1] And perhaps, at the end of the day, such interpretation is partly true in the sense that the enjoyment of provocation, the mischievous attitude and the fun of upsetting traditional mores are certainly not alien to the movements in question. They enjoy being at the heart of a storm that is both of their making and which shapes their being, where practically any individual and collective behaviour is admissible, where the more unorthodox the behaviour the better its chance of finding a place in which to operate. [2] Movements of some interest have also been found in the United States. In particular the Community Agriculture Supported groups are groups of persons who either autonomously or at the initiative of the producer “adopt a farm”. The support is such that, and here lies the main difference from our own SBGs, the members not only benefit from the products, but also bear part of the costs and risks of management. For further information see Cooley J.P., Lass D.A., “Consumer Benefits from community supported agriculture membership”, Review of Agriculture Economics, Vol. 20, n. 1, 1998 and Adam K.L., Community Supported Agriculture, http://attra.ncat.org/attra-pub/csa.html. [3] In other cases the association formula is used (21%) or it is hosted by already existing associations or cooperatives (11%), with great advantages in terms of access and contributions, concessions and facilities, but with however greater bureaucratic strings attached. [4] According to the groups approached, the greatest difficulties for collective buying lying in the logistics: 32% find the business of collective members’ orders particularly laborious. 19% say that they have major problems in finding space to store the goods, 15% in scheduling their own consumption over the longer term and 13% in finding the time required for the attendance of meetings. [5] For 34% of the groups the meetings are seen as an occasion to discuss issues that are dear to the lifestyle of the critical consumer and an opportunity for cultural exchange, while for 15% of the groups these are truly social occasions. [6] The solidal economies network is currently being tested through local “solidal economy district” networks, which as many as 14% of those interviewed said that they were engaged in.

1371
Consumer Receptiveness in the Development of a Holistic Communication Strategy: Trust, Advocacy and Brand Ecology
Antonio Lorenzon, [email protected]
SLOAN School of Management, Boston – MIT, USA Luciano Pilotti, [email protected] Università degli Studi di Milano, Italy
Abstract In a new marketing era where the Push/Pull marketing model has been replaced by the new Trust/Advocacy framework to better relate marketing strategies with consumer behaviour, companies have still problems to identify, measure and evaluate consumer receptiveness and to drive it in the development of an ecological brand communication strategy. Even if brand loyalty is becoming harder and harder to reach, managers are almost blended about brand dislike analysis and “brand ecology”. Communication strategies have to become multi-channel and multi-target to better respond to consumer receptiveness and to allow advertising to shift from infotainment to entertainment and then with the support of an holistic marketing approach to move from entertainment to engagement. Advertising has to create trust and empathy more than purchasing needs, only in this perspective in a growing and growing advertising jam Companies will be able to sustain their Brand identities and equities. The final purpose of this paper is to show the importance of Consumer Receptiveness as key driver in the development of a holistic communication strategy based on multi-channel solutions. Create consumer receptiveness knowledge to better vehicle brand information to customers in a more and more engaged two-ways dialogue. Introduction Since the early nineties some authors as Payne (1995), McKenna (1991), Cross and Smith (1992) discussed about the increasing need to manage relationship building has brought forth a variety of "new generation" marketing approaches-customer-focused, market-driven, outside-in, one-to-one marketing, data-driven marketing, relationship marketing, integrated marketing, and integrated marketing communications.
The increasing importance of communication in marketing is demonstrated by differentiating these “new generation marketing” approaches from traditional and classic ones. Each approach emphasizes two-way communication through better listening to customers and interactivity and the idea that communication before, during, and after transactions can build or destroy important brand relationships (Duncan and Moriarty 1997; McKenna 1991; Peppers and Rogers 1993; Schultz et al. 1993; Zinkhan et al. 1996).
In this article we argue it’s possible to build a competitive advantage into a brand communication strategies looking at the customer behaviour with a “new generation” perspective: considering the reach, the attentiveness, the relevance, the receptiveness and the impact of a brand since during the whole brand communication strategy it will be possible to develop a real innovative holistic plan based on a Trust and Advocacy perspective (Urban, 2005) that offers to the brand image a real competitive advantage in term of awareness, trust and reliability and brand ecology. The paper approach is based both on a critic literature review concerning the increasing customer power, the challenge to use a multichannel communication plan based on a ecological multi ways dialogue between front office and back office.
In their classic paper, Gardner and Levy (1955) wrote that the long-term success of a brand depends on marketers' abilities to select a brand meaning prior to market entry, operationalize the meaning in the form of an image, and maintain the image over time. The fact that several brands have been able to maintain their image for decades supports their position and our perspective. Short-term, market-driven factors such as current consumer needs and competitors are used as a basis for managing the brand's image/position (Aaker and Shansby 1982; Arabie et al. 1981; Keon 1983; Trout and Ries 1979; Urban and Hauser 1980; Wind 1982). Because both positioning and repositioning decisions are based on current

1372
conditions, they are not strategically oriented. In this perspective our objective is to provide a deeper understanding of the holistic communication in an interactive and more and more complex scenario where trust is not anymore a added value but a requirement. Copy and advertising are becoming more and more expensive and the competition stronger and stronger so it becomes necessary to develop holistic communication plans based on the capability of a brand strategic target (or prime prospect) to be reached and to be involved into the brand message. After a critic literature review we found a lot of strategic overviews about these subjects but few indications of possible tactical solution regarding for instance when and where customers are more receptive, how to use multimedia solution to reach engagement or even more important how to apply the concept of Brand Ecology inside a Trust and Advocacy multimedia communication plan. The article is organized to show and to explain all the most important concepts that have to be included in a ecological holistic communication plan. We look first at Consumer Receptiveness and Customers Understanding then at Brand Ecology, Trust and Advocacy and cross media benchmarking and finally at the creation of an ecological holistic communication brand.
Consumer Receptiveness Several scholars have acknowledged that marketers play an important, active role in providing social relationships (Blau 1973; Bradach and Eccles 1989; Granovetter 1985; Kang and Ridgway 1996). Most market transactions contain social interaction elements (Granovetter 1985), and more important, marketers usually try to be nice to their customers (Bradach and Eccles 1989; Granovetter 1985). Furthermore, as relationship marketing has become an increasingly common marketing strategy, the social content of market interactions has increased (Kang and Ridgway 1996). Social exchange theory suggests that, in responding to marketers' friendliness, consumers feel obligated to return the friendly overture (Blau 1973; Kang and Ridgway 1996). This provides the unscrupulous marketer an opportunity to harm consumers financially or emotionally. There are several theoretical explanations that can be used to identify consumers who are more receptive. Social integration and activity theories suggest that consumers' openness to sellers’ may result from a sort of social isolation. Social isolation makes people feel less connected to friends and other support systems and makes them more likely to respond to sellers who pay attention to them (Butler 1968; Friedman 1992; Kang and Ridgway 1996; Phillips and Sternthal 1977). In 1980 Nahemow explained the relationship between social isolation and the ability to persuade, as follows: “Individuals who, by virtue of their social isolation, are not in a position to argue their opinions for the benefits of a Brand with other people ultimately become unsure of their own point of view and are, therefore, highly vulnerable to persuasive communication”. So, as a matter of fact, a nowadays lifestyle that make us spending a lot of time by ourselves push our receptiveness high and helps companies to become more effective with their advertising.
Companies know that and they usually wonder “when and where their consumers are more receptive”. Looking both at the literature and at the market industry it’s possible to assume there isn’t a standard definition of receptiveness. All the models we have analysed are based on the traditional AIDA conceptual scheme for creating advertising and marketing communication messages. According to Kang and Ridgway (1996) starting from AIDA model it’s possible to decline tens of different combinations of consumer receptiveness schemes. Although it’s possible to define several basic steps that can cover all the different solutions in the field of Consumer Inclination to buy the product/service of a specific firm. Some of this aspect can be summarized as: 1. Being exposed to advertising; 2. Attention; 3. Interest; 4. Understanding the content; 5. Relating the content to available knowledge; 6. Acquiring relevant skills; 7. Desire to own/consume; 8. Storing the changed pattern of knowledge/desire; 9. Storing product features; 10. Attitude change; 11. Decision; 12. Purchase; 13. Possible repurchase.
The philosophy of the current big market consumer goods companies is to reach the attentiveness of the consumer with a huge advertising pressure and possibly high quality products. The advertising helps them to support what is called the “first moment of truth” when a consumer decides to buy a product from a seller. Starting from the AIDA model and going through the thirteen steps regarding Consumer Inclination to buy it would be possible to define three different overall scenarios concerning the consumers’ involvement and in everyone it’s possible to define a kind of priority order relating to the three main consumers’ actions on the purchasing process:

1373
- Do (the action of purchase), - Feel and - Learn (about the product). According to the literature on consumer receptiveness and typologies of market (Lee and Soberon-Ferrer 1997; Lord and Kim 1995; McGhee 1983) it’s possible to define two main typologies of Product/Service market: - High Involvement: where consumers are strongly involved in the action of choosing, buying and using a product; - Low Involvement: where consumers are marginally involved in the action of choosing, buying, using a product. Finally looking at several studies (e.g. D. Hyman and J. Shingler, 1999) concerning the relationship between consumer receptiveness and product distinctiveness we can distinguish: - Distinctive Product: when for a consumer it’s easy and immediate to recognise a product, its
peculiarity compare with other product and its possible competitive advantage; - Similar Product: where for consumers it’s hard to distinguish one product attributes to the others’. Looking at the “Do, Feel and Learn” approach together with the “typologies of market” and the “Product Distinctiveness” it could be possible to summarise them in a final scheme where depending on the typology of market and on the product distinctiveness, the three main consumers’ actions on the purchasing process can take a different order:
High Involvement High Involvement Low Involvement Low Involvement Distinctive Products Similar Products Distinctive Products Similar Products 1. Learn 2. Feel 3. Do
1. Do 2. Feel 3. Learn
1. Do 2. Learn 3. Feel
1. Learn 2. Do 3. Feel
FIG. 1 – THE DIFFERENT ORDERS OF THE THREE MAIN CONSUMERS’ ACTIONS ON THE PURCHASING PROCESS - KELLER, K.L. (2003)
This result becomes very significant regarding the “Who”, the “What” and the “How” on a Brand Communication Strategy. When there is an High Involvement Market, as for example Racing Motorbikes, and the Products are very distinctive (Ducati, Honda, Yamaha, etc.) consumers first try to catch as many information as possible, then they try to feel which is the best choice for them and not always it’s the most convenient in term of Cost/Quality (Moschis 1992) and only at the end they decide which motorbike they will buy. On the contrary, when in a High Involved market products are similar (e.g. casual clothes) consumers first but a product, then they feel about the product they bought and finally they start to learn about the product and about competitors.
In a Low Involvement market as Consumer Goods, consumers have the “Feel” action only at the end of the purchase process. When the products are distinctive consumers first buy the “leader” product for their needs and then acquire information about other similar products, when Products are Similar Consumers first learn about products and then they but the most efficient product for their needs. Whether in High Involvement Market the receptiveness of consumer is naturally very high on people that are interested in the product and very low on people that are no-consumers of the product, in Low Involvement market it becomes strategically very important to define when the consumers could be more receptive because the natural interest on consumer goods product for example is usually very low. So, being a company which sells product is a Low Involvement market, it’s common to say that “identifying drivers or situations of high receptivity (in a media sense) will be much more difficult than identifying drivers of strong copy or advertising (in a content sense)”. This is due to the fact that copy drivers work more on a general, basic level while media receptivity is more related to specific consumer groups, situations, etc (Lee and Soberon-Feffer 1997; Lord and Kim 1995).

1374
Receptiveness Driving Factors Several authors, especially Bradach and Eccles in 1989 and Granovetter in 1985, identify three main driving successful factors in terms of creativity and media scenario (from a consumer receptiveness perspective): - The basic "C" level (called biological or natural level, genetically driven): these are factors that
influence consumers via consumers’ natural and biological mechanisms; - The intermediate "B" level (called learned, culturally driven level): factors that work on consumers’
"learned" mechanisms; - On top of them, the "A" level (called the actual situation level): these are factors related to the concrete
situation in which the consumer is at a certain moment. The "C" factors are pretty general and can be broadly applied across countries, target groups, categories. Companies are typically using many of them in their creative copy development work. Usually the Advertising departments have a range of discrete number of them, and firms with experience in advertising have learnt that these factors apply pretty universally.
The "B" factors are more specific to countries, cultures, and target groups. Big firms address them typically in creative copy work when they think about the use of copy for different targets, in different countries etc. A simple example would be the arrangement of print advertising which should follow the standard theme of how a page is read: from left to right in Western countries, from right to left in the Near East.
Lastly, the "A" factors can be very specific: think of the factors that "rule" situations of media reception: target, mood of the person, time of day, social circumstances, program environment, position of commercial in block etc. The difficulty here is that there are so many different factors (so that each of them has limited influence only), they come in many variations and combinations, and they are hard to control. Therefore it will be quite difficult to find rules or even guidelines to help Advertising and Creative Manager identifying "receptive" situations on a broad, general level (Kang and Ridgway 1996). A corollary could be that corporate receptivity studies might be of limited value, at least for the developed countries where consumers are consuming media and advertising in a very sophisticated and educated, often cynical way. The situation may be different in developing countries where a company’s products are more emotional and media (especially TV) are consumed in a more positive and sensitive way. In other words, companies may have to answer the receptivity question by individual studies, specific to country (or region), category, sometimes target. One gold rule in marketing is never asking consumers about their receptivity directly. For Consumers the topic is not self-concerning and it is too difficult for them to separate the media from the message. Companies will probably be more successful with an indirect approach or using consumers’ panel where they obtain media exposure (for the different channel like TV, Radio, Cinema, Print, Outdoor/Indoor Ads) and read purchases. Using advanced modelling techniques, and based on a sufficient number of data points on respondent level, Marketing departments could obtain the most effective situations of media reception with effectiveness being defined as triggering purchase (Moschis 1992; Smith and Moschis 1985).
Another very important aspect in the receptivity arena is the time in term of share of brain dedicated to listen advertising in that precise moment of the day. Someone who is much focused on an activity or is under high stress will not have much capacity left and not be receptive to advertising while someone who is in a relaxed mood and not focused on a demanding activity will have some brain capacity left and thus be more open to advertising messages. “The real problem with the concept of “timing” in term of share of brain is how to make it controlled and actionable by media. If it will be a reliable scenario”.
The last important dimension about receptivity is “how” the message will be receipted. Starting from some empirical researches done by McKenna (1991) and McLuhan (1994) looking at the movies context we can define several main modalities on how the movie story and drama are receipted by the audience:
1. trying to find some connections and relations between the content of the movie and their own life or current situation,
2. being emotionally touched by the film (e.g. crying during sad scenes or screaming), 3. loosing space and time dimensions because of being totally captured by the plot, 4. deep identification with the hero,

1375
5. analyse in deep the message of the movie trying to extract emotional contents focusing on the emotional narrative element of the story,
6. and thinking about the production values of the film (money costs, special effects, etc.) 7. how the plot could be changed (criticism or other points of view)
Different types of people will go through more or less all modalities, but tend to "prefer" some of them. Over the course of a specific movie, modalities will obviously change, following the drama. Noticeably, these modalities are also at work for TV advertising. A hypothesis is therefore that advertising that "continues" the modality of the feature film is better received. Again, the question is how we can make this concept actionable. A lot of research will be needed for example on the relation of different modalities to different channels, targets, situations. When and Where Are Your Consumers Receptive? “Marketers are being bombarded with news and concepts that consumers are getting harder and harder to reach with advertising messages” (Shocker, Allan D; Srivastava, 1998). Audiences are fragmenting, consumers are multi-tasking, and new technologies give consumers the power to skip commercials if they choose. The Big Advertising Spender Companies have responded to this news with a strategy to generate and leverage deep “consumer insights” to connect effectively and efficiently with their targets when and where they are most receptive. The purpose of this paragraph is to synthesize some of the key current messages about receptivity and give guidance on how to proceed with receptivity work on a brand communication strategy plan. Jean-Noel Kapferer (2001) on his work regarding the “Reinvention of a Top Brand in the new market realities” and later Keller (2003) explains in deep the concept of “Receptivity”; here there is a summary of the four main components: 1. Reach-ness: it is the first building block to effective communication. Reach-ness is a basic requirement but it is not sufficient by itself. It tells us how many target consumers had an opportunity to see or hear an advertisement. The biggest worldwide companies have developed measures for most traditional and some emerging media vehicles in the different regions of the world. 2. Attentiveness: Marketers need to reach consumers when they are paying attention to commercial messages; when they are listening not sleeping; when they are watching not chatting to friends; when they are interacting not looking at the children. 3. Relevance: Categories have 'relevant moments', when consumers are more likely to engage with messages about the category. It’s fundamental to know the prime prospects of a Brand to choose the right advertising in the right moment. Furthermore, relevance of the message itself appears to be a driver of receptivity in all categories. 4. Impact: Advertising messages reach attentive consumers when the category is relevant to them and the final step is to deliver a message that will motivate them to act. The current best measure for message impact is a mix-combination of Recall and Persuasion. Starting from the population who are persuaded by the message it will be visually identified the “Gaps” scheme to arrive at the Total Potential population:

1376
FIG. 2 – “GAPS” SCHEME ON RECEPTIVENESS
The majority of scholars about receptiveness (especially Friedman 1992; Lee and Soberon-Ferrer 1997; Moschis 1992) are strongly connected with the clear understanding of “Who” is your “strategic target” and “prime prospect”. In the literature scholars look at the connections between receptiveness and Prime Prospect focusing on two main directions: 1. Contact-centric research that produces insights about what vehicles are most influential to the Brand target consumers and how consumers interact with media vehicles. Some examples of contact centric researches are Custom Contact Studies and Market Contact Audits. Finally to provide consumer perceptions of what contact are most influential in a category worldwide consultant companies give Category Specific, available for all markets. 2. Occasion-centric research that provides insights about the occasions a Brand message is most likely to be relevant to the Brand target consumers, independent of their media habits. Some examples of Occasion-centric researches are Focus Groups and One-to-one deep interviews. As a brief conclusion of these two approaches it has to be said that the real challenge for Companies is to find the intersection of influential contact and relevant occasions and some of the best examples are on businesses that have run both types of research together. Understanding Customers: “Who”, “What” and “How” Since 1941 Oxenfeldt and Swam said that “a well-communicated image should help establish a brand's position, insulate the brand from competition and therefore enhance the brand's market performance”. Later in 1979 Shocker and Srinivasan added that you can “well communicate” only if you know who is the right target for the communication. All the biggest consumer goods companies as for example Procter & Gamble, Unilever, Colgate and so forth invest heavy budgets and a lot of effort trying to understand their customers thoughts, needs, behaviours etc. For them it’s crucial to know something about consumers before the competitors because, as Wind (1993) said “create relationship with your customers is the first and critical step in building competitive advantage”. Similarly, as the traditional marketing mix elements have become commoditized, companies are realizing that their most valuable assets are relationships with customers and other key stakeholders. This is because the net sum of brand relationships is a major determinant of brand value (Duncan and Moriarty 1997). The importance of relationships as market-based assets that ultimately contribute to shareholder value is discussed by Srivastava, Shervani, and Fahey (1998). Duncan and Moriarty (1997) (as reported in the following scheme) described very in deep the parallel communication and marketing processes showing that the communication is properly defined by a Receiver (“Who”), by a message (“What”), by a channel (“How”) and finally by the presence of the competitors (“Noise” is called by Duncan and Moriarty).
PERSUASED (by the message)
RELEVANT (interested about the category)
ATTENTIVE (was actually watching or listening the advertising)
REACHED (had the opportunity to see or hear the advertising)
TOTAL POTENTIAL (100% of strategic target population)
The “Impact” Gap
The “Relevance” Gap
The “Attentive” Gap
The “Reach” Gap

1377
FIG. 3 - T. DUNCAN, S. MORIARTY – PARALLEL COMMUNICATION AND MARKETING PROCESSES - 1998
So, to create relationships Marketing and Brand Managers have to answer three basic questions:
1. “Who” is my target I want to relate with? 2. “What” do we want to tell them during our communication and our relationship? 3. “How” can we pass the brand message to make it as efficient as possible?
In the following pages we will try to go deeper on answering these three questions with a special focus on the correlation between “Who”, “What” and “How” definition and the development of a holistic band communication media plan. • “Who”: Before starting with any Marketing Action the most important aspect is to understand who will be the target of our marketing or communication campaign. Inside the potential universe of people that could use our product/service it’s important to define:
- Overall Target: people that can be interested on trying or purchase our product/service; - Strategic Target: we have to define which segment of the Overall Target is strategically more significant
for our business and for the company; - Prime Prospect: finally it’s very important to define inside the Strategic Target the consumers who could
be more profitable for the company and the consumers who have to buy first the product to support the ROI of the advertising campaign.
FIG. 4 – THE COMPOSITION OF “WHO?” When these three segments are clearly defined Managers have to start wondering which message (“What”) could be more appropriate for the Prime Prospect they have defined: • “What”: Duncan and Moriarty (1997) in their Parallel Communication and Marketing Model call our “What” as “Message”: the concepts are exactly the same. Which message does the company wants to communicate to its Strategic Target and Prime Prospect? We decide to use “What” because the question marketing managers have to wonder is “What do we want to communicate”. The answer can be connected with the new using of the product, or the benefits of a product, or a new claim to re-position the product or a simple clear picture of a special characteristic or design.
Overall Target
Strategic Target Prime Prospect

1378
The “What” is the message we want to communicate to our “Who”. In the message it has to be clear which is the Brand we are talking about and its benefits. Both the Brand and the benefits have to be in line with the already existing Brand equity and the Brand Image. The purpose of the message is to show to the “Who” that there is a Brand which responds to their needs and which makes them feel comfortable with its benefit. Finally when we have defined the target of our communication and the object to communicate it’s fundamental to define how we communicate the “What” to the “Who”. It’s time to define the “How” or “the right channel to communicate the message to the target” • “How”: In Schramm's basic communication model (1954), information flows through channels of communication, or media. Channels in marketing studies refer to distribution instead of communication, and "flow" is represented by the movement of goods. In marketing's value chain, Schramm's stream metaphor contributes the idea of upstream (suppliers/vendors) and downstream (distributors, customers). What is common to both is that a channel is a conduit through which a stream of something (products, information) flows. The way to communicate a Brand message is as much important as the message. Very effective message sometime are communicated with an improper “How” and on the other hand not very effective message are communicated with very efficient media channels and communication actions. In the communication plan the media strategy is usually the part concerning the “How” and the measures to determine if a media is good to communicate and advice about the “What” are: Reach, Frequency and Gross Rating Points (GRP) per media. Although it’s important to remember that a good “How” is not only concerning about choosing the right media channel but also working together with the whole Brand team to define the main line to follow to communicate as clearly as possible the benefits and the plus of a product/service. Not only the Television, the Radio or the Print can be right channel to “How” communicate: packaging, free sampling, tribal marketing, stickers, word of mouth can be sometimes much more effective channel (e.g. “A-Style”, fashion clothes for young, in Italy). Brand Ecology In a marketing arena where it’s getting harder and harder to catch consumer receptiveness the concept of Brand Ecology becomes more central and strategic on the development of a Communication Campaign. The concept of Business Ecology (Pilotti, 2004) is concerning the creation of a virtuous network between the final results and the beginning factors that helped to create that result. The idea is to create a virtuous circle where not only the business key factors (customers, processes, suppliers, market shares and so forth) are analysed and considered to develop new strategies but also the correlations and the interrelations among these concepts become strategic. If we apply this perspective to the Brand Management we could say that Brand Ecology is the evaluation, development, analysis and creation of brands where receptiveness, segmentation, targeting, positioning and so on become not anymore a single channel concept but a multi-channel one so we will have multi-segmentation instead of single segmentation, multi-targeting, multi-positioning, new concepts that will be able to re-orienting the brand strategy in a scenario with an increasing brand distortion and receptiveness fragmentation.
Clients are more and more different one to the other, not only for their life-styles but for their purchasing impulses associating different products frequently not connected with the traditional demographic, social or “by using” variables. There are other factors as community styles or brand dislike where the traditional mass market advertising is not so efficient anymore. This weakness is strongly connected with the more and more widespread micro-segments which are able to move independently from the macro-segment where they are considering part of. For example a phenomenon like Brand Dislike (Dalli, 2004) become more and more frequent in the creation of specific users community and a lot of micro-segments start to follow an adaptive imitation process to identify themselves as not-belonging to some Brand values.
The Brand Ecology suggests considering concepts as targets, channels, timing exposure, etc. increasing the level of complexity during the cross sections analysis to investigate possible hidden correlations and interactions.
1379
Consumers perceive different messages depending on conditions where they listen the advertising, depending on the channel is presenting the advertising and so on. The level of complexity is maximum during his receptiveness process and, more important this process of acquisition of Brand information is not sequential. As a possible answer to that problem there is the Brand Ecology Approach where the push-pull marketing strategy is substitute by the Trust and Advocacy approach (Urban, 2005). Trust and Advocacy “Advocacy is a major step forward in the evolving interaction between a firm and its customers. Push/pull marketing is driven by the economics of mass production-efficient processes that created mounds of low-cost goods. Relationship marketing is impelled by the saturation of push marketing and intense rivalries, particularly around quality, price and communication. Advocacy will be the next imperative because of the accelerating growth of customer power” this is how Prof. Glen Urban (2005) explain the shift from the push/pull model to the new trust/advocacy model. Behind this shift there is the growing customer power, customers who starts to dislike and to reject both mass communication products and mass communication advertising. To create virtuous relationships the communication has to become more efficient in the customer perspective. Nowadays on Internet you can compare prices, performances, fares and whatever else just in few clicks. If the communication is reaching the wrong target or the receptiveness of the message is too low a company would loose customers in much less time than 5 years ago. The customer power needs to be supported not limited.
To build competitive advantage is strategic to know as much as possible the receptiveness of the “Who” but it’s strategic as well to communicate the “What” in the most trustworthy way to gain customer loyalty and to contrast as much as possible Brand Dislike effect.
To work in an advocacy perspective is important to understand consumer receptiveness (Do, Learn, Feel) to communicate the right message in the most holistic and complete way. Inside the new Trust/Advocacy Paradigm the Brand Ecology plays a crucial rule: only with an ecology perspective it will be possible to move from infotainment to entertainment. Only when a communication strategy has reached an entertainment level it will be possible to move forward to the final engagement level and to reach that it’s necessary to work with a cross-media campaign. To engage customer it will be necessary to surprise them communicating the right message at the right time keeping control not only on consumer behaviour, habits or like but especially on effect as brand distortion, community dislike effect, perceptions and feelings.
Trust and Advocacy have to lead Business choices in all the different media-channels and in particular on the new-media as Internet, Mobile devices, TV on demand and so forth where the power of customers is key factor to success. Companies have to understand that customers are responsible and very good decision maker. Urban in his “Don’t Just Relate, Advocate” (2005) is writing that “Customers are active and want to control the buying process; they prefer to learn and make an informed decision”. The implication of this “Advocacy Theory” is a more efficient communication strategy based on real superior performances based on engaging advertising messages to create feelings on top of brand loyalty.
Trusted tools (Advisors, neutral benchmark, free trial, sampling, etc.) are available and are proven trust builders throughout each communication channel. The Ecology approach suggests using them simultaneously to improve the complex of the communication matrix and to create an engagement built on trust. To create engagement is necessary to create a multiplicity of stimuli and the only way to do that is to pop up the complexity (considering more variables and more customer human being aspects) and the inter-communications among channels, messages and receptiveness. Cross Media Benchmarking Another very important aspect to be considered is the cross media analysis to determine the effectiveness (in term of cost and ROI) of a specific media in relation with a specific brand or service. Overall, results show that TV, Print and large, interactive on-line advertisings such as “Superstitials” or Integrated Sponsorship (area on media sites that

1380
look/feel like the brand with brand/category specific content), are effective communication vehicles. However, other on-line advertising units, such as banners, pop-ups and sidebars, do not deliver similar branding and should be curtailed, where branding is an important objective. Looking more in details at the media quoted above (font: Nielsen Media Research and Nielsen//NetRating, 2005):
1. Television provides the best balance of providing broad reach to a brand's strategic target, effective communication of the brand's core equities, and creating an emotional connection with viewers in a cost effective manner.
2. Print , despite being lower in recall vs. Television, is still an effective medium; particularly as it relates to creating a more intimate message amongst a brand's prime prospects or strategic target where increased depth of sale/greater explanation of benefits are required.
3. On-line “Superstitial” and Integrated Sponsorship deliver effective branding. They also show strong potential to create a two-way dialogue to communicate very complex and personalized messages. Interaction with and recall of ad units increases with their size, provided the large size does not negatively disrupt the task/quest the consumer is on.
4. Other on-line advertising models (e.g. banners, banners with pop ups, sidebars, etc.) suffer from poor interaction and recall and should be avoided for branding purposes. However, with better negotiations/ industry moves to cost per click or acquisition metrics, these units may become economical conduits to other quality branding vehicles (e.g. e-mail, sampling, etc). Related, but beyond this media study, e-mail and Mini-sites are emerging as cost effective branding vehicles:
1. E-mail has become an effective vehicle, particularly when in-house lists are used. All Brands should drive options to opt-ins for future contacts, as part of site registration or as part of other on-line sampling, promotion, e-mail or sponsorship programs. However, caution must be used to ensure contacts reward the consumer for their attention by providing valuable programs, offers and utility/services to avoid risk of list burn-out or deleting.
2. Mini-sites (less then 15.000€ manufacturing) are important for all brands to cultivate a basic presence on the web. These sites provide basic brand/product information, answer FAQ (Frequent Asked Questions), collect registrations into email opt-in lists and create a base to drive sampling or word-of-mouth efforts. Conversely, creating Destination-sites (more than 30.000€) will be appropriate only for brands in categories with high involvement or a high information need that is not being met otherwise. The constant need to refresh content to maintain repeat visitors makes this cost prohibitive for most brands and companies. As such, these large sites should only be considered as part of a broader CRM effort. J.Lull (2000) on his work about Media, Communication and Culture assumed that to complete a cross media benchmarking other two concepts have to be analysed and considered as indicators for media plans development: Effectiveness and Efficiency.
1. Effectiveness: Television, Print and Superstitials are all strong in terms of their effectiveness in communication and recall. Specifically, Television provides the best balance between broad reach and the ability to make an emotional connection with the viewer communicating basic brand messages and refreshing its core equities (Television average recall 63% - Nielsen Media Research 2005). Where more detailed information is needed or where the message is complex, Print (Print average recall 43% - Nielsen Media Research 2005) or Superstitials within Mini-Sites are likely to be more effective. Other online models like banners or frames are relatively less effective. Even if it was not directly investigated in this paper, in the literature (Lee and McGowan 1998; McQuail, 2002; Lull, 2000 and others) there is a broad convergence on the conclusion that the biggest value that internet based models can bring is in creating two-way consumer relationships. Also, recall and interaction are linked to the size of the interactive ad units. Further, while this is not a specific media mix research, some results from media consultants (e.g. Nielsen//NetRatings) show that Television when integrated with an online campaign produces more effective results than either one used separately.
2. Efficiency: Brands must look at acquisition and impression costs of effectively reaching target consumers via each medium. In terms of generating recall, Television is about 30% costlier than Superstitials, and Print is about twice as costly as Televison. However, Television is still three times cheaper than Web-Banners in this respect. Nevertheless, since only part of the population is online, limitations of reach with Superstitials/E-mails and

1381
the type of marketing message (e.g. whether there is a need for interaction) still make Television essential to achieve broad scale message delivery.
So, in term of effectiveness and efficiency, Television or Print is not always the best media choice. Looking for alternatives, for example, e-mail is capable of delivering personalized brand messages in a cluttered online media environment, particularly as part of in-house lists. E-mail, when integrated into a well orchestrated Consumer Relationship Management (CRM) program has the highest impact as it is expected and benefits from significant open rates (more than 70% - Nielsen Media Research 2005). This is because those who opt-in are more inclined to respond to the brand communications. This reinforces the theory that marketing to existing consumers is cheaper (McGhee, 1983 Lord and Kim, 1995). The Ecological Holistic Communication Plan “A holistic communication is the base to create a good and successful brand image and brand idea” (Friedman 1992; Lee and Soberon-Ferrer 1997). Looking at the literature there is a lot of effort regarding the importance on developing an efficient master communication plan but only few works regarding the importance of the qualification test before starting with the final execution of advertising to calibrate the receptiveness factors and to start an ecological circle on customer channels. An holistic communication plan which tries to be as consistent as possible on building the brand image becomes ecological when all the factors described before (from the definitions of the key driving factors for an engagement communication (factor C, B or A) to the definition of Reachness, Attentiveness, relevance and Impact through the analysis of the purchasing process (Learn, Feel, Do) concur with the same importance on the definition of the cross media choices to reach a real multichannel plan. In this plan all the messages have to be trustworthy to advocate consumers’ purchasing and to shift from infotainment to entertainment. Summarising the main works on communication developed during the last decade by Walther (1996), McQuail (2000), Friedman (1992); Lee and Soberon-Ferrer (1997) and other researchers regarding media communication projects it was possible to synthesised five critical steps during the creation of a Holistic Communication plan:
1. The importance of the landscape Before starting with any communication or marketing action is fundamental to clearly define and understanding of the Strategic Target and the Prime Prospect within it. Inspirational, broadly defined, relevant brand equity is important along with clear business objectives and a good understanding of the landscape (Friedman, 1992).
2. New ideas in communication The first and basic idea has to be media-neutral and inspiring. It needs to have legs and be able to support a possible campaign. The brief that has to be done at this stage is not for a storyboard or a print advertising, but it is a brief for a general communication idea. “The key tip to see if an idea could be an immediate good idea was to ask the agency to explain their idea in less than 20 words” (McQuail, 2000). Only with good ideas advertising can create entertainment. If the good idea is communicated at the right moment the entertainment will become engagement.
3. The Communication Master Plan The development of a good Communication Master Plan is based on deep consumer insights and a good understanding of not only the contact points, but the context of when and where the target is likely to be most receptive. The Connection Context (McLuhan, 1994) is the idea that crystallizes and embodies your desired connection with your target. The Connection with the target has to be established in the right context for the consumers. The right Context is the best moment of receptiveness of consumers and it coincides with the using of the product or with the need to have a specific product for the current context. The Connection Context becomes the lens; filter; focus for when and where you will connect. The Communication Master Plan is the blueprint for connections and reflects when and where our target will have the opportunity to see, feel, hear, and touch the Brand's messages. The key here is to consider all relevant touch-points. Brand management doesn't necessarily have to use them and it may end up with Television being the key channel to reach the consumer, but don't just default to Television without considering the full range of appropriate contacts. Appropriate contacts include in-store and

1382
influencer/PR driven opportunities. As well as prioritizing contact points, the Communication Master Plan outlines the strategic role of each contact point and how they integrate (McLuhan, 2000).
4. Qualification and Pre-Test Based on the contact channels identified, issue the "call to work" briefs to the agencies that will execute the contacts and the agencies that will develop the content. New steps at this stage include the Agencies conducting a synergy review themselves ahead of the complete work being presented to the Brand. In this step the pre-test qualification become very important because depending on the Communication Master Plan defined it’s important to invest energy and money in a feasible and traceable idea development. A real test of the idea in this step could be not applicable because it’s too early but it’s important to start the qualification process between the Master Plan and the idea creation and definition. During this pre-test it has to be measured the Connection Context (McLuhan, 1994) to better define the weights and the degree of development and application of concepts as attentiveness, receptiveness, purchasing process, receptiveness driving factors and so forth.
5. Execution and Measurement The last action is regarding the execution of the idea and then the measurement of that. It’s strategically very important to develop the idea exactly as it was defined on the plan without changes concerning problems in the material execution of the communication message or the advertising. As important as the execution is the correct measurement of the communication idea in term of attribution, awareness, ROI, purchase and re-purchase and so forth. In term of ROI it has to be considered the correct period of development of the idea and it has to be “cleaned” from other communication/advertising/promotion effects. Regarding the attribution and the awareness it’s important to test if consumer correctly connects the communication with the Brand and of course if they have seen it at least one time. Measuring this it has to be keep in mind that “it’s not enough to have seen an advertising (Awareness Barrier) but it’s necessary to remember the Brand whose the advertising id concerning about (Attribution Barrier)” (McLuhan, 1994; Keller, 1993). Finally it’s relevant to make sure the learning is brought back into the marketing and media organization. Main Conclusions This paper wants to be an overall review of all the key factors that occur during the development of a holistic brand communication plan from an Ecological point of view. Both in the academic literature and in the industries’ market there is a clear converge on the importance to consider the final consumer as the driver for any marketing action and especially for the communication projects. In this scenario the definition of the right “prime prospect” become fundamental to avoid the risk to be driven by the wrong driver.
Looking at the whole Communication process described above it’s important, at the same level of the “Who” to support the “What” and the “How” analysing in a Trust and Advocacy perspective all the Marketing Processes required: from the Company organization to the Customer Service passing through the concepts of product evaluation, distribution, and competition analysis and customer segmentation. Only using a complete perspective it will be possible to develop an ecological and holistic communication plan. The Brand has its own specific identity and in a more and more competitive market the management has to respect its image and equity developing innovative communication plan and marketing projects. Looking at the competitors’ media strategies could be not enough for three main reasons: first it’s becoming harder and harder to correctly identify the delivery strategies, the targeting strategies and the continuity strategies of competition, secondly competitors can have another “prime prospect” as driver and thirdly it’s always harder to define a clear brand identity and brand image if a company is following the actions of the market leader. Instead of looking too much at competitors is much more efficient to concentrate on how to evaluate the receptiveness of brand consumers and to communicate in the entertainment way using multichannel solutions with a higher degree of complexity concerning the relationship between consumer receptiveness and message engagement. It has to be understood which is the right consumer purchase behaviour “Do, Feel, Learn” and which are the right receptiveness driving factors to evaluate “when” and “where” they are more receptive.

1383
A Brand Communication plan has to be part of a broader Trust and Advocacy business philosophy where strategies are global but tactics are local. A global competitive advantage can be gained only supporting the brand with trustworthy efficacy local tactics starting from product position to local cross media Benchmarking. The right definition of the “How?” passes trough a complete analysis of all the possible touch-points with the final market. Effectiveness and efficiency has to be key words in the definition of the holistic communication plan and in this definition process a special comment has to be developed for the most important media: Television. In the “New Marketing Era”, Paul Postma (1998) explains how in a holistic perspective the rule of television has to be strongly correlated both with the using of “new media” as internet and e-mail and with the traditional communication channel to create a multichannel environment where engagement is the new shared language.
An efficient holistic communication plan, driven by consumer needs and based on Trust and Advocacy paradigm, can become the most important competitive advantage for a brand in term of image, awareness and recognition. Building an holistic and trustworthy reputation allow the Brand to be positioned in consumer’s mind as a leader brand and consumers are more leaned towards giving knowledge to an image leader brand. So the marketing knowledge circle regarding the brand shift from an efficacy circle to an ecological chain where brand knowledge sharing between consumers and the company becomes a powerful fuel to build new ideas and stronger competitive advantages. In this ecological perspective marketers and companies have to use the interactive tools (web, mobile devices, blogs, etc.) as strategic solutions to gain feedbacks from the growing customer power. Messages reach customers several times per days and the majority reach the customer when their receptiveness is very low. For this reason a more interactive communication model based on Trust and Advocacy could re-distribute communication budget focusing more on entertainment or engagement solution instead of only on an invasive infotainment. There is also another important aspect: the correct evaluation of the communication cube (channel, message, content and contest). It could become useless to show a luxury car advertising right after an advertising concerning a no-profit funding campaign. The single message has to be as much interactive and engaged as possible but it has to present and communicate a content appropriated for the overall contest. In this scenario marketers have to be very careful to measure the possible brand-dislike phenomenon using respect, trust, advocacy, commitment, partnership, transparency as basic ingredients to create an advertising campaign. Creating shared trust value with a “win to win” strategy where there are benefits both for companies (profit, awareness, loyalty, etc.) and for customers (trust, engagement, message and product customization, etc.) allow advertising to continue to play a strategic role during the transition from broadcasting scenario to the narrowcasting scenario. Further Research Trajectories As a next step research trajectory in building Competitive advantage into a Brand Communication plan is to consider the debate around the value of Prime Time versus Non-Prime Time (or Daytime). In this paper we haven’t consider this variables in the developing of a holistic communication framework because, in the literature, there isn’t clear evidence on how manage this Prime Time versus Non-Prime Time variable. Then there is a lack in take into account the question of distribution channels which is important in high developed countries as European countries and United States (e.g. network vs. cable channels). A future step could be measuring the receptiveness of customers in an engagement scenario vs. an entertainment or infotainment one using the ecology approach in a complete trust and advocacy perspective.
References [1] American Association of Retired Persons (AARP) (1996), "AARP Calls for New Approach in Fight
Against Telemarketing Fraud," News Release, (August 6) - (1999), "Facts About Fraudulent Telemarketing," (accessed April 27), http://.aarp.org/fraud/ Ifraud.htm

1384
[2] Brill, Jonathan E. (1992), "Interpersonal Interaction Styles of Adult Retail Shoppers: A Social and Aging Perspective," doctoral dissertation, Temple University.
[3] Cohen, Jacob and Patricia Cohen (1983), Applied Multiple Regression/Correlation Analysis for the Behavioural Sciences, 2d ed. Hillsdale, NJ: Lawrence Erlbaum Associates. [4] Duncan, T., Moriarty, SE (1998) - A Communication-Based Marketing Model for Managing Relationships Journal of Marketing, 1998 - JSTOR [5] Fay, M.; Currier, G. (1994) - The Rise and Fall of the Copy Point - European Journal of Marketing [6] Ganzaroli A., Pilotti, “I sistemi informativi di nuova generazione” in Pilotti L., Percorsi di Management
della Conoscenza, Carocci, 2005. [7] Granovetter, Mark (1985), "Economic Action and Social Structure: The Problem of Embedded-ness,"
American Journal of Sociology, 91 (3), 481-510. [8] Hyman, D.J.; Shingler, J. - The Hierarchy of Consumer Participation and Patterns of Economic, Social,
and Political areas - The Journal of Consumer Affairs, 1999 - Blackwell Synergy [9] Kang, Yong-Soon and Nancy M. Ridgway (1996), "The Importance of consumer Market Interactions as a
Form of Social Support for Elderly Consumers," Journal of public policy & Marketing, 15 (Spring), 108-17
[10] Kapferer, J.N. (2001) - Reinventing the Brand: Can Top Brands Survive the New Realities? – New York Press [11] Keller, K.L. (1993) – Conceptualizing and Managing Customer-Based Brand Equity - Journal of Contact authors for the full list of references

1385
An Application of the Conversion Model to Analyse Customer Commitment
Nic S Terblanche, [email protected] University of Stellenbosch, South Africa
Abstract Customer retention has become a major concern for many firms as it contributes to profitability over the long term. Various strategies have been followed to achieve customer retention, because of the benefits associated with customer retention. The apparent route to enhance customer retention is to create long term relationships with customers. Customer delight, customer satisfaction and customer commitment are some of the strategies that have been studied for the creation of long term relationships to achieve customer retention. This article deals with the measurement of customer commitment to assess customer retention. The Conversion Model (CM) is used to measure customer commitment. This study explores customer commitment, as measured by the CM, in the South African fast food industry. The empirical findings in respect of the customer commitment segments for fast food retailers in South Africa and the marketing strategies that could be followed for the different segments are also reported. Introduction The late management guru Peter Drucker once said that the sole purpose of a business is to create a customer (1973). The past two decades have witnessed a surge in academic research and practices that focus on the opposite of what Drucker promoted, namely retaining the customer. This interest in customer retention could have been triggered by the work of Dawkins and Reichheld (1990) who reported that a 5 per cent increase in customer retention led to an increase in customer net present value of between 25 to 95 per cent across a broad spectrum of different business environments. Customer retention has become a focal point for many firms as it has been acknowledged as a vital contributor to profitability over the long term (Anderson and Sullivan, 1993; Fornell, 1992; Iniesta and Sánchez, 2002; Heskett, Sasser and Schlesinger, 1997; Heskett, 2002; Dick and Basu, 1994; Anderson, Fornell and Lehmann, 1994). The focus on customer retention has led to “a growing recognition that customers, like products, have a life-cycle that companies can attempt to manage. Customers are acquired, retained and can be grown in value over time” (Ang and Buttle, 2006). Various strategies have been followed to achieve customer retention, because of the obvious benefits associated with customer retention. The apparent route to enhance customer retention is to create long term relationships with customers. Various authors have described the advantages of longer relationships to enhance customer retention and marketing productivity. The interdependencies resulting from longer relationships reduce transaction costs and generate higher quality while keeping governance costs lower than exchange marketing (Sheth and Sisodia, 1995; Heide and John, 1992; Williamson, 1985; Heskett, Sasser and Schlesinger, 1997; Palmatier, Dant, Grewal and Evans, 2006). The starting point of departure for the creation of long term relationships has also generated a fair amount of debate amongst academics and practitioners. Customer delight, customer satisfaction and customer commitment are some of the strategies that have been considered as essential for the creation of long term relationships with the ultimate aim to achieve customer retention and loyalty. Each of these three strategies has been discussed comprehensively in the academic literature (Anderson, Fornell and Lehmann, 1994; Anderson and Sullivan, 1993; Rust and Oliver, 2000; Szymanski and Henard, 2001; Oliver, 1999; Gounaris, 2005; Gundlach, Achrol and Mentzer, 1995; Bansal, Irving and Taylor, 2004). This article deals with the measurement of customer commitment as a means to assess customer retention. The Conversion Model (CM) is used to measure customer commitment. Customer Commitment Commitment has been defined from various perspectives. For the purpose of this article it is deemed necessary to attend to some of these definitions as it will provide insight into the complexity and the multi faceted dimensions of

1386
commitment. Scanzoni identified commitment as the fourth phase in relationship building. In Scanzoni’s view commitment consisted of three measurable criteria, namely inputs, durability and consistency (1979:87). Inputs refer to significant resources being exchanged; desirability refers to association over time between the parties concerned, whilst consistency means the extent of inputs made to maintain the association. Commitment has been defined as “an implicit or explicit pledge of relational continuity between exchange partners” (Dwyer, Schurr and Oh, 1987:19). Dwyer et al also state that commitment implies a willingness to make short-term sacrifices to realize longer-tern benefits and that commitment represents the highest stage of relational bonding and concur with Scanzoni’s three criteria to define commitment (1987:23).
Berry and Parasuraman (1991: 139) argue that in the domain of services marketing, “relationships are built on the foundation of mutual commitment”. Morgan and Hunt found that, after an extensive literature review as well as support in an empirical study, commitment is central to all the relational exchanges between a firm and its partners (1994: 23). Morgan et al. (1994: 25) also determined that co-operation arises directly from relationship commitment. Gundlach et al. (1995: 79) argue that commitment has three basic components: an input or instrumental component (some form of investment), an attitudinal component (which refers to behavioural intention) as well as a temporal dimension that refers to the intention of relationships to exist over time.
Anderson and Weitz (1992) found that “commitment in a relationship suggests a long-term orientation and assumes that the relationship is stable and will continue long enough for channel members to realize the long term benefits”. This is similar to a study by Mohr and Spekman (1994: 137) who found that commitment suggests a future orientation in which partners attempt to build a relationship that can weather unanticipated problems.
A broad definition was provided by Morgan et al. (1994: 23) when they described commitment as “the belief of an exchange partner that the ongoing relationship with another is so important as to warrant maximum efforts at maintaining it”. This definition is similar to that of Moorman, Zaltman and Despande (1992: 316) who define commitment as "an enduring desire to maintain a valued relationship." The "enduring desire to maintain" component of this definition, indicates that a committed partner would prefer the relationship to endure for an indefinite period and is therefore willing to put in some effort in order to maintain the relationship. The "valued relationship" concept argues that commitment will only exist if partners agree to the importance of the relationship.
One of the key characteristics of commitment in a relationship is the committing party’s purposeful and consistent engagement of resources to maintain the relationship over an extended period of time (Gao, Sirgy and Bird, 2005: 399). Gao et al. further imply “that reciprocal or joint commitment can lead to stable long-term relationships through aligning participants’ incentive structures and enhancing their confidence in each other’s behaviours” (2005: 399).
Gounaris defined commitment as “the desire for continuity manifested by the willingness to invest resources into a relationship” (2005: 127). Gounaris also pointed to the existence of two types of commitment, namely affective and calculative commitment (2005: 127-128). The distinction between affective and calculative commitment, which was originally identified by Mathieu and Zajac in 1990, stems from different motivations for maintaining a relationship despite the fact that both types of commitment are relatively stable attitudes and beliefs concerning the relationship. The motive for affective commitment appears to be a generalized sense of positive regard for and attachment to the other party, while calculative commitment stems from an anticipation of high termination or switching costs associated with ending the relationship (Gounaris, 2005: 128).
The above-mentioned definitions of commitment share certain common characteristics. The characteristics are: • it requires inputs from the parties involved • it has a long term orientation • it has a psychological dimension • the parties make efforts to maintain the relationship – the relationship is important to them.
It is deemed necessary to distinguish between loyalty and commitment to avoid possible confusion. Loyalty is essentially behavioral - it is the continuous usage or purchase of a brand, product, service, etcetera (Ceurvorst and Kitaeff, 1996:56). Continuing to be a customer of a bank or airline, repurchasing the same brand of car, and buying the same brand of washing powder are examples of loyal behavior. Continuity of the afore-mentioned behaviour,

1387
however, does not necessarily indicate strong, absolute loyalty. Commitment, on the other hand, is of a psychological nature - it is the power of the relationship between a person and a brand, product, or service. It is crucial to measure commitment because it can decay long before it becomes evident in a person's behaviour. One can become uncommitted to a brand of car long before you're in the market for a new car or you can be uncommitted to a bank long before you switch.
Hofmeyr and Rice (2000:80) identify three conditions to exist for a person/customer to be perfectly committed to anything. These three conditions are: (1) they must be happy with <whatever product, service, etc> (2) the relationship must be something that they care about (3) there must be nothing else that appeals to them. Purpose of the Study Studies on the effect of commitment on customer retention have been extremely limited (Bansal, Irving and Taylor, 2004; Garbarino and Johnson, 1999; Pritchard, Havitz and Howard, 1999; Bettencourt, 1997). This article is an attempt to make a contribution in this respect. During 2005 and 2006 the CM was used in a study of two industries in South Africa, namely the fast food and motor vehicle industries. These two industries were selected because both are extremely competitive whilst their products represent the two boundaries of low involvement products (fast food) and high involvement products (motor vehicles). This article deals with the application of the CM in the food industry.
The primary objective of this study is to explore customer commitment, as measured by the CM, in the South African fast food industry. A secondary purpose of the study was to report on the empirical findings in respect of the customer commitment segments for fast food retailers in South Africa and the typical marketing strategies that could be followed in respect of each segment. The Conversion Model The CM establishes a consumer’s level of commitment to a brand to make predictions about future loyalty. The CM uses four dimensions to measure commitment. The first dimension is satisfaction with the brand. However, satisfaction correlates poorly with future behaviour, as evidenced by many researchers (Keaveney, 1995; Mittal and Lassar, 1998; Miranda, Kónya and Havrila, 2005; Andreassen and Lindestad, 1998). Understanding satisfaction does not help us to fully understand why consumers do what they do. Customer satisfaction falls short in two important areas. Firstly, it does not provide for the identification of customers who are at risk and secondly it is unable to manage non-customers (Richards, 1996: 52). Satisfaction is, however, an essential component of understanding the relationship between customers and brands. The second dimension is a customer’s perception of the alternatives. The evaluation of a brand does not happen in isolation. It is a comparative measure against the competition. This also means that a high customer satisfaction score does not necessarily mean that the relationship with the customer is secure. The third dimension is the importance of brand choice to a consumer. If brand choice doesn’t matter, it is difficult to achieve commitment. The product category, as well as brand choice, has to be something relatively important in the consumer’s life for commitment to be possible. The more that brand choice matters, the more likely it is that the consumer will take time and trouble to make the final decision about which brand to choose. The fourth dimension is the consumer’s degree of ambivalence. The more ambivalent the consumer is about which brand to choose, the more likely it is that the final brand choice will be delayed until the last possible moment. For consumers such as these, point-of-purchase stimuli become critically important, as they will often only make their final choice at the shop shelf.
The CM classifies consumers in terms of their level of commitment to a brand. Thus, the relationship that consumers have with every brand in the market is identified. This approach is a prerequisite to distinguish the relative attraction of other brands compared to those that consumers are currently using. With this information, users

1388
and non-users can be placed in different segments. Users and non-users are classified in according to four segments Hofmeyr and Rice (2000:25-26). Figure 1 is an illustration of the eight segments produced by the CM.
The CM split users of a brand into one of four segments (Hofmeyr and Rice, 2000: 25): Entrenched: these are users of the brand who are not likely to switch brands in the near future. Average: these users of the brand are unlikely to change in the short term, but there is a possibility that they might change in the medium term. Shallow: these users have a lower commitment than average and some of them are already actively contemplating alternatives. Convertible: these users are most likely to defect to other brands.
FIG. 1: SEGMENTS OF THE CONVERSION MODEL Source: Hofmeyr and Rice, 2000: 26.
Non-users are, similar to users, also graded into one of four segments (Hofmeyr and Rice, 2000: 26): Available: this group of non-users of the brand prefer the brand to their current brands though they have not yet switched but they have been identified as psychologically ready to switch. Ambivalent: these non-users are as attracted to the brand as they are to their present brand – they are therefore 'open' to the brand. Weakly unavailable: non-users whose first choice lies with their current brands, though not firmly. Strongly unavailable: this group of non-users prefer their current brands and they are least likely to switch to the brand in the near term. Methodology and Empirical Study Measures
USERS
COMMITTED UNCOMMITTED
ENTRENCHED AVERAGE SHALLOW CONVERTIBLE
NON-USERS
OPEN UNAVAILABLE
WEAKLY UNAVAILABLE
STRONGLY UNAVAILABLE
AMBIVALENT AVAILABLE

1389
The CM employs the following four dimensions to measure a consumer’s commitment to a particular brand (Rice and Bennett, 1998; Hofmeyr and Rice, 2000): • Need satisfaction – which refers to the extent to which consumers’ needs are satisfied by a particular brand. • Involvement in the category – which express the importance of the brand choice in the category to the
consumer. • Attitude to alternatives – which indicate the levels of commitment that the consumer has to the brands currently
used. • Intensity of ambivalence - which refers to the degree to which the consumer is pulled in different directions by
the brands on offer. Need satisfaction is measured on a 10 point Likert scale. Involvement and attitude to alternatives are
measured with one item each on a 7 point Likert scale. The intensity of ambivalence is measured on a 3 point scale. According to Hofmeyr and Rice (1995) CM establishes the strength of the psychological relationship
between a person and all his/her choices in a market. CM classifies the users of a product/service in terms of how committed they are to continue to use it whilst non-users are classified in terms of how available for conversion to the product/service they are. The algorithm that is used to allocate consumers to the segments illustrated in Figure 1, is based on the mathematics of catastrophe theory (more specifically the butterfly cusp) (Rice and Bennett, 1998: 62). The allocation algorithm classifies respondents according to their responses on the four dimensions of satisfaction with the brand, the importance of the brand, the perception of alternatives and a respondents’ degree of ambivalence. The following example illustrates a customer in the entrenched segment: “If a respondent was extremely satisfied with a brand being used, the choice of the brand was extremely important (that is, the respondent was involved in the category and with the brand), the brand was perceived to be significantly better than any other brand on the market, and the respondent was not at all ambivalent about his or her consumption pattern, the respondent would be classified as "entrenched" (Rice and Bennett, 1998: 62). For understandable reasons, all the possible permutations of the dimensions are not described in this article, as the CM is a proprietary technique. The data analysis for this article was done by The Customer Equity Company, the developers of the Conversion model. The output of the CM is both brand and person specific (Hofmeyr and Rice, 1999). As far as brands are concerned the technique produces a full overview of the psychological strength of the brand in its market. CM also produces a specific profile for a person, in other words, it produces a profile of the strength of the psychological relationship that each person has with each brand in the market. Sample and Data Collection Data were collected by means of a questionnaire that was personally administered. Personal interviews were conducted with respondents during June 2005. All interviews were conducted using random suburb sampling to obtain a representative sample. Suburbs were drawn from the 2001 South African census and five interviews were conducted within each selected suburb to ensure that a demographically representative sample was achieved across suburbs and areas. The total sample for this study was 2000 interviews. Other characteristics of the sample and sampling procedure are as follows: • the interviews were conducted in the seven major metropolitan areas of South Africa • the sample is in the same proportions of the South African population in terms of both ethnic group and gender
to be representative • respondents are interviewed in-home • respondents were required to be 18 years and older to qualify for the interview.
A total of 33 national fast food brands were included in the study. The Appendix contains the names of the brands. Results of the Data Analysis Figure 2 illustrates the findings for all the brands included in the study. The graph clearly illustrates that commitment is rather low in the fast food industry.

1390
1% 2% 2% 3% 0% 2%
14%
76%
Ent
renc
hed
Ave
rage
Sha
llow
Con
vert
ible
Ava
ilabl
e
Am
biva
lent
Wea
k un
avai
labl
e
Str
ong
unav
aila
ble
Commitment category
0
5000
10000
15000
20000
25000
30000
35000
40000
No
of o
bser
vatio
ns
FIG. 2: COMMITMENT CATEGORIES OF THE CONVERSION MODEL FOR THE FAST FOOD BRANDS INCLUDED IN
THE STUDY
Figure 3 illustrates the eight segments produced by the analysis of the data of the six best supported brands. The number of respondents for each of the six brands is set out in Table 1.
TABLE 1: NUMBER OF RESPONDENTS FOR BEST SUPPORTED BRANDS
Brands Number of respondents KFC (Kentucky Fried Chicken) 533 Nando’s Chicken 124 Chicken Licken 99 McDonalds 92 Spur 89 Steers 65

1391
KFC (Kentucky Fried Chicken)
20% 19%
12% 12%
1%3%
9%
24%
0%
10%
20%
30%
Ent
renc
hed
Ave
rage
Sha
llow
Con
vert
ible
Ava
ilabl
e
Am
biva
lent
Wea
kun
avai
labl
e
Str
ong
unav
aila
ble
Nandos
5% 6% 4% 6%1%
6%
15%
57%
0%
25%
50%
75%
Ent
renc
hed
Ave
rage
Sha
llow
Con
vert
ible
Ava
ilabl
e
Am
biva
lent
Wea
kun
avai
labl
e
Str
ong
unav
aila
ble
Spur
3% 5% 6% 5%1%
9%13%
57%
0%
25%
50%
75%
Ent
renc
hed
Ave
rage
Sha
llow
Con
vert
ible
Ava
ilabl
e
Am
biva
lent
Wea
kun
avai
labl
e
Str
ong
unav
aila
ble
McDonalds
3% 4% 5%9%
1%5%
13%
61%
0%
25%
50%
75%
Ent
renc
hed
Ave
rage
Sha
llow
Con
vert
ible
Ava
ilabl
e
Am
biva
lent
Wea
kun
avai
labl
e
Str
ong
unav
aila
ble
Chicken Licken
3% 4% 4%9%
0% 1%
12%
66%
0%
25%
50%
75%
Ent
renc
hed
Ave
rage
Sha
llow
Con
vert
ible
Ava
ilabl
e
Am
biva
lent
Wea
kun
avai
labl
e
Str
ong
unav
aila
ble
Steers
3% 2% 4% 6%1%
6%
14%
64%
0%
25%
50%
75%
Ent
renc
hed
Ave
rage
Sha
llow
Con
vert
ible
Ava
ilabl
e
Am
biva
lent
Wea
kun
avai
labl
e
Str
ong
unav
aila
ble
FIG. 3: RESULTS OF THE CONVERSION MODEL STUDY: USER AND NON USER SEGMENTS
Figure 3 clearly indicates that KFC is by far the strongest fast food brand in South Africa because 20% of
their customers are entrenched whilst the second strongest brand, Nando’s, only have 5% entrenched customers. The

1392
rest of the brands have 3% or less entrenched customers. Entrenched customers are the prime customers of a brand as they are users of the brand who are not likely to switch brands in the near future. These "apostles" are likely to recommend the brand to other people and in doing so provide valuable goodwill (Ceurvorst and Kitaeff, 1996). Discussion of the Results of the Data Analysis Table 2 is a summary of the committed, uncommitted, open and available customers of the six best supported brands.
TABLE 2: PERCENTAGE OF CONSUMERS IN THE DIFFERENT CM SEGMENTS USERS NON USERS
Brand Committed Uncommitted Total Open Unavailable Total KFC 39 24 63 4 33 37 Nando’s 11 10 21 7 72 79 Spur 8 11 19 10 70 80 McDonalds 7 14 21 6 74 80 Chicken Lickin 7 13 20 1 78 79 Steers 5 10 15 7 78 85
Table 2 shows that 62% of KFC’s users are committed [(39÷63)(100)]. KFC has the strongest brand
strength of the brands studied. McDonalds and Steers, on the other hand, have the weakest brand strength of the six best supported brands, namely 33% committed customers.
The appropriate management of the relationship with customers differs from segment to segment. Basically those customers who use the brand can be split between committed (entrenched or average) or uncommitted (shallow or convertible), while those who do not use the brand can be divided into those who are open to the brand (available or ambivalent) or unavailable (weakly or strongly unavailable). The non-users, except in the case of KFC, constitute the largest segment. This situation, as will be indicated later on, is applicable to most instances.
Committed customers are the easiest relationships to manage. These customers prefer and are fond of the brand, believe the advertising about the brand and are not particularly price sensitive. However, they require continuous reassurance about the choice they have made. If the commitment of customers is not taken care of, their relationship with the brand can weaken. This is especially relevant for brands such as Spur, McDonalds, Chicken Lickin and Steers as their committed customers only constitute between 42% and 33% of their users. A drop of one percent in committed consumers of Steers, for instance, result in a drop of 6% of the committed share of their users (that is [(5÷15)(100)] = 33% and [(4÷15)(100)] = 27%). One of the very functional means to nurture committed consumers is advertising. Advertising set consumers’ minds at rest and enhance the consumption experience in their minds. Commitment will only persist with maintenance of the brand. The high allegiance to brands amongst committed consumers make brand switching very difficult to accomplish, especially in respect of the most favoured brand in the repertoire. Markets tend to be more static, with considerable changes only happening when new channels of distribution are introduced into the marketplace “(such as Egg, the first Internet-based bank in the United Kingdom) or when new meaningful dimensions are introduced to product categories (such as adding baking soda to toothpaste), causing consumers to reassess what the realistic alternatives are to the brands they are using” (Hofmeyr and Rice, 2000: 36-37).
A lack of commitment by users to a brand can come from many sources, such as a lack of involvement in the category or dissatisfaction with the product or service. The opposite can also give rise to a lack of commitment, namely exceptional heavy involvement in the category, which in turn leads to a dedication to experiment with brands and ongoing assessment of new brands. Uncommitted consumers for whom brand choice is unimportant, are consumers for whom brand choice is so unimportant that they might be unaware of the actual brand they buy. They select the brand that can be purchased with the least hassle - convenience and price are their main selection criteria. Advertising is rather unsuccessful at reaching these consumers, as they belong to that group of consumers that is least likely to 'see' and 'like' any advertising for the category. They will be screen out advertising and marketing efforts should rather focus on point of sale and promotion activities that increase the visibility of the brand.
In the event where consumers are uncommitted but brand choice does matter, the marketer faces a

1393
daunting task. In such a situation it is likely that the customer experienced problems in the past. The precise nature of the problem encountered has to be established and the most fitting action taken. A very distinct type of customer, namely the “promiscuous” consumer is also part of this segment of consumers. An example is the keen wine enthusiast for whom brand choice is very important but who also experiment frequently with other brands. These consumers are devoted to experimentation and pay a lot of attention to advertising and therefore the more information they can be given about a brand, the better.
Available non-users are non-users who don’t use a particular brand at present, but who are immediately available for acquisition. The extent of this segment is very relevant when new categories, such as cell phones, are launched. In one study it was found that the size of the available non-user segment to all brands of cell phones was so large, that any focus on inter-brand competition was irrelevant (Hofmeyr and Rice, 2000: 39). As non-users were available to the category, it meant that the brand that was most easily available, came to mind first and was competitively priced, would be selected.
Ambivalent consumers are not using a brand because they are undecided about it. The brand about which this segment is ambivalent, is not regarded as any better or any worse than the brand they currently use. To win these consumers over to a product, some worthwhile incentive has to be offered to them. Examples in this regard could be price, more convenient packaging size or a particular form of promotion. Additional research among these consumers is required to gain insight into what could win them over to a product. Most of the South African fast food brands studied, have experienced great success with promotions including co-branding (for example Disney characters sold with meals) or linking up with a major sporting event such as the Soccer World Cup. In the latter instance customers could qualify for a draw in which the prizes included all expenses paid trips to the sporting event if a meal was purchased during a particular period.
As explained above, non-users who are available to or ambivalent about a brand are uncommitted users of competitor brands. Marketers are frequently enticed to focus more on the unavailable than on the available and ambivalent segments since, for most brands, the unavailable segment tend to be the largest of all segments. Except for KFC, this is also the situation amongst the six brands reported in Table 2. The unavailable segment constitutes 70% or more respondents in the case of the brands other than KFC. The reason(s) why a consumer may be unavailable to a particular brand could be one or more of the following (Hofmeyr and Rice, 2000: 40): • they know of the brand, may even have tried it, but see no reason to switch; • they are committed to the brands they use; • they are aware of the brand, but have a poor image of it; • They don't know the brand exists.
The latter reason for unavailability is the easiest one to remedy. The brand must be brought under their attention through via advertising or other promotion means to induce trial.
In some instances consumers are aware of the brand, tried it, but are still not interested in buying it again. In the cider market it was found that male drinkers, who had tried the product, were the unavailable (Hofmeyr and Rice, 2000: 41-42). They found the cider too sweet and believed it was mainly for women. In this situation it was evident that a new product, preferably a cider with a drier taste and more of a 'macho' image, would have to be launched to satisfy the needs of these unavailable consumers. It made no sense to continue to attempt to try to convince unavailable male drinkers to use the current brand.
In the event of established mature brands, the most common motive for unavailability to a brand is that consumers are satisfied with their current choice. They have no reason to switch from their current choice. They don’t perceive anything wrong to wrong with a competing brand; they are contented with their current brand.
The unavailable segment of consumers is least likely to be persuaded by advertising. The best possibility for advertising is to bring the brand to this segment’s attention and even then, the chances that the advertising will be viewed in a positive way are low. Trial or sampling remains the dominant means to get unavailable consumers so far as to consider the inclusion of the brand in their repertoire of brands. This approach is particularly relevant when the reason for their unavailability to a particular brand lies in a strong commitment to the brands they are currently using. The segments produced by the CM enable us to comprehend why consumers are unavailable to a brand. It enables us to come to a decision whether there is any reasonable chance of winning the unavailable segment to a

1394
particular brand in the near future. Managerial Implications Customer retention has become a major challenge for many firms as it has been acknowledged as an essential contributor to profitability over the long term. The dilemma many managers experience is that although their customers state they are satisfied, they often still switch over to competing suppliers or brands. The basic truth is that satisfied customers aren’t necessarily loyal customers. Even behavioural loyalty is misleading. Behavioural loyalty requires a concomitant attitudinal dimension that mere satisfaction does not possess and which is a prerequisite for commitment. The major advantage of the CM is that it takes, apart from satisfaction, also the psychological importance of the brand choice to the consumer as well as a comparative measure of the customer’s preferred brand against the competition, into account. The CM is also useful, apart from measuring retention, to indicate possible sources of new business.
The management tasks for managing individual segments can be summarised as follows: • For committed customers it is important to continually reassure them about the choice they have made.
Regular advertising for maintenance of the brand is important as it put consumers’ minds at rest and enhances the consumption experience.
• Point of sale and promotion activities are important for uncommitted customers with no particular brand preference.
• It is necessary to create ample opportunities for uncommitted customers for whom brand choice is important, to complain or to make suggestions. For the “promiscuous” type in this segment it is important that advertising takes place regularly, websites are updated frequently with new information and to try and get these customers on mailing lists.
• Available non-users are important when new categories of products are launched. For them the brand must be easily accessible, came to mind first and be competitively priced.
• Ambivalent consumers require that a worthwhile incentive has to be offered to them, usually via an unusual or extraordinary promotion campaign, to win them over to a product.
• Unavailable segments require in-depth research to determine whether any marketing strategy or tactic could be of assistance to persuade such consumers.
Limitations of the Study Care should be exercised in the interpretation and utilisation of the results. The major reason for this is that, although the sample is representative of the entire South African population, this does not necessarily mean that the respondents are representative of typical fast food consumers. In other words, the typical customers of the various fast food retailers might be underrepresented in the sample. Location of the fast food retail outlets and the mobility levels of the different racial segments of the population can influence representation in the sample.
References [1] Anderson, E. W., Fornell, C., & Lehmann, D. R. (1994). Customer satisfaction, market share, and
profitability: findings from Sweden. Journal of Marketing, 58(3): 53-66. [2] Anderson, E.W., & Sullivan, M.W. (1993). The antecedents and consequences of customer satisfaction for
firms. Marketing Science, 12(2): 125-43. [3] Anderson, E., & Weitz, B. A. (1992). The use of pledges to build and sustain commitment in distribution
channels. Journal of Marketing Research, 29 (1): 18-34. [4] Andreassen, T.W., & Lindestad, B. (1998). Customer loyalty and complex services. International Journal
of Service Industry Management, 9(1): 7-23.

1395
[5] Ang, L., & Buttle, F. (2006). Customer retention management processes: A quantitative study. European Journal of Marketing, 40(1/2): 83-99.
[6] Bansal, H.S., Irving, P.G., & Taylor, S.F. (2004). A three-component model of customer commitment to service providers. Journal of the Academy of Marketing Science, 32(3): 234-250.
[7] Berry, L.L., & Parasuraman, A. (1991). Marketing services. New York : Free Press. [8] Bettencourt, L.A. (1997). Customer voluntary performance: customers as partners in service delivery.
Journal of Retailing, 73(3): 383-406. [9] Ceurvorst, R.W., & Kitaeff, R. (1996). Customer taxonomy. Electric Perspectives, 21(6): 56-61. [10] Dawkins, P.M., & Reichheld, F.F. (1990). Customer retention as a competitive weapon. Directors and
Boards, 14(Summer): 42-47. [11] Dick, A. S., & Basu, K. (1994). Customer loyalty: Towards an integrated framework. Journal of the
Academy of Marketing Science, 22(2): 99-113. [12] Dwyer, F.R., Schurr, P.H., & Oh, S. (1987). Developing buyer-seller relationships. Journal of Marketing,
51(2): 11-27. [13] Drucker, P.F. (1973). Management: tasks, responsibilities, practices. New York: Harper & Row. [14] Fornell, C. (1992). A national customer satisfaction barometer: The Swedish experience. Journal of
Marketing, 55(1): 1–21. [15] Garbarino, E., & Johnson, M.S. (1999). The different roles of satisfaction, trust and commitment in
customer relationships. Journal of Marketing, 63(2): 70-87. Contact author for full list of references.
Appendix
NATIONAL FAST FOOD BRANDS INCLUDED IN THE STUDY
Al’s Gourmet Chicken Ocean Basket BJ’s O’Hagans Barcelos Pannarotti’s Pizza Bimbos Pie City Chicken Licken Pizza Hut Debonairs Pizza Pizza Perfect Fish Aways Romans Golden Egg Roosters Juicy Lucy Scooters Kauai Steers Kentucky Fried Chicken (KFC) St Elmo’s King Pie Something Fishy London Pie Company Subway McDonalds Spur Milky Lane Whistle Stop Mimmo’s Wimpy Nando’s Chicken Other (Had to be specified)

1396
Convergence of Marketing & CSR through Innovative Products& Services
P K Banerjea, [email protected] ICFAI Business School, Pune, India
Abstract It has been seen from the population pyramid that about 4 Billion people live on less than $1500 per annum on a purchasing power basis. More than 50% of these people live on less than $ 1/- a day. For these people the government of the country concerned is trying to do something but it is awfully inadequate in terms of both quality and quantity. The author propagates that some progressive corporate is doing something as a part of their corporate social responsibility agenda. This will not solve the problem; to make a dent in this area a proper business model has to be developed that will get revenue that will meet the demands of the other stakeholders. Author quantifies the health spending of these people which if channelised properly it can bring in revenues to the corporate as also meet their social needs. Some examples set the direction in which market & CSR will converge.
Objective
The paper is an effort to take the author’s earlier research forward (paper presented at CSR conference at Vilamoura Portugal in February 2006) [1] on how innovative products and services can meet the requirement of the Bottom of the Pyramid and simultaneously generate revenues for the corporate that has to look after their stakeholders. The concept of Bottom of the Pyramid by C K Prahalad was the inspiration of the earlier paper of the author and the present paper is an extension of the same. While C K Prahalad, was mainly focusing on the innovative marketing technique, the undersigned focusing on the innovative product and services. The present paper focus on the healthcare needs of the BOP section of the market segment that constitutes a consumer base of 4 Billion. The effort of the government is always needed but with the advent of neoliberalism, most of the governments are unable to meet the expenses as also rising aspirations of the people. The paper explore various ways business and industry can help in this regard; only corporate social responsibility will not be enough, business has to earn revenue to have sustained interest and then only there will be real improvement the health care delivery of this large segment of the business through innovative products and services. Methodology The research is mainly in the South Asia and based on secondary data from UNDP, World Bank and IBRD sources. Some other published papers were referred including the speech of Chairman of Hindustan Lever Limited in the Annual General Meeting of the company in 2007. The company is well known for its corporate social Responsibility and serving the Bottom of the Pyramid. In addition to that personal interview of some of the important executives of leading business houses in India was carried out on the on going projects. Preamble
As will be seen in the following paragraph, that South Asia has the dubious distinction of becoming home to more than half of the 4 billion BOP populations. Significantly almost half of the world’s poor living on less than $1 a day lives in the South Asian region. The problem of finding food, nutrition, safe drinking water and proper sanitation is so acute that hardly any body thinks about their health care. Increasingly, the governments of these SAARC countries are faced with deficit in revenue expenditure year after year, trying to reduce expenses so it is becoming almost impossible for them to fund health care for this unfortunate lot. In the developed country also there is a shift from government spending to private participation in healthcare delivery but the reason is quite different. In their

1397
case it is a matter of Equity i.e. improving the health of the entire population and giving a uniform pattern and also putting resources where the need is more. Secondly Efficiency which means the treatment given is efficient as also cost effective. Finally, Response that caters to the needs of the individual patient and user of the facilities. [2] However, in case of South Asian region it is a battle of survival. The following table will highlight the enormity of problem on only one aspect.
TABLE 1: SELECTED HEALTH INDICATORS IN SOUTH ASIAN COUNTRIES - = NOT AVAILABLE | GNP = GROSS NATIONAL PRODUCT| * = MOST RECENT DATA FROM 1997-2000|
SOURCE: WORLD BANK, WORLD DEVELOPMENT INDICATORS 2002 DATABASE
The global community is focusing on inequality increasingly as it is realized that unless there is inclusive growth it is very difficult to achieve sustainable growth. Extensive research has been carried out by IMF and World Bank. Gwatkin and others have carried out lot of analytical work by demographic and health surveys which was released by World Bank in 2000. [3,4,5]. “From the perspective policy, there is a qualitative difference between the inequality described in the first three rows of the Table 2 below and that described by the last two rows…..health sector outcome such those in the first three rows, are determined by factors within as well as outside the health sector. While health outcomes are the ultimate of a health system, policymakers have far more control over health sector outputs such as those in the last two rows” said Abdo S Yazbeck, World Bank and David H. Peters of John Hopkins University in their Overview of the publication Health Policy Research in South Asia. [6]
COUNTRY POPULATION GNP PER
CAPITA [2001]
INFANT MORTALITY
RATE [2000]
TOTAL FERTILITY RATE [2000]
CHILDHOOD MALNUTRITION
[1997-2000]*
Afghanistan 27247944 - 163 7 49 Bangladesh 133405392 370 60 3 48
Bhutan 828044 640 58 5 19 India 1033389824 460 69 3 47 Nepal 23584706 250 74 4 47
Pakistan 141450160 420 83 5 - Sri Lanka 19649486 830 15 2 -

1398
TABLE 2: INEQUALITY IN HEALTH OUTCOMES AND HEALTH SECTOR OUTPUTS IN SOUTH ASIA (WEALTH
QUINTILES). BANGLADESH
1996/97 INDIA 1992/93 NEPAL 1996 PAKISTAN 1991
OUTCOMES AND OUTPUTS
Poorest Richest Poorest Richest Poorest Richest Poorest Richest
Infant Mortality ratea
96 57 109 44 96 64 87 62
Child stuntingb 50 24 65 31 59 32 61 33 Fertility ratec 3.8 2.2 4.1 2.1 6.2 2.9 5.1 4 Full immunization
47 67 17 65 32 71 22 55
Attended delivery
2 30 12 79 3 34 4.6 55
A Deaths under age 12 months per 1000 live births. B Percentage of children under age 5 years whose height for age is below-2 standard deviation z-score. C births per woman ages 15-49 years. Source: Gwatkin and others 2000. [3]
Four Consumer Tiers At the very top of the world economic pyramid are 75 to 100 million affluent Tier 1
Now consider the 4 billion people in Tier 4, at the bottom of the pyramid. Their annual per capita income based on purchasing power parity in U.S. dollars is less than $1,500, the minimum considered necessary to sustain a decent life. For well over a billion people roughly one-sixth of humanity per capita income is less than $1 per day.
Even more significant, the income gap between rich and poor is growing. According to the United Nations, the richest 20 percent in the world accounted for about 70 percent of total income in 1960. In 2000, that figure reached 85 percent. Over the same period, the fraction of income accruing to the poorest 20 percent in the world fell from 2.3 percent to 1.1 percent.
This extreme inequity of wealth distribution reinforces the view that the poor cannot participate in the global market economy, even though they constitute the majority of the population. In fact, given its vast size, Tier 4 represents a multi-trillion-dollar market. According to World Bank projections, the population at the bottom of the pyramid could swell to more than 6 billion people over the next 40 years, because the bulk of the world population

1399
growth occurs there. Most Tier 4 people live in rural villages, or urban slums and shantytowns, and they usually do not hold legal title or deed to their assets (e.g., dwellings, farms, businesses). They have little or no formal education and are hard to reach via conventional distribution, credit, and communications. The quality and quantity of products and services available in Tier 4 is generally low.
Let’s have a quick view on the conditions and the facts, figures of the South Asian countries and India. The results are on the loop side but give a lot of opportunities for the corporate sector, if utilized.
� Access to safe water & sanitation facilities is one of the fundamental requirements of the human beings globally whether they reside in urban or rural areas. However, it is noticed that problem is more acute in the rural areas as compared to the urban areas. Although significant achievement has been made in providing safe drinking water, only 60% people across the globe are under sanitation coverage. This means about 2.4 billion people in the world are yet to get improved sanitation facilities and 80% of such people live in rural areas. Unfortunately, the majority of this population lives in Asia and particularly in India and China.
� The challenge of poverty alleviation is particularly acute for the South Asia region. With 20% of the world population, South Asia represents about 40% of the world's poor. Nowhere is this challenge more acute than in the area of providing safe drinking water and good sanitation services. In South Asia, the deficiency in terms of access to safe drinking water is anywhere from 15-30% of the total population and for sanitation in the area of 60% or more.
� As per Fifty Fourth Round Report of National Sample Survey Organisation published in July 1999, only 17.5% of rural population was using the improved latrines in India. By the end of the Ninth Five Year Plan i.e. March, 2002, it is estimated that sanitation facility would improve to 20% of the rural households. As per Global Water Supply and Sanitation Assessment 2000 Report of WHO & UNICEF, 73% urban population and 14% rural population had access to sanitation facilities in year 2000, while the total coverage for the whole country was at 31%, which is far below the requirement.
� Health hazards of poor water supply and sanitation facility are enormous. Approximately 4 billion diarrhoea cases are reported every year because of this and approximately 2.2 million children, mostly under the age of five, die every year. The loss to human lives is abnormally high. About 10% population of the developing world is affected by intestinal worms, which can be controlled by better sanitation and hygiene facility. Now let’s have a look at the health and human development indicators of India
TABLE 3: KEY DEVELOPMENT INDICATORS Population 1.1billion
GDP 8.4% growth rate Poverty (at $1 a day, ppp) 35% ( as per latest report it
is 29%) Fertility rate 2004 3 births per woman
Average life expectancy at birth (1998-02) 63yrs
Infant mortality (per 1000 live births, 2004) 62
Maternal Mortality (per 100,000 live births, 2001) 540 Access to improved water source 2001 86% Access to improved sanitation facilities 2002 30%
SOURCE: WORLD DEVELOPMENT INDICATORS, 2006 AND CSO REVISED ESTIMATES OF GDP
Figures speak facts. That’s what we can infer from the above indicators. Though India is making efforts in
the direction of improvement but still there are many milestones to cross. The race still falls far from the finish line

1400
and with the world speeding to that end point; and India has to move fast. If we look at the sectoral lending of the funds from world bank- rural water, health and education are still very much inadequate.
The following figure gives a detailed view of lending of funds from World Bank to different sectors.
Lending by Sector (As on June 30, 2006, in US$ million)
Initiatives taken by the Government of India • In India, Government has taken up this challenge through a major National Programme viz. the Rajiv Gandhi
National Drinking Water Mission. The programme has allocated USD 500 million to finance a Programme in 63 Districts across 25 States impacting about 70 million people in the rural areas. The Programme is supporting a decentralized, drinking water and sanitation program in partnership with our local governments and communities.
• So far, Government of India (GOI) sanctioned 138 such projects with an outlay of INR 14260 million. The physical targets that these projects intend to achieve are: construction of 12.30 million individual household latrines, 120 thousands latrines for schools, 14048 sanitary complexes for women, 9086 toilets for balwadis/ anganwadis and 1132 Rural Sanitary Marts/Production Centers. GOI also intend to cover all the remaining 374 districts during the Tenth Five Year Plan period, which will commence from April 2002.
India, we have some very good successful initiatives taken by Non-Governmental Organizations (NGO) and communities in the sanitation sector. The emergence of “Sulabh Souchalay” is one of the most interesting and social innovations in modern India. It has not only provided low cost sanitation facilities but also helped in liberating scavengers in the country. It has provided eco-friendly solutions. This organization has been able to construct and maintain 5000 public toilets with bath attached and has rehabilitated more than 36000 scavengers. For details see [1].
We have seen how the life of the people of Tier 4 is, poverty breeds discontent and extremism. Although complete income equality is an ideological pipe dream, the use of commercial development to bring people out of poverty and give them the chance for a better life is critical to the stability and health of the global economy. The

1401
emergence of the 4 billion people who make up the Tier 4 market is a great opportunity for corporate sector. It also represents a chance for business, government, and civil society to join together in a common cause. Indeed, we believe that pursuing strategies for the bottom of the pyramid dissolves the conflict between proponents of free trade and global capitalism on one hand, and environmental and social sustainability on the other. One concrete example could be sanitary napkins needed by the women in the productive age group could generate enormous business if these products can be made available to this segment at a price affordable by them. Council of Scientific & Industrial Research in India is developing absorbent materials that can be made from scrap paper, cloth and some plastic materials which can be used to make a set of sanitary napkins at price which is one tenth of the multi-national brand. With a BOP population of 4 billion moving up to 6 billion giving an enormous new market segment. Even if only 30% of the women in the BOP use this it is a mind boggling regular business which is hitherto untapped. Either corporate can research and develop an alternate absorbent materials or make a joint effort with CSIR to develop and/or market the product. Here is an ideal area of public private partnership that can meet a social need as also generate millions of dollars for the corporate.
Sustainable product innovations initiated in Tier 4, and promoted through consumer education, will not only positively influence the choices of people at the bottom of the pyramid, but may ultimately reshape the way Americans and others in Tier 1 live. Indeed, in 20 years, we may look back to see that Tier 4 provided the early market pull for disruptive technologies that replaced unsustainable technologies in developed countries and advanced the fortunes of the corporate sector with foresight.
Because Tier 4 communities are often physically and economically isolated, better distribution systems and communication links are essential for development of the bottom of the pyramid. Few of the large emerging-market countries have distribution systems that reach more than half of the population. This led to continued dependence of the poorest consumers on local products and services which are sub standard, more expensive; similarly cheap credit is not available through Banks and these unfortunate lot has to depend on unscrupulous moneylenders who charges astronomical rate of interest. As a consequence, few MNCs have designed their distribution systems to cater to the needs of poor rural customers. Creative local companies, however, lead the way in effective rural distribution.
New commerce in Tier 4 will not be restricted to businesses filling such basic needs as food, textiles, and housing. The bottom of the pyramid is waiting for high-tech businesses such as financial services, cellular telecommunications, and low-end computers. In fact, for many emerging disruptive technologies (e.g., fuel cells, photovoltaic, satellite-based telecommunications, biotechnology, thin-film microelectronics, and nanotechnology), the bottom of the pyramid may prove to be the most attractive early market. Healthcare at the Bottom of the Pyramid There are significant reasons to pay attention to healthcare at the bottom of pyramid. “bottom of the pyramid” (BOP) markets are all the rage right now BOP has strong implications/promise for healthcare delivery, as Kevin Jones from Xigi states: “half of BOP health care spending is on pharmaceuticals, much higher than in more affluent countries. This is especially the case in rural areas, where access to clinics is often limited.” It is too early to assess the impact, but for those unfamiliar to this segment, there is a growing drumbeat and unmistakable energy surrounding this concept
Rural East Africa illustrates both the challenges BOP households face in obtaining health care and the potential health market they represent. Access to public health care is often very limited. Even finding medicines to buy—especially ones that work—can be difficult. Spending on health care is low— only $183 a year for a typical rural household in Uganda.Of that, half is spent on medicine, often without a doctor’s prescription; self-medication is common for BOP households.
The measured BOP health market in Africa (12 countries), Asia (9), Eastern Europe (5), and Latin America and the Caribbean (9) is $87.7 billion. This represents annual household health spending in the 35 countries for which standardized data exist and covers 2.1 billion of the world’s BOP population. The total BOP health market in these four regions, including all surveyed countries, is estimated to be $158.4 billion, accounting for the spending of 3.96 billion people

1402
TABLE 4: POTENTIAL OF HEALTH MARKET
AREAS Health market potential(in billions) Population covered
Asia $42.2 1.5 billion Asia & Middle East $95.5 2.9 billion Latin America $24 360 million Eastern Europe $18 486million
The share of total household health spending that takes place in the BOP—and thus the relative importance
of the BOP market—varies widely. In Asia the BOP dominates the market, with an 85% share. In other regions its share is far smaller: 54% in Africa, 45% in Eastern Europe, 38% in Latin America. In Eastern Europe and Latin America mid-market and high-income groups tend to dominate health markets, even though large majorities of the population in both regions are in the BOP. But Africa shows the greatest disparity between the BOP share of the total population (95%) and the BOP share of health spending (54%). Generally speaking, the smaller the percentage of the population in the BOP, the greater is the likelihood of wealthier population segments account for a disproportionate share of the health market.
TABLE 5: THE BOP INCOME SPECTRUM
BOP 3000 BOP 2500 BOP 2000 BOP 1500 BOP 1000
Bottom-heavy BOP markets—where more than half of spending occurs in the bottom three of the six BOP
income segments—predominate in Africa (9 of 12 countries) and Asia (8 of 9). Malawi and Tajikistan illustrate this pattern. In two of the larger countries, India and Indonesia, while still bottom-heavy, spending is concentrated more toward the middle of the BOP income spectrum, in BOP1000–2000. India, with $35 billion in annual BOP health spending (85% of the national market), shows what this spending pattern looks like .Generally in Africa and Asia the distribution of health spending across BOP income groups closely matches the distribution of the population across these groups.
The products and services that households are willing to buy depend to some extent on income. Average household spending at different income levels is thus a useful guide to product design. But spending, especially for health care, also depends on access to services. If travel to a hospital or health clinic costs more in cash or lost wages than the service itself, anecdotal evidence suggests, price-sensitive BOP households may defer treatment until a condition is relatively serious. In any event, the available health dollars might be larger if health care services were available relatively easily, and travel costs could be avoided. Current levels of household spending on health should thus be regarded as establishing a lower bound for the willingness to pay.
Average health spending by BOP households varies widely across countries. The difference depends in part on whether markets are top heavy or bottom heavy and may also reflect BOP access to public health services. But the variation can also reflect differences in the questions asked and the expenditures captured in national surveys. Both Indonesia and Pakistan have bottom-heavy health markets, for example, their reported BOP health spending per household averages are very different: $78 and $197 (the extremes for measured countries in Asia).In most countries measured household health spending increases roughly in proportion to income through the BOP.
In many countries, however, health spending increases disproportionately in the highest BOP income segments, BOP2500 and BOP3000—indications of latent demand for health care in the BOP. The ratio of average health spending per household in BOP3000 to that in BOP500 is 8:1 in Nigeria, 6:1 in Gabon, 9.5:1 in Sri Lanka, 3:1 in Ukraine, and 6:1 in Peru. Health care models that can tap higher income segments to cross-subsidize services

1403
to lower income segments—such as the Aravind Eye Care Hospitals in India—show much promise as a way to extend even expensive services such as surgery to the poorest parts of the BOP
As incomes rise still higher, per household health spending continues to increase—but only modestly compared with the increases in income, except in Africa. The ratio of average annual household spending for health in the mid-market segment to that in the BOP is 1.5:1 in Russia, 2:1 in Colombia, 2:1 in India, and 3:1 in Thailand—but reaches 11:1 in Nigeria and 14:1 in South Africa.
The relative sizes of urban and rural BOP health markets differ significantly across regions. In Asia the rural BOP health market is 2.4 times the size of the urban one, largely reflecting the distribution of the BOP population.
Pakistan’s BOP health market, for example, is 71% rural. Among measured Asian countries, only in Indonesia does BOP health spending in urban areas exceed that in rural areas. In Africa urban and rural BOP health markets are roughly comparable in size, even though rural areas generally account for a larger share of the BOP population. In Nigeria, for example, rural areas account for 52% of the BOP health market but have 22% more BOP households than urban areas.
The BOP share of the total urban health market is smaller in every region than the BOP share of the rural market, because of the concentration of mid-market and high-income populations in urban areas.
The first response to illness in many BOP households, especially in the lower income segments that dominate bottom heavy markets, tends to be self-medication. Pharmacies or other sources of medicines are thus often the front line of health care, especially in rural areas where access to clinics and hospitals may be limited. Supportive evidence for this comes from the surveys reported in this analysis: in nearly every measured country and in every BOP income segment pharmaceuticals account for more than half of all BOP health spending. As a result, the BOP often dominates national pharmaceutical markets, especially in Africa and Asia. Trends Pointing towards Robust Future Growth
1. Growing incomes, literacy and awareness bode well for the healthcare services market 2. Proportion of households in the low -income group has declined 3. Rising income expanding rich and middle income group 4. Shift in disease profiles from infectious to lifestyle-related diseases are expected to raise expenditures 5. In the inpatient market, the share of infectious diseases is expected to decline from 19 per cent in 2004 to
16 percent in 2008.
The Rural Healthcare: an Opportunity or a Challenge? Challenges posed by the rural environment often exacerbate already complex health policy problems. Our Nation as a whole is struggling with issues related to:
• Providing access to care for the large and growing number of uninsured persons. • Reducing infant mortality & improving health of mother • Caring for an aging population. • Aligning financial incentives for payers, providers, and patients. • Integrating population-based services with personal health care services. In rural areas, these problems are further complicated by: • Geographic isolation. • Transportation barriers. • Population those are generally older and less affluent. • Shortages of financial, human, and capital resources.
Although the challenges facing rural communities are formidable, the opportunities for improving health and health care services are also great. Many believe that government at all levels will continue to play a crucial role in

1404
providing targeted subsidies or enhanced payments to providers located in rural areas. The private sector also can play a major role if they can harness the vast opportunities that are available at the base of the pyramid. In the World bank publication named Innovations in Health Service Delivery [7], the editors Alexander Preker and April Harding discussed about the corporatization of Public Hospitals as most of the national governments are finding it very difficult to meet the expenses incurred as also meet the growing aspirations of the people in quality of the service provided. Here is an opportunity of for the corporate to meet the social responsibility as well as earn some revenue for the stake holders. Many of the major players in the private sector have started to change their direction. They started to discover the latent potential in the rural for an improvised and low cost technology. House of Tata is a role model in India so far as corporate social responsibility is concerned and they started the Tata Memorial Hospital in Mumbai to meet the growing needs of the people for cancer treatment. They have a section where poor people can get free treatment. Over the years, the reputation of the hospital reached such a height that patient of all income levels from various parts of the country as also neighboring SAARC countries are pouring into Mumbai to get treated for this deadly disease. This success led the Tata to start a similar hospital at Kolkata by investing INR 5 billion. Here is an example of how CSR and Business Plan are converging. Health is Wealth That’s what is being realized by the corporate. With major work force for the factories particularly in the shop floor coming from the Tier 4 or the BOP, much emphasis is being given to the healthcare at this level. There is a large market for health services in this level of the economic pyramid. Science and technology are often termed as a double edged weapon, but it can be said that technology is a multi- edged weapon. In the case of the bottom of the pyramid, technology can be best utilized to provide a cost effective health facilities to the people. Since the income level of the people at the BOP is very low, they can’t afford costly healthcare. Making cost effective does not mean that they should be provided with inferior quality goods. Some of the examples of the companies that have started their campaigns for the up bringing of the healthcare in the rural area are P&G, Glaxo, and Philips etc. Focusing on the healthcare project of Phillips India, there are lots to it. A brief of their plans and initiatives is given below. Philips India- Rural Healthcare Philips India, a subsidiary of the Netherlands based Royal Philips Electronics, the Indian Space Research Organization (ISRO), part of the Department of Space under the Ministry of Science and Technology, Apollo Telemedicine Networking Foundation (ATNF) and Development of Humane Action (DHAN), a Madurai based NGO are jointly involved in DISHA (Distance Healthcare Advancement) - a project aimed at meeting the healthcare needs of the less privileged in India. Each is a strategic partner in the project bringing their unique capabilities to deliver the Project's aims.
DISHA, a telemedicine initiative is a business plan conceived by Philips India for providing distance healthcare to the underserved people at the base of the economic pyramid. Healthcare is a core focus area for Philips and the company has a clear vision to make technological innovations in healthcare accessible, available, and affordable to wider sections of people around the world. DISHA is a step in that direction. The project will meet the needs of India's more vulnerable groups who need adequate but affordable healthcare.
This strategic partnership between a Government agency (ISRO), the largest healthcare service provider in Asia (Apollo), one of the most respected NGO in the country (DHAN) and a global leader in imaging and medical diagnostics (Philips) is the first of its kind in India and is an outstanding example of public-private partnership in addressing one of the country's key concern areas.
In 2004 Philips commissioned ACNielsen (with support from ICG Consultants) to conduct a qualitative and quantitative research in India, which revealed that people in rural areas with lower incomes spend a higher proportion of money on healthcare than their urban counterparts. A large percentage of costs go to paying high interest rates on loans for healthcare, while travel and lost work time accounts for much of the remainder. Early

1405
intervention in a health crisis is therefore critical in dealing with poverty. The DISHA initiative is being piloted in Theni district in Tamil Nadu and was formally inaugurated recently in Madurai.
Philips, a leader in high quality diagnostic equipment, has custom-built a tele-clinical van complete with diagnostic equipment, including an ultrasound machine, X-ray machine, a defibrillator and an ECG machine. This van with dedicated doctors and other Para-medical staff will operate in the areas around Theni district in Tamil Nadu.
ISRO has in the past couple of years, taken the initiative for a satellite-based telemedicine network in the country to reach super specialty healthcare and consultancy to rural and remote area population. For the DISHA project, ISRO is providing the connectivity through VSAT and allocating the required bandwidth on its INSAT satellite free of cost.
Apollo Hospitals Group is a pioneer in the field of Telemedicine in India and is credited with being the first to set up a rural telemedicine centre in the village of Aragonda in Andhra Pradesh. Apollo Telemedicine Network Foundation (ATNF) with 76 telemedicine centres including 5 overseas has today emerged as the single largest Telemedicine solution provider in India.
The Apollo Specialty Hospitals, Madurai, the leading super-specialty tertiary care hospital in Madurai is the referral hospital for the DISHA mobile tele-clinical van. Apollo will make available to Philips the required doctors and paramedical staff in the van, as also train the medical and paramedical manpower. Apollo's specialist doctors and operational staff at its hospital in Madurai will provide specialized diagnosis and care for patients visiting the mobile tele-clinical van. DHAN Foundation provides the vital link to the local community and will play a key role in community participation for the project. DHAN will provide counseling (through domiciliary follow-ups) to the patients on nutrition and hygiene. They will train volunteers from the villages to motivate and play an active role in counseling. This will enable the villagers to directly participate in the implementation of the project.
“Philips is a Healthcare, Lifestyle and Technology company. Our vision is to be able to improve people's quality of life through the products we offer and the markets we serve. Our challenge lies in expanding our scope to new markets and new business opportunities with sustainability as the key driver” said Mr. Ramachandran CEO Phillips India.
“Today the population growth is highest in emerging markets especially in the mid and low ends of the economic pyramid. Technology can help drive sustainable solutions that bridge the divide between the privileged and less privileged sections of society and improve the quality of life at all levels. However, new value delivery models need to be created to make this happen and this strategic partnership is a step in that direction” he added
In India, 80% of the population lives in the rural areas, whereas 80% of the medical community lives in the cities. 11% of the world's population, which resides in the rural areas of India, remains devoid of quality healthcare. This scenario could change with the use of Telemedicine, that would bridge geographical distances and provide healthcare to those sections of the society that currently don't have access to quality healthcare. Through telemedicine we transfer the knowledge and not the patients, who are then treated at their respective villages. This is very convenient, cost and time effective.
Opportunity at the Bottom of the Pyramid
Hindustan Lever Ltd. (HLL), a subsidiary of Unilever PLC and widely considered as one of the best-managed companies in India, has been a pioneer among MNCs exploring markets at the bottom of the pyramid. For more than 50 years, HLL has served Indian elite who could afford to buy MNC products. HLL’s rural marketing department adopted a customer-centric approach with the ‘Project Bharat’ programme that involved a direct marketing method. This enabled HLL achieve higher penetration in rural homes by studying the awareness, attitudes and habits of rural consumers. The modus operandi involved use of vans that offered a price-pack consisting of small-unit detergent, toothpaste, face cream and talcum powder - for Rs.15. Video shows were used by the sales reps to explain the benefits of using these products. The affordability factor was a decisive one for the sampling exercise. To build on the success of this initiative, HLL used the ‘Integrated Rural Promotion Van’ programme to ensure that its products

1406
reached even villages where the population was over 2000 people. To reach out to the villages having a population less than 2000, HLL used self-help groups by providing them self-employment opportunities. Banks provided micro-credit that enabled these villagers to purchase stocks from HLL and start selling them directly to consumers. This was the first step in educating the villager personal care which was immediately followed by health and hygiene that were fostered through the usage of its products. To spread the message, it formed tie-ups with Non Government Organizations (NGO) and voluntary organizations, United Nations Development Programme (UNDP) etc. The aim was to cover 75 per cent of the population from the current 43 per cent. The ‘Project Bharat’ programme enabled HLL to reach out to 13 million rural households by the end of 1999. It enabled higher growth rates of its products in rural areas compared to urban areas. HLL continued to use relevant tie-ups to further its rural marketing efforts. While addressing the share holders at the Annual General Meeting in May 2007, Mr. Harish Manwani the chairman of HLL reiterated Unilever’s commitment to fight against child hunger and providing nutritional expertise and financial support to the poor families. In partnership with UN scheme of World Food Program (WFP), the company is working “Together for Child Vitality” in countries like Ghana, Kenya and Columbia as the starting point. This three year partnership is a part of UN Millennium Development Plan for alleviating extreme poverty and providing primary education. In 2001, HLL embarked on the ‘Project Shakti’ programme that has received a lot of media attention owing to its objective of empowering underprivileged rural women. HLL focused on villages having a population less than 2000 people and launched the Shakti Vani programme that not only provided income opportunities for the women but also provided health and hygiene education. The Shakti programme covered 50,000 villages in 12 states in India that included Andhra Pradesh, Karnataka, Gujarat, Madhya Pradesh, Tamil Nadu, Chhattisgarh, Uttar Pradesh, Orissa, Punjab, Rajasthan, Maharashtra and West Bengal. (http://www.hll.com/citizen_lever/lifebuoy_chetna.asp) [9]Drawing inspiration from Grameen Bank of Bangladesh, micro credit enabled these under privileged women to earn close to Rs. 750 and in some cases up to 2500/-. HLL successfully roped in the state governments and several NGOs to support the effort. According to HLL it is double the average household income. There are about35, 000 women who have already joined this programme and they are reaching 100 million rural consumers thru’ 100,000 villages by 2006 It is an excellent business strategy of reaching and penetrating market to enhance market share. This is a cost effective way of reaching more than 2 million rural households. [10] This is where the convergence of marketing and CSR takes place with innovative approach. Conclusions
It can be seen from the above facts and figures that many organizations are doing lot of philanthropic work to meet the corporate social responsibilities. However that alone can not solve the problem of health care delivery to the bottom layer of the economic pyramid. There has to be revenue generation for the corporate to meet their stakeholders’ aspirations otherwise it remains a social reform agenda that will remain a co curricular activity. We may draw the following conclusions:
• Delivery of health and hygiene offers a great opportunity to corporate sector • The size of the market is billions of dollars and innovative products and services can bring in additional
business to corporate world. • Development of cost effective sanitary napkins may rake in millions of dollars and eliminate lot of health
problems. • Similarly educating the rural populations about health & hygiene will meet some social objectives and also
promote the products as was done by HLL for their brands Lifebuoy soap & Pepsodent toothpaste • Another challenge is the logistics of delivery of modern and advanced treatment that can be done thru’
modern technology as was done by a consortium of ISRO, DHAN and Apollo Hospital. • In the study made by Philips India thru’ AC Nielson proved that BOP population in the villages spend more
money than their urban counterpart and thru advanced technology this potential can be tapped. It will also eliminate self medication and lost wages due to travel. Deployment of the latest technology will make the

1407
availability better, reducing the cost factor and avoiding self medication. This will also make it cost effective and elimination of over medication which many a time is harmful in the long term.
• Some isolated efforts of the corporate are there but it has to be made a movement to tap additional market segment and meet the social responsibility of the corporate.
References
[1] Banerjea P K (2006) Innovations to Serve the Bottom of the Pyramid Paper presented in the Conference on
Corporate Social Responsibility organized by WCFCG,IOD & CSR on 15 – 17 February at Vilamoura Portugal
[2] Gottret Pablo & Scheiber George 2006 Health Financing Revisited Delivery The International bank for Reconstruction & Development / World Bank Washington DC
[3] Gwatkin, Davidson, Shea Rutstein, Kierrsten Johnson, Rohini P. Pande& Adam Wagstaff. 2000Socioeconomic Differences in Health, Nutrition and Population in India. HNP Publications Thematic Group Washington DC World bank
[4] IMF (International Monetary Fund) and World Bank 1999aPoverty Reduction Strategy papers—Operational Issues. Draft for Discussion.
[5] Prekar Alexander & Handing April (2003) Innovations in Health Service Delivery The International bank for Reconstruction & Development / World Bank Washington DC
[6] ---1999bBuilding Poverty Reduction Strategies in Developing Countries (poverty.worldbank.org/files/building_english.pdf)
[7] ----1990cHeavily Debted Poor Countries(HPIC) Initiatives-Strengthening the link between Debt Relief and Poverty Reduction (poverty.worldbank.org/files/strengthening_link_english.pdf)
[8] --- 2001Poverty Reduction Strategy Papers---Progress in Implementation 2001 (poverty.worldbank.org/files/prsrprogress.pdf)
[9] Yazbeck Abdo S. & Peters David H. 2003 Health Policy Research The International bank for Reconstruction & Development / World Bank Washington DC
[10] Prahalad C K (2005) The Fortune at the Bottom of the Pyramid Wharton School Publishing [11] (http://www.hll.com/citizen_lever/lifebuoy_chetna.asp [12] Manwani Harish Chairman Hindustan Lever Limited Speech at the AGM held in May 2007

1408
Studies on Conditions of Brand Extension and the Framework of Evaluation
Zhou Yun, [email protected] Liu Ruihan,
Beijing University of Agriculture, China Zhang Jing
Beihua University, China
Abstract Apart from owing the value of the core mechanism, most of rand assets came from brand extension. Consequently, the study on brand extension is the vital important aspect in the brand research fields, on top of that, it is also a question that we can not avoid. However, the studies on brand extension always lag on the brand essence. This paper based on the forward achievements, by normative analysis for the conditions of brand extension, to arrive at the conclusions of the brand extension functions, and bring up the evaluating framework for the brand extension. Key words: brand extension, brand assets, framework of evaluation Introduction The main value of brand assets came from brand extension. As is known to all, the costs and risks of establish new brand is more and more high, the approximately expense of creating a new brand are between $50,000,000 and $100,000,000 in developed countries. To build an international famous brand, the outlay will reach $1,000,000,000, Even if such expenses have been invested, it does not mean that the new brand will be successful. In general situations, less than 30% of the new brands can survive in the market for three years. So, the brands’ extending ability becomes the most important factor to determine the realization of brand value. At the same time the brand extension is the most common application in brand-building practices. Take the USA as an example, in the past ten years, among the new-launched consuming products, about 95% belongs to brand extension, and the new brand product is merely 5%. Therefore, the brand extension has all the while been the exploring object for the brand researchers. Brand Extension There still be no uniform definition of brand extension, the scholars have different views in their special researching fields. The definition of marketing is rather representative, it is generally believed that the brand extension is a strategic decision between increase the new product line or new brand, and it refers extending a well-known brand or a successful brand with marketing influence to totally different products (Zhang, 2005). A rather straight forward expression is that brand extension refers to, based on the brand status, extend core brand to new products or services, with the expectation of reducing the risks of marketing new products and gaining greater market returns with fewer marketing costs. (Hu, 2004). There is also another definition that Brand extension is a marketing strategy, based on quite well-known brand in the market, to name new products or services with the existing brand in order to reduce the risks of launching new products (Ding, 2005).
Those definitions of rand extension are based on viewing the brands as a marketing tool, however the development of brands research goes beyond that. After brand relations theory, the essence of the brand could be expressed by the value of brand equity and brand operating system. So the understandings of brand extension could not be a simple marketing tool. The perspective of brand extension should be an operating system, rather than a simple marketing tool.
Mechanism of brand extension building on the Brand management system is not only the researches on products’ correlation degrees under brand, brand Cognitive, and psychological mechanism of brand extension, but

1409
should make it possible to abstract the extension of general sense of products from the brands, and understand essence of the role of extension. The best abstract method is to establish the Brand Extension Model. Brand extension theoretical model is the advanced issue of brand theories. In the past, many studies have focused on the elements composing the brand model. After all, brand itself is not only an independent functional system but also an aggregate of many subsystems. Even if the model is set up, the occurrence of the corresponding conditions are still difficult to achieve. Therefore, we view the activity of brand extension as the campaign of subsystems synergy relations, and the result of coordinated interaction between subsystems. We don't believe the model is determined by some certain variable, and researches on extension will no longer be stuck in the elements and elements relations. More importantly, we solve the problems of perspective of the essence mechanism by point of view of accruing conditions. Conditions of Brand Extension While abstract the Brand as a complete operating system, the factors influence the conditions of brand extension can be categorized into the following three aspects: firstly, the open degree of brand system; secondly, the exclusive degree of brands system’s surrounding environment; thirdly, the correlation degree between brand system and extending environment. The following three aspects will be discussed: The Open Degree of Brand System Every developing system is opened, so is brand system. It is continuous developing during the process of necessary contacts and exchanging with the outside. Whether a brand can extend or the degrees of brand extension were all constrained by the extent of openness of the system itself. The degree of openness is negative correlate with the degree of specialization, and the higher level of openness system is, the weaker the specialization get. The system openness will be restricted by specialized power. Therefore, we can describe their degree of specialization in the countdown to the brand extension of this nature.
The degree of a brand’s specialization is fixed by the initial time of brand’s establishment, i.e. the positioning stage in marketing. The higher degree of the segments of the Positioning products covered by Brand System is, the higher degree of specialization is. The brands with high degree of specialization are well accepted by consumers because that building brands system in a segmented market will reach the brand relationship easily than the less specialized brands. However, the further extension will be restricted by their original position, and it is difficult to utilize the nature brands extension to fulfill the value of extension. As expatiated as above, we can draw the degree of openness of brand system as follows:
the degree of openness=1⁄the degree of specialization
the degree of specialization=The degree of the segments≈segment market⁄total target market This access to a general assessment indicator: µ1 represents the degree of open system, I represents the capacity of segment market, and M represents the capacity of total target market.
So, we can get the formula: µ1 ≈Ι⁄Μ formula ①
µ1∈﹝0,1﹞ The primary theory is brand oneness theory which distorts the brand specialization frequently, i.e. the brand only has one concept and one kind of core value, even if two different products belong different industries, after abstracting, the identical concept and core value adapt to the basic conditions of extension. Using the degree of openness of brands system to describe the brand extension is much more accurate than the associate degrees of products. The Exclusive Degree of Brands System’s Surrounding Environment Exclusivity means certain individuals were excluded from the consumer products interests. When consumers pay for private goods, other people can not enjoy the benefits brought by such products or services, and they have to pay enough money to consume the product. An operating environment could be an industry or a product market, if only it matches the qualification of existing and extending of brands system, then we can take it as the brand extension environment. The developing environment which brands exist in is independent opening system, and can be viewed as an entity with many attribute. Exclusivity is the most correlative attribute with brand extension, and it is the most factor affecting brand extension and capability of extension. The more exclusive environment is, the lower level of

1410
compatibility the brand extension is, Vice versa. There are several indexes to estimate the exclusivity of marketing environment, mainly determined by the
market’s position in lifecycle and competitive extent. Some studies showed that the efficiency of brand extension in the introduction stage is better than in the mature stage. The more mature, the more exclusive market is. By estimating the specific market, we can position the market in the stage of life-cycle. To denote the degree of maturity, we use percentage depth dose from the introduce stage to the top of maturity stage. Since the decline stage is following with top of maturity stage, the value of brand extension in those stages is to small to ignore, we will not take those stage into account. We use α to represent market maturity.
Saturation degree is the general index to estimate the competition, and usually use the ratio of the real market supply capacity to maximize market capacity. The bigger the ratio is, the more fierce competition is. we use βto represent the open degree of system, s to represent he real market supply capacity, and Ζto represent maximize market capacity of target market environment system. Then we can draw the following:
β=s⁄Ζ
To sum up,we use µ2 to represent the index of exclusive degree of brand system surrounding environment, and
draw the following formula:
µ2=µ2[α,β] formula ①
µ2∈﹝0,∞﹞ The Correlation Degree between Brand System and Extending Environment The degree describes the correlation of abstracted brand system and extending environment. One of brand system`s manifestation is the information class, which is the abstracted brand symbol system, it reflected the mutual accepted parts between brand accepter and brand manufacturer. Originally, the brand was used in marketing, always act as a tool of diversity, it`s manifestation can be understand as the course of identification abstraced between the brand of product and consumers, until the brand symbol system have matured completely, marked that the course of abstract finished.
The course of a brand develop from the concrete to the abstract, the mature mark of brand is the integrity of symbol system. If a brand possessed the ability of extension or not, is not controlled by brand system, in the long-term practice, consumer have a blur understanding to every industry or segmental market. In order to simplify course of memory and choice, these blur understanding will be abstracted as symbol, and stable comparatively.
The market that covered by brand system do not compare with brand itself, after extension, they will abstract respectively, compare and contrast interaction,a compared model can be established. The correlation is more weak,the brand extension is more difficult, vice versa. Based on the difference of consumer experience, the degree of abstract is difference. The evaluation about this course, need to establish a caompared model of matrix. The course can be expressed in vectors.
µ3 is the degree of correlation between brand system and the environmentof extension. Γ1[µ1] is the vectors of abstract degree of brand system. Γ2[µ2] is the vectors of reflect degree of consumer
Then we can draw the following:
µ3=Γ1[µ1] ·Γ2[µ2] formula ①
Unfold Γ1[µ1]:[0,µ11 ,µ12 ,µ13 …µ1n] ,among them:0 is a concrete entity,µ1n was abstracted
completely,Unfold Γ2[µ2]:[0,µ21 ,µ22 ,µ23 …µ2n], 0 is the knowledges of consumer are conform to the characters of market completely, µ1n was abstracted as character of feeling completely.
and draw the following formula:

1411
µ3=Γ1[µ1] ·Γ2[µ2]=[0,µ11 ,µ12 ,µ13 …µ1n] · [0,µ21 ,µ22 ,µ23 …µ2n] Estimating Framework of Capability of Brand Extension Capability of brand extension is produced by the interaction of brand system and environment system. When the interaction between the subsystems is equal, the conditions of brand extension are fulfilled. The relationship of above three indexes can interpret the interaction between brand system and environment either. The relation between the open degree of brand system and exclusive degree of brand surrounding environment is independent. the
correlation degree is the relation of brand system and the extending environment,and the relation is built on µ1
、µ2 、µ3, given by the following formula:
µ =Ε(µ3) [µ1 ,µ2] formula ①
put it into formula ①,we can get the following formula:
µ =Ε(Γ1[µ1] ·Γ2[µ2] ) [µ1 ,µ2] formula ①
put formula①, ①into formula ① ,we can get:
formula: µ1 ≈Ι⁄Μ formula: µ2=µ2[α,β] µ =Ε(Γ1[Ι⁄Μ] ·Γ2[µ2[α,β]] ) [Ι⁄Μ,µ2 [α,β]] formula ①
The formula① is the model framework to estimate capability of brand extension incorporation operating system.
Conclusions This paper bases on the character of brand operation system, interprets the conditions of brand extension, and brings up the evaluating framework for the brand extension. Calculation of extension theory, same as the Brand Mechanism, is also built on the demonstration. Therefore, launching further research to framework is to study on the ability of Brand extension to find out the correlation coefficient.
References
Contact authors for the list of references

1412
Re-defining Brand Value under the Influence of Shifting Consumer Behaviour
Helena Malisova, [email protected] Peter Starchon, [email protected]
Comenius University, Slovak Republic Abstract In the last years, the number of “green and ethical” brands has increased as a result of shifting consumer behaviour in favour of environmental and ethical consumerism, mainly in North America and the EU. This paper gives a brief introduction into the new market realities of global and national markets, which include, among other factors, a shift in consumer purchasing behaviour and their power to influence companies’ practices and products. These new market conditions may have significant implications on brand building, as well as its management. The purpose of this paper is to bring into a discussion a holistic approach in creating values associated with the brands, which may lead into a new model of brand building. It is argued that companies with the ability to adapt quickly to changing market situation may gain bigger market share in contrast to those who continue thinking according to the rules created 50 years ago. Introduction Every sequence of several centuries the society goes through a significant transformation stage. Within several decencies every society transforms itself - its overall worldview shifts, its basic values and norms move, social and political structures change, arts and the key institutions adapt according to the changes and trends in the external environment (Drucker, 2006). Today’s fundamental changes, started over thirty years ago, are only the beginning of new future realities. To name some of them, Kapferer (2001) identifies the following factors, which create new market conditions: mega-distribution power, new consumer power bolstered by the Internet, new unconventional Internet competition, consumer and media fragmentation, the rise of local identities in reaction to the forces of globalization. The other phenomenon, which influences the ways companies do their business, is a rise of ethical consumerism around the world (Harrison, 2005). This paper focuses only on selected factors that have a growing impact on the perception of brand value and the management of brand. Shifting Consumer Behaviour Increase of level of literacy of the population and ease of information flow through the Internet has created new realities that completely change market conditions and how companies do their business. The corporations are no longer closed organisations, but through the Internet they become ever more open and interactive places for providing and receiving information as well as exchanging ideas, stories and experience that consumers have with their products and shopping per se.
Internet brings consumers into direct contact with the company’s values by involving them on their personal and behavioural level (Kapferer, 2001). It is largely used by many consumers to learn more than just about the company’s products, but also to “check” whether companies behave responsible towards its stakeholders and different society groups.
Today’s consumers are more than ever interested in how companies create their values (Willard, 2005). Big corporations like Nike, C&A, H&M, Next, Nivea, L’Oréal, British Telecom or Ford Motor Company promote on their websites not only their products, but make available information that goes much beyond the traditional marketing „promote-sell“ strategy. This consequently alters consumers’ attitudes towards companies and their purchasing behaviours while choosing different products.
Global companies often speak about global issues such as environment, climate change, health and safety issues or poverty and human development, which traditional marketing was not used to. Most of the famous

1413
garments’ brands such as Nike, Next or C&A have been progressively introducing ecological labels and/or informative labels about their socially responsible activities. H&M, for i.e. attached to certain articles a label showing the company’s commitment to tackle water scarcity in the selected developing countries.
An increased awareness about global challenges among the consumers forces companies to speak and react on the issues that where not on their agenda a few years ago. This is all due to a rise in the number of ethical consumers around the world over the last two decades appears to be unprecedented (Harrison, 2005). If one would tape “ethical consumer” into the Google search in 11 April 2007, 1 610 000 related messages show up. To try searching for “effects of multinational corporations” 1 160 000 and just for two words “global challenges” the number is much higher and reaches 160 000 000. Search engines such as Google, Yahoo and other local search engines make extraordinary easy, and in global scale, access to all kind of knowledge and information that consumers may require and use when they make purchasing decision.
Additional specific examples of the various impacts of information and communication technology on consumer behaviour can be mentioned (Business Dialogue. NCFSD, 2006): e.g., the availability of increased and better information with the emergence of web-based markets such as e-Bay [making more ‘anarchic’ but also possibly better functioning markets), digitalization and ‘de-materialisation’ (goods are substituted by services, e.g., music being downloaded over the web rather than bought on CDs) accessibility of all kind of sources of information related to the quality and origin of the products, the company’s practices and behaviour make consumers much more knowledgeable and informed than it was before the spread of informatization age.
Recent EU Special Eurobarometer 217 - public survey - published in 2005 by the Environment General Directorate shows that nearly half of the respondents are worried about “water pollution” (47%), “man made disasters” (46%), “climate change” and “air pollution” (both scoring 45%). The fifth most mentioned issue is “the impact on our health of chemicals used in everyday products” (35%). In average climate changed worries 45% of the EU citizens (this issue is not perceived as the most important for citizens in the New Member States - NMS - than it is in EU15 original countries). Finally, men seem to be significantly more concerned about the issue of “climate change” (49% versus 41%) while women seem to be more concerned about natural disasters, and the “impact of chemicals on health” (35% versus 28%). The greatest concern was expressed on the issue of “increasing quantities of waste”: 43% for NMS citizens, in contrast to 27% for EU15 citizens. “Air pollution” is a greater concern in the 10 NMS at 52%, (in fact, it is the second highest concern for people in these countries). In the former EU15 the issue scores 43%. According to the same survey, scores on “air pollution” in all 10 NMS are above the EU-25, and on average reached 45% of the answers.
Societal concern about the quality of the environment, intensified by daily media news, documentary films and radio broadcasting about the causes and consequences of human activities on the natural ecosystems and climate, strongly influence individual aspirations, attitudes and change purchasing strategies and behaviours towards more environmentally friendly and ethically produced goods and services.
Local, regional and global social and environmental organisations and movements as well as think-tanks (i.e. Worldwatch Institute, Greenpeace, World Conservation Union, OXFAM, International Faire Trade Organisation, World Resource Institute, and International Institute for Sustainable Development, just to mention some of them) have also a transformative impact on how people think and behave.
Changes related to the size and age structure of the population, degree of education and level of income are another factors relevant to the market. Ageing of population and reducing of family size in many developed economies have radically changed the way we live. UN Organisation in the report World Population Prospects: 2000 Revision predicts that European population will decline rapidly from 451 million in 2000 to 110 million in 2050, but immigration rate will remain high. The report showed that almost every European country is experiencing very low birth rates. Effects of demographic trends on retirement age and health could create an increased demand and consumption of health- and personal-care products and services, and overseas travel, as people have demands to be satisfied during a longer life. These demographic trends have direct consequences on how, what and where people will buy and in what quantities.
Growing number of government laws and regulations in favour of environmental protection as well as environmentally-friendly consumption and production are also direct consequences of changing society attitudes and opinions about ecological values. Looking back to the history of the European Union, in October 1972 the EU put

1414
into effect the first environmental legal act. At the time of writing this paper (March 2007), the European Union has more than 700 items of Community legislation relating to environmental protection (reference to the European Parliament Fact Sheets), including more than 200 legal acts to monitor (according to the EU, DG Environment web site). These legislative measures cover all environmental sectors, including water, air, nature, waste, and chemicals, and others which deal with cross-cutting issues such as access to environmental information, and public participation in environmental decision-making.
To summarize the main aspects of the growth of ethical consumerism, Harrison (2005) proposes the following factors:
• the globalisation of markets and the weakening of national governments • the rise of multinational corporations and brands • the rise of campaigning corporations and brands • the social and environmental effects of technological advance • a shift in market power towards consumers • the effectiveness of market campaigning • the growth of a wider corporate social responsibility movement
Emerging “Eco-hedonism” “Eco-hedonism” (taking pleasure from buying ecologically friendly products of high quality) creates an increasing demand for more ecologically and ethically produced goods and services in all EU countries. In some countries like Austria, Germany, Switzerland, Denmark or Great Britain “ecological consumerism” make green products “cool to care” as stated in the Business Dialogues 2006 of UK National Business Council for Sustainable Development.
At a time when net disposable income continues to grow, particularly in the NMS (ICEG EC, 2005), the individual consumption patters change and consumers determine what they see as socially desirable or acceptable products. A recent Czech survey showed that Czech consumers progressively prefer to consume healthier food, including organically produced, and Czechs pay more attention on the origin of the food if compared to the previous years (Main TV News, 10 May 2007).
The findings from the survey “Organic food Products Surge Ahead” published in January 2007 by GfK Germany show that organic products are a market with a future. Already last year, as many as 90% of all German households bought at least one organic product and the number of purchases and amounts spent on these products is continually rising.
According to the report prepared by United Nations Economic Commission for Europe and FAO, Danish consumers are very interested in environmental topics (98 % think that it is very important to take care for the environment) and are also willing to pay more for the sake of the environmental protection. They indicate that they would pay up to 43 % more for the products provided these products have lower environmental impacts than the conventional ones, and knowing that their use may have a positive impact. The main reason why Danish buy green products is environmental protection (76 %), followed by a wish to sustain their health and prosperity (51 %). These findings can be compared to the Czech survey, prepared by Synergy Marketing and GfK Czech Republic in 2006, showing that organically produced food increased by 30% in 2006 to compare to 2004. Those respondents who buy regularly green products do it, above all, due to health reasons. The criterion of nature protection does not matter to them as much as to the Danish consumers.
According to Mori survey conducted in 2000 on behalf of CSR Europe (a European non-profit organisation promoting CSR concept) across 12 European countries, 70% respondents said that a company’s commitment to social responsibility is very or fairly important when they are making a purchase decision, which includes a quarter of those for whom it is very important. The survey further showed that social responsibility is seemingly most important in Spain, Belgium, Switzerland and Great Britain. Moreover, around one in five of the public across Europe would be very willing to pay more for products that are socially and environmentally responsible. This opinion was the strongest in Denmark, Spain, Sweden, the Netherlands, Switzerland and Finland. (Mori and CSR Europe, 2000).
Another survey of public in 23 countries, conducted by Environics in 2000 revealed that for the first time responsibility issues such as treatment of employees, community commitment, ethics and environment were

1415
mentioned more often than product and brand quality as important factors in forming an impression of a particular company (Environics Millennium Poll, 1999).
The recent UK poll - The Future Leaders Survey 2006-2007, prepared and launched by Forum for the Future and Universities and Colleges Admissions Services, provides interesting findings into the hopes, fears and expectations of 54,240 UK's university students aged 17 to 21, for the academic year 2006-2007. The survey was based on the premise of what the world will be like in 25 years. The majority expects quality of life in the UK to improve but 91% think climate change will be significant, and 80% think inequality between rich and poor countries will continue to grow. According to the questionnaire results, two thirds believe global oil reserves will have run out. 76% believe lifestyles need to change radically in many areas, to tackle climate change and other environmental challenges. The report further highlighted that respondents think of themselves as less healthy, more affected by crime, more worried about the future, and more materialistic than their parents were at their age, 65% see themselves as more materialistic, and only 6% think they are less. 55% of respondents believe they are more concerned about the environment than their parents were at their age - identifying the main reasons for this as a growth in awareness for current challenges. When asked to name the type of actions taken for environmental reasons, the respondents gave the following answers:
• 40% had bought locally produced food instead of imported food • 34% had avoided large chain stores and favoured locally owned shops • 22% had taken part in a demonstration or protest march and 17% had written to their MPs • 17% had taken a holiday in the UK instead of travelling overseas • 26% had joined a third world development charity and 14% joined an environmental charity or
pressure group The Future Leaders Survey may be a sign for nowadays government and economy leaders to look at.
Today’s young people are future leaders. Studies like these should be a reference for marketing experts as to think on appropriate strategies to be adopted, as today’s young people become tomorrow’s main consumers.
World celebrities show new preferences, too. “What would you drive if you could afford any car in the world?” That was the question for Hollywood starts like Cameron Diaz, Brad Pitt, Alicia Silverstone, and 33 others, all driving around Hollywood in their hybrid cars (Celebrity Hybrid Cars Web site). With so many celebrities showing themselves in the hybrids, it's hard to ignore their potential influence in getting more people to think about switching their gas-guzzlers for a hybrid car.
Still, there are many paradoxes in consumers’ behaviour and disagreement between what people think is good and right and how they act. In Mori survey of public opinion (2000) with CSR Europe showed that despite the high level of concern expressed by the public on ethical issues in their relationships with companies, half of the British respondents (53 per cent) agree that they are sympathetic to social and environmental issues but not active (Mori and CSR Europe, 2000). This dissonance is unlikely to counter-balance what consumers are concerned about from their consumers purchase behaviour. Already cited report Business Dialogue from UK National Business Council for SD showed that consumers know what behaviours are unsustainable and yet, are highly selective about which products or personal behaviour they choose to change. For instance, they may switch off lights but still use cheap air travel to go on holiday more frequently.
With changing market conditions, alongside with shifting consumer values towards environmental and ethical consumption (Calvin and Lewis, 2005) companies should adapt and elaborate strategies based on the questions how the market is today and will be tomorrow, rather than based them on the old paradigms and assumptions. Strategy elaboration represents a key process within each company aiming at continuous and goal-oriented development of its business activities. The importance of strategic planning rises in the period of uncertainty and permanently changing external and internal conditions. The major challenge relates more to the identification of critical factors that will shape the new futures than to the actual description of the market situation. Managing and building brands in turbulent times therefore have to quickly adjust to the new realities and uncertainties.

1416
Categories of Emerging Conscious Consumers Conscious consumers differ from the conventional ones in many aspects. According to Roper Starch Worldwide (Roper, 1996) there are five different consumer segments, classified into the following consumer categories in Table 1.
TABLE 1: CONSUMER CATEGORIES
True Blue Greens
Hold strong environmental beliefs and live accordingly. The most “fired” from all environmental activists, they believe they can personally make a difference in reducing environmental damage through personal green-shopping and political and social activism. They devote time and energy to environmentally cautious practices and they try to influence others to behave the same. True Blues are more willing to support financially environmental organisations and more likely to boycott products made by companies that do not action an environmentally responsible manner. They are the most educated in terms of received education out of the five groups; many of them hold executive or professional positions in various private or public organisations.
Greenback Greens
They are willing to pay extra for environmentally friendly products. Although they are very much concerned about the state of environment and support environmental associations and NGOs, still they feel too busy to change their lifestyles and behaviour. Greenbacks are generally not politically active, but are ready to pay and support green products through product price premium (you said this already above). “Green” shopping within this group is very high.
Sprouts
They are ready to engage in environmental activities but only when it requires little or no effort. Actions like recycling, when supported by local municipal law, are their main green activity. They read labels - although less often than the True-Blues and Greenbacks. Their concerns for being green ends at the supermarket cashier: Sprouts generally will not choose a green product if it is more expensive than other products. When they do, they are only willing to pay up to 4 % extra. They are well educated, and most of them are married. With more education and information, they are often the source for new Greenbacks and True-Blues.
Grousers
Do not believe that individuals play any significant part in protecting the environment. They feel the responsibility remains with the government and large corporations. Grousers complain that they are too busy to get involved in any environmental activity, and at the end, green products are expensive. Finally, they believe everything they do will have no positive impact on the current unsustainable consumption and production anyways. Their overall attitude is that it is not their business to care.
Basic Browns Are overall not convinced that environmental problems are that serious as for them to pay attention. They just don’t care. The largest of the five groups, Basic Browns have the lowest median income and the lowest level of education.
Not all “deep green” consumers (True Blue Greens) have the same characteristics and reasons why they
buy green products. It is possible to further segment them into sub-categories, reflecting the major types of environmental issues that are of their interest. Jacqueline Ottman (Ottman, 1998) divides them into the following three sub-categories: Planet Passionates, Health Fanatics, and Animal Lovers.
With the goals of protecting natural environment and keeping the wildlife pure and untouched, Planet Passionates focus on issues relating to land, air, and water. They recycle bottles and cans, avoid overpackaged products, clean up shores, forests and rivers, and boycott tropical hardwood producers, and companies that do not behave responsibly. They often belong to the social group of people supporting a lifestyle known as “voluntary simplicity”, which is about living a meaningful life - one in which an individual determines what is important, or "enough," for him or her, and neglects the rest.
Health Fanatics, as understood from their name, are mainly concerned on the health consequences of environmental problems. They worry about, for example, getting cancer from too much exposure to the sun, genetic defects from radiation and toxic waste and hazardous chemicals and on the long term impacts on their children’s health of pesticides on fruits and vegetables. Health fanatics frequent natural food stores and eat organic foods.
Animal Lovers, the third major group of deep greens, protect animal rights. As an example of their actions, they do not eat meat, product of a mass production. Or, they simply become rather vegetarians than meat consumers.

1417
Animal Lovers check to see if products are "cruelty-free," if not, they immediately boycott them. They often support financially wildlife animal protection-focused organisations.
According to Ottman “green” consumers want their products they buy to be sexy, economical, and environmental friendly, all at the same time.
“Green” consumers read the labels and often search for the environmental information about origin and effects of purchasing products from Internet, magazines and books. They follow and boycott those corporations that do not behave socially and environmentally responsibly and they are likely to switch brands and become loyal to those who do behave so.
MORI conducted another more recent research in typology of ethical consumers in the study for the Co-operative Bank, in 1999, through out a series of four focus groups across UK. The outcomes showed that the middle-aged (35-54) appear to be the most active consumers on ethical issues. The research revealed that there are key consumer types (MORI with Co-operative Bank, 1999):
TABLE 2: KEY CONSUMER TYPES
Type Percentage Characteristics Global watchdogs 5% Ethical hardliners Conscientious consumers 18% More than “Do what I can” type “Do what I can” 49% Older, active recyclers Brand generation 6% Younger, less values led “Look after my own” 22% Lowest income, lowest interest
Global watchdogs are always well informed about the companies’ commitment to social and environmental
issues and their purchasing strategies are strictly based on ethical criteria. Conscientious consumers are not that active in promoting CSR of companies, but still the ethical aspects of products and the overall company behaviour matter for them. Older generation seems to be sensitized on certain issues related to social and environmental concerns, though they do not put an extra effort to boycott products of irresponsible companies, rather than that they do what they can; such as example is recycling products or select waste. Despite of the common assumption that younger people (18-35) are more value-driven than those older once above 36, the report showed that actually for younger generation it is a brand that matters the most. Last consumer type was called as “Look after my own,” which represented almost one quarter of the population with the lowest income and little interest in ethical issues. Re-defining Brand Values under Shifting Consumer Behaviour The first part of this paper introduces only some of these factors that fundamentally influence the business environment. The next section gives a few definitions of brand values that are often found in the marketing theories, followed by an attempt to re-define the brand value according to the new market conditions and realities using the holistic approach.
There are number of definitions that could be chosen as examples. Some authors describe brands with help of their names by which a product is known, others according to added values, image, expectation, distinctive characteristics, etc., which can be all assigned to brands. Still for some academics and business representatives, a brand value is often used as a synonym to brand equity. Both concepts are different, yet intricately linked to one another. Pedro Laboy, international marketing expert, defines brand value as “the net present value of future cash flows from a branded product minus the net present value of future cash flows from a similar unbranded product—or, in simpler terms, “what the brand is worth to management and shareholders” (Laboy, 2005). This understanding of a brand value is similar to what Feldwick (quoted in Haigh, 2005) defines as brand equity. He claims that the word “equity” is a purely financial term borrowed by marketing experts from financial management to measure the economic value of a brand. Laboy, in opposite to Feldwick, yet defines brand equity “as a set of perceptions, knowledge and behaviours on the part of customers that creates demand and/or a price premium for a branded product”. In other words, “what the brand is worth to a customer.” It can be also defined as “a set of elements such as brand associations, market fundamentals, and marketing assets that help distinguish one brand from another”

1418
(Laboy, 2005). Kotler and Keller (2006) describe a brand value as “a value, which may be reflected in how consumers think, feel, and act with respect to the brand, as well as the price, market share, and profitability that the brand commands for the firm.” Armstrong and Kotler (2006) understand the real value of a strong brand in its power, which is reflected in consumers’ preference and loyalty to a brand. According to an explanation of David Aaker (2003), one of the most respected personality in the field of brands, brand value “includes all the actives (and passives) linked with the brand’s name and symbol that increase or decrease a value that product or service brings to a company and/or a consumer.” Aaker also identifies the main categories of a brand value, which includes: a) brand loyalty, b) brand awareness, c) perceived quality, d) brand associations, and finally, and e) other properties assets.
All of these authors propose models how to build a strong brand. Yet, all of them focus primarily on building associations and values with respect to a brand-product relationship, which do not include new consumers’ requirements, resulted from corporate social responsibility. Even though all these definitions and models are correct, still something is missing. Holistic Approach to an Extended Brand Value Model First, we need to define what we mean by a holistic approach and how this fits into the concept of brand building. Second, we give an example of the company that attempt to use such approach.
Within last fifty years an extensive academic researches have delivered a number of models for building and managing brands. Large volume of substantive knowledge in this field, coupled with empirical and case studies provide managers with the rules how to build, manage and increase brand values. As argued in the previous section, new realities governing global and national markets significantly alter the market conditions and the ways the companies do their business. As a logical extension of it, there is a need to re-think and apply new rules, which will govern the ways, how companies build their brands.
Many authors of books about environmental and ethical consumption argue that big companies, whatever efforts they do to re-position and re-brand themselves in the public mind as socially responsible organisations, often fail to do so, for a number of reasons (Crane, 2005, McEachern and Schroder, 2002). One of the critical concerns is lack of transparent and trustworthy communication about companies’ commitments and efforts to improve employees and external social groups’ well-being as well as to respect nature’s capacity to regenerate. With this respect, the authors of this paper argue that there is a need for stretching the concept of the brand. In this section the authors give a brief introduction into a holistic approach towards brand building, which can better embraces current market trends.
Holism (from a Greek word meaning all, entire, total) is the idea that all the properties of a given system (biological, chemical, social, economic, mental, linguistic, etc.) cannot be determined or explained by the sum of its component parts alone. Instead, the system as a whole determines in an important way how the parts behave (Wikipedia, Free Encyclopaedia). A brand with its product creates inherent part of a company’s system. Therefore, a company, its products and its brands cannot be separated from each other and together work as one. The other important aspect of holistic approach is the idea of evolution, which in the concept of a company is often accomplished through technical and social innovations. This is first and foremost important as paradigms - how people see the world – including norms and values evolve over time. Thus, every company that wants to survive has to adapt to a changing paradigm.
Another characteristic of such approach is that it opposes to reductionism, which in contrary to holism, is often used in science to eliminate many parts and factors in analysing complex systems. With an ever increasing complexity of social-economic system, reductionism seems to deliver solutions, which are often inaccurate due to elimination of many factors. In the concept of brand building, these aspects may be often crucial to understand and develop an appropriate brand strategy.
Holism is often seen or sometimes even interchanged with a definition of a system, which can be also applied to any company. A system is a set of entities, real or abstract, comprising a whole where each component interacts with or is related to at least one other component and they all serve a common objective (Wikipedia, Free Encyclopaedia). A company is such a system, including many different subsystems.
Gunter Pauli, an author of several famous books about a new model for a company and founder of several successful enterprises, defines a company as “a totally open economic system and a totally closed environmental system. That system involves everything we do. The products and the way we produce them. The ecological factory

1419
where the products are made. How we communicate our message to customers. How we work with each other. Why we spend so much time on social-cause related initiatives all around the world” (personal interview, May 10, 2007). In other words, it is an open economic and social system, created and managed by humans, which uses ecological systems to its benefits to produce and deliver goods and services, but without minimum or no harm to ecosystems and people. All three different systems are in permanent interactions.
The same can be applied for brands. As there is no brand without a product or a service, every brand is both the part and the whole. The brand includes both tangible and intangible elements: product itself, but also values, images, emotions, and feelings. “Branding is about feelings and emotions. It is about our “Nature” as human beings. The power of branding comes from the fact of it ability to step out from the constraints of Reason. Trust your instinct and your heart and do not underestimate the power of aligning people behind big emotional values” (Braun, 2007). Brands create their own world.
With an increase of complexity of the market conditions, coupled with ever increasing consumers’ needs and desires, the complexity of the concept of brand goes beyond the traditional approach to brand building. As a consequence of it, a model of brand value needs to be based on holistic approach rather than mechanistic, reductionism, often too simplistic. Such model has to re-think how companies create their values, including consumers’ requirements for more environmental and social responsible companies, embraced in the company’s vision and purpose, resulted in environmental and ethical products.
As a short example of a company that manages to apply a holistic approach to their business activities could be mention Interface Corporation, one of the biggest producer and distributor of floor coverings and fabrics, designed and inspired by nature. The company’s vision says that Interface’s ultimate goal is: “To be the first company that, by its deeds, shows the entire industrial world what sustainability is in all its dimensions: people, process, product, place, and profits - by 2020 - and in doing so we will become restorative through the power of influence” (Interface Sustainability Web site). Such ambitious vision must be inspired and driven by visionary and committed leaders that are able to concretize “mental images” into concrete outcomes.
Ray Anderson, chief executive officer of Interface, in his bestseller “Mid-course Correction” (Anderson, 1998) writes that the 21st century companies need to have a clear vision, making the commitment to 5Ps – people, process, product, place and profits. Such a company strives to create an organization where all people are awarded unconditional respect and dignity, one that allows each person to continuously learn and develop. Important focus is put on products and services through constant emphasis on process quality and engineering, combined with careful attention to the customers’ needs, for delivering superior value to them, therefore, maximizing all stakeholders’ satisfaction. At the same time, all the industrial processes need to incorporate ecological principles into the design of products and services delivered. Such company leads by example and validates by results, including records on profits and overall increased company’s access.
Informal communicational channels such as word of mouth, working for the company or knowing family or friends, who work there, spread quickly such approach. Moreover, it seems to be the best communication strategy (Worcester and Dawkins, 2005).
Interface has to create a completely new system. The business model this company promotes is based on sustainable business practices, biologically inspired approach to industrial production, and the company’s commitment to stakeholders, including involvement in those communities of urgent need on a global scale. “For Interface, sustainability is more than surface appearance. It's a belief that is built into our business model. It's an underlying corporate value, ensuring that business decisions are weighed against their potential impact on the economic, natural and social systems we touch. It's a means for our associates to deliver superior value to our customers and to our shareholders.” (Interface Sustainability Web site, Company) In other words, Interface is committed to continuously improve operational procedures in all of their facilities, which can be mirrored throughout high quality products with a low environmental impacts, enlightened people, and significant profits for supporting new and ongoing innovations.

1420
Conclusion There are several approaches how to build, manage and increase commercial brand values. As shortly discussed in this paper, the ecological and ethical values become more embedded in consumer purchasing strategies, resulting in the implementation of social and environmental responsible management practices, which should be respectively reflected the ways how companies build their brands.
To capitalise on the holistic approach to brand building, the companies have to fundamentally re-think the ways the companies build their brand values. Consequently, investments into new areas such as the environment, employees, and local communities should be understood as opportunities rather than threats, and future profits rather than today’s costs. In times of shifting consumers’ preferences and changing fundamental society values and norms, particularly with regards to the natural environment and ethics, commercial brands may significantly gain and increase their value unless the companies behave and act more proactively towards the accumulation of all four capital resources: economic, natural, social and human.
On a longer term perspective, companies focusing on green and social innovations may increase the value of their brands and thus gain competitive advantages through reduced operational costs, increased company’s image, improved risk management, and last, but not least, have an easier and more flexible access to external financial resources. Such a capacity requires re-defining the company vision and purpose, goals and business practices, resulted into environmentally friendly and ethically produced products and services.
Despite of numerous studies on brand building, there are no models that would question and propose comprehensive strategies how shifting consumer values and purchasing behaviour can affect future brand values and brand management. In this paper the authors introduce the basic idea of a holistic model for brand building. The proposed concept, however, needs further research in order to better incorporate fundamental changes of the market as well as new findings not only from management and leadership fields, but also from completely other areas of science and technology, which have emerged over last 20 years across the whole academic spectrum.
References [1] Aaker, D. A. (2003). Brand Building. Budovani znacky. Vytvoreni silne znacky a jeji uspesne zavedeni na
trh. Computer Press. Brno. ISBN 80-7226-885-6 [2] Amstrong, G. & Kotler, P. (2006). Marketing – An introduction 8th Edition. Pearson – Prentice Hall. New
Jersey. ISBN 0-13-186591-9 [3] Anderson, R. (1998). The Mid-course Correction – Towards a Sustainable Enterprise: The Interface Model.
Perengrizilla Press. Atlanta, GA. ISBN 0-9645953-5-4 [4] Braun T. (2007). The Philosophy of Branding: Great Philosophers Think Brnads. Paperback ed. Kogan
Page. London. ISBN-10: 0-7494-5000-2 [5] Clavin B. & Lewis A. (2005). Focus Groups on Consumers’ Ethical Beliefs. Quoted in: Harrison, R.,
Newholm, T., and Deirdre S., Sage Publications. London. 2005. ISBN 1- 4129-0352-1 [6] Drucker, P. (2006). Drucker na kazdy den: 366 zamysleni a podnetu, jak delat spravne veci. Management
Press. Praha. ISBN 80-7261-140-2 [7] Haigh, D. (2002). Ocenovani znacky a jeho vyznam. Management Press. Praha. ISBN 80-7261-073-2 [8] Harrison, R. (2005). Pressure Groups, Campaigns and Consumers. Quoted in: The Ethical Consumer.
Edited by Harrison, R., Newholm, T., & Deirdre S. (2005). Sage publications. London. ISBN 1-41290352-1
[9] Hawken, P., Lovins, A. B., & Lovins, H. (1999). Natural Capitalism. Little, Brown. ISBN 0-316353-167 [10] Hollensen, S. (2003). Marketing Management: A Relationship Approach. Prentice Hall. Harlow. ISBN 0-
273 64378-9 [11] Kapferer, J. -N. (2001). Re-inventing the brand: Can top brands survive the new market realities? Kogan
Page. London. ISBN 0-7494-3593-3.

1421
[12] Kotler P. & Keller K. L. (2006:276). Marketing Management. 12th Edition. Pearson - Prentice Hall. New Jersey. ISBN 0-13-145757-8
[13] McEachern, M.G. and Shroder, M.J.A. (2002). The role of livestock production ethics in consumer values towards meet, Journal of Agricultural and Environmental Ethics, 15 (2): 221-37.
[14] MORI & CSR Europe (2000, November). The First Ever European Survey of Consumers Attitudes towards Corporate Social Responsibility and Country Profiles. London: MORI/CSR Europe
[15] Ottman, J. (1998). Green Marketing: Opportunities for Innovations. New York. SurgeBook. ISBN 1-59457-07
Contact authors for the full list of references.

1422
Brand Awareness and Consumer Buying Behavior in GSM Mobile Sector
M.D.Lawrence, [email protected] MMCC University of Pune, India
Abstract Living in an age of transition, one cannot help wondering about the revolutions that have taken place, and will take place in social, economic and technological areas. Technological changes have been rapid and radical in India with the use of wireless and cellular technology by companies for their global business operations. The revolution is not yet over, particularly for the Indian Telecom sector, as India is expected to have 100 million Global System for Mobile communications (GSM) subscribers by 2007-08 as compared to 26 million subscribes as on March 2004, according to Global Mobile Suppliers Association (GSA). India has been a success story for GSM as it is one of the fastest growing markets with its subscriber base being doubled in 2003. At this pace the target of 100 million users in February 2004, with GSM accounting for 80 percent of the new subscriber growth in 2003. Though, it does not resolve the increasing debate over GSM versus Code Division Multiple Access (CDMA) in mobile services arena, GSM has been a successful mobile standard with over one billion users and is an open mobile standard supporting automatic international roaming, which is a major contributor to business plans. The study is an attempt to find out the brand awareness and consumer buying behavior with regard to GSM mobile of LG in PUNE, the historical capital of the State of Maharashtra and fast growing IT city. The present study becomes more relevant and significant because LG is very new to GSM phone sector, only a year old in Pune. The finding will be useful to enhance customer value, satisfaction; retention can help the strategic and marketing planners who are concerned with the philosophy and practice of new product development to introduce better, innovative and customized products to the consumers.
Introduction
A major revolution in communication is sweeping across business, industry, and influencing the daily lives of everyone. As an offshoot, the developments are never ending the field of Information and Communication Technology (ICT). These leads to new business models and new ways of marketing products and services. The changes are highlighted through telemetric, radio frequency identification devices, smart products. Moreover, with the presence of many players in the field of GSM, the organization has to know the growth prospect of the market so that they can be able to make their long-term strategic plan, based on the consumer buying behavior. The increased attention given to consumer behavior and research is due to the belief that, the consumer has more power than ever before, the consumer has access to more information than ever before and, Marketers can offer more services and products than ever before due to advancements in technology and digitalization. . The researcher has attempted to study the various dimensions of consumer buying behavior of GSM mobile phone customers with reference to brand awareness level, price, battery backup and features. The findings of the study, it is hoped, will enable the companies to focus on their weaknesses and adopt corrective measures, to become the market leader. It is found that LG is the market leader in WLL mobile phone sector, but Nokia is the market leader for GSM mobile phone. About 82 percent customers are using the GSM service as compared to WLL service provider. So, there is a great potential market for GSM mobile at Pune. Hence, this study was undertaken as an attempt to find out, the consumer buying behavior with reference to GSM mobile of LG, in Pune. The results of the study, it is hoped, will be useful to enhance customer value, and satisfaction also help the market planners to strategic new marketing techniques, which are concerned with the philosophy and practice of new product development to introduce better, innovative and customized products to the consumers.

1423
Review of Literature The necessity for studying consumer behavior arises because of the fact that business organizations have to operate, survive and progress in a highly dynamic economy where change is the rule, not the exception. These changes often give rise to innumerable problems and challenges to the marketers. Most of these changes are thrust on mangers, who are forced to adjust their activities in order to take full advantage of favorable developments or to minimize the adverse effects of unfavorable ones. Successful organizations try to visualize the problems before they turn into emergencies. With the presence of many players in the field of GSM, the organizations want to know the growth prospects of the market so that they can be able to make their long-term strategic plans, based on the consumer buying behavior. Consumer buying behavior which refers to the buying behavior of the ultimate consumer.
According to Schiff man and Kanuk (2003), "The process of consumer decision-making can be viewed as three distinct but interlocking stages: the input stage, the process stage, and the output stage." The input stage influences the consumer's recognition of a product need and consists of two major sources of information—the firm's marketing efforts and the external sociological influences on the consumer (family, friends, and neighbors). The cumulative impact of each firm's marketing efforts, influence of the family, friends, neighbors, and society's existing codes of behavior, are all inputs that are likely to affect what consumers purchase and how they use what they buy.
The process stage of the model focuses on how consumers make decisions. The psychological factors inherent in each individual affect how the external inputs from the input stage influence the consumer's recognition of a need repurchase search for information, and evaluation of alternatives. The output stage of the model consists of two closely related post-decision activities: purchase behavior and purchase evaluation. Factors Influencing Buyer Behavior
According to Kotler (2003), "The starting point for understanding buyer behavior is the stimulus-response model as shown in Figure 1. Marketing and environmental stimuli enter into the buyer's consciousness. The buyers' characteristics and decision process lead to certain purchase decisions. A consumer's buying behavior is influenced by cultural, social, personal and psychological factors. Cultural factors exert the broadest and deepest influence."
FIGURE 1: FACTORS INFLUENCING BUYER BEHAVIOR
Marketing
Stimuli
Other Stimuli
Buyers' Characteristics
Buyer's Decision Process
Buyer's Decisions
— >
Product Price Place Promotion
Economic Technological
Political Cultural
Cultural Social Personal
Psychological
Problem recognition Information search
Evaluation of alternatives
Purchase decision
Product choice Brand choice Dealer choice
Purchase timing Purchase amount
— >
Source: Philip Kotler Marketing Management (2003), 11th Edition, p. 184, Pearson Education (Singapore) Pvt. Ltd., Indian Branch, Delhi.

1424
Review of Some Related Studies in Consumer Behavior
Consumer behavior has become an integral part of strategic market planning. The belief that ethics and social responsibility should also be the integral components of every marketing decision is embodied in a revised marketing concept—the societal marketing concept—that calls on marketers to fulfill the needs of their target markets in ways that improve the society as a whole. Since LG is very new to the GSM phone sector, only a year old in Pune, very few studies have been conducted in this city, which is aspiring for a big leap into modernization.
Chirayath (2002) conducted a study to find out the market potential and customer attitude towards GSM Mobile in terms of price, features and quality. The study was conducted in Pune, Gumla and Hazaribag on a sample of 300 customers, 100 each from the three district headquarters. The study revealed that since Z value is lesser than 1.96 that made the investigator to accept the hypothesis. Hence, it was accepted that their reason for the low market share of LG-GSM handsets is its high price.
The study could prove to be an indicator for LG company. If the company intends to have a good market share in Pune, it should offer its product at a competitive price. Chirayath (2003) conducted a study with the following objectives in mind:
• To find out the influence of media on consumer buying behavior with regard to LG-GSM mobile phone, • To find out the buying behavior of different segments of population based on income, age, occupation,
education with regard to GSM mobile. The study was conducted in the city of Pune with the sample of 200 customers. The study revealed that
majority of the existing users had GSM phone in the price range between Rs. 5,500-10,000. These are those users whose income is in middle and high-income range. Secondly, these are old users and at that time most of the handsets were priced more than Rs. 5,500. It is evident that price range greater than Rs. 10,000 is not preferable. Hence, LG should offer its GSM phone at a price less than Rs. 10,000.
The analysis revealed that there is no potential relationship between these two variables. The r (coefficient of repression) is -0.21536, since this is a very negligible value, hence it can be said that there is no relationship between income levels of the individuals and the price of their handsets. The r coefficient has a negative sign because most of the people in high income range are in late adulthood stage of life cycle model and possess handsets which are simple to look at, and have less features, hence these handsets belong to a lower price range. Most of the young people fall in the middle and lower income range but they possess handsets which have more features and good looks. Hence, these are high priced handsets. So, to improve market share of GSM phone sets, LG should offer high-featured products targeting youth with competitive price. Saxena (2003) conducted a study to find out the market potential of LG's microwave oven in Pune, to understand the factors which influence the consumer buying decisions process of microwave ovens, and also to know the satisfaction level of consumers.
LG Electronics is the biggest manufacturer of air conditioners and microwave ovens. The study revealed that in Pune, LG is the market leader with 66 percent of the market share. Samsung was found to be the topmost competitor of LG with market share of 16 percent. BPL and Electrolux and others formed a minor market share with 5 percent, 3 percent and 10 percent, respectively. The study also revealed that more and more people were interested in buying microwave ovens because of the increasing female employment. Limitations of the Previous Studies
The previous studies were conducted on a sample drawn on convenience sampling. In this method, there is
no appropriate representation to the various strata in the population based on occupation, income, age etc. Hence, it was decided to get a more clear picture about the population to draw the sample based on stratified random sampling and conduct a study on brand awareness and market potential. Thus, this study got materialized.
Moreover, the above studies did not mention anything about the need of creating brand awareness among people, which is the most important requirement to sell its products in the market. Hence, this study concentrates on the study of brand awareness.

1425
GSM
GSM is mostly a European system and is largely unused in the US. GSM is interesting in that it uses a modified and far more efficient version of Time Division Multiple Access (TDMA). GSM keeps the idea of time slots and frequency channels, but corrects several major shortcomings. Since the GSM time slots are smaller than TDMA, they hold less data but allow for data rates starting at 360 bits per second. Thus, a call can use as many time slots as necessary up to a limit of 13 Kilobits (KB) per second. When a call is inactive (silent) or may be compressed more, fewer time slots are used. To facilitate filling in gaps left by unused time slots, calls do "frequency hopping" in GSM, which means that calls will jump between channels and time slots to maximize the system's usage. A control channel is used to communicate the frequency hopping and other information between the tower and the phone. To compare it with the other systems, it should be noted that GSM requires one watt of output power from the phone. About the Company
LG Electronics was established in 1958 as Gold Star Company Ltd. and has been a trendsetter in the electronics industry ever since. The corporate name was changed into LG Electronics in 1995 as a part of the effort to make the company a major player in the world market. The LG Group is today one of Korea's top three conglomerates. In 1998, LG set up a state-of-the-art manufacturing facility at Greater Noida, with an investment of Rs. 500 cr. This facility manufactured color televisions, washing machines, air-conditioners and microwave ovens. In the year 2001, LG also commenced the home production for its eco-friendly refrigerators, and established its assembly line for its PC monitors at its Greater Noida manufacturing unit. This unit has been designed with the latest technologies at par with international standards in Korea and is one of the most eco-friendly units amongst all LG manufacturing plants in the world.
Objectives of the Study
The study was undertaken with the following objectives: • To study the buying behavior of customers with regard to GSM • To study the brand awareness of GSM mobile of LG Electronics in Pune. Definition of Terms
GSM mobile sector: GSM, which stands for Global System for Mobile communication, is a part of wireless communication. Consumer Behavior: The term consumer behavior is defined by Schiff man and Kanuk (2003), "as the behavior that consumers display in searching for, using, evaluating and disposing of products and services that they expect will satisfy their needs." Hypotheses Tested in the Study • Customer is not able to distinguish among the various GSM mobile phones on the criterion of 'Looks'. • Customer is not able to distinguish among the various GSM mobile phones on the criterion of 'Battery Back-up'. • Customer is not able to distinguish among the various GSM mobile phones on the criterion of 'Connectivity'. Data Collection Methods
• The Questionnaire is used to collect the data. A rating scale and also objective type questions are used for the market survey.

1426
Sampling
The sample of the present study consists of 300 customers based in various locations of Pune. Stratified random sampling technique was used to select the customers. The stratification of the customers was based on income (high, low, and middle), education (graduate, undergraduate, postgraduate and professional), and occupation (professional, nonprofessional, businessmen). Statistical Analysis, Percentage analysis, Probability Distribution, Weight age attached to buying factors, Rank analysis, Mean, Median, Mode, Standard Deviation, Hypothesis Testing, Normal distribution test, ANOVA test. Relative Weight age of Different Factors
An attempt was made to know how various factors considered by cell phone users for purchasing their handsets are being ranked. Figure 2 reveals that 32 percent of the existing GSM users believe that price is the most important factor for purchasing a GSM phone. The brand comes as the second factor in consideration. It becomes clear that people first fix a price range for buying a mobile handset and in the price range they look for the alternative brands available. Table 1 shows the ranking of different factors as considered by existing GSM phone users for purchasing their mobile phones with relative weight age.
FIGURE 2: FACTORS CONSIDERED BU GSM USERS WHILE PURCHASING HANDSETS
32%
19%17%
16%
7% 6% 3%
Price
Brand
Connectivity
Features
Battery Back
Look
Weight
TABLE 1 : RANKING OF DIFFERENT FACTORS WITH RELATIV E WEIGHT
AGE Factors
Frequency of Occurrences
Weight age
Rank
Price
54
0.32
1 Brand
33
0.19
2 Connectivity
30
0.17
3
Features
27
0.16
4 Battery Backup
13
0.07
5
Look
11
0.06
6 Weight
06
0.03
7
The investigator also looked into the factors considered by WLL users and the analysis revealed that they rank connectivity as Rank 1. The results are summarized in Figure 2 and Table 2.

1427
FIGURE 3: FACTORS CONSIDERED BY WLL USERS
46%
31%
15%8% Connectivity
Brand
Features
Price

1428
Table 2 reveals that WLL users have very narrow range to choose handsets, so they prefer those handsets which have good network connectivity, and they have given 0.46 weight age to this. As there are only few models of handsets available with significantly low price difference, hence they have narrow price range, and more or less the y have to pay same piece for getting a WLL handset. Hence, price is given a low weight age of 0.08 and ranked 4. Figure 3 and Table 3 reveal the ranking of potential customers and their relative weightage.
It has been found out that the potential customers have given highest weight age to the price. Brand and feature have got equal weight age of 0.13. During market survey it was observed by the investigator that people prefer those handsets which had more features than the brand, although both had same weight age, most of the handsets available in the market were Nokia, Samsung, Motorola, etc., and all of them have a good brand image. Hence, people go for features than the brand because they perceive all these brands as equally good. Due to coming up of high buildings in the city, people are getting connectivity problems inside their apartments, so they have given more weight age (0.10) to connectivity than battery backup (0.06).
Hence LG should offer product at competitive price with more features and good connectivity to get a good market share in the long run.
TABLE 2: RANKING OF DIFFERENT FACTORS BY WLL USERS
Factors
Frequency of Occurrences
Weight age
Rank
Connectivity
18
0.46
1
Brand
12.
0.31
2 Features
06
0.15
3
Price
03
0.08
4
TABLE 3: RANKING BY POTENTIAL CUSTOMERS Factors
Frequency of Occurrences
Weight age
Rank
Price
48
0.52
1
Features
12
0.13
2
Brand
12
0.13
3
Connectivit
9
0.10
4
Battery
6
0.06
5
Looks
3
0.03
6
Weight
3
0.03
7

1429
Testing of Hypothesis
To test the hypothesis “Customer is not able to distinguish between the various mobile phone handsets on criterion of looks”, data collected from the survey is converted into 10 point scale for calculation purpose and is shown in Table 4. The calculation between column variables is given in Table 5. Between column variance = 15.15 Variance of the first sample = 3.8 Variance of the second sample = 4.8 Variance of the third sample = 8.67
TABLE 4: DATA IN 10-POINT SCALE
Nokia (X,)
Motorola <X2)
LG (X3)
Samsung (X4)
10
7
5
7 5
3
5
7 7
7
7
7 7
5
10
3 7
7
10
7 10
3
10
7 7
7
10
7 7
7
7
7 7
5
10
10 7
3
1
10 3
1
7
10
77
55
82
82 Note: X = 6.73
TABLE 5: CALCULATION BETWEEN COLUMN N
X
X
X - X
(x-x)2
N(x-x)2 11
7
6.73
0.27
0.0729
0.8019 11 5 6.73 -1.73 2.9929 32.9219
11 7.46 6.73 0.73 0.5329 5.8619 11
7.46
6.73
0.73
0.5329
5.8619
45.4476
FIGURE 4: FACTORS CONSIDERED BY POTENTIAL CUSTOMERS
52%
13% 13%
10%6% 3% 3%
Price
Features
Brand
Connectivity
Battery Backup
Look
Weight

1430
Variance of the fourth sample = 4.07 Therefore, population variance within the sample = 5.34 F ratio = 2.8371 F statistics = 2.84 Since the null hypothesis falls in the acceptance region hence it is accepted that the hypothesis: "Customer is notable to distinguish between the various mobile phone handsets on LOOKS" is accepted.
In Table 6, the value of acceptance (2.8371) is very nearer to 2.84 the critical value; so it can be inferred that we cannot strongly accept this hypothesis. Hence Nokia, LG, Samsung and Motorola can be distinguished on outer Looks criteria and have different weight age as perceived by the customers. Hence, there is very little chance that customers will buy handsets only by considering the influence of looks criterion. Hence, there is no need to improve the outer looks. LG should maintain the present outer looks of its GSM mobile phone as the mean value of LG's looks parameter 7.46 is greater than the grand mean. Testing of Second Hypothesis To test the hypothesis "Customer is not able to distinguish between the various mobile phone handsets on battery back up". Null hypothesis is 'Mean battery backup of all the GSM phone is same'. Data is summarized in Table 7. The calculation between columns is given in Table 8. Between column variance = 20.03 Variance within the sample = 3.585
TABLE 6: CALCULATION WITHIN SAMPLES
Nokia
LG
Samsung
Motorola
x,
x,-x.
(2x,-x,)
x,
X 2-X 2
(X2-X 2)
2 **
x3-x3
(x3-x3)2
x,
(x4-x4)
(x4-x4)2
10
3
9
7
2
4
5
-2.46
6.0516
7
-0.46
0.2116
5
-2
4
3
-2
4
5
-2.46
6.0516
7
-0.46
0.2116
7
0
0
7
2
4
7
-0.46
0.2116
7
-0.46
0.2116
7
0
0
5
0
0
10
2.54
6.4516
3
-4.46
19.8916
7
0
0
7
2
4
10
2.54
6.4516
7
-0.46
0.2116
10
3
9
3
-2
4
10
2.54
6.4516
7
-0.46
0.2116
7
0
0
7
2
4
10
2.54
6.4516
7
-0.46
0.2116
7
0
0
7
2
4
7
-0.46
0.2116
7
-0.46
0.2116
7
0
0
5
0
0
10
2.54
6.4516
10
2.54
6.4516
7
0
0
3
-2
4
1
-6.46
41.7316
10
2.54
6.2516
3
-4
16
1
-4
16
7
-0.46
0.2116
10
2.54
6.4516
Total 38 48 86.7276 40.7276

1431
TABLE 8: CALCULATION BETWEEN COLUMN VARIABLES N
X
X
X-X
(X-X) 2
N (X-X)2 11
9
7.09
1.91
3.6481
40.1291 11
5.82
7.09
-1.27
1.6129
17.7419
11
6.82
7.09
-0.27
0.0729
0.8019 11
6.73
7.09
-0.36
0.1296
1.4256
60.0985
TABLE 7: DATA IN 10-POINT SCALE FOR HYPOTHESIS
Nokia (X,)
Motorola <X2)
LG (X3)
Samsung <X4)
10 7 7 7 10
3
5
7 7 5 5 5
10
5
7
7 10
10
10
7 10
7
5
5 5
5
10
5 10
7
7
7 7
7
7
10 10
1
5
7 10
7
7
7 99
64
75
74 Mean = 9
5.82
6.82
6.73
Note: Grand Mean = 7.09 TABLE 9: CALCULATION WITHIN SAMPLES
Nokia
Motorola
LG
Samsung x,
x,-x,
(2*1 -*i)
x,
X2 X2
te-x,)2
X,
X 3 -X 3
te-x,)2
X4
X4 -X 4
ft-*,) 2
10
1
1
7
1.18
1 .3924
7
0.18
0.0324
7
0.27
0.0729
10
1
1
3
-2.82
7.9524
5
-1.82
3.3124
7
0.27
0.0729 7
-2
4
5
-0.82
0.6724
5
-1.82
3.3124
5
-1.73
2.9929 10
1
1
5
-0.82
0.6724
7
0.18
0.0324
7
0.27
0.0729 10
1
1
10
4.18
17.472
-
3.18
10.1124
7
0.27
0.0729 10
1
1
7
1.18
1.3924
5
-1.82
3.3124
5
-1.73
2.9929 5
-4-
16
5
-0.82 '
0.6724
-
3.18
10.1124
5
-1.73
2.9929 10
1
1
7
1.18
1.3924
7
0.18
0.0324
7
0.27
0.0729 7
-2
4
7
1.18
1.3924
5
0.18
0.0324
10
3.27
10.693 10
1
1
1
-4.82
23.232
7
-1.82
3.3124
7
0.27
0.0729
10
1
1
7
1.18
1.3924
7
0.18
0.0324
7
0.27
0.0729 Total
32
57.636
33.6364
20.182

1432
F Ratio = 5.5872 At 3 DOF for the denominator, 40 DOF for the denominator and at significance level of 5 percent, the value of F statistics from Table 9 was found to be 2.84. Variance within the sample = 3.585 Since the calculated value falls in the rejection region, hence the null hypothesis "Mean battery backup of all the GSM phonse is same" is rejected. The mean value of LG's battery backup (6.82) is less than die grand mean (7.09). Hence, there is need to improve the quality of its battery in comparison to its competitor Nokia with mean value 9. It could also be interpreted that LG is not considered as a phone with good battery backup; it is definitely after Nokia and Samsung. Testing of Third Hypothesis Hypothesis: "T/7e customer is not able to distinguish between the various mobile phone handsets on network connectivity" Null hypothesis: The mean value of the connectivity for all the GSM phone (Nokia, LG, Motorola and Samsung) are the same." The results are summarized in Table 10. Table 11 gives data for calculating between column variance.
TABLE 10: DATA IN 10-POINT SCALE
Nokia (X,)
Motorola (X2)
LG (X3)
Samsung <X4)
10
5
7
7
7
5
5
5
7
10
5
5
7
5
10
3
10
10
7
7
10
7
7
7
7
7
10
7
10
7
10
7
7
10
5
7
10
1
7
5
10
7
7
3
95
74
80
63
Mean=8.64
6.73
7.27
5.73

1433
TABLE 12: CALCULATION WITHIN THE SAMPLES Nokia
Motorola
LG
Samsung
*i
X|-*i
(2*1 -*i)
x,
X 2 -X 2
te-x,)2
Xa
X 3 -X 3
(Xa-X,)2
X4
(*4-X4)
K-X,)2
10
1.36
1.8496
5
-1.73
2.9929
7
-0.3
-.0.0729
7
1.24
1.6129 7
-
1.64 2.6896
5
-1.73
2.9929
5
-2.3
5.1529
5
-0.73
0.5329
7
-1.64
2.6896
10
3.27
10.693
5
-2.3
5.1529
5
-0.73
0.5329
7
-1.64
2.6896
5
-1.73
2.9929
10
2.73
7.4529
3
-2.73
7.4529
10
1.36
1.8496
10
3.27
10.693
7
-0.3
0.0729
7
1.27
1.6129 10
1.36
1.8496
7
0.27
0.0729
7
-0.3
0.0729
7
1.27
1.6129
7
-1.64
2.6896
7
0.27
0.0729
10
2.73
7.4529
7
1.27
1.6129 10
1.36
1 .8496
7
0.27
0.0729
10
2.73
7.4529
7
1.27
1.6129
7
-1.64
2.6896
10
3.27
10.693
5
-2.3
5.1529
7
1.27
1.6129
10
1.36
1.8496
1
-5.73
32.833
7
0.3
0.0729
5
-0.73
0.5329
10
-1.36
1.8496
7
0.27
0.0729
7
-0.3
0.0729
3
-0.73
0.5329 Total
24.546
74.109
38.182
26.182
TABLE 11: CALCULATION BETWEEN COLUMN VARIABLES*
N
X
X
x-x
(X-X) 2
N(X-X) 2 11
8.64
7.09
1.55
2.4025
26.4275
11
7.63
7.09
-0.36
0.1296
1.4256
11
7.27
7.09
0.18
0.0324
0.3564
11
5.73
7.09
-1.36
1.8496
20.3456
48.5551
Note: * Between column variance = 16.19.

1434
Grand Mean = 7.09 Population variance obtained from the variance within the individual samples (within the column variance) = 4.08 F Ratio = 3.967
At 3 DOF of numerator, 40 DOF for denominator, and at 5 percent significance level value of the F statistics from the Table = 2.84 It was found that the calculated value falls in the rejection region. So, the null hypothesis is rejected Hence, the various GSM handsets offer different types of network connectivity. It is encouraging to know that the mean value on connectivity parameter of LG is 7.27, which is more than the grand mean 7,09.
Therefore, the customer believes that LG-GSM handset phone has comparatively better network reception (connectivity) in comparison to its competitor. Only Nokia is ahead of LG. So LG should retain this parameter at its present value only with slight improvement.
Suggestions and Recommendations
Based on the findings, the researcher feels proud to give the following suggestions to the company. It is recommended to tie up with GSM service provider BSNL and offer free SIM card on purchase of every LG-GSM mobile. As there is scarcity and difficulty in getting BSNL SIM card at Pune, definitely customers will give preference to buy LG-GSM in comparison to others.
Offer better after-sales service, and implement CRM, to target opinion leaders as they are the most influential persons and give their opinion to buyers during evaluation of alternative brand(s).
To improve the product availability, make available the entire product range at sales counter. During the survey it was found that dealers were not getting the whole product range of LG-GSM mobile
phone. After seeing the advertisement in TV and print media, the customers are approaching the local dealers and on demand they are not getting the LG handsets. It gives a bad impression. Hence, there is a need to improve the product availability.
Offer various models at mean price range of Rs. 5,888, as it comes out from the survey that price is the most important factor for buying mobile phone. It was also found that the potential customers want to own GSM phone in price range less than Rs. 6,000.
Target people in the age group of 25-35 years, as it comes out from the survey that they are the opinion leaders. The opinion leaders have the power to influence the future buyers.
Offer better margins to dealers, so that they will take more interest in selling LG-GSM phones, and push sales will improve.
There is a need to increase the product depth, i. e., offer wide product range. LG should offer its product in all price range.
There is a need to create brand awareness, because it was found that 40 percent of people do not know about LG-GSM handsets. People know about LG-WLL handsets, but are not aware about LG-GSM phone. *
References
Contact author for the list of references
End Notes
1. Schiffman G Leon and Kanuk Lazar Leslie (2003). Consumer Behavior, 8th Ed., Prentice Hall of India, New Delhi. 2. Kotler Philip (2003). Marketing Management, 1st Ed., Pearson Education (Singapore) Pvt. Ltd, Indian Branch, 482 FIE, Patpargang, Delhi. 3. Chirayath (2002). Study of Market Potential and Customer Attitude Towards LG-GSM Mobile Sector. Consumer Research Carried out for LG Electronics India Private Limited.

1435
4. Chirayath (2003). Study of the Influence of Media and Customer's Income on Consumer Buying Behavior. Consumer Research Carried out for LG Electronics India Private Limited, Pune. 5. Saxena Anurag (2003). Consumer Buying Behavior of Microwave Oven with Reference to LG Electronics. Consumer Research carried out for LG Electronics India Private Limited.

1436
Corporate Social Responsibility and Global Brand Equity
Paolo Popoli, [email protected] Parthenope University of Naples, Italy
Abstract When viewed in a managerial perspective and not merely as a fashion or smokescreen, Corporate Social Responsibility (CSR) is an attribute of business strategy which determines a new source of competitive advantage for the company, alongside those usually featuring in the processes of value creation. Using the theoretical frameworks of “stakeholders’ theory” and “systemic approach” applied to companies, we set out to analyse the connection that exists between CSR strategy and brand equity, with particular reference to the global context. First we focus on the role of the brand image in constituting this connection, observing it as a “synthesis of a firm’s relationship competences”. We go on to outline the connection between CSR strategy, brand image and the maximising of profit, and end by analysing the differences in approach required for CSR strategy in passing from a local to a global context to ensure benefits for brand image and equity. Introduction Corporate Social Responsibility (CSR) can take on many varied meanings, covering all the aspects of a company’s activity having social and environmental effects: the working conditions of employees and employment policies; the quality of products and services and features of the production processes; the drawing up of budgets and all the information made available to third parties; relations with political, administrative and social institutions in the communities where the company operates; localisation of the production activities; fiscal practice and the ways of exploiting the resources which investors hand over to the company in the form of stocks and shares; the bearing of products, services and production technologies on the ecological environment.
The scope of the issues involved in the domain of CSR is given a focus by the requirement for companies to legitimise themselves in the eyes of markets, the State and society, not only in economic terms but also in social terms1. The image of a company as a cell in the social system is not a novelty, but it has undoubtedly been given greater prominence by some recent financial and social scandals which have made the public worldwide better informed and more aware of the widespread existence of cases of “social irresponsibility” in managerial practice.
Inevitably CSR represents a strategic factor for securing competitive advantage, and it is thus a key element in the domain of management principles. The idea of analysing the connection that exists between CSR strategy and brand equity derives from the consideration of CSR as a driver in reinforcing brand image, in turn a component of brand equity, and from the question as to whether the approach to CSR at the local level can be considered valid also with reference to the global context. In this perspective we deal with the following considerations: − brand equity is determined by material and immaterial components of the company’s offer; among these, an
important impulse is the ability of the company to satisfy the demand of all the stakeholders to adopt socially responsible behaviour; this ability is reflected in the brand image;
− the theoretical frameworks which put CSR strategy and brand image in direct contact are those of stakeholder theory and the systemic approach to business studies; starting from different conceptual standpoints, these converge on the conviction that the company’s relational ability towards the external environment is a source of competitive advantage; this ability emerges in the various expectations concerning the company’s activity and the ability to render their fulfilment coherent and functional with respect to the business objectives;
− the relationship between CSR strategy and brand image and equity does not respond to the same dynamics in the local and global contexts; the difference in the predominant values in the various local contexts, and thus in CSR expectations, raises a problem of approach in their fulfilment, which has to be defined on the basis of evaluation criteria which change in passing from the local to the global context.

1437
The Role of Brand Image in Determining Brand Equity Brand image, in its components of identification, product personality and perceptions elicited in the consumer (Keegan, Moriarty and Duncan, 1994), is one of the most significant immaterial resources on which the company can base its quest for distinctive elements with respect to competition.
Much well known research work done on the company’s intangible assets has highlighted the close link that exists between the value of the brand and the competitive positioning of the company in its strategic business area, and hence the role of the brand in making the company offer distinctive and difficult to imitate in the eyes of end consumers2. This is all the more true if one considers that in today’s competitive contexts the differentiation strategies available to companies are less and less based on the differentiation of technological and performance attributes of products and services, and increasingly based on the enhancement of immaterial resources (Kapferer, 1997) concerning knowledge and relations. From this point of view, the brand represents a component in the company offer which greatly influences the choices of the end consumer, because it is an asset which is directly linked to the urge to pursue, through the acts of purchasing and consumption, expression of one’s own personality and life style (values, behaviour and identification). Thus the vital significance of brand has to be identified in its components of perception (cognitive and emotive associations evoked in the mind of the consumer) and trust (expectations of the consumer which are fulfilled by the company) (Howard, 1977).
In terms of our analysis it is particularly significant how the brand image determines an added value for the consumer (Aaker, 1993), reflecting the company’s efforts to incorporate the stakeholder approach in its business strategy. We can also recall that recent studies (Bertoli, Busacca and Costabile, 2000) have shown how the brand image is an immaterial resource which has a particular influence on market “trust”. More than other resources used in company policy, it is fundamental in reinforcing that trust. Conversely it is potentially able to diminish the degree of credit accorded to the company by the market. This is why people speak about brand “vulnerability” (Werther and Chandler, 2004), which becomes all the greater as brands become central to corporate strategy, revealing the potential of the brand to increase or reduce company equity.
In a customer-based perspective the brand image interacts with the brand identity3 and brand awareness4 (Keller, 1998) in determining the brand equity, and thus in enhancing the immaterial element which goes into constructing the “product offering” 5. By intervening on the three elements of brand identity, brand image and brand awareness, one can extend the brand’s ability to generate and increase the distinctive elements of the company’s offer with respect to competitors (ability of differentiation); to facilitate the company’s entry in new markets or segments (ability of diffusion); to increase and consolidate the company’s cognitive patrimony (ability of learning).
An increasingly important objective in brand policies in our era of a “dematerialised” economy is the dissociation between brand and product that the consumer can achieve through processes of abstraction (Fournier, 1998), so as to create new associations for the brand in cognitive and emotive terms. Thus the brand image is now oriented toward creating affective associations, of psychological and social well-being and self-identification on the part of the consumer, within the system of values and material components proposed by the company.
In the new perspective for brands incorporating “real life significance”, three of the functions it performs acquire greater importance: personalisation, communication and warranty (Kapferer and Thoenig, 1991). These functions are performed by the brand even independently of the product associated with it, since they relate to the set of value, symbolic and expressive elements which the company transmits to the market by means of its product offer and its economic and social behaviour.
To sum up this brief overview of the fundamental elements of strategic brand management, serving to introduce the subject of our analysis, we wish to emphasise that the dissociation between brand and product can also be viewed in the perspective of competitive strategy. In particular, it is the pivot for the strategy of competitive differentiation based on the company’s “basic characteristics”, meaning the distinctive image which the company seeks to create in consumer perception.

1438
The Brand Image as Synthesis of the Firm’s Relationship Competences In the light of these brief theoretical considerations placing the brand image in the context of the strategy of differentiation and quest for competitive advantage based increasingly on immaterial resources involving trust, another theoretical framework we can refer to is the view of a brand as “synthesis of a firm’s relationship competences”.
If we consider the premises and dynamics linking company and environment elaborated in the systemic approach applied to business studies, we can view the company as a “system” interacting with other systems lying outside the company, prior to investigating the links existing between brand equity and corporate social responsibility. The conceptual elaborations of the systemic approach (von Bertalanffy, 1968; Emery, 1974; Maturana & Varela, 1980; Cafferata, 1995; Capra, 1996; Tagliagambe & Usai, 1999; Golinelli, 2000) and stakeholder theory (Mitroff, 1983; Freeman, 1984; Frederick, Davis & Post, 1988; Carroll, 1989; Freeman & Reed, 1993; Donaldson & Dunfee, 1994; Clarkson, 1995) converge in the centrality of the relationships which the company manages to set up with external subjects, institutions and systems, vectors of resources which the company must succeed in exploiting in pursuing its objectives of survival and development6.
In particular, the company lies at the centre of a dense network of relations with the outside world, expressing its ability to legitimise itself, in both economic and social terms, by fulfilling the expectations and pressures focused on it by the environmental super-systems (Golinelli, 2000).
The conditions of survival and development for the company are thus to a great extent determined by the ability of its governing body to interpret and adopt the demands coming from the stakeholders, obtaining in return the provision of “resources” of various kinds.
Of course the regulation of the degree of openness of the company-system to its external environment (Maturana and Varela, 1984), controlled by the governing body, also involves a grading of the stakeholders’ expectations according to “importance”7.
Among these, the resources of trust which the company manages to build up involve, in concrete terms, acceptance on the part of the stakeholders of the products on offer, the values and the track record of the company, and consequently the value of the brand which draws on the recognition by the external environment of its ability to be a cell in a system which is at once economic and social.
This is in outline the dynamic linking the company to its external environment, which is achieved through reciprocal conditioning. In the perspective of the stakeholders, the conditioning of the company consists in projecting expectations in both economic and social terms and subsequently in manifesting their degree of satisfaction by means of mechanisms of rewards and sanctions. Nonetheless it is clear that the satisfaction of the stakeholders’ expectations has to be set against the need for economic, financial and organizational equilibrium (Cafferata, 1995), and thus against the expectations expressed by the sub-systems within the company. The efficacy of the governing body’s action involves managing both inter- and infra-organizational relations and pursuing an overall systemic equilibrium. This equilibrium, which is thus both internal and external, is a necessary condition for the company’s survival.
In conclusion, in the perspective of the systemic approach and stakeholder theory, the brand represents a “container” of values, competences and business strategies which interact with one another and influence each other; the value of this “container” is thus a function of the company’s ability to coordinate the goal of maximising profit with the fulfilment of all the stakeholders’ expectations (Fig. 1).
This simple diagram highlights the following three brand-related issues: − the consideration of stakeholders’ expectations is crucial to any business policy, irrespective of whether it is
“finalistic” or “instrumental” and its position in the system of company goals; − the value of the brand, drawing on brand identity, brand image and brand awareness, reflects the collocation of
the company in the economic and social system, because it measures the degree of acceptance on the part of all the stakeholders (clients, suppliers, employees, public administration, trade associations, NGOs, unions, etc.) not so much of the product offer but rather of the company’s track record, on the basis of multidimensional criteria (both economic and social) of evaluation;

1439
− the competitive advantage which the company manages to secure, ensuring profitability, is highly conditioned, in the current competitive scenario, by brand policies, while the link between fulfilment of stakeholders’ expectations (including those relating to corporate social responsibility) and profit is all the greater to the degree in which the competitive strategy is brand-driven.
FIG. 1: THE BRAND IMAGE AS ‘CONTAINER’ OF A FIRM’S RELATIONSHIP COMPETENCES
The Connection between CSR and Brand Image The conceptual starting-point for an analysis of the connection between CSR and brand image, and by extension between CSR and the competitive advantage determining profit, concerns the widespread expectations of social responsibility in all the company’s stakeholders. In other words, the expectations concerning CSR are not localised in precise points (e.g. shareholders or financiers, suppliers or clients, public administration or non profit organizations) but can be found in each typology of stakeholder (Fig. 2).
The different nature of stakeholders’ expectations concerning the company’s social responsibility constitutes a matrix of multidimensional social responsibility factors linked to economic, environmental and social issues. This means that all the stakeholders have increased expectations vis à vis the company, from raw results to operating modalities.
In this perspective, stakeholder theory can be seen as the outcome of a new conception of the company, to be viewed not in terms of company-market and company-State (as in the liberal economics tradition) but in the triad market-State-society (Velo, 1998). This means that the company no longer interacts only with market and State but also with society, which requires it to fulfil a functional role in the relative social system.
BRAND IMAG E BRAND IDENTITY BRAND AWARENESS
BRAND EQUITY
COMPETITIVE ADVANTAGE
PROFIT
SATISFACTION OF STAKEHOLDERS’ EXPECTATIONS
VALUES STRATEGY COMPETENCES

1440
FIG. 2: THE PRESENCE OF CSR EXPECTATIONS EVERYWHERE
The rationale of the social budget is a tangible effect of this; the company must provide information to
society at large on the strategic and operative modalities in which it balances pursuit of profit with a socially responsible behaviour. The recipients of this recent form of communication are no longer merely certain stakeholders, such as shareholders or financiers, but society as a whole (Zadek, Pruzan and Evans, 1997).
Furthermore CSR expectations are not only “everywhere” but also “on the increase”, associated with the pressure on companies to take a “proactive” approach to environmental and social issues, rather than merely conforming to existing legislation. The CSR Monitor, which annually surveys twenty countries through institutes belonging to GlobalScan, highlighted in its 2004 Eurisko report on Italy the “new” environmental and social responsibilities facing companies (Tab. 1).
TABLE 1: OLD AND NEW CSR EXPECTATIONS
The “old” CSR expectations The “new” CSR expectations
− Do not damage the environment − Communicate financial profits honestly − Treat employees fairly − Make profits, pay taxes − Communicate social and environmental
commitment honestly − Use raw materials which have been
produced “responsibly” − Good quality / low price
− Improve environmental conditions − Apply high standards universally − Reduce human rights abuses − Improve education in the community − Reduce poverty − Orient economic stability − Support NGOs − Help to solve social problems
COMPANY CSR expectations among Providers
CSR expectations among Customers
CSR expectations among Employees
CSR expectations among Stockholders
CSR expectations among Syndacates
CSR expectations among Social Groups
CSR expectations among Mass Media
CSR expectations among Environmental Groups
CSR expectations among Local Associations
CSR expectations among Public Administration
CSR expectations among Consumer Associations

1441
The historic approach of Friedman8 (1962; 1970), and more recently of Sternberg9 (1994), to corporate social responsibility, in which the company’s only responsibility is to make a profit, now appears totally inadequate in the light of the new order of company-State-market-society relationships in the post-industrial era, even if we merely consider CSR as being instrumental in the pursuit of profit. Both stakeholder theory and the systemic approach are based on this view of the company as interacting with society as a whole, with markets and the State as components. The company system (a cell of the social system) is no longer separated from the social system but is considered a component, and the mechanisms by which markets function are no longer based merely on the economic variables of price, salaries, incomes, asset values, etc., but respond to the social conventions and norms of behaviour which regulate management organizations and political and social institutions.
The shortcomings of Welfare State policies in conditioning market mechanisms have restored centrality to the “enhancement of public life”; as Adam Smith maintained, a proper functioning of society depends on the extent to which “civic virtues” have been disseminated amongst the population. These results in new responsibility for the company: as an actor in the economic and civic progress of society, it must incorporate in its underlying principles the logic of created social value, balancing it against the logic of created economic value. The economic value chain and social value chain unite in the new company mission which, as Freeman (1984) observed, is to be seen in balancing the interests of all the stakeholders.
However, we still have to confront the crux of the question: does CSR represent a manifestation of the culture of civic coexistence among subjects (companies included) featuring in society, or is it a manifestation of economic culture which, driven by economic utility and limited rationality, attributes to CSR a role which is in any case instrumental with respect to the maximising of profit in the long term?
In our opinion it is predominantly the latter perspective which guides company strategy concerning CSR, since we see companies’ willingness to assume civic responsibility as being still weak or indeed in many cases non-existent.
There is a lot of empirical evidence for the fact that CSR initiatives are prompted by the advantages gained in terms of reputation and trust rather than the wish to meet stakeholders’ expectations. For example the Global CSR Study, carried out by APCO Worldwide in 2004 using an elite research panel in 10 countries in North America, Europe and Asia-Pacific, shows that the consensus of opinion is that companies act in a socially responsible manner because it is in their business interest to do so, not because they are pressed by stakeholder demands (Tab. 2).
TABLE 2: CSR IS A BUSINESS INTEREST
Strongly agree
Somewhat agree
Companies act in socially responsible manner because it is in their business interest to listen to and adapt to society’s concerns
31% 29%
Companies act in socially responsible manner because internal and external stakeholders place pressure on companies to address society’s concerns
20% 20%
Like consumers, other typologies of stakeholder are often sceptical concerning the ethical motivations
behind CSR initiatives. For example, research carried out by the “Public Administration and No Profit Organizations Department” of the Bocconi University, Milan, Italy, promoted by Sodalitas (2004), showed that public institutions and non profit organizations consider that companies very often adopt socially responsible behaviour “only for reasons of image or reinforcing customers relations”, and hence merely for “egoistical reasons”. These two important stakeholders, public institutions and NGOs, thus show little faith in the social commitment of companies, and believe that the most effective communications tools are those guaranteed by third parties, such as certification, ethic labelling and awards for CSR initiatives, while social advertising, cause-related marketing and even ethic codes are not very credible, the latter being dismissed as “no more than declarations of intent”.
On the other hand, companies have taken on board the notion that “good ethics is good business”, meaning that in the long term social responsibility pays (Sciarelli, 1993). Thus we can say that social responsibility has

1442
become an objective for companies rather than being merely a limitation on its operations, as it was under the old regime dominated by shareholders rather than stakeholders.
This appraisal, which may well sound pessimistic, also derives from my personal conviction that any “social value” can become a guide to individual behaviour to the extent to which it gauges the results obtained in relation to the effort invested. Since there are essentially two modalities of appropriation − economic enhancement in one’s own favour and enhancement of the ego − it is surely illusory if not ingenuous to maintain that this particular genus of homo aeconomicus (the entrepreneur) can have added a fourth “P”, Philanthropy, to the traditional three − Profit, Power and Prestige. This does not mean that the world of entrepreneurs is entirely devoid of values and behaviour demonstrating CSR, induced not by considerations of economic interest but in the perspective of psychological and social self-realisation combining with the pursuit of profit, power and prestige, but rather that the scarcity of these presences does not allow us to deny that CSR can be collocated in a position of absolute instrumentalism with respect to economic managerial goals.
We can also note, in connection with the combination of profit-power-prestige, that even if one tries to invert the order of the three objectives, considering the first two as instrumental for the third10 (Sciarelli, 2002), it must be granted that this can hardly apply to the managerial function, but only to a capitalist enterprise in which the manager is also the owner. If this were not the case, we would have to identify values and behaviour based on social responsibility also outside economic systems, in particular in political and social systems at both the collective and individual levels. Only in this case could we recognise a phenomenon of reciprocal contamination between economic, political and social systems, and thus interpret CSR as a manifestation in the economic sphere of values and principles occurring transversally in all social systems.
Some commentators, of even greater severity, maintain that the irresponsible company is a “structural feature of contemporary capitalism” (Gallino, 2005: p. 17) and that forms of regulation at the international level are called for to ensure that social responsibility enters into the processes of company governance.
In any case there can be no doubt that there is widespread scepticism concerning both corporate commitment to CSR and the “credibility” of the initiatives they have announced. In this respect the research carried out by APCO Worldwide showed that only 4% believe that companies have done “much more” over the past few years, while 16% believe they have done “much less”. Moreover the “credibility” of their CSR activities is much greater when they are verified by independent third parties, like NGOs or local governments (Fig. 3).
Have companies become more socially responsible or less socially responsible over the past few years, or has there been no change?
No change 9%
Somewhat less 27%
M uch more 4% M uch less
16%
Somewhat more 45%
How much more credible or less credible is information from companies on their social and environmental practices when it is verified by independent third-parties, like NGOs or local government, or does it make no difference?
M uch more credible 35%
Somewhat less credible
1%
Somewhat more
credible 56%No
dif ference 9%
FIG. 3: CYNICISM SURROUNDING CSR PROGRESS
One further consideration is that the concept of CSR as being instrumental to profit, and hence to be
included in calculating economic interest, does not necessarily diminish its intrinsic value. It is a recognition of reality, and as such no less laden with consequences for the functioning of companies. At the same time it is no less

1443
important in moulding a new conception of them, but certainly less hypocritical, and much less illusory, than a “socially romantic” vision of managerial activity. In fact in today’s world there is a widespread, substantial demand for social responsibility; what is lacking is a response that can be evaluated without using the parameters of economic interest11.
One element which seems to confirm the instrumentality of CSR in terms of profit-making emerges from a recent investigation12 of the state of application of CSR in major European companies carried out by ISTUD13 in 2002-2004. In particular this revealed a trend to substantial uniformity in the approach and behaviour of the companies analysed. This “resemblance” can be ascribed to the phenomenon of “isomorphism” described by organizational new institutionalism, by which organizations tend to adopt similar behaviour as a result of external pressures which define the rules and relationships among subjects and tend to stabilise over time (Di Maggio and Powell, 1991).
CSR is seen as displaying a threefold isomorphism (Caramazza, Carroli, Monaci and Pini, 2006): − coercitive isomorphism, caused by formal and informal pressures on the organization from other entities in the
“organizational sphere”, and by the cultural expectations of the social context; this may also include pressure deriving from juridical norms or behavioural norms defined by dominant companies;
− mimetic isomorphism, caused by phenomena of imitation of the behaviour of other organizations; this is particularly influential in the case of CSR;
− normative isomorphism, caused by the “professionalisation” of CSR, implemented by professional associations and groups by means of congresses, initiatives, documentation; in the case of CSR, the diffusion of a culture and technical jargon is pursued by various organisms such as CSR Europe, Eabis, Esomar, Emac, Egos, all operating in Europe14.
As we have recognised, this appraisal may seem to some unduly pessimistic. Yet the incorporation of the values deriving from CSR among goals rather than instruments may require a transition phase, involving “gradual assimilation”, starting from the calculation of economic interest. However, this is not the right place to take this particular analysis any further. Currently CSR is unequivocally collocated amongst the managerial strategies designed to maximise profit. What instead is profoundly different with respect to a few years ago is the telescoping of the time span used when referring to profit-making. A CSR strategy is increasingly a necessary condition for obtaining profits, not only in the long term but also in the short and medium terms.
The virtuous relationship existing between economic, competitive and social performance has been perfectly familiar to both management experts and practitioners for a considerable while.
Numerous studies have shown the existence of a close link between corporate social behaviour and income performance (Murray and Vogel, 1997; Sen and Bhattacharya, 2001; Institute of Business Ethics, 2006) and, more specifically, between the former and consumers’ readiness to reward or punish (Aaker, 1990; Keller and Aaker, 1993; Speed and Thompson, 2000). In a recent article designed to evaluate The Impact of Perceived Corporate Social Responsibility on Consumer Behaviour, Becker-Olsen, Cudmore and Hill (2006) show that 52% of interviewees boycott products and services of companies seen as irresponsible.
There are deep cultural roots for the dual economic and social profile of a company in all the managerial cultures in the world, and there is no point in dwelling on this here. Instead I wish to stress the vector that makes this association operative, and how CSR finds in brand policies the interface between company and consumer. In this perspective, the brand takes on the role of “inter-systemic connector” between company-system and consumption-system, integrating the CSR strategy (company values and track record) and the company’s competitive strategy. In fact they are combined in the cognitive and emotive associations which the brand manages to elicit in the mind of the consumer.
In the Global CSR Study by APCO Worldwide, referred to above, it emerges that “opinion elites act in response to news they receive about a company’s social responsibility through their purchase decisions and influence on others. Three-quarters say they have purchased a company’s products or services in response to positive news about a company’s social responsibility”.
The connection existing between brand and CSR takes on particular significance for companies which operate on the global scale and introduces the highly complex topic, to be tackled in the next section, of diversity of

1444
approach in global CSR strategy. In particular, the connection between global brand strategy and global CSR strategy represents in our opinion the conceptual crux for companies, characterised by having:
− a CSR strategy; − a brand-driven competitive strategy.
These two features of business strategy pose no particular problems if referred to a company which operates in a single, specific local context (a certain country, with certain stakeholders’ expectations and standard systems of ethic values). This is not the case, however, for a company which operates on the global scale and thus in various countries, with different stakeholders’ expectations and different systems of ethic values. How to Combine Global Brand Strategy and Global CSR Strategy? Referring to stakeholder theory and the systemic approach, I have outlined the theoretical frameworks required to analyse the links between global CSR and global brand strategy, which I shall now go on to investigate by projecting them onto a global dimension. The crux of the question can be expressed thus: does the construction of brand image by the assumption of socially responsible behaviour observe the same principles at the local and global levels? Or does the passage from local to global throw up new or different elements of analysis which preclude transferring our considerations from one to the other? In other terms, which vectors are available when the pursuit of a global brand strategy seeks reinforcement by assuming social responsibility?
Before trying to provide an answer to these questions, we can observe that it is not enough to say that “a global CSR strategy is necessary to reinforce the global brand image”. We have to identify the contents and meaning which CSR strategy takes on at the global level.
A second preliminary consideration is that when above we viewed CSR strategy as instrumental for business strategy and maximising profit (extended to the short as well as medium and long term), we expressed scepticism concerning any hope of finding social responsibility in an entrepreneur’s DNA. The profound crisis currently undermining political, social, educational and market systems, with economic and social scandals, loss of reference values, and cultural impoverishment in education at primary and secondary levels , makes us inclined to believe that CSR is the manifestation, in the economic sphere, of socially oriented values and culture that characterise the organizational systems in contemporary society.
That said, the first important difference in approach between local and global CSR concerns the “sectorial” or “systemic” formulation of the respective strategies. In particular, while the fact of operating in a local context makes it possible to “select and hierarchise” CSR expectations as a natural effect of the selection and hierarchisation of stakeholders influencing the company’s action, operating in a global context requires a coordinated and comprehensive consideration of CSR expectations, in the light of the inter-dependence created between stakeholders scattered in different contexts, but always in direct contact with each other.
This question can be clarified in the following terms. In a restricted, local context, the action of the company’s governing body in terms of interaction with the external environment involves the possibility of setting up a “filter” and “selection” with respect to the expectations and pressures coming from external systems and entities, according to the degree of importance perceived by the governing body in terms of the business strategies. In other terms, in the concept of a “partially open system” (Maturana and Varela, 1980) we must also collocate the possibility available to the governing body to discretionally evaluate the positioning of the company in the economic and social system, and to attribute to it the identity it considers most functional with respect to the established goals. In terms of social responsibility this results in discretional evaluation and selection of the responses to be given to the demand for social responsibility expressed by local stakeholders, and their collocation in a system of hierarchical priorities and importance. Thus the governing body must be able to interpret what is required from the company by the specific cultural and social context in which it operates, the specific requisites being manifested in the expectations and pressures of the stakeholders (Golinelli, 2000). For example, one context might attribute priority, in the context of “social responsibility”, to the need to safeguard workers’ rights; on the contrary, another local context could attribute the same priority to safeguarding the environment, perhaps because it believes that the juridical regime is sufficiently protective of workers’ rights. Such a divergence in priorities is dealt with by the governing

1445
body deciding local CSR strategy so as to respond to its stakeholders. There is support for this in the results of the above-mentioned ISTUD survey (2002-2004), which shows that stakeholders are generally handled on the basis of single projects, concerning single reference groups, in a “one to one” dimension (Caramazza, Carroli, Monaci and Pini, 2006),
As a result the approach to CSR is “sectorial”, selecting and hierarchising the various CSR expectations in the light of the evaluations formulated by the governing body concerning their interdependence with the company’s contingent requisites and goals. Thus the company will formulate a response on CSR calibrated according to the specific requisites of the local context, as well, naturally, as the conditions for the company’s survival which the governing body safeguards adopting a schematic and selective approach, without proceeding to a systemic overview of all the CSR projects.
In fact the CSR strategy implemented in the specific local context sees its evaluation by the local stakeholders mirrored in the local brand image, elaborated according to the judgement – positive or negative – given by the stakeholders concerning the company’s record in social responsibility. The connection between local CSR strategy and local brand image responds to the sequence CSR local demand – CSR local response – local brand image, and in its contents also reflects the power that the local stakeholders are able to exert over the company’s activity.
In our opinion this approach is not valid when the company’s activity extends to the global level. The heart of the question is that an approach to global CSR strategy cannot be characterised by “sectoriality”, in the sense of selection and hierarchisation of CSR expectations. Operating in a global context means taking into consideration a wide variety of expectations which, while they are specific and susceptible to hierarchisation in the local contexts, at the global level constitute a single multidimensional set. As a result, all the possible declinations of the concept of social responsibility come to assume equal importance, without the possibility of establishing a hierarchic order nor the instances of a demand, failing to elicit a response on the part of the company. Thus the action of the governing body in terms of social responsibility is deprived of the possibility of “selecting” and “hierarchising” the requirements of CSR from the external environment. At most, in regulating the degree of openness of the company-system to its environment, it will decide the degree of satisfaction of expectations concerning CSR, but not an orientation towards certain issues rather than others. It must be borne in mind that in the global dimension one loses the relative power of the stakeholders vis à vis the company and vice versa. The overall position of the global stakeholders derives from a unitary composition of local stakeholders, by means of a dual process: additive and compensative. It is additive because the stakeholders whom the global company has to consider are the sum of the external entities and systems operating in the various local contexts; compensative because their respective powers of influence and conditioning on the company’s activity support and compensate each other reciprocally, assuming equal importance. To return to the example given above, the difference of expectations among local stakeholders concerning the contents of social responsibility (workers’ conditions, environment, transparency and reliability of information, and so on), tends to be cancelled out as a result of their intersection in the global context. As a result, the response of the company cannot be based on the selection and hierarchisation which operate locally, but has to take into account their addition and compensation in a systemic rather than sectorial approach. Independently of the various juridical systems which regulate some aspects of social responsibility in the various countries, the company must give an overall response to the global market concerning its economic and social conduct, and thus establish a CSR strategy which includes all the possible declinations.
The connection between global CSR strategy and global brand image, which also follows the sequence CSR demand – CSR response – brand image, will reflect the ability of the company to be perceived as socially responsible in terms of all its meanings. Without the possibility of operating any selection or hierarchisation, the company must show itself to be socially responsible in an overall, non-sectorial perspective.
Thus in the global context there must be an overall strategic plan which the company draws up according to a multi-stakeholder logic. Unlike the sectorial logic, its systemic counterpart consists in defining a CSR strategy taking into consideration: − the overall set of requirements concerning CSR manifested by all categories of stakeholders;

1446
− the relationships between the various categories of stakeholders, with specific reference to reciprocal conditioning in making positive or negative evaluations of the company’s track record;
− the rapidity and scope of the inter-stakeholder communication process which, at the global level, brings about reciprocal contamination and conditioning of the various local brand images, acting as an amplifier worldwide of the judgement formulated by stakeholders on a company’s social behaviour, both when this is positive and above all when it is negative.
By means of this systemic approach to CSR strategy, which goes beyond the logic of single projects in favour of joint project elaboration aimed at an overall equilibrium in relations with stakeholders15, the company can elevate CSR into a strategic asset to be exploited in global markets.
In this way the global brand image can indeed be reinforced thanks to the company’s social responsibility commitment which, in a global business strategy, is not the mere sum of the responses which the company provides locally to the requirement of social responsibility.
For a company which operates at the global level, integrating CSR in strategy and operativity means creating distinctive competences which are recognisable to stakeholders worldwide and reinforce the brand image.
A concrete example of this perspective, considering stakeholders on a global rather than local level, is seen in the Sony Group, which has eliminated some chemical substances from its products, throughout the world, even though they are prohibited only in Europe. In its CSR Report 2006, Ryoji Chubachi, President and Electronics CEO, gave this summary of Sony’s global CSR approach: “Although the RoHS (Restriction of Hazardous Substances) Directive restricts the use of certain specified chemical substances in electrical and electronic equipment brought to market in the European Union beginning in July 2006, Sony has eliminated these specified chemical substances from nearly all of our products shipped worldwide, not just in Europe, by March 31, 2006. I believe that special consideration for the conservation of the environment is not only a corporation’s social responsibility but also a key to its competitiveness. As a global organization, we are actively endorsing the importance of compliance with the laws and standards of each country and region in which we operate, and of conducting our operations in a manner that is in harmony with accepted corporate ethics and social norms, throughout the Sony Group”.
From this point of view we agree with Werther and Chandler (2005: p. 324) when they say that “strategic corporate responsibility is a global brand insurance”; on condition, however, that CSR is a component of the global business and not a strategy of “masking” or a mere “fashion”, nor a contingent response made to avoid social or legal sanctions. Beyond Voluntary Action: Towards an International Regulation of CSR A rather different issue that arises in passing from local CSR to global CSR concerns the juridical regulation of the subject in the world and the way in which this varies from one country to another. Although this seems to be quite separate from a managerial analysis of the subject, in fact it does have major implications on the “systemic approach” which as we have seen should characterise global CSR strategy. In fact it makes it necessary to probe the requirement for CSR expressed by one particular category of stakeholder, the State, through its regulation of economic activities. The juridical and economic aspects of CSR are closely linked, and cannot be observed separately. Thus any analysis of CSR on the global scale cannot neglect, globally even more than locally, the question of juridical regulation and its implications on the action of a company’s governing body.
In the light of this, in order to make global CSR accessible to companies according to a systemic rather than sectorial approach there has to be a uniform legal framework at the international level, for two reasons. First, because, in keeping with our scepticism concerning the interiorisation of CSR in a company’s value patrimony, voluntary adhesion and self-regulation on the part of companies are undoubtedly weak factors in the construction of socially responsible systems and economic actors16. In particular, a widespread, genuine CSR will make headway in the world only if certain types of behaviour, actions and values concerning the social sphere are made obligatory by forms of juridical regulation, without invalidating our attempt above to collocate CSR among the management principles and sources of competitive advantage.
It comes as no surprise when findings of empirical research show how little CSR is really integrated into company strategy. An investigation carried out by the Business for Social Responsibility and the Dutch Ministry of Economic Affairs in 2005, “Taking the Temperature of CSR Leaders”, shows that “the degree of CSR integration into core business functions is perceived as very low across all sectors, organizational positions and countries”. In

1447
particular, among Multinational Companies (MNCs), Small & Medium-Sized Enterprises (SMEs) and Non-Governmental Organizations (NGOs) it emerged that CSR is not well integrated into the core functions and activities of business. In fact there were low scores agreeing or strongly agreeing that “Most businesses have done a good job of integrating CSR into their core functions and activities” across all three categories analysed (Fig. 4).
FIG. 4: LOW LEVEL OF INTEGRATION OF CSR INTO THE BUSINESS
Similarly among managers, executives and staff, many respondents believe that CSR will play a much
more important role in the future. The scores agreeing or strongly agreeing that “Five years from now, CSR will be an even more important part of business than it is today” were very high across the three categories analysed (Fig. 5).
FIG. 5: CSR AS PLAYING IMPORTANT PART IN BUSINESS IN THE FUTURE
One further confirmation of the very limited insertion of CSR in business strategy emerges from findings of
a survey carried out in 2005 by AIAF (Italian Association of Financial Analysts) on the environmental, social and sustainability balance sheets in the Italian companies listed on the stock exchange. In particular, it emerged that over 50% of companies do not include in their CSR balance sheet a section dedicated to future goals, and 35% merely state their objectives generically, without showing year-on-year comparisons (Fig. 6).
15,0%
5,0%
10,0%
0% 5% 10% 15% 20% 25%
MNC
NGO
SME
95,0%
82,0%
93,0%
40% 60% 80% 100%
Executives
Managers
Staff

1448
NO 51%
DETAILED 14%
GENERIC 35%
FIG. 6: PRESENCE IN CSR BALANCE SHEETS OF FUTURE GOALS
In the same source, the most disturbing finding is that in 2006 the number of companies which presented a
CSR balance sheet to the AGM was down on 2005, from 23 to 20; this detail is also connected with the fact that there is no legal obligation to draw up such documents. Another survey carried out by Robert Half Executive Search, specialised in recruiting skilled personnel, based on interviews with 2700 European managers, showed that one of the chief obstacles to the spread of CSR practices is the lack of any internationally valid rules. In Italy, for example, it transpired that 48% of companies do not invest in initiatives of social responsibility for this reason.
Secondly, because the asymmetries and diversities currently found in the juridical systems of different countries constitute a factor which distorts the opportunity for free competition worldwide. It subjects companies to different restrictions (and hence costs), altering the “condition of parity” which is at the root of efficient competitive confrontation. For example, the fact that France17 is the only European country to have introduced a juridical regulation which is binding for companies undoubtedly penalises French firms in global competition and, on the contrary, favours those operating in countries with no such juridical prescriptions.
Moreover, in such asymmetric conditions, the distribution of socially ir/responsible companies worldwide is bound to correspond to geographical position and the intensity of legal obligations, and in particular to the existence and intensity of legally enforceable sanctions as the real “conditioning force” behind these obligations.
From this point of view, the ambiguities and differences in behaviour among public bodies has created a climate of scepticism concerning the role they can play in promoting CSR. Referring once again to the enquiry of the Business for Social Responsibility and the Dutch Ministry of Economic Affairs, it emerges that NGOs, MNCs and SMEs are very critical about the efforts made by national and local governments to promote CSR and believe that they “are not doing enough when it comes to the promotion of CSR”.
The problem of juridical regulation also reflects the need to establish international standards framed with multistakeholders in mind. As things stand, international certification is still too sectorial: the existing standards refer to specific aspects of CSR. Without claiming to be exhaustive, the main international standards are: SA 8000 (by the Council on Economic Priorities Accreditation Agency – CEPAA), concerning above all the supervisions of working conditions, also for minors; BS 8800 (by the British Standards Institution – BSI) and OHSAS 18001 (by a group of national organisms, certification bodies and experts), concerning issues of Occupational Health and Safety; AA 1000 (by the Institute for Social and Ethical Accountability – ISEA), concerning the guiding principles for Social and Ethical Accounting, Auditing and Reporting, so as to make the findings from different sources compatibles; ISO 14001 (by the International Organization for Standardization, in the European Community) and EMAS (EEC Regulation n. 1836/93) concerning Environmental Management Systems.
It is not possible here to probe further into the issue of juridical regulation of CSR, but we wished to raise it because, as stakeholders theory and the systemic approach show when applied to the study of businesses, the relations between a company and its environment must be viewed in their globality and not individually, in their inter-dependence rather than as single instances of cause and effect.
We believe that CSR represents a central aspect in company governance. In the future no company will be able ever again to consider it merely a hindrance to its action, but will have to include it among the sources of

1449
competitive advantage, alongside the traditional attributes. However the issue of global CSR strategy does not stop at the matter of management principles, but includes delicate juridical aspects which inevitably emerge in the passage from local to global. In relation to our chosen topic, the relationship between CSR strategy and brand equity in the global context, juridical regulation can be seen as an element that conditions global CSR strategy and hence, as we have shown, the construction of a global brand image. In conclusion, the strategic valence of CSR and its juridical regulation constitute the two factors which can attribute to the connection we have examined characteristics of “concreteness and realism” rather than “theoretical abstraction and mere utopia”.
References
[1] Aaker, D.A. (1993). Brand Equity. La gestione del valore della marca. Milano: Franco Angeli. [2] Bertoli, G., Busacca, B. & Costabile, M. (2000). La difesa delle risorse di fiducia. Sinergie, 51, 143-192. [3] Boatright, J.R. (1993). Ethics and the Conduct of Business. New York: Prentice Hall, Englewood Cliffs. [4] Caramazza, M., Carroli, C., Monaci, M. & Pini, F.M. (2006). Management e responsabilità sociale.
Milano: Il Sole 24 Ore. [5] Carroll, A.B. (1989). Business & Society. Ethics & Stakeholder Management. Cincinnati: South-Western
Publishing. [6] Clarkson, M.B.E. (1995). A Stakeholder Framework for Analyzing and Evaluating Corporate Social
Performance. Academy of Management Review, 20, 92-117. [7] Donaldson, T. & Dunfee, T.W. (1994). Toward a Unified Conception of Business Ethics: Integrative Social
Contracts Theory. Academy of Management Review, 19, 252-284. [8] Freeman, R.E. (1984). Strategic Management. A Stakeholders Approach. London: Pitnam. [9] Friedman, M. (1970, September 13). The Social Responsibility of Business is to Increase its Profits. New
York Times Magazine. [10] Gallino, L. (2005). L’impresa irresponsabile. Torino: Einaudi. [11] Golinelli, G. (2000). L’approccio sistemico al governo dell’impresa. Padova: Cedam. [12] Jawahar, I.M. & McLaughlin, G.L. (2001). Toward a Descriptive Stakeholder Theory: an Organizational
Life Cycle Approach. Academic of Management Review, 26, 397-414. [13] Kapferer, J.N. (1997). Strategic Brand Management. London: Kogan Page. [14] Sternberg, E. (1994). Just Business. Business Ethics in Action. London: Little Brown. [15] Werther, W.B. & Chandler, D. (2005). Strategic Corporate Social Responsibility as Global Brand
Insurance. Business Horizons, 48, 317-324. Contact author for the full list of references.
End Notes
1 One well known analysis of CSR, Carrol (1989), features four categories: Philanthropic, i.e. “being a good citizen”; Ethical, i.e. “being in line with society’s values”; Legal, i.e. “obeying the laws”; Economic, i.e. “being profitable”. 2 Kotler and Scott (1992) define “brand” as a name, term, symbol, drawing or combination of these serving to identify a company’s goods or services, differentiating them form those of its competitors. 3 “Brand identity” covers both all those attributes (name, logo, symbols, jingles) by which the consumer identifies the brand and distinguishes it from alternatives in competition, and the company values which characterise a specific company in the context of the supply system. 4 “Brand awareness” involves the ability of the brand to be identified by the consumer, in terms of probability (brand recognition) and speed (brand recall), at the moment of choosing and purchasing products or services in competition.

1450
5 Product offering is the set of elements perceived by the consumer which condition purchase choices, responding to the question: what “gets” to the consumer? What does the consumer see to be significant in making choices? These components are functional (product, customer service); expressive-symbolic (brand, image); instrumental (communication, merchandising); economic (price and conditions for payment). 6 It has become a general consensus in business studies that the “success” of a company cannot be measured in terms of profit, but “in the degree of satisfaction of the various subjects involved in the value creation process” (Sicca, 1998: p. 8). 7 According to Golinelli (2000), the “importance” of a systemic entity belonging to the external environment is in turn determined by the “critical quality of the resources yielded” and the “influence which that entity exercises on the company”, in terms of restrictions and modes of behaviour required for the company’s activities. 8 In one of his most celebrated articles Friedman (1970) set out three basic concepts: − the managers’ responsibility is merely to act in the interests of the shareholders, so that each departure from the
goal of profit is an abuse and a betrayal; − the management of social questions is the business of other institutions, in particular the State, which must
regulate it properly and, where necessary, impose its policy on companies; − only individuals, and not companies, can be invested with a moral responsibility for their actions. 9 Sternberg (1994) also denies the possibility of attributing to companies forms of social responsibility, since this is extraneous to the interests of the owners. He argues that all the managers’ actions must be viewed in terms of the effects they produce on shareholders’ returns. He talks of a “Robin Hood syndrome” in saying that social responsibility is “a wrongful expropriation of the owners’ capital” (Sternberg, 1994: p. 4). 10 According to this approach, the chief goal of the entrepreneur is prestige (social leadership), beside which the goals of market power (competitive leadership) and profit are merely instrumental (Sciarelli, 2002). 11 We believe that CSR can be viewed in the company-environment relationship in a “reactive” logic, in that the interaction between the company and its stakeholders varies over time according to the relative importance of each vis à vis the critical organizational requisites that vary in the company’s developmental phases (start-up, growth, maturity, transition/renewal/decline) (Jawahan and McLaughlin, 2001). Thus the expectations of stakeholders, including ethical and social concerns, are considered by the company if and to the extent that they figure explicitly and there is some form of legal or social sanction in case of failure to satisfy. 12 REBUS (Responsibility between Business & Society). An analysis of the overall results of the project can be found in Caramazza, Carroli, Monaci and Pini (2006). 13 ISTUD (Istituto di Studi Aziendali) is an Italian Business School operating in Europe in the sphere of advanced professional training and research into management. 14 CSR Europe, non-profit organisation that promotes corporate social responsibility; Eabis, European Academy of Business in Society; Esomar, European Society for Opinion and Marketing Research; Emac, European Academy of Marketing; Egos, European Group for Organizational Studies. 15 It must be remembered that the quest for overall equilibrium in relations with stakeholders also requires management of the possible conflicts of interest between stakeholders, both at the local and global level, identifying which are the crucial conduct and obligations for being held responsible (Boatright, 1993). 16 The numerous initiatives concerning social responsibility carried out by international organisms in the last twenty years contain, with few exceptions, only principles, recommendations, and declarations of intent, but no juridically significant constrictions, so that CSR has remained a voluntary and self-regulated matter. Among the many examples some are particularly well known: the UN “Global Compact”, 1999; OECD “Principles of company governance”, 1999; EU Green Paper “Promoting a European framework of corporate social responsibility”, 2001; UN “Norms on economic, social and cultural rights”, 2003. 17 The law “Nouvelles Régulations Économiques” of 2001 and subsequent application, 2002, identify the categories of social and environmental information which must be inserted in the annual reports of French companies quoted on the Bourse.

1451
The Competence and Constraints of Brand-Building for Contract Manufacturers
Feng-Hsu Liu, [email protected] Heng-Yih Liu, [email protected]
Yuan Ze University, Taiwan (R.O.C.) Ting-Ling Lin, [email protected]
National Taipei University, Taiwan (R.O.C.)
Abstract
While brand-building may provide contract manufacturers with another growth opportunity, it may also give rise to the cancellation of orders from existing clients because of the potential threat of competition. What we try to put forth in this paper is that the own-brand building on the part of contract manufacturers is influenced by the interplay of two sets of forces derived from the initial decision mode of the selected OEM business. The first set of forces relates to competence, with competence in terms of the manufacturing process being concerned with product design, process development and the scaling up of manufacturing. It also influences the ability of contract manufacturers to develop their own-design products. The second set of forces has to do with the constraints, by which we mean the concentrated customer structure that will limit the extent to which contract manufacturers will want to change the way of doing business. In regard to this, we venture to suggest that while the existing manufacturing process competence of contract manufacturers will positively trigger their own-brand building, the concentrated customer structure will have moderating effects on the relationship between existing competencies and own-brand building. Furthermore, we argue that contract manufacturers can effectively minimize the threat of a concentrated customer structure and create value through various means, which include leveraging existing competence into related product lines, selecting geographic target markets cautiously, and entering such markets at the growth stage of the product life cycle. Introduction
Many international brand companies such as Dell, HP and Motorola in the past started to outsource some of their activities, manufacturing in particular, in view of the trend toward globalization, in an attempt to enhance their cost advantages. Accordingly, these companies cooperated with suppliers that had the ability to engage in high-quality and low-cost manufacturing (Heide and John, 1990; Quinn and Hilmer, 1994; Ziggers and Trienekens 1999). Among these global suppliers, Taiwan’s original equipment manufacturers (OEM)1 emerged due to their prominent manufacturing ability, especially in the electronics industry. In fact, there are widely-shared productive capabilities for which much of the Taiwan electronics industry’s growth over the last decade is accounted for owing to the factor cost differences between Taiwan and the developed country markets. The implications of this are that the attractiveness of the Taiwan electronics industry was initially driven, not by firm capability differences, but rather by country-level comparative cost advantages (Porter, 1990). Although Temporal (2005) stated that many Asian businesses fall into OEM trap which often settling for complacency and short-term gains due to strategic myopia, many of Taiwan’s contract manufacturers2 have not only continued to improve their manufacturing efficiency based on cost advantages, but have also enhanced the scope of their own competence beyond manufacturing while in the process of cooperating with their clients.
By continuously learning and grasping the lessons from prior experiences and the best practices of either themselves or their customers (Collis, 1996; Zollo and Winter, 2002; Hobday, 1995), the scope of competence of these contract manufacturers has developed from manufacturing to product design and development. The expansion in the scope of competence has helped contract manufacturers create more value by dedicating resources to the creation of own-design and own-brand products which may be similar to previous low-end OEM products based on a better financial position as a result of the OEM business (Lee and Chen, 2000).
However, firms have to stop rigidly focusing on short-term profits and concentrate more on long-term brand building (Burmann and Zeplin, 2005). On the other hand, branding building needs not only the sufficient resources that firms can provide but all staff must have desire to commit in. (Chernatony, 2001). Contract manufacturers who prefer

1452
to have their own brand seem to inevitably compete against their original clients and bear the risk of lost orders. This is because the prior decision of selecting the OEM mode of doing business ultimately elicits collaboration from international brand companies that like to share their technology, manufacturing know-how and so forth. This gradually forms a customer structure where contract manufacturers and their clients share similar competence. Once the former intends to have its own-brand, it naturally threatens and contradicts the interests of the latter in that may not continue to cooperate with each other.
Contract manufacturers will need to evaluate the trade-off between OEM business and own-brand business before the decision to engage in own-brand building is made, especially when the customer structure is concentrated. Such questions have not been discussed in the existing literature because previous studies on brand development have tended to focus on the factors influencing resources and the type, limitation or development of competence (Doyle, 1990; Bansal, Gatignon and Weitz, 1990; Arnold, 1993; Mudambi, Doyle and Wong, 1997; Scherer, 2000). They, however, neglect the factor of a concentrated customer structure which is an important factor in explaining why some contract manufacturers struggle for own-brand building even though they have good competence in manufacturing and product design. Thus, our conceptualizations illustrate and emphasize that either type of competence or customer structure is derived from the initial self-selection mode of OEM business, which past research left unveiled. Furthermore, we argue that contract manufacturers can build their own brands based on their existing competence, but will inevitability face conflict with clients who have similar competence through long-tern cooperation within their customer structure.
Based on the above, we argue that there are two contradictory forces in regard to own-brand building, and believe that this problem can be mitigated or resolved by adopting various approaches, including competence leveraging involving related product lines, cautious geographic target-market selection, and entry at the growth stage of the product life cycle.
By examining four cases of IT companies in Taiwan, we aim to examine, first, how the initial OEM mode taken by contract manufacturers affects the formation of manufacturing process competence and unique customer structure, which in turn influence the following decisions related to own-brand building. Secondly, we probe into how the contract manufacturers strike a balance between own brands and existing clients’ benefits. This paper starts with a literature review in the next section. An explanation of the research design follows, and includes a discussion on the selection of cases and data collection. Finally, our research concludes and prepares six propositions based on our framework, analyzing and comparing each case based on our gathered information.
Literature Review
Greiner (1972) points out that an organization’s past decisions have much more influence than its current decisions or external market variations. We can see this concept as the explanation for path dependencies from the point of view of resource-based theory. Here, the present position usually reflects the organization’s past pattern and emphasizes how past experiences have an enormous impact on future developments (Teece, Pisano, and Shuen 1997). Thus a firm’s previous investments and its repertoire of routines will influence or constrain its future behavior. In other words, an organization’s current decision in each period will be swayed by its past decisions and events, and will also stipulate its next decision. Accordingly, in this paper, we emphasize that there are two features of contract manufacturers resulting from the selection of an OEM strategy in the initial period. Manufacturing Process Competence: A Competence-based View The resource-based view believed that the firm is a repository of resources (Penrose, 1959). A firm should build resource barriers based on its own uniqueness in order to pursue profits (Wenerfelt, 1984; Mahoney and Pandian, 1992). Nevertheless, a firm will persist in pursuing economic rents not only because it has sufficient resources but also because it has the ability to use them (Penrose, 1959). Therefore, the definitions and classification of core competence (Prahalad and Hamel, 1990) and capability (Amit and Schoemaker, 1993) are generated by the diversities of the firm’s optimal resource deployment or even how it learns to deploy the bundle of assets efficiently. As mentioned above, the perspective of competence or capability and the resource-based view are fundamentally related to the firm’s competitive advantage from its inner perspectives.

1453
Although Taiwan’s contract manufacturers face increasingly severe competition from their global rivals, holding a relatively weak position in product technology and marketing capabilities appears to be another issue. How can it keep pursuing its growth with a fast changing environment? Sanchez, Heene and Thomas (1996) mentioned in their research that the firms must have two elements for sustaining their growth in a dynamic environment. These are, first, competence leveraging, which means that the firm will duplicate and enlarge its existing resources or specialties in order to extend their usage into possibly new fields, and, second, competence building, which means that the firm must create new assets or capabilities by overcoming learning to create new opportunities for its growth in the future. Only when it achieves a balance in terms of competence, can it contribute to a successful business operation (Sanchez, Heene and Thomas, 1996; Christensen and Foss, 1997).
In fact, if the company can strengthen its key competence by the cooperation with the international manufacturers, the stable revenue from orders of OEM business and the integrated management on its global supply chain setting, it will have sufficient capital and capability to invest in potential techniques and competence. In general, the contract manufacturer can benefit itself by making changes of resource configuration to invest in potential competence and leverages existing or new competences into another potential markets (Prahalad and Hamel, 1993).
Contract manufacturers used to specialize in low cost strategies based on their manufacturing competence. However, competence in terms of low cost manufacturing is hardly different from that of competitors, which can barely retain customers because of insignificant switching costs. To sustain a competitive edge, many contract manufacturers have started to expand the scope of their competence scope manufacturing to product design and development through learning from partners or through searching by themselves (Hobday, 1995; Lee and Chen, 2000). It is this that we define as manufacturing process competence. In doing so, contract manufacturers will engage in businesses other than OEM and will have the opportunity to engage themselves in own-design products.
As they face low cost competition from counterparts in China and Southeast and keep on learning product design and development from their international partners who have recently started to outsource everything except marketing in order to enhance their competitive cost position and pay more attention to competition in their product market dimension, there is no doubt that Taiwan’s contract manufacturers will have the chance and ability to step forward and have a go at manufacturing their own-brand products.
Furthermore, due to branding is a core marketing activity (Webster Jr and Keller2004), contract manufacturers can not only obtain higher profit margins from own-brand business but can obtain more market information regarding product design and development. Therefore, we agree that once the contract manufacturers have developed own-competence pertaining to design or key techniques, they may have a greater chance of leveraging existing competence to offer own-brand products. However, a contract manufacturer can seldom initiate this new strategic move without substantial costs, which has something to do with the unique customer structure gradually built up through the trajectory of previous OEM decision modes. Characteristics of Customer Structure The international brand companies adopt outsourcing modes in order to enhance its competitive cost position, in which they could achieve unique competitive edge. In such international cooperative relationships between international brand companies and global contract manufacturers, it is very easy for these two types of companies to resemble each other especially in manufacturing process competence which constitutes the unique customer structure for the latter. In other words, the unique customer structure can be seen as forms in which clients have similar products and techniques in industrial markets.
Besides the similarities in terms of the products and techniques, the discernable characteristics of customer structure are in this paper either concentrated or dispersed. A concentrated customer structure is defined based on the concentration ratio utilized to measure industry structure. The concentration ratio is expressed using the term CRx, which stands for the percentage of orders controlled by the largest x clients (Allen, 1969). For example, CR2 = 50% would indicate that the top two firms control 50% of the orders. In accordance with the concentration ratio used to measure the industrial structure, we also point out that a CR4 (C4, usually) of over 50% is generally considered to be a concentrated customer structure.
The reason why we want to classify the concentrated or dispersed customer structures is to infer the degree of dependence for contract manufacturers on their buyers. This characteristic of the customer structure will induce the use of different resources, different relationships with clients, and the ability of firms to expand their markets or develop

1454
their technology. On the one hand, a firm with a concentrated customers strategy can gain many advantages from this kind of relationship such as meeting clients’ requests on time, maintaining long-term customer relationships by offering relatively high quality service, increasing the degree of familiarity and reducing the chances of bad communication, which in turn reduce the costs and expenses associated with arranging, managing and monitoring. However, on the other hand, with a concentrated customer strategy, relatively few sources of techniques and knowledge from fewer clients limit the extent to which contract manufacturers have more chance to build their own competence which the ability or techniques of new or innovative product development, which in turn make also cause them to face more risks of an order being cancelled, cause them to lack the sources of techniques or product information and increase the costs of new knowledge creation or searching when they build their own brands. In other words, the more concentrated customer structure, and the less innovative product development by own competence. By discussing the characteristics of customer structure, we emphasize that concentrated customer structure is the main consideration for contract manufacturers due to the potential threat and risk of orders being cancelled and sources of competence being lost from cooperative relationships when contract manufacturers decide to have their own-brand products.
Method As already mentioned, our question is concerned with the question of building a brand of which the main goal is to explore the company’s customer structure formed by its initial decision, and how it affects on the brand decision and how its influences can be minimized. To conduct such an exploratory research, case studies become necessary. Generally speaking, quality research with case studies can be divided into two ways: Positivism and Interpretativism (Dyer and Wilkins, 1991). The former is a method that places greater emphasis on analysis, emphasizing the use of construct-analyzing cases (Eisenhardt, 1989). The latter is interpretative in that some theoretical perspectives are used in order to make a story stand out. The method that we adopt in this research is the former because our purpose is to form and build theory based on constructs. We will state the research design as follows.
Moreover, based on Yin’s (1994) case study research, we can use single and multiple cases to proceed with case study research. Although multiple case studies require a lot of resources and time-consuming efforts to apply for a key and critical factor or unique case, it has the advantage of generating theory with much complexity, and its empirical grounding is likely to be convincing (Eishendart, 1989). With regard to this advantage of multiple case studies, we adopt this approach of engaging in in-depth research into the four electronics industry contract manufacturers. This study interviews the key people who physically engage in the companies’ operations and tracks the important strategy-making points. Case Selection We select four electronics industrial companies that have developed their own-brand products and analyze them by means of case studies .The major considerations in relation to case selection in this study are as follows. First, all cases selected are contract manufacturers that engage in OEM business. Second, the OEM business of the contract manufacturers can be classified into many types in light of different criteria. The types of customer structure that result from different elements of OEM business seem to have different kinds of influence on brand building. Therefore, we also try to select two cases, which have different elements of customer structure among these four cases, in order to emphasize the different influences of customer structure on brand building. By doing this, in the selection of cases we rely on replication logic, rather than sampling logic (Yin, 1994). One case (ASUS) selected indicates that contract manufacturers adopt an initial strategy with their own-brand product, while another case (HTC) suggests that some companies choose to cooperate and develop competence with software companies like Microsoft. In fact, our choices of notebook3 and mobile phone4 firms also reflect an adequate representation of the industrial landscape in Taiwan. Data Collection Miles and Huberman (1994) suggested that the researcher to start his analysis during the data collection stage. The selection of data collection methods is guided by the nature of case study research that requires a certain level of triangulation (Yin, 1994). The data collection of a case study research design is extensive, drawing on multiple sources

1455
of information, including observation, interviews, questionnaire surveys, documentation, archival records, and physical artifact, etc.
The primary information used in this research is mainly conducted using secondary information5 In the primary part, we refer to the open instruction and specialty reports accompanied by the research reports of the Institute for Information Industry and other relevant authorities, the TRI (Topology research institute), MIC and IDC as well as other related websites such as electronics news, global electronics news, stocks and bonds business investigation reports, etc. The sources of these materials can be collected extensively at different times and in different places, which provides a proper disclosure of the incidents recorded and the history of relevant information used in this research. Furthermore, we also use various information analysis skills including charts for this research. Research Framework
According to the above literature review, the present study proposes a research framework, as shown in Figure 1, to guide our subsequent research.
FIG. 1: RESEARCH FRAMEWORK
Findings and Propositions
Based on our data, we have identified a list of key issues, as shown in Table 1 below. We analyze the case evidence with respect to each construct of the framework, and compare the case findings against previous theoretical arguments. The company that adopts an OEM strategy in its early stages must face conflicts with clients. Among these cases, BenQ, ASUS and HTC insist on own-brand building except Quanta. Furthermore, apart from BenQ, we also can see that ASUS and HTC’s later customer relationship is almost the same as the previous customer structure. The reason why we point this out is that these two companies make three choices to reduce the risks of conflicts as Propositions 4, 5 and 6 argue.
P2 P4, P5, P6
OEM decision
Manufacturing process competence
Customer structure
* Concentrated
* Disperse
Own-brand building
* Product lines
* Geographic markets
* Product life cycle
Change in customer relationship
P1 P3

1456
TABLE 1: COMPANY PROFILE Notebook Mobile phone
Quanta ASUS BenQ HTC
Year of Establishment
1988 1989 1984 1997
Main Product Notebook Motherboard
Notebook Mobile phone
PDA Intelligent mobile
phone Source of
competence Hardware company
Hardware company
Hardware company
Software company
Contract manufacturers
profile
Brand-Building Date
2000 1997 2001 2004
Clients’ main product
Notebook Motherboard
Notebook Mobile phone
PDA; Intelligent mobile phone
Customer structure Concentrated Disperse Concentrated Disperse
Customer structure before brand-
building
International brand name notebook
computer companies
Small & medium-sized
regional distributors
Motorola
Palm One, HP
Euro and USA telecom system
providers
Customer structure
Customer structure after brand-building
International brand name notebook
computer companies
Small & medium-sized
regional distributors
Sony, Apple
Nokia Euro and USA telecom system
providers
Evolution of strategy
OEM—OEM OBM—OBM OEM—OBM OEM—OBM
Product lines Existing New Existing New Geographic market
selection Overlap
with clients Separate
from clients Overlap
with clients Separate
from clients
OBM strategy
Product life cycle Maturity Growth Maturity Growth The Accelerated Force for Own-brand Building: Manufacturing Process Competence Hobday (1995) found that the mode of subcontracting and OEM was an important mechanism for contract manufacturers to gain superior technology or knowledge by cooperating with ascendant firms. Many studies also have found that knowledge and the learning of techniques can be achieved through alliances or cooperation among alliances (Hamel, 1991; Inkpen, 1996; Steensma, 1996).
As for the three companies examined in our case studies (Quanta, BenQ and HTC), each was transplanted much knowledge and techniques such as the management of manufacturing efficiency and product design and development from partners. Quanta, which is the main manufacturing partner of Dell, which made great efforts to bring Quanta up when the notebook industry was not growing yet and manufacturing techniques were not mature. Asus started from a core product of motherboard, it entered the notebook market with its own brand in 1997. Although it started quite late compared to other big companies, Asus has developed its notebook computers to be the main products with its strong and continued R&D capabilities renewing. BenQ was already Taiwan’s first company to develop the mobile phone. In 1996, the first type of GSM phone passed the FTA test because of its cooperation with Motorola, and was authorized to be an OEM partner in the same year. HTC cooperates with the world’s leading

1457
software company, Microsoft, and its competence building is different from other contract manufacturers of mobile phones in Taiwan. In 2000, when the Palm PDA was popular in the market, HTC retreated from the mainstream Palm-platform by choosing to cooperate with Microsoft. They consequently launched the PDA with the Pocket PC-platform of the Windows Mobile system and had a powerful capability among the PDA market.
Quanta launched its first own-brand computer “VALUE 2000” in 2000. BenQ launched its first own-brand mobile phone with a GSM system in 2001. HTC launched its first own-brand smart phone with the Microsoft Windows Mobile system in 2005. Based on these three companies, we found that all three notebook and mobile phone companies have tried to bring considerable benefit to the development of own-brand building with its manufacturing process competence being derived from learning with their clients. Therefore, the capability of manufacturing and design seem to provide the contract manufacturers with an opportunity to enhance their process knowledge by creating their own-design and own-brand products. Hence, we may state that the driving force behind manufacturing process competence for contract manufacturers’ brand building may be summed up in the following proposition:
Proposition 1:Other things being equal, the prior manufacturing process competence developed based on an OEM strategy will have a positive effect on future contract manufacturers’ own- brand building.
The Restrained Force for Own-brand Building: a Concentrated Customer Structure The competence of contract manufacturers is always developed and built based on their cooperation with their clients. Webster Jr and Keller (2004) also stated that industrial marketers derive a major portion of their total revenue and profit from a relatively small number of customers such as original equipment manufacturers. However, Bettis, Bradley and Hamel (1992) and Markides and Berg (1988) have also stated that the buyer may tend to be cautious in transferring design and development technology when they consider potential competition from outsourcing partners. That is to say, contract manufacturers will bear the risk of losing the source of competence and their learning objective if their clients are against own-brand building especially as their client are few. Thus, the more concentrated the customer structure, the greater the risk of losing the source of competence, which in turn reduces the willingness to engage in own-brand building.
Quanta received orders from Dell computer in 1993. The orders from Dell accounted for 35-40%, and Gateway, Apple and HP accounted for a further 40% of all orders in 2000. Furthermore, BenQ gained its initial international orders from Motorola in 1996 and became the main mobile phone manufacturer in Taiwan with Motorola’s consistent orders which accounted for 60-70% of BenQ’s output in 2003. As mentioned above, Quanta and BenQ’s customer structure in the market in which they build own-brand is concentrated according to a concentration ratio in which a CR4 of over 50% is generally considered to be a concentrated customer structure. In other words, Quanta and BenQ face the problem that they bear big risks of losing the source of competence and having orders cancelled if their few clients decide to end the cooperative relationship. Fortunately, Quanta gave up its own-brand due to its client’s resistance. Contrary to Quanta, BenQ maintain its OBM strategy even though it faces resistance from Motorola which has finally resulted in its orders being passed on to other contact manufacturers. From these two cases, we can see that a concentrated customer structure has a moderating force on own-brand building.
As for the other cases, namely, ASUS and HTC, the constitution of customer structure efforts has proved to be critical for own-building as well. However, the customer structures which are formed from their initial OEM decision are different from the previous two cases. In general, contract manufacturers can be classified into two types of brand building strategy through different types of evolution (Keller, 2003). When ASUS entered the notebook market, ASUS’s main tactic was to build its own brand and develop its own competence in order to try to aggressively obtain orders of OEM contracts. Because brand companies always choose to collaborate with the contract manufacturers without their own brand in order to avoid conflicts, ASUS’s initial clients were mainly small and medium-sized regional distributors or smaller brand companies. Thus, this kind of customer structure-based initial OBM strategy has made ASUS not only avoid conflicts with original customer structures in the motherboard market, but ASUS has also developed its OBM in the notebook market with few conflicts because of its decentralization and smaller clients in terms of customer structure.
Besides, HTC is mastering the key techniques of PDAs and Smart phones by cooperating with Microsoft. Its customer structure in relation to Smart phone manufacturing includes many hardware companies like HP and Palm One and other Euro-US telecom system providers. Therefore, although HTC’s and BenQ’s cases indicate that the

1458
competence building is enabling them to learn from international cooperation, the obstacle to the evolution of OBM business is very different. This kind of cooperative characteristic enables HTC to cooperate with many hardware companies but avoids the risk of losing future product or technology development due to the main source of competence being Microsoft which is not its competitor in the mobile phone market. We may summarize these findings as in the following proposition: Proposition 2: Other things being equal, the concentrated customer structure which is formed from the OEM strategy
of a firm’s early development will have moderating effect on the relationship between competence and own-brand building of contract manufacturers in the future.
The Relationship between Own-brand Building and Customer Relationships De Chernatony (1991) stated that the brand leader will adopt a plan of attack as he finds his market to have been eroded by some brand followers. This argument is in correspondence with the difficulty that contract manufacturers face when they build their own brands.
Quanta launched its brand ‘VALUE 2000’ notebook computer in 2000 but discontinued it mainly because of its notebook brand clients’ suspicions and objections. It is obvious that the own-brand strategy created conflicts in the strategy of previous OEM. Based on these considerations, Quanta’s policy is to still stick to its conventional manufacturing policy.
BenQ’s customer structure is always focused on a big company - Motorola. In 2004, the year-on-year increase in BenQ’s own-brand selling aroused Motorola’s suspicions and the withdrawal of up to 70% of the mobile phone orders. This cancellation of orders made BenQ face the risks associated with its OEM business operations and the costs of searching and building its own competence. Although BenQ fortunately transferred its customer structure to another big company – Nokia, Nokia’s consideration of its business relationship with BenQ relates to its manufacturing capability. Based on these two cases, our investigation shows that the own-brand building of contract manufacturers is more directly linked with the relationship with the customers. Hence, we may establish the following proposition: Proposition 3: Other things being equal, the strategy of own-brand building will induce a change in customer relationships. Competence Leveraging into Related Product Lines Mahoney and Pandian (1992) stated that a diversification strategy is the way that firms can adapt to the pursuit of growth. In general, applying existing competence to different end products is what we call a related diversification, which seems to be an easy and less risky way for firms to pursue growth. This is because launching new products through the utilization of existing competence will not only be seen as the management of strategically similar business by dominant logic (Prahalad and Bettis, 1986), but it will also preserve the value of current resources or competence by transferring that competence to other product lines that are less similar to the original product lines (Mahoney and Panadian, 1992; Bettis, 1981).).
We believe that contract manufacturers can move in at least two directions when developing own-brand products. The first type is to build their own-brand products based on previous and existing competence in the same product line as their original clients, such as Quanta and BenQ, which give rise to suspicion and objections from their clients. For example, BenQ’s own-brand phone is mainly based on the GSM system which shares the same technical features as its original client, Motorola.
The second type relates to leveraging current competence in regard to new product lines in related markets such as HTC that built its own-brand of smart phone rather than that for the original PDA market. In doing so, HTC can leverage its competence in relation to PDA techniques to the area of Smart phone development, while also minimizing the risk of brand clients recalling orders in the PDA market when HTC tries to have its own-brand in the Smart phone market. ASUS’s key competence leveraging was based on its main product, the motherboard (Prahalad and Hamel, 1990) that has a creditable brand impression, and it entered the notebook computer industry with its own-brand in 1997.
Therefore, we argue that contract manufacturers who diversify into different product lines by exploiting existing manufacturing process competence can not only avoid fairly high costs of creating new competence but also the conflicts with clients that have the same product lines. We therefore submit the following proposition:

1459
Proposition 4:Other things being equal, if the contract manufacturers can master the key competence and leverage in new related product lines, this will minimize the conflicts with their original clients when they build up their own-brand products. Cautious Geographic Target-market Selection The geographic market is one determining variable for market segments (Kotler, 1997). Geographic market selection in this paper refers to the choice of which contract manufacturers need to attempt to avoid conflicts with existing clients. BenQ is aiming at the markets of China and Europe. From its distribution, the European market has the most striking sales; in the Asian distribution, there is a significant growth in the China, Hong Kong and India areas. The system applied in both areas is the GSM system. BenQ’s success in these markets has had a huge impact on its GSM manufacturing client Motorola whose geographic target-markets are similar to those of BenQ.
Unlike BenQ’s case that targets global markets and gives rise to conflicts with its original clients, ASUS and HTC avoided the conflicts with their customers while determining the coverage of their geographic scope. ASUS’s own-brand business is based in the markets of Taiwan, China and the Asian Pacific zone. Similar to ASUS’s geographic target-market strategy, the main target market of HTC’s own-brand Dopod is distinguished from that of its clients. In the European market, it uses an OEM/ODM strategy for T-Mobile. While in Asia it launches its brand Dopod in Hong Kong, Indonesia, New Zealand, and Australia. We can infer from the above arguments that Taiwan manufacturers’ geographic target-market is likely to prevent them from direct competition with international giants, regardless of whether their market is related to the original geographic target-market or not. Therefore, the following research proposition is propositioned: Proposition 5: Other things being equal, if the contract manufacturers can avoid conflicts with their original clients
through cautious geographic target-market selection, this will minimize the conflicts with their original clients when they build up their own brands.
Product Life Cycle Effect The product life cycle suggests that the product in the market, both during and after the diffusion, will face the following different developing stages: (1) Introduction, (2) Growth, (3) Maturity, and (4) Decline. Among these stages, there are more different characteristics of customers, products, competition and manufacturing (Kotler, 1991). For contract manufacturers, the stage of growth is an opportunity to develop its own-brand, which lack product standards, manufacturing quantity and customer loyalty. The growth stage is the chance for contract manufacturers to form the consumer’s brand perception including the image that consumer’s form of the brand and their experience with the brand (Gelder, 2004).
In the notebook cases, according to information compiled by MIC in 2004, the global notebook product’s life cycle is about 3~4 years. Meanwhile, we can take 1997 to 2001 as a life cycle of the notebook. This is because the Y2K changing PC boom had disappeared and the global economy is depressed, which in turn causes the market to decline rapidly beginning with 2000. Accordingly, Quanta launched its own-brand in 2000; and ASUS entered the notebook computer industry with its own brand in 1997. This indicates that Quanta entered the notebook market during a period of decline contrary to ASUS.
In the mobile phone cases, it was only in 2002 that BenQ formally launched its own-brand mobile phone. According to an MIC report, the number of global mobile phone users has been growing more slowly since 2001 after high-speed growth of about 50% in 2000. The annual growth rate has fallen to less than 30%. Compared to the rapid growth of the past, the mobile phone has gradually moved into its mature period. This shows that BenQ launched its own-brand into the mobile phone market, when the market was entering its mature period. Compared to BenQ, HTC announced the introduction of its first own-brand “Dopod 565” into the Smart phone market in 2005. According to an IDC report, in 2007 it is estimated that sales will increase to more then sixty-two million sets from 9 million three hundred and thirty thousand sets in 2003. Based on that, it is evident that when HTC launched its own-brand, the market was going through a growing period. Thus, we may submit the following proposition: Proposition 6: Other things being equal, if the contract manufacturers can enter the market in its growing period, it will minimize the conflicts with its original clients when it builds up its own brand.

1460
Conclusion OEM businesses rely heavily on the operational excellence on management efficiency, cost reduction, and quick responses to demand fluctuation to maintain sufficient margins. However, in viewing the value chain for value creation, brand building provides contract manufacturers with another growth opportunity. This paper argues that the initial self-selection as original equipment manufacturer has given rise to a manufacturing process competence and concentrated customer structure. Although competence is the driver for contract manufacturers to build their own brand, it is easy for contract manufacturers who build a brand based on existing competence in existing product lines to have conflicts of interest with their clients. If contract manufacturers are determined to pursue own-brand products along the same product lines, the customer relationship seems to unavoidably change in the end. In short, the decision of the initial OEM strategy that forms a unique customer structure is the main factor that decides whether the firm can rapidly enlarge its scale. However, it turns out to be a big obstacle when the firm strives to build up its own brands. If not properly managed, starting to build an own brand could cause serious concerns from the major clients and lead to orders being cancelled, which can become an immediate threat for contract manufacturers. In order to avoid or minimize the conflicts of interest, we suggest that the selection of new product lines and new geographic target-markets at the growing stage of the product life cycle have moderating effects on the relationship between own-brand building and customer relationships.
Research Limitation The findings have two limitations. First, the objectives of this paper are limited to Taiwanese firms. However, the issues that are addressed here have significance to other East Asian countries, too. Second, due to primary information, this research is mainly conducted with secondary information, and the secondhand information could give rise to false results as a result of the incomplete collection of data and the reporters’ prejudices. For example, the news story may not have been specially written for a certain specific research project, and its suitability needs to be discussed by researchers. Therefore, we try to avoid this pitfall by cross checking the information and discover its advantages of stability, precision and wide scope coverage.
Managerial Implications
When faced with saturated growth and thin profits, contract manufacturers start to think of the possibility of developing their own brand. However, this strategic move seems tempting but raises concerns from existing clients owing to conflicts of interest. The goal of this study is to develop a perspective for understanding the antecedents of own-brand building and finding solutions to reducing conflicts with existing clients.
We provide two significant managerial implications. First, the above discussion clearly portrays a critical lesson observed from these cases that contract manufacturers can leverage their existing competence to related product lines and build their own-brand products by focusing on competence and embedding it in the new products. Second, in order to effectively build brands, contract manufacturers should have their own-brand products in dissimilar geographic markets to alleviate the conflicts of interest with original clients. They also engage in the branding at the growth stage of the product life cycle in order to avoid fierce competition in mature products with high standardization, saturated markets, and high barriers related to customer loyalty.

1461
References [1] Allen, B.T. (1969). Concentration and Economic Progress: Note. American Economic Review, 59, 600-604 [2] Amit, R. & Schoemaker, P. J. H. (1993). Strategic assets and organizational rent. Strategic Management
Journal, 14(1), 33-46. [3] Bettis, R. (1981). Performance Differences in Related and Unrelated Diversified Firms. Strategic
Management Journal, 2(4), 379-383. [4] Bettis, R. A., Bradley, S. P., & Hamel, G. (1992). Outsourcing and Industrial Decline. Academy of
Management Executive, 6(1), 7-22. [5] Burmann, C., & Zeplin, S. (2005). Building Brand Commitment: A Behavioral Approach to Internal Brand
Management. Journal of Brand Management, 12(4), 279 -300. [6] Chernatony, L. D. (2001). A Model for Strategically Building Brands. Journal of Brand Management,
9(1), 32-44. [7] De Chernatony, L. (1991). Formulation Brand Strategy. European Management Journal, 9(2), 194-200. [8] Doyle, P. (1990). Building Successful Brands: The Strategic Options. Journal of Consumer Marketing.
7(2), 5-20. [9] Dyer, W. G., & Wilkins, A. L. (1991). Better Stories, Not Better Constructs, to Generate Better Theory: A
Rejoinder to Eisenhardt. Academy of Management Review, 16 (3), 613-619. [10] Eisenhardt, K. M. (1989). Building Theories from Case Study Research. Academy of Management Review,
14(4), 532-550. [11] Gelder, S. V. (2004). Global Brand Strategy. Journal of Brand Management, 12 (1), 39-48. [12] Greiner, L. E. (1972). Evolution and Revolution as Organizations Grow. Harvard Business Review, 50. 37-
46. [13] Inkpen, A. C. (1996). Creating Knowledge through Collaboration. California Management Review, 39(1),
123-140. [14] Keller, K. L. & Lehmann, D. R. (2003). How Do Brands Create Value? Marketing Management, 12(3),
26-32. [15] Mahoney, J. T. & Pandian, J. R. (1992). The Resource-Based View within the Conversation of Strategic
Management. Strategic Management Journal, 13(5), 363-380. Please contact authors for the full list of references.
End Notes
1. OEM (original equipment manufacturing): Here, the manufacturer follows the buyers’ sample specifications and details of design to assemble all parts into a product and then conducts the transaction with the assigned shipping mode (Lee and Chen, 2000). 2. Contract manufacturer: In this paper, a contract manufacturer is defined as a manufacturer that has an OEM business. 3. Due to the notebook computer prices with a downward tendency, and the high-mobility characteristics, the need from its worldwide market has a stable going-up trend compared to desktop computers since year 2000 (MIC, 2004).Taiwan’s notebook computer productivity predictably reached up to 80% of the global market in 2005 (MIC, 2005). Taiwan’s notebook computers have been in the important position of global supply 4. In 2002, due to the ensuing capability development of Taiwan companies in mobile phone manufacturing and design, the number of phones reached up to twenty-eight million six hundred and twenty thousand sets accounting for 6.9% of global market share (MIC, 2004). 5. We also adopt personal interviews including one operations and one marketing managers in these contract manufacturers for purpose of identifying some information.

1462
Management of Service bundling through the Product/service Interface: Examples of Product and Package Solutions in Japan
Caroline Bramklev, [email protected]
Lund University, Sweden Patrik Ström, [email protected]
Göteborg University, Sweden
Abstract
In the globalized economy, companies compete on their value-added service offer. Quality and reliability of products are the prerequisites for business, but long-term relationships are built on complex product and service interaction. Japanese firms have a long tradition of outstanding manufacturing quality. However, the Japanese service industry is less developed in comparison with other OECD countries. Services have often been bundled together with products or internalized in manufacturing firms, and because of this not been visible. We argue that this service bundling can be highly valuable in certain industries where there is a need to increase the service content to compete. The paper uses the service-interaction between product and package to show the potential strengths of the Japanese firms in terms of increasing service value-added in the value-chain. It offers a theoretical contribution to the discussion on the service-economy and gives empirical examples from industry in Japan.
Introduction
The Japanese manufacturing industry is an example of an industry sector that early moved towards the globalization of firms by searching for new market opportunities and optimized resource utilization (Dunning, 2000; Alexander et al., 2002). Many of the world’s largest corporations are Japanese (Fortune, 2006). Apart from the well-known manufacturing firms within the automotive industry and electronics, the large Japanese trading companies (sogo shoshas) have been important actors within international business. Nevertheless, the internationalization seen in manufacturing has not been equally successful in the service sector (Ström, 2004, 2005). The domestic Japanese market has also seen a less developed service sector in comparison with other highly advanced OECD economies. One explanation behind this development is said to be the internalization of Japanese service functions. This means that the service function might be there, but it is not visible as independent firms or even separate departments. Even the sogo shoshas have a very mixed and diversified service supply. These structures have formed the innovation and development within the Japanese business environment. Important aspects for these multinational firms are to provide the intended product with sufficient properties of both tangible and intangible character, from the manufacturing of the product until it is ready for use. In addition, aspects of these multinational firm’s globally dispersed operations also have to be included during the development of the product to be. In order to achieve this and equally obtain competitive productivity in the global market place, the product lifecycle is important during the product development process.
Through the product life cycle perspective it is possible to handle global operations in e.g. production, simultaneous with diverse global customer preferences. Thus, the life cycle is a system for handling all aspects of importance for the intended product. In parallel with the globalization of industry and increasing complexity within supply-chains, the importance and potential of the packing industry has increased (Bramklev, 2007). This industry is also in a need for increasing the value-added of packaging in the product life-cycle. The tradition of service-bundling and internalization of service functions can be of value for the interaction of the Japanese manufacturing and packaging industries, through introducing service content in the value-chain. The fact that the Japanese service industry seems less developed in an international comparison and that service internalization characterizes the business environment make studies of the service and product interaction highly important. Packaging is in this case an excellent example of this service and product interaction. It can be part of the product, but it can also provide the product with additional service of great value for the users during the product life cycle. In contrast to pure service

1463
firms, the service internalization and bundling approach might be of great competitive value for the Japanese manufacturing firms, giving them a holistic perspective.
Aim and Objective
The paper uses the ongoing globalization of production of goods and services as a base for developing a conceptualization of the product/service offer. Customer demand and the complexity of the supply-chains have increased the need for service. We will use examples from the packaging industry in Japan, to visualize the possible value-gains that can be generated through a product/service perspective for both the packaging provider and the manufacturing firm. The conceptualization offered here is a first attempt to grasp the potential of service-bundling and internalization. For the development, competitiveness and internationalization of the service industry it has shown to be problematic. In the interface between the physical product and service, it might instead be an asset. Apart from building the conceptualization, the aim of this paper is also to develop and indicate future research agendas.
The rest of the paper is structured as follows. First, we will describe the method and analysis structure of the paper. Second, a discussion of the transforming service economy in East Asia is provided along with a presentation of the dual industrial structure in Japan. Third, we provide key-concepts and discussion and the interaction between the product and service interface. Following, we develop a conceptual model and provide four examples from the Japanese manufacturing industry. Finally, conclusions and suggestions for further research are presented.
A Note on Method
The paper uses a combination of primary and secondary sources. The primary data comprises of interviews made in Japan in March 2004. They include academics working within this field and representatives from the Japan Packaging Institute and Asian Productivity Organization. Additionally, an interview was made with representatives from one of the largest packaging companies in the world (non-Japanese) in Tokyo to get a deeper understanding of how they perceive the packaging industry and its interfaces with the manufacturing industry in comparison with their other markets. The interviews also included two manufacturing companies (non-Japanese) and two academic research institutes. They have helped to establish knowledge of the Japanese product and package market. The pilot study has acted as a frame of reference in building the conceptual model in this paper. It was not intended to be a deep empirical study on which strong conclusions could be drawn. In this paper the conceptual development is mainly based on a theoretical literature review. The paper uses prior literature from relevant disciplines to develop the conceptual framework. It includes academic publications, publications from international organizations, industry associations and company material. See Table 1 below for a view of the research approach in this paper.

1464
TABLE 1: REVIEW OF ANALYTICAL APPROACH Area Content covered Rationale
1. Literature review; classification and definitional issues
Approaches to definitions of service and product. Review of research on the Japanese and Asian service economy.
Conceptual framing of the business environment and service economy in Japan
2. Theoretical concerns Theoretical perspectives; international business, economic geography, management and product development.
Determine the range of theories that may be used to inform of how to develop a conceptualisation of the product and service interaction.
3. Model development Analytical dimensions that can add to the value creation of the service production within Japanese firms.
Discussing knowledge gaps that can help to develop the analytical tools for the Japanese product/service interaction. Introduce a conceptual model that can be tested further through deeper empirical studies.
4. Empirical examples – Pilot study
Asian Productivity Organization, Japan Packaging Institute, company and research institute visits. (3 companies and 2 research institutes)
Discuss factors of importance for the service dominated economy established through the literature and theoretical review. Get an understanding of the competitive situation of the packaging industry in Japan and relations to the manufacturing industry. Locate a number of potential directions for further research.
The East Asian Service Economy
International comparisons have revealed that the Japanese service sector lags behind many of the most industrialized OECD countries in contributions to GDP, employment share and trade and investment (Fukao & Ito, 2000; Ono, 2001). There might be several explanations behind these features, but a tightly regulated market, internalization of services within manufacturing, business organization, and the specific characteristics of the Japanese business environment are often referred to as the most important (Enderwick, 1990; Dicken et. al, 1997; Ono, 2001; Ström & Mattsson, 2005).
The Japanese economic development model shows a number of specific characteristics. One of the most debated factors is the government involvement in the economy through various forms of regulatory and support functions. The government has used an array of tools in the so-called developmental state. The most well-known measures have been the attempt by MITI to use preferential treatment for certain sectors in combination with regulation (Johnson, 1982, 1985; Okimoto, 1989). Supporting a number of potential industries for export promotion, regulation on foreign direct investment and the financial markets, and shielding domestic industries from competition are just a few examples of this government involvement. The Japanese business environment with large industrial groups, keiretsu, and rigid labour market worked in parallel with the regulatory environment in creating a rather unique model of rapid economic development.
A debate exists, however, on the real effects of these measures for the industry. Some parts of the economy certainly was helped by the government involvement, but there are also examples of companies going their own way or simply taking advantage of the existing favourable market conditions (Friedman, 1988). The high level of

1465
involvement did not always create the expected out come. The result has become a dual structure with competitive and uncompetitive firms. Today, the economy has changed and the government acknowledges the importance of foreign direct investment and the need to restructure the labour market. The life-time employment system of the high-growth era has now transformed and the labour market is now less rigid. Nevertheless, there are sectors that are in need of restructuring to compete on the international market. The service sector is one such example. The service industry has not received the same government attention as other manufacturing sectors in terms of industrial development assistance. Instead the sector has been kept shielded from international competition in the domestic market. This has created a weaker service sectors in general in Japan in comparison with other advanced economies (Ström, 2004, 2005). Apart from lower share of GDP and employment stemming from the service sector, Japanese services have a limited international success. In international trade Japan runs a large deficit in services trade. This shows a completely different picture of the Japanese economy than the usual in the case in manufacturing trade. The export ratio in services is also very low. This gives a clear indication of that the economy has primarily had a manufacturing focus. A further indication is that there has been a problem with productivity within the sector and that the Japanese companies in general have experienced low profitability (Wainai, 2001; Wölfl, 2003).
Japanese service firms found at foreign locations has primarily been following a Japanese client. The Japanese banks internationalized through the international success of manufacturing companies. The situation is similar within insurance, financial consulting and other professional business service firms. A common characteristic is that these firms had problems in expanding their client base outside their main traditional Japanese clients. The feared competition even from Japanese service firms that existed in the late 1980s proved to be much less than anticipated (Enderwick, 1990; Johansson, 1990). As the Japanese clients abroad were pressured by competition, in combination with the domestic problems in the Japanese economy, many of the service firms became forced to seek non-Japanese clients to keep their business running. This has been a very difficult task. Many Japanese service firms have chosen to withdraw from non profitable markets. Sectors such as, construction, insurance and retailing, have all seen this development (Ström, 2006). The local knowledge in combination with a long experience of the business environment helps to explain this situation. There might be several reasons behind the problems of internationalization among the Japanese firms. On the one hand, the lack of clear strategy and limited international brand recognition are important. On the other hand, services have traditionally been seen as something which should be free in Japan. There has not been the same tradition in charging for information or knowledge. Instead this should be included in a larger package, such as a product or a loan from a bank (Ström, 2004, 2005). This has created a business environment where services have been internationalized through an introvert approach, mainly using the already existing business relations to Japanese clients (Ström & Mattsson, 2005). In several manufacturing sectors, Japan has also seen increased competition from neighbouring countries. Korea has become a world leader in the automotive and electronics industry, just to mention a few. The Korean service sector, however, shows a number of similarities with the Japanese. Even though the economy has been growing rapidly over the last decades, the service sector has not developed at the same pace. Even compared to the Japanese situation the Korean service industry is lagging behind. One example is the fact that the contribution GDP by the Korean service sector was 57.2 percent in 2003 (OECD, 2005). In Japan, the contribution was 68.0 percent. Ten years before, this difference between the countries was about the same. The data shows that the Korean economy is still dependent on the international competitiveness of the manufacturing sector. Regarding the share of total employment of the service sector the difference between Japan and Korea is smaller. In 2004 67.1 percent of the Japanese labour force was found in services and 64.4 percent of the Korean (Ibid.). This is an indication of that the Korean economy is moving ahead to become a service and knowledge dominated economy, with a strong government push in this direction (Kim, 2003). The tendency to leave the manufacturing dominated economy exists in many of the East and Southeast Asian countries. Even countries like China have many areas with rapid growth, where the service industry is booming. The competition in East Asia has changed and moved into new industries apart from cars and electronics. It is now a question of which countries that can make the most out of the possibilities that new technology and the network economy can bring. With technical ability and strong innovation systems countries can leapfrog in economic development. ICT clusters in Korea and China stand strong in the new knowledge based economy (Masuyama & Vandenbink, 2003). The technological development and innovation strategies implemented by governments push competition in new sectors. Japan that for long led the way in the

1466
manufacturing industries in East Asia has seen competition rise. The market has been pushed by the technological development.
The Dual Industrial Structure of Japan After the bubble economy it became clear that the Japanese economy was characterized by a dual economic structure. On the one hand, the world had seen the rise of highly competitive international companies. Many of them, world leaders in their respective industry, with industrial tools such as lean production, just-in-time and Kanban. During the catch-up period after the war, the entire Japanese economy was directed towards increasing the industrial out-put and concentrating on the manufacturing industry. Through the involvement of the government in the economy and a corporate culture fostering competition on production effectiveness, it was possible to establish world renowned companies (Johnson, 1982). In parallel with these multinational companies, the small and medium sized firms have played an important role in the Japanese industrial development, and it is within these sectors that most of the labour force has been employed (Whitaker, 1997). These firms have supplied the industry with machinery and other forms of equipment. The Japanese corporate model and its industrial focus have been built around a number of specific characteristics where the end goal has been to beat competition on operational effectiveness. Table 2 below shows the main factors behind this production driven economy
TABLE 2: FACTORS INFLUENCING THE JAPANESE CORPORATE MODEL
Factors Characteristics High quality and low cost Superior quality at low price. Standardization, mass
production and eliminating unnecessary steps. Wide arrays of models and features A set of standard products with a wide range of
features and optional equipment. Lean production Total quality control, continuous improvement
(kaizen), Just-In-Time planning, design for manufacturability, close supplier relationships, flexible manufacturing, rapid cycle time.
Employees as assets
Create a strong sense of community and reciprocal loyalty.
Life-time employment Encouraged on-the-job training, generalist and multi-skilled and adaptable workers.
Leadership by consensus Consensus decision making (ringisho) for smooth implementation. Connected to the development of quality circles to enhance manufacturing efficiency.
Strong intercorporate networks Cross-share holdings within industrial groups (keiretsu). Often centred around a main group bank. Stable long-term ownership.
Long-term goals Market share instead of direct profit in order to sustain production at full capacity. Less pressure from the stock market.
Internal diversification into high-growth industries
Internal development in related industries.
Close government relationships
Government support for specific industries and preferential treatment.
Source: Porter et al., 2000. This corporate model has generated a structure where the manufacturing sector has been highly effective
and competitive on the world market and foreign firms have benchmarked against Japanese firms. This has also

1467
been facilitated through long-term business relations, product development and the keiretsu structure forming complex inter-company relationships (e.g. Gerlach, 1992; Nonaka & Takeuchi, 1995; Kensy, 2001).
On the other hand it was clear that, the Japanese economy had shielded many sectors from international competition through subsidies and regulation. Large parts of the service sector could be found here (Ono, 2001; Ström, 2005). In the period following the bubble economy, the first group of companies have successfully continued to compete on the global market. The most successful companies can almost all be found in the manufacturing sector. In a world where the largest share of the economy in the most advanced economies is dominated by services, Japan seems to have lost momentum in finding new prosperous sectors to develop. In fact the second largest economy in the world is lagging behind many of the most advanced OECD countries in terms of service sector share of the GDP and service sector share of total employment (OECD, 2005; Ström 2004). It gives and indication of that the Japanese economy has been far from as successful in the service industry as compared with the manufacturing sector. Even if the service sector is disaggregated into specific sub-sectors the pattern still exists. See Table 3.
TABLE 3: CONTRIBUTION TO TOTAL EMPLOYMENT BY HIGH INTERMEDIATE SERVICES, PERCENT
Country 1990 2000 2002
Canada 12.7 15.2 16.1
France 13.5 15.8 16.5
Germany 9.6 14.8 15.4
Italy 9.5 12.8 13.6
Japan 4.8 4.4 4.4
UK 15.5 19.0 19.3
US 14.2 16.8 16.7
Source: OECD in figures 2002 and 2004. The knowledge intensive professional business service industry, which has been a strong driving force
behind international success of many OECD economies, has had difficulties to successfully strengthen and move abroad from Japan (Ström & Mattsson, 2005). It is possible that internalization of services can be competitive in the interface of product and service, but that the industrial and corporate structure of Japan has not been able to generate a service sector that could be competitive and independent of the manufacturing oriented tradition. The notion of the increasing importance of services has also changed the way organizations such as the Asian Productivity Organization with 19 member countries, based in Tokyo, perceive their contribution to up-grading service productivity. Today they try to help member countries in Asia to develop knowledge of how to strengthen their service economies. From the analysis of Porter et al., (2000) there are no internationally successful Japanese services to be fund on the world market other than services that have been connected to manufactured products. One example is the Japanese computer game or consol industry, which was tightly connected to the development of the IC industry. There are similar potentials to be found in relation to the packaging industry in Japan.
Conceptual Development from Related Work
In this part of the paper we would like to explain and elaborate on the terminology for the product, service and the relation between the two. Some Notes on the Terminology of the Product A product may be a service or a physical object and, according to Roozenburg and Eekels (1995), is used as “an instrument in human action” to fulfil a set of values and needs of a person or an organisation. Kotler states that the product may be either tangible or intangible (also termed service) (Kotler & Armstrong, 1994). However, the focus in this report is on man-made physical products, also designated as artefacts.
According to Ulrich & Eppinger (2003), artefacts are “…products conceived, produced, transacted and used by people because of the properties and functions they may perform.” In other words, customer values and

1468
demands correspond to a number of functions that are realised as properties in the materialised product, see Figure 1 below (Roozenburg & Eekels, 1995). Common for these artefacts is that they can be classified by their product design through the combination of function structure, main working principle and the embodied design (Pahl & Beitz, 1996; Roozenburg & Eekels, 1995).
FIGURE 1: THE RELATION BETWEEN FORM, PROPERTIES, FUNCTION AND CUSTOMER DEMAND AND VALUES
ACCORDING TO ROOZENBURG & EEKELS (1995). The classification of a product through its function structure is a representation of the intended behaviour
of the product and its parts. In other words, customer demands are transformed into functions, which are abstract formulations of the task the product shall perform to fulfil customer demands. The set of functions a product shall fulfil may vary. To make a meaningful and compatible description of the product, functions are structured into a combination of sub-functions and overall function, thus the term function structure.(Pahl & Beitz, 1996; Roozenburg & Eekels, 1995)
A product may also be classified by its main working principle (Pahl & Beitz, 1996). For example, classifying a product as mechanical is simply based on the fact that its main working principle constitutes the technical realisation of physical (mechanical) effect(s), or that a majority of its subsystems in turn are based on mechanical working principles.
The embodied design is the final description of the product, usually as a drawing or physical prototype of the product. As such, embodied design devises and describes the geometry, materials and production techniques of the product.(Pahl & Beitz, 1996; Roozenburg & Eekels, 1995)
In an additional approach, provided by Kotler and Armstrong (1994) a product may be divided into product-classification schemes based on product characteristics and consumer preferences. Two common product classifications are consumer goods, which are products bought by final consumers for personal consumption, and industrial goods, which are products bought by individuals or organisations for further processing or use in conducting a business.(Kotler & Armstrong, 1994) Some Notes on the Terminology of Service Characteristics The problem of classification of service is a well-known phenomenon. In parallel with the increased service content attached to many products and the fact that traditional manufacturing firms elaborate on extending their product portfolio with service operations, the line between the product and the service becomes blur. The intangible value for the customers is then the service.
Broadly, the distinction between producer services and consumer services is used (e.g. Perry, 1990; Marshall & Wood, 1995; Dicken, 2007). However, to obtain analytical sharpness, sub-classifications are necessary in empirical research. One possibility is to use the classifications set-up by the OECD, WTO and Eurostat (see e.g. GATT, 1989; Dicken, 2007), but overlaps exist and they do not really make the problems of conceptualization much clearer. These classifications basically use an industry approach, but it is also possible to use an occupational approach established on measurements of what employees de facto are working with. Often the real problem is not to fit services within these classifications, but rather to be able to distinguish unclear distinctions in terms of sub-sectors. When combining the services with goods it becomes even more complex. Sometimes it is difficult to draw the line between the service and the product. “Every definition of ‘services’ is slippery” according to Bryson et al. (2004:7). According to the same authors, however, there is a broad consensus on the following parts of the service economy:
1. Finance, insurance, real estate,
Form Properties Function Demand Value
� Speed� Weight� Stability� Price
� Bicycling � Recreation� Physical
Practice� pleasure
� Health� Beauty

1469
2. Business services, 3. Transportation and communications, 4. Wholesale and retail, 5. Entertainment and hotels, 6. Government services on different levels 8. Non-profit agencies.
The Interface between Product and Service The term encapsulation has been introduced to conceptually handle the issue of the increasing interaction and complexity of product and service (Howells, 2000). It describes how services are wrapped around or are embedded in products and through which services can facilitate innovations in other sectors of the economy. Bryson et al, (2004:58) argue that this effect can influence the establishment of both new manufactured products and services. In practical terms it means that services not only are used to enhance products, but can also impact the development of additional services in the entire production system. These new forms of product and service interaction have generated a business structure where we find five types of companies, where more of the value-added activities are generated through service operations or at the product and service interaction. See table 4 below.
Because of the rapid transformation of the economy since the WWII, managing the service economy has become a vital measure for success. Today traditional manufacturing companies have large service divisions or large service content in their offer to the customers. It has become for difficult to only compete on quality, efficiency and price in the globalized economy. In order to build long-term relations with customers, the value added of the service content is growing. A larger service contribution in the total company value-added has also made company valuations more difficult.
TABLE 4: TRANSFORMATION OF THE GENERAL COMPANY STRUCTURE
Company structure Company characteristics
Manufacturing companies Not yet involved in service production
Manufacturing-service companies Companies that have begun to sell services linked to their physical products.
Service-manufacturing companies
Companies that are still producing products, but the balance of their activities is shifting towards services. Through the process of servicing, manufacturing companies can learn and develop new products or redesign existing products.
From manufacturing to service companies
Companies that used to produce goods, but are no longer engaged in these activities. The company starts to sell knowledge-products but rapidly realize that the sale of such products is more profitable than either manufacturing or selling goods.
Virtual production companies
These are firms that are no longer directly engaged in the physical production of goods. They have closed or sold their plants or may never have been involved in the production process. Products are designed and marketed, but the production process is undertaken by service-manufacturing companies.
Source: Elaborated from Bryson et al., (2004). Additionally, academics and practitioners came to understand that managing the service economy was
something different from the traditional way of managing business and manufacturing operations (Grönroos, 1994; Normann, 2000). It is argued that today’s service management is dependent upon an overall perspective including a

1470
holistic organizational approach with a clear market focus. Managing quality and a stable internal development has high priority. The fact that perceived service quality is increasingly important can be seen by the impact of quality measurement (Fornell et al., 1996; Majkgård & Sharma, 1998; Anderson & Fornell, 1999). The service economy gives priority to external efficiency and quality perception, instead of overemphasizing internal efficiency, economy of scale and cost focus (Grönroos, 1994). The service concept offered by Normann (2000) suggests that firms need a specific capacity to deliver services, close linkages and social relationships, transfer of complex know-how and management and organization as a cornerstone of the service offer. Furthermore, in business service internationalization, marketing the service on offer and at the same time managing the internationalization process, in an often turbulent environment built on close connections with the customers, can be a difficult task. Combining the right a service offer with a product can be difficult. If the technical development is not followed with stringent strategies on how to manage this new business offer, the result might be poor. Studies conducted by McKinsey show these problems. "Over the past few years, as sales growth for new products has slowed and product margins have fallen, services—typically with higher margins and returns on invested capital—have become an increasingly attractive way to provide a point of competitive differentiation. However, most companies have squandered this profit potential by using poorly designed and priced service plans" (Bundschuh & Dezvane 2003). According to the same authors, the issue of incorporating services in manufacturing and the ability to compete successfully is often a difficult task to handle. "No doubt, putting a price on services is more difficult than pricing products, because the benefits of services are less tangible and they often lack well-documented standard unit-production costs as a benchmark. Service costs can vary significantly by the configuration, accessibility, and age of equipment; usage patterns; operating conditions; region; and even individual technicians" (Bundschuh & Dezvane 2003).
In trying to reveal international success among service operations, attempts have been made at studying the internationalization of services by using an integrated approach consisting of management and international marketing. Lehtinen & Välikangas (1994) have established a framework where they discuss how firms can handle internationalization by dividing services into generic, specialized and customized. They argue that these different kinds of services need specific approaches when going global. The more tailored the service is, the more the internationalization process is dependent upon narrow segments, networks and local presence (Ibid.; Sharma, 1991; Løwendahl, 2000). They also argue that the more customized the service is, the more control that is needed in the internationalization process, ranging from simple license agreements to subsidiaries following customers abroad.
According to the Service Engineering Forum (2007), the combination of service and product can be distinguished into five areas: service science, service management, service marketing, service engineering and product-service system (see Figure 2.)

1471
FIGURE 2: THE RELATIONSHIP BETWEEN SERVICE AND PRODUCT
Source: http://www.service-eng.org/contents-e/about.html The perspective emphasised in this paper is the combination of a tangible product with a service, also
called a product-service system. This perspective is built on the common fact that all products, intangible or tangible, are “instruments” in human action and thereby goes through a number of processes from the origination to the disposal of the product or the product materials. In engineering and product development literature, especially for the description of industrially developed products, this product lifespan is referred to as the product life cycle or the technical product life cycle (see e.g. Olsson, 1976; Roozenburg & Eekels, 1995). According to Olsson (1976) the technical life cycle consists of the phases generation, manufacture, distribution, use and elimination. According to the product-service system approach, throughout the technical life cycle the tangible product is accompanied with service – the two are a combined solution, a Product-Service-Solution (PSS). Figure 3 below illustrates the product technical life cycle and the accompanied service throughout the cycle.

1472
Distribution P
roduction
Distribution P
roduction
FIGURE 3: THE PRODUCT LIFE CYCLE ACCORDING TO OLSSON (1995) AND THE ILLUSTRATION OF THE
PACKAGE COMPLEMENTING THE PRODUCT DURING ITS’ PRODUCT LIFE CYCLE The value-added in the product-service system is provided through the combination of service and object as
“instrument” in human action, and the creation of positive effect(s) in the interface between the object (in this paper the service, the product or the product-service system), the life-cycle system (any system within the product life cycle) and the actor (an individual(s)). Research dealing with the development of product service systems which is at the interface of the product and service, where a system combines a product as an artefact with a service that the product provides the user, is provided by e.g. Matzen & Andeasen (2006). It can also be focused at developing features for the product life cycle (e.g. Tomiyama, 2001). There are projects dealing more with the design dimension of the product and service interaction (e.g. Matzen et al., 2007). Here the authors make a distinction between what Figure 2, labels product-service system and product/service engineering. In this paper we concentrate on the interaction in product-service system, since its main aim according to (Matzen et al., 2007) is to bring in service operations in to the product development.
Research on product-service system builds upon Olesen (1992) where he uses a theory on dispositional effects, i.e. the effects derived from interfaces between artefacts (man made objects) and activities in the life cycle exist. Dispositions occur in inter-functional relationships, where one decision in one functional area affects different activities in other functional areas. Olesen (1992) claims, that disposition always exist when a decision is made. Looking at a product’s life cycle of different phases/systems, from development onwards, dispositional effects occur all along the cycle and should be taken into account, be controlled and exploited. They are measured “in terms of their effects on the universal virtues”, i.e. on cost, quality, flexibility, risk, speed, efficiency, environmental effects (Olesen et al, 1996). The effects could be measured during all phases of the life cycle, if sufficient knowledge about the parameters characterizing the system is available. In other words, all product-service system decisions and/or service decisions affect product life cycle activities and actors of the product life cycle. For example, as illustrated in Figure 4 below, the interface between the store (life-cycle system) selling a filled decorated package (the object) to a consumer (an actor) provides an identification effect. This dispositional effect is then measured against the goal, or universal virtues. By doing so one can illustrate what type of effects that dominate around product-service system in its life cycle and decide whether it is suitable to use such a solution for the product-to-be.

1473
FIGURE 4: EXAMPLE ILLUSTRATING THE GALLERY TECHNIQUE. The manifestation of the product-service-solution is different based on the level of detail one holds in
analysis. Starting for the product-service-solution on a product level in a company the product life cycle perspective provides valuable insight into the operational value-added aspects of the solution. The service offer is the intangible value that a firm can encapsulate into or around the product. This can be done at different stages of the product-life-cycle or through the entire lifespan of the product.
In networks of interrelated companies and industries the product-service-solution may be used different. Brusoni (2001) discusses three different types of networks (decoupled, tightly coupled, loosely coupled) based on the network reliance on technology, product and organisation co-ordination mechanisms. By this he refers to the capability to manage the body of knowledge consisting of relationships in a dense network of internal and external relationships. We suggest that depending on the type of network the product-service solution may be used to the advantage of that network. In addition, Danilovic & Winroth (2005) discusses a tentative framework to understand and analyze the prerequisites for inter-organizational integration in a network setting. The suggested framework introduces four dimensions: the surface of integration (what), the scope of integration (who), the time horizon of integration (when) and the intensity of integration (how). To manage a collaborative network Danilovic and Winroth (2005) means that structure (work breakdown, work packages, production system design), workflow (task definition, organizational routines) and people (psychological and social boundaries) should be analyzed. Under these circumstances the combination of service and product is most important for the benefit of the integration between organisations.
Kodama (2005) discusses integration aspect in Japanese firms, stating that strategic communities with internal and external actors increase rapid innovation in contradiction to full control of innovation systems through conventional hierarchical mechanisms and closed autonomous systems. We argue that these strategic communities provide the knowledge base upon which the best combination of service and product are built.

1474
A Multidimensional Framework for Product-Service Solutions: the Conceptual Model
The theoretical discussion above is of great value for understanding the relation between product and service. However, the overview together with interviews and discussions of our pilot study indicate that it is important to deepen the analysis. Therefore, we add an additional axis of analysis to handle the problems of layers in the product/service interface.
From a company perspective, different combinations of product-service-solutions must be placed in a product portfolio and constantly evaluated and updated. Comparing industries, the product-service-solution may also differ. The product service interaction discussed from various perspectives above also works on different levels in the business environment. Company structures, production networks, agglomeration advantages and other determinants of the economic geography of firms are important (e.g. Dicken, 2007). We argue that there is a need for an added analysis axis in addition to the ones presented in Figure 2. In Figure 5 below, we introduce an additional way of making an analysis of the product/service offer at different geographical and business levels. It is the strengths and company capabilities in relation to these levels that can decide whether an increased service encapsulation will be successful.
Analysis Design
Product
Service
Product level
Intra-firm level
Inter-firm level
Product-
Service
System
Product-
Service
System
Product-
Service
System
FIGURE 5: THE DIMENSIONS OF SERVICE PRODUCTION – ELABORATIONS ON THE RELATIONSHIP BETWEEN
SERVICE AND PRODUCT The first level is the product level that is found within the company. This level would be the initial phase
for planning to develop products that could later be fitted with or encapsulated with service functions. This level is often connected to a specific geographical market where these are demand or market potential for launching a new product with encapsulated service characteristics. It can be seen as the second stage of company transformation that was describes in table 4. The second level is more associated with the how this encapsulation can take place. Larger firms might bring in different parts of the company in making these decisions. It can include product development, marketing and finance just to mention a few. At this stage larger companies might also use their geographical scope or presence in order to test new product and service offers, but also to make use of different knowledge-pools for development. From the discussion above it is clear that this is a complicated process, but if it is conducted successfully, the result might be difficult for competitors to imitate. The third level is more related to external linkages within larger industrial groups, of which the Japanese keiretsu is one example. At this level it becomes

1475
important to develop linkages that can be used to either enhance the capabilities of the product or add intangible value through the product/service offer. Through the development of strong linkages that can help to enhance to service offer, firms can establish a strong market position. These linkages can then help to promote the product/service offer on the global market. Therefore these inter-firm relations often span over several geographical locations to make use of various capabilities and market channels.
The Japanese companies with a strong product or manufacturing focus might be well-positioned for taking advantage of these layers in combination with a long and successful internationalization. The service internalization or services bundling within these firms enhance their international competitiveness if they take advantage of the possibilities of encapsulation of services into the product. Capabilities in product development at the first level can then be complemented with global knowledge-pools at level two and finally they can make use of inter-firm networks of which they have long experience through the keiretsu structure. Kensy (2001) goes even as far as arguing that the keiretsu experience in Japan is equal to the new or postmodern economy, where networks within and between multinational firms are pivotal for building long-term competitiveness. For building sustained competitiveness, however, it is vital that the Japanese firms not only continues the product and service development, but in parallel build up skills that are necessary for marketing and value the intangible content. The Conceptual Model Implications – Examples of Package-Service Solutions In this part of the paper we will show and discuss a number of examples in relation to our suggested conceptual model. See Figure 5. These examples are taken from Japan Packaging Institute (JPI), Packing Award 2002 and 2006. The Japan Packaging Contest is held every year under the sponsorship of the Japan JPI with the aim of promoting development and spread of high-quality packages and packaging techniques over Japan. It is evaluated based on five major features shown below:
(1) GP Mark for Superior Package (2) All Good Packages to be exhibited (3) Excellent Examples of Appropriate Package (4) From Design to Logistics (5) Entry for Asia star and World star Contents For further information see JPI homepage; www.jpi.or.jp Apart from the fact that Japanese firms seem to have a product life cycle perspective, and larger share of
internalized service content in production and distribution, there has always been a pressure in the Japanese domestic market to consider the package both for production (e.g. Spencer, 2001) and market purposes (Fields, et al., 2000; Terhune & Kahn, 2003). This has led to a world leading position of Japanese packaging design and development (Parsons et al., 1985; Nagelberg, 1993). Working together, these aspects can create a suitable environment for establishing competitiveness for Japanese firms. In other words, the limited success in 'pure' services can be enhanced through the effective incorporation of services and product existing in parallel to fulfil customer demands over the product life cycle. A Japanese semiconductor firm and its packaging company jointly developed products and cross-licensed assembly and packaging patents to enhance the productivity of the both firms (Spencer, 2001). This means that both companies obtain important intangible service content well connected to their respective product development and production process. Additionally the product development process has become an important tool of incorporating production characteristics and customer preferences.
For the discussion we have chosen four examples: Japan Star 2002 and 2006; Japan Good Packaging 2002 and 2006. The Japan Star examples are an environmentally friendly packaging for PC set produced by Sony Corp and Chuoh Pack Industry Co. (2002) and a fold-up package for LCD-TV "AQUOS" produced by Sharp CORP. and OJI CHIYODA CONTAINER CO. (2006) – See Figure 6 below.

1476
FIGURE 6: JAPAN STAR PACKAGING AWARD: (RIGHT) ENVIRONMENTALLY FRIENDLY PACKAGING FOR PC SET, SONY CORP AND CHUOH PACK INDUSTRY CO. (2002); AND (LEFT) FOLD-UP PACKAGE FOR LCD-TV
"AQUOS", SHARP CORP. AND OJI CHIYODA CONTAINER CO. (2006) On the product level for our conceptual model these package examples represent solutions to problems that
the respective firms have experienced in their offer to customers throughout the product life cycle. Through the product invention at Sony, it became possible to pack both monitor and computer into the same package, which additionally increased the number of parts that could be fitted into the box. The new package greatly increased the efficiency in the distribution process. At the same time it enabled the company to make use of more environmentally friendly materials. For both distributors and end-users it is also much easier to only handle one box instead of two as before. It is an example of how a firm acknowledges a problem or unseen opportunity and seeks to capitalize on it. The 2006 LCD-TV example also show how the combination of the package and the manufactured good can help to enhance the intangible value through the product life cycle. After the purchase of the LCD-TV, the package can be cut into two pieces and folded without using a cutter. This volume reduction facilitates the recycling process. The package helps to reduce risk of injuring individuals handling the package. However, in order to perceive the possibilities the analysis must begin at the product level. If this analysis is not correctly conducted the entire system could fail in later stages. These two examples show the increased complexity of product and service interaction, and also suggest that it is sometimes difficult to make a clear distinction of where the intangible value begins.
The next two examples are for good packaging award. They consist of a corrugated fibreboard box for scooter produced by Yamaha Motor Co. and Yamaha-Motor Taiwan Co (2002). and a packaging solution for YAMAHA Outboard Motor 9.9-15PS produced by YAMAHA MARINE CO., YAMAHA KUMAMOTO Product CO., Sasten Co. and Rengo CO. (2006).

1477
FIGURE 7: JAPAN GOOD PACKAGING AWARD: (RIGHT) CORRUGATED FIBREBOARD BOX FOR SCOOTER AT YAMAHA MOTOR CO. AND YAMAHA-MOTOR TAIWAN CO (2002).; AND (LEFT) PACKAGING SOLUTION FOR
YAMAHA OUTBOARD MOTOR 9.9-15PS AT YAMAHA MARINE CO., YAMAHA KUMAMOTO PRODUCT CO., SASTEN CO. AND RENGO CO. (2006)
These two examples for good packaging are similar to the ones discussed above, since the product level
drives the development of the sought intangible value. See Figure 7. In the case of the scooter the package largely reduced the material cost for transportation and at the same time simplified the packaging of the product. The package additionally reduced the working cost and highly enhanced space utilization. The outboard engine is difficult to package due to its weight balance. The engine is also sensitive to oil leakage if transported in the wrong way. Total cost reduction, quality improvement and eco-friendliness were realized through material reduction, simplified disposal and abolition of steel.
For the discussion of these examples on an intra-firm level one can imagine that each company has a portfolio of different product-service solutions for which the service content is similar or different. Additionally, each product-service solution has similar or different designs providing the same service content. On this level the company can make use of its various knowledge pools, i.e. working with different departments such as finance, logistics, and marketing in order to establish the potential economic outcome of the project at an early stage. It is likely that larger companies like the ones in the examples are better positioned to leverage their knowledge. It can facilitate intra-firm learning capabilities, which have been one of the key-characteristics in the Japanese company structure and product development through a quality and efficiency focus based on physical products. Companies that have presence at several geographical markets can also use them for testing purposes, for later global usage and make use of economies of scope and scale in parallel. This could mean that the firm introduces a standard for all package designs, so that same service content e.g. storage utilization, handling utility, will be provided world-wide.
For the discussion of these examples on an inter-firm level it is notable that different firms probably have similar, but especially interesting, different experiences on how to combine product-service solutions. Even on a higher level, one could imagine that different industries solve their value-added to customers in different ways, due to life cycle infrastructure, available technology and customer segments. In such a setting, one could probably find interesting benchmark alternatives between industries and companies for their value-added experiences. This means that external linkages are important for both spreading new product and service solutions to other firms, but also be able to absorb best-practice in the market place. Companies as Sony, Sharp and Yamaha Motor, that have multiple geographical locations can probably make the best use of analysing and compare market differences. The tradition of long-term business relationships that have been part of the Japanese business environment could be of value with interaction on the inter-firm level. Even if cross-shareholdings have been reduced in the keiretsu system, the mutual trust that exists can facilitate knowledge interaction through network linkages. Companies with a trusty relationship can assist each other in developing a product and service solution based on experiences in the market place.

1478
Conclusion We are convinced that our conceptual model is a valuable tool for the description and management of the product service solution. This is also indicated through the examples provided in this paper as they visualize the possible value-gains that can be generated through a product/service perspective for both the packaging provider and the manufacturing firm. Earlier research has shown that Japanese service firms have not been particularly competitive on the global market. However, this paper indicates that service internalization and service bundling is used within Japanese companies for a combined product and service offer to establish competitiveness. For the sustained competitiveness of the Japanese companies it will be of great importance to be able to value and price their created intangible value for customers. This is something that has hindered the Japanese service industry. Additionally, for the future, the management of the portfolio of product/service solutions is of great importance.
It should be noted that for the examples in this paper, most of the service content can be found in relation to storage, handling and transport of packaged products. This is due to the purpose of the package and especially for those packages we have present here. Other examples would provide service content beyond logistics. The conceptual model presented needs to be further tested in the Japanese business environment, primarily through either a survey or by in-depth case studies. Another interesting aspect for further research would be to make comparative studies of Japanese and non-Japanese companies in the global market.
References
Contact author for the full list of references

1479
The Interface between Market Orientation and Quality Design on New Product Development Performance: Empirical Evidence from a Developing Country
Sany Sanuri Mohd Mokhtar, [email protected]
Rushami Zien Yusoff, [email protected] University Utara Malaysia, Malaysia
Abstract Integration between departments especially marketing and operation departments in an organization is essential in the new product development to ensure customer satisfaction. Both market orientation and quality design concepts associated with these departments has been regarded as a source of competitive advantage. However, despite their importance many organizations have not fully adopted to become a market driven and quality oriented organization. This paper reviews the theoretical contribution of these two concepts and how integrating both of them can lead to better organizational performance. This paper also investigates the role of quality design in moderating the effect of the relationship between market orientation and new product development performance. The data were collected in diverse manufacturing organizations in Malaysia with a sample of 158 organizations. The results showed that quality design moderate the relationship between market focus-new product performance and market planning-new product performance. Introduction The increase in competitive pressure and the need to respond efficiently to customer needs has led the organizations to seek for high organizational performance. Organizations are searching for tools that can help them survive in the face of intense competition. As customer needs and customer satisfaction have become the central aspect of business operation, the management of the organization in the industry needs to continuously redefine and re-establish the factors that will allow them to maintain their competitive edge and survival. Recent years of globalization process have witnessed a renewed importance on delivering superior quality products that meet customer needs. This is especially in the case of Malaysian business industries. As the impact of globalization, World Trade Organization and free trade agreements led to the opening up of the local market, Malaysian organizations need to adapt to the changes that takes place in the market. Tan Sri Azman Hashim, the Malaysian Industry Excellence Award council chairman identified that the key to succeed in the marketplace is innovation, branding and marketing as the marketplace is international and organizations need to compete with the best in the world (Chong, 2007).
As organizations continued to create new product innovation in tapping the opportunity in the marketplace and ensuring their survival, many of the innovation failed to perform to the expectation of the market. There have been many cases where new products was delivered to the market but failed in the marketplace due to wrong judgment in identifying the market needs. These cases highlight the importance of integration between departments in the organization especially marketing departments and operations to ensure customer satisfaction are met. Two important concept of management can be applied to the business setting to improve the integration between departments and ultimately led to higher organizational performance. The concepts are market orientation and quality design. Theoretical Framework and Hypothesis Market Orientation Market orientation has been defined as the ‘organization wide generation of market intelligence pertaining to current and future customer needs, dissemination of the intelligence across departments, and organization wide responsiveness to it’ (Kohli & Jaworski, 1990). Three main activities underlying this definition are generation of

1480
market intelligence, dissemination of intelligence, and responsiveness to market intelligence. These activities represent customer orientation and coordination elements of the marketing concept. As specified by Kohli & Jaworski (1990), ‘the meaning of the market orientation construct that surfaced in the field is essentially a more precise and operational view of the first two pillars of the marketing concept – customer focus and coordination’. According to them intelligence generation should not be seen as a narrow concept, whereby an organization obtains the information on customer needs. However, the generation of intelligence should include obtaining information from other exogenous factors outside the organization system such as government regulation, technology, competitors and environmental forces. In other words, the focus of obtaining information is the market that involves end users, distributors and other external forces that affect customer needs and preferences. In addition the information obtained is not limited to the current needs but also future needs of the customer since it is important for an organization to develop a new product offering.
The second elements of market orientation, described by Kohli and Jaworski (1990), are intelligence dissemination or specifically, distributing and sharing the information obtain throughout the organization. Kohli and Jaworski (1990) suggest that dissemination of the information needs to be carried out effectively so that it will result in collaborative actions among all the departments. Besides formal distribution of information, informal discussions and horizontal communication among employees are other means of disseminating the market information (Kohli and Jaworski, 1990).
Responsiveness is the third element of market orientation, which is basically responding to market needs (Kohli and Jaworski, 1990). As a result of generating the information and disseminating the information throughout the organization, action needs to be taken by the organization to respond to the market information. All departments not only marketing, need to take action in the form of selecting target markets, designing, offering, producing, promoting and distributing products/services that meet current and potential needs (Kohli and Jaworski, 1990). The element of responsiveness is further defined to comprise of two set of activities– response design and response implementation, which means using market intelligence to develop and executing the plans (Jaworski and Kohli, 1993).
Alternatively, market orientation has been viewed as an organizational culture that force a business to achieve sustainable competitive advantage by creating superior value for customers (Narver & Slater, 1990). Thus, market orientation has been defined by them ‘as the organization culture that most effectively and efficiently creates the necessary behaviors for the creation of superior value for buyers and, thus, continuous superior performance for the business’(Narver & Slater, 1990). Three behavioral components: customer orientation, competitor orientation and interfunctional coordination represent the operationalisation of marketing concept as they involves with activities in the organization to create superior value for the customer.
Market orientation has been linked to organizational performance since it provides firms with sustainable competitive advantage (Narver & Slater, 1990) and capabilities (Day, 1994) that set the organization ahead from competitors. Sustainable competitive advantage can be attained by creating the necessary behaviors to deliver superior value to customers (Narver & Slater, 1990). On the other hand, capabilities can be attained through acquiring the necessary skills, which ensure coordination of functional activities that direct the organization to anticipate and respond to changing market requirements to achieve superior performance (Day, 1994). Thus, a market oriented organization performs better in the market since the activities involved are directed towards identifying and responding to customer needs and satisfying customers (Jaworski & Kohli, 1993). Further argument also noted that market oriented organizations culture is a strong source of competitive advantage (Pelham & Wilson 1996; Pelham 2000).
Previous studies (Jaworski & Kohli, 1993; Narver & Slater, 1990; Pelham, 1997; Pelham & Wilson, 1996; Pitt, Caruana, & Berthon, 1996; Pulendran, Speed, & Widing II, 2000; Ruekert, 1992) have found a positive association between market orientation and performance. However, there are few cases that have found no linked or weak association on these relationships. For examples, Greenly (1995) identified that market orientation was not significantly related to performance. Quality Design According to Burrill & Ledolter (1999), quality design is ‘the process of converting customer requirements into a product concept and capturing the concept in a set of product requirements that are complete, clear, and consistent’.

1481
Quality design is regarded as one of the critical factors for successful quality management implementation (Saraph, Benson, & Schroeder, 1989). It is argued that quality design is important as it can have an impact on quality performance in terms of the delivery of product reliability, product features and serviceability (Flynn, Schroeder, & Sakakibara, 1995). The reliability of product refers to the rate of product failures in the market. On the other hand, product features refers to the ability of the organization to provide product that meet customer needs; while, serviceability refers to the ease of customer handling or use of the product. Their study found out that product design process has a positive impact on the perceived quality market outcomes.
Thus, based on the argument of previous studies, it is important for organization to design product or services that meet customer requirements. It was noted that many of the product failures in the market is due to the inability of the manufacturer or the operations functions to implement activities such as product design according to customer requirements (Juran & Gryna, 1993). Hence, it is important for the organization to integrate with marketing as they can provide customer input into the design process of the product. It is argued that the whole organization needs to agree and work on achieving the customer requirement. As specified by Oakland & Sohal (1996), ‘customer satisfaction must be designed into the whole system’.
One of the specific techniques or tools known as quality function deployment (QFD) is able to facilitate cross functional coordination between marketing and operation functions. QFD is a ‘technique consisting of a series of interlocking matrixes that translates customer needs into product and process characteristics’ (Juran & Gryna, 1993). Alternatively, QFD is also known as ‘a customer-driven planning process to guide the design, manufacturing, and marketing of goods’ (Evans & Lindsay, 2002). The objective of QFD is to ensure that all the customer requirements are translated into the design of product and process so that the final product produce is according to customer needs.
1. The Relationship between Market Orientation and Quality Design on New Product Performance As mentioned earlier, quality design is an important element for organization performance. Many of the product failures in the market are due to the inability of the manufacturer or the operations’ functions to implement activities known as product development, research & development, engineering, or product design according to customer requirements (Juran & Gryna, 1993). However, the introduction of specific techniques or tools called quality function deployment (QFD) is able to facilitate cross functional coordination between marketing and operation functions. QFD is a ‘technique consisting of a series of interlocking matrixes that translates customer needs into product and process characteristics’ (Juran & Gryna, 1993). Alternatively, QFD is also known as ‘a customer-driven planning process to guide the design, manufacturing, and marketing of goods’ (Evans & Lindsay, 2002). The objective of QFD is to ensure that all the customer requirements are translated into the design of product and process so that the final product produced is according to customer needs. It is also argued that QFD is able to operationalise the marketing concept by providing a means of identifying what is needed by customer and how these needs can be met in the development of the product (O'neal & Lafief, 1992).
This quality tool is useful for marketing as it focus on processing the information from the customer. This information can then, be translated into the design of product in the operations functions. Marketing needs the tool from quality as marketing has been criticized as not having the appropriate tools to achieve organization success (O'neal & Lafief, 1992). As specified by O'neal & Lafief (1992), QFD provides ‘a comprehensive, customer-focused methodology to establish customer needs, specify the means by which these needs may be satisfied, and facilitate the use of appropriate quality technologies in the transformation and delivery processes’. Furthermore, quality has the specific characteristics of organization-wide commitment to deliver products according to customer needs.
The integration of quality design with market orientation is also in line with the system theory, which emphasis on ‘….adaptation and assessments of environmental trends and events’ and ‘…organization is a unit in interaction with its environment’ (Spencer, 1994). In other words, TQM through quality design, plays a role in identifying customer needs and views customers and suppliers as part of the organization processes that interact with the environment (Spencer, 1994). Figure 1 illustrates the relationship between market orientation and new product development performance being moderated by quality design.

1482
Source: Developed for this research
FIGURE 1: CONCEPTUAL MODEL OF THE RELATIONSHIP BETWEEN MARKET ORIENTATION AND NEW PRODUCT PERFORMANCE BEING MODERATED BY QUALITY DESIGN
Thus, quality design with market orientation together, will provide a synergistic effect at a higher
organization performance. However, despite the importance of this relationship, there is limited evidence of study that investigate these variables specifically. Therefore, this study proposes that: H1: Quality design moderate the relationship between market orientation dimensions and new product development performance Methods The study used the whole organization or strategic business unit of an organization as the unit of analysis. The population of this study comprises the manufacturing industry in Malaysia. The sampling frame for the study includes the entire organizations listed by Federation of Malaysian Manufacturers (FMM) directory in 2005. There are about two thousand manufacturing and industrial services organizations registered with FMM body. Given the amount of this population size, the sample size that is taken into consideration in this study is about three hundred and twenty two to warrant a good decision model (Krejcie & Morgan, 1970). A key informant technique was employed in this study. The individual selected to answer the questionnaire in this study are assumed to have specific knowledge in both market orientation and quality orientation practices in the organization. Therefore, for this study it was assumed that quality managers or marketing managers or chief executive officer (CEO)/managing director has the specific knowledge of marketing and quality practices in their respective organization. The survey method strategy was employed to collect the data with regard to market orientation and quality orientation practices and managers’ perception of the organizations’ performance. The method of data collection for this study was carried out using mail questionnaire survey approach. Simple random sampling was employed in the study so that it guarantees equal and independent representation of data is chosen. Measures The whole market orientation practices were measured by twenty-six items instrument adapted from past studies measures of Gray et al.(1998), Kohli & Jaworski (1993) and Narver & Slater (1990). Factor analysis was carried out on these items. Five factors or dimensions with twenty-items emerged after the analysis. These dimensions were renamed as: (1) market action; (2) market planning; (3) market focus; (4) market feedback; & (5) market coordination.
Quality design is represented by one dimension of quality design itself. Quality design measures the degree of the product design process that focuses on integrating with customer requirements. The extent of quality design practices in the organization was measured by a nine-item instrument adapted from past studies measurement (Ahire, Golhar, & Waller, 1996; Badri, Davis, & Davis, 1995; Flynn, Schroeder, & Sakakibara, 1994; Saraph et al., 1989).
Market Orientation
New Product Performance
Quality Design

1483
The dependent variable, new product performance was measured with four items adapted from past studies
measurement (Kaplan & Norton, 1992, 1993, 1996a, 1996b; Sim & Koh, 2001; Yeniyurt, 2003). All the three variables required the respondents to answer the question on a six-item scale.
In this study, Cronbach’s coefficient alpha test is carried out to measure the internal consistency reliability. It is specified that an instrument, which scores around 0.60 is considered to have an average reliability standard; while a score of 0.70 and above indicates that the instrument possesses high reliability standard (Hair, Anderson, Tatham, & Black, 1998; Nunally, 1967; Sekaran, 2003). Table 1 below reports a summary of the reliability analysis results for the main variables.
TABLE 1: RELIABILITY ANALYSIS OF THE MEASUREMENT
Construct Cronbach Alpha Coefficient Market Focus 0.88 Market Action 0.85 Market Planning 0.75 Market Coordination 0.75 Market Feedback 0.73 Quality Design 0.93 New Product Performance 0.80 The result of the reliability test for all the dimensions shows that the Cronbach alpha coefficients were above 0.7; hence, indicates that the measures met the high reliability standard.
Hierarchical regression analysis was carried out in the study to test the interaction effect of the moderator
variables in the relationship between independent and dependent variables. Hierarchical regression or moderator regression analysis has been cited as the appropriate technique in identifying moderator variables (Anderson, 1986; Baron & Kenny, 1986; Frazier, Barron, & Tix, 2004) Results Based on a 500 questionnaires sent out to selected participants, a total of 158 useable questionnaires were collected representing a response rate of 31.8 per cent of the total questionnaires distributed and 49.4 per cent of the sample size required. This overall response rate is considered quite high given the approach of data collection (mail survey) and the respondents are key personnel holding an important position in the organizations. Table 2 and 3 provides summary of the personal and organizational background of the respondents.

1484
TABLE 2: BACKGROUND OF THE RESPONDENTS Variable Frequency
(n= 158) Percent
(Total= 100%) Gender 1. Male 2. Female
123 35
77.8 22.2
Age Group 1. ≤ 30 2. 31-35 3. 36-40 4. 41-45 5. 46-50 6. ≥ 50
16 26 52 29 19 16
10.1 16.5 32.9 18.4 12.0 10.1
Years of Service in Current Position 1. 1-5 years 2. 6- 10 years 3. 11-15 years 4. 16-20 years 5. 21 and above
54 49 35 12 8
34.2 31.0 22.2 7.6 5.1
Position hold in the organization 1. Director/MD/CEO/GM 2. Senior Manager 3. Manager 4. Senior Executive
24 14 94 26
15.2 8.9 59.5 16.5
TABLE 3: BACKGROUND OF THE ORGANISATION
Number of Employees 1. 51-150 2. 151-250 3. 251-500 4. 501 and above
47 34 33 44
29.7 21.5 20.9 27.8
Annual Sales Turnover (RM) 1. < 10 million 2. 10 million -< 25 million 3. 25 million – 50 million 4. More than 50 million
14 38 33 73
8.9 24.1 20.9 46.2
Types of Ownership 1. Fully local 2. Majority local 3. Majority foreign 4. Fully foreign
74 29 17 38
46.8 18.4 10.8 24.1

1485
Table 4 reports the results of the means and standard deviations of the variables in the study.
TABLE 4: MEAN AND STANDARD DEVIATION OF THE VARIABLES
Variables Mean Std. Deviation Market Focus 5.19 .68 Market Action 4.24 .98 Market Planning 4.44 .91 Market Coordination 4.56 1.04 Market Feedback 4.63 1.17 Quality Design 4.68 .93 New Product Performance 3.83 .80
The mean score market orientation dimensions ranges from 5.19 to 4.24. The highest mean score was
market focus (mean = 5.19) followed by market feedback (mean = 4.63). Quality design shows a mean score of 4.68. The scores of market orientation dimensions and quality design is not a very high score but reasonable indicating that the organizations seem to engage in market orientation and quality design activity. In terms of dependent variables, the organizations displayed an average new product performance (mean = 3.83). Table 5 displays the results of the main hierarchical regression analyses.
TABLE 5: THE MODERATING EFFECT OF QUALITY DESIGN ON THE RELATIONSHIP BETWEEN MARKET ORIENTATION AND NEW PRODUCT PERFORMANCE
Step 1 Step 2 Step 3 Variables Standardized Beta
Market Focus (MF) Market Action (MA) Market Planning (MP) Market Coordination (MC) Market Feedback (MFB)
.164*
.075
.209**
.174**
.032
.106
.047
.159
.148*
.024
.159
.053
.164*
.171*
.065 Quality Design (QD) .171 .088 MF x QD MA x QD MP x QD MC x QD MFB x QD
.164* .042 -.189* .127 -.095
R² R² change F change Sig. F change
.238
.238 9.357 .000
.251
.014 2.718 .101
.292
.041 1.657 .149
***: significant at 0.01 **: significant at 0.05 * significant at 0.1
As shown in the above table, the F change from step 1 to 2 and from step 2 to 3 was not significant. Nevertheless, upon inspection of the beta coefficient for interaction terms, there was a significant interaction between market focus and quality design and between market planning and quality design at 10% significant level. This suggests that quality design moderates the relationship between market focus and new product performance and between market planning and new product performance.

1486
In order to examine the precise nature of the interaction effect, Figure 2 and 3 displays the impact of quality design on the relationship between market focus and new product performance and market planning and new product performance respectively.
HighModerateLow
Market Focus
4.40
4.20
4.00
3.80
3.60
Mean
New
Prod
uct P
erform
.
High
LowQuality Design
FIGURE 2: THE IMPACT OF QUALITY DESIGN ON THE RELATIONSHIP BETWEEN MARKET FOCUS AND NEW
PRODUCT PERFORMANCE
It is apparent from the above graph, when the level of market focus is low to moderate; the differential impact for both organizations that focus on low and high quality design does not have a considerable impact on new product performance. However, when the level of market focus is moderate to high, there is a large impact on the level of new product performance for both organizations that emphasize on less and greater quality design. The highest new product performance is attained by those organizations that put priority on quality design and adopt highest level of market focus.

1487
HighModerateLow
Market Planning
4.20
4.00
3.80
3.60
3.40
Mean
New
Prod
uct P
erform
.
High
LowQuality Design
FIGURE 3: THE IMPACT OF QUALITY DESIGN ON THE RELATIONSHIP BETWEEN MARKET PLANNING AND
NEW PRODUCT PERFORMANCE
Figure 3 reveals contrasting relationship between the effect of low and high quality design. When the level of market planning is low to moderate, organizations that focus on less quality design shows a positive relationship with new product performance compared to those with greater quality design. On the other hand, when the level of market planning is moderate to high, the impact of high quality design leads to greater new product performance. The maximum new product performance is achieved when organizations adopts high level of market planning with high level of quality design. Discussion and Conclusion The present study attempted to investigate the interaction effect of quality design in the relationship between market orientation and new product performance. The study was carried out in the Malaysian manufacturing organizations. It has been suggested that market orientation and quality design activities in the manufacturing organizations are crucial to the organizational performance. The results partially support the proposed hypothesis. Market focus and market planning have been found statistically significant interacting with quality design, hence suggesting that quality design moderate the relationship between market orientation and new product performance. The result of the study suggests that highest new product performance is attained by those organizations that put priority on quality design and adopt highest level of market focus and market planning.
It has been reported in the literature that many of the product failures in the market are due to the inability of the manufacturer or the operations’ functions to implement activities known as product development, research & development, engineering, or product design according to customer requirements (Juran & Gryna, 1993). Therefore, this study provides some evidence that organisation need to focus on quality design by demonstrating activities such as identifying customer requirement and coordination between functions in the process of product development as this can enhance new product development performance. At the same time, organization should pay attention to market focus. Market focus place an important aspect on customer orientation such as understanding customer needs, strong customer commitment and creating value for customer. Organisations that listen and understand customer needs are in a better position in the market (Shapiro, 1988; Slater & Narver, 1994b; Webster Jr., 1988). Thus, maintaining a good relationship with customer should be the main agenda in the organizations. In general, the results of the moderating effects of quality design on the relationship between market orientation dimensions and
1488
new product performance confirm with the literature which suggests that both market orientation and quality orientation should complement each other to achieve higher organisational performance (Lai & Cheng, 2005; Longbottom, Mayer, & Casey, 2000; Sittimalakorn & Hart, 2004).
The findings contribute to the existing body of knowledge by investigating the moderating role of quality design in the market orientation-new product performance relationship. Previous studies have not examining this specific variable moderating relationship. Most of the past studies focus on the moderating role of business environmental variables (Diamantopoulos & Hart, 1993; Greenley, 1995; Jaworski & Kohli, 1993; Pulendran et al., 2000; Slater & Narver, 1994a) and there has been no consistent findings of this environmental role in the relationship between market orientation and organizational performance. Meanwhile, quality design could be considered as an internal organizational variable that provide synergistic effects with market orientation in the new product performance. Therefore, the present study contributes to the literature by introducing quality design variable as moderator for the relationship between market orientation and new product performance. This study also provides empirical evidence for practicing managers in their management practices as organizations may consider the result of the study by coordinating both market orientation and quality design in their efforts to strive for better organizational performance.
References [1] Ahire, S. L., Golhar, D. Y., & Waller, M. A. (1996). Development and validation of TQM implementation
constructs. Decision Sciences, 27(1), 23-56. [2] Anderson, C. H. (1986). Hierarchical Moderated Regression Analysis: A useful tool for retail management
decisions. Journal of Retailing, 2(62), 186-203. [3] Badri, M. A., Davis, D., & Davis, D. (1995). A study of measuring the critical factors of quality
management. International Journal of Quality & Reliability Management, 12(2), 36 - 53. [4] Baron, R. M., & Kenny, D. A. (1986). The moderator-mediator variable distinction in social psychological
research: Conceptual, strategic, and statistical considerations. Journal of Personality and social psychology, 51(6), 1173-1182.
[5] Burrill, C. W., & Ledolter, J. (1999). Achieving quality through continual improvement. New York: John Wiley & Sons.
[6] Chong, P. K. (2007, March 20). Show us how good you are. New Straits Times, p. 2. [7] Day, G. S. (1994). The capabilities of market-driven organizations. Journal of Marketing, 58(4), 37. [8] Diamantopoulos, A., & Hart, S. (1993). Linking market orientation and company performance: preliminary
evidence on Kohli and Jaworski's framework . Journal of Strategic Marketing, 1(2), 93. [9] Evans, J. R., & Lindsay, W. M. (2002). The management and control of quality (5th ed.). Ohio: South-
Western. [10] Flynn, B. B., Schroeder, R. G., & Sakakibara, S. (1994). A framework for quality management research
and an associated measurement instrument. Journal of Operations Management, 11(1), 339-366. [11] Flynn, B. B., Schroeder, R. G., & Sakakibara, S. (1995). The impact of quality management practices on
performance and competitive advantage. Decision Sciences, 26(5), 659-692. [12] Frazier, P. A., Barron, K. E., & Tix, A. P. (2004). Testing moderator and mediator effects in counselling
psychology research. Journal of Counseling Psychology, 51(1), 115-134. [13] Gray, B., Matear, S., Boshoff, C., & Matheson, P. (1998). Developing a better measure of market
orientation. European Journal of Marketing, 32(9/10), 884-903. [14] Greenley, G. E. (1995). Market Orientation and Company Performance: Empirical Evidence From UK
Companies. British Journal of Management, 6(1), 1. [15] Hair, J. J. F., Anderson, R. E., Tatham, R. L., & Black, W. C. (1998). Multivariate Data Analysis (5th ed.).
New Jersey: Prentice Hall.

1489
An Investigation of Young Chinese Consumers’ Casual Wear Buying Behaviour in Greater China
C.Y. Kwan, [email protected]
K.F. Au, [email protected] K.W. Yeung, [email protected]
Institute of Textiles and Clothing, The Hong Kong Polytechnic University, Hong Kong
Abstract With a huge consumer market and an increasing spending power, Greater China is becoming an important market that cannot be neglected by many international apparel retailers. However, the conduct of apparel retailing business in this region is often regarded as a great challenge due to the diversity of market and cultural difference. In the literature, it is realized that Chinese consumers appeared to be distinctively different from Western consumers in their buying behavior, yet little attention has been put on investigating the differences among Chinese consumers who reside in different Chinese societies. As Culture is identified as an important variable in affecting consumer buying behavior and is also believed that intra-cultural variations in Hong Kong, Taiwan and Mainland China are likely to exist, consumers’ clothing buying behavior in these three societies are expected to be different in some ways. Thus, the aim of this study is to investigate young Chinese consumers’ casual wear buying behavior in Hong Kong, Taiwan and Mainland China. The results indicated that the most important criteria for young Chinese consumers for apparel assessment are related to price and quality aspects. Comparison of responses also revealed that the importance of clothing choice criteria, the preferred buying channels and the casual wear buying practices are quite different among the five selected cities in these three Chinese societies. Keywords: Greater China, Young Chinese consumers, clothing buying behavior, casual wear. Introduction China acceded to the World Trade Organization (WTO), becoming one of the WTO’s formal members in 2001. With the gradual removal of market access restrictions and liberalization of regulations for foreign investment in the apparel retailing sector linked with WTO membership obligations, more and more foreign apparel marketers will be able to gain market entry into China. In particular, the youth market segment is believed to be a potentially profitable market for international clothing marketers.
The constantly increasing living standard of consumers, the implementation of double holidays by employers and the diversification of entertainment activities in China have generated a great demand and needs for casual wear in the consumer market. According to the survey conducted by the China Textiles University in 1997, casual wear consumption was accounted for more than 50% of the total clothing consumption and young consumers who aged between 20 and 40 were the largest consuming group accounting for more than 50% of the consumption of the total population in terms of purchasing casual wear (HKTDC, 1999). Considering the large demand for casual wear in the market, many international apparel marketers have started to gain entry into this market and the apparel retailing market in China is becoming very competitive when restrictions on market access in equity, geographic area, number and form of establishment no longer apply to foreign investors (HKTDC 2001; HKTDC 2001). In light of this keen competition, equipping international marketers with a better understanding of young consumers who reside in different Chinese societies, especially their decision-making towards casual wear purchase would assist them in competing in this market. Thus, the aim of this study is to investigate young Chinese consumers’ casual wear buying behavior with due consideration taken for the intra-cultural differences. Hong Kong, Taiwan and the Mainland China - the three economies of China that are influenced by Chinese culture - were chosen as the target areas for investigation. As these three places are separated geographically and to a certain extent, has each developed independently, a certain degree of cultural difference which in turn has led to greater diversification of consumer behaviour within each individual society is likely to exist, due to their dissimilar political and economic systems

1490
(Yau 2000). Within these three societies, Beijing, Shanghai, Guangzhou, Hong Kong and Taipei were further selected as the target cities to investigate since consumers in these cities tend to act as opinion leaders for consumers in other parts of the country (Papadopoulos et al. 1987; Hu 1994). Clothing Choice Criteria Clothing choice criteria are defined as the intrinsic (inherent to the product) and extrinsic (product-related, but not part of the physical product) product attributes that associated with desired benefits or incurred costs as consumers make buying decision among clothing alternatives (Davis 1985; Hatch and Roberts 1985; Eckman et al. 1990; Hawkins et al. 1995; Forney et al. 1999). Different criteria may have varied importance in every consumer’s mind. Consumers would assign high importance on the criteria that can really reflect their underlying characteristics and experiences. Since the critical characteristics of apparel can always determine its ultimate purchase acceptance or rejection by consumers (Sproles 1979), the criteria that consumers use in clothing purchase decisions have long been regarded as an important issue for investigation in previous consumer studies. Researchers have identified many product attributes and criteria that are critical for fashion consumers in making clothing purchase. Eckman et al. (1990) have summarized the criteria that influence consumers’ evaluation of apparel products in 21 clothing related studies into 35 extrinsic and 52 intrinsic attributes. In Zhang et al. (2002) study, fit, comfort, style, colour and workmanship were identified as the most important attributes in affecting Chinese consumers’ casual wear purchase. In this study, 17 clothing choice criteria which were adopted from previous studies (Jenkins and Dickey 1976; Cassill and Drake 1987; Eckman et al. 1990; Lee and Burns 1993; Hu 1994; Zhang et al. 2002) were employed to investigate the perceived importance of clothing choice criteria on casual wear purchase in China. They are brand reputation, colourfastness, comfort, country of origin, durability, care, enhancement of self-image, trendiness, fibre content, fit, price, rarity, sex appropriateness, store image, style, uniqueness and workmanship. Fashion Involvement Fashion involvement, a term frequently used to indicate involvement with the apparel product category (Fairhust et al. 1989), is often regarded as a central motivational factor influencing consumer’s purchase decisions in many of the consumer studies (Beatty et al. 1988; Zaichkowsky and Sood 1988; Kapferer and Laurent 1993). It is associated with the level of perceived personal relevance or importance of clothing products to the customer (Gotlieb et al. 1992; Flynn and Goldsmith 1993) and would influence consumer’s general approach in making purchase decisions (Kassarjian 1981; Kim et al. 2002). It is often considered to be multidimensional, consisting of perceived importance, decision risk, psychological risk and pleasure dimensions (Laurent and Kapferer 1985; McQuarrie and Munson 1987). Consumers with high fashion involvement would demonstrate interest, pleasure and eagerness toward clothing products (Goldsmith 1991). Consumers’ involvement with clothing products would also lead to involvement with related advertisements and purchase decisions. In addition, several behavioural outcomes were also found to be associated with high involvement, including frequent purchase and use of a product, increased acquisition of product information and frequent care of a product (Zaichkowsky 1985; Flynn and Goldsmith 1993; Dholakia 1998). Thus, it is believed that stronger insight into the dynamics of consumer decision making in terms of apparel products can be gained through consideration of fashion involvement (Kim et al. 2002). In the current study, 23 statements which were adapted from previous studies (Laurent and Kapferer 1985; Mittal 1995; O'Cass 2000) regarding the three major aspects, including product involvement, purchase involvement and advertising involvement were used to measure the fashion involvement level of young Chinese consumers. Methodology Questionnaire survey was employed to collect the primary information of young consumers’ buying behaviour towards casual wear in Beijing, Shanghai, Guangzhou, Hong Kong and Taipei. A well-structured questionnaire which consisted of four parts was devised for data collection. These four parts concerned about consumer’s general

1491
buying behaviour towards casual wear (7 questions), consumer’s clothing choice criteria (17 questions), fashion involvement (23 questions) and the demographic characteristics (8 questions).
Before carrying out the fieldwork survey, a pilot test was conducted with 30 subjects in these cities in order to pretest the format and suitability of the questions in the questionnaire. Questionnaires were then distributed to 1,250 male and female University students with diverse majors on the campuses of three or more Universities in the five cities (250 each) in 2004. Judgmental and quota sampling was employed. In determining the sample size, a rule of thumb that the total sample size for conducting a countrywide consumer survey should range from 1,000 to 2,500 (Sudman 1976) was used. Among the distributed questionnaires, 1,118 were returned and 1,092 provided usable responses, yielding an 87% response rate. Profile of Respondents The majority of the samples (70 %) aged between 20 and 24, a quarter (25%) were younger than 20, and fewer than 5 % of respondents were 25 or older. The proportion of female and male respondents in this study was 61 % and 39 % respectively. More than half of the respondents in Beijing, Shanghai and Guangzhou were single child, while more respondents in Hong Kong and Taipei had one or more siblings. The monthly personal income of most of the Beijing, Shanghai and Guangzhou subjects fell in the category of RMB500 or below, whereas the median income for the Taipei and Hong Kong respondents was in the categories of HK$501-1,001 and HK$1,001-2,000 respectively. The monthly household income of nearly half of Beijing (55%), Shanghai (47%) and Guangzhou (50%) respondents was RMB2,001-5,000, and more than one-third of the respondents in Taipei (34%) were in the range of HK$20,001-40,000. The household income of the Hong Kong respondents was the highest, with 45% and 34% in the categories of HK$20,001–40,000 and HK$10,001-20,000 respectively. Findings Six aspects regarding young Chinese consumers’ casual wear buying behaviour - fashion information source, social reference, quarterly expenditure on casual wear, favourite marketing channel for casual wear purchase, fashion involvement level and clothing choice criteria for casual wear purchase were investigated and provided the main findings of this study. Fashion Information Source and Social Reference Most of the respondents regarded store display (49%), fashion magazine (22%) and TV (13%) as the most influencing media on their casual wear purchase. Only a small percentage of respondents agreed that non-fashion magazine (4%), billboard and leaflet (3%), newspaper (2%), the Internet (2%) and other channels (5%) were important channels for them to gain fashion information (Figure 1). The results gained from the five cities were similar in suggesting that store display and fashion magazines were the two most common channels for sourcing fashion information. In general, young Chinese consumers enjoy shopping and like to browse for a variety of shops in their leisure time. They often gain fashion news from the window and in-store displays and they tend to conform themselves to media standards, especially the fashion magazines in casual wear selection. Compared with the counterparts in the other four cities, the influence of TV and non-fashion magazines was significantly different for young consumers in Hong Kong. Only 7% respondents in Hong Kong regarded TV as the most important media, while 16% reported the importance of non-fashion magazine in affecting their casual wear purchase. This indicated that the impact of magazines, including fashion and non-fashion ones, is considerably important, while the influence of TV is comparatively low for young consumers in Hong Kong.
In addition to the non-personal reference from the media, personal reference from consumers’ surrounding social groups is also important. Among the six personal socialization agents that included in the investigation, peers were reported as the most important agent for young Chinese consumers. Nearly 500 respondents (49%) regarded their friends as the most influential people in their purchase decisions on casual wear (Figure 2). About 15% respondents chose their parents, lovers and others as the major influencer on their casual wear purchase. Among the ones who selected others as the major reference, most of them stated themselves as the sole influence on the

1492
purchase. Instead of accompanying others to go shopping, these consumers tend to shop casual attires alone. Comparing the results with the other four cities, the importance of peer influence on Hong Kong respondents (39%) was relatively low, while the impact of sales assistants was significantly high. Nearly 12% of the Hong Kong respondents considered in-store sales assistants as the most important agent to affect their purchases. In addition, it is not surprising that more respondents in Beijing and Shanghai (>20%) regarded parents as the greatest influencer, since the majority of them were single-child. They often go shopping with their parents and their expenditure on casual wear is highly relying on their parents.
Fashion Information SourceFashion Information SourceFashion Information SourceFashion Information Source
13%
49%
22%
4%3%
2%
2%5%
TV
Store Display
Fashion Magazine
Non-fashion Magazine
Billboard and Leaflet
Newspaper
The Internet
Others
Social ReferenceSocial ReferenceSocial ReferenceSocial Reference
45%
13%
5%
4%
4%
14%
Friends
Parents
Husband/boyfriend orWife/girlfriendPop Stars
Siblings
Sales Assistants
Others
FIGURE 1:
RESPONDENTS’ MAJOR FASHION INFORMATION SOURCES FOR CASUAL WEAR
FIGURE 2: THE MOST IMPORTANT PERSON AFFECTING RESPONDENTS’ CASUAL WEAR PURCHASE DECISIONS
Quarterly Expenditure and Favourite Marketing Channel for Casual Wear Purchase Approximately two-thirds of the respondents in Beijing, Shanghai and Guangzhou had bought 0 – 6 pieces of casual wear and spent RMB 500 or less on casual wear purchases in the three months prior to the survey. About half of respondents in Guangzhou (53%) and nearly one-third of respondents in Beijing (32%) and Shanghai (34%) indicated individual stores as the most frequent shopping venue for casual wear. More than one-third of the respondents in these five cities (43%) reported their preferences for buying casual wear in individual stores (Figure 3). Around a quarter of respondents in Beijing (25%), Shanghai (26%) and Taipei (21%) regarded department stores as the major venue for buying casual wear, while 22% of respondents in Guangzhou indicated their liking for branded specialty stores. Similarly, a majority of Taipei respondents had bought 0 – 6 pieces of casual wear (89%) and spent HK$500 or below (61%) on casual wear in the last three months. Individual stores (48%) and department stores (21%) were also identified as two major shopping venues for casual wear in Taipei. With the highest personal and household income, the clothing purchasing power for Hong Kong consumers was comparatively higher, with a median expenditure in the range of HK$501–1,000. Nearly one-third of the Hong Kong respondents reported they would buy casual attire once per month (35%) or once every two weeks (26%), and a quarter of the respondents would shop for clothes at least once a week. More than half of the Hong Kong respondents preferred to buy casual wear in individual stores and a comparatively higher proportion (15%) preferred to purchase casual wear in discount stores.

1493
Most Favourite Channel for Casual Wear PurchaseMost Favourite Channel for Casual Wear PurchaseMost Favourite Channel for Casual Wear PurchaseMost Favourite Channel for Casual Wear Purchase
43%
17%
15%
9%
7%
5%4%
Individual Store
Department Store
Branded Specialty Store
Discount Store
Hypermarket
Street Hawker
Others
FIGURE 3: RESPONDENTS’ MOST FAVOURITE CHANNEL FOR CASUAL WEAR PURCHASE
Fashion Involvement Level In general, the fashion involvement of young Chinese consumers is in a medium level. Most of the subjects reported that they enjoy shopping casual wears and concern about the symbolic value of casual wear for themselves. They care about the negative consequence of a purchasing mistake, thus, their purchase decision on casual wear would not be made casually. In order to determine the differences of fashion involvement level among the respondents in the five cities, analysis of variance (ANOVA) tests were conducted. Significant differences on product involvement (p<0.01), purchase involvement (p<0.001) and advertising involvement (p<0.05) among the cities were identified. The results indicated that the fashion involvement level of Beijing respondents was significantly higher than the others, while the subjective probability of making a purchase mistake on casual wear was relatively high for Hong Kong respondents. Beijing subjects were more likely to regard casual wear as a relevant product in their daily life and they believed casual attire as an important tool to express their identities. Unlike Hong Kong consumers who have a higher propensity for impulse purchase, Beijing consumers tend to think carefully and make more comparison before making the purchase on casual wear, thus, their likelihood to make purchase mistake is lower. Clothing Choice Criteria for Casual Wear Purchase The results showed that fit, comfort, enhancement of self-image, style and price, in that order, were rated as the five most important criteria, whereas country of origin was rated as the least important criteria for consideration in the casual wear purchase by the respondents. The average scores of the top five criteria were over 3.76, while the means for all criteria were in the range of 2.43 and 4.24 (Table 1).
Results of the ANOVA tests revealed that there was significant difference (p<0.001) on the perceived importance of fit, comfort, enhancement of self and price among the respondents in the five cities. The average scores of comfort (3.93), enhancement of self-image (3.55) and fit (3.98) for Hong Kong respondents were significantly lower, while the mean of price (4.11) for Taipei subjects was considerably higher than that of the counterparts in the other cities. Even though fit and comfort were both rated as the most important criteria for the Hong Kong respondents, the perceived importance of these criteria for Mainland consumers was much greater. This indicated that most young Chinese consumers would often like to try on the products for checking the fit and the appearance of garments in matching their own images before making the purchase. Thus, sizing and image of the products are very important for the fashion business, especially those in Mainland China. In line with the findings of Hung’s (2005) study, Taiwan consumers in general pay greater attention to price when making purchases. They usually prefer to buy less expensive garments and are discerning with an increasing demand for quality clothing at reasonable price.
In addition to these five criteria, respondents also regarded colourfastness, durability, care and uniqueness as important attributes to consider in making casual wear purchase. The mean scores of these four criteria were ranged from 3.51 to 3.63. The ratings of colourfastness, care and uniqueness were significantly lower for Hong Kong samples, while the average score of durability was considerably higher for Taipei subjects than for the

1494
respondents in the other cities. This suggested that young consumers in Hong Kong would pay less attention on these physical attributes in the quality aspect. They care about the general feeling of comfort, style and fit more than the quality of the casual wear. Unlike the Hong Kong subjects, respondents in Taipei attached greater importance to durability than style. In general, their ratings on the quality aspects of casual wear (e.g. colourfastness, comfort, care, durability...) were higher than that of the respondents in the other four cities. This indicated that product quality is particularly important for selling casual wear in Taiwan.
TABLE 1: THE PERCEIVED IMPORTANCE OF CLOTHING CHOICE CRITERIA ON CASUAL WEAR PURCHASE Criteria Mean SD
Fit 4.24 0.87
Comfort 4.20 0.92
Enhancement of Self Image 4.01 0.95
Style 3.95 0.89
Price 3.76 0.91
Colourfastness 3.63 1.02
Durability 3.53 0.97
Care 3.51 0.98
Uniqueness 3.51 1.03
Sex Appropriateness 3.38 0.98
Workmanship 3.31 1.09
Trendiness 3.26 0.97
Fibre Content 3.11 1.06
Rarity 3.02 1.14
Store Image 3.02 1.01
Brand Reputation 2.98 1.04
Country of Origin 2.43 1.02
Conclusion In this study, young Chinese consumers’ casual wear buying behaviour in three different Chinese societies, i.e. Hong Kong, Taiwan and Mainland was investigated. Based on the results of the survey conducted in five cities, it is found that most of the young Chinese consumers would buy casual attire once a month and spend less than HK1,000 in a

1495
quarter. They prefer to shop casual wear in individual stores, department stores and branded specialty stores. Consumers in Beijing, Shanghai and Taipei are more likely to choose department stores as the major venue for buying casual wear, while Guangzhou consumers tend to shop in branded specialty stores. In general, young Chinese consumers consider store display and fashion magazine as the important fashion information sources. They enjoy shopping casual wear and often gain fashion news from store windows and in-store displays. TV is regarded as a popular channel for the young consumers to source updated fashion information in Mainland China, whereas the importance of non-fashion magazine is greater for Hong Kong consumers. Among the personal socialization agents, friends are considered as the most influential people in their purchase decisions on casual wear. It is not surprise that the influence of sales assistants is considerably high for Hong Kong consumers, while the importance of parents is particularly great for Beijing and Shanghai consumers. The fashion involvement of young Chinese consumers is in a medium level. Among the five cities, the fashion involvement level for Beijing consumers is the highest, while the propensity of making purchase mistakes on casual wear was high for Hong Kong consumers. It is unexpected that fit, comfort and enhancement of self image are the three most important criteria that young Chinese consumers would consider when they make purchase decisions on casual wears. This finding is not consistent with the results of a large-scale study conducted by the National Bureau of Statistics (1997) with the shopping public in 72 cities in China and which states that price was the most important consideration in the apparel consumption (HKTDC 1999). Price is only considered as the fifth important criteria with a mean score of 3.76 in the present study. This appears to indicate that, unlike the whole population, this specific group of consumers (university students aged between 18 and 30) place great emphasis on the feeling of comfort, sizing and personality aspects of casual wear, and price is relegated to a lower position in their buying decisions.
The above findings implied that clothing buying behaviour for young consumers in different Chinese cities are quite different. Understanding the reactions of these customers to market stimuli can obviously help the marketers to focus or alter their product attributes to meet the requirements that perceived as critical by the consumers. It is strongly believed that this study can help the international apparel marketers to recognize the differences among these consumer segments which in turn would very likely to increase their chance of success for in developing, modifying and marketing apparel products in the Greater China. Acknowledgement The authors would like to thank The Hong Kong Polytechnic University for providing funding to support this study.
References
[1] Beatty, S. E., Kahle, L. R. and P.Homer (1988). "The involvement-commitment model: Theory and implications." Journal of Business Research, 16: 149 - 167.
[2] Cassill, L. N. and Drake, F. M. (1987). "Apparel selection criteria related to female consumers' lifestyle." Clothing and Textile Research Journal, 6(1): 20-28.
[3] Davis, L. L. (1985). "Effects of physical quality and brand labeling on perceptions of clothing quality." Perceptual and Motor Skills, 61: 671 - 677.
[4] Dholakia, M. U. (1998). "Involvement-response models of joint effects: an empirical test and extension." Advances in Consumer Research, 25(1): 499 - 506.
[5] Eckman, M., Damhorst, M. L. and Kadolph, S. J. (1990). "Toward a model of the in-store purchase decision process: consumer use of criteria for evaluating women's apparel." Clothing and Textiles Research Journal, 8(2): 13 - 22.
[6] Fairhust, E. A., Good, K. L. and Gentry, W. J. (1989). "Fashion Involvement: An instrument validation procedure." Clothing and Textile Research Journal, 7(3): 10 - 14.
[7] Flynn, L. R. and Goldsmith, R. E. (1993). "Application of the personal involvement inventory in marketing." Psychology and Marketing, 10: 357 - 366.
[8] Forney, J. C., Pelton, W., Caton, S. T. and Rabolt, J. N. (1999). "Country of origin and evaluative criteria: Influences on women's apparel purchase decisions." Journal of Family and Consumer Sciences, 91(4): 57-62.

1496
[9] Goldsmith, R. E. (1991). "Measuring product category involvement: a multitrait-multimethod study." Journal of Business Research, 23(4): 363 - 371.
[10] Gotlieb, J. B., Schlacter, J. L. and St.Louise, R. D. (1992). "Consumer decision making: A model of the effects of involvement, source credibility, and location on the size of the price difference required to induce consumers to change suppliers." Psychology and Marketing, 9(3): 191 - 208.
[11] Hatch, K. and Roberts, J. A. (1985). "Use of intrinsic and extrinsic cues to assess textile product quality." Journal of Consumer Studies and Home Economics, 9(4): 341-357.
[12] Hawkins, D. I., Best, R. J. and Coney, K. A. (1995). Consumer Behaviour: Implications for Marketing Strategy. Chicago, Irwin.
[13] HKTDC (2001). China's Accession to WTO - Embracing the Opportunities, Meeting the Challenges. Hong Kong, Hong Kong Trade Development Council.
[14] HKTDC (2001). The Implications of China's WTO Accession for Hong Kong's Manufacturers/Traders in Textile and Clothing Products. Hong Kong, Research Department, Hong Kong Trade Development Council.
[15] Hu, Q. Y. (1994). China's Consumer Market: Shanghai Consumers' Attitudes Toward Foreign-Brand and Chinese-Brand Apparel. USA, University of Missouri-Columbia.

1497
Marketing and Agriculture: Some Reflections on Future Directions
Alessio L. Lokar, [email protected] Michela C. Mason, m.mason@uniud
University of Udine, Italy Abstract The objective of this paper is to try to define the area of investigation of agro-industrial marketing in order to gather the evolutionary characteristics that come closest to modern business marketing techniques. In order to do this, and after a short examination of the available literature, it has been suggested that the increasing propensity to view agricultural marketing as applications of modern marketing principles of agricultural and food business is a consequence of the evolution in patterns of food products. The subject is a relatively new one because traditionally agricultural products were sold in the form of commodities, foodstuffs or staples and where the price, which was connected to an average quality, was the most important element of the deal. Nowadays, this situation is gradually changing and we would like to point out the main implications of this change. Review of the Literature To discuss agro-industrial marketing is not all that simple. It can represent an opportunity for a second, critical reading of the evolutionary path of the birth, the affirmation of the discipline, its tools and its points of view, together with well-established certainties and by welcoming the intricacies of the Italian school of thought. Firstly and more precisely, some terminological ambiguities have quite often appeared within the context of Italian academia when “agro-industrial marketing” has been discussed because the term marketing has been used as synonym of the word “market” and because it concerns the field of investigation. Secondly, it is in fact not always clear if the reference point is a particular sector, which highlights the characteristics of the primary sector, or if it is in reference to the marketing of a product that emphasises the applications of the approach of marketing to the agro-industrial company and particularly to the agricultural company as whole.
Regarding the first point and the North American school of thought the relationship between “agro-industrial marketing” and the “economy of the agro-food markets” appears to be very narrow in that the subject of agricultural marketing is developed as branch of agricultural economics. In particular, Ritson highlights how agricultural marketing can be placed within the context of marketing management decisions once the special characteristics of the marketing of agricultural commodities has been understood (Ritson, 1997). In Italy this relationship takes on some rather mellow contours thanks to the originality and incisiveness of the scientific contributions by Luigi Guatri in the 1960s and 70s.
Guatri has the merit of having extended the “Zappiani” principles by reformulating the institutionalised paradigm “disclosure-management-organization” so as to be able to apply it to the complex phenomena that links the company to the market. Within the setting put forth by Guatri there is a constant link of marketing phenomena to other business phenomena and in particular to economic-financial elements. Significant examples regard those that are relative to proposed solutions in order to solve the problem of the relationship of costs which can be found in the company's overall nature of its productive and commercial policies. The interactions between marketing and economics go well beyond the company matrix leaving ample space to neo-classical economic theory (Chamberlain, Dean, Bain) which becomes a useful yet non-exhaustive reference point for a discipline which is applied with realistic demands of marketing. Analogies with this formulation are also recognizable within the context of Italian agricultural economics some decades ago, above-all in the works of Vito Saccomandi. Saccomandi’s 1991 text, “Agricultural product market economy institutions”, is considered to be pioneering as he leans on a neo-institutional theory of agricultural markets and makes it the methodological core of the industrial economy. Accordingly, the lines between market economics and marketing become, as the author himself affirms, “(…) this method of conceiving the economy of the agricultural market would tend to make it coincide with the study of agricultural

1498
marketing, one which can be interpreted more or less as a specialized branch of the economy of the agricultural company”. According to the second point, Saccomandi provides a useful distinction between sector and product marketing which goes back to the categories that are present in business subjects such as micro and macro marketing. More precisely, by taking into consideration the macro marketing conceptualization as proposed by Shawver and Nickels in 1979 can be identified as the study of the exchange activities and of exchange systems from the point of view of the company. Within this context agricultural marketing is expanded in order to include "the analysis of the production-consumption path and the consequences produced from the structure of this path on the sales methods of agricultural production ". Following such guidelines then, by using a term suggested to us by Davis and Goldberg, that the term “agri-busniess marketing” is used. Agricultural marketing is therefore defined as “(…) the of all business activities involved in the flow of food products until they are in the hands of consumers (Kohls and Uhl, 1990)”. This line of reasoning later evolved and was initially proposed in order to analyse the link between the consumption and the marketing of the agricultural product and the structure of the agricultural market reference point. Following the formulation established by the Malassis French school of thought, the agro-industrial sector is one “of the activities which compete to perform the food function of a given company (Malassis, 1996)”. In more recent times such a formulation placed the emphasis on the “social” aspects of marketing. This has resulted in crossing over into the world of societal and social marketing thanks also to the responsibilities on behalf of companies which goes beyond the quest of a satisfactory profit. In conclusion, agro-industrial marketing contributions developed within the context of relational marketing and of territorial marketing also take on a rather noticeable importance (relations between the various protagonists of the industry and the consumer). Traditional Agricultural Market One of the most known models which is used for the explanation of economic phenomena is the so-called “perfect market”. Compared to the market as a whole, supply side economics in this model is formed by a large host of producers which are not able to change the price of their products due to the small size of the companies. Hence, they must adapt to the “invisible” hand of the market. Moreover, in such a perfect market, total transparency of knowledge regarding processes reigns because technologies change slowly throughout time and enough financial means are at disposal. As a consequence, there are few barriers for new entrants into the supply side of the market. If, for instance, profit materializes in the given industry, new entrepreneurs are attracted and compete by price. Therefore, profit is eroded and in the long run it disappears altogether. The reality of the perfect market might be luring at the bottom of every economic activity. It seems to us though that the model was created with in mind the particular traditional market of agricultural products. Historically, agricultural production was carried out by small and individual farmers. Technologies were widely known in the local cultures and have only been changing slowly in time: only at a century’s pace were new agricultural products introduced. Examples may be potato, tomato, tobacco, sugar and other species imported from overseas. In the meantime, few things changed during the centuries. The agricultural entrepreneur, in order to start producing, needed only to own soil, a task which was not impossible. Even today, there is still disposable soil even in inhabited areas. The small scale farmers have been partly producing for subsistence and partly for the market, obtaining low prices for their supplies and approaching the model of the perfect market as described above. Buyers of products have been in most cases middlemen and owners of storing facilities whence they sold crops to markets that were frequented by consumers. Middlemen very often obtained the most of the value added which materialized in production.
In modern times and as a consequence of democratic processes the traditional farmers in some areas were able to coalesce politically by fighting for their interests and by obtaining subsidence by guaranteed prices. These were higher than those which they would get by means of the mechanism of the mere perfect market. Such agricultural policies happened within national states. On even a larger scale they have been present in modern regional groupings like the EU. The Common Agricultural Policy (CAP) is renowned for the agricultural interests around which the union as a whole has been formed. Until now, each year more than half of the EU’s budget is

1499
destined to subsidize farming activities. But lately such a policy has been put under question. See for instance the so called Doha Round as it is
considered economically much more advantageous for mankind in general and in particular also for the consumers of developed countries that shift the traditional agricultural production to developing countries therefore obtaining several advantages all at once: reducing the subsidies in the developed world, lifting the financial weight from budgets, producing at lower costs, reducing financial burdens on final consumers by imposing cheaper prices, helping the developing populations by fostering the demand for products where they have competitive advantage. But the talks connected with such changes only advance at a slow pace as they require for restructuring the agricultural activities both in the developed and in the developing world. One of the main problems hovering over the horizon of further development in the area is the one expressed by the following question: after such changes, what would the human resources of those employed in agriculture in developed countries really do? If many products were imported from abroad which activity would they be left with? This is a question which remains as a psychological barrier on the road to a larger opening of global market integration. We could say: wait and see but such an answer is not in line with modern sensibility. Modern thinkers like to plan, i.e., have some assurance regarding the future. In the given case we can formulate two answers:
1. The relative number of people employed in agriculture in the developed countries is nowadays already pretty low. In many of them we are speaking of percentages varying between 1 and 5 percent of the population, down from 60 to 80 percent two or three centuries ago. Therefore, the absolute number of people struck by liberalizing global agriculture markets would be low. In most cases, it would be easily handled by the welfare system of the single countries.
2. There is still though a certain number of people who would like to carry out agricultural activities in the face of adverse odds. It is has also been taken into consideration that the supply of agricultural products cannot be satisfied completely by imports. Some products will always be produced domestically for reasons regarding transportation, stocking, conservation, freshness and quality. So the real question is the following one: without subsidies, how can the battle with cheaper imported products be won by a given entrepreneur who would like to express himself in the area of agricultural production? Modern Agricultural Markets The answer to such a question we can find in art or in the science of marketing as defined by the technique by which the subject A, who is offering a, tries to convince the subject B to accept a, getting in return b,as an exchange for it. a is in general a product but can be entirely and generally-spreaking also a service, a product plus a service, a program, or an idea ( Fig.1).

1500
b is normally a financial reward but it can be also a vote, an adherence, an attendance, or a participation. It is important to understand that B is not compelled to accept a, but he/she is free to do it. In most situations, he/she has also the choice to accept a, or a1, a2, …., an, or a substitute of it �, offered by suppliers C …N. In the field of agriculture a is an agricultural product and may be also a connected service: for instance, cauliflower with a cooking recipe. If qa is the quantity of a and qb, the quantity of b, then
pa = qb
qa
1( )
is the price of a. Hence, the art, technique, or science of marketing is about how to convince B to accept a, giving in exchange b, where B is free to do it. In order to obtain this result A has at its disposal the knowledge of the so called “marketing paradigm” by which what he tries to do is to differentiate the offer of a in a way that it becomes convenient to B to accept it, becoming thus he willing to give to A the reward b in return. Why is it necessary to differentiate a?
The very reason is connected to the considerations which we took into account at the beginning of this paper when we spoke about the “perfect market”. The truth is that for A the situation of the perfect market is unbearable as it doesn’t provide profits. Therefore, A tries to escape from the perfect market in a market which is non-perfect as much as it is possible. Such an operation is carried out by means of differentiation.
The problem is that real markets are part of a super-system or an environment and this environment is always changing step-by-step in time. A must adapt to these changes if he/she wants to continue to stay in the market, i.e.: offering a desirable a to B. In other words, he/she must adapt. But adaptations cost. It is difficult to forecast exactly how much he/she will have to adapt and how much the adaptation will cost to him/her. The profits are needed to get a reserve in order to cover the risky costs of adaptation.
B
b A
a
Fig. 1.

1501
GEO-DEMOGRAPHY
ECONOMY - INCVOME
POLITICS LAWS
CULTURE
TECNOLOGY
NATURAL ENVIRONMENT
SUPPLIERS
MIDDLEMEN
COMPETITORS
BUSINESS CULTURE.
CLIENTS
VARIABLES OF THE COMPANY
PRODUCT OR SERVICE
PRICE
DISTRIBUTION
COMUNICATION ADVERTISEMENT
SALES PROMOTION
PUBBL. RELATIONS
PERSONAL SELLING.
V. OF THE MICRO-ENVIRONMENT
V. OF THE MACRO ENVIRONMENT COMPANY
FIG 2 VARIABLES OF THE MARKETING PARADIGM
1502
For instance, at the beginning of globalization in another industrial area such as the automotive one some producers like the Italy’s Fiat experienced a troubled situation. Due to certain historical reasons it is possible to sustain that they were caught by surprise by the phenomenon. Initially, it looked like they wouldn’t be able to carry out the adaptation asked for by the muted circumstances. But the final result was positive and today the Italian carmaker is showing a successful adaptation to the globalization phenomenon.
The adaptation was possible because in earlier times the owners of the company accumulated enough financial reserves to be able to hand off a guarantee for the financial exposures extolled by the environmental change.
The marketing paradigm is expressed by the so-called marketing variables as shown in Fig.2. There are several kinds of marketing variables: the passive variables of the micro and macro environment and the active variables of the company which are divided into the so-called marketing and communication mixes. In every particular case the use of the variables makes it possible to devise a strategy thus enabling the company to reach its activity goals. Differentiation Strategies So the real problem is: how to differentiate? The first answer to this question is that the possible strategies of differentiation are numerous as they may depend on all the elements depicted in Figures 1 and 2. We can start with a, the offer which takes into account its M-Mix, the famous 4 Ps of marketing: Product, Price, Place and Promotion. Differentiating amongst them but also making combinations of them and combining them with the environmental variables.
Let us make the following case: we would like to sell oranges which are produced in a totally natural manner and without additives and other treatments. In this case, we offer an agricultural product a, the oranges, which become differentiated with respect to other oranges. The average oranges sold in the markets are treated for conservation purposes but the oranges which are used in our case are not treated, therefore having a superior taste and a superior natural environmental quality. We differentiate the product by taking into account one of the variables of the macro environment: the modern sense or culture for natural features and environmental aspects. The differentiation attracts customers who are willing to buy the product giving in return a higher price than normally. Moreover, for such oranges we might choose a name in order to create a brand, let us say: ARNOTRADIS. Afterwards, we must follow a strategy in order to support and implement the brand on the market and thus consolidate the differentiation strategy.
But we can start also with B, the consumer, differentiating with respect to him/her: for instance, the supplier can choose a particular segment or a niche of consumers where competition is not so strong. In such a case he/she did differentiate in respect to consumers and not products, satisfying nevertheless the scope of the company in order to obtain a good economic result. The field of possible differentiation strategies is extremely wide but some basic strategies may be the following ones: 1 Selling to a single consumer: this is the strategy of handicraft production. The Saville Road tailor is producing his/her clothes on commission for single, personal consumers. 2 Selling to a market segment or niche: this is the strategy where we choose in the market as a whole a group of consumers whose desires and needs are to some extent homogeneous. It is similar to the strategy a, with the exception that we don’t have only one customer but rather a certain number n of them. 3 Selling to a homogeneous market. It is the strategy of mass production: the product is the same for everybody. For instance: a bank opens a counter where everyone can do any type of operation. Un-differentiated products and services can compete only by price p, hence, in this case we return to the condition of the perfect market. If there is a new potato producer but his/her potatoes do not differentiate in any way with respect to other potatoes on the market then in order to beat the competition he/she can succeed by lowering the price. 4 The biggest differentiation of a product is carried out by innovation: traditional products are totally substituted by new ones and are better fit for demand and circumstances. Nowadays, in the product industries’ office

1503
the use of computer plus printers is almost completely substituted by typewriters which were used ages ago. Of course as we pointed out above: the possibilities of differentiation are “legion” and they depend very
much on the fantasy and ingenuity of the entrepreneur working on the market. He/she can change a lot of things with the scope of convincing the consumer to purchase his/her products. There are cases of producers who have succeeded by changing products and their accessories, prices, sales locations, promotions by selecting particular consumers in the market and also taking into account the changes of the macro and micro-environment as we have seen in the examples shown above. Analytical Aspects The above ideas may be also shown from an analytical point of view in the following way: in the long run, company A must be in equilibrium. R, T and U are vectors regarding A shown as a system (Fig. 3): R, the revenue, T, the total cost and U, the profit, or capital reward. We assume the following convention: input vectors of the company have a positive sign and output vectors have a negative one. R− T − U = 0 1( ) From expression (1) it is easy to find the form (2): U = R− T 2( ) the usual form of the equilibrium equation of the company, meaning that profit U is given by the difference between revenues R and the total costs T. But we know that revenue R is the product of price times the quantity q: R= pq 3( ) Combining (2) and (3) we get, remembering that total cost T is also a function of q U = pq− T q( ) 4( ). As we have already pointed out in a perfect market p is constant as it is determined by the “invisible hand” of the market and cannot be changed by the company. In that case the condition of maximum profit max U� yields:
dU
dq= U '= p−
dT q( )dq
= p− T'= 0 5( )

1504
From expression (5) we can calculate the price
p =dT q( )
dq= MTC = T' 6( )
In the perfect market price is equal to marginal total cost, MTC, or T’. Combining expressions (6) and (4) we can calculate max U①, the maximum profit in the perfect market: maxUΠ = T 'q− T 7( ) In the case of differentiation of the product we get a differentiation situation which is a situation in the direction of a monopoly situation. In such a case price is not constant with quantity: p = p(q) 8( )
and the profit function becomes U = p q( )q− T(q) 9( ) The extreme is: U '= p'q+ p− T '= 0 10( )p = T '− p'q 11( )
and the price is: p = T '− p'q 11( )
Applying this expression in (9) we get Max Um=(T’-p’q)q-T=T’q-p’q2-T (12) If a company shifts from a pure market condition into a differentiated one it may obtain a maximum increment in profit of ∆U = maxUm − maxUΠ which is, considering equations (7) and (12): ①U=T’q-p’q2-T-(T’q-T)=-p’q2 (13) Considering now that elasticity is given by the expression
ε = − p
qp' 14( )
A R T
U FIG 3: A AS A SYSTEM

1505
we can calculate p’ as a function of the elasticity price versus quantity
p'= − p
qε 15( )
and introducing p’ in (13) we get
∆U = pq
ε remembering that pq=R, we get
∆U = R
ε 16( )
the advantage of differentiation is given by the revenue R which A gets divided by the elasticity of price and which is the very measure of differentiation. If it is large, at least ∞ the product is not differentiated at all and there is no advantage under the form of profit difference. If it is small, at least 0, the difference is big, at least ∞. If ①=1 the difference is given by the revenue. So everything therefore depends on the elasticity of the products which we introduce by differentiation: to have an advantage they must have a low elasticity, meaning that the price is not influenced very much by the quantity which is offered. For instance, when the new product computer + printer was offered initially in competition to the typewriter people preferred it and bought it even if it was much more expensive because the advantages offered by the combination of the two products were immensely superior to the old product, the typewriter. Therefore, in this case the price bore a low elasticity mark. But we must make another consideration: in order to produce differentiation or even in an extreme situation innovation, costs have been borne by the company for the development of the differentiation. These particular costs must also be considered if we want to carry out a fair estimate of the innovative strategy. Moreover, we must take into consideration that all this happens stochastically in the sense that differentiation not always succeeds. There is always a probability of not being successful. If we put P as the probability of success of the differentiation trial of the company and K as the total costs of R&D the average economic effect M(DIFF)n of the differentiation trial would be:
M(DIFF ) = PR
ε− K
+ 1− P( ) −K( ) = P
R
ε
− K 17( )
(17) is an expression by which we may estimate the advantage of a given differentiation measure and strategy. Conclusion Nowadays marketing is becoming important in the agro-business industry, as there is a trend to shift traditional agricultural production to the developing world. Also for agriculture “an effective macro marketing system is necessary for economic development, improved marketing is often the key to growth in less developed nations” (McChartey and Perrarult, 1993). Marketing is both a set of activities performed by individual organizations (micro marketing) and a social process which determines the development status of economies (macro marketing).
According to Bartels and Jenkins micro and macro marketing can be understood in a normative and in a positive way. Positive theory explains the practices of management and the function of the marketing system as a whole. Normative models involved in the setting of objectives are indispensable for the management process. On the one hand, micro marketing in a positive theory lets us understand the behaviour of food consumers. Its normative models are an application of marketing principles for companies in the food marketing sector. On the other hand, positive macro marketing concerns the study of the behaviour of agricultural and food markets and its normative models are an application of structure-conduct-performance approach to the food sector.
It can be deduced that a modern approach to marketing is very important for agriculture. In particular, the producers of the developed world would be then compelled to use marketing concepts and techniques in order to

1506
supply products by carrying out differentiations, in order to better convince consumers to buy differentiated products at a premium price.
The most important way to differentiate is innovation. In this article we have disused about the essence of the differentiation process of the products. From the point of view of the neoclassical economic theory we have elaborated an analytical expression which could serve to estimate the convenience of the differentiation effort by a given producer.
References Contact authors for the list of references


![Turning Back [updated 6.5.2015]](https://static.fdokumen.com/doc/165x107/6335f35102a8c1a4ec01fd86/turning-back-updated-652015.jpg)


![[Updated Constantly] - ITExamAnswers.net](https://static.fdokumen.com/doc/165x107/631602506ebca169bd0b61e0/updated-constantly-itexamanswersnet.jpg)