
Section 8 Updated FINAL - CiteSeerX
358
1711 Strategic Role of Information Systems in Contemporary Management Michal Greguš, [email protected] Eleonóra Beňová, [email protected] Faculty of Management, Comenius University in Bratislava Abstract Strategic role of information systems plays in contemporary management a key role in today’s global, dynamical and highly competitive environment. In this paper we identify a strategic information system (IS) issues in an organization. We critically analyze and evaluate the organization’s practice to solve the problems connected with the implementing strategic information systems. We try to discuss the wider organizational implications of the steps taken by the organization in the use of IS and their consequences. In conclusion we summarize how this knowledge and the use of advanced information and communication technologies can be used to gain a competitive advantage. Introduction In this paper we will consider a company in Slovakia, with above average industry performance. Geographic accessibility of the company’s major markets in WE and CEE, together with low cost operations, represent the major competitive advantages of the firm. Declining markets, existing production, overcapacity in Europe, and increased imports from Asian low cost countries intensify competition and enhance further industry consolidation. The company has a long-term history of local ‘big successful enterprise operating in a mature industry and stable CEE environment, with all implications on organizational structures, systems, company culture, processes, leadership and peoples’ mindset. After privatization of the company in mid 1990’s, international company took-over management control (50% shareholder). The company became strategic business unit (SBU) of the multinational enterprise (MNE). The integration of the company into MNE structures triggered massive restructuring and downsizing processes within this SBU and implied cultural clashes. On the other hand the integration created the opportunity to utilize the synergies from common distribution channels, procurement and production planning. Core Thesis Lack of the company’s emphasis on information systems integration with customers and suppliers, and the resulting poor/inefficient information and information exchanges within the value system, represents the major missed opportunity for value creation and was one of the underlying reasons for company’s takeover. The company’s over reliance on internal value chain optimization as a source of competitive advantage has proved to be an unsustainable source of competitive advantage. Business Strategy The company’s competitive strategy can be characterized as a hybrid strategy (Johnson-Scholes, 2002), where the low cost base (cost leadership), reinvested in low price, is merged with differentiation based on quality, reliability, flexibility, innovation and sustainable value creation for all key stakeholders. The company’s current business strategy can be characterized as a turnover strategy (Gerstein, 1983) that followed the company’s take-over and subsequent integration of this SBU into MNE structures. The turnaround strategy has not been driven by poor financial performance (SBU has enjoyed sound financial performance), but rather by the desire of new shareholders to increase productivity and to change organizational culture and structure, which are necessary measures asserting sustainable competitive advantage of a low cost, lean and entrepreneurial enterprise. Despite the management rhetoric (Carter and Jackson, 2004) expressed in MNE’s business strategy, in reality the cost cutting and strong centralization are dominant in SBU, in the context of a mature industry, severe price competition and the SBU’s background. This paper examines the alignment of IS and business strategy and the contribution of IS practices towards business objectives.
-
Upload
khangminh22 -
Category
Documents
-
view
3 -
download
0
Transcript of Section 8 Updated FINAL - CiteSeerX

1711
Strategic Role of Information Systems in Contemporary Management
Michal Greguš, [email protected] Eleonóra Beňová, [email protected]
Faculty of Management, Comenius University in Bratislava
Abstract Strategic role of information systems plays in contemporary management a key role in today’s global, dynamical and highly competitive environment. In this paper we identify a strategic information system (IS) issues in an organization. We critically analyze and evaluate the organization’s practice to solve the problems connected with the implementing strategic information systems. We try to discuss the wider organizational implications of the steps taken by the organization in the use of IS and their consequences. In conclusion we summarize how this knowledge and the use of advanced information and communication technologies can be used to gain a competitive advantage. Introduction In this paper we will consider a company in Slovakia, with above average industry performance. Geographic accessibility of the company’s major markets in WE and CEE, together with low cost operations, represent the major competitive advantages of the firm. Declining markets, existing production, overcapacity in Europe, and increased imports from Asian low cost countries intensify competition and enhance further industry consolidation.
The company has a long-term history of local ‘big successful enterprise operating in a mature industry and stable CEE environment, with all implications on organizational structures, systems, company culture, processes, leadership and peoples’ mindset. After privatization of the company in mid 1990’s, international company took-over management control (50% shareholder). The company became strategic business unit (SBU) of the multinational enterprise (MNE). The integration of the company into MNE structures triggered massive restructuring and downsizing processes within this SBU and implied cultural clashes. On the other hand the integration created the opportunity to utilize the synergies from common distribution channels, procurement and production planning. Core Thesis Lack of the company’s emphasis on information systems integration with customers and suppliers, and the resulting poor/inefficient information and information exchanges within the value system, represents the major missed opportunity for value creation and was one of the underlying reasons for company’s takeover. The company’s over reliance on internal value chain optimization as a source of competitive advantage has proved to be an unsustainable source of competitive advantage. Business Strategy The company’s competitive strategy can be characterized as a hybrid strategy (Johnson-Scholes, 2002), where the low cost base (cost leadership), reinvested in low price, is merged with differentiation based on quality, reliability, flexibility, innovation and sustainable value creation for all key stakeholders. The company’s current business strategy can be characterized as a turnover strategy (Gerstein, 1983) that followed the company’s take-over and subsequent integration of this SBU into MNE structures. The turnaround strategy has not been driven by poor financial performance (SBU has enjoyed sound financial performance), but rather by the desire of new shareholders to increase productivity and to change organizational culture and structure, which are necessary measures asserting sustainable competitive advantage of a low cost, lean and entrepreneurial enterprise. Despite the management rhetoric (Carter and Jackson, 2004) expressed in MNE’s business strategy, in reality the cost cutting and strong centralization are dominant in SBU, in the context of a mature industry, severe price competition and the SBU’s background. This paper examines the alignment of IS and business strategy and the contribution of IS practices towards business objectives.
1712
IS Strategy From strategic point of view the issue is the extent to which the improvements in information processing capability can improve and assist the way in which knowledge is created and shared both within and around an organization (Johnson&Scholes, 2004).
The competitive pressures have resulted in the takeover of company by MNE. The company, as a SBU of a large multinational enterprise is in a position of Implementor (Gupta, 1991) and its IS strategy making process could be plotted on Whittington model (2001) as classical (Grant, 2002), where over reliance on higher-level strategies (from MNE) is apparent. The company is ‘forced’ to accept systems from other units (located in Austria) for largely economic (or even political) reasons, without recognition of their differing business situations and organizational competencies (Ward&Pappard, 2004). The strategic IS are designed centrally and rolled over to the SBU, so that the approach to corporate strategic information system planning could be identified as an incremental one (Salmela&Spil, 2002). Overall IS strategy focuses on the integration of existing IS within SBU’s, as well as external integration with wider value chain partners (SCM) with the aim of supporting both the cost leadership and differentiation strategy. Analysis of IS Procedures and Practices Porter and Miller (1985) assert that management of information systems can no longer be the sole province of the EDP function such as accounting and record keeping, focused on cost control and reduction. The use of advanced information systems in value chain activities allows companies to enhance competitive differentiation as well as attain cost leadership and consequently gain sustainable competitive advantage. In other words, the ability to pursue cost reduction and differentiation simultaneously should be a criterion for IS utilization. Earl (1998) asserts that IS must have the potential to be a strategic weapon in at least one of the following: (1) gaining competitive advantage; (2) improving productivity and performance; (3) enabling new ways of managing and organizing; (4) developing new businesses. These views suggest that the utilization of IS in strategic and managerial activities is more important than their use in operational contexts (Soo, 2002). The following part of this paper analyzes and critically evaluates the company’s practice in addressing the issue of low internal and external integration of its information systems and its negative impact on upstream and downstream value creation. Internal Value Creation The company has consistently tried to enhance its business efficiency and effectiveness by reassessing its internal business operations such as purchasing, warehousing, materials management and distribution. This has involved using techniques such as Manufacturing Resource Planning (MRPII) and Just-In-Time (JIT) to improve internal value chain effectiveness and efficiency. The company has implemented its major ERP system (SAP R3) in early 1990’s (comprising FI, CO, HR, MM, SD and other modules). The company achieved relatively high internal integration of the processes within the company’s value chain towards the end of 1990’s. However, after takeover by MNE, many non-integrated applications were implemented replacing SAP’s existing functionalities (e.g. for sales, Cost controlling, etc.), as the parent enterprise had implemented SAP only to a limited extent. The situation for the company represents a step back in their internal integration efforts for sake of uniformity of the group IS. The major barrier towards full internal integration of the company’s information systems therefore represents the variety of applications used for different processes. This shows poor strategic information system planning (SISP) at MNE level, in the context of a fast growing group (through external acquisitions) where IS was considered not a strategic weapon, but rather an operational information processing tool. The cost versus value added quantification of IS integration has been problematic (topic is beyond the scope of this paper). Moreover, the integration of IS in the context of MNE has the additional dimension of intra SBU/corporate integration, which is considered a major issue at the corporate level.
The clear decision on the major platform for integration has still not been taken, but a feasibility study undertaken by a team of internal and external experts has shown that the most beneficial medium-term solution lies in building the data warehouses on the top of existing applications ensuring the gathering, integration, storing and sharing of the available information for users. Moreover, historically strong focus on internal value chain integration reduces opportunities of whole value chain in which the company operates for cost savings and leads to duplication of effort, maintenance of redundant systems, and investment in inefficient processes such as manual entry of data when machine sources are available.
1713
External Value Creation The company is in today’s highly competitive global market place required to reassess its business operations and examine both internal processes and external linkages with business partners to satisfy the changing needs of their customers, react to the actions and new business models of their competitors and opportunities afforded by new technologies (Chaffey, 2002). Therefore the process of re-engineering the whole supply chain and examining the linkages between internal and external functions has started at MNE level. The project is facilitated by an external consultant company and comprises a wide range of information systems applications on both the supplier and customer sides of the value chain. The major part of the report will analyze the external upstream IS integration. The company moved from the first phase of Interorganizational information system (IOS) development (Shore, 2001), where paper copies of purchase orders, bills and invoices represent most of the information flows over the last decade. The company currently processes purchase orders and invoices as well as provides its customers with order status, pricing enquiries and scheduling transactions via Electronic data interchange (EDI) using value added network (VAN) and heading towards the third phase of IOS development where there is integration between information management systems of the company and the Web (Shore, 2001). The company is now in process of integrating its current applications into Enterprise Resource Planning (ERP) systems (Haiwook, 2001).
The major barriers towards the smooth integration in the company are both poor internal integration of applications used for different processes, and lack of industry standards (supplier and customers using variety of different systems), making value system management difficult. Upstream Value Creation using Integration of IS Contribution of the company’s practice in respect of IS improvements towards their higher integration is analyzed and critically evaluated using an example of systems integration of the company and its packaging materials supplier. The targets of the project called Supply Inventory Management (SIM) were defined as follows: increase forecast accuracy and delivery performance, reduce supply chain planning cycle time, synchronize inventory supply/demand schedules, automate inventory replenishment, proactively identify and resolve exceptions, eliminate unnecessary administrative burden and drive continuous improvement with integrated intelligence (Zuckerman, 2005). The Project is part of the wider MNE group movement CSC aiming for building collaborative supply chain system based on utilization of synergies from information sharing via integrated supplier/customer information systems. Cost Reduction The presented project contribution towards the cost leadership could be found in improved planning processes, where the information about demand is shared with the supplier. In particular the sales information system of the company is providing demand level information based on booked orders from the company’s final customers. This information is combined with the company’s SAP MM module information on standard consumption of packaging materials. The transfer of information is supported by an Extended Mark-up Language (XML) standard. The solution provides the intelligence feature of automatic safety stock levels calculation which, in combination with current stock levels of packaging materials (as per MBP MM SAP module), enables automatic planning of replenishment of packaging materials. The cost benefit therefore at this stage comes from replacing non-integrated (mainly human, excel based) planning processes with automatic system based processes, saving administration costs (headcount, paper, etc). In addition, it eliminates redundant planning processes (on the supplier side, as the system is providing plans based on shared data from the company). The accuracy of plans also increases, as well as planning flexibility where automatic changes are executed following the changes in final customer demands. The cost benefits are shared though between both parties involved.
The intelligence features of the new systems enable the trigger of automatic ordering process, once inventory level reaches the predefined floor. Based on production planning data it then generates the optimal order quantity by item. The tentative or real electronic order report is generated and fed into the suppliers SD SAP module. The system therefore recognizes whether the delivery is to be made at a specified date or just held available as part of supplier’s stock (supplier managed inventory). Subsequently, automatic order procedure is executed on the side of both the company’s and the suppliers’ MM or SD modules with updates of all relevant ledgers. No manual input is needed for standard items representing as much as 98% of transactions. Major direct cost savings impact of

1714
the automatic ordering process is in administration (no paper orders, no confirmations by human, headcount reduction, accuracy). These intelligent data sharing system features provide the opportunity for supplier inventory management (SMI) where it eliminates reasons for buffer stock on the company’s side (responsibility is based on SLA on the supplier), and also enables the optimization of stock levels on the suppliers’ side, based on accurate and timely information on demand for packaging material. The new quality of data exchange enables management of the consignment inventory model. The cost savings are therefore in working capital reductions, lower storing and ordering costs for both parties. Moreover, the financial part of standard packaging delivery procedures (invoicing and settlement are also covered by the SMI project. Invoicing process is triggered by the company’s SAP MM module information on consumption of an item (i.e. customer does not own any packaging materials at all). The invoices are electronic, issued based on SLA prices agreed per period without human confirmation (except discrepancies identified by SAP), where automatic updates of AP and AR ledgers are ensured by SAP on both sides. Payments are processed based on automatic procedures, where both companies share a cash pooling system facilitated by an electronic payment system. The new level of systems integration enables indirect savings in the area of financial processes (lowering outstanding balances of AP/AR leading to improved working capital and cash flow and lowered administration costs of maintaining AP/AR ledgers). Other Sources of Differentiation Advantage The new level of systems integration enabling better information exchange between both partners within the industry supply chain also supports the differentiation advantage of the company’s both partners. More specifically, improved production planning enhances better utilization of production capacities, and increases the flexibility (volume and time) of the supplier. Resulting shorter lead times and improved delivery accuracy, enables the company to react to ultimate customer requests more promptly therefore creating differential advantage. The quality of final products is enhanced due to lower rate of human based errors in the processes and improved planning and control mechanisms implemented, as well as enhanced quality of service received from supplier (due to the company being perceived as a good customer). Supplier power is being decreased as they share common benefits from closer co-operation, however their switching costs are increased, balanced by opportunities for additional revenue creation. In addition, the upstream value chain analysis and subsequent restructuring identified the possibility of eliminating an intermediary from the chain. The new model, using extensive information exchange in real time with intelligent features, reduced the value added of this value chain component dramatically. The elimination of the intermediary meant exclusion of its margins from the chain as well as reducing total lead-time, making the supply chain it less costly and more flexible. The targets fully support the cost (business process re-engineering eliminates redundancies, improves/streamlines processes and increases their transparency, and enables stock level reductions on both the company and supplier side, automation of human based processes, brings less administration and errors) as well as the differentiation competitive strategy (shorter lead times, higher flexibility, knowledge sharing). This information sharing has allowed the company and the supplier to improve operational efficiency and has resulted in substantial benefits. The company has reduced stock-holding costs by about SKK 20 million and improved stock management. The supplier has benefited by increasing service levels and thereby increasing sales by up to SKK 2 million per annum.
Unfortunately, quantification of targets has not been performed and evaluation/monitoring/control mechanisms are not established. Downstream Value Creation using Integration of IS Sales and Marketing functions are fully centralized at MNEi level, therefore the company has very limited chance to influence the ISPS used to integrate our systems with downstream value chain. The CSC project at MNE level is aiming to improve the integration of internal value chain with the major customers, however it is still in its planning stage. The project is still very much focused on integration of IS among SBUs and corporate level. The successful internal integration is a necessary precondition for the next stage of integration. The competition moves are signaling the establishment of a strong alternative industry value system, based on downstream vertical integration of a major manufacturer with a major merchant company. The manufacturer aims to achieve advantages from being closer to its customers. This acquisition provides the manufacturer with excellent distribution network fit in terms of additional geographical market coverage, as well as access to IS expertise of this

1715
distributor. The integration of the merchant company into existing manufacturer structures and information systems will be crucial and will shape this industry in Europe. Following Porter’s (2001) argument SCM and CRM are starting to merge, as end-to-end applications involving customers, channels and suppliers, link orders to manufacturing, procurement and service delivery. This situation represents a major challenge for MNE. There are several options open to respond to this competitor move: to build up an alternative competitive supply chain, follow the move and acquire a similar distributor, or enter into a collaborative relationship with other players (or even the abovementioned manufacturer) and further develop and share benefits of a unified distribution channel. In any case IS will play an important role regardless of what path MNE selects. While it is more dangerous than ever to ignore the power of IOS, it is even more dangerous to believe that on its own an IOS can provide an enduring business advantage (Keng Siau, 2003). Keng Siau also suggests that new competitive philosophy should be: to compete on the use of electronic tools not on their exclusive ownership. This represents value creation proposition that might match the competitor’s move – eliminate the merchants from the value chain by building an end-to-end customer IS based on internet technology that would save costs, generate value and increase flexibility of the chain.
Application of network-based coordination and optimization are the collaborative process-outsourcing possibilities available when enough members are connected to the network (Christiaanse, 2005). Opportunities to optimize transportation and logistics arrangements are presented by MNE’s alliance with logistic companies, which capitalize on expertise of the partners. Basis for collaboration is utilization of IS and infrastructure (Cross Docking Centers, Warehouse Management Systems, etc). Detailed analysis of the project is beyond the scope of this paper.
Conclusion The company became part of MNE competing on global markets within global industry value chain with strong competition. The resources used by competitors are to high extent similar (technology, people, money); difference makes how those resources are employed/managed. Nowadays financial markets are looking at a broader picture in order to understand the perspectives of businesses that are often not obvious from its financial statements. Intellectual capital that includes company information systems management abilities is often the distinguishing factor of perspective and profitable companies and drives companies’ value (Couger, 1995). IS at the company has been traditionally focused on supporting internal efficiency. Firms must have trusting long-term relationships with each other and with the B2B marketplace itself to allow members to penetrate this deeply into each other’s internal business processes. IS potential to generate value is in inspiration, creation and support of collaborative value networks rather than reducing internal data processing costs. The company realized the challenge and is moving in the right direction in terms of integrating their IS into the changing industry value chain to generate additional value for all stakeholders.
References [1] Ahituv, Niv, (1980). A Systematic Approach Toward Assessing the Value of an Information System, MIS
Quarterly, Dec80, Vol. 4 Issue 4, p61 [2] Akkerman, H. A., Bogerd, P., Yucesan, E., & van Wassenhove, L. N., (2003). The impact of ERP on
supply chain management: Exploratory findings from a European Delphi study, European Journal of Operational Research, 146(2), 284–301.
[3] Angeles, Rebecca, (2005). RFID TECHNOLOGIES: SUPPLY-CHAIN APPLICATIONS AND IMPLEMENTATION ISSUES, Information Systems Management, Winter2005, Vol. 22 Issue 1, p51
[4] Caldeira, Mário M; Ward, John M., (2002). Understanding the successful adoption and use of IS/IT in SMEs: an explanation from Portuguese manufacturing industries, Information Systems Journal, Apr2002, Vol. 12 Issue 2, p121
[5] Carter, Pippa, Jackson, Norman, (2004). For the Sake of Argument: Towards an Understanding of Rhetoric as Process, Journal of Management Studies 41:3 May 2004
1716
[6] Chaffey, D., (2002). E-business and E-C management, p. 208. England: Prentice-Hall. [7] Christiaanse, Ellen, (2005). PERFORMANCE BENEFITS THROUGH INTEGRATION HUBS,
Communications of the ACM, Apr2005, Vol. 48 Issue 4, p95 [8] Earl, Michael J.; Sampler, Jeffrey L., (1998). Market Management to Transform the IT Organization, Sloan
Management Review, Summer98, Vol. 39 Issue 4, p9 [9] Gefen, David; Ragowsky, Arik, (2005). A MULTI-LEVEL APPROACH TO MEASURING THE
BENEFITS OF AN ERP SYSTEM IN MANUFACTURING FIRMS, Information Systems Management, Winter2005, Vol. 22 Issue 1, p18
[10] Gerstein, M, Reisman, H., (1983). Startegic Selection: Matching Executives to Business conditions, Sloan Management Review, Winter 1983, pp. 33-49
[11] Gold, Andrew H.; Malhotra, Arvind; Segars, Albert H., (2001). Knowledge Management: An Organizational Capabilities Perspective, Journal of Management Information Systems, Summer2001, Vol. 18 Issue 1, p185
[12] Grant, R.M., (2002). Contemporary Strategy Analysis: Concepts, Techniques, Applications, 4-th edn., Oxford: Blackwell cited in Beardwell, I, Holden, L., Claydon, T., (2004), “Human Resource Management”, 4-th edn., FT Prentice Hall
[13] Greenstein, Marilyn M.; Ray, Amy W.. Holistic, (2002). Continuous Assurance Integration: e-Business Opportunities and Challenges, Journal of Information Systems, Spring2002 Supplement, Vol. 16 Issue 1, p1
[14] Gupta, A.K., Govindarajan, V, (1991). Knowledge Flows and the Structure of Control within Multinational Corporations, Academy of Management Review, Vol. 16, No. 4, pp. 768 – 792
[15] Haiwook, C., (2001). The effects of interorganisational information systems infrastructure on electronic cooperation: An investigation of the ‘‘move to the middle’’, Ph.D. abstract, Proquest digital dissertations, www.lib.umi.com/dissertations, accessed 13.3.2003. in Williamson, Elizabeth A.; Harrison, David K.; Jordan, Mike, (2004). Information systems development within supply chain management, International Journal of Information Management, Oct2004, Vol. 24 Issue 5, p375
Contact authors for full list of references.

1717
High-Speed Broadband and Global Competitiveness
Ruben Xing, [email protected] Robert W. Taylor, [email protected]
Montclair State University, USA
Abstract While the United States is both a military superpower and the world’s top economy, it is losing the race to Europe and East Asia in developing high-speed broadband. While the United States has a substantial number of broadband subscribers, it is mostly in “basic” broadband which is too slow to run the many innovative applications necessary to maintain economic competitiveness. East Asian countries, particularly, are moving quickly to harness the economic benefits, the increased productivity, and the better quality of life that high-speed and ultra high-speed broadband technologies offer their societies. This paper discusses how the United States is falling behind in offering high-speed broadband and compares its lagging performance to the successes of countries such as Japan and South Korea. It concludes by stating that future economic and country competitiveness could well be determined by the successful adoption of these new technologies. Introduction There were 216 million broadband subscribers in the world in early 2006, approximately half of the total number of the world’s internet subscribers, while there were 60 million mobile broadband users worldwide, only three percent of total mobile users. Figure 1 shows the development of broadband networks worldwide and the percentage breakdown in different regions of the world. But, the number of subscribers of broadband is a misleading indicator of broadband use. For instance, the United States has the highest number of world broadband subscribers, but when that number is compared to broadband penetration per 100 inhabitants; it is not even in the top ten countries. Countries such as Japan, South Korea, Italy, and Sweden had a far greater broadband penetration rate. Also, the type of broadband available in most U.S. households is “basic”, among the slowest, most expensive, and least reliable form of broadband. And, the U.S. is falling way behind Japan and South Korea in providing fast, cost-effective wireless mobile broadband. What is at stake is just not just the “bragging rights” to global innovation and technology, but something much more important, a country’s ability to compete economically in the 21st century.

1718
FIG. 1: SOURCE: DIGITAL LIFE ITU INTERNET REPORT 2006
High-speed broadband is fundamental to economic competitiveness. Many of the 21st century business
sectors that are positioned to greatly expand are tied to high-speed broadband infrastructure capability. Health care, entertainment, increased business service productivity, communications are but a few of the business sectors affected. The questions to ask are: How did the U.S., a leader in the development of the internet in the 1990’s lose its innovative edge in high-speed broadband? How did countries like Japan and South Korea take the ascendancy in this technology? And lastly, how can the United States compete in high-speed broadband.
Broadband Impacts and Global Transformations Broadband technologies are all about freeing people from having to be connected with regular telephone lines or cables, and letting them have speedier data connections than they ever imagined. The so-called high-speed Internet encompasses all evolving high-speed digital technologies that provide consumers integrated access to voice, high-speed data, video-on-demand, and interactive delivery services, are a fundamental component of the communications revolution. The current broadband services are listed in Table 1.
Development of broadband networks worldwide: 1999-2005 by region, 2006

1719
TABLE 1: CURRENT BROADBAND SERVICES Service Description Bandwidth
X.25 Packet-switching standard that packets of 128 bytes Up to 1.544 Mbps Frame relay Packages data into frames for high-speed transmission over
reliable lines but does not use error-correction routines Up to 1.544 Mbps
ATM (asynchronous transfer mode)
Parcels data into uniform cells to allow high-capacity transmission of voice, data, images, and video between different types of computers
25Mbps~2.5Gbps
ISDN Digital dial-up network access standard that can integrate voice, data, and video services
Basic Rate ISDN:128Kbps; Primary Rate ISDN:1.5Mbps
DSL (digital subscriber line)
Series of technologies for high-capacity transmission over copper wires
ADSL-up to 9Mbps for receiving and up to 640Kbps for sending data; SDSL-up to 3 Mbps for both sending and receiving
T1 Dedicated telephone connection with 24 channels for high-capacity transmission
1.544 Mbps
Cable modem Service for high-speed transmission of data over cable TV lines that are shared by many users
Up to 4Mbps
Broadband brings a considerable number of benefits (Table 3). A fully-evolved broadband will virtually eliminate geographic distance as an obstacle to acquiring information, and dramatically reduce the time it takes to access information. Also, a country’s economic competitiveness is highly correlated to the diffusion of broadband. This phenomenon is often referred to as the “digital divide.” In the International Telecommunications Union’s analysis of high income nations and broadband, it was found that 86% of world broadband users were located in high income countries, a far greater relationship than between internet use and income. This is not difficult to understand as only high income countries have the economic capacity to develop the extensive infrastructure necessary for high speed internet; at least, using today’s technological platforms. But, a number of interesting events are occurring that could significantly after this relationship and boast some countries while other nations could decline. First, the U.S. while a global economic leader is losing its capacity to lead in high-speed broadband which could jeopardize its economic leadership. And second, developing countries, with the proper leadership and national policies could utilize newer, less costly technology to “leapfrog” over the first generation of broadband which was dependent on existing built infrastructure, giving richer countries an advantage. These newer technologies, such as WIMAX, could “jump-start” these economies and make them significant competitors in the global economy.

1720
TABLE 2: MAJOR BROADBAND BENEFITS What can broadband benefit your business
� Broadband can increase productivity by enabling the transfer of large data files directly from local offices to head offices located in other cities, or even other countries.
� Employees can access better training opportunities using broadband by logging on to corporate intranets and the Internet to train for new product offerings or to refresh their knowledge on current products or services.
� Businesses can use high-capacity Internet to track shipments and to seek out other export markets, enabling them to compete successfully with markets outside the province.
� Newspapers, or graphic design firms, that want to keep their business in a rural community can use broadband to send and receive large data files needed for production.
� Broadband allows businesses to conduct net-meetings or face-to-face meetings using videoconferencing to discuss urgent decisions, minimizing travel costs for in-person meetings.
What can broadband benefit your schools
� Broadband connects music students in northern Quebec to violin lessons with musicians in Ottawa using live videoconference.
� Students in rural and remote communities can easily surf the Web to visit virtual museums.
� Broadband allows students to develop and post original music and video for school projects online.
� High-capacity Internet allows teachers to take advantage of many online resources and integrate them into everyday classroom activities.
What can broadband benefit your municipal government
• Broadband enables a technology-based customer service centre that allows a one-stop shop for town business transactions, including licensing, billings, permits and utilities payments.
What can broadband benefit your community
� Broadband can increase tourism opportunities by enabling online marketing resources to promote local and historical attractions. It also allows for online reservation systems.
� High-capacity Internet brings a larger audience and buyers to local artisans and craftspeople, allowing them to promote and sell their work via the Internet.
� Aboriginal communities can accumulate and disseminate their cultural information without the connectivity limitations they now face.
� Broadband can help ensure that families, businesses and young people in rural and remote areas are not forced to leave in order to find an economic or social future elsewhere.
What can broadband benefit agriculture
� Commercial farming operations can use broadband to network and connect barns, enabling the transfer of data between them using wireless communication.
� Custom crop spraying operations for grain producers can use broadband to enable voice communication and data transfer to and from operating units and equipment.
� Broadband can connect livestock farmers with workers in the fields, family at home and other operations using a wireless communication network.
� Information about the farming industry, growing conditions and animal health is more easily accessed with high-capacity Internet.
� Broadband opens up opportunity to access larger markets and expanded marketing channels.

1721
The Recent State of Broadband in the World According to Business Week, South Korea, Japan and some other nations or regions such as Canada, Singapore, Hong Kong, Taiwan, Belgium, Iceland, and Denmark have quickly adopted policies to promote broadband years ago. In contrast, no U.S. administration has yet endorsed a comprehensive plan. While the United States has the worlds highest number of broadband subscribers it is not even in the top 15 countries in the world when viewing broadband penetration (See Figure 2).
FIG. 2: SOURCE: DIGITAL LIFE ITU INTERNET REPORT 2006
Currently, the U.S. phone companies sell 500K bit per second to 1 megabit digital subscriber line (DSL)
connections for around $20-30 a month, and the cable companies offer cable modems with maximum speeds of 3 megabits for $40-$45 a month. Broadband is available to 89% of all U.S. households, but only 28% subscribe today. While the Europe’s speeds and penetration are similar to those in the U.S., in South Korea, the recognized world’s broadband leader, there are 73% of households subscribe to high-speed Internet. Most Koreans pay $27 a month for a connection speed of up to 3 megabits. A few thousand choose to pay $52 a month for a 20-megabit advanced DSL (ADSL) connection which is much faster and cheaper than anything available to Americans. Japanese can get some of the fastest and cheapest broadband service in the world up to 26 megabit for about $30 a month. Figure 3 shows the relationship between prices and bandwidth. In Japan, for instance, a broadband user can buy 100 kbit/s for 7
Top 15 economies (both fixed line and mobile), ranked by total number of subscribers and penetration rate, Dec. 2005

1722
cents (U.S.) while in the United States this same amount of broadband will cost 49 cents, seven times as much. The ability of countries such as South Korea and Japan to bring to their citizens high-speed internet at reasonable rates will provide these countries a significant competitiveness in economic activities that demand high-speed connections, i.e. high definition television, video streaming, etc.
FIG. 3: SOURCE: DIGITAL LIFE ITU INTERNET
Lowest Prices for Broadband per 100 kbit/s per month, April 2006 and change 2005-2006

1723
Figure 4 compares broadband usage at home in different countries.
. FIG. 4: BROADBAND USAGE AT HOME
Source: NetRatings Table 3 summarizes the current status of U.S. broadband deployment:
TABLE 3: THE CURRENT STATUS OF U.S. BROADBAND DEPLOYMENT Services Deployment Status
Subscribership To Advanced Services Providing Connections To The Internet
At speeds exceeding 200 kbps in both directions has more than tripled since the FCC’s last report, from 5.9 million lines in June 2001 to 20.3 million lines in December 2003
High-Speed Lines Providing connectivity of more than 200 kbps in at least one direction has almost tripled from June 2001 to December 2003, from 9.6 million lines to 28.2 million lines
Cable Modem And ADSL Service
Providers provide the vast majority of advanced services lines, with cable representing 75.3 percent, ADSL representing 14.9 percent, and other technologies representing 9.8 percent in December 2003. The relative position of cable and ADSL was 56 percent and 16.8 percent at the time of the last report, in June 2001
Further Plans On High-Speed Lines, Cable Services
Looking more broadly, the service represented 58 percent of lines, with ADSL representing 34 percent of lines as of year end 2003.
Advanced Lines Service For Residential And Small Businesses
In December 2003, there were 18.1 million lines serving residential and small business customers, compared to 4.3 million lines in June 2001. The number of high-speed lines for residential and small business subscribers more than tripled, to 26.0 million in December 2003, from 7.8 million in June 2001.
Overall Figures As of December 2003, only 6.8 percent of zip codes in the U.S. reported no high-speed lines, compared to 22.2 percent of zip codes with no reported lines in June 2001. There also has been a steady growth in the percent of zip codes reporting four or more providers of high-speed lines, from 27.5 percent in June 2001 to 46.3 percent in December 2003.
Source: FCC

1724
The State of Wireless Broadband Broadband technologies started with digital cell phones a decade ago, and now have exploded into panoply of radio technologies – from wireless local area networks (WLAN) to smart antennae, ultra-wide band transmission and mesh networks. The 802.11b (Wi-Fi) standard created an entirely new market for wireless networks during the depth of telecom’s worst recession and the time when the broadband Internet started booming. Wireless Internet networks are being deployed to previously underserved areas and are creating new competition for cable and DSL. According to Telecommunications' Future 2003-2008, analysts at Insight Research Corp. predict that the market for products and services based on the 802.11 specification will grow from revenue of $7 billion this year to $44 billion by 2008. Table 4 provides a landscape of current broadband wireless services. Fiber Connections in the U.S. As another major broadband communications channel, fiber-to-the-home (FTTH) is beginning to make significant strides in some parts of the world, and the United States also lags far behind, according to a new report by In-Stat/MDR (Scottsdale, AZ). In Korea, Sweden, Japan, and Italy — strong residential FTTH deployments are already underway. In the United States, FTTH is a small percentage of the total broadband business market, registering under 1%. North America accounts for roughly 50,000 subscribers, while Asia-Pacific and Europe account for 390,000 subscribers. The high cost is a hurdle. Currently, the monthly cost of getting high-speed voice, video, and data access over fiber in the U.S is around $130. In the future, the subscriber will be able to purchase the entire package for less than $100, which is what most customers are paying now for high-speed Internet access, voice, and video. Figure 5 compares fiber connections between the U.S and other countries.
TABLE 4: WIRELESS COMMUNICATIONS LANDSCAPE Broadband
Wireless LAN – WLAN
Services Ranges Tech Features
Wireless Fidelity (Wi-Fi) 802-11b
Most mature and widely deployed worldwide. It’s popular within enterprises and for remote access in hotspots
Uses DSSS radio transmission with 2.4GHz band, max 11Mbps speed/375ft
802-11a Has existed on paper since 1999. Real products began shipping in 2002. Supporting higher end applications
Uses DSSS radio transmission with 5GHz band, max 54Mbps speed/300ft
802-11g Backward-compatibility with 802-11b. Moving forward as a strong interim solution
Uses 3 incompatible modulation tech with 2.4GHz, max 54Mbps
802-11e To build quality of service for 802-11x so that they can support voice and video.
Works as 802-11a, 802-11b and -11g
802-11i To further secure and modify 802-11 includes two main developments: Wi-Fi Protected Access (WPA) and Robust Security Network (RSN).
Modified 802-11a and 802-11b with more secured features
802-11h Being developed. A modified version of 802-11a to extend use in Europe
Extended 802-11a
802-11n Starting Aug/2004, World Wide Spectrum Efficiency (WWiSE) use 4x4 MIMO channels to increase throughput – aimed to replace current 802.11/a/b/g
200 ~500Mbps at 40Mhz, support 802/11a/b/g at 20Mhz
Bluetooth A wireless personal area network (PAN) transmitting digital voice, data between mobile devices
Max 1Mbps/33ft
Mobile Broadband Services Ranges Tech Features

1725
Wireless Access WiMax (802.16) New generation of BWA. It is designed for mobile clients
using PDA or laptops. 7 times faster than Wi-Fi/30 miles with 2~6 GHz bands
802.20 Another broadband wireless standard, this time aimed primarily at mobile users. The standards have been looking particularly closely at the way it works with 802.11. It is designed to deal with high-speed mobility issues, and a direct competitor to 3G
Deliver around 1Mbps to devices on fast move at speeds of up to 250kph, with 3.5GHz bands
Fixed Broadband Wireless Access
Services Ranges Tech Features
Fixed broadband Wireless Web
Alternative to wired broadband like DSL, cable modem, to access the Internet using wireless computing devices
Max 1Gbps/ 35miles
Mobile WAN Services Ranges Tech Features 2G digital cellular Transmitting data, voice using wireless digital cellular
technology Max 14Kbps/ Nationwide
2.5G digital cellular With improved speed accessing e-mail and Internet using wireless digital cellular technology
Max 384Kbps/ Nationwide
3G digital cellular With improved speed transmitting multimedia data and voice using digital cellular technology
Max 2Mbps/ Nationwide
i-Mode Using ‘smart’ cell-phone to access Web-based services with cHTML (developed by NTT DoCoMo)
Max 384Kbps/ Nationwide
Wireless Access Protocol (WAP)
Using cell-phone, and other wireless devices to access Internet with WML and micro-browser
Max 384Kbps/ Nationwide
FIG. 5: COMPARING WORLDWIDE AND U.S. FIBER SUBSCRIBERS

1726
Why U.S. High-Speed Broadband Has Fallen Behind? U.S. high-speed broadband has lagged behind other countries mainly due to the narrowed ranges of spectrum and interferences of useful frequencies. Demanded spectrum and frequencies for broadband communications are governed tightly by the Federal Communications Commission (FCC). These technical limitations are major curbs of broadband development in America. These technical regulations were established over 70 years ago for the purpose of separating broadcasting channels, thereby protecting them from competing neighboring stations. These limitations have produced an atmosphere of protectionism that has maintained itself into the present. Technically Speaking Today, a radio is more likely to be a piece of software burned into a digital signal processor chip hopping from channel to channel during a nanosecond, while seeking gaps through which to send bursts of data. The channels of current broadband to communicate can be crammed with no buffer zones between them. Also, when such adaptive digital radios are allowed to co-operate with one another, the network’s capacity can actually increase – rather than decrease, as was long believed with every new radio added. Therefore, the interference is irrelevant, and bandwidth, as a measure of communication capacity – is also irrelevant. So we believe that the biggest problem inhibiting broadband in the U.S. is the habit of reserving various radio bands for specific services. Historically, that made sense when it was hugely expensive to build radios that could be turned to more than a few adjacent bands. Today, digital radios that can dynamically jump all over the spectrum are to be had for the price of a microchip. What Is the Holdup? As explained above, the so called spectrum and frequency interference are not the reasons blocking the faster broadband speeds. The faster broadband speeds in other countries are less about technological prowess, and more about policy. A clear case is shown in both South Korea and Japan where the national government made the deployment of broadband services a national priority. South Korea deregulated what had been a monopolistic phone system and opened the market to competition. That stimulated a race among providers to wire up the nation quickly. Moreover, those countries are more densely populated than U.S. which has made broadband deployment much easier and cheaper.
In the U.S., in addition to larger territory and population in the country, there are not sufficient broadband services and applications provided, such as online movies, concert or games that need higher speeds. More importantly, the conserved development is largely confined by U.S. telecommunication regulations. For instance, the Bells, the major U.S. broadband technology developer complain that archaic rules designed for traditional telecoms services rather than the Internet, curbed and discouraged them from providing faster DSL services. They further argued that those rules are ambiguous because a different set of overlapping regulations still requires them to share their lines with rivals at government-mandated prices. So far, the U.S. is not having a comprehensive and strategic broadband plan. The U.S. Congress is unlikely to force politically powerful Bells to share their networks, even through lawmakers are expected to rewrite the telecom industry’s regulations next year.
Another hitch for moving U.S. broadband quickly is that the best radio spectrum for wireless broadband isn’t available. It is being used by TV broadcasters for analog transmissions. American broadcasters have been given another set of airwaves, for digital TV, but they’re not eager to forfeit their freebie. (Catherine Yang, September 2004). U.S. broadband developers have complained that wireless broadband is currently being allocated on the wrong spectrum, hampering the growth of the technology, according to former Federal Communications Commission (FCC) chairman Reed Hundt (Roy Mark, April 2004). The problem is said that wireless broadband is being designed where the radio frequencies are very high, and as a result, the radio waves cannot penetrate buildings. This rule was defined in the Telecommunications Act of 1996, and the U.S. congress needs to change this rule before this problem is solved.
The major barriers to U.S. high-speed broadband are both technical and political. In 2006, 30 million American homes and offices have signed up for basic broadband, which is much slower, costly, and less reliable. While the Telecommunications Act of 1996 was designed to open up residential telephone lines to competitors, the regional telecoms have lobbied congress and sought court decisions to reduce competition. Americans connect to the internet mostly through either cable or DSL. It has not been in the interest for either cable companies or telecoms to
1727
support this new technology. Cable companies look at internet television as a competitor to their cable television franchises, and telecoms look at the possible competition from VOIP telephony. Usually, in the policy making area, when there is no national policy, to promote high-speed broadband, as in the case of the United States, it means that there is a policy to protect the existing companies from competition. The loser is the customer and the overall capacity of the American economy to maintain its leadership in the global economy. Broadband Policy of Japan and South Korea It is ironic that the United States, a country that prides itself on supporting the free market and opposing protectionism, is in the position of placing regulatory and license barriers to slow down high-speed broadband development. In contrast, the successful broadband rollout in South Korea and Japan had only minor technical breakthroughs, and no massive governmental subsidies, but had a clear national policy put in place by their governments. They forced the incumbent phone companies to let startups use their networks at reasonable, government-set prices. Startups such as Hanaro in South Korea and Yahoo! BB in Japan competed strongly with their giant rivals, driving speeds up and prices down. Competition created by national governmental policy created a level playing field which benefited the consumer and generated demand for content that stimulates economic growth.
The U.S. is even further behind Japan and South Korea in wireless, mobile-phone based broadband access. A notable success is the story of Japan’s NTT DoCoMo, which introduced the “i-mode” service that has provided the Japanese with instant email, financial services and internet access on a cost-effective basis to over 72 million Japanese. Tthe Japanese government has been instrumental in this success. In 2000, Prime Minister Yoshiro Mori appointed the Information Technology Strategy Council which put together a plan to bring high-speed broadband to 40 out of 46 million Japanese households. The government’s plan, through a public-private partnership, was to make cost-free spectrum available for each wireless upgrade, thereby supporting the new technologies, while maintaining protections for consumers. This policy has led to a quick transition to fourth generation “i-mode” phones which can support high-definition television; movie downloads, advanced gaming, and other multimedia applications. How to Catch the Rolling Ball? To have any hope of joining the world’s broadband vanguard, more deregulation is the key. The U.S. must create a viable third competitor (Catherine Yang, Sept. 2004). According to FCC, the U.S. aims to classify both the phone companies’ DSL and cable operators’ cable-modem operations as “information services”. The Commission recently adopted its fourth report on the availability of advanced telecommunications capability in the United States, and that advanced telecommunications capability is being deployed on a reasonable and timely basis to all Americans. (FCC News Report, Sept. 2004) FCC reported the significant development of new access technologies that has taken place. It highlights the growth in Wi-Fi Internet access hotspots, WiMax, third-generation mobile phones, personal area networks, satellite technologies, fiber to the home, and broadband over power lines, in addition to more familiar cable modem and DSL services. Recently, FCC also described the development of new Internet-based services, such as voice communications over Internet protocol (or VoIP).
Chief among these rival services, 802.16-WiMax looks most promising. It can extend broadband wireless over longer distances and at higher speeds than current Wi-Fi or Bluetooth systems. Its access range is up to around 30 miles (48 kilometers), compared to Wi-Fi's 300 feet (91 meters) and Bluetooth's 30 feet. It supports data transmission speeds up to 75Mbps (bits per second), compared to the popular 802.11b Wi-Fi standard's 11Mbps or the 802.11a's 54Mbps. In addition to its distance and speed advantages, WiMax doesn't require line-of-site transmission. Many experts expect WiMax service to be deployed in rural areas, where high-speed cable infrastructure is either poor or nonexistent. Some also see opportunities to use the technology for backhauling traffic between Wi-Fi hot spots, as well as for creating large wide-area hot spots.
The recent FCC reports demonstrate that the United States is making substantial progress in closing the gaps in access for traditionally underserved areas. Those in rural areas, those with low incomes, and those with disabilities – who stand in particular need of advanced services—are finding advanced services more available.

1728
Federal and State governments can provide other incentives to create a third rival. Government can attract broadband to populated regions without tax dollars by creating pools of local buyers – a measure Canada has adopted to reach its vast rural expenses.
At the same time, from the international point view, no nation is taking the lead in developing a coherent international broadband policy. There is no movement to a common global allocation of spectrum for wireless broadband, for instance. Yet communication is one area where there is a real opportunity for the US and Europe to convene an international forum that would articulate a rule of law for broadband technologies. “What is needed is a new, treaty-based WTO approach to the problem. It would set out a framework covering such matters as a precise definition of universal broadband service and appropriate timetables and target. National and regional measures would follow to ensure public or private funding and oversee implementation.” (Reed Hundt and Scott Beardsley, Dec. 23, 2004) Anyway, in order to catch up the global race for the next-generation Internet and the new businesses it can spawn, the key is the U.S. must make policy change and create vigorous competition to drive the low prices and high speeds in the country. The Future of High-Speed Broadband Over the next few years, broadband connections will go into the air, the home, the taxicab, and the all businesses (Gabriel Allan and Evan Schuman, Business Week, September 2004). Broadband will include a whole new suite of concepts. Those concepts will include everything from Internet security devices to audio and video, from video collaboration and file sharing to distribute computing and data storage. And the much-ballyhooed convergence of voice, data and multimedia also will be a factor. The future of communication is high-speed, wide-band digital with interactive data and voice,” says David Robinson, president of the Motorola broadband communications sector. “A company that offers principally video or data will be able to offer competitive voice. For the business user, that will mean more control, more variety and more choice.” The future of broadband offers great opportunities, as long as executives think about and plan for it in advance. Executives will have exciting new tools for sales, marketing, product development and other business tasks that can be enhanced or simplified by using broadband. But issues of security, robustness, pricing and coverage will continue to arise, and it’s important to watch the changing landscape.
While several broadband leading countries are offering up online digital content market which includes gaming, music, and video, most U.S. broadband providers are only just beginning to roll out services. The high-speed Internet connections running at speeds of 10 to 20 Mbps won’t become available to most consumers for at least three to six years, according to Walt Megura, general manager of Nortel Networks. Conclusion The high speed Internet with wired or wireless broadband will certainly leave no field untouched. While several Asia and Europe countries have quickly adopted and developed broadband, the U.S. lags behind the move. As Productivity growth and military power are now driven primarily by information systems, which are becoming heavily Internet-dependent, the broadband problem is becoming a major bottleneck in the U.S. and world economy. The cause is less about technological prowess and more about policy. Policymakers should make structural reforms in industry, policy, and the U.S. regulatory system. Appropriate measures include structural separation of switching, enhanced services, and data transport in the telephone industry; divestiture of content from transport in the cable television sector; mandatory open interfaces for interconnection; increased financial transparency and disclosure; and reforms in regulatory systems to increase their efficiency, high technology expertise, and political independence. In short, more deregulation is the key. A new era in the evolution of broadband is approaching, but it won’t happen overnight.

1729
References
[1] Adi Armoni “Internet2 – WWW”, Information Science, vol.4, 2001 [2] Blea, Thomas, “Down to the Wire,” Foreign Affairs, May/June 2005 [3] Charles H. Ferguson – “The US Broadband Problem”, The Brookings Institution, 2002 [4] Dutta, Amitava “Telecoms and Economic Activity” Journal of Management Information Systems 17, no.4
Spring 2001 [5] Gabriel Allan and Evan Schuman, “Broadband to Go” BusinessWeek, September 2004 [6] Grover, V. & K. Saeed “The Telecommunication Industry Revisited” Communications of the ACM 46, no.
7 July 2003 [7] Horrigan, John. “Internet and American Life,” Pew Internet Project, March 1, 2004 [8] Hunt, Reed & S. Beardsley “ Only Joint-up Policy Will Bring Broadband to All”, Financial Times,
December 23 2004 [9] International Telecommunications Union, “Digital.life: ITU Internet Report, ITU,2006 [10] International Telecommunications Union, “world Information Society, August, 2006. [11] Landon, Kenneth & Jane “Essentials of Management Information Systems”, Prentice Hall 2004 [12] Mark, Roy. “Wireless Broadband in Wrong Spectrum” www.internetnews.com/wireless, April 2004 [13] Scottsdale, AZ , “Market Report” In-Stat/MDR Research, January 2003 [14] Slashdot “US Holdup on Broadband” http://slashdot.org/articles/02/01/08/2012225.shtml, Jan. 2002 United States GAO, “Report to Congressional Committees, “Telecommunications: Broadband Deployment” May 2006 [15] Wigfield, Mark “FCC News Announcement”, September 2004 [16] Yang, Catherine “Behind in Broadband”, Business Week, September 2004

1730
E-Business Adoption in the SME’s: towards an Integrated Theoretical-Empirical Research Framework
Celestino Robles-Estrada, [email protected]
Universidad de Guadalajara, Mexico Mónica Gómez-Suárez, [email protected]
Universidad Autónoma de Madrid, Spain
Abstract This paper presents the results of an in depth analysis of 189 empirical published research papers between January 1996 and June 2006 focusing in the conceptualizing and measuring of e-business adoption; and develops an integrative research model for assessing the adoption of e-business in the SME’s at firm level. The model integrates and combines the key results of the 189 empirical studies reviewed, with the main theoretical models used to explain innovation adoption -the Innovation Decision Process by Rogers, the Technology Acceptance Model by Davis, Bagozzi & Warshaw, the Technology-Organization-Environment framework by Tornatzky and Fleisher-, combined with the Resource-Based Theory, to generate an holistic model that can be empirically tested to explain e-business adoption at firm level. It also integrates in the research framework an entrepreneur perspective since in some e-business studies entrepreneurship and e-business innovation have been connected. The proposed model is part of a theoretical-empirical research project aimed to explain e-business adoption in Mexican exporting SME’s.
Introduction The emergence of the Internet in the business world has affected Small and Medium Enterprises (SMEs) as much as it has large corporations. It was initially viewed as an extraordinarily powerful tool enabling small business to “level the playing field” when compared to larger firms (e.g., Hsieh and Lin, 1998; Zang and Vokurka, 2003). SMEs constitute a great part of the world industry and economy. This and the fact that they have special prerequisites concerning human and technology resources makes them an interesting research focus when looking at the transformation process toward e-business (EB) (Ihlström and Nilsson, 2003). While many small firms have pursued EB activities other have been reticent and slower to adopt these new technologies (Thong, 1999; Auger, Barnir and Gallaugher, 2003; Zang and Vokurka, 2003). This phenomena has led several researchers to study the adoption, use and value of electronic business in that way that adoption of EB has emerged into an active research area in the information systems (IS) discipline (Straub et al. 2002) as well as in the management and marketing disciplines. Nevertheless, most of the studies on EC and EB adoption were undertaken in USA and Europe. There are fewer studies from the Asia-Pacific region and almost none from Latin-American countries.
As the purpose of this study is to develop a model aimed to explain EB adoption by Mexican SMEs, two basic questions arise to get insight on EB adoption: what is e-business adoption? And what explains e-business adoption in SMEs? To answer these questions, three aspects of EB adoption serve as a background for this research: the obvious choice for a theoretical approach appears to be innovation adoption theory. In this line of research, a lot of knowledge has been gathered on conceptualizing innovation adoption, mechanisms of organizational innovation adoption behavior and related firm characteristics. However, in innovation adoption research it is generally assumed that the innovation, often a technological innovation, has stable, pre-determined features and is considered for adoption when the organization judges it to be beneficial to the business. Yet, EB is an innovation that is largely shaped by the adopting organization. After all, it is the organization that decides how to apply ICTs. Also it can be assumed that EB is about generating business and value creation. Innovation is not a goal in itself, but an instrument for a firm to achieve its (strategic) goals. ICTs are applied in order to create business. A second choice is to review the existing literature on empirical research dedicated to explain EB adoption. The review can give an overview of the existing body of empirical knowledge on e-business adoption in SMEs useful in the developing of a theoretical- empirical model aimed to explain EB adoption. A third choice has to do with entrepreneurship. In entrepreneurship

1731
literature, the instrumental role of innovations in creating business can be recognized. It was Schumpeter that pointed at innovativeness as the key ingredient to entrepreneurship (Schumpeter, 1934). As Drucker put it: innovation is the specific tool of entrepreneurs, the means by which they exploit change as an opportunity for a different business or a different service (Drucker, 1985). Technological innovation offers a multitude of opportunities for entrepreneurship. Apparently, some SMEs are very good at discovering and realizing Internet-based business opportunities (e.g. IDC, 2002) while others don’t.
Accordingly with the above mentioned, in this study, besides the empirical perspective, the phenomenon of EB adoption is considered from two theoretical perspectives, innovation adoption and entrepreneurship. In reviewing literature from both streams, it becomes clear that innovation and entrepreneurship have a strong relationship. Nevertheless, each perspective has its own view on seizing business opportunities offered by innovations, and emphasizes different aspects of business processes. These three aspects of the innovation literature will be used to develop an integrated theoretical-empirical research model aimed to explain EB adoption. Literature Review Review of EB Adoption Empirical Literature To find relevant academic publications, five multidisciplinary databases were used: Proquest, EBSCO, Web of Science, Emerald Collection and Science Direct. The following keywords were used: Internet, World Wide Web, electronic commerce, electronic business, in combination with the keywords: adoption and use. A was conducted search for studies published between 1996 and June 2006. This time span was determined by two considerations. First, 1996 was the first year in which several academic articles were published concerning the adoption of the Internet (using the aforementioned search engines). Second, the 1st of June 2006 was set as a practical limit to the search so as to enable analysis. Studies focusing on consumers were omitted In addition to the Internet search results a number of relevant refereed Publications were used, which were either cited in references in the publications found or given to as by colleagues. In total, this procedure yielded 189 studies1. There is no guarantee that the review of existing literature from this time span is complete. However, the search engines used safeguard the inclusion of publications on this topic in the most relevant journals. In the studies under review, EB adoption is conceptualized from various viewpoints. Some authors look at the type of applications that are used to characterize EB adoption. Others investigate the value of EB and how this is achieved or the intensity with which applications are used. In most studies a combination of aspects or features is used to obtain a characterization of EB adoption.
Seven dimensions of e-business adoption were found: – Activity. An activity-based aspect offers insight into the way that the company is supported by ICT.
Usually, several business processes are listed, such as sending purchase orders to suppliers or offering information to customers. This dimension of adoption was frequently applied in the studies examined (113 out of 189).
– Application. In these studies, adoption is measured by the use of certain applications such as e-mail, www, website, Intranet etc. in the company. Sometimes, the variable of adoption is a dichotomous variable referring to the adoption or non-adoption of only one application. Many of the studies (112 out of 189) focused on an application-based measure of adoption.
– Value creation. Another category of studies characterizes adoption based on the value that the use of Internet-based applications has for the business. Usually, the respondents are asked about the actual or perceived benefits gained by using e-mail, the Internet or the World Wide Web (for example Daniel & Grimshaw, 2002).
– Intensity of use. In this category, measures represent some sort of intensity or frequency: how much, how often or how widespread is the innovation being used? For example, the number of times per day that the Internet is used (Teo, Lim & Lai, 1999) or the number of departments with an Intranet application (Eder & Ibaria, 2001).
– First time of use. A classic measure of diffusion is based on the notion that it is possible to classify organizations into adopter categories, based on the point in time when they adopt the innovation relative to

1732
other organizations (Rogers, 1995). For example, Cockburn and Wilson (1996) investigate the number of years a company has access to the Internet. The measure can also be used internally in organizations to measure diffusion (for example Eder & Igbaria, 2001).
– Stage of development. In only a few studies (42 out of 189), researchers assess the adoption of Internet using a stage or level of development model. This is in contrast with literature on the Internet or e-business strategy, where the use of multi-stage business models is very common to characterize companies and their use of the Internet (for example Fischer, 1998; Venkatraman & Henderson, 1998; Amit & Zott, 2000; Earl, 2000; Timmers, 2000).
– Other. Most studies surveyed fall into one or more of the previous categories, apart from a few exceptions. A noteworthy example of such an exception is the study by Cockburn and Wilson (1996), later continued by Ng, Pan and Wilson (1998) and Greaves, Kipling and Wilson (1999), who also characterizes the adoption of the World Wide Web by the cost of maintaining the company’s website. Many of the studies investigate the adoption of the Internet or the World Wide Web in business. This is
usually limited to assessing the functionality of the company’s website, or the support offered by the Internet for a list of business activities or processes. To describe EB adoption many authors rely on measures from various viewpoints to obtain a richer picture of the phenomenon. In doing so, most authors pass over the conceptualization of their subject of study, and focus on operationalization. Consequently, most studies are clearly empirical observations and do not offer conceptual or theoretical contributions. Among the 189 studies in this survey, 47 focus on explaining the adoption of electronic business2. These are surveys as well as multiple case studies. Nine studies aim at explaining adoption on the individual level and the others focus on firm level. A large variety of variables and their relation to e-business adoption have been investigated. The determinants of adoption or use can be roughly divided into two categories: perceived innovation characteristics, and adopter characteristics.
We also investigated the way in which EB adoption is explained. In 26 of the 47 studies under investigation, the authors’ objective is to explain the adoption of ICT technologies. The use of perceived innovation characteristics to explain e-business adoption clearly prevailed in the studies reviewed. In addition, adopter characteristics or network influences were used as explanatory variables. We classified the explanatory variables used into three main categories of explanatory variables. For each explanatory variable we examined its reported relationship to e-business adoption. In the studies under review, EB adoption is conceptualized from various viewpoints. Some authors look at the type of applications that are used to characterize EB adoption. Others investigate the value of EB and how this is achieved or the intensity with which applications are used. In most studies a combination of aspects or features is used to obtain a characterization of e-business adoption. A large number of studies (36 out of 47) examine the role of perceived innovation characteristics in the adoption of EB. The attributes of the innovation at hand as perceived by the adopter have proven to be significantly instrumental in predicting adoption (Tornatzky & Klein, 1982). The majority of the studies reviewed examine the adoption of Internet related technologies in the tradition of Rogers (1995). A smaller number of studies use the TAM or Technology Acceptance Model (Davis, 1989; Davis, Bagozzi & Warshaw, 1989). An even smaller number of studies use the TOE or Technology-Organization-Environment model (Tornatzky & Fleisher 1990). The TOE model is consistent with the innovation diffusion theory of Rogers (1995).
The second category of determinants of adoption consists of adopter characteristics. The adopter is a firm, or an individual within a firm depending on the level of analysis. Looking at the list of variables found in the review some clusters can be distinguished:
– Relevant knowledge and experience. Several determinants of adoption relate to the presence of knowledge and experience relevant to e-business like it-knowledge or experience with information systems. In general, relevant knowledge and experience facilitate e-business adoption. Examples of these variables are adoption of clusters of related it-innovations (LaRose & Hoag, 1996), knowledge barriers (Nambisan & Wang, 2000), organizational readiness in terms of IT knowledge and use (Mehrtens, Cragg & Mills, 2001), and managing director’s education (Lal, 2002).
– Organizational size. 15 studies investigate the role of firm size on adoption with various results (LaRose & Hoag, 1996; Sillince, Macdonald, Lefang & Frost, 1998; Premkumar & Roberts, 1999; Nambisian & Wang, 2000; Eder & Igbaria, 2001; Wei, Ruys, Van Hoof & Combrink, 2001; Daniel & Grimshaw, 2002;

1733
Lal, 2002; Sadowski, Maitland & Van Dongen, 2002; Windrum & De Berranger, 2002; Zhu, Kraemer & Xu, 2003; Oyelaran-Oyeyinka and Lai et al., 2005; Dinleroz & Hernández-Murillo, 2005; Levenburg, 2005 y Zhu & Kraemer, 2005). In some studies, the influence of size on adoption is positive, in others insignificant.
– Network pressure. Outside the firm, actors in the firm’s network or value chain motivate the firm or exert influence on the firm to adopt e-business. In general, network pressure has a positive influence on e-business adoption in the firm. Examples of variables in this group are external pressure (from trading partners) (Premkumar & Roberts, 1999), competitive pressure (Premkumar & Roberts, 1999; Mehrtens, Cragg & Mills, 2001; Raymond, 2001; Sadowski et al., 2002), customer and supplier pressure (Daniel & Grimshaw, 2002), and e-mail use by trading partners (Sillince et al., 1998). In studies on individual level, equivalent determinants are used. For employees, adoption can be influenced by a normative belief about EB within the firm and a motivation to comply (Cheung et al., 2000; Chang & Cheung, 2001; Cheng, Cheung & Chang, 2002).
– Network orientation. A firm can turn to actors in the firm’s network for information and support. Several studies demonstrate that EB adoption is facilitated by a network orientation. Examples of determinants in this group are external training and technical support (Premkumar & Roberts, 1999), technological collaboration (Lal, 2002), the degree of involvement of a supply side institution (Nambisan & Wang, 2000), and the involvement of a change agent (De Berranger, Tucker & Jones, 2001). In studies on an individual level, EB adoption is positively influenced when employees are facilitated by training, support and easy access to Internet (Cheung et al., 2000; Chang & Cheung, 2001; Cheng, Cheung & Chang, 2002).
– Entrepreneurship. Less evident as a group is a number of variables that refer to a positive and encouraging attitude towards innovation within the firm and strategic importance that is being attached to e-business. Organizational support was found to be positively related to adoption in various studies (Sillince et al., 1998; Premkumar & Roberts, 1999; Beatty, Shim & Jones, 2001). Two studies observe the importance of an in-house champion (LaRose & Hoag, 1996; Mehrtens, Cragg & Mills, 2001). Teo and Too (2000) found that firms with a more strategic view of information systems use the Internet more proactively to tap new business opportunities and achieve competitiveness. Katz and Dennis (2001) found that firms are likely to undertake innovations like e-commerce when they see innovation as central to their vision for the firm. In an individual level study, Busselle, Reagan, Pinkleton and Jackson (1999) found that the adopter’s need for innovativeness was the strongest factor in explaining Internet use.
Apparently, characteristics of the adopter play a role in the adoption of EB either through the perception of the attributes of EB or directly. In the e-business literature reviewed six groups of adopter characteristics that were found to be related to the adoption of EB: the organization’s relevant knowledge and experience, organizational size, perceived network pressure, network orientation and entrepreneurship. It appears that innovation requires an organization that has a sound knowledge base, is able to acquire and process knowledge, establishes effective external linkages, and encourages innovation. In innovation literature, several authors deal with organizational attributes that enhance organizational innovativeness (Damanpour, 1991). In his meta-analysis on determinants of organizational innovation, Damanpour finds ten statistically significant associations. The majority of determinants deal with internal structural characteristics of the organization: specialization, functional differentiation, professionalism, centralization, administrative intensity, slack resources, and internal communication. Specialization, differentiation, and professionalism represent the firm’s complexity (Damanpour, 1991). Rogers reports relations between organizational innovativeness and a group of structural variables comparable to Damanpour: complexity, centralization, formalization, organizational slack, interconnectedness, and size (Rogers, 1995). However, Rogers states that several hundreds of studies show rather low correlations of each of the independent variables with organizational innovativeness.
From the review and the subsequent discussion on the findings, a model emerges of e-business adoption from an innovation adoption perspective. This model of e-business adoption is presented in Fig. 1. Note that the relation between perceived innovation characteristics and e-business adoption has been found repeatedly in literate and is therefore represented by a continuous arrow. The other relationships (dashed arrows) are hypothetical and need further exploration.

1734
FIG. 1: E-BUSINESS ADOPTION: THE INNOVATION ADOPTION PERSPECTIVE
Review on Innovation Adoption Theory The innovation decision process by Rogers (1995) Rogers conceptualizes innovation adoption as a process through which an individual or other decision making unit passes from first knowledge of an innovation, to forming an attitude towards the innovation, to a decision to adopt or reject it, to the implementation of the new idea and to the confirmation of this decision (see Fig. 2). Central to Rogers’ model are the innovation characteristics as perceived by the adopter. Rogers postulates that ‘subjective evaluations of an innovation, derived from individuals’ personal experiences and perceptions and conveyed by interpersonal networks, drives the diffusion process’ (Rogers, 1995: p. 208). Interpersonal networks together with mass media channels make up communication channels through which subjective evaluations of an innovation are communicated to the potential adopter. The adopter’s evaluation of certain characteristics of the innovation can inhibit adoption, such as its perceived complexity, or encourage adoption, such as its perceived advantages. In his review, Rogers (1995) investigates five perceived innovation characteristics:
– Relative advantage. The degree to which an innovation is perceived as being better than the idea it supersedes,
– Compatibility. The degree to which an innovation is perceived as consistent with the existing values, past experiences, and needs of potential adopters,
– Complexity. The degree to which an innovation is perceived as relatively difficult to understand and use, – Trialability . The degree to which an innovation may be experimented with on a limited basis, and – Observability. The degree to which the results of an innovation are visible to others.
The Technology Acceptance Model or TAM (Davis, 1989; Davis, Bagozzi & Warshaw, 1989). This model is an individual level adoption model based on Fishbein and Ajzen’s Theory of Reasoned Action (TRA) (1975). Davis introduces the TAM as an adaptation of TRA. TAM is an intention-based model developed specifically for explaining and/or predicting user acceptance of computer technology. The original model is depicted in Fig. 3.
TAM suggests that usefulness and ease of use predict individual attitude toward use of a system, which then influence intention to use and system usage (Davis et al., 1989). TAM proposes two specific belief constructs -perceived usefulness and perceived ease of use as determinants of an individual’s technology adoption decision (Davis, 1989). Perceived usefulness (PU) is defined as ‘the degree to which a person believes that using a particular system would enhance his or her job performance’ (Davis, 1989, p. 320). Perceived ease of use (peou) refers to ‘the degree to which a person believes that using a particular system would be free of effort’ (Davis, 1989, p. 320). TAM is an individual level adoption model; however Riemenschneider, Harrison and Mykytyn used the model to explain website adoption on company level. They justify using the model by arguing that ‘it adoption decisions in small businesses are typically made by a single executive’ (Riemenschneider, Harrison & Mykytyn, 2003: 270).
Value creation
E-business adoption
Perceived innovation characteristics
Adopter characteristics
Knowledge and experienceNetwork influenceAttitude towards changeOrganizational structure
Relative advantageCompatibilityComplexityTrialabilityObservability
ActivityApplicationIntensity of useFirst time of useStage of development

1735
FIG. 2: THE INNOVATION DECISION PROCESS BY ROGERS (1995)
FIG. 3: THE TECHNOLOGY ACCEPTANCE MODEL BY DAVIS, BAGGOZZI & WARSHAW (1989) The Technology-Organization-Environment or TOE by Tornatzky & Fleischer (1990), To study adoption of general technological innovations Tornatzky and Fleischer (1990), developed the Technology -Organization-Environment (TOE) framework which identified three aspects of a firm’s context that influence the process by which it adopts, implements and uses technological innovations: (a) Technological context describes both the internal and external existent technologies in use and new technologies relevant to the firm, as well as the pool of available technologies in the market (b) Organizational context refers to descriptive measures bout the organization such as scope, size, the centralization, formalization, and complexity of its managerial structure; the quality of its human resource, and the amount of slack resources available internally. (c) Environmental context is the arena in which a firm conducts its business –its industry, competitors, and dealings with the government (Tornatzky and Fleischer, 1990, pp. 376-383). As a generic theory of technology diffusion, the TOE framework can be used for studying different types of innovations (Zhu and Kraemer, 2005) According to the typology proposed by Swanson (1994), there are three types of innovations: Type I innovations are technical innovations restricted to the Information systems (IS) functional tasks (such as relational databases); Type II innovations apply IS to support administrative tasks of the business (such as financial, accounting, and payroll
IKnowledge
IIPersuasion
IIIDecision
IVImplementation
VConfirmation
1 Adoption
2 Rejection
Prior conditions:
Characteristics of the decision-making unit:
1. Socioeconomic characteristics
2. Personality variables3. Communication
behavior
1. Previous practice2. Felt needs/problems3. Innovativeness4. Norms of the social
systems
Perceived characteristics of the innovation:
1. Relative advantage2. Compatibility3. Complexity4. Trialability5. Observability
External variables
Behavioral intention to use
Attitude toward using
Perceived ease of use
Perceived usefulness
Actual system use

1736
systems); and Type III innovations integrate IS with the core business where the whole business is potentially affected and the innovation may have strategic relevance to the firm. From the above, we consider EB a Type III innovation in the sense that EB is often embedded in a firm’s core business process. Fig. 4 shows the TOE framework as adapted by Zhu et al., (2003) to investigate EB adoption at firm level.
FIG. 4: THE TECHNOLOGY-ORGANIZATION-ENVIRONMENT BY TORNATZKY AND FLEISCHER (1990) AS ADAPTED BY ZHU ET AL. (2003)
Fig. 5 shows a more developed variation of the TOE model proposed by Zhu and Kraemer (2005) for assessing EB use and value at the firm level. They propose to use six factors within the TOE framework as drivers of EB use. They propose to integrate the TOE framework and the resource based theory to develop a conceptual model that can be used to evaluate in an integrative way, the EB adoption phenomena, including the post-adoption variations in usage and value of EB.
FIG. 5: THE TECHNOLOGY-ORGANIZATION-ENVIRONMENT BY TORNATZKY AND FLEISCHER (1990) AS ADAPTED BY ZHU AND KRAEMER (2005) TO EVALUATE EB ADOPTION
• IT infrastructure• Internet skills• e-Business Know-how
Intent to adopt E-business
Technological context• Technology competence
Organizational context• Firm size• Firm scope
Environmental context• Consumer Readiness• Competitive Pressure• Lack of Trading Partner Readiness
• Consumer Willingness• Internet Penetration
2nd order construct
Interactive construct
E-business use
Technology context
Organization context
Environmental context
E-business value
Impact on sales
Impact on internal
operation
Impact on procurement
Front-End Integration
Back-EndIntegration

1737
Entrepreneurship and Innovation Adoption Innovation and entrepreneurship have a strong relationship. This leads many authors to evade discrimination between the concepts and use the concepts interchangeably (Sexton & Camp, 1993). In order to understand the relationship between entrepreneurship and innovation it is important to understand what connects the two concepts as a well as what discriminates them. Barton Cunningham and Lischeron (1991) typify this view on entrepreneurship as the ‘Classical School’3. In this school of thought, innovation, creativity, and discovery are the key factors. It was Schumpeter that pointed at innovativeness as the key ingredient of entrepreneurship (Schumpeter, 1934). He defined innovation as the introduction of a new product or a new quality of a product, a new method of production, a new market, a new source of supply of raw materials or half-manufactured goods, and finally implementing the new organization of any industry (Schumpeter, 1934). In the early works of Schumpeter, much attention is paid to the role of the entrepreneur as the personification of innovation. It is the entrepreneur that introduces new combinations (Hagedoorn, 1996; McDaniel, 2000). In line with this view, entrepreneurship has been defined as the creation of new business, initiated by individuals (for example, Gartner, 1985; Low & MacMillan, 1988). Schumpeter recognized that ‘the entrepreneurial function need not be embodied in a physical person and in particular in a single physical person. Every social environment has its own ways of filling the entrepreneurial function.’ (Schumpeter, 1989: p. 260). The focus in research shifted from the entrepreneur to entrepreneurship. The majority of definitions of entrepreneurship indeed focus on the pursuit of opportunity (Kirzner, 1979; Stevenson & Gumpert, 1985; Stevenson, Roberts & Grousbeck, 1989; Sexton & Camp, 1993; Churchill & Muzyka, 1994; Venkataraman, 1997; Timmons, 1999; Shane & Venkataraman, 2000). They define entrepreneurship as a process, by which individuals -either on their own or inside organizations- pursue opportunities without regard of the resources they currently control. Research however is dominated by micro-level analysis using the individual or the firm as level of analysis (Davidsson & Wiklund, 2001). Entrepreneurship on firm level is generally called corporate entrepreneurship and refers to new venture creation by individuals or teams within the firm, or strategic renewal i.e. wealth creation through the new combinations of resources (Guth & Ginsberg, 1990). Wiklund defines entrepreneurship as ‘taking advantage of opportunities by novel combinations of resources in ways that have impact on the market’ (Wiklund, 1998: p. 13). Evidently, entrepreneurship centers around innovation as Schumpeter intended: new combinations. All entrepreneurial behavior can be considered innovative as it entails the discovery and implementation of new ideas. However, innovation does not always result in the creation of profit or wealth (Guth & Ginsberg), or an impact on the market (Wiklund, 1998; Stopford & Baden-Fuller, 1994). It is the exploitation of opportunities resulting in economic value creation that separates entrepreneurship from innovation (Sexton & Camp, 1993; Churchill & Muzyka, 1994). Thus, from an entrepreneurship perspective, the adoption of e-business may be considered an entrepreneurial act when it results in the exploitation of an opportunity.
In the entrepreneurial process, opportunities play a central role. De Bono describes an opportunity as ‘something you do not yet know that you want to do – and can’ (De Bono, 1978: p. 15). In a business context, Sexton and Camp define opportunities as ‘creative ideas that possess a known and accessible potential for generating pure profit or economic wealth’ (Sexton & Camp, 1993: p. 199). Christensen, Madsen and Peterson (1994) define an opportunity as a possibility for new profit potential, through (a) the founding and formation of a new venture, or (b) the significant improvement of an existing venture. The exploitation of opportunities is a means to improve the financial performance of a firm. Some opportunities offer competitive advantage that only in time will improve the company’s financial performance (Zahra & Covin, 1995). Basically, entrepreneurial opportunities can stem from Schumpeter’s five different loci of change: new products of services, new geographical markets, new raw materials, new methods of production and new ways of organizing (Eckhardt & Shane, 2003). The introduction of ICTs in a firm opens up opportunities and may lead to different types of value creation. The adoption of EB may incrementally improve existing ways of working, but may also open up new markets or generate new products or services. In this study, EB adoption is considered entrepreneurial when economic value is created from a new means-end framework resulting in new ways of working for the firm that have an impact on what is offered on the market.

1738
Before an innovation can be exploited, an opportunity must be perceived by the firm (Shane, 2000). Opportunity recognition is considered the important first step in the entrepreneurial process. Moreover, opportunity recognition has been called ‘the core of entrepreneurship’ (Kirzner, 1973; Timmons, Muzyka, Stevenson & Bygrave, 1987). Long and McMullan (1984), Bhave (1994), De Koning (1999), Sigrist (1999), Lumpkin, Hills and Shrader (2001), have modeled the opportunity recognition process. Although they each use different terms, the essence of the process is that an initial idea for creating new business is discovered and subsequently developed into a viable business opportunity. The opportunity recognition process is subdivided into two phases: opportunity discovery and opportunity development (see Fig. 6). Studies on how opportunities are discovered revealed that entrepreneurs encounter ideas either by chance or through deliberate search (Vesper, 1989; Vesper, Shragge & McMullan, 1989; Gaglio, 1997; Ardichvili & Cardozo, 2000; Chandler, Dahlquist & Davidsson, 2002).
FIG. 6: THE OPPORTUNITY RECOGNITION PROCESS
Having an initial idea for new business is only the starting point of the entrepreneurial process. Many authors show that considerable development, incubation or elaboration is necessary to turn an initial idea into a full-fledged business opportunity (e.g. Long & McMullan, 1984, Bhave, 1994; De Koning, 1999; Lumpkin, Hills & Shrader, 2001). The evaluation of opportunities is an important aspect of developing initial ideas into business opportunities. Insights are evaluated and the feasibility and desirability of the opportunity are checked (Hills, Shrader & Lumpkin, 1999; Lumpkin, Hills & Shrader, 2001). The opportunity must be ‘wanted’, both by potential customers (Singh, 2001), and the entrepreneur (Christensen, Madsen & Petersen, 1994). Some authors focus specifically on the more formal evaluation of opportunities (Timmons et al., 1987; Vesper 1989; Zimmerer & Scarborough, 1998; Timmons & Muzyka, 1994; Timmons, 1999). Evaluation criteria include market and financial analysis, risk assessment, and the qualities of the management team. In sum, opportunity recognition is the process of developing an initial idea into a feasible and desirable business opportunity. In this process, the perceived market need and the (attainable) resources are assessed. The entrepreneur considers the opportunity’s potential to create value and decides to proceed with exploitation of the opportunity or not. As far as e-business adoption is concerned, it is not very difficult to see the relation with opportunity recognition. In order to exploit the possibilities of ICTs and create economic value, an opportunity for EB must be perceived.
Although Schumpeter recognized that every social environment has its own ways of filling the entrepreneurial function (Schumpeter, 1989: p. 260), opportunity recognition research has hardly touched upon the subject on firm level. An exception is the longitudinal study by Schwartz and Teach (Teach, Schwartz & Tarpley, 1989; Schwartz & Teach, 2000). Their analysis is on firm level, although they do not discuss their choice for this level of analysis. De Koning and Brown (2001) are explicit in their choice for firm-level analysis. They show that it is possible and fruitful to do research into opportunity recognition antecedents on firm level when firm-level constructs are used. They establish that entrepreneurial orientation and customer orientation have a significant positive impact on entrepreneurial alertness. Actually, De Koning and Brown establish the effect of these factors on the firm’s scanning behavior in different contexts. In these studies there are suggestions that knowledge and experience, network contacts, innovativeness and pro-activeness are important. However the attention for the firm’s strategic orientation stands out. Entrepreneurial behavior is driven by opportunities, which entails an external (market) orientation rather than an internal (resource) orientation. Furthermore, entrepreneurial behavior is oriented towards opportunity pursuit. Acting rapidly upon opportunities involves risk-taking, creativity, and innovativeness
Opportunity discovery
Opportunity development
Opportunity recognition

1739
(Stevenson & Gumpert, 1985). Miller (1983) and Covin and Slevin (1991) suggest innovation, risk-taking, and pro-activeness are key dimensions of entrepreneurial activity focused on the discovery and pursuit of opportunities. In sum, knowledge and experience, network contacts, and strategic posture may explain opportunity recognition on firm level (depicted in Fig. 7).
FIG. 7: FIRM LEVEL OPPORTUNNITY RECOGNITION
How can an entrepreneurship perspective contribute to explaining the adoption of e-business? The
technology is an innovation that forms the basis for an entrepreneurial opportunity. Opportunity recognition literature provides us with an understanding of this process. The entrepreneurship perspective clarifies why firms innovate. This is an important addition to innovation theory as it puts innovation into perspective. In sum entrepreneurship and innovation are strongly related, yet they are different concepts. Entrepreneurship and innovation are separated by the exploitation of opportunities resulting in economic value creation. Thus, from an entrepreneurship perspective, the adoption of EB may be considered an entrepreneurial act when it results in the exploitation of an opportunity. The introduction of ICTs in a firm opens up opportunities for e-business and may lead to different types of value creation. E-business may incrementally improve existing ways of working, but may also open up new markets or generate new products or services. The Resource Based Theory The resource-based view (RBV) provides a theoretical base for linking EB use and value (Zhu and Kraemer, 2005). Rooted in the strategic management literature, the RBV of the firm posits that firms create value by combining heterogeneous resources that are economically valuable, difficult to imitate, or imperfectly mobile across firms (Barney 1991; Peteraf, 1993). In the IS literature, the RBV has been used to analyze ICT capabilities (Mata et al., 1995) and to explain how ICT business value resides more in the organization’s skills to leverage ICT than in the technology itself (Clemons and Row, 1991; Soh and Markus, 1995, Ross et al., 1996). That is, ICT business value depends on the extent to which ICT is used in the key activities in the firm’s value chain. The greater the use and the wiser the use, the more likely the firm is to develop unique capabilities from its core ICT infrastructure (Zhu, 2004). Although the individual components that go into the ICT infrastructure are commodity-like, the process of integrating the components to develop a coherent infrastructure tailored to a firm’s strategic context is complex and imperfectly understood (Milgrom and Roberts, 1990,; Weill and Broadbent, 1998). Thus, ICT-enhanced capabilities that integrate various resources cannot be easily imitated and have the potential to create business value (Bharadwaj, 2000; Zhu and Kraemer, 2002). The unique characteristics of the Internet can be examined and linked in three ways
Opportunity discovery
Opportunity development
Opportunity recognition
Firm characteristics
Knowledge and experienceNetwork contactsStrategic posture
Opportunity discovery
Opportunity development
Opportunity recognition
Firm characteristics
Knowledge and experienceNetwork contactsStrategic posture

1740
through which EB can create value –transactional efficiencies, market expansion, and information sharing (Zhu and Kraemer, 2005). Combining them with the RBV, they developed an EB value hierarchy as shown in Fig. 8. This value hierarchy depicts the unique characteristics of the Internet and how these characteristics enable value creation via EB. The bottom layer of the value hierarchy shows the unique characteristics of the Internet. The Internet is unique in terms of open standard, public network, and global connectivity.
From these Internet characteristics EB creates value in three ways, as shown in the middle layer of the value hierarchy. EB can substantially improve transactional efficiencies (Malone and Laubacher, 1998). Internet-based search capabilities can lead to a closer match between a firm and its customers in greater reach than before. In addition, EB can achieve lock-in by leveraging various interactive applications such as loyalty programs, virtual communities, and customization (Amit and Zott, 2001). At the same time the Internet connects EB to consumers in geographic areas that were costly to reach before the Internet (Steinfield et al., 2002). Furthermore, conducting business on a platform with open standards facilitates information sharing along the value chain (Zhu, 2004). In sum, the open-standard connectivity and public network characteristics of the Internet enable EB value creation by improving transactional efficiencies, expanding the markets, and achieving information sharing and integration, as shown in the top layer of the value hierarchy in Fig. 8.
FIG. 8: E-BUSINESS VALUE HIERARCHY: FROM INTERNET CHARACTERISTICS TO VALUE CREATION. ADAPTED FROM ZHU AND KRAEMER (2005)
The Proposed Research Model This research aims to answer which firm characteristics explain e-business adoption in firms. The basic proposition in this study is that the ability of a firm to recognize and develop business opportunities for the application of ICTs is an essential factor in explaining EB adoption. Evident from both the innovation adoption and the entrepreneurship perspective is the role of knowledge and experience, the role of network contacts, and the importance of a positive attitude towards change in the adoption of e-business on firm level. On the other hand, entrepreneurship perspective emphasizes that the recognition of opportunities for e-business is facilitated by firm behavior involving innovation, risk-taking and pro-activeness.
In innovation literature, organizational innovativeness is often related to the internal structure of an organization, but in his extensive review, Rogers (1995) found rather weak correlation between organizational innovativeness and various structural variables like differentiation, centralization, formalization etc. More importantly, organizational structure is a non-behavioral organizational attribute, and as such does not make a firm entrepreneurial (Covin & Slevin, 1991). Miller and Friesen (1982) found that determinants of innovation in a firm
Unique characteristics of the Internet
Value creation
Impact on firm performance
Sup
port
• Impact on sales• Impact on internal operation• Impact on procurement
• Transactional efficiencies• Market expansion• Information sharing and integration
• Open standard• Public network• Global connectivity

1741
are to a very great extent a function of the strategy that is being pursued. As strategic posture is explicitly included in the theoretical model, little additional value of the internal organizational structure to explaining EB adoption is expected so we found that it is justifiable to leave the internal organizational structure out of the model.
Three major firm characteristics remain from the review of innovation adoption and entrepreneurship literature that relate to e-business adoption: knowledge and experience, social network contacts, and strategic posture. Therefore we propose to talk about perceived opportunity characteristics in the model. We assume that these perceived opportunity characteristics are the result of an evaluation of the business opportunity by a firm in its context As in Rogers’ model of the innovation decision process (Rogers, 1995), we assume that the characteristics of the firm influence the development of a perception of using the innovation in the firm However, there are situations conceivable where a positive attitude does not lead to EB adoption. Thus, in the model, we need to allow for firm characteristics to have a direct influence on EB adoption. Finally, EB adoption results in value creation when the business opportunities offered by ICT are exploited. This way, the entrepreneurship perspective on EB adoption is expressed in the model along wit the RBV. The proposed theoretical model is depicted in Fig. 9. EB adoption and consecutive value creation are both regarded as dependent variables in the model. Firm characteristics and perceived opportunity characteristics are the independent variables Elements of E-business Adoption Model Value creation As we discussed in my review on e-business adoption literature e-business is generally associated with supporting business activities by the use of ICT technologies to gain a certain Benefit. However, with EB new economic value can be created in a number of ways and from a number of sources (Amit & Zott, 2001). Based on Hammer and Mangurian (1987) Riggins distinguishes three categories of value creation for EB (Riggins, 1999; Riggins & Mitra, 2001):
– Improving efficiency (time and cost-related), – Improving effectiveness (related to communication) and – Strategic benefits (related to products, markets and services).
In this study, e-business adoption is regarded an entrepreneurial act when the economic value created can be labeled as strategic. So a distinction is made between two types of value creation:
– Organizational value creation: the adoption of e-business leads to value creation related to time, cost, and/or communication,
– Strategic value creation: the adoption of e-business leads to value creation related to products, markets, and services. We expect e-business adoption to lead to organizational and strategic value creation (propositions 1a and
1b). Organizational value creation, related to process innovation, is expected to precede strategic value creation, related to new products, services and markets, in the specific situation of e-business adoption (proposition 1c). Value creation as discussed before using the RBV is incorporated in the model trough propositions 1e, 1e and 1f Perceived opportunity characteristics In many innovation adoption studies, the perceived attributes of the innovation at hand play a decisive role in the adoption decision. However, as Moore and Benbasat (1991) note, most authors use Rogers’ definitions of perceived innovation characteristics, which are based on perceptions of the innovation itself, and not on perceptions of actually using the innovation. In the case of electronic business, we argue that it is not the ICT-related innovation itself that is being assessed. Companies judge the opportunity that ICTs create for them. In entrepreneurship literature several authors focus specifically on evaluation of opportunities (Timmons et al., 1987; Vesper, 1989; Zimmerer & Scarborough, 1998; Timmons, 1999). They mainly focus on business plans or investment opportunities and deal with criteria like market and financial analysis, risk assessment, and the qualities of the management team. we argue that ultimately the perceived value of the opportunity determines the likelihood of exploitation. With regard to the selection of attributes that are relevant to assess, Rogers (1995) identified five attributes of innovations: relative advantage, compatibility, complexity, observability, and trialability. Tornatzky and Klein (1982) found a total of 30 different innovation characteristics (including the ones identified by Rogers). They conclude that three innovation characteristics had the most consistent significant relationships to innovation adoption: perceived relative advantage, compatibility, and complexity

1742
Perceived relative advantage: The EB opportunity only exists when the potential adopter perceives a possibility for creating value with ICTs. Therefore, perceived relative advantage is conceptualized as the degree to which an organization believes that with EB value can be created. We propose that the perceived relative advantage of the opportunity is positively related to adoption (proposition 2a).
Compatibility: Compatibility was originally conceptualized by Rogers (1995) as the degree to which an innovation is perceived as consistent with the existing values, past experiences, and needs of potential adopters. Moore and Benbasat (1991: p.199) comment on Rogers’ conceptualization that ‘the inclusion of “needs” is considered as a source of confounding with relative advantage, as there can be no advantage to an innovation that does not reflect an adopter’s needs’. Therefore they suggest eliminating reference to adopters’ needs from compatibility. We conceptualize perceived compatibility as the degree to which an organization believes that e-business is congruent with the values and norms in the company, and with existing practices within the company and its value chain. I expect the perceived compatibility of the opportunity to be positively related to adoption (proposition 2b).
Complexity: Rogers (1995) defined complexity as the degree to which an innovation is perceived as relatively difficult to understand and use. Complexity refers to what makes people perceive the innovation as complex (Tornatzky & Klein, 1982). Davis’ construct ‘perceived ease of use’ (Davis, Bagozzi & Warshaw, 1989) is the antonym of complexity (Moore & Benbasat, 1991). Thus we conceptualize perceived complexity as the degree to which an organization believes that e-business is difficult to understand, oversee and use. A negative relationship between perceived complexity and adoption is expected (proposition 2c). General firm characteristics The company’s base of knowledge and experience, its network contacts and pro-active external orientation determine the point of departure for opportunity recognition. In the following sections, we will elaborate on the factors we have chosen to serve as antecedents of opportunity recognition for e-business, and describe and discuss the relations that I expect with the adoption of e-business
The level of formal knowledge: Several researchers demonstrate that a higher level of formal knowledge will most likely characterize innovative organizations and promote innovation (Brancheau & Wetherbe, 1990; Rogers, 1995; Tabak & Barr, 1999). Formal knowledge seems to facilitate a deliberate search for opportunities as well as their unexpected discovery. It provides a basis for the interpretation of new information and its conversion to new knowledge. I expect the level of formal knowledge in a firm to have a positive relation with e-business adoption (proposition 3a).
IT knowledge and experience: Cohen and Levinthal (1990) explain that accumulated prior knowledge enhances the ability to put new knowledge into memory, and the ability to recall and use it. An accumulation of knowledge makes it possible to see connections between different categories of existing knowledge and associate new knowledge with existing knowledge. In addition to prior knowledge, there is an effect of prior experience in learning on the acquisition of new knowledge (Cohen & Levinthal, 1990). This ability enables a firm to discover new opportunities for business by combing new knowledge with existing knowledge. I propose that the knowledge and experience with it in a firm is a positive antecedent for e-business adoption (proposition 3b).
Customer and competitor orientation: To conceptualize a focus on the market and on customers, it seems obvious to turn to the (marketing) concept of market orientation. However, many explanations exist on what a market orientation contains and there is still no one single definition (for a review, Van Raaij, 2001). Van Raaij effectively conveys the ‘relatively simple message’ of the discussion in marketing literature about market orientation: ‘market oriented organizations are organizations that are well informed about the market and that have the ability to use that information advantage to create superior customer value’ (Van Raaij, 2001: p. 275). A market orientation is usually defined as ‘the business culture that most effectively and efficiently creates superior value for customers’ (Narver & Slater, 1990: p. 20). Therefore we choose to conceptualize a market and customer focus as a customer and competitor orientation. Of course, this conceptualization does not in any way pretend to cover market orientation as discussed in the marketing literature. We expect a customer and competitor orientation to relate to e-business adoption (proposition 3c).
Environment as a source of ideas: The environment and more specifically the social network acts as a source of ideas and information (Aldrich & Zimmer, 1986; Christensen & Peterson, 1990; Hills et al., 1997).

1743
Entrepreneurs consistently use their social network to get ideas and gather information to recognize entrepreneurial opportunities (Birley, 1985; Moss Kanter, 1988; Smeltzer et al., 1991; Singh, Hills, Hybels & Lumpkin, 1999; De Koning, 1999; Singh, 2000). In short, the ability of a firm to use the environment as a source of ideas, acts as a positive antecedent to EB adoption (proposition 3d).
Entrepreneurial orientation: Moss Kanter (1988) identifies several conditions at the organizational level that facilitate the ability to see new opportunities. One of these conditions is that the organization should support innovation, not only by providing resources like time and money, but also by favoring change as a culture. a firm’s past entrepreneurial experience creates an antecedent for future opportunity recognition. Several authors made attempts to measure a firm’s entrepreneurial behavior. The most widely used construct in this respect is ‘entrepreneurial orientation’ (for an overview, Lyon, Lumpkin & Dess, 2000). Miller (1983) originally suggested that a firm’s degree of entrepreneurship could be seen as the extent to which they take risks, innovate and act pro-actively. This experience in entrepreneurship indicates that a firm has the motivation and the ability to really act upon opportunities. We therefore propose that a firm’s entrepreneurial orientation is positively correlated with EB adoption (proposition 3e). Specific firm characteristics Bhave (1994) concludes in his exploratory research that entrepreneurs go through a process of elaborating, filtering and refining opportunities before they decide on pursuing a certain business opportunity. In this process, the entrepreneur matches knowledge, experience, skills and other resources with market needs. In her investigation, De Koning (1999) concludes that opportunities are basically ‘formed’ through an iterative process in which the entrepreneur discusses the desirability and feasibility of opportunities with network ties and seeks feedback information from experts. Nambisan and Wang (2000) argue that with the emergence of more knowledge intensive technologies like the Internet, opportunities for their exploitation are not so clearly defined and apparent and are often highly context and firm specific. As pointed out earlier, network contacts play an important part in providing information and resources firm characteristics that facilitate the development of EB opportunities refer to EB-related knowledge, experience, and network contacts.
E-business-related knowledge: The possibilities of ICTs are endless, and outside knowledge is often hardly targeted to the specific needs and concerns of the firm. Especially for new technologies the information available will be focused on the technology (know what) and less on the possibilities for application (know how) The less targeted the information available is, the more important it is to have knowledge inside the firm permitting it to recognize the value of this outside knowledge, assimilate it, and exploit it (Cohen & Levinthal, 1990, p. 140). We therefore expect that the presence of knowledge about EB facilitates the development of opportunities, and therefore the adoption of EB (proposition 4a).
The presence of innovation roles: In innovation literature often the presence of individuals fulfilling specific roles is stressed as especially important in the innovation process (Rothwell, 1992). An organization’s capacity to acquire and assimilate new knowledge will depend on the absorptive capacities of its individual members (Cohen & Levinthal, 1990). We propose that the presence of innovation roles, contributes to the recognition of EB opportunities, and therefore facilitates EB adoption (proposition 4b).
The perceived dedication of resources for e-business: Turning ideas for innovation into business opportunities requires an organization to play a role in stimulating opportunity development. One way to facilitate this opportunity recognition process is to make sure people in the organization can rely on the release of time and money, when necessary (Moss Kanter, 1988). In innovation literature, the influence of resource availability is raised. Awareness of organizational resource availability reinforces the perceptions of affordability of experimentation with innovations (Tabak & Barr, 1999). We suggest that the perceived dedication of resources for EB is positively associated with EB adoption (proposition 4c).
An activated information network: Birley (1985) concludes that during opportunity development the entrepreneur uses the network to obtain information on what is available, advice on how to best proceed, reassurance that it will work, and resources. As the concept of a business opportunity is created, the entrepreneur also seeks out potential resources and assesses them in terms of the opportunity. This part of the process seems enhanced by a network of weak ties with many potential resource providers (De Koning, 1999). Singh (2000) concludes that social networks play a vital role in the opportunity recognition process. We expect that the opportunity recognition process

1744
is facilitated when the firm actively approaches several social contacts for information regarding EB. This ‘activated information network’ facilitates EB adoption (proposition 4d).
FIG. 9: E-BUSINESS ADOPTION THEORETICAL MODEL. OVERVIEW OF PROPOSITIONS
Perceived external pressure: All innovations carry a degree of uncertainty and the adopter has a need for social reinforcement of its attitude towards the new idea (Birley 1985; Rogers 1995). In EB research, the influence of several external parties has been investigated, notably competitive pressure. Some authors found competitive pressure of insignificant importance (Nambisan & Wang, 2000; Sadowski et al., 2002). The social network of the firm may influence the firm’s perception of an innovation, as it is not an isolated entity. The perception of social pressure from for example competitors, change agents, or sector-organizations, can play a part in the evaluation of EB opportunities. This perceived external pressure might even induce a firm to adopt, even when the actual
Formal knowledge level
IT Know-how
Customer and competition orientation
Entrepreneurial orientation
Environment as a source of
ideas
E-business related
knowledge
Presence of innovation roles
Perceived dedication of
resources
Perceived external pressure
Activated information
network
Perceived relative
advantage
Perceived compatibi-
lity
Perceived complexity
E-business adoption
Organiza-tionalvalue
creation
Strategic value
creation
General firm characteristics
Specific firm characteristics
Impact on sales
Impact on operations
Impact in
services
+(4a, 4b,4c, 4d, 4e)
+(3a, 3b,3c, 3d, 3e)
+(2a)
-(2c)
+(2b)
+(1b)
+(1c)+(1a)
+(1d)
+(1f)
+(1e)

1745
advantages of EB to the firm are unclear, and create a ‘kap-gap’4. In short, we expect perceived external pressure to be positively related to EB adoption (proposition 4e).
Conclusions and Future Research Work The present study develops a theoretical model that can be used to explain EB adoption by SMEs. The research model was developed from three different perspectives: the EB adoption empirical perspective, the innovation adoption theoretical perspective and the entrepreneurship perspective. It also includes the RBV as it can be utilized to better explain EB adoption by SMEs.
The innovation adoption perspective gives an insight into EB adoption. However, EB is not a ready-to-use concept. Therefore we argue that EB adoption cannot be viewed as classic adoption i.e. of a relatively well-defined innovation. Following the implicit definition from the review, EB is about supporting business activities by adopting ICT technologies to gain certain benefits.
Entrepreneurship and innovation are strongly related, yet they are different concepts. Entrepreneurship and innovation are separated by the exploitation of opportunities resulting in economic value creation. Thus, from an entrepreneurship perspective, the adoption of EB may be considered an entrepreneurial act when it results in the exploitation of an opportunity. The introduction of ICTs in a firm opens up opportunities for EB and may lead to different types of value creation.
The goal of the model developed is to answer the following research questions: 1 What is e-business adoption? 2 Which firm characteristics explain e-business adoption in SMEs? 3 What are the differences in explaining EB adoption from an innovation adoption perspective compared to an entrepreneurship perspective?
The model needs to be tested empirically to prove its real value. To test propositions and find variation in EB adoption and firm characteristics using the proposed model, quantitative analysis of a large sample of firms is necessary. The obvious choice is a survey. Further work is needed to make operational the constructs and develop a detailed empirical research method. The model is intended to be tested in the second semester of 2007, using as a population for the research, the Mexican exporter SME’s.
References Contact authors for the list of references
End Notes
Contact author for the list of studies and authors. 2 Ídem 3 Other schools of thought in entrepreneurship that Barton Cunningham and Lischeron (1991) distinguish are the “Great Person”, and the Psychological Characteristics School (assessing personal qualities of entrepreneurs), The Management, and Leadership School (studying the way entrepreneurs act and manage a venture), and the Entrepreneurship School (studies the need for adapting an existing organization). 4 A kap-gap exists when a relatively high level of knowledge about the innovation (k), and a positive attitude (a) do not lead to adoption of the innovation (p), or vice versa (limited knowledge and negative attitude leading to adoption).

1746
Determinants of Successful Business Intelligence Deployment: Field Study of Telecommunication Industry
Azizah Ahmad, [email protected]
Norshuhada Shiratuddin Universiti Utara Malaysia, Malaysia
Mohammed Quaddus, [email protected] Curtin University of Technology, Australia
Abstract The concept of Business Intelligence (BI) as an essential competitive tool has been widely emphasized in the strategic management literature. However, deployment of BI in organizations, which involve IT systems and other organizational resources to manage knowledge strategically, is not well explained. While the literature on BI covers various issues, it lacks comprehensive studies of factors and variables of successful BI deployment. This paper attempts to highlight these issues in the context of Telecommunication Industry. A qualitative field study in Malaysia is undertaken in this research, where all of four telecommunication services providers, in various levels of BI deployments, are studied. The study is conducted via interviews with key personnel, whom are involved in decision-making tasks in their organizations. Contents analysis is then performed to extract the factors and variables and a comprehensive model of Successful BI Deployment is developed. The results of the interviews identify nine major variables affecting successful BI deployment as; Accuracy, Govern Design, Development and Deployment of BI, User Training, Retraining and Support, Online Real-time Capability, Fully Integrated to Various Data Sources, Warehouse Concept, Satisfied Users, Good Reporting Features and Reviewed Regularly. The paper also highlights the research and managerial implications of the Successful BI Deployment Model. Keywords: Business Intelligence; Successful Deployment; Telecommunication Industry; Qualitative Method; Content Analysis Introduction “What enables the wise sovereign and the good general to strike and conquer, and achieve things beyond the reach of ordinary men, is foreknowledge”
---- Sun Tzu, the Art of War, Over 2,500 years ago!
The above quote highlights that acquiring and utilizing knowledge in sustaining competitive advantage is not a new phenomenon. Human civilizations have been preserving and passing knowledge from generation to generation for better understanding of the past and therefore, the future. In today’s business competitive environment, the deployment of business intelligence (BI) as a competitive tool is increasing and the demand for BI in market is stronger than ever before. This is evidenced through BI being in the list of top ten CIO priorities according to a Gartner survey in 2004 [35]. In addition, a survey of 225 Fortune 500 companies in 2001 reported an increasing use of computer-based systems in BI programs [16] and the BI software industry has grown from over US$2 billion in 1998 to US$4 billion in 2004. This new trend has called firms’ attention to the importance of deploying a successful BI and its role in creating and sustaining competitive advantage due to its knowledge creation capabilities [9, 20, 14, 13, 5, 10, 36; among many others)
Although BI has been studied widely over the last several years, literature suggests that there is a scarcity of empirical studies on successful BI deployment. Like any other information systems, the success of BI deployment depends on its effective use by the users. A number of case studies are available in the literature which present success and failure factors of BI initiatives. However, no comprehensive study on the successful BI deployment found in the literature. What must be done to develop or adopt BI? What factors are important in deploying BI? These are natural questions to investigate in the context of BI development and deployment.

1747
This paper investigates the above questions in the context of telecommunication industry in Malaysia. Basic premise of the study is the extensive literature review on the deployment of BI-related applications. The primary objectives of this paper are two-fold:
i) To identify various factors and variables of successful BI deployment; and ii) To explore and develop a model of Successful BI Deployment
We employ qualitative field study as the research method and use structured interview techniques to collect relevant data. In the next several sections, we first present relevant background literature on BI and the deployment process. The research method is presented next which describes the process of data collection via interview and data analysis via a combination of inductive and deductive approaches of content analysis. Results of the study are then presented in detail, in the form of factors and variables of determinants of successful BI deployment, and a comprehensive model of successful BI deployment as obtained from field study. Finally, conclusions and future directions are presented. Literature Review
The term business intelligence has been used in many studies. However there is no conclusive definition of BI so far. Gartner first coined BI term in 1996 and popularized by analysts Howard Dresner, which generally refer to the process of turning data into information and then into knowledge [20, 14]. BI is further defined as the ability to access and analyze information as needed and to utilize this information to make sound business decisions [13]. Bernstein et al. [5] defined BI as the utilization of high-level software intelligence that can help organizations to achieve sound business decisions. Chung et al. [10] and Liebowitz [20] put forward the idea that BI enable organizations to understand their internal and external environment through systematic acquisition, collation, analysis, interpretation and exploitation of information in the business domains. Vedder et al. [36] claimed that BI is also known as Competitive Intelligence, which comprises of process and product. BI is defined as a process which is the set of legal and ethical methods used to harness information in achieving success, while as a product BI is the information about competitors’ activities from public and private sources comprising the present and future behavior of competitors, suppliers, customers, technologies, acquisitions, markets, products and services, and the general environment. Bergerou [4] later related BI to a process that increases the competitive advantage of a company by intelligent use of available data in decision-making. Successful BI Deployment BI-related technologies and strategies have been deployed in various industries for many years. Among the first BI application was for monitoring foreign currency instabilities way back in 1967 [17]. Other industries that have deployed BI include: Logistics for transport management and warehouse management [28], Manufacturing for order shipment and customer support, Retail for user profiling and inventory management, Financial services for claims analysis, risk analysis, credit card analysis and fraud detection [25], Transportation for fleet management, Telecommunications for call analysis, network usage assurance and fraud detection [34], Utilities for power usage analysis, Insurance for premium payment behavior, claim activity, agency performance and potential policy lapses [12] and Healthcare for customer analysis [33] and pharmaceutical R&D supply chain [1]. From the various BI terms defined above and the utilizations in different industries, the emphasis of BI is towards turning available data into the actionable knowledge needed for sound business decision-making, which is relevant to this study. It is argued that knowledge generated from successful BI deployment can be used to sustain competitive advantage of a firm. Unfortunately, in the area of successful deployment of BI, most of the research available focused on the technological and operational aspects. There is very little research, which considers the factors in the managerial and strategic levels. Therefore, the study on antecedents of successful BI deployment that will lead to sustainable competitive advantage is of utmost importance. Antecedents of BI Deployments Two groups of potential antecedents of successful BI deployment based on specific BI literature have been defined for the purpose of this study. The first group of antecedents is based on Resource-based Theory [3], which considers firm’s internal unique resources in deploying BI. These resources include firm’s assets, skills, knowledge and ability that will play important roles in BI deployment. The second group of antecedents is adapted from the Theory of

1748
Innovation Diffusion [29], which takes into account of the perceptions about an innovation before adoption process takes place. Perceptions are important elements in the successful adoption process as it enhances people’s awareness of the innovation. In this study, the innovation is the BI systems that are used by the firms.
Four antecedents under the Firm’s Resources Group are considered, namely Quality Information (QI), Quality User (QU), BI Governance (BIG) and Business Strategy (BS). These resources will influence firm’s successful BI deployment, which will help in making sound business decisions. First of all, BI can only be deployed successfully if users can perceived its full potential [37] and these potentials are categorized into tangible and intangible benefits. The most tangible benefits are time saving and more and better information. The latter includes better decisions, improved business process and support for the accomplishment of strategic business objectives. In a recent study, Nelson et al. [26] added that successful adoption of IS is largely based upon quality, satisfaction and usage. Based on context-based view, information quality is taken to be the most important, which is described as the usefulness of the information in decision-making. The context-based view expands the dimension of information quality beyond accuracy to include dimensions such as relevance, completeness, currency and format. Dijcks [11] and Jarke et al. [19] added that information quality aspect is often ignored in BI implementation and suggested a methodology for embedding data quality into overall BI architecture.
BI can only delivers value if the users are capable of utilizing information gained and turn them into sound business decisions [2]. Therefore, quality users with different set of skill such as technical, business and analytical are needed in order to perform necessary tasks. Avery and Watson [2] defined 4 types of users: (1) power users, (2) business users, (3) technical users, and (4) executives where they have different needs and tasks that are categorized into strategic, tactical and operational. Imhoff and Pettit [18] suggested realizing the different types of analyses and grouping them with similar characteristics can gain a valuable head start in understanding, anticipating, and satisfying their needs.
Another important aspect of BI deployment is BI Governance [21], which is defined as ‘defining and implementing an infrastructure that will support firm’s goal’. The infrastructure includes the hardware, software, staffing and strategy needed to glean intelligence from data. Moss [23] put forward the idea of the alignment between business and IT in BI governance and suggested that successful BI deployment are initiated and driven by business rather than IT. Sherman [32] suggested that BI steering committee should be formed in order to sponsor and govern design, development and deployment of BI project. It needs both the Chief Information Officer (CIO) and a business executive, such as Chief Financial Officer (CFO), Chief Operations Officer (COO), or a senior Vice President of marketing/sales to commit budget, time, and resources. Users training and support play an important role in BI Governance. Training would include all level of users that differs in their tasks and responsibility about data and information needs in organizations [2].
Another four antecedents under Innovation’s Perception Group used for this study are: (1) Relative Advantage, (2) Compatibility, (3) Complexity, and (4) Problem Solver (adapted from Rogers [29] and Mustonen-Ollila [24]). Relative advantage is the degree to which an innovations is perceived as better than it supercedes, Compatibility is the degree to which an innovation is perceived as being consistent with existing values, past experience, and need of potential adopters, Complexity is the degree to which an innovation is perceived as difficult to understand and us [39]. Problem Solver is the desirability of adopting an innovation depending on the problem the innovation promises to solve for the adopter [24]. Other Factors Apart from above mentioned antecedents, Organizations culture also plays an important role in BI success [23]. Large percentage of BI applications fails not because of technology but organizational culture and infrastructure dysfunctions. Firms that instill the right organizational culture are foreseen to be successful in deploying BI initiatives. Creating a learning organization culture has become an important strategic objective for many firms that hinges on the acquisition of information [7]. Weir [38] added that knowledge sharing culture is also critical in ensuring the success of BI deployments. For BI to work, the entire organization must participate in intelligence gathering and sharing.
Utilization of BI tools is also been mentioned in literature as an important criterion in deploying and using BI. Carvalho and Ferreira [8] and Chung et al. [10] defined two classes of BI tools. The first class of tool is used to manipulate massive operational data and to extract essential business information. Examples include Decision
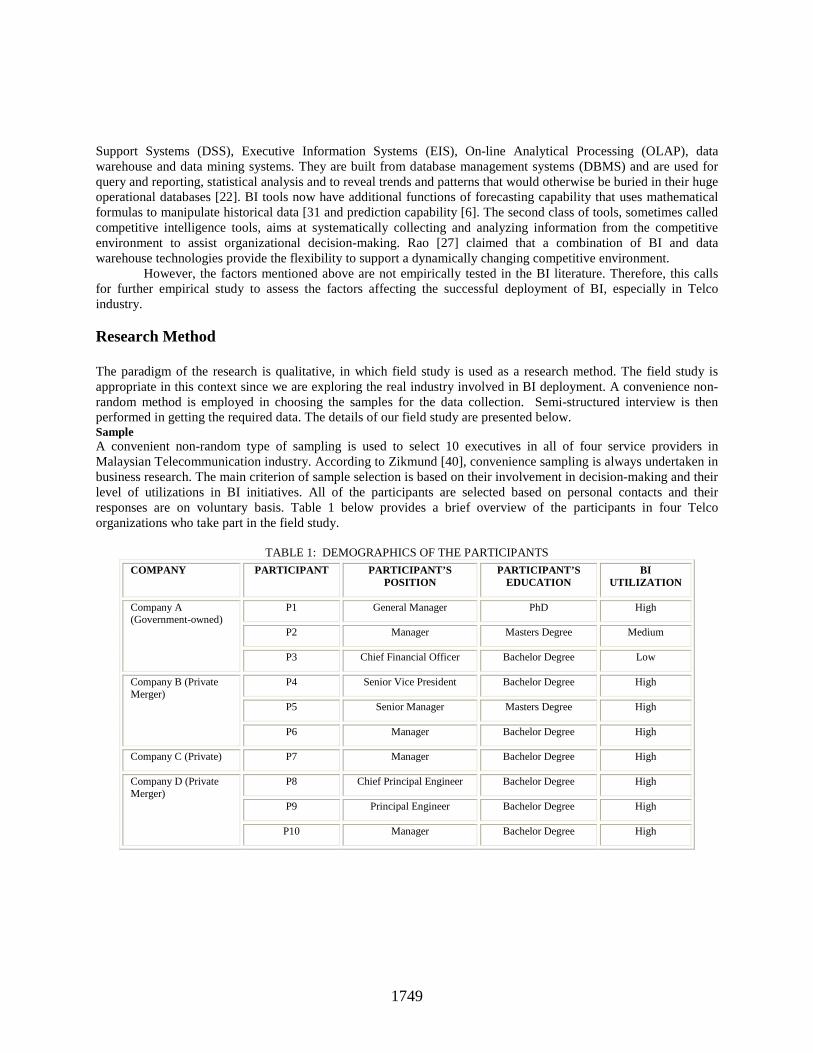
1749
Support Systems (DSS), Executive Information Systems (EIS), On-line Analytical Processing (OLAP), data warehouse and data mining systems. They are built from database management systems (DBMS) and are used for query and reporting, statistical analysis and to reveal trends and patterns that would otherwise be buried in their huge operational databases [22]. BI tools now have additional functions of forecasting capability that uses mathematical formulas to manipulate historical data [31 and prediction capability [6]. The second class of tools, sometimes called competitive intelligence tools, aims at systematically collecting and analyzing information from the competitive environment to assist organizational decision-making. Rao [27] claimed that a combination of BI and data warehouse technologies provide the flexibility to support a dynamically changing competitive environment.
However, the factors mentioned above are not empirically tested in the BI literature. Therefore, this calls for further empirical study to assess the factors affecting the successful deployment of BI, especially in Telco industry.
Research Method The paradigm of the research is qualitative, in which field study is used as a research method. The field study is appropriate in this context since we are exploring the real industry involved in BI deployment. A convenience non-random method is employed in choosing the samples for the data collection. Semi-structured interview is then performed in getting the required data. The details of our field study are presented below. Sample A convenient non-random type of sampling is used to select 10 executives in all of four service providers in Malaysian Telecommunication industry. According to Zikmund [40], convenience sampling is always undertaken in business research. The main criterion of sample selection is based on their involvement in decision-making and their level of utilizations in BI initiatives. All of the participants are selected based on personal contacts and their responses are on voluntary basis. Table 1 below provides a brief overview of the participants in four Telco organizations who take part in the field study.
TABLE 1: DEMOGRAPHICS OF THE PARTICIPANTS
COMPANY PARTICIPANT PARTICIPANT’S POSITION
PARTICIPANT’S EDUCATION
BI UTILIZATION
P1 General Manager PhD High
P2 Manager Masters Degree Medium
Company A (Government-owned)
P3 Chief Financial Officer Bachelor Degree Low
P4 Senior Vice President Bachelor Degree High
P5 Senior Manager Masters Degree High
Company B (Private Merger)
P6 Manager Bachelor Degree High
Company C (Private) P7 Manager Bachelor Degree High
P8 Chief Principal Engineer Bachelor Degree High
P9 Principal Engineer Bachelor Degree High
Company D (Private Merger)
P10 Manager Bachelor Degree High

1750
Data Collection
The semi-structured interview questions have focused on the following areas of information needed in the study: i) General perceptions and understanding of BI ii) The main factors that influence the successful BI deployment iii) Usage of BI-based knowledge in decision-making activities iv) Required tools for generating knowledge v) The role of organization culture in utilizing BI-based knowledge vi) The role of business strategy in BI success especially in aligning between knowledge and business The interviews are scheduled as per convenience of the interviewees to ensure less disruptions and
interruptions in their working schedule. Prior to an interview session, a participant is contacted by telephone to provide an idea of the interview process and some brief understandings of BI. The duration of a one-to-one interview session takes about 1 to 2 hours to complete. Fruitful discussions are observed during the sessions where the interviewer managed to tap some of the information that was not pre-defined in the questions. This may be due to the fact that most of the participants are aware of the subject matter and they are quite involved in BI initiatives. The interview data are noted with the interviewees’ permission and their voices are recorded using a micro-audio recorder. To ensure trustworthiness of the data, the write-up of the full set notes is done soon after the event [30]. These are performed immediately to ensure accurate data from participants’ body languages and physical and emotional cues. Next, the verbatim transcriptions of all the recorded interviews are completed for data analysis [31]. Data Analysis Content analysis is chosen to analyze the data because of the qualitative field study is exploratory in nature, rather than confirmatory. There are more than 100 pages of verbatim transcripts from micro-audio and notes to be analyzed despite only 10 participants involved the interviews. Content analysis is carried out in two phases. Phase one involves analysis of an individual script, while phase two deals with integrating these individual scripts [39]. Analysis is conducted manually because of the nature of a simple language used by Malaysian participants. The researcher has to carefully interpret the meaning of every word and sentence uttered by participants. A combination of inductive and deductive approaches is then performed to categorize the factors and variables. Detail of the steps involved in analyzing the data is shown in Appendix A.
All the interview transcripts are first carefully analyzed manually (Step A1). An inductive process is first performed on the transcripts, where every single word and sentence is reviewed to uncover key patterns or themes (Step A2). Keywords or phrases are produced at this stage in order to be used later (Step A3). The key words or phrases are given labels or categories (Step A4). High-level factors and corresponding variables are identified. The relationship between factors from each script is identified next (Step A5). A deductive process is performed here where the identified factors are matched with the ones found in the literature previously (Step A6). These factors are revised and updated accordingly without scarifying any factors and variables obtained from the interviews (Step A7). Tables of factors, variables and their links are finally developed for each interview (Step A9).
The main aim of the second phase of the content analysis is to develop a finalized BI model based on the factors, variables and links that have been identified in the previous phase. The best way to do it is to integrate all the information gathered so far into one single entity. As shown in Step B1, the similarities and differences of variables under each factor are identified. A mathematical ‘union’ concept is used at Step B2 in integrating the similar variables. The new combined variable is given a new name and unique variables are retained (Step B3). The same ‘union’ concept is used to integrate the links among the factors (Step B4). Then, Step B5 developed the final tables of factors, variables and their links. Finally, the new combined BI model is developed.
Results Demography Table 1 presents the demographics information on the companies involved in the study. There are 10 executives from all of 4 companies in Telco industry in Malaysia willingly took part in the study. It should be noted that all of them had some level of decision-making as part of their responsibilities. Additionally, the levels of BI utilizations

1751
among them were fairly high. As a result, the majority of them were aware of the issues involved in BI deployment and its relationship with company’s sustainable competitive advantage, through their working experience. All of the participants were also aware of the importance of acquiring knowledge in decision-making process and they were to certain extent contributing to the organizations’ policy-making process. Factors and Variables of Successful BI Deployment From the content analysis mentioned earlier, 12 factors and 68 different variables of successful BI deployment are produced. Different participants have mentioned either similar or different variables during the interview sessions. A complete list of factors and variables with subsequent frequencies is shown in Appendix B. Out of 12 factors, 11 are primary factors. These are: Quality Information, Quality Users, Effective BI Governance, Relative Advantage, Problem Solver, Organization Culture, Business Strategy, Individual Benefits and Company’s Benefits. It is noted that if possible the factors are labeled in line with the literature. However, some of the variables identified differed in their meaning, as they are intended to represent the responses of the participants in the context of BI deployment.
It is interesting to note that out of 68 different variables; only 9 variables are mentioned by all 10 participants. These variables are Accuracy, Govern Design, Development and Deployment of BI, User Training and Support, Online Real-time Capability, Fully Integrated to Various Data Sources, Warehouse Concept, Satisfied Users, Good Reporting Features and Reviewed Regularly and they are called major significant (not in statistical sense) variables.
The responses from the participants confirm the influence of the firm’s internal resources factor of Quality Information, Quality Users and Effective BI Governance. Variables Accuracy, Accessibility, Completeness and Currency under Quality Information factor receive majority responses by participants. So do variables Technical Skills, Business Skills and Analytical Skills under Quality Users factor and variables Govern design, development and Deployment, User Training, Retraining & Support, Enforcement & Top Down Directive and Management Support under Effective BI Governance factor. However, there is limited support for the influence of Quality Process Flow although this construct is identified as important factor in the deployment of BI initiatives and IT systems in general [28]. Only one participant, a network manager from leading Telco Company, mentions this factor.
There are also very strong support from amongst the participants for the innovation perception factor of Relative Advantage and Problem Solver. In order to successfully deploy BI in organizations, the concept of anytime, anywhere and fully integrated to legacy systems, data warehouse that store various information in one place, total solutions across departments as well as reliable systems and ease of use are necessary. However, variables of Compatibility and Complexity are not supported by the interview findings, where none of these participants mention them.
Organizational Culture is one of the most significant variables affecting successful IT and other related technology. A learning organization and sense of business competition are the right culture to nurture BI deployment. The Use of BI Tools factor may be the most important factor for the success of BI deployment. BI is considered an effective business tool and used for Online Analytical Processing (OLAP) capability, data mining, performance monitoring, customer profiling, revenue and network forecast, among many other usage. Successful BI Deployment Model The model is developed through a process of identifying the similarities and differences between factors in the literature and those identified by all the participants in the field study. By combining the similar factors identified in the interview analysis, the model is finalized as shown in figure 1 below. The figure shows a comprehensive model of the factors and variables that affect the successful deployment of BI. From the model, it is observed that the basic determinants, which are obtained from the literature, apply quite effectively in the successful BI deployment. These determinants are Quality Information, Quality Users, BI Governance, Business Strategy, Use of BI Tools, and Organization Culture, which falls under firm’s unique resources. The other group of determinants consists of Relative Advantage, Problem Solver, Individual Benefits and Company’s Benefits belongs to Innovation’s Perception group.
Organizations planning to embark on BI can consider these variables as criteria of successful deployment. However, these criteria may not be applicable to all Telco organizations. Careful analysis is first needed to select the appropriate criteria for the company. A multiple criteria modeling approach can then be undertaken to access the
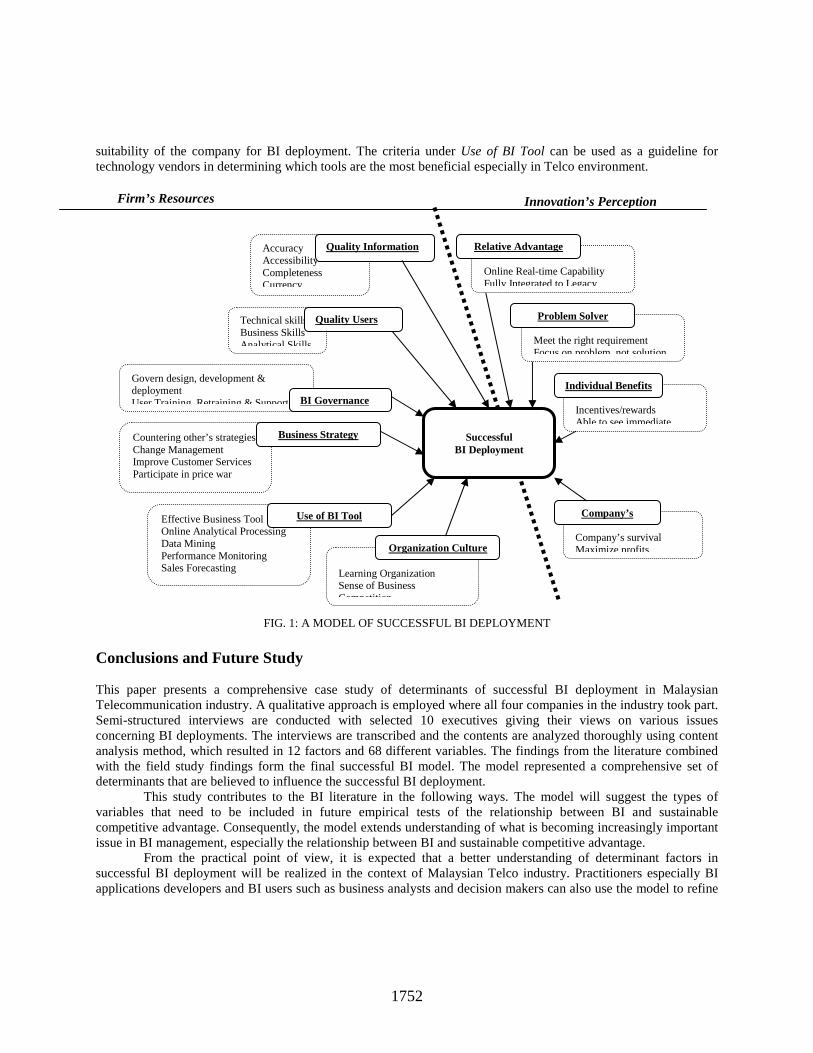
1752
suitability of the company for BI deployment. The criteria under Use of BI Tool can be used as a guideline for technology vendors in determining which tools are the most beneficial especially in Telco environment.
FIG. 1: A MODEL OF SUCCESSFUL BI DEPLOYMENT
Conclusions and Future Study
This paper presents a comprehensive case study of determinants of successful BI deployment in Malaysian Telecommunication industry. A qualitative approach is employed where all four companies in the industry took part. Semi-structured interviews are conducted with selected 10 executives giving their views on various issues concerning BI deployments. The interviews are transcribed and the contents are analyzed thoroughly using content analysis method, which resulted in 12 factors and 68 different variables. The findings from the literature combined with the field study findings form the final successful BI model. The model represented a comprehensive set of determinants that are believed to influence the successful BI deployment.
This study contributes to the BI literature in the following ways. The model will suggest the types of variables that need to be included in future empirical tests of the relationship between BI and sustainable competitive advantage. Consequently, the model extends understanding of what is becoming increasingly important issue in BI management, especially the relationship between BI and sustainable competitive advantage.
From the practical point of view, it is expected that a better understanding of determinant factors in successful BI deployment will be realized in the context of Malaysian Telco industry. Practitioners especially BI applications developers and BI users such as business analysts and decision makers can also use the model to refine
Firm’s Resources Innovation’s Perception
Learning Organization Sense of Business Competition
Organization Culture
Countering other’s strategies Change Management Improve Customer Services Participate in price war
Business Strategy
Effective Business Tool Online Analytical Processing Data Mining Performance Monitoring Sales Forecasting
Use of BI Tool
Govern design, development & deployment User Training, Retraining & Support BI Governance
Accuracy Accessibility Completeness Currency
Quality Information
Technical skills Business Skills Analytical Skills
Quality Users
Successful
BI Deployment
Meet the right requirement Focus on problem, not solution
Problem Solver
Online Real-time Capability Fully Integrated to Legacy
Relative Advantage
Incentives/rewards Able to see immediate
Individual Benefits
Company’s survival Maximize profits
Company’s

1753
their thinking about BI and their firm’s other strategic resources. The model will suggest the types of BI investments that are most likely to be the sources of sustained competitive advantage. Our immediate future plan is to study the model further using a structural equation modeling approach. This part of the research will use a quantitative approach, which will test a number of hypotheses and the model itself.
References
[1] Alshawi, S., Saez-Pujol, I., & Irani, Z. (2003), Data Warehousing in Decision Support for Pharmaceutical
R&D Supply Chain, International Journal of Information Management’, vol. 23, pp. 259-268. [2] Avery, K. L., & Watson, H. J. (2004), Training Data Warehouse End Users, Business Intelligence Journal,
vol. 9, no. 4, pp 40-51. Retrieved: April 16, 2005 from ABI/INFORM Global. [3] Barney, J. B. (2001), Is the Resource-based “View” a Useful Perspective for Strategic Management
Research? Yes, Academy of Management Review, vol. 26, no. 1, pp. 41-56. [4] Bergerou, J. (2005), Gaining Business Intelligence. Retrieved: April 1, 2005 from http://click-here-for-
more-information.com/business-intelligence.htm. [5] Berstein, A., Grosof, B., & Provost, F. (2001), Business Intelligence: The Next Frontier for Information
System Research?, Proceedings of the Workshop on Information Technologies and Systems (WITS ’02), New Orleans, LA, USA, Dec 15-16, 2001.
[6] Breault, J. L., Goodall, C. R., & Fos, P. J. (2002), Data Mining a Diabetic Data Warehouse, Artificial Intelligence in Medicine, vol. 26, pp. 37-54. Retrieved: 15 April 2005 from Elsevier Science B.V.
[7] Buhler, P. M. (2003), Managing in the New Millennium: Business Intelligence – an Opportunity for a Competitive Advantage, Supervision, vol. 64, i. 8, pp. 20-23.
[8] Carvalho, R. B., & Ferriera, M. A. T. (2001), Using Information Technology to Support Knowledge Conversion Process, Information Research, vol. 7, no. 1, October 2001.
[9] Chuang, S-H. (2004), A Resource-based Perspective on Knowledge Management Capability and Competitive Advantage: An Empirical Investigation, Expert Systems with Applications, vol. 27 (2004), pp 459-465. Retrieved: May 10, 2005 from Elsevier Ltd.
[10] Chung, W., Chen, H., & Nunamaker Jr, J. F. (2003), Business Intelligence Explorer: A Knowledge Map Framework for Discovering Business Intelligence on the Web, Proceedings of the 36th Hawaii International Conference on System Sciences (HICSS’03).
[11] Dijcks, J-P. (2004), Integrating Data Quality into Your Data warehouse Architecture, Business Intelligence Journal, vol. 9, no. 2, pp. 18-26. Retrieved: 15 May 2005 from ABI/INFORM Global
[12] Ferguson, M. (2005), Integrating CPM and Business Intelligence. Retrieved: 26th December 2002 from http://www.ibm.com.
[13] Ghoshal, S., & Kim, S. K. (1986), Building Effective Intelligence Systems for Competitive Advantage, Sloan Management Review, vol. 1, 49-58 (Fall 1986)
[14] Golfarelli, M., Rizzi, S., & Cella, I. (2004), Beyond Data Warehousing: What’s Next in Business Intelligence?, Proceedings of the 7th ACM International Workshop on Data Warehousing and OLAP, November 12-13, 2004, Washington, DC, USA.
[15] Golfarelli, M., Rizzi, S., & Cella, I. (2004), Beyond Data Warehousing: What’s Next in Business Intelligence?, Proceedings of the 7th ACM International Workshop on Data Warehousing and OLAP, November 12-13, 2004, Washington, DC, USA.
Contact author for the full list of references

1754
Appendix
APPENDIX 1: CONTENT ANALYSIS PROCESS
STAGE 1
Step A1. Manually analyze the interview transcripts
Step A4. Produce labels or categories of the keywords or phrases
Step A5. Identify high-level factors and corresponding variables
Step A9. Develop table of factors, variables and their links
Deductive Process
Step A8. Revise and update the result accordingly
Step A7. Match the factors and variables with literatur e
Step A6. Look for relationship among
Inductive Process
Step A2. Review every single word and sentence to uncover patterns/themes
Step A3. Produce keywords or phrases
STAGE 2
Step B6. Develop the combined BI model
Step B2. Use ‘union’ concept to integrate the variables
Step B1. Identify similarities and differences in the variables
Step B5. Develop finalized tables of factors, variables and their links
Step B4. Use ‘union’ concept to integrate links among factors
Step B3. Give common name. Retain unique variable

1755
APPENDIX 2: FACTORS AND VARIABLES OF SUCCESSFUL BI DEPLOYMENT
Factors Variables R1
R2
R3 R4 R5 R6 R7 R8 R9 R10
Quality Information Accuracy
/ / / / / / / / / /
Accessibility
/ / / / / /
Completeness/Comprehensive / / / / / / / /
Currency / / / / / / /
Format/Presentation (Graphical/diagrammatic)
/ / / / / / /
Availability of internal data (database) / / / / / / / / /
Availability of external data (market/competitor/industry/new technology))
/ / / / / /
Integrity / / / / /
Meeting company’s requirements / / / / / /
Quality Users
Technical skills
/ / / / / /
Business skills / / / / / / /
Analytical skill / / / / / / / /
Competence/ Knowledgeable / / / / / /
Ability to understand requirements well / / / / / / / / /
Determination to use and act based on data / / / / / /
Ability to utilize data and turn into knowledge
/ / / / / / / /
Willingness to optimize the systems capabilities
/ / / / /

1756
Quality Process Flow
Process that drive technology /
Total solution /
Good communication /
Efficient /
Effective /
Effective BI Governance
Govern design, development & deployment of BI
/ / / / / / / / / /
User Training, Retraining & Support for various level of BI utilization
/ / / / / / / / / /
Enforcement to benefit organization/top down directive
/ / / / /
Management involvement and support
/ / / / /
Relative Advantage
Online real-time capability/concept of anytime, anywhere
/ / / / / / / / / /
Fully integrated to legacy systems/various data sources
/ / / / / / / / / /
Warehouse that store all data in one place
/ / / / / / / / / /
Total solutions across departments / / / / /
Reliable
/ / / / / / /
Ease of use
/ / / / /
Problem Solver
Meet the right requirements / / / / / / / /
Focus on problem, not solution / / /
Successful BI Deployment
System dependant / / / / / / / /
Satisfied users / / / / / / / / / /
Total reliance on BI / / / / / / / / /
Decision-making dependant on BI-based info
/ / / / / / / / /
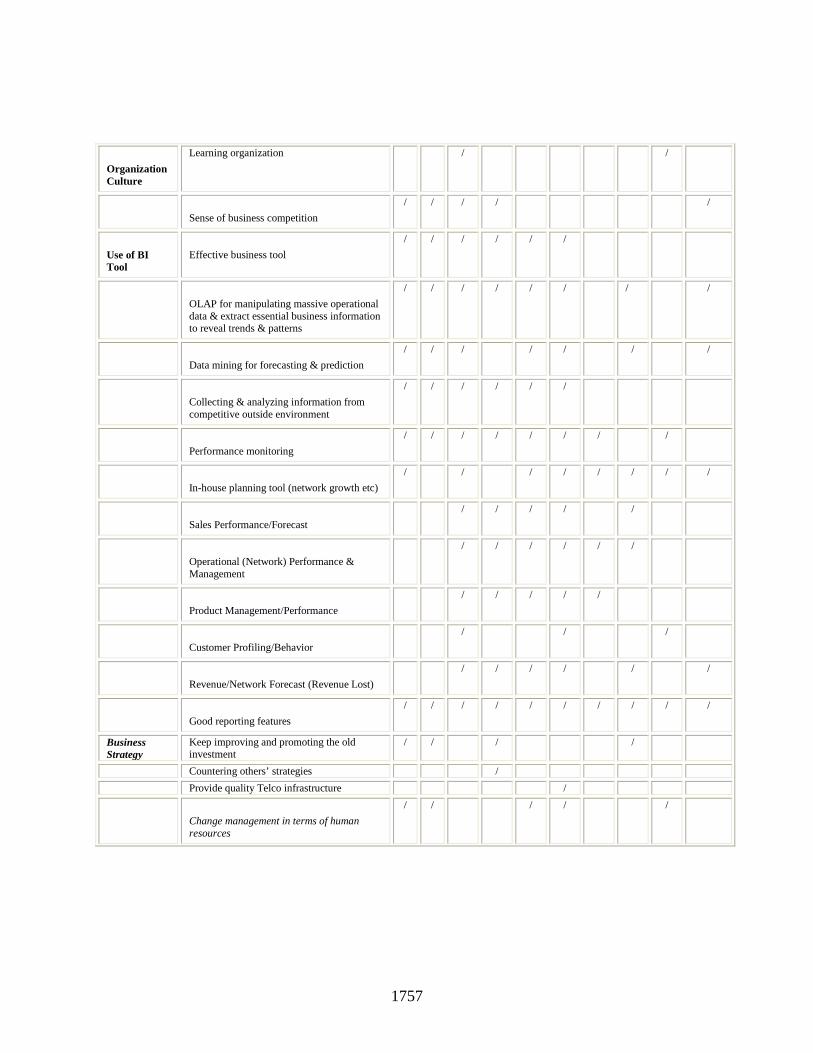
1757
Organization Culture
Learning organization / /
Sense of business competition
/ / / / /
Use of BI Tool
Effective business tool
/ / / / / /
OLAP for manipulating massive operational data & extract essential business information to reveal trends & patterns
/ / / / / / / /
Data mining for forecasting & prediction
/ / / / / / /
Collecting & analyzing information from competitive outside environment
/ / / / / /
Performance monitoring
/ / / / / / / /
In-house planning tool (network growth etc)
/ / / / / / / /
Sales Performance/Forecast
/ / / / /
Operational (Network) Performance & Management
/ / / / / /
Product Management/Performance
/ / / / /
Customer Profiling/Behavior
/ / /
Revenue/Network Forecast (Revenue Lost)
/ / / / / /
Good reporting features
/ / / / / / / / / /
Business Strategy
Keep improving and promoting the old investment
/ / / /
Countering others’ strategies /
Provide quality Telco infrastructure /
Change management in terms of human resources
/ / / / /

1758
Improve customer services
/ /
Venture into different market by introducing unique new product and services
/ / / / /
Participate in price war / / /
Mission and vision of the organizations /
Reviewed regularly (periodically or ad-hoc) / / / / / / / / / /
Individual Benefit
Incentive/rewards / / /
Able to see immediate benefit /
Incentive/rewards /
Organizational Benefit
Company’s survival / / / / / / / / /
Maximize company’s profit / / / / / / / / /

1759
An Analysis of the Relationship between ICT Diffusion and Business Start-Ups in Japan
Yuka Sakamoto, @ms.kagu.tus.ac.jp Wendy A. Spinks, [email protected]
Tokyo University of Science (RIKADAI), JAPAN Abstract This paper examines two questions: does ICT diffusion act to expand the number of business start-ups in Japan; and does ICT diffusion trigger more business start-ups by Japanese women and seniors? The data set (N=6,783) is from the telework population survey conducted by the Japanese Ministry of Land, Infrastructure and Transport (M LIT) in November 2002. The major findings are: a higher probability for workers who used ICT prior to their cu rrent job to establish new businesses than those with no prior ICT experience; a higher probability for workers in specialist/technical occupations to establish new businesses than those in non-white collar occupations, but not to a statistically significant degree; a higher probability for workers aged sixty and over to establish new businesses than those in other age groups; a difference in the rate of business start-ups between males and females; and women with small children show a stronger tendency to opt for establishing new businesses. Research Background Diffusion as a Driver of Business Start-Ups Whereas the number of self-employed businesses in the Japanese agricultural and retail sectors has fallen consistently since 1975, it has been noted that the increase in the number of specialist and/or technical self-employed businesses during the same period is high (Yahata 1998). This increase is frequently attributed to the emergence of a new group of technologically-savvy self-employed businesses known as SOHOs (Small Office Home Office). In Japan information and communication technologies spread rapidly in the latter half of the 1990s, the number of technologically-savvy self-employed workers as of 2005 reportedly being approximately 1.68 million or 16.5% of all self-employed workers in general (MILT, 2006). In recent years, the number of non-primary industry self-employed businesses in many European countries including Germany, Denmark, the Netherlands and the United Kingdom has shown a slight increase (Hoffman & Walwei, 2003). Elsewhere, while it is commonly mooted that the diffusion of ICT has led to an increase in the number of non-primary industry self-employed businesses in Europe, the United States and Japan, an exact definition of what constitutes this type of new freelancer or self-employed worker created by the rise of ICT has yet to be established. As a result, it is extremely difficult at present to conduct an international comparison of the number of technologically-savvy self-employed workers using statistical data. Diffusion as a Driver of Business Start-Ups There are three main factors behind the increase in small-scale, specialist and/or technical self-employed businesses accompanying the diffusion of ICT. The first is the relatively small amount of capital required to start ICT-based ventures. The vast majority of self-employed workers using ICT are involved in some form of information-related activity. In contrast to the large amount of capital required for plant investment in manufacturing, for example, information-related businesses can be boot-strapped, the amount of initial investment required being minimal especially with the growing progress in smaller and cheaper computers and peripherals since the 1990s. Furthermore, due to the widespread diffusion of ICT, information-based businesses are not as location-sensitive as services that require face-to-face interaction and therefore conveniently located customer premises. As a result, smaller initial costs are deemed to lower the hurdle for starting up businesses. The second factor is the corporate trend to greater outsourcing and the accompanying drop in the number of employees on the payroll witnessed in the 1990s, a trend common to Europe, the United States and Japan (Ohsawa & Houseman, 2003). The two main causes of outsourcing are the increase in international competitiveness triggered by the global economy and the subdivision of manufacturing processes (ibid.). The adoption of ICT inside firms also

1760
led to a standardization of business processes, thereby opening the way for the outsourcing of in-house tasks. In other words, the need to accumulate specialist in-house human capital has fallen (Abe, 2001). The third factor does not concern socio-economic change, but rather a growing desire on the part of individual workers to engage in self-employment. For example, Pink (2001), who pointed to the growing number of free agents in the United States, cites two reasons for the trend: 1) the risk inherent in working continuously for a single employer as individual longevity increases but corporate longevity decreases; and 2) the difficulty in meeting both work and family obligations as firms make increasing time demands on their workers as well as the difficulty for women to achieve internal rewards with the so-called “glass ceiling” still firmly entrenched. Accordingly, he sees women as key players in the freelance and/or self-employed market. In Japan, the number of female workers is increasing, but approximately 70% of women employed before childbirth are reported to leave their jobs following childbirth (MHWL, 2002). The trend to resign from work due to childbirth is especially pronounced among salaried workers, most self-employed workers staying in the workforce (Nagase, 1997). Higher levels of education and longer periods in the workforce before marrying mean that an increasing number of women have accumulated considerable human capital prior to marriage. Should the barriers for establishing a business be lowered, women in salaried employment may not necessarily leave the workforce due to childbirth but opt to start their own business. Elsewhere, it has been reported that while many firms stipulate sixty years as their retirement age, many individuals wish to remain in the workforce after sixty. The age of pension eligibility has been raised due to Japan’s relatively rapid demographic graying and the government is actively pursuing policies to keep older workers in the workforce. Should the barriers for establishing a business be lowered, seniors may also opt to start their own business. Based on the above trends, this paper will attempt to answer two questions: 1) ICT diffusion is widely seen as lowering the barriers for starting up new businesses, but has ICT diffusion in fact acted to expand the number of business start-ups in Japan at present? 2) To date, the majority of new businesses in Japan have been established by males in their late thirties, but does the lowering of entrance barriers really expand the opportunities for women and seniors to establish their own businesses?
Methodology The Data Set Our research uses data collected at the individual worker level and analyzes individual work status choices to ascertain the relationship between ICT and business start-ups. The data itself consists of the individual survey sheets collected in the 2003 Comprehensive Policy Support Survey for Regional Activity Through the Promotion of Telework & SOHOs, conducted by the Urban Infrastructure Division in the Urban & Community Infrastructure Bureau of the Japanese Ministry of Land, Infrastructure & Transport (referred to hereafter as the “MLIT Telework Survey”). Table 1 provides an outline of the survey data, which is suitable for our research purpose given that it consists of a random national sample and provides detailed information on ICT usage and work status. The average age of the sample was 45.3 for males (range: 15-84) and 44.9 for females (range: 16-86). Compared to the 2002 Basic Survey on Workforce Composition (Japanese Bureau of Statistics), the sample’s ratio of under-twenty year olds is low and the ratio of 40-50 year olds is somewhat high (MLIT 2003). For analysis a data set of 5,346 was used after removing students and primary industry workers. The average age of this subset was 44.8 for males (range: 15-84) and 44.5 for females (range: 18-86).

1761
TABLE 1: AN OUTLINE OF THE MLIT TELEWORK SURVEY Survey Type Cross section survey Survey Subjects Nationwide, male & female workers 15 years and older Sampling Random Digital Dialing (RDD) Survey Method Phone interviews
Survey Period October 25 - November 10, 2002
Sample size No. Surveyed
Valid responses Response Rate
6,899 4,125 59.8% (revised sample size for within-household individual selection probability = 6,783)
No. used for analysis 5,346 excluding students and primary industry workers Analytical Variables The following analytical variables will be used.
Start-up Operators: The dependent variable “start-up operators” is 1 and “Others” the 0 dummy variable. Of the items indicating position level, those who corresponded to “company owner/manager” “freelance/self-employed (no employees)” as well as having ten years or less in current job were treated as “start-up operators”. Those in their current job for longer than ten years, employees and/or “family worker” and “piece worker” in the non-employee category were excluded. The cut-off point of ten years was chosen to ensure a sample size large enough to produce robust results in the statistical analysis. It was also felt that the ten-year period would allow us to explore the relationship of ICT and business start-ups, given that ICT started to diffuse rapidly in Japan in the first half of the 1990s.
ICT Usage: This is to ascertain whether business start-ups have increased due to ICT diffusion or not, and uses two variables: “ICT use in current job” and “ICT use before current job”. If e-mail and/or the Internet are used for business purposes “ICT use in current job” is 1; if not, 0 is the dummy variable. If length of e-mail use is longer than years in current job “ICT use before current job” is 1; if not, 0 is the dummy variable. The reason for using “ICT use before current job” is to identify a causal relationship, if any, between ICT use and business start-ups. In order to identify whether ICT diffusion has led to a business start-up, it is necessary to distinguish whether prior users of ICT established a business using their ICT skills or whether ICT is being used simply as a means of communication after setting up their business. If more people have been using ICT longer than having their own business, the proposition that new businesses are on the increase due to ICT diffusion will be held to be true.
Age (Age Group): This variable is used to ascertain whether older workers are setting up their own businesses or not. Moreover, since there is a large age bias in ICT users, age also acts as an important control variable for examining the effect of ICT itself on business start-ups. Actual age is used and categorized into five groups: 15-29, 30-39, 40-49, 50-59, and 60 and over.
Human Capital: The education and occupational variables are used here. The occupation variable is used to ascertain whether business start-ups are increasing in jobs that mainly use information. Since there is also a strong tendency for higher educated, white-collar workers to use ICT, age and education act as important control variables to determine the effect of ICT use. For the education variable, “senior high school graduate” is used as the benchmark, four additional categories being “junior high school graduate” “college graduate” “university graduate” and “graduate school graduate”. The MLIT Telework Survey includes an item on years in current job, but since it does not ask the total number of years in the workforce, age is used as a proxy for work experience. For occupation five categories are used, four white-collar categories from the Japanese Industrial Standard (JIS) classification (“clerical” “managerial” “sales” “specialist/technical”) and “non-white collar” for all other occupations.

1762
Needs: “Life stage” and the “dual income dummy” are used as variables to ascertain individual worker needs for setting up a business and working as a non-salaried worker. The need for non-salaried work, which provides greater work-hour discretion that being employed, is deemed to increase for workers with small children and a working spouse. For life stage, three categories for the various stages of child-raising are given, namely “youngest child 0-2 years of age” “youngest child 3 yrs – preschool” “youngest child at primary school”. An additional category for all others (single, no children in residence, junior high school and above) is also used. A value of 1 is used in the case of a working spouse; if not, 0. The 0 value also includes respondents with unemployed spouses and single respondents.
Results Firstly, descriptive results of the share of freelance/self-employed workers by gender, life stage and ICT usage are discussed. This is followed by logistic regression analysis using start-ups as the dependent variable, to identify the factors behind business start-ups. The analysis is conducted for the sample as a whole as well as for the male and female subsets. The full set analysis is used to ascertain whether male or female business start-ups are more numerous after controlling for all other variables. The subset analysis is used due to the large gender gap that exists regarding the share of ICT users and work status choices. Cross-Variable Relationships Share of Start-Up Operators: Table 2 provides a summary of the descriptive results for the share of start-up operators, the proportion being 7.3% for non-primary industry workers. Cross-variable analysis and χ2 testing show that “ICT Use” “Age” “Occupation” and “Life Stage” are statistically significant. Looking at the statistically different (those with an adjusted residual of 1.96) characteristics of start-up operators, in contrast to the low number who only chose ICT “use in current job”, a statistically significant number chose “use before current job”. Looking at age, the number of start-up operators in the 50-59 years of age group was statistically significantly low, but 60 and over was statistically significantly high. In terms of occupation, in contrast to existing literature, the proportion of start-ups in “specialist/technical” occupations was not statistically significant. The statistically significantly high results for “managerial” occupations may be a function of the considerably large number of start-up operators employing staff. The share of start-up operators also differs according to life stage, those with “youngest child 3 years – preschool” being statistically significantly high and those with “Single/Youngest child high school or above/No children in residence” low. Based on these cross-variable results alone, there does indeed seem to be a tendency for people using ICT before their current jobs to start-up a new business. Looking at the gender breakdown, the number of male start-up operators is slightly higher, but not statistically significant. While previous research indicates that males in their late thirties dominate new business start-ups, our results show that the proportion of start-up operators aged 60 years and over is high.

1763
TABLE 2: SHARE OF START-UP OPERATORS (%) Start-up Operators N
yes no TOTAL
Total ICT Usage*** Use in current job* Of whom, use before current job** Don’t use* Gender Male Female Age Group* 15-29 30-39 40-49 50-59* 60 and over** Education College University/Graduate School Junior/Senior High School Occupation*** Clerical** Managerial** Specialist/Technical Sales* Non-white collar Life stage*** Youngest child 0-2 yrs Youngest child 3yrs-preschool** Youngest child primary school Single/Youngest child high school or above/ No children in residence Dual income Yes No
5,347
1,618 658 3,072
2,953 2,394
684
1,179 1,356 1,418
711
474 1,476 3,397
1,147
276 1,117
838 1,969
356 371 656
3,964
2,709 2,637
7.3
3.6 7.8 6.4
6.0 5.3
5.1 5.3 6.3 4.7 8.0
6.3 5.8 5.6
2.9
12.3 6.6 7.2 5.3
7.3
10.8 4.9
5.2
5.6 5.8
92.7
96.4 92.2 93.6
94.0 94.7
94.9 94.7 93.7 95.3 92.0
93.7 94.2 94.4
97.1 87.7 93.4 92.8 94.7
92.7 89.2 95.1
94.8
94.4 94.2
100.0
100.0 100.0 100.0
100.0 100.0
100.0 100.0 100.0 100.0 100.0
100.0 100.0 100.0
100.0 100.0 100.0 100.0 100.0
100.0 100.0 100.0
100.0
100.0 100.0
***p<.001 **p<.01 *p<.05 Logistic Regression Analysis (Business Start-Ups) Tables 3, 4 and 5 give the results for the total sample, the male subset and female subset in that order. Model 2 includes the Human Capital variables and Model 3 the Needs variables. After ascertaining the impact of age, gender, human capital and needs on business start-ups, Model 4 incorporates the ICT usage variables and examines the effect of ICT use on business start-ups after controlling for all other variables. Age & Gender: Age and gender (only in the total sample) were loaded into Model 1 to verify whether women and older workers showed a propensity to establish their own businesses. While the cross-variable analysis indicated there were more male start-up operators than female, controlling for age resulted in more female start-up operators than male. In terms of age, start-up operators aged sixty years and over were high in both the total sample (Table 3) and the male sub-sample (Table 4). However, since start-up operators are limited to managers, self-employed and freelancers with 10 years or less in their current job, it should be kept in mind that the start-up operators aged sixty years and over include people who set up their businesses in their fifties.

1764
Impact of Human Capital: Model 2 incorporates the Human Capital variables. Education was not statistically significant in either the total sample or the two sub-samples. However, whereas it was negatively aligned in the male sub-sample, it was positively aligned in the female sub-sample. Of the occupational variables, only “managerial” showed a statistically significant positive alignment across all samples. While not statistically significant, “specialist/technical” loaded positively in all samples, and women in specialist/technical occupations showed higher start-ups than their male counterparts. Looking at the odds ratio, the probability of business start-ups in specialist/technical occupations as compared to non-white collar occupations was 1.17 times higher for males and 1.47 times higher for females. TABLE 3: SUMMARY OF LOGISTIC REGRESSION ANALYSIS FOR PREDICTING START-UPS (Total sample: N=3,322)
MODEL 1 MODEL 2 MODEL 3 MODEL 4 B SE B Odds B SE B Odds B SE B Odds B SE B Odds
Age (RG:15-29) 30-39 40-49 50-59 60 & over Gender(female dummy) [Human Capital] Ed.(RG:jnr/snr high) College Uni/Grad.School Occ.(RG:Non-white col) Clerical Managerial Specialist/Tech Sales [Needs] Life stage (RG:single/ high school & over/no child. resident) Youngest 0-2 yrs Youngest 3-prescl Youngest primary [IT Use] Use in current job Use before current job Constant
.063 .231
- .090 .490* .129
-3.007
.217 .208 .216 .223 .120
1.065 1.260 .914
1.632 1.138
.049 .192
- .178 .400+ .002
.177
- .107 - .644** .969*** .260 .329+
-2.963
.218 .209 .219 .227 .130
.213
.151
.211
.223
.171
.173
1.050 1.212 .837
1.492 1.002 1.193 .899
.525
2.637 1.297 1.390
- .162 .205
- .049 .526*
- .031 .224
- .124 - .626** .964*** .239 .313+
.539* .930***
- .016 -3.075
.231 .218 .225 .232 .131
.214
.152
.211
.223
.171
.174
.240
.208
.215
.851
1.228 .952
1.692 .969
1.251 .884
.535
2.621 1.270 1.367
1.713 2.534 .984
-.023 .397+ .101 .592* .080
.256 - .002
- .505* 1.154*** .332+ .365*
.619* 1.018*** .022
- .809*** .260
-3.225
.232 .222 .229
.2380 .133
.215
.158
.218
.229
.175
.176
.241
.209
.216
.176
.185
.977
1.487 1.107 1.807 1.084
1.290 .998
.603
3.171 1.394 1.441
1.857 2.768 1.022
.445
1.297
χ2 df
12.239* 5
55.778*** 11
77.079*** 14
110.361556*** 16
***p<.001 **p<.01 *p<.05 +p<.10 Needs’ Verification: Model 3 incorporates the variables concerning the need for work styles with a high degree of discretion over work hours. Looking at life stage, the probability of choosing business start-ups was high in all samples for respondents with small children. However, there was a difference in selection probability for males and females. Whereas the probability of males with children “3 years – preschool” opting for a business start-up was 1.93 times that of respondents without small children, the corresponding figure for females was 4.46 times. In the female sub-sample (Table 5), the probability of respondents with children “0 – 2 years” was also high, 5.22 times that of females with no small children. The impact of a working spouse was also explored in the male sub-sample (Table 4), but found not to be statistically significant. Finally, the probability of opting for business start-ups is lower for the 30-39 age groups in all samples in Model 3 as compared to Model 2.

1765
Effect of ICT: Model 4 incorporates the ICT-related variables. It was confirmed in the cross-variable analysis that ICT “use before current job” was statistically significant for business start-ups, indicating that previous use of ICT coincides with a tendency to establish new businesses. Model 4 looks at the impact of ICT vis-à-vis the probability of opting for business start-ups when controlling for other variables. The ICT variables produced the same results in all samples. Irrespective of the impact of other variables, ICT “use in current job” was statistically significant and loaded negatively for business start-ups. In contrast, ICT “use before current job” was statistically significant and loaded positively across all samples. The probability of male respondents who used ICT prior to their current job starting up a new business was 1.35 times higher than non-ICT users, the corresponding figure for females being 1.30 times. TABLE 4: SUMMARY OF LOGISTIC REGRESSION ANALYSIS FOR PREDICTING START-UPS (Male sample: N=1,999)
MODEL 1 MODEL 2 MODEL 3 MODEL 4 B SE B Odds B SE B Odds B SE B Odds B SE B Odds
Age (RG:15-29) 30-39 40-49 50-59 60 & over [Human Capital] Ed.(RG:jnr/snr high) College Uni/Grad.School Occ.(RG:Non-white col) Clerical Managerial Specialist/Tech Sales [Needs] Life stage (RG:single/ high school & over/no child. resident) Youngest 0-2 yrs Youngest 3-prescl Youngest primary Dual Income [IT Use] Use in current job Use before current job Constant
- .288 - .007 - .280 .512+
-2.709
.280 .262 .272 .271
.749 .993 .756
1.668
-.294 -.016 -.359 .405
-.131 -.175
-1.094** .764** .160 .270
-2.672
.282 .265 .278 .277
.459
.186
.376
.255
.233
.222
.745 .984 .698
1.499
.877
.839
.335 2.147 1.173 1.310
-.410 .053 -.250
.474+ -.144 -.175
-1.108**
.746**
.127
.248
.035 .659*
- .332 - .208 -2.647
.304 .285 .292 .286
.460
.186
.377
.255
.234
.223
.316
.288
.332
.172
.664
1.054 .779
1.606
.866
.839
.330 2.109 1.136 1.282
1.036 1.932 .718 .812
- .222 .280
- .070 .525+
- .102 - .070
- .999** .948*** .226 .300
.091
.746* - .261 - .213
- .756** .302 -2.726
.305 .293 .298 .297
.462
.195
.383
.262
.240
.225
.318
.289
.334
.174
.218
.240
.801
1.323 .932
1.691
.903
.932
.368 2.579 1.253 1.350
1.095 2.108 .770 .808
.469
1.353
χ2 df
13.695* 4
42.372*** 10
51.487*** 14
72.217*** 16
***p<.001 **p<.01 *p<.05 +p<.10
Comparing Model 4, which incorporates the ICT variables, and Models 1-3, the “60 years & over” coefficient is high in all models, but especially in Model 4. If the probability of respondents sixty years and over starting up a new business was to fall when incorporating the ICT usage variables, this would suggest that ICT usage would account at least partially for this probability. The results, however, indicate the opposite, namely that start-up operators age sixty and over are not ICT users.

1766
TABLE 5: SUMMARY OF LOGISTIC REGRESSION ANALYSIS FOR PREDICTING START-UPS (Female sample: N=1,323)
MODEL 1 MODEL 2 MODEL 3 MODEL 4 B SE B Odds B SE B Odds B SE B Odds B SE B Odds
Age (RG:15-29) 30-39 40-49 50-59 60 & over [Human Capital] Ed.(RG:jnr/snr high) College Uni/Grad.School Occ.(RG:Non-white col) Clerical Managerial Specialist/Tech Sales [Needs] Life stage (RG:single/ high school & over/no child. resident) Youngest 0-2 yrs Youngest 3-prescl Youngest primary [IT Use] Use in current job Use before current job Constant
.571 .603+ .222 .437
-3.292
.358 .349 .362 .396
1.771 1.827 1.248 1.548
.575 .543 .177 .467
.268
.150
-.354 1.682** .388 .439
-3.467
.359 .352 .368 .401
.250
.262
.275
.502
.257
.281
1.778 1.721 1.193 1.595
1.307 1.162
.702
5.374 1.474 1.551
.324 .820* .659+
.880* .394 .135
-.325 1.558** .337 .394
1.653*** 1.495*** .340 -3.962
.375 .377 .393 .418
.254
.267
.278
.516
.260
.284
.384
.317
.294
1.382 2.271 1.933 2.410
1.482 1.144
.772
4.751 1.400 1.482
5.221 4.459 1.405
.395
.977*
.785+
.999*
.423+ .224
- .210 1.682** .413 .429
1.775*** 1.568***
.354
- .727* .265
-4.084
.379 .388 .402 .427
.256
.276
.291
.529
.265
.287
.390
.321
.294
.302
.297
1.484 2.656 2.193 2.716
1.527 1.251
.811
5.375 1.512 1.536
5.898 4.798 1.424
.483
1.304
χ2 df
5.097 4
26.797** 10
55.817*** 13
64.990*** 15
***p<.001 **p<.01 *p<.05 +p<.10
Concluding Remarks Using data from a nationwide telework survey, this paper has explored whether the perceived impact of ICT diffusion on lowering of barriers for establishing new businesses actually affects workers’ choices to start up new businesses or not. The major findings can be summed up as follows. Relationship between ICT & Business Start-Ups There is a higher probability for workers who used ICT prior to their current job and workers in specialist/technical occupations to establish new businesses than those with no prior ICT experience, but not to a statistically significant degree. Conversely, the number of ICT users among start-up operators was small. Existing research (Fujioka, 2004) shows that the larger the place of employ, the greater the share of ICT users. Therefore, the small scale of start-up businesses may explain this low level of ICT usage. However, despite the fact that the number of ICT users is low among start-up operators, the fact that the findings show a tendency for ICT users to opt for establishing new businesses suggests that workers in ICT-based occupations are more likely to set up new businesses than non-ICT based occupations. It also suggests that despite the fact that the number of new business start-ups has been falling in recent years in Japan, ICT diffusion has led to a small increase in the new type of technologically savvy self-employed workers. Relationship between Age/Gender/Life Stage & Business Start-Ups The probability for workers aged sixty and over to establish new businesses was found to be statistically significantly higher than those in other age groups. However, no difference in the rate of business start-ups between

1767
males and females was seen. Additionally, women with small children showed a stronger tendency to opt for establishing new businesses. Bearing in mind that males in their thirties have to date accounted for the majority of business start-up in Japan, the high number of over-sixty start-up operators and the lack of a significant difference between start-up rates for the male and female samples, would seem to suggest that business start-up opportunities for older workers and female workers are indeed expanding. Taking into consideration the trend for over-sixty start-up operators to not use ICT, however, their high rate of business start-ups cannot necessarily be attributed to ICT diffusion. Rather women with small children and the over-sixty age group may merely be refusing to engage in jobs with a low level of discretion over work-hours, or are forced to opt for self-employment by being shut out of salaried employ due to age barriers. Accordingly, the spread of so-called decent jobs with a high degree of working hour discretion and job stability in the labour market may be a greater determinant of whether workers opt for self-employed business start-ups or not.
There are two main issues where future research would be valuable. The first concerns occupational classifications. In this paper, we used four categories for white-collar work, but in order to accurately ascertain the relationship between ICT and business start-ups, more detailed categorization such as the degree of work ICT dependence proposed by Sakamoto et al (2003) would seem advisable1. A second issue concerns the need to obtain more long-term data on start-up operators’ careers before and after setting up their businesses. Existing research has highlighted SOHO operators’ tendency to display little interest in growing their businesses over the long-term, but we were unable this time to analyze whether women with small children remain self-employed through various life-stages or whether they choose work status to match a given life-stage’s work requirements. This area could be clarified by event history analysis after obtaining sufficient information on start-up operators’ job experience.
References [1] Abe Masahiro (2001). What is the impact of ICT on employment? Japan Institute for Labor and Policy
Training Magazine, No.498. (in Japanese) [2] Fujioka Isao (2004). Factors determining Information Equipment Use. Naoi Yu & Taroumaru Hiroshi
(eds.) Interim Report from the National Survey on the Information Society (JIS). Osaka University. (in Japanese)
[3] Hoffman, Edeltraud & Walwei, Ulrich (2003). Changing Workstyles in Germany and Denmark. Ohsawa Machiko & Houseman, Susan (eds.) The Future of Work: A Comparison of Alternative Workstyles in Europe, the U.S. & Japan, Japan Institute of Labor. (in Japanese)
[4] Japanese Ministry of Health, Welfare & Labor (2002). The First Cross-sectional Survey on Children Born in the 21st Century. (in Japanese)
[5] Japanese Ministry of Land, Infrastructure & Transport, (2006). Results of the 2005 Telework Population Survey. http://www.mlit.go.jp/kisha/kisha06/04/040614_.html. Accessed 23/9/2006. (in Japanese)
[6] Nagase Nobuko (1997). Female work choices: home-based production and labor supply. Chuma Hiroyuki, Suruga Terukazu (eds.) Changes in Employment Practices & Female Labor, University of Tokyo. 279-312. (in Japanese)
[7] Ohsawa & Hausman (eds.) (2003). The Future of Work: A Comparison of Alternative Workstyles in Europe, the U.S. & Japan, Japan Institute of Labor. (in Japanese)
[8] Pink, D.H. (2001). Free Agent Nation: The future of working for yourself, Warner Business Books. [9] Sakamoto Y., Spinks, W.A., Shozugawa Y. (2003) An Analysis of the MLIT Survey 2002: The Japanese
telework [10] Population. The 8th International Telework Workshop, Electronic proceedings http://www/telework-
academy.org [11] Yahata Shigemi (1998). The Shift from Employee to Self-Employment. Japan Institute for Labor and
Policy Training Magazine, 452: 2-14 (in Japanese)

1768
End Notes
11) Jobs predicated on the diffusion and use of ICT (jobs directly involved with ICT, e.g. website design, programming, etc.); 2) jobs where the diffusion of ICT has changed a major part of how that job is performed (formerly paper-based jobs, e.g. design, finance, etc.); 3) jobs where the diffusion of ICT has changed a minor part of how that job is performed (jobs directly handling physical goods or dealing directly with clients, e.g. agriculture, transportation, retail sales, etc.).

1769
Can Organizational Type Be a Significant Predictor of Information Technology Adoption?
James Yao, [email protected] John Wang, [email protected]
Qiyang Chen, [email protected] Montclair State University, USA
June Lu, [email protected] University of Houston, Victoria, USA
Abstract Organizations need to constantly adopt new technological innovations one way or another in order to improve or keep their efficiencies or competitive advantages in business. What are the factors of an organization that can influence its adoption of new information technology? Can organizational type be a significant predictor of an organization’s IT adoption? The present study examined organizational type and its relationship with the adoption of an information technology, asynchronous transfer mode technology, in organizations. Research results provided significant evidence that there is a statistically significant relationship between organizational type and ATM technology adoption in organizations. Introduction Paisley (1985) stated that technological change has placed communication in the front lines of a social revolution. While some companies have the opportunities and resources to take advantage of low labor costs by moving their production facilities to low labor cost countries, other companies are forced to compete in this environment by making themselves more efficient (Ariss, et al., 2000). One way to improve their efficiency is to exploit modern technology (Millen & Sohal, 1998). As we moved from the Industrial Age into the Information Age (Toffler, 1980), means of communication and the exchange of information and information resources have come to rely increasingly upon computer-based information technologies and information systems. The computer-based information systems brought a very basic change in human communication (Rogers, 1986). Currently, personal computers and workstations are commonplace in organizations. Information technology and computers have given organizations the ability to establish effective information systems for business functional areas and even share hardware, software, and data resources with business partners. The increasing power of personal computers permits multimedia, virtual reality, streaming video, instant messaging, and other applications to be conducted on computer networks and over the Internet, especially in organizations. To exchange these applications of high-speed digital bits a great deal more bandwidth is required on the network, even with further onset of compression (Roberts, 1994). The commonly-used Ethernet and Token Ring networking technologies cannot deliver bandwidth on demand, particularly at the switching level. As more traffic is added to the network, especially voice and video, traditional technology becomes ever more incapable of satisfying the demands of business users. A solution for solving the bandwidth problem is needed to form a unified broadband network which can deliver high bandwidth on demand.
The incompatibilities between different types of LANs and WANs have existed for a long time. Data and voice messages need to be carried via different networks. There is a definite need for a unified broadband network. To provide such a broadband network, a switching and multiplexing technology suitable for the design of high capacity switches is the core. As many technologies failed their promises for the requested broadband services, asynchronous transfer mode (ATM) has stood out as one technology that has fulfilled its promise. ATM is a switching and multiplexing mechanism operating over a fiber based physical network. The essential features of ATM are a fixed-length packet (called a cell, a 53-byte packet with 5 bytes for header/footer and 48 bytes for information payload), which is switched based on a virtual circuit identifier in the cell header. All information types (voice, data, and video) are transported inside the cell. The most significant advantage of ATM is in its ability to do

1770
statistical multiplexing and thus can effectively handle the bursty variable bit rate (VBR) and constant bit rate (CBR) traffic types. It is primarily a connection-oriented technology using a combination of virtual circuits (VC) and virtual paths (VP) to establish an end-to-end connection. End-hosts request that the network sets up a virtual circuit via a signaling control protocol that allows them to specify the desired quality of service (Chatterjee & Xiao, 1997; Kalmanek, 2002). According to McDysan and Spohn (1995), ATM takes on many forms: provides software and hardware multiplexing, switching, and cross-connect functions and platforms; serves as an economical, integrated network access method; becomes the core of a network infrastructure; provides quality to the much-touted ATM service. ATM technology is one of the most important developments in internetworking in the last two decades. It has the potential to transform our network communication process. However the debate over the merits of such a technology is still going on (Crowcroft & McAuley, 2002).
Today, ATM is used to provide VPN (Virtual Private Network) services to businesses, consisting primarily of point-to-point virtual circuits connecting customer sites. ATM services represented a 2 billion dollar business in 2001. ATM provides the underpinning of DSL (Digital Subscriber Loop) services, which are growing rapidly. ATM is also used as the core network infrastructure for large Frame Relay networks and for some IP networks (Kalmanek, 2002). Based on the far-reaching significant position ATM possesses in networking, it can be seen that ATM will play a more important role in the building of a new utility infrastructure for communications technologies (Neff, 1994). The adoption of ATM technology will probably change the current networking systems, upgrade the quality of current networks, and provide increased services. Despite the increasing deployment of ATM technology and the important role it plays in today’s information technology infrastructure, little research has been found devoted to its study. A few recent researchers have examined organizational characteristics, such as organizational size, and their relationships to organizational adoption of technological innovations (Damanpour, 1987; DeLone, 1981; Eder & Igbaria, 2001; Kimberly & Evanisko, 1981; Lind, et al., 1989; Marcotte, 1989; Yap, 1990). However, no research has been found that studies ATM adoption in institutions of higher learning, nor has any research of this nature been found in other information technology and organizational studies. This research examined ATM technology adoption in university settings to determine whether university type is related to ATM adoption. It has been proposed that organizational variables have been clearly the best predictors of adoption of technological innovations (Kimberly & Evanisko, 1981). Identification of such organizational variables as university size and type will provide valuable information to researchers in their study of information technology adoption in universities, as well as similar information technology innovation adoptions in other settings. Furthermore, previous and current theories on new technology adoption focus primarily on issues at the individual level (Venkatesh & Brown, 2001). This study, however, brings a constructive contribution to the deposition of IT innovation adoption research, based on organizations, under the theory of innovation adoption and diffusion. The study originally included several organizational variables. However, organizational type was selected from among others for presentation in this paper to fit with the conference themes, paper scope, and size requirements. Therefore data analysis and discussions will be focusing on findings of this variable and its related indications. Conceptual Model and Research Question Since the publication of Lewin’s (1952) organizational change model and Rogers’ (1983) innovation diffusion theory, studies of organizational change have been increasingly associated with organizational innovation adoptions. Over the years and based on Lewin’s model, Kwon and Zmud (1987) developed their own information systems implementation model, which examines six stages of information systems implementation: initiation, adoption, adaptation, acceptance, use, and infusion. A number of studies have emerged from this model to examine the adoption and use of technological innovations in organizations (Eder & Igbaria, 2001). In fact, organizational study journals have recently published a number of papers that directly explore the consequences of adopting and using information technologies (Constant, et al., 1996; DeSanctis & Poole, 1994; Jarvenpaa & Leidner, 1999; Mitchell & Zmud, 1999; Orlikowski & Yates, 1994; Walther, 1995). This is because information technology research can benefit from incorporating institutional analysis from organizational studies, while organizational studies can benefit

1771
even more by following the lead of information technology research in taking the material properties of technologies into account (Orlikowski & Barley, 2001). Among the characteristics of organizational structure, organization type as a variable to study technological innovation adoption has been favorably examined. Damanpour (1991) observed that organizations of all types adopt innovations to respond to changes in their external and internal environments. However, organizational factors may unequally influence innovation in different types of organizations, as extra organizational context and the industry or sector in which an organization is located influence innovativeness (Van de Ven, 1986). Miller and Friesen (1982) observed that the impact of organizational variables on product innovation differs considerably between entrepreneurial and conservative firms. Hull and Hage (1982) found that the association between innovativeness and structural variables differs among traditional, mechanical, organic, and mixed organizations. In distinguishing types of organizations between manufacturing and service, Damanpour (1991) reported that considerable differences in the technologies and underlying dimensions of structure exist in these organizations. In the same paper, Damanpour also stated that differences can also exist among facilitators of the adoption of innovation in each type. The nature of activities of manufacturing and service organizations differ. Mills and Margulies (as cited in Damanpour, 1991) pointed out that unlike the situation in manufacturing organizations, in service organizations (a) the output is intangible and its consumption is immediate, and (b) the producer is close to the customer or clientthey must interact for delivery of the service to be complete. Thus, in a service context, technical core employees must deal with client variety and unpredictability, whereas in a manufacturing context, buffering roles reduce uncertainty and disruptions of the technical core (Daft, 1989). These differences would unequally affect both the determinants of innovation and the strength of their influence in each context (Damanpour, 1991). The same distinction applies to institutions. Different institutions have different missions and educational functions, and different institutions offer different degrees. The Carnegie Classification of higher education groups American colleges and universities on the basis of their missions and educational functions (Boyer, 1987). It is its different mission and educational function of each individual university that distinguishes itself from others. Accordingly, Research Universities give higher priority to research (The Carnegie, 1994), while non-research institutions give higher priority to teaching and other institutional missions. According to Carnegie Classification (The Carnegie, 1994), Research Universities I & II give higher priority to research. They receive more federal support and award more Ph.D. degrees than non-research universities annually. Boyer (1994) expressed research universities’ distinguishing missions and educational functions in this way:
“America must continue to support a core of world-class research centers; they are essential to the advancement of knowledge and to human achievement. Such activity is costly, however, and it is crucial that we have available the fiscal resources needed to sustain an expanding network of institutions devoted to scholarly research” (p. vii).
Institutional type has been used in some institutional related research works as an organizational variable, most of the time as one of the independent variables. Taggart (1994) used institutional type as one of his seven independent variables in his study on how the seven variables interact with budget decision criteria used by chief fiscal officers at 179 selected Research I, Research II, and Doctorate-Granting institutions of higher education. Dennison (1994) included institutional type and size as independent variables to examine what effect, together with other variables, they had on the described leadership behaviors of on-campus public radio station managers. Organizational type in institutions can be defined as research and non-research, or as public and private. In Matthews’ (1993) study, university type was defined as research university and teaching university. For the purpose of this study, university type is defined as Research University (which includes both Research Universities I and Research Universities II classified by The Carnegie Foundation for the Advancement of Teaching) and Non-Research University (which includes Doctorate-Granting Colleges and Universities I and II and Comprehensive Colleges and Universities I and II classified by The Carnegie Foundation for the Advancement of Teaching). Based on the literature drawn from technological innovation adoption and diffusion, the present research is guided by the research model developed by Damanpour (1987), Kwon & Zmud 1987), and the theoretical framework from Roger’s (1995) innovation diffusion theory. The study intends to answer such a research question:

1772
What is the relationship between organizational variable, namely university type, and university’s adoption of ATM technology? In other words, is there a statistically significant relationship between university type and ATM technology adoption in university settings? If the question is tenable, then organizational type can serve as a predictor of information technology innovation adoption. Methodology The research design for this study was correlational since this method permits analysis of the relationships among a number of variables in a single study (Borg & Gall, 1989). The sample subjects were randomly selected from the population of university domain LAN administrators in the United States. University domain LAN administrators are those who are directly involved in planning, constructing, administering university domain LAN infrastructure plus adopting and implementing state-of-the-art technology innovations, such as ATM. The preference of only university domain LAN administrators makes the selected subjects homogeneous so that more accurate data of the variable can be obtained (Borg & Gall, 1989). University type was defined as research university and non-research university (non-research doctorate-granting and neither research nor doctorate-granting) for this study. The list of research and non-research universities was obtained from the technical report published by The Carnegie Foundation for the Advancement of Teaching (The Carnegie, 1994).
A survey questionnaire was designed to identify the current and future status of ATM adoption in universities. It contained categorical items identifying ATM adoption status of participating universities. The questionnaire used in present research was reviewed by five experts in networking/telecommunications and ATM technology. Two of them were university domain LAN administrators. Suggestions from these experts were used to modify the questionnaire. The questionnaire was posted on the World Wide Web. E-mail was used to distribute the cover letter of the questionnaire to each university domain LAN administrator. A total of 554 user addresses were actually sent through via the Internet. From the 554 user addresses sent through, 208 responses were received for a response rate of 37.55%. Out of the 208 responses, 9 were unusable, leaving 199 usable, yielding a usable response rate of 35.92%. The response rates are shown in Table 1.
TABLE 1: SUMMARY OF RESPONSES
Out of 554 Mailed Initial Mailing 1st Follow-up 2nd Follow-up Total Rate% Responded 67 113 28 208 37.55% Unusable 2 7 0 9 Total Usable 65 106 28 199 35.92%
Data Analysis Logistic regression was employed to study the relationship between organizational variables and the ATM technology adoption status of a university. According to Hosmer and Lemeshow (1989), regression methods have become an integral component of any data analysis concerned with describing the relationship between a dependent variable and one or more independent variables. Very often the dependent variable is discrete, taking on two or more possible values. Logistic regression, in many fields, has become the standard method of analysis in this situation. The dependent variable in this study is dichotomous (adoption and non-adoption) with an objective of describing the relationship between the dependent variable, ATM technology adoption, and the independent variable of university

1773
type. Therefore, logistic regression was an appropriate statistical analysis method for this study. The data were analyzed by using Statistical Package for the Social Sciences (SPSS). Findings ATM Adoption Status Of the 199 responses received, 58 universities indicated that they had adopted ATM technology, which was 29.1% of the responses. Of these 58 universities which have adopted ATM, 51.7% (n = 30) were research universities and 48.3% were non-research universities. Among the non-research universities, 22.4% (n = 13) were doctorate-granting universities, and 25.9% (n = 15) were neither research universities, nor doctorate-granting universities. The frequencies of ATM adoption are shown in Table 2.
TABLE 2: FREQUENCIES OF ATM ADOPTION STATUS
University Type
Adopted Non-Adopted Total
Freq. Percent Freq. Percent
Research 30 51.7 16 11.4 46
Doctorate 13 22.4 23 16.3 36
Neither 15 25.9 102 72.3 117
Total 58 100.0 141 100.0 199
Total % 29.1 70.9 100
Speed, Bandwidth, and Efficiency Improvement About 93% (n = 54) of the universities, which had adopted ATM, reported that their networks’ speed, bandwidth, and/or efficiency had been improved since they adopted ATM. Only about 7% (n = 4) of the universities did not indicate speed, bandwidth, and/or efficiency improvement on their networks since they adopted ATM. Table 3 shows the frequencies of the speed, bandwidth, and/or efficiency improvement.
TABLE 3: FREQUENCIES OF IMPROVEMENT
Status Freq. Percent Improved 54 93.1 Not Improved 4 6.9 Total 58 100.0

1774
Logistic Regression Results Nested models were used to analyze model variables. Logistic regression coefficients for the nested models are listed in Table 4. According to Norusis (1994), logistic coefficient can be interpreted as the change in the log odds associated with a one-unit change in the independent variable. Logit (the log of odds) is represented by coefficient valueβ. Since it is easier to think of odds rather than log odds (Norusis, 1994), the logistic model uses Exp (β) (exponential function of coefficient) to represent odds, which can be interpreted as by increasing the value of independent variable’s coefficient from 0 to 1 the odds are increased by a factor of the value under Exp (β). If the independent variable’s coefficient value β is positive, this factor will be greater than 1, which means that the odds are increased; if the β value is negative, the factor will be less than 1, meaning that the odds are decreased. Based on this rule of thumb and the coefficient values revealed in Table 4, interpretations of these models are stated in each of the individual sections to follow. Model 2 Model 2 included independent variable UTYPE (university type). β coefficient for UTYPE is 1.6733. The Exp (β) value for UTYPE is 5.3297. The p-value for university type is less than .001. Therefore, it reveals that there is a statistically significant relationship between ATM Adoption and university type. To be more specific, the odds ratio of 5.3297 shows that, in this model, the odds of adopting ATM for research universities is about 433% greater than that for non-research universities.
Model 2 has a Model χ2 of 37.519 relative to two degrees of freedom, which is statistically significant (p < .05). Compared to Model 1, Model 2 improves the goodness-of-fit (37.519 - 23.979 = 13.540) (2 - 1 = 1). As a result, Model 2 is better than Model 1 because the variable university type further improves the fit by ∆ χ2 = 13.540 relative to one degree of freedom. Model 3 and Model 4 The odds ratio for UTYPE is 5.2095 in Model 3, which indicates that, the odds of adopting ATM for research universities is 421% greater than that for non-research universities. The p-value for university type is less than .001. There is a statistically significant relationship between university type and ATM adoption. It is apparent that university type is a significant predictor of ATM adoption. Model 3 shows a Model χ2 of 53.953 relative to three degrees of freedom, which is statistically significant (p < .001). Compared to Model 2, Model 3 improves the goodness-of-fit (53.953 - 37.519 = 16.434) (3 - 2 = 1).
In Model 4, the p-value of UTYPE is less than .01. The odds ratio for UTYPE is 4.5740, which indicates that the odds of adopting ATM for research universities are 357% greater than that for non-research universities. This allows us to conclude that, again, there is a statistically significant relationship between university type and ATM adoption. Model 4 yields a Model χ2 of 53.953 relative to two degrees of freedom, which is statistically significant (p < .001). Compared to Model 3, Model 4 improves the goodness-of-fit (59.618 - 53.953 = 5.665) (5 - 3 = 2). See Table 4 for details.

1775
TABLE 4: LOGISTIC REGRESSION COEFFICIENTS AND GOODNESS-OF-FIT FOR THE NESTED MODELS
Variable
Model 1 Model 2 Model 3 Model 4
β Exp (β) β Exp (β) β Exp (β) β Exp (β) ENROLLMT
.00008**
*
1.0001 .00003 1.0000 .00002 1.0000 .00002 1.0000
UTYPE
1.6733*** 5.3297 1.6505*** 5.2095 1.5204** 4.5740
NTBUDGET
.0528*** 1.0542 .0526*** 1.0540
MT1 .6980* 2.0098 MT2 .3479 1.4161 Model χ2
23.979 37.519 53.953 59.618
Df 1 2 3 5 Significance
.0000 .0000 .0000 .0000
*p<.05; **p<.01; ***p<.001

1776
Conclusion and Discussions The results of logistic regression statistical analysis satisfied the research question that statistically there is a significant relationship between ATM technology adoption and university type. University type revealed a strong association with ATM adoption. The data analysis findings in Model 4 indicate that research universities are 357% more likely to adopt ATM than non-research universities. Therefore, we can conclude that organizational type can be used as a significant predictor of information technology adoption.
Table 3 presents that 6.9% (n = 4) of the universities did not indicate an improvement of their networks’ speed, bandwidth, and/or efficiency since they adopted ATM. Does this mean that ATM adoption was not a good choice for these universities or does it mean something else? A comparison of the data reveals that three out of the four universities adopted ATM in the same year as the survey was administered, and the survey was sent out in the last two months of the year. This could signify several possibilities. It could be that they were not in the adoption evaluation phase to determine whether their network’s speed, bandwidth, and efficiency had been improved or the systems implementation of the technology was still in progress by the time they were administered the survey. Limitations, Implications, and Recommendations The subjects of the study were randomly selected from universities throughout the United States. Since the data were obtained from surveys and other means of data collection conducted by third party organizations, such as The Carnegie Foundation for the Advancement of Teaching, their data collection is presumably to be accurate, reliable, and unbiased. Thus, the generalizability of the results of this study may be subject to the influence of the findings of the above-mentioned factors. Moreover, the generalizablilty of this study may be limited to organizations with similar settings, levels, and technologies. Within this limitation, the following implications are posited. The results of the study provided strong evidence to support the postulation that university type is significantly related to ATM technology adoption in universities. The results support the earlier findings (Bayless & Johnson, 1990; Damanpour, 1987; Ellis, 1994; Lind, et al., 1989; Marcotte, 1989; Yap, 1990) that organizational type is a necessary factor when applied to the study of organizational adoption of information technology innovations. Thus the study has brought a constructive contribution to the deposition of information technology innovation adoption literature. The positive association between ATM adoption and university type indicates that organizations of certain types may have higher likelihood of adopting information technology innovations in order to keep their leading positions in the industry or academic standings. Being early adopters of new information technology may be one of the major factors that these organizations can sustain their current positions. Information technology vendors, on the other hand, can benefit from the research findings by realizing that certain types of organizations, such as research universities, are often early adopters of cutting-edge information technologies. These vendors ought to target markets based on their in-depth understanding of their current clients and potential customers, including their organizational characteristics, to establish larger and long-lasting markets for ATM technology and other new information technologies. Organizations which have adopted ATM technology may be prepared to adopt new ATM technology products as well as post adoption management and maintenance. At the same time, they may need to cope with the changes in their organizational structure as a result of their new information technology adoptions.
Given the seminal and exploratory nature of the study, further studies of ATM and other information technology adoption may want to look into additional organizational variables, such as organizational structure, information systems structure, etc. In doing so, these studies may yield more valuable and enriched information for guiding IT/IS implementation practices in organizations. It is also recommended that examination of the relationship between organizational type and information technology innovation adoption, as it is in this study, be replicated in future studies to confirm the validity of our findings.

1777
References [1] Ariss, S. S., Raghunathan, T. S., & Kunnathar, A. (2000). Factors affecting the adoption of advanced
manufacturing technology in small firms. S.A.M. Advanced Management Journal, 65(2), 14-21. [2] Bayless, M. L., & Johnson, B. S. (1990). An analysis of critical factors in the installation of local area
networks for university office systems programs. Office Systems Research Journal, 9(1), 39-45. [3] Borg, W. R., & Gall, M. D. (1989). Educational research: An introduction. New York: Longman. [4] Boyer, E. L. (1991). Foreward. In A Classification of Institutions of Higher Education (1991 Ed.).
Princeton, New Jersey: The Carnegie Foundation for the Advancement of Teaching. [5] Chatterjee, S., & Xiao, W. (1997). Increasing throughput in ATM/B-ISDN using simple buffer
management and selective discarding. ACM SIGCOMM Computer Communication Review, 27(5), 44-60. [6] Constant, D., Sproull, L., & Kiesler, S. (1996). The kindness of strangers: The usefulness of electronic
weak ties for technical advice. Organization Science, 7, 119-135. [7] Crowcroft, J., & McAuley, D. (2002). ATM: A retrospective on systems legacy or “A technology with a
fabulous future behind it?” ACM SIGCOMM Computer Communications Review, 32(5), 11-12. [8] Daft, R. L. (1989). Organization theory and design, 3rd Ed. St. Paul: West Publishing Company. [9] Damanpour, F. (1987). The adoption of technological, administrative, and ancillary innovations: Impact of
organizational factors. Journal of Management, 13(4), 675-688. [10] Damanpour, F. (1991). Organizational innovation: A meta-analysis of effects of determinants and
moderators. Academy of Management Journal, 34(3), 555-590. [11] Dannison, C. F. (1994). Administrative patterns of on-campus radio stations and the leadership behaviors
of the managers [CD-ROM]. Abstract from: ProQest File: Dissertation Abstracts Item: 9409871. [12] DeSanctis, G., & Poole, M. S. (1994). Capturing the complexity in advanced technology use: Adaptive
structuration theory. Organization Science, 5(2), 121-147. [13] Eder, L. B., & Igbaria, M. (2001). Determinants of intranet diffusion and infusion. Omega, 29, 233-242. [14] Ellis, R. W. (1994). Local area network adoption: an examination of selected variables as explanatory
reasons for adoption. Dissertation Abstracts International, 54(9), 3247. [15] Hosmer, D. W., & Lemeshow, S. (1989). Applied logistic regression. New York: John Wiley & Sons Inc. Contact the authors for the complete list of references

1778
The Adoption of ICT and Technology in Industrial Sector
Juhary A, [email protected] Zulkhairi, Md-D., [email protected]
Fadzilah, S., [email protected] Segumpan R.,
Nordin Y. Universiti Utara Malaysia, Malaysia
Mohd-Zukime M. J. Ismail, A.
Kolej Universiti Kejuruteraan Utara Malaysia, Malaysia
Abstract As in many countries, Malaysia has adopted ICT and technology in various sectors such as manufacturing, banking, finance, and telecommunication, to name a few. To identify the level of ICT and technology adoption in industrial sectors, a survey was conducted using a random sample of organizations representing the industrial and government sectors in Malaysia. The study suggested that the awareness by the industrial sector in adopting ICT and other advanced technology is important in order to generate higher value-added economy. The findings on technology adoption also suggests the direction the industry should take towards integrated technology as integrated solutions become more and more feasible and economical as organizations enter the era of globalization and become more competitive. In addition, productivity performance for service based industry increases from double in the low to moderate productivity to almost triple at the high productivity category due to ICT and technology adoption. This result may suggest that more focus should be given to the service industry in order to help accelerate the Malaysian economy, particularly in our efforts to become a fully developed nation in the not too distant future. Keywords: ICT Adoption, Technology Adoption, Information and Communication Technology Introduction The role of information and communication technology (ICT) in boosting productivity and in promoting human resource development cannot be underestimated. Small and medium enterprises (SMEs), in particular, have to grapple with the technological innovations that challenge operations, efficiency, and productivity vis-à-vis human resource capabilities. SMEs play a significant role in Malaysian economy and in providing employment opportunities. In a world of global competition, the use of technological resources has become a major strategic challenge for SMEs (Marri, Gunasekaran, & Kobu, 2003). The claim of ICT implementation is critical to SMEs strategies because the absence of suitable and sufficient knowledge on this topic exposes a “rhetoric versus reality” argument (Shiels, McIvor & O’Reilly, 2003). As part of the efforts to nurture the development of small and medium-scale enterprises (SMEs) in view of their strong growth potential, Bank Negara Malaysia initiated the establishment of the National SME Development Council in 2004, chaired by the Prime Minister.
The manufacturing sector has been a major driver of growth for the Malaysian economy since the country’s independence. Today, the manufacturing sector’s share of total GDP amounts to about 31 per cent, contributes more than 80 per cent of Malaysia’s total exports. Given the manufacturing sector’s importance, scholars and policy-makers have attempted to ascertain the stage of technological development in the sector. Thus far, most empirical studies on technological development in the country have concentrated on selected industries (notably the electronics and automotive sectors) and firms (Jomo, Felker & Rasiah, 1999).
Under the 9th Malaysia Plan (2006-2010), the Malaysian government will boost the adoption and use of ICT in the country. The number of MSC status companies is projected to grow from 1421 as at 2005 to some 4,000 by 2010 and these are expected to create 100,000 new jobs and generate about 1,400 new intellectual properties. It

1779
is also projected that the manufacturing, the services and the agriculture sectors are the main drivers of the growth of the economy. The economy is expected to grow at an average of 6% annually for the next five years. It is projected that there is an increase in productivity, competitiveness and valued added in these three focus sectors. The use and adoption of technology are anticipated to increase productivity and efficiency in the manufacturing sector. In the service sector, the ICT development in the banking and finance, insurance, transportation and logistics are emphasized in the SME sectors.
In Malaysia, there is a distinction between small and medium scale enterprises (SMEs) and small scale industries (SMIs). The SMEs are usually referred to those involved in non-manufacturing activities and usually are business traders of finished goods and services. The business activities involve: wholesale, distribution, retailing, contractors, and food processing, farming, financing and mining. There are also “informal” traders/ micro business/ street traders participating in the economy. SMIs are usually defined and referred to those involved in the manufacturing/production/processing/engineering sectors.
As in many countries, Malaysia has adopted ICT and technology in various sectors such as manufacturing, banking, finance, and telecommunication, to name a few. To identify the level of ICT and technology adoption in industrial sectors, a survey was conducted using a random sample of organizations representing the industrial and government sectors in Malaysia. ICT and Technology Adoption in the Industry
In the developed countries, an increasing number of industries are adopting ICT in their effort to develop a competitive advantage and maintain their position in the marketplace. A study in the UK found that even small industrial firms with less than 100 employees adopt IT using at least one PC to support their business (Dahalin and Golder, 1998). Lees and Lees (1987) found that the reasons firms adopt IT are to improve operational procedures, to produce information at a lower cost, to make available new management tools for decision making, to facilitate billing and invoicing, to facilitate business growth, to facilitate inventory control, and to be innovative. The benefits derived include better record keeping, timely, accurate, and expanded information, improved customer service, increased productivity, and enhanced management control and decision making. This many benefits encouraged more and more firms in the industrial sector to adopt IT. However, studies have also shown that the industrial sector, constituting more than 90% of small and medium industries (DTI, 1997), generally have end-users with low level of computer literacy and received elementary formal education.
Licht and Moch (1999) found that ICT has important impacts on the qualitative aspects of service innovation. Firms that introduced process innovation in the past are particularly successful in using ICT; the output elasticity of ICT capital for these firms is estimated to be about 12 per cent, about four times that of other firms (Hempell, 2002). This suggests that the productive use of ICT is closely linked to innovation in general, and to the re-engineering of processes in particular. Studies in other countries also confirm this link. For example, Greenan and Guellec (1998) found that organizational change and the uptake of advanced technologies (which assume that ICT investment has been made) seemed to increase the ability of firms to adjust to changing market conditions through technological innovation.
According to Fuller (1996), the computers and software programs (information technology or IT), are business tools which can be used, for example, to reduce costs, create stronger linkages with customers, innovate, and facilitate niche marketing. The term adoption is used generically to include the purchase of IT equipment and software, and the implementation of this in the individual enterprise. The terms ‘infusion’ and ‘absorption’ are also used to describe the increasing use and involvement of IT in the individual enterprise. Related Studies Shiels, McIvor and O’Reilly (2003) indicate that the characteristic of the firm and the industry sector are contributory factors to the extent of adoption and exploitation of ICTs by SMEs, to support business processes. In the United Kingdom, it was found that firms with relatively high (low) proportions of skilled workers were expected

1780
to have a competitive advantage in minimizing the cost both of ICT adoption and of learning how to make best use of ICTs (Forth and Mason, 2004). Peansupap and Walker (2005) studied on factors affecting ICT diffusion in three large Australian construction contractors. The study of ICT diffusion within construction organizations consisted of two phases: gathering quantitative and qualitative data. In order to understand ICT diffusion within construction organizations, a case study methodology was adopted. The reason for choosing this methodology was to provide qualitative data that could understand better how ICT is initiated within construction organizations and to expose factors that supported ICT diffusion. The data collection from the case interviews were conducted from October 2002 to May 2003. Phase 1 of the research comprised one contractor, one consulting engineering organization and a government department. In phase 2, three large main construction contractors were interested in participating in this research, including the contractor from phase 1. The research team conducted semi-structured interviews. To receive the from cross-organizations, data were collected from the ICT application implementer/facilitator and five to six professional users including project managers, engineers, and foremen. Each interview took approximately 30-35 minutes. Results from the study found that 11 factors influence ICT diffusion. The report on phase 2 study results within three construction organizations based on the 11 factors found to influence ICT diffusion. Semi-structured interviews were undertaken with five to six ICT users and an implementer for each of the case study companies. It is clear that people diffuse ICT innovation and they must feel motivated to do so. This introduces the importance of support mechanisms that includes not only technical solutions such as superior hardware and software operational features, but also software support that is championed by supervisors who behave as role models.
Mazuki, Mohd Rizal and Maimun (2004) studied the integration of information technology among 106 small and medium-sized enterprises in Malaysia. The results show that the higher levels of IT integration among manufacturing companies that produce high technological goods and services exhibits higher integration levels. The overall correlation is significant to substantiate the hypothesis that higher levels of IT integration leads to better performance efficiencies in all functional areas. In terms of organization size, SMEs with larger number of employees have higher levels of IT integration. Until the 1980s, firms in sectors such as mechanical and electrical engineering depended mainly on the skills of their designers, draftsmen, production engineers and draftsmen for their technology. The various stages of the production and distribution process, along with the interfaces between organizations in the supply-chain, are now codified and managed electronically. As a result, traditional craft and production engineering skills for example have been replaced by computer design skills, and the ability to integrate successfully the various elements of computer-controlled work and information flows within and across company boundaries is now a key competence in many industries (Clarke, 2001). Haskel and Heden (1999) found that computerization reduces the demand for manual workers, even when controlling for endogeneity, human capital upgrading and technological opportunities. In addition, Caroli and Van Reenen (1999) found evidence that human capital, technology and organizational change are complementary, and that organizational change reduces the demand for unskilled workers. Lal (2004) conducted a case study approach to examine both direct and indirect employment associated with the adoption and production of new technologies. The study covers a wide spectrum of large firms ranging from skill intensive sectors such as garment manufacturing and E-business technology producing firms. The sample includes firms that produce e-business technology as well as those use such technologies. Within the technology using firms there are two extremes of the industrial spectrum – the modern industry segment represented by consumer electronic and component-manufacturing firms, and the traditional, labour intensive, industry represented by garment manufacturing firms. Samples were selected on the basis of their sales turnover over the past few years of the firms on the map of India. Data covering a period of nine years in 1994-1995 to 2003-2004 were used in the analysis. The results of the study did not find any evidence to support the argument that adoption of e-business technologies leads to a loss of jobs. The results do indicate, however, that the adoption of e-business technologies might result in the restructuring of business organizations. Another study conducted by Atrostic and Nguyen (2002) identifies the effects of computers on productivity, particularly using information technology in firms. The sample of data on the use of computer networks and electronic business processes in the manufacturing sector of the United States were collected in 1999. The findings of this study indicate that there is a strong link between labour productivity and the presence of computer networks. Marri, Gunesekaran and Kobu (2003) found that the implementation of computer-integrated

1781
manufacturing (CIM) in small and medium enterprises in companies provides benefits for both employers and employees. The findings also show that 33 per cent of companies achieved a good degree of flexibility after the implementation of CIM in their companies whereas 33 per cent of companies indicated that they reached an average degree of flexibility. To this end, it is the intention of this paper to assess the level of ICT and technology adoption of the Malaysian industry as well as the public sector in terms of the end-users and various technologies such as Stand-alone, Intermediate, and Integrated technology. Methodology The study was based on a field study in the form of a survey research using a cross-sectional approach where a sample of firms representing the production and manufacturing firms listed in the Federation of Malaysian Manufacturers (FMM, 2002) and government and government linked companies were sought. A questionnaire was developed by the researcher based on literature review and formal interviews with companies’ officers (such as HR managers) to get an overview about ICT and technology adoption. The questionnaire is divided into several parts, namely:
Part A: Background of the Company Part B: Information and Communication Technology (ICT) Adoption
This section requests respondents to disclose information on the extent of their ICT adoption through the use or non-use of automation in the workplace.
Part C: Technology Adoption This section seeks information on how the company utilizes certain form of technology.
Sampling technique in the form of proportionate random sampling was used taking into account the different sample frame sizes according to the industries (Kerlinger, 1986). A total of 1000 firms were selected in which questionnaires were sent and 120 returns were received. Out of these, 46 firms were categorized as small having less than 50 employees, 29 firms were medium sized having between 50 to 199 employees, and 45 were large with 200 and more employees. Findings Table 1 shows the distribution of respondents according to the States in Malaysia. As can be seen, all States are included with the exception of Sabah, and only one respondent each coming from the States of Sarawak and Negeri Sembilan. The highest percentage of respondents in the sample came from the States of Penang and Selangor each with 19.2 percent of the total sample size of 120. Next came Kedah with 15 percent and this is followed by Perak (13.3 percent). Smaller samples came from the State of Johore (7.5 percent), Federal Territory Kuala Lumpur (5.8 percent), States of Melaka (5 percent), Kelantan (4.2 percent), Trengganu (4.2 percent), and Pahang and Perlis each at 2.5 percent.
Distribution of the sample by region shows that the majority of the sample respondents came from the Central Region with 38.33 percent. This is followed closely by the Northern Region with 36.67 percent. The Southern Region and East Coast are less represented with each account for 13.33 percent and 10.83 percent, respectively.
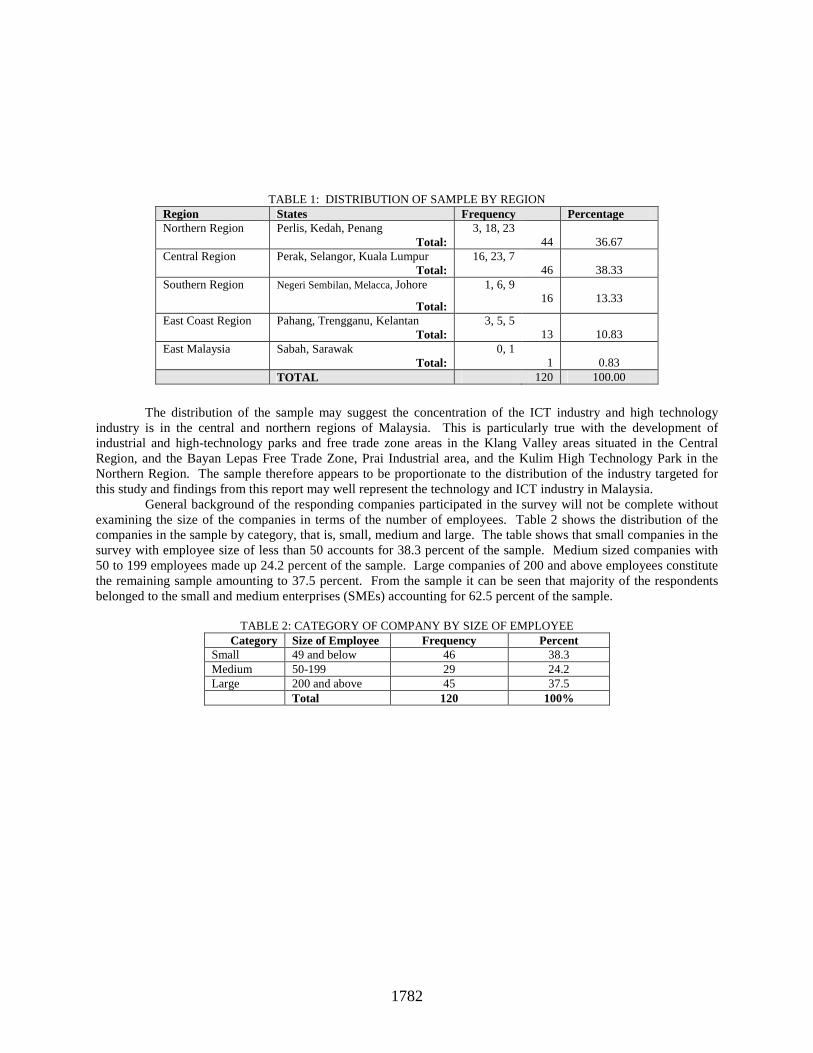
1782
TABLE 1: DISTRIBUTION OF SAMPLE BY REGION
Region States Frequency Percentage Northern Region Perlis, Kedah, Penang
Total: 3, 18, 23
44
36.67
Central Region Perak, Selangor, Kuala Lumpur Total:
16, 23, 7 46
38.33
Southern Region Negeri Sembilan, Melacca, Johore
Total:
1, 6, 9 16
13.33
East Coast Region Pahang, Trengganu, Kelantan Total:
3, 5, 5 13
10.83
East Malaysia Sabah, Sarawak Total:
0, 1 1
0.83
TOTAL 120 100.00
The distribution of the sample may suggest the concentration of the ICT industry and high technology industry is in the central and northern regions of Malaysia. This is particularly true with the development of industrial and high-technology parks and free trade zone areas in the Klang Valley areas situated in the Central Region, and the Bayan Lepas Free Trade Zone, Prai Industrial area, and the Kulim High Technology Park in the Northern Region. The sample therefore appears to be proportionate to the distribution of the industry targeted for this study and findings from this report may well represent the technology and ICT industry in Malaysia.
General background of the responding companies participated in the survey will not be complete without examining the size of the companies in terms of the number of employees. Table 2 shows the distribution of the companies in the sample by category, that is, small, medium and large. The table shows that small companies in the survey with employee size of less than 50 accounts for 38.3 percent of the sample. Medium sized companies with 50 to 199 employees made up 24.2 percent of the sample. Large companies of 200 and above employees constitute the remaining sample amounting to 37.5 percent. From the sample it can be seen that majority of the respondents belonged to the small and medium enterprises (SMEs) accounting for 62.5 percent of the sample.
TABLE 2: CATEGORY OF COMPANY BY SIZE OF EMPLOYEE
Category Size of Employee Frequency Percent Small 49 and below 46 38.3 Medium 50-199 29 24.2 Large 200 and above 45 37.5 Total 120 100%

1783
The next section of the survey analyzes availability of skilled workers for the technology and/or ICT adoption in the company and the results are displayed in Fig. 1.
FIG. 1: AVAILABILITY OF SKILLED WORKERS IN TECHNOLOGY AND ICT ADOPTION
As can be seen from Fig. 1, more than half of the sample indicated having skilled workers in both technology and ICT with both categories have about the same proportion. Though this may look encouraging, quite a significant proportion (46 percent) of respondents indicated they did not have adequate skilled workers in both technology and ICT. Considering the majority of the sample respondents came from the industrial areas, this finding is quite disturbing as significant number of organizations within the industry are still finding it difficult to fill up positions that requires skills and expertise. A closer look at the distribution of skilled workers shows that for the technology industry, slightly above 30 percent, have 10 or less skilled workers. Twenty-three percent of the technology sample indicated having more than 50 skilled workers, and about 45 percent have skilled workers in the range 10 to 50. For the ICT category, 25.5 percent have less than 10 skilled IT workers, and the same proportion indicated having more than 50 skilled workers. The remaining half of the sample of ICT category has between 10 to 50 skilled workers.
The comparisons on the level of ICT adoption in the administration, operation, and software usage is presented in Fig. 2. With the exception of software usage, the level of ICT adoption appears to be higher in the administration compared to the operations. In the administration, an average of 55.6 applications is used as semi-automated and only 31 applications are fully automated. In the operations, an average of 49.4 applications is used as semi-automated and only 28.2 applications are fully-automated. The results indicate semi-automated applications are dominant in both administration and operations functions. It is interesting to note that there is still manual usage of traditional word processing (usage of typewriter), manual spreadsheet, project planning, and human resource planning though on the average only 8.43 applications are manually done. It is understandable that software usage in fully-automated applications is the highest with an average of 61.9 percent. The sample respondents also indicated that a number of applications are in their planning with software usage top the list at 4.86 applications. The results also show more operations applications are in the pipeline as compared to the applications supporting the administration function.
53.7
46.3
53.6
46.4
42
44
46
4850
52
54
56
Yes No
Technology
ICT

1784
FIG. 2: COMPARISON OF LEVEL OF ICT ADOPTION
55.6
31
49.4
28.2
19.57
8.43
33.14
61.9
19.8
2.2
11.4
20.12
2.76
4.86
11.71
0
10
20
30
40
50
60
70
Fully Manual Semi-Aut omat ed Fully-Aut omat ed In-Planning Not Applicable
S c a l e
Administ rat ion
Operat ions
Sof t ware Usage

1785
Adoption of ICT in the workplace was also explored, specifically in terms of administration and operations.
As shown in Fig. 3, more than 200 (n = 208) of the companies surveyed utilized ICT in administration-related work like purchasing, tender, and bookkeeping, among others. More than a hundred (n = 134) were fully automated, while 78 were fully manual. Seven companies were still in the planning process of ICT adoption in administrative work, while 18 said it was ‘not applicable’.
FIG. 3: ICT ADOPTION IN ACMINISTRATION IN WEST COAST
Apparently, ICT was highly adopted in operational work, such as material control, scheduling, selling, and product development, to name a few. Fig. 4 shows that more than 700 (n = 738) of the companies in the west coast utilized semi-automated technology for operations-related jobs, while close to 400 (n = 387) were fully automated. More than 200 (n = 237) were fully manual, 42 said they were in the planning phase of such ICT adoption, and 259 said it was ‘not applicable’ in their working environment.
Adoption of ICT in terms of administration and operations in the states of Sarawak, Kelantan, Pahang and Terengganu was also examined in the study. In terms of administration, the majority (n = 41) of the companies involved in the study were semi-automated, with a number of them in Terengganu (n = 19). Many were also fully automated (n = 18), posting the highest in number. Other companies covered in the study were fully manual (n = 15), with companies in Kelantan (n = 7) taking the lead for such a practice. Some (n = 8) companies did not find the need for ICT adoption necessary, while the remainder was still planning for it.
9
3
10
17
6
1
6
18
69
2
32
44
19
2
7
18
89
2
36
30
11
14
9
1
17
31
21
7
26
64
13
0
10
20
30
40
50
60
70
Not-Applicable In-Planning Fully-Automated Semi-Automated Fully-Mannual
Scale
Fre
quen
cy
JohorMelakaPenangW. PersekutuanKedahNegeri SembilanPerakSelangor

1786
ICT adoption in operations was relatively substantial and extensive yet not applicable to several companies in the east cost. The companies studied were mostly fully automated (n = 95) and semi-automated (n = 80) in their operations. The bulk of fully automated (n = 32) as well as semi-automated (n = 36) companies in terms of operations was found to be in Terengganu. The findings also showed that a number of fully manual-based operations were in Kelantan (n = 14). Seventy-four companies found ICT adoption in operations ‘not applicable’, while a small number (n = 5) was in its planning stage.
Close to 400 (n = 382) companies were fully automated in their ICT software adoption, while nearly 200 (n=172) were semi-automated; 52 companies said they utilized fully manual technology, and 21 were planning for software usage. Fifty-nine responded that such usage was not applicable in their work environment (see Fig. 5).
FIG. 4: ICT ADOPTION IN OPERATIONS WEST COAST
36
52
23
13
1
23
43
57
164
52
17
64
15
2
111
57
17
5245
99
70
55
188
70
2517
20
105
1223
31
106
6
58
50
20
40
60
80
100
120
140
160
180
200
Not-Applicable In-P lanning Fully-Automated Semi-Automated Fully-M annual
Scale
Fre
quen
cy
Johor
M elaka
Penang
W. Persekutuan
Kedah
Negeri Sembilan
Perak
Selangor

1787
FIG. 5: USAGE OF SOFTWARE ICT ADOPTION IN WEST COAST
T h e l i n e c h a r t s h o w n t h e s o f t w a r e i n c o mp a n y I C T a d o p t i o n w i t h t h e
w e a s t c o a s
10
2 9
12
43 1
2 1
15
2
18
9 3
3 7
4
2 5
41
2 7
144
5 7
6
4 8
81316
9
7 7
10811
2 8
9
7 9
12
0
10
2 0
3 0
4 0
5 0
6 0
7 0
8 0
9 0
10 0
Not - Applicable I n - Plan n in g Fully- Aut omat ed Semi- Aut omat ed Fully- M an n ual
Sc a l e
Johor
M elaka
Pen an g
W. Per sekut uan
Kedah
Neger i Sembilan
Per ak
Selan gor

1788
Software usage in the east coast was also evident among the companies covered in this study, such as word processing, spreadsheet, and database, to name a few. Of the companies studied, 49 were fully automated, with 17 of them based in Terengganu. Thirty-five were semi-automated, with 12 of them located in Pahang. Three companies were fully manual, which are all based in Kelantan. Ten were in the planning stage, while 23 of them responded ‘not applicable’.
Fig. 6 presents the findings on the types of business in ICT adoption in the west coast-located companies. As observed, twenty-six companies were fully manual, while 29 were semi-automated. Although 72 companies indicated fully automated technology, 87 were still in the planning stage. Likewise, 69 mentioned that it was applicable in their business context.
The companies involved in this research were operating on business to business, business to customers, and
business to government transactions. Only eight of these companies in the east coast were fully automated, half of which were located in Terengganu. Ten were semi-automated, with about half also based in Terengganu (n = 4). Fifteen of them were in the planning phase, while nine responded ‘not applicable’
The adoption of stand-alone, intermediate, and integrated technology among companies in the west coast was also explored. As shown in Fig. 7, a large number (n = 369) of the respondents did not find stand-alone technology (such as computer-aided technology and material working laser) applicable in their business operations. Almost a hundred (n = 99) of them were full automated, 71 were semi-automated, and the remainder (n = 6) utilized fully manual technology. About fifty (n = 49) of the companies were in the planning process in terms of stand-alone technology adoption.
4
11
4
2
65
45
4
21
12
19
4
13
5
11
23
14 14
12
10
43
16
18
6
4 4
12
20
15
13
6
0
5
10
15
20
25
Not-Applicable In-P lanning Fully-Automated Semi-Automated
Fully-M annual
Scale
Fre
quen
cy
Johor
M elaka
Penang
W. Persekutuan
Kedah
Negeri Sembilan
Perak
Selangor
FIG. 6: TYPES OF BUSINESS ICT ADOPTION IN WEST COAST

1789
In terms of technology adoption, the companies that responded to this study adopted stand-alone (e.g.,
engineering technology and design), intermediate (e.g., material control technology), and integrated (e.g., just-in-time) forms of technology. For those that adopted stand-alone technology in the east coast, only a few were fully automated (n = 12), half of which were based in Terengganu. Nine of the companies were semi-automated, with two-thirds (n = 6) of them in Sarawak. A number of them were still in the planning stage (n = 16), and a great majority (n = 65) said this was not applicable yet.
With regard to the adoption of intermediate technology in the west coast, about fifty (n = 46) were full automated, 55 were semi automated, and 28 were full manual. Eighteen companies were in the planning stage, while more than a hundred (n = 113) responded ‘not applicable’ (see Fig. 8).
33
1
19
4
73
33
2
30
4
39 37
6
66
2
103
1
6 10
4 58
15
5 44
18
105
1211
912
7
0
20
40
60
80
100
120
Not-Applicable In-Planning Fully-Automated Semi-Automated
Fully-M annual
Scale
Fre
quen
cy
Johor
M elaka
Penang
W. Persekutuan
Kedah
Negeri Sembilan
Perak
Selangor
FIG. 7: STAND-ALONE TECHNOLOGY ADOPTION IN WEST COAST
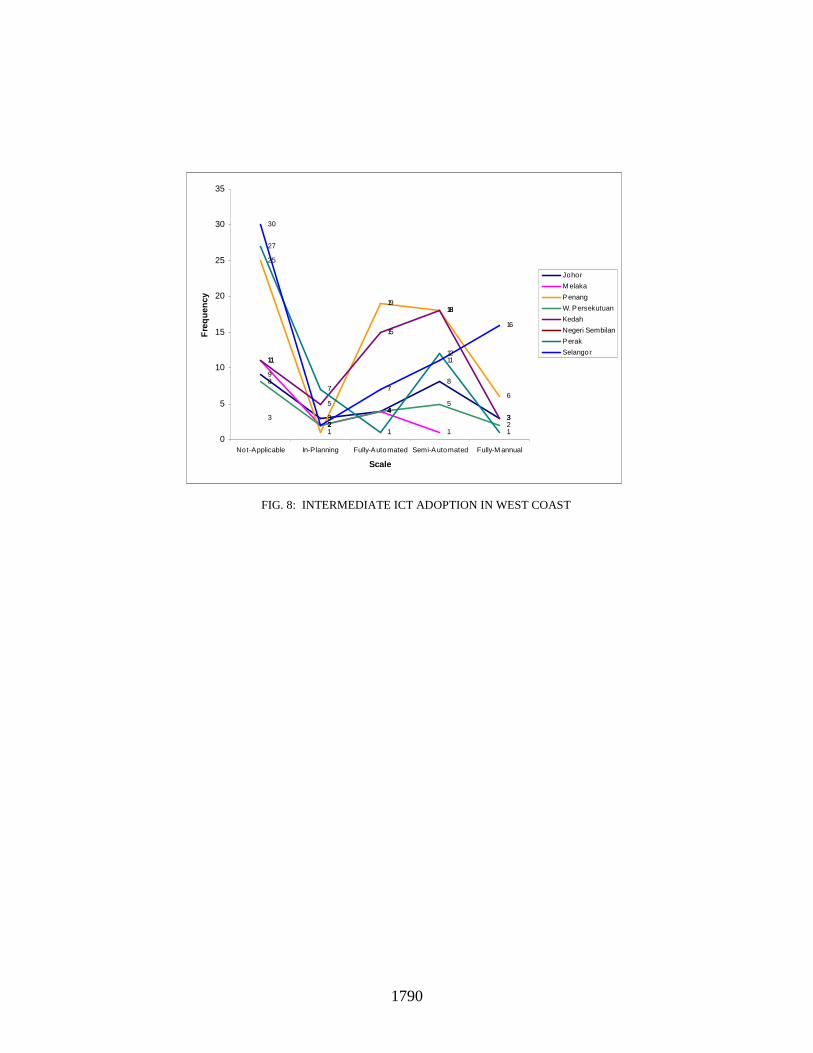
1790
9
34
8
3
11
2
4
1
25
1
1918
6
8
2
45
2
11
5
15
18
33
27
7
1
12
1
30
2
7
11
16
0
5
10
15
20
25
30
35
Not-Applicable In-Planning Fully-Automated Semi-Automated Fully-M annual
Scale
Fre
quen
cy
Johor
M elaka
Penang
W. Persekutuan
Kedah
Negeri Sembilan
Perak
Selangor
FIG. 8: INTERMEDIATE ICT ADOPTION IN WEST COAST

1791
Of the companies that adopted intermediate technology in the east coast, nine were fully automated, five of which were located in Terengganu. Seven were semi-automated, six of which were based in Pahang. Eleven were in the planning phase, while 19 said ‘not applicable’.
Adoption of integrated ICT technology was also not in full swing yet, as shown by 267 companies which said that this was ‘not applicable’ in their organizations. Thirty-five companies were ‘in-planning’ for it, while 52 companies were fully automated. About a hundred (n = 97) were semi-automated, while 13 were fully manual as shown in Fig. 9.
Many of the companies in the east coast said that integrated technology was not applicable (n = 35) in their
companies, 24 of which were based in Pahang. Thirteen companies were fully automated, while eight were semi-automated. Four were fully manual, while others (n = 14) were in the planning stage.
On technology adoption, intermediate technology appears to be dominant in the fully and semi automated categories. This may suggest that solutions for technology adoption are currently most popular in the intermediate technology which could be more economical than integrated technology but have the power and capability that goes beyond stand-alone technology. Fig. 10 shows the trends in technology adoption from fully manual technology to fully automated technology. Intermediate technology is also dominant in the fully manual category. For future planning however, the trend indicates a shift to the integrated technology. This may suggests the direction the industry should take towards integrated technology as integrated solutions become more and more feasible and economical as organizations enter the era of globalization and become more competitive.
19
58
1314
73
1
49
1
28 29
8
25
52 3
27
12
2325
35
51
10
2
15
2
77
12
3
118
0
10
20
30
40
50
60
70
80
90
Not-Applicable In-Planning Fully-Automated Semi-Automated
Fully-M annual
Scale
Fre
quen
cy
Johor
M elaka
Penang
W. Persekutuan
Kedah
Negeri Sembilan
Perak
Selangor
FIG. 9: INTEGRATED TECHNOLOGY ICT ADOPTION IN WEST COAST

1792
The questionnaire also examined the productivity of the respondent companies based on whether the companies are production based or service based companies, or both. Fig. 11 shows the result of the productivity trends from low, moderate to high productivity as indicated by the respondents. The result indicates that service based companies have better productivity performance than production based companies. The graph indicates productivity performance for service based industry increases from double in the low to moderate productivity to almost triple at the high productivity category. This result may suggest that more focus should be given to the service industry in order to help accelerate the Malaysian economy, particularly in our efforts to become a fully developed nation in the not too distant future.
3.5
7.38
7
17.8
22.62
2.95
0.431.09
4.64.8
4.62
0
5
10
15
20
25
Not Appl icable Low Moder ate High
S c a l e
Pr oduction based
Ser cives or pr oject based
A both based
1.2
15.218.83
74
12.33
27
21.33
49.76
5.2
21.8
16.4
63.4
10.83
9.76
13.2
0
10
20
30
40
50
60
70
80
Fully Manual Semi-Automated
Fully-Automated
In-Planning NotApplicable
Category
Ave
rage
Stand-alonetechnology
Intermediatetechnology
Integratedtechnology
FIG. 10: TECHNOLOGY ADOPTION
FIG. 11: MEASUREMENT OF PRODUCTIVITY

1793
Conclusion The study suggested that the awareness by the industrial sector in adopting ICT and other advanced technology is important in order to generate higher value-added economy. The findings on technology adoption also suggests the direction the industry should take towards integrated technology as integrated solutions become more and more feasible and economical as organizations enter the era of globalization and become more competitive. In addition, productivity performance for service based industry increases from double in the low to moderate productivity to almost triple at the high productivity category due to ICT and technology adoption. This result may suggest that more focus should be given to the service industry in order to help accelerate the Malaysian economy, particularly in our efforts to become a fully developed nation in the not too distant future.
References [1] Atrostic, B., K & Nguyen, S. (2002). Computer networks and U.S. manufacturing plant productivity: New
evidence from the CNUS data, CES working paper 02-01, Center for economic studies, Washington D.C. [2] Caroli, E., & Van Reenen, J. (1999). Organization, skills and technology: Evidence from a panel of British
and French establishment. IFS Working paper series: Institute of Fiscal Studies. [3] Clarke, E. (2001). The intangible economy impact and policy issues. European Commission October. [4] Dahalin, Z. and Golder, P.A. (1998). Information technology adoption and end-user
computing survey: Preliminary results, Division of Electronic Engineering & Computer Science, Aston University.
[5] (DTI) Department of Trade & Industry (1997). Competitiveness U.K. A Benchmark for success, HMSO, London.
[6] FMM. (2002). Federation of Malaysian Manufacturers. Malaysian Industries (33rd Ed.). Kuala Lumpur. [7] Forth, J. & Mason, G. (2004). Information and Communication Technology (ICT) adoption and utilisation,
skill constraints and firm-level performance: Evidence from UK benchmarking survey. NIESR Discussion Paper No. 234. National Institute of Economic and Social Research, London.
[8] Fuller, T. (1996). Fulfilling IT needs in small businesses: A recursive learning model. International Small Business Journal, 14, 4, 25-44.
[9] Greenan, N., Mairesse, J., & Topiol-Bensaid, A. (2001). Information technology and research and development impacts of productivity and skills: Looking for correlations on French firm level data. NBER Working Paper 8075, Cambridge, MA.
[10] Haskel, J., & Heden, Y. (1999). Computers and the demand for skilled labour: Industry-and establishment-level panel evidence for the UK. The Economic Journal, 109.
[11] Hempell, T. (2002). Does experience matter? Productivity effects of ICT in German service sector. Discussion paper No. 02-43, Center for European Economic Research: Mannheim.
[12] Jomo, K. S., Felker, G., & Rasiah, R. (1999). Industrial technology development in Malaysia. Routledge: London.
[13] Kerlinger, F.N. (2000). Foundations of Behaviour Research. 3rd Ed. New York. Holt, Rinehart & Winston.
[14] Lal, K. (2004). Growth of employment and the adoption of E-business. Discussion paper series. United Nations University, Institute for New Technology. Retrieved August, 2004, from http://www.intech.unu.edu
[15] Lees, J. D., & Lees, A. D. (1987). Realities of small business information system implementation. Journal of System Management, 6-13.
Contact authors for the full list of references

1794
A Study on Factors Affecting e-Commerce Adoption in Steel Industry
Namjae Cho, [email protected] Jungwon Keum, [email protected]
Hanyang University, KOREA Sangho Han
Erae Elecronics Inc., Korea Abstract The purpose of this research is to analyze the factors that affect the use of e-commerce in steel industry. Data from 51 companies are collected. The influence of e-commerce utilization on corporate performance was also examined. It was found that several factors known to influence e-commerce use such as transaction methods preferences and the level of information-orientation did not actually have a significant impact. Rather, factors such as the maturity of e-commerce experience and perceptual compatibility between product characteristics and e-commerce turned out to have a significant influence on the utilization of e-commerce. The level of e-commerce utilization had a significant impact on each of the three performance dimensions: internal performance, external performance and financial performance. Introduction
Steel products are used virtually in all industries such as automobile, construction, appliances, oil and gas, packaging, railroads, shipbuilding, and industrial and agricultural equipments. The steel industry as a whole generates some $300 billion in annual revenue and employs some 2 million people. In 2001 the world consumed 765 million metric tons of finished steel products.
The introduction of Internet is believed to increase the effectiveness of business practices by changing business processes of organizations. It also has the potential to increase competitiveness by creating new customers and markets. However, the steel industry seems to have preference to traditional off-line processes. One of the reasons might be that the industry doesn't have strong influential factors such as appropriate policy measures.
However e-commerce adoption is a complicated phenomenon, and needs to be analyzed taking social, economic, and governmental aspects into consideration. Traditional trade process provides only a limited support to growth to sustain the power of a company in the age of a fierce competition. This paper summarizes the relationship between various industrial factors and the level of e-commerce utilization as well as the relationship between the level of e-commerce utilization and corporate performances. The result of the study will help us successfully upgrade Internet infrastructure and use e-commerce in steel industry. Theoretical Background Industrial Factors Affecting e-commerce in Steel Industry A narrow definition of e-commerce is “to buy and sell goods and services via the Internet among consumers and firms.” A broad version includes all economic activities such as production, procurement, distribution, advertising, marketing, and customer services.' [Kalakota,1996].
According to WSD (World Steel Dynamic) Journal, the amount of steel transaction through e-commerce is expected to grow by 50% annually from 5million tons in 2000 until 2010, when it will reach 45.8% ($400million) tons of the world's total steel transaction. Thus, B-to-B e-commerce will become the norm of the industry by that time. [Korea financial newspaper, 2002]
However, on a negative side of the fact, MetalSite, the representative online steel marketplace, finally suspended sales activities due to hostile market situation and increased burden from high system costs. As can be

1795
seen from the case of MetalSite, the introduction of B2B in steel industry is not simple. To introduce e-commerce practice, steel industry should be prepared with a very careful plan, because of several unique risks in this industry.
According to MBR(Mercantile Bancorp Report), obstacles of e-commerce (B2B) utilization in steel industry include: � security-related problems, � technical retaliation problems, � distribution and logistics problems, � widespread insensitivity to customer services, � lack of understanding and experience on e-commerce processes. Obstacles of e-commerce (B2B) utilization in Korean steel industry can be summarized differently as in [FIGURE 1]. (Kim, 2001).
FIG: 1 OBSTACLES TO ACTIVATE UTILIZATION OF E-COMMERCE IN STEEL INDUSTRY
(1) Lack of support to overall integration in the process by way of e-commerce (2) Lack of mutual understanding and cooperation between trading companies and manufacturers. (3) Decrease of competence of domestic steel companies due to the introduction of e-commerce among
major steel companies in the world. (4) Difficulty of constructing e-commerce system due to the lack of sufficient resources. Furthermore, Korea Industrial Informatization White Paper (Korea National Computerization Agency,
2001), pointed out the followings as main obstacles to e-commerce (B2B) utilization in Korean steel industry: � multiple standards exist for steel products even in one nation, � over-reliance on account payable, � over-emphasis on informal personal relationships, � taxes regarding e-commerce utilization, � loss of intellectual property, � lack of rules and regulations related to privacy and related issues, � uncertainty intrinsic to credit, distribution, processing and transportation, � excessive and subjective request toward on-line transaction. Major Industrial Factors Affection e-commerce POSCO is the largest and representative steel producer in Korea. For the last few years, POSCO extensively pursed process innovation (PI) project, which includes the development of 'POSPIA' and 'Steel-N.com'. POSPIA is a task and process innovation system. Steel-N.com is a cyber market for B2B e-commerce focusing on steel products. POSCO has been trying transmitting information online to customers, and utilizing e-commerce in every aspect of their processes.
POSCO faced with many problems during establishing integrated system for B2B; � Unique and stringent organizational culture of POSCO � miss-focused team work with vendor companies and excessive expectation from consultants, � mistrust and dissatisfaction of internal staff with the changes, � shortage of flexibility due to too much application modules, etc. The obstacles to the active use of e-commerce (B2B) identified from the case analysis include: � lack of interface with legacy systems, � lack of understanding and participation of existing clients, � dissatisfaction of existing customers from the potential loss of established relationships, � insufficient electronic catalogs and difficulties caused by new order processing mechanism and product classification, �
increased potential sensitivity to the diffusion of system errors, ⑹ retaliation from local business against electronic B2B procuremen (Kim, J.W. 2003).

1796
In another case, since March, 2000, Anysteel.com, an e-market operator of nonferrous metals and steel products, has been doing e-commerce business in steel industry. AnySteel.com actually failed to complete even a single transaction. The main obstacles of e-commerce (B2B) utilization in Korean steel industry identified from
these cases include: (Kim,J.W 2003) ⑴ fear related to tax evasion, ⑵ reliance on traditional bill transactions, ⑶
cash settlement custom (paying cash 20days after deadline.), ⑷ lack of governmental support regarding tax
exemption, ⑸ uncertainty of participants, ⑹ increased security concern on trade information , ⑺ insufficient supply of professional experts. Research Model and Method The Research Model and Hypotheses Research Model: The model and selected variables are based on prior studies and exploratory interviews. The model includes 3 dimensions; (1) industrial factors, (2) level of e-commerce utilization, (3) corporate performance. The research model is presented in [Figure 2]. The first part of the model hypothesized the relationship between the industrial factors of e-commerce and the level of e-commerce utilization. The second part of the model aims at examining the relationship between the perceived level of e-commerce utilization and corporate performances.
FIG: 2 RESEARCH MODEL
Industrial factors ⇒ Level of e-commerce
utilization ⇒ Corporate performance
* The level of infrastructure for e-commerce
* Compatibility of e-commerce with transaction methods
* Preferences to specific transaction methods
* Information intensity of the process
⇒ * Level of e-commerce
utilization ⇒
* Internal performance * External performance * Financial performance
Hypotheses: To address the research questions explained in the previous section, this research presents the following hypotheses. [Hypothesis 1] Industrial factors affect the level of e-commerce utilization.
H 1-1: The level of infrastructure for e-commerce affects the level of e-commerce utilization. H 1-2 : The compatibility of e-commerce with transaction methods affects the level of e-commerce utilization. H 1-3 : Preferences to specific transaction methods affect with level of e-commerce utilization.
H 1-4 : Information intensity of the process is positively correlated to the level of e-commerce utilization. [Hypothesis 2] The higher the level of e-commerce utilization, the higher the level of performance. H 2-1 The higher the level of e-commerce utilization, the higher the internal performance.
H 2-2 The higher the level of e-commerce utilization, the higher the external performance. H 2-3 The higher the level of e-commerce utilization, the higher the financial performance.
Research Method Data Collection: The survey was conducted on Korean manufacturing companies, value added resellers of POSCO and those specialized in secondary processing and distribution. Middle to high level managers (IT, the planning section, administrative section, and marketing section) of these companies were chosen as respondent. 51 companies

1797
participated in this research. Questionnaires were distributed out to these companies accompanied by telephone interviews. Data only from companies with multiple informants with more than 1 person were used to ensure face validity. Sample Characteristics: According to survey results, the majority of respondents were between 30 and 40 (90.1%) in their age, and 88.3% of respondents were college graduates. 47.17% of respondents were department heads, and 47.1% of respondents were in marketing departments. Most of the companies had 30 to 500 employees, and average annual revenue fell in the range of 50 to 300 Billion KRW. Research Results Validity and Reliability of Measure The constructs were first assessed for reliability and validity. The questions were tested for validity using factor analysis with principal components and varimax rotation. Results of industrial factors in e-commerce and results of corporate performance factors, are presented in [TABLE 1] [TABLE 2].
TABLE 1: ANALYSIS INDUSTRIAL FACTORS IN E-COMMERCE
Item number The level of
infrastructure for e-commerce
The compatibility of e-commerce with transaction
methods
Preferences to specific
transaction methods
Information intensity of the
process
1.3 0.855 2.2 0.850 2.3 0.850 2.1 0.824 2.4 0.759 1.2 0.746 1.1 0.649 1.4 0.633 3.7 0.877 3.6 0.839 4.2 0.607 4.1 0.554 4.6 0.479 4.8 0.831 4.9 0.801 4.7 0.771 4.3 0.441 3.1 0.912 3.2 0.849

1798
TABLE 2: ANALYSIS OF CORPORATE PERFORMANCE FACTORS
Internal performance
External performance
Financial performance
1.2 0.846 1.3 0.799 1.1 0.787 1.4 0.745 2.1 0.814 2.3 0.806 2.2 0.781 3.3 0.720 4.1 0.682 3.1 0.682 4.2 0.624
Detailed item consistency for all constructs was checked using Cronbach’s α (Cronbach 1951). All Crombach's α value exceeded 0.8. Nunnally (1978) suggested that a value of at least 0.60 indicated adequate reliability. [TABLE3] presents the results of reliability tests.
TABLE 3: ANALYSIS OF RELIABILITY
Variable - Name Item of details Number of item Chronbach’s α
Level of e-commerce utilization
Level of e-commerce utilization for the e-commerce system
7 0.861
Internal performance 4 0.946
External performance 3 0.910 Corporate - performance
Financial performance 4 0.952
The level of infrastructure for e-commerce 8 0.929
Compatibility of e-commerce with transaction methods
5 0.819
Preferences to specific transaction methods 4 0.831
Industrial factors
Information intensity of the process 2 0.817
Hypothesis Tests Test Related to Level of e-commerce Utilization: 4 industry factors were used as independent variables to explain the level of e-commerce use. [Table 4] and [Table 5] shows results from multiple regression analysis on the level of e-commerce utilization. The level of infrastructure for e-commerce and compatibility of e-commerce with

1799
transaction methods among independent variable were found to have a significant influence. Preferences to specific transaction methods and information intensity of the process were not supported.
TABLE 4: MULTIPLE REGRESSION ANALYSIS FOR LEVEL OF E-COMMERCE
UTILIZATION
Dependent variable
Independent variable B T Significance
Constant 0.528 0.762 0.450 The level of
infrastructure for e-commerce
0.462 4.598 0.000 **
Compatibility of e-commerce with
transaction methods 0.289 2.149 0.037 *
Preferences to specific transaction methods
0.270 1.722 0.092
Level of e-commerce utilization
Information intensity of the process 0.071 0.874 0.387
( R2 = 0.482, F = 10.712 )
TABLE 5: TEST RESULTS ON E-COMMERCE UTILIZATION.
[Hypothesis 1] Industrial factors affect level of e-commerce utilization. H1-1 The level of infrastructure for e-commerce affects the level of
e-commerce utilization. Supported
H 1-2 The compatibility of e-commerce with transaction methods affects the level of e-commerce utilization.
Supported
H 1-3 Preferences to specific transaction methods affect the level of e-commerce utilization.
Not Supported
H 1-4 Information intensity of the process is positively correlated to the level of e-commerce utilization.
Not Supported

1800
Test of the Impact of e-commerce Utilization on Corporate Performance: The impact of the level of e-commerce utilization on internal performance, external performance, and financial performance is summarized in [Table6] and [Table7].
TABLE 7: MODEL 2 –HYPOTHESIS AND RESULTS OF TEST.
[Hypothesis2] The higher the level of e-commerce utilization, the higher the corporate performance.
H2-1 The higher the level of e-commerce utilization, the higher the internal performance.
Supported
H2-2 The higher level of e-commerce utilization, the higher the external performance. Supported
H2-3 The higher level of e-commerce utilization, the higher the financial performance. Supported
TABLE: 6 SIMPLE REGRESSION ANALYSIS OF INTERNAL PERFORMANCE CORRELATED WITH E-COMMERCE
Independent variable
Dependent variable
R2 F-test B Beta T-value Significance
Internal Performance 0.466 42.696 1.076 0.682 6.534 0.000 **
External Performance 0.353 26.782 0.857 0.594 5.175 0.000 **
Level of e-commerce utilization
Financial Performance 0.516 52.288 1.085 0.718 7.231 0.000 **

1801
Conclusions This study examined manufacturing companies specialized in secondary processing and distribution of steel products. The purpose of this research was to investigate triggers and outcome of the level of e-commerce utilization in the steel industry. It was found that many factors that were known be influential to e-commerce in the steel industry such as preferences to specific transaction methods and the information intensity of the process did not actually have a significant impact. Rather, items such as how mature the individual corporation’s level of infrastructure for e-commerce and how compatible is the process of transaction with e-commerce, turned out to have a significant influence on the level of e-commerce utilization. Further, the level of e-commerce utilization had significant impact on all of the three performance categories; internal, external and financial performances. The result implies that companies in the steel industry should be prepared to adapt to rapidly changing market, and have to implement and utilize e-commerce to remain competitive. A more agressive investment and support is needed to prepare an effective e-commerce infrastructure. At the same time more, effort should be exerted to improve and change perceptions of managers on the nature of the transaction processes.
References
[1] Kalakota & Whinston, Frontiers of Electronic Commerce, Addison Wesley, 1996. [2] Kim. C. H., Academic Society of Information and Communication project report, 2001. 2. [3] Kim, J.W., "Hindrance and promotors of B to B e-comerce : Based on Steel Industry's Case",
Konkuk University , Graduate school of Information and Communication, Unpublished Thesis 2003. [4] Kim, K.C. & Cho, D.S., Premier e-Business Cases from Asia, Ministry of Industry and Energy,
Federation of Korean Industries. 2003 . [5] Korea Financial Newspaper, 2000. 11. 20. [6] National Computerization Agency, Korea Industrial Informatization White Paper 2001. 12 [7] Park, J.S., e-Business Strategy by Industry �steel industry - Production and Distribution Market'.

1802
Performance Improving Factors on E-Business System Stages
Kiho Park Hoseo University, Republic of Korea
Abstract The e-business strategies ultimately pursue creating the maximal value for customers through the competitive advantages and business opportunities newly created on the basis of information technologies. For the realization of e-business strategies, the successful implementation and operation of e-business system must be the crucial activities in and out of an organization. Therefore, in physical world, there were lots of interests that what kind of key factors can lead the success of e-business system. Moreover, in the field of academia also, there have been many research results for investigating and finding out the key success factors for e-business system. However, the perceptual level of the significance of key success factors that organization members perceive can be changed over each phase of system life cycle(hereafter “SLC”) such phases as introduction(1st stage), growth(2nd stage), maturity(3rd stage), and decline(4th stage). This study investigated that there might be significant differences in the perceptual level regarding importance of success factors among phases of SLC. Introduction According to system development life cycle(hereafter “SDLC”) methodology, after completed system development and deployed at workplace, the age of e-business system will rise up (O'Brien, 2005; Choi, 2005). On the system maintenance process, the reason why system age gives the crucial implications to an organization is for that efforts in the process of operations are required more than in system development (Hana, 1993; Swanson & Dans, 2000). Companies, therefore, have to periodically assess the remnant life expectancy (Swanson & Dans, 2000). From the beginning of system operations, system maintenance will be sustained and repeatedly performed the system upgrading (Chappin, 1988). Thus, the e-business SLC can be defined as system age from deployment after finishing development to system replacement or major upgrade. The SLC may be dependent upon organization sizes, system types, or the purpose of system. Zvegintzov (1984) had suggested five reasons for replacing software with new one: (1) it is no longer needed; (2) it no longer runs on its hardware; (3) its hardware should be replaced; (4) it is not adaptable to changing physical fields; (5) the alternative software is developed or available for purchase. In our research, considering the situation of Korean companies, we classified the system ages into four phases such as first phase as below one year after deployment, second phase, between one and two years, third phase, between two to four years, and fourth phase, more than four years.
The many literatures related to the e-business system success have presented a variety of key success factors, which those were in early stage of deployment. These factors, however, have been in one lump sum without any division with e-business system ages or phases of SLC. Because, according to the system ages, the perceived importance regarding these factors can be changed. Namely, although, in initial stage of system deployment, some factors were dealt with the crucial things, as time passed, those may lose their gravity or be not important (Park, 2004). Based on previous study, the key success factors in ERP system, for example, are top manager’s support and intention, the alignment between business and system strategies, innovation of business process, and system competence in an organization (Park & Cho, 2004; Chang et al., 2000; Davern & Kauffman, 2000; Akintoye, 2000; Markus & Tanis, 2000; Nah & Lah, 2001). Through this research, we suggest ten elements as core influential factors like managerial supports, strategic alignment with business, cooperative relationship with partners, project planning capability, system competence in organization, change management, proper system design for fieldwork, collaboration among teams, standardized business process, and competitive investment in IS(information system (Park & Cho, 2004).

1803
Drawing from these basic intentions, we are especially interested in investigation on which there might be significantly different from the perceptual level regarding importance of success factors among phases of SLC. Thus, according to the phases of SLC, organizations have to focus on the crucial factors in each phase. We believe that the findings of research can give vital implications for the successful e-business strategies and maintenance processes. E-Business System Evolution In generally, the e-business SLC or system age implies software’s residual life consisting of information system. Because hardware components can be easily upgraded, however, the advanced features of software should be newly redeveloped or have to purchase new version products. Thus the e-business system life cycle is just the life of software (Park et al., 2006, Chappin, 1988).
According to researcher’s experience, as the system age may be dependent upon companies’ traits or cultural characteristics, it is difficult to clearly classify each phases of system evolution. However, this study proposed four stages for system ages based on system deployment period.
Phase One (introduction): less than one year after IS deployment We defined first phase of system age as below one year after system development or deployment. Generally, when organizations newly start on system operation, they need to educate and train employees for adaptation and solve organizational conflict and adaptive period. In addition, during this period, possible software errors like programming errors or logic errors should be fixed and modified (Choi, 2005).
Phase Two (stabilization): from one to two years This phase, under two years, is the stabilized period of system, which completely fixed errors and stabilized. At this phase, almost employees are familiar with system environment. In this phase, successful achievement of system investment should be based on alignment between business goals and system strategies (Segars and Grover, 1998). And collaborative relationship with business partners might be critical and vital process (Davernport, 1998; Brynjolfsson and Kemerer, 1996; Bingi et al., 1999).
Phase Three (accustomed): from two to four years If the system fully stabilizes and end-users accustom themselves to the system, there may not be improperness or inconvenience to use. Without system, all of business activities can not be sustained. At this phase, rapid change of organizational structure and business environment may positively drive system upgrading or new development.
Phase Four (upgrade): more than four years The fourth phase, which hardware and software should be upgraded or newly developed, can be defined as phase that gradually decrease system usability in an organization. E-Business System (hereafter “IS”) Payoff Assessment The issues of IS investment payoff has been important research areas of work over last two decades (Bakos, 1991; Christiaanse and Venkatraman, 2002). As for the business value, some researchers focused on efficiency gains from deployment of powerful dedicated systems in mid-1980s (McFarlan, 1984; Porter and Millar, 1985). Meanwhile, the possibility of deploying IS for revenue enhancement was emphasized through business scope changes in mid-1990s (Venkatraman, 1994). Three views including such as organizational performance, industrial organization, and information economics perspectives as for theoretical perspectives were proposed by Bakos and Kemerer (1992). The potential and realized value obtained after implementing IS systems are emphasized the importance of considering both types of values for both ex ante project selection and ex post investment evaluation (Davern and Kauffman, 2000). The effects of electronic data interchange (EDI) technology were analyzed into just-in-time (JIS) delivery and performance (Srinivasan et al., 1994). A few researchers focused on the process-driven values such as capacity utilization, inventory turnover, quality, price, and innovation under the context of EC (electronic commerce) technology investment (Barua et al., 1995). And the values of IS as cost savings, improvements in quality, customer service, and new product developments were identified (Brynjolfsson and Hitt, 1998).

1804
As diversity of the views, the heterogeneity of corporate characteristics causes diverse assessment views and approaches and value gaps in most cases. Harris and Katz (1989) examined the usefulness of two information technology managerial control ratios as discriminating factors for differentiating between levels of organizational performance in a set of insurance companies. The control ratios were the IS cost-efficiency ratio, defined as the ratio of IS expense to premium income, and the IS expense ratio, defined as the ratio of IS expense to total operating expense. The dependent variable, the operating expense ratio, defined as the ratio of no interest operating expense to premium income, served as an inverse measure of profitability and productivity. And companies can have several their own approaches to measuring IS payoff that may be suited to the level of investment or the nature of industry. Research Model and Hypotheses Research Model This research established the research model as below figure and hypotheses. In order to verify research model, I proposed nine hypotheses. Also, on the basis of researcher’s field experiences and survey results, the system ages were classified into four phases.
FIG. 1: RESEARCH MODEL
Hypotheses Managerial Support (MS) Many researchers have suggested the key success factors of IS investment. However, it might be true the structured researches about the unpredicted factors inducing the value gap during information system operation are relatively lack. In order to succeed the IS strategy, top-management support has been frequently emphasized by lots of researchers and consistently proposed as one of IS success factors (Smith, 1988; Yoon et al., 1995; Jang et al., 2000).
H1: According to each of the system phases, the cognitive level of importance of the MS (managerial support) affecting organizational performances is different.
H1a: The cognitive level of importance of the MS affecting CSV is different in each system phase. H1b: The cognitive level of importance of the MS affecting OCV is different in each system phase. H1c: The cognitive level of importance of the MS affecting FV is different in each system phase.
Strategic Alignment(SA) Generally accepted that one of key IS success factors is the close linkage of the IS strategy and business strategy (Segar and Grover, 1998; Henderson and Venkatraman, 1993).
Customer Satisfaction Value (CSV)
Organizational Competence Value (OCV)
Financial Value (FV)
First: below 1 year Second: from 1 to 2 years Third: from 2 to 4 years Fourth: four or more
Managerial Support (MS) Strategic Alignment (SA)
Collaborative Relationship (CR) Project Planning (PP)
Organization IS Capability (OC) Change Management (CM) Proper System Design (PD)
Task Collaboration (TC) Standardized Process (SP)
Competitive Investment (CI)
System Ages
Performances Influential Factors

1805
H2: According to each of the system phases, the cognitive level of importance of the strategic alignment affecting organizational performances is different.
H2a: The cognitive level of importance of the SA affecting CSV is different in each system phase. H2b: The cognitive level of importance of the SA affecting OCV is different in each system phase. H2c: The cognitive level of importance of the SA affecting FV is different in each system phase.
Collaborative Relationship(CR) By extending interorganizational networking, whether easiness of interrelationship between seller and buyer, seller and seller, buyer and buyer and so on exist or not became crucial factor in IS valuation. For example, not only intrafirm BPR but also interfirm process reengineering and the mutual sharing of process importantly played a role in ERP system environment (Davernport, 1998; Brynjolfsson and Kemerer, 1996). And in SCM environment, interactive information sharing and strong collaborative relationship with business partners should be continuously emphasized and conducted (Rhonda et al., 2000).
H3: According to each of the system phases, the cognitive level of importance of the strategic alignment affecting organizational performances is different.
H3a: The cognitive level of importance of the CR affecting CSV is different in each system phase. H3b: The cognitive level of importance of the CR affecting OCV is different in each system phase. H3c: The cognitive level of importance of the CR affecting FV is different in each system phase.
Project Planning and Management Capability (PP) To maximize the effects of IS investment, the project planning capability is important (Markus and Tanis, 2000; Nah and Lah, 2001). Also, through the right man in the right place, the active communication among related teams, and the adequate IS investment, needs, which satisfy field workers, can elevate the effect of system investment (Cameron and Meyer, 1998; Bingi et al., 1999).
H4: According to each of the system phases, the cognitive level of importance of the project planning and management capability affecting organizational performances is different.
H4a: The cognitive level of importance of the PP affecting CSV is different in each system phase. H4b: The cognitive level of importance of the PP affecting OCV is different in each system phase. H4c: The cognitive level of importance of the PP affecting FV is different in each system phase.
Organizational IS Capability(OC) In general, new technologies change the existent equilibrium state within organizations. Information systems, specifically ERP, SCM, have the potential to significantly change the work practices and procedures in the production, logistics, and distribution. In the progress of change, role ambiguity is possibly generated.
H5: According to each of the system phases, the cognitive level of importance of the organizational IS capability affecting organizational performances is different.
H5a: The cognitive level of importance of the OC affecting CSV is different in each system phase. H5b: The cognitive level of importance of the OC affecting OCV is different in each system phase. H5c: The cognitive level of importance of the OC affecting FV is different in each system phase.
Change Management Capability (CM) To successfully stabilize rapid changes in the managerial environment in organization, sharing the information and communication should be patiently progressed (Cummings and Huse, 1989). Against the organization-wide changes, there must be conflicts from conservative persons. Under this situation, whether these conflicts could be overcome or not can be the influential factors in occurring IS performance discrepancy. Also, inadequate incentive system or process design can be barriers against effective system use (Davern and Kauffman, 2000).
H6: According to each of the system phases, the cognitive level of importance of the change management capability affecting organizational performances is different.
H6a: The cognitive level of importance of the CM affecting CSV is different in each system phase. H6b: The cognitive level of importance of the CM affecting OCV is different in each system phase. H6c: The cognitive level of importance of the CM affecting FV is different in each system phase.

1806
Properness of System Design (PD) The factors that create the end-user’s satisfaction and influence the effects of IS investment are quality of IS, quality of reported information, and properness for field task processing(Seddon and Kiew, 1994; Delone and Mclean, 2003). Therefore,
H7: According to each of the system phases, the cognitive level of importance of the properness of system design for fieldwork capability affecting organizational performances is different.
H7a: The cognitive level of importance of the PD affecting CSV is different in each system phase. H7b: The cognitive level of importance of the PD affecting OCV is different in each system phase. H7c: The cognitive level of importance of the PD affecting FV is different in each system phase.
Interdepartmental Task Collaboration (TC) The degree of cooperation is important in order to reduce the potential conflict which may jeopardize the implementation of strategic IS plans (Henderson, 1990). In SCM system, the interdepartmental information sharing and the close cooperation between teams must be the vital factor to improve the effect of system investment (Robert & Kilpatrick, 2000).
H8: According to each of the system phases, the cognitive level of importance of the interdepartmental task collaboration affecting organizational performances is different.
H8a: The cognitive level of importance of the TC affecting CSV is different in each system phase. H8b: The cognitive level of importance of the TC affecting OCV is different in each system phase. H8c: The cognitive level of importance of the TC affecting FV is different in each system phase.
Business Process Standardization (SP) The process-centric perspective argues that IS creates value for the organization by improving individual business processes, or inter-process linkages, or both. Consequently, the greater the impact of IS on individual business processes and on inter-process linkages, the greater will be the contribution of IS to firm performance (Tallon et al., 2000). Thus,
H9: According to each of the system phases, the cognitive level of importance of the standardized business process affecting organizational performances is different.
H9a: The cognitive level of importance of the SP affecting CSV is different in each system phase. H9b: The cognitive level of importance of the SP affecting OCV is different in each system phase. H9c: The cognitive level of importance of the SP affecting FV is different in each system phase.
Competitive Investment (CI) By the exploratory study, lots of companies, unfortunately, experienced the failure of IS investment cause of imitative or competitive investment (Cho and Park, 2003). The unclear goal of system deployment or inter-organizational conflict as barrier factors against successful IS implementation arise from imitative or competitive investment (Ginsberg, 1988). Hence,
H10: According to each of the system phases, the cognitive level of importance of the interdepartmental task collaboration affecting organizational performances is different.
H10a: The cognitive level of importance of the CI affecting CSV is different in each system phase. H10b: The cognitive level of importance of the CI affecting OCV is different in each system phase. H10c: The cognitive level of importance of the CI affecting FV is different in each system phase.
Research Findings Data Collection The data for this study were collected from 315 questionnaires completed by 48 Korean domestic companies using IS systems such as SCM, ERP, or CRM. Two incomplete questionnaires were eliminated from analysis. The total survey period took one month. To ensure a high response rate and reliability, surveys were conducted in person. After factor analysis, excluding the CI (competitive investment), Cronbach’s alpha as criteria of reliability of independent variables was above .70, indicating construct unidimensionality.
The collected sample consists of 216 current system users and 97 system developers. The IS usage period after deployment consists of 2-4 years (40.6%) followed by 1-2 years (30.7%), and above 4 years (12.5%)

1807
sequentially. The majority of the respondents deployed the foreign-made solution (58.5%) followed by subcontracted development (15.7%), and in-house development (14.4%). The percentage of domestic packages (10.5%) is lower than foreign-made solutions (58.5%). The job title of respondents consists of 39.9 percent as managers, 29.6% as senior employees, 28.4% for employees working for 2-3 years, and 1.6% as directors.
TABLE 1: RELIABILITY ABD VALIDITY OF MEASURES
Factor and items Eigenvalue Loadings Cronbach's α Factor 1. Management support (MS)(H1)
Participation in operation Participation in development Interest in system user satisfaction Emphasis of strategic importance to employees Financial support Human resource support
14.176
0.827 0.808 0.686 0.671 0.614 0.592
0.8935
Factor 2. Strategic alignment (SA)(H2) Emphasis of IS importance to top management Degree of strategic investment Clear goals of investment Organizational consensus of IS role Understandability of strategic benefits of IS Connectivity with strategic goals Perceptual level of business strategy of IS employees
2.757
0.748 0.740 0.592 0.566 0.555 0.548 0.523
0.8701
Factor 3. Collaborative relationship (CR)(H3) Co-working to solve problems Cooperative participation in developing process Perceptual level of common goals Easy to share operational information
1.989
0.838 0.778 0.767 0.724
0.8864
Factor 4. Project planning (PP)(H4) Rationale performance evaluation criteria Reasonable forecasting skill of investment effects Collaborative level with system users Acceptability of requirement from field workers Flexibility of risk management
1.729
0.734 0.710 0.667 0.611 0.604
0.8652
Factor 5. Organization IS capability (OC)(H5) Clear role assignment of operating team IS professionals Clear goal of development team Evaluation skill of venders or company outsourced Capability of IS usage Understandability of IS technology Clear goals in resource allocation
1.58
0.658 0.621 0.603 0.561 0.555 0.546 0.485
0.861
Factor 6. Change Management (CM)(H6) Perceptual level of necessity of change Positive activities for solving conflict against change Persistent training of reason for change
1.51
0.824 0.723 0.706
0.7925
Factor 7. Proper system design (PD)(H7) Easy to maintain Scope of adaptability Easy to use
1.312
0.744 0.594 0.562
0.8027
Factor 8. Interdepartmental task collaboration (TC)(H8)
Easy to cooperate within an organization Sharing the necessary information
1.155
0.824 0.810
0.8375
Factor 9. Business process standardization (SP)(H9) Code standardization in identical industry Business process standardization in identical industry
1.047
0.856 0.788
0.8155
Factor 10. Competitive investment (CI)(H10) Competitive and imitated investment
1.021
0.941
Extraction Method: Principal Component Analysis. Rotation Method: Varimax with Kaiser Normalization. Rotation converged in 8 iterations.

1808
TABLE 2: SYSTEM-RELATED FREQUENCIES Freq. Percentage Valid percent Cumulative percent
Role User Developer
21697
69 31
6931
69100
IS Usage period < 6 months 6 months - 1 years 1 - 2 years 2 - 4 years above 4 years
232896
12739
7.3 8.9
30.7 40.6 12.5
7.38.9
30.740.612.5
7.316.3
4787.5100
Deployment type Foreign-made Domestic product In-house Subcontract ASP
1833345493
58.5 10.5 14.4 15.7
1
58.510.514.415.7
1
58.569
83.499
100
Hypotheses Test Linear Regression estimates coefficients of the linear equation, involving one or more independent variables, which best predict the value of the dependent variable. This study used a stepwise procedure for variable selection. As criteria of variable selection, F-value was used and some of predictors as entered variables were selected with more significant level than α=.05, otherwise removed from regression equation.
To determine whether the multicollinearity exist or not, as the statistical criteria, the tolerance (TOL) or variance inflation factors (VIF) are used in general. As the tolerances of each regression model were greater than .10. the multicollinearity problems of predictors did not exist. First of all, not considering the system age, I conducted the multiple regression analysis to investigate relationship and principal factors between system performance and independent variables. I determined three variables (CSV, OCV, and FV) as the dependent variables and ten variables (managerial support, collaborative relationship with business partners, etc) as independent variables. Null and Alternative hypotheses for this study are as follows:
Null hypothesis (H0): β0 =β1 =...βn = 0 Alternative hypothesis (Ha): not all of βi are zero.
As depicted in ANOVA table, hypothesis (H0) is not supported at significant level(α=0.01) because all of
significant probabilities are .000 for three dependent variables. This implies that the critical success factors significantly affect the performances including CSV, OCV, and FV. The explanatory powers concerning three regression models are .347, .431, and .339 each. The critical influential factors influencing CSV are project management, strategic alignment with business strategic goals, and proper system design for field work. Project planning, interdepartmental task collaboration (TC), strategic alignment (SA), and proper system design (PD) may be principal and significant to improve the OCV. To improve the FV, the critical success factors are SA, SP, PP, and OC.

1809
TABLE 3: ANOVA BETWEEN FACTORS AND PERFORMANCES (W/O DEMARCATION OF SYSTEM AGE) Dependent Variable Sum of Squares df Mean Square F Sig. R R2 Adj. R2 CSV Regression
Residual Total
34.021 63.892 97.912
5 301 305
11.340 .212
53.425 .000a .589 .347 .341
OCV Regression Residual Total
29.692 39.212 68.904
4 298 302
7.423 .132
56.411 .000b .656 .431 .423
FV Regression Residual Total
25.491 49.632 75.123
4 299 303
6.373 .166
38.392 .000c .583 .339 .330
a. Predictors: (Constant), project planning, strategic alignment, proper design, Dependent Variable: customer satisfaction b Predictors: (Constant), project planning, task collaboration, strategic alignment, proper design, Dependent Variable: organization capability c Predictors: (Constant), strategic alignment, standardized process, project planning, IS capability, Dependent Variable: financial value
To determine whether the multicollinearity exist or not, as the statistical criteria, the tolerance (TOL, TOLi
=1-Ri2) or variance inflation factors (VIF, VIFi = 1 / TOLi) are used in general. As the tolerances of each regression
model were greater than .10. So, the multicollinearity problems of predictors did not exist.
TABLE 4: REGRESSION COEFFICIENTS (W/O DEMARCATION OF SYSTEM AGE) Non-standardized Standardized Multicollinearity
Dependent Var. Factors B Std. Error Beta
t-value Tolerance VIF
CSV
(Constant) Project Planning Strategic Alignment Proper System Design
1.268 0.176 0.270 0.186
0.175 0.058 0.058 0.052
0.205 0.276 0.217
7.245*** 3.028*** 4.621*** 3.581***
0.475 0.606 0.593
2.105 1.650 1.687
OCV
(Constant) Project Planning Task Collaboration Strategic alignment Proper System Design
1.318 0.125 0.148 0.187 0.163
0.147 0.047 0.042 0.047 0.043
0.173 0.190 0.227 0.225
8.940*** 2.680*** 3.551*** 4.009*** 3.788***
0.457 0.665 0.593 0.539
2.189 1.504 1.686 1.854
FV
(Constant) Proper System Design Standardized Process Project Planning IS Capability
1.221 0.204 0.192 0.109 0.102
0.172 0.054 0.052 0.050 0.050
0.238 0.212 0.145 0.127
7.084*** 3.801*** 3.712*** 2.165** 2.027**
0.563 0.677 0.493 0.560
1.776 1.477 2.030 1.785
** p<.05,*** p<.01.
Concerning the relationship between system age and organization performances, by passing time of system operation, we assumed that the critical factors influencing system achievements may be different. Table shows that all of regression models on system age each have statistical significance.

1810
TABLE 5: ANOVA BETWEEN SYSTEM AGE AND FACTORS System Age Performance SS df MS F Sig. R R2 Adj. R2
CSV Regression Residual Total
4.946 12.139 17.085
1 49 50
4.946 .248
19.967 .000 .538 .290 .275
OCV Regression Residual Total
3.886 6.142 10.028
2 48 50
1.943 .128
15.184 .000 .622 .387 .362
First (< 1 year)
FV Regression Residual Total
4.228 4.606 8.834
2 48 50
2.114 .096
22.033 .000 .692 .479 .457
CSV Regression Residual Total
6.939 3.103 20.042
2 85 87
3.470 .154
22.508 .000 .588 .346 .331
OCV Regression Residual Total
3.509 9.893 13.402
2 83 85
1.754 .119
14.718 .000 .512 .262 .244
Second (1-2 years)
FV Regression Residual Total
4.001 10.594 14.596
2 85 87
2.001 .125
16.051 .000 .524 .274 .257
CSV Regression Residual Total
16.289 23.082 39.371
3 119 122
5.430 .194
27.994 .000 .643 .414 .399
OCV Regression Residual Total
17.536 15.869 33.404
3 119 122
5.845 .133
43.834 .000 .725 .525 .513
Third
(2-4 years)
FV Regression Residual Total
18.164 22.357 40.521
3 118 121
6.055 .189
31.957 .000 .670 .448 .434
CSV Regression Residual Total
9.057 10.254 19.310
2 35 37
4.528 .293
15.457 .000 .685 .469 .439
OCV Regression Residual Total
7.098 2.757 9.855
4 33 37
1.774 .084
21.240 .000 .849 .720 .686
Fourth (above 4 years)
FV Regression Residual Total
4.344 5.100 9.444
3 34 37
1.448 .150
9.654 .000 .678 .460 .412
First, for the customer satisfaction value(CSV), factors affecting the CSG, CR with business partners at first phase, CR and PP at second phase, PP, SA, and PD at third phase, and for fourth phase, SA, TC, OC, and CR were significant at .01 or .05 level each. Thus, hypotheses H2a, 3a, 4a, 7a, and 8a are supported.
Second, for the organization capability value(OCV), factors such as PD for work and SP at first phase, PD and CM at second phase, PP, TC, and PD at third phase, and SA, TC, OC, and CR at fourth phase at significance level of 1%, 5% each were influential factors to the OCV. Thus, the hypotheses, H2b, 3b, 4b, 5b, 6b, 7b, 8b, 9b were supported.
Third, for the financial value discrepancy (FV), factors affecting FV were such as SP and PD at first phase, CR and SA at second phase, OC, PP, and SP at third phase, and at fourth phase, SA, CI, and CR at fourth phase were influential factors to the OCV. Thus, the hypotheses, H2c, 3c, 4c, 5c, 7c, 9c, 10c were supported.

1811
TABLE 6: REGRESSION COEFFICIENTS Non-standardized Standardized Multicollinearity
System Age Performance Factor B Std. Error Beta
t-value Tolerance VIF
CSV (Const.)
CR 1.874 .480
.363
.107
.538 5.166*** 4.468***
1.000
1.000
OCV (Const.)
PD SP
1.648 .278 .273
.383
.090
.127
.417 .288
4.308*** 3.095*** 2.141**
.704 .704
1.421 1.421
First (less than 1 year)
FV (Const.)
PD SP
1.360 .253 .340
.331
.078
.110
.404 .384
4.105*** 3.249*** 3.088***
.704 .704
1.421 1.421
CSV (Const.)
PP CR
1.535 .326 .245
.278
.075
.076
.408 .304
5.511*** 4.352*** 3.246***
.876 .876
1.142 1.142
OCV (Const.)
PD CM
1.986 .223 .202
.260
.076
.074
.311 .290
7.634*** 2.945*** 2.742***
.797 .797
1.255 1.255
Second (1-2 years)
FV (Const.)
CR SA
1.619 .262 .236
.305
.065
.077
.381 .290
5.314*** 4.037*** 3.072***
.959 .959
1.043 1.043
CSV
(Const.) PP SA PD
1.245 .220 .261 .153
.242
.089
.087
.072
.268 .285 .195
5.143*** 2.465** 3.000*** 2.115**
.417 .548 .580
2.400 1.826 1.724
OCV
(Const.) PP TC PD
1.190 .252 .265 .158
.197
.064
.061
.062
.333 .324 .218
6.023*** 3.931*** 4.382*** 2.538**
.556 .729 .540
1.799 1.372 1.851
Third (2-4 years)
FV
(Const.) OC PP SP
.860
.316
.246
.161
.257
.083
.075
.081
.335 .295 .165
3.345*** 3.815*** 3.289*** 2.000**
.605 .581 .684
1.652 1.722 1.463
CSV (Const.)
SA TC
.369
.534
.346
.580
.162
.169
.479 .298
.636 3.293*** 2.049**
.718 .718
1.392 1.392
OCV
(Const.) SA TC OC CR
.706
.361
.286
.318 -.201
.330
.104
.096
.108
.098
.453 .345 .372 -.248
2.139** 3.472*** 2.992*** 2.948*** -2.046**
.498 .638 .532 .577
2.009 1.567 1.880 1.733
Fourth (above 4 years)
FV
(Const.) SA CI CR
1.722 .611 .196
-.332
.439
.124
.072
.125
.782 .345 -.418
3.920*** 4.918*** 2.714*** -2.643**
.628 .986 .635
1.592 1.015 1.574
** p<.05, *** p<.01

1812
TABLE 7: INFLUENTIAL FACTORS CSV OCV FV
Factor Total 1st 2nd 3rd 4th Total 1st 2nd 3rd 4th Total 1st 2nd 3rd 4th
MS
SA � � � � � � � �
CR � � � � � � �
PP � � � � � � �
OC � � �
CM �
PD � � � � � � �
TC � � �
SP � � � �
CI �
Remark)✓: Statistical Significant Factors

1813
TABLE 8: RESULTS System Age
Hypotheses Factor First Second Third Fourth
H1 1a(CSV) 1b(OCV) 1c(FV)
Managerial Support
H2 2a(CSV) 2b(OCV) 2c(FV)
Strategic Alignment
�
� � � �
H3 3a(CSV) 3b(OCV) 3c(FV)
Cooperative Relationship � �
�
�
� �
H4 4a(CSV) 4b(OCV) 4c(FV)
Project Planning
� � � �
H5 5a(CSV) 5b(OCV) 5c(FV)
Organization IS Capability
�
�
H6 6a(CSV) 6b(OCV) 6c(FV)
Change Management
�
H7 7a(CSV) 7b(OCV) 7c(FV)
Proper System Design � �
�
� �
H8 8a(CSV) 8b(OCV) 8c(FV)
Task Collaboration
�
� �
H9 9a(CSV) 9b(OCV) 9c(FV)
Standardized Process � �
�
H10 10a(CSV) 10b(OCV) 10c(FV)
Competitive Investment
�
Remark)✓: Supported Hypothesis
Implications and Conclusion In an organization, we are interested in which factors are the principals for gaining organizational performances based on the phases of SLC. On the basis of previous researches, we divided the SLC into such four phases as introduction (less than one year), stabilization (between one and two years), accustomed (between two and four years), and upgrade (more than four years). For empirical analysis, we suggest ten elements as core influential factors like managerial supports, strategic alignment with business, cooperative relationship with partners, project planning capability, system competence in organization, change management, proper system design for fieldwork, collaboration among teams, standardized business process, and competitive investment in IS. We are especially interested in investigation on which there might be significantly different from the perceptual level regarding importance of success factors among phases of SLC. Thus, according to the phases of SLC, organizations have to focus on the crucial factors in each phase. We believe that the findings of research can give vital implications for the successful e-business strategies and maintenance processes.

1814
Differently with the previous research results, the managerial support factor was not significant for performance in all phases. This implies that the informatization of firms can not be strange any more and the managerial support, not principal factor. The variable, the strategic alignment, as a whole (CSV in third and fourth phase, OCV in fourth, and FV in second and fourth), influences the dependent variables. This also suggested that the positive effects from IS strategic aligning with business strategies indeed need not short term but long term period. Next, the cooperative relationship affects CSV in first and second, OCV in third and fourth, and FV in second and fourth phase each. This means that the cooperative relationship may be understood a very important factor for customer satisfaction in early phase. Moreover, as time passed, this variable gradually influences OCV. From early stage (first, second and third) in system age, the principal and the crucial variable affecting improving OCV was proper system design for fieldworks.
In summary, almost independent variables except for the managerial support were influential factors that showed the differences in statistical significance on each phases of SLC. At first phase, the significant variables influencing performances were the cooperative relationship with partners, the proper system design for fieldworks, and the standardization of business and task processes. Differently with first phase, at second phase, the strategic alignment with business strategies, the cooperative relationship with partners, the project planning competence, the change management, and the proper system design for fieldworks. The principal factors at third phase were the strategic alignment, the project planning, the IS competences, the task collaboration, and the business process standardization. Lastly, at fourth phase, the strategic alignment, the cooperative relationship, the IS competences, the task collaboration, and the competitive investment. Accordingly, based on the above research findings, we found out that the influential factors may be different from on each system phases. Thus, firms should focus system investment on those factors for raising the organizational performances.
The limitations of this research are as follows. First, as the system ages were defined by author’s field experience or subjective judgment, not based on the general criteria, the system age should be classified with more reasonable and valid criteria. Second, the system age may be different in organizational size, system platform, or system usage. The reason is why we guess that the smaller organization size is, the more sensitive the perceptual level of importance concerning the key success factors is. However, we did not take into account the firm’s size, so research findings may have weak reliability and validity. Third, in addition to firm’s size, we excluded the industry types. Further researches should be investigated to get more reliable results with the SLC strictly classified by criteria like organizational size and industrial types as pointed out above limitations.
References
[1] Akintoye, A., Mcintosh, G., and Fitzgerald, E.(2000), "A Survey of Supply Chain Collaboration and Management in the UK Construction Industry," European Journal of Purchasing & Supply Chain Management, 6,159-168.
[2] Bingi, P., Sharma, M.K., and Godla, J.K.(1999), "Critical Issues Affecting an ERP Implementation," Information Systems Management, 16(3), Summer, 7-8.
[3] Brynjolfsson, E., and Hitt, L.(1998), “Beyond the productivity paradox.” Communications of the ACM, 41(8),49-53.
[4] Brynjolfsson, E., and Kemerer, C.F.(1996), "Network Externalities in Microcomputer Software: an Econometric Analysis of the Spreadsheet Market," Management Science, 42(12),1627-1647.
[5] Cameron, P.D. and Meyer, S.L.(1998), "Rapid ERP Implementation a Contradiction," Management Accounting, 80(6), 58-60.
[6] Chang, K.S., Seo, K.S., and Lee, W.B.(2000), “An Exploratory Study on the Key Success Factors for ERP System Implementation”, Information Systems Review, 2(2), 255-281.
[7] Chappin, N.(1988), "Software Maintenance Life Cycle", Proceedings of Conference on Software Maintenance, 6-13.
[8] Cho, N.J., and Park, K.H.(2003, June), “Barriers Causing the Value Gap between Expected and Realized Value in IS Investment: SCM/ERP/CRM,” Information Systems Review, 5(1), 1-18.

1815
[9] Choi, E.M.(2005), Software Engineering, ChungIksa, 28-40. [10] Davern, M.J., and Kauffman, R.J.(2000), “Discovering potential and realizing value from information
technology investments,” Journal of Management Information Systems, 16(4), 121-143. [11] Davernport, T.H.(1998, Jul.-Aug.), "Putting the Enterprise into the Enterprise System," Harvard Business
Review, 76(4), 121-131. [12] Davernport, T.H., and Short, J., "The New Industrial engineering: Information Technology and Business
Process Redesign," Sloan Management Review, 31, 4, 1990, pp.11-27. [13] Delone, W.H. and McLean, E.R.(1992), “Information Systems Success: The Quest for the Dependent
Variable,” Information Systems Research, 3(1), 60-92 [14] Devaraj, S. and Kohli, R.(2002), The IT Payoff Measuring the Business Value of Information Technology
Investments, Prentice-hall Inc., 1-10, 31-64, 129-160. [15] Edwards, J.B.(2001, Jul/Aug), "ERP, balanced scorecard, and IT: How do they fit together?," The Journal
of Corporate Accounting & Finance, 12(5). Please contact the author for a complete list of references.
1816
Expressing Emotions on Blogs: A Content Analysis Comparison between the U.S. and Mexico
Juan Antonio Vargas-Barraza, corporació[email protected]
Universidad de Guadalajara, Mexico Laura Serviere, [email protected]
University of Texas-Pan American, U.S. Abstract
Internet users have emoticons as a way to use images to show their emotions. Emoticons are usually found among Internet blogs, which are user-generated website where entries are made in journal style and displayed in a reverse chronological order. Despite the quantity of free information available users from different countries may express and interpret online information in a different manner, such as some users employ more often images than words to express their feelings and ideas. This study addresses emoticon usage of personal blog postings from the U.S. and Mexico. The results supported the hypothesis that cross-country differences do exist in the use of emoticons between the U.S. and Mexico. The results showed that Mexican users employ emoticons more frequently to express their emotions than their American counterpart. In addition, Mexican users showed a larger preference to use a large variety of emoticons to express their emotions.
Introduction As a web-based communication tool, the term "blog" is a blend of the words web and log (Web log). A blog entry is a diary-style site in which the author, a "blogger", writes and post ideas or short articles displayed in a chronological order (Lamb and Johnson, 2006). In addition, the blogger can link other web pages that he or she finds interesting which are usually posted in reverse chronological order (Perrone, 2005).
Blogs either provide commentaries or news on a particular subject, such as food, politics, or local news or function as personal online diaries. A typical blog combines text, images, and links to other blogs, web pages, and other media related to its topic. The ability for readers to leave comments in an interactive format is an important part of earlier blogs. Most blogs are primarily textual, although some focus on photographs (photoblog), sketches (sketchblog), videos (vlog), or audio (podcasting) (Blog, 2007).
The word emoticon is the mixture of words “emotion” and “icon” and invented in 1981 by Scott Fahlman (Tanskanen, 1998) used to express an emotion (Mallon and Oppenheim, 2002). Initially, emoticons were also called smileys, which were a series of typed characters that, when turned sideways, resemble facial expressions. However, the set has extended to many other characters not only involving faces but also other body parts, such as “thumbs up” (Serviere, Hernandez, and Minor, 2005). As DeFranco (2005) mentioned, “Emoticons are shorthand feelings. Their purpose is to express non-verbal attitudes, which are lost or misunderstood in simple text messages. A statement made with a smile is often better received and remembered than one without emotion” (pg. 6). Hence emoticons may be useful to express feelings that might be expressed through tone of voice or behavior in speech (Mallon and Oppenheim, 2002).
Consumption is now seen as involving a constant flow of fantasies, feelings, and fun encompassed by what is called the “experiential view.” This experiential view considers consumption as a primarily subjective state of consciousness with a variety of symbolic meanings, hedonic responses, and esthetic criteria (Holbrook & Hirshman, 1982).

1817
Literature Review
Nowadays the consumers require marketing products providing experiences for the consumer (Schmitt, 1999). The consumers may be able to make valid perceptions or affective distinctions among several brands (Holbrook & Hirshman, 1982). Internet is a mean that provides such experiences, and the possibility to reach consumers from the entire world, using several marketing tools for the consumers.
The previous efforts of marketing were always transmissions from the companies, one way communications, intended for target the highest quantity of visitors as possible, such as announcements, emergent windows in Internet and alike. Marketers use banner ads, design websites to be reminiscent of product brochures, and make available “show rooms” to consumers (LaFerle et al., 2002).
With blogs, the site becomes closer to the customers, since each blog reader is doing it for his/her own desire, each reader is choosing to interact with the business and each reader wants to listen more about the business (Wright, 2007). The acceptance and use of images to represent an idea may be different from country to country. Choong and Salvendy (1998) made an experiment between the U.S. and China. It was determined that in cognitive questions, the American participants had advantages over the Chinese participants when textual models were used. However, when models with graphics were used, the Chinese participants performed better. Moreover, for certain cultures the use of images is more valuable than the use of texts. Such uses of images over text emphasize the cultural differences that have to be accounted for in the design of a site. This is because different cultures might expect a certain web design and when they encounter a different one, they might react differently (Fang and Pei-Luen, 2003). For example, if the design of a website is displeasing, the visitors might simply choose not to revisit the site, leading to losing potential customers.
As part of research on online images, some studies have been conducted regarding the usage of emoticons. The research addressing gender differences in emoticon use in newsgroups by Wolf (2000) found that female users, when in a predominantly female group, were more emotional than male users as they utilized emoticons in a more frequent and varied manner. However, once in a mixed-gender newsgroup, male users employed emoticons at the same rate of their counterparts. On another study, Serviere, Hernandez, and Minor (2005) compared the underlying set of emotions expressed by five Latin American online community users, particularly users from Argentina, Chile, Mexico, Peru, and Venezuela. The results strongly suggested that the use of emoticons and the sense of freedom provided by the Internet highly motivated online users to express their emotions. Among the five Latin American countries included in the study’s sample, Argentina, Mexico, and Venezuela exhibited the highest number of emoticons. Among these countries, Argentina and Mexico were the countries with the largest variety of emotions expressed (Serviere, Hernandez, and Minor, 2005). Methodology Richins (1997) defined an emotion as an affective reaction to perceptions of situations. According to this definition, the criteria followed in the selection of emoticons were based on Richins’ (1997) criteria and adapted where necessary. The criteria utilized to identify the emotions expressed included all kinds of emoticons. Although labeled as a cognitive state, the emoticon for “confusion” was included in the criteria because this is a commonly used emoticon referring to this emotion. The technique used for the content analysis was netnography (ethnography on the Internet) as proposed by Kozinets (2002). This marketing research technique was appropriate since it was particularly developed for the analysis of the content of online communities. Furthermore, this technique was appropriate for this study because the purpose was to investigate and identify insights into the emotions expressed by bloggers of two culturally different countries: the U.S. and Mexico. The netnographic data collection procedure requires the selection and extraction of data from online postings which in this case were extracts from blogs.
To test the hypothesis for this research a content analysis was conducted. The analysis started with the selection of blogs where emoticons were used as part of the comments for a post. The sites where no emoticons were showed were discarded. The hypotheses tested were:

1818
H1: There is a significant cross-country difference in the use of emoticons between Mexico and United States. H2: There is a significant cross-country difference in the use of different emoticons between Mexico and United States. Data Collection
A total of 61 personal blogs that showed emoticon usage were selected for each country. To be able to collect a sufficient amount of postings, a total of 244 blogs had to be reviewed. To conduct the data collection process, the comments or responses that people posted about a blog were reviewed. Because of the quantity of comments that might be posted after an author has placed his or her personal entries, a specific date, April 8th, 2007, was selected for reviewing the postings. To be selected for the study, the postings should have been generated between April 2006 and April 2007. Only the response posts displayed in the first page of each blog showing an emoticon were reviewed and counted. The Mexican blogs were personal blogs gathered from www.blogsmexico.com. As a blog was opened, the posts and their comments were analyzed to check if they had emoticons. It was determined that for every four blogs, only one had comments with emoticons. A total of 244 blogs were reviewed of which 61 were collected. This represents a 25% of emoticon usage based on the first pages count. For the American blogs, the selection criterion was the same as the one followed for the Mexican blogs. American blogs were gathered from www.blogger.com. For every 13 blogs, only one had emoticons in its comments. From a total of 793 blogs reviewed, only 7.69% blogs were using emoticons.
To increase research objectivity, three independent persons were reviewing the comments and counted the emoticons in the selected postings. This was done to accomplish the minimum of three judges proposed by Kassarjian (1977) for content analysis.
Statistical Analysis and Results The statistical analysis program STATGRAPHICS + Version 4 was used to test hypotheses 1 and 2. The results showed that for American blogs, 126 emoticons were used in 523 comments. In Mexico, there were 237 emoticons found within the 517 comments that were reviewed. The relationship of comments with emoticons per type is showed in the Table 1.
TABLE 1: TYPE OF EMOTICONS IN COMMENTS PER COUNTRY
Emoticon Emoticon Type in characters
Descriptor Total of comments using emoticons per type in blogs from USA
Total of comments using emoticons per type in blogs from Mexico
= ] or :-) or :) or =) or :^)
Happiness 110 183
:-S or :S Confusion 1 10
:-( or :( or =( or D:
Sadness 9 31
XP or >:-O or >:-( or >:[ or >:E
Mad/Angry 0 3
Support 1 6
¬3¬ or ¬w¬ or ¬.¬ or ¬¬ or ¬_¬
Sarcastic 5 4
Total of comments with emoticons in 61 blogs 126 237 Total of emoticons used in total of comments 126 / 523 comments 237 /517 comments
For H1, a Hypothesis Test was run. The size for the U.S. sample consisted of 61 observations with a mean of 0.28 and a standard deviation of 0.14. Mexico’s sample size consisted of 61 observations as well, with a mean of

1819
0.5, and a standard deviation of 0.24. The computed t statistic equals -6.18413. Since the P-value for the test is less than 0.05, the null hypothesis is rejected at the 95.0% confidence level. The confidence interval shows that the values of mu1-mu2 supported by the data fall between - 0.290436 and - 0.149564. Therefore, our sample provided support for H1. Overall results indicate there is a significant cross-country difference in the use of emoticons (TABLE 2).
TABLE 2: HYPOTHESIS TEST RESULTS FOR H1
USA Mexico Sample Means 0.28 0.5 Simple Standard Deviations 0.14 0.24 Simple Sizes 61 61 95.0% confidence interval for difference between means:
-0.22 +/- 0.070436 [-0.290436, -0.149564]
Null Hypothesis: Difference between means = 0.0, mu1-mu2 = 0.0
Alternative Hypothesis: Not equal, mu1-mu2 <> 0.0
Computed t statistic: -6.18413
P-Value: 8.92496E-9 Reject the null hypothesis for alpha 0.05
Multifactor ANOVA was performed to test H2, which addresses differences in the frequency used per type of emoticon per country. The frequency on the use of emoticons was used as a dependent variable and contrasted with type of emoticon per country. The ANOVA table decomposes the variability of Frequency into contributions due to various factors (TABLE 3). The contribution of each factor is measured having removed the effects of all other factors. The p-values test the statistical significance of each of the factors. Since 3 P-values are less than 0.05, these factors were deemed to have statistically significant effect on Frequency at the 95.0% confidence level. There is a significant difference between the use of emoticons and the countries, having the Mexican blogs the highest amount of them (FIGURE 1)., and there is also significant difference between the quantities of emoticons per type used in the two countries, being the Mexican blogs were most of them are used (FIGURES 2 and 3).
For both countries, the most used emoticon was happiness (FIGURE 4). After happiness, the usage of emoticons was as follows for Mexican blogs: mad, sad, sarcastic, support, and confusion. For American blogs, the usage was: sad, sarcastic, support, and confusion.
TABLE 3: RESULTS FOR MULTIFACTOR ANOVA FOR FREQUENCY
Source Sum Of Squares Df Mean Square F-Ratio P-Value Main Effects A: Country 0.467555 1 0.467555 34.36 0.0000 B: Emoticon 8.30713 5 1.66143 122.08 0.0000 Interactions AB 0.444281 5 0.0888563 6.53 0.0000 Residual 9.7986 720 0.0136092 Total (Corrected) 19.0176 731

1820
Means and 95.0 Percent LSD Intervals
Country
Frequency
MEX USA 38
58
78
98
118 (X 0.001)
FIG. 1: FREQUENCY OF EMOTICONS VS. COUNTRIES
Interaction Plot
Emotion
Frequency
Country MEX USA
0
0.1
0.2
0.3
0.4
Confusion Happy Mad Sad Sarcastic Support

1821
FIG. 2: TYPE AND FREQUENCY OF EMOTICONS PER COUNTRY
Intera ction Plot
Country
Frequ ency
Emoti con Conf usion Happy Mad Sad Sarcas tic Support
0
0.1
0.2
0.3
0.4
MEX USA
FIG. 3: TYPE AND FREQUENCY OF EMOTICONS PER COUNTRY
Means a nd 95.0 Perce n t LSD Interva l s
Emoti con
Frequ ency
Conf u s ion Happy Mad Sad Sarcas tic Sup p ort
- 0.01
0.09
0.19
0.29
0.39
FIG. 4: FREQUENCY OF EMOTICONS IN BOTH COUNTRIES.
Discussion The results supported the hypothesis that cross-country differences do exist in the use of emoticons between the U.S. and Mexico. The results showed that Mexican users employ more frequently emoticons to express their emotions than their American counterpart. Out of 517 comments reviewed, Mexican users employed 237 emoticons as part of their postings. In contrast, American users only employed 123 emoticons on a set of 523 postings. The fact that Mexican users almost double their usage of emoticons when compared to American users perhaps denotes a more expressive society. We cannot infer that Mexican users are more emotional only from their higher usage of emoticons, but it does seem that they are a more expressive online community. It appears that the Mexican users prefer visual aides to express their views, concerns, and emotions.
From these results, it seems appropriate to recommend that online campaigns aimed towards Mexican users use a great deal of visual aids to attract and keep interest of potential consumers. This preference for emoticons uncovers a person that prefers to be highly expressive through visual tools. Online design, such as web pages, ads, and emails, should try to communicate not only with words but, with the support of vivid imagery. This approach

1822
would contrast with the one aimed towards the American user who denoted a preference for written content only. The lesser usage of emoticons of the American user should not be interpreted as a sign of a less expressive user. American users can be as expressive as the Mexican users but American users chose words rather than images to convey their feelings and thoughts.
Regarding the usage of a large variety of emoticons, Mexican users showed a larger preference for these. In addition, Mexican users showed a larger preference to use a large variety of emoticons to express their emotions. Their usage included a wide variety of emoticons such as the ones available to denote happiness, confusion, sadness, anger, support, and sarcasm. The American user opted for a smaller variety of emoticons showing again their preference for a communication style that largely prefers words.
The limitations of the study are inherent to the nature of online data. Since most of the data required to post comments on blogs is optional, our study was not able to provide demographic information such as gender, age, level of education, and income. This encourages future research to collect additional postings to obtain a larger sample size in order to achieve more generalized results. Profiles of Internet users by country based on their emotions expressed should also be considered. In addition, analyses could also be performed to study how online users make decisions or form attitudes based on their emotions.
References
[1] Blog. (n.d). Retrived March 21, 2007 from http://en.wikipedia.org/wiki/Blog [2] Choong, Y.Y; Salvendy, G. (1998). Designing of Icons for use by Chinese in Mainland China.
Interacting with Computers, 9, 417-430. [3] DeFranco, G. (2005). Creating Personalized Graphic Devices: Emoticons. Inside Photoshop; Jan; 9,1; 6-7. [4] Fang, X; Pei-Luen, P. R. (2003). Culture differences in designo of portal sites. Ergonomics. Vol 46., No. 1-
3, 242-254. [5] Holbrook, Morris B. and Elizabeth C. Hirshman (1982), The Experiential Aspects of Consumption:
Consumer Fantasies, Feelings, and Fun, Journal of Consumer Research, 9, 132-40. [6] Kassarjian, H. (1977), Content Analysis in Consumer Research, Journal of Consumer Research, 4 (1), 8-
18. [6] Kozinets, R. V. (2002), The Field Behind The Screen: Using Netnography for Marketing Research in
Online Communities, Journal of Marketing Research, 39, 61-72. [7] LaFerle, Carrie, Steven M. Edwards, and Yutaka Mizuno (2002), Internet Diffusion in Japan: Cultural
Considerations, Journal of Advertising Research, 42, 65-79. [8] Lamb, A; Johnson L.(2006)- Blogs and Blogging, Part I. School library Media Activities Montly; Apr 2006;
22, 8. 40-43. [9] Mallon, R; Oppenheim, C. (2002). Style used in electronic mail. Aslib Proceedigns; 54, 1. 8-21. [10] Perrone, J. (2005, May 20). What is a weblog?, Retrieved March 21, 2007, from Guardian Unlimted Web
site: http://www.guardian.co.uk/weblogarticle/0,6799,394059,00.html#article_continue [11] Richins, M. L. (1997), Measuring Emotions in the Consumption Experience, Journal of Consumer
Research, 4, 127-46. [12] Schmitt, Bernd H. (1999), Experiential Marketing: How to get customers to sense, feel, think, act, and
relate to your company and brands. New York: Free Press. [13] Serviere Laura, Monica D. Hernandez, and Michael S. Minor (2005), Emotions and Emoticons Expressed
in Online Communities: A Latin American Comparison, Proceedings of the Annual Meeting of the Association for Global Business.
[14] Tanskanen, S.K. (1998), Disclourse in cyberspace: Studying Computer Mediated Communications, Anglicana Turkuensia, Vol. 16, 143-156.
[15] Wolf, Alecia (2000), Emotional Expression Online: Gender Differences in Emoticon Use, CyberPsychology & Behavior, Vol. 3 (5), 827-833.

1823
[16] Wright, J. (2007). Fundamentos del Blogging: Se trata de comunicacion. In Blog Marketing (pp 3-4). Mexico. McGrawHill.

1824
Sustainability of IT Industries in India: What makes India’s IT industry Competitive?
Nibedita Saha, [email protected] Drahomira Pavelkova, [email protected] Tomas Bata University in Zlin, Czech Republic
Abstract This article tries to reveal how India’s IT industry will sustain in this high-tech competitive world, i.e. survival of the fittest. So to keep fit India, this study tries to highlight and investigate the hidden treasures of driving forces that plays a great role behind the sustainability of IT industries in India and to gain the competitive advantage. What are the major factors that influence the India’s IT industry that has been discussed in this paper followed by governmental incentives, human resources, clustering and so on.
Introduction To sustain in this modern competitive world and also to keep pace with the continuously increasing complex network of social, political and economic entities is not an easy job. On the other hand achieving success is also no longer a simple task for an individual firm and to get a best position in a global market. Though it’s not easy to get success but still there some success stories that inspire us to know. Behind every success always there are some motivating factors that stimulate to get success. This article is going to deal with one such success story, i.e., the sustainability of Information Technology (IT) industries in India. Recently it has been observed that India’s IT sector is moving very fast to compete globally in compare with other sectors. Now the question arise what makes India’s IT sector so powerful to meet the global challenges? And how India can keep on go ahead its progress in near future. This article will try to answer of all these questions.
This article argues that how the different motivating factors, especially the governmental incentives, human resources, and clustering providing a major contribution to the IT industries in India. How these factors are adding values by aligning various strategies and driving forces with business needs and connecting people from divergence. Finally this article tries to give a special reference of Bangalore, as an example how it becomes a special hub of IT industries in India with the existence of IT cluster that foster high levels of productivity and innovation and lays out the implications for competitive strategy and economic policy. Economic geography in an era of global competition poses a paradox. Today’s economic map of the world is characterized by what Porter calls clusters: critical masses in one place that linked industries and institutions [1-3]. Overview of IT Industry in India This article is going to talk about the success of India’s IT industry so we must know about the status and position of India’s IT industry. Over the past decade, Information Technology (IT) industry in India has become one of the fastest growing industries in India as well as the fastest growing segment of the Indian economy. The software and IT Enable services (ITES) raises the exports in India from US$12.9 billion to US$ 17.7 billion in the year 2004-2005. Strong demand over the past few years has placed India amongst the fastest growing IT markets in the Asia- Pacific region. The Indian software and ITES industry has grown at a Compound Annual Growth Rate (CAGR) of 28 % during the last five years. The industry's contribution to the national Gross Domestic Product (GDP) has risen from 1.2 % to a projected 4.8 % during the year 2005-06.
India has a competitive advantage with respect to this sector owing to cost advantage, skilled manpower advantage, reasonable technical innovations, Indian domestic market growth, and multi- country service delivery capabilities among others. It is expected that the contribution of IT and IT Enable services (ITES) of national GDP
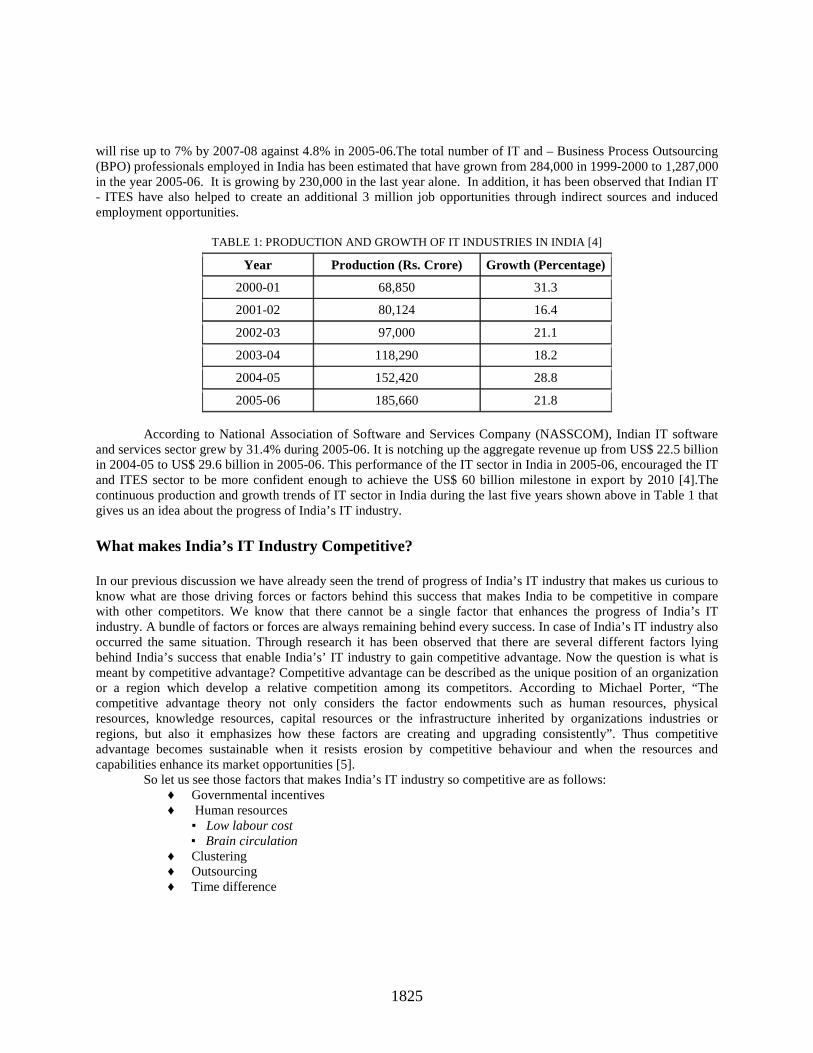
1825
will rise up to 7% by 2007-08 against 4.8% in 2005-06.The total number of IT and – Business Process Outsourcing (BPO) professionals employed in India has been estimated that have grown from 284,000 in 1999-2000 to 1,287,000 in the year 2005-06. It is growing by 230,000 in the last year alone. In addition, it has been observed that Indian IT - ITES have also helped to create an additional 3 million job opportunities through indirect sources and induced employment opportunities.
TABLE 1: PRODUCTION AND GROWTH OF IT INDUSTRIES IN INDIA [4]
According to National Association of Software and Services Company (NASSCOM), Indian IT software and services sector grew by 31.4% during 2005-06. It is notching up the aggregate revenue up from US$ 22.5 billion in 2004-05 to US$ 29.6 billion in 2005-06. This performance of the IT sector in India in 2005-06, encouraged the IT and ITES sector to be more confident enough to achieve the US$ 60 billion milestone in export by 2010 [4].The continuous production and growth trends of IT sector in India during the last five years shown above in Table 1 that gives us an idea about the progress of India’s IT industry. What makes India’s IT Industry Competitive? In our previous discussion we have already seen the trend of progress of India’s IT industry that makes us curious to know what are those driving forces or factors behind this success that makes India to be competitive in compare with other competitors. We know that there cannot be a single factor that enhances the progress of India’s IT industry. A bundle of factors or forces are always remaining behind every success. In case of India’s IT industry also occurred the same situation. Through research it has been observed that there are several different factors lying behind India’s success that enable India’s’ IT industry to gain competitive advantage. Now the question is what is meant by competitive advantage? Competitive advantage can be described as the unique position of an organization or a region which develop a relative competition among its competitors. According to Michael Porter, “The competitive advantage theory not only considers the factor endowments such as human resources, physical resources, knowledge resources, capital resources or the infrastructure inherited by organizations industries or regions, but also it emphasizes how these factors are creating and upgrading consistently”. Thus competitive advantage becomes sustainable when it resists erosion by competitive behaviour and when the resources and capabilities enhance its market opportunities [5].
So let us see those factors that makes India’s IT industry so competitive are as follows: ♦ Governmental incentives ♦ Human resources ▪ Low labour cost ▪ Brain circulation ♦ Clustering ♦ Outsourcing ♦ Time difference
Year Production (Rs. Crore) Growth (Percentage)
2000-01 68,850 31.3
2001-02 80,124 16.4
2002-03 97,000 21.1
2003-04 118,290 18.2
2004-05 152,420 28.8
2005-06 185,660 21.8

1826
Thus we can say that all these above mentioned number of factors seem to be propelled India to maintain the position of a dynamic IT player in the world. Governmental Incentives Under governmental incentive it has been observed that Government of India (GOI) has taken a major step towards promoting the domestic industry to achieve the full potential of the Indian IT entrepreneurs through venture capital by the formation of a new ministry for IT. It is necessary to highlight some major activities of GOI that open our eyes that what GOI is doing to make India’s IT to be successive. As an example we can say that to promote the Indian IT industry, the Government has set up a National Task Force on IT and Software Development to examine the feasibility of strengthening the industry. The Government of India is also actively providing fiscal incentives and liberalizing norms for Foreign Direct Investment (FDI) and raising capital abroad. Recently, an IT committee was set up by the Ministry of Information Technology, Government of India, comprising Non Resident Indian (NRI) professionals from the United States to seek expertise and advice and also to step up U.S. investments in India's IT sector. Government of India is stepping up the number and quality of training facilities in the country to capitalize its extraordinary human resource. It is estimated that India has over 4 million technical workers, over 1,832 educational institutions and polytechnics, which train more than 67,785 computer software professionals every year that helps the Indian economy to sustain higher rate of growth and the policy makers are fully aware of this achievements [6]. Human Resources Another important force or factor for the rise and growth of IT industry in India is human resource that we must agree, which is also a great advantage of India. As we all know that the international competitiveness of a firm mainly depends on its backbone, i.e. strength of human resources to respond and to face the competitive pressures in international markets that already exists in India.
FIG.1: A MODEL OF HUMAN RESOURCES AS A SOURCE OF SUSTAINED COMPETITIVE ADVANTAGE [7].
From the above mentioned Fig. 1 we can have a look that in India how Human Resource (HR) is adding
value to the business houses through its large pool of human capital, human behaviour that lead India towards competitive advantage. Explicitly, it ensure the presence of competent employees that enable an enterprise, i.e. IT industries in India to build its competitiveness that motivate those employees concerning to their development. Low Labor Cost According to resource-advantage theory of Hunt and Morgan [8], a firm strives for superior financial performance by enabling its resources to capture a position of competitive advantage in a certain market or market segment. This position is captured if two conditions are satisfied: (1) if the firm can creates more customer value than competitors do, and (2) if the firm has lower investment costs than competitors. In the case of India’s IT industry this two conditions were satisfied and facilitate India to gain the competitive advantage.
The low labor cost appears to be the most convincing factor that worked in favor for the progress of India’s software companies. From a global perspective, it can be said that salary levels in India are comparatively lower than in Western nations which is also benefiting India to achieve success. Research shows that he entry level of professionals in India are amongst the lowest (if not the lowest paid) in the Asia Pacific region. Research shows that India has a vast pool of talent comprising educated and computer literate personnel, where every year approximately 9.1 million students are enrolled for tertiary education in India. However, recruiting the right candidate for the right job remains a challenge [5].

1827
Brain Circulation India has also benefited in great deals from immigrants of Indian origin who had pursued technological careers in developed economies. This brain circulation not only helped in transfer of technology through movement of the skilled personnel or through the companies they helped and start, but has proved to be a unique factor for the development of this sector [5]. Clustering According to Porter, “an industrial cluster is a set of industries related through buyer-supplier relationships, or by common technologies, common buyers, common distribution channels, or by common labour pools.” Such type of relationship leads to improve the efficiency and international competitiveness of micro small and medium enterprises (MSMEs). Porter claims that clusters have the potential to affect competition in three ways [9]:
• By increasing the production of the companies in the cluster. • By driving innovation in the field. • By stimulating new business in the field.
In general cluster has three kinds of embedding. Namely: Institutional embedding relates the impact of regulation and norms of conduct, taxes, subsidies, legal system, infrastructure, schooling, research and labour market. Structural embedding relates the features of networks, density, centrality and the stability of the structure i.e. the rate of entry and exists. Relational embedding relates the social network to build the linkage between one firm and another that strengthen the ties, bonds and alliances of the inter-organizational relationships [10]. Clustering is also another important aspect behind the success of India’s IT industry. On the other hand it can also be said that clustering is a part of networking. Clusters are defined as concentration of activities belonging to the same sub sector. So without any hesitation we can consider the presence of cluster in India is also another major driving force, that has a great influence behind the success of India’s IT industry.
FIG. 2: THE INTEGRATED MODEL OF CLUSTER MAP [1]
Specialist
Supporting firms
Physical supporting
environment
Demand market
conditions
Cluster Core Firms
Network Structure
Human factor
Technical Infrastructure
Knowledge resources
Capital
resources
Social
supporting environment

1828
The above mentioned Fig. 2 is an example of main driving forces of a cluster that facilitate the IT industries
in India. Basically a cluster core firms has five main factors i.e., the human factor, the technical infrastructure, the network structure, capital resources and knowledge resource, which become more competent with the existence of certain supporting conditions like (a) specialist supporting firms, (b) physical supporting environment, (c) social supporting environment and (d) demand market conditions that has a great impact on innovation and competitiveness of firm’s management. These five "balloons of competitiveness" are interrelated. Each of them measures the competitiveness of a firm. Each condition has a close inter-relationship between them to make an efficient and effective firm [1]. Outsourcing Outsourcing is another aspect of a new business model and undoubtedly a business niche that is an advantage or plus point for India, which leads India to face the competitive world. A survey conducted by Sobol and Apte in 1995 [5], revealed that a significant proportion of the US companies had outsourced at least one of their information system function to a domestic provider, i.e. India. India’s outsourcing business is based on the country's decade old experience in this area, i.e. the fluency in the English language, supportive government policy infrastructure, and high quality offerings. Time Difference Time difference between the clients and the service providers in India added a round-the-clock proposition to the business and reduced total cycle time. With the advancement of telecommunications infrastructure in India, the software developers in the US and Europe could send application specifications to India at the close of their business [5]. And then the Indian programmers start working on the same program on the other side of the world and delivered the code before the US developers could resume work the next day. This needs to be counted for the sustainability of IT industry in India.
In a nut shell we can say that the above mentioned all facts and figures enable us to give a clear vision about the driving forces that enable India’s IT industries to be competitive. Observing all these situations government of India (GOI), took the initiation to build and create an enabling environment to enhance the emergence of IT cluster in India especially in Bangalore. Bangalore IT Cluster: Case Study The rise of the Bangalore IT cluster is a concrete example of the success story of IT industry in India that guaranteed us the possibilities of India’s IT industry will be more competitive. Bangalore have some positive externalities that were generated by agglomerations through the availability of (i) skilled labour and inputs; (ii) certain types of infrastructure; and (iii) innovation generating informal exchanges that makes Bangalore a special hub of IT industries (Fig.3) that enable India to sustain its IT industries.
This process of networking and clustering contribute to the competitiveness and growth of the “participating” firms in Bangalore. Industrial clustering in India has a number of benefits like: rapid interchange of information and knowledge (about best practices, about market opportunities), locational economies (it is cheaper to provide infrastructure to a cluster of software firms than to the same number of firms that are scattered), and a raised marketplace profile [11].

1829
FIG.3: SPECIAL HUB OF IT INDUSTRIES IN INDIA [12]
Research shows that GOI has took the initiative for IT industry in Bangalore by creating a special group. Where the group will [6]:
• Monitor global IT developments and refine Indian IT policy to meet global requirements. • Promote the growth of human resource development in the IT sector with the aim of creating
quality-based education; • Promote R&D in the sector by identifying thrust areas and drawing up a blueprint for action.
On the other hand from the clustering point of view research shows that 40% of country’s industrial output and over 30% of direct exports goes through clustering, the rise of Bangalore IT cluster has become successful. So we can say once again that the above mentioned factors like clustering are really enhancing the sustainability of IT industries in India.
The ICT cluster in Bangalore, India has also attracted much research and media attention as it is often referred to as the Silicon Valley of India, where it boasts over 1500 IT firms like Infosys, Wipro, Texas Instruments and Hewlett Packard [13]. Hence from the above mentioned discussion it shows that around one third of all India’s software exports are from the city of Bangalore that open our eyes how India is taking the upliftment with the existence of cluster. Above mentioned brief picture of Bangalore will clear our ambiguity and ensure how it will be possible for India to be more competitive and successive. How India’s IT Industry will become more Competitive?
We have already discussed in our earlier part of this article about the factors and driving forces behind the success story of India. Now the question arise is it possible for India to be more competitive with those above mentioned motivating factors? If so, then how? This study allows us to ensure that yes it is possible for India to become more competitive with those motivating factors by following ways as follows:
1. Building networks and reducing the cultural difference 2. Building and creating an enabling environment by public policy

1830
3. Linking multinational firms and large private firms: 4. Linking the relationship between Academy and Industry 5. Inter and Intra-Cluster linkages
Building Networks and Reducing the Cultural Difference Study shows that building networks enables a firm to be competitive and on the other hand it also reduces the gap of cultural differences. For example in India it has been observed that the talented and skilled immigrants who have studied and worked abroad, while back home they transfer not only technology and capital but also their managerial skills and institutional know-how. They try to link the local producers directly to the market opportunities to enhance the networks and reduce the cultural barriers. As a result in India that many entrepreneurs have started companies like Mastech, Syntel and Information Management Resources (IMR) in U.S. that relied on Indian programmers to provide support to the domestic clients. Bangalore IT industry is an example discussed in earlier part of this article where there are 71 to 75 multinationals in Software Technology Park (STP) were headed by Indians who lived and worked overseas. Building and Creating an Enabling Environment by Public Policy Public policy means the role of government’s initiative is one of the main and most important criteria that will benefit the IT industries in India. As like Bangalore if GOI will take the same or more initiation like (i) establishing number of universities, institutions and colleges; (ii) trade protection and liberalization for exports and export –oriented foreign investment; (iii) set-up electronic parks and infrastructure to meet the demand at an international level one day obviously India will be more competitive. Government must take initiative for creating a physical supporting environment, modern and diverse transport systems and advanced technical communication systems other than Bangalore to facilitate the India’s IT market. Linking Multinational Firms and Large Private Firms In earlier part of this article we have already mentioned about the various activities of cluster that enhance a firm’s competitiveness where small firms can get in touch with the large firms. As result small IT firms in India have started to offer their workforce on project basis to the large firms in an arrangement of contact basis. Such as System Logic, Datacons Pvt. Ltd, Intertec Communications and Nataraj Technologies are lending a part of their workforce to the multinational firms as Texas Instruments (TI) Hewlett Packard (HP), Robert Bosch to get the work done efficiently and effectively within a short period of time. Thus we can say that this is also another way how India can be more competitive to get the optimum level of outcome and to sustain in the long run. Linking the Relationship between Academy and Industry Another important aspect to be more competitive is to link the relationships between the academician and the industrialist to uphold the performance of IT industries, which is possible through clustering. In our earlier study we have seen that India has a large pool of knowledgeable manpower, so government should take initiative to open more institutions and technical universities near to the Software Technology Park (STP) complex or in other parts of India. So that fresh candidates can easily absorb in the professional field and provide their modern knowledge and skills to the industries. It has been observed that academia-industry linkages in Bangalore make Bangalore a special hub of IT industries. Inter and Intra-Cluster Linkages Inter and Intra-cluster linkages of India’s IT cluster also build a strong relationship among the same category of firms. It is to be noted that Bangalore IT firm has a close network system within India and even outside India that boost the social as well as the political stability in India to avoid labour conflicts, to establish a techno park, improving the physical infrastructure [11,13 -14]. As result we have seen IT cluster in India derive more benefits due to their proximity with customers and suppliers. So we can say that the above mentioned different paths can facilitate India to be more competitive. As Bangalore IT cluster is a special reference of all these above mentioned paths.
Conclusion

1831
Finally we can conclude that above mentioned all factors and ways are the means how India is progressing to sustain in this dynamic world with the help of various above mentioned factors specially with government incentives, with its large pool effective and efficient manpower and with clustering that broaden the scope of networking of IT industries. It gives us an insight about the competitive advantage of India’s IT industry. It necessary to say that cluster in India represent a new way of thinking about national, state, and local level that provides a new role for companies, government, and other institutions for enhancing the competitiveness of a firm. India’s IT industry is not exception of it.
Though we have viewed in our previous discussion that how India’s IT industry is moving forward, but it is also need to keep in mind that nothing in the world remain static so to keep pace with the ever changing world GOI must keep its eye open and develop more network and effective cluster based firm to reach every corner of the world. To maintain and to uplift the India’s present status certain things need to be taken into account such as:
• Human capital that determines the growth of every industry. Without the creation of high quality human capital, other advantages are not going to be of much helpful. Government of India must invest more to build high quality educational institutions for high quality personnel.
• Location is also a positive aspect of any industry. As we have seen due to locational advantage Bangalore becomes a hub of IT industry. So government of India should also search for another new location which will be suitable for building another software technology park like Bangalore.
• Technology is also another important aspect that plays a vital role. Government of India must invest more on research and development for technological upgradation and to keep pace with the changing environment.
• Ultimately, despite locational advantages, what matters is quality. It has to be remembered the largest concentration of IT companies in the world are in locations like Bangalore with the highest level of quality certifications.
• Last but not the least it might be good to create a competition among different IT clusters in the same country. Most of the IT clusters in India are viewing with each other in attracting new startups. Thus the local governments are prodded further and further to have ever increasing proactive roles which has immensely benefited India as a whole
Acknowledgement
Authors are thankful to the Grant Agency in the Czech Republic (GA CR) No. 402/06/1526 for financial support to carry out this investigation.
References [1] Martinez, C. (1998), Industry Clusters: Competitive Advantage through Innovation, Newcastle: HURDO,
Industry Cluster Studies, Working Paper No 1 [2] Porter, M.E. Clusters and the New Economics of Competition, Harvard Business Review, November-
December 1998. [3] Porter, M.E. Location Competition and Economic Development: Local Clusters in a Global Economy.
Economic Development Quarterly 14, no.1, February 2000, 15- 34 [4] Welcome to India in Business: Industry & Services, India in Business, Ministry of External Affairs
Government of India; Information Technology, overview Website http://www.indiainbusiness.nic.in/industry-infrastructure/service-sectors/it.htm
[5] Mahapatra, S. Shapira, P. (2003). Sustaining Economic Development: Contributions from and Challenges to India’s software Industry; Georgia Institute of Technology School of Public Policy; Thesis Paper Website: www.cherry.gatech.edu/REFS/STUDENT/mohapatra-2003.pdf
[6] Embassy of India: (2001) India Information; India’s Information Technology Industry, overview

1832
Website: http://www.indianembassy.org/indiainfo/india_it.htm [7] Khandekar, A and Sharma, A (2005) “Organizational learning in Indian organizations: a strategic HRM
perspective” Journal of Small Business and Enterprise Development, Vol.12, No.2, pp. 222. [8] Hunt, D.S., Morgan, M.R. (1996): “The Resource-Advantage Theory of Competition: Dynamics, Path
Dependencies, and Evolutionary Dimensions” Journal of Marketing, Vol. 60/1, pp. 107-114. [9] Business Cluster- Wikipedia, The free Encyclopaedia
Website: http://en.wikipedia.org/wiki/Business_cluster [10] Asheim, B; Cooke, P and Martin. R. (2006), Clusters and Regional Development; Critical reflections and
explorations. Routledge publishing; ISBN 13: 978-0-203-64089-0 [11] Balachandirane, G (2007), IT cluster in India, Discussion Paper no 85
Website: http://www.ide.go.jp/English/Publish/Dp/pdf/085_balatchan.pdf [12] Image Map of Bangalore2. png.Website: http://en.wikipedia.org/wiki/Image:Map_of_Bangalore_2.png [13] Basant, R (2006), Bangalore Cluster: Evolution, Growth and Challenges, Ahmedabad: Indian Institute of
Management, Working Paper No -2006-05-02 [14] REACH Technologies (2007): Why India? , India Advantages: News, Information Technology Consulting
firm. Website: www.reach-tech.com/whyindia.html

1833
Intelligent Information Processing for Educational Funding Institutions
Nooraini Yusoff, [email protected] Fadzilah Siraj, [email protected] Universiti Utara Malaysia, Malaysia
Abstract There are number of educational funding institutions such as PTPTN, JPA, MARA and state institutional bodies (SELO) that support learning of higher education in Malaysia with loan or scholarship to students for their allowances and fees. In every intake, the funding institutions have to process, screen and approve loan applications. For this purpose, several processes and decision makings are required for ensuring loans or scholarships are granted to an eligible student with a sufficient of amount. The funding institution usually employs loan officers to make credit decisions or recommendations for that particular institution. These officers are given some hard roles in processing and evaluating the worthiness of each application. As the number of applications increases every year, the loan processing and approval tasks have become more challenging and difficult especially for the funding institutions which are still practici ng manual or semi-manual processing. In addition, due to inefficient filing system, some funding institutions face a problem in tracing back the higher learning leavers for payment back purpose. As a result of interviews, observation and analysis, this study suggests the educational funding institutions to employ a web-based intelligent information system that integrates 3 systems, namely web based office automation system, knowledge-based system and artificial neural network. Hence, with integration of those three systems, the institution would be able to improve its services and reduce the time, cost and manpower to manage loan application process. Introduction Loan or scholarships are required in supporting the teaching and learning of higher education. Certain amounts of fund are given to students for their allowances and fees, thus learning institutions can provide more facilities for a well conducive learning environment. Nowadays, there are number of institutions that offer loans or scholarships including PTPTN, JPA, MARA and state intuitional bodies. Prior to mortgaging loan or scholarship, a few processes and procedures are required for ensuring loan or scholarship are granted to an eligible student with a sufficient of amount. The institution usually assigns loan officers to make credit decisions or recommendations for processing and screening submitted application. These officers are given some hard roles in evaluating the worthiness of each application. As the number of applications increases every year, the loan processing and approval tasks have become more challenging and difficult especially for the funding institutions which are still practicing manual or semi-manual processing. This may delay the loan or scholarship payment for students of higher learning institution. In addition, due to inefficient filing system, some funding institutions face a problem in tracing back the higher learning leavers for payment back purpose.
In improving routine office tasks that include data processing and reporting, a number of applications have been invented such as Microsoft Word, Access and Spreadsheet. In addition, various information systems also developed to meet specific organization’s needs. Nevertheless, today’s demands are not only for documenting and reporting, most of organizations’ tasks deal with decision-making which some decisions that may require the presence of experts in the domain. For office tasks automation purposes, existing information systems are useful in summarizing data, processing data to information and representing diagnostics information but it lack of prediction and explanation capability which some organizations might need this facilities to answer questions such as why did July’s sales drop down? or can sales be increased next month?, and what is the characteristic of students enrolled in this May or what types of student will be registering next May?. The answers can only be provided by the experts in that particular domain who have years of experience to predict and explain certain occurrences.
Hence, one of the principal courses of action in making modern automated systems of the organizational-information type more efficient is to lend them a measure of intelligence (Kozichev, 2004). This means that in

1834
addition to the usual functions of collecting, storing, accumulation, searching, processing and transmission of data, information systems should also include analysis, advisory and forecasting facilities which form the basis of intelligent information systems (IIS). IIS consists of knowledge base, database, and model base (Potter, Somasekar, Kommineni & Rauscher, 1999). The model base includes decision support models, forecasting models, and visualization models that require appropriate techniques.
On the other hand, the needs to mimic or replicate human thinking processes have motivated the research in Artificial Intelligence (AI). The capability of AI techniques in predicting, diagnosing and advising has made AI becoming popular. A number of AI techniques have been integrated into various information systems including Knowledge-based Systems (expert systems) (KBS), Fuzzy Logics and Artificial Neural Network (ANN). In this study, an integration of web-based office automation system and AI techniques specifically knowledge-based system and ANN is proposed. Web-based automation system can assist both applicants and management in performing loan application processing, while the AI techniques can be as helpful tools in loan approval decision making. Intelligent Information Processing Information systems can be defined as computer-based systems which access a variety of computer-stored or generated base data, and select and process that data to provide specific information to aid management in their routine tasks (Mahling, Craven & Croft, 1995). However, in the computing tasks needed to support higher levels processing such as analysis, decision support and forecasting, artificial intelligence techniques are essential, since the regularity appropriate to algorithmic approached is typically lacking in ordinary information system. Due to this, a number of AI techniques have been integrated with information systems in various domain that such system known as intelligent information system.
Among discussed IISs include Qiang, Bing and Yijun (2005) that incorporated artificial neural network technique specifically Amnestic Neural Network, which simulates human cognitive behavior of forgetting, to solve the problem of cross-temporal data selection. The effective of Amnestic Neural Network was tested by the application on stock price prediction experiment in the stock market of China. Meanwhile, Patel and Ranganathan (2001) integrated ANN, KBS and Fuzzy Logic for intelligent control of urban traffic that is important in providing a safe environment for pedestrians and motorists. The performance of the proposed IIS was evaluated by mapping the adaptable traffic light control problem. The results of extensive simulations using the three approaches indicate that the integrated system provides better performance and leads to a more efficient implementation. For similar integration, Weiren, Lixu, Li and Xin (2003) had also employed ANN, KBS and Fuzzy Logic in evaluating the potential public works based on both quantitative and qualitative factors to assist the decision makers to make the right decision for the sake of providing the government with an optimal prediction.
In medical domain, Liping and Lingyun (2005) discussed the use of ANN, KBS and Rough set integrated in IIS specifically for prognosis of coronary artery disease. The system correctly classified 83.75% of the testing set at a tolerance level of 0.25, and 85% at a tolerance level of 0.30. In another application, Lin, Yurong, Yanhui and Hong (2006) presented web based intelligent system for spare parts joint replenishment in a nuclear power plant. They integrate the artificial neural network and gene algorithms-based spare parts criticality class identifying system to confirm the target service level, and the web-based joint replenishment system to obtain reasonable inventory control parameters that can be helpful for reducing of total inventory holding costs. The proposed IIS was successful in decreasing inventories holding costs significantly by modifying the unreasonable purchase applications while maintaining the predefined target service level.
Since in educational loan processing tasks require the use of forecasting and advising techniques, there is a natural tendency to integrate artificial neural network and knowledge-based technique techniques with web based office automation system that such integration can be beneficial to assist the decision maker in making decisions regarding loan application. ANN provides a means for discovering the relationships in historical data, while ensuring those relationships discovered will generalize to the future data. In addition, knowledge based system supports the management by performing reasoning that can provide decision explanation which ANN is not good at this due to its “black box processing” mechanism. This integration is useful in assisting loan officers of educational funding institutions to determine whether to accept or reject an application.

1835
Background and Motivation In general, application for loan or scholarship is announced in every academic term each year. A funding institution announces the release of the application form via newspaper and or media, but there are still institutions that require applicants to go to the main office to get and to return the application form personally with an amount of price. Starting from the submission, funding institution staffs will collect all the application forms and calculate the merit for each complete application form. Merit is given by accumulating the total mark for each applicant based on the criteria defined by the institution. The range of merit that indicates the eligibility of the applicants is determined by each institution. The list of eligible applicants will then be tabled in the institution committee board meeting. In the meeting, the number of applicant selected is based on the quota allocated for each public and private university. For the number of applicant that is less than the university’s quota, the applicant will be selected based on the rank of merit. Once the approved applicants are selected, the offer letters and the agreement will then be posted to them. When the acceptance letters are received from the applicants, their profiles will be stored in files for further use. The application process will take about couple of months, starting from the submission of application up to listing out those approved applicants.
From the managerial point of view, every application of loan needs to be processed and revised for every criteria defined by particular funding bodies. As number of applicants increases year by year, the application processing has become challenging and difficult, which creates problems when most of the processes are still done manually with no systematic filing system and database. Instead of using hardcopy form, a few managements have moved to online form for the application purposes (Kozichev, 2004; Jingtao & Chew, 2001). This may reduce the task of encoding and storing applicants’ information into a database. However, evaluation to select or shortlist applicants are still consuming more time as number of application increases every year.
In addition, any funding institutions that are still practicing manual merit system will have more workload as number of applicant increases. The approval of any loan or scholarship is time-consuming as the evaluation is done manually based on human judgment. There was an issue due to qualified student were not granted applied loan or scholarship. This could be due to inconsistency in judging the loan or scholarship. Inefficient file system also could create problems in tracing the student’s status for the payment back purposes. This issue had also been raised in our media that reported the funding institutions are facing problems regarding loan payment back by the graduated students. In addition to student unawareness of this issue, the inefficient of file system also contributes to the same problem.
With the rapid evolution of electronic technology, information systems were developed that provided for the storage, manipulation, computation, reporting, and transmission of large amounts of information (Baker, 1996). These information systems were designed as a single piece of stand-alone equipment or as a work station or terminal linked to a mainframe, mini-computer, or local area network. Nowadays, information systems are integrated with AI techniques to provide facilities that require intelligence as most organizations are constantly faced with making important decisions and almost always uses prior knowledge or experience in determining them. In addition, the necessity to solve problems of practical nature and size, always arrive at correct solutions, and adapt to the changes in the application environment are the main reasons AI techniques have been applied in various domains. There are two common approaches for intelligent information system, one based on learning systems, such as the ANNs, and the other based on knowledge-based systems. In a learning system, the decisions are computed using the accumulated experience or knowledge from successfully solved examples meanwhile in knowledge-based system, decision is based on stored rules captured from the domain expert (Patel & Ranganathan, 2001).
During knowledge acquisition, the knowledge base is formed with the aid of an expert interacting with a knowledge engineer. The knowledge acquisition process consists of subtasks that include knowledge extraction, formal representation of knowledge, coding and validation. Since the quality of knowledge representation affects the efficiency, speed, and maintenance of the system, the method of knowledge representation is critical. The choice is usually limited by the application domain, the preferences of the knowledge engineer, and the expert. In learning systems such as ANNs, the knowledge acquisition task is performed by the training process. However, the training

1836
process, in most cases, is a time-consuming task requiring the application of input training patterns in an iterative manner (Sima & Cervenka, 1998).
An important aspect in intelligent information system design is decision explanation, which involves supplying a coherent explanation of its decisions (Kasabov, 2002). This is required for acceptability of the solution and correctness of the reasoning. The knowledge-based systems can explain the reasoning process by evaluating the trace generated by the inference engine or by analyzing the rule base (which typically use IF THEN rules). In learning systems such as ANNs, knowledge is represented in the form of weighted connections, making decision tracing or extraction difficult. Thus, using an ANN or a knowledge-based system approach to intelligent information system leads to different levels of performance depending on the model as well as the application. By integrating the two approaches, it is possible to overcome the deficiencies associated with using a single approach. Knowledge Based Systems Knowledge-based systems (KBS) (Fig. 1) use human knowledge to solve problems normally requiring human intelligence. The aim is to model and implement human expert knowledge. A knowledge-based system can act as a human expert in diagnosing and troubleshooting of certain problem. Due to this, most of the KBSs developed are concentrating in advising that the main purpose is to automate such facility as well as to provide consistent decision. In addition, the deployment of the KBS may also be able to assist the administrative in decision-making, thus to succeed they should possess performance at the same level as the human expert.
Among researchers that discussed the use of KBS include McGowan, Gleeson & McGowan (1998) that
highlighted “expert” admissions system that was developed to screen and evaluate applicants’ information (e.g., undergraduate college, grades on specific courses, etc.) for American Medical College Admission. In addition, Harlan (1994) also proposed the Automated Student Advisor, a KBS that provides the user with an accurate picture of the progress a student has made towards graduation and to assist in selecting courses for the upcoming semester. Meanwhile, McAninch (1998) proposed Principia Student Advisor, an expert system for advising on course prerequisites, all college requirements and off campus study program of Computer Science majors at Principia College. As an advisory system, KBS has the capability to explain and justify the “why” and “how” certain decision is inferred. These are suchalso systems that have been used in industry and finance (Pomykalski, Truszkowski & Brown, 1999), and government (Shrobe, 1996)) for many years.
FIG. 1: KNOWLEDGE BASED SYSTEM
KNOWLEDGEBASE
Problem area
Domain expert
Knowledge engineer
INFERENCE ENGINE
INTERFACE
...............
rules
Knowledge
Knowledge
KNOWLEDGE BASED SYSTEM

1837
Artificial Neural Networks With the advent of modern computer technology and information science, sophisticated information systems can be built that can make decisions or predictions based on information contained in available past data. Such systems are called learning systems and are currently used for the purpose of classification and prediction (Principe, Euliano & Lefebvre, 2000). ANN are popular AI techniques for classification and prediction problem.
An artificial neural network system is an artificial intelligence model that replicates the human brain’s learning process. Tsoukalas & Uhrig (1997) define a neural network as: “A data processing system consisting of a large number of simple, highly interconnected processing elements (artificial neurons) in an architecture inspired by the structure of the cerebral cortex of the brain.”
In an artificial neural network, a number of inputs, or attributes, and their corresponding outputs, or classes, are given. A training algorithm uses these sample inputs, called the training set, to design a decision function that can accurately predict the class for any sample thereafter. The algorithm response is compared to the actual response to determine how well the classifier performs (Barker, Trafalis & Rhoads, 2004).
Nodes are used to represent the brain’s neurons and these nodes are connected to each other in layers of processing. Fig 2 illustrates the three types of layers of nodes: the input layer, the hidden layer or layers (representing the synapses) and the output layer. The input layer contains data from the measures of explanatory or independent variables. This data is passed through the nodes of the hidden layer(s) to the output layer, which represents the dependent variable(s). A nonlinear transfer function assigns weights to the information as it passes through the hidden layer nodes, mimicking the transformation of information as it passes through the brain’s synapses. The goal of the artificial neural network model is that the effect of these weights will result in a response that is equivalent to the response that would result from the relationship that really exists between the input independent variables and the output, or dependent, variable(s).
In contrast, a traditional knowledge-based system would have rules encoded within it that a designer has
previously identified. The advantage of artificial neural network systems is that it is not always possible for a human designer to express and encode rules in a reasonable time-frame or even express then at all. A further disadvantage of knowledge-based systems is that if the rules change for some reason then it is necessary for the designer to reincorporate the new rules within the rule-base (Barker et al., 2004)
Integration of artificial neural network had been discussed by Mullier, Moore and Hobbs (2002) that proposed an automated system for predicting the grade and the questions in a tutorial with minimal input from the human teacher. In addition, Cripps (1996) discussed the use of artificial neural networks to predict degree program completion, earned hours, and GPA for college students. Carlson (2000) also proposed the deployment of artificial neural network to predict which applicants are likely to enroll at Hopkins College. The use of artificial neural network also may be able to help administrators with a variety of other planning chores, such as precisely predicting the demand for student services, or estimating how much space on the campus to devote to which uses.
FIG. 2: NEURAL NETWORK ARCHITECTURE

1838
Another applications of ANNs found in literature also include in business (Hanke & Reitsch, 1998; Hall, 2000; Siraj, Zakaria, Ab Aziz & Abas, 2003), economy (Siraj & Junoh, 2002), financial (Kaastra & Boyd,1996; Perez,1999; Surkan, 1999; Siraj, Zakaria, Yasin & Ishak, 2000; Jingtao & Chew, 2001), and education (Whitson, 1999; Carlson, 2000; Mullier,2001; Gonzalez & Des Jardins, 2002; Siraj &Asman, 2002; Siraj & Rahman,2003; Siraj & Sudin, 2003; Yusoff & Siraj, 2006; Barker, 2004).
Intelligent Information System for Educational Funding Institution In improving the capability of information system this study suggests funding institutions to integrate two AI techniques namely, knowledge-based system and artificial neural network. In essence, the potential use of such a system can be accelerated to promote any organizations as an efficient and effective organization that has competitive advantage. Fig. 3 illustrates the intelligent information system.
FIG. 3: INTELLIGENT INFORMATION SYSTEM FOR EDUCATIONAL FUNDING INSTITUTIONS
Prediction results
Information
data data
data
Reporting Software Reporting Maths /Stats/AI
ModelsGraph Decision Support SystemDecision and analysis
Pre- Processing Pre-processing Application FormApplication Form
Knowledge Base
Knowledge
Predicted approvable applicants Information
Solution & Explanation
Loan Officer
Information (Universities)
Information (Policies,rules..)
Artificial Neural Network Knowledge Based
System
Web based Office Automation System
ANN
Advisory services
Internet
Applicants
RESULT
Applicant with
Applicant’s DB
sufficient merit

1839
As depicted in Fig. 3, the proposed intelligent information system comprises 3 main subsystems; Web based Office Automation System, Knowledge-based System and Artificial Neural Network. Web-based Office Automation System Web based office automation system can be implemented to ease the loan application access with some payment mechanisms such as online payment. The form application can filled up and submitted through online. As an application submitted, the information will automatically be stored into the system database. Before evaluation takes place, the merit calculation for each application can be done automatically whenever the management needs the information. Even the acceptance letter can be generated automatically. The stored information can accessed easily with some authorization procedures when the evaluation to be performed. Knowledge-based Approach The integration of knowledge based system can provide advisory services to the management in loan approval decision making. The system consists of rules that explicitly explain why an application is recommended to be accepted or rejected. In addition to knowledge-based system, artificial neural network system can help the management to predict which application to accept or reject. This can be done as ANN has trained previous batch of loan application data and stored association between application characteristics (attributes) that explains which applications were accepted and rejected. The association in previous data can predict the new current application data with same characteristic but no loan acceptance result (Garret & Leatherman, 2000; Baesens, Van Gestel, Stepanova & Vanthienen, 2003; Handzic, Tjandrawibawa & Yeo, 2003). Artificial Neural Network Approach In this study, the NN approach involves 2 main processes that include data training and prediction. Data training involved in obtaining a set of weight coefficients ([v] and [w], see Fig. 4) from historical data collected earlier. The sampling consists of 1062 records of previous loan application from Lembaga Bisasiwa Negeri Kedah (LBNK), one of the state educational loan bodies that have been accepted and rejected. Many of the questions found on the survey closely resemble student attributes appearing in the LBNK’s loan application form and other educational research. The data set consists of respondents’ academic, demographic, and socio-economic backgrounds have been identified as the number of input nodes in the input layer. The target output or the classification variable is divided into two categories of loan application status, reject or accept. The collected data was pre-processed and cleansed prior to training. The result from training indicates that ANN obtained 99.06% prediction accuracy.
Once training is completed, the web based prediction module is able to predict the status of an application (accept or reject) using a feedforward Neural Network algorithm. The algorithm uses the weight obtained from the training process and also the Binary Sigmoid Function (as 1) to predict the educational loan application status.
Application status, yk = 1/(1 + exp -y_in k) (1)
Prior to predicting the application status, the user of the prediction system has to respond to some questions based on his/her academic, demographic, and socio-economic background. During the testing phase, 200 hundreds of applications can be processed and predicted the acceptance status in less than half an hour. The ANN process can be illustrated in Fig. 4.

1840
APPROVED
REJECT
HISTORICAL DATA
1
1
DATA TRAINING
Attribute n Attribute 2
Attribute 1
Input layer
Hidden layer
Output layer
weights [vij]
weights [wj]
v00
x1 x2 xn
z0 z1 z2
y
v01
v02
v12 v11
v10
v20 v21
v22 v30
v31 v32
w0 w1
w2 w3
-------------
weight v
PREDICTION
NEW DATA
-------------
weight w
FIG. 4: ARTIFICIAL NEURAL NETWORK PROCESS

1841
ANN and knowledge-based systems have been extensively explored as approaches for decision making. While the ANNs compute decisions by learning from successfully solved examples, the knowledge-based systems rely on a knowledge base developed by human reasoning for decision making. It is possible to integrate the learning abilities of an ANN and the knowledge-based decision-making ability of the KBS. Both knowledge-based and ANN system can assist the management in evaluating application. The management only needs to agree or disagree to the system recommendations and advices without reviewing each application one by one. All the information and explanation provided by system are based on human represented knowledge or previous loan application results. The proposed integration can be beneficial in reducing the time required for loan application processing and with efficient database management system, the information can be updated easily that can ease the process of tracing the graduated students for payment back purposes. Conclusion This study focuses on loan or scholarship application processing, emphasizing on the information management perspectives, specifically the way the educational funding institution manages loan application processes. From the information management point of view, this study identifies several flaws in loan application processing. One of the apparent problems is the time taken for processing application forms. Since the number of staffs that have to deal with the applications is small, the processing time is bound to increase as the number of applicants increases from year to year. Therefore, the importance of automation system in loan application processing is undeniable. Consequently, once the automization of the information system takes place, the paper-based management can be transformed into paperless management which form web based office automation system. In effect, the cost of providing application forms is reduced and the number of staff required is minimal.
However, as the result to overcome lacking in existing information system, an intelligent information system has been presented in this study. The system consists of web based automation system, artificial neural network and knowledge-based system. Web based office automation system is useful that it may ease the loan application process. The form application can be filled up and submitted through online. As an application submitted, the information will automatically be stored into the system database. For initial screening purpose, the merit calculation for each application can be done automatically whenever the management needs the information. ANN can be used to predict an application is to be accepted or rejected. This can be done as ANN has trained previous batch of loan application data and stored association between application characteristics (attributes) that explains which applications were accepted and rejected. From experiment of data training that had been conducted in this study, it was shown that ANN has achieved satisfactory result with 99.06% classification accuracy. The result indicates that ANN has strong potential as a forecasting technique in classifying educational loan application. Meanwhile the integration of knowledge-based system can provide advisory services to the management in loan approval decision making. The system consists of rules that explicitly explain why an application is recommended to be accepted or rejected. Nevertheless, the final decision is based on the management whether to agree or disagree with the system’s recommendations.
By integrating this system into any funding institutions’ systems, inevitably it can ease the decision-making for the institutions especially in the loan process application. This system can also assist in screening for eligible applicant. Hence, with integration of those three systems in funding institution information system, the institution would be able to improve its services and reduce the time, cost and manpower to manage loan application process.

1842
References
[1] Baesens, B., Van Gestel, T., Stepanova, M. & Vanthienen, J. (2003). Neural network survival analysis for personal loan data, Proceedings of the Eighth Conference on Credit Scoring and Credit Control (CSCCVII'2003).
[2] Baker, B. (1996). Improving the effectiveness of IS Planning: The Existence of Feedback and Its Relationship to Success, Ph. D. Thesis, University of Warwick, England.
[3] Barker, K., Trafalis, T. & Rhoads, T. R. (2004). Learning From Student Data, Proceedings of the 2004 Systems and Information Engineering Design Symposium. Jones, M. H., Patek, S. D. & Barbara Tawney, E., eds., 79 – 86.
[4] Carlson, S. (2000). Neural Networks may transform college planning. Washington, The Chronicle of Higher Education, 46(29), issue dated March 24.
[5] Cripps, A. (1996). Using Artificial Neural Nets to Predict Academic Performance. Proceedings of the ACM symposium on Applied Computing, 33-37. ACM Press New York, USA (ISBN:0-89791-820-7).
[6] Garrett, T. A. & Leatherman, J. C. (2000). An Introduction to State and Local Public Finance. Regional Research Institute, West Virginia University [online] <http://www.rri.wvu.edu/WebBook/Garrett/chapterfour.htm>
[7] Gonzalez, J. M. B. & Des Jardins, S. L. (2002). Artificial Neural Network: A New Apparoach to Predicting Application Behaviour, Research in Higher Education, 43(2), 235 -258.
[8] Hall, O., P. (2002). Artificial Intelligence Techniques Enhance Business Forecasts: Computer-based analysis increases accuracy [online]. <http://gbr.peperdine.edu/022/print_intelligence.html>.
[9] Handzic, M., Tjandrawibawa, F. & Yeo, J. (2003) How Neural Networks Can Help Loan Officers to Make Better Informed Application Decisions [online] <http://www.citeseer.ist.psu.edu/handzic03how.html>.
[10] Hanke, J., E. & Reitsch, A., G. (1998). Business Forecasting (6th Ed). New Jersey: Prentice Hall. [11] Harlan, R.M. (1994). The Automated Student Advisor : A Large Project for Expert Systems Courses. ACM SIGCSE Bulletin, 26 (4), 31 – 35. [12] Jingtao Y. & Chew, L.T. (2001). Guidelines for Financial Forecasting with Neural Networks, Proceedings
of International Conference on Neural Information Processing, Shanghai, China, 757-761 [13] Kaastra, I. & Boyd, M. (1996). Designing a Neural Network for Forecasting Financial and Economic Time
Series, Neurocomputing, 10, 215-236. Elsevier Science B.V. [14] Kasabov, N. (2002). Connectionist-Based Decision Support Systems and Expert Systems. Department of
Information Science, University of Otago, New Zealand. divcom.otago.ac.nz/infosci/kel/CBIIS/pubs/pdf/hbsnn2002-kas.pdf
[15] Kozichev, V.N. (2004). Intelligent information systems: application and principles of designing [online] <http://www.findarticles.com>.
Contact authors for the full list of references.

1843
Optimal Learning Path in Distance Learning using Neuro-Fuzzy Approach
Iraj Mahdavi, [email protected] Babak Shirazi
Hamed Fazlollahtabar Navid Sahebjamnia
S.Ali Hadighi Mazandaran University of Science and Technology, Babol, Iran
Abstract Internet evolution has affected all industrial, commercial, and especially learning activities in the new context of e-learning. Due to cost, time, or flexibility, e-learning has been adopted by participators as an alternative training method. By development of computer-based devices and new methods of teaching, distance learning has been emerged. The effectiveness of such program is depended on powerful learning management systems. In this paper, a neuro-fuzzy approach is proposed based on evolutionary technique to obtain an optimal learning path for each learner. Therefore, the neural network approach has been applied to make personalized curriculum profile based on individual learner requirements in a fuzzy environment. Keywords: e-learning, optimal path, distance learning, neuro-fuzzy Introduction Internet has significantly impacted the establishment of Internet-based education, or e-learning. Internet technology evolution and e-business has affected all industrial and commercial activity and accelerated e-learning industry growth. It has also fostered the collaboration of education and Internet technology by increasing the volume and speed of information transfer and simplifying knowledge management and exchange tasks. E-learning could become an alternative way to deliver on-the-job training for many companies, saving money, employee transportation time, and other expenditures. An e-learning platform is an emerging tool to corporate training. Employees can acquire competences and problem solving abilities via Internet learning for benefits among business enterprises, employees, and societies while at work.
Currently e-Learning is based on complex virtual collaborative environments where the learners can interact with other learners and with the tutors or the teacher. It is possible to give to the learner's different synchronous and asynchronous services. The former group includes virtual classrooms and individual sessions with the teacher or tutors. The latter group includes the classic didactic materials as well as Web-based seminars or simulations always online. These functions can be usually accessed by the means of software platforms called Learning Management Systems (LMSs). Among the other functions, the LMS manages learners, keeping track of their progress and performance across all types of training activities. It also manages and allocates learning resources such as registration, classroom and instructor availability, monitors instructional material fulfillment, and provides the online delivery of learning resources. User and student modeling is a fundamental mechanism to achieve individualized interaction between computer systems and humans [Paiva, A., 1995]. It is usually concerned with modeling several user related issues, such as goals, plans, preferences, attitudes, knowledge or beliefs. The most difficult task in this context is the process of interpreting the information gathered during interaction in order to generate hypotheses about users and students behavior [Paiva, A., 1995], and involves managing a good deal of uncertainty. Interactive computer systems deal in general with more meager and haphazardly collected users’ data than it usually happens when humans are engaged in face-to-face interaction [Jameson, A., 1996]. Thus, the gap between the nature of the available evidence and the conclusions that are to be drawn is often much greater [Jameson, A., 1996]. Numerical techniques have been employed in several cases in order to manage uncertainty, [Beck, J., Stern, M., Woolf, B.P.,

1844
1997; Conati, C., Gertner, A., Vanlehn, K., 2002; Hawkes, L.W., Derry, S.J., 1996; Herzog, C., 2005; Katz, S., Lesgold, A., Eggan, G., Gordin, M.,1992; Lascio, L.D., Gisolfi, A., Loia, V., 1998; Panagiotou, M., Grigoriadou, M., 1995], and neural networks have been used in order to add learning and generalization abilities in user models and draw conclusions from existing user profiles [Chen, Q., Norcio, A.F., Wang, J., 2000; Harp, S.A., Samad, T., Villano, M., 1995; Magoulas, G.D., Papanikolaou, K.A., Grigoriadou, M., 2001; Mengel, S., Lively, W., 1992; Mengel, S., Lively, W., 1990; Posey, C.L., Hawkes, L.W., 1996; Stathacopoulou, R., G.D. Magoulas, M. Grigoriadou, 1999; Yasdi, R., 2000].
According to Self, [Self, J., 1991], student modeling is the process of creating and maintaining student models. It is divided into the design of two different but tightly interwoven components [VanLehn, K., 1988]: (1) the student model which, in its simplest form, is a data structure that stores information about the student; (2) the diagnostic module which performs the diagnostic process that updates the student model. Student models are distinguishing features of Artificial Intelligence, (AI), based computer-based instructional systems. This work focuses on an application of student modeling in Intelligent Learning Environments (ILE). ILEs are considered as generalization of traditional Intelligent Tutoring Systems (ITSs), which are based on objectivist epistemology, and embrace instructional environments that make use of theories on constructivism and situated cognition [Akhras, F.N., Self, J.A., 2002]. Naturally, a ground for building student models for ILEs is provided by research conducted in the area of ITSs [Brusilovski, P., 1994]. The student model-centered architecture is also proposed for ILEs in order to support student driven learning and knowledge acquisition [Brusilovski, P., 1994]. Ideally, the student model should include all the aspects of student’s behavior and knowledge that have repercussions for their performance and learning [Wenger, E., 1987]. In practice, the contents of the student model depend on the application. It includes learner goals and plans, capabilities, attitudes and/or knowledge or beliefs, and is used as a tool to adapt ILE’s behavior to the individual student [Holt, P., Dubs, S., Jones, M., Greer, J., 1991]. Inferring a student model is called diagnosis because it is much like a medical task of inferring a hidden physiological state from observable signs [VanLehn, K., 1988], i.e. the ILE uncovers the hidden cognitive state (student characteristics) from observable behavior. Evidence shows that human teaching is not based on fine-grained diagnostic behavior [Reusser, K., 1996]. In particular, studies in human tutoring have found little evidence to suggest that human tutors build detailed cognitive models as a basis for understanding student performance and adapting their tutoring strategy [McArthur, D., Stasz, C., Zmuidzinas, M., 1990; Putman, R.T., 1987]. More recently, researchers have tried to identify the constructs that tutors use to classify and discriminate among different students states for the purpose of adapting tutoring to student individual differences [Derry, S.J., Potts, M.K., 1998]. The neural network-based fuzzy model presented in this paper investigate the optimal path for a student in a distance learning educational system based on items such as capabilities, attitudes, knowledge level, motivation and learning style. Fuzzy logic is used to provide a mode of qualitative reasoning, which is closer to human decision making since it handles imprecision and vagueness by combining fuzzy facts and fuzzy relations, whilst neural networks provide a convenient way to achieve adaptability of the diagnostic process for reasoning and judgments. Fuzzy and Neural Approaches to User (Instructor) and Student Modeling As already mentioned a variety of numerical techniques have been employed in user and student modeling systems in order to handle the imprecise information provided by the users, and reason under vagueness and uncertainty; a comparative review of techniques can be found in [Jameson, A., 1996]. For example, Bayesian networks have been successfully used to relate in a probabilistic way user’s knowledge and characteristics with user’s observable behavior. The key to success with all Bayesian network models lies in accurately representing the probabilistic dependencies in the task domain [Conati, C., Gertner, A., Vanlehn, K., 2002]. Fuzzy logic techniques have also been used for this task effectively. When considering the use of such techniques in a user or student modeling system, the addressed arguments do not concern in principle the question of whether or not fuzzy logic provides accurate or useful results by rather the usability of fuzzy logic techniques in the design of the specific system, in terms of

1845
knowledge engineering requirements, programming effort, empirical model adjustment, computational complexity, human-likeness, interpretability and justifiability [Jameson, A., 1996].
One of the first attempts in using fuzzy student modeling has been made by Hawkes et al. [Hawkes, L.W., Derry, S.J., 1996]. In this context fuzzy logic has been proposed as a flexible and realistic method to easily capture the way human tutors might evaluate a student and handle tutoring decisions, which are not clear-cut ones. Clearly, the capability to deal with such imprecision is a definite enhancement to both ITSs and ILEs. This approach, which has been revised some years later [Hawkes, L.W., Derry, S.J., Rundensteiner, E.A., 1990], was used to evaluate students in a system called TAPS, and applied degrees of membership to linguistic labels that match student’s solutions to ‘‘acceptable’’ solutions with the use of informal fuzzy reasoning. Towards this direction, several other attempts have been proposed in the literature. In Sherlock II [Katz, S., Lesgold, A., Eggan, G., Gordin, M., 1992] and in the MDF tutor [Beck, J., Stern, M., Woolf, B.P., 1997] the uncertainty in student’s performance was managed using fuzzy distributions and a set of rules for their formulation and update. Several other systems have been employed based on fuzzy logic concepts. In an ITS for the physics domain, the, so called, ‘‘Knowledge and Learning Student Model’’ [Panagiotou, M., Grigoriadou, M., 1995] has been proposed to infer student’s knowledge level and cognitive abilities through processing and aggregating membership functions that represent teacher’s assessments. Fuzzy rules have been proposed in the BSS1 tutoring system [Warendorf, K., Tsao, S.J., 1997] to implement a general fuzzy logic engine that can better manage student’s learning, and in SYPROS [Herzog, C., 1994] to help determine student’s plans. A fuzzy algebraic structure has been proposed as a dynamic model of user’s states during navigation to monitor cognitive variables of the user model in a multimedia tutoring system [Lascio, L.D., Gisolfi, A., Loia, V., 1998]. The development of fuzzy logic in user or student modeling systems was motivated largely by the desire to make the arbitrary specification of precise numbers unnecessary [Jameson, A., 1996]. For certain types of problems, such as learning to interpret complex real-world sensor data, neural networks are among the most effective learning methods currently known [Mitchell, T.M., 1997]. In the user or student modeling field, neural networks have been proposed in the literature mainly due to their ability to learn from noisy or incomplete patterns of users’ or students’ behavior, generalize over similar cases, and then use this generalized knowledge to recognize unknown sequences [Chen, Q., Norcio, A.F., Wang, J., 2000; Yasdi, R., 2000]. Particularly in student modeling, neural networks have been originally proposed to simulate student’s cognitive process of performing subtraction with the aim to predict student’s responses and errors [Mengel, S., Lively, W., 1992]. A problem, which comes up when trying to apply a neural network in modeling human behavior, is knowledge representation [Yasdi, R., 2000]. The fact that student models need to be inspectable, [Wenger, E., 1987], explains the small number of neural network-based student models as opposed to symbolic approaches [Sison, R., Shimura, M., 1998]. Neural networks and other numeric-based AI methods have been criticized as unable to support learning interactions because they only allow for implicit understanding [Self, J., 1995]. However, several attempts have been made to incorporate the powerful learning abilities of neural networks in existing student modeling systems taking advantage of synergies with other AI methods. A hybrid approach, where each node and connection has symbolic meaning, has been proposed in TAPS [Posey, C.L., Hawkes, L.W., 1996]. The back-propagation algorithm has been used to modify weights that represent importance measures of attributes associated with student’s performance, in order to refine and expand incomplete expert knowledge. Another approach combining ideas from neuro-fuzzy systems has been proposed [Shi, Y., Mizumoto, M., Yubazaki, N., Otani, M., 1996]. In [Magoulas, G.D., Papanikolaou, K.A., Grigoriadou, M., 2001], the model of [Shi, Y., Mizumoto, M., Yubazaki, N., Otani, M., 1996] has been expanded to incorporate evaluation mechanisms that used multi-attribute decision making for synthesizing various judgments to estimate student’s knowledge levels and personal characteristics in order to plan the content of a Web based course. The proposed model allows exploiting and efficiently processing structured knowledge in the form of linguistic rules. Of course it is not always possible to elicit this knowledge from the teachers. Teachers, sometimes, although they can easily classify students by observing their actions, they cannot articulate rules that reproduce their decisions. In addition, teachers are able to classify students with respect to specific characteristics, whilst in the case of ILE-supported learning students’ behavior cannot be defined accurately. To alleviate these problems, a neural

1846
network-based implementation of the diagnostic process is adopted. Specialized neural networks are trained through examples of existing students’ profiles, or using examples that represent teacher’s experience. Knowledge is represented by developing association of student’s behavior patterns with particular characteristics through neural network learning and is expressed, if necessary, with fuzzy IF-THEN rules. Thus, it is possible to encode structured and non-structured knowledge. The Fuzzy-based Diagnosis System Student’s observable behavior is considered important source of diagnostic evidence to both human tutors and ILEs. In the terminology of ILEs, student’s behavior refers to a student’s observable response to a particular stimulus in a given domain. The response, together with the stimulus, serves as the primary input to the student modeling system [Sison, R., Shimura, M., 1998]. The input can be an action or the result of that action, and can also include intermediate results [Sison, R., Shimura, M., 1998]. However, it is not generally clear what type of information is available during interaction, and which features of student’s behavior should be selected as inputs to the diagnostic process. Human tutors obtain diagnostic information from observing what students would say and do, and how something is said and done, i.e. tone of voice, inflection, hesitancy, etc. [Derry, S.J., Potts, M.K.,1998]. Studies in human tutoring found that tutors use as diagnostic evidence for adapting their tutoring not only errors and student’s responses to queries, but also features of interaction, e.g. the timing of student responses, the way of delivering a response and others [Derry, S.J., Potts, M.K.,1998].
In order to alleviate the problem of limited information that is caused by the restricted communication channel between student and ILE, our system implements a close monitoring mechanism of student’s actions over time, where each response such as keystroke, mouse move or drag can be timed and recorded. In this manner student’s observable responses are summarized into n groups. Each group contains information about student’s behavior of a specific type of knowledge data, chronometric data, try data or navigation data. A teacher usually defines specific types of responses that enable him or her to discriminate among students with regards to a particular characteristic.
The set { }ni BBBBB ,...,,...,, 21= , where Bi (i = 1, 2, . . . , n) is a word or a sentence describing the i th
type of response that is observed, describes linguistically the k aspects of student’s observable behavior that will serve as inputs to the diagnostic process. The term observable, here, stands for measurable. The n measured responses constitute a set of numeric information that represents student’s behavior. Each type i (i = 1, 2, . . . , n)
takes its values in a set of positive numbers Ui. The numerical input { }ni xxxxX ,...,,...,, 21= , where ii Ux ∈
and iU is the universe of discourse of the i th input; each +ℜ⊂iU (i = 1, 2, . . . , n) represents the measured
values of Bi and formulates an input to the diagnostic process. The output of the diagnostic process updates the student model regarding L different student learning
characteristics H1, H2, . . . , HL, such as student’s abilities, motivation or learning style. Student’s evaluation regarding each characteristic Hl (l= 1, 2, . . . , L) is described qualitatively with the use of linguistic values. Depending on the l th characteristic we use a different number ml of linguistic values that describe Hl (l= 1, 2, . . . , L). Student’s evaluation regarding each characteristic is assessed by processing the numerical input
{ }ni xxxxX ,...,,...,, 21= , of student’s behavior. The process consists of three stages: fuzzification, inference,
and defuzzification (see Fig. 2). In the first stage a qualitative description of student behavior is obtained by transforming the numeric input data into linguistic terms. The i th fuzzifier i= (1, 2, . . . n) transforms the numeric input xi into membership degrees of the linguistic values that describe Bi. In the second stage, the inference process provides a fuzzy assessment of student’s characteristics, H1; H2; . . . ; HL, by assessing membership degrees to the linguistic terms that describe each characteristic HL. To this end, an ensemble of specialized fuzzy systems, where each system infers about a particular characteristic HL is used to make a fuzzy assessment from a fuzzy precondition. A fuzzy system of this type combines linguistic values and realizes fuzzy relations operated with the max-min composition. These relations represent the estimation of a human tutor to the degree of association between an
observed input { }ni xxxxX ,...,,...,, 21= , and a fuzzy assessment of a particular student characteristic Hl (l= 1, 2,
. . . , L). Finally, in the third stage, the fuzzy assessments are defuzzified to non-fuzzy values, i.e. evaluation

1847
decisions for the characteristics H1, . . . , HL by using a defuzzifier from the ensemble of the Q defuzzifiers. Each defuzzifier has a different number of inputs. Therefore, depending on the number of linguistic values ml of each characteristic Hl (l= 1, 2, . . . , L) a different defuzzifier Q is used in order to evaluate student’s characteristic.
FIG. 1: SCHEMATIC OF THE FUZZY DIAGNOSIS MODEL
Fuzzification Stage for Fuzzy Knowledge Representation This stage represents in linguistic form teacher’s subjective description of student’s responses when acting face-to-face communication during instruction (e.g. the time needed to solve the exercises was short; the student answered enough questions during instruction). The types of responses B1, . . . , Bi; . . . , Bn are treated as linguistic variables. Each variable Bi= (i= 1, 2, . . . , n) can take different number of linguistic values fi. The number fi of the linguistic
values and their names if
VVV ,...,, 21 are defined by the developer with the help of experts, and depend on each
variable. The set { }iifii VVVBT ,...,,)( 21= is the term set of Bi. For example, let us consider the linguistic variable
Bi =”time on task”. The corresponding term set could be
{ }LongNormalShorttaskontimeTBT i ,,)()( == including three (fi=3) linguistic values, or any
classification such as { }LongVeryLongNormalShortShortVerytaskontimeTBT i ,,,,)()( ==
including five (fi=5) linguistic values, depending on the required resolution. { })(),...,(),...,( 1 ni BTBTBTT = is
the set of all term sets that represent the overall observable behavior B (for all Bi; i = 1, 2, . . . , k). Thus, the numeric
input { }ni xxxxX ,...,,...,, 21= , that represents the measured values of B1; . . . ; Bi; . . . ; Bn is fuzzified by means
of linguistic values .,...,,;,...,,;,...,, 212111211 1 ni nfnnifiif VVVVVVVVV Hence, the student behavior B is
represented as a set of numeric values { }),...,,(),...,,...,,(),...,,...,,( 212111211 1 ni nfnnifiif yyyyyyyyyY = in
[0,1], which represent the degree of membership of each numeric value xi (i = 1, . . . , n) into the term set of Bi with
linguistic values iifii VVV ,...,, 21 .
Inference Stage for Fuzzy Knowledge Representation This stage represents teacher’s reasoning in categorizing students qualitatively according to their abilities and personal characteristics, such as attentive, rather slow, good, etc. Teachers’ can provide a series of IF-THEN rules that approximates their reasoning. For example, if the time spent to read the theory is short and the number of correct answers is high, and few attempts to find the correct answers have been made then the student learning rate is fast.

1848
In our model, a qualitative description of student’s characteristics H1, H2, . . . , HL is performed by treating student’s characteristics as linguistic variables. Each linguistic variable HL can take a different number of linguistic
values ml. { }llmlll HHHHT ,...,,)( 21= is the term set of Hl. The expert-teachers set the number ml of the
linguistic values and their names llmll HHH ,...,, 21 for each characteristic Hl according to their personal judgment.
For example, if we treat the linguistic variable Hl “learning rate of the student” using five linguistic values (ml=5) then the term set could be: T(Hl)= T (learning rate)={Slow, Rather Slow, Normal, Almost Fast, Fast}. In this way, a mode of qualitative reasoning, in which the preconditions and the consequents of the IF-THEN rules involve fuzzy variables [64], is used to provide an imprecise description of teacher’s reasoning:
21 2211 II VisBANDVisBIF …21 2211 LLnIn HisHANDHisHTHENVisBAND
n…
llLL HisHAND
where I1 = 1, 2, … , f1; I2 = 1, 2, . . . , f2; In = 1, 2, . . . , fn ; L1 = 1, 2, . . . , m1; L2 = 1, 2, . . . , m2; LL = 1, 2, . . . , mL. All possible combinations in the preconditions, denoted as PCP below, are represented by the Cartesian
product of the sets in { })(),...,(),( 21 nBTBTBTT = : )(...)()( 21 nBTBTBTPCP ×××= , and the number
nfffN ×××= ...21 of possible cases in the preconditions equals to the number N of elements of PCP. Each
fuzzy system l (see Fig. 2) infers a fuzzy assessment of a different characteristic Hl (l = 1, 2, . . . , L). Within each fuzzy system, the intersection (corresponding to the logical AND) between the membership functions associated with the linguistics values of each precondition is the min operation, and results in the numerical truth-value pn of the precondition. Thus, student’s current behavior is described by a vector P = [p1, p2, . . . , pn] , where p1, p2, . . . , pn are in the interval [0,1], representing degrees of fulfillment of preconditions. By means of a fuzzy relation, [44,45], as described below, P is translated into fuzzy assessments by exploiting teacher’s subjective judgments (denoted by the symbol Rl in the relation right below) with respect to a characteristic Hl
ll HRP =o ,
where Hl is an m-dimensional vector Hl = [h l1, hl2, . . . , llmh ] with hl1, hl2, . . . ,
llmh in [0, 1] representing the fuzzy
assessment of student’s characteristic Hl, i.e. an assessment with membership degrees hl1, hl2, . . . , llmh on each
linguistic value (Hl1, Hl2, . . . , llmH ) of the linguistic variable for the characteristic Hl; Rl is a lmn× weight
matrix representing teachers’ estimations of the degree of association between precondition P and the linguistic values of student’s characteristic Hl; the symbol o denotes the max–min composition operator. Defuzzification Stage This stage represents teacher’s final decision in classifying a student in one of the predefined linguistic values Hl1,
Hl2, . . . , llmH of the characteristic Hl. This process is performed by weighting the fuzzy assessment. Depending on
the number of linguistic values ml of each characteristic Hl, we use an appropriate defuzzifier from the ensemble, i.e. implementing a different defuzzification procedure that ‘‘imitates’’ a teacher’s subjective decisions. Teacher’s decisions may be clear-cut or marginal. Neural-network Based Implementation of the Fuzzy Model Fuzzification
Depending on the linguistic variable Bi and the linguistic value iifii VVV ,...,, 21 , we subjectively define different
membership functions, which assign to each element xi of the universe of discourse Ui (1, . . . , n) a degree of
membership )( iif xyi
to the linguistic value iifV of iB . In this way they contribute to the semantic rule that
associates each linguistic value iifV of iB with its meaning [Zadeh, L.A., 1972]. In general, the form of a
membership function depends on experts opinions [Zadeh, L.A., 1965]. In our case, we have adopted an approach that simplifies the implementation by approximating the membership functions using a library of regular shapes and implementing the fuzzifier stage as a group of fixed weight neural networks that calculate such regular shapes. Since membership functions are subjective and generally

1849
context-dependent, [63], a set M = {m1, m2, . . . , mn} of parameters that adjust the membership functions [53] is defined to allow a range of adaptations to teacher’s subjective judgments. Thus, for each one of the linguistic values
of the set { })(),...,(),( 21 nBTBTBTT = , the fuzzifier stage calculates the output Y of numeric values in [0, 1]
based on the input vectors { }ni xxxxX ,...,,...,, 21= , and M = {m1, m2, . . . , mn}
{ } { }{ }
=),(),...,,(),,(
,...,),(),...,,(),,(,),(),...,,(),,(
21
2222222222111111121111 21
nnnfnnnnnn
ff
mxymxymxy
mxymxymxymxymxymxyY
n
Thus, in our implementation, shown in Fig. 2, we have used sigmoid functions (α ) as membership
functions for the extreme linguistic values if
VV ,...,1 , and the pseudo-trapezoidal function (composed of two
sigmoid functions) for the intermediate values, 1
,...,2 −ifVV ; the adjusting parameter mi is the expected mean value
of a measured value xi, as estimated by the teacher of the specific teaching subject.
α
α
α
α
FIG. 2: THE IMPLEMENTATION OF A FUZZIFIER
Each fuzzifier i (i = 1, 2, . . . , n) of Fig. 1 is implemented with a network of the type shown in Fig. 2. The network of Fig. 2 is used to calculate the membership grades of the linguistic values fi, when xi = x and mi = m. The left and the right extreme fuzzy sets are given by
;0,))(exp(1
1),( 1
111 <
+−+= g
cg
wmwxw
mxy
;0,))(exp(1
1),( >
+−+== gi
cigif w
wxwmxy
where i = 2(f – 1). An intermediate set j is given by
,))(exp(1
1
))(exp(1
1),(
'' mwxwmwxwmxy
cigicigij +−+
−+−+
=
where j = 2, . . . , f - 1, wgi > 0, wgi' > 0 (i = 2(j - 1) ; i' = i + 1).
In the above relations, x indicates the current measurement of the observed response; wci and wgi, are defined in advance according to human teachers opinions; wci . m (i = 1, . . . , 2(f - 1)), is the central position of the sigmoid function; wgi, (i = 1, . . . , 2(f - 1)) is the gradient of the sigmoid function.

1850
Inference Stage
The preconditions P = [p1, p2, . . . , pn] are produced by a single layer of n, nfffn ×××= ...21 , nodes. The
network realizes the intersection by performing the min operation on the membership functions ending at each node. Thus, each node is activated to the degree of the numerical truth value pn of the precondition in [0, 1].
Each fuzzy system l (see Fig. 1) contains a precondition layer and realizes a fuzzy relation
ll HRP =o which is implemented by a two layer network with n, nfffn ×××= ...21 , input nodes and ml
output nodes. The output nodes perform the max-min composition and the synaptic weights r il (i = 1, . . . , n; l = 1, . . . ; ml] are the elements of the Rl matrix. Defuzzification We have used a neural network-based approach, which allows the system to adapt the defuzzification to individual teacher’s opinion by training. A three layer neural network with ml input and ml output nodes and a hidden layer was trained with a modified back propagation algorithm that uses variable step size, called BPVS [Magoulas, G.D., Vrahatis, M.N., Androulakis, G.S., 1997]. Training the network results in encoding teachers’ unstructured knowledge, and during operation the network acts as a ‘‘generalizer’’ that defuzzifies in a way that imitates teachers’ decision procedure. The Proposed Neuro-Fuzzy Learning System for Students Automatic definition of a model starting from of numerical data can be done efficiently through methodologies in the area of Soft-Computing, a new computing paradigm which synergically integrates different information processing methods, such as neural networks, fuzzy systems and evolutionary programming, in order to deal with uncertainty, typical of real-world domains, while preserving characteristics of processing and robustness. Especially, considerable work has been done to integrate the learning capabilities of neural network with explicit knowledge representation given by fuzzy systems, resulting in the neuro-fuzzy modeling approach [Arons, A.B., 1990].
As it is represented in Fig. 3 in this model, students are considered to choose the best curriculum for themselves regarding to the profile of each course and their requirements. The neural network is used to obtain student’s curriculum within a distance learning educational system. In the former system a fuzzy based management (diagnosis) system is applied for the qualitative items in order to reach the optimal learning path for a student in such a system. The first layer, which is considered as the input layer, is the number of students who want to select the courses for a semester. The second layer is the number of courses that are offered in a semester. Those courses have instructors for varied levels of students, Strong; Moderate; Weak, i.e. students can choose a course with one of those instructors regarding to their capability as the following (if …. then) fuzzy rules that are being constructed in the management system:
• If a student chooses instructor with “strong” title then the weight is 3, • If a student chooses instructor with “moderate” title then the weight is 2, • If a student chooses instructor with “weak” title then the weight is 1,
And also students choose their courses regarding to the criteria such as capabilities, attitudes, knowledge level, motivation and learning style by their preferences according to TABLE 1:
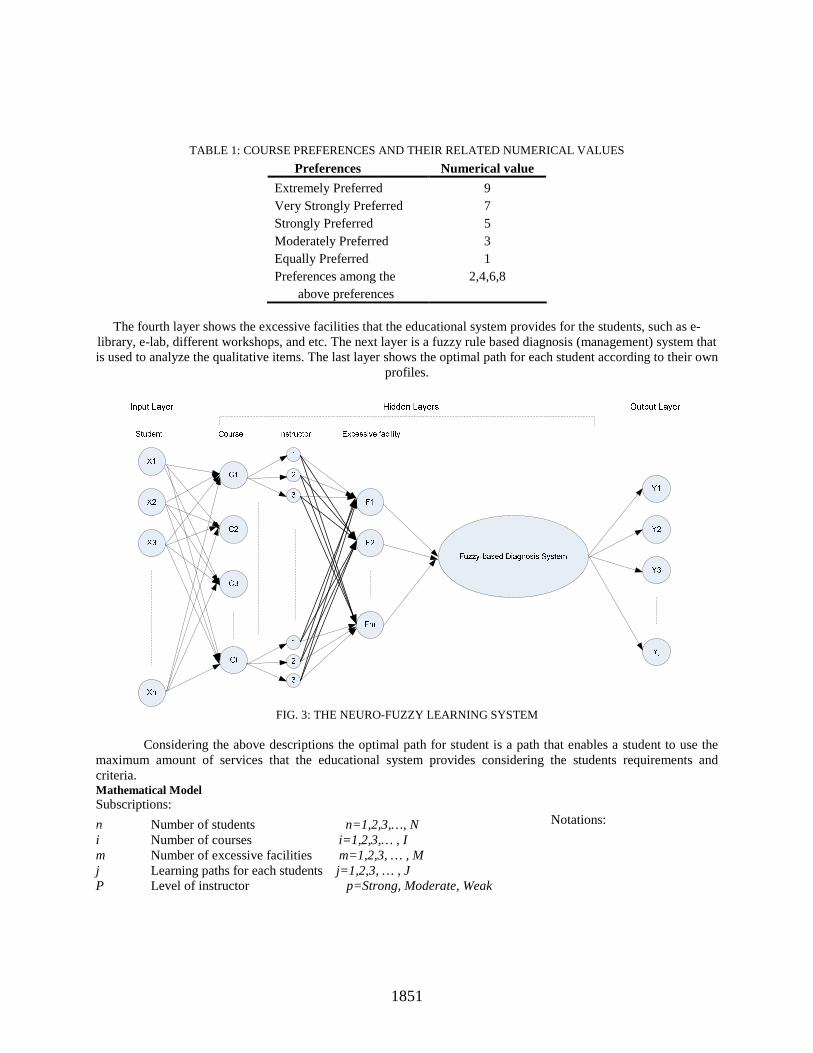
1851
TABLE 1: COURSE PREFERENCES AND THEIR RELATED NUMERICAL VALUES
Preferences Numerical value
Extremely Preferred 9 Very Strongly Preferred 7 Strongly Preferred 5 Moderately Preferred 3 Equally Preferred 1 Preferences among the 2,4,6,8 above preferences
The fourth layer shows the excessive facilities that the educational system provides for the students, such as e-
library, e-lab, different workshops, and etc. The next layer is a fuzzy rule based diagnosis (management) system that is used to analyze the qualitative items. The last layer shows the optimal path for each student according to their own
profiles.
FIG. 3: THE NEURO-FUZZY LEARNING SYSTEM
Considering the above descriptions the optimal path for student is a path that enables a student to use the
maximum amount of services that the educational system provides considering the students requirements and criteria. Mathematical Model Subscriptions:
Notations:
n i m j P
Number of students n=1,2,3,…, N Number of courses i=1,2,3,… , I Number of excessive facilities m=1,2,3, … , M Learning paths for each students j=1,2,3, … , J Level of instructor p=Strong, Moderate, Weak

1852
Xn Ci
Fm
Yj
Wi
Wp
The nth student The ith course The mth facility The jth path The weight for course i th
The weight for instructor pth
Decision variables:
=0
1
niψ
=0
1
nmϕ
∑∑ ∑ ∑+i p n m
nmpnii WWMax )( ϕψ (1)
S.t: AXXX n =+++ ...21 (2)
UCL i ≤≤ (3)
MFm ≤≤0 (4)
Equation (1) is the objective function which presents the maximum service of the educational system that is
the optimal learning path. Equation (2) specifies the number of students who try the course selection. Equation (3) identifies the lower and upper bound for course numbers. Equation (4) presents the number of facilities that the educational system prepare for being used by the students.
The noticeable parameters are Wi and Wp that are the weights of the criteria in the course selection. The Wp is based on the fuzzy rule-base engine that explained before but Wi s will be identified by a multi criteria decision making approach. In this paper the analytical hierarchy procedure (AHP) is applied to find the weights. Determining Weights by AHP Approach The analytical hierarchy procedure (AHP) is proposed by Saaty (1980). AHP was originally applied to uncertain decision problems with multiple criteria, and has been widely used in solving problems of ranking, selection, evaluation, optimization, and prediction decisions [Golden, Wasil, & Levy, 1989]. Harker and Vargas (1987) stated that ‘‘AHP is a comprehensive framework designed to cope with the intuitive, rational, and the irrational when we make multi-objective, multi-criteria, and multi-factor decisions with and without certainty for any number of alternatives.’’
The AHP method is expressed by a unidirectional hierarchical relationship among decision levels. The top element of the hierarchy is the overall goal for the decision model. The hierarchy decomposes to a more specific criterion a level of manageable decision criteria is met [Meade & Presley, 2002]. Under each criterion, sub-criteria elements relative to the criterion can be constructed. The AHP separates complex decision problems into elements within a simplified hierarchical system [Shee, D. Y., Tzeng, G. H., & Tang, T. I., 2003].
If student n choose the course i
O.W
If student n use facility m
O.W

1853
The purpose of the AHP enquiry in this paper is to construct a hierarchical evaluation system based on the independent factors as capabilities, attitudes, knowledge level, motivation and learning style, the AHP method could gain factor weights and criteria, and then obtain the final effectiveness of each course.
The AHP usually consists of three stages of problem solving: decomposition, comparative judgments, and synthesis of priority. The decomposition stage aims at the construction of a hierarchical network to represent a decision problem, with the top level representing overall objectives and the lower levels representing criteria, sub-criteria, and alternatives. With comparative judgments, users are requested to set up a comparison matrix at each hierarchy by comparing pairs of criteria or sub-criteria. A scale of values ranging from 1 (Equally Preferred) to 9 (Extremely Preferred) see Table 1, is used to express the users preference. Finally, in the synthesis of priority stage, each comparison matrix is then solved by an eigenvector method for determining the criteria importance and alternative performance. The following list provides a brief summary of all processes involved in AHP applications:
1. Specify a concept hierarchy of interrelated decision criteria to form the decision hierarchy. 2. For each hierarchy, collect input data by performing a pair wise comparison of the decision criteria. 3. Estimate the relative weightings of decision criteria by using an eigenvector method. 4. Aggregate the relative weights up the hierarchy to obtain a composite weight which represents the relative
importance of each alternative according to the decision-maker’s assessment. One major advantage of AHP is that it is applicable to the problem of group decision-making. In group
decision setting, each participant is required to set up the preference of each alternative by following the AHP method and all the views of the participants are used to obtain an average weighting of each alternative.
In this paper regarding to the stated criteria, the following hierarchy is proposed. The aim is to obtain the weight for each course to be used in the objective function of optimal path. The hierarchy is presented in Fig. 4.
FIG. 4: THE HIERARCHY OF THE PROPOSED MODEL
According to Fig.4 the following matrix is used to calculate the weights ratio each of the criteria i.e. courses are evaluated ratio capabilities, attitudes, knowledge level, motivation and learning style based on the preference numbers (Abc ) of the courses considering Table 1:

1854
Matrix 1
Capability Course 1 Course 2 Course i Course 1 1 A12 A1i Course 2 1/A12 1 A2i
. . . .
. . . . Course i A1i=1/Ai1 A2i=1/Ai2 1
The same matrix is used for other criteria (attitudes, knowledge level, motivation and learning style) we call this dual comparison of courses. After calculating the above matrixes, a matrix that indicates the weights (Wbc ) of the courses for the mentioned criteria is formed as follows: Matrix 2
Capability Attitude Knowledge level Motivation Learning style Course 1 W11 W12 W13 W14 W15 Course 2 W21 W22 W23 W24 W25
. . . . . .
. . . . . . Course i Wi1 Wi2 Wi3 Wi4 Wi5
After that the criteria dual comparison matrix is configured as follows:
Matrix 3
Capability Attitude Knowledge level Motivation Learning style Capability 1 A12 A13 A14 A15 Attitude 1/A12 1 A23 A24 A25
Knowledge level 1/A13 1/A23 1 A34 A35
Motivation 1/A14 1/A24 1/A34 1 A45 Learning style 1/A15 1/A25 1/A35 1/A45 1
Now we reached the weight of each criterion by the above matrix. Therefore, the weight for each course
considering the criteria is achieved as follows:
LiMiKiAiCi
LMKAC
LMKAC
WWWWWWWWWWicourseforweightTotal
WWWWWWWWWWcourseforweightTotal
WWWWWWWWWWcourseforweightTotal
×+×+×+×+×=
×+×+×+×+×=×+×+×+×+×=
54321
2524232221
1514131211
.
.
2
1
Where WC= capability’s weight, WA= attitude’s weight, WK= knowledge level’s weight, WM= motivation’s weight, WL= learning style’s weight, that are obtained by matrix 3. In this way the weights are calculated to be used in equation (1) and the optimal path for students will be identified after solving the simple mathematical model. Conclusions In this paper a neuro-fuzzy model of the diagnostic process was proposed for inferring student characteristics and for identifying the optimal path of students in applying distance learning courses based on their profile. A main advantage of the new approach is that the neuro-fuzzy model allows creating an interpretable knowledge

1855
representation, which can be developed on the basis of rules when reasoning is well defined, as well as it can be trained when the reasoning strategy is purely intuitive and ill-defined. In addition the model can be easily tailored to a teacher’s personal view. This approach can be used to implement an open student model, which will be interactively adjusted by the teacher.
AHP approach is applied to find the optimal path in the proposed virtual learning environment based on the qualitative parameters regarding to the students characteristics. Our current work targets the extraction of knowledge from existing student profiles to drive model’s adaptation during operation with the aim to adapt the feedback and pedagogical strategy to students’ learning style. Future works will be about the implementation of the model and the experimental results which will represent the pros and cons of our model.
References [1] Akhras, F.N., Self, J.A., Beyond intelligent tutoring systems: situations, interaction, process and
affordances, Instructional Science 30 (2002) 1–30. [2] Arons, A.B., A Guide to Introductory Physics Teaching, John Wiley and Sons, Washington, 1990. [3] Beck, J., Stern, M., Woolf, B.P., Using the student model to control problem difficulty, in: Proceedings of
the Sixth International Conference on User Modeling, 1997, pp. 277–289, Available on-line from <http://www.cs.umass.edu/~beck/publications.html> accessed at 31/11/ 2000.
[4] Brusilovski, P., Student model centered architecture for intelligent learning environments, in: Proceedings of Fourth International Conference on User Modeling, 15–19 August, Hyannis, MA, USA, User Modeling Inc., 1994, pp. 31–36.
[5] Cellura, M., Beccali, G., Ecobilancio del laterizio [Eco-balance in the brick industry], Palermo University; (1999) Chen, Q., Norcio, A.F., Wang, J., Neural network based stereotyping for user profiles, Neural Computing and Applications 9 (2000) 259–265.
[6] Conati, C., Gertner, A., Vanlehn, K., Using Bayesian networks to manage uncertainty in student modeling, User Modeling and User-Adapted Interaction 12 (2002) 371–417.
[7] Derry, S.J., Potts, M.K., How tutors model students: a study of personal constructs in adaptive tutoring, American Educational Research Journal 35 (1) (1998) 65–99.
[8] Frankl P., F. Rubik, The use of LCA in business decision making processes, Final Report to the European Commissions DG XII, Springer Ferlag; (1999).
[9] Golden, B. L., Wasil, E. A., & Levy, D. E. Applications of the analytic hierarchy process: A categorized, annotated bibliography. In B. L. Golden, E. A. Wasil, & P. T. Harker (Eds.), The analytic hierarchy process. Berlin: Springer-Verlag. (1989).
[10] Greer, J.E., McCalla, G.I. (Eds.), Proceedings of NATO Advanced Research Workshop on Student Modeling: The Key to Individualized Knowledge-Based Instruction, Ste. Adele, Que., Canada, May 4–8, 1991, NATO ASI Series, F125, Springer-Verlag, Berlin, 1994.
[11] Harker, P., & Vargas, L. The theory of ratio scale estimation: Saaty’s analytic hierarchy process. Management Science, 33(11), 1383–1403. (1987).
[12] Harp, S.A., Samad, T., Villano, M., Modeling student knowledge with self-organizing feature maps, IEEE Transactions on Systems Man and Cybernetics 25 (5) (1995) 727–737.
[13] Hawkes, L.W., Derry, S.J., Rundensteiner, E.A., Individualized tutoring using an intelligent fuzzy temporal relational database, International Journal of Man–Machines Studies 33 (1990) 409–429.
[14] Hawkes, L.W., Derry, S.J., Advances in local student modeling using informal fuzzy reasoning, International Journal of Human–Computer Studies 45 (1996) 697–722.
[15] Herzog, C., Fuzzy techniques for understanding student solutions in intelligent tutoring systems, Papers for the Seventh Meeting of GI Section 1.1.5/7.0.1, Intelligent Tutoring Systems, Research Institute for Application- Oriented Knowledge Processing (FAW), Germany, 1994
Contact authors for complete list of references

1856
Online Services Delivered by NTO Portals: A Cross-Country Examination
Marco Papa, [email protected] University of Bari, Italy
Marina Avgeri, [email protected] Banca Monte dei Paschi di Siena, Italy
Abstract
This study compares the online services currently delivered by the Official National Tourism Organisations (NTO) portals of the 25 EU states, to assess their capability in evolving into powerful marketing communication tools. A conceptual framework that identifies 129 online service quality attributes is developed based on the 2QCV3Q model (Mich and Franch, 2002) and on four different perspectives: marketing, customer, technical and information for the destination (So and Morrison, 2004). The 25 portals are compared by means of content analysis. Our rankings provide a first time assessment of the NTO online offerings and indicate high variability in their performance. Surprisingly, Greece and Italy, two of the most popular tourism destinations, underperformed with respect to all of the four perspectives examined. We provide out-of-sample evidence that affluence levels explain the variation in the observed scores, while e-readiness, popularity of tourism destination and cultural richness are not statistically significant. Introduction: the Role of National Tourism Organisations’ Portals Among the Destination Management Organisations (DMO), prominent is the role of the National Tourism Organisations (NTO1) in marketing a destination at a national level. Prior to the Internet era, the DMOs, have been rather passive and limited to the distribution of printed tourist promotional material on demand (So and Morrison, 2004; King, 2002). However, the adoption and the diffusion of e-commerce applications, has provoked unprecedented changes (Wöber, 2003). All the EU countries, have invested in the development of websites with different levels of interactivity (Morgan et al., 2002). Essentially, these portals undertake the management of “content information” relating to a tourist destination, arriving from a wide variety of different sources (Turban et al., 2004: 322). By assuming the role of on line brokers of information providers, they become responsible for matching cross culturally demand of individual tourists with the destinations’ tourism service supply (Scharl et al., 2004). Different studies indicate that NTO portals should not be perceived exclusively as information seeking facilitators (Morgan et al., 2002). Instead, they should aim to evolve into powerful interactive marketing communication tools (Griff and Palmer, 19992; Cano and Prentice, 1998) that have the potential to enhance the overall attractiveness of a travel destination and to evoke an optimal experience for their on line users, offering to different customer groups’ superior value (Nysveen et al., 2003). However, while the trend of internet being the first point of embarkation for prospect tourists is gaining momentum (Buhalis and Licata 2002) and the presence of NTOs through internet is becoming better established (Feng et al., 2002), there is still a paucity of research regarding the online offerings and the internet marketing strategies undertaken from them.
Under the recognition that it is important to examine NTOs in an exploratory way, where the dimensions of online quality from a customer perspective will serve as a framework, this study compares the official European NTO portals online offerings. The aim is to examine what information and services of value added each of the 25 EU NTO portals is offering and what do these offerings reveal regarding the underlying internet marketing strategies currently adopted. To this end, as first objective, there were identified the online services that may facilitate the tourist search, evaluation of information and purchase of services via the NTO sites, based on a deep inspection of the e-SQ literature (paras 2-3). Secondly, these portals were compared by means of content analysis (paras 4-6), in order to document what information and online services currently are provided, allowing to make inferences as to up to which extent they are using their potential as customer-led marketing tools.

1857
Extant Approaches in Measuring E-service Quality The way e-SQ is conceptualized is still at an exploratory stage. Researchers not only have tried to combine known dimensions that influence product quality and SQ, but also to discover some unique factors, relevant to the virtual operations only. The e-SQ attributes seem to depend on the level of web-based technology readiness of the different users (Zhu et al., 2002) and do not to demonstrate a linear relationship, since “more” of an attribute is not necessarily perceived as better (O’Neill et al., 2001). In order to define e-SQ, some authors take into account both the pre and post web sites services aspects (Santos, 2003; Liu and Arnett, 2000), while others consider only the interaction with the site itself (Zeithaml et al., 2002). Additionally, in contrast to the traditional service offerings, online users tend to regard e-SQ more as an universal concept, deriving from their overall online experience, rather than from sub-processes (Van Riel et al., 2001).3 The focus of each individual research (e.g. consumer buying procedure), as well as the types of web sites used (e.g. portals, retailing sites, etc.); determine how the definition of e-SQ may be conceptualised (Kim et al., 2006). Given that the NTO portals’ core activity is to help customers at different stages in the information search process, the definition of website quality used in this study is based on the concept of value added services as provided by Nysveen, (2003) and Lexhagen (2005): “Services giving access to various forms of information about the tourism products offered on a website”, disregarding approaches tailored for e-commerce shopping (Zeithaml et al., 2002), or based on an ex-ante definition of e-services (Santos, 2003: 235). Not only defining, but also measuring the multidimensional construct of e-SQ continues to generate increased academic debate. Many different scales have been proposed during the last eight years based on different classifications of quality dimensions and attributes (O’Neill et al., 2001; Madu and Madu, 2002; Zhu et al., 2002; Yoo and Donthu 2001; Santos, 2003; Zeithmal et al., 2002; Parasuraman et al. 2005, etc.), either emphasizing the human and soft elements of service quality or the technical dimensions of on line efficiency, or both (Sigala, 2004). An extended framework, which incorporates many of the e-SQ dimensions proposed by previous approaches, has been developed by Madu and Madu (2002). Their model included some of the product quality dimensions according to Garvin (1984), as well as the 5 quality dimensions of the SERVQUAL scale (Parasuraman et al., 1988), while it identified some unique, new dimensions, appropriate only for virtual contexts. Even if the proposed dimensions have never been tested empirically, it is interesting the evolutionary approach it adopts, encompassing both product and services features. Barnes and Vidgen (2000)4 based on 54 students’ evaluations of British online bookstores, have extended the SERVQUAL scale of Parasuraman et al., (1988) to an online context, encompassing softer service related attributes by introducing 24 different measurement items under their index named WebQual. They focused on the following aspects: reliability, competence, responsiveness, access, credibility, communication and understanding. Later on, Loiacono et al., (2002)5 proposed the WebQualTM scale which emphasised again the technical aspects of the website in the evaluation of its online quality, developing 12 web design features. This approach has been criticised by Zeithaml et al., 2002 and Parasuram et al., 2005, for having limited capabilities in capturing important quality dimensions (e.g. “fulfilment”, customer service), since these scales have been produced by using convenience samples of students rather than actual online purchasers. A further drawback derives from the fact that the participating students have rated researcher specified categories that had not emerged through a qualitative study. Parasuramam et al., (2005) recently have developed the well known E-S-QUAL model. Under the latter, e-service quality dimensions have been divided into 7 categories: efficiency, fulfilment, privacy, service recovery dimension, compensation, contact. A recent application of the E-S-QUAL model has been undertaken by Kim et al., (2006) which evaluated the performance of 111 US apparel retail websites in providing on line service attributes that facilitate efficient and effective shopping, purchasing and delivery of garments. Such on line service attributes were examined by means of content analysis, by considering the E-S-QUAL categories, accommodated to include other dimensions: personalisation, information and graphic style, regarded relevant for the specific retail context. Overall, it was found that the e-SQ level of the sample companies was unsatisfactory.

1858
Empirical Literature on DMO Previous studies have investigated tourism websites from three different perspectives: a) from a business, b) from a customer perspective and c) a combination of the previous two. The former implies that the on line quality is evaluated as superior according to where the business is in the transformation process: if a site is only informative or whether it offers more advanced features such as on line booking services, etc. (Hart et al., 20006; O’ Connor, 19997; Doolin et al., 2002). Representatives of this strand: Doolin et al., (2002), extended and applied an internet commerce adoption metric (eMICA) developed by Burgess and Cooper (2000)8 for bench marking the relative maturity of 26 New Zealand’s Regional Tourism Organisations (RTO) websites and concluded that the majority of them displayed moderate to high levels of interactivity. The customer perspective encompasses two different approaches: the former, assesses the websites according to their level of customer support during the information searching process, thus following a “consumer behavior theory”; whereas the latter, according to their level of design features superiority. Finally, under the last approach the business and customer perspectives are combined together, within different contingent evaluation frameworks, ranging from technical approaches, such as the Balanced Score Card (Morrison et al., 1999; Ismail et al., 2002; Feng et al., 2002; So and Morrison, 2004), to more theoretical ones, such as the Marketspace model (Blum and Fallon, 2002), which emphasized the marketing mix and the customer relationships. Moreover, so far, research in assessing websites effectiveness in the tourism sector, has been mainly focused on either a) opinions of experts of tourist services providers (Chung and Law, 2003; Hudson and Lang, 2002; Jung and Butler, 2000) or b) end users (tourists) evaluations (e.g. Jeong et al., 2003, Tierney 20009) or c) by applying quantitative measures (e.g. Scharl et al., 2004, Wöber, 2003). Regardless of whether the end users or the tourist experts have been focused upon, both directions’ research findings seem to converge in one common admittance: the importance of the online content in terms of richness of information, features and services (Huizingh, 2000; Scharl et al., 2004; Cai et al., 2004b) and content quality (Aladwani and Pavia, 2002) as critical success factor of tourism websites. In particular, as far as destination portals are concerned, their content has been broadly recognised (Doolin et al., 2002, Cano and Prentice, 1998) as being responsible for creating the perceived image of the destination. Finally, there is also a recent research stream (Skadberg et al., 2005; Chen and Wells, 1999, Hoffman and Novak, 199610) who supports that since tourism is mainly experiential, the overall web site effectiveness depends on the flow experience of the online visitors in tourism destination websites. It can be argued that even though different studies did include some DMO websites in their sample, very few have been focusing on the evaluation of them per se (Cano and Prentice 1998; Bauer and Reid, 200011; Doolin et al., 2002; Mich and Franch, 2002; Morrison et al., 2002, Ismail et al., 2002; So and Morrison, 2004). Moreover, only a few comparative studies have been carried out (Mich and Franch, 2002, 2003; Feng et al., 2002, Ismail et al., 2002; So and Morrison, 2004) and none of them has covered the enlarged EU as a whole. Namely, Cano and Prentice (1998) examined by means of content analysis, through a questionnaire survey addressed to 14 area tourist boards and 32 local authorities, 983 different Scottish websites and concluded that a variegated image of Scotland is promoted world wide, where the absence of a common communicative style and a distinctive design style contributed to the underselling of the whole Scotland as a tourist destination product. Recently, Feng et al., 2002, Ismail et al., 2002 and So and Morrison, 2004, in three papers, by means of content analysis, compared the performance of DMO websites of different countries, based on the Balanced Scorecard Approach, developed by Kaplan and Norton (1996)12. These studies acknowledge tourism website performance in a holistic way, encompassing four different perspectives. The first study compared 36 Chinese DMO websites to 30 US DMO websites and concluded that the latter were superior in terms of marketing strategies and destination information provided. The second study examined website’s information content and photos from a cultural point of view, while the third one compared 15 East Asian NTO sites, concluding that none of them had been particular effective as an online marketing tool. Finally, Mich and Franch, 2002 have developed a meta-model 2QCV3Q, to compare the regional tourist boards (RTB) websites in the area of Alps. In their approach, quality of web site has been identified as the ability to satisfy the needs and objectives of all the online users involved. Their model by asking a set of questions identifies
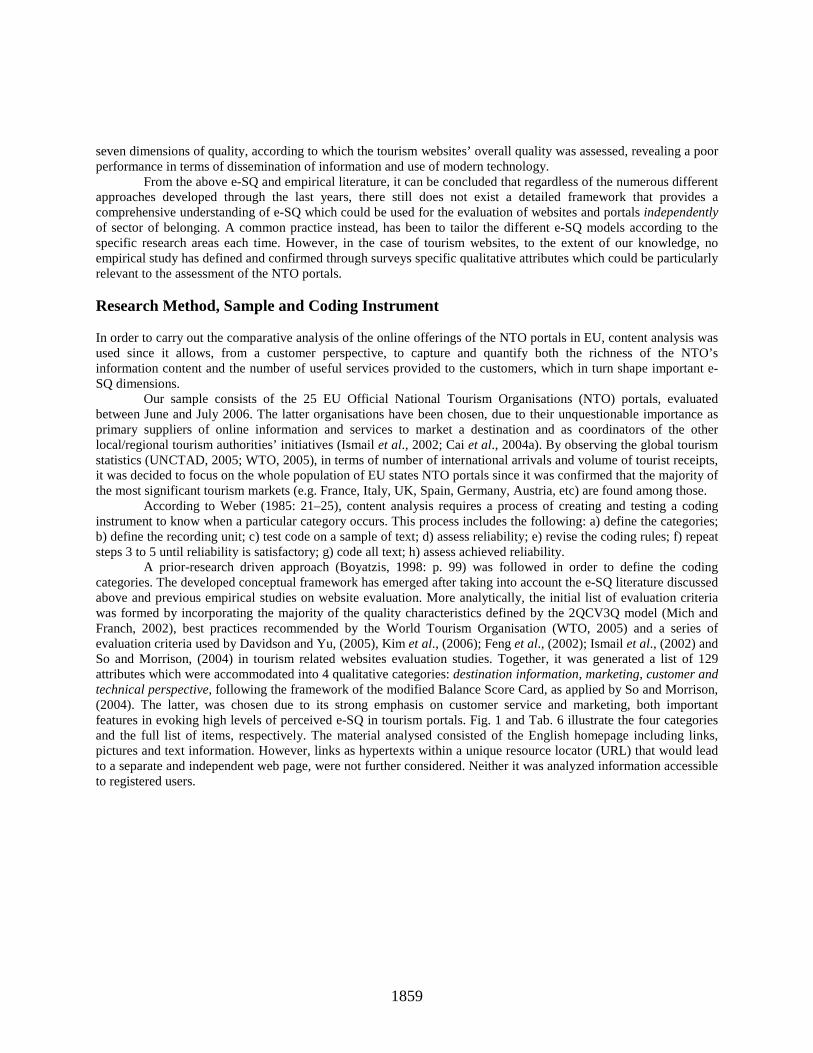
1859
seven dimensions of quality, according to which the tourism websites’ overall quality was assessed, revealing a poor performance in terms of dissemination of information and use of modern technology. From the above e-SQ and empirical literature, it can be concluded that regardless of the numerous different approaches developed through the last years, there still does not exist a detailed framework that provides a comprehensive understanding of e-SQ which could be used for the evaluation of websites and portals independently of sector of belonging. A common practice instead, has been to tailor the different e-SQ models according to the specific research areas each time. However, in the case of tourism websites, to the extent of our knowledge, no empirical study has defined and confirmed through surveys specific qualitative attributes which could be particularly relevant to the assessment of the NTO portals. Research Method, Sample and Coding Instrument In order to carry out the comparative analysis of the online offerings of the NTO portals in EU, content analysis was used since it allows, from a customer perspective, to capture and quantify both the richness of the NTO’s information content and the number of useful services provided to the customers, which in turn shape important e-SQ dimensions.
Our sample consists of the 25 EU Official National Tourism Organisations (NTO) portals, evaluated between June and July 2006. The latter organisations have been chosen, due to their unquestionable importance as primary suppliers of online information and services to market a destination and as coordinators of the other local/regional tourism authorities’ initiatives (Ismail et al., 2002; Cai et al., 2004a). By observing the global tourism statistics (UNCTAD, 2005; WTO, 2005), in terms of number of international arrivals and volume of tourist receipts, it was decided to focus on the whole population of EU states NTO portals since it was confirmed that the majority of the most significant tourism markets (e.g. France, Italy, UK, Spain, Germany, Austria, etc) are found among those.
According to Weber (1985: 21–25), content analysis requires a process of creating and testing a coding instrument to know when a particular category occurs. This process includes the following: a) define the categories; b) define the recording unit; c) test code on a sample of text; d) assess reliability; e) revise the coding rules; f) repeat steps 3 to 5 until reliability is satisfactory; g) code all text; h) assess achieved reliability. A prior-research driven approach (Boyatzis, 1998: p. 99) was followed in order to define the coding categories. The developed conceptual framework has emerged after taking into account the e-SQ literature discussed above and previous empirical studies on website evaluation. More analytically, the initial list of evaluation criteria was formed by incorporating the majority of the quality characteristics defined by the 2QCV3Q model (Mich and Franch, 2002), best practices recommended by the World Tourism Organisation (WTO, 2005) and a series of evaluation criteria used by Davidson and Yu, (2005), Kim et al., (2006); Feng et al., (2002); Ismail et al., (2002) and So and Morrison, (2004) in tourism related websites evaluation studies. Together, it was generated a list of 129 attributes which were accommodated into 4 qualitative categories: destination information, marketing, customer and technical perspective, following the framework of the modified Balance Score Card, as applied by So and Morrison, (2004). The latter, was chosen due to its strong emphasis on customer service and marketing, both important features in evoking high levels of perceived e-SQ in tourism portals. Fig. 1 and Tab. 6 illustrate the four categories and the full list of items, respectively. The material analysed consisted of the English homepage including links, pictures and text information. However, links as hypertexts within a unique resource locator (URL) that would lead to a separate and independent web page, were not further considered. Neither it was analyzed information accessible to registered users.

1860
TABLE 6: LIST OF PERFORMANCE ITEMS Frequency in percentage Frequency in percentage
Marketing perspective (43) 51 Management of information 61
Segmentation 51 Option to search for lodging by type (e.g. stars) 72No hotel lodging alternatives 88 Directions of how to reach destinations 36Spa 92 List of "highlights" (e.g. main attractions) 56Fitness 60 Option to request material on line 56Dining per categories 48 Option to download on line 84Nightlife 44 Printing options (e.g. full page, some areas etc.) 80Kids corner 36 Audio 28Youth section 32 Route planner 40Business tourism 84 Interactive maps 92City break 52 Information updated 52Gay/lesbian 32 FAQ section 40Religious tours 32 Advanced search engine 100
Wedding organisations 20 Ease of contact 61Educational courses 36 NTO address 80Thematic forms of tourism 52 NTO operating hours 28
Tangibility of destination 58 Web-master e-mail 84Photos different landscapes, all regions 88 NTO telephone number 88Maps 100 NTO fax number 76Photo gallery 76 Call centre 12
Virtual tours 40 Navigability 73Video clips 52 Graphic design changes for each different section 76Web cams 12 Site map 68E-cards 40 Advanced search engine 40
Branding 59 Link avoiding homepage 84Environment statements 20 Link to homepage from all pages 80Quality certification 28 Principal elements visible before entire loading 84Logo in homepage 100 Web site visible without images loaded 80
Logo in other webpages 84 Accessibility 28Information behind public entity 96 Information for disabled accessability in hotels 68URL among the first 5 findings 76 Portal version in "bigger fonts" 8Site popularity 60 Seperate specialised accessibility section 8Data on use 4
Relationship marketing 34 Destination information (35) 67Customised research 32 Culture 76Feedback forms 44 Artistic heritage 100Sharing of imformation to counterpaters 52 Local culinary traditions 100News letters 72 Local handicraft/trades 64Send comments 8 Local famous people 68View reviews 12 UNESCO listed sites 76Travel plans favourites 36 Local events 84Memory settings 12 Food recipes 40
Marketing research, customer database 55 General information 66Links to lower level toursit organisations 84 Popular sports 96Tracking country of origin 52 Dining facilities 56Portal versions according to country of choice 44 Natural assets 92Registration within the site 76 Political information 64Online surveys 24 Religion 68On line competitions 48 Economic information 40
Customer perspective (45) 47Demographic information 76
Privacy and trust 24 Geographical information 96Identification of information source 24 Highlights for the next year 8Un registration option 24 Practical information 65Statements of personal data privacy 36 Public transportation 100Terms of use 44 Car rental 72Security certification 8 National public holidays 88Last update date 8 Opening/business hours 76
Service integration 12 Pricing and payment methods 80Accomodation booking on line 32 Currency information 76Holiday package on line 8 Discounts 40Air plane ticket on line 4 Custom/taxes information 68Other facilities on line 12 Immigration/work permit 24Track state of orders 8 Entry requirements 84
Real estate information 4Virtual community 8 Traffic & parking rules 68
Service aggregation 47 Regulations for pets 52Native language expression 28 Taxis 64Press office 60 Voltage 72List of articles, books, guides 24 Embassies and consulates 36Weather forecast 60 International phone acess code 76Exchange convertor 64 Climate 84
Emergency numbers 68

1861
FIG. 1: BSC FRAMEWORK
Reliability Assessment, Scoring System and Determinants of NTOs’ Performance In performing content analysis it is essential to refine the coding instrument until a satisfactory level of reliability is achieved (Krippendorff, 1980). From the three types of reliability. a) stability over time; b) accuracy; c) inter-coder reliability; the last has been demonstrated through the assessment of the coefficient of agreement and the Krippendorff’s alpha coefficient. Two randomly chosen websites were analysed independently by the second author and 23 pairs of disagreement were found, out of a total number of 246 (123 criteria for each portal). This implied a coefficient of agreement of 0.90 per cent, well above the cut off value of 70 per cent recommended by the literature (Boyatzis,1998:156). Similarly, Krippendorff’s alpha, has been found 81.29 per cent, again above the suggested limit. The coding unit is represented by the single items. Contrary to web evaluation based on a Likert type scale (Davidson and Yu, 2005; Morrison et al., 1999), a binary code (Mich and Franch, 2002; Feng et al., 2002) was followed where a score of 1 was given if the item was available, and 0 if not. According to the coding instrument’s rules, multiple references of the same item were ignored. Following coding, the overall score (Score) for each of the three categories (j) was quantified as follows:
TOTS/SScorek
kj ∑= (1)
where: j = the perspective category, j = 1, 2, 3; k = the item subscript, k = 1, ….129; sk = the number of items found in each NTO portal (answered as “yes”); TOTS = the total maximum number of possible items for each perspective (i.e 45 for customer perspective). Based on this score, each portal, within each of the 3 perspectives (marketing, destination information and customer), was ranked in a descending order from 1 to 25, with means assigned to ties. Only, in the case of the technical perspective, each portal has been ranked within each of the 6 technical criteria used, six different times (Tab. 1).
Technical perspective
• Load time
• Broken links
• Link popularity
•Search engine saturation
• Browser compatibility
• HTML errors
Marketing perspective
• Relationship marketing
• Market Research
• Segmentation
• Branding
• Tangibility of destination
Customer perspectiveDestination info perspective
• Culture
• General information
• Practical information
• Services Integration
• Services aggregation
•Trust & privacy
• Management of info and services
• Ease of conduct
• Navigation
• Accessibility

1862
TABLE 1: TECHNICAL RANKINGS
NTO EU member state
HTML
errorsa
Compatibility
Problemsb
Link
Popularityc
Search Engine
Saturationd
Downloaded time
at 56Ke
Broken
Linksf
Sum of
RankingsNetherlands 0 1 0 1 12.105 18 230.900 4 0,2 3 8 3 30,0Poland 1 2 3 2 10.834 19 153.895 9 3,09 4 1 2 38,0Czech Republic 3 4 8 7 76.155 7 96.028 12 0,02 1 21 8 39,0Austria 1 2 14 12 101.019 3 145.404 10 19,37 13 17 6 46,0Cyprus 2 3 3 2 17.937 15 58.818 14 18 11 0 1 46,0Italy 6 7 12 10 56.231 8 2.492.975 2 17,76 10 26 11 48,0Malta 1 2 7 6 31.427 11 177.388 8 26,98 14 25 10 51,0France 2 3 4 3 86.426 6 58.169 15 14,73 6 72 19 52,0Finland 2 3 0 1 33.628 10 98.689 11 39,69 17 26 11 53,0UK 16 12 3 2 163.552 1 3.318.441 1 48,65 21 38 16 53,0Lithuania 0 1 0 1 6.262 22 30.201 18 0,06 2 27 12 56,0Denmark 11 10 6 5 154.463 2 186.448 6 74,12 23 26 11 57,0Slovenia 0 1 10 8 6.283 21 36.699 16 7,2 5 17 6 57,0Estonia 5 6 4 3 43.130 9 22.289 20 16,87 9 33 15 62,0Germany 0 1 16 14 90.997 5 77.148 13 35,39 16 31 14 63,0Slovakia 0 1 0 1 10.522 20 23.030 19 47,57 20 12 4 65,0Greece 2 3 3 2 3.453 23 819 24 14,76 7 22 9 68,0Portugal 4 5 5 4 12.205 17 230.330 5 45,84 19 67 18 68,0Spain 48 16 29 16 93.293 4 177.489 7 42,55 18 18 7 68,0Sweden 19 13 11 9 22.384 13 2.287 22 16,74 8 14 5 70,0Latvia 2 3 8 7 523 25 59 25 18,61 12 8 3 75,0Luxembourg 27 15 7 6 13.510 16 255.001 3 194,12 24 64 17 81,0Belgium 9 9 13 11 23.522 12 1.180 23 34,56 15 29 13 83,0Ireland 8 8 23 15 1.718 24 32.096 17 54,13 22 0 1 87,0Hungary 24 14 15 13 21.189 14 5.650 21 241,22 25 38 16 103,0 Notes: a) refers to the number of errors, as estimated by www.netmechanic.com; b) refers to any unsupported HTML tags and attributes that block viewing on specific NTOs’ browsers, as estimated by www.netmechanic.com; c) refers to the number of pages in each search engines index that contains a link to a portal’s domain, as estimated by www.marketleap.com; d) refers to the number of pages a given search engine has in its index for the NTO website domain, as estimated by www.netmechanic.com; e) refers to the download times (seconds), as estimated by www.watson.addy.com; f) refers to the total links, as estimated www.netmechanic.com. Kendall’s Coefficient of Concordance (W) was calculated to test the degree of association among the 4 different rankings as follows (Siegel and Castellan, 1988: 271):
121-
-
= 21=
2∑/)N(N
)RR(
W
N
ii
(2)
where: N = the number of portals to be ranked;iR = the average of the ranks assigned to the ith portal, R =
the average (or grand mean) of the ranks assigned to a portal across all the categories. Since the sample consisted of 25 EU NTO portals, this coefficient can be approximated by a chi-square distribution (X2) with 24 degrees of freedom. A univariate analysis was conducted to investigate the extent to which country context variables could explain differences in the NTOs’ performance. Namely, the following independent variables were considered: a) popularity of a tourism destination; b) level of affluence; c) e-readiness level; d) cultural richness. As no one of the empirical literature relates e-SQ to NTO portals and because there may be different competing explanations, the following null hypotheses have been stated:

1863
H 1. Tourism popularity. The on line offerings performance (in terms of marketing, destination information, customer and technical perspectives) of NTO portals’ is equal in popular tourist destinations and in less popular tourist destinations, within the EU;
H 2. Affluence levels. The on line offerings performance of NTO portals’ is equal, in affluent destinations and in less affluent destinations, within the EU;
H 3. E-readiness. The on line offerings performance of NTO portals’ is equal in e-advanced destinations and less e-advanced destinations, within the EU;
H 4. Cultural richness. The on line offerings performance of NTO portals’ is equal in cultural rich destinations and in less cultural rich destinations within the EU.
In order to test the hypotheses, the sample of portals’ was split into the 8 independent groups as illustrated in Tab.2.
TABLE 2: PROXY MEASURES USED TO CLUSTER THE 25 EU STATES
EU member state
International tourist arrivals
(1000) for
2004a
Destination tourism
popularity above the EU
average
GDP per capita at ppp in $
(2005)b
Levels of affluence
above the EU average
Economist E-readiness
classification 2005
2005 E-readiness
classification above average
No of UNESCOheritages
Cultural richness
Austria 19.400 1 33.822 3 8 5 8 8
Belgium 6.710 2 31.196 3 8 5 9 8Cyprus 2.349 2 21.602 4 n.a 7 3 8
Czech Republic 6.061 2 18.404 4 6 7 12 8Denmark 3.358 2 34.673 3 9 5 4 8
Estonia 1.750 2 16.452 4 6 5 2 8Finland 2.840 2 31.237 3 8 5 7 8
France 75.100 1 30.356 3 8 5 30 7
Germany 20.100 1 30.489 3 0 5 32 7Greece 14.000 1 23.314 4 6 5 16 7
Hungary 12.200 2 16.852 4 6 7 8 8Ireland 6.982 2 41.767 3 8 5 2 8
Italy 37.100 1 28.597 3 7 5 41 7Latvia 1.080 2 12.666 4 5 7 2 8
Lithuania 1.491 2 14.236 4 5 7 4 8Luxembourg 874 2 68.869 3 8 5 1 8
Malta 1.156 2 19.708 4 n.a 7 3 8
Netherlands 9.600 2 30.784 3 8 5 7 8Poland 14.300 1 12.864 4 6 7 13 7
Portugal 11.600 2 19.387 4 7 7 13 7Slovakia 1.401 2 16.168 4 6 7 5 8
Slovenia 1.499 2 21.846 4 6 5 1 8Spain 53.600 1 26.642 3 0 5 39 7
Sweden 3.003 2 30.049 3 9 5 14 7UK 27.800 1 30.648 3 9 5 27 7
mean 13.414 26.505 6 12 Notes: 1 (2) means tourism popular (less tourism popular) countries; 3 (4) means affluent (less affluent) countries; 5 (6) means e-ready (less e-ready) countries; 7 (8) means rich cultural (less rich cultural) countries; a) source: WTO , 2005; b) source: Euromonitor database, 2006.

1864
Findings and Analysis: Destination Information Category The results of the BSC approach to evaluate the EU NTO portals are summarised in Tab. 3. It emerges that Denmark achieved the best overall ranking (4.8), implying that currently the Danish portal is the most customer led one, whereas the Latvian (19.9) and the Greek portal (21.1) occupy the last positions, with the latter being the worst of all in terms of the marketing perspective.
TABLE 3: OVERALL RANKINGS THROUGH THE BSC FRAMEWORK
EU Member state URLMarketing Ranking
Customer Ranking
Destination Info
Ranking
Technical Ranking
Total
Denmark http://www.visitdenmark.com 3 1 2,5 12,5 4,8UK http://www.visitbritain.com 1 2,5 7 9,5 5,0Netherlands http://www.holland.com 7,5 12,5 1 1 5,5Austria http://www.austria.info 9,5 5 7 4,5 6,5Spain http://www.spain.info 2 2,5 7 18 7,4France http://franceguide.com 4,5 8,5 18 8 9,8Malta http://www.visitmalta.com 4,5 15 13,5 7 10,0Sweden http://www.visit-sweden.com 9,5 8,5 7 20 11,3Slovenia http://www.slovenia.info 6 4 24 12,5 11,6Czech Republic http://www.cheztourism.com/ 14 10 23 3 12,5Ireland www.discoverireland.com 11 11 4 24 12,5Finland http://www.visitfinland.com 16,5 18 7 9,5 12,8Cyprus www.visitcyprus.org.cy 16,5 22 10 4,5 13,3Germany http://www.germany-tourism.de 7,5 15 16 15 13,4Hungary http://www.hungary.com/ 12 6 16 25 14,8Belgium http://www.visitbelgium.com 14 21 2,5 23 15,1Estonia http://www.visitestonia.com 20 12,5 16 14 15,6Luxembourg http://www.ont.lu 20 7 13,5 22 15,6Slovakia www.slovakiatourism.sk 20 17 11,5 16 16,1Portugal http://www.visitportugal.com 14 15 19,5 18 16,6Poland http://www.poland-tourism.pl 20 24 21,5 2 16,9Italy http://www.enit.it 20 19,5 25 6 17,6Lithuania http://www.travel.lt 24 19,5 19,5 11 18,5Latvia http://www.latviatourism.com 23 24 11,5 21 19,9Greece http://www.visitgreece.gr 25 24 21,5 18 22,1
Kendall’s coefficient of concordance was found W=0.410, considering the four rankings of the BSC approach, adjusted for ties, and equal to 0.647 excluding the technical ranking. It is evident that this value is not perfect, however X2 (39.35) is statistically significant at 5 per cent level and it can support the conclusion that the Danish portal has the best performance in terms of the four perspectives combined. Tab. 4 presents the descriptive statistics of our sample. The average scores in the three categories indicate that the NTOs’ performance was higher in terms of Destination information in comparison to the Marketing and Customer categories of the BSC approach. Of the overall sub-categories of the scoring list, “culture” and “navigability” are the ones with the highest performances, averaging 76 and 73 per cent respectively (consult Tab. 6 for the sub-totals and frequencies of the single items).

1865
TABLE 4: DESCRIPTIVE STATISTICS
Perspectives Minimum Maximum Mean Std. Deviation Marketing 0.28 0.77 0.507 0.146 Customer 0.29 0.73 0.478 0.130
Information 0.17 0.86 0.674 0.143 Technical 30.00 103.00 60.760 16.741
Figure 2 shows the distribution of Destination information scores across the 25 portals. It reveals that the
NTO portals are performing quite similarly, implying high degrees of standardisation in the levels of information provided online. This pattern may be further investigated by considering Tab. 6. For example, as expected, the vast majority of NTO sites provide practical advices covering basic useful travelling information (e.g. transportation, public holidays, entry requirements, etc.). However, less than half of them (40%) show increased sensitivity for the tourists’ needs by including useful tips, such as information regarding tourist discounts, or information regarding foreign embassies and consulates in their country (36%).
10%
20%
30%
40%
50%
60%
70%
80%
90%
Austria
Belgium
Cyprus
Czech
Rep.
Denmark
Estonia
Finland
France
Germany
Greece
Hungary
Irelan
dIta
ly
Latvia
Lithua
nia
Luxembourg
Malta
Netherlands
Poland
Portuga
l
Slovakia
Slovenia
Spain
Sweden UK
Marketing perspective Customer perspective Destination Information perspective
FIG. 2: DISTRIBUTION OF BSC SCORES ACROSS PORTALS
The Dutch portal manages better to promote Holland through the provision of an impressively rich and well organised content. The practical advices provided go beyond the “typical” basic practical information before visiting the destination, covering aspects such as immigration and work permit regulations. The last place in this category is occupied by the Italian NTO portal since the latter fails completely to transmit a comprehensive picture about the diversity of the different Italian regions and it gives very limited attention to the Italian cultural assets such as local events. In addition, its content is poor and sometimes even outdated. By consulting the sub-category Culture (Tab. 6), it emerges that the EU countries have understood the power of internet for marketing their own culture. All the websites maintain separate sections where the artistic heritage of the destination such as castles, churches, museums, as well as the local culinary traditions are thoroughly described. Moreover, the majority of them (21 portals) is in the

1866
position to provide an updated database, which covers the main incoming local events, with a particular emphasis on the small characteristic local festivals. Although it is evident that some destinations put more effort in marketing online their culture more extensively (e.g. Belgium, Netherlands, etc.), again it can be argued that the cultural cues used to promote a destination are characterised by relatively high degrees of standardisation. Only when it comes to examining the promotion of local handicrafts, trades and local food recipes, some higher degrees of individualism arise, with only 64% of them promoting the former and 40% of them providing the latter. Finally, interestingly enough, the relatively low destination information percentages of countries possessing rich cultural heritage such as Italy, France, Greece and Spain imply that the latter do not appear to leverage particularly successfully their NTO portals to promote it. Thus, it is confirmed the realisation of the Ismail et al., (2002: 175), that there is no evidence of particular effectiveness of NTO websites from destinations with high number of cultural attractions and resources. The latter statement has been tested statistically in section 6. Customer Perspective Findings Among the 25 portals, Denmark and UK scored higher within this category with the former having 33 out of the 45 identified items (73.3%) and the later having 31 (68.9%) respectively. Both these NTO have realised the importance of “one site shop” as a driver of superior customer service for the contemporary demanding and time sensitive visitors. Both of them are offering direct online booking for accommodation, holiday packages and even more specialised vacation items, such as theatre and other attraction tickets. In addition, the British portal supports the acquisition of airplane tickets and it is offering a well organised online shop, where buyers can track the state of their orders. By consulting the sub-category Privacy and trust (Tab. 6), it emerges that a) a “terms of use” section, b) a “privacy statement” for the collection of personal data and c) a “security certification” are often missing. In particular, the lack of the above, combined with: “neglecting to stating the source of information provided” in 19 out of 25 portals (76%), and to “guarantee any last updating date for the site’s content, antecedent of the last 2 months” in a stunning: 23 out of 25 portals, definitely influence the building of trust between the entity behind the website and its online visitors. Since trust and control of online users have been regarded as key components of e-SQ (Parasuraman et al, 2005; Nysveen et al, 2003) it exists a big margin for improvement. The three web sites with the most disappointing performance in the customer perspective are the Latvian, the Polish and the Greek one (Fig. 2). These portals can be regarded as “product driven” ones, where emphasis is given on the presentation of as much as possible information about the country, failing to organise this information and to “empower” their visitors, through the provision of advanced search engines which allow them to discover on their own only that kind of information they are mostly interested about. Disappointing is the picture regarding the measures undertaken by the portals for assuring accessibility, accommodating different users’ needs and capabilities. More specifically, while the majority of the websites under examination (17) include sufficient information regarding accessibility for travellers with special needs, only 2 of them (the Spanish and the British NTO) declare that their portals are adhering with the legal imperatives for accessibility according to the web content accessibility guidelines (http//w3.org). This is consistent with the findings of Williams et al., (2004) who found discouraging low levels of accessibility for tourism related websites in Germany and UK. A further category where the sample portals are performing particularly weakly is service integration, averaging 12 % across the total sample. Virtual communities are recognised as services of value added (Nysveen et al., 2003; Hjalager, 2001) however, only 2 NTO websites (the Slovenian and the Irish one) are making use of them. As far as it concerns the category management of information the majority of portals (23 portals, or 92%) make extensive use of modern internet applications such as interactive maps, whereas less than half of them (9 portals or 36%) offer a complete value added service including the provision of directions of how to reach different destinations and/or a route planner (10 portals, or 40%) and even fewer are providing directions for alternative ways of transporting. Finally, it is worthy mentioning that, regardless the portals’ large size, the majority of them (73%) include functions which enhance navigability.

1867
Marketing and Technical Perspective Findings As Fig. 2 reveals, the UK NTO website has scored higher in the marketing category, with 33 out of the 43 examined items (76,7%) being present. It appears as highly interactive with strong brand identity and satisfactory information customisation and personalisation features. Moreover, its design effectively supports market research and targeted marketing activities, and finally it assists the tangibility of destination through the provision of a wide variety of helping cues. On the other hand, the Greek and the Lithuanian portal have the poorest on line presence in terms of marketing functions (27.9% and 32.6% respectively) and need urgently to improve their efforts in marketing segmentation, tangibility of destination and market research. Finally, many websites such as the NTO portals of Estonia, Italia, Poland, Luxembourg and Slovakia have scored equally low (37,2%) implying the existence of significant margins for improvement. A closer examination of the single items highlights some specific features within the relationship marketing category. First of all, it can be argued that the websites employ relatively low levels of interactivity, with only 11 or 44% of them supporting online feedback forms, and only two of them (Slovenia and Portugal) including users’ ratings on: a) price offers and/or b) usefulness of the information received. Once more, very few of them (only 3) seem to have realised the importance of “word of mouse” and provide the possibility to browse other users’ experiences and comments on certain issues. Similarly, there have been detected varying levels of customisation and personalisation of information. In terms of personalisation items, the sample websites did not perform well since only 36% of them (9 portals) are allowing online visitors to select, organise, and store personal interest information into a “favourites section” and even less (12% or 3 portals) maintain in memory previous settings such as “choice of language”. As far as it concerns the segmentation category, the vast majority of them (23), in conformity with one of the strongest trends of the last years, are providing extensive information for spas and fitness centres, in an attempt not only to satisfy better the needs of their online users, but also to target more effectively the most valuable market segments. Moreover, slightly more than half of these portals (52%) are including a city break section, another important trend gaining popularity among the time sensitive tourists of nowadays. On the other hand, segmentation according to lifestyle is not extensively used. Indeed the provision of a separate nightlife section, with information regarding entertainment options is a less strong trend (only: 44% or 11 portals). The other emerged targeted segment is business tourism, with 21 portals (84%), providing separate, specialised web-sites within their main portal. In terms of the number and kind of cues used to enhance the tangibility of the destination, although almost every portals makes use of tools such as maps (100%) and photographs of landscapes of different regions (88%), more sophisticated and advanced tools such as virtual tours (10 portals or 40%) or video clips (13 portals or 52%), and webcams (3 portals or 12%) are not yet fully employed. Eight items have been used to examine whether the NTO are branding their site sufficiently. Among these: a logo is included in the homepage of all the portals(100%), as well as in the rest pages (84%). However, the sites often miss a quality certification (only 7 out of 25 portals do have one), failing to assure their visitors for the content of the information provided. Finally, they hardly include data on their use, such as number of registered users, number of hits, etc. (1 out of 25 portals only). By consulting the marketing research and customer database category, it emerges that the majority of the NTO portals (76%) are maintaining a customer database since they allow their visitors to register online. A less popular way to gather personal data regarding their visitors, is through online competitions (12 portals or 48%). In terms of market research and targeting: 52% of the websites (in total 13 portals) track the country of origin of the different visitors and 11 portals provide multiple versions of their website, with content adjusted to reflect the local tourist market conditions of each country. As Tab. 3 reveals, the Dutch NTO portal was the one which scored higher in the technical perspective. Indeed, the latter portal gained the highest ranking position in terms of HTML errors and browser compatibility problems, an equally high classification in terms of broken links and overall downloaded time at a 56K speed connection (3rd position), and the 4th position in terms of search engine saturation (Tab. 1). On the other hand, the Hungarian website was rated as the least technically sound NTO portal with serious delays in downloading time. Finally, the high positions of some of the accession states, such as the 2nd position of Poland, the 3rd position of

1868
Czech Republic in contrast to the lower classifications of more e-advanced nations such as Sweden and Ireland (Economist, 2005) support the position that Internet empowers new players and boosts competitiveness regardless the smaller internet penetration rates of the latter.
Hypothesis Testing The Wilcoxon-Mann Whitney has been calculated to test whether the online performance were equal in the 8 groups of countries defined in para. 4.2. It emerged that the variable affluence (see Tab. 5), has a significant influence on the online performance in terms of marketing, destination information and customer perspective. The Austrian, French, German, Belgian, Danish, Finish, Irish, British, Italian, Dutch, Swedish, Spanish and the Luxembourg NTO portals with a mean rank of 16.31 in terms of marketing, 15.85, in terms of customer and 16.96 in terms of destination information, perform almost twice as the portals from the less affluent countries (Greece, Portugal and the ten Accession states) with a mean rank of 9.42, 9.92 and 8.71, respectively. On the contrary, the “affluence” variable does not have any significant influence on the online performance of the NTO portals in terms of technical perspective. The remaining three independent variables were not found to have a statistically significant influence on the NTO portals’ online performance.
TABLE 5: WILCOXON-MANN WHITNEY TEST
Perspectives Groups N Mean Rank Sum of Ranks Z Marketing Affluent 13 16.31 212.0 -2.352a** Less affluent 12 9.42 113.0 Customer Affluent 13 15.85 206.0 -2.017** Less affluent 12 9.92 119.0 Information Affluent 13 16.96 220.5 -2.817*** Less affluent 12 8.71 104.5 Technical Affluent 13 13.31 173.0 -0.218 Less affluent 12 12.67 152.0
a** and *** indicate statistical significance levels of 5 percent and 1 per cent , respectively, in two-tailed tests Finally, an univariate correlation analysis was performed to assess the relationship between the four perspectives. All correlation coefficient were positive, except between customer and technical and between technical and destination information perspectives. Marketing was the most significant contributor to the total score at 0.907 (p<0.01) followed by the customer category at 0.765 (p<0.01). Moreover, a positive and high correlation (0.749) was found between the Marketing and the Customer perspective (p< 0.01), a realistic result since e-marketing excellence by definition is closely related to customer orientation. The correlation among the other perspectives was low and insignificant. Conclusion and Further Research This study analyses the on line offerings of 25 EU NTO using a framework that captures four e-quality categories. It is found that NTOs have realised that by just including basic information on their websites and waiting for online visitors to arrive is not a viable solution anymore. However, even if the vast majority of them demonstrate “acceptable” levels of online performances significant margins for improvements do exist. In particular, there were observed relatively high degrees of standardisation in the areas of: content of information for the destination and cultural cues used to promote the destination. This implies that the NTOs are failing, up to a certain extent, to create a “unique sales proposition” to promote their destination. In most of the cases, some basic features necessary to promote “trust” for the online users were missing. In addition, basic features enhancing accessibility for all online users were almost absent. Lastly, some further areas to work on are: a) interactivity among the users and the portal, b) service integration applications and virtual communities. The results support the hypothesis that the affluence

1869
variable has a significant influence on the online performance in terms of marketing, destination information and customer perspective. This research is a necessary first step in order to make inferences about the current level of online offerings and e-quality provided by the NTO web sites. Customer perceptions’ of e-quality need to be explored as well in order to form a complete picture of online quality. Thus, future research could concentrate on increasing our understanding of: which of the information and services present here contribute the most in achieving a high level of overall service quality, as perceived by the end users and b) if the latter perceptions are culturally sensitive. A survey could be addressed to online users with the scope to capture which of the identified on line services are rated as most important by prospect tourists when seeking tourism information on line and in what order of importance. The latter would be of particular value to the NTO, since it would reveal eventual gaps between their current offerings and customers preferences of on line value added services. A further interesting direction would be: to examine if these findings can be generalized in other categories of tourism websites more profit oriented. Due to the dynamic nature of web sites the reported results can be considered valid only for a limited period of time. As Feng et al., (2002) comment they provide only a snapshot in time. Thus, it would have been necessary to monitor how their content and consequently also their online service quality evolve through time.
References
[1] Aladwani, A.M., Pavia, P.C, (2002), ‘Developing and validating an instrument for measuring user
perceived web quality’, Information and Management, Vol.39, pp.457-476 [2] Blum, V., Fallon, J., (2002), ‘Welsh visitor attraction websites: Multipurpose tools or technological
tokenism?’ Information Technology and Tourism, Vol.4, pp.191-201 [3] Boyatzis, R.E., (1998), ‘Transforming Qualitative Information: Thematic Analysis and Code Development’,
Thousand Oaks, CA: Sage Publications. [4] Buhalis, D., Licata, M. (2002), ‘The future of eTourism intermediaries’, Tourism Management, Vol. 23,
No.3, pp.207-220 Contact authors for the complete list of references.
End Notes
NTO is defined by WTO, (1996)as: “An autonomous body of public, semi-public or private status, established or recognised by the state as the body with competence at the national level for the promotion and in some cases, marketing of inbound international tourism” as cited in Law et al., 2004:100 2 cited in Santos, 2003:236 3 cited in Santos, 2003:235 4 cited in Sigala, 2004: 105 5 cited in Zeithmal et al., 2002: 366 6 cited in Blum and Fallon, 2002:193 7 cited in UNCTAD, 2005:159 8 cited in Doolin et al., 2002:558 9 cited in Scharl et al., 2004: 258 10 cited in Skadberg et al., 2005: 148 11 cited in Hudson and Lang: 2002:156 12 cited in So and Morison, 2004:101

1870
Glocalization of bilingual websites of global corporations
Miranda Y.P. Lee The Hong Kong Polytechnic University, Hong Kong
Abstract Glocalization, as a portmanteau of globalization and localization, means the co-presence of both universalizing and particularizing tendencies (Robertson, 1997). It highlights the fact that the globalization of a brand is more likely to succeed when the brand is adapted to the locality or culture it is marketed in. Internet as a global communication medium is often used by a global corporation to market its product or service and to promote its image for local communities. Corporate website becomes the major medium to present a corporation’s messages to local communities around the world, and to demonstrate its understanding of the social world of the local communities. A well-designed corporate website therefore has to ‘be global and speak local’. The term ‘speak’ here is interpreted as communicating with the local communities in their way of speaking, such as their tone and style. In order to meet the expectations and to follow the linguistic and cultural conventions of diverse communities, the local or the subsidiary websites of a global corporation often adopt rhetorical strategies which may differ from those adopted on its main or master website. The rhetorical strategies including discourse, rhetorical devices and register may even vary among polities speaking the same language, such as within the Greater China region. Background and Objective
In recent decades, an overwhelming number of global corporations have expanded their market to Greater China and many of them have established subsidiary websites for readers in the region. However, comparative analyses of bilingual websites targeting diverse local communities in Greater China are very limited. This preliminary study seeks to examine how the top global corporations localize their websites targeting readers in Greater China, and how they demonstrate their concerns and understanding of diverse local communities. The content selection and the ways of presentation may differ between the main and the subsidiary websites which are in different languages, as well as among the subsidiary websites of different polities. Findings from the study demonstrate certain patterns of how the top corporations glocalize themselves on their corporate websites, and provide a useful reference for drafting websites that communicate effectively with diverse local communities, especially those in Greater China. Specific objectives are as below:
1. to examine how global and local elements co-present on corporate websites; 2. to identify inter-linguistic and inter-cultural differences in rhetorical strategies of websites targeting
western and Chinese readers, by comparing the bilingual (English and Chinese) versions; and 3. to analyse intra-linguistic and intra-cultural variations of websites in Chinese, through comparing
different Chinese versions targeting readers of Mainland China, Hong Kong, and Taiwan. Methodology The study analysed the main and the subsidiary websites of global corporations targeting respectively the English speaking communities and the Chinese speaking communities in Greater China. In order to make the data more representative and to ensure a broad coverage of different business nature, I selected global corporations from various industries or fields including automobile, banking, electronics and electrical appliances, food and catering, information technology, insurance, logistics, and petroleum. As a preliminary study, the top two corporations in each of these industries from the list of Fortune Global 500 in 2006 which have their subsidiaries or branches established in Greater China for more than a decade were chosen as samples. Bilingual websites of 16 global corporations in total formed the corpus for analysis (see Table 1 below). The analysis concerns mainly the rhetorical patterns

1871
including the discourse, rhetorical devices and register adopted in the corporate slogans, corporate history and profile on the websites. TABLE 1: CORPORAT WEBSITES ANALYZED IN THIS STUDY
Industries / fields Corporations
Automobile Toyota Ford
Banking Citigroup HSBC
Computer & Information technology Dell Microsoft
Electronics and Electrical appliances Siemens Hitachi
Food & Catering Nestlé PepsiCo
Insurance AXA ING
Logistics Maersk FedEx
Petroleum Exxon Mobil Shell
Co-Presence of ‘Global’ and ‘Local’ Elements A global corporate website serves as a useful medium to establish the corporation’s global image, and at the same time to show its understanding of local communities. Many global corporations have expanded their business to Greater China and set up their websites for local communities there. This section illustrates the successful examples of some of these global corporations in designing their subsidiary websites for Greater China, and seeks to provide a reference for other global corporations which plan to develop their websites for the Greater China communities.
‘Global’ and ‘local’ elements often co-present on the bilingual websites of multinational corporations operating in Greater China. HSBC is one of the typical examples embracing both ‘global’ and ‘local’ elements on its main website as well as on its subsidiary websites for diverse local communities. Its corporate slogan “the world’s local bank” illustrates its ambition to ‘be global and act local’. Its Hong Kong website states in the corporate profile page in English and Chinese that: “At the Group’s core around the world are domestic commercial banking and financial services, which fund themselves locally and do business locally.”
“集團在世界各地以商業銀行及金融服務作為核心業務。此兩項業務以本土市場作為資金來源和經營地區,並運用技術提高效率,提供符合當地客戶需要的各種國際產品及服務。”
Similarly, on its Taiwan website, HSBC highlights the importance of ‘local’: “We never underestimate the importance of local knowledge.”
The corporate website of AXA also demonstrates “interconnections of both global and local institutions and cultural practices” (Holton 2005, p.130). The website for the Mainland community displays a high degree of attachment to and support of local culture. As noted by Roudometof (2005, p.126), “such an attachment and support for local culture are likely to take a variety of different forms depending upon the specifics of different national cultures around the globe”. For instance, AXA relates its contributions to the economic development of China. Its mission stated on the China website is:
“承诺发展,贡献中国” (committing to the development, contributing to China) (researcher’s translation) AXA China stresses its attachment to the local society and aims to develop as a “nation-wide insurance
company”. On the other hand, AXA is marketed differently for the Hong Kong community. It emphasizes its global leadership in the industry – “a worldwide leader in financial protection”, and writes:“In Hong Kong, we are one of

1872
the top general insurers with over 170 years of experience in Asia.”. The local tendencies are not so apparent on the Hong Kong website than on the China one.
The co-presence of global and local elements is not confined to banking and insurance industries. It is also common across different industries. Siemens on its website for the Taiwan community shows its global and local
commitments – “global innovation, local partnership” (創新全球 在地夥伴).
Inter-Linguistic and Inter-Cultural Differences bet ween English and Chinese The above mentioned ways such as adopting words of ‘world’, ‘international’, ‘domestic’ and ‘local’, and listing the facts of the ‘global’ and ‘local’ achievement of the corporation are explicit means to glocalize a corporate website. There are other means which can be considered as implicit for achieving the goal of glocalization. A corporate website may display how ‘local’ the global corporation is through adopting the way of ‘speaking’ of the local communities on its subsidiary website. This section compares the bilingual (English and Chinese) versions of the main and the subsidiary websites of the same corporations, and focuses on rhetorical comparisons between two language versions targeting communities from distinct linguistic and cultural backgrounds.
The English and the Chinese versions of the same corporations may differ in the foci of messages presented. The English version often provides a detailed history of the corporation; while the Chinese one tends to skip the details and adopts a simplified version instead. The latter often explains the corporate logo and the origin of company name. Such examples as Citibank of which its main website in English lists a detailed timeline of the history with a caption “The story of Citigroup: 100 countries. 200 years”. Its Chinese versions for the Hong Kong and the Taiwan communities on the other hand give only a brief introduction to the history but add an explanation of the logo of ‘red umbrella’. Similarly, Hitachi Hong Kong shows how the company name is formed on its Chinese version, but not in its English one:
“HITACHI 由兩個漢字拼合而成:「HI」代表「日」,而「TACHI」代表「立地」,象徵人類通往直前,立地前瞻初昇的旭日,計劃更美好的生活與未來。”
(Hitachi is formed by two Chinese characters: ‘Hi’ represents ‘sun’ and ‘Tachi’ represents ‘standing on the earth’, symbolizing that humans move forward, standing on the earth facing the rising sun, and plan for a better life and future.) ING also mentions its logo in the corporate profile on its Taiwan Chinese website:
“ING集團的表現就如其企業標誌 – 獅子般耀眼” (The performance of ING is as outstanding as the lion on its corporate logo.)
While the above explanations or references to the corporate logo or name are popular in the Chinese versions, they are not so common in the English ones.
The second distinctive feature between the English and the Chinese versions can be identified in the presentation of the message from top management. Examples include the corporate websites of AXA and Toyota. There is a webpage of “Message from Top Management” on the main website of Toyota in English. However, webpages of this kind are absent on the websites for the Mainland and the Hong Kong communities. In addition, messages from top management are often presented in more vivid and lively manner in the English than in the Chinese versions. For example, the main website of AXA in English uses direct quotes:
“ ‘We have chosen a demanding business… Our vision of the business is what guides our daily work. It reflects the social and human aspects of Financial Protection, whose value to people has never been greater.’ Henri de Castries – Chairman of the AXA Management Board”
Instead of presenting the corporate mission or vision in the form of direct quotes, the Chinese versions in Greater China adopt a rather descriptive and factual approach. Consider below the examples extracted from respectively the Hong Kong and the Taiwan websites:

1873
AXA 為客戶提供經濟保障及管理服務,…… 了解他們在不同階段的需要。 (AXA provides financial protection and management services for customers, …understand their needs at various stages.)
AXA 集團秉持為顧客提供財富保障及管理服務為信念,提供全面性的保險服務,…… (AXA’s mission is to provide financial protection and management services, as well as comprehensive insurance services for customers…)
The third major difference between English and Chinese lies in the varying degrees of formality. The Chinese version tends to be relatively more formal than the English one. Parallel structure and formal register become some of the common rhetorical characteristics of websites in Chinese. Parallel structure or parallelism refers to a similarity of structure in a pair or series of related words. It is one of the typical rhetorical features adopted in phrasing Chinese slogans (Lee and So, 2007). It reinforces the message presented and gives readers an impression of a high degree of formality in Chinese (Lee et al, 2006). On the other hand, the English version adopts less formal register. Compare the English and Chinese slogans below:
The world’s local bank (HSBC)
環球金融 地方智慧 Creating opportunities in global commerce (Maersk)
展望全球 創建商機 Be life confident (AXA)
生活無限 自有把握 Moving forward (Toyota)
车到山前必有路 有路必有丰田车 Each of the above Chinese slogans is presented in parallel structure – a pair of expressions containing the
same number of characters. Apart from slogans, headings in Chinese are often in parallel structure. For instance, ING adopts a strict
structure for headings on its website in Chinese but not in English. Some of the Chinese examples include the following which are structured in pairs of four-character expressions:
柜台服务 最为贴心 (The most comprehensive front desk service)
主动出击 了解您心 (Be proactive and understand what you think)
Intra-Linguistic and Intra-Cultural Variations in G reater China One may expect that the rhetorical patterns of corporate websites are similar among the Mainland, Hong Kong and Taiwan since the main readership of these websites is Chinese speakers. In fact, the content, foci and register differ across polities in the Greater China region. Since Chinese communities in these polities have diverse expectations and varied cultural and linguistic norms, corporate websites need to adopt rhetorical strategies that are considered appropriate for the local communities. A comparative analysis of websites across different polities in Greater China can help illustrate how global corporations localize themselves, i.e. how they make themselves look local.
In terms of the availability of language versions of websites, there exist assumptions that a global corporation provides only a Chinese version for the polities in Greater China, and that bilingual versions are not common there since an English version is already available on the main website of the corporation. However, my investigation reveals that not all sampled global corporations offer a Chinese version for the local communities in Greater China. Some of the corporations offer only an English version, for the Hong Kong community in particular, such as Ford. In addition, bilingual versions in both English and Chinese are common in Hong Kong but not so

1874
common in other two polities (see Table 2). Microsoft is an example of this kind. The above findings reveal the corporations’ positioning and their response to the different expectations of
diverse communities within the Greater China region. English is a common medium of business in Hong Kong whereas Chinese is still the major language used in other two polities, Mainland China in particular. Certain global corporations may attempt to enhance their local relevance by providing only a language version which is widely accepted by the local communities. In fact, for those corporations which offer only monolingual versions for their subsidiary websites, many of them are in Chinese for the Mainland and the Taiwanese readers, but not for the Hong Kong group. Examples include Ford, Toyota, etc. Table 2. Language versions provided by the sampled corporate websites
Language versions of websites Mainland China Hong Kong Taiwan
Corporations *
English Chinese English Chinese English Chinese
AXA � � � � � �
Citigroup � � � � � �
Dell � � � � � �
Exxon Mobil � � � � � �
FedEx � � � � � �
Ford � � � � � �
Hitachi � � � � � �
HSBC � � � � � �
ING � � � � � �
Maersk � � � � � �
Microsoft � � � � � �
Nestlé � � � � � �
PepsiCo � � � � � �
Shell � � � � � �
Siemens � � � � � �
Toyota � � � � � �
* Corporations are listed according to alphabetical order of the corporate names.
In order to fulfil diverse expectations of different communities, global corporations tend to vary the content and adopt different foci on their websites. One distinctive feature among the three polities is an emphasis on awards for the Mainland and the Taiwan websites but not for the Hong Kong one. For instance, Citibank Taiwan lists its awards in a rather elaborate approach but Citibank Hong Kong does not choose awards as the main content for its website.
“花旗銀行在台灣卓越的表現,連續多年獲得Finance

1875
Asia雜誌『最佳外國商業銀行』的肯定。2006年,花旗銀行更連續十二年榮獲天下雜誌評選為『銀行業最佳聲望標竿企業』!”
(The outstanding performance of Citibank Taiwan has been recognized by Finance Asia as the Best Foreign Commercial Bank in Taiwan. Citibank has also been recognized by Common Wealth Magazine as “The most respected bank” for 12 years.)
Citibank Taiwan lists its awards in detail on its website. Similarly, HSBC China and Taiwan emphasize
HSBC’s achievement by listing her awards on their websites. While corporations like Citibank and HSBC have been well-established in Hong Kong but are relatively new in the Mainland and Taiwan, more emphases on the achievement, especially the concrete one as represented by awards, become essential for the latter two polities.
The third distinctive feature among the three polities is the relevance to the local government. Websites for the Mainlanders often highlight the corporations’ relations with the local government and display the support gained from it. For instance, Ford China shows the support from the former President of PRC in its corporate profile:
“福特汽车当时的董事长亨利·福特二世于1978年得到了邓小平先生的见,……” (Henry Ford, the Chairman of Ford, had a meeting with Mr. Dang Xiao-ping in 1978…) Microsoft China demonstrates its mission to collaborate with the local government by stating that:
“协助政府发展中国软件产业
积极参与政府和企业进行信息化建设” (It assists the government in developing the software industry in China.
It actively participates in the government’s and the corporations’ development of information technology.) Siemens China also shows its contribution to the local economy in both its Chinese and English versions. Its websites write:
“西门子是中国经济不可分割的一部分,也是积极帮助中国完成主要基础设施建设和实现工业现代化忠实而可靠的合作伙伴。”
“Siemens is an integral part of the China economy and a reliable, committed and trustworthy partner of China actively contributing to major infrastructure developments and industrial modernization.”
The above characteristic of a particular relevance to the local Chinese government is not common in other two polities. It is rather culturally specific in the Mainland in which collaboration with the Chinese government and gaining its support are essential for the success of doing business in China.
Another intra-cultural dissimilarity is the varied emphases on corporate citizenship. Corporate citizenship is interpreted differently across the three polities. Concrete actions on achieving social responsibility are highlighted on the Taiwan websites, as illustrated by example of Citibank Taiwan:
“本著取之於社會,用之於社會的精神,長期贊助喜憨兒基金會、公共電視種籽教育基金、亞卓市,…
… 以扮演良好的企業公民為己任,希望為台灣建立一個更美好的未來。” “Since 1995, Citigroup has been actively involved in both education and community development in Taiwan, sponsoring many programs such as the Elementary School Financial Education, Dollars and Sense - a financial education program for teenagers, ... These programs have been well received by the public and demonstrate Citigroup's long-term commitment to the community in which it lives and runs its businesses.”
However, corporate citizenship is not the major concern in Mainland China. As a result, it is only briefly mentioned on the websites for the Mainlanders.
The fifth distinctive feature is the varying degrees of formality in register among the three polities. Numbers are often presented in a full form, i.e. Chinese characters, on the Mainland website, but are in an Arabic presentation for other two polities. Compare below the different presentations of numbers on the websites of respectively Mainland China, Hong Kong and Taiwan:

1876
“花旗以全球领先的金融服务经验在一百多个国家约为二亿客户提供金融服务。” (Citibank is a global leader of financial services, providing services for two hundred million customers in more
than one hundred countries.)
“客戶約達200,000,000人,業務遍佈全球100多個國家。” (Our customers reach 200,000,000. Our service covers more than 100 countries.)
“目前共有3200名員工及11家分行,……” (Currently there are 3200 staff and 11 branches, …)
Websites for the Mainland Chinese and the Taiwanese communities adopt relatively more formal register as compared to the Hong Kong websites. A use of pronoun, such as ‘we’ or ‘us’ for addressing the corporation, is regarded as less formal than using the corporate name. For the title or caption of introducing the corporation, the
websites for the Hong Kong community tend to use “關於我們” (About us) while those for the other two polities
use the corporate name, such as “關於花旗” (About Citibank). Another point relating to the address form of the corporation is the language code presenting it. There is a
tendency for the Mainland websites to use the Chinese code. On the other hand, websites for the Hong Kong and the Taiwanese communities often switch the codes, firstly use Chinese and then switch to the English names of the
corporations. AXA is one of the examples. Only the Chinese corporate name “金盛” but no English name “AXA” is
used on its Mainland website. However, the corporate name is firstly presented in the Chinese code, “安盛” and
“瑞泰” respectively for the Hong Kong and the Taiwan websites; and then switch to its English name “AXA”. The code-switch phenomenon is rather common in Taiwan. To take Ford Taiwan as an example, its website firstly uses
“關於福特” as the caption for the corporate profile. In the context of the profile, it switches to use “FORD”. When
introducing the corporate history, “Ford 歷史” becomes the caption. On the other hand, the code for the corporate
name is relatively consistent in the Mainland. “福特” is used throughout the whole website. The last linguistic feature which merits discussion is the deployment of rhetorical devices. Websites for the
Mainland were found to adopt more parallel structures than those for the other two polities. For instance:
卓越银行服务 (Outstanding banking service)
备受全球信赖 (Globally trusted)
The above examples are some of the captions or headings on the website of Citibank China, in parallel structures of six-character expressions. Similarly, AXA China adopts a parallel structure for its values:
专业 创新 务实 团结 诚信 (professionalism, innovation, pragmatism, integrity, trust)
While many parallel structures were identified on the Mainland websites, the construction of expressions is not so strict in other two polities. A strict structure of expressions is a manifestation of a high degree of formality in Chinese, as a means to show respect for readers. This finding is in line with that relative to the address form for the corporations discussed above. The register of the Mainland websites is more formal than that of other two polities.

1877
Conclusion A corporate website can be considered as a mirror of a corporation for projecting its corporate image to its stakeholders. It also helps promote corporate culture and illustrates its concerns for local communities. In order to achieve a common goal of multinational corporations for projecting global image and practicing locally, certain rhetorical rules and patterns need to be observed in designing websites for diverse communities.
This paper has attempted to generalize some inter-linguistic and inter-cultural patterns between the English and the Chinese versions, as well as some intra-linguistic and intra-cultural variations of the Chinese communities in Greater China. It succeeds in raising awareness of these variations in glocalizing a corporate website, and in providing a useful reference for effective communication through websites targeting diverse communities in Greater China. Findings were obtained from observations on bilingual websites of some top global corporations. They are preliminary and may not be universally applicable. The rhetorical strategies in fact are rather corporate culturally specific, highly dependent on the unique corporate culture and positioning. Nevertheless, the study offers a prelude for future investigations which may involve more corporate websites from diverse industries, so as to verify if the glocalized patterns identified on the sampled websites and if inter-linguistic and inter-cultural differences between English and Chinese, as well as intra-linguistic and intra-cultural variations in Greater China apply to other global corporate websites.
References [1] Holton, R. J. 2005. Making globalization. New York: Palgrave Macmillan. [2] Inoue, N. 1997. (ed.) Globalization and Indigenous Culture, Institute for Japanese Culture and Classics.
Tokyo: Kokugakuin University. [3] Lee, M.Y.P., So, D.W.C. and Wong, L.Y.F. 2006. An inter-linguistic and inter-cultural analysis of global
corporate websites. Corporate Communications: An International Journal, Vol. 11 (3): 275-287. [4] Lee, M.Y.P. and So, D.W.C. 2007. Corporate slogans of corporations operating in Greater China. Corporate
Communications: An International Journal, Vol. 12 (1): 58-69. [5] Robertson, R. 1994. Globlisation or glocalisation?. The Journal of International Communication, 1(1): 33-52. [6] Robertson, R. 1997. Comments on the 'Global Triad' and 'Glocalization’. In N. Inoue (ed.), Globalization and
Indigenous Culture, Institute for Japanese Culture and Classics, 217-225, Tokyo: Kokugakuin University. [7] Roudometof, V. 2005. Transnationalism, Cosmopolitanism and Glocalization. Current Sociology, 53; 113.
SAGE. [8] Ritzer, G. 2004. The globalization of nothing. Thousand Oaks, California: Pine Forge Press. Contact author for full list of references

1878
Analyzing Quality Function Deployment Based on Voice of Customer
Fadzilah Siraj, [email protected] Nooraini Yusoff, [email protected]
Norshahrizan Nordin Universiti Utara Malaysia, Malaysia
Abstract Analyzing Quality Function Deployment (QFD) based on voice of customer aims to provide an advanced machine planning methodology based on QFD principles, for identifying and minimizing the risks of project failures due to failure in complying with the voice of the customers. This study focuses on the development of general QFD for machine specification selection so that it later can be used for any kind of machine evaluation prior to purchasing the machines. A set of questionnaires was used as an instrument and was distributed to 223 respondents. NN models were generated and statistical methods were used to explain the relationship between attributes used in this study. The findings from the experiments conducted exhibit that the significant correlations of QFD with customer voices help to explain the relationship between attributes used in the study. The study also indicates that NN forecasting model has been established with 12.30 percent misclassification error in determining the customer voices based on QFD. This indicates that the approach has the potential in explaining the relationship between QFD and the customers, as well as predicting the type of customer if QFD information is provided. Hence, the study reveals the type of machine and type of operation that are favourable to customer prior to acquiring the machines for their industrial usage. Keywords: Quality Function Deployment (QFD), Voice of Customer, Neural Network, Machine Planning
Introduction QFD is one of the techniques that aim to fulfil the customers’ satisfaction at the very beginning, namely the product design phase. It enables the companies to become proactive to quality problems rather than taking a reactive position by acting on customer complaints. QFD technique is used to plan and design new or improved products and services. According to Wikipedia (2006), Quality function deployment of QFD is a flexible and comprehensive group decision making technique used in product or service development, brand marketing, and product management. QFD can strongly help an organization focuses on the critical characteristics of a new or existing product or service from the separate viewpoints of the customer market segments, company, or technology development needs. The results of the technique yield transparent and visible graphs and matrices that can be reused for future product/service development.
This study presents alternative ways to identify the relationship QFD and customer voices. It also aims to build QFD forecasting model with respect to different types of customers. The combination of effort in QFD and the utilizing of neural network as a tool of IT in manufacturing and product development will torch the light towards the creation of the QFD forecasting model. Some statistical techniques may be utilized to support the findings in this study.
Related Works
QFD takes the voice of the customer from the beginning of product development and deploys it throughout the firm. Through QFD, the voice of the customer aligns the company’s resources to focus on maximizing customer satisfaction. Customer satisfaction is influenced by product development outcomes which, in turn, are influenced by the technical and organizational dimensions. Basically, QFD is aimed to fulfil the customer’s expectation of the product or service. San Myint (2003) describes a framework of an intelligent quality function deployment (IQFD) for discrete assembly environment of QFD as well as the project’s profile. They used Taguchi experimental design for manufacturing process optimization using historical data and a neural network process model (Wimalin &

1879
James, 2005). QFD with applied statistics techniques are employed to facilitate the translation of prioritized set of customer requirements into a set of system level requirements during conceptual design (Yu & Fu, 2004).
QFD is a proven tool for process and product development, which translates the voice of customer (VoC) into engineering characteristics (EC), and prioritizes the ECs based on the customer’s requirements. Conventional QFD evaluates these targets for crisp weights of the customer attributes (CA), identified from the VoCs. Fuzzy logic approach to prioritize engineering characteristics in QFD (FL-QFD) addresses the issue of defining non-crisp customer attributes in the QFD. It is an innovative method of determining optimum rating of engineering characteristics (EC) by simulating the QFD matrix for randomized customer attributes (CA) in the fuzzier range (Rajam & Selladurai, 2004). Vivianne & Hefin (2000) reviews methods and techniques to assist QFD by integrating fuzzy logic with it since fuzzy logic exhibits some useful features for exploitation in QFD
Engineering systems have become increasingly complex to design and build while the demand for quality and effective development at lower cost and shorter time continues. The study employs neural networks based approach in QFD process to prescribe a new methodology to generate a conceptual design baseline. A generalized neural networks oriented conceptual design process is introduced and a hybrid intelligent system combining neural networks and expert systems for conceptual design. Statistical regression methods adopted in the past is computationally inexpensive but with poor accuracy (Yu & Fu, 2004).
Zhang et al. (1996) have proposed a machine learning approach to QFD, in which a neural network automatically evaluates the data by learning from examples. The suggestion is to incorporate the engineering solutions of the product (the in-house and the competitor's product), within the neural network to find weighting that represents the customer's satisfaction. The techniques such as fuzzy logic, artificial neural networks, and the Taguchi method can be combined with QFD.
Neural Network (NN) is an important technology of Artificial Intelligence, which have been widely used, in recent years, for manufacturing process monitoring using output pattern recognition (Guh and Tannock, 1999). Neural networks are found to be a good alternative to traditional analytical techniques, for the modelling of complex manufacturing process. This is because of the number of process variables involved, and the non-linear nature of problems. One major application with neural network is forecasting since they can provide a valid alternative to such conventional approaches as time series and regressions. Compared to the traditional statistical methods, neural network are apparently bare of priori assumptions supposedly underlying the models, more capable of addressing problems in the nonlinear domain where the dependent and independent variables are not realized with linear relationship, and rather more general and flexible to approximate any desired accuracy (Zhang et al., 1998).
They have also been used, less frequently, for process modelling (Heider et al., 2002; Jimenez-Marquez et al.,2003), the approach which has been adopted in this study. A number of successful implementations of neural networks process modelling have been reported in Table 1.

1880
TABLE 1: THE APPLICATION OF NEURAL NETWORKS IN PROCESS MODELLING IS SUMMARIZED Author (Year) Process / Production Training Data Architecture /
learning algorithm Wimalin & James (2005) Production of hollow wide cord fan blades for
aircraft engines (Rolls Royce) EX MLP
Yu & Fu (2004) Ship design principle AC BP Rajam & Selladurai (2004) Flexible manufacturing process (FMS) EX & SIM BP Jimenez-Marquez et all (2003) Cheese manufacturing AC MLP/QN Heider et all (2002) Thermoplastic tow placement process SIM MLP/BP Benardos & Vosniakos (2002) CNC face milling EX MLP/LM Hsieh & Tong (2001) IC manufacturing EX MLP/BP Cook et all (2000) Particleboard manufacturing AC AP Nascimento et all (2000) Chemical process AC & SIM MLP/BP Raj et all (2000) Metal forming and machining SIM MLP/LM Edwards et all (1999) Paper making industry AC MLP Ko et all (1999) Metal forming process EX & SIM MLP/BP Yarlagadda & Chiang (1999) Pressure die casting AC & SIM MLP/LM Notes: AC = actual process data, EX = experimental data, SIM = simulated data, MLP = Multilayer Perceptron, BP = Back propagation algorithm, QN = Quasi-Newton Optimization algorithm, LM = Levenberg-Marquardt algorithm, AP = Adaptive gradient rule
Methodology The main research design in this study is a survey type that would be used to build QFD modelling and carrying out the analysis. In order to meet the objective of this study, a QFD methodology described by Clausing & Pugh, 1991 is adopted (see Fig. 1).
FIG. 1: A PROPOSED ARCHITECTURE FOR ANALYZING QFD FOR CUSTOMER VOICE
For survey purposes, an instrument used is a questionnaire that contains two main sections, a customer profile and possible customer requirements. For customer profile, there are three parameters used namely, name of company or institution, type of customer and type of work piece material used. For customer requirements, there are six (6) sections according to machine standard specification, machine control, machine safety, machine performance, machine maintenance and machine after sales services. The important subject to focus is the target selected to model of QFD for industry which is type of customers. These include professional, management level, maintenance and an operator. A questionnaire was constructed based on the study by Abd Rahman & Mohd Shariff (2003) regarding the application of QFD method for pultrusion machine design planning. It has also been adopted from Khodabocus (2003). Khodabocus study indicates that the most important for QFD questionnaire design for the service is the subject matter under investigation and the statistical analysis employed in the study. This questionnaire is also based on the success factors of QFD projects by Herzwurm et al. (1997).

1881
Neural network and statistical tools was employed to carry out the analysis. The approach for building forecasting model is adopted from Integrated QFD model methodology (see Fig.2) which was introduced by San Myint (2003). The NN technique is used to overcome QFD weakness in subjective judgments of relationship values with the help of human expert.
FIG. 2: STEP TO CARRY OUT FOR BUILDING FORECASTING MODEL
Results The survey was conducted to investigate and obtain information concerning Quality Function Deployment for general machine planning. The information obtained as a result of data mining activities could serve as guideline for future attempts to build forecasting model of QFD. The goal of the survey was to collect data from four different target type’s voice of customers, professional, management, maintenance and operator. They are from engineering and technical background with industrial experience, concerning their views of the resources needed for successful machine planning process in the different areas addressed within the core organizational system, in alignment with its strategy and with particular reference to the experiences in their respective organization.
A total of 300 questionnaires were distributed to various customers, and 223 questionnaires were returned (74.3%). The distribution of customers with respect to their group type is illustrated in Fig.3. Based on Fig.3, the highest percentage for type’s voice of customer contributed by operator (45%).
Type of customer
Operator, 101, 45%
Maintenance, 36, 16%
Management, 41, 18%
Professional, 45, 20%
FIG. 3: PIE CHART OF TYPE OF CUSTOMERS
Professional group comes from those who are really involved in teaching how to operate the machine,
either in terms of theory or practice. This group is selected from KUKUM, POLIMAS (Mechanical Engineering Department) and ILP, Jitra and 20% from overall sample. It is about 45 persons from three selected institution above. Management is for those who are really involved as a decision maker, such as the Dean and Deputy Dean for a faculty, Managing Director, Senior Executive, Engineer and Assistant Engineer. This group usually has more experience in handling the heavy machine, and also involved in selecting or forecasting the need for a machine at their institution. About 41 person or 18% are willingly to involve as a respondent for this study.

1882
Maintenance group are globally expert from small to big matter in operating machine. They also ready to settle and troubleshoot a problem happen while machine was operated. For this study, around 36 people (16%) from 100% work as the industrial technician almost 10 years. The operator comes from POLIMAS student, the student who has already worked before pursuing their study. They are in final semester and have a good technical knowledge to joint this survey. They gave the exact answer for all questions. 101 operators (45.3%) were selected from 3 different classes (DKM 5B, DTP 6A, DTP 6B. Types of Work Piece and Voice of Customers Further analysis was conducted to explore the relationship between types of work piece with respect to voice of customers (see Table 2). Based on Table 3, all significant correlations at the 0.01 level (1-tailed) are highlighted. The significant attributes include wood (p = 0.00, r = 0.776), plastic (p = 0.00, r = -0.266) and composite (p = 0.00, r = 0.402) out of six type of work piece used. Out of these, wood has the strongest (0.776) relationship with voice of customers. This shows that customers prefer wood type to other work piece of material. This may be due to the fact that wood is cheaper in price, and easily available. Furthermore, the wood specimen can be bought in various sizes and types. The other three types of work piece that do not have significant correlations are metal, mixed, and product assembly. TABLE 2: TYPE OF PIECE MATERIAL USED/PROCESSED
Type Of Customer
Type of Work Piece Correlation Coefficient
Material Used (N = 223)
Wood .000 .776** Plastic .000 -.266** Metal .449 .009
Composite .000 .402**
Mixed .183 .061
Product .000 -.304
** Correlation is significant at the 0.01 level (1-tailed). * Correlation is significant at the 0.05 level (1-tailed).
Possible Customer Requirements This section describes machine specification requirement specified by the customers. Results based on Spearman’s rho correlation for each machine specification categories are discussed in accordance to the section written in the questionnaire. Machine Standard Specification For machine brand, several are investigated such as from US made, German, Europe, Japan and Taiwan. The significant correlation coefficient between type of customer and US machine manufacturer is p = 0.00 and (r = -0.324), German made p = 0.004, (r = 0.179), Japan made p = 0.001, (r = -0.216) and Taiwan made p = 0.00, (r = 0.578). All the correlations stated above are significant at 0.01 levels (1-tailed). The result shows that Taiwan made (0.578) has the strongest relationship among machine brand name or manufacturer.
Among low duty, medium duty and heavy duty items, only operation type of heavy duty operation type achieved a significant correlation r = .208, (p = 0.001). The result indicates that customers prefer heavy duty operating type of machine. This type of machine normally is more robust, and can be used to perform multiple tasks such as sanding, sawing, cutting, pivoting, threading, dowelling and drilling process. For machine standard specification, electrical, hydraulic and manual machine drive type have significant correlation at p = 0.007, (r = -0.163), p = 0.00, (r = 0.332) and p = 0.00, (r = .229). The hydraulic drive type at p = 0.00, (r = 0.332) is the most significant relationship among this drive type. Only pneumatic drive type does not have a significant level out of four drive type categories. According to the power in kilo Watt for machine standard

1883
specification, all types of power consumption had been selected by all type of customer as significant value. Low power is defined as below 1 kilo Watt; medium is 1-5 kW and high power is above 5 kW. Low, Medium and High powers have significant correlation in both 0.01 levels and 0.05 levels. Low power and medium power have significant correlation at p = 0.042, (r = 0.116) and p = 0.050, (r = 0.110), and high power has correlation that is significant at p = 0.00, (r = 0.353). High machine power is the most significant at p = 0.00, (r = 0.353) rather than low and medium power.
The table and clamp configuration usually designed in two types, horizontal/vertical (xy) axis and flexible (xyz) axis. From the analysis, only flexible axis clamp configuration has a significant correlation at p = 0.00, (r = 0.343). The clamp types have 3 different clamping, pneumatic, electrical and hydraulic. For this study, all clamp type have a correlation coefficient at p = 0.00, (r = 0.289) for pneumatic, p = 0.00, (r = 0.245) for electrical clamp and p = 0.00, (r = 0.308) for hydraulic clamp. The hydraulic clamp type is the strongest (0.308) relationship similar to hydraulic drive type. In general, the pressure (Nm) for machine standard specification is divided into three main types, low pressure, medium pressure and High pressure. The high pressure machine has the strongest (0.362) relationship with customers’ voice compared to other type of machine pressure. The findings of the survey also indicate that customers preferred machine with Low torque spindle speed (r=0.318, p=0.00) to medium and high torque spindle speed. In addition, they also preferred low load capacity (r=0.13, p=0.034), and positioning accuracy (r = 0.520, p=0.00).
Dimension machine standard specification decision is the important categories to locate whether the machine is in the product or process layout. In other words, it should suit the size of the area allocated by the shop floor of machine. From this study, the findings indicate that it dimension of the machine that has more than 1000 mm3 has the strongest significant correlation at r = 0.414 and p = 0.000. The findings also reveal that the significant weight of the machine is more than 2000 kg (r=0.414, p=0.00). Machine Control A machine control criterion was generated based on the control system for the machine as proposed by Abdul Rahman & Mohd Shariff (2003). With reference to three choices of control system, only manual control system has significant correlation at (p = 0.000, r = 0.332) rather than fully and semi-automated. The machine with visible control located within hand reach has correlation coefficient at (p = 0.000, r = -0.315) at the 0.01 significant level (1-tailed). LCD display interface has correlation coefficient at (p = 0.031, r = -0.125), that is significant. For the user storage for programs and data and its correlation coefficient is (p = 0.011, r = 0.154). For machine control option, it concludes that only four out of fourteen criteria achieved the significant value for correlation coefficient (see Table 4).
TABLE 4: MACHINE CONTROL
Correlation Coefficient
(N =223) Type Of Customers
Manual .000 .332** Visible control located within hand reach 0.000 -.315**
LCD display interface 0.031 -.125* User storage for programs and data 0.011 .154*
Based on the correlation results, Manual is the strongest type of control system for machine specification.
This could be due to the reason that the process involved in manufacturing process with wood work piece selected before comes from manual machine control. In addition, all types of customers either technical or non-technical background inevitably would be able to operate this manual control machine. Machine Safety Machine safety is the third important segment for general machine specification. Only four criteria out of ten have four significant correlations at 0.05 levels (1-tailed) as shown in Table 5. Foot Brake Switch has the strongest

1884
(0.235) relationship with type of customer. This criteria is preferable to other machine safety type since it is the most commonly used for wood material. It seems reasonable that this type of machine safety achieves significant correlation due to the facts that most material used is wood as indicated earlier.
TABLE 5: MACHINE SAFETY
Correlation Coefficient
(N =223) Type Of
Customer Earth and insulation to prevent electric shock 0.007 -.164** Emergency stop button 0.003 -.187** Foot brake switch 0.000 .235** Exhaust fan for cutter 0.007 .165**
Machine Performance Machine performance have thirteen important elements that consist of Sensors for Warning, Alarm Signal for Machine Error, Simple Mould Replacement, LED Display to Show Current Operation, High Production Speed, Can Accommodate Different Types of Product, Utilize Small Amount of Resin, Rigid and High Damping, Minimum Noise and Vibration, Zero Resin Spillage, Able to Whist and Continuous Operations, Reasonable Power Consumption and Low Operational Cost. Among these elements, four of them have significant correlations with customer’s voice, and their correlations coefficients and respective significant values are exhibited in Table 6.
TABLE 6: MACHINE PERFORMANCE
Correlation Coefficient
(N =223) Type Of Customer
Simple mould replacement 0.013 .149* Utilize small amount of resin 0.000 .289** Rigid and high damping 0.001 .201** Zero resin spillage 0.000 .242**
Machine Maintenance Machine Maintenance contains several precaution steps in preserving lifetime of a machine. In this questionnaire, machine maintenance is measured by several items such as Easy Lubrication Points, Easy Replacement Parts, Simple Part Replacement, Simple Assembly and Disassembly, Self and Periodic Diagnose and Calibration, Coolant System and Lighting, Quick Mould Change and Set-up and Easy Trouble Shoot. Out of these items, Easy Lubrication Points (p = 0.011, r = -0.154), Simple Part Replacement (p = 0.024, r = -0.133), Simple Assembly and Disassembly (p = 0.032, r = -0.125) Easy Trouble Shoot (p = 0.030, r = -0.126) have significant correlation with customers voices (see Table 7). However, the strongest negative correlation is shown by Easy Lubrication Points.
TABLE 7: MACHINE MAINTENANCE
Correlation Coefficient
(N =223) Type of Customer
Easy lubrication points .011 -.154* Simple part replacement .024 -.133* Simple assembly and disassembly .032 -.125* Easy trouble shoot .030 -.126*

1885
Machine after Sales Services For machine after sales services, there are 7 items, including Speed of Supervisory/Technical Person, Speed of Spare Part Delivery, Reasonable Spare Part Price, Continuous Technical Consultancy, Near Service Center, Availability of Spare Parts, and Alternative Offer. Among these 7 items, Availability of Spare Parts shows significant correlation with voice of customer (p = 0.027, r = -0.129). The results indicate that when customers show an interest in buying a specific machine, one of the most important criteria that they would consider is after sales services. This is to ensure that the machine they bought can be maintained, serviced or replaced the parts whenever it is necessary. Therefore, the Availability of Spare Parts becomes important item in machine after sales services section. QFD Neural Network Model The analysis using Neural Network (NN) is performed in two ways. First, each individual entry of the questionnaire would be considered as an attribute for each pattern in NN dataset. The second method is to get the average value for each section in the questionnaire as an entity for NN attributes. Individual Entry In order to determine the most suitable number of hidden units, the dataset was trained with various hidden units ranging from 2 to 20. The results illustrated in Fig. 8(a) indicate that hidden unit 2 and 11 obtained highest test and least training accuracy for both training and testing. A set of networks with hidden unit 2 and 11 were further trained to determine which hidden is more appropriate to be used in the next experiment. The results depicted in Fig. 8(b) show that a network with 2 hidden units obtained higher average classification accuracy than a network with 11 hidden units (53.36% versus 43.88%).
Classification Accuracy
0
10
20
30
40
50
60
70
80
2 4 6 9 11 13 15 17 20 22
Number of Hidden Unit
Per
cent
(%)
Train Test
Classification Accuracy
60.59
53.0553.36
43.88
0
10
20
30
40
50
60
70
2 11
Number of Hidden Unit
Per
cent
(%)
Train Test
Experiments have been conducted to determine the suitable number of epoch prior to determining the backpropagation training parameters. For experimental purposes, the learning rate is 0.1 and the momentum rate was set to 0.3. Based on the results exhibited in Fig. 9(a), epochs 600, and 700 obtained the highest test results with 96.25% and 86.59% classification accuracy. These two number of epochs were further investigated by varying weight seeds in order to determine the most suitable number of epoch for the problem at hand. The results displayed in Fig. 9(b) show that a set of network trained up to 600 epoch achieved the highest average test result with 87.696% accuracy or 12.304% misclassification error.
FIG. 8(A): CLASSIFICATION ACCURACIES FOR DIFFERENT NUMBER OF HIDDEN UNITS
FIG.8(B): AVERAGE CLASSIFICATION ACCURACIES FOR NETWORK TRAINED WITH HIDDEN UNIT 2 AND 11

1886
Classification Accuracy
0
20
40
60
80
100
120
100 200 300 400 500 600 700 800 900 1000
Number of Epoch
Per
cent
(%)
Train Test
Classification Accuracy
89.285
91.252
87.696
86.217
83
84
85
86
87
88
89
90
91
92
600 700
Number of Epoch
Per
cent
(%)
Train Test
Similar experiments were conducted to determine the learning rate and the momentum rate for Backpropagation learning algorithm. The experimental results show that learning rate 0.1 obtained 40.01% classification accuracy whilst momentum rate of 0.3 achieved 44.78%. Once again the number of epoch was investigated based on the selected training parameters of Backpropagation. The Neural network architecture and training parameters for classifying QFD machine planning datasets are summarized in Table 8 and Table 9. For the average value (Table 9), the best learning rate is 0.2 while 0.2 for the best momentum rate. Sigmoid activation function has been chosen as it produced the highest test percentage. For the best epoch, 100 is selected as it represents the highest test percentage that is 87.621%. Based on results displayed in Table 8, the best learning rate is 0.1 while 0.3 for the best momentum rate. Sigmoid activation function has been chosen as it produces the highest test percentage. For the best epoch, epoch of 600 has been selected as it represents the highest test percentage that is 87.696%. The summary of the NN parameters to classify the QFD for machine planning datasets individual entry is listed as below:
TABLE 8: NN PARAMETERS Parameter Value
Architecture Multilayer Perceptron Learning Algorithm Backpropagation Input Node 97 Hidden Node 2 Output Node 4 Learning Rate 0.1 Momentum Rate 0.3 Activation Function Sigmoid Number of Epoch 600
Average Value Similar experiments have been conducted by averaging values of items for Type of Workpiece, Machine Standard Specification, Machine Control, Machine Safety, Machine Performance, Machine Maintenance and Machine after Sales Service. For brevity, the results are summarized in Table 9.
FIG. 9(A): CLASSIFICATION ACCURACIES FOR DIFFERENT NUMBER OF EPOCH
FIG. 9(B): AVERAGE CLASSIFICATION ACCURACIES FOR NETWORK TRAINED UP TO 600 AND 700 EPOCHS

1887
TABLE 9: NN MODEL FOR AVERAGE VALUE Parameter Value
Architecture Multilayer Perceptron Learning Algorithm Backpropagation Input Node 97 Hidden Node 4 Output Node 4 Learning Rate 0.2 Momentum Rate 0.2 Activation Function Sigmoid Number of Epoch 100
Hundreds of experiments have been conducted to establish a forecasting NN model in this study. For both models, the architecture of NN model can be expressed as 97-2/4-4 or 97 input nodes, 2 or 4 hidden nodes and 4 output nodes. Both models used sigmoid activation function, backpropagation learning algorithm with slightly different learning and momentum rates. To this end, the performances of both models are presented in Table 10. Based on the results, the datasets with individual value achieves higher percentage accuracy (87.696%) or lowest misclassification accuracy (12.304%). Therefore, NN model summarized in Table 10 is chosen to represent the QFD model based on voice of customer with architecture of 97-2-4.
TABLE 10: NN MISCLASSIFICATION ERROR
Conclusion There are few reasons why we need to build QFD forecasting model and identification of relationship between type of customer and QFD:
� QFD forecasting model is to help the manufacturer to find the best machine specifications. � QFD forecasting model gives the customer to give a response on a product/service with no limit in
computerized form. � Help the designer to concentrate much more on identifying customer satisfaction towards the design
specification of the product. The data gathering from customers will be easier to understand and analyze. The findings presented in this paper may benefit all purpose of measurement related to customer
satisfaction and needs. The future application may be applied into new product development, product liability, ISO9000 series, process assurance, services, part suppliers, material and processing equipment manufacturers, reliability and technology deployment. In summary, the findings from the experiments conducted indicate that the significant correlations with customer voices are summarized in Table 11.
Multi-Layer Perceptron (MLP) (Individual Value)
Multi-Layer Perceptron (MLP) (Average Value)
12.304% 12.379%

1888
TABLE 11: CORRELATION SUMMARY
Section Significance item Significant
values Spearman’s rho
Correlation Type of workpiece material used Wood p = 0.000 r = 0.776 Machine Standard Specification Heavy Duty Operation Type P = 0.001 r = 0.208 Machine Control Manual Control System P = 0.000 r = 0.332 Machine Safety Foot Brake Switch P = 0.000 r = 0.235 Machine Performance Utilize Small Amount Of Resin P = 0.000 r = 0.289 Machine Maintenance Easy Lubrication Point P = 0.011 r = -0.154 Machine After Sales Service Availability of Spare Parts P = 0.027 r = -0.129
These correlations help to explain the relationship between attributes used in the study. To complete the
study, NN forecasting model has been established with 12.304% misclassification accuracy in determining the customer voices based on QFD. The study indicates that the approach has some potential in providing some information regarding the relationship between QFD and the customers, as well as predicting the type of customer if QFD information is provided. Hence, the study reveals the type of machine and type of operation that are favourable to customer prior to acquiring the machines for their industrial usage.
References [1] A.R. Abd. Rahman and N.B Abdul Rahim (2003). Application of Quality Function Deployment for
pultrusion machine planning. Journal of Industrial Management and Data System, Vol.103, pp.373-387. [2] Benardos, P.G. and Vosniakos, G.C. (2002). Prediction of surface roughness in CNC face milling using
neural networks and Taguchi’s design of experiments. Robotics and Computer Integrated Manufacturing, Vol 6, pp.81-101.
[3] Cook, D.F., Ragsdale, C.T. and Major, R.L.(2000). Combining a neural network with a genetic algorithm for process parameter optimization. Engineering Application of Artificial Intelligence, Vol 13, pp.391-6.
[4] Edwards, P.J., Murray, A.F.,Papadopoulos, G., Wallace, A.R., Barnard, J. and Smith,G.(1999). The application of neural networks to the paper making industry, IEEE Transaction on Neural Networks, Vol 10, pp. 1456-64.
[5] Guh, R.; Tannock,J.(1999). A neural network approach to characteristic pattern parameters in process control charts. Journal of Intelligent Manufacturing, Vol 10, pp.449-462.
[6] Heider, D., Piovoso, M.J. and Gillespie, John W.Jr (2002). Application of a neural network to improve an automated thermoplastic tow-placement process, Journal of Process Control, Vol 12, pp.101-11.
[7] Hertz, J., A.Krogh, and R.G.Palmer. (1991). Introduction to the theory of neural computation. Addison-Wesley, New York.
[8] Hsieh, K.L. and Tong, L.I (2001). Optimization of multiple quality responses involving qualitative characteristics in IC manufacturing using neural networks. Computer in Industry, Vol 46, pp.1-12.
[9] Jimenez-Marquez, S.A.,Lacroix,C.& Thibault,J.(2003). Impact of modelling parameters on the prediction of cheese moisture using neural networks. Journal of Computers and Chemical Engineering, Vol 27, pp.631-46.
[10] Ko, D.C., Kim, D.H. and Kim, B.M. (1999). Application of artificial neural network and Taguchi method to perform design in metal forming considering workability. International Journal of Machine Tools & Manufacture, Vol 39, pp.771-85.
[11] Nascimento, C.A.O., Giudici, R. and Guardani, R. (2000). Neural network based approach for optimization of industrial chemical processes. Computers and Chemical Engineering, Vol 24, pp. 2303-14.

1889
[12] Raj, K.H., Sharma, R.S., Srivastava, S. and Patvardhan, C.(2000). Modeling of manufacturing processes with ANNs for intelligent manufacturing. International Journal of Machine Tools & Manufacture, Vol 40, pp. 851-68.
[13] San Myint. (2003). A framework of an intelligent quality function deployment (IQFD) for discrete assembly environment. Journal of Computers and Industrial Engineering, Vol 45, pp. 269-283.
[14] Vivianne Bouchereau and Hefin Rowlands (2000). Methods and techniques to help quality function deployment (QFD) benchmarking. An International Journal, Vol 7, pp. 8-19.
[15] Wikipedia, (2006). Quality Function Deployment. April, 2006, from: http://en.wikipedia.org/wiki/Quality_function_deployment Contact authors for the full list of references

1890
Evolution of Network Governance: Control & Coordination in a Network Context
Emanuela Todeva, [email protected] University of Surrey, UK
Abstract This paper builds upon the work on comparative governance systems (Todeva, 2005), and on the development of business network theory (Todeva, 2006, 2007). Business networks are dynamic agglomerations of interconnected firms, where there is an overlap between contractual relationships, inter-firm resource flows, and joint and collaborative activities. For our analysis we suggest that network governance is a system / mechanism for allocation of resources, control and co-ordination of economic activities at network level. On these grounds this paper attempts to address the questions of the governance of interconnected and interdependent firms using collaborative relationships. We compare the institutional arrangements for the governance of the Japanese Keiretsu and Sogo-Shosha business networks. The main conclusions from this analysis relate to the efficiencies generated by an institutional and relational environment that supports sharing of risks and information, and the alignment of interests via optimisation of benefits across the network. Introduction Most of the discussions on corporate governance have been dominated by the scholarship research that focuses attention on the Anglo-American corporate system based on publicly traded assets, distributed ownership, separation of ownership from control at corporate level, and the distribution of rents among investors and other residual claimants. The economic and strategic management literature that engages with these issues has argued for the supremacy of the Anglo-American model of corporate governance over the ‘welfare capitalism’ (Germany, Japan). The theorising has built upon an efficiency argument that lead to a believe that financing and control of corporate activities is best undertaken within the institutional environment associated with the stock market, and that the wealth creation for shareholders and stakeholders is maximised under the conditions of ‘perfect’ markets and competitive relations. The fundamental market imperfection is treated as an illness of the system that can be remedied with various regulatory efforts by the state.
The discussion under this leading stream in corporate governance theory has been dominated by concerns with the effectiveness of the boards of directors that represent shareholders’ interests and exercise a monitoring and control function against the opportunistic behaviour of managers. The future development of the shareholder system has been sought mainly through alignment of the interests between managers and shareholders and through improvement of the information asymmetry between them. The present crisis of the system is attributed mainly to weak boards and lack of independency of the outside directors in order to exercise their governing role (Gupta, 2002). The remedy of the system is sought to be enhanced by more active regulatory intervention on behalf of government and regulators, by stock market self-regulation, and by positive action of the corporations themselves to enhance transparency and to re-build the trust with their stakeholders.
This discussion ignores the fact that the modern corporation in its present form is a business network of interconnected and interdependent units, embedded in different business systems scattered throughout the world. The multinational enterprise (MNE) that controls assets in multiple markets is tied in contractual relationships with multiple host-governments and local suppliers, customers and institutions beyond the reach of its home governance structure. The adversarial and competitive relationships in one market are not replicated in another, where different context of the competitive environment applies. Hence, the corporate governance mechanisms put in place to control strategic management decisions in the home environment may be no longer binding the strategic choices of remote units in host countries.
The interdependence between strategic business units and alliance partners is fundamentally underpinned by technological linkages, value-added chains, resource dependencies, and numerous other ties that induce strategic

1891
choices that are more aligned to the conditions in these interdependent environments, rather then to efficiency considerations. The strategic choices and strategic decisions (and their implementation), that are ultimately responsible for the value-creation and wealth creation by multinational enterprises (MNEs), are framed by resource and operational interdependencies, and by their embeddedness in the institutional and the relational environment surrounding each autonomous business unit.
This paper attempts to go beyond the efficiency argument in relation to different corporate governance systems. We do not want to argue for supremacy of one mechanism over another. We take a holistic approach to the corporate governance mechanism, as a set of institutional arrangements (mechanisms, tools and practices) that have evolved to facilitate the allocation of resources for corporate activities. We base our analysis on the definition of corporate governance as a system / mechanism for allocation of capital and corporate resources, for co-ordination and control of economic activities at firm level that facilitates: strategic direction, accountability, transparency, wealth creation (Todeva, 2005). We also distinguish that modern MNEs represent complex business networks, and their governance can no longer refer to them in singularity. Network governance builds upon everything we know about corporate governance, but recognises that any governance mechanism applicable to a modern MNE is conditioned by multiple institutional and relational environments. Its effectiveness depends heavily on the structure of the corporation and on the actor’s attributes, or these resources and capabilities that are employed in the value-creation process, including their development and growth through learning and knowledge sharing.
Our in-depth analysis of the governance systems and practices in two cases – the Japanese keiretsu networks and sogo-shosha networks - aims to demonstrate the challenges that corporate governance theory is facing. The governance mechanisms employed in these cases promote the argument that collaborative inter-firm relationships are effective tools for information sharing, for risk and resource sharing, for learning and development of intra-corporate capabilities, and for effective management under the conditions of uncertainty and rapid change. Determinants of Network Governance The efficiency arguments that derive from the neo-classical economic theory commence with the assumption that shareholders are these entrepreneurs that invest their capital in efficient manner, and managers are another type of entrepreneurs, that take risk and make strategic decisions by which they achieve the ultimate corporate objectives for enhanced performance and profitability. The evidence however, of the source of efficiency in this scenario is very inconclusive. In addition to managers and shareholders, there are numerous other stakeholders that have direct impact on the value creation process and the subsequent corporate performance. These are employees (implementing the strategic decisions), middle managers (coordinating operations and activities in efficient manner), suppliers and clients (directly affecting the value creation and the value-realisation processes).
Wealth creation for shareholders and stakeholders is also a derivative of the overall environmental conditions that the corporation is facing on a global scale. Performance is affected not only by the strategic decisions and the mechanisms of financing and control, i.e. a particular corporate governance system, but also by the market conditions and location advantages in international business operations of the MNCs. The performance of each business unit is dependent on the local input and output markets. The overall corporate performance depends on the cumulative effects of both – the global market trends and the local market conditions.
Hence, both firm performance and wealth creation are hugely dependent on the intra-firm and inter-firm structures and relationships that facilitate decision-making and decision implementation, and the overall coordination of activities. They are simultaneously a function of governance, strategic decision making, environmental context, and internal resources and capabilities (Fig. 1). Corporate performance is also directly affected by environmental factors such as institutional and relational embeddedness.
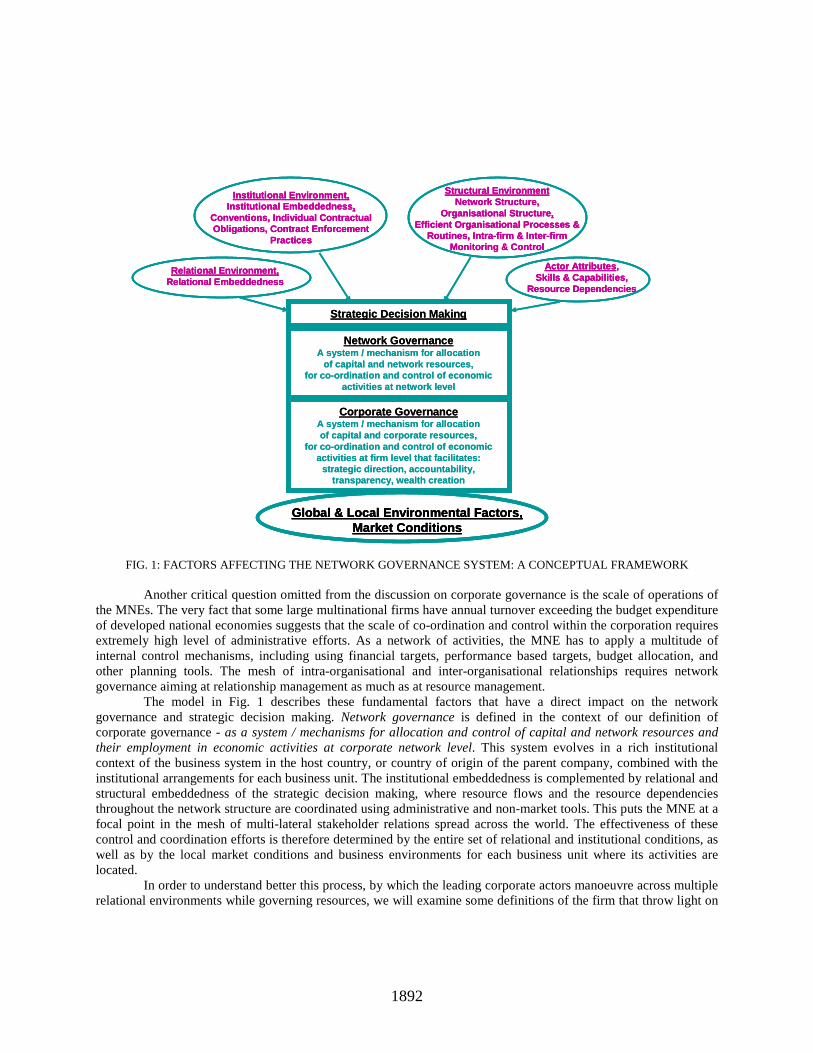
1892
FIG. 1: FACTORS AFFECTING THE NETWORK GOVERNANCE SYSTEM: A CONCEPTUAL FRAMEWORK
Another critical question omitted from the discussion on corporate governance is the scale of operations of the MNEs. The very fact that some large multinational firms have annual turnover exceeding the budget expenditure of developed national economies suggests that the scale of co-ordination and control within the corporation requires extremely high level of administrative efforts. As a network of activities, the MNE has to apply a multitude of internal control mechanisms, including using financial targets, performance based targets, budget allocation, and other planning tools. The mesh of intra-organisational and inter-organisational relationships requires network governance aiming at relationship management as much as at resource management.
The model in Fig. 1 describes these fundamental factors that have a direct impact on the network governance and strategic decision making. Network governance is defined in the context of our definition of corporate governance - as a system / mechanisms for allocation and control of capital and network resources and their employment in economic activities at corporate network level. This system evolves in a rich institutional context of the business system in the host country, or country of origin of the parent company, combined with the institutional arrangements for each business unit. The institutional embeddedness is complemented by relational and structural embeddedness of the strategic decision making, where resource flows and the resource dependencies throughout the network structure are coordinated using administrative and non-market tools. This puts the MNE at a focal point in the mesh of multi-lateral stakeholder relations spread across the world. The effectiveness of these control and coordination efforts is therefore determined by the entire set of relational and institutional conditions, as well as by the local market conditions and business environments for each business unit where its activities are located.
In order to understand better this process, by which the leading corporate actors manoeuvre across multiple relational environments while governing resources, we will examine some definitions of the firm that throw light on
Corporate GovernanceA system / mechanism for allocation of capital and corporate resources,
for co-ordination and control of economic activities at firm level that facilitates:
strategic direction, accountability,transparency, wealth creation
Relational Environment,Relational Embeddedness
Structural EnvironmentNetwork Structure,
Organisational Structure,Efficient Organisational Processes &
Routines, Intra-firm & Inter-firmMonitoring & Control
Institutional Environment,Institutional Embeddedness,
Conventions, Individual Contractual Obligations, Contract Enforcement
Practices
Network GovernanceA system / mechanism for allocation
of capital and network resources, for co-ordination and control of economic
activities at network level
Strategic Decision Making
Actor Attributes , Skills & Capabilities,
Resource Dependencies
Global & Local Environmental Factors,Market Conditions
Corporate GovernanceA system / mechanism for allocation of capital and corporate resources,
for co-ordination and control of economic activities at firm level that facilitates:
strategic direction, accountability,transparency, wealth creation
Relational Environment,Relational EmbeddednessRelational Environment,
Relational Embeddedness
Structural EnvironmentNetwork Structure,
Organisational Structure,Efficient Organisational Processes &
Routines, Intra-firm & Inter-firmMonitoring & Control
Structural EnvironmentNetwork Structure,
Organisational Structure,Efficient Organisational Processes &
Routines, Intra-firm & Inter-firmMonitoring & Control
Institutional Environment,Institutional Embeddedness,
Conventions, Individual Contractual Obligations, Contract Enforcement
Practices
Institutional Environment,Institutional Embeddedness,
Conventions, Individual Contractual Obligations, Contract Enforcement
Practices
Network GovernanceA system / mechanism for allocation
of capital and network resources, for co-ordination and control of economic
activities at network level
Strategic Decision Making
Actor Attributes , Skills & Capabilities,
Resource Dependencies
Actor Attributes , Skills & Capabilities,
Resource Dependencies
Global & Local Environmental Factors,Market Conditions
Global & Local Environmental Factors,Market Conditions

1893
the nature of the corporate activity. Then we will look at the internal environment of the MNEs, its structure, competence base and resource dependencies. Ultimately, strategic decisions are framed both by the internal and the external environment, including institutional and relational context.
In Willianson’s view of the firm (1975, 1988, 1991), it is the organizational structure that economises on transaction costs, rather then the governance structure. The governance structure has evolved merely as a substitute to compensate for the inefficiencies that emerge from the separation between the ownership and control.
Different theories refer to different definitions of the firm. Whitley (1993) defines firms as centres of economic power that combine allocative decision making with authoritative coordination of economic activities and as such they add value to human and material resources through collective organisation of work. Firms are seen as dominant units of strategic decision making and planned coordination that combine differentiated skills, capabilities and knowledge, and embody a collective organisation which transforms human and material resources into productive services. Intra-firm networks represent even more complex structure of layers and modules of differentiation that require coordination.
Mark Casson (1998) gives another definition of the firm – as an institution that specialises in coordination of business functions using a single locus of responsibility as a legal entity, and a structure designed to harmonise the decision making efforts of a group of people. Business networks on the contrary represent a system of multiple focal areas of responsibilities where the power and influence of the headquarters are challenged by localised institutional arrangements. There are many descriptions of complex inter- and intra-organisational agglomerations and many classifications of organisational structures that attempt to synthesise this knowledge (see Todeva, 2006). The most important aspects of these classifications are that there is an evolution of organisational forms from more simple to more complex systems, where the relationships between the constituent parts represent different configurations – from modular and nested structures, to dispersed formations utilising both strong and weak links to interact between each other. Each type of structure accommodates different forms of power and different monitoring and control mechanisms. Structures are responsible for the effective contract enforcement within each organisation and between organisations within the network.
The M-form or multi-divisional form of organising that is associated with multinational corporations was invented in the context of the General Motors corporation in the US to encompass: central control and ownership; vertical integration of the production; formal internal coordination through vertical and horizontal linkages; corporate head office function and specialized staff concentrated in departments and sub-units. The M-form of structure represents an evolution and adaptation of organisational hierarchy under the conditions of complexity and uncertainty of operations. The M-form of structure enables the internationalisation of the firm and the emergence of the trans-national corporate network with centralised governance and modular type of coordination of activities.
The M-form is challenged mainly by the hybrid or network type of organisation, based on intra- and inter-organisational relationships partnerships and strategic alliances that generate a complex system of interdependent business activities. The main principles in hybrid network organisations and heterarchies described by Hedlund (1986) are the following:
- co-ordination is through lateral referrals and lateral decision process and integrating mechanisms; - key skills are dispersed through the network; - communication and co-ordination is based on shared values and normative integration; - co-ordination and control is based on dynamic strategy-structure adjustments in response to changes in
performance and changes in the environment; and - balance is sought between horizontal and vertical integration using simultaneously output based and
behaviour based control. While the economic theories of the firm look at the firm as a black box, as a unit processing inputs into
outputs, the behavioural theory of the firm (BTF) looks at what happens inside the firm, how the throughput takes place as economic activity, and how decisions are made regarding production, scheduling, and inventory. In its essence BTF can be described also as a network theory of the firm, where decisions are interpreted as a sequential process which includes both rational and non-rational aspects, relationships and resource dependencies. All these new theoretical work on organisations indicates that the modern corporation is no longer characterised by pre-specified and stable relationships, instrumentality of goals, additivity of parts, uni-directionality of command,

1894
universality of communication flow, and synergy in activities. The network type of organisation resembles dynamic relationships, continuously re-negotiated goals, dispersed control and multi-directional flow of communications and resources.
The board of directors of such business network can not bring value added to the corporation, unless it takes direct responsibilities over strategic decision making and implementation. Its monitoring and control function may not enhance corporate performance directly, or add value. Sanctioning managers for opportunistic behaviour is not a value adding activity by itself, but a final resort when crisis is imminent. The true value-adding activities derive from the co-ordinated actions of managers, workers, investors, suppliers and customers among other stakeholders. The empirical research by Pettigrew and McNulty (1995) also shows that the power of outside directors to exercise a positive effect on the corporation is affected by a multitude of factors such as: personal capabilities and legitimacy; the need to maintain a positive attitude in this collaborative settings; political will and interpersonal skills in building Board coalitions; the need to subscribe to norms and expectations that derive from the role of outside director; the learning time required to grasp the complexity of the corporation; the interpersonal dynamics that emerge as an outcome of the selection of board members. The effectiveness of the Board as a monitoring and control devise (or institution) has been questioned with this research.
Another critical factor that frames strategic decision making and implementation at corporate level is the institutional environment. Although almost all market economies have attempted to establish stock market institutions and governance relations of the Anglo-American type, it is clear that there are significant differences both at the level of institutional requirements, incentives and constraints, and at the level of coordination and control practices. These variations derive from the evolution of a large number of relationships that bond economic actors in a network system, and that provide framework and context to all resource-allocation decisions. The evolution of these relationships establishes a framework of enactment of ownership rights, control functions, and their coordination across the entire relational system. Fligstein and Freeland (1995) describe this relational system as tensions between: 1) the control relationship between management and workers, 2) relationship between management and shareholders; 3) division of labour and the subsequent division of power and responsibilities within the corporation or intra-corporate intra-management relationships, 4) relationship with investors and capital markets, 5) relationships with suppliers, 6) relationships with competitors, 7) relationships with the state, with governments and other public institutions.
If we look at the corporate governance as a mechanism for allocation of resources in the economy and for creating value-added, then we need to consider all relations between economic agents that are critical in determining productivity and efficiency. The relations between shareholders and managers (ownership and control) no doubt are fundamental to financing corporate growth. Relationships with shareholders and investment fund managers are also important as they need to have trust in the working of capital markets and the market for corporate control in order to make their funds available. Managers and workers and all other actors involved intra-management and intra-corporate relations need to have consent over the operations and the strategic directions of the firm in order to expropriate the invested capital in the most efficient way. Relations with suppliers are critical to achieve superior quality and to increase competitive advantage. Relations with government are critical for the legitimacy of the corporate activities and therefore affecting relations with all other stakeholders. Even relations with competitors are important for determining industry standards and as a form of self-regulation, avoiding costly and deadly collisions in the market place, and co-ordination of the direction of technology, product and process innovation.
Managing each of these relationships employs parallel political processes of negotiations and influence. Independent political processes take place simultaneously inside the corporation (affecting decision making and decision implementation), inside the Boardroom (affecting the function of the independent directors and the entire Board as an institution), and inside investment funds (affecting investors’ attitudes and the certainty of capital supply). Clearly political processes affect not only the allocation of capital to productive assets, but also the efficient expropriation of this capital for wealth creation.
These political processes take place in a specific institutional environment that produces stable behavioural patterns and expectations that reduce monitoring and control costs. Among the elements of the institutional environment that shape behaviour and strategic choices are: contracts, rules, procedures, practices, roles, positions, norms, expectations, constraints and incentives, or the normative framework that governs behaviour and

1895
interactions. These concepts represent different mechanisms whereby a particular normative element exercises pressure on actors, and as such, it frames their motives for action, their choices of partners, and their patterns of interactions with these partners.
Although each of the concepts describing the normative framework invites multiple definitions and interpretations, there is a fundamental understanding that contracts usually specify incentives and constraints in the form of responsibilities, liabilities and rights for each actor. Contracts are explicit agreements that are formulated in texts and legal documents. Rules and procedures are also explicit statements governing practice as they indicate required behaviour. They are employed in hierarchical structures, but can be incorporated in any relational settings which are governed by authority, or by contracts and agreements. Contracts, rules, and procedures represent the formal side of the institutional framework, including expected behaviour, where monitoring and control of this behaviour are possible.
The interactions between network actors start with some agreements and repeat over time for the duration of the agreement. Repetitive agreements lead to the emergence of conventions that are observed as business practices. Some agreements are sealed by formal contracts, while others are acknowledged as informal and implicit commitments that translate into action. Practices represent accepted or legitimate behaviour motivated by the implicit commitments that each actor undertake. Practices are established in the context of a set of constraints and incentives and implicit or negotiated rules and procedures, and they generate mutual expectations.
The diffusion of certain practices and interactions in a network is uneven process, where actors play different roles. Roles are simultaneously assigned from one actor to another, and/or voluntarily adopted by each actor. Roles in business networks are ascribed to individual actors by the headquarters and by the set of network relationships in which individual actors are embedded. Negotiations of roles between actors represent informal agreements between them. Role performance and role enactment are the internalisation of these agreements.
Interaction and transaction patterns over time crystallise at differentiation of positions, where different actors occupy different positions according to their involvement in the transaction path, or the value chain of activities. Roles and positions induce status for individual actors, which represent another institutional mechanism that governs behaviour and generate expectations.
Although positions are specific actor’s attributes and network characteristics, a position is changing by the activities of the actors. Both roles and positions are communicated across the network and give signals to the other network members regarding the potential for a relationship. Positions and roles are accepted by other interacting parties and hence are elements of the normative framework that governs all interactions and behaviour.
Norms are cultural artefacts that emerge on the basis of shared values, beliefs, and expectations within cohesive groups of actors. Norms are elements of the corporate culture which are known to impose constraints on actors that have internalised specific values.
Constraints can be interpreted both in terms of physical or technical boundaries, and in terms of institutional prescriptions. The awareness and acceptance of these boundaries and limitations suggests to actors particular choices and decisions, or a particular course of action. While constraints regulate behaviour and activities of network members, incentives generate new motives for action. Incentives are classified as internal and external to the network. The Japanese Keiretsu and Sogo-Shosha Corporate Networks The aim further in this paper is to compare two Japanese cases of governance of corporate networks – the Keiretsu governance and the Sogo-sosha governance with the purpose to identify specific institutions and mechanisms within the welfare capitalism that facilitate economic growth and wealth creation. Japanese Zaibatsu /Kkeiretsu The history of the big business groups in Japan keiretsu starts with their pre-war establishment as family-controlled business networks called zaibatsu, or giant trading conglomerates that ran most of pre-World War II Japanese industry. The historical Japanese family business zaibatsu resembled a closed intra-family corporation, where family

1896
investors were not able to take back their own investments, and some family businesses remained undivided for more than 300 years (Numazaki, 2000).
As a form of business organisation, zaibatsu was controlled by a family council Shacho-kai, and the change of the number of partners took place only through family adoption, by marriage, or by birth and death. The inheritance law in Japan, is perhaps one of the most significant factors historically that led to the consolidation of the family power in Japan and Korea, compared with its relative fragmentation in other countries in the region.
The zaibatsu institution combined the wealth of rich merchant families, the organizing capabilities of warriors, and the expertise of university graduates in order to create large-scale family controlled conglomerates. Zaibatsu represented also a corporate network and was an organisational form, that emerged in response to market failures at the time of Japan's early industrialization after the Meiji Restoration in 1868 (Hirschmeier and Yui, 1981, Imai and Itami, 1984, Lynn and Rao, 1995). The market failure at that time is described as the inability of capital markets to allocate efficiently resources to entrepreneurs because of the lack of an infrastructure to mobilize savings and to facilitate risk assessment for investment in new business ventures, especially, in industries such as mining, steel and shipbuilding (Lynn and Rao, 1995). Jacoby (2000) also puts forward the arguments that Japan, like Germany, France and other European countries experienced the pressures of late industrialisation catch-up, and the state played an active role to mobilise national resources in order to level up with already industrialised Britain. The relational governance system allowed the Japanese government to protect infant industries and to allow them to grow. Although with the development of Tokyo stock market an alternative mechanism of financing investment and growth was established, the old tradition prevail until the most recent consolidation across the financial sector in Japan.
The new enterprise system in the 20th century comprised of narrowly focused and inter-linked factories, effective at transferring new technologies between the Western economies and the Japanese economy (Imai, 1992), and possessing 'permeable boundaries' that enabled them to gain economies of scope (Fruin, 1992). Part of the system were the zaibatsu in-house 'organ banks', insurance and trust companies, that enabled the zaibatsu to overcome the weakness of the Japanese stock exchanges, and to mobilize and channel financial resources to entrepreneurial ventures (Lockwood 1954). The retained profits were allocated to new ventures through internal finance and budgeting systems, which facilitated endogenous growth.
On the one hand, the zaibatsu controlled constituent units through stock held by the holding company, through centralized purchasing and sales functions, and through despatching directors to manage subsidiary units. The holding company exerted authority over the constituent units to reconcile incongruent goals and aspirations. On the other hand, the zaibatsu were market-like organizations to the extent that constituent units behaved independently and competed for resources, and some of them acted as entrepreneurial organizers of economic activity (Gerlach, 1992a, Lynn and Rao, 1995).
In the post-War period, serious attempts to dismantle the Japanese holding companies were made by General MacArthur and the occupation forces in 1946. Subsequently, encouraged by government industrial policies, the reunification of formerly connected businesses through cross-shareholding and mutual business dealings under the name of keiretsu took place. Many of the zaibatsu practices, traditions, and network formations were resurrected under the new governance form.
• Institution-centred 2-tier governance system • Multi-level boundaries of corporate units with interlocking ties • Resource & capabilities-based division of labour • Managing through co-ordinating interdependence

1897
FIG. 2: JAPANESE KEIRETSU BUSINESS NETWORKS
The present Keiretsu networks comprise of close, long-term business relationships established by large corporations with selected groups of smaller firms, financial and trading institutions. They represent a web of overlapping financial, commercial, and governance relationships, initiated from a central core to pull-in large segments of the Japanese economy (Gerlach, 1992a, 1992b). Present Japanese inter-corporate keiretsu relationships are considered in terms of three different structural conditions to facilitate interactions: corporate groups, with financial centrality, and industrial interdependency through value chain activities. These corporate groups are not conglomerates as the holding companies are illegal under Japan's post-war commercial law. The companies are independent and publicly traded. However, they are linked through cross-shareholding investment and the exchange of personnel, through shared debt and equity, and mutual strategic plans. The strategic leadership resides within the presidents' club Shacho-kai, where implicit rules and shared understandings in unstated "gentlemen's agreements" lead to co-ordination and general co-operation for mutual benefit (Futatsugi, 1986, Kester, 1991, Gerlach 1992b, Shimotani, 1995, Tezuka, 1997).
Shacho-kai as an institution represents the interests of the inner circle of the keiretsu as a clique of firms whose reciprocal commitments stem from long association and strong collective identity (Lincoln, et.al., 1996). This association of the presidents holds monthly meetings to discuss group strategy. It supports group solidarity, mediates intra-group activities, and settles intra-group disagreements. Keiretsu members can thus develop plans based on activities that other keiretsu members are pursuing. Although it appears that Shacho-kai facilitates insider trading and may be called ineffective allocation of resources, it does provide an efficient platform for managing intra and inter-corporate relationships, which is a major contributor to wealth creation within the corporate group.
Numerous firms lacking shacho-kai seats are also tied to the group through their financial and commercial ties, and through various forms of monitoring and governance practices. For example, middle managers of keiretsu firms meet monthly to discuss operations and to co-ordinate corporate activities. This is another effective
Shacho-kai
First tier suppliers
Second tier suppliers
GROUPBANK

1898
mechanism for intra-group knowledge management that facilitates learning and innovation within the group, as well as sharing skills, capabilities, best practices on a wider scale.
Other direct linkages within the keiretsu are represented by the stable corporate cross-shareholdings, by dispatch of managers to insider director positions, and by director interlocking as control relations that are superimposed on the network of business dealings (Lincoln et.al., 1996). All these mechanisms lead to alignment of interests among managers within the group and strengthening of the governance framework. In addition, these co-operative relations bring intrinsic value to the corporate network as they smoothen the internal negotiations between agents, and member firms. These relationships also facilitate co-ordination for innovation, development, and growth.
Regarding the cross-shareholding within keiretsu networks, share ownership is a symbol of commitment and mutual obligation, rather than motivated by expectations of dividends and returns on investment (Tezuka, 1997). A typical keiretsu core company will have 20% to 40% of its stock owned by other companies within the keiretsu. Long-term shareholding agreements with other corporations create a situation whereby 60% to 80% of the keiretsu stock is never traded (Industry Week, 1992). As the stock market is not the main source of financing for the corporate group, this limited trading of shares of large Japanese multinational groups is not necessarily a detriment, but could be interpreted as a spare and underutilised mechanism that can be employed in cases of financial difficulties.
In addition to these direct forms of relational governance, there are a number of other indirect ties that bond the commercial and investment activities within the keiretsu, such as: (1) the selection of keiretsu trading partners, (2) the amount of borrowing from group banks, (3) the extent of shareholding by group banks and corporations, (4) the selection of board members from the management of big leading firms (Lincoln, et.al., 1996). These represent specific governance mechanisms that enhance international operations, generating both internal and external synergies.
Overall financial and commercial dependencies exist both ways: on the group banks for borrowed capital, and on the group manufacturers and trading firms as buyers and sellers of products and services. However, the ‘relational-insider’ governance system appears to be better equipped to manage interdependencies, as it has established institutions, mechanisms and platforms for negotiations, information sharing and enhanced intra-corporate learning.
There are numerous classifications of Japanese keiretsu, emphasizing on specific aspects of the network formation – vertical, horizontal, supplier-based, bank-centred. Overall there is an overlap between different categories, and most features are observed in each of the keiretsu. A supplier keiretsu is a vertical group of companies, centred along a major manufacturer, such as Sony, Honda, and Matsushita, which run multi-tier supplier networks. As an example of this form of business organisation Toyota has more than 60 percent of its parts and subsystems supplied by external contractors – tied in long-term contract relations, and Canon is outsourcing nearly 90 percent of the value added components in its copiers to related companies (Industry Week, 1992). The vertical keiretsu represents formation that is highly vertically integrated along the value chain. It is held together by a complex mix of inter-linked people, financial resources, information flow, parts and product exchanges, and joint technology development agreements. Toyota has established a first-tier suppliers' group, the Kyoukoukai (176 companies); Nissan has its Takarakai (104 companies). Members of the vertical keiretsu have had little choice but to accept this combination of co-operation and competition. Vertical keiretsu is a way to create competitive teams of inter-linked suppliers, engaged in product and process development (Tezuka, 1997, Kim and Limpaphayom, 1998). This governance form delivers both cost efficiencies (within the supply network) and enhanced productivity from co-ordination of business activities, technologies and practices.
Ownership is only a part of this linkage: most lead firms have minority shares in their suppliers. The lead firm encourages the second or third supplier to match the first supplier's cost and quality, often passing along important technical and process information on the first supplier's operations – a clear example of sharing competences and capabilities between competitors, which creates added value to the group.
The lead firm tries to avoid monopoly power in its network, thus stimulating all suppliers to be more efficient and price competitive. Suppliers in the same keiretsu group co-operate in projects, and yet compete with each other and with outside suppliers to excel in quality, delivery, reliability, and cost performance (Tezuka, 1997).

1899
This dynamic is an evidence of the positive effect of managed expectations that creates collaboration among competitors, and can be attributed clearly to the ‘relational-insider’ governance system.
The bank-centred keiretsu are larger than the supplier-only keiretsu and include those headed by the four largest pre-war industrial groups or zaibatsu (Mitsui, Mitsubishi, Sumitomo, and Fuyo) and the two major bank-centred groups, Dai-Ichi Kangyo Group and Sanwa Group. They are also called Mutual Insurance Systems (Tezuka, 1997). Their member companies come from a variety of industries, and they seek to integrate not only vertically, but also horizontally. Although there is a deep restructuring of these keiretsu groups triggered by the consolidation of the financial sector in Japan and the most recent merger of their group-banks, the literature has described sufficient details of their governance system at the pre-consolidation stage.
Financial or horizontal keiretsu represent a two-tier corporate governance system, where corporations are linked together through an extensive network of corporate cross-shareholdings, and corporate members have close ties to a main bank. The keiretsu bank not only provides member firms with debt financing, but also owns a substantial amount of each firm's equity (Kim and Limpaphayom, 1998).
In normal situations, usually the first stage of group governance intervention is in place, and corporate shareholders provide mutual monitoring through the linkages and institutions described above. When firms are performing well, keiretsu financial institutions do not restrain leverage levels, and keiretsu formations encourage cross-investment and collaboration among corporate members. Both corporate owners and managers take responsibilities for the higher leverage and for the expansion of trade credits and account receivables as a common source of short-term financing (Prowse, 1990, Kim and Limpaphayom, 1998). At this stage there is no significant relationship between ownership structure and financial leverage as banks approve and handle most transactions (Kim and Limpaphayom, 1998).
In situation of crises and reduced profitability the keiretsu network reacts with a second-stage governance intervention. The bank assumes control to reduce debt, and acts as an ultimate disciplinarian (Hoshi, et.al., 1990). Keiretsu banks can reduce financial leverage levels of their member firms in several ways: (1) allowing interest concessions, (2) providing equity infusions, and/or (3) writing off outstanding loans. Financial institutions act as both debt- and equity holders, and allow their member firms to carry more debt (Kim and Limpaphayom, 1998). The recent mergers of keiretsu banks are expected to have a positive impact towards increased financial discipline and reduced debt. This can reduce the banks’ bail-out powers, but it will not negate the other financial mechanisms that have been used in the past to assist group members in crisis situations.
Shacho-kai membership ties, as well as trade, debt, and equity ties are stable relations that increase the possibilities for assistance when a partner firm encounters difficulties. Member companies usually maintain or even increase their equity in the troubled firm. Directors are transferred from the main bank and major trading partners to the firm's board to assist in strategic and operational decisions. Network suppliers and customers adjust their contracts to favour the target firm and transfer technical personnel to its operating divisions. Network members may in addition mandate exclusive purchases from the target firm's product line until the crisis has passed (Lincoln, et.al., 1996). Enhanced financial discipline as a result of the banking consolidation is expected to raise the criteria for assistance, but it does not change fundamentally the governance system, and may have a limited impact on these practices of cash-flow assistance.
Keiretsu equalizes the fortunes of their members, smoothing inequality in financial returns across participating firms. Members are not able to maximise their benefits, i.e. extraction of profits and rents, but instead have been obliged to optimise output measures. Keiretsu networks are seen as clusters of large firms charging each other "efficient" prices (i.e., prices in line with their respective opportunity costs) while collectively extracting other market benefits through a collective action for maximizing the joint welfare of all member firms (Lincoln, et.al., 1996).
Keiretsu members face lower risk than independent companies in Japan, because the whole keiretsu group shares individual risks. Keiretsu companies obtain lower interest rates from both keiretsu banks and from other financial institutions, and tend to have higher debt ratios than either independent Japanese companies, or their U.S. counterparts (Tezuka, 1997).
Keiretsu groups also claim to be an effective organisational system of minimising transaction costs, and reaping efficiency gains by economizing on information and control through regularized communication and

1900
exchange (Williamson 1985). They avert the threat of over-organization by keeping their contractual arrangements implicit and their modes of monitoring and intervention informal and flexible (Lincoln, et.al., 1996). Keiretsu membership can be interpreted as a ‘hedge against future failure’ (Aoki 1988:280). The advantages of keiretsu governance system are: their flexibility, adaptability, facilitated information and knowledge exchange, access to a range of alternative sources of financial assistance, and collaborative attitude to problem solving. These are an asset to the Japanese keiretsu groups not only in their home market, but also in their international operations. By integrating the political process within the system, keiretsu governance offers a valuable mechanism in building relationships with host governments in international business ventures, and other partner firms in multinational alliances, or with their foreign subsidiaries. Japanese Trading Networks - Sogo Shosha Japanese trading companies Sogo Shosha emerged since the 17th century and have further evolved from providing services as middlemen to their clients and keiretsu members to diversifying in different business areas with higher risk. In building diversified business portfolios shosha have settled as hubs in large business networks, controlling complex flows of resources. At various times shosha have acted as commission agents, importing and exporting on behalf of clients; as dealers, trading in their own right; as middlemen in transactions between members of a keiretsu network; as financiers, lending money to smaller keiretsu members; as facilitators and intermediaries in negotiations with foreign partners; and more recently as investment-trust managers, venture capitalists, and business consultants (The Economist, 1995). This description suggests that shosha represent the ultimate entrepreneurs, transforming every business opportunity into a profitable venture, relying both on own financial resources and raising capital from the stock market.
FIG. 3: JAPANESE SOGO SHOSHA BUSINESS NETWORKS
• Intermediary-centred governance system utilising mixed ownership & connectivity role • Blurred ownership and control boundaries • Asset-based division of labour • Managing through controlled autonomy & controlled interdependence
Many shosha are relying on their expertise as oil traders, and are currently repositioning themselves from being traders to operators in infrastructure industries, such as electricity generation, telecommunications, television broadcasting, and even satellite communications. Their current metamorphosis means shedding their past ‘low- margin’ role as agents and petty financiers towards businesses with high profit margins. They often form alliances with foreign companies in preference to alternative keiretsu partners. Their networks of partners are much more multinational than traditional keiretsu.
As hubs in their own business networks shosha have always held large shareholdings in other companies. Some of their investments represent shares in keiretsu firms (The Economist, 1995), some holdings are in their own independent subsidiaries (the shosha have generally preferred to run their own subsidiaries as non- core activities). Now shosha exhibit the new role of Venture Merchants. Each of the leading shosha has between 10 and 20
Sogo Shoshatrading
company
Foreign partners
BANK
Keiretsunetwork
Firms

1901
subsidiaries that are eligible to be listed on the Tokyo stock market. Share trading appears to be an attractive business for shosha, and a powerful mechanism for the growth of their business network.
The main governance mechanisms of the shosha holding networks appear to be: flexibility in financing both through own capital and using financial instruments available at the stock market; close hub-and-spoke co-ordination of related as well as unrelated business operations; ‘employing’ trust relations through family linkages or other informal associations between managers of individual businesses; actively using stock market financial instruments not only for enhancing their return on capital (ROC), but also for reinvestment of this capital in productive assets and business operations, and the endogenous growth of their business portfolio.
Discussion of Cases and Conclusions Both cases of Keiretsu and Sogo Shosha resemble much more a holding formation, and offer two independent alternatives to the multidivisional form (M-form) of corporation with public limited liabilities and financed through trading on stock markets. Both cases demonstrate that the same socio-economic and institutional environment in Japan has nurtured two distinctive forms of governance, each of which offers different forms of bundling of ownership and control functions. Under the Keiretsu governance system there are two institutions engaged in monitoring and control, and both exercise ownership rights, and actively participate in strategic decision making and resource allocation. The Keiretsu Bank and the Presidents’ Association Shacho-kai are the main stock-holders that assume responsibilities and liabilities. Within the Keiretsu system they manage collectively the complex and multi-level network of corporate assets, utilising resource and capabilities based on division of labour, interlocking resource ties, optimisation strategies, and co-ordination of interdependencies.
The literature on Sogo Shosha does not give many details on the institutional arrangements of their governance system. However, from the scares descriptions of their operations we may induce that their governance system is centred in the trading firm, which utilises a mixed ownership and connectivity function, controlling and directing the trading operations of its subordinate assets. The trading firms itself have neither full ownership, nor full control of the independent firms under their sphere of influence. However, Shosha clearly generates value added by facilitating trading and operability of these firms. Its network incorporates asset-based division of labour which allows the centre trading firm to coordinate multi-level operations. Shosha’s relationships with its subordinate firms exhibit a mixed form of controlled autonomy and interdependence.
Clearly both cases demonstrate governance systems that generate economic efficiencies beyond the specialisation between owners and managers and the effective control over the managerial function. Re-bundling of ownership and control within the relational-insider system facilitates good reinvestment of capital into economic growth and creates a number of institutions that facilitate smooth negotiation of contract commitments and outcomes. The lack of transparency, attributed to this system may be associated with limited accountability, but it is also associated with effective intra-corporate information sharing, learning and innovation.
Regarding their international operations, their governance flexibility and adaptability are a strong advantage compared with the MNC that originate from the Anglo-American stock-market system. The MNCs subject to the strict regulatory environment of the stock-market capitalism have evolved as a multidivisional form (M-form) of incorporation of subsidiaries, where full ownership and control is the most desirable relationship from the perspective of the ‘parent’ company. The network formation diminishes the costs of hierarchical control and coordination, and creates a more fluid structure of interlinked assets. On this basis it can be claimed that the governance costs of networks are lower compared with the M-form of corporation. Flexibility in financing investment and growth strategies is another advantage of network governance. Network formations also allow for more adaptable approach to managing relationships with subsidiaries, which will be a particular advantage in international operations.
Among the evidence of convergence between the ‘stock-market governing system’ and the ‘relational-insider system’ are the changes that are taking place in Japan. These are: the large and liquid market for corporate equities, the governance reforms in the 90’s permitting a number of stock-market practices established in the US capital markets (such as equity swaps and stock purchases by corporations), and banks engaged in liquidating

1902
shareholdings (Jacoby, 2000). However, these changes are reported to be slow and superficial, as they do not lead to a radical transformation of the corporate governance system. Jacoby (2000) also reaches the conclusion that there are limits to convergence, and that a path which is locally efficient is not necessarily globally efficient.
There are mechanisms which act as complementarities and substitutes in different historical and institutional settings. For example the very high innovation rates in Japan are a result of big-company funding and corporate spin-offs, rather then venture capital like in the US (Jacoby, 2000).
If we consider that venture capital is one of the attributes of the stock-market capitalism then it is very difficult to explain that it has high profile in the US economy and its profile in the UK has diminished. This is evidence of divergence within rather then convergence across governance systems. Arguments about the superiority of one of the governance systems discussed above are difficult to sustain due to fundamental differences in the pace of economic growth. At the same time comparative research can identify specific governance mechanisms within each system that enhance efficient allocation of resources and effective control over the management of these resources.
Both Keiretsu and Sogo-Shosha resemble business networks coordinated from a centre that is not constrained by the division between major shareholders and executive managers. Shacho-kai is an institution developed to handle corporate responsibilities and strategic decision making. Shosha is a firm that is controlling both repetitive and market transactions, and is engaged directly and indirectly in operations management. Both cases exhibit a form of re-integration of the ownership and control function. How does this apply to MNCs and global business networks?
The MNCs have to handle and control multiple transactions in remote locations adopting a variety of co-ordination mechanisms – most of which have been invented for the purpose of effective administration and management of economic activities in organizations and institutions. The complexity of MNC operations requires a complex set of tools used by individual and collective agents – all engaged in a complex allocation of resources for operational and strategic purposes. In this context the discussion of the decision making power of the individual members of the Board of Directors, or the accountability of insider agents to outsider shareholders and stakeholders merely reaches the paradox that there are no boundaries to managerial opportunism, and enhanced control that assumes tentative opportunism, generates merely more sophisticated evasive manoeuvres from executives entrusted to handle operational risks.
Collaborative governance demonstrates an alternative way for re-alignment of interests of all economic actors, and shortens the cycle for reinvestment of capital into productivity and growth, compared with the portfolio investment mechanism within the stock-market governance system. It facilitates information sharing, learning and innovation that ultimately brings comparative advantage to an MNC,
Ownership rights do not produce automatically enhanced accountability or ethical behaviour. Both of these outcomes require institutional support from a social canvas that evolves historically and in a particular legal and socio-economic context. Governance mechanisms taken out of this context may not work and may not be applicable to other systems. In addition to that, systemic changes are always costly to implement, and require radical approach.
This comparative analysis of the governance mechanisms that have evolved under the ‘relational-insider’ governance system illuminates some of the advantages of an economic system that have facilitated rapid growth and rapid internationalisation particularly after the Second World War. The criticisms of the welfare governance have been usually raised from a narrow perspective.
Further research into the governance mechanisms behind Sogo-shosha is essential in order to explain the success of this form of business growth. The growing popularity of holding companies in the rapidly developing economies is evidence of the importance of this corporate form for growth and wealth creation. Most of the governance mechanisms discussed in the paper are subject to evolution, particularly under the influence of the on-going consolidation of the financial sector in Japan, and the changes in the regulatory environment. The existing research on Keiretsu governance will need updating in the context of the recent merger wave across Keiretsu group banks. Comparative and longitudinal analysis is expected to enlighten the debate not only on systemic changes in Japan, but also on global convergence, and the conceptual framework in this paper is an effort to present a systematic view on the factors that affect corporate governance outcomes.

1903
References
[1] Aoki, M. and Sheard, P. (1991) The Role of the Japanese Main Bank in the Economy. Cambridge:
Cambridge University Press. [2] Blair, M. (1995a) Corporate “Ownership”. Brookings Review, Winter 1995, 13/1: 16-20. [3] Blair, M. (1995b) Rethinking Assumptions Behind Corporate Governance. Challenge, Nov-Dec 1995: 12-
18. [4] Cadbury Code, The (1992) Report of the Committee on the financial Aspects of Corporate Governance:
The Code of Best Practice, Gee Professional Publishing, London. [5] Casson, M. (1998) Entrepreneurship and the Theory of The Firm, in Z. Acs, B. Carlsson (eds.)
Entrepreneurship, Small and Medium-Size Enterprises and the Macro-economy, Cambridge UP. [6] Castanias, R. and Helfat, C. (2001) The Managerial Rent Model: Theory and Empirical Analysis. Journal
of Management, Nov-Dec, 2001. [7] Chandler, A. (1962) Strategy and Structure: Chapters in the History of the American Industrial Enterprise,
Cambridge, MA: MIT Press. [8] Cyert, R. and March, J. (1963) The Behavioural Theory of the Firm. Englewood Cliffs, NJ: Prentice Hall. [9] Economist, The (1995) Sprightly Dinosaurs: Japan's Trading Companies. Feb 11, 1995, 334, 7901: 55-58. [10] Fligstein, N., Freeland, R. (1995) Theoretical and Comparative Perspectives on Corporate Organization,
Annual Review of Sociology, 21: 21-44. [11] Fruin, W. Mark. (1992) The Japanese Enterprise System. New York: Oxford University Press. [12] Futatsugi, Yusaku (1986) Japanese Enterprise Groups, Monograph No. 4. School of Business
Administration, Kobe University. [13] Gerlach, Michael (1992a) The Japanese Corporate Network: a Block-model Approach. Administrative
Science Quarterly 37: 105-139. [14] Gerlach, Michael (1992b) Alliance Capitalism: The Social Organization of Japanese Business. Berkeley,
CA: University of California Press. [15] Gupta, R. (2002) Gloom at the Top. McKinsey Quarterly, 4: 4-6.

1904
A Cross Country Study of Open Source Software (OSS), National Culture and Piracy
Timo Pykäläinen, [email protected] University of Joensuu, Finland
Tony Fang, [email protected] Stockholm University School of Business, Sweden
Abstract The purpose of this article is to examine if there exist relationships between international practices of open source software (OSS), piracy and national culture. A number of existing data bases are integrated for empirically test. The article shows that Hofstede’s national cultural dimensions have varying influences on international practice of OSS across cultures in high-income level countries. The findings of this research are useful for both business and R&D functions of open source software companies and commercial software vendors. Future research on the subject is discussed.
Introduction In recent years, open source software (OSS) has gained an increasing attention in industry and academia. OSS systems allow people to work together by making the source code open to everyone and Linux1 operating system is the best known example (Economist, 2004). Furthermore, OSS products can be downloaded, distributed and shared freely (Krishnamurthy, 2003) among OSS community members. These features do not characterize traditional proprietary software. Opposite to OSS, traditional software licenses prohibit open access and free knowledge sharing (Barton and Nissanka, 2001). OSS products are often developed by volunteers and often cost nothing to use (Economist, 2006). Regardless of OSS often being free, OSS has been developed into a huge business sector and about one third of servers in American firms run on Linux, for example (Lacy, 2006). OSS can bring significant savings to the corporate world and to society as well, IBM can save around $900 million per year by spending $100 million per year on Linux development (Tapscott and Williams, 2007).
Activeness of OSS community members towards on-line surveys is important as the development of OSS products is dependent very much on the activity of OSS users and developers. OSS developers may have less incentives and resources to advertise their products than proprietary software counterparts because the former do not get direct profit from the use of OSS products (Comino and Manenti, 2005). Therefore word-of-mouth is a crucial marketing practice for OSS (Krishnamurthy, 2003). For example, Linux users often proactively promote Linux to their personal networks. Mustonen (2003), however, argues that the OSS programmers do not adequately pay attention to whether the software is used outside the OSS community. Most importantly, according to Comino and Manenti (2005) the competition between commercial software and OSS happens only among the consumers who know about the existence of OSS.
As OSS distribution, development and marketing is dependent on the activity of users and developers themselves, often across national boundaries, it is important to look at the factors that could influence the international activity of OSS. This information could be used as a proxy to evaluate potential adoption rates across different countries and market potential for OSS in different national markets. Thus it is important to study the behavior of OSS community members towards international surveys concerning OSS. This can provide marketing professionals valuable information concerning the OSS markets in both practical and theoretical terms.
The purpose of this article is to study the impact of national cultural characteristics on activity of open source software (OSS) community members in on-line surveys concerning themselves. We intend to answer three research questions: (1) What economic and cultural variables would influence the activity of OSS member? (2) Does piracy affect the activity of OSS community members? and (3) What national culture characteristics would provide a breeding ground for OSS community members? The data used in this research is obtained from a number of publicized databases representing the activity of OSS community members in separate on-line surveys. We intend to

1905
integrate these databases to provide a broader platform to achieve the purpose of this study. The data consists high-income level countries (GNI per capita higher than USD $10066 in 2004).
In the rest of this article we first discuss OSS and the relationships of culture and intellectual property (IP) including piracy. Then we develop hypotheses concerning relationships between national culture, economic development, piracy, information and communication technology (ICT) infrastructure and education level on activity of OSS. This is followed by methodology, results, discussion, and conclusions. We conclude this article by discussing its limitations and suggesting future research.
OSS, Piracy, and National Culture OSS refers to software whose source code is available to everyone (Krishnamurthy, 2003) compared with commercial software companies that guard their software source code in order to be able to sell their products (Economist, 2004). In OSS there is no risk of being locked-in to a single vendor (Bruggink, 2003; Economist, 2003; Murphy, 2004) and OSS can provide flexibility and more choices (Brandl, 2004; Krishnamurthy, 2003). However, despite of its flexibility and availability, OSS comes with a license as well and it is copyrighted (Krishnamurthy, 2003).
The licensing terms of software defines what the user can and cannot do with the software. A good source for OSS license requirements is the Open Source Initiative (OSI). OSI (2007) gives general requirements and definition for OSS licenses and they list OSI approved OSS licenses on their web site. Some OSS licenses (such as GPL2) do not give the right to use the source code inside a proprietary software, whereas some licenses, such as BSD, allow the use of the source code even in proprietary software products (Krishnamurthy, 2003; West, 2003). OSS users can make improvements, fixes and modifications if they wish to do so. The interaction between users and developers makes the OSS a community movement rather than an organization (Krishnamurthy, 2003).
OSS movement is driven by the technical and economical merits of OSS, whereas Free Software Foundation (or FSF) base their arguments on moral and ethical principles (Hicks et al., 2005). However, the ideological motivations do not adequately explain the large population of developers in the OSS (Mustonen, 2003). Details of OSS community and products are discussed in the following sections while developing the hypotheses concerning international activity of OSS community members.
National culture, in addition to economic variables, affects national attitude towards innovativeness (Herbig and Dunphy, 1998; Lee, 1990), intellectual property (Marron and Steel, 2000; Shore et al., 2001; Yang, 2005) and adoption of technology (Slowiskowski and Jarrat (1997). Although OSS is essentially related to IP issue national culture's influence on OSS has rarely been studied.
In this article national culture’s impact on activity of OSS community members is examined by using Hofstede’s (1984) national cultural dimensions. It is noticed that Hofstede’s culture theory has been criticized in number of research articles (e.g., Fang, 2003, 2006; Gallivan and Srite, 2005; McSweeney, B. 2002). But as Fang (2006) also stated, Hofstede’s dimensions are useful for testing hypothesis in cross-country comparison. It is based on this understanding that this article sets out to map several important OSS communities and their product characteristics based on Hofstede’s cultural dimensions. We focus on Hofstede’s four cultural dimensions: Individualism-Collectivism (IDV), Masculinity-Femininity (MAS), Uncertainty avoidance (UAI) and Power Distance (PDI). The fifth dimension (long-term vs. short-term orientation) is excluded given its limitations (Fang, 2003).
Fang (2006) proposed a dialectical approach to understanding national culture. In his view national cultures embrace paradoxical values. Opposite cultural orientations coexist within national cultures depending on situation, context and time. This approach will also be useful in understanding the influence of culture in the context of OSS as well, for example, by explaining the seemingly paradoxical behaviors related to OSS community members and activities – in one situation a person is a user and in another situation the same person can be a developer.
Another issue related to culture is the influence of culture on piracy. In the software industry piracy is a common problem influencing the businesses of software companies all over the world. Business Software Alliance (BSA, 2004) reports piracy rates as high as 92% in China and Vietnam, and lowest 22% in USA. Researchers have

1906
studied the relationship between piracy and culture and a number of economic variables (Depken and Simmons, 2004; Husted, 2000; Marron and Steel, 2000; Shin et al., 2004; Shore et al., 2001). Earlier studies have also found that the individualism-collectivism dimension affects piracy rates, although the impacts of other cultural dimensions have received only varying support. Piracy per se is not an issue in OSS (Krishnamurthy, 2003), but it may have an effect on OSS because pirated software are also low cost or freely available and as such competitors for OSS. In addition piracy rate and OSS popularity may be tied together through people’s attitudes towards IP.
Hypotheses In some countries it seems impossible to purchase legit proprietary software as Ghosh (2003) demonstrated with the effective costs of a popular commercial operating system and office suite. Thus, unfortunately, another option for sometimes costly commercial software is pirated commercial software. Illegal copying of software is often referred as software piracy (Tang and Farn, 2005). Piracy includes unauthorized copying of software, using one license to install software on several computers and purchasing illegal copies of software (Prasad and Mahajan, 2003). Piracy rates and income level have relationship (higher income level countries have lower piracy, see Husted, 2000; Marron and Steel, 2000; Shin et al., 2004). Husted (2000) writes that software is vulnerable to illegal copying because it can happen with very low costs. According to BSA (2004) some countries have piracy rates more than 90% and world average was as high as 36%. Piracy itself is not an issue in OSS (Krishnamurthy, 2003), although it may have an impact on its popularity as pirated software are also popular and cheap, albeit illegal, alternatives. This relationship is likely to associate OSS with piracy, thus:
1. International activeness of OSS community members is affected by the piracy rate in the country. OSS is cheap (Economist, 2003). OSS represents a low cost and/or free alternative to commercial software. From the point of view of cost, national economic development should be accounted in this study as well,
even though this study is limited to high-income countries. Would the relative popularity of OSS be higher in lower income countries than in higher income countries? For users in lower income countries it seems more relevant to embrace OSS products, such as Linux, as OSS products are mostly free-of-charge (e.g. downloadable from the Internet). However, due to piracy OSS may not be seen as attractive as commercial software from the costs point of view either: by pirating commercial software one can get a real bargain with the same price as an OSS product, which will likely lower the overall interest towards OSS.
2. International activeness of OSS community members is affected by the income level (GNI per capita) of the country. However, the effect of economic development of the country is not limited only to the effect through the
piracy and software costs. Because OSS is most often distributed over the Internet and the development is done in Internet communities, thus the country’s Internet or more generally the ICT infrastructure should be developed enough to support the distribution of large software packages such as Linux operating systems. Moreover OSS support is often provided by Internet communities, which may further indicate the influence of adoption of Internet on OSS activities. Naturally the more country has Internet users more chances there are that they have stumbled upon OSS. The activity of OSS community members could depend on the Internet infrastructure or more general communication network infrastructure, because a) to show their activity OSS members must get on-line to take part in the on-line surveys used in this research, and b) to acquire Linux or take part in OSS development an Internet connection is likely to be necessary.
To access Internet there are three common mediums: broadband, modem (fixed land lines) and mobile phone networks. OSS developers may require frequent and fast Internet access, thus, in the focal research the number of broadband subscribers is also accounted. Broadband can be up to 50 times faster than modem (or dial-up) connection and it is always on (Savage and Waldman, 2005). Modem or mobile phone connections might be enough for casual Internet surfing and e.g. filling in the surveys used in this research. Broadband access is not a requirement for Linux users as, for example, some Linux distributions, such as Ubuntu3 also offer free shipments of CDs, that you can order from their website. In addition some Linux distributions are also sold in shops.

1907
Related to the Internet adoption and on-line activity of OSS community members, the number of computers in a country could be important variable. There is a practical reasoning behind this: one needs a computer to use and install Linux – of one hundred computers only at most one hundred can be Linux computers. Most importantly the user must have the right to install software to the computer he or she wants to have Linux installed on. Thus the higher the adoption rate of PCs is in the country the higher chances are that more users have the right to install software on them (e.g. more home users). This is more so concerning the OSS developers – they are very likely to require administration rights to the computer they develop software.
In this article, the effect of overall ICT infrastructure on the international activity of OSS community members is tested on four indicators, namely, broadband subscription per 1000 people, fixed and mobile phone lines per 1000 people, Internet users per 1000 people, and PCs per 1000 people. World Bank uses three last ones as ICT indicator in the Millennium Development Goals (MDG). In this research they are included separately because of their potential varying effect on OSS activities (e.g. developer may require broadband access whereas a modem connection may be sufficient for a user). Based on the above discussion the hypotheses concerning the relationship between ICT infrastructure and the activity of OSS community members are as follows:
3. International activeness of OSS members is affected by the broadband subscription rate (per 1000 people) in the country (provides high-speed Internet access).
4. International activeness of OSS members is affected by the telecommunication infrastructure (fixed and mobile phone lines per 1000 people) in the country (provides low-speed Internet access).
5. International activeness of OSS members is affected by the Internet users rate (per 1000 people) in the country.
6. International activeness of OSS members is affected by the availability of computers (per 1000 people) in the country.
Some findings about OSS suggest that education level may have some effect on the popularity of Linux,
e.g. OSS is often targeted to sophisticated users (Krishnamurthy, 2003; Lerner and Tirole, 2002) and in the last decade it has been popular in the market for high-end/professional users (Comino and Manenti, 2005).
OSS is typically developed by communities in the Internet (Hars and Ou, 2002). According to Krishnamurthy (2003) OSS is supported by a growing OSS community and it is a global movement. In non-English speaking countries, due to language barriers, OSS could be more popular among educated people (or lead users could be highly educated). For instance in a study concerning OSS developers by David et al. (2003) 95.02% of the respondents stated being fluent enough in English and 36.72% of them had master’s or doctor’s degree. In Ghosh et al. (2002) 85.71% of the respondents (likewise OSS developers) stated being able to speak English and 37.66% of them had master's or doctor’s degree. If OSS users are mainly high end and educated users, then the activity level of OSS community members may relate to the education level in the country. Moreover, if pirated software are competitors for OSS, then higher education would, also through decreased piracy, increase the market interest towards OSS (Marron and Steel [2000] noticed that piracy rate is lower in countries where education level is higher).
7. International activeness of OSS community members is affected by the education level in the country. OSS concerns both developers’ and users’ individual initiatives and freedoms. But paradoxically, OSS is
also about achieving the collective good by sharing individually created knowledge with the entire OSS community. For instance, OSS can be customized as the source code is available (Bruggink, 2003; Economist, 2003) and OSS provides more choices to users and it is more flexible (Brandl, 2004; Krishnamurthy, 2003). OSS products can be downloaded, distributed and shared freely (Krishnamurthy, 2003). As opposite to OSS, traditional software licenses are often restricting (Barton and Nissanka, 2001). Herbig and Dunphy (1998) argued that collectivistic cultures value freedom less than individualistic cultures. Thus, when comparing OSS and traditional software, users in individualistic cultures could prefer the freedoms OSS provides. However according to Marron and Steel (2000) individual ownership of intellectual property is valued in individualistic cultures, which is an opposite what OSS stands for – OSS is community owned. West (2003) stated that OSS developers give up their rights to profit from their R&D work. According to Jacobs et al. (2001) sharing is perceived as more Asian, whereas IP protection, e.g.

1908
copyrights and patents, are viewed as Western. Thus, they continue, new ideas and technologies belong to the public and cultural esteem may be stronger incentives for creativity than material success.
Of the above two examples the first one (freedom) is inclined with individualism, but the latter one (public ownership) is very much against it. In individualistic countries, users would like the freedoms OSS provide, but why would one from an individualistic culture develop something to be given away? This seems to support Fang’s (2006) hypothesis that people can choose contradicting values and behaviors in different situations. It seems possible that while using OSS a person identifies himself with the individualistic values OSS stands for and when developing software he or she is more inclined with the collectivistic characteristics. Even efforts to develop OSS could mean energies of individualism
Krogh et al. (2003) argued that OSS development has characteristics of collective action. Majority of the respondents in study by Lakhani and Wolf (2003) had strong sense of group identity. Additionally, two of the main motivational factors among Linux developers, according to Hertel et al. (2003), are “a more general identification as Linux users” and “a more specific identification factor as a Linux developer” among others. Hars and Ou (2002) identified intrinsic motivation, altruism, identification with the community, direct compensation and expected future returns as important factors. However, they write, professional developers (i.e. salaried and contract programmers) were less motivated by altruism and community identification than student and hobby programmers (two different situation – at work and a hobby). Hofstede (1997) argued that individualism-collectivism dimension relates to the degree by which individuals are integrated into groups. Clearly, based on earlier findings, for OSS developers groups seems to have some importance. It is important to note that OSS developers are also users, thus in one situation they could be motivated by collectivistic characteristics where as in another situation (as users) they might be driven by the individualistic characteristic. Although Krishnamurthy (2002) found out that many OSS projects have only one developer.
How about other frequently shared software? Shore et al. (2001), Husted (2000), Shin et al. (2004), Marron and Steel (2000), and Depken and Simmons (2004) found out that piracy rate gets lower in more individualistic cultures. Piracy is sharing other’s intellectual property for free and illegally, whereas OSS is sharing one’s own and others' IP legally freely. Moreover, pirated software and OSS are competitors. As piracy and collectivism has relationship, and higher level of piracy might decrease popularity of OSS, thus individualism-collectivism and piracy together may influence the activity of OSS actors as well.
8. International activeness of OSS community members is affected by individualism-collectivism dimension of the culture. OSS seems to be influenced by both masculine and feminine cultural characteristics. In masculine cultures
material success and progress are important values (Hofstede, 1997). OSS developers, as discussed earlier, surrender their rights to profit from the software. They arguably do this in order to increase the speed of diffusion and the speed of development, which paradoxically has both masculine characteristics (progress) and feminine characteristics (giving for free can be seen as the opposite of material success). Giving for free and free distribution of software suggest care for others and for society at large. In addition openness and sharing of software source code guarantees continuity. According to Hofstede (1997) caring for others and preservation are dominant values in feminine cultures. However, as pirated software were considered to be a cheap competitor for OSS and Shore et al. (2001) found relationship between masculinity and piracy (the higher the masculinity the lower the piracy), thus, when both piracy rate and masculinity get lower we could expect higher OSS activity. Also Husted (2000) found same sign in his study.
9. International activeness of OSS community members is affected by masculinity-femininity dimension of a culture. As pointed out earlier, OSS is developed in communities, support is provided by communities etc. and even
the companies are part of the communities that has the power. The strength of the community is indicative from Dahlander and Magnusson’s (2005) argument that the software code is controlled by the community, where companies co-exist, and the community has the knowledge to create software. Moreover, users can make modification and fixes in OSS, if they wish to do so (Krishnamurthy, 2003). If everyone can take the software source code and make changes etc., then it is likely to lower the inequality between the actors in the OSS community – especially between users and developers. Power distance cultural dimension means the unequal

1909
distribution of power between the members in organizations or institutions and how they accept it (Hofstede, 1997). What makes OSS and power distance interesting is that actors in OSS have possibility to proactively shape and modify the technologies (Jesiek, 2003). It is quite opposite in closed source software, as Jesiek (2003) states that limited groups and users posses only a little negotiation power. In addition, OSS provides more choice and several kinds of freedoms as came up earlier. Thus high power distance cultures may somewhat easier accept restricting commercial software licenses, whereas low power distance cultures could expect to have more control of the software one uses. Interestingly, in higher power distance cultures people are more willing to choose to “steal” software as the findings by Depken and Simmons (2004) suggest, which should be taken into account as well. Likewise Shore et al. (2001) found positive relationship between power distance and piracy.
10. International activeness of OSS community members is affected by culture’s power distance index. Human society has created technologies among other things to decrease anxiety (uncertainties). In
uncertainty accepting cultures people are more tolerant to different and innovative behavior and ideas. (Hofstede, 1997) Low uncertainty avoidance cultures are more willing to take risks associated with new methods and procedures, thus, for example, in low uncertainty avoidance cultures people could be more willing to try new information technology before it is proven elsewhere (Shore and Venkatachalam, 1996). There is a greater technological uncertainty when the technology changes fast or it is new (Moriarty and Kosnik, 1989), and both developers and buyers are not familiar with the newest technologies (Meldrum and Millman, 1991). Development process of OSS, its distribution and support systems are quite different/innovative from commercial software and it is a rather new phenomena. Barton and Nissanka (2001) and Suzor et al. (2004) have expressed that licensing may have some uncertainties in OSS (e.g. termination of OSS license), which might be seen unfavorably in some cultures. As earlier stated piracy may also affect OSS popularity. According to Shore et al. (2001) piracy increases when culture’s uncertainty avoidance increases. By pirating software users can test software with very low costs (decreasing uncertainty), which puts pirated software in competing position with OSS as both are cheap to try.
11. International activeness of OSS community members is affected by the uncertainty avoidance dimension of a culture. The above discussions show that many of the values that OSS represents simultaneously reflect both poles
of each of Hofstede’s cultural dimensions. The entire OSS movement is therefore permeated with dialectical properties. On the one hand this can mean that Hofstede’s cultural dimensions may not be appropriate for analyzing OSS as it shows complicated relations between OSS characteristics and culture. On the other hand, if culture is perceived in dialectical terms with paradoxical values and behaviors coexisting in the same culture depends on the situation, context and time (Fang, 2006), the relationships between OSS and culture can be better explained.
Methodology In this research international activeness of OSS community members was tested among OSS developers and Linux Counter users. The data is obtained from a number of publicized databases representing piracy rates, ICT and economic variables, and the activity of OSS community members in separate on-line surveys, namely, BSA (2004), World Bank (2007, 2006), OSS developers study by Ghosh et al. (2002) and David et al. (2003), and Linux Counter Project (2007). Cultural indices of each countries in this study are from Hofstede (1997) and www.geert-hofstede.com (2007). Countries/cultures included in the analysis are listed in Table 1.

1910
TABLE 1: COUNTRIES AND CULTURES INCLUDED IN THE RESEARCH. *ESTIMATES AND **REGIONAL ESTIMATES FOR ARAB WORLD FROM WWW.GEERT-HOFSTEDE.COM
Australia France Italy Netherlands Spain
Austria Germany Japan Norway Sweden
Belgium Greece Korea New Zealand Switzerland
Canada Hong Kong Kuwait** Portugal United Arabs Emirates**
Denmark Ireland Luxembourg* Saudi Arabia** United Kingdom
Finland Israel Malta* Singapore USA
BSA (2004) reports estimated piracy as the percentage of pirated software of the software installations in
each country. In the focal research piracy was taken as a comparative measurement. According to Husted (2000) there is no indication that BSA would report higher piracy rates in certain areas than in others. BSA data is commonly accepted measurement for software piracy in the industry and a number of researchers (e.g. Husted, 2000; Marron and Steel, 2000; Shin et al. 2004) have employed BSA data in studying software piracy issues.
World Bank's (2006) Information and Communication for Development report concerning ICT global trends and policies is used to obtain information concerning the ICT infrastructure of each country. The report offers data from 144 countries and it is from year 2004. ICT report authors express that they have taken considerable measures to standardize the data and the data they have collected is from the sources thought to be most authoritative. World Bank ICT study includes data about Internet users per 1000 people, number of PCs per 1000 people, broadband subscribers per 1000 people, fixed telephone lines and mobile phone subscribers per 1000 people and GNI per capita. ICT report was used as the primary source for these variables, in case of missing values World Bank’s Internet database (2007) were queried. Tertiary education enrollment rate was obtained from World Bank’s Internet database (2007).
Ghosh et al.’s (2002) study data had 2784 respondents (OSS developers) from year 2002 and David et al.’s (2003) study had 1588 respondents (year 2003). Both of these studies had respondents from more than 60 countries. In the analysis term ‘Floss’ is used to refer to OSS developers data (from Ghosh et al., 2002 and David et al. 2003). Ghosh et al. (2002) mainly covers European respondents. Ghosh et al. (2002) suspect that there is a possible bias towards more motivated developers in their study. In addition some nationalities may be over-represented while others under-represented (especially Asian countries). Their survey announcement was translated to several languages (five European languages in addition to English) and the survey was posted on various developer websites (14 sites). David et al. (2003) tried to reach more respondents outside Europe. This study was also, according to researchers, probably skewed towards more motivated OSS developers. Their survey announcement was submitted to nearly 50 websites and mailing lists and translated to English, Dutch, German, Italian, Russian, Spanish, Portuguese and Chinese. In both of the studies majority of respondents were from Europe. Countries that didn’t have respondents to the surveys are taken not to have active OSS developers, thus they are counted in the analysis as zero (i.e. not as missing values). In the analysis these two sets of developers data are combined into one variable.
Linux Counter is a website where Linux users can, voluntarily, register their Linux systems. Linux Counter Project (2007) started from 1993 (the organization was started in 1999) onwards and as of 12.02.2007 had 138003 Linux users counted from almost 200 countries. Linux Counter Project’s (2007) main website is in English, but their international4 Website is also translated to 14 alternative languages (13 European languages). Linux counter data most likely suffers from self-selection bias and is likely to include the most pro-Linux enthusiastics. To increase

1911
reliability of the data Linux Counter cleans it from ‘dead’ Linux users based on their deletion policy, e.g. accounts that have not been accessed within two years and reminder has been send at least three months ago. Linux counter data is referred as ‘Counter’ in the analysis.
The raw data (absolute number of Linux users/developers) from Counter and Floss data were unusable as such. In the analysis proportions of OSS developers and Linux users to the number of Internet users in each country were used. This is considered appropriate because both OSS and surveys used for data collection are highly dependent on the Internet. By using the number of Internet users as the denominator we get comparable values across countries. Proportion to the total population is not appropriate because of e.g. the dependency of OSS on the Internet. For instance, in Tuomi's (2004) study concerning Linux Kernel developers, Luxembourg had the highest (populated weighted) growth rate of Linux Kernel developers which is due to small population of the country as the author pointed out.
The acknowledged skewness of either Floss or Counter data does not create problems to the focal study because users’ and developers’ activity in the international OSS community in each country/culture is under investigation. In fact, possible self-selecting is useful, because we can find out in what kind of national cultures internationally active OSS developers/users can be located. A person who fills in the survey 100 times is more active than a person who fills the survey only one time. Analysis is conducted in a sample that includes high-income countries. These countries were selected because they presents various cultural and political backgrounds, but still the economical variation is limited by the GNI per capita constraint.
Results The population in this study includes high-income level countries (in 2004). However only countries/cultures that had individualism, power distance, uncertainty avoidance and masculinity-femininity dimensions of Hofstede’s cultural index data available are included. In addition to Hofstede (1997) also www.geert-hofstede.com website was consulted for cultural dimensions data, which resulted additional estimates for a few countries. In the analysis 30 countries had all the necessary variables. Data covers 72.5% of the respondents in OSS developers studies and 62.6% of Linux Counter users.
First, descriptive statistics were counted. Data was analyzed by using correlations and linear regression models. In the tables abbreviation are used for some of the variables: IDV stands for individualism-collectivism dimension, MAS for masculinity-femininity, PDI for power distance and UAI for uncertainty avoidance. Table 2 has the means and standard deviations of each variable. Tertiary enrollment rate had three missing values (Canada, Germany and Singapore). Missing values for tertiary enrollment rate were replaced with values from 2002 data for Canada, and with the mean in the analysis for Germany and Singapore. Replaced values were compared with other educational data (such as literacy rate and primary education) to make sure they would have minimal effect in the analysis. Piracy rate was missing from Luxembourg and for the analysis it was replaced with the regional average value (Western Europe, 36%) provided in the BSA piracy study.

1912
TABLE 2: MEANS AND STANDARD DEVIATIONS OF THE VARIABLES (N = 30)
Variable Mean SD
Floss/net users 1.106e-5 9.609e-6
Counter/net users 3.053e-4 2.219e-4
Piracy rate (N = 29) 0.3786 0.1166
GNI per capita 28948 11470
Broadband subscribers/1000 people 105.34 64.80
Fixed and mobile/1000 people 1389.63 266.06
Internet users/1000 people 430.47 143.31
PCs/1000 people 425.70 200.40
Tertiary education enrollment rate (N = 28) 57.32 21.32
Individualism (IDV) 59.23 21.3
Masculinity (MAS) 49.57 20.67
Power distance (PDI) 46.63 20.2
Uncertainty avoidance (UAI) 63.1 25.48
In Table 4 (in Appendix A) there are the correlations between independent and dependent variables.
Correlation matrix shows some significant correlations between a number of variables. OSS developers had significant correlations with piracy rate, GNI per capita, fixed and mobile phone lines, and individualism index. Linux Counter data had significant correlations with GNI per capita, fixed and mobile phone lines, tertiary education enrollment rate, individualism, and power distance indices. There was also a strong correlation between OSS developers and Linux Counter users.
Linear regression models are solved with both data sets separately. In both cases backward selection model is used to choose the best factors for the linear regression model. In the backward selection probability of F less than or equal to 0.05 was used to keep the variable. In Table 3 the model summaries are represented for both OSS developers and Linux Counter users. In Table 3 variables that are excluded from the models are omitted and the hypotheses the variable refers to is marked in the brackets e.g. H1 refers to hypothesis 1.
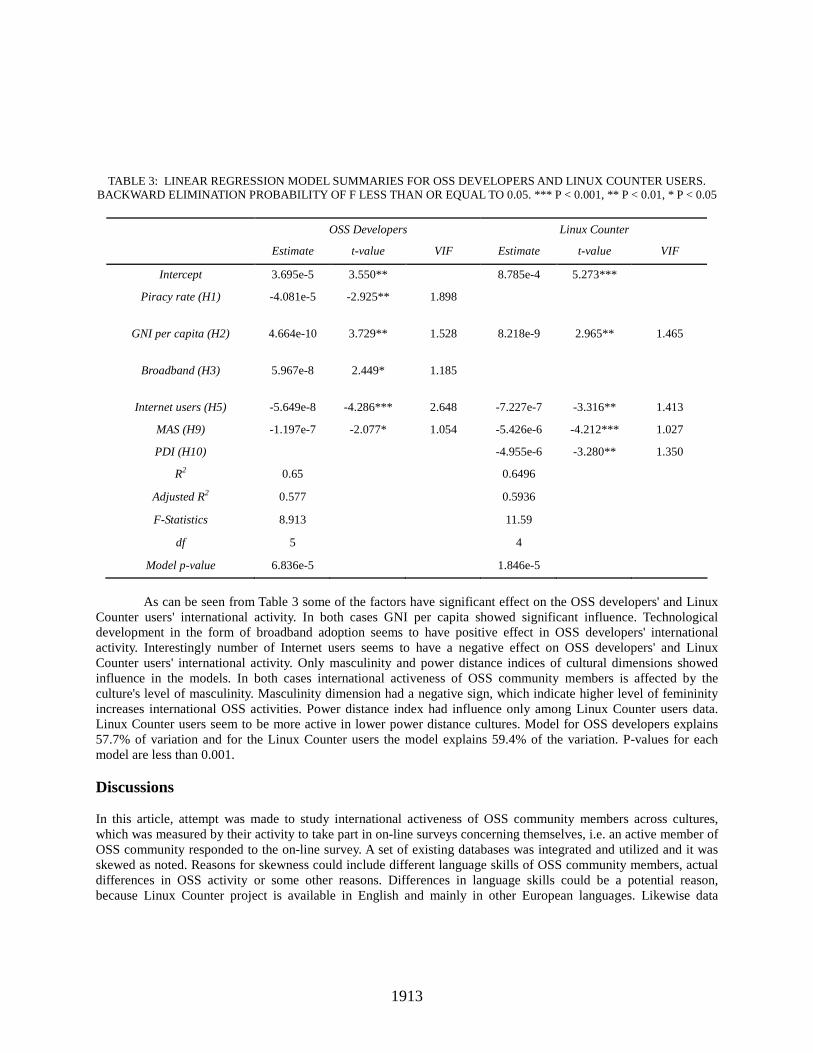
1913
TABLE 3: LINEAR REGRESSION MODEL SUMMARIES FOR OSS DEVELOPERS AND LINUX COUNTER USERS. BACKWARD ELIMINATION PROBABILITY OF F LESS THAN OR EQUAL TO 0.05. *** P < 0.001, ** P < 0.01, * P < 0.05
OSS Developers Linux Counter
Estimate t-value VIF Estimate t-value VIF
Intercept 3.695e-5 3.550** 8.785e-4 5.273***
Piracy rate (H1) -4.081e-5 -2.925** 1.898
GNI per capita (H2) 4.664e-10 3.729** 1.528 8.218e-9 2.965** 1.465
Broadband (H3) 5.967e-8 2.449* 1.185
Internet users (H5) -5.649e-8 -4.286*** 2.648 -7.227e-7 -3.316** 1.413
MAS (H9) -1.197e-7 -2.077* 1.054 -5.426e-6 -4.212*** 1.027
PDI (H10) -4.955e-6 -3.280** 1.350
R2 0.65 0.6496
Adjusted R2 0.577 0.5936
F-Statistics 8.913 11.59
df 5 4
Model p-value 6.836e-5 1.846e-5
As can be seen from Table 3 some of the factors have significant effect on the OSS developers' and Linux
Counter users' international activity. In both cases GNI per capita showed significant influence. Technological development in the form of broadband adoption seems to have positive effect in OSS developers' international activity. Interestingly number of Internet users seems to have a negative effect on OSS developers' and Linux Counter users' international activity. Only masculinity and power distance indices of cultural dimensions showed influence in the models. In both cases international activeness of OSS community members is affected by the culture's level of masculinity. Masculinity dimension had a negative sign, which indicate higher level of femininity increases international OSS activities. Power distance index had influence only among Linux Counter users data. Linux Counter users seem to be more active in lower power distance cultures. Model for OSS developers explains 57.7% of variation and for the Linux Counter users the model explains 59.4% of the variation. P-values for each model are less than 0.001.
Discussions In this article, attempt was made to study international activeness of OSS community members across cultures, which was measured by their activity to take part in on-line surveys concerning themselves, i.e. an active member of OSS community responded to the on-line survey. A set of existing databases was integrated and utilized and it was skewed as noted. Reasons for skewness could include different language skills of OSS community members, actual differences in OSS activity or some other reasons. Differences in language skills could be a potential reason, because Linux Counter project is available in English and mainly in other European languages. Likewise data

1914
collection for OSS developers was announced in English and in several European languages, although some other languages were used as well. The analysis included only high-income level countries, thus the regression models may not be accurate for low-income level countries.
Activity of OSS developers and Linux Counter users to take part on the on-line surveys correlated with a number of variables. Regression models revealed that piracy rate, income level, broadband adoption rate, Internet adoption rate, and two cultural dimensions, namely, masculinity-femininity and power distance have influence in OSS community across counties/cultures. Hypothesis 1 (piracy rate), 3 (broadband users per 1000 people) and 10 (power distance dimension) received support at least in one of the two the models. Hypotheses 2 (GNI per capita), 5 (Internet users per 1000 people) and 9 (masculinity-femininity dimension) are supported in both of the models.
The influence of piracy rate indicates that in countries where piracy rate is higher there is less OSS developers. This should not come as surprise, OSS developers create IP whereas piracy destroys the value of IP. It is natural that software developers value IP and thus do not engage in piracy as easily as other users. In addition to open source software OSS developers may also develop proprietary software, thus they have natural interest in IP issues. Interestingly, though, piracy seems to have effect only in OSS developer data, not in OSS community in general.
Although income level of the countries was used as limiting factor, it still showed influence among both OSS developers and Linux Counter users. GNI per capita was used as a measurement for income level of a country. GNI per capita had positive effect depicting that in higher income countries there are more active OSS community members. This probably indicates that the costs of the software is not an important characteristic of OSS (i.e. in high income countries there would be less demand for free, as zero costs, software, if the costs were important factor), or perhaps in higher income level countries people have more time to fiddle around with challenging OSS projects on their free time.
The effect of ICT infrastructure on the international activity of OSS community members was measured with four variables. Two of these variables, namely, PC adoption, fixed lines and mobile phone subscription rates did not indicate influence in neither of the models. Internet adoption rate had a negative effect in both of the models. One possibility for this might be the chronological diffusion of Internet technologies, for example, countries with higher Internet adoption rate may have started the adoption earlier, but not until recent years OSS has become mature competitor for proprietary software, thus countries that have adopted Internet later has an easier path to adopt OSS as they have not been locked-in to proprietary systems. So, in countries that has adoption process later, users have had the possibility to choose between OSS and proprietary software whereas earlier adopters (e.g. decade ago) may not have had this choice, which could reflect in the activity of OSS community members as the 'inverse' effect of Internet adoption indicates. In contrast, broadband adoption had a positive impact in the model for the OSS developers. For OSS developers broadband access is important or even necessary to share and follow the software projects. Moreover broadband access is somewhat newer than the Internet as a whole and perhaps the adoption of broadband connections has occurred more simultaneously across countries included in this research. OSS community members' activity to register themselves to Linux Counter was not influenced by broadband adoption as indicated by the model for Linux Counter users.
Education level was considered to be one factor that affects the international activity of OSS community members. The effect of education level was measured with the tertiary education enrollment rate. According to the analysis education level did not show influence on the international activeness of OSS community members in neither of the models.
Culture's impacts on international activeness of OSS community members was studied by utilizing Hofstede's cultural dimensions. Some of the cultural dimensions had influence in both models. Individualism and uncertainty avoidance dimensions showed no influence in neither of the models. Masculinity and power distance, however, showed influence.
Negative influence of masculinity indicates that more active OSS community members can be located in more feminine cultures. OSS developers give the fruit of their work for free, the distribution of the products is free, and OSS guarantees continuity, which suggests some feminine values, even though OSS is also embedded with some masculine values.

1915
Power distance showed influence in the model for Linux Counter users. There can be various reasons for it, for instance the differences could be due to difference of the nature of surveys (Counter project is a continuous survey), but, most importantly, we have to also keep in mind that Linux Counter respondents includes both Linux users and developers, whereas Floss data was only about developers. As discussed earlier OSS seems to lower the power distance between developers and users due to the nature of the software and the rights granted for the users. Besides in OSS users have possibility achieve far greater power than in proprietary software.
Differences between OSS developers and Linux Counter requires more attention. The differences may indicate that the values related to the same OSS phenomena influence differently in different adopter groups or persons’ behavior in different situations reflecting different cultural values. Different influences of the power distance dimension in the two groups seem to support Fang's (2006) idea of cultural behavior being paradoxical and dependent on time, situation and context. As an example, in the model for OSS developers power distance is absent. This may be because software developers can develop software by themselves, i.e. if they need a calculator they can program one that fits their needs. Users on the contrary, can either buy a ready calculator software that may or may not fit their needs or they can use open source calculator. In the first case they can suggest ideas to the original developer, however only the developer can make the changes (this was pointed out e.g. by Krishnamurthy [2003]). In the latter case, however, they can make changes by themselves or ask any developer to make necessary changes, thus it significantly decreases the power distance between developers and users because the original developer cannot keep the strings too tight. In OSS if the original developer is not willing to make changes, then the user can always take the source code and go – with proprietary software the users can only hope the developer listens. In lower power distance countries more users may require this option, so there exists the negative influence of the power distance index in the model for Linux Counter users.
Conclusion
We need to acknowledge that the competition between commercial software and OSS happens only within the informed computer users (Comino and Manenti, 2005). Thus OSS users in one country might be more than in another country because of the greater number of informed computer users - not only because of the economical or development level of the country etc. This is why knowledge about the activity of existing OSS users and developers is important in overall assessment of OSS adoption and market potential. If a user takes active measures participating in on-line survey then, perhaps, he or she also promote OSS usage among their acquaintances. In this research international activeness of OSS community members was tested among OSS developers and Linux Counter users. The latter one may also include users in addition to developers. GNI per capita, Internet adoption rate and masculinity-femininity dimension showed influence in both OSS developers and Linux Counter users regression models. Piracy rate, broadband adoption rate and power distance dimension influenced at least in one of the two the models.
Commonly attached characteristic to OSS community and the development process is their collective nature. Regardless of the collective characteristics, OSS developers' nor Linux Counter users' activity did not depend on the individualism-collectivism dimension of the culture. Likewise, earlier findings by Krishnamurthy (2002) also indicate that many OSS developer work alone. However, culture has impacts on the OSS community in terms of masculinity-femininity and power distance dimensions. Lower level of masculinity seemed to increase OSS activity among OSS community members. More important is the finding that culture showed different influences among Linux Counter users and OSS developers. Among developers only masculinity dimension had an effect, but among Linux Counter users power distance was influential factor as well. Thus marketers and software developers should take culture's potential impacts into account when conducting business across cultures whether it is development or promotion of OSS products. Proprietary software vendors could also take advice and consider the effect masculinity and power distance dimensions have in the commercial software markets when they are competing with OSS. The contradicting influences of cultural dimension on the same phenomena (OSS), but in different role of the person as user and developer, is an important finding that lends support to Fang's (2006) conceptualization of culture which embraces paradoxical values and behaviors.

1916
Interestingly, the effect of Internet adoption rate (as users per 1000 people) in the country had a negative effect in the models. This could be because of the lock-in to proprietary systems some countries are experiencing due to their earlier Internet adoption and lack of competition at the time. OSS has brought competition only in the recent years, thus countries that have adopted Internet later have had the ability to try OSS before potential lock-in to proprietary systems. This needs further investigations to draw conclusions. In opposite, broadband subscription rate had positive influence in the international activeness of OSS developers and it seems rather natural as OSS development is highly dependent on Internet and a fast Internet access may be a requirement for OSS developers to keep up with the latest developments. Piracy showed influence only among the OSS developers, which is natural effect as OSS developers create IP whereas piracy destroys the value of IP.
Our study has a number of weaknesses. The empirical data on which the study is based comes from an integration of a number of existing databases. The data represents only a fraction of the OSS community members. It may represent the cohort of early OSS adopters and the most passionate OSS advocates, thereby as making the data suffer from biases.
Hofstede’s (1997) cultural dimensions indices which are developed in the 1960s and 1970s maybe outdated. In addition Hofstede’s cultural indices may not be fine grained to measure complicated phenomenas such as OSS. Moreover, Hofstede’s theory is based on bipolarizing cultures giving little room to understanding culture in dialectical terms. However, due to the availability and its usability in testing hypothesis Hofstede’s dimensions are considered relevant in this study. To assess actual cultural values of OSS developers and non-OSS developers, and OSS users and non-users primary data collection and measurement for their cultural values should be used. This would prevail the softer values behind the affection towards software freedoms. However, the results of this study provide strong indication and leads the way for understanding OSS activities across cultures.
In this research several background variables were included, but as visible from explanation power of the regression models the differences in activeness of OSS community members across cultures include also some other variables than those in this study. Future research is needed to identify such potential variables as foreign language skills (more fine grained analysis of education level), political orientation, or attitudes towards technology in general etc. However the scope and range of variables in this study are limited because the respondents are only from the population who can access the Internet and current research is limited to high-income countries. Future research should be conducted to cover the activity of OSS community members from lower income countries. More important, this article suggested that culture may have a paradoxical influence on OSS. Future research needs to address in more detailed the dialectical properties of OSS movement and their implications for industry and academia.

Appendix APPENDIX A - TABLE 4: CORRELATIONS BETWEEN THE INDEPENDENT AND DEPENDENT VARIABLES. *** P <
0.001, ** P < 0.01, * P < 0.05
Floss Counter Piracy GNI Broadband
Fixed & Mobile
Internet users
PCs Tertiary Education
IDV MAS PDI
Counter/net 0.787***
Piracy rate -0.427* -0.340
GNI per capita
0.557** 0.437* -0.560**
Broadband 0.224 0.107 -0.324 0.297
Fixed & Mobile
0.443* 0.369* -0.234 0.555** 0.314
Internet users
0.030 0.004 -0.608*** 0.482** 0.662*** 0.327
PCs/1000 persons
0.253 0.177 -0.594*** 0.696*** 0.594*** 0.397* 0.760***
Tertiary Education
0.239 0.375* -0.334 0.101 0.379* 0.123 0.410* 0.347
Individualism
0.459* 0.397* -0.617*** 0.493** 0.037 0.210 0.268 0.455* 0.289
Masculinity -0.261 -0.484** 0.040 -0.0567 -0.219 -0.187 -0.161 -0.114 -0.320 -0.008
Power distance
-0.432* -0.490** 0.671*** -0.462* -0.220 -0.463* -0.409* -0.544** -0.400* -0.602*** 0.067
Uncertainty avoidance
-0.005 -0.024 0.336 -0.387* -0.237 -0.215 -0.543** -0.633*** -0.119 -0.264 0.196 0.299

1918
References
[1] Barton P., Nissanka V. (2001). Innovation V. Suppression: An English View of Open Source Software Licensing. Journal of Internet Law, 16-20.
[2] Brandl, D. (2004). Open up with open source. Control Engineering, 51, May 2004, 56. [3] Bruggink, M. (2003). Open Source Software: Take It or Leave It? The Status of Open Source Software in
Africa: A study towards informed decision-making on ICT-platforms. IICD Research Report No. 16, June 2003.
[4] BSA (Business Software Alliance). (2004). Global Software Piracy Study. Retrieved May 16 2005, from http://www.bsa.org/globalstudy/.
[5] Comino, S., & Manenti, F.M. (2005). Government policies supporting open source software for the mass market. Review of Industrial Organization, 26, 217-240.
[6] Dahlander, L., & Magnusson, M.G. (2005). Relationships between open source software companies and communities: Observations from Nordic firms. Research Policy, 34, 481-493.
[7] Dalle, J.M. & Jullien, N. (2003). 'Libre' software: turning fads into institutions?. Research Policy, 32, 1-11. [8] David, P., Waterman, A., & Arora, S. (2003). The free/libre/open source software survey for 2003.
Retrieved May 15 2005, from Stanford Institute for Economic Policy Research web site: http://www.stanford.edu/group/floss-us/.
[9] Depken, C.A., & Simmons, L.C. (2004). Social construct and the propensity for software piracy. Applied Economics Letters, 11, 97-100.
[10] Economist. (2003). Microsoft at the power point. Economist, 368, 13.09.2003, 59. [11] Economist. (2004). Beyond capitalism?, Economist, 371, 12.06.2004, 16-17. [12] Economist. (2006). Open, but not as usual. Economist, 378, 18.03.2006, 73-75. [13] Fang, T.. (2003). A Critique of Hofstede’s Fifth National Culture Dimension. Cross Cultural Management,
3, 347-368. [14] Fang, T.. (2006). From “Onion” to “Ocean”: Paradox and Change in National Cultures. International
Studies of Management and Organization, 35, 71-90. [15] Gallivan, M., & Srite, M.. (2005). Information technology and culture: Identifying fragmentary and holistic
perspectives of culture. Information and Organization, 15, 295-338. Contact authors for the full list of references
End Notes
1 In this paper Linux, or some insist using the ‘proper’ term GNU/Linux, is taken as one representative of OSS, even though there are many other open source software. In addition 'Linux' is used to address the combination of various GNU and other open source packages that form the operating system running on the Linux kernel. 2 One common open source software license, see http://www.gnu.org 3 http://www.ubuntu.com, last accessed 11.01.2007 4 International Linux Counter at http://i18n.counter.li.org/, last accessed 12.02.2007

1919
Challenges of Technology Protection for Chinese Private Enterprises
Wenqi Liu, [email protected] Jianming Mao
Zhejiang Shuren University, P.R.China
Abstract Chinese private enterprises have created substantial wealth in recent years. During expedited globalization, Chinese private enterprises encounter a few of challenges in the regions of technology protection and management. Currently, due to lack of consciousness to protect technologies, the technology protection and management systems have not been established well until now in many private enterprises. As a result, a few of them are inadequate to deal with suits they involved which probably incurred losses as well. Therefore, technology protection is being critical for their survival and development. It is also of great significance for local governments to provide policy supervision at right time to help private enterprises to conquer these difficulties. Introduction Since the implementation of the market-oriented reform and open policy in China, Chinese private enterprises have been playing an active role in the social economy. In these years, the GDP contributed by the private economy increases continuously, and the advantages of private enterprises emerge gradually as well. Although more and more private enterprises devote themselves to technology innovation, their core competence still far lags behind that of large state-owned enterprises in China and their counterparties in developed countries. Presently, the enterprises with their independent technologies only account for 0.03% among all the enterprises. [1] Simultaneously, private enterprises are faced with many other challenges, such as the deficient technology protection and management systems, the imperfect legislation and enforcement, the insufficient supports and assistance provides by the government and associates, and so on. Therefore, in order to promote competitive abilities of private enterprises and to increase their market share, both the private enterprises and Chinese government should take positive policies to conquer these difficulties, to facilitate the innovation and to protect technologies. The Challenges of Technology Protection for Private Enterprises The Weak Awareness and Consciousness of Intellectual Property Right (IPR) Protection Many private enterprises in China pay little attention to IPR protection, which is showed in the following folds. Firstly, enterprises’ awareness and consciousness of IPR protection is especially weak. Quite a few of them appreciate the importance of the increase of tangible asset; however, they ignore protection for IPR including patents, copyrights, technological secrets, and so on. As a result, an amount of technologies are lost. It is reveal that the enterprises have made no study on the roles of IPRs in economic activities, thus not understanding how to use the patent system to improve technical innovation mechanism, product quality and high-tech contents for developing and protecting market. Secondly, the consciousness of maintaining the validity and effectiveness of their patents is not strong enough. Some enterprises have only concern about the amount of the patents filed and granted, but think little of patent validity, patent quality and actual value of their patents. Patent validity means a patent is maintained effectively before its term expired. It reflects the technological innovation abilities and competitive abilities of enterprises and a nation. The patent holder is only willing to pay maintenance fee to keep the validity of patents which have market value. Therefore, the number of valid patents represents the technological level more factually than the number of patents granted. Chinese Patent Law stipulates that the duration of patent rights for inventions is twenty years, and the duration of patent rights for utility models and design is ten years. However, the validity period of many patents is less than maximum period prescribed by law. According to the data investigated and

1920
statistically analyzed by Patent Office of the People’s Republic of China, the patents granted by Chinese authority with valid periods less than seven years account for 66.3% among all the Chinese patents, and the patents with valid periods more than 10 years only account for 17.5%. Nevertheless, the two corresponding proportion mentioned above are respectively 41.9% and 29% in foreign countries. [2] Thirdly, the utilization of IPR is simplified. Most of private enterprises limit to use their IPR in production by themselves, but few of them make profits through cooperation, license, technology transfer, and other ways, which are usually adopted by multinational corporations. The Insufficient Experiences in Dealing with Suits Related to Technology Protection IPRs are powerful weapons for many private enterprises. In Chinese domestic trial experiences, more and more cases involving technology protection happen annually. On the one hand, private enterprises have recognized gradually that it is critical to protect their IPRs. It can be seen that many enterprises will bring an accusation actively against infringement. On the other hand, some private enterprises do not respect IPRs owned by others well enough; consequently, they are probably accused as defendants due to their infringements. Currently, there are two obvious characters in the cases involving IPR disputes as follows. Firstly, the number of cases is creasing in the recent years, and the majority of the cases are related to technologies. For example, there are 400 cases registered in the Intermediate People Court of Hangzhou in 2006, and 370 cases have been ended. Among them, 212 cases are about patent issues. The amount of these cases has reached the culmination in the trial history in this court. Similar situation has also occurred in the Intermediate People Court of Nanjing, Shanghai, and Beijing. [3] Secondly, current cases are more complex and more difficult than the cases happened in several years ago. The scope of disputes has been extended from the traditionary areas, such as patents and copyrights, to some advanced areas, including plant variety rights, rights of discovery, and so on.
In the cases involving the IPR issues, private enterprises are usually faced with the following troubles. Firstly, it seems that many private enterprises are reluctant to solving disputes and protect IPRs through judicatory proceedings. In China, both the judicial proceedings and administrative enforcement constitute the whole system of remedy for infringed IPRs. Above all, intellectual property rights are important civil rights. In civil infringement cases, the people's court is empowered to order the infringer to bear civil responsibility for the cessation of the infringement. Moreover, if the infringement of intellectual property rights is so serious that it has disrupted the economic order and constitutes a crime, the infringer's criminal responsibility is investigated and dealt with according to law. Both of them are the practical and effective judicial protection method. In addition to judical practices, Chinese intellectual property rights administrative departments exercise their legally stipulated powers and functions to safeguard law and order within the field of intellectual property, encourage fair competition, mediate disputes, settle cases involving violations of intellectual property rights, and protect the interests of the broad masses of the people by maintaining a good social and economic environment. In China the administrative procedures for solving disputes concerning intellectual property rights are simple and convenient. Cases can be quickly filed for official examination and possible prosecution, investigation follows promptly, and efficiency in handling the case is high. This is advantageous to the owners of the rights. [4] In comparison, judicial proceedings is the final means of claiming remedies, is more powerful than the latter. Whereas, if enterprises choose to enter into judicial proceeding, they will be confronted with several risks of too cumbersome and time-consuming courses, difficulties in bearing the burden of proof, and high legal cost. Just due to the factors mentioned above, many enterprises, especially medium and small enterprises, are more willing to take actions by administrative proceeding. It should be noted that administrative authorities can only provide conciliation and mediation services for remedies, instead of making judgments. As a result, most of the IPR holders cannot obtain a satisfying economic compensation. Secondly, in many cases, the plaintiffs sue for a large amount of money, which leads to a big gap between their claims and the judgment made by courts. Some private enterprises know little of litigation rules, so that their claims are unreasonable. Moreover, sometimes they cannot provide evidence of their loss caused by the sued infringement convectively. Hence, their claims cannot be supported by courts. Thirdly, some private enterprises’ capabilities of dealing with suits are quite weak. At present, a few of international corporations have established their strategic systems to protect their IPRs. Especially, some of them engage some searchers to find out whether their IPRs are being infringed in various markets in China. In contrast, Chinese private enterprises have not paid enough attention to IPRs. Not only do they conduct infringements, but also they prepare little for coping with the boring suits in which they are possible defendants. According to the statistics provided by the Intermediate People Court of

1921
Nanjing, the failure rate of such suits in which the domestic enterprises are defendants reaches 83% amazedly. [5] One of the important reasons resulting in failure of suits is such a passive defense reaction. The Absence of Reasonable Management System of IPRs and Excellent Professionals An intellectual property (IP) management system defines the principles that IPRs are designed to serve and how patent matters and other IP matters are handled within the enterprise. It includes the management of the creation, ownership, protection, and commercial exploitation of IP. The purpose of IP policy is to support the business operations of an enterprise. Neglecting IPRs may turn into a threat to development in an internationally expanding business. However, the reasonable management system of IPRs is rarely established in numerous Chinese private enterprises. In many large-sized enterprises in developed countries, there are hundreds of professionals who are well versed in management and protection of IPRs. They are dedicated in studying the laws, ideology, economic status, and custom of different countries. [6] Based on such a powerful and efficient system, their technologies are often implemented in an optimal way. In comparison, the management in Chinese private enterprises still needs further improvement. A complete and effective mechanism for management and protection of IPRs hasn't been formed within many private enterprises. Majority of them choose the familiar management method, which lacks special persons in charge of affairs related to IPRs. Even though some private enterprises engage managers for IPR protection, a quite few of these managers only provide part-time services. Such an unprofessional and logy management system cannot ensure the necessary consultation.
Additionally, the IP professionals with abundant legal knowledge, experience and technological background are extremely rare in China. The persons who are trained well for IPR services are less than 1,000 annually. [7] Additionally, many experts flow to foreign-invested enterprises and lawyer’s offices. It is of great importance and urgency for private enterprises to recruit such excellent professionals. Proposals for Improving Protection and Management System for Technologies Accelerating the Construction of Protection and Management System for Technologies It is necessary for private enterprises to strengthen their awareness and consciousness of IPR when they enter into the competitive market. Enterprises should guard against potential infringements to maintain their hard-own market share. Enterprises shall vigilantly refrain from infringing other’s rights as well; otherwise, they will suffer from great loss due to atonement and punishment caused by their prudential rough torts. Therefore, enterprises shall try their best to develop an effective system of technology management. Such a system will be helpful to improve the competitive abilities of enterprises, to maintain the economic value of technologies, to enforce IPRs and to monitor torts. Additionally, enterprises shall be always striving to promote their mechanisms for coping with suits. Besides using of arbitration and mediation, the current legislation and enforcement in the area of IPR in China encourage enterprises to fully protect their technologies by judicial means. The criminal, civil and administrative liabilities can deter and combat the infringement effectively. Simultaneously, some proceedings in litigation, such as preliminary injunction, evidence preservation, and attachment of property prior to entry into judgment, can protect the rights of technology holders in time, which will guarantee the legal remedy. In particular, the Supreme People's Court and the Supreme People's Procuratorate have jointly issued the Interpretation of Several Issues Relating to Specific Application of Law to the Treatment of Criminal Cases of Intellectual Property Infringement No. 2 which came into force on the same day. This Interpretation aims to further strengthen the protection of intellectual property rights in China. [8] With regarding to the importance of judicial proceeding, private enterprises shall prepare constructively for trial and can contribute positively toward their defense. Such a prudent attitude to suits is necessary. Enterprises should gather necessary evidence to substantiate their claims. The disputes related to technologies and IPRs are generally esoteric, so that it is also essential to consult a lawyer or legal center and research the specific laws. Finally, enterprises shall recruit professionals who are specialized in searching, viewing, and analyzing of IPR data collections worldwide, in managing and protecting technologies, and enacting particular strategies for technology protection. The excellent human sources can be obtained through introducing and training staffs, or cultivating special talents by cooperating with other enterprises. Enhancing the Function of Agencies and Associations to Assist Private Enterprises for Technology Protection

1922
Agencies of IPR provide a series of professional services and handle technologies -related affairs, such as preparing patent application, analyzing actions and preparing responses to actions, providing status reports related to IPRs for clients as needed, and taking necessary actions to keep IP holders in good standing in China and around the world. Agencies shall be approved by the State Intellectual Property Office of the People’s Republic of China, and their work shall comply with the laws and regulations. Associations for IPRs protection are nongovernmental organizations, which are dedicated to promoting a better understanding of the creation and utilization of Intellectual Property. They are made up of individuals, businesses, institutions, and organizations involved with the development, promotion, protection, and utilization of Intellectual Property. In the recent years, the IPR Protection Association of China, the Patent Protection Association of China, the Trademark Protection Association of China, and many other associations have been constructed. These associations function as coordinators to harmonize the benefits between enterprises and the government, and function as supervisors to maintain the fair competition in markets. It can be seen that agencies and associations play an important role for private enterprises to protect their technologies. However, a short development history of agencies and associations in China leads to the absence of authoritative status and strong cohesion. Moreover, many private enterprises have no confidence in services provided by agencies and associations, so that it is difficult for the latter to perform their inherent function. In contrast, some agencies and associations with abundant experiences in developed countries perform an important function in the related area. For enterprises, they give advices on management and dealing with special cases, make investigation in the actual markets, and mediate disputes. For the central and local governments, they report the remand of industries, propose the industry standard, and assist legislation and enforcement. These experiences shall be learned from by agencies, associations, and private enterprises in China. Reinforcing Guidance and Improving Assistance Provided by the Governments Firstly, the central government and local governments should set up a proper administrative system. Above all, the governments shall strengthen the enforcement to protect the rights of technology holders. It is also practical to develop information systems to report acts of violation of the laws and regulations. Based on the information they obtain, the governments have an obligation to publish it for private enterprises’ reference. At the same time, the governments shall help enterprises avoid the risks in the international technological trade and investment, give directions in commercial issues, and carry out professional training to improve the abilities of staffs in private enterprises.
Secondly, the governments shall develop an open and expedite information channel for giving better access to government services. Most of IP information comes from the governments and their departments. Compared with enterprises and individuals, the governments act as an electronic clearing house for information on other sources of assistance, including private sector experts, educational and training institutions, and investors and companies interested in partnering. Therefore, the accurate classification, careful edition, and prompt reports of IP information are all critical for enterprises, which can provide private enterprises convenience and save their valuable time.
Thirdly, the markets of agencies and associations should run under the laws and supervision provided by Chinese authorities. Above all, the professional qualification of agencies shall be evaluated termly. Moreover, the governments shall guide agencies and associations to do some academic research for the purposes of providing high quality services. Additionally, when making policies, the governments shall promote communication with agencies and associations, and consider the opinions from them, which reflect the problems in practices. Finally, the governments shall encourage agencies and associations to discuss difficult and disputable issues with private enterprises, and to make suggestions for them. Such actions will increase confidence of enterprises in services offered by agencies and associations.
Finally, government can assist private enterprises human resources development by sponsoring exchanges of business, scientific and technical information, and by strengthening and supporting the role played by teachers, trainers and private sector consultants and management consultants in the area of IP management. Moreover, the educational propaganda of IPR protection shall be carried out by the governments, enterprises, organizations, and all the social forces. These instructive actions will be significant to build a good environment of respecting IPRs and protecting technologies.

1923
Conclusion The challenges in the regime of technology protection posed by technical development for Chinese private enterprises are obvious. Although private enterprises have made some efforts to conquer the challenges, the abilities of technology protection still lag far behind the requirements of the new knowledge-economy era. Therefore, Chinese private enterprises should pay more attention to the establishment and perfection of their management and protection systems for technologies. They should utilize all available resources to improve the level of technology protection. Moreover, the central and local governments, agencies, and association also have obligations to provide necessary services for private enterprises to cope with difficulties composedly.
References
[1] The Ministry of Science and Technology of P.R.China. (2006, Sept 9). Only 0.03% enterprises own the independent intellectual property.http://scitech.people.com.cn/GB/1057/4798140.html. [2] State Intellectual Property Office of P.R.China. (2007, Feb 12). The analysis of the validity of patents in
China. http://www.sipo.gov.cn/sipo/ghfzs/zltjjb/200702/P020070214391263886412.df. [3] The Intermediate People Court of Hangzhou. (2007, Feb 1). The top ten cases related to intellectual
property protection judged by the Intermediate People Court of Hangzhou in 2006. http://zg.zj.com/zxzz/zscq/2007-02-01/100553.html. [4] Information Office State Council Of the People's Republic of China, Intellectual property protection in China.(2004, Dec 24). http://www.china-un.ch/eng/bjzl/t176937.htm. [5] Wang, Jianglong. (2006, Jan 23). Investigation on intellectual property cases related to private enterprises
in Nanjing. http://www.laww.cn/n2863c78.aspx. [6] Chen, zhiqiang., (2006) The operating mode and functions of intellectual property protection organizations
in USA. Associations, 7, 52-54. [7] Li,QZ., Yan, WF. Gu, ZQ., (2005, Sept 16). Difficulties in introducing professionals display the rarity of intellectual property professionals.
http://www.sipo.gov.cn/sipo//xwdt/mtjj/2005/200509/t20050916_72600.htm. [8] Wilkinson & Grist, China: Rule change facilitates IP prosecutions
http://www.managingip.com/?Page=10&PUBID=34&ISS=23780&SID=684399&TYPE=20

1924
Impact of Code of Ethics on Behavioral Intention of Indulging in Software Piracy
Nivedita Debnath Shri Ram
Centre for Industrial Relations and Human Resources, India Kanika T Bhal IIT Delhi, India
Namjae Cho, [email protected] Hanyang University, Seoul, South Korea
Abstract A code of ethics is a formal document that states an organization’s primary values and the ethical rules it expects its employees to follow. Researchers have found that a well-written ethical code could serve to convey the organization’s commitment to ethical conduct (Molander (1987). The study explores the influence of formal codes on individual’s behavioral intention of indulging into unethical activity of software piracy in the work place. For this purpose data has been collected by structured questionnaire from 379 respondents working in different IT companies located in South India, West India and North India. To find out the influence of codes of ethics on intention to act for software piracy, correlation was computed on perceived ethicality and intention to act for piracy. Along the direct relationship of formal codes with the intentions to act for piracy we have also studied the interactive effect of formal code with attitude to predict the intention as an outcome. Introduction Organizations can guide members’ ethical behavior by developing formal codes of ethical conduct. A code of ethics is a formal document that states an organization’s primary values and the ethical rules it expects its employees to follow.
Research is inconclusive regarding effectiveness of the formal codes in changing attitudes or behavior. It suggests that codes of ethics must be consistent with the organizational culture and must be enforced in order to be effective (Trevino, 1986). In a 1979 survey of Fortune 1000 corporations three fourths of the companies had codes how ever only one half of the companies distributed the codes beyond the level of officers are “key employees” (White and Montgomery, 1980). Weaver and Ferrell, (1977) found that codes of ethics were more likely to affect beliefs about what is right, than behavior and that enforcement of corporate policy was necessary to change ethical behavior. Hegarty and Sims (1979), in a laboratory experiment found that an organizational ethics policy significantly reduced unethical decision. On the other hand many researchers have found that code of ethics don’t any impact on person’s ethical/ unethical behavior. Cressey and Moore (1983) analyzed the conduct codes of 119 corporations; they concluded that codes did not relieve organizational pressure to be unethical. Cleek, and Leoward (1998), conducted a survey of 150 business students and concluded that code of ethics is not influential in determining a persona ethical decision making behavior.
Software Piracy We consider it wrong to steal chocolate from a shop, however it seems to be quite different when we consider stealing information from a floppy disk (Wong, 1995). Software piracy has become a major problem for the software industry and for business, it has been estimated that software piracy results in between 2 to 10 illegal copies made for every legitimate copy sold (Conner and Rumelt, 1991).
Software piracy is defined as the unauthorized copying of an organization’s internally developed software or the illegal duplication of commercially available software in order to avoid fees (Straub and Collins, 1990). It is

1925
the illegal act of copying software for many reasons, other than back up, without explicit permission from and compensation to the copyright holder (Gopal and Sander, 1998). Piracy is claimed to be a major problem for the microcomputer software industry. Industry sources estimate the losses from piracy of commercial software at over $I billion per year and many fear that rapidly increasing losses will threaten the financial viability of the whole software industry (Bequai, 1987).
The pervasiveness of software piracy throughout the world is having a profound effect on the software publishing industry and the development of digital intellectual properties and technologies especially in developing countries where the piracy rates are extremely high (Gopal and Sanders, 1998).
Software piracy, the illegal copying of computer software, has received increased attention as a form of unethical behavior in recent years and has become a widespread problem universally, in government and business environments (Sims, Cheng and Teegen, 1996). The 1980s witnessed a virtual explosion in the use of microcomputer for business, education and personal / home functions. This spread of hardware has been accompanied by a proliferation of software, much of which “pirated” is i.e., unlawfully reproduced. Intention Intention refers to the subjective probability of one’s engagement in any behavior (Fishbein and Ajzen 1975). Stronger the behavioral intention, the more likely the execution.
Accordingly to Fishbein and Ajzen (1975) intention to act is determine by the individual’s attitude and perceived social pressure from significant others. Glass and Wood (1996), in their study showed that variations in resource gained through the software exchange influence an individual’s intentions to provide his or her legal copy of software to another for purpose of illegal copying. Attitude Attitude toward the behavior refers to the degree to which the person has a favorable or unfavorable evaluation of the behavior in question (Ajzen 1989). Early theorists tended to use the term affect to denote an attitude’s valence, i.e., overall degree to favorability (Thurstone’s, 1931). To avoid confusion (Ajzen and Fishbein, 1980) proposed to use the term “attitude” to refer to the evaluation an object, concept, or behavior along a dimension of favor or disfavor, good or bad, like or dislike.
Many researchers (Schultz and Oskamp, 1996) in their studies have found that attitude leads to behavioral intentions. Prislin and Ouellette (1996) found that highly embedded attitudes towards preservation of the environment were more strongly related to an aggregate measure of behavior intentions than were low embedded attitudes. In an IT ethical context, if individuals view stealing software as wrong, they are unlikely to intend to steal it. Methodology Since the focus of the study was using information technology, it was assumed that the level of familiarity with IT was likely to influence the responses. To address this issue an attempt was made to choose a sample that was homogeneous in terms of familiarity with IT, the study was conducted on the software professionals working in 16 software organizations based in North, South and West regions of India. These organizations varied in terms of ownership and respondents from Indian multinational and government organizations were included in the study. Participants This study was conducted on professionals working software organizations. Altogether 379 executives from 16 organizations constituted the sample for this study. The data was collected via questionnaires that were administered in the organizations. The employees were assured of confidentiality and were informed that the information would

1926
be used for academic and research purpose solely. Age and gender wise distribution of the sample is given in Table 1.
TABLE 1: AGE-GROUP AND GENDER WISE PROFILE OF THE RESPONDENTS
Gender
Age-Group Male Female
Total
20-25 98 54 152
25-30 164 37 201
30-35 17 4 21
40-45 2 2
45 -50 3 3
Total 284 95 379
It can be seen that the sample had mainly young professionals in the age group of 25 –30 years. It needs to
be mentioned here that the age of the respondents is reflective of the actual age profile of the software professionals. However, the actual population probably has a larger share of female professional as compared to this sample.
Further, an attempt was made to collect data from, the different parts of the country to make the finding more universally representative.131, 142 and 106 respondents were from Western, Southern and Northern parts of India. Respondents’ belonged to different types of organizations 160 were from Indian Private Organizations 189 were form Multinationals and 30 were from Government Organizations.
Western, 131
Southern, 142
Northern, 106
FIG. 1: REGION WISE DETAILS OF THE SAMPLE

1927
Private Organisation,
160
Multinational, 189
Government, 30
FIG. 2: ORGANIZATION WISE DETAILS OF THE SAMPLE
Instruments Used Piracy Situations – Attitude and Intention Based on (Shore, Solorzane, Burn and Hussan, 2001) two situations of software piracy were adopted. Both the situations are related to corporate piracy (piracy for organization). The attitude and behavioral intention for each situation was measured by using 3- items each. Attitude was assessed in terms of perceived ethicality and intention through likelihood of indulging in the activity. The rating was done on five point likert scale with responses ranging 1= Always to 5= Never. Reliability (cronobach’s alpha) of attitude and intention for both the situations are reported in Table 2. Code of Ethics The five items of code of ethics was adopted from Pierce and Henry (1996). One items where on ordinal scale, (Does your company have a formal code of conduct) where yes and no type. Rest four items were placed on a five point Likert Scale with responses ranging from strongly agrees =5 to strongly disagree =1. Reliability alpha of four items are reported in Table 2.
TABLE 2: SCALE CHARACTERSTICS OF THE VARIABLES INCLUDED IN THE STUDY SCALE Mean St. Deviation Alpha No. of items
Piracy Situation 1 Attitude 3.2 1.16 .93 3 Intention 3.3 1.08 .88 3 Situation 2 Attitude 3.5 1.09 .92 3 Intention 3.4 1.05 .88 3 Code of Ethics 3.21 .615 .58 4

1928
Direct Relationship Interactive Relationship
FIG. 3: RESEARCH MODEL It was hypothesized that code of ethics would affect the perceived ethicality (attitude) and intention of
individual decision-making regarding software piracy. Code of ethics can serve three major purposes in organization. These include demonstrating a concern for ethics by the organization, transmitting ethical values of the organization to its members and impacting the ethical behavior of these members (Wotruba, Chonko and Loe, 2001).
Results Presence of formal code was assessed through a yes/no response format. When we asked respondents whether they are aware of formal code of conduct in their company 320 respondent out of 379 said that they were, whereas 55 respondents said they were not. (χ2 which is significant at P <. 01). Thus, it seems that most companies had a formal code of conduct.
Next to find out the influence of codes of ethics on intention to act for software piracy, correlation was computed between codes and intention to act for software piracy. Table 3 shows the results of correlation analysis.
TABLE 3: CORRELATION BETWEEN CODES OF ETHICS AND BEHAVIORAL INTENTION.
Piracy Intention Situation 1 Situation 2
Codes of Ethics .103*
(365)
.147**
(365)
Note: figures in parenthesis represent N (sample size). * = P < .05 ** = P < .01. It can be seen from Table 1 that code of ethics has a significant correlation with intention to act for
software piracy for both the situations. Interaction Effect of Code of Ethics and Attitude
Codes of ethics INTENTION
Attitude
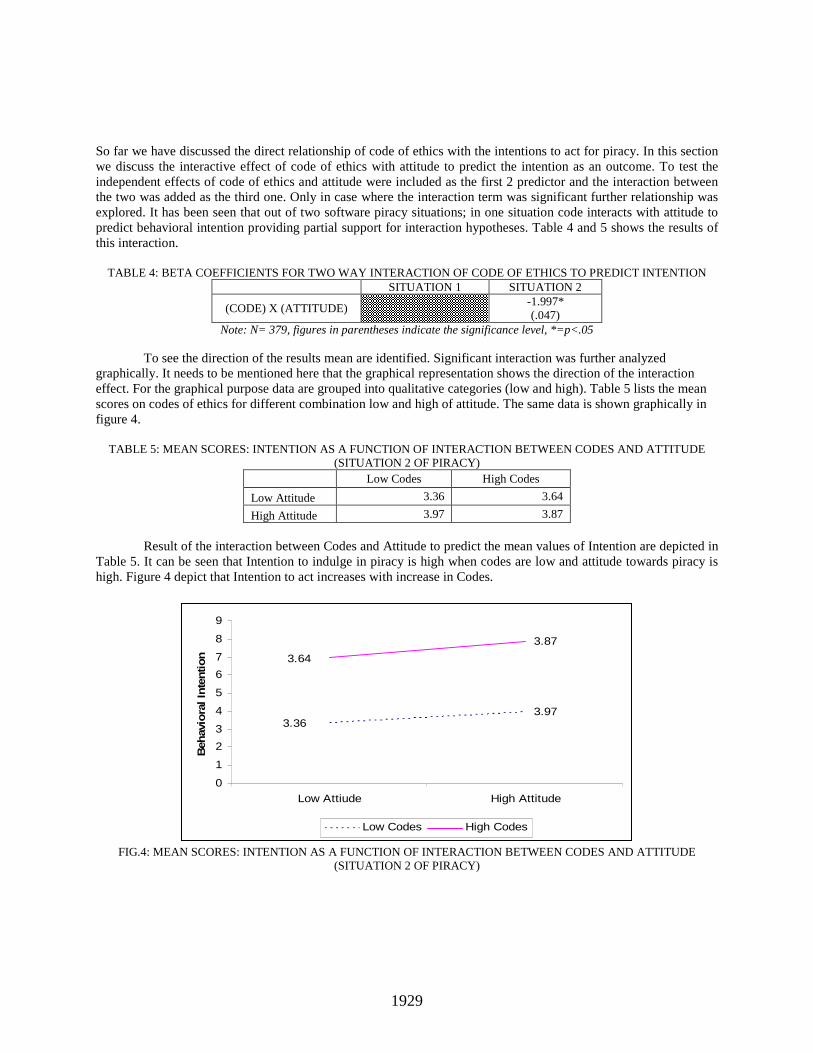
1929
So far we have discussed the direct relationship of code of ethics with the intentions to act for piracy. In this section we discuss the interactive effect of code of ethics with attitude to predict the intention as an outcome. To test the independent effects of code of ethics and attitude were included as the first 2 predictor and the interaction between the two was added as the third one. Only in case where the interaction term was significant further relationship was explored. It has been seen that out of two software piracy situations; in one situation code interacts with attitude to predict behavioral intention providing partial support for interaction hypotheses. Table 4 and 5 shows the results of this interaction.
TABLE 4: BETA COEFFICIENTS FOR TWO WAY INTERACTION OF CODE OF ETHICS TO PREDICT INTENTION SITUATION 1 SITUATION 2
(CODE) X (ATTITUDE) -1.997*
(.047) Note: N= 379, figures in parentheses indicate the significance level, *=p<.05
To see the direction of the results mean are identified. Significant interaction was further analyzed
graphically. It needs to be mentioned here that the graphical representation shows the direction of the interaction effect. For the graphical purpose data are grouped into qualitative categories (low and high). Table 5 lists the mean scores on codes of ethics for different combination low and high of attitude. The same data is shown graphically in figure 4.
TABLE 5: MEAN SCORES: INTENTION AS A FUNCTION OF INTERACTION BETWEEN CODES AND ATTITUDE (SITUATION 2 OF PIRACY)
Low Codes High Codes
Low Attitude 3.36 3.64
High Attitude 3.97 3.87
Result of the interaction between Codes and Attitude to predict the mean values of Intention are depicted in
Table 5. It can be seen that Intention to indulge in piracy is high when codes are low and attitude towards piracy is high. Figure 4 depict that Intention to act increases with increase in Codes.
3.97
3.87
3.36
3.64
0
1
2
3
4
5
6
7
8
9
Low Attiude High Attitude
Beh
avio
ral I
nten
tion
Low Codes High Codes
FIG.4: MEAN SCORES: INTENTION AS A FUNCTION OF INTERACTION BETWEEN CODES AND ATTITUDE (SITUATION 2 OF PIRACY)

1930
Conclusion In the present study we have taken ethical issues of software piracy and tried to assess the impact of code of ethics on unethical/ethical decision making regarding the issue, at the same time we are also tried to assess the interactive effect of codes with attitude to predict the intention as an outcome.
At the first level, there is a significant correlation between the codes of ethics and intention to act for software piracy. Hence it proves our hypothesis, that the stronger the code of ethics lower will be the intention to indulge in software piracy. Along the direct relationship of formal codes with the behavioral intention to act for piracy in the present study we have also studied the interactive effect of formal codes with attitude to predict the intention as an outcome. Thus our second hypothesis receives only partial support as, the interactive relationship were significant only for the second situation of software piracy. Many researchers have found that a company code of ethical conduct has several benefits to the organization. It helps maintain and promote public trust, promotes “….greater managerial professionalism, protects against improper employee conduct, defines ethical behaviors in light of new laws or social standards, and ensures the maintenance of high ethical, standards in the face of changing corporate culture and structure” Pelfrey and Peacock (1991). In such cases organizations need to have a well-defined policy of personal computing behavior, which should be clearly communicated to its employees. If the organization doesn’t have strong codes and policies, it will give opportunity to its employees to engage in unethical activity of software piracy.
References [1] Ajzen, I. (1989). Attitude structure and behavior. in A.R. Pratkanis, S.J. Breckler, and A.G. Greenwald
(Eds.), Attitude structure and function, Lawrences Erlbaum Associates, Hillsdale, NJ, 241-274. [2] Bequai, A. (1987). Technocrimes. Lexington, MA: Lexington Books. [3] Cleek, M.A. and Leoward, S.L. (1998). Can corporate codes of ethics influence behavior? Journal of
Business Ethics, 17, 619 – 630. [4] Conner, R.K. and Rumelt, P.R. (1991). Software piracy: An analysis of protection strategies. Management
Science, 37 (2), 125 – 139. [5] Cressey, D. and Moore, C. (1983). Managerial values and corporate codes of ethics. California
Management Review, 25, 53-77. [6] Fishbein, M. and Ajzen, I. (1975). Beliefs, attitude, intention and behavior: An introduction to theory and
research, Boston, MA: Addison- Wesley. [7] Glass, R.S. and Wood A.W. (1996). Situational determinants of software piracy: An equity theory
perspective, Journal of Business Ethics, 15, 1189 – 1198. [8] Gopal, D.R. and Sander, L.G. (1998). International software piracy: Analysis of key issues and impact,
Information Systems Research, 9(4), 380 – 398. [9] Hegarty, H.W. and Sims, H.P. Jr. (1978). Some determinants of unethical decision behavior: An
experiment, Journal of Applied Psychology, 63(4), 451 – 457. [10] Molander, E. (1987). A paradigm for design, promulgation and enforcement of ethical codes. Journal of
Business Ethics,6, 619-631. [11] Pelfrey, S. and Peacock, E. (1991). Ethical codes of conduct are improving, Business Forum, Spring, 14-
17. [12] Pierce, A.M. and Henry, W.J. (1996). Judgments about computer ethics: Do individual, co- worker and
company judgments differ? Do company codes make a difference?. Journal of Business Ethics, 28, 307 – 322.

1931
[13] Prislin, R. and Ouellette, J. A. (1996). When it is embedded, it is potent: Effects of general attitude embeddedness on formation of specific attitudes and behavioral intentions, Personality and Social Psychology Bulletin, 22, 845-861.
[14] Schultz, P. W. and Oskamp, S. (1996). Effort as a moderator of the attitude-behavior relationship: General environmental concern and recycling, Social Psychology Quarterly, 59, 375-383.
[15] Shore, B.; Venkatachalam, A. R.; Solorzane, E.; Burn, M. J.; Hussan, Z. S. and Janczewshi, J. L. (2001). Softlifting and piracy: Behavior across culture. Technology in Society, 23, 563 – 581.
Contact authors for complete list of references.

1932
Integrating Digital Forensics into the Workplace
BJ Gleason, [email protected] University of Maryland, USA
Abstract More crimes than ever before are leaving a trail of digital evidence behind. However, if an organization is not prepared to recognize, preserve, collect, and analyze this evidence, the criminals may never be caught. Now, more than ever, organizations need to take a proactive approach and start integrating digital forensics processing into their standard operating procedures. However, by the time investigators arrive at the scene of the digital crime, the evidence often has been wiped clean. This paper examines the issues and difficulties faced by organizations trying to incorporate digital forensics into the work environment. The author also proposes a new methodology for collecting and preserving potential evidence before an incident even occurs. Introduction Although it is easy to believe that most of the computer attacks originate from outside one’s network and organization, the truth is often just the opposite. While an exact number is not known, computer crimes performed by insiders accounts for 50–85% or more of all computer crime (Whitman & Mattord, 2007). While the actual malicious attacks by insiders appear to be fewer in number, there have been numerous cases of pirated software, child pornography, mishandling of classified data, computer viruses, Trojan horses, and copyright infringement (Little, 2005; Svan, 2006; Wait, 2006; Weckerlein, 2006). Crimes and attacks are being committed on both sides of the network, by insiders and outsiders, and they all have to be properly addressed, since all represent real threats to the operations, stability, and security of the computing environment.
Whether collecting physical evidence, such as fingerprints or DNA, or digital evidence, an investigator must follow certain laws and procedures. Digital forensics is the application of methodical investigatory techniques to solve criminal cases involving computer systems (Casey, 2004). Digital forensics deals with the preservation, identification, extraction, documentation, interpretation, and presentation of data collected from a computer system. Digital evidence is hard to destroy but easy to damage. If not collected and preserved properly, the evidence, digital or otherwise, often cannot be used in a legal proceeding (Casey, 2004; U.S. Department of Energy, 2000; Vacca, 2005; Whitman & Mattord, 2007).
The National Institute of Standards and Technology has recommended that all organizations start incorporating digital-forensics processing into their incident-handling procedures (as cited in Kent, Chevalier, Grance, & Dang, 2006). In addition to the precautionary measures that sure procedures provide in the event that legal actions are necessary, forensic tools and techniques can be used for data recovery and troubleshooting. The major premise of Kent et al.’s report, however, was that “organizations should ensure that their [information technology] IT professionals are prepared to participate in forensic activities” (p. ES-2). They stressed that incident handlers and first responders should receive forensics training and education so they know what they should and should not do when responding to a potential incident. They need to be prepared to cooperate with law enforcement and to make sure that they do not hinder the investigation or damage the evidence. Digital evidence collection, preservation, and analysis are complex and time-consuming tasks. Forensic training is demanding and costly. The U.S. military faces even more challenges and problems with their global operations, shifting assignments, frequent rotations, and a constant barrage of cyberattacks from virtually every country on the planet.

1933
The Growing Problem The threat to the military’s computer infrastructure is growing daily. In the 1980s and 1990s, most of the threats seemed to come from teenaged hackers who saw breaking into computers as a rite of passage (McCormick, 1996) and gaining access to the Pentagon as the Holy Grail (Christensen, 1999). Often, however, intermixed with these teenagers were terrorists, both foreign and domestic, with other agendas. Although the numbers are hard to come by for security reasons, according to a report in Newsweek (Vistica, 2000), the Pentagon computer systems were attacked over 250,000 times a year. At least 500 of those are considered to be serious attempts aimed at classified computer systems (Vistica, 2000). As the result of a major international taskforce, the leader of a Romanian computer hacking team was just charged with breaking into more than 150 U.S. government computer systems. It is believed that the main reason the group kept attacking U.S. government computers systems is that they are considered to be “some of the securest machines in the world” (Associated Press, 2006).
In addition, computer hacking has become state sponsored, with many counties establishing information warfare teams to penetrate other countries’ computer networks. Dr. Byeon Jae-Jeong of South Korea’s Defense Ministry's Agency for Defense Development (as cited in "N. Korea's Hackers Rival CIA," 2005) indicated that his analysis of the 500- to 600-member North Korean hacker unit revealed that they had abilities comparable to those of the Central Intelligence Agency and could take over the U.S. Pacific Command and Control Center as well as the power grid for much of the United States. These North Korean hackers may be responsible for a 450% jump in attacks on computers in South Korea in 2003 (Magnuson, 2006). Although not widely discussed, it is well known that China, while enjoying status as a “most favored nation” trading partner, has been hacking into military computer systems for years (Thornburgh, 2005).
Whereas at first it seemed as if the hackers simply wanted to steal secrets or shut down the systems, it now appears they have more devious purposes. The computers are hijacked and used by the hackers for identity theft, spying, theft of information, distributed denial of service attacks, and as zombie servers (Magnuson, 2006). Incorporating Digital Forensics in the U.S. Forces Korea
The U.S. Forces Korea currently has only two fully qualified computer forensic specialists supporting over 26,000 computers. Thus, it is often impossible to respond properly to all the potential incidents that would require digital-forensic processing in a timely and efficient manner. To assist the forensic specialists, a small team of 10–20 IT specialists spread throughout the country can be called upon to perform some typical, first-responder data collection tasks.
Under the current system, local first responders are contacted by the Regional Computer Emergency Response Team (RCERT) when they have detected an anomaly on the network that needs to be investigated. The RCERT typically specifies the target System of Interest by its Internet Protocol address. The first responder must determine the machine’s physical location and then, schedule permitting, travel to the System of Interest, which can be located anywhere on the Korean peninsula, and run a program to collect the system logs. Depending on their other duties, the time of day, and other factors, the time elapsed from receipt of the call until the logs are collected can be up to 48 hours. Once the logs are collected, they are e-mailed back to the RCERT for analysis to determine what additional actions, if any, need to be taken next. If the incident is deemed severe, and the system is to be seized, the responder is contacted, and the process is repeated. This time, however, upon arriving at the site, the computer is shut down, seized, and turned over to the forensic specialists. This entire process, from first call until seizure, can span a week or more (R. Henderson, personal communication, October 15, 2006).
During that time, no additional controls are being enforced on who is using the computer system. During the process of normal daily operations, thousands of files are being created, destroyed, overwritten, and modified. Potential evidence is lost or damaged, and since no chain of custody has been initiated, much, if not all, of the evidence collected from the system will be useless in a legal proceeding (Casey, 2004; Vacca, 2005).
If and when the computer is seized, the user is often left without a computer system, and all of the user’s documents and e-mails have been taken along with the system. In some cases, the computer is not seized, but the
1934
hard drive is wiped and the operating system reloaded to ensure that all traces of malicious code or classified data are erased. This procedure has the side effect of removing all of the user’s data as well (A. Johnson, personal communication, November 1, 2006). These “slash and burn” techniques are being used for several reasons: None of the incident responders have any formal forensic training, there is a heavy workload, and wiping and reloading the system typically is the fastest way to close out the incident (R. Henderson, personal communication, October 15, 2006; A. Johnson, personal communication, November 1, 2006). However, in the process, almost all of the digital evidence is lost, making it almost impossible to perform any true forensic analysis or even a simple root-cause analysis to find the initial vector of the problem, in order to prevent a recurrence (Whitman & Mattord, 2007). Preparing the Troops A potential solution to this problem would be to identify more IT specialists who perform first-responder duties and to provide them with training on the proper collection of digital evidence. If enough first responders could be trained, the workload should be decreased, and the evidence should be preserved properly, allowing for a more detailed analysis, while restoring the user’s system to an operating state. An additional benefit to preserving the digital evidence would be to include a copy of all the user’s files and e-mails, which then could be returned to the user, provided those files were not directly involved with the incident.
Each unit in the military has at least one information management officer (IMO) who is the equivalent of the system administrator in the corporate environment. The IMOs are typically the first people called when users are experiencing problems with their computers. When IMOs arrive at the site, their primary goal is to correct the problem and get the system back online as soon as possible. However, if they detect any potential signs of suspicious computer activity, they have to secure the computer until they receive further guidance from an information assurance manager or the RCERT. A conflict can occur because a mission-critical system often needs to be brought back online as soon as possible, but that process typically destroys any digital evidence on the system.
Although the IMOs receive some required online computer security training, the bulk of their computer security training is done during a 2-week training class offered three or four times a year, schedule permitting. As most IMOs are only in Korea for a 1-year tour of duty, they may not receive any training for up to 4 months, depending on when they arrived. Moreover, this course focuses only on the general legal aspects of computer investigations and does not address evidence-preservation issues and techniques (P. Riopel, personal communication, August 17, 2006).
According to the Federal Bureau of Investigation, the amount of digital evidence processed from Fiscal Year 200 to Fiscal Year 2005 has increased 3,060% to a staggering 1,426 terabytes of data. During the same time, the number of forensic examiners only increased by 182%, to a total of 264 (Talley, 2006). Shreeve (2005) also indicated that the field is growing at an exponential rate, and that police and government agencies are not prepared to handle the increase. In fact, a large percentage of cases dealing with digital evidence are being outsourced to private organizations, due in part to the lack of properly trained law enforcement professionals and increasing demand for digital-evidence processing.
To address the growing interest in digital forensics, many colleges and universities are implementing digital-forensics programs (Gottschalk, Liu, Dathan, Fitzgerald, & Stein, 2005), but many of these are multiyear programs and go far beyond the scope of what would be needed by IMOs to collect digital evidence. Unlike what is seen on TV shows such as “CSI,” most crime-scene technicians only collect the evidence and do not analyze it—that is the job of the forensic specialist (Horswell, 2004; Roane & Morrison, 2005; Saferstein, 2004). The IMOs would play a similar role; they would be responsible for the proper collection of digital evidence. This would require only what Armstrong and Russo (2004) referred to as a Level 1 education, typically required by new recruits and police officers on the beat.

1935
A Proposal: The Digital Forensic Precrime Evidence Collection Unit
In the 2002 Steven Spielberg, film, “Minority Report,” loosely based on a Philip K. Dick short story, Tom Cruise stars as a “precrime” officer, who, with the use of psychics, can predict when a crime is going to happen. Using sophisticated computer technology and a team of specialists, his precrime task force is able to get to the scene just before the crime is committed, save the victim, and arrest the soon-to-be perpetrator. No matter what precautions we take, some attacks are going to break through our defenses. Due to the nature of the attacks—zero-day exploits, the time to find solutions, time to implement fixes, and so on—it may be days if not weeks before the malware or an incident is actually detected on a system. In a recent attack by the polymorphic Storm Worm, the worm had created over 42,000 variants of itself during 12 days in order to evade detection, and it worked. The worm was able to evade 27 different antivirus programs; only 4 were able to detect it (Larkin, 2007). The Sony digital rights management software, XCP, installed a rootkit to prevent its discovery and opened up a backdoor on the system; the worm might have gone undetected for up to 4 months before being discovered. It went undetected by all the standard antivirus, malware, spyware, and other security packages. Via an analysis of domain name system requests, the worm infected more than an estimated 500,000 computer systems world-wide, including military and government PCs (Norton, 2005). It was only detected by the author of a rootkit detector program who inadvertently had installed the rootkit on the system on which he was developing the software (Russinovich, 2005). So, not only can these malware packages be residing undetected on systems for days, weeks, or even months, evading all of the sensors, but they also can be causing performance degradation and system crashes. Russinovich (2005) indicated that the Sony rootkit was so poorly written and used such unsafe procedures calls that it would cause the system to crash, resulting in the dreaded “Blue Screen of Death.” Even if the malware does not cause the system to crash, it can slow down the system. If multiple malware applications from competing organizations are loaded, the system can slow to a crawl, becoming unusable. The New Three Rs: Reboot, Reinstall, and Reload When faced with unknown problems, users and technicians alike often apply the same methodology: Reboot, reinstall, and reload. First, they try rebooting the system. It seems to have become common knowledge that rebooting the computer system will fix most problems. Even the helpdesk personnel seem to believe this (Seebach, 2006). Unfortunately, from a forensic point of view, rebooting destroys any evidence residing in RAM. If the reboot does not solve the problem—and with a malware infestation, it typically does not—the user may try to reinstall a specific application that is causing problems or the last application installed. This usually does not help either. If the malware was installed with an application, the malware will stay even if the primary application is removed. With the reinstall or uninstall having failed to make a difference, the next step is the one that does the most damage from the forensic point of view. Given the time pressure to get a system back online, the limited troubleshooting skills of most first-level technicians, and the ease of reloading a standard system image, it is becoming more prevalent to reload the entire system from an image server, such as a Symantec Ghost or Acronis True Image Server. With the user’s data residing on the a local file server, the disk can be wiped, and the operating system and applications can be reloaded from a standard configuration disk image over the network, from a DVD, from a USB hard drive, or from a hidden partition on the system itself. Depending on the size of the image and speed of the channel, the system can be reloaded, rebooted, and operational in less than 20 minutes. However, if an update of the scanning software signature database reveals a malware infection or some other incident involving this specific system, chances are that most, if not all, of the evidence has been eradicated via the reloading of the image. Although it may be possible to use some forensic tools to try and reclaim fragments from the unallocated clusters on the hard drive, it would be difficult to associate those fragments with the event. Implementing a Digital Forensic Precrime Evidence Collection Unit Having experienced too many of those “after-the-fact” moments, the author wished that there was some way to turn back the clock and collect the evidence before the system was reloaded. Thus, a new methodology is being developed to do just that: The “evidence” is collected before the system is reloaded. Of course, this evidence collection is just a precautionary measure, but in several incidents this technique already has yielded positive results.

1936
As noted earlier, one of the primary cornerstones of digital forensic evidence collection is data duplication. However, using even high-speed forensic duplicators, large hard drives can take hours to duplicate and verify, a process that most users would not be willing to tolerate simply as a precautionary measure. Thus, this research has taken a different approach. Before a system is reloaded, the hard drive is replaced with a clean, wiped drive of similar specifications. The old drive is placed in a read-only USB container, and a chain-of-custody form is started. The new drive is loaded with the image, and the old drive is secured. This process only takes a few more minutes than a simple reload but provides numerous advantages:
• The process is simple and should be able to be performed by entry-level technicians with minimal training. • Old drives can be scanned with additional tools unavailable on the original host system. • Old drives can be subjugated to tests that would take too long on the original host system. • As new signatures are released, the old drives can be rescanned. • Old drives are still available for data retrieval, in case the users had stored documents locally. • Old drives should still be forensically sound and unmodified since they were collected. • The old drive is the original evidence, not a copy. The chain of custody has preserved its integrity. • The process provides a larger window of time in order to conduct the investigation • After a set time frame, perhaps 90 days, drives not involved in ongoing cases could be wiped and reused.
Despite some additional costs associated with this methodology, such costs would be reasonable. They would vary, of course, with the size and type of hard drives in the organizations, the retention time frame, and how often the systems were reloaded. Yet, even 100 hard drives of 160GB would only cost approximately $6,000 in addition to the other forensic tools and software already acquired.
This is a new methodology, and developers are still consulting with legal counsel. So far, it is believed to be legally sound, provided certain precautions are taken. This process has to become part of the standard operating procedure and has to be applied to all systems. It needs to be fairly automated and consistently performed. Once the old drives are acquired, they should all be treated the same, unless the additional scans or tests indicate otherwise. They must always be in a read-only container, and the chain of custody should be maintained. In these cases, the old drives could still be used in legal proceedings and treated the same as archival backup tapes and files, such as in the cases Medtronic v. Michelson (2003), Zubulake v. UBS Warburg LLC (2003), and Alexander v. Federal Bureau of Investigation (2000).
This methodology also should address the concerns stated by the National Institute of Standards and Technology (as cited in Kent et al., 2006). Kent et al. indicated that step-by-step procedures should be developed for routine tasks: “Guidelines and procedures should support the admissibility of evidence into legal proceedings, including information on gathering and handling evidence properly, preserving the integrity of tools and equipment, maintaining the chain of custody, and storing evidence appropriately” (p. ES-2).
Although employees have a Fourth Amendment right to a reasonable expectation of privacy in the workplace, that right is not absolute. Cases such as O'Connor v. Ortega (1987), United States v. Simons (1998), and United States v. Monroe (2000) have sided with the employer and the government. For the most part, if a technician discovers an illegal activity during the normal course of events, investigation is acceptable and admissible. However, it is important to make sure that technicians do not just start “poking around” in these hard drives looking for evidence, which would clearly violate the employee’s expectation of privacy. Before implementing any potential evidence collection methodology, organizations should review it with legal counsel.
About the Author BJ Gleason is a Ph.D. candidate in Information Science at Nova Southeastern University and currently working as a System Administrator for Group W, under contract to the U.S. military in Korea. Mr. Gleason has taught undergraduate computer science courses at the New Jersey Institute of Technology and The American University in Washington, DC, and is currently an Adjunct Associate Professor with the Asian Division of the University of

1937
Maryland, University College, in Seoul. He is a Certified Computer Examiner, International Society of Forensic Computer Examiners.
References [1] Alexander v. Federal Bureau of Investigation, 194 F.R.D. 299, 304 (D.D.C. 2000). [2] Armstrong, H., & Russo, P. (2004). Electronic forensics education needs of law enforcement. Paper
presented at the 8th Colloquium for Information Systems Security Education, West Point, NY. [3] Associated Press. (2006). "WhiteHat Team" leader charged with hacking government computers. Retrieved
Dec 1, 2006, from the Cable News Network Web site: http://www.cnn.com/2006/TECH/12/01/ hacker.charged.ap/index.html
[4] Casey, E. (2004). Digital evidence and computer crime: Forensic science, computers, and the Internet (2nd ed.). Boston: Academic Press.
[5] Christensen, J. (1999, April 6). Bracing for guerrilla warfare in cyberspace. Retrieved Nov 4, 2006, from the Cable News Network Web site: http://www.cnn.com/TECH/specials/hackers/cyberterror/
[6] Gottschalk, L., Liu, J., Dathan, B., Fitzgerald, S., & Stein, M. (2005, February 23-27). Computer forensics programs in higher education: A preliminary study. Paper presented at the meeting of the Special Interest Group on Computer Science Education, St. Louis, MO.
[7] Horswell, J. (2004). The practice of crime scene investigation. Boca Raton, FL: CRC Press. [8] Kent, K., Chevalier, S., Grance, T., & Dang, H. (2006). Guide to integrating forensic techniques into
incident response (NIST Special Publication 800-86). Gaithersburg, MD: National Institute of Standards and Technology.
[9] Larkin, E. (2007, April 12). Consumer alert: Massive virus outbreak—A quick test by PC World shows that many antivirus programs fail to catch today's nasty Storm Worm variant [Electronic version]. PC World. Retrieved April 14, 2007, from http://www.pcworld.com/article/id,130686-pg,1/article.html
[10] Little, V. (2005, June 17). Yokota airman gets jail time for possession of child porn. Pacific Stars and Stripes, 4.
[11] Magnuson, S. (2006, February). Network vulnerabilities worry Pentagon [Electronic version]. National Defense Magazine. Retrieved November 4, 2006, from http://www.nationaldefensemagazine.org/issues/ 2006/feb/MarineVulner.html
[12] McCormick, K. (1996). Cyberskating: Computers, crime, and youth culture. In G. M. O'Bireck (Ed.), Not a kid anymore: Canadian youth, crime, and subcultures (pp. 349-361). Toronto, Ontario, Canada: Nelson Canada.
[13] Medtronic v. Michelson, 229 F.3d 550, 559 (W.D. Tenn 2003). [14] N. Korea's hackers rival CIA, expert warns [Electronic version]. (2005, June 2). Chosun Ilbo. Retrieved
November 11, 2006, from http://english.chosun.com/w21data/html/news/200506/200506020014.html [15] Norton, Q. (2005, November 15). Sony numbers add up to trouble. Wired. Retrieved April 4, 2007, from
http://www.wired.com/politics/security/news/2005/11/69573 Please contact the author for a complete list of references
1938
The Cognitive Basis of Systems Integration: the Eclipse of “Core” and the Emergence of Redundancy
Massimo Paoli, [email protected]
Simone Poledrini, [email protected] University of Perugia, Italy
Abstract Over the last few years, research has developed a new theoretical framework called systems integration. To date, systems integration has been developed from different perspectives, such as theoretical, historical and managerial. However, not many contributions have dealt with the cognitive aspects of systems integrator. The aim of this article is to shed light on the cognitive aspects of systems integration. In particular, it shows that a systems integrator should retain and dominate, in-house, many knowledge bases and competences as well as a whole range of contexts. In order to do this, firstly, the article defines the key elements of the cognitive nature of systems integration and provides an epistemological reflection on both the personal and social nature of the knowledge involved in successful systems integration. Finally, it attempts to show that strategic control over the technological and commercial evolution of the value chain requires full control of the processes of systems integration. Introduction The objective of this work is to offer some considerations on how the control of systems integration can really be maintained and also on how innovating it is towards more conveniently retained paths. In opposition to the predominant ideology of “core” (by now the common sense of management, especially in Europe), the basic idea is of redundancy, of knowledge basis, therefore of agents as profiles of adequate professional bearers of such knowledge, but also of contexts, “organizational containers”, predisposed to allow agents and their knowledge basis to be integrated in order to construct the fundamental business axis of systems integration. This fundamental axis resides in the capability of vision-construction to change and its marching direction (a change that is used as a “club” competitive strategy).
Inherent evolution and change in the integration system itself, a dynamic activity by its very nature and role, of a systems integrator, are always ready to decline in the mere assembling of parts whose technological course is suggested by others. Nowadays, although systems integration has received much attention from scholars from different perspectives, such as the theoretical one within the context of evolutionary economics (Prencipe, Davies, & Hobday, 2003), the historical one by showing the changing role of individual firms specializing in systems integration (Pavitt, 2003) or the managerial one by showing how systems integration relates to competitive advantage (Prencipe, 2003) the cognitive nature of systems integration has not been focused on enough by scholars. Therefore, the aim of this article is to shed light on the cognitive nature of systems integration.
In order to do this, section 2 provides a simple definition and the historical origin of systems integration. It identifies the main factors that characterised its initial development and explains what systems integration is today. Section 31 gives a definition of the traditional model of individual knowledge, which lies at the basis of the paradigm “efficiency without intelligence”, which is still mainly common sense. In sections 4 and 5, an attempt is made to outline an interpretation of different types of human knowledge, from whose nature other foundations descend from which to choose a “redundancy of intelligence” paradigm as opposed to an “efficiency” one, without forgetting the economic reasons for efficiency, by putting them back in the right place, which is always behind cognitive reasoning. In section 6, we try to focus again on the concept of systems integration which has been too often reduced to a mere problem of design in recent years. In section 7 we try to justify, on the basis of the principle of systems integration control, the superiority of the reasons for the “redundancy of intelligence” in those firms that

1939
want to remain or become systems integrators. Finally, in section 8 we present our conclusions and summarize our main findings. Systems Integration: an Emerging Approach within Industrial Organization According to Hobday et al (2003) systems integrators are those firms that leave part of their production to specialized suppliers but keep their own design and integration capabilities. In other words, the role of a systems integrator can be divided into two main aspects (Prencipe, Davies, & Hobday, 2003). On the one hand, it subcontracts part of its production to specialised suppliers: those companies supplying systems rather than just products, for example, aircraft engine manufacturers that outsource production of parts of their aircraft engine. These aircraft engine components are multifaceted and involve complex technology that needs to be produced by specialists (Prencipe, 2000). This side of systems integration is similar to a (reduced) outsourcing process in which a systems integrator manages a division of labour among a network of specialised suppliers through the value chain.
On the other hand, a systems integrator should have the capabilities and knowledge to integrate and control these systems and to develop design ability. These activities are produced in-house and so this aspect of the organization is similar to an integration process through the value chain. This is the main task of a systems integrator because it allows a systems integrator to control all the value chain. As pointed out by Brusoni et al (2001), the division of labour among firms does not mean a division of knowledge. Indeed, in the case of systems integration, knowledge is maintained and controlled by the systems integrator. Otherwise, a systems integrator would be an assembler of multi-technologies and multi-products. In other words, there is a “big” distinction between an assembler and a systems integrator. The former is able to put together different components and systems of a product, while the latter maintains the capabilities and knowledge to control all the knowledge process through the value chain and in order to introduce new product architectures.
Following the concept of architectural knowledge (Henderson & Clark, 1990), systems integration is the ability to know how to integrate and link together into a coherent whole the new technologies and components as they are produced. To do this, a systems integrator needs to know and control the steps of its value chain (Paoli, 2003). A systems integrator can be seen as a kind of industrial organization with two faces (Hobday, Davies, & Prencipe, 2005): vertical integration and outsourcing. Indeed, as Hobday et al (2005 p.1111) pointed out: “systems integration capability is not merely the counterpart to outsourcing, but the capability needed to manage outsourcing as well as “joint sourcing” and “insourcing” to enable the systems integrator firm to gain the advantages of both outsourcing and vertical integration through different phases of the product life cycle”.
Systems integration was developed for the first time by the American Military Industry, following the Second World War. Mainly, the cold war induced the production of new and sophisticated weapons that needed considerable collaboration among many firms and different subjects. Moreover, new technologies started to cross dissimilar disciplines. Both of these aspects pushed for a new kind of organization that used multidisciplinary groups of researchers and engineers to work together on systems integration. Through it, new skills and knowledge were developed in producing multi-technology and multi-component systems (Sapolsky, 2003).
Over time, engineers, physicists, and chemists joined together diverse tasks to integrate different technologies into one product. They discovered that complex products needed different competences and know-how at the same time, so they formulated a new organization based on a systems engineering-integration approach. This kind of organization was able to manage the complexity of new productions by building teams of engineers, that were composed of scholars from different firms and disciplines, while the previous organization was based on a strict division of labour inside firms and among firms as well (Johnson, 1997).
However, the breakthrough of systems integration took place when the new engineering practices were transferred from the mainly military sector to the civilian one, such as the aerospace industry where some firms were involved in both military and civilian sectors. At that stage systems integration changed from a mere engineering task to a business organization tool and various non-military industries started to adapt their organizations according to the division of labour and knowledge of systems integration, such as Texas Instruments and IBM (Sapolsky, 2003). Indeed, as Prencipe et al (2003) pointed out, systems integration has become a business activity; therefore, it
1940
needs of managerial skills to direct those involved in the systems integration and to increase its internal capabilities of integrating and developing systems. Nowadays, systems integration has became part of the organization strategies within the world’s leading corporations, such as General Electric, Dell, Ford, IBM, HP, Siemens, Nokia, Rolls-Royce and Boeing (Hobday, Prencipe, & Davies, 2003).
Indeed, broadly speaking (Kash & Rycoft, 2000), when products or systems depend, above all, on the production of different technologies and knowledge, for example, to manufacture an aircraft or a space station, firms need various different technologies and capabilities from diverse disciplines. These kinds of products are the combination of systems and each system usually requires different technologies and knowledge to be produced that can only be managed by a systems integrator. The nature of systems integration and the structure of a systems integrator greatly depend on the nature of the knowledge involved to manage the technological evolution of the system. The Traditional Concept of Individual Knowledge The concept of knowledge - of man and within man - has long been the stable center of monumental reflections in various fields. In economy and above all in management studies, its “statute” - or in other words its contents - has never been made overly clear. Even today neoclassical economics, management and, lastly, common sense are based on a conception of individual knowledge which is essentially what was devised in the twentieth century by the epistemology of neo-positivism and logic empiricism; knowledge is made up of information, information has the same nature as knowledge, even if it is found at different hierarchical levels of the cognitive system. Therefore, a coherent togetherness of information (parts of a jigsaw, bits, etc...) forms knowledge.
In other words, it is enough to put the pieces of a mosaic (information) together and knowledge appears as a result of the sum of the pieces. All this is based on the assumption that good common sense would essentially translate to: • reality is outside of us and is accessible, that is to say, it informs us of its sense (by observations or
experiments); • formal (language) systems, that we use to represent theories, describe reality and do so in a way that the first
ones to express it do not have syntactical problems (they can be logical or complete, it is enough to be particularly accurate in elaborating them);
• there are no ambiguities in attributing meaning to theories (also when they are still hypotheses), to observations and to the languages used to describe them; therefore, there are no problems attributing common and shared meanings to theories when they become universal truths;
• from a methodological point of view, it is necessary and sufficient to follow the Aristotelian/Cartesian principles of the distribution of economy solving, or rather, it breaks up the problem, starts to resolve the smallest and easiest problems, when it may seem that it has resolved everything (or a substantial part) it reconstructs, given that to reconstruct is only the analogous opposite to deconstruct (there are no differences in the quality of the process).
In the course of the twentieth century, this explanatory paradigm, that is still the basis of good common sense prevalent also in management, was annihilated by dynamic epistemology. Bachelard (1938; 1953; 1996) has made us understand the inconsistency of the fourth point. Rebuilding is a construction of diverse meanings and it cannot be compared at all to breaking it down. Thanks to this breaking down process we will never know what we lose from the ‘whole’ object of decomposition, given that we break things down when we still do not know anything, while thanks to the re-adding process, re-integration itself will give the observer/re-integrator completely new motives to attribute previously unknown meanings to the whole inconceivable before (it is in any case the systematic principle that the ‘whole’ is more than the sum of its parts).
Duhem (1914) and Quine (1969) dissolved the third point, indicating the impossibility of giving the theory a single heading. Gödel (1931)2 stripped down the second showing how formal systems are complete and how they are contradictory, or are not contradictory, but then must be incomplete. Maturana and Varela have fundamentally dismissed the first by the concepts of autopoietic system and structural coupling. Therefore, we find ourselves

1941
forced again to reconstruct a different meaning to individual knowledge laces, a sense exceptionally rich in implications. Assigning Meanings and the Concept to an Autopoietic System An important part of modern neurophysiological studies point out that individuals are autopoietic systems (Maturana & Varela, 1980; 1987; Varela, Maturana, & Uribe, 1974), that is, brains and bodies that can only operate thermodynamic exchanges with each other and with the environment. Brains are connected by filters that select the stimuli that the central nervous system interprets without the possibility to access reality (i.e. the environment or the world) or the other autopoietic systems (i.e. other individuals). According to this view (also labelled structural coupling) individuals can only exchange thermodynamic expressions like: vibrations in the air (a phenomenon perceived in a very narrow global spectrum of audible frequencies), light in different wavelengths (and also in this case a phenomenon perceived in a very narrow global spectrum of visible wavelengths), chemical particles which make up smells, pressures on the skin (i.e. pressures on our tactile receptive system under the skin).
In other words, individuals can only exchange thermodynamic impulses, supports for “languages”, and supports that we can consider hand in glove with the language3 only by oversimplification. In any case pure languages (sequences of symbols ruled syntactically) are only significant, linguistic expressions, such as words, images, sounds, behaviours, in other words information4. Information cannot give sense, it needs sense. Knowledge is your personal system of meanings. Knowledge is the matrix that allows you: to recognize a sequence of symbols as interrelated to each other and not symbols at random, to form one or more significant transporting piece of information, to apply sense to the significant that transports information (a process depending on your capability to interpret, i.e. on all that you already know).
These significances may become Vivaldi’s Four Seasons or a troublesome noise, the strange look of an anonymous face or the beautiful smile of your son, the sumptuous bouquet of a good wine or the stench of rotten fish, according to the ‘sense’ that it is given by the single individual. It is the individual’s knowledge that gives them some meaning, and only specific meanings. Individuals produce sense even if they do not want to (they think, they know, they learn even if they do not want to); they survive because they produce sense continuously, which is not necessarily the right sense, of course. An autopoietic system can never know if it is right or not, because the sense created about any phenomenon it interfaces is always a hypothesis of the world and it remains forever a hypothesis, whether it is stronger or whether it is weaker. This system is continuous and greatly independent from will because it continuously serves the behaviour of men, their continuous intervention on the world. In fact, individuals always behave, even when they decide not to (even in this case we cannot thoroughly investigate the theme).
Individuals cannot share meanings because they can only “speak about them”, they can emit significance. As a consequence of this regime of exchange, autopoietic systems cannot measure their semantic distance or proximity and cannot communicate and share any meaning but only information (i.e. linguistic expressions) that does not carry any objective meaning per se. In fact, a meaning makes sense for an emitting system and sense for each of the million other systems that receive the meaning. “Red” has a meaning for the emitting individual, and millions of meanings for the millions of potential or actual receivers; thus, it can neither have “one” meaning nor a “shared” meaning. Autopoietic systems making up an organization, therefore, cannot share any rule or any other organisational routine or “memory”; they cannot share any actual vision of the system (product or process), because they do not share meanings. Furthermore, they cannot exchange meanings (not even about “the syntax of the rules” to share in order to form an “organization”), and they cannot exchange meanings about the distance or the proximity of their processes of convergence (if there were one) because they only produce languages, syntax and meanings in a strange spiral cycle in which the more they are aware of the uselessness of the effort to communicate something to someone, the stronger is the effort to communicate5.
We cannot thoroughly investigate the consequences on organization, but this phenomenon allows us to introduce the idea that individuals in social systems (fewer and fewer systems of men, more and more systems of contexts) do not form organizations but systems of relationships among micro-meso-macro-contexts (physical, socio-technical, cultural and so on). The illusion of sharing is often created in organizations by the effort to conform

1942
to what each individual believes to be dictated by the need to co-ordinate behaviour. They are, nonetheless, convergent because they are originated by the same context (constructed by each participant for himself, in parallel, but together in the same context). At the most you have convergence, not sharing, and you have convergence of languages (words, behaviours and so on). It is the same process with which operational slang emerges, for example, or the dialects that are almost transformed into common spirits, the languages of veterans, the languages of war stories (Cohen et al., 1996). The concept of organisation implodes into its action.
The social system (ex-organization) becomes a hierarchical system of continuous "formatting" patterns of action and not a separate entity, which applies such patterns (Argyris & Schon, 1978). In this framework, the system that should be integrated is not out of you, somewhere in an objective reality. It is in your mind. Each individual who takes part in the systems integration process has a different system in mind and, most of all, has a different vision of its conceptual and technological dynamics. It is important not to mistake the actual sharing of significances with the convergence of linguistic behaviour. Many times, the last seems to put even some senses or values in common, but it is a pure linguistic illusion. Language convergence does not mean that you share meanings, and in particular that you share significances about a process like systems integration (and its dynamics).
The system you have produced (product or process) is not the product of shared meanings and it is not in an actual common vision. It lies in its specific design: a more or less sophisticated linguistic product. Like every other linguistic product, the design is a complicated product-artefact. Systems integration is a process and, above all, if you want to use it as a competitive weapon, it is dynamic, like the conceptual and technological evolution of the system. Therefore, it is a complex process. Knowledge as a Process of Processes Involving Systems of Systems Based on Memory
Reflection on individual knowledge needs complexity. Let us attempt to follow a logical, coherent line of thought, especially in trying to compensate for and overcome the considerable difficulties and the traps set by the limitations of any language.
A person’s knowledge is a dynamic and complex system, composed of at least four other large systems: 1. the deep system of meanings which is continuously produced and tied to the self-reference of the psyche6; 2. the system of memory creation-processing-activation processes (use and production of significances); 3. the system of memory processing-activation-creation products7 (from significances to linguistic
expressions/perceptions and vice versa); 4. the system of relationships among 1-2-3.
When the concept of system is given the meaning of a complex unit, because it is intrinsically dynamic, relational (the system emerges from these, and is not seen as the static equivalent of its parts or of its structure) and organized (again, held together by processes), then one has a unitas multiplex (Angyal, 1941). Here, the foremost and fundamental complexity is created by conjugating, in a dynamic relational perspective, the idea of unity with that of diversity, multiplicity and irreducibility of its characteristic unitary “system” properties to its component parts, individuality combined with decomposability (or “quasi” decomposability). The latter, however, is obtained at the price of decomposing and transfiguring the system itself, despite the fact that such a system cannot be reduced to its component parts because the whole is more than the “sum” of its parts (Atlan, 1972; Simon, 1962; von Forester, 1962) and, conversely, the parts cannot be reduced to the system because the whole is actually less than the “sum” of its parts (Morin, 1983).
In order to grasp the nature of the complexity we are dealing with, it is indispensable to appeal to what has been termed the concept of emergence8: a phenomenon linked to the process of transforming the parts into a whole which, by this very process, forms and transforms (transforms and forms) (Le Moigne, 1990, p. 48), maintains and organizes complementary tendencies, creates diversity, forges links between and organizes antagonisms, organizes antagonism within complementarities (Lupasco, 1962, p. 332), controls organizational entropy, allows variety to spread out and repetitive order to be re-established and transformed into organizational reliability, i.e. it is the very survival capacity (Atlan, 1974) of the knowledge-system itself.

1943
In other words, knowledge is the continuous emerging sense of things, meaning that has intrinsic value, independently of how or through what means it is created and stored. Sense is the cornerstone allowing construction of our interpretations of the reality which surrounds us, without which it would be impossible to plan and evaluate our continuous interventions in the world. But how can we be without memory?
“I don’t know – I don’t remember,” are equivalent as far as the execution of any action in this interpreted world is concerned. We certainly have many forms of memory, but today the impression that memory-knowledge is all above “sense-meaning” (emotional as well, obviously9) is clearer than ever. Memories are not files; it is a permanent action of reconstructing meanings. Bringing a memory to mind is therefore an act of “constructing” sense, with certain aspects which are completely invented, true “stopgaps” of memory activation, and not an act of mere “reproduction”. Construction of this largely depends on the meanings (or on the meaningful role) which we would now (and not then) like this memory to have. But while memories based on active contents of an explicit type depend mostly on the state of activation of the memory (it’s easier to forget), the long-term knowledge-abilities which are activated by procedural memories are almost never forgotten; on the contrary, even after a long period of non-utilization, when the activity is resumed, the ability is restored – barring some initial difficulty which is rapidly overcome – practically at the same level at which the ability was “left off.” This is true in the motor sense – simply think of riding a bicycle – as well as in the interpretive sense; just thinks of one’s ability to solve polynomials or equations, or of diplomatic mediation.
Procedural knowledge-memories (and declarative long-term memories) seem to be more important to us, and have pre-eminence over others (always from the viewpoint of survival of the autopoietic system); precisely because they make us “proactive” with respect to the environment itself, to such an extent that we sometimes believe we “control” it. Knowledge-memories either have a “sense” or they do not survive long, or are actually never even formed. If you accept all this reasoning, what are the consequences for companies that aim to control and drive the technological dynamics of their multi-tech systems’ (products/processes), or, in other words, in this regime of the nature of knowledge, how is it possible to maintain the control of systems integration? Systems Integration
The systems integration process is a meta-super-cognitive-negotiative-dynamic process among individuals distributed in several firms’ contexts that are composed of specific physical attributes, but also of the knowledge of the agents themselves, their linguistic interactions, their organizational rules, incentives, power distribution, beliefs, myths, cultures and so on (the constituents of the "formatting" power "in" and "of" these contexts).
Agents can construct at the same time the systems integration process of a multi-technological artefact (process or product) and as a consequence its global evolutionary path. The dynamics of the artefact-product/process-system, in fact, arises from the joined and superimposed technological trajectories of the whole and its parts. Moreover, it is the result of multidisciplinary convergence-divergence and integration-disintegration, both at the technological and scientific level. This phenomenon constitutes a further level of evolution, endowed with the remarkable generative capacity of: a) autonomous scientific and technological trajectories-opportunities, b) continuous reconfiguration of the dependence and influence of relationships between scientific and technological fields. Regarding the latter, it is worth highlighting that it greatly affects to a great extent the dependence and influence that relationships have among system, subsystems and parts.
In this light, the evolution of the product/process-system (and, therefore, the activity of systems integration) can be identified as a continuous destruction-reconstruction of hierarchical and functional orders which over time affect the ways of the conceptual and ideal decomposition10 of the product-system itself. In this framework, systems integration is a macro-process of conceptualisation, by which several problems regarding the design of the product or the engineering of its manufacturing may emerge, but the relationship between the dynamic of the conceptualisation and the following problems of design is the same as what you can observe between knowledge and the linguistic artefacts called information. Thus, systems integration can never be reduced to a problem of design, even if it may be expressed only by design, just like knowledge that can never be reduced to information-language, even if it may only be expressed by language.

1944
In this framework, we introduce the key distinction between the capacity of designing and producing the product-system, which is at the most complicated11 (a product/process design completed in every aspect is only a complicated linguistic artefact), and the effort to master systems integration and its evolutionary dynamics which is the complex strategic problem12. In effect, understanding which step is best to take along the invented trajectories of parts, the trajectories of the system, the trajectories of the relationships between parts and system, the trajectories of systems integration, is actually a complex construction. At this point it may be useful to establish, with a certain degree of automatism, a corresponding classification of agents’ constructions. More specifically, one finds two contrasting orders of complication/complexity for the composition of observed systems (Le Moigne, 1990, p. 27):
TABLE 1: TWO DIFFERENT ORDERS OF CONSTRUCTING (COMPLICATION/COMPLEXITY)
System/Phenomenon Representation System/Phenomenon Representation
Decomposable Complicated Indecomposable Complex
By Disjunction Application/decomposition By Conjunction Combination/composition
Decomposed Simple Indecomposed Implex
The complicated construction-model obtains by the simple view of the “fragmented” (reduced) phenomenon disjunction-decomposition. The complex construction-model obtains an implex vision (non-decomposable) of a non decomposed phenomenon by composition-combination. The former may be decomposed and the job divided (to photocopy a great number of pages, for example), the latter cannot be decomposed and it is much better if you do it by yourself (to write a paper, for example).
Any process of modelization, however much it makes use of sophisticated forms of codification and language, is an eminently and irreducibly “personal” process through which different alternative readings-interpretations of phenomena can be created. This means that there are no complex phenomena, but complex constructions of phenomena that have been observed, i.e. created, (dans notre tête). We can outline the creation process (and complexity creation) as the flow of becoming what relinquishes the idea of analysis of something perceptible in order to assume the idea of intentional constructive conception (deliberately systemic), which is in turn composed of instrumental representations of phenomena created and understood as complex and, therefore, indecomposable except at the risk of mutilations. Such a process consists of the transition (Le Moigne, 1990, pp. 27-28,) from the figure of the analyst to that of the conceptualizer-constructor, from the decomposable object to the conceivable project, from decomposition into simple passive elements to composition of implex actions.
Firms, as social systems composed by autopoietic systems, can deal with the problem of mastering the systems integration process (and its dynamics) only by creating complexity in the constructions13 that they build and that in some ways affect the path (or, more precisely, the paths) of the product-system’s change. Constructions are the result of hard, more or less chaotic/ruled negotiations, among agents in an organization legitimated to speak about the technological trajectories that the systems (and therefore the systems integration) potentially could assume.
For these reasons, the task of system companies is to keep redundant knowledge bases in house. It is worth underlining, however, that the judgment on the importance of the knowledge basis relies heavily on the complexity that the system company has been able to create in the past. But it is for greater convenience that we are using (and we shall use later on) the label "system company". In effect, we always refer to the continuous negotiation among "visions" of individuals (autopoietic systems) in the organizations of those firms, and the continuous dynamics of their knowledge basis. There are not "firm" knowledge bases; there are only knowledge bases possessed by men. The path we are referring to is the path of each of their knowledge bases and the path of the equilibrium points to which negotiations among these visions in the organizations converged over time.
This path, which is ex-ante uncertain and non-definable, is the process of the evolution of the artefact envisaged by the system company and selected in the marketplace. Even if the historical path of the organization and the effectiveness-efficiency achieved by the organizational mechanisms are of great importance, the latter has to be distinguished by the technical-scientific ‘quality’ of the individuals belonging to the organization. The knowledge basis possessed by individuals, the history of these and their organizations, find the roots to create complexity. In other words, the knowledge bases should be considered as generators of the complexity required to create the

1945
evolutionary path (or paths) of the systems of systems. To create complexity means to generate a greater number of different potential states of the world, that is to say, technological alternatives for parts, subsystems, and the whole architecture of the system, and their relationships, for the future "n" time units, during which you imagine the evolution of the system itself.
An important part of knowledge basis consists of expertise, that is theoretical elaboration and hands-on knowledge which is heavily dependent on the generative contexts it refers to14. Moreover, in this framework, the distinction between knowledge related to the nature of the nature (scientific knowledge usually deriving from fundamental or long-term research) and ways of manipulating it (technologies commonly growing out of applied research and industrial development) tends to blur and, as a consequence, gives rise to unitary and global knowledge which is no longer decomposable. This process ends up being both effect and cause of the emergence of a new concept of integrated and trandisciplinary knowledge, that merges from methodologies and sociology of classic sciences, but it is triggered by applications with which the emergence of scientific-technological disciplines (science-tech) are associated15.
To be able to command its integration and, therefore, its evolution, it is necessary to: possess the knowledge basis regarding the subsystems, possess the knowledge basis regarding the architecture of the system which represents a separate part of the system itself, command knowledge bases regarding the interfaces among different technologies which the system’s architecture anticipates. But what does possessing the knowledge basis to be able to generate effective competence and specific ‘know-how’16 mean for a business? According to the definitions we have given in this paper it means that in a business-organisation there are men with profound knowledge at least in the single and fundamental scientific-technological disciplines for the forming of a knowledge basis (of the subsystems, architecture and of interfaces). Moreover, the organisation places at its disposal the contexts (laboratories, product processes, organisational machine rules, work methodologies, incentives, languages, schools, economic resources, power and dynamic distributions, paradigms, myths, beliefs, stories, etc.) necessary to be able to express such knowledge (we go from individual to multidisciplinary17 task forces, an interdisciplinary18 team, a stable trans-disciplinary19 group).
In any case, knowledge to support the capacity of systems integration emerges from the application of all knowledge in all effective contexts (not only in R&D, but also in the production of the components and of the system, in the planning, etc.) on the basis of the re-composition that we can imagine, given the system’s breakdown which is carried out in order to reconstruct. All these are activities that can clearly be described as the fruit of interactions among agents, physical systems and other people in a specific context (Greeno & Moore, 1993, p. 49; Vera & Simon, 1993, pp. 46-47), namely that pertaining to the specific agent. If the latter is a social system or an organization20, then the overall picture also includes the fact of its “being” history and the developmental path of its routines, of its decision-making mechanisms and the roles of the different interest or power groups and ideologies (taken as the ideal direction to which visions of the future should point) present in the organization itself21.
Thus, if you do not keep a sufficient number and variety of redundancy contexts in the firm, you drastically diminish your capability of systems integration (you are moving towards roles of assembling, not systems integration). But such capacity diminishes whenever you gain knowledge. It diminishes without anyone being aware of it. It is the metaphor of the blind man who does not know what he does not see. So, whoever loses contexts loses knowledge connected to them, and becomes less and less capable of constructing complexities in his interpretations of the integration system and, therefore, of the evolutionary dynamics of the system, but knows less than what he thinks he may know or know nothing at all. Awareness appears individually when someone who we have always beaten (perhaps at chess) finally beats us. It happens from a social point of view (perhaps playing football) when the team that has never won before finally beats us.
However how many defeats will make it necessary to become aware that it was not fate or anything else. Also, in a special way, in the case of businesses, how many signals will be wasted before someone realises that defeats are the effects of a loss of competitive ability due to a lack of knowledge, due to the loss of context, perhaps in homage to the ways of outsourcing, of making core choices, of creating a lean or flat organization. They are certainly themes that cannot be underestimated but also bases for choices with strategic consequences that cannot be underestimated either.

1946
The Relevant Strategic Problem: Maintaining Control of Systems Integration Not only does knowledge tend to be represented even more in unique (transcending the classic base-applied dichotomy) and transdisciplinary (transcending the classic boundaries between disciplines) ways, but it is even more important if the linguistic outcomes of cognitive activities (not only R&D, but also design, production marketing and so on) are more or less appropriable in economic terms, the cognitive processes that may lead to processes of production of knowledge (in its articulations, bases, competences, expertise) are always appropriable because they are agent-specific and therefore firm-specific. In fact, competencies and historical paths of learning are specific to each autopoietic system forming the social group called "organization". They are linked to the evolution of organization and to the system company’s specific organizational setting in terms of number, variety, redundancy of (cognitive) contexts and their constituents. The latter, in their turn, can be considered as generators of robust views of the world or, rather, of richer constructions of possible options in its evolution. The more the processes have completely been internalized over time, the deeper those possible options are rooted.
Bearing these things in mind, we can apply this summarizing scheme to a systems integration ‘cognitive’ strategy that we can put forward as an exemplary case: • Given a product/process-system or its family; • Its systems integration evolutionary dynamics, conceived as an ability to introduce innovations (to be measured
not only in quantitative terms, incremental or radical, but also in qualitative terms, modular, interface, architectural, systemic) and, therefore, as a capacity to compete through and by means of innovation, can be described with complex models22. These models are specific to those particular individuals and through organizational specifications of those particular groups in specific organizational contexts in which those particular individuals are working;
• The degree of complexity of those constructions is a function of processes of relevant knowledge which are absolutely tacit in nature. Moreover, complexity depends on specific situations: (1) of the two way (circular) relationships among scientific (and its state, namely descriptive, predictable, etc..), technological, applied, and integrated knowledge (Reismann, 1992, p. 110), and (2) of elaboration of experience (all contained in contexts);
• In any case, regarding the system companies’ abandoning support to cognitive processes and context activities (R&D for example, but also manufacturing of components and subsystems) and shifting towards a general assembling organization means losing the capacity of modelling the possible evolution of the systems integration. Put differently, this leads to the often irreversible loss of the ability to create complexity in modelling the evolutionary path of the system and, as a result, to the loss of strategic control of the evolution of its integration. The actual risk is that you could lose the role of systems integrator23, becoming a simple assembler without you realizing it24.
Naturally, other considerations, predominantly economic or strategic, may, in any case, lead to the adoption of different or alternative solutions concerning structure, level and nature of vertical integration and/or of the various possible internalizations. But from the point of view of experience-expertise and of the knowledge necessary for strategic dominion over evolution of the artefact-systems integration, it may prove to be extremely dangerous to entertain the illusion that the cognitive results (of R&D for example) can systematically be purchased-transferred (which would mean disregarding the fact that the underlying processes cannot be bought-transferred), just as it would be equally risky to believe that the division of innovative labour and of labour in general, together with the sale or transfer of innovative activity and manufacturing techniques (above all if accompanied by abandonment of research and design efforts) need not be systematically considered as the surrender of cognitive processes, a transfer of generative contexts25, jeopardizing world-creating ability. Failure to realize this peril would inevitably result in diminished capacity for the “imagination-creation” of alternative paths of opportunity. The costs and strategic implications of such transfers (or more generally, of non-possession, even if seen in a networking context) should always be evaluated in and by the decentralizing decision-making processes in such a way as to mitigate the weight of “economicistic” evaluations and, thereby, extenuate the idea that networking to the point of virtualizing systems integration is also systematically virtuous (Paoli & Prencipe, 1999).

1947
The ability to retain institutional continuity depends primarily on learning from experience, in cumulated expertise and capacity to integrate of diverse knowledge bases26. Such ingredients make it possible to engage in strategic elaboration in order to overcome the distinction between content-process and context of strategic elaboration itself (Dodgson, 1989, pp. 1-10). This is because learning about the context defines the content of innovative strategic behaviour, while implementation of the latter, with the ensuing learning, redefines, or rather, re-creates a new context, thereby blurring the demarcation between the definition of the content of technological strategy and its implementation27. Without experience there can be no learning (non decomposable and therefore non-sharable unitary processes), and without learning there is a failure or, at the very least, a decrease in the capacity-ability to continually re-create the spectrum of exploitable opportunities along the path that is continually being re-created. Such a spectrum must possess the breadth required by current competition conditions, or required by the strategic position the firm has assigned itself in a more or less illusory fashion. This means that it could, in fact, be pointless for a firm to specifically adopt a strategic position of being offensive, defensive, leader or follower, broad or narrow front (Harris, Mowery, & Pavitt, 1990, p. 24), because this will, to a large extent, depend on the nature and level of integrated-accumulated knowledge bases and competences (Dodgson, 1989, p. 4) (held in common, not sharable in a network) which, taken together in specific but adequate contexts (in-house), endow a firm with greater - or lesser - capacity to maintain the control and direction of systems integration, to create technological and market opportunities for subsequent exploitation, as compared to its competitors, and enable the firm to be more - or less, as the case may be - dynamic, broader or narrower in its spectrum (different technologies, different scientific fields, integration of technologies and spectrum, etc.). Conclusion We have argued that in complex products and systems and other high-technology goods, systems integrators control the dynamic trend of technological trajectories of multi-component and multi-technology goods. Moreover, the role of a systems integrator is to manage the control of trajectories of systems integration itself. Therefore, a systems integrator differs from an assembler, because the latter is not able to control the dynamics behind systems integration throughout the entire value stream.
In addition, we proposed that at the base of systems integration capabilities there is an emerging view of knowledge as redundancy of intelligence. This concept underlines the role and importance of structural coupling in understanding the role of systems integrator and organizational context as containers that allow agents to produce their knowledge. In other words, systems integration is the capability of constructing visions of technological trajectories within a value stream of critical components, parts and subsystems.
The concept of redundancy of intelligence is based on a vision of knowledge that is different from the traditional one. Basically, as we imagined, the latter considers knowledge and information to be similar and it does not take into account the importance of context in developing the knowledge of each agent, while the former perceives individuals as bearers of knowledge and organizational contexts as the “place” where agents develop their knowledge.
References
[1] Argyris, C., & Schon, D. A. (1978). Organizational Learning: A Theory of Action Perspective. Reading:
Addison-Wesley. [2] Atlan, H. (1974). On a formal definition of organization. Journal of Theoretical Biology, 45, 1-9. [3] Bachelard, G. (1996). Le nouvel esprit scientifique. Paris: PUF. [4] Brusoni, S., Prencipe, A., & Pavitt, K. (2001). Knowledge specialization, organization coupling, and the
boundaries of the firm: Why do firms know more than they make? Administrative Science Quarterly, 46(4), 597-621.

1948
[5] Cohen, M. D., Burkhart, R., Dosi, G., Egidi, M., Marengo, L., Warglien, M., et al. (1996). Routines and Other Recurring Action Patterns of Organizations: Contemporary Research Issues. Industrial and Corporate Change, 5(3), 653-698.
[6] Dodgson, M. (1989). Introduction: technology in a strategic perspective. In M. Dodgson (Ed.), Technology strategy and the firm: management and public policy. London: Longman.
[7] Duhem, P. (1914). La théorie physique: son object et sa structure. Paris: Rivière. [8] Gödel, K. (1931). Über Formal Unentscheidbare Sätze der Principia Mathematica und Verwandter
Systeme. Monatshefte für Mathematik und Physik, 38, 173-198. [9] Greeno, J. G., & Moore, J. L. (1993). Situativity and Symbols: Response to Vera and Simon. Cognitive
Science, 17, n°1(Special Issue: Situated Action), 49. [10] Harris, R. G., Mowery, D. C., & Pavitt, K. (1990). Strategies for innovation: an overview. California
Management Review, 32. [11] Henderson, R. M., & Clark, K. B. (1990). Architectural innovation: the reconfiguration of existing product
technologies and the failure of established firms. Administrative Science Quarterly, 35, 9-30. [12] Hobday, M., Davies, A., & Prencipe, A. (2005). Systems integration: a core capability of the modern
corporation. Industrial and Corporate Change, 14(6), 1109-1143. [13] Johnson, S. B. (1997). Three approaches to big technology: operations research, systems engineering, and
project management. Society for the History of Technology, 891-916. [14] Kash, D. E., & Rycoft, R. W. (2000). Patterns of innovating complex technologies: a framework for
adaptive network strategies. Research Policy, 29(7-8), 819-831. [15] Le Moigne, J. L. (1990). La Modélisation des Systèmes Complexes. Paris: Bordas. Contact authors for the full list of references
End Notes
1 All these considerations are more developed in Part I of Paoli (2006). 2 See Nagel and Newman (1992, p.93). 3 In this chapter we do not have the opportunity to develop this problematic level of the relationship between supports and languages. 4 In this framework, knowledge does not have the same nature as information. The first is pure sense and it cannot be shared, the second is language, syntax, information carried by meanings without any objective sense, vehicles that transport symbols (in any form) to which the emitting subject has applied a meaning, and to which each of the receivers will apply his subjective meaning (too many senses = no sense). 5 We converge on Weick’s idea according to which organizations do not exist, but there is only the effort to organize. 6 The sense of things with “us” at the centre (from the moment in which we are conscious we are naturally at the centre of our respective universes) (Gregory, 1991, Arduini, 1998). 7 In our opinion even behaviour is a linguistic product. 8 Emergence is a quality, a property, a product (of the organization in a system), globality (since it cannot be dissociated from the systemic unit), an event (it arises discontinuously once the system has been formed), a novelty (in respect of the parts), irreducibility (cannot be decomposed without the risk of its own decomposition which, as in system decomposition, is also transformation into something else), indeducibility (cannot be deduced from the quality-functions of the parts) and finally implexity. (Morin, 1983, p. 139-143, Le Moigne, 1990, p. 48, Churchland & Sejnowski, 1992, p. 13). 9 Who knows why we’ve removed emotion from the processes of knowledge production, as if a scientist, an engineer or a technician learned without emotions. It has become certain on the other hand that the most effective learning takes place when emotions are involved. Do you remember how easy it was to “do well” in the subject taught by a friendly, enthusiastic professor?

1949
10 Decomposition is conceived here as modelling: «Action d’elaboration et de construction intentionelle, par composition de symboles (to which we add also non-symbolic schemes), de modèles susceptibles de rendre intelligible un phénomène perçu complexe, et d’amplifier le raisonnement de l’acteur projetant une intervention délibérée au sein du phénomène; raisonnement visant notamment à anticiper le conséquences de ces projects d’action possibles» that in the system dynamics is modeling of a complexity for which it is true the distinction: «Pour comprendre (donner du sens à) un système compliqué on peut le simplifier - pour décuvrir son intellegibilité (explication). Pour comprendre un système complexe on detruit a priori son intellegibilité» (Le Moigne, 1990). 11 And, therefore, conceived, designed and defined. 12 And, therefore, non-definable, uncertain and undefined. 13 In this chapter the notions of Program and Representation (only indirectly considered) do not have the common meanings of cognivitism; here they always mean “construction”. 14 The notion of context is extremely important in this paper. A famous definition can clarify its nature: «...context as collective locus for all the events that indicate to the organism-agent the set of options within which the latter must do further choice. » (Bateson, 1976). The nature of the context is somehow generative of the learning. Losing or abandoning a context entails losing its cognitive generative capacity. 15 Transfer sciences are disciplines where the knowledge on the nature of the nature and on the ways of manipulating it is blended indivisibly. 16 Without knowledge basis you cannot aspire to the systems integration, competences are not sufficient, and vice versa. 17 We have the multidisciplinary attitude when we are called to work, according to our own knowledge basis in a specific area of a task with a spirit that we could define as ‘advising’, in fact everyone is responsible on their behalf while there is normally a ‘command centre’ that integrates everyone’s work and responsibility. 18 We have the interdisciplinary attitude even if bringing our own specific knowledge, everyone’s work is however to occupy yourself with the entire task, including the integration that is anticipated in this operative order as a collective operation undergone by all the participants. Everyone is responsible for the task. This set up generally allows disciplinary fusions. 19 The transdisciplinary attitude not only uses permanent work structures, but it also nourishes disciplinary fusions to give life to knowledge bearers which are not reduced to discipline anymore. For example, in a multidisciplinary order a problem of fluid-dynamics can be faced by statistics, physics, chemicals, mathematics, etc. In a transdisciplinary order that has a history of interdisciplinarity before and transdisciplinarity after, the work group will be constituted only by fluid-dynamics. 20 It is important to note that even as far as scientific knowledge is concerned the idea of the disembodied scientist or the organization is oversimplified. 21 «...knowledge is about meaning. It is context specific and relational. », (Nonaka & Tackeuchi, 1995, p. 58). 22 The lower the complexity of the representations, the more the loss of competitive capacity through innovation. 23 A systems integrator is whoever decides which evolutionary trajectory the system takes. 24 With regard to this phenomenon it seems very representative the dynamics of the evolution of technology and in parallel of the roles among assemblers (almost all ex-systems integrators) and componentists in the automotive sector. 25 The abandonment of an excessively “mentalistic” approach to competence has led to an absolute enhancement of the context as a co-generator of context. The so-called activity theory (and the multiple intelligence theory) defines activities as syntheses of mental and behavioral processes, but it does not reduce them to mere mental or behavioral phenomena. They are analysis units within which the agents’ competence can be assessed in socially organized contexts. The object of the analysis is the interaction process of the agents themselves with the reference environment. The analysis unit is therefore practical action which incorporates (it activates, one might say) the environment-context (which, therefore, is defined, in this work, as generative). There is no learning without context. That is to say, there cannot be a learning dissociated from the context in which the practical action-activity will produce it (Vigotsky, 1978,

1950
Leontieff, 1981, pp. 37-71, Gardner, 1983). « In order to explain the march of the blind [and naturally explain his learning], then the road, the stick and man are required; road, stick and man and so forth, recursively » (Bateson, 1976, p. 470). In this regard, it can be likened to the concept of formative contexts: each business routine refers to a f ormative context from which it receives meaning and which makes it “natural” or “plausible” (Lanzara, 1993, p. 38). On this issue, see also Unger (1987) and Ciborra and Lanzara (1988). 26 «Whatever the source of technological breakthrough, it is company wide-ranging R&D expertise that are more likely to recognize (to create) the significance and potential of both incremental and radical technological developments, Broad R&D competences and skills are a method of dealing with discontinuities turbulence; a way of technology watching and keeping options open.» (Dodgson, 1989, pp. 4-5). 27 Implementation of strategic technology is therefore an integral part of its definition.

1951
Subjectivity and Cognition: An Explorative Review on an Inherent Problem of Knowledge Management
Martin Rahe, [email protected]
EADA, Spain
Abstract Knowledge has become the most important production factor in the companies, since value creation is considered being the key element for sustainable advantage. Knowledge results from cognitive processes which are influenced by stereotyping, awareness, motivation and the external environment. These factors create a multitude of different perceptions, interpretations and understandings between individuals in general and between individuals of different cultures in particular. The present paper discusses the impact of subjectivity in knowledge management by analysing the influencing factors on knowledge creation. Different mind sets and mental models increase the probability of misunderstanding and also the effectiveness of knowledge management. Apart from knowledge creation, the transmission of knowledge is damaged when communication is codified and standardized. Finally, knowledge management is far from being management of objective truth. The paper highlights theoretically on management slacks in knowledge management and, in doing so, indicating areas of inefficiency in knowledge management. Introduction
In 2005, UNESCO stated that diversity is in danger. Instead of maintaining cultural differences, globalisation tends to homogenize cultures and promotes the disappearance of regional knowledge and languages. Especially threatened are small and geographically localised cultural identity groups or cultures without enough global presence. Often, these groups possess local or indigenous knowledge that has evolved over generations and persists in people's minds thus becoming the general knowledge of the society. As cultures become extinct, knowledge disappears and as a consequence so does the variety of culturally different mind sets.
The run for innovation through technological progress and research reinforces the supremacy of technological and scientific knowledge and weakens traditional elements of knowledge. If this kind of knowledge (spiritual, emotional, etc.) and along with it local languages as transmitters of knowledge are lost, then the idea of cultural diversity will be seriously undermined. UNESCO identifies a “great divide” between technological and scientific knowledge on the one hand and traditional, indigenous knowledge on the other, and it puts an emphasis on the fact that the loss of knowledge and language always entails a loss of cultural identity and vice versa.
Advances in information and communication technologies such as computer-supported cooperative work systems, groupware, internet and intranet prove that technologically the management of knowledge is no longer a critical issue. The ongoing challenge concerns the content of knowledge itself. Diversity among cultures creates a multitude of different perceptions, interpretations and reflections, which affect individual cognition. This may end up making mutual understanding and communication more difficult and consequently knowledge management as well. In order to overcome such obstacles, which have evolved especially as a result of globalization, the knowledge society has developed communication standards which are used worldwide. As a result, some knowledge becomes codified and common sense while other types of knowledge remain invisible and could eventually disappear. What we now see is an upcoming global-local dialectic arising from the tension between local knowledge production and its use in the global environment. The impact for knowledge management is twofold; on the one hand, we may lose knowledge which is crucial for sustainable management. The saying “think global, act local” neglects the fact that local thinking may become an important skill and a competitive advantage for companies due to a better understanding of local particularities. The American company Monsanto serves as an example of how insufficient knowledge and adaptation to European culture hindered their entrance into the European transgenic food market. On the other hand, communication suffers when people lose their native language and express themselves in a foreign one. Technically speaking, the transmission of codified “hard” content into a foreign language may work, but it

1952
becomes difficult when we transmit “weak” emotions and feelings. UNESCO is very much aware of this problem and defends multilingualism as a way of maintaining the diversity of languages and of knowledge.
The disappearance of local knowledge and local languages affects the continuity of local cultures because it eliminates part of their cultural heritage. From the point of view of foreign companies a reduction in knowledge and language diversity reduces transaction costs but increases the risk of misunderstanding and not connecting to the local market.
This study aims to discuss the factors which influence understanding and transform objective information or signals into subjective knowledge. The first assumption is that knowledge results from a process which is influenced by three relevant factors: the contextual environment, individual cognition and communication. Due to its role as a subjectivity filter, individual cognition denies the creation of objective knowledge. In this sense, knowledge management is an attempt to deal with a disparate bundle of mental models, trying to codify and transmit subjective knowledge. The second assumption is that knowledge diversity negatively affects the effectiveness of knowledge management because it involves different understandings and interpretations.
After a brief overview of research developments in knowledge management, chapter 3 goes on to look at stereotype thinking, awareness and rationality as relevant factors which affect the internal process of cognition (the inner dimension). Chapter 4 focuses on the external environment, which influences knowledge creation through the existence of institutions and values. In knowledge management, knowledge sharing is a complementary component to the creation of knowledge. Chapter 5 then comments on communication and its importance for the quality of knowledge. The theoretical analysis finishes off with some reflections concerning findings that are relevant to knowledge management. The final chapter focuses on the American multinational company Monsanto as a practical example which highlights certain aspects that were dealt with previously in the theoretical discussion.
Methodologically speaking, this paper is based on a review of the literature in the field of behavioural economics and where it overlaps with economics and psychology. The term “diversity” is used in its broadest sense as an expression for being different and refers to different mind maps due to individual cognitive processes and the influences of the environment. This research aims to stimulate and contribute to the debate around knowledge management and wishes to open the way for further research. Traditional Concepts of Knowledge Management
Since the advent of globalization and the necessity of companies to boost value creation, knowledge has proved to be the major source of sustainable competitive advantage. An overview of the research on knowledge shows that most studies emphasize the organisational dimension, focusing on the creation, administration and dissemination of knowledge. Different theoretical currents are concerned with the organisational perspective and these can be classified into three groups: a) organizational learning theory, b) resource based theory of the firm, and c) knowledge creation theory. All these approaches have in common that they place special emphasis on the importance of managing knowledge. The primary objective of knowledge management has been first of all, to increase the effectiveness of human capital through knowledge sharing and knowledge synergies and secondly, to improve organisational flexibility towards change and innovation. Polanyi as well as Nonaka and Takeuchi strongly emphasize the distinction between tacit (weak) and explicit (hard) knowledge. Explicit knowledge can easily be codified and transmitted through formal and systematic processes which are provided by different IT-tools. This knowledge is technical and represents a quasi-public good, which means that users of this knowledge can hardly be excluded. Therefore, for companies the problem is finding ways to get the maximum benefit out of published knowledge. Legal restraints such as patents and intellectual property rights are attempts to internalize profits ensuing from explicit knowledge. In contrast, tacit knowledge is personal and has a cognitive component that intervenes in perception and learning This knowledge belongs to specific contexts and, therefore, to specific communities or identity groups. A proper understanding of tacit knowledge requires contextual expertise.
Given the increasing importance of the knowledge resource, concepts and models have been developed, which try to measure and balance organisational competencies. A frequently cited example of successful KM is the Swedish company Skandia. Already in 1993, Leif Edvinsson divided the company's intellectual capital into three

1953
segments: organisational capital, customer capital and human capital and identified its value in relation to five key areas of success: Finance, customers, process, innovation and human resources. Similar to the Skandia Navigator, the Balanced Scorecard follows the same idea of analysing corporate vision, strategy and performance from the different perspectives of finance, customer relations, internal processes and learning and growth. Critical success factors are defined for each specific area and are used as a basis for constructing performance indicators. Considering the impact of group dynamics on knowledge flows, communities of practice place emphasis on the creation of focus groups for problem solving. The concept of a community of practice refers to the process of social learning that occurs when people who share a common interest in a certain matter or problem collaborate over an extended period of time to share ideas, find solutions, and build innovations. A more holistic model of KM has been developed by CIDEM, the Centre of Corporate Innovation and Development in Catalonia, Spain. The model relates different components of organisation, culture and strategic vision, people, technology and processes with KM. Within the academic field, Riverola developed a model which demonstrates how corporate learning and problem solving work together. Finally, Zahra and George studied how knowledge and learning potentials help companies to maintain their strategic flexibility.
All these concepts have one thing in common. They all focus on the effectiveness of KM at the organisational level but without taking into account individual knowledge creation within different contexts. While research on cross-cultural management reflects visible, action based individual performance related to different cultural environments, research on knowledge does not raise questions concerning diversity. Nevertheless, if knowledge is regarded as a crucial asset, knowledge management must also take into account different contexts and their influence on the way individuals produce, exchange and modify their knowledge. Diversity in Cognitive Processing
In the Literature, knowledge is defined as the result of a process which combines ideas, rules, procedures and information. The outcome of this process is based on reasoning and understanding and therefore made by the mind, whereby the process itself reflects information through experience, learning or introspection. Mind made mental models involve “a homomorphic mapping from one domain to another, resulting in an "imperfect" representation of the thing being modelled.”. If we acknowledge that imperfectness is an inherent element of mental modelling, then cognitive processes are not only highly subjective but also incomplete reflectors of reality. This means that every effort to manage organisational knowledge takes place under the restrictions of subjectivity and incompletion. This becomes particularly important when team performance is required. The fact that cognitive processes are carried out independently by each individual based on their experience, expectations, etc. means that team performance will suffer when there is no overlap between different mental models. The opposite also holds true. Team performance is optimal when there is a complete overlap of mental models. In such a situation, communication and coordination within the group becomes easier due to fewer misunderstandings and misinterpretations. But as Banks & Millward point out, a high match of individual mental models within a team leads to inefficient duplication of knowledge and to a reduction of communication. Instead of increasing team performance through knowledge synergies, team output is hindered by knowledge parallels. Hansen studied the effectiveness of knowledge sharing among the different business units of a company and considered connectivity at the knowledge creation level, which means different but connected, and at the infrastructure level, which requires formalized linkages among the business units as crucial conditions. Both can be supported by task-specific knowledge networks. Banks & Millward put forward arguments along the same lines and state that team performance achieves better results when mental models are different but connected in such a way that knowledge is able to flow between the team members. As an essential prerequisite for understanding, the connected team members should partially share their mental models. This means that each member has their own individual knowledge zone except for a part which overlaps with the knowledge zones of the other partners in the team. This overlapping area assures communication and understanding.

1954
IndividualKnowledge
Zone
IndividualKnowledge
Zone
Shared Knowledge Zoneor
Communication Zone
Individual I Individual II
FIG. 1: KNOWLEDGE SHARING BETWEEN DIFFERENT INDIVIDUAL MINDSETS
Knowledge Management and Knowledge Creation
Reducing complexity, mental processes are structured in semantic networks on different levels. Spiridonov makes the distinction between two different “worlds” which affect individual thinking and problem solving. The premium world is the complex intellectual potential of an individual which enables a person to reflect on problems. Existing knowledge is supported by memory content and involves associations, functional meanings of objects, images, etc. Knowledge is structured through combinations of factors (high order variables) that carry information about stable or regular relationships and determine the features of problem solving. According to Spiridinov the second world of cognition is the conceived world, which repackages complex and diverse content into comfortable units that are clearly structured and easy to work with. The conceived world aims at reducing mental complexity by ignoring ambiguous, contradictory or incomprehensible constructions. Learning processes are channelled through hierarchical mental structures and all recalled knowledge units (from memory) have to pass through these knowledge channels. With cognitive structures such as these, inflexibility concerning the unknown becomes the rule. Ignorance of knowledge elements which are not connected with the existing mental structure supports mental stability on the one hand, but also encourages stereotype thinking. Stereotype Thinking In his book The Sensory Order, Hayek outlined the strong interdependence between cognition and environment and explained its limiting influence on intellectual endeavour. The merit of this work is that it draws a connection between mental structures and the external framework of culture and institutions and in doing so it is a precursor of the economic theory of institutions, which explains rational decision making and human behaviour in the light of the surrounding environment. Following Hayek, we come to the conclusion that within the symbiotic relationship between mind and culture, culture is an influential factor for stereotyping. This conclusion is in line with the existence of mental structures as discussed above and what Bruner has termed the phenomenon of readiness of categories. A different view to that of Hayek is put forward by Donald, whose standpoint is that the form of the individual mind constrains the type of culture that any given species will produce. Culture, institutions and environment may have an influence on thinking but do not condition human cognition. Our ability to disconnect thinking from the environment differentiates human beings from animals. Donald argues that animals access their

1955
memory, or perhaps better, recall their instinct, in certain situations that occur in their environment. Animals react when they are confronted with something whereas human beings are able to voluntarily access their memory independently of the environment. An example which illustrates this difference is that of an animal moving through a forest, where its behaviour is determined by the external environment. In contrast, humans can move through the forest, thinking about something totally unrelated to the environment. The discussion shows that cognitive processes and the creation of knowledge are influenced by the environment, but that our thinking is not completely determined by it. Environments create mental stereotypes, but these stereotypes can be recalled in any situation. The mental inflexibility created by stereotype thinking can be somehow compensated through flexible access to memory (auto cuing). This discussion leads to the conclusion that a conversation between two individuals with different mental structures may end up in misunderstanding because of different ways of thinking and different knowledge bases. In order to improve the communication, a third person with sufficient capacity to mediate between these two individuals needs to intervene. If stereotype thinking is based on culture, this third person must be someone with cultural experience from both environments and the ability to mediate between both. Due to auto cuing, the mediator is able to access at least one part of his/her memory that is not related to the present environment. Awareness Cognitive processes, even if influenced by the surrounding culture, are a highly subjective matter. In his theoretical study, Bonanno analyses the role of information and belief for mental awareness and extends the discussion about cognition to non rational components. Bonanno defines information as objective signals from the environment which forms the basis for knowledge production. Taking a simple example from literature, Bonanno shows that the awareness and interpretation of signals may vary entirely from one individual to another and that the creation of knowledge may therefore differ, even if both individuals share the same information (signals). In Conan Doyle's novel Silver Blaze a horse was stolen from the stable and footprints were discovered on the ground. Sherlock Holmes remarked that it was very strange that the dog did not bark at night. His counterpart replied that the dog did nothing at night-time and Holmes insisted that this was very strange. This example gives us an idea of how far the same signal - the dog that did not bark – is subject to very different evaluations, interpretations and therefore awareness. Karp describes this subjective awareness as consciousness, which he defines as the individual's ability to perceive the relationship between oneself and one's environment. Even if cognitive processes are based on rational logic or reasoning and even if signals are objective, the resulting knowledge may be very different. Hence, reality has two different outlooks, on the one hand the objective exterior dimension which is made up of signals and information, and on the other hand the subjective interior dimension, which is the outcome of cognition and reasoning. The conclusion here is that reality transmitted from one individual to another is automatically manipulated by the individual's inner reality. In order to obtain true facts we need to identify the interior dimension of reality.
But knowledge is not only about rationality, logic and reasoning but also about beliefs. This irrational component has its origin in information as well, “but (beliefs) are not fully justifiable on the basis of it.” Additional components are intuition, guessing or something else that cannot be explained by rationality and these components are often rooted in cultural tradition and rituals. Meindl, Stubbart and Porac stress the importance of rational and irrational components in knowledge building processes and therefore in judgement and decision-making. Motivation In liberal economics the principle of rationality refers to behaviour that is oriented towards individual benefits. From the point of view of methodological individualism, rationalism results from a subjective perspective of the environment which takes into account the individual's preference structure. Following the paradigm of rational choice theory, knowledge creation depends on the individual cost of information gathering and the expected benefit from the use of information. This approach does not analyse cognitive structures but connects knowledge about the environment with decision-making and therefore with behaviour.
Under the premise of rationalism, it is not convenient for the individual to maximise information gathering. Although necessary for decision making, the cost-benefit rule suggests that we should search for information until the marginal cost reaches the marginal benefit from information gathering. Converting information into knowledge creates additional costs because of the time taken up by the cognitive process. As regards the cost side, routine and experience are factors that reduce costs due to the learning effects from earlier processes. Rational information

1956
behaviour theory reaches the conclusion that the individual is already satisfied with their limited view of the whole picture, which in turn implies that ignorance of surrounding information is an important skill for rational behaviour.
In psychology, this behaviour had already been investigated by Tversky, who explained in his “elimination-by-aspect” approach that individuals quite schematically follow a subjectively defined standard of preferences and desires, and squib all alternatives which do not match in a concrete situation. As early as five decades ago, Thibaut/Kelley, Simon as well as Cyert/March presented arguments along the same lines saying that individuals seek out rank happiness, which means that satisfaction is not an absolute value, but relative. They found that individuals feel good or bad when they compare themselves with others. In addition to that, Selten focussed on the capacity of individuals to adjust their expectations once they recognise that their original expectations cannot be achieved. The conclusion is that rationality in the cognitive process is based on the individual's perception of expectations and consequences and that it is therefore future oriented. Knowledge Management and Values
Values build the normative structure which orientates people in decision making situations. In this sense, values have an impact on cognitive category building as mentioned by Hayek and in doing so they also influence learning processes. From this perspective, learning is an instituted process of interpretation and evaluation, which applies existing and creates new cognitive frames. Within the wide range of values, some values can be rationally explained through reasoning while others are rationally inexplicable and create beliefs and myths. Rational, logic based values like humanity and irrational, emotional values like Christianity converge into the orientation system for individual activity. Generally accepted and shared values in society increase the transparency of behaviour because there is a clear distinction between normatively correct and incorrect behaviour.
Bush defines values based on rationality, reasoning and consciousness as instrumental values. These are established in order to solve problems and to contribute to the progress of society. One example is a country's constitution, which represents the society's commitment towards humanity, the community, etc. and which is a normative compass that enables the society to distinguish between tolerated and penalized behaviour. In contrast, societies also generate values unconsciously, which evolve over time. These values are transmitted from generation to generation and their justification is based on tradition, rituals, beliefs, etc. According to Bush, these are ceremonial values, which are characterized by conservatism and prudence towards change.
The relationship between instrumental and ceremonial values is contradictory if ceremonial values obstruct progress founded on scientific and technological reasoning but it can also be complementary in cases where scientific research manages to explain the formerly unexplained and, in doing so, turns ceremonial values into instrumental ones. Similarly, the relationship between these two types of values is complementary when the outcome of scientific or technological progress becomes tradition and is converted into common sense. It is evident that the maintenance and renewal of values are two driving forces and that society advances due to the creation of new applicable knowledge. A society's conservatism towards change is a manifestation of the predominance of ceremonial values. Progress on the other hand is a result of the cognitive potential to convert information and signals into knowledge. According to North, progress always entails a loss of traditional and therefore of ceremonial values. The logical conclusion is that the management of people always entails the management of competitive or complementary value systems. This is particularly important for multinational companies in high value societies such as Islamic or Christian societies or under high value regimes such as Marxism or National Socialism.
In economic theory, institutional economists like North regard generally accepted values as normative institutions which are established formally (instrumental values) or informally (ceremonial values). From the point of view of institutional economics, institutions direct behaviour by means of social commitments and increase the predictiveness of individual activity by setting up routines and reducing uncertainty. According to Rutherford “an institution is a regularity of behaviour or a rule that is generally accepted by members of a social group, that specifies behaviour in a specific situation, and that is either self-policed or policed by an external authority.” The efficiency of institutions can be measured by how far they reduce the cost of social life through rule setting. Normative institutions, either formal (instrumental values) or informal (ceremonial values), need to be cognitively

1957
implemented in order to become a parameter for individual behaviour. Rituals and belief, informal constraints, embodied in interpersonal ties, play an important role in people's relations, especially in societies with a weak formal setting of institutions or a strong influence of tradition. Knowledge Management and Communication
The Austrian writer and journalist Karl Kraus fought all his life against the simplification and misuse of language. Born in 1874, he devoted his efforts to elucidating the interconnection between language and thinking. According to Kraus, rather than a mere tool for transmitting pre-prepared opinions, language is a medium of thinking and critical reflection. Language verbally embodies what is thought and makes cognitive processes explicit. Kraus was convinced that people speak the way they think. The deterioration of linguistic capacity is a consequence of the simplification of thinking. This means, in a positive sense, that elaborate language proficiency helps one to express oneself in such a way that complex content can be transmitted without losing information.
This capacity is especially important in knowledge sharing processes, where diverse mindsets are required to exchange expertise and where complex cognitive patterns need to be verbalized. In such a situation the quality of knowledge management largely depends on the quality of communication. Codified communication in international business, for example the worldwide use of the English language as a vehicle for the exchange of information and data, runs the risk that communication is imperfect and of low quality in the case of non-native speakers. A foreign language that is learnt through schematic techniques will not enable a foreigner to understand all the sentimental and emotional patterns conveyed by the language and which have evolved over thousands of years, influenced by history and culture. In situations where the correct use of language is important, tools are applied in order to ensure the quality of information transfer. International comparative studies for example, which are based on empirical data research often use the back translation technique to make sure that the wording of questions has the same meaning in different languages. If this were not the case, data from different countries could hardly be compared and information would be lost along the way.
But communication is not only a matter of verbal expression, but also of visual images. Gesture is a form of visual behaviour which supports verbal messages and, in doing so, adds importance to them. The dialectic relationship between verbal and visual representation is processed in the mind and forms people's understanding. In the arts, visuality through images is of particular importance for transmitting messages without using words. The Canadian artist Geneviève Cadieux in his object “Hear With Your Eyes” vividly describes the impossibility of verbal communication in certain emotional states. For proper understanding to take place, observation and interpretation of gestures are crucial in order to compensate for the lack of verbal communication. Reading facial expressions, exaggerated expressions or ritualizing small things may often become a necessary skill in intercultural communication. The artist Gary Hill from California focuses on the phenomenon of understanding. In his work “Remarks on colour”, his young daughter Anastasia reads Ludwig Wittgenstein aloud without understanding the contents of what she is reading. The girl tries to pronounce the philosopher's complex words correctly and to use the right intonation in reciting the phrases. Nevertheless, she does not always succeed and the text's meaning gets lost. Gary Hill's work highlights the difficulties of understanding and making sure that one is being understood.
The issue of understanding is also raised by Martin Gannon, whose book “Understanding Global Cultures” presents a metaphorical analysis of 17 countries from all the continents. In contrast to other cultural studies such as those of Hofstede, his interest is not centred on items and scales which measure cultural differences. His approach is based on observation, cultural particularities and metaphors that are linked with a country's image. Instead of empirical objectivism, what he delivers is a subjective view on culture. For Gannon there are several culture-creating factors such as religion, language, geographical proximity, the educational system, socialization, the form of government, history, social class structures and the rate of technological change, but he considers the use of a common language as probably the key integrating factor. Sharing a common language helps people to feel comfortable, define in-groups and out-groups and communicate both thoughts and emotions. The opera as a metaphor for explaining Italian culture points to the importance of language and voice in Italian social life. The subtle use of word endings and inflections in the Japanese language distinguish insider from outsider status and a

1958
person's relative status in society. The Belgium conflict between the French and Flemish languages relates directly to the controlled and balanced behaviour that Belgians manifest in everyday life. According to Gannon, these are only three examples of what is probably a long list of examples which could demonstrate the importance of language as a culture-forming mechanism. Coming back to Karl Kraus, his assumption about the link between speaking and thinking is very interesting when we consider that some words in certain cultures do not exist in other cultures. The word “privacy” has no appropriate translation in Italian. Similarly, it is difficult to find a correct translation for “cosiness” in the Spanish language. According to Kraus, this shows the relatively minor importance that a culture gives to certain aspects of living. Consequences for Knowledge Management
By way of summing up the above discussion, the management of knowledge involves highly subjective factors in knowledge production as well as in knowledge transfer. These factors belong to processes, which are either internal, within the individual's mind when processing information or external, when communicating knowledge to others. It is evident therefore that knowledge management is much more than simple data mining. In fact, it is a complex task of managing people's knowledge related individuality. The obstacle is that knowledge is created through internal processes which are not transparent to others. As a consequence, what is probably the most important part of knowledge management, knowledge content, eludes management. The challenge for knowledge managers is to deal with parameters that are not controlled by the management.
As we mentioned previously, the parameters are divided into two dimensions whereby one segment refers to the cognitive dimension and the other to the communication dimension. With regard to the cognitive impact on knowledge, three parameters bear an influence on the inner dimension of knowledge creation.
• Categorization and auto cuing are both aspects that describe one's ability to select information in such a way that situations become less complex. The ability to ignore (categorization) and abstract from reality (auto cuing) are tools of complexity reduction through simplified selective perception. This means that any knowledge that is created, shared, administered and stored in a company passes through an internal cognitive filter, which prepares the information in such a way that makes it appropriate for the individual's use. Managing knowledge on a global scale means dealing with knowledge which has been processed by a variety of different filters influenced by the cultural environment and which is incomplete compared with reality. According to Senge, people's behaviour is always in tune with their mental models. If mental models promote complexity reduction through ignorance and there is no overlap of mental models in a team, then we can expect mutual ignorance regarding other people's knowledge, experience and perception. Finally, this would depreciate the value of knowledge management and would affect behaviour and team performance. Knowledge management in culturally diverse groups has to take into account diverse mind maps and has to find ways of harmonizing them in order to achieve a mental overlap and to create commonly shared knowledge zones.
• The reflection about oneself within a specific context creates awareness and consciousness regarding the things that happen around us. As mentioned in the Sherlock Holmes example above, the interpretation of a particular situation can be completely different depending on each individual's awareness of it. Awareness and consciousness play a crucial role in the priority setting of knowledge. The same knowledge content may have a different impact on different people and consequently a different impact on working with knowledge.
• The motivational factor drives individual behaviour and influences the individual's participation in knowledge management. Following the rationality approach, the cost-benefit relationship is decisive for carrying out activities. Sharing knowledge is considered positive if the individual receives a benefit, which is considered higher than the cost of participation. Factors that influence motivation in knowledge management are specialization, experience, responsibility, image and prestige. Specialisation and experience are very sensitive factors as they determine the uniqueness of knowledge. Possessing unique knowledge in the company improves the individual's negotiating power when this knowledge is of

1959
importance for the organisation. In this sense, the price of knowledge, reflected in the person's salary, is higher than the salary of employees without any specialisation. In such situations there is probably no incentive for employees to share their specialised knowledge with others because this would depreciate their value for the company. Concerning image and prestige, the personal benchmark with colleagues at the workplace is an important driver for increasing or lowering an individual's effort or involvement in knowledge management.
• The communication dimension is strongly influenced by language, which is comprised of factors such as native like proficiency, gesture and the ability to express oneself. A low degree of native like proficiency and ability to express oneself together with a rich mixture of different cultural gestures makes knowledge sharing difficult and reduces the information load that is transferred in each message. Additionally, transmission, understanding and interpretation are also determined in cases where certain verbal expressions do not exist in some languages for certain situations. The communication aspect is absolutely crucial when a company wants to improve its organisational knowledge.
Communication
InnerDimension
• Category, Autocuing• Consciousness, Awareness• Motivation
KnowledgeManagement
Individual IIIndividual III
Individual IV
• Gesture• Native/foreign language• Ability of expression
Individual I
FIG. 2: COGNITION AND COMMUNICATION BARRIERS IN KNOWLEDGE MANAGEMENT
The conclusion is that knowledge management is far away from being the management of true reality.
Instead of objective information, what is being managed is reality that is manipulated through individual perception. Even if one attempts to come as close as possible to objective reality, it is often impossible for foreigners to perceive and understand all the details from regionally restricted knowledge zones. If the environment has an impact on cognitive processes, then people who have grown up in different environments are more likely to use different forms and levels of complexity reduction. Mind making based on category thinking, awareness and motivation differs in different cultures. What's more, language always plays a crucial role in transmitting knowledge when individuals

1960
with different native languages communicate. In such situations knowledge content runs the risk of being lost during the transmission process. This is especially the case when tacit knowledge needs to be codified in a foreign language, where one's ability of expression is limited.
Monsanto is an example of a company that decided to enter into the European market based on an erroneous knowledge base. Confiding in their American experience, Monsanto underestimated the backlash against their products from European consumers. Misperceptions, misinterpretation, misunderstanding and bad communication were mistakes that were made by the company's management. Monsanto: The Failure of the Free Market Argument
Monsanto is an American multinational agricultural biotechnology company that was founded in 1901 by John Francis Queeny, a veteran of the pharmaceutical industry. Already in 1919, the company started its expansion towards Europe by establishing an alliance with a chemical plant in Wales. Since 1971, Monsanto has produced and successfully commercialised its star product “Roundup”, a herbicide glyphosate. In 1982, tests were started on genetically modified plant cells with the aim of developing genetically modified grains and crops that were resistant to “Roundup”. The overall idea was to offer a herbicide/plant package which would increase crop productivity. Today, Monsanto has over 16,000 employees worldwide and an annual revenue of US$7,344 billion reported for 2006. The company is by far the biggest producer of transgenic seeds, with a market share of 70% – 100% in some markets.
In May 1996, Monsanto received authorization from the European Community to export transgenic soybeans to the European market. The product was treated as a commodity, which means that the European Community did not classify the product as dangerous for people's health. Nevertheless, some months later, protests from ecologists and non-governmental organisations (NGO's) against the import of transgenic food raised awareness among consumers and led to a massive boycott of products containing genetically modified soybeans. The company's image as well as its economic results came under pressure and at the end of 1997, the general manager of Monsanto in Europe, Carlos Joly, apologized for the big mistakes that were made during the introduction of transgenic products in Europe. According to Joly, the company had underestimated the cultural differences between the United States and Europe concerning technology and in particular biotechnology. This came as a surprise, given the company's long standing tradition in doing business in Europe.
The motto “think global, act local” probably sums up the company's expansion approach very well, but it also reveals its arrogance in neglecting local thinking. Furthermore, Monsanto is an example of how rational arguments are bound to fail in emotional debates. The Inner Dimension Even if this approach refers to individual thinking, it can be easily applied to corporate policy if we consider that each policy is developed by human brains and that there is always somebody who takes the decision based on available information.
Mental categorization and awareness: Monsanto grew within the American cultural context. Even though it is a multinational company, Monsanto relied on the American market and American legislation when it came to considering whether a product was economically and legally approved. The company has a strong belief in instrumental values which are related to American society and closely linked with openness towards innovation, belief in technology and an orientation towards the future. In contrast, Europe has always been known for a certain degree of scepticism towards new technology and demonstrated cautiousness and prudence towards technology innovation. Especially in the case of transgenic food, the discussion was led emotionally with a nostalgic touch concerning the role of farmers as food producers and protectors of nature. In contrast to the American belief in technology, the European belief in historical experience and confidence makes it more likely for Europeans to reject change. Monsanto ignored these differences and applied the American way of thinking to Europe. This reduced the complexity of business but also revealed awareness building based on insufficient data. The ability to pursue one's own business model without taking into account regional particularities is an example of auto cuing, a human phenomenon which allows the individual to disconnect his thinking from the surrounding reality.

1961
Motivation: Monsanto's strategy has always focussed on markets and competition. The company positioned and benchmarked itself as a privately operating company. As an advocate of free markets, Monsanto's moral approach was based on utilitarianism and libertarianism. Monsanto postulated the importance of freedom of choice and argued that consumers are able to decide whether they want the product or not. Nevertheless, European consumers got the impression that they did not have any freedom of choice because of a lack of transparency and because they had not been consulted about the introduction of these products in Europe. Communication The communication policy of Monsanto was poor compared to the effort it had made in the United States. Relying solely on information and experience from the American market, European citizens were not invited to give their opinion nor was there an information campaign about biotechnology. This sharply contrasted with the information campaigns in the United States where a variety of initiatives such as open door events in the laboratories, education and information videos about biotechnology and articles in journals were undertaken in order convince the American public. From the European point of view, ignorance and lack of communication were interpreted as an insult against European interests. Finally, Monsanto was accused of spreading North-American economic and technological imperialism. The company had also underestimated the impact of verbal expressions such as “genetic revolution” on the European public. Many people interpreted these types of expressions as an attack on nature. Conclusion
Based on a review of the literature, this study has looked into the relationships between subjectivity, knowledge and knowledge management. The initial premise was that with globalisation, cultural diversity has becomes increasingly more important and that different understandings and interpretations of the same thing evolve. As the study shows, this is due to individual, highly subjective factors that come into play, transforming objective information into subjective knowledge. Knowledge management in general and organisational learning in particular entail the management of diverse cognitive processes. But since cognition is an internal process that occurs in the inner dimension of human behaviour, organisational knowledge management has no direct access. What may happen is that with globalisation there is an increased risk of failure in the management of knowledge. Taking the American company Monsanto as an example, one can see that decision making based on misguided assumptions, interpretations and understanding of important interest groups may damage a company's image.
This explorative study should be seen as a preliminary research effort which opens up the field to further in-depth empirical analysis. Scales can be developed in order to measure quantitative information about cognitive categorizing, awareness, motivation and communication from culturally diverse samples. Such research helps us to clarify the risk of misunderstandings in global knowledge management and therefore to relativise the effectiveness of knowledge management under global conditions.
References Contact author for the list of references.

1962
Identification of Core Technologies on the Basis of ANP-Based Technology Network
Hakyeon Lee Chulhyun Kim
Hyunmyung Cho Yongtae Park, [email protected] Seoul National University, South Korea
Moon-Soo Kim Hankuk University of Foreign Studies, South Korea
Abstract
Numerous studies have attempted to examine technological structure and linkage as a network. Network analysis has been mainly employed with various centrality measures to identify core technologies in a technology network. None of the existing centrality measures, however, can successfully capture indirect relationships in a network. To address this limitation, this study proposes a novel approach based on the analytic network process (ANP) to identification of core technologies in a technology network. Since the ANP is capable of measuring the relative importance that captures all the indirect interactions in a network, the derived “limit centrality” indicates importance of technologies in terms of impacts on other technologies, taking into account all the indirect influences. Using patent citation data as proxy for interactions between technologies, a case study on telecommunication technologies is presented to illustrate the proposed approach. Introduction Due to the intractable complexity and volatility of modern technologies, it is of increasing importance to examine technological structure, and grasp technological trends and advances. Identifying and assessing technological advances critical to the company’s competitive position is now recognized as a crucial activity for achieving and maintaining competitive positions in a rapidly evolving environment [10]. Since technology systems are characterized by strong interdependence [1], there have often been attempts to examine technological structure and linkage as a form of network [36][40][42].
What is at the core of measuring technological interdependence or linkage is patents. Patents have been the representative proxy for technology [37]. A number of studies have been conducted to identify current technology structure and make a projection of technological future trends by using patent analysis [1][2][3][7][13][17]. Several measures have been employed for measuring technological linkage with patents, such as co-classification [6][16], co-word [9], and keyword vector similarity [42]. Among those, citation analysis has been the most popular one in spite of controversial discussions about its validity. The underlying assumption is that there exist technological linkages or flows between the two patents if a patent cites another patent.
Network analysis has often been used in conjunction with patent citation analysis with the aim of grasping the overall relationship and structure in a network. What is at the center of interest is to identify important or core technologies in a technology network [36]. As a quantitative measure of importance in a network, centrality measures can be deployed in network analysis. Among various measures, degree centrality has been implicitly deployed as an indicator of importance of technologies in the previous studies [38]. However, it does not take into account indirect relationships despite the fact that indirect citations as well as direct citations play a crucial role in characterizing technology networks [40]. None of the existing centrality measures can successfully capture indirect relationships and produce meaningful results for identifying core technologies in a patent citation-based technology network.
To address these limitations, this study proposes a novel approach based on the analytic network process (ANP) to identification of core technologies in a technology network. Since the ANP is capable of measuring the relative importance of technologies that captures all the indirect interactions in the technology network, the derived

1963
“limit centrality” can be used as an implicative centrality measure characterizing a network and showing core technologies in the network.
The remainder of this paper is organized as follows. Section 2 deals with the previous studies on patent citation network analysis. The underlying methodology of the proposed approach, the ANP, is briefly introduced in Section 3. The proposed approach is explained and illustrated with a case study in Section 4. The paper ends with conclusions in Section 5.
Patent Citation Network Analysis Patents and patent statistics have long been used as technological indicators [15]. Although patents have been the representative proxy for technology as direct output of R&D activities, there has been a ceaseless controversy about the use of patent analysis since patents have advantages and disadvantages like any other technological indicator [1]. The pros and cons of patent analysis are not explained here in detail, but can be found in the literature by Archibugi and Pianta [1], Ernst [11], Griliches [15].
The most common method for early patent analysis was to simply count patents and to compare how many patents had been assigned to each entity, e.g. nations, firms, and technological fields [40]. The basic idea is the more patents belong to different entities, the more important the entity is. Due to the highly skewed distribution of patent values, however, judgments on importance based on simple patent counts could be biased to a large extent in many cases [21]. It is also incapable of measuring importance that mirrors influences or linkages among entities.
Thus, what has become the center of interest in patent analysis is citation information. Patent citation analysis is based on the examination of citation links among different patents [30]. The use of citation information in patent analysis boosts studies from various streams. One of the main research topics is to measure the values of patents based on the number of citations of patents in subsequent patents. It is validated by a number of evidences that more frequently cited patents have higher technological and economic value [5][31][37]. In this context, many studies have employed the number of citations as an indicator of patent quality [11][22][26][33]. Firm’s value can also be measured based on the values of patents belonging to the firm [18]. Another subject of studies with patent citation information is to identify similarities between technologies. The similarity information can be used for identifying technology overlaps with collaborative firms [29], and proposing a new classification system by clustering patents [25]. The use of patent citation information in this study is in line with the other research stream, analyzing technological knowledge flows or technological linkages based on patent citation relationships. The underlying assumption is that there exists a linkage or a flow between the two patents if a patent cites another patent. However, patent citation analysis alone cannot grasp the overall relationship and structure among all the patents because it merely captures individual links between two particular patents [42].
To address this limitation, network analysis has often been used in conjunction with patent citation analysis to measure technological knowledge flows between entities and identify important or core entities. In general, the interactive relationships among actors can be portrayed as a network composed of actors (nodes) and interactions (edges) [14]. The structure of relations among actors and the location of actors in the network provide rich information on diverse aspects of an individual actor, a group of actors, and an overall network [27]. Thus, network analysis has attracted considerable interests from the social and behavioral science community in recent decades, and has also been applied and proved fruitful in a wide range of disciplines [41]. A patent citation-based network is one of the areas where network analysis is effectively employed with the aim of measuring technological knowledge flows among actors. An actor can be an individual patent or patents are assigned to a corresponding entity such as a nation or a technology class as an actor. Then, the citation relationships among patents represent interactions among actors. A number of studies have employed the patent citation network analysis at various levels, such as national level [23], industry level [20], firm level [19], and technology class level [36].
To characterize either holistic network characteristics or individual actor’s positions in a network, various centrality measures can be calculated. Three common measures of centrality are degree centrality, closenees centrality, and betweenness centrality [12]. Among those, degree centrality has been implicitly deployed as an indicator of importance of technologies in the previous studies [38]. Degree centrality can be defined as the number

1964
of ties incident upon a node. However, none of these centrality measures take into account indirect relationships [4]. Whereas in traditional network theory indirect links are in general of less value than direct links, this does not hold true in the case of patent citations [40]. Therefore, it is required to develop a new centrality measure that can capture indirect relationships in a network.
ANP The ANP is a generalization of the AHP [35]. The AHP, also developed by Saaty [34], is one of the most widely used multiple criteria decision making (MCDM) methods. The AHP decomposes a problem into several levels that make up a hierarchy in which each decision element is supposed to be independent. The ANP extends the AHP to problems with dependence and feedback. It allows for more complex interrelationships among decision elements by replacing a hierarchy in the AHP with a network [28]. Therefore, in recent years, there has been an increase in the use of the ANP in a variety of problems [24].
The process of the ANP is comprised of four major steps [8][28][35]. (1) Network model construction: The problem is decomposed into a network where nodes correspond to
clusters. The elements in a cluster may influence some or all the elements of any other cluster. These relationships are represented by arcs with directions. Also, the relationships among elements in the same cluster can exist and be represented by a looped arc.
(2) Pairwise comparisons and priority vectors: Elements of each cluster are compared pairwisely with respect to their impacts on an element in the cluster. In addition, pairwise comparisons are made for interdependency among elements outside clusters. When cluster weights are required to weight the supermatrix at the next stage, clusters are also compared pairwisely with respect to their impacts on each cluster. The way of conducting pairwise comparison and obtaining priority vectors is the same as in the AHP.
(3) Supermatrix formation and transformation: The local priority vectors are entered into the appropriate columns of a supermatrix, which is a partitioned matrix where each segment represents a relationship between two clusters. The supermatrix of a system of N clusters is denoted as the following:
where Ck is the kth cluster (k= 1, 2,…,N) which has nk elements denoted as ek1, ek2,…, eknk. A matrix segment, Wij, represents a relationship between the ith cluster and the jth cluster. Each column of Wij is a local priority vector

1965
obtained from the corresponding pairwise comparison, representing the importance of the elements in the ith cluster on an element in the jth cluster. When there is no relationship between clusters, the corresponding matrix segment is a zero matrix.
Then, the supermatrix is transformed into the weighted supermatrix each of whose columns sums to one. A recommended approach to obtaining the weighted supermatrix is to determine a cluster priority vector for each cluster, which indicates relative importance of influences of other clusters on each cluster. This can be done by conducting pairwise comparisons among clusters with respect to the column cluster.
Finally, the weighted supermatrix is transformed into the limit supermatrix by raising itself to powers. The reason for multiplying the weighted supermatrix is because we wish to capture the transmission of influence along all possible paths of the supermatrix. The entries of the weighted supermatrix represent only the direct influence of any element on any other element, but an element can influence a second element indirectly through its influence on a third element that has the direct influence on the second element. Such one-step indirect influences are captured by squaring the weighted supermatrix, and two-step indirect influences are obtained from the cubic power of the matrix, and so on. Raising the weighted supermatrix to the power 2k+1, where k is an arbitrarily large number, allow convergence of the matrix, which means the row values converge to the same value for each column of the matrix. The resulting matrix is called the limit supermatrix, which yields limit priorities capturing all the indirect influences of each element on every other element. For more details on supermatrix characteristics and theory, see the text by Saaty [35].
(4) Final priorities: When the supermatrix covers the whole network, the finial priorities of elements are found in the corresponding columns in the limit supermatrix. If a supermatrix only includes components interrelated, additional calculation should be made.
ANP-Based Technology Network Overview of Proposed Approach The ANP underlies the novel approach to identification of core technologies in a technology network. The ANP and network analysis has the keyword, ‘network’, in common, but they are markedly different in ultimate objectives and nodes that make up a network. The ANP is a MCDM methodology aimed at setting priorities of alternatives or selecting the best alternative. A network model in the ANP is composed of decision elements such as goal, criteria, and alternatives. On the other hand, the purpose of network analysis is to grasp the overall structure of a network consisting of a variety of types of actors by visualization and quantification. When a network is constructed to only visualize the overall relationships among actors, the ANP has nothing to do with network analysis. If measuring importance of actors or identifying core actors is intended in network analysis, however, the ANP can also be employed for the same purpose by viewing actors as alternatives. Then, the centralities or importance of actors are equivalent to the priorities of alternatives.
The overall process of the proposed approach is as follows. Firstly, the scope and level of a technology network is determined and patent data on selected technologies are collected. Then, a citation frequency matrix is obtained based on the citation relationships among technologies. Finally, the ANP is applied to obtain importance of technologies, which is named “limit centrality” that captures all the direct and indirect influence among technologies. In this section, the proposed approach is explained with a case study on telecommunication technologies. Technology Selection and Patent Data Collection Since, on any measure, the information and communication technology (ICT) industry has been at the forefront of industrial globalization [32], analyzing the ICT network is expected to provide valuable implications. However, the scope of ICTs is so wide that we narrow down the scope of the network to telecommunication technologies.
Paten data were collected from the United States Patent and Trademark Office (USPTO) database. The USPTO has classified granted patents into corresponding technology classes defined by the USPC (Unites States Patent Classification). Each subject matter division in the USPC includes a major component called a class and a minor component called a subclass [39]. A class generally delineates one technology from another and consists of subclasses that delineate processes, structural features, and functional features of the subject matter encompassed

1966
within the scope of a class. There also exists a hierarchy among subclasses in a class. Every subclass has an indent level as a shorthand notation for illustrating dependency, represented as a series of zero or more dots. A subclass having an indent level of zero is called a mainline subclass which is set in capital letters and bold font in a class schedule. Subclasses having one or more dots are the child of a mainline subclass. In this study, a mainline subclass is treated as a building block of the technology network. Since the child subclasses inherit all the properties of their parent subclass, it doest not make sense to treat all the subclasses at the same level.
A series of discussions with telecommunication technology experts led to selection of classes in the USPC as telecommunication technologies. For the convenience of illustration of the proposed approach, only four classes, as shown in TABLE 1, were selected, they are not exhaustive though. The titles of mainline subclasses are attached in Appendix A.
TABLE. 1: TELECOMMUNICATION TECHNOLOGY CLASSES Class Title Number of mainline subclasses 370 Multiplex communications 7 375 Pulse or digital communications 14 379 Telephonic communications 20 455 Telecommunications 12
Documents of all the granted patents assigned to the four classes were collected from the USPTO database
and stored in a database. Since the number of patents is so huge that we cannot collect all of them in manual, the own-developed JAVA-based web document parsing and mining program was used for automatically downloading patent documents. Citation Frequency Matrix The next step is to construct a citation frequency matrix which represents citation relationships among mainline subclasses. It indicates technological knowledge flows or influences among mainline subclasses. The basic form of a citation frequency matrix is shown in TABLE 2 where fNiMj denotes the number of patents in ith mainline subclass of class N that patents in mainline jth subclass of class M cite. As a citation has a direction from a citing patent to a cited patent, the matrix is asymmetric.
TABLE 2: FORM OF CITATION FREQUENCY MATRIX
… Class M (Citing) … … 1 2 … m …
… … … … … … … … 1 … fN1M1 fN1M2 … fN1Mm … 2 … fN2M1 fN2M2 … fN2Mm … … … … … … … …
Class N (Cited)
n … fNnM1 fNnM2 … fNnMm … … … … … … … … …
To examine the current structure of the telecommunication technology network, citations made by patents
only granted from 2000 to 2004 were considered. The number of citations for each cell was calculated by manipulating the database storing the collected patent documents. Since the number of mainline subclasses of the four classes is 53, the resulting citation frequency matrix is a 53×53 matrix, but not shown here due to the space limit. Only the citation frequency matrix at the class level is shown in TABLE 3.
TABLE 3: CITATION FREQUENCY MATRIX AT THE CLASS LEVEL
Cited class Citing class 455 379 375 370 455 15487 166 6804 744 379 1392 368 132 190 375 6469 29 19587 1380 370 1815 58 3151 1827

1967
ANP Network Model Construction Basically, a network model in ANP is constructed based on expert judgments to model an abstract decision problem. The network in the proposed approach is made on the basis of citation relationships represented in the citation frequency matrix, as is in the case of network analysis. A cluster in the ANP network corresponds to a class, and elements in a cluster are equivalent to mainline subclasses in a class. In the ANP context, then, the resulting network model only includes alternative clusters, contrary to the general network model in the ANP comprised of a goal cluster, criteria clusters, and alternative clusters. Thus, the importance of alternatives is only evaluated with respect to impacts or influences on other alternatives, not with respect to criteria or a goal, which is the same as the idea of centrality measures in network analysis.
An arrow indicates a citation relationship between classes or mainline subclasses. For example, an arrow which leaves class A and enters into class B is added to a network if some of the patents in class A cite some of the patents in class B. What this also means is class B has some influences on class A; thus, subclasses of class B should be pair-wisely compared with respect to impacts on each subclass of class A.
FIG. 2 shows the telecommunication technology network for ANP including the four classes. Every class has influences on each other, and includes a feedback loop that represents citation relationships among mainline subclasses in the class itself. Though the network can be elaborated more by describing citation relationships at the mainline class level, it is not represented due to its complexity.
FIG 2: TELECOMMUNICATION TECHNOLOGY NETWORK FOR ANP
Pair wise Comparisons and Priority Vectors The next step deals with obtaining priority vectors. Firstly, cluster weights are determined through comparisons at the cluster level. The basic form of measurement in the ANP is a pairwise comparison with a scale of 1–9 since subject judgments have to be made on qualitative aspects. When the measurements derive from judgments based on experience and understanding, they are obtainable only from relative comparisons, not in an absolute way [Saaty, 1996].
However, pairwise comparisons do not have to be done in the proposed approach since the importance of elements can be directly measured from the citation frequency matrix. For example, TABLE 3 shows that the number of citations made by patents of class 379 is 58 for the patents of class 370, 29 for the patents of class 375. This can be interpreted that class 370 is twice (=58/29) more important than class 375 in terms of impacts on class 379. Then, the number 2 is inserted to position (370, 375) and reciprocal value, 0.5, is assigned to position (375, 370). In this way, the pairwise comparison matrix with respect to class 379 among the four classes can be obtained as shown in TABLE 4. Then, the priority vector for class 379 is derived from the eigenvector method. This priority vector is naturally the same as the vector of the number of citations that the four classes received divided by total

1968
number of citations made by the patents of class 379. This is because the pairwise comparison matrix is a completely consistent matrix. TABLE 4: PAIRWISE COMPARISON MATRIX WITH RESPECT TO CLASS 379 AND RESULTING PRIORITY VECTOR
<379> 455 379 375 370 Priority vector Normalization 455 1 0.45 5.72 2.86 0.2673 =166/621 379 2.22 1 12.69 6.34 0.5926 =368/621 375 0.17 0.08 1 0.50 0.0467 =29/621 370 0.35 0.16 2 1 0.0934 =58/621
Therefore, the priority vectors for every pairwise comparison can be directly obtained from the citation
frequency matrix. TABLE 5 shows the cluster weights derived, which will be used to obtain the weighted supermatrix.
TABLE 5: CLUSTER WEIGHTS
455 379 375 370 455 0.6155 0.2673 0.2293 0.1797 379 0.0553 0.5926 0.0044 0.0459 375 0.2571 0.0467 0.6601 0.3333 370 0.0721 0.0934 0.1062 0.4412
Secondly, local priority vectors for mainline subclasses are obtained. In ANP, basically, pairwise
comparisons are made among elements of a cluster an arrow enters with respect to each element of a cluster from which an arrow leaves. For a feedback loop, elements in a cluster are pair-wisely compared with respect to each element in the cluster itself. For each pairwise comparison supposed to be made, local priority vectors can be directly derived without pairwise comparisons as mentioned above. For example, the importance of mainline subclasses of class 370 on each mainline subclass of class 450 is obtained by transformation of the citation frequency matrix, as shown in TABLE 6. What is important here is normalization of columns has to be done for each cluster. The resulting set of priority vectors, a priority matrix, will be imported to the supermatrix.
TABLE 6: CITATION FREQUENCY MATRIX AND ITS TRANSFORMATION INTO PRIORITY MATRIX
(A) CITATION FREQUENCY MATRIX 455
455/3.01 455/403 455/7 455/39 455/73 455/91 455/130 370/203 0 38 0 16 12 36 63 370/212 0 2 0 3 0 0 3 370/213 0 0 0 0 0 0 0 370/215 0 0 0 0 2 1 6 370/229 0 22 0 0 0 0 1 370/241 0 9 0 4 3 2 9 370/259 0 10 1 0 2 3 4 370/276 1 34 5 14 32 9 72 370/310 3 350 41 21 52 43 152 370/351 6 104 2 10 4 1 6 370/431 2 40 2 3 3 8 35
370
370/464 5 90 9 67 50 57 230
(B) PRIORITY MATRIX 455
455/3.01 455/403 455/7 455/39 455/73 455/91 455/130 370/203 0 0.054 0 0.116 0.075 0.225 0.108 370/212 0 0.003 0 0.022 0 0 0.005 370/213 0 0 0 0 0 0 0 370/215 0 0 0 0 0.013 0.006 0.01 370/229 0 0.031 0 0 0 0 0.002 370/241 0 0.013 0 0.029 0.019 0.013 0.015 370/259 0 0.014 0.017 0 0.013 0.019 0.007 370/276 0.059 0.049 0.083 0.101 0.2 0.056 0.124 370/310 0.176 0.501 0.683 0.152 0.325 0.269 0.262 370/351 0.353 0.149 0.033 0.072 0.025 0.006 0.01 370/431 0.118 0.057 0.033 0.022 0.019 0.05 0.06
370
370/464 0.294 0.129 0.15 0.486 0.313 0.356 0.396 Supermatrix Formation and Transformation The supermatrix is constructed with local priority vectors obtained from the previous step. TABLE 7 shows the form of the supermatrix for the telecommunication technology network, which is a 53×53 matrix composed of 16(=4×4) blocks. A block corresponds to a set of priority vectors, a priority matrix. The priority matrix in TABLE 6 is equivalent to W41 in the supermatrix. The whole supermatrix is not represented due to the space limit.

1969
TABLE 7: FORM OF SUPERMATRIX FOR TELECOMMUNICATION TECHNOLOGY NETWORK 455 379 375 370
455 W11 W12 W13 W14 379 W21 W22 W23 W24 375 W31 W32 W33 W34 370 W41 W42 W43 W44
The supermatrix then needs to be transformed into the weighted supermatrix. Each matrix segment of the
supermatrix is multiplied by the corresponding cluster weights shown in TABLE 5. For example, all the elements of W11 are multiplied by the weight of class 455 for class 455 itself, 0.6155, W41 is multiplied by 0.0721, and so on. However, the resulting matrix is not column stochastic because there are several matrix segments that have columns all of whose entries are zero. When this is the case, the weighted column of the supermatrix must be renormalized [Saaty, 1996]. The renormalized matrix, which is now column stochastic, is what is called the weighted supermatrix. A part of the weighted supermatrix is shown in TABLE 8.
TABLE 8: WEIGHTED SUPERMATRIX (EXLUDING CLASS 379 AND 375)
455 379 375 370 3.01 403 7 39 73 91 130 . . 203 212 213 215 229 241 259 276 310 351 431 464
3.01 0.0000 0.0003 0.0000 0.0032 0.0003 0.0014 0.0007 . . 0.0000 0.0000 0.0000 0.0000 0.0000 0.0000 0.0000 0.0000 0.0000 0.0056 0.0000 0.0035 403 0.0849 0.4270 0.2075 0.0570 0.1000 0.0197 0.0055 . . 0.0547 0.0257 0.0180 0.0628 0.0000 0.0000 0.1647 0.0051 0.0742 0.0842 0.0650 0.0243
7 0.0000 0.0228 0.1153 0.0142 0.0176 0.0066 0.0053 . . 0.0026 0.0000 0.0000 0.0000 0.0000 0.0000 0.0000 0.0000 0.0027 0.0000 0.0000 0.0165 39 0.1273 0.0455 0.0715 0.1740 0.0345 0.0521 0.0295 . . 0.0651 0.0513 0.0539 0.0000 0.0000 0.0000 0.0449 0.0253 0.0492 0.0730 0.0535 0.0373 73 0.2335 0.0956 0.1521 0.0538 0.1333 0.0938 0.0628 . . 0.0208 0.0000 0.0000 0.0628 0.0000 0.0000 0.0449 0.0051 0.0000 0.0056 0.0115 0.0043 91 0.0849 0.0046 0.0461 0.0585 0.0715 0.3256 0.0619 . . 0.0104 0.0000 0.0359 0.0000 0.0000 0.0000 0.0000 0.0013 0.0000 0.0000 0.0000 0.0017
455
130 0.0849 0.0195 0.0231 0.2547 0.2582 0.1163 0.4499 . . 0.0260 0.1027 0.0719 0.0628 0.0000 0.1797 0.0150 0.1517 0.0536 0.0112 0.0497 0.0920 379 . . . . . . . . . . . . . . . . . . . . . . 375 . . . . . . . . . . . . . . . . . . . . . .
203 0.0000 0.0039 0.0000 0.0084 0.0054 0.0162 0.0078 . . 0.1427 0.0788 0.0000 0.0000 0.0000 0.0000 0.0000 0.0000 0.0379 0.0041 0.0751 0.0209 212 0.0000 0.0002 0.0000 0.0016 0.0000 0.0000 0.0004 . . 0.0053 0.0630 0.0000 0.0000 0.0000 0.0000 0.0000 0.0000 0.0000 0.0000 0.0000 0.0000 213 0.0000 0.0000 0.0000 0.0000 0.0000 0.0000 0.0000 . . 0.0053 0.0473 0.2146 0.0000 0.0000 0.0000 0.0000 0.0000 0.0000 0.0000 0.0000 0.0043 215 0.0000 0.0000 0.0000 0.0000 0.0009 0.0005 0.0007 . . 0.0000 0.0000 0.0119 0.0000 0.0000 0.0000 0.0000 0.0000 0.0000 0.0000 0.0000 0.0014 229 0.0000 0.0023 0.0000 0.0000 0.0000 0.0000 0.0001 . . 0.0000 0.0158 0.0119 0.0000 0.0336 0.0939 0.0000 0.0000 0.0141 0.0358 0.0000 0.0043 241 0.0000 0.0009 0.0000 0.0021 0.0014 0.0009 0.0011 . . 0.0106 0.0315 0.0000 0.0000 0.0336 0.0469 0.0945 0.0000 0.0076 0.0225 0.0000 0.0058 259 0.0000 0.0010 0.0012 0.0000 0.0009 0.0014 0.0005 . . 0.0000 0.0000 0.0000 0.0000 0.0000 0.0000 0.0945 0.0000 0.0011 0.0010 0.0000 0.0007 276 0.0042 0.0035 0.0060 0.0073 0.0144 0.0041 0.0089 . . 0.0159 0.0000 0.0000 0.0000 0.0000 0.0000 0.0000 0.1704 0.0022 0.0082 0.0000 0.0029 310 0.0127 0.0361 0.0493 0.0110 0.0234 0.0194 0.0189 . . 0.1295 0.0945 0.0715 0.4110 0.1008 0.0000 0.1891 0.1947 0.1257 0.0235 0.2253 0.1024 351 0.0255 0.0107 0.0024 0.0052 0.0018 0.0005 0.0007 . . 0.0026 0.0000 0.0119 0.0000 0.0672 0.1314 0.0000 0.0000 0.0347 0.1535 0.0657 0.0591 431 0.0085 0.0041 0.0024 0.0016 0.0014 0.0036 0.0043 . . 0.0185 0.0158 0.0238 0.0514 0.0336 0.0282 0.0000 0.0000 0.0119 0.0328 0.0188 0.0137
370
464 0.0212 0.0093 0.0108 0.0350 0.0225 0.0257 0.0286 . . 0.1110 0.0945 0.0954 0.0000 0.2689 0.1408 0.2836 0.0974 0.2060 0.1597 0.0563 0.2256
Finally, the limit supermatrix was derived by raising the weighted supermatrix to powers, as shown in
Appendix E. In this case, convergence is reached at W41. TABLE 9 shows a part of the limit supermatrix.

1970
TABLE 9: LIMIT SUPERMATRIX (EXLUDING CLASS 379 AND 375) 455 379 375 370
3.01 403 7 39 73 91 130 . . 203 212 213 215 229 241 259 276 310 351 431 464 3.01 0.0007 0.0007 0.0007 0.0007 0.0007 0.0007 0.0007 . . 0.0007 0.0007 0.0007 0.0007 0.0007 0.0007 0.0007 0.0007 0.0007 0.0007 0.0007 0.0007 403 0.0591 0.0591 0.0591 0.0591 0.0591 0.0591 0.0591 . . 0.0591 0.0591 0.0591 0.0591 0.0591 0.0591 0.0591 0.0591 0.0591 0.0591 0.0591 0.0591
7 0.0082 0.0082 0.0082 0.0082 0.0082 0.0082 0.0082 . . 0.0082 0.0082 0.0082 0.0082 0.0082 0.0082 0.0082 0.0082 0.0082 0.0082 0.0082 0.0082 39 0.0393 0.0393 0.0393 0.0393 0.0393 0.0393 0.0393 . . 0.0393 0.0393 0.0393 0.0393 0.0393 0.0393 0.0393 0.0393 0.0393 0.0393 0.0393 0.0393 73 0.0450 0.0450 0.0450 0.0450 0.0450 0.0450 0.0450 . . 0.0450 0.0450 0.0450 0.0450 0.0450 0.0450 0.0450 0.0450 0.0450 0.0450 0.0450 0.0450 91 0.0463 0.0463 0.0463 0.0463 0.0463 0.0463 0.0463 . . 0.0463 0.0463 0.0463 0.0463 0.0463 0.0463 0.0463 0.0463 0.0463 0.0463 0.0463 0.0463
455
130 0.1640 0.1640 0.1640 0.1640 0.1640 0.1640 0.1640 . . 0.1640 0.1640 0.1640 0.1640 0.1640 0.1640 0.1640 0.1640 0.1640 0.1640 0.1640 0.1640 379 . . . . . . . . . . . . . . . . . . . . . . 375 . . . . . . . . . . . . . . . . . . . . . .
203 0.0158 0.0158 0.0158 0.0158 0.0158 0.0158 0.0158 . . 0.0158 0.0158 0.0158 0.0158 0.0158 0.0158 0.0158 0.0158 0.0158 0.0158 0.0158 0.0158 212 0.0004 0.0004 0.0004 0.0004 0.0004 0.0004 0.0004 . . 0.0004 0.0004 0.0004 0.0004 0.0004 0.0004 0.0004 0.0004 0.0004 0.0004 0.0004 0.0004 213 0.0011 0.0011 0.0011 0.0011 0.0011 0.0011 0.0011 . . 0.0011 0.0011 0.0011 0.0011 0.0011 0.0011 0.0011 0.0011 0.0011 0.0011 0.0011 0.0011 215 0.0004 0.0004 0.0004 0.0004 0.0004 0.0004 0.0004 . . 0.0004 0.0004 0.0004 0.0004 0.0004 0.0004 0.0004 0.0004 0.0004 0.0004 0.0004 0.0004 229 0.0017 0.0017 0.0017 0.0017 0.0017 0.0017 0.0017 . . 0.0017 0.0017 0.0017 0.0017 0.0017 0.0017 0.0017 0.0017 0.0017 0.0017 0.0017 0.0017 241 0.0023 0.0023 0.0023 0.0023 0.0023 0.0023 0.0023 . . 0.0023 0.0023 0.0023 0.0023 0.0023 0.0023 0.0023 0.0023 0.0023 0.0023 0.0023 0.0023 259 0.0008 0.0008 0.0008 0.0008 0.0008 0.0008 0.0008 . . 0.0008 0.0008 0.0008 0.0008 0.0008 0.0008 0.0008 0.0008 0.0008 0.0008 0.0008 0.0008 276 0.0074 0.0074 0.0074 0.0074 0.0074 0.0074 0.0074 . . 0.0074 0.0074 0.0074 0.0074 0.0074 0.0074 0.0074 0.0074 0.0074 0.0074 0.0074 0.0074 310 0.0365 0.0365 0.0365 0.0365 0.0365 0.0365 0.0365 . . 0.0365 0.0365 0.0365 0.0365 0.0365 0.0365 0.0365 0.0365 0.0365 0.0365 0.0365 0.0365 351 0.0101 0.0101 0.0101 0.0101 0.0101 0.0101 0.0101 . . 0.0101 0.0101 0.0101 0.0101 0.0101 0.0101 0.0101 0.0101 0.0101 0.0101 0.0101 0.0101 431 0.0064 0.0064 0.0064 0.0064 0.0064 0.0064 0.0064 . . 0.0064 0.0064 0.0064 0.0064 0.0064 0.0064 0.0064 0.0064 0.0064 0.0064 0.0064 0.0064
370
464 0.0513 0.0513 0.0513 0.0513 0.0513 0.0513 0.0513 . . 0.0513 0.0513 0.0513 0.0513 0.0513 0.0513 0.0513 0.0513 0.0513 0.0513 0.0513 0.0513
Limit Centrality As the supermatrix covers the whole network, the columns in the limit supermatrix (TABLE 9) represent final priorities, namely, limit centrality. That is why it is called limit centrality. Due to the nature of limit priorities in ANP, the limit centralities of all the elements sum to one. The limit centrality indicates importance of technologies in terms of impacts on other technologies, taking into account all the direct and indirect influences. TABLE 10 shows the limit centrality of 53 mainline subclasses. The limit centrality of a class is the sum of mainline subclasses belonging to the class.
TABLE 10: LIMIT CENTRALITY OF 53 MAINLINE SUBCLASSES Class 455 Limit centrality Class 379 Limit centrality Class 375 Limit centrality Class 370 Limit centrality 455/3.01 0.000670 379/1.01 0.000892 375/130 0.047675 370/203 0.015783 455/403 0.059142 379/67.1 0.013203 375/211 0.000492 370/212 0.000351
455/7 0.008231 379/90.01 0.034076 375/216 0.003655 370/213 0.001105 455/39 0.039348 379/110.01 0.000686 375/219 0.010537 370/215 0.000421 455/73 0.045033 379/111 0.009484 375/224 0.003602 370/229 0.001710 455/91 0.046345 379/142.01 0.001169 375/229 0.013847 370/241 0.002271
455/130 0.164017 379/156 0.001585 375/237 0.000321 370/259 0.000782 379/188 0.004292 375/238 0.001695 370/276 0.007402 379/201.01 0.005496 375/239 0.002604 370/310 0.036503 379/350 0.005229 375/240 0.007805 370/351 0.010078 379/399.01 0.003691 375/242 0.004499 370/431 0.006361 379/414 0.000000 375/256 0.000159 370/464 0.051279 379/419 0.008376 375/257 0.000792 379/441 0.001678 375/259 0.049151 375/286 0.004466 375/295 0.041154 375/316 0.150020 375/353 0.000352 375/354 0.068507 375/377 0.001981 0.362786 0.089857 0.413314 0.134046
At the mainline subclass level, the one with the highest limit centrality is 455/130 (receiver or analog

1971
modulated signal frequency converter), and the next is 375/316 (receivers). It is obvious that these technologies have significant impacts on other technologies, and therefore they are considered as the core technologies of the telecommunication technology network. On the other hand, the limit centrality of 379/414 (transmission line conditioning) is zero since the patents of 379/414 have never been cited by all the patents of the four classes. The class whose limit centrality is the highest is 375 (Pulse or digital communications), followed by 455, 370, and 379. Conclusions The proposed approach measures the limit centralities of technologies with the aim of identification of core technologies in the technology network. A case study on the telecommunication technology network was presented to illustrate the proposed approach. After constructing the citation frequency matrix based on patent data collected from the USPTO, the ANP network model was constructed and local priority vectors were obtained. Forming and transforming the supermatrix led to converged priorities, limit centralities.
The main contribution of this study is to apply the MCDM methodology, ANP, to a technology network. Since ANP captures the relative importance that mirrors all the direct and indirect interactions, the limit centrality measures importance of technologies in terms of impacts on other technologies in the technology network, taking into account indirect impacts or relationships, which is very difficult or tedious with the conventional centrality measures. The applicability of limit centrality is not limited to a technology network. For any type of social networks, the limit centrality can be used as an implicative centrality measure characterizing a network and showing core actors in the network.
Nevertheless, this research is still subject to some limitations. The drawback of the proposed approach is it cannot be used for undirectional networks where an edge has no direction and only represents the existence of a relationship between two nodes since relationships in a network of ANP must have directions depending on the influence between elements or clusters. The problem with the case study presented is the four patent classes selected are by no means exhaustive; they cannot cover the whole range of telecommunication technologies. More patent classes need to be included in the network. These limitations could serve as fruitful avenues for future research. Applications of the proposed approach to a variety of networks can be a worthwhile area for future research as well. A dynamic analysis on the telecommunication network is also expected to provide useful information on the change of the network structure and technological trends.
Acknowledgements This research was supported by the MIC(Ministry of Information and Communication), Korea, under the ITRC(Information Technology Research Center) support program supervised by the IITA(Institute of Information Technology Assessment)
References
[1] Archibugi, D., Pianta, M., (1996). Measuring technological change through patents and innovation surveys. Technovation, 16, 451-458.
[2] Basberg, B. L. (1984). Patent statistics and the measurement of technological change: an assessment of the Norwegian patent data, 1840-1980. World Patent Information, 6, 158-164.
[3] Basberg, B. L. (1987). Patents and the measurement of technological change: a survey of literature. Research Policy, 16, 131-141.
[4] Borgatti, S. P. (2005). Centrality and network flow. Social Networks, 27(1), 55-71. [5] Breitzman, A., & Thomas, P. (2002). Using patent citation analysis to target/value M&A candidates.
Research Technology Management, 45, 28-46. [6] Breschi, S., Lissoni, F., & Maleraba, F. (1998). Knowledge Proximity and Technological Diversification,
CESPRI, ISE Research Project.

1972
[7] Chen, D-Z., Chang, H-W., Huang M-H., & Fu, F-C. (2005). Core technologies and key industries in Taiwan from 1978 to 2002: a perspective from patent analysis. Scientometrics, 64, 31-53.
[8] Chung, S., Lee, A., & Pearn, W. (2005). Analytic network process (ANP) approach for product mix planning in semiconductor fabricator. International Journal of Production Economics, 96(1), 15-36.
[9] Courtial, J. P., Callon, M., & Sigogneau, A. (1993). The use of patent titles for identifying the topics of invention and forecasting trends, Scientometrics, 26(2), 231-242.
[10] EIRMA (2000). Technology Monitoring for Business Success, European Industrial Research Management Association, Working Group 55 Report.
[11] Ernst, H. (2003). Patent information for strategic technology management. World Patent Information, 25(3), 233-242.
[12] Freeman, L. C. (1979). Centrality in social networks: conceptual clarification. Social Networks, 1, 215. [13] Gangulli, P. (2004). Patents and patent information in 1979 and 2004: a perspective from India. World
Patent Information, 26, 61-62. [14] Gelsing, L. (1992). Innovation and the development of industrial networks. In: Lundvall, B. –A. (Ed.),
National Systems of Innovation – towards a Theory of Innovation and Interactive Learning. Pinter, London, 116-128.
[15] Grilliches, Z. (1990). Patent statistics as economic indicators: a survey. Journal of Economic Literature, 28, 1661-1707.
Contact the author for a complete list of references
APPENDIX
APPENDIX A. TITLES OF CLASSES AND MAINLINE SUBCLASSES 455 Telecommunications
1 INTERFERENCE SIGNAL TRANSMISSION (E.G., JAMMING) 2.01 AUDIENCE SURVEY OR PROGRAM DISTRIBUTION USE ACCOUNTING 3.01 WIRELESS DISTRIBUTION SYSTEM 400 HAVING SINGLE-CHANNEL TELEPHONE CARRIER 403 RADIOTELEPHONE SYSTEM
7 CARRIER WAVE REPEATER OR RELAY SYSTEM (I.E., RETRANSMISSION OF SAME INFORMATION) 26.1 USE OR ACCESS BLOCKING (E.G., LOCKING SWITCH)
39 TRANSMITTER AND RECEIVER AT SEPARATE STATIONS 73 TRANSMITTER AND RECEIVER AT SAME STATION (E.G., TRANSCEIVER) 91 TRANSMITTER
130 RECEIVER OR ANALOG MODULATED SIGNAL FREQUENCY CONVERTER 899 MISCELLANEOUS 379 Telephonic communications 1.01 DIAGNOSTIC TESTING, MALFUNCTION INDICATION, OR ELECTRICAL CONDITION MEASUREMENT
36 FREE CALLING FROM PAYSTATION 37 EMERGENCY OR ALARM COMMUNICATIOSN (E.G., WATCHMAN'S CIRCUIT) 52 INCLUDING AID FOR HANDICAPPED USER (E.G., VISUAL, TACTILE, HEARING AID COUPLING)
55.1 HAVING NEAR FIELD LINK (E.G., CAPACITIVE, INDUCTIVE) 56.1 HAVING LIGHT WAVE OR ULTRASONIC LINK FOR SPEECH OR PAGING SIGNAL 67.1 AUDIO MESSAGE STORAGE, RETRIEVAL, OR SYNTHESIS
90.01 TELEPHONE LINE OR SYSTEM COMBINED WITH DIVERSE ELECTRICAL SYSTEM OR SIGNALLING 110.01 COMPOSITE SUBSTATION OR THERMINAL (E.G., HAVING CALCULATOR, RADIO)
111 WITH USAGE MEASUREMENT (E.G., CALL OR TRAFFIC REGISTER) 142.01 RECEPTION OF CALLING INFORMATION AT SUBSTATION IN WIRELINE COMMUNICATIONS SYSTEM
143 WITH CHECK OPERATED CONTROL (E.G., PAYSTATION) 156 MULTI-LINE OR KEY SUBSTATION SYSTEM WITH SELECTIVE SWITCHING AND CENTRAL SWITCHING OFFICE
CONNECTION 167.01 PRIVATE (E.G., HOUSE OR INTERCOM) OR SINGLE LINE SYSTEM
177 POLYSTATION LINE SYSTEM (I.E., PARTY LINE) 188 CALL OR TERMINAL ACCESS ALARM OR CONTROL
201.01 SPECIAL SERVICES 219 PLURAL EXCHANGE NETWORK OR INTERCONNECTION

1973
242 CENTRALIZED SWITCHING SYSTEM 333 CONCENTRATOR OR TRUNK SELECTOR 338 REPEATER (E.G., VOICE FREQUENCY)
406.01 ECHO CANCELLATION OR SUPPRESSION 350 SUPERVISORY OR CONTROL LINE SIGNALING
387.01 SUBSTATION OR TERMINAL CIRCUITRY 398 LINE EQUALIZATION OR IMPEDANCE MATCHING
399.01 SUBSCRIBER LINE OR TRANSMISSION LINE INTERFACE 414 TRANSMISSION LINE CONDITIONING 418 CALL SIGNAL GENERATING (E.G., RINGING OR TONE GENERATOR) 419 TERMINAL 441 TERMINAL ACCESSORY OR AUXILIARY EQUIPMENT 457 MISCELLANEOUS 375 Pulse or digital communications 130 SPREAD SPECTRUM 211 REPEATERS 216 APPARATUS CONVERTIBLE TO ANALOG 218 EARTH OR WATER MEDIUM 219 TRANSCEIVERS 224 TESTING 229 EQUALIZERS 237 PULSE NUMBER MODULATION 238 PULSE WITH MODULATION 239 PULSE POSITION, FREQUENCY, OR SPACING MODULATION 240 BANDWIDTH REDUCTION OR EXPANSION 242 PULSE CODE MODULATION 256 PULSE TRANSMISSION VIA RADIATED BASEBAND 257 CABLE SYSTEMS AND COMPONENTS 259 SYSTEMS USING ALTERNATING OR PULSATING CURRENT 286 MULTILEVEL 295 TRANSMITTERS 316 RECEIVERS 353 PULSE AMPLITUDE MODULATION 354 SYNCHRONIZERS 377 MISCELLANEOUS 370 Multiplex communications 200 PHANTOM 201 CROSSTALK SUPPRESSION 202 AMPLITUDE COMPRESSION OR EXPANSION 203 GENERALIZED ORTHOGONAL OR SPECIAL MATHEMATICAL TECHNIQUES 212 PULSE WIDTH (PULSE DURATION) MODULATION 213 PULSE POSITION MODULATION 214 SIMULTANEOUS TELEGRAPHY AND TELEPHONY 215 PHASE MODULATION 216 FAULT RECOVERY 229 DATA FLOW CONGESTION PREVENTION OR CONTROL 241 DIAGNOSTIC TESTING (OTHER THAN SYNCHRONIZATION) 254 NETWORK CONFIGURATION DETERMINATION 259 SPECIAL SERVICES 272 SEXTUPLEX 273 QUADRUPLEX 276 DUPLEX 297 DIPLEX 298 LOW SPEED ASYNCHRONOUS DATA SYSTEM (E.G., TELETYPEWRITER SERVICE) 307 TRASMULTIPLEXERS 308 RESONANT TRANSFER TECHNIQUES 309 RESONANT TRANSFER SUBSTITUTES 310 COMMUNICATION OVER FREE SPACE 351 PATHFINDING OR ROUTING 431 CHANNEL ASSIGNMENT TECHNIQUES 464 COMMUNICATION TECHNIQUES FOR INFORMATION CARRIED IN PLURAL CHANNELS 546 MISCELLANEOUS

1974
The Emergence of Technology Entrepreneur and Economic Growth
Guoqiang Li, [email protected]
University of Macau, China
Abstracts Based on Yang and Ng’s model, this paper will study the emergence of technology entrepreneur from the perspective of saving transaction cost. Inframarginal analysis (total cost-benefit analysis across corner solutions in addition to marginal analysis of each corner solution) of the model has formalized the Coase-Cheung theory of the firm. It is shown that firm can be used to improve transaction efficiency and to promote the division of labor by excluding the activity with the lowest transaction efficiency from being directly priced and traded. The analysis of the emergence of technology entrepreneur has found the conditions for the existence of technology entrepreneur and its implications for economic growth.
Introduction
This paper employs Yang and Ng’s analysis framework (Yang and Ng, 1993; 1995) to investigate the existence of technology entrepreneur 1 in the line of Coase and Cheung’s firm theory. (See also related contributions by Borland and Yang, 1995; Liu and Yang, 2000; Yang, 2001.)
Since firms play a very important role in the growth of modern economies, it is unusual for outsiders to economics to take it for granted that there exists a well-developed theory of the institution of firm (Hart, 1996). However, we fail to deal with the problem of economic organization successfully. The mission of firm in economy is to “find the efficient level and pattern of division of labor in order to reduce scarcity by trading off the productivity gains against transaction costs” (Yang and S. Ng, 1998). Therefore, we are very familiar with the function of the price system in allocating resource, 2 rather than the function of the price system in coordinating specialization and division of labor (Yang, 2001).
Actually, most formal models of “domestic firm” are rudimentary, and some other models with “real world features of corporations” fail to be accepted by the theoretical mainstream due to the lack of precision and rigor (Hart, 1996). Therefore, we cannot obtain enough help from the existing theories of “firm” when we try to explore the emergence of technology entrepreneur. We will turn to a new classical framework.
There are two alternative ways to coordinate production: one is the external market, which is decentralized and achieves resources allocation through the price mechanism; the other is the internal organization of firm, which suppresses the mechanism with central planning and direct control (Coase, 1937). Cheung (1983) interprets Coase’s firm theory in the light of contractual arrangements.3 Cheung argues that "we do not exactly know what the firm isnor is it vital to know. The word ‘firm’ is simply a shorthand description of a way to organize activities under contractual arrangements that differ from those of ordinary product markets." He claims that "The growth of a firm may then be viewed as the replacement of a product market by a factor market, resulting in a saving in transaction costs."
Yang and Ng (1995) and Yang (2000) refine Coase theory of firm. In Yang and Ng’s model and Yang’s model, one intermediate good is needed in the production of final goods. The intermediate good can be produced inside a firm, or it can be purchased from the market outside. Yang and Ng interpret Cheung’s argument of the replacement of product market with labor market as a necessary condition for the existence of firm.
The rest of the paper is organized as follows: In section 2, the model with one intermediate good is introduced and two types of the production of the final goods are assumed. In section 3, all the possible market structures are analyzed and their corner equilibrium solutions are derived. In section 4, the emergence of technology entrepreneur is presented and we provide a brief conclusion in section 5.

1975
The Model
Let us consider an economy with 1M ex ante identical consumer-producers. There are one consumer good y and
one intermediate good x (we can interpret x as technology). The amount self-provided of the consumer good and
intermediate good are y and x respectively. The amount of the two goods sold to the market are sy and sx
respectively. The amount of the two goods purchased from the market are dy and dx respectively.
An individual’s production function for the final good is
( )[ ]ayd
xs lxtxyy +=+ , 15.0 << a 4
where xt is the transaction efficiency coefficient of the intermediate good market. xt−1 is transaction cost
coefficient, 5 which “disappears” in transaction. dx xt is the net amount an individual receives from the purchase of
this intermediate good. dx xtx + is the total amount of the intermediate good employed in the production of the
final good y . yl is the labor share in producing the final good and syy + is the output of this final good. A
person’s labor share in producing a good is defined as his level of specialization in producing this good. A production function is said to display economies of specialization if the total factor productivity of a
good increases with a person’s level of specialization in producing the good (Yang, 2001). The total factor used to
produce the final good y is ( ) ( ) 5.05.0
yd rlx and the total factor productivity is ( ) ( )( ) ( ) 5.05.05.0
/−= a
yd
yds rlxrlxy
which increases with yl if 5.0>a . The parameter a is the indicator of the degree of economies of specialization
in producing the final good. The production function of the intermediate good is
( )bx
s lxx =+ , 1>b
where sxx + is the output of the intermediate good and xl is a person’s level of specialization in producing the
intermediate good. If 1>b , the production function displays economies of specialization. Similarly, the parameter b represents the degree of economies of specialization in producing the intermediate good.
We assume that each individual is endowed with one unit of labor, so we have
1=+ yx ll , 10 ≤≤ il , yxi ,=
The utility function of each individual is given by
dkyyU +=
where the amount self-provided of the final good is y . dy is the amount purchased from the final good market and
k is the transaction efficiency coefficient of the final good market. Finally, personal budget constraint for each individual is
sy
sx
dy
dx yPxPyPxP +=+
where yP is the price of the final good andxP is the price of the intermediate good.
Free entry for all individuals into any sectors and a very large 1M are assumed. Free entry implies every
individual can choose to become a technology producer or become a worker, who transforms the technology into the final good.

1976
Market Structure and Corner Equilibrium Technology Producer’s Possible Choices Each individual makes a decision about which goods to produce and on his demand for and supply of any traded good to maximize his utility. A given structure of production and trade activities for any individual is defined as a
configuration. There are 6426 = combinations of zero and non-zero values of x , sx , dx , y , sy , dy and
therefore 64 possible configurations. The combination of the configurations of the 1M individuals in the economy
is defined as a market structure. A feasible market structure is composed of a set of choices of configurations by individuals such that the market clearing conditions can be maintained. Each market structure has a corner equilibrium solution. Corner equilibrium is defined as a set of relative numbers of individuals choosing different configurations such that (1) market clearing conditions can be maintained; (2) each individual maximizes his utility at a given prices for a given market structure.
Using Kuhn-Tucker sufficiency theorem, we can rule out interior solutions and many corner solutions from the list of candidates for optimal decision. Yang and Ng (1993) and Wen (1998) used Kuhn-Tucker conditions to establish following lemma (See also Yao, 2002 and Diamantaras and Gilles, 2004 for the results under more general conditions).
Lemma: An individual sells at most one good and does not buy and self-provide the same good. he self-provides the consumer good if he sells it. If 1>b and )1,5.0(∈a , he does not self-provide the intermediate good
unless he produces the final good. After having considered the Lemma, we can identify four possible structures: autarky, technology
transferor, technology specialist and technology entrepreneur. Structure of autarky and structure of technology transferor are non-firm mode of production, as shown in Fig. 1 and Fig. 2. Structure of technology specialist and structure of technology entrepreneur are firm mode of production as shown in Fig. 3 and Fig. 4.
In the structure of autarky, 6 Each individual spends some time to self-provide intermediate good x , and then he uses his remaining time and x produced to produce the final good. In the structure of technology transferor, markets for the intermediate good x and the final good emerge. Some individuals are specialized in producing x and the others are specialized in producing the final good. In the structure of technology specialist, worker is the owner of a firm and technology producers are employed to produce technology in the firm. And the technology producers hired by firms are called technology specialists. In the structure of technology entrepreneur, technology producer is the owner of a firm and workers are employed to transform the technology into the final good. So this technology producer as the owner of a firm is called technology entrepreneur. y y x y
dx sy x sy
d
xl dyl sy y x
sx dy sxl dy s
yl dy
FIG. 1 FIG. 2 FIG. 3 FIG. 4 AUTARKY TECHNOLOGY TECHNOLOGY TECHNOLOGY
TRANSFEROR SPECIALIST ENTREPRENEUR
A xy /
yx /
xly /
yl x / yl y /
ylx /

1977
Technology Producer’s Utility from Different Choices In the structure of technology entrepreneur as shown in Fig. 4, technology producer is the owner, who produces the technology and hires workers from labor market to produce the final good. He claims the residual of the contracts
between him and the employees. This is denoted by configuration ( ylx / ). Let ( yl y / ) denote a configuration, in
which an individual sells his labor, becomes a worker, and buys the final good. In Fig. 4, ovals represent configurations, and lines represent the flow of labor and the final good. Dotted circle represents the institution of firm.
In configuration ( ylx ), technology entrepreneur’s utility can be represented by
Max YU x =
s. t. ss NyYY =+ (total output of the firm)
( )a
yds rlxy = , 1=yl (production function of every employee)
Nxx sd = (intermediate good used by every employee)
( )ax
s lx = , 1=xl (owner’s production function)
NwlYP ys
y = (budget constraint)
where Y is the residual return claimed by the owner, sY is the total amount of the final good sold to the employees.
N is the number of the workers hired. sy is the output of the final good produced by each employee, yl is
employee’s level of specialization in producing the final good. dx is the intermediate good used by each employee, sx is the total amount of the intermediate good produced by the owner. w is the wage rate. r is the transaction
efficiency coefficient of the labor market for workers. In configuration ( yl y ), employee’s utility can be represented by
Max dy kyU =
s. t. yd
y wlyP = , 1=yl (budget constraint)
where dy is the amount of the final good needed by each employee. k is the transaction efficiency of the final
good market. In corner equilibrium, the owner’s utility should be equal to employees’ utility due to the assumption of ex
ante identical consumer-producers. Solving the corner equilibrium solution, we can obtain the technology entrepreneur’s utility:
( ) aaaaTE kraaU −−−= 111
We can do the similar analyses to obtain technology producer’s utilities from the other three choices. They are summarized in Table 1.

1978
TABLE 1: TECHNOLOGY PRODUCER’S REAL INCOMES FROM DIFFERENT CHOICES
Choices Technology producer’s real incomes
Meaning of the coefficients
Autarky (A) ( ) ( )baabA bbU +−+= 11
Technology transferor (TT) ( ) aaaaTT ktaaU −−= 11 t : transaction efficiency of technology
market
k : transaction efficiency of final good market
Technology specialist (TS) ( ) ( ) aaats
aaTS kraaU −−= 11 tsr : transaction efficiency of market
for technology specialists Technology entrepreneur (TE) ( ) aa
waa
TE kraaU −−−= 111 wr : transaction efficiency of market
for workers The Emergence of Technology Entrepreneur From above analyses, we can find that standard marginal analysis of interior solution does not work and corner solutions are allowed in our model. Therefore, we need a three-step inframarginal analysis. In the first step a list of candidates for an individual’s optimum decision are identified by excluding all inefficient interior and corner solutions. In the second step all the solutions for possible corner structures will be derived. The third step is total cost-benefit analysis. After we have obtained the corner equilibrium solutions for four market structures, we can find the relevant conditions under which technology entrepreneur will emerge.
In all the four corner structures, the fourth structure as shown in Fig. 4 is the structures of technology entrepreneur. If it is the general equilibrium structure, we can say that technology entrepreneur emerges. Now, let us look at the conditions for the emergence of technology entrepreneur.
The reason for the structure of technology entrepreneur to be the general equilibrium structure is that it can
generate the highest per capita real income for all the individuals in the economy. We have iTE UU > ,
TSTTAi ,,= .
If ATE UU > , we have ( ) ( ) ( ) ( ) ( )baaaaw bbaakr +−−−−− +−>
−− 1111 1111
. This inequality shows that the structure
of technology entrepreneur can generate more income than the structure of autarky when the transaction efficiency of the labor market for workers and the efficiency of the final good market are high enough. Although there are no transaction costs in the structure of autarky, technology entrepreneur still emerge if the economy of specialization can overweigh the transaction costs incurred in the structure of technology entrepreneur.
If TTTE UU > , we have 12 −−> a
w tkr . If this inequality is satisfied, the structure of technology
entrepreneur can generate more income than the structure of technology transferor. Compared with t , the
transaction efficiency of technology market, if wr , the transaction efficiency of market for workers is high enough,
this inequality will be satisfied. Between these two market structures, efficient labor market for workers is the sufficient condition for the emergence of technology entrepreneur.
If TSTE UU > , we have 12 −−> aa
tsw krr . This inequality indicates that when the labor market for workers
is very efficient, the structure of technology entrepreneur can generate more income than the structure of technology specialist, and technology entrepreneur will emerge. Since the labor market for workers is relatively more efficient, without doubt, the ideal structure must make full use of this more efficient labor market. Naturally, the structure
with the workers as the owners of firms is not the ideal structure. 12 −−> aa
tsw krr can also be written as

1979
( )aaawts krr 2121 −−−
< . This inequality shows that when the labor market for technology specialists is not efficient, it is
better to avoid measuring the efforts made by technology specialists hired by firms. In this case, the structure of technology entrepreneur will be the ideal structure.
Conclusion This paper has refined Coase’s ideas about transaction costs. Coase claims that the institution of the firm can be used to reduce transaction costs. This claim should be interpreted from the perspective of marginal analysis of growth or shrink of the firm. Compared with the structures of Autarky and the structure of technology transferor, the structure of technology specialist and the structure of technology entrepreneur have more market transactions and entail more transaction costs. The institution of firm will emerge as long as increased economies of division of labor outweigh the increased transaction costs.
The basic conditions for the emergence of technology entrepreneur is that the transaction efficiency of the good market for technology and the transaction efficiency of the labor market for technology specialists are not sufficiently high, so that the ideal structure should avoid the direct pricing and trading of the technology, and avoid using of the low efficient labor market for technology specialists. This condition implies that technology specialist should be the owner of firm. The evolution of economic organization from the structure of autarky to the structure of technology transferor, to the structure of technology specialist and finally to the structure of technology entrepreneur implies that our economy grows discontinuously.
References [1] Alchian A. A. and Demsetz H. (1972). Production, information costs, and economic organization. American
Economic Review, LXII, December, 777-795. [2] Auerbach, P. (1988). Competition: the economics of industrial change. Blackwell: Oxford. [3] Borland, J. and Yang, X. (1995). Specialization, product development, evolution of the institution of the firm,
and economic growth. Journal of Evolutionary Economics, 5, 19-42. [4] Bull I., Thomas H. and Willard G. (1995). Entrepreneurship: perspectives on theory building. Pergamon:
Britain. [5] Cheung, S. (1983). The contractual nature of the firm, The journal of law and economics, 1, 1-21. [6] Coase, R. E. (1937). The nature of the firm. Economica, Vol. 4, 386-405. [7] Diamantaras, D. and Gilles, R. P. (2004). On the Microeconomics of Specialization. Journal of Economic
Behavior and Organization, Special Issue, 55(2), 223-236. [8] Glancey K. S. and Mcquaid R. W. (2000). Entrepreneurial economics. Macmillan: London. [9] Grossman, S. and Hart. O. (1986). The costs and benefits of ownership: A theory of vertical and lateral
integration. Journal of Political Economy, 94, 691-719. [10] Hart, O. (1996). An economist's perspective on the theory of the firm, in The Economic Nature of The Firm,
edited by Putterman, L and Kroszner, R. S. Cambridge University Press: Cambridge. [11] Lambing P. and Kuehl C. (1997). Entrepreneurship. Prentice-Hall. [12] Liu, P. and Yang, X., (2000). The theory of irrelevance of the size of the firm. Journal of Economic Behavior
and Organization, 42, 145-165. [13] Shi, H. and Yang, X. (1998). A new theory of industrialization. Journal of Comparative Economics, 20, 171-
189. [14] Wen, M. (1997). Division of labor in economic development, PhD dissertation, Department of Economics,
Monash University. [15] Milgrom, P. and Roberts, J. Economic theories of the firm: past, present, and future. Canadian Journal of
Economics, 21, 444-458.

1980
Contact author for full list of references.
End Notes
1 Please see Bull I., Thomas H. and Willard G. (1995) for the development and comments on the theoretical
framework of entrepreneurship and Glancey K. S. and Mcquaid R. W. (2000) for entrepreneurial economics.
2 Yang and Ng (1993) refer to Marshall’s neoclassical economics as “economics of resource allocation”. 3 The main objective of both Coase's paper "The Nature of the Firm" and Cheung's paper "The Contractual
Nature of the Firm" is to explain the reason of why the institution of the firm exists. 4 If 1>a , intuitively, the owner will hire all the individuals in the economy. This is not realistic. 5 We do not explicitly model the source of the transaction costs. Here, iceberg type transaction costs are
assumed. Yang and Ng (1995) point out that the exogeneity of transaction costs allow us to capture in a simple way the main ideas which seem to have emerged from the transaction cost literature, namely that transaction costs exist and that they may differ across goods and factors and across institutional structures for production and exchange. The transaction cost includes four types of costs: the brokerage cost of finding a correct price; the cost of defining the obligations of parties in a contract; the risk of scheduling and related input costs; and the taxes paid on exchange transaction in a market (Rugman, 1980). Transaction efficiency depends on transaction technology, institution arrangements, urbanization of a country and etc.
6 A criticism by Auerbach (1988) focuses on the disjointed way in which Coase and his followers see firms and markets, in particular the presupposition of the existence of markets and failure to see the role of firms in the making of markets. Therefore, it is necessary to begin with the studies of market structures from autarky.

1981
Usage of Time of an Entrepreneur
Mikki Valjakka, [email protected] Lahti University Consortium
Lappeenranta University of Technology, Finland Abstract Does the actual usage of time of an entrepreneur coincide with the wishes (theoretical) usage of time? What is the length of a workday? The workday was divided into eight elements and 44 statements: Planning and managing company operations (4 statements); Development of customer- and market-oriented functions (5): Development of human resources (5): Development of financial administration (9); Personal Development (6); Performing different roles (4), Operating with people (6) and Operating in different places and/or with equipment (5). Is there any difference based on age, gender, education or parenthood? How much time is spent doing house work, taking care of children, studying, and sleeping? The 656 owner-entrepreneurs examined are dissatisfied with their usage of time – most of their time was spent by “Performing different roles” instead of “Plannin g and managing company operations”. The results show significant differences based on gender and education. The respondents work 11 hours a day and want more time for housework and leisure. Introduction Values, skills and usage of time are important factors of wellbeing of entrepreneurs. Values demand prioritization of one’s actions, which show in usage of time. It is important for the quality of life of entrepreneurs to feel to be in control of their lives. It means that they have sufficient time for the important tasks and a balance between what they want or aim to do and what they actually do. The right usage of time gives the feeling of being in control, satisfaction, motivation and willingness to develop. If entrepreneurs can manage their work time properly and in a way they appreciate, the company will progress and entrepreneurs will also inspire people around them, as well as leading to improved self-confidence and better mental capacity. Societal success depends on the success of its companies; therefore it is important to study entrepreneurial usage of time. This increases the awareness of the needs and wishes of entrepreneurs and their readiness to be leaders. Balancing usage of time increases the chances of leading a healthy life mentally and physically and the ability to work well. Therefore, it makes sense to research entrepreneurial usage of time. Numerous studies have examined entrepreneurial work content, but fewer have studied actual and theoretical entrepreneurial usage of time. This study aims to chart and analyze the judgments of entrepreneurs regarding their own usage of time – the present and future states.
This paper aims to shed more light on the profile of a Finnish SM entrepreneur and increase the amount of research. The perspective is individual centered, more precisely entrepreneur centered. Objects and Questions There is no consensus concerning the minimum tasks entrepreneurs must do and where to spend time. Even general items concerning many entrepreneurs are difficult to define because of the different demands depending on the branches of activity and environment. In addition, phase of a life cycle and a size of a company (the resources available) place different demands on tasks. This study focuses on Finnish owner-entrepreneurs, so the survey charted the entrepreneurial tasks based on the “Demands for the vocational qualification of an entrepreneur” (Allardt - Asp - Heikkonen - Rautkallio - Vuorinen 1984, 7) Allardt et al state that managing as an entrepreneur one must master certain thematic entities like
1982
planning and managing operations, company and society, entrepreneurship and development as an entrepreneur and financial administration and marketing. To carry out the study the entrepreneurial thematic entities to manage time have only focused on the eight elements listed below. The contents of the elements (single statements) are shown in Appendix 1. The examined elements are (44 statements included, see Appendix 1): 1. Planning and managing operations (4) 2. Development of customer- and market-oriented functions (5) 3. Development of human resources (5) 4. Development of financial administration (9) 5. Personal development (6) 6. Usage of time in different roles (interpersonal -, disseminator-, decision-making - and technical roles – 4) 7. Usage of time with different people (other owners of the company, employees, fellow entrepreneurs, customers, people belonging to interest groups, private individuals – 6) 8. Usage of time in different places and with equipment (5) Both present and future states were examined. Additionally dividing the 24 hours between working, doing housework, taking care of children, studying, and sleeping were studied. This paper aims to answer the following questions:
1. How is the workday of an entrepreneur divided between different elements and how one wants it to be divided? - Differences are based on age, gender, education or parenthood?
2. How are the 24 hours divided and how one wants them to be divided? - Length of workday?
Methodology The study follows the quantitative and descriptive tradition. The data was gathered using a questionnaire sent by e-mail to 3, 253 e-mail addresses. These e-mail addresses of owner-entrepreneurs were provided by two Finnish Company Organizations in two provinces in Finland. 660 owner-entrepreneurs returned the questionnaire of which 656 were accepted, the response rate being 20.2 %. So the sample consists of 656 observations including 163 female and 493 male owner-entrepreneurs. (Entrepreneur Profile See Appendix 2)
The usage of time was examined and analyzed by calculating the means. Explorative Factor analysis was used to test and confirm the statements, and the Mann-Whitney-U test was used for the comparisons. The usage of time (the actual and theoretical) were rated using a four-step scale. Present state: I spend time… very little = 1; …some = 2; … quite much = 3; …very much = 4. Theoretical: My usage of time is OK = 0. I wish I could spend a little more time = +1; … moderately more time = +2; …much more time = +3. There was also a box for comments. About the Usage of Time The contents of the work and tasks of managers and their usage of time have been studied since the1950s. The study published by Fayol (1925) “Administration industrielle et generale” and the study published in the 1930s by Gulick (1937) “Science, values and public administration” and perhaps also some of the studies in 1940s resolution /conclusion school could possibly be considered as studies of usage of time. Herbert Simon (1947) found decision-making to be the most critical managerial function. Moreover, Carlson published his first study of usage of time in 1945. Next are some significant “old” studies from the last millennium, studies of managerial work and usage of time. As a link to the studies of the 1950’s, Carlson’s study “Executive Behavior” (1951, reprint 1991) must be mentioned, where the diary method was used for the first time .The study describes the first systematic study ever made of top managers at work. According to Tengblad (2003) it is regarded as a classic. Other studies from the 1950s are Gibb, C. (1954) “Leadership” and Guest, R. (1956) “Of Time and Foreman”. From the 1960’s significant

1983
researchers include Neustadt (1960), Sloan 1963, Sayles 1964, and Stewart’s large study from 1967 and Carlson’s follow-up study from 1969. From one of the significant studies from 1970’s the most famous is ”The Nature of Managerial Work” by Henry Mintzberg written in 1973. His study “The manager’s job: folklore and fact” in 1975 is also notable. From the 1980’s important studies include Mintzberg (1980), Kotter (1982), Hales (1986), Stewart (1988), and Moss Kanter (1989). From the 1990’s they include Mintzberg (1991) ”Managerial Work: Forty years later”, Stewart (1991) ”Managing Today and Tomorrow”, and Panko (1992) ”Managerial Communication Patterns”. Also Therese Macan’s study focused on usage of time, Routamaa & Hakuli & Ryhänen (1992) examined the tasks of managers. Other studies on usage of time and work include Adam (1995), Stewart (1996), and Kotter, John P. “What Effective General Managers Really Do” (1999, first published 1982). The comparison of studies is not easy while in some studies the (1) Top Managers (CEO), that is the executive managers of multinational companies , (2) Middle Manager, (3) Lower Managers, (4) Division Managers, and (5) Professionals have been differentiated and not in some studies. Additionally, as mentioned earlier, the phase of the life cycle and the size of a company (the resources available) place different demands on tasks, as well as the branch of activity and environment. How people organize time can be examined in several ways. Firstly, one can ask people about their usage of time, life, interpretations of the past and visions of the future. Secondly, one can study facts made by people and thirdly, one can observe people and their behavior. The data of studies of managerial usage of time usually comprise questionnaires, interviews, notes from usage of time diaries, and observations. Comparison of Seven International Studies of Managerial Usage of Time There follows a description of managerial usage of time and tasks based on seven significant studies: 1. and 2. Tengblad, Stefan (2002) ”Time and space in managerial work” and Carlson, Sune (1951) “Executive Behavior”; 3. & 4. Mintzberg, Henry (1973 and 1980) “The Nature of Managerial Work” and Mintzberg, Henry (1975) “The manager’s job: folklore and fact”; 5. Farmer, P.L. (1978) “Managerial Work and the Growth and Development of the Firm” 6. Kotter, John P. (1982 and 1999) “What Effective General Managers Really Do”; 7. Stewart, Rosemary (1988) ”Managers and their jobs”. (1and 2) Stefan Tengblad (2002) carried out his study of usage of time in 1998 – 1999 using the scope and methods of the investigation similar to those in “Executive Behavior” (1951) by Sune Carlson and tried to identify similarities and differences, quantitative as well as qualitative, between the Carlson study and his own. Tengblad’s participants were eight Swedish large-scale company managers and Carlson had nine. The workdays examined by Tengblad were 19.9 days, 246 work hours and 218 functions. Two of Tengblad’s participants represented metal engineering (three of Carlson’s), one forest industry, one utilities, one retailing, two banking and insurance, and one media production (this industry did not exist in 1951 so was not in Carlson’s study). The most striking difference between the two studies concerning the workplace is the big increase in time spent on traveling. The results also indicate that the work time increased from Carlson’s 11 hours 42 minutes to Tengblad’s 12 hours 22 minutes, working alone in own office decreased and was 3 hour 49 minutes by the time of Tengblad’s study (Table 1).
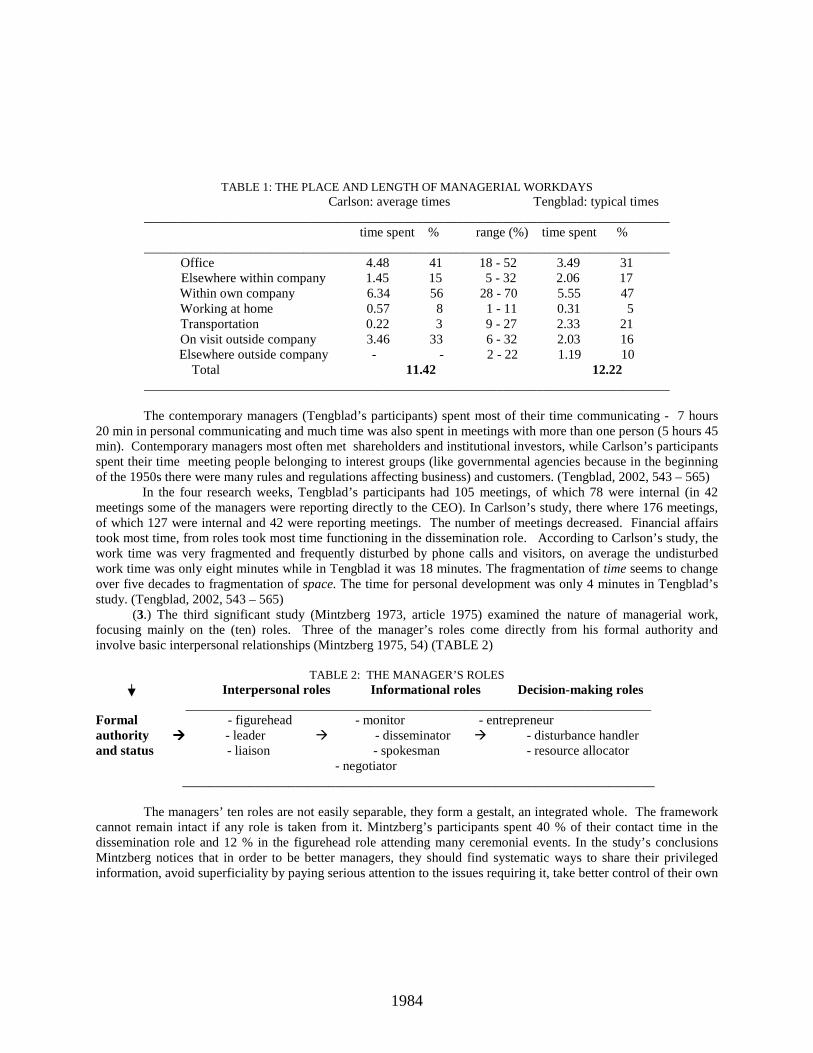
1984
TABLE 1: THE PLACE AND LENGTH OF MANAGERIAL WORKDAYS Carlson: average times Tengblad: typical times
_______________________________________________________________________________ time spent % range (%) time spent %
_______________________________________________________________________________ Office 4.48 41 18 - 52 3.49 31 Elsewhere within company 1.45 15 5 - 32 2.06 17 Within own company 6.34 56 28 - 70 5.55 47 Working at home 0.57 8 1 - 11 0.31 5 Transportation 0.22 3 9 - 27 2.33 21 On visit outside company 3.46 33 6 - 32 2.03 16 Elsewhere outside company - - 2 - 22 1.19 10
Total 11.42 12.22 _______________________________________________________________________________
The contemporary managers (Tengblad’s participants) spent most of their time communicating - 7 hours 20 min in personal communicating and much time was also spent in meetings with more than one person (5 hours 45 min). Contemporary managers most often met shareholders and institutional investors, while Carlson’s participants spent their time meeting people belonging to interest groups (like governmental agencies because in the beginning of the 1950s there were many rules and regulations affecting business) and customers. (Tengblad, 2002, 543 – 565) In the four research weeks, Tengblad’s participants had 105 meetings, of which 78 were internal (in 42 meetings some of the managers were reporting directly to the CEO). In Carlson’s study, there where 176 meetings, of which 127 were internal and 42 were reporting meetings. The number of meetings decreased. Financial affairs took most time, from roles took most time functioning in the dissemination role. According to Carlson’s study, the work time was very fragmented and frequently disturbed by phone calls and visitors, on average the undisturbed work time was only eight minutes while in Tengblad it was 18 minutes. The fragmentation of time seems to change over five decades to fragmentation of space. The time for personal development was only 4 minutes in Tengblad’s study. (Tengblad, 2002, 543 – 565) (3.) The third significant study (Mintzberg 1973, article 1975) examined the nature of managerial work, focusing mainly on the (ten) roles. Three of the manager’s roles come directly from his formal authority and involve basic interpersonal relationships (Mintzberg 1975, 54) (TABLE 2)
TABLE 2: THE MANAGER’S ROLES Interpersonal roles Informational roles Decision-making roles ______________________________________________________________________ Formal - figurehead - monitor - entrepreneur authority ���� - leader � - disseminator � - disturbance handler and status - liaison - spokesman - resource allocator - negotiator
_______________________________________________________________________ The managers’ ten roles are not easily separable, they form a gestalt, an integrated whole. The framework cannot remain intact if any role is taken from it. Mintzberg’s participants spent 40 % of their contact time in the dissemination role and 12 % in the figurehead role attending many ceremonial events. In the study’s conclusions Mintzberg notices that in order to be better managers, they should find systematic ways to share their privileged information, avoid superficiality by paying serious attention to the issues requiring it, take better control of their own

1985
time by delegating and participate in managerial training. (Mintzberg 1975, 60 – 61) Mintzberg’s study has been severely criticized (Carroll & Gillen 1987, 39 – 40) and to some extent it has been considered controversial. (4.) Mintzberg also conducted 1980 a study of the content of managerial work and (condensed) found six characteristic features: - Great amount of work and unrelenting pace (constant flow of visitors) - Great number of tasks characterized by brevity, variety, and discontinuity - Favoring action (dislike reflective activities) - Favoring verbal communication - Acting between their organization and contact networks (48 % of contact time with subordinates, 44 % with external contacts, and 7 % with superiors) - Overburdened with obligations (often the rights and obligations are mixed): often the manager can not decide about his own usage of time (Mintzberg, 1980, 109 – 111) (5.) Farmer (1978) aimed to ascertain how the size of the company influenced managerial usage of time. He categorized managers as owner-operators, typical entrepreneurs, etc. and found that the smaller the company the more the activities of an entrepreneur concentrate on production and selling. When the company grows the entrepreneur’s visits to the factory decrease but the time spent getting information increases. Managers of smaller companies concentrate less on formal and more for production activities and are in contact with a number of activities and their activities were more short-term than those of the managers of bigger companies. Managers of smaller companies also participated less in official meetings and their external network was significantly more constricted (Farmer, 1978, 5-10). (6.) Kotter (1999, first published 1982) found the following characteristics of the workday of 15 successful general managers in nine companies: - They spend most of their time with others, with many people in addition to their direct subordinates and their bosses, in short, disjointed conversations - The breadth of topics in their discussions is extremely wide and during conversations, managers rarely seem to make ”big” decisions and rarely give orders in a traditional sense - They ask many questions during conversations and attempt to influence others - Their discussions usually contain a fair amount of joking and often concern topics unrelated to work, and the issue discussed is relatively unimportant to the business or organization - They often react to others’ initiatives; much of the typical manager’s day is unplanned - Managers work long hours Successful managers had developed agendas made up of loosely connected goals and plans and also developed a network of cooperative relationships. Kotter points out the importance of conversations that look like a waste of time while he found that such conversations prevent burn out and promote long-term competitive advantage. (Kotter, 1999, 145- 159) (7.) According to Stewart (1988) work hours varied from 35 to 60 hours per week. The managers spent 43 % on unstructured conversations, 36 % on paperwork, 7 % on committees, 6 % on control, 6 % on telephone calls, and 4 % on other social activities. The internal contacts (foremen, subordinates, colleagues) took much more time than external contacts (customers, suppliers, others). Workdays were fragmented and full of interruptions. Long hours burn off, usage of time was at the mercy of other people, and decisions were often superficial. To sum up the work of entrepreneurs is quite fragmented, with the time taken to concentrate on a single task being often only a matter of minutes. According to many other studies (Fisher, 1992; Hochschilds, 1997; Jacobs & Gerson, 1998; Maume & Bellas, 2001; Kvassov, 2002; Tetard, 2002; Brett & Stroh 2003) managers and entrepreneurs (Federation of Finnish Companies, 2005) work about 50- 60 hours per week, which is 10 – 12 hours per workday. The workload is very demanding and the pace is unrelenting, much time is spent on face-to-face communication, discussion topics are in a wider context and often not work-related and the managers ask many questions. A manager functions in different roles (in interpersonal-, disseminator-, and decision-making roles). Managers spent much time in their own office and work unit. Travel and transportation and meetings take up much time.

1986
One Finnish Study Comparing the Usage of Time of an Entrepreneur to Other Professions Next a Finnish survey of usage of time of all professions (male and female), and especially examining the usage of time of entrepreneurs (male and female). (Niemi & Pääkkönen 2001) According to the survey, male farmers have the longest work hours of all professions, and the shortest is female higher employee. Entrepreneurs work 228 hours per year more than other professions, that is, more than 28 eight-hour workdays per year (Table 3, Niemi & Pääkkönen 2001, p. 21).
TABLE 3: ANNUAL WORK HOURS OF DIFFERENT PROFESSIONS
______________________________________________________________ Annual work hours 1999 – 2000 (hours/year) ________________________________________________________________________________ Men Profession Women mean 2.409 farmer 1.722 1.965 higher employee 1.442 1.849 lower employee 1.563 1.904 worker 1.478 2.032 mean of other professions 1.551 1.792 2.287 entrepreneurs 1.752 2.020 ________________________________________________________________________________ The data for Table 4 has been taken from the study ”Usage of time of working men 1999 – 2000” and from ”Usage of time of working women 1999 – 2000” (Niemi & Pääkkönen 2001, pp. 67 and 69). Figures include all seven days of the week.
TABLE 4: USAGE OF TIME OF DIFFERENT PROFESSIONS USAGE OF TIME 1999 – 2000 Men (women)
Farmer Higher employee Lower employee Worker Entrepreneur *Working 6.43 (4.48) 5.54 (4.23) 5.32 (4.45) 5.43 (4.26) 6.38 (5.10) Housework 2.03 (5.08) 2.26 (3.40) 2.19 (3.38) 2.25 (3.47) 1.58 (3.17) Personal needs 9.55 (9.44) 10.04 (10.23) 10.22 (10.27) 10.07 (10.29) 10.15 (10.34) Studying 0.03 (0.00) 0.07 (0.08) 0.07 (0.05) 0.03 (0.04) 0.10 (0.09) Leisure 5.02 (4.11) 5.22 (5.22) 5.34 (5.00) 5.33 (5.06) 4.49 (4.43) Miscellaneous 0.14 (0.09) 0.07 (0.04) 0.06 (0.05) 0.09 (0.08) 0.09 (0.07) Total 24 24 24 24 24
*Working includes commuting; Housework includes household work, maintenance, taking care of children, shopping, and transactions; Personal needs include sleeping (mean of gender 8 h 20 min), eating, get washed and dressed; Studying includes transportation
Working: male farmers work the longest (47 h 1 min during the week/seven days) and second longest male entrepreneurs (46 h 26 min/seven days). Female higher employees work the shortest hours (30 h 41 min/seven days) as mentioned earlier. The biggest difference between genders is found among farmers: males work 1 h 55 min longer than females. (See Housework) The difference between entrepreneurs by gender is 1 h 28 min in favor of men. Housework: Female farmers work the longest hours (35 h 56/seven days). Male entrepreneurs spend the least time on housework (14 h 21 min/seven days). The difference between genders is approximately the same in all professions being about 1 h 20 min in favor of women. Female entrepreneurs spend the least time on housework of women in all professions. Taking care of children took 10 min from male and 11 min from female entrepreneurs.

1987
Personal needs: Female entrepreneurs spend the longest time on personal needs 10 h 34 min (� they spent 8 h 33 min sleeping), female farmers spent the least time (9 h 44 min). Biggest difference between genders is by worker. Male entrepreneur slept 8 h 7 min and female 8 h 33 min which was the most of all professions. Studying: Hardly any time was spent studying among all professions. Male entrepreneur spent 1 h 10 min/seven days studying and female farmers spent none. Leisure: Male lower profile employees have the most leisure time (38 h 58 min/seven days) and female farmers the least (29 h 17 min) and female entrepreneur (33 h 1 min) the second least. The biggest difference between genders is by lower employees (3 h 58 min/seven days). The difference by entrepreneurs is 6 minutes in favor of men. (TABLE 4) Consultants have developed many systems for time management. Their aim is to spend time more effectively. They often include recommendations to make lists of priorities, restrict the number of contacts, etc. According to Kotter (1982) successful managers did not follow these instructions (see earlier). It has been said that the people, who work independently and who have power, seem to have the biggest problems mastering usage of time. A tremendous amount of self-discipline is needed to effectively spend time because people easily forget plans and begin to do something nice. Study Findings-Present and Future States The median respondent is male, aged 43, married with 2–3 children, ‘O’-level to college-level education and has worked for 12 years as an entrepreneur. The entrepreneur profile is in Appendix 1. The usage of time was charted according to “ Demands for the vocational qualification of an entrepreneur” and it was presumed that entrepreneurs spend their time Planning and management operations (4 statements), Development of customer- and market-oriented functions (5 statements), Development of human resources (5 statements), and Development of financial administration (9 statements). The time spent on personal development (6), in different roles (4), with different people (6), and in different places/ equipment (5) was also charted. The respondents were asked to judge their usage of time (present state) using four grades: I spend my work time 1= almost not at all; 2 = some; 3 = moderately much, and 4 = very much. The future state: my usage of time is OK = 0; I would like to spend a little more time =+1; moderately more =+2; much more = +3. The scale of the future state has been transferred to the same as present state, that is
future state: I would like to spend time present state: I spend my work time much more = + 3 � 1 = almost not at all moderately more = + 2 � 2 = some a little more = + 1 � 3 = quite much my usage of time is OK = 0 � 4 = very much
Tables 5 – 12 in Appendix 3 (pp. 15 - 17) show the means and standard deviation (SD) of the present and future states of all eight elements examined. Planning and managing operations element Present state. Differences between statements among the Planning and management operations element are very small. Time was spent on all statements quite much. Some time was spent only on Forecasting functions, mapping out risks. Table 5 shows the order of four statements. Future state. The answers show that most of the extra time the respondents wanted was for ‘Forecasting functions, mapping out risks’ in Planning and management operations element corresponding to the Present state. (Table 5, page 15) Development of Customer and Market-oriented Functions Present state. The most time was spent on the Development of customer- and market-oriented functions element in the statement ‘Interactive, productive salesmanship and customer service’ and the second most on ‘Customer satisfaction’ function. The least time was spent on ‘Interpreting market research and competitor analyses’. Future state. The least extra time in the Development of customer- and market-oriented functions element was for ‘Interpreting market research and competitor analyses’ so it was considered unimportant or felt to be in order.

1988
Respondents wanted to spend most extra time on ‘Customer satisfaction’. In ‘Free word’ they emphasized the meaning of old networks, even those from college days. Some criticized the whole idea of segmenting customers by their profitability. (Table 6, page 16) Development of Human Resources Present state. The most time was spent on Development of human resources elements’ statement ‘Attending to the wellbeing of the personnel’ and second most on ‘Enhancement of team spirit’. The least time was spent on ‘Using human resources development discussions in personnel management’ and the second least on ‘Eliminating resistance to change’. Future state. Most of the desired possible extra time was for ‘Attending to the wellbeing of the personnel’ and ‘Enhancement of team spirit’ so the ample time already spent on those was considered insufficient. The least extra time was for ‘Eliminating resistance to change’. Probably the resistance to change was not a problem for respondents. The differences between the present and future state are big. In ‘Free word’, the relationship between work and rest and good taking care of oneself was considered very important and a prerequisite for taking care of other people. Resistance to change was eliminated by careful listening and reasoning. (Table 7, page 16) Development of Financial Administration Present state. Most time was spent on Development of financial administration element in statement ‘Working with profitability, liquidity, financial stability, and productivity matters in company operations’. The least time was spent on ‘Working with regulations, company forms, company reorganization, and contract regulations’ and second least on ‘Defining indicators for surveying the business’. Future state. Respondents wanted to use most extra time on ‘Planning, controlling, and directing the company economy’. The present showed that most of the time was already spent on this so it was considered very important. The least extra time was wanted for ‘Using the services of accountants, accounting companies, or such when planning, controlling, and directing the company economy’. In “Free word” ’Using ,the services of accountants, accounting companies, or such when planning, controlling, and directing the company economy’ was considered important, if one cannot do something or have no time it is better to buy the service. It was also stated that it is easy to analyze but not easy to fulfill or react to analyses. (Table 8, page 16) Personal development Present state. In Personal development most of the time was spent on ‘Maintenance of family-/friendship relationships’ and the second most on ‘Studying the skills needed in work’ (like public appearance, communication skills, information technology skills, foreign languages, knowledge of one’s own field, analyzing skills). The least time was spent on ‘Taking care of affairs connected to confidential post (outside work life)’ Future state. The respondents wanted most extra time for ‘Maintenance of family-/friendship relationships’ and secondly to ‘Physical hobbies’. Least extra time was wanted for ‘Taking care of affairs connecting to confidential post (outside work life)’. (Table 9, pages 17) Usage of time in different roles Present state. Most of the time spent on in different roles went on actually completing the production/services, that is functioning in ‘Technical role’. Most respondents were small entrepreneurs so the input of the owner is essential. The least time was spent on ‘Dissemination role’. Future state. Most extra time was wanted for ‘Dissemination role’ and least for ‘Technical role’. (Table 10, page 17) Usage of time with different people Present state. Most time in the Usage of time with different people element was spent on ’Customers’ and second most of ’Employees’. The least time was spent on ‘the other owners of company (which perhaps do not even exist) and second least on ’Fellow entrepreneurs’. Future state. Most of the extra time wanted was for ‘Customers’ and surprisingly the second was for ‘Private individuals’. The least extra time was spent on ‘Other owners of the company and the second least on ‘Employees’. (Table 11, page 17)

1989
Usage of time in different places/equipment Present state. When charting the Usage of time in different places/equipment, most of the work time occurs in ‘Own office’ and the second most ‘On the telephone’. The least is for ‘Lunch hour’ and the second least ‘Transportation’. Future state. The respondents wanted most extra time firstly for ‘Own office’ and secondly for ‘Handling emails’. The least extra time was wanted for ‘Lunch’ (Table 12, page 17). Table 13 deals with the data of the means of present and future states, the numeral differences between them, the mean of the means, orders of present and future states of the eight elements for spending time. (TABLE 13)
TABLE 13: ORDER OF FUTURE STATES AND MEANS VS. ORDER OF PRESENT STATES AND MEANS
____________________________________________________________________________ n = 656 ________________________________________________________________________________________________________________________
Order Future state Present state Order Difference Planning and managing operations 1. 2.96 2.48 2. 0.48 Customer- and market-oriented fu 2. 3.00 2.33 3. 0.67 Personal development 3. 3.03 2.13 7. 0.90 Financial administration 4. 3.15 2.21 5. 0.94 Human resources 5. 3.23 2.09 8. 1.14 Different roles 6. 3.34 2.52 1. 0.82 Different people 7. 3.39 2.26 4. 1.13 Different places/equipment 8. 3.69 2.19 6. 1.50 Mean of means 3.22 2.28 0.94 __________________________________________________________________________________________ According to respondents most of their time should be spent on Planning and managing operations but they actually spent second most time on it, – so the actual usage of time and wishes are almost balanced (difference of one place). The same situation is in the Customer and market-oriented function and Financial administration elements, which also have a difference of one place. The third important function on which time was spent (future state) was the Personal development element. According to actual usage it was only in seventh place, a difference of four places. The usage of time does not correspond to the wishes in the Personal development element. The fifth important function how to spend time (future state) was the Human resources element. According to actual usage it was in eighth place, a difference of three places. The usage of time does not correspond to the wishes in Human resources element either. The biggest difference in orders is, however, in the Different roles element, five places (future state sixth place, present state first place). The respondents spend a great deal more time than they would wish on the Different roles element. The situation is the same in the Different people element, a difference of three places and Different places/equipment element, a difference of two places. In both elements the respondents spent more time than they would like. (TABLE 13) To sum up, in (present state) most of time was spent on ‘Customers’ (Different people element), ‘In office’ (Different places –element) and in ’Interactive, productive salesmanship and customer service’ (Customer- and market-oriented functions element). In future state, respondents would like to use most of their time on ‘Maintenance of family-/friendship relations, the second most ‘Physical hobbies’ and third most on ‘Taking care of affairs connecting to confidential post (in work life)’ all three belonging to the Personal development element.

1990
The Inner Comparison of Data: Influence of Age, Gender, Education and Parenthood Is the usage of time different (present and future states) based on different groups? It will be analyzed comparing the data with Mann-Whitney-U-test. The focus is on the influence of age, gender, education and parenthood on eight elements of usage of time. Only the statistically significant differences p<0.05 will be mentioned. The Inner Comparison of Data (Age, Gender, Education and Parenthood) - Present state: Age The respondents were categorized based on age into four groups: Group 1. = 53 years old or older (n=53); group 2. = 43 – 52 years (n=237); group 3. = 33 – 42 years (n=246), and group 4. = 32 years or younger (n= 120). The comparison is between the oldest (53) and youngest (120) respondents. The only significant difference (p=.007) was ‘Mental hobbies’ (Personal development) in favor of the oldest respondents. Gender Female 163 and male 493 n= 656. A significant difference was found in 14 out of 44 statements; 11 statements in favor of women and 3 in favor of men. (Table 14)
TABLE 14: DIFFERENCES IN USAGE OF TIME: INFLUENCE OF GENDER. Usage of time no signif. statistically significant difference p<0.05
Planning and managing company operation X Development of customer- and market-oriented functions
Interactive, productive salesmanship… (f+) * Customer satisfaction (f+)
Development of human resources X Development of financial administration Pension, accident and unemployment ins… (f+) Personal development Studying the skills needed in work (f+)
Mental hobbies (f+) Maintenance of family-/friendship relation.. (f+)
Different roles Dissemination role (f+) Technical role (f+)
Different people Employees (f+) Customers (m+)
Different places/equipment Office (f+); Dealing with email (f+); Lunch (m+); Transportation (m+)
* f+ in favor of women, m+ in favor of men Only the Planning and managing operations and Human resources elements had no significant differences influenced by gender Table 14. Education Does education influence the actual usage of time? The respondents were categorized into four groups: group 1. = no degree or vocational; group 2= college-level training or O-level; group 3.= lower academic, and group 4.= higher academic degree. 94 respondents were in group 1, 294 in group 2, group 100 in group 3, and 61 in group 4, with 107 unaccounted for. In a comparison of groups 2 and 4, the only significant difference (p=.016) was in favor of group 4 ‘Other owners of the company’ (Different people element). Parenthood Does parenthood influence the actual usage of time? 79 of the 605 respondents had no children and 526 had one or more children. No statistically significant differences were found. The Inner Comparison of Data (Age, Gender, Education and Parenthood) -Future State: Age Comparison is between oldest (53) and youngest (120) respondents. No statistically significant differences. Gender Comparison between 163 female and 493 male respondents showed significant differences in favor of women were found in 10 statements, none in favor of men. Women would like to have extra time significantly more than men in three statements belonging to Human resources. Women are more people-oriented so this result was predictable like
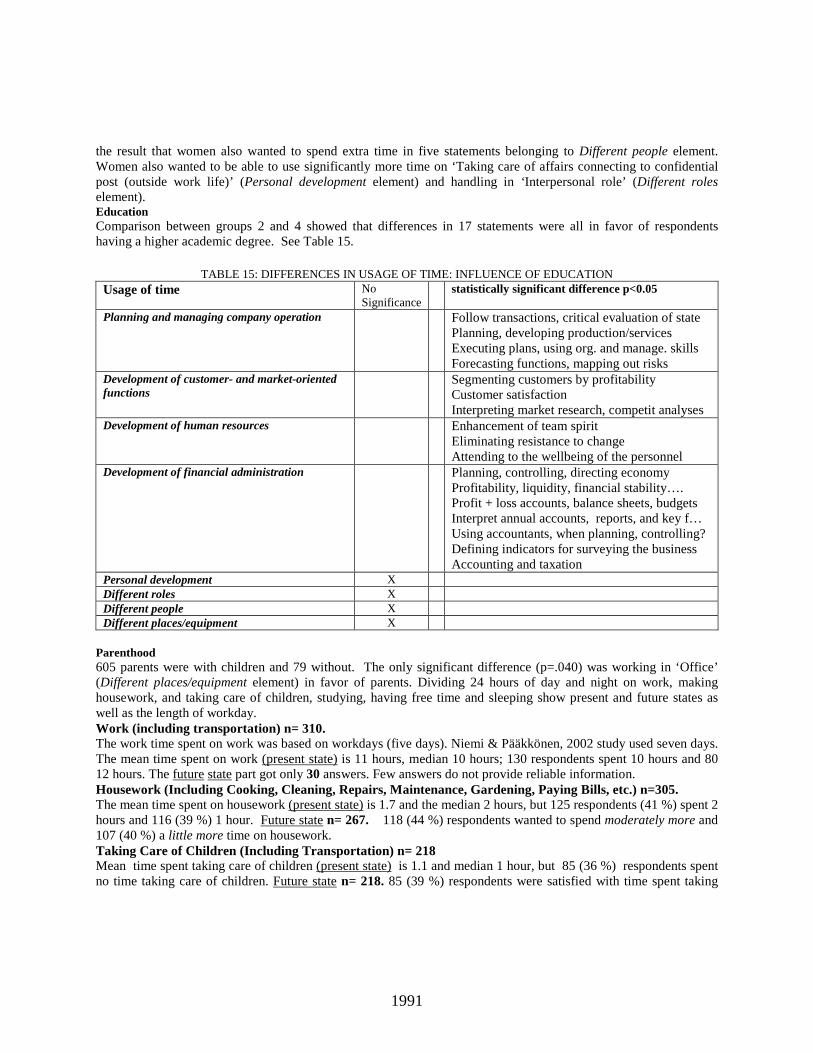
1991
the result that women also wanted to spend extra time in five statements belonging to Different people element. Women also wanted to be able to use significantly more time on ‘Taking care of affairs connecting to confidential post (outside work life)’ (Personal development element) and handling in ‘ Interpersonal role’ (Different roles element). Education Comparison between groups 2 and 4 showed that differences in 17 statements were all in favor of respondents having a higher academic degree. See Table 15.
TABLE 15: DIFFERENCES IN USAGE OF TIME: INFLUENCE OF EDUCATION
Usage of time No Significance
statistically significant difference p<0.05
Planning and managing company operation Follow transactions, critical evaluation of state Planning, developing production/services Executing plans, using org. and manage. skills Forecasting functions, mapping out risks
Development of customer- and market-oriented functions
Segmenting customers by profitability Customer satisfaction Interpreting market research, competit analyses
Development of human resources Enhancement of team spirit Eliminating resistance to change Attending to the wellbeing of the personnel
Development of financial administration Planning, controlling, directing economy Profitability, liquidity, financial stability…. Profit + loss accounts, balance sheets, budgets Interpret annual accounts, reports, and key f… Using accountants, when planning, controlling? Defining indicators for surveying the business Accounting and taxation
Personal development X Different roles X Different people X Different places/equipment X
Parenthood 605 parents were with children and 79 without. The only significant difference (p=.040) was working in ‘Office’ (Different places/equipment element) in favor of parents. Dividing 24 hours of day and night on work, making housework, and taking care of children, studying, having free time and sleeping show present and future states as well as the length of workday. Work (including transportation) n= 310. The work time spent on work was based on workdays (five days). Niemi & Pääkkönen, 2002 study used seven days. The mean time spent on work (present state) is 11 hours, median 10 hours; 130 respondents spent 10 hours and 80 12 hours. The future state part got only 30 answers. Few answers do not provide reliable information. Housework (Including Cooking, Cleaning, Repairs, Maintenance, Gardening, Paying Bills, etc.) n=305. The mean time spent on housework (present state) is 1.7 and the median 2 hours, but 125 respondents (41 %) spent 2 hours and 116 (39 %) 1 hour. Future state n= 267. 118 (44 %) respondents wanted to spend moderately more and 107 (40 %) a little more time on housework. Taking Care of Children (Including Transportation) n= 218 Mean time spent taking care of children (present state) is 1.1 and median 1 hour, but 85 (36 %) respondents spent no time taking care of children. Future state n= 218. 85 (39 %) respondents were satisfied with time spent taking

1992
care of children, 70 (32 %) wished to be able to use a little more, 47 (22 %) moderately more and 16 (7 %) much more time for taking care of children. Studying (Including Transportation) n = 217 The mean and median time spent studying is 1 hour. 69 (32%) respondents spent no time, 102 (47 %) 1 hour, 35 (21 %) two hours, 5 (2 %) three hours and 2 even six hours a day. Future state n= 197. 89 (45 %) respondents wished to spend a little more, 69 (35 %) were satisfied, 34 (17 %) wished to spend moderately more and 5 (3 %) much more time studying. Leisure, n=300 Both mean and median for leisure was 3 hours. 76 (25 %) respondents had two hours, 68 (23 %) three, 46 (15 %) four, 45 (15 %) one, 31 (10 %) had five, 12 (4 %) six and 12 (4 %) even seven hours leisure. Future state n= 186. 74 (40 %) wanted moderately more, 63 (34 %) much more and 43 (23 %) a little more free-time. 6 (3 %) of respondents were satisfied with their leisure. Sleeping, n= 307 Mean is 6.9 and median 7 hours for sleeping. 133 (43 %) reported sleeping eight hours, 84 (27 %) seven, 44 (15 %) six, 14 (5 %) nine and 10 (3 %) only one hour. 11 respondents reported not sleeping at all. Without those that did not sleep the mean would be 8.6 hours and median 8 hours. Future State n=20 So few answers did not provided reliable information. To sum up, the day and night of the median respondents is as follows: 10 hours for work, 2 housework, 1 taking care of children, 1 studying, 3 leisure and sleep 7 hours. According to the means the day and night are spent as follows:
Work (incl. transportation) 11.00 Housework (incl. cooking, cleaning, maintenance, gardening, paying bills) 1.42 Taking care of children (incl. transportation) 1.06 Studying (incl. transportation) 1.00 Leisure 3.00 Sleeping 6.52 Total 24.00
Present state. This part of the study attempts to give a picture of an actual workday of an entrepreneur. Converted to weekly work hours (according to means) work hours will be 55 hours (according to medians 50 hours). According to the earlier study of Niemi & Pääkkönen, 2001, entrepreneurs (mean of male and female) worked 5 h 54 min/seven days, converted to 5 days’ weekly hours it would be 41 h 18 min. So the entrepreneurs in this study have about a 2 hour 43 min longer workday (11 – 8.17 = 2.43) the respondents of this study spent 55 min less time for housework (2.37 – 1.42 = 55 min), 32 min less (1.38 – 1.06 = 32) for taking care of children and 3 min less (1.03 - 1 = 3 min) for studying, 1 hour 46 min (4.46 – 3 = 1.46) less for leisure, and 1 h 28 min less (8.20 – 6.52 = 1.28) for sleeping Future state. Only a few respondents expressed their wishes concerning the amount of work. Evidently they are content with the amount of time spent working. 118 (44 %) respondents wanted moderately more time for housework (n=267) and 107 (40 %) a little more time. 74 (40 %) (n= 186) respondents wanted moderately more for leisure, 63 (34 %) much more, and 43 (23 %) a little more leisure. Six entrepreneurs (3 %) were content with the amount of leisure. Conclusions This paper aimed at shedding more light on the profile of a Finnish SM entrepreneur and increasing the amount of research by emphasizing the themes and elements which become evident as usage of time. This paper aims at answering the following questions: - 1. How does the workday of an entrepreneur divide between different elements and how does one want it to divide? As a sub question: Are there any differences based on age, gender, education or parenthood?

1993
- 2. How are the 24 hours divided and how one wants them to be divided? As a sub question: What is a length of the workday? In answer to the first question it can be seen that according to their own opinions the respondents spend most of their time handling and functioning in different roles and of the roles the ‘technical role’ was emphasized. Entrepreneurs must spend plenty of time actually working (for instance in manufacturing or selling). This is because the responding companies are small in size. According to Mintzberg’s (1982) research results, the managers in the smaller companies spend their time more on manufacturing. The decision-making role was also emphasized. Particularly in small companies, the entrepreneur is often the only decision maker. The second biggest time consumer was the Planning and managing operations element, again due to the small size of the companies. In Tengblad, 2002 most of the time was spent on financial and administrative affairs and the dissemination role.) The least time in this study was spent on Human resources and the second least on functioning in the Personal development element. Evidently these two are elements where time can be most easily deducted without immediately disturbing the normal functions and operations of a company. Most of the time was spent equally on single statements: ‘With customers’, ‘Office’, ‘Selling/customer service’. SM entrepreneurs are closer to their customers than the managers of big companies. But the amount of time working in the office is about the same as in the other studies. Most extra time was wanted for the Planning and managing operations element. This understandably is very important for the company and also one that entrepreneur can not delegate. Time is very easily spent on routines, but for planning one must deliberately find time and allocate more than just a few minutes. The second most extra time was wanted for work in the Development of customer- and market-oriented function. In a small company the customer cannot be forgotten even for a moment. Entrepreneurs wanted to spend least time on Different places/equipment. The difference between the present and future states was greatest in this element. Eating and transportation take time, which was a worry. According to other studies these obligatory breaks are important and entrepreneurs ought to try to relax and enjoy these breaks worrying just uses up energy and creates negativity. The second least extra time respondents wished to have to spend was on Different people. According to public discussion managers and entrepreneurs must always have their door open to employees to come, but this study shows that entrepreneurs do not want to spend more time with their employees (future state: the eight last place). The ’Maintenance of family-/friendship relationships’, ’Physical hobbies’, and ’Taking care of affairs connecting to confidential post (work)’ all in the Personal development element were emphasized and at the top of the list for extra time. Additionally, ‘Mental hobbies’ work was emphasized. The most important value (Valjakka, 2005” Life values and company work”…) of these very same entrepreneurs was ’The family, its safety and taking care of family members’, so it is evident they would like to have more time to spend with the family. Also the ’Physical state’ of these respondents (Valjakka, 2006 “Is Modesty attractive?”) had the mean of 2.63 which meant hardly well (the lowest figures in its category). A good physical state also helps in mental pressures and, on the other hand, Finnish society places a high value on good physical condition. To answer to the question: ‘Are there any differences based on age, gender, education or parenthood concerning usage of time, in both the present and future state?’ it can be seen that the influence of age is insignificant , at least compared to that of gender and education. The only statistically significant difference (present state) was in ‘Mental hobbies’ where the oldest respondents spent more time (p=.007). Gender, on the other hand, had a lot of influence. In the present state women spent more time on three statements belonging to the Personal development element. These were ‘Studying the skills needed in work’, ‘Mental hobbies’, and ‘Maintenance of family-/friendship relationships’. Additionally more of women’s time was spent on two of the statements in Development of customer- and market-oriented functions: ‘Interactive, productive salesmanship and customer service’ and ‘Customer satisfaction’. Additionally women spent more time on four other statements. Male respondents spent more time than women on ‘Customers’, ‘Lunch’, and ‘Transportation’. See Table 14 on page 9. Gender. Future state. In the summary f 44 statements examined, women wanted extra time in ten statements, men in none. What does this say about women? Respond the usage of time of women worse their wishes than men’s? Are women slow and ineffective workers compared to men? Or do women have a higher standard concerning their performance? Or do women have lower self-esteem than men?
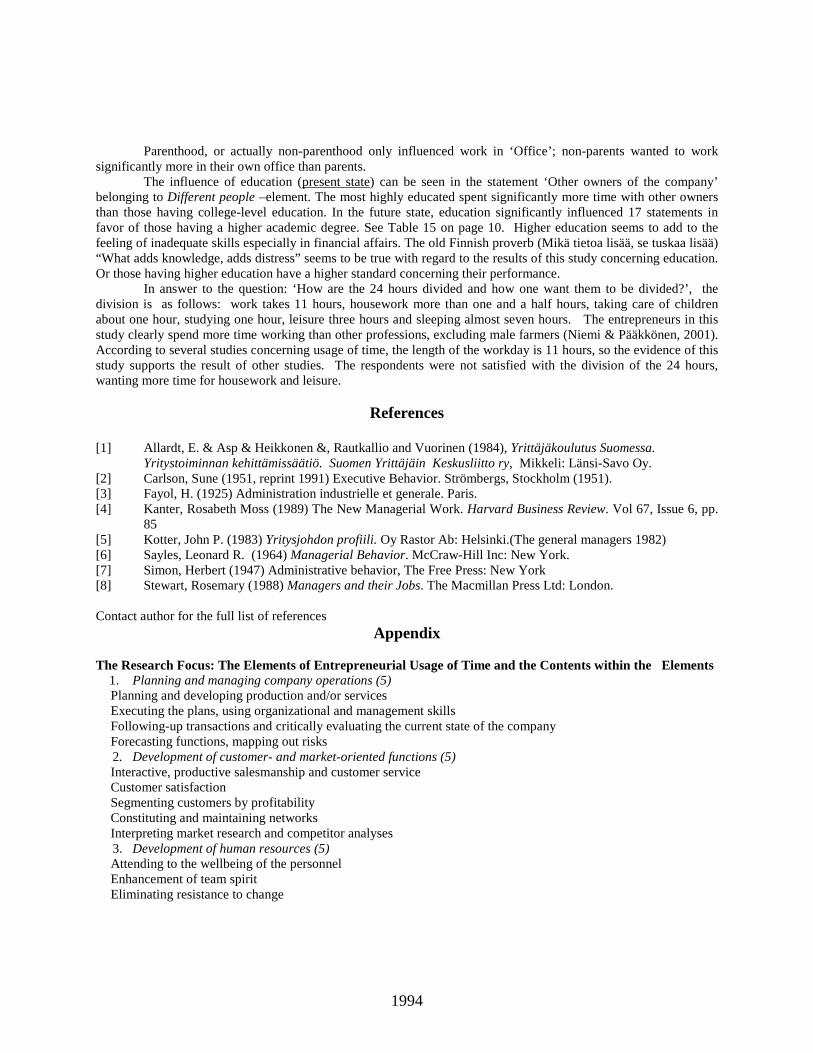
1994
Parenthood, or actually non-parenthood only influenced work in ‘Office’; non-parents wanted to work significantly more in their own office than parents.
The influence of education (present state) can be seen in the statement ‘Other owners of the company’ belonging to Different people –element. The most highly educated spent significantly more time with other owners than those having college-level education. In the future state, education significantly influenced 17 statements in favor of those having a higher academic degree. See Table 15 on page 10. Higher education seems to add to the feeling of inadequate skills especially in financial affairs. The old Finnish proverb (Mikä tietoa lisää, se tuskaa lisää) “What adds knowledge, adds distress” seems to be true with regard to the results of this study concerning education. Or those having higher education have a higher standard concerning their performance.
In answer to the question: ‘How are the 24 hours divided and how one want them to be divided?’, the division is as follows: work takes 11 hours, housework more than one and a half hours, taking care of children about one hour, studying one hour, leisure three hours and sleeping almost seven hours. The entrepreneurs in this study clearly spend more time working than other professions, excluding male farmers (Niemi & Pääkkönen, 2001). According to several studies concerning usage of time, the length of the workday is 11 hours, so the evidence of this study supports the result of other studies. The respondents were not satisfied with the division of the 24 hours, wanting more time for housework and leisure.
References
[1] Allardt, E. & Asp & Heikkonen &, Rautkallio and Vuorinen (1984), Yrittäjäkoulutus Suomessa. Yritystoiminnan kehittämissäätiö. Suomen Yrittäjäin Keskusliitto ry, Mikkeli: Länsi-Savo Oy. [2] Carlson, Sune (1951, reprint 1991) Executive Behavior. Strömbergs, Stockholm (1951). [3] Fayol, H. (1925) Administration industrielle et generale. Paris. [4] Kanter, Rosabeth Moss (1989) The New Managerial Work. Harvard Business Review. Vol 67, Issue 6, pp.
85 [5] Kotter, John P. (1983) Yritysjohdon profiili. Oy Rastor Ab: Helsinki.(The general managers 1982) [6] Sayles, Leonard R. (1964) Managerial Behavior. McCraw-Hill Inc: New York. [7] Simon, Herbert (1947) Administrative behavior, The Free Press: New York [8] Stewart, Rosemary (1988) Managers and their Jobs. The Macmillan Press Ltd: London. Contact author for the full list of references
Appendix The Research Focus: The Elements of Entrepreneurial Usage of Time and the Contents within the Elements 1. Planning and managing company operations (5)
Planning and developing production and/or services Executing the plans, using organizational and management skills Following-up transactions and critically evaluating the current state of the company Forecasting functions, mapping out risks
2. Development of customer- and market-oriented functions (5) Interactive, productive salesmanship and customer service Customer satisfaction Segmenting customers by profitability Constituting and maintaining networks Interpreting market research and competitor analyses
3. Development of human resources (5) Attending to the wellbeing of the personnel Enhancement of team spirit Eliminating resistance to change
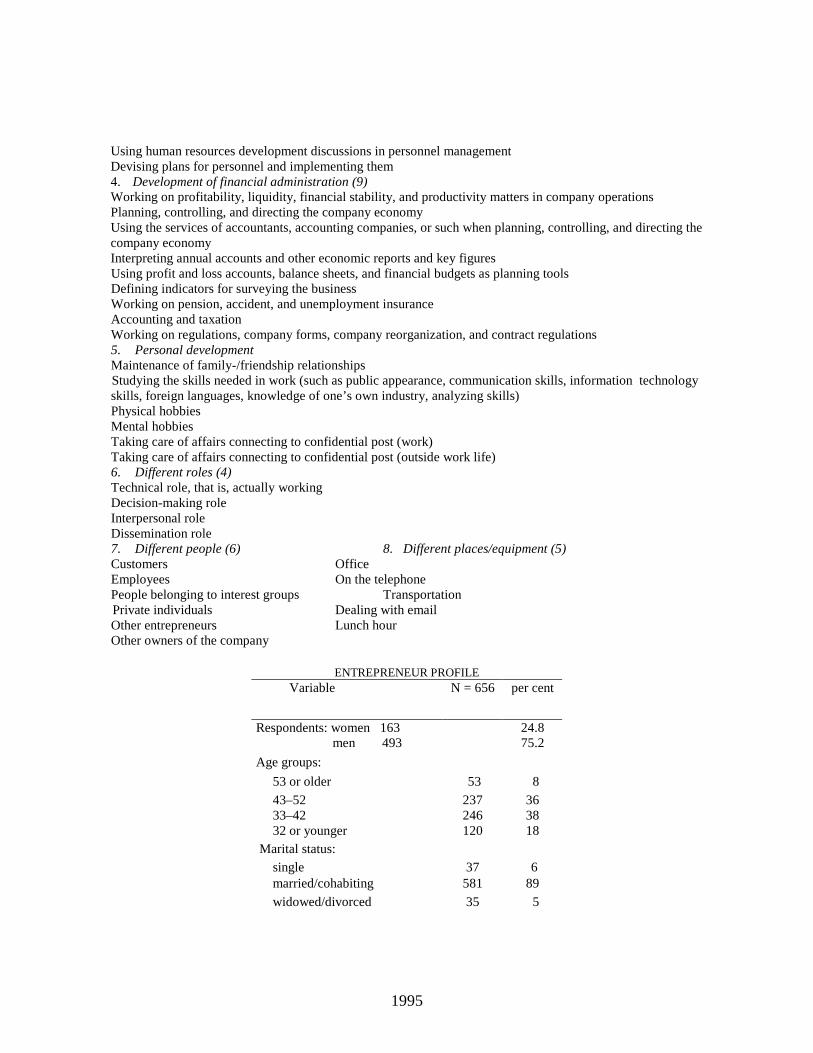
1995
Using human resources development discussions in personnel management Devising plans for personnel and implementing them 4. Development of financial administration (9) Working on profitability, liquidity, financial stability, and productivity matters in company operations Planning, controlling, and directing the company economy Using the services of accountants, accounting companies, or such when planning, controlling, and directing the company economy Interpreting annual accounts and other economic reports and key figures Using profit and loss accounts, balance sheets, and financial budgets as planning tools Defining indicators for surveying the business Working on pension, accident, and unemployment insurance Accounting and taxation Working on regulations, company forms, company reorganization, and contract regulations 5. Personal development Maintenance of family-/friendship relationships Studying the skills needed in work (such as public appearance, communication skills, information technology skills, foreign languages, knowledge of one’s own industry, analyzing skills) Physical hobbies Mental hobbies Taking care of affairs connecting to confidential post (work) Taking care of affairs connecting to confidential post (outside work life) 6. Different roles (4) Technical role, that is, actually working Decision-making role Interpersonal role Dissemination role 7. Different people (6) 8. Different places/equipment (5) Customers Office Employees On the telephone People belonging to interest groups Transportation
Private individuals Dealing with email Other entrepreneurs Lunch hour Other owners of the company
ENTREPRENEUR PROFILE
Variable N = 656 per cent
Respondents: women 163 men 493
24.8 75.2
Age groups:
53 or older 53 8
43–52 237 36 33–42 246 38 32 or younger 120 18 Marital status:
single 37 6 married/cohabiting 581 89
widowed/divorced 35 5

1996
unavailable 3 0.5 Education:
elementary school 91 14
middle school 264 40 matriculation 204 31 unavailable 97 15
Qualification:
vocational school 94 14 college level 294 45 lower academic degree 100 15 higher academic degree 61 9 unavailable 107 16
Years as entrepreneur:
over 25 152 23 16–25 168 26 6–15 115 18 5 or less 138 21 unavailable 83 13
TABLE 5: PLANNING AND MANAGING OPERATIONS (4 STATEMENTS)
Range 1 - 4 Present and future states _________________________________________________________________________________________ n = 656 Present state Future state alpha = .8912 alpha = .9440 mean SD mean SD _________________________________________________________________________________________
Planning and developing production 2.53 .863 2.93 1.057 Executing the plans, using org. skills 2.51 .842 2.94 1.066 Follow-ups, critically evaluating 2.50 .840 3.08 1.032 Forecasting functions, mapping out risks 2.37 .859 2.88 1.091
Mean of the means 2.48 2.96

1997
TABLE 6: DEVELOPMENT OF CUSTOMER- AND MARKET-ORIENTED FUNCTIONS
(5 STATEMENTS) Range 1 - 4 Present and future states ____________________________________________________________________________________ n = 656 Present state Future state alpha = .8148 alpha = .9220 mean SD mean SD ____________________________________________________________________________________
Interactive salesmanship, customer service 2.70 .907 3.02 1.051 Customer satisfaction affairs 2.55 .874 2.93 1.076 Segmenting customers by profitability 2.38 .910 3.02 1.045 Constituting and maintaining networks 2.20 .979 2.96 1.064
Interpreting market research and comp. anal.. 1.84 .829 3.06 1.027 Mean of the means 2.33 3.00
TABLE 7: DEVELOPMENT OF HUMAN RESOURCES (5 STATEMENTS) Range 1 - 4 Present and future states ____________________________________________________________________________________ n = 656 Present state Future state alpha = .9105 alpha = .9490 mean SD mean SD ____________________________________________________________________________________
Attending to the wellbeing of the personnel 2.41 1.015 3.16 1.021 Enhancement of team spirit 2.26 1.006 3.21 1.000 Devising and implementing plans for person.. 2.01 .913 3.26 .965 Eliminating resistance to change 1.92 .935 3.31 .964 Using human resources development discuss 1.87 .897 3.23 .977
Mean of the means 2.09 3.23
TABLE 8: DEVELOPMENT OF FINANCIAL ADMINISTRATION (9 STATEMENTS)
____________________________________________________________________________________ n = 656 Present state Future state alpha = .9314 alpha = .9680 mean SD mean SD ____________________________________________________________________________________
Working on profitability, liquidity, finance.. 2.51 .900 3.07 1.074 Planning, controlling and directing economy 2.49 .858 3.08 1.028 Using services of accountants, controlling 2.29 .939 3.13 1.058 Interpreting annual accounts and other rep.. 2.28 1.014 3.27 .990
Using profit and loss accounts, balance she 2.20 .915 3.12 1.046 Defining indicators for surveying the busin.. 2.17 .943 3.14 1.022 Working on pensions, accident insurance 2.02 .924 3.21 .990 Accounting and taxation 2.01 1.051 3.16 1.018 Working on regulations, company forms 1.92 .918 3.20 1.023 Mean of the means 2.21 3.15

1998
TABLE 9: PERSONAL DEVELOPMENT (6 STATEMENTS)
Range 1 - 4 Present and future states ____________________________________________________________________________________ n = 656 Present state Future state alpha = .7604 alpha = .8870 mean SD mean SD ____________________________________________________________________________________
Maintenance of family-/friendship relation.. 2.50 .872 2.64 1.174 Studying the skills needed in work 2.22 .889 2.89 1.057 Physical hobbies 2.22 .894 2.66 1.143 Mental hobbies 2.15 .887 3.00 1.049 Taking care… confident. post (work) 1.86 .920 3.47 .852
Taking care confident. post (outside work) 1.84 .929 3.55 .818 Mean of the means 2.13 3.03
TABLE 10: USAGE OF TIME IN DIFFERENT ROLES (4 STATEMENTS) Range 1 - 4 Present and future states ____________________________________________________________________________________ n = 656 Present state Future state alpha = .8919 alpha = .8870 mean SD mean SD ____________________________________________________________________________________
Technical role, participating in production 2.69 1.051 3.41 .902 Decision-making role 2.61 .990 3.31 .922 Interpersonal role 2.39 .952 3.33 .900 Dissemination role 2.38 .914 3.30 .898
Mean of the means 2.52 3.34
TABLE 11: USAGE OF TIME WITH DIFFERENT PEOPLE (6 STATEMENTS) Range 1 - 4 Present and future states ____________________________________________________________________________________ n = 656 Present state Future state alpha = .7465 alpha = .8930 mean SD mean SD ____________________________________________________________________________________
Customers 2.70 .932 3.18 1.005 Employees 2.35 1.058 3.48 .870 Interest groups 2.18 .863 3.30 .923 Private persons 2.14 .884 3.28 .953 Fellow entrepreneurs 2.11 1.017 3.46 .871
Other owners of the company 2.08 1.176 3.65 .785 Mean of the means 2.26 3.39

1999
TABLE 12: USAGE OF TIME IN DIFFERENT PLACES/EQUIPMENT (5 STATEMENTS) Range 1 - 4 Present and future states ____________________________________________________________________________________ n = 656 Present state Future state alpha = .6608 alpha = .8570 mean SD mean SD ____________________________________________________________________________________
Office 2.70 .932 3.57 .778 On the telephone 2.57 .917 3.71 .635 Dealing with e-mail 2.28 .877 3.66 .701 Transportation 1.97 .917 3.79 .537 Lunch 1.48 .735 3.72 .628
Mean of the means 2.19 3.69

2000
The Development of Thai Entrepreneurs
John Walsh, [email protected] Shinawatra University, Thailand
Abstract Entrepreneurialism in Thailand has been hampered throughout known history by the segregation of the labour market, the lack of governmental and institutional support for local firms and the low level of emphasis placed upon value-adding activities. The result has been that the bulk of entrepreneurial activity has been organised and controlled by people from other countries. This situation has persisted into the modern age and it was not until the inauguration of the systematically pro-business Thai Rak Thai government that significant, Kingdom-wide efforts were made to encourage high quality entrepreneurial activity in the wake of the 1997 financial crisis, which had already flourished in terms of numbers as many industrial, urban jobs were lost. It is not yet clear whether these efforts have been sufficient to embed desirable types of activity thoroughly into the bedrock of the economy.
Introduction The renowned Thai historian Chatthip Nartsupha wrote in his seminal work The Thai Village Economy in the Past: “The Thai village economy in the past was a subsistence economy. Production for food and for own use persisted and could be reproduced without reliance on the outside world. Bonds within the village were strong. Control of land was mediated by membership of e community. Cooperative exchange labour was used in production. Individual families were self-sufficient. Agriculture and artisan work – that is, rice cultivation and weaving – were combined in the same household … Production relations were similar to those of the primordial socialist community – a small community in which people help one another in a spirit of common humanity” (Chatthip, 1999, p.73).
This very influential viewpoint concerns the heart of what it means to be a Thai: to live in a village free from external control and to grow rice. The concept of the village seems almost to be one of paradise. As a consequence, anything that challenges the ways that the traditional villagers live and the way they try to change their lives will always be seen to be antithetical to Thai-ness and, consequently, wrong. As village life has become monetized and the villagers themselves have attained levels of personal mobility and transportation that has freed them from isolation, they have sought out cash paying income for periods when their labour is not needed in agricultural pursuits. Now, villages throughout Thailand boast at least some houses with air conditioning, satellite TV and other emblems of twenty first century consumerism. As people are able to achieve their dreams of personal wealth, they also become estranged from their roots and the moral values attached to those roots. This is not a phenomenon that is restricted to Thailand, of course, although it is held strongly in the Kingdom, which retains many very powerful and conservative social institutions. The concept of an entrepreneur, therefore, which is wholly lacking of Chatthip’s conception of village life, is an alien one to the Thai way of life, no matter how well and avidly many Thai people have taken to it. As trade in its various forms has, throughout recorded history, been controlled and conducted by people from other countries, the correlation between trade and the non-Thai has become more firmly established. Entry into the world of commerce has become primarily the preserve of ethnic Chinese, while those who consider themselves more purely Thai prefer government service or the professions, if possible. Of course, this concept of ‘ethnic purity’ is next to meaningless (or, more accurately, highly susceptible to manipulation of social perceptions and expectations) in a land in which waves of migration have led to the thorough intermixing of dozens of different ethnic groups (Evans, 1997).
Resulting from some ambivalence about the role and importance of entrepreneurial activity, therefore, the growth in the number of entrepreneurs required by the modern age has led to some social concern. Efficiency in all forms of agricultural production has yet to penetrate all sectors of the industry in Thailand but it has achieved enough that it would no longer be feasible to argue that, overall, farmers are now primarily involved in subsistence

2001
agriculture. Consequently, more people are freed to work in other forms of activity and, at least in the closing decades of the twentieth century, the long-term blight of the Thai economy, under-population, has been largely resolved and so urban populations have grown. The urban environment has never been described as a ‘primordial socialist community’ and has always been regarded as a place where commerce has sovereignty over many other forms of non-feudal activity; that is, activities which came under the jurisdiction of the crown and the feudal system which supported it remained their supremacy, even though agencies of the crown used commercial institutions to transact the state’s business. Ultimately, support for business and the entrepreneurs who are an important part of creating it came into direct conflict with socially conservative elements in Thai society in the form of organised street demonstrations against the Thaksin Shinawatra government which achieved their aim of restoring military dictatorship to the country. However, in the twenty-first century, business has become such an important part of a sophisticated modern society that it would be almost impossible to try to suppress it without serious damage to the economy overall.
This paper investigates the ways in which entrepreneurs and attitude towards entrepreneurs in Thailand have changed through history and pays particular attention to the ways in which entrepreneurs have been supported since the 1990s and what the future prospects for these issues are likely to be for the future. Entrepreneurialism in Premodern Thailand Throughout recorded history until the modern age, the majority of Thais were subsistence rice farmers who owed the monarch a period of corvée labour which could last for several months per year. The corvée labour period was generally spent in civil engineering projects or else military service. Men, therefore, found their lives to be circumscribed by the seasonal needs of agriculture and the need to serve the state. Women were more likely to enter into petty trading, using barter to exchange home made food or handicraft items. This was necessary since men were unavailable. The history of the great cities such as Ayutthaya and Angkor Wat in Cambodia, abound in accounts of women rowing small boats through the many canals which were the main urban thoroughfares and selling their produce. Most of these women entered the city to trade and returned to their rural homes subsequently. Urban areas were the homes of government and its religious and military apparatus. They were also the homes of artisans, who made items that brought status to rulers and which were also of intrinsic economic value. Since the non-elite Thais were restricted to rice farming, most artisans had to be imported from other areas, either voluntarily or involuntarily. The warfare that was endemic throughout mainland Southeast Asia for most of known history was largely motivated by the desire to increase manpower and, so, capture slaves. For example, The Chiang Mai Chronicle records King Mangrai the Great travelling to Phukam-Ava in the last decade of the thirteenth century because he had heard of the famous god, silver and bronzesmiths living there. Accompanied by his army, the mighty Mangrai obviously made a powerful impression because the Burmese king of Ava granted him 500 artisan families to take with him back to his capital of Chiang Mai (Wyatt and Aroonrut, 1998, p.39).
After the establishment of Ayutthaya as a great city, many forms of trade were conducted both domestically and with overseas traders. Indians, Persians and Chinese were very important in organizing the trade of the nation. Most Thai people had no role in the trade, even though their home villages might already have been converted to economic specialties. For example, the Chronicles of Ayutthaya describe villages known as, among others, Hamlet of the Shrimps, Village of the Gong Shed and Village of Sweet Mango (Cushman, 2000, passim). The movement of peoples around the country, it would seem, had already reached the level by which specializations had been achieved. Since these villages had been placed under the ownership of one of the elite classes of nobility or privileged Chinese merchants, it would be inaccurate to describe the individuals involved as entrepreneurs. However, as the owners of the artisans were unlikely to have a high level of technical knowledge of the crafts involved, it was the workers themselves who would have been involved in innovation and new product development, albeit at not a very rapid pace in most examples. Although, not many of all the associations have been retained through the centuries until the present.
Vietnamese were important early entrepreneurs in the country. As foreigners, they were exempt from corvée labour and poll tax and, so long as they could put up with occasional harassment, they could establish their small businesses wherever they could find an empty patch of land and a market. This was particularly common in the northeastern part of the country known as Isan. Étienne Aymonier, who traveled the region in 1883-4, observed that:

2002
“ … my travelers saw some tens of huts of other Annamese [Vietnamese] who had lived there for five or six years. They burned patches of the forest to plant rice and they distilled alcohol. Being foreigners, they had no poll tax to pay. And because they had come from the border areas of Annam, they knew nothing about their country” (Aymonier, 2000, p.100).
Foreign entrepreneurs have remained important in Thailand, since many of the Thai people lack the education and experience to create lucrative new businesses themselves. It has been observed that Thais are naturally entrepreneurial in nature and a trip to any town or city would reveal the diligence with which so many try to create some profit. However, it has often been necessary for outsiders to show how a new and unknown form of skill or knowledge may be exploited to create a surplus. In recent years, Dr Harvey Ludwig established Seatec International as an environmental engineering consulting firm, which was the first such business in Thailand. Many Thai engineers received training and experience from the company and then subsequently left to establish their own consultancies (Ludwig, 2006).
The rural-urban system had already become established during the period of Ayutthayan ascendancy. When that city was razed to the ground by the invading Burmese army in 1767, the founder of the new (and continuing) Chakri Dynasty established a new capital at Bangkok, albeit initially on the Thonburi side of the river. Goods were grown or created in rural areas under the control of merchants or elites and then sold in urban markets. This is clear from the description of entrepreneurial activity by Fournereau who, visiting the capital in 1892, observed the vibrant Talat Noi (ironically, ‘little market’) and the entrepreneurial activity therein:
“This market is the greatest of Bangkok one finds anything one desires here and naturally, by preference, things from English or German origin. Like in France, in the Middle Ages, each type of business has its special quarter here: in the first part, called Talat Noi, one finds the carpenters, the coopers, the basket makers, the bottle merchants, haberdashers, a few government operated pawnshops, Chinese restaurants and, finally, small stalls in which low quality silks, cloths with flower patterns used for making sarongs, Indian cloths, cotton threads, hats, etc., are sold. The majority of these stalls belong to Chinese (Fournereau, 1998, p.51).
The entrepreneurial activities available for the majority of the common people, therefore, were strictly limited to marketing and petty retail activities. There was no leadership in promoting entrepreneurial activities or in fostering conditions in which high value-adding activities can take place (Ayal, 1966). Public sector activities to foster entrepreneurialism were hampered by lack of resources and understanding (Marsden, 1984). A similar system has persisted in modern Bangkok, in which large numbers of market traders work hard to earn small amounts of commission from trading goods which belong to a larger scale entrepreneur, who acts in the form of a landlord. This can provide opportunities for small-scale traders to come into contact with much larger economic actors and to enter into relations with them:
“The interaction between micro-entrepreneurs and the volatile real estate market as mediated through relations with landowners’ points to spatial transformations of selling environments vis-à-vis inputs of capital. This results in both opportunities for and marginalization of small-scale cooked-food sellers. Some small food-shop owners have relocated within the growing number of food centres in the city, most situated in department stores and shopping plazas” (Yasmeen, 2006, p.183).
The economic history of Thailand, in short, reveals a series of connected characteristics which are features of entrepreneurialism in the country: most activities are micro-scale in size (i.e. fewer than 10 employees and usually just single-person), retail and service sectors are dominant and women are over-represented numerically. The margins on which the businesses operate are also generally very thin and a sudden economic shock can leave many thousands in a negative cash flow position. A survey of small-scale entrepreneurs in Bangkok and Phetchaburi in 1999 found that most were aged 30-40, with a few older and very few younger. Their education level was lower than average and most had completed only the elementary level of education. Women predominate in the micro-enterprise category, either because of lack of access to suitable resources or because of a long-standing attitude towards gender-suitable work (Maitree, 1999). There are, certainly, larger-scale entrepreneurs and many of these are able to prosper because of already existing connections established by family and relatives. Thailand is a generally low-trust society in which family connections are often significantly more important than economically-based relations. This makes members of influential family-based networks particularly attractive as business partners.

2003
Panthongthae Shinawatra, the son of former Prime Minister Thaksin, was able rapidly to attract capital and success to his media import company in large part because of the willingness of partners to establish a relationship with him. The history of Thai entrepreneurialism, therefore, demonstrates the low level of value-added activities that have been permitted to those Thai people able to participate in entrepreneurial activity. More economically advanced activities have traditionally been entrusted to or controlled by nationals of other countries. Thai entrepreneurs with good ideas for new business activities have often found their inspiration from an overseas partner or educational institution, although there have of course been some natural born geniuses who have personally created new businesses and industries, although this has been rare. Research among entrepreneurs in the Isan region has demonstrated that, up until the 1990s at least, these issues remained relevant to Thai entrepreneurialism. It was dominated by people of ethnic Chinese origin and the activities they pursued were clustered into a comparatively small number of sectors. Personal networking through professional organizations was also a powerful tool (Ueda, 2000). Subsequent research has failed to find tangible links between the possession of network connections and information and subsequently superior performance (Butler, Brown and Wai, 2003).
Research among the Vietnamese migrant community in Thailand also demonstrated the importance of personal connections in establishing a successful business and the clustering of entrepreneurs into a restricted list of industrial activities. After the migration of Vietnamese across the Mekong in 1945, for example, a secret committee established an unofficial machine repair training facility and, as a result, many young Vietnamese men opened businesses in this field subsequently (Walsh and Nguyen, 2005). The 1997 Financial Crisis In the years leading up to 1997, the Thai economy was hurtling along at a rapid and seemingly accelerating pace. As subsequent events demonstrated, this progress was hiding a number of structural problems which were revealed with, for many, disastrous results. The closing of many industrial facilities led to the large-scale movement of people out of regular employment and into semi-employment or unemployment. Some people in these categories also started their own businesses. The impact on people in different business sectors was very varied and the ability to cope depended considerably on internal resources such as resilience and determination. Many people faced the prospect of returning from Bangkok to provincial homes where they might be able to find partial or full employment in the agricultural sector, which was benefiting from higher cash prices for some agricultural products. However, most such people had already rejected the agricultural life and preferred to live in the urban environment. To do so, a number of people resorted to petty trading entrepreneurialism and related trades. Food vending and market stall management were popular and available choices. Between 1997-8, the number of people employed in the private sector declined by nearly a million (8.2%) and the number of people in the unpaid sector by more than 300,000 (5.5%) and, while some of these losses were countered by increases in the ‘employed’ and ‘own account’ categories (National Statistical Office figures, 1998). However, the total size of the active labour market declined by more than 850,000, which represented a 2.8% decrease overall. Those who were most vulnerable were generally those with lowest levels of education and income (hence savings). When members of the affected population enter entrepreneurial activities, therefore, they are most likely to do so in sectors which offer low margins and few opportunities for improvement.
The 1997 crisis revealed, among many other things, the lack of a coherent, integrated and overarching labour market policy in Thailand.
There are certainly elements of labour market policy objectives which are principally enacted by public sector agencies with diligence and determination but these are not part of a wider whole infused by a vision of what is required for future economic growth. Many other countries share a similar situation, of course, although that does not make the situation any better. A labour market policy for modern Thai society should integrate at least the following elements:
• Active labour market elements: policies and agencies to assist people move into new work opportunities through vocational training, job matching and database management schemes;
• Passive labour market elements: social security payments for the unemployed or those unable to work; • Migration management policies: thousands of Thais go overseas to work temporarily or permanently,
while more than one million overseas migrants are in Thailand in a variety of officially and

2004
unofficially registered activities. Policies are needed to identify a vision for managing these situations and ensuring that individuals and skills meet current and future jobs;
• Education: there is a need to identify future skills and competency needs and to provide schools and colleges with the resources to enable willing students to obtain those skills and competencies.
• Business support for entrepreneurs, including research and training facilities, micro-credit support schemes, credit facilities and similar activities.
Currently, these various functions are divided among a host of different and often overlapping government agencies. Coverage of the entire Kingdom is not always assured and long-term funding is rarely guaranteed. Research has indicated that a number of entrepreneurs are not satisfied with the complexity of the search for specialist support that they need, especially when considering the often very limited resources of time and money that they have and on which there are numerous other calls. The quality of support is also not consistently high and this exacerbates the often incipient problems of mistrust between the private and public sectors. Maitree (1999) found that a sample of SME executives had the following constraints in improving their business prospects:
• Lack of or limited access to credit financing • Lack of access to wider markets • Lack of capability for business planning • Lack of or limited skills of workers • Lack of knowledge or information on technology • Lack of skills in financial management and simple accounting • Lack of knowledge or information on other markets and on business opportunities • Lack of knowledge or information on tax laws and other commercial laws and regulations.
The next government of Thailand, which was a broad-reaching coalition of political interests under the banner of Thai Rak Thai (Thais Love Thais) led by Thaksin Shinawatra, aimed to address some of these issues. Of course, there had been initial examination of the conditions in which entrepreneurs might flourish prior to Thai Rak Thai, with a number of politicians sponsoring and supporting schemes of differing levels of success. These included the promotion of technology development and business incubation (Swierczek, 1992). However, these attempts were rarely if ever systematically deployed or deeply embedded in the commercial system of the country. The Thaksin Administration The Thai Rak Thai party was elected under a pro-business manifesto and the intention to develop regional Thailand from which it drew most of its support. It also included support from labour unions and activists and a number of radical thinkers who had, in previous decades, been categorized as and excoriated fro being Communists. Some of these coalition partners broke with the government in power.
A variety of new institutions was created to support small and medium-sized enterprises (SMEs) as part of a policy programme that came to be known, sometimes vituperatively, as ‘Thaksinomics,’ which was based on the concept of reducing dependence on external demand (export industries) fed by manufacturing industries in urban areas and on unproductive asset speculation (i.e. the property bubble), through developing domestic demand and traditional sectors of the economy. This has led to a dual track form of economic development and it had five main policy areas:
• Revitalizing growth at the grassroots level • Jump-starting key sectors • Enhancing economic efficiency and long-term competitiveness • Providing a stable and supportive macroeconomic environment to facilitate growth while maintaining
overall policy discipline • Promoting the external sector through market expansion and fostering financial stability through regional
and global cooperation (ADB, 2005). Clearly, this policy set required considerable stimulation of the entrepreneurial segment of society and institutions and agencies were established in order to support it. One of the principal forms of support was the creation of the SME Banki. The Bank describes its mission as being “… the leading bank for developing and strengthening
2005
competitiveness of Thai SME entrepreneurs, in the drive towards a strong and sustainable growth of the Thai economy, with high-quality services, good governance, efficiency, and financial stability.” The services that they provide include multi-stage funding such as: general credit; factoring credit; packing credit; leasing and hire-purchase credits; joint venture; L/G (letter of guarantee); and Aval (a guarantee added to a debt obligation by a third party who ensures payment should the issuing person default). Numerous types of loans are also advertised under a variety of schemes, as well as a number of networking activities, newsletters and counseling services. Additionally, many training services are provided, including: New Entrepreneur Creation scheme; accounting system and software application; POS system training for small retail businesses; tax laws and planning training for SME entrepreneurs; market research and new product development training; product distribution and public relations strategic training for SMEs; intellectual property management training; modern financial management training: techniques for capital reduction in SMEs and training for early-retired government officers.
In addition to the SME Bank, there is the Department of Business Development, the One Tambon One Product (OTOP) scheme, the Institute for SME Development and the National Food Institute. It is not clear to what extent these services will survive the military government. OTOP is a scheme aimed at promoting local knowledge and products and selling them in both the domestic and international markets. As of the end of 2006, the 7,405 tambons (sub-districts) of Thailand produced more than 23,000 OTOP items (ThaiTambon.com, http://www.thaitambon.com/English/TTBPR1A.htm). The government has assisted the scheme by providing extensive trade fairs and marketing and distribution support which had not previously been available to local people. The purpose of the scheme was not just to promote local products but to enhance rural development while retarding the growth of internal migration. Inevitably, many products have been found to be uncompetitive because of lack of demand or, more importantly, lack of consistent supply and quality control. In a number of cases, government agencies through the Ministry of Labour (especially the Department of Employment) have been able to intervene to provide training and education to help remedy the shortfall in quality control and supply chain management. Once people have the incentive of being able to sell products they themselves have understanding of and to the improvement of which they might be able to contribute, then they are generally more receptive to receiving such training.
It is difficult to evaluate the success or the sustainability of the OTOP scheme overall because of the lack of comprehensive statistics and because many issues are shrouded in political complications. However, it is certainly true that domestic and to a lesser extent some international demand has been created and OTOP items have been integrated into the distribution systems of some large multiple retail stores. Ironically, these foreign-owned retail multiples have sporadically received criticism and demonstrations accusing them of destroying the regional economies of Thailand.
The bankruptcy law of 1940 was amended and enacted in 2004. It represented a modernization of some stipulations relating to the bankruptcy laws and restructuring of various fees and procedures. In bringing the bankruptcy provisions somewhat more closely into line with international norms, as represented by the International Association of Insolvency Regulators (IAIR), the Thai government promoted entrepreneurialism to some extent by reducing the negative implications of bankruptcy.
Figures from the Board of Investment suggest that the various measures were moving in the right direction; the Private Investment Index, which took a baseline of 1995 = 100, fell dramatically in 1997 and had only reached 81.6 in 2004, 87.9 in 2005 and 91.5 in August of 2006, before tailing away again after the military coup of September 2006 (BOI, 2007, http://www.boi.go.th/english/how/private_investment_indicators.asp). Up to date indicators of business registrations are difficult to obtain, although the Department of Business Development figures suggest an initial rise in the number of new businesses. The labour market expanded from 2002 to 2004 by 5.0%, with the majority of this increase led by the private employee classification (15.3% increase). However, the situation remains very volatile with high churn rate of entrepreneurs – besides which, the technical capacity of the Thai civil service to record accurate, comprehensive and timely statistics is limited, especially given how many firms are part of the unofficial or black market sector. Some evidence suggests that the number of household-based businesses in semi-urban and rural Thailand as much as tripled in the wake of the financial crisis but it is not clear how many of these have ever been viable (Paulsen and Townsend, 2005).
2006
The Current Agenda The military government has sought to differentiate itself from the previous, ousted government by declaring many of the previous policies inappropriate or improper as a result of being ‘populist’ in nature. It has promoted the concept of the Sufficiency Economy, which is closely related with the ideas of HM the King and, hence, beyond criticism of any sort within the country. The Sufficiency Economy has been summarised by the UNDP in the following way:
“The Sufficiency Economy is an approach to life and conduct which is applicable at every level from the individual through the family and community to the management and development of the nation. It promotes a middle path, especially in developing the economy to keep up with the world in the era of globalization. Sufficiency has three key principles: moderation; wisdom or insight; and the need for built-in resilience against the risks which arise from internal or external change. In addition, those applying these principles must value knowledge, integrity, and honesty, and conduct their lives with perseverance, toleration, wisdom, and insight. Sufficiency in this sense should not be confused with self-sufficiency, turning inward, rejecting globalization, or retreating towards the mirage of a simpler world. Rather, this approach offers a way to cope with the unavoidable realities of the market and globalization in the contemporary world. The Sufficiency approach stresses that individuals need a certain measure of self-reliance to deal best with the market, and countries need a certain measure of self-reliance to deal with globalization. Sufficiency has the dual meaning of ‘not too little’ and ‘not too much.’ The principle of moderation or the middle way is a guide for finding the right balance between internal resources and external pressures, between the needs of society at the grassroots, and the imperatives of the global economy” (UNDP, 2007, p.XV) It is noticeable that, throughout the whole length of this book length report, the word ‘entrepreneur’ is used
only twice and, on both occasions, to describe events that happened prior to 1997. It may be assumed, therefore, that while the Sufficiency Economy is not necessarily antithetical to the concept of entrepreneurialism, it accords no particular value or virtue to the concept and, hence, little if any support will be provided for those involved in such activities. In this sense, therefore, the Sufficiency Economy may be seen as a return to the traditional, conservative view of Thai-ness and the proper role of people in the Thai economy. However, exactly how that view will be enacted in the future, with its endless bustle of events and external shock, remains to be seen. The 10th National Plan, for example, specifies the role of social entrepreneur in the development of the country, particularly with respect to the role of women. Indeed, much of the language of the military-appointed prime minister General Surayud Chulanont and his office in discussing the economy remains very similar to that of the previous, democratically-elected government, although most regional development policies have been scrapped. It is also not clear whether the military government will feel itself bound to follow the 10th National Plan, since it was approved in early September, 2006, a few weeks prior to the armed coup. If the junta has an alternative plan by which it intends to guide the development of the economy, then it has not yet shared this with the public. Policy Recommendations In considering what might be done to strengthen the role of entrepreneurs in the Thai economy, it is impossible not to have to consider what is practical and will be considered acceptable as well as what is desirable. Even so, there are clearly some areas which must be addressed, popular or not:
• the OTOP programme is a success and should receive further funding and support. Of course, not all areas have been able to develop successful products and those in such tambons may be offered training to work on different products;
• continue to work with innovative free trade agreements such as the Japanese-Thai Economic Partnership Agreement which includes a private sector initiative by Japanese firms to provide apprenticeships in Japan for Thai workers;
• reassert the importance of lifelong learning in Thai society and encourage people to continue to invest in their own skills and competencies. Thailand currently enjoys something of a demographic dividend arising

2007
from minimal payments in support for non-members of the labour market and now is the time to use that dividend to create a more skilled workforce;
• maintain existing provision of government services and be aware of response among customer groups and stakeholders and adjust the provision and nature of services in response to changes of demand;
• work with and within international organizations such as ASEAN and the ILO to obtain better training for the labour market and help in identifying new opportunities for entrepreneurs to consider.
The continuing and probably irreversible internationalization of the Thai economy will lead to the wider identification of possible entrepreneurial opportunities and products by potential or existing entrepreneurs. The introduction of mechanisms by which such innovation and creativity may be transmitted more widely throughout society would be very welcome.
References and Further Reading [1] Asian Development Bank (ADB), Asian Development Outlook 2005 (Manila: ADB, 2005). [2] Ayal, Eliezer B., “Private Enterprise and Economic Progress in Thailand,” The Journal of Asian Studies,
Vol.26, No.1 (November, 1966), pp.5-14. [3] Aymonier, Étienne, Isan Travels: Northeast Thailand’s Economy in 1883-1884, translated and edited by
Walter E.J. Tips (Bangkok: White Lotus Co. Ltd., 2000). [4] Butler, John E., Brad Brown and Wai Chamornmarn, “Informational Networks, Entrepreneurial Action and
Performance,” Asia Pacific Journal of Management, Vol.20, No.2 (June, 2003), pp.151-74. [5] Chatthip Nartsupha, The Thai Village Economy in the Past, translated and edited by Chris Baker and Pasuk
Phongpaichit (Chiang Mai: Silkworm Books, 1999). [6] Cushman Richard D., The Royal Chronicles of Ayutthaya: A Synoptic Translation, edited by David K.
Wyatt (Bangkok: The Siam Society under Royal Patronage, 2000). [7] Evans, Grant, “Is Anyone that Roi Percent? The Sinicised Tai,” Tai Culture, Vol.2, No.1 (June, 1997),
pp.16-29. [8] Fournereau, Lucien, Bangkok in 1892, translated with an introduction by Walter E.J. Tips (Bangkok: White
Lotus Co. Ltd., 1998). [9] Ludwig, Harvey F., “Saga of Dr Harvey F. Ludwig and Seatec International,” Environmentalist, Vol.26,
No.3 (September, 2006), pp.201-4. [10] Marsden, Keith, “Services for Small Firms: The Roles of Government Programmes and Market Networks
in Thailand,” International Labour Review, Vol.123, No.2 (March/April, 1984), pp.235-49. [11] Maitree Wasuntiwongse, “Needs and Characteristics of a Sample of Micro and Small Enterprises in
Thailand,” Working Paper 5, Micro and Small Enterprise Development and Poverty Alleviation in Thailand, Project ILO/UNDP: THA/99/03 (Bangkok: ILO, 1199).
[12] Paulsen, Anna L. and Robert M. Townsend, “Financial Constraints and Entrepreneurship: Evidence from the Thai Financial Crisis,” Economic Perspectives, Vol.29, No.3 (Third Quarter, 2005), pp.34-48.
[13] Swierczek, Fredric William, “Strategies for Business Innovation: Evaluating the Prospects of Incubation in Thailand,” Technovation, Vol.12, No.8 (December, 1992), pp.521-33.
[14] Ueda, Yoko, “The Entrepreneurs of Khorat,” in Ruth McVey, ed., Money and Power in Provincial Thailand (Chiang Mai: Silkworm Books, 2000), pp.154-94.
[15] United Nations Development Project (UNDP), Thailand Human Development Report 2007: Sufficiency Economy and Human Development (Bangkok: UNDP, 2007).
Contact author for complete list of references.

2008
End Note i SME is Small and Medium Sized Enterprises, which are conventionally categorized as firms with fewer than 250 employees. In Thailand, the great majority of SMEs are much smaller than this.

2009
Psychic Distance and the Market Entry of Finnish Software Firms to the Japanese Market
Arto Ojala, [email protected] University of Jyväskylä, Finland
Abstract This paper investigates the concept of psychic distance in the Uppsala internationalization model by analyzing the market and entry mode choice of eight small and medium-sized Finnish software firms. The case findings in this study reveal that, despite of the psychic distance between Finland and Japan, most of the firms entered Japan at a very early stage of their internationalization process by using direct entry modes. This could be interpreted as a sign of the Uppsala internationalization model being non-valid or outdated in the present global business environment. Findings also imply that highly segmented product offering forced the case firms enter into countries which provide a large customer base. In addition, high requirements for close cooperation with customers in sales and after-sales processes increased the need for direct business operations. However, firms were able to overcome psychic distance by hiring local employees and western managers who already had working experience in the Japanese market. Introduction Several internationalization theories [5, 11, 14, 18, among others] describe internationalization as a gradually developing process through various “stages” where a firm enter first nearby countries using indirect entry modes, such as exporting, which require less commitment to the market. Once the firm has gathered more experience on the market, it starts to develop operations which require more commitment to the market and establish direct business operations such as subsidiaries or joint ventures. One of the best known and most cited internationalization theory is the Uppsala internationalization model [11, 14], which includes the idea that when firms start to expand their operations to foreign markets, they first enter countries with a low psychic distance to theirs and then gradually move on to countries with a greater psychic distance. Although the arguments in the Uppsala internationalization model seem reasonable, it should kept in mind that the model was developed from the viewpoint of large, well established multinational firms. For these reasons, several studies related to international entrepreneurship [2, 3, 6, 20] have investigated the applicability of the model to small and medium-sized high-technology firms. These studies propose that SMEs in the field of international entrepreneurship do not commonly follow incremental step-wise progress in internationalization [11, 14]. Although findings in these studies [2, 3, 6, 20] give support to the conception that high-technology intensive SMEs first internationalize their operations to countries with a low psychic distance to theirs, they have not found evidence supporting the incremental internationalization process viewpoint. On the contrary, SMEs in the high-technology sector tend to internationalize their operations simultaneously to several countries within short time period and using various entry modes.
The conceptual model of Bell et al. [4] suggests that high-technology intensive firms start to internationalize their operations to leading markets, such as the USA and Japan, soon after their establishment. A limited domestic market, niche market segments, and high research and development costs in high-technology sectors can function as drivers for entering markets with a large customer base and purchasing power [4]. For these reasons, this study focuses on small and medium-sized Finnish software firms’ internationalization to the Japanese market. Japan is among the leading markets in the world, and it is a very important market for foreign software firms. Japan is ranked as the world’s second largest software market after the U.S. [9], and the overall software market size in Japan was 131,773 million U.S. dollars in 2004 [23]. However, the Japanese market has commonly been cited as a difficult one to enter for foreign firms [e.g. 7]. Japan can also be characterized as a psychically distant country from Finland due to cultural and language differences [15].

2010
Literature Review The concept of psychic distance came popular after Nordic studies by Johanson and Vahlne [11] and Johanson and Wiedersheim-Paul [14], known as the Uppsala internationalization model, were published. In the model, the factors that determine psychic distance between countries were defined as differences in language, culture, political system, level of education, level of industrial development etc. [14]. These factors affect a firm’s capability to learn and acquire knowledge from the target country. Thus, the lack of knowledge of foreign markets and operations have proved to be the main obstacle for internationalization. Lack of knowledge relates to the differences between the home and target country. According to the model, firms are expected to enter first into familiar markets with a low psychic distance, but once they have acquired more knowledge about how to operate internationally they start to enter counties with a greater psychic distance. International experience is also connected to the choice of entry mode: a firm first starts irregular exporting to the target country and, while gathering more experience, it starts exporting via independent representatives, may establish a sales subsidiary, and may finally starts its own production in the target country. The choice of entry mode is conceptualized as a learning process and increasing commitment to the market [11, 14].
In the Uppsala internationalization model, knowledge of foreign markets is divided into general knowledge and market-specific knowledge. General knowledge includes marketing methods of a product, operation modes, and typical customers in a global scale. It is mainly objective and transferable from previous countries entered to the target country [11, 12]. Market-specific knowledge is experiential knowledge about the target country environment, such as culture, the market structure, customers in the market etc. This knowledge is mainly acquired through operating in the target country [11] and it is highly tacit. Due to this tacitness it is difficult to acquire and transfer from country to country [17]. However, a firm can, to a certain extent, use their experiences and knowledge from earlier foreign operations when entering into a new country. Thought their experiences in the market, the firm can learn the general characteristics of markets, such as how to act with customers, suppliers, competitors and public organizations [13]. Psychic Distance in the International Entrepreneurship Literature
Several studies related to international entrepreneurship [2, 3, 6, 20, among others] have tested the suitability of the Uppsala internationalization model to explain internationalization behavior of small and medium-sized high-technology firms. These studies propose that SMEs involved with international entrepreneurship enter first to geographically close countries, which gives support to the concept of psychic distance. However, these studies have commonly found some additional factors, which explain internationalization of high-technology SMEs better than psychic distance between countries.
The study of Coviello and Munro [6] related to New Zealand-based small software firms implies that entry mode and market choice depend on firms’ formal and informal network relationships which evolve over time. The firms’ network relationships first give access to countries with a low psychic distance and, in time, these relationships enable market entry to countries with a greater psychic distance [6]. This is somewhat in line with the Uppsala internationalization model [11, 14], with the exception that the internationalization process of small software firms was very rapid, included less stages, and used a number of alternative entry modes simultaneously.
Findings in the study of Moen et al. [20] are consistent with the study of Coviello and Munro [6]. They found very little support to the Uppsala internationalization model related to the market and entry mode choice of small software firms. The entry mode choice of small software firms is more dependent on available network relationships than on the firms’ international experience. Initial market selections were related to psychic distance whereas in later choices the psychic distance is less visible. However, their [20] findings suggest that firms prefer countries where English is commonly spoken, because it facilitates communication and networking. This finding gives some support to the concept of psychic distance.
In his study, Bell [2, 3] investigated the internationalization of small software firms in Finland, Ireland, and Norway by validating the applicability of incremental internationalization models in explaining the
2011
internationalization behavior of software firms. Findings of the study suggest that software firms internationalize their operations first to countries with a low psychic distance, but there are other explanatory factors with more explanatory power than the concept of psychic distance. Bell [2] found that internationalization behavior of firms is more related to customers’ followership, niche markets, and industry-specific characteristics than to systematic steps or stages as suggested in the Uppsala internationalization model. Summary and Research Questions Altogether, earlier studies propose that the concept of psychic distance is valid, to some extent, in the internationalization process of both large multinational firms and SMEs in the high-technology sector. However, these studies have commonly taken a cross-national viewpoint without focusing on any specific country. For this reason, this study investigates the market entry and entry mode choice of eight Finnish software firms in the Japanese market. According to the concept of psychic distance, Japan can be ranked as a country relatively distant from Finland. Thus, in line with the concept of psychic distance, Finnish firms are supposed to enter the Japanese market only after operating directly in several less distant countries. This helps to validate the applicability of the traditional internationalization theories regarding the present global business environment. Therefore, the following questions are of particular interest in this study:
1. To what extent does psychic distance influence market entry to the Japanese market? 2. To what extent does psychic distance influence entry mode choice in the Japanese market? 3. What are the particular reasons for market entry to the Japanese market? 4. How are firms able to overcome psychic distance in the Japanese market?
Research Method The multiple case-study method was selected for this study due to the explanatory nature of the research question. Eisenhardt [8] holds the view that multiple case-study enables studying patterns that are common to the cases and theory under investigation. The case-study method also makes it possible to explain the significance and cause-and-effect relationships of the examined phenomena [24].
The case firms were selected for this study for theoretical reasons and not by random sampling [8]. The selected firms complied with the following criteria: a) they have their headquarters in Finland, b) they have direct business operations in the Japanese market, c) they do business in the field of software, and d) they have a maximum of 500 employees worldwide. Focusing on one single sector in this study helps to complement existing studies related to the software industry [2, 3, 6, 20] and reduces the potential for confusing results [22]. In addition, it allows comparing research results to earlier findings in the software industry, especially to those related to international entrepreneurship. Internationalization process of the case firms in this study was limited only to direct business operations in the target countries (excluding Japan) due to the fact that software products are easily delivered through Internet or firms’ file transfer protocol (FTP) server making traditional exporting activities less important than was the case previously.
In this study, Finland was chosen as the country of origin due to its small and open economy with a very limited domestic market. Due to its small domestic market, internationalization is generally a common growth strategy for Finnish software firms. Japan was chosen as the target country for the following reasons: firstly, Japan has the second largest market for software products. Thus, it is among the leading markets for software firms. Secondly, as recognized in several studies [e.g. 7], Japan is a very challenging country to enter and conduct successful business with. Thirdly, due to language and cultural differences between Finland and Japan, Japan can be characterized as being a psychically distant country from Finland [15, 18]. Finally, choosing Finnish software firms in Japan enabled addressing the target group, to a large extent, by using a qualitative case-study method.
Suitable firms for this study were identified from the websites of the Finnish Chamber of Commerce in Japan and Finnish Software Business Clusters, as well as from a list of firms in the publication “Software Product Business Cluster in Finland 2005”. By using these sources a total of nine suitable firms were identified. These firms

2012
were contacted with an e-mail request to attend the research. Eight of the nine firms answered and were willing to share their knowledge and their experience of the Japanese market.
Altogether 16 semi-structured open-ended interviews were conducted with managers in each firm’s headquarters in Finland and their units in Japan. All executives (with titles: CTO, Director, Executive Vice President, President, Managing Director, and Sales Administrator) that were interviewed had an in-depth knowledge of their firms’ international operations and the entry to the Japanese market. The 60-90 minute-long interviews were digitally recorded, carefully listened to, and transcribed verbatim with the help of a word processor. A second listening was arranged to ensure correspondence between the recorded and transcribed data. Complete case reports were sent back to the persons interviewed to ensure the validity and authenticity of the collected data. If interviewees in the case firms found some inaccuracies in the text, these were corrected based on their comments. In addition, some telephone and email interviews were used to collect further information from the interviewees. The collected data was also compared with other sources, such as websites and annual reports of the case firms.
In the data analysis, guidelines suggested by Eisenhardt [8] and Yin [24] were followed. All eight individual cases were written out as stand-alone case histories. After that, the unique patterns of each case were identified and similar patterns were categorized under common themes. This helped to organize and summarize the collected data. In addition, analytical tools were applied within and across the cases as proposed by Miles and Huberman [19]. For instance, checklists and event listings were used to identify critical events related to market entry process of each case firm. Research Findings and Analysis This section presents the empirical findings of this study and compares the findings to the theoretical background of this study. Firstly, the internationalization history of case firms is presented from the establishment of a firm until the market entry to the Japanese market in terms of direct business operations. Secondly, development of business operations of the case firms in Japan is described and discussed. Thirdly, the main reasons for the market entry of the case firms are presented. Finally, some strategies to overcome psychic distance in the Japanese market are discussed. Internationalization Activities of the Case Firms before Entering the Japanese Market All the case firms had been established between 1990 and 2000, except firm C that had been established already in 1966. The number of overall employees varied from 12 to 300, the average being 127 employees. Fig. 1 demonstrates the internationalization history of the case firms in terms of direct business operations until the establishment of direct business operations in Japan.

2013
FIG. 1: DIRECT BUSINESS OPERATIONS OF THE CASE FIRMS UNTIL THEIR MARKET ENTRY TO JAPAN
As it can be observed from the Fig. 1, almost all the firms started their foreign direct business operations in countries with large markets for their products and only two in a country with a low psychic distance. Four of the firms started their foreign direct business operations by entering into the USA market, one selected the UK as the first target country, and one firm entered straight into the Japanese market. Only firms C and F started their foreign direct operations by entering Sweden, which represents a psychically close market to Finland. However, pretty soon after entering the Swedish market, they started direct business operations in more distant markets such as Hong Kong and Malaysia. Firm C was the only firm that had direct business operations in more than two countries before entering the Japanese market. Four of the firms (B, D, E, and H) selected the Japan as the second target country and as noted earlier, firm G started their direct business operations first in Japan. These findings demonstrates that firms’ internationalization process before entering Japan did not generally follow the concept of psychic distance of the Uppsala internationalization model [11, 14], which proposes that firms first enter countries in a psychical proximity. Six case firms out of eight entered first countries which offer a large market for their products, namely the USA, Japan, and the UK. Only two of the firms started their foreign business operations in a nearby country. However, the internationalization processes of the case firms give support to the conceptual framework of Bell et al. (2003), which affirms that knowledge-based firms tend to internationalize their operations to the leading markets. This is also in line with Bell (1995) in that software firms enter to markets which are assumed to offer growth possibilities to their niche products. Entry Mode Choice of the Case Firms All in all, the case firms used six different entry modes in their market entry (Fig. 2). Firms C and F started their business operations by using Japanese distributors and firm E by direct sales. Other firms entered the market through direct business operations. Three of the case firms (A, B, and D) used representatives as their first entry mode. Firm G established a joint venture and firm H entered into the Japanese market by selling their shareholding to a Japanese corporation; the firm still had headquarters in Finland and operated as an independent unit of the corporation.
1995 96 97 98 99 2000 01 02 03
Firm A (1998)
Firm B (1992)
Firm C (1966)
Firm D (1990)
Firm E (1995)
Firm F (1991)
Firm G (1998)
Firm H (2000)
USA Hungary Japan
Sweden USA, Malaysia JapanGermany, UK
USA Japan
USA Japan
USA Japan
Sweden HongKong Japan
Japan
UK Japan
1995 96 97 98 99 2000 01 02 03
Firm A (1998)
Firm B (1992)
Firm C (1966)
Firm D (1990)
Firm E (1995)
Firm F (1991)
Firm G (1998)
Firm H (2000)
USA Hungary Japan
Sweden USA, Malaysia JapanGermany, UK
USA Japan
USA Japan
USA Japan
Sweden HongKong Japan
Japan
UK Japan

2014
FIG. 2: CASE FIRMS’ ENTRY MODES IN THE JAPANESE MARKET
Firms A and B used a representative as their current entry mode. Firm A was established in 1998 as a spin-off from a large Finnish software corporation and they had a representative in Japan from 2002 onwards. Firm A’s initially thought handling the market through a distribution channel, but due to the complex nature of the products using a sole distributor proved impractical. Their representative in Japan worked within the distribution channel in technical sales support. Firm B was established in 1992, and they stared developing their current products in 1998. In 2002, firm B established a representative office in Japan for two reasons. Firstly, a representative in the market enabled close cooperation with customers in both pre and after sales phases. One informant at firm B commented on this in the following way:
“Keeping regular contacts with our customer is much more difficult if we have to do it from here [Finland], it is the same with visits to potential customers [in Japan]. Regular appointments are required for these types of products… Anyway, physical presence is a must in our business”.
They also contemplated the possibility of handling the market with the help of a distributor. However, product sales would have required deep technical knowledge not possessed by the distributor. Secondly, a representative office enabled a cost-effective market entry and, compared to a subsidiary, required less bureaucracy in the establishment phase.
Four of the firms (C, D, E, and F) used a subsidiary as their current entry mode. In all of these cases, the subsidiary was established mainly for sales and marketing activities although firms C, E, and F had some minor product development activities in Japan. Firm C was established already in 1966, and they entered the Japanese market in 1999 with the help of two distributors. However, quite soon the other of the distributors closed its business and firm C found itself in a situation where they needed to find a new distributor or establish a unit for the Japanese market. They thought that handling the Japanese market with the help of single distributor was too risky. In 2000 they established a representative office, and in 2001 changed it to a subsidiary mode. This enabled better marketing and after-sales support for their customers in the Japanese market. Firm D that was established in 1990 entered into the Japanese market in 1999 by establishing a representative office. The purpose of the representative office was to provide support to their distributor who started to sell their products in Japan at the same year. The representative office also gave good opportunities to find and recruit local employees for their subsidiary that was established one year later (in 2000). The subsidiary enabled better support services to local distributors who handled the sales of their products. Firm E was established in 1995 and they entered into the Japanese market in 1999 with direct sales
Subsidiary
Representative office
Corporate
Joint Venture
DistributorDirect sales
Firm A 1998
2002
Firm B 1992
2002
Firm C 1966
1999
2000
2001
Firm D 1990
1999
2000
Firm E1995
1999
2000
Firm F 1991
1997
2001
2005
Firm G 1998
1999
Firm H 2000
2003
Subsidiary
Representative office
Corporate
Joint Venture
DistributorDirect sales
Firm A 1998
2002
Firm B 1992
2002
Firm C 1966
1999
2000
2001
Firm D 1990
1999
2000
Firm E1995
1999
2000
Firm F 1991
1997
2001
2005
Firm G 1998
1999
Firm H 2000
2003

2015
from Finland to Japanese customers. However, after half of year they decided to establish a subsidiary. The subsidiary was needed for keeping regular contacts with the distributor and for technical support. Another reason for establishing the subsidiary was the requirement to hire an employee able to speak Japanese. One informant at firm E explained this in the following manner:
”There were many potential customers in Japan, but the market was very difficult to handle without knowledge of the Japanese language. Those negotiations where I was involved were really difficult, because Japanese customers spoke only Japanese and we always needed an interpreter”. Firm F was established in 1991, and they entered into the Japanese market in 1997 with the help of a
distributor. That time they had only few customers in Japan due to the mobile network structure in Japan than was different from those elsewhere, and they were able to handle the market through the distributor. However, when Japanese launched the third generation (3G) mobile network, firm F established a joint venture (in 2001) for the Japanese market, which now offered large market potential for 3G network analyzers. A joint venture with Japanese partners provides better opportunities to network with customers and to give better after-sales support. However, firm F changed their operation mode to sales subsidiary in 2005 to achieve a better control of the market.
Firm G was established in 1998 and they entered into the Japanese market only one year after the start-up establishing a joint venture with their Japanese partners in 1999. Earlier, in their former jobs, the firm’s employees had created personal relationships their Japanese partners who were interested in launching firm G’s products to the Japanese market. Helped by their local partners, the firm was able to get access to Japanese telecom operators. Firm G’s unit in Japan gave maintenance support to the distributors who delivered their mobile games to the consumers.
Firm H was established in 2000, and they got access into the Japanese market by incorporating with a large Japanese corporation. Firm H noticed that successful market entry into the Japanese market required a great deal of financial resources and local knowledge. They decided to sell their shareholding to this Japanese corporation and corporate with them in 2003. This strategy facilitated a successful market entry, and one unit of the Japanese corporation started to sell and market firm H’s products in Japan and in other East and Southeast Asian markets.
As the case descriptions demonstrate, firms C, E, and F followed stepwise entry routes in line with the Uppsala internationalization model, starting their operations in Japan with ‘export’ activities without their own presence. Firms C and E however changed their entry modes to the subsidiary mode within a very short period of time. Five of the firms started their operations in Japan with integrated entry modes. The main reason for using integrated entry modes were the requirements for close cooperation with customers in the sales and after sales process. Thus, the overall development of entry modes of the firms discussed here does not fully support the conception of stepwise extension of operations as suggested in the Uppsala internationalization model [11, 14]. However, the findings are consistent with Coviello and Munro [6] implying that firms are simultaneously using several entry modes in the market. In this study, all firms (excluding firms B and H) used distributors in addition to their own units in the market. Reasons for the Market Entry to the Japanese Market Five of the firms (A, C, D, E, and F) mentioned that the main reason for their market entry was the large size of the target industry in Japan. Firms G and H entered the Japanese market attracted by the sophisticated industry structure for their products, and firm B chose the market for the reason that their important customer was located in Japan (see TABLE 1).

2016
TABLE 1: THE MAIN REASONS FOR THE MARKET ENTRY TO THE JAPANESE MARKET
Main reason for the market entry F
irm
A
Fir
m B
Fir
m C
Fir
m D
Fir
m E
Fir
m F
Fir
m G
Fir
m H
Size of the target industry in Japan
X X X X X
Sophisticated target industry
X X
Important customer located in Japan
X
Firm A produced virtual designing and modeling tools for mobile phone manufacturers, telecom operators,
and electronics industry. The large size of these industries in Japan made the market very important for firm A. Firm C’s core business in Japan focused on modeling software for steel and concrete construction industries, which are large industries in Japan and offer good opportunities for selling products to the local construction firms. Firms D and E produced enterprise level security software solutions mainly for banks, financial institutions, and network operators. The Japanese market offered a large customer base for these highly specialized data security solutions. Firm F produced analyzers for telecom networks and, in Japan, sold their products to telecom operators and research and development units which developed mobile networks. Although all these four firms were doing business in very narrow industry segments, the Japanese market offered a large customer base for their products. The market entry of these four firms occurred at the time of the so-called “IT-boom”. One informant at firm D explained this in the following way:
“It was really crazy times at the end of 1990s; although our products were based on software, we were not able to deliver as many licenses of our software as we got orders in Japan” Firm B developed software components for handheld devices such as mobile phones. The market entry of
firm B was thought necessary, because they got an important customer from Japan. The negotiations with the customer and product specifications required so much time and traveling between Finland and Japan that firm B decided to establish their own unit in the market. Other reasons for the market entry were attractive markets in Japan that might generate more sales later on to other mobile phone and semiconductor manufacturers.
The main reason for the market entry of firms G and H was the sophisticated target industry in Japan. Firm G sold mobile phone games to consumers through telecom operators which distributed games to end users. Value added services in mobile networks in Japan were well developed and consumers were used to use these services. Another reason for the market entry was based on the idea that sophisticated Japanese telecom markets might teach them something that would be useful later on in other markets. Firm H developed gaming-on-demand solutions and content for broadband networks. Use of their products requires highly developed broadband networks, and in this respect the Japanese market offered the most sophisticated markets for their products.
The above case descriptions underline the fact that almost all of the case firms produced their software for areas such as mobile phones, telecom networks, and data security, that were regarded as very attractive markets for foreign firms in Japan [10]. These findings parallel those of Bell et al. [4] and Rothaermel et al. [21], which indicate that technology intensive firms tend to favor countries with attractive markets. However, the size and sophisticated industry structure in vertical markets seemed to be more important, as a determinant of the country choice, than the overall market size. This became evident in that none of the firms based their choice of the market on the number of consumers, instead the market choice was based mainly on the size of the target industry. Apart from firms G and H, all the other case firms sold their products to other firms in Japan. This finding gives support to Bell [2] in that software firms enter to markets which offer growth possibilities to their narrow product segments.

2017
Ways to Overcome Psychic Distance in the Japanese Market According to the Uppsala model, experience of foreign markets and operations there lower the uncertainty to invest into more psychically distant markets [11, 12]. However, all the firms expect firm C, entered the Japanese market at a notably early phase in their life-cycle. Four of the firms (A, E, G, and H) entered into Japan within five years after their establishment and three (B, D, and F) within ten years after their establishment. In addition, the case firms’ international experience before establishing direct business operations in Japan were relative exiguous (from one year to five years). In addition, the case firms started to use entry modes which require high commitment (such as subsidiary, joint venture, own representative) in the market quite soon after the establishment. However, all the case firms which had international experience in terms of direct business operations reported that those experiences helped them when they started their operations in Japan. The experience gained facilitated mainly in operational level activities such as cost estimations, choice of entry mode, and location choice in the target country, i.e. in issues to be dealt with in the market entry process. This knowledge was reported to be mainly in the headquarters and not facilitated in practical issues in Japan, which required more knowledge related business environment. One informant at firm E highlighted this as follows:
“In the headquarters, they knew how to evaluate cost and time [of establishment] to make everything to work and what steps are required…but so far, the experience is still always personalized…person who established our subsidiary in the USA, he know how to do it, but he was not at all involved [in the establishment process of the subsidiary in Japan], he was managing our subsidiary in the USA…some parts of this process was known in the headquarters, but the knowledge about what we needed on the spot [Japan] was missing”. These findings are in line with Johanson and Vahlne [13] which indicate that, to a certain extent, a firm can
resort to their experiences and knowledge from earlier foreign operations when they are entering into a new country. This also supports the concept of knowledge in the Uppsala model suggesting that general knowledge about markets is mainly objective and transferable from one country to another, whereas market-specific knowledge is tacit and based on experiences of individuals [11, 12, 13]. This tacitness makes it difficult to transfer market-specific knowledge between different countries [17]. All the case firms, except firm A, acquired local knowledge either by recruiting local employees for their unit in Japan or for the headquarters or by partnering with a Japanese firm (firms G and H). This facilitated fast market entry and commitment to the market. Because knowledge of both business practices and technology were critical for the case firms, most of their employees in Japan were recruited from competitors or customers. These employees already knew the products and players in the market. This decreased their training needs and enabled the use of their already existing business connections. In addition, firms C, D, E, and F recruited a western manager with a long working experience in the Japanese market for their subsidiaries in Japan. These managers were able to act as “cultural mediators” between the western culture and the Japanese culture. Conclusions This paper investigated the market entry and entry mode choice of eight small and medium-sized Finnish software firms to the Japanese market. In addition, this study analyzed reasons for the market entry and how firms were able to overcome psychic distance between Finland and Japan. The findings in this study show that six of the eight firms started their foreign direct operations by entering into a country that would provide large markets for their products. In addition, the firms started developing their foreign direct business operations relatively early on by establishing foreign units to the main market areas for their products. These findings support the conceptual model of Bell et al. [4] suggesting that high-technology intensive firms start to internationalize their operations to leading markets soon after their establishment. However, these findings give very little support to the internationalization process described in the Uppsala internationalization model [11, 14]. Many of the firms entered Japan at an early stage of their internationalization; one of the firms even selected Japan as the location for their first direct operation abroad. This could be interpreted as a sign of the traditional internationalization or “stage” theories being non-valid or outdated in the present global business environment.

2018
In their entry mode choice, only three firms out of eight followed the traditional stepwise entry route in the Japanese market by starting their operations using indirect entry modes. However, these firms established their own units in the market quite soon after starting these indirect operations. Other five firms started their operations using direct entry modes. Thus, the findings in this study do not fully support the entry route suggested in the Uppsala internationalization model [11, 14], where a firm first acquires knowledge about the market by using indirect operations and then gradually starts to favour direct business operations. The findings in this study highlight that the choice of the entry mode was based on the complexity of the firms’ products, which required intensive cooperation with the customers in the sales process, implementation phase, and also made it possible to offer after-sales services near the customers. This gives a less obvious role to the network relationships in the entry mode choice compared to the findings of Coviello and Munro [6] and Moen et al. [20], because only in three cases (G, H, and F), the entry mode choice was related to the firms’ available networks.
The findings of this study are in line with the earlier studies in the field of international entrepreneurship [2, 3, 6, 20] in suggesting that high-technology firms select their target countries for other reasons than those related to psychic distance. This study found that most of the firms selected the Japanese market for the reason that it provided a large customer base for the firms’ niche products, which were commonly targeted to telecommunication industry or for dealing with large corporations’ telecommunication networks’ security. The limited local market in Finland was also one reason why the firms started to search market opportunities in major markets, such as Japan and the USA, for their products. Thus, the case firms were forced to enter into these major markets despite of the psychic distance to them. Only this enabled the firms to conduct profitable business in their niche market segments. This is consistent with Lindqvist [16] findings indicating that due to niche product offering, firms in high-technology sectors are forced to internationalize into markets where their target customers are located. Because the firms were actively targeting their products to the Japanese market, this might be the reason why network relationships had a less obvious role in the market selection compared to findings in Coviello and Munro [6] and Moen et al. [20].
Although all the case firms entered the Japanese market quite early on in their internationalization process and with limited international knowledge, they were able to overcome the psychic distance between Finland and Japan. For instance, almost all the case firms hired local employees to handle sales processes in Japan where the Japanese language is an important skill. In addition, each firm with a subsidiary in the market recruited a western manager with a long working experience in the Japanese market to overcome the cultural differences there. These managers had experiential knowledge about business practices in the Japanese market, which helped them to develop their firm’s operations in the market. As highlighted in the study of Barney [1], experiential ‘tacit’ knowledge is a valuable competitive resource for a firm. This finding suggest also that the perception of cultural differences by managers in firms seems to be more important that the actual variation in cultures. From a practical perspective, this is an important managerial implication suggesting that a firm can significantly reduce psychic distance between home and the target country by hiring managers with relevant experiential knowledge. This facilitates the market entry, makes it faster, and helps integrate firms operations to the culture of the target country. Limitations and Further Research This study is not without its limitations. Firstly, it focuses only on direct business operations of the case firms, thus its findings are not fully comparable to earlier studies related to internationalization of small and medium-sized software firms [2, 3, 6, 20]. Secondly, the concept of psychic distance is a wide concept and there are several alternative definitions for it. This study used the definition of psychic distance based on the Uppsala internationalization model [11, 14]. However, further study is needed to investigate the psychic distance concept more deeply, especially on an individual level, because it seems to help firms overcome differences between home and target country. Thirdly, although network relationships had less obvious role in this study compared to earlier findings in the field of international entrepreneurship [2, 6, 20], the supportive role of network relationships in internationalization process requires further study. Network relationships in the internationalization process have been commonly studied using cross-national perspective. Further network relationship studies could benefit from investigations dealing with impacts of network relationships where a firm is targeting their operations to a certain country. Finally, although the sample of this study covered almost all Finnish small and medium-sized software firms having direct business operations in the Japanese market, the sample can be generalized only to some extent and further study is needed to validate these findings.

2019
Acknowledgements The author would like to thank Merja Karppinen for her valuable insights and suggestions for an earlier draft of this paper and Pasi Tyrväinen for his assistance with figures. Financial support from the Foundation for Economic Education in Finland for this study is also gratefully acknowledged.
References [1] Barney, J. (1991). Firm Resource and Sustained Competitive Advantage. Journal of Management, 17(1),
99-120. [2] Bell, J. (1995). The Internationalization of Small Computer Software Firms: A Further Challenge to
“Stage” Theories. European Journal of Marketing, 29(8), 60-75. [3] Bell, J. (1997). A Comparative Study of the Export Problems of Small Computer Software Exporters in
Finland, Ireland and Norway. International Business Review, 6(6), 585-604. [4] Bell, J., McNaughton, R., Young, S. & Crick, D. (2003). Towards an Integrative Model of Firm
Internationalization. Journal of International Entrepreneurship, 1(1), 339-362. [5] Cavusgil, S.T. (1980). On the internationalisation process of firms. European Research, 8(6), 273-281. [6] Coviello, N. & Munro, H. (1997). Network Relationships and the Internationalisation Process of Small
Software Firms. International Business Review, 6(4), 361-386. [7] Czinkota, M.R. & Kotabe, M. (2000). Entering the Japanese Market: A Reassessment of Foreign Firms’
Entry and Distribution Strategies. Industrial Marketing Management, 29(6), 483-491. [8] Eisenhardt, K.M. (1989). Building Theories from Case Study Research. Academy of Management Review,
14(4), 532-550. [9] EITO (2006). European Information Technology Observatory 2006. Berlin, Germany. [10] JETRO, (2005). Attractive Sectors: ICT. Japan External Trade Organization. Retrieved November 8, 2006
from http://www.jetro.go.jp/en/market/attract/ict/ [11] Johanson, J. & Vahlne J-E. (1977). The internationalization process of the firm – a model of knowledge
development and increasing foreign market commitments. Journal of International Business Studies, 8(1), 23-32.
[12] Johanson, J. & Vahlne, J-E. (1990). The Mechanism of Internationalisation. International Marketing Review, 7(1), 11-24.
[13] Johanson, J. & Vahlne J-E. (2003). Business Relationship Learning and Commitment in the Internationalization process. Journal of International Entrepreneurship, 1(1), 83-101.
[14] Johanson, J. & Wiedersheim-Paul, F. (1975). The internationalization of the firm: four Swedish cases. Journal of Management Studies, 12(3), 305-322.
[15] Karppinen, M. (2006). Cultural Patterns of Knowledge Creation: Finns and Japanese as Engineers and Poets. Ph.D. dissertation, Helsinki School of Economics, Helsinki.
Contact the authors for a full list of references

2020
Early Prediction of Employee Attrition in Software Companies-Application of Data Mining Techniques
Vishnuprasad Nagadevara, [email protected]
Vasanthi Srinivasan, [email protected] Indian Institute of Management Bangalore, India
Abstract Employee retention is one of the biggest challenges in IT companies all over the world. Different companies adopt different strategies to retain the employees. These strategies include large increases in compensation, liberal perks, frequent job rotations, as well as travel and stay abroad. However, literature on turnover indicates that a person’s intention to quit is a function of demographic characteristics, job characteristics and organizational characteristics. Individual who have an intention to quit are also likely to engage in other withdrawal behaviors like absenteeism and late-coming. This paper uses data on demographics and the withdrawal behaviors like absenteeism and late-coming to predict turnover. It applies various data mining techniques to identify turnover in organizations. This exploratory study identifies four variables which could enhance the accuracy of prediction of turnover. Further research on the variables needs to be done to contribute to prediction and also identify the possible reasons for attrition. Introduction India has emerged as a major exporter of software services in the international economy in the past decade and a half. India’s software sales grew at a compound rate of over 50% between 1995 and 2000. Despite fears that the market for Indian software would surely collapse with the recession in the US, the growth of the software services industry continued and the industry diversified into other geographical and related markets. According to NASSCOM Mc Kinsey report, 2005, the number of people required in the IT industry alone would be 0.8 million in 2010 (Nasscom, 2005).
The initial growth of the Indian software industry could be attributed to the fortunate circumstance of an excess supply of engineers and scientific labour (Arora and Athreye 2002). As the demand for software professionals increased, wages in the software industry started to grow and attrition rates started increasing. More than half of all firms covered in the study by Arora selected manpower shortage and employee attrition as the most serious problems affecting them.
Attrition creates different kinds of threats and problems. When IT professionals leave an organization, not only is the number of them available for assignment to projects decreased, the professionals themselves often take specialized skills, tacit knowledge, and understanding of specific business operations and information systems with them (Moore & Burke, 2002). When attrition is at senior levels then it is also likely that a firm loses some of its customer base to the competitor. “Many of the firms saw employee attrition as an important problem. Several clients commented on the delays due to entire project teams leaving in the midst of the project in response to a more lucrative offer. Such delays were particularly troubling for smaller clients and for product focused clients with a need to shorten product development cycles. In both cases attrition threatened to open up the credibility gap which earlier firms had strived so hard to close” (Athreye 2003).
With increasing competition for human resources, the ability to attract, develop, and retain high-quality employees is becoming the main concern for the industry. Companies are adopting a number of strategies such as market hiring (hiring experienced people from other companies), advertisements, job portals, campus recruitment, headhunters, joint industry–academia programs, employee referrals, and support for higher education, flexi working schedules and retaining freelance headhunters to work exclusively for a particular company. Still, no single approach adequately meets the need.

2021
Turnover in Software Industry-Global Scenario Turnover of software professionals appears to be a global phenomenon. Some of the studies from US report that the knowledge and skills of IT professionals are needed by a multitude of industries globally. This results in them being more able and willing to change employers than workers in other industries (Freeman & Aspray, 1999). Many IT professionals engage in frequent job-hopping, which provides a greater scope of experience and training rather than remaining in the same position (Summer, 2001 as cited in Snyder et al, 2006). A recent survey indicates that the average time that managers consider acceptable to retain IT workers decreased from an average of 33 months in 2001 to an average of 30 months in 2004 (ITAA, 2004 as cited in Snyder et al, 2006) Capelli (2001) found a particularly high level of turnover among programmers. In a National survey of college graduates done by him, only 19% of computer science graduates remained in the field 20 years later while 52% of the civil engineering graduates did so. A study by George Mason University similarly found that career change among IT workers was double that of workers in other fields (Mandell, 1998). It is increasingly being recognized that the relatively short tenure of IT professionals may be due to the focus by the organizations on hiring workers who have the technical skills needed to deliver on the project immediately, but may realize after the project is completed that the formerly valuable skills are no longer beneficial (Snyder et al, 2006). Providing additional training to the workers creates a contradictory process. While training may increase the ability of the workers to perform better on current and future projects, it also enhances their attractiveness in the market and they become targets for poaching by competitors. Therefore, organizations appear to have chosen the “buy” strategy of seeking necessary skills in new workers rather than retraining (Capelli 2001). However, IT professionals tend to rate career development and a challenging job as greater than monetary compensation in determining their job satisfaction. (Meares & Sargeant, 1999 as cited in Snyder, et al, 2006). This inconsistency makes it difficult for organizations to balance between hiring and training to achieve the balance of skills that are required. In the Indian context, with rising internal competition and continued overseas demand for talent, the average industry attrition ranges between 12 and 35 percent (as reported in popular press), leading to a very high cost of hiring and employee development. For knowledge-intensive activities such as high-tech product development, attrition means not only losing people to competitors but also knowledge walking out of the organization (Moitra, 2001).
The competitiveness of the Indian IT industry rests on its labour pool and therefore, employee turnover is a source of great concern to the industry as a whole. The cost of attrition to the company can be broadly classified in to five categories: the cost of recruiting the new person, the cost of training, the cost of loss productivity, the cost of lost knowledge and the cost of the position remaining vacant till a suitable replacement is found (Sharma, 2007). All these costs would significantly take away the profitability of the firms. Presently cost and quality of personnel are the two sources of competitive advantage for the Indian IT industry.
Research on Turnover, Absenteeism and Lateness The three dimensions namely turnover, absenteeism and lateness have been grouped together as withdrawal behaviors and have been studied by work psychologists since they impact cost, production and productivity directly. Adler and Golan (1981) define lateness as “the tendency of an employee to arrive at work after the scheduled starting time” Johns (1985) defines absenteeism as the “failure to report for scheduled work” Others define absenteeism as “an individual’s lack of physical presence at a given location and time when there is a social expectation for him or her to be there (Martocchio & Harrison, 1993). The definition of turnover is “the termination of an individual’s formal membership with an organization (Lee, 1997). The connections between the three kinds of withdrawal behaviors have been of interest to researchers.
In particular, the progression perspective has been of particular interest in recent years. It can be conjectured that withdrawal will progress from minor, less salient acts, such as occasional lateness, to more salient acts, such as absence and finally turnover (Johns 2001). Longitudinal studies by Clegg (1983), Wolphin, Burke, Krausz and Freibach (1988) and Rosse (1988) found a lateness-absence progression although Adler & Golan (1981) and Krausz, Koslowsky and Eiser (1998) did not. Blau (1994) found a pattern of increasing chronic lateness that was

2022
associated with elevated absence within the same 18 month period. Several studies reveal a progression from absence to turnover (Krausz et. Al, 1998, Crosby & Brandt, 1988; Rosse 1988). If the progression was indeed existent, then statistically we would expect the relationship between lateness and absenteeism, absenteeism and turnover to be stronger than the relationship between lateness and turnover. The meta-analysis studies support this connection. Koslowsky et al (1997) reported a corrected correlation of 0.40 between lateness and absence and Mitra et al (1992) reported a corrected correlation of .33 between absence and turnover. Koslowsky et al estimated the mean correlation between lateness and actual turnover to be .07 and that between lateness and an apparent composite of actual turnover and turnover intentions to be .27 (Johns, 2001).
The linearity of the progression of withdrawal behaviors is still under scrutiny. However, some studies (Somers, 1999; Sheridan 1985) have found a nonlinear, discontinuous relationship between these behaviors and their relationship with some attitudinal constructs. The review of literature presented above indicates that any study of attrition would need to consider the history related to absence and late-coming. Demographic Variables and the Impact on Withdrawal Behaviors The literature on the impact of demographic variables on withdrawal behaviors has been ambivalent. Research has reported ambivalent findings on age, tenure, gender and education. Some studies have reported positive relationship between absenteeism and educational level and gender (Steel & Rentsch, 1995). In a review of literature on turnover among sales professionals, Lucas et al (1987) report that , among all personal characteristics , the most studied and the most consistent in its relationship to turnover is the employee age. Older employees were less likely to leave the organization than younger employees. The role of Tenure and education was unclear; however other researchers (Mobley 1982) consider tenure to be the best single predictor of turnover.
In the research done on IT, Ahuja et al (2007) found age had a modest but significant effect on turnover intention, but tenure did not affect turnover intention. Gender and marital status also did not affect turnover intention. While the database search on turnover and IT/MIS professionals yielded significant results, a similar search on absenteeism and lateness and IT/MIS professionals did not yield any articles. It is therefore, assumed that such a study exploring the relationship between turnover, absenteeism and lateness may not have been explored in the context of software professionals. .
This study attempts to understand attrition by using the demographic variables like age, sex, tenure, nature of the project and martial status along with the withdrawal measures like lateness and absenteeism. This would enable organizations in identifying individual employees who are likely to leave. Application of data mining techniques can help these companies in addressing this problem. Objectives of the Study The objectives of the study are as follows:
1. To evaluate the effectiveness of different models with respect to their predictive accuracy. 2. To identify the factors that influence employee attrition 3. To develop a predictive models for employee attrition
Methodology The methodology adopted involves application of various data mining techniques to predict employee attrition. The models used are artificial neural networks, logistic regression, classification trees (C5.0), classification and regression trees and discriminant analysis. The data on employee attrition was obtained from a software company. The data was extracted from a sample taken from the records of the company. The names of the employees as well as all other such identifiers were first removed from the data. In order to facilitate validation of the models, each employee record was given a unique identification number. The sample consisted of employees who had left the company during the past 3 years as well as those who are still with the company at the time of selecting the sample.

2023
This variable was taken as the dependent variable for the purpose of prediction of attrition. The following data was obtained from the employee records:
• Date of birth • Gender • Marital status • Total years of work experience (binned into 3 categories) • Months of experience in the present company (binned into 3 categories) • Months of in the current team (binned into 3 categories) • Months of experience in the current position (binned into 3 categories) • Type of position occupied currently in the company (binned into 6 categories) • Type of software domain expertise • Number of job changes till joining the present company (binned into 3 categories) • Month-wise use of casual leave (binned into 3 categories) • Month-wise use of privilege leave (binned into 3 categories) • Month-wise data on arrival time at work (binned into 3 categories)
Most of the literature concerning lateness, absence and turnover uses data from employee personnel files to measure the behavior. This study uses the same basis to collect information. The age of the employee was derived from the date of birth. All the experience related variables were binned into categories. The binning was generally based on equi-depth binning. The month-wise data on casual leave, privilege leave and daily arrival times were analyzed to identify changes in the patterns during the past 6 months. The analysis was primarily aimed at isolating cases where the usage was similar, or increasing or decreasing over the past 6 months. When an employee had left the company, the data for 6 months prior to leaving the company was analyzed. Similar analysis was done to identify changes in patterns in arrival times at work.
The normal practice while applying data mining techniques is to divide the data into training and testing data sets. Such division is usually done on random basis. The models are trained using the training data set and then the model thus developed is tested using the testing dataset. The main objective of such separation of training and testing datasets is to make sure that the models developed will not be specific to the special patterns in a particular dataset. Such a separation would be possible where the number of observations is large enough to allow such a luxury. In the present case, the same dataset was used for training as well as for testing because of the dataset contained only a limited number of observations. It is proposed that the models developed and tested could be used with data on other employees in the company for cross validating the model. Sample Profile Among all the employees in the sample, 28 percent had left the company where as the remaining 72 percent are still with the company as on the date of sample selection. The sample is predominantly male accounting for 70 percent. Only one-third of the sample employees were married. The group was relatively young with only 30 percent aged above 28 years. The average experience (total experience) was slightly less than 5 years. At the same time, only one-third of the sample employees had more than 6 years of total experience in the industry. The average experience within the company was slightly more than 2 years. More than two-thirds of the sample employees had experience of less than 30 months in the present company. The average experience within the current team was slightly more than 18 months, which is somewhat longer than the usual norm in the industry. The sample employees have spent even less time on average in their current position. The average time in the current position was less than 18 months indicating that the promotions were rather fast and early? Another interesting aspect of the sample was that the average number of job changes was just about one. This was the very first job for about one-third of the sample employees.
In summary, it appears that the employees in the sample are young, with fast growth in the company and continuing in the same team for a fairly long time. They are predominantly male and single.

2024
Development of Prediction Models As mentioned earlier, five different types of models were trained and tested. These models are:
• Artificial Neural Networks (ANN) • Logistic Regression • Classification Trees (C5.0) • Classification and Regression Trees (CART) • Discriminant Analysis
The following section describes each of the models and presents the results with respect to the training and testing of these models. The variables that are significant in each of the models and their relative importance are also discussed in this section. Artificial Neural Networks The artificial neural networks (ANN) are generally based on the concepts of the human (or biological) neural network consisting of neurons, which are interconnected by the processing elements. The ANNs are composed of two main structures namely the nodes and the links. The nodes correspond to the neurons and the links correspond to the links between neurons. The ANN accepts the values of inputs into what are called input nodes. This set of nodes is also referred to as the input layer. These input values are then multiplied by a set of numbers (also called as weights) that are stored in the links. These values, after multiplication, are added together to become inputs to the set of nodes that are to the right of the input nodes. This layer of nodes is usually referred to as the hidden layer. Many ANNs contain multiple hidden layers, each feeding into the next layer. Finally, the values from last hidden layer are fed into an output node, where a special mapping or thresholding function is applied and the resulting number is mapped to the prediction. The ANN is created by presenting the network with inputs from many records whose outcome is already known. For example, the data on age, income and occupation of the first employee (first record) are inputted into the input layer. These values are fed into the hidden layer and after processing (by combining these values using appropriate weights) the prediction is made at the output layer. If the prediction made by the ANN matches with the actual known status of the employee (say either left the company or not), then the prediction is good and the ANN proceeds to the next record. If the prediction is wrong, then the extent of error (expressed in numerical values) is apportioned back into the links and the hidden nodes. In other words, the values of the weights at each link are modified based on the extent of error in prediction. This process is referred to as the backward propagation. The artificial neural networks are found to be effective in detecting unknown relationships. ANNs have been applied in many service industries such as health (to identify the length of stay and hospital expenses) (Nagadevara, 2004), air lines (Chatfield, 1998) and ANNs are used in this paper for predicting the categories of the members of the loyalty programmes (Nagadevara 2005).
A total of 14 variables are used to build the ANNs for predicting the employee attrition. These are in addition to the dependent variable, which is a nominal variable indicating whether the employee is still with the company or had left the company. Most often the mathematical relationships or equations developed by the ANNs are complex and not available to the user. As a result, these are treated as black boxes, only to be used to obtain the prediction results. Nevertheless, it is important to know the relative importance of each of the variables in predicting the categories. The software used provides the sensitivity of the prediction with respect to each of the variables and this can be viewed as an indicator of the relative importance of the variables in question. Table 1 summarizes this information with respect to each of the 14 variables used for building the ANNs.

2025
TABLE 1: RELATIVE IMPORTANCE OF THE INPUTS USED IN THE CONSTRUCTION OF ANNs
Variable Relative importance Privilege Leave Used (Binned) 0.148577 Current Position in the Company (Binned) 0.146736 Current Technical Expertise 0.146736 Late Arrival at the office (Binned) 0.144292 Experience in the company (Binned) 0.082996 Total Experience (Binned) 0.078281 Domain Experience 0.071921 Casual Leave Used (Binned) 0.069042 Total number of job hops 0.034097 Marital Status 0.025611 Gender 0.014790 Age (Binned) 0.010350 Experience in the current position (Binned) 0.004343 Experience in the current team (Binned) 0.003620
The prediction accuracy obtained using the ANNs is 81.63 percent. The prediction percentages are presented in Table 6 at the end of this section. While the ANNs are able to predict those who remained with the company with an accuracy level of more than 90 percent, the accuracy level of prediction is only 59 percent with respect to those who left the company. In other words, the ANNs are excellent in their predictions with respect to those who remain with the company. The most important indicator for prediction is the pattern of use of Privilege leave. This is followed by the current position in the company, current technical expertise and the pattern of late arrival at the office. It is not surprising that two of the four most important indicators are the changes in the behavioral patterns of the employees. Logistic Regression Logistic regression is a specialized form of regression used to predict and explain a categorical dependent variable. It works best when the dependent variable is a binary categorical variable. The regression equation developed is very similar to a multiple regression equation with “regression-like” coefficients which explains the impact of each of the independent variable in predicting the category of the dependent variable. One special advantage of logistic regression is that it is not restricted by the normality assumption which is a basic assumption in the regression analysis. It can also accommodate non-metric variables such as nominal or categorical variables by coding them into dummy variables. Another advantage of logistic regression is that it directly predicts the probability of an event occurring. In order to make sure that the dependent variable, which is the probability, is bounded between zero and one, the logistic regression defines a relationship between the dependent and independent variables that resembles an S-shaped curve. It uses an iterative process to estimate the “most likely” values of the coefficients. This results in the use of a “likelihood” function in fitting the equation rather than using the sum of squares approach of the regression analysis. The dependent variable is considered as the “odds-ratio” of a specific observation belonging to a particular group or category. In that sense, logistic regression estimates the probability directly.
In order to get the best prediction results from the logistic regression, it is important to have continuous variables as independent variables. It is also important to define the nominal variables appropriately, so that they are converted into the required number of dummy variables. Thus, the use of binned variables is kept to the minimum possible in the case of logistic regression. The variables used in building the logistic regression and the corresponding coefficients are presented in Table 2.

2026
TABLE 2: VARIABLES IN THE EQUATION Variable B Exp(B)
Age (in years) .762 2.142
Gender -.770 .463
Marital Status 1.699 5.470
Total Experience in Years -.984 .374
Experience at the Company .263 1.300
Experience in the Current Team -.461 .631
Experience in the Current Position -.334 .716
Total number of Job Hops -.459 .632
Casual leave used .410 1.506
Privilege Leave used -.119 .888
Late arrival at the office -.262 .769
Current Position (Binned)
Current Position Binned(1) -.828 .437
Current Position Binned(2) .623 1.865
Current Position Binned(3) -.409 .664
Current Position Binned(4) -2.318 .098
Current Position Binned(5) 3.612 37.035
Constant -14.489 .000
TABLE 3: OMNIBUS TESTS OF MODEL COEFFICIENTS
Chi-square df Sig.
Step 60.179 16 .000
Block 60.179 16 .000
Step 1
Model 60.179 16 .000
The prediction accuracy obtained by the logistic regression is 79.58 percent. In logistic regression,
interpretation of the regression coefficient is not as that of the regular regression equation. The exponential value of the coefficient is considered to be the measure of the impact of the corresponding independent variable on the “odds-ratio”. Hence, Table 2 presents not only the regression coefficients, but also its exponential value. The relative importance of different variables on the “odds-ratio” can be obtained directly from Table 2. Classification and Regression Trees (CART) Classification and Regression Trees (CART) is one of the popular methods of building classification trees. CART always builds a binary tree by splitting the observations at each node based on a single attribute or variable. CART uses gini index for identifying the best split. If no split that could significantly reduce the diversity of a given node could be found, the process of splitting is stopped and the node is labeled as a leaf node. When all the nodes become leaf nodes, the tree is fully grown. At the end of the construction of the tree, each and every observation has been assigned to a leaf node. Each leaf can now be assigned to a particular class and a corresponding error rate. The error rate at the leaf node is nothing but the percentage of misclassifications at the leaf node. The error rate for the entire tree is the weighted sum of the error rates of all the leaf nodes.
The classification and regression trees work best with nominal or binned variables. Hence, the data used to build the classification and regression tree is either in the form of binned data or nominal data. The resultant tree is presented in Figure 1. It can be seen from the tree that experience in the current team is one of the important determinants. Not only it appears at the top of the tree, but it also results in a pure node on one of the branches.

2027
Similarly, the relative importance of different variables could be seen from the tree. As shown in Table 6, the prediction accuracy of the Classification and Regression Tree is 89.80 percent. Here also, the predictions are much better with respect to those who have not left the company. Classification Trees (C5.0) In the case of C5.0 classification trees, the splitting of the records at each node is done based on the information gain. Entropy is used to measure the information gain at each node. This method can generate trees with variable number of branches at each node. For example, when a discrete variable is selected as an attribute for splitting, there would be one branch for each value of the attribute. The construction of the tree, creation of leaf nodes and labeling of the leaf nodes as well as the estimation of error rates are very similar to the CART methodology.
As it is in the case of Classification and Regression Trees, nominal or binned variables are best suited for the Classification Trees. The tree constructed using the classification tree (C5.0) method is presented in Figure 2. One major difference between the CART and the classification trees is that classification trees allow multiple branches at any given node where as CART allows only binary splits. This is evident at Node 4 (Level 3) of the classification tree. In the case of classification trees also, experience in the current team appears to be one of the important factors in predicting attrition. The pattern of late arrival at the office appears to be one of the important determinants under classification trees. The prediction accuracy of the classification trees is 88.44 percent, which is very similar to that of the CART. The prediction accuracy of the classification tree is marginally better with respect to those who had left the company (as compared to CART).
The prediction accuracies of both CART and Classification Trees are very similar. This is not unexpected, considering that both the techniques work on similar principles, but differ only in terms of methodologies and splitting criteria adopted. Discriminant Analysis Discriminant analysis is one of the commonly used statistical techniques where the dependent variable is categorical or nominal in nature and the independent variables are metric or ratio variables. It involves deriving a variate or “z-score” which is a linear combination of two or more independent variables that will discriminate best between two (or more) different categories or groups. The discriminant analysis involves creating one or more discriminant functions so as to maximize the variance between the categories relative to the variance with the categories. The z-scores calculated using the discriminant functions could be used to estimate the probabilities that a particular member or observation belongs to a particular category.
It is important that the independent variables used in discriminant analysis are continuous or metric in nature. Accordingly, the variables used in estimating the discriminant function are the original variables. The coefficients of the standardized discriminant function are presented in Table 4. In addition to the coefficients, the Chi-square statistic as well as Wilks’ Lambda, which indicates the goodness of fit are also presented in Table 5.
The prediction accuracy of employee attrition based on discriminant analysis was 82.09 percent. The predictions are more accurate with respect to the employees who had left the organization. It can be seen from Table 4 that the standardized coefficients with respect to four variables namely, age, experience in the company, casual leave used and late arrival at the office are negative. The dependent variable, which is categorical, is coded as “0” for those who left the company and as “1” for those who remained in the company. Thus it can be concluded that these variable with a negative coefficient have a positive relationship with attrition (employees likely to leave the company)

2028
FIG.1 CLASSIFICATION AND REGRESSION TREE DIAGRAM
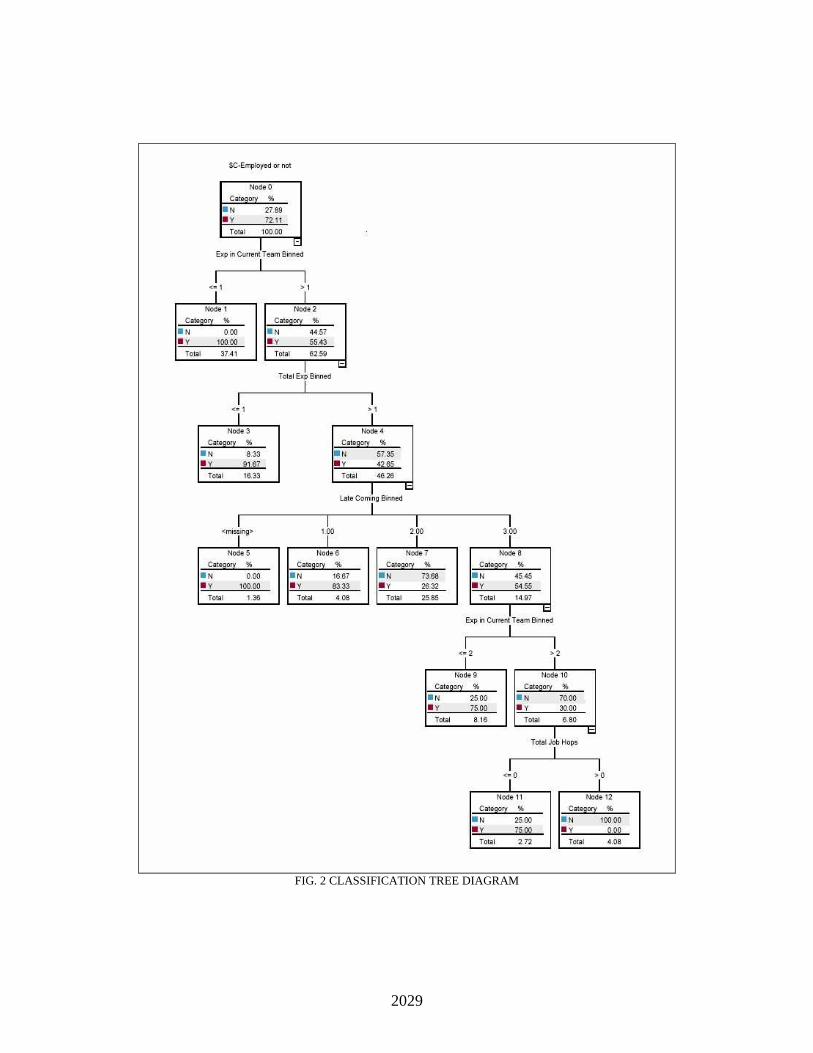
2029
FIG. 2 CLASSIFICATION TREE DIAGRAM

2030
TABLE 4: STANDARDIZED CANONICAL DISCRIMINANT FUNCTION COEFFICIENTS
Variable Coefficient
Age (in years) -1.437
Total Experience in Years 1.815
Experience at the Company -.832
Experience in the Current Team .629
Experience in the Current Position .615
Current Technical Expertise .002
Total number of Job Hops .197
Casual leave used -.306
Privilege Leave used .204
Late arrival at the office -.073
TABLE 5: CHI-SQUARE STATISTIC AND WILKS' LAMBDA CORRESPONDING TO THE DISCRIMINANT FUNCTION
Test of Function(s) Wilks' Lambda Chi-square df Sig. 1 .742 37.873 10 .000
Table 6 summarizes the prediction accuracies of all the five techniques used for prediction of attrition. Interestingly, all the five prediction techniques have shown reasonable accuracy levels with respect to those employees who remained with the company. On the other hand, discriminant analysis had given the highest accuracy level with respect to those who had left the company. Artificial neural networks are the lowest on predictive accuracy with respect to those who had left the company. From the company’s perspective, it is important to predict those who are likely to leave the company more accurately so that pro-active strategies could be initiated to minimize the attrition levels. The company would be in a position to engage those who are predicted as likely to be leaving the company to identify the possible reasons even before the employees have made the final decision. On the whole the classification trees and CART appear to give the best results in terms of prediction accuracy. Both these techniques are able to predict the attrition with an accuracy level of above 80 percent. At the same time the accuracy levels of these techniques with respect to those who remained with the company are above 90 percent.

2031
TABLE 6: PREDICTION ACCURACIES OF DIFFERENT TECHNIQUES USED Prediction Actual
Left the Company Not Left the Company Total C 5.0 Left the Company 82.93% 17.07% 100.00% Not Left the Company 9.43% 90.57% 100.00% CART Left the Company 80.49% 19.51% 100.00% Not Left the Company 6.60% 93.40% 100.00% Logistic Regression Left the Company 75.00% 25.00% 100.00% Not Left the Company 18.63% 81.37% 100.00%
The cut value is 0.700 Artificial Neural Networks Left the Company 58.54% 41.46% 100.00% Not Left the Company 9.43% 90.57% 100.00% Discriminant Analysis Left the Company 86.84% 13.16% 100.00% Not Left the Company 19.79% 80.21% 100.00%
Summary and Conclusions This paper applies various data mining techniques to identify such individuals. Five different techniques namely, artificial neural networks, classification and regression trees, logistic regression, classification trees (C5.0) and discriminant analysis were applied to predict the employee attrition. The overall predictive accuracy was between 79.57 percent and 89.80 percent. The companies would be more interested in the prediction accuracies of those who are likely to leave the company. The prediction accuracies have shown a wide variation in this respect. The ANNs appear to lowest predictive accuracy at only 58.54 percent where as the best prediction was possible with discriminant analysis. The identification of the four variables age, experience in the organization, late coming and casual leave in their relationship to turnover is significant from a research perspective. The role of age as a variable in the Indian context is particularly significant. The IT industry has been hiring in large numbers from the campus. Most of these graduates are first time workforce entrants who appear to have unrealistic expectations from the job and the organization. This unrealistic expectation coupled with scarcity of employable skills, and soaring salaries make them particularly vulnerable for turnover. It is also likely that many employees engage in a process of career exploration in their first few jobs. Therefore, the relationship between age and turnover has to be examined in the Indian context. Existing research on careers also suggests that older employees given their career and life stage, may not be able to move as easily. The role of lateness and absenteeism in predicting turnover requires further examination.
While these predictive accuracies are specific to the data used in the analysis and to the specific company in question, the study has shown that it is possible to predict the employee attrition, and identify those who are likely to leave the company even before they had made their final decision to leave. Such predictive abilities could help the company to initiate proactive measure to minimize the attrition. It is important for the company to try out different models and techniques and identify important variables before finalizing on a specific technique or model. It is also possible to adopt a hybrid methodology rather than depending on a single technique alone to improve predictive accuracies.

2032
References [1] Adler S & Golan J (1981) Lateness as withdrawal behaviour . Journal of Applied |Psychology, 66, 544-554 [2] Ahuja M K, Chudoba K M & Kacmar C J (2007) IT Road Warrior: Balancing work –family conflict, job
autonomy and work overload to mitigate turnover intentions MIS Quarterly 31(1) pp 1-17 [3] Arora, A. and S. Athreye (2002): The software industry and India’s economic development. Information
Economics and Policy, Vol. 14(2): 253-273. [4] Athreye S, The Indian Software Industry (2003), Working Paper 03-04, Carnegie Mellon Software Industry
Centre, October, 2003 [5] Blau G (1994) Developing and testing a taxonomy of lateness behaviour Journal of Applied Psychology
79, 959-970 [6] Capelli, P. (2001). Why is it so hard to find information technology workers? Organizational Dynamics, 30
(2), 87-99. [7] Clegg C W (1983) Psychology of employee lateness, absence, and turnover: A methodological critique and
an empirical study. Journal of Applied Psychology, 68. pp 88-101 [8] Express Computer (2004), “Combating High Attrition”, available at
http://www.expresscomputeronline.com/20041227/technologylife01.shtml [9] Freeman P & Aspray W (1999) The Supply of Information Technology workers in the US Washington DC
(www.cra.org/reports/wits) [10] Information Technology Association of America (ITAA). (2004). Adding value….growing careers: the
employment outlook in today’s increasingly competitive job market. Retrieved July 8, 2005 from http://www.itaa.org/eweb/Dynamicspage
[11] Johns G (1995) Absenteeism. In N. Nicholson (Ed.) The Blackwell Encyclopedic dictionary of Organizational behaviour (pp1-3). Oxford : Blackwell
[12] Johns G (2001) The psychology of Lateness, absenteeism and turnover in Anderson N, Ones P S, Sinangil H K & Viswesvaran C (Eds) Handbook of Industrial work and organizational psychology Vol 2 Sage. London
[13] Krausz M, Koslowsky M & Eiser A (1998) Distal and proximal influences on turnover intentions and satisfaction: support for a withdrawal progression theory. Journal of Vocational Behaviour, 52, 59-71
[14] Lee T. W (1997) Employee Turnover in L H Peters , C R Greer & S A Youngblood (Eds) The Blackwell Encyclopedic dictionary of Human resource Management (pp 97-100) Oxford Blackwell
[15] Lucas G H Jr, Parasuraman A,Davis R A & Enis B M (1987) An empirical examination of Journal of Marketing 51 (3) PP 34-59
Contact authors for the full list of references

2033
Technological Knowledge Transfer from Foreign Partners to Uganda's International Joint Ventures: A Case of the Manufacturing Industries
Mary Basaasa Muhenda, [email protected]
Uganda Management Institute Zainal Ariffin Ahmad, [email protected]
Universiti Sains Malaysia
Abstract The study investigates the extent of and factors that affect technological knowledge transfer from foreign partners to IJV in Uganda’s manufacturing sector. Government’s policy that encourages local firms to acquire and adopt technological knowledge to foster industrialization prompted the study. A total of 103 IJV’s were surveyed using a self administered questionnaire. Data was analysed using factor and reliability analysis and multiple regressions. Findings confirm a fairly low incidence of transfer of technological knowledge from foreign partners to IJV and also indicate that learning and development and structural attachment have a positive significant effect on the extent of technological knowledge transfer. This is in line with Blau’s (1964) social exchange theory which recognizes the importance of investing in irrecoverable resources in a relationship to create ties that set an expectation of reciprocity. Future research could be directed to conducting a longitudinal study to investigate other types of knowledge preferably in service industries. Background of the Study
The application of knowledge is now recognized to be one of the key sources of growth in the global economy (World Bank, 2006). Countries especially those in the developed world are at the forefront of harnessing employer’s knowledge as a strategy to increase competitiveness, growth and wealth and to improve performance. And as global competition that has resulted in an increasingly complex and unpredictable business environment intensifies, access to and application of knowledge become decisive factors in determining economic growth (Dahlan, Ramayah, Karia, Fun & Asaari, 2005; Hoeg & Schulze, 2005; World Bank, 2006). Developing countries in general and Uganda in particular who wish to effectively participate in globalization and benefit from it and yet their knowledge bases are insufficient must focus on facilitating knowledge worker productivity for survival more than ever before. In response to these challenges, governments around the world are adjusting their development strategies within a new framework in which accumulation of knowledge by way of knowledge transfer is occupying a central place.
The Government of Uganda in its effort to promote high economic growth and compete globally is committed to building local technological capabilities in-order to propel the country towards the status of an industrialized nation (UNCTAD, 2004). This fundamental national economic move is articulated in Uganda’s National Vision 2025 emphasizing macro economic stability through an enterprising, innovative and industrious society. Industrial development is linked with the existing national policies, programs and strategies that regard technology and knowledge among the key factors of production (World Bank, 2006). The expansion or establishment of new industries whose goal is wealth creation and improvement of people’s welfare and poverty reduction is expected to increase the value of the county’s natural resources, ensure job creation, guarantee enhanced household incomes, raise foreign exchange earnings and facilitate the transfer of technical know-how.
Aware of its insufficient levels of scientific and technological knowledge (UNCTAD, 2004; World Bank, 1995), the Government of Uganda has embarked on several strategies aimed at acquiring and adopting new scientific and technological knowledge from foreign partners. Through its numerous economic reforms, the government has since 1986 attracted many foreign investors, encouraged local firms to form joint ventures in business partnerships with foreign investors in the hope that firms in Uganda could gain knowledge and expertise from such consortia and partnerships and apply it in their own operations and enacted the 1991 Investment Code that delineates the policy that promotes the transfer of technological knowledge from foreign partners. In spite of all

2034
these efforts on the part of Government to accumulate technological knowledge from foreign partners, there is no indication of the extent of transfer of technological knowledge from foreign partners as a result of joint partnerships.
Though there are few existing studies in form of case studies and donor commissioned surveys that provide an insight on the transferability of technological skills in Uganda, we are not aware of any empirical studies that have particularly investigated the transfer of technological knowledge from foreign partners to IJV in Uganda. The few studies revealed that the soft side of technology transfer, absorption of organization and management practices as well as tacit knowledge that refer to the kind of instinct values, personal beliefs, individual actions and experience that resides in people’s minds (Nonaka, 1994; Nonaka & Takeuchi, 1995; Polanyi, 1967) was neglected (UNCST, 2000, 2001). The studies further suggest that technologies that were transferred were embodied in new equipment or in patents, blueprint technical drawings and manuals that brought direct outcomes of innovation rather than mechanisms, which facilitate learning about the innovation process itself (UNCTAD, 2002; UNIDO, 2000). Since there is ample literature to show that knowledge transfer in organizations occurs through alliances and other forms of inter-organizational relationships, this study complements literature by investigating technological knowledge transfer from foreign partners to IJV in Uganda’s manufacturing sector. The choice for the manufacturing sector cannot be underscored since technological knowledge comprises the knowledge base that manufacturing industries apply in the development, design, production and application of processes, procedures, systems and services. Literature Review
Starting from Polanyi’s (1967) assertion that knowledge comprises of tacit and explicit dimensions that are mutually complementary, several other scholars have also defined knowledge by categorizing it into different forms (Bloodgood & Salisbury, 2001; Edvinson & Sullivan, 1996; Nonaka &Takeuchi, 1995). Nonaka (1994) has categorized tacit knowledge into two dimensions. The technical dimension encompasses skills, crafts, and the cognitive dimension that resides in people’s heads in the form of instinct values, experience and personal beliefs that shape the way individuals perceive the world around them. The importance of technical know- how in Uganda cannot be underscored considering that it is such type of knowledge that is required to transform the available resources and to produce direct outcomes of innovation that spur industrial growth (Fernandize, Montes, Gullermo, Bustamante & Vazquez 1999; Shrivastava & Sounder, 1987). We consider such technical know-how as technological knowledge, which is defined as a body of experience, contextual information and techniques used in the development, design, production and application of processes, procedures, systems and services (Shrivastava & Souder, 1987). Knowledge Transfer in International Joint Ventures Earlier research on International joint venture literature dwelt on three interconnected theoretical dimensions of primary emphasis (Luo, 2000; Mcfashion & Sweeney, 2003; Parke, 1996; Wong & Ellis, 2002). The dimensions are antecedents, which include JV formation and partner selection; specific management issues pertaining to control and conflict; outcomes that encompass JV stability and performance. The traditional approaches however omitted the concept of learning, which are now the trend of current research and the focus of this study. The concept of learning as a current phenomenon has gained popularity at unprecedented levels in the last century (Bochel et al., 1998; Lyles & Dhanaraj, 2004). The organizational learning perspective focuses on how value is created through the enhancement of partner skills (Inkpen, 2000; Lyles & Dhanaraj, 2004). There are two distinct values on alliance learning (Peridis, 2000), co-specialization and capability enhancement and conduits for skills accessibility. The opportunity for co-specialization and enhancement of capabilities that are associated with new business opportunities arise from the integration of partner capabilities (Griffith et al., 2002; Mimbaeva & Pedersen, 2003). The second value coined “the race to learn” (Hamel, 1991) views alliances as conduits for accessing partners’ strategic resources and embedded knowledge (Inkpen & Beamish, 1997; Tiemessen et al., 1997). The second value is considered as a win–win situation because the benefits of learning are transferable to the partners other business hence resulting in a multiplier effect and increasing the incentive to co-operate (Peridis, 2000). The race to learn on the other hand is considered unstable because a faster mastery of skills on the part of a partner that is quicker to learn is likely to lead to alliance instability (Inkpen, 1998). Organizations capable of integrating and utilizing

2035
knowledge according to Griffith et al. (2002) have been linked to improved manufacturing productivity, alliance efficiency and adaptability, supporting international expansion strategies and developing a sustainable competitive advantage. Factors Affecting Technological Knowledge Transfer Some studies have analyzed barriers of knowledge transfer and replication, which include features of knowledge or causal ambiguity (Inkpen & Dinur, 1998; Simonin, 1999; Zander & Kogut, 1995). Other studies explored the effect of social contexts in terms of social distance and organizational culture on the transfer of knowledge (Inkpen, 2001; Inkpen & Dinur, 1998; Kostova, 1999). Gupta and Guvindarajan (2000) also investigated perceived value of the source unit’s knowledge, the transferors’ willingness to share knowledge, the existence and richness of transmission channels and transferee’s willingness to share knowledge. Tsang (2002) also investigated the effect of previous experience in forming and managing alliances or having collaborated with the same partner on knowledge transfer. Yet other studies investigated the characteristics of the transfer process (Argote, 1998; Argote et al., 1990; Baum & Ingram, 1999; Darr et al., 1995). Literature suggests that research on knowledge transfer in joint ventures does not seem to converge as evidenced by a proliferation of constructs and models (Lyles & Dhanaraj, 2004). From our discussion on the various frameworks above, it is evident that several factors affect the transfer of knowledge in Joint Ventures. However some studies on technological acquisitions and innovation emphasize the importance of similar external environments, technological similarity, geographical proximity and comparable internal structures in facilitating effective inter-firm technological knowledge transfers (Rosenkopf & Almeida, 2003; Stern & Henderson, 2004). External Environment External environment refers to anything outside the typical boundaries of an organization that create opportunities and threats to the organization, but over which the organization has little control (Hall, 2002; Robbins, 2001). Five organizational environmental domains include social, political, ecological, economic and technological (Hall, 2003). The different environmental domains have varying impacts on organizations according to Hall (2003). Whereas some organizations face relatively static environments like absence of new competitors, unavailability of new technological breakthroughs, less consumer demands others face very dynamic environments. Erratic government policies and regulations, sophisticated consumer demands, insufficient raw materials and numerous competitors are some of the characteristics of dynamic environments. The relatedness of external environment is an important determinant of where an IJV will search for and acquire competencies (Hansen & Lovas, 2004). Empirical studies of patent data posit that firms continue to seek and draw upon knowledge bases of firms most technologically similar to theirs (Mowery, et al., 1996) and from those in geographically proximate locations (Rosenkopf & Almeida, 2003; Song et al., 2003). Technological Similarity The extent to which firms can internalize new skills and techniques may be partially dependent on the recipients’ knowledge bases (Hamel, 1991). Hamel (1991) further observed that if organizations’ learning has to be effective, the knowledge bases have to be almost similar or else there will be many learning steps that make learning almost impossible. A partner firm possesses a related technological competence as long as its technological and technical expertise has similarities with what an IJV requires. This implies that elements of similar technological knowledge facilitate the integration of the acquired knowledge base (Hamel, 1991; Kogut & Zander, 1992). The proposition of technological similarity is anchored on Cohen and Levinthal’s (1990) notion of absorptive capacity. It is posited that common skills, shared languages and similar cognitive structures enable technical communication and learning (Lane & Lubatkin, 1998). Likewise, technologies that are particularly foreign and unfamiliar to the firm in relation to its technical competency base are difficult to comprehend (Steensma, 1996). Geographical Proximity Studies investigating technology transfer have pointed out that most technological knowledge that accompanies hard technology is highly firm specific, tacit, personal and less transferable across boundaries (Kogut & Zander, 1992; Mowery et al., 1996). To transfer such technological knowledge, the recipient firms would usually need to establish a much closer and more interactive relationship with the knowledge providers (Roberts, 2000). Studies investigating the impact of physical distance have posited that intense interactions often required in R&D demand close proximity (Almeida, 1996). That this is important because the parties need to go through alliterations of trying and testing and

2036
doing some more in order to develop R& D capability (Cummings & Teng, 2003). These studies suggest that geographical proximity reduce the cost and time of communicating and increases the frequency of personal contacts that build social relations thereby facilitating knowledge flow (Rosenkopf & Almeida, 2003). Comparable Internal Structures Technological knowledge is often embedded in a firm’s problem-solving techniques, communication channels that with time become taken for granted. These core structural features of an organization where technological knowledge is embedded become implicit, durable and difficult to change (Nelson & Winter, 1982) and as such learning about complex technologies becomes context-dependent. As a result of this, the effective transfer of technological competencies across businesses with less compatible internal structures is highly unlikely for in the absence of such similarities, the recipient firms would lack the following (Stern & Henderson, 2004):The communication channels needed to evaluate, receive and filter rich information; The organization routines and structures for effective storage and maintenance; The implicit problem-solving strategies needed to interpret information and apply it to solve organizational problems and apply it to commercial ethos. Conceptual Framework and Hypotheses Though recent research emphasizes the ease of technological knowledge flow between technologically and geographically proximate firms, we support Rosenkopf and Almeida’s (2003) suggestion that the formation of strategic alliances as in case of joint ventures can enable firms overcome geographical and technological constraints. We also posit that even when partners undertake to collaborate with the intention of exploiting external knowledge, certain requirements must be in place for the successful completion of the whole process. One is that partners must be confident that the relaters can be relied upon to behave in such a manner that the long term interest of the partners will be served, they must be committed to the relationship long-term maintenance and willing to have earnest dialogues. Another is that, there must be norms or routines that provide a formal structure to a relationship. Luo (2002) described such ties that manifest at an organizational level as structural attachments that bind parties to a relationship and make it difficult to consider other exchange partners (De Wulf et al., 2003). Lastly, the partner must have the necessary capacity to learn. This capacity includes an ability to internalize within its core organization the knowledge that it acquires through an alliance and the ease with which an organization allows its staff to generate new ideas. Our choice of variables is guided by theories that underpin the model, by previous literature on technological knowledge and by the Ugandan context in which IJV operate. Although some of these factors have been examined extensively in developing economies, to the best of our knowledge, these are yet to be extensively researched in the underdeveloped economies. The importance of establishing very close and more interactive relations with knowledge providers and the essence of technological similarities is cited in technological transfer literature (Ahuja & Katila, 2001; Hansen & Lovas, 2004; Rosenkopf & Almeida, 2003; Steensma, 1996; Stern & Henderson, 2004). The inclusion of relationship quality factors was based on Uganda’s past history. With the expulsion of the Asian community most of who owned the industries and were the custodians of the technical know-how, we believe that investigating trust between IJV and foreign partners and communication behavior cannot be underscored. We drew relationship quality and firm-level learning capabilities’ variables from Argote (1999) model and incorporated inter-party attachment from Luo (2002) model. We have not come across any previous research that considered Argote’s and Luo’s constructs simultaneously. By combining Argote’s and Luo’s constructs into one integrated model, we have been able to enrich the model further. We can therefore assess the differential impact of these factors in a more reliable way as opposed to testing their effect separately. We integrate this conceptualization with the social exchange theory on the premise that partners will only continue to exchange valuable resources if they perceive the exchange relationship attractive and likely to yield a pattern of reciprocal obligations (Blau, 1964; Demirgarg & Mirza, 2000). The affection that develops motivates partners to share strategic resources like know-how that enhance a firm’s ability to recognize and evaluate new knowledge (Cohen & Levinthal, 1990). Such a framework will contribute to theory, contribute to the aforementioned existing gaps in literature and expand research that could significantly impact on emerging economies that will propose solutions to narrow the technological gap between them and advanced nations. From the review of literature and from our conceptual perspective, we believe that the main motive behind joint venture formation in Uganda is their importance as conduits through which firms can access and learn each

2037
other’s critical skills and capabilities (Inkpen, 2000, 2001). We thus seek to investigate the extent to which technological knowledge has transferred from foreign partners to IJV in Uganda’s manufacturing sector. The transference of technological knowledge is particularly imperative because technological knowledge constitutes an important phase for industrialization on which developing countries anchor their economic growth. The study assesses how factors such as relationship quality, inter-party attachment, and firm-level learning capabilities affect the extent of technological knowledge transfer in Uganda’s IJV. Trust and Communication Behavior The quality of a relationship between IJV and its partners is very important because a firm is able to learn more easily from alliance partners when the degree of trust, transparency and openness between them is high (Doz & Hamel, 1998; Hamel, 1991). Since the cost of developing, deploying capabilities and of sharing know-how in inter-organizational relationships is high, effective mechanisms must be in place to discourage free riding and allow knowledge exchange (Dyer & Singh, 1998). Equally important is the quality of information and know-how exchanged in terms of accuracy, comprehensiveness and timeliness and participation in goal formulation and joint planning referred to as communication behavior. Existing research suggests that mutual trust between partners reduces the fear of free riding and opportunistic behavior often associated with the exchange and accessibility of assets such as knowledge that create value, are not available on open market and require time to build up (Ahuja, 2000; Gulati; 1995 Zaheer et al. 1998). Building upon this extent literature, that improved relationship quality can contribute to a freer and greater information exchange and expertise between committed exchange partners. Overall, we believe that the amount of knowledge transferred from foreign partners to the IJV will be influenced by the degree of trust between the foreign partner and the IJV. More trust in the partners’ competence will result in higher intent to acquire and adopt knowledge on the part of the IJV because higher levels of transparency and openness are often associated with the ease to learn (Inkpen, 1998) and will most probably affect the amount of knowledge transferred. Second, partners who trust each other are likely to lower the level of protectiveness towards each other thus increasing transparency. This nevertheless leads to accuracy, comprehensiveness and timeliness of information provided. Information is a necessary medium in organizational learning for knowledge exploitation (Nonaka, 1994). Individuals obtain and interpret information and learn by updating their mental models (Von Hippel, 1994). As individuals’ mental modes are enhanced, organizations ability to search, identify, acquire and adapt external knowledge is also enhanced. We therefore conclude that improved communication behavior will result in greater extents of technological knowledge transfer. Thus, we hypothesized that: H1. The higher the quality of the relationship between partners in terms of trust, the greater the extent of technological knowledge transfer. H2. The higher the quality of the relationship between partners in terms of communication behavior, the greater the extent of technological knowledge transfer. Structural Attachment Cross organizational boundaries aimed at establishing social ties (Luo, 2001) at either individual or organizational level play an important role in knowledge transfer. When the partners have developed a strong attachment that is manifested at organizational level, it’s more likely that they will have a basic understanding about each other’s skills and competencies (Inkpen & Beamish, 1997). Effective attachments reduce risk by carrying expectations of trust and abstention from opportunism and encourage resource exchange (Luo, 2000; Seabright et al., 1992) of which technological knowledge transfer is part. More so, social ties lubricate the workings of the relationship by supporting the existence of shared values, non-opportunistic behavior (Morgan & Hunt, 1994) and timely communication. We follow Luo (2002) argument that attachments in IJV create a favorable climate for knowledge exchange because increased trust and commitment that develops between exchange partners facilitate the transfer of especially embedded knowledge. Both parties develop a common culture that nourishes mutual learning which when coupled with increased familiarity of policies and procedures with greater understanding of the nuances of each other’s knowledge, ease the ability to transfer. We thus hypothesized that: H3. The greater the structural attachment between partners, the greater the extent of technological knowledge transfer.

2038
Learning & Development and Creativity & Flexibility A transferee’s learning capability is reported to be a major influence of knowledge transfer (Gupta & Govindarajan, 2000; Lane et al., 2001; Simonin, 1999) .An IJV learning capacity requires that firms have considerable in-house expertise that complements the technology activities of its alliance partners. Organizations that have clear strategies for learning and staff development acquire knowledge more effectively from their foreign parents (Inkpen & Crossan, 1995). Learning and development will enhance individual absorptive capacity and cumulatively improve overall learning of the IJV. Since possession of prior related knowledge is necessary for the effective assimilation of new knowledge (Cohen & Levinthal, 1990) we anticipate that IJV that encourage their employees to learn by formal training and development are more likely to exploit any critical external knowledge opportunities. Likewise, Amabile et al., (1996) posits that the creation of new knowledge depends upon a person’s expertise, thinking skills and motivation. She argues that whatever an individual’s expertise and creative thinking skills, the environment under which one operates can either enhance or inhibits the level of creativity. This line of argument is also supported by Rice (2003) who argues that employees can engage in creative problem-solving and exploitation of new knowledge as long as the working conditions within which an IJV are operating are flexible enough and conducive to allow for individual and group creativity. We hypothesized that: H4. There is a positive relationship between IJV degree of competency in training and development and the extent of technological knowledge transfer. H5. There is a positive relationship between IJV flexibility and creativity and the extent of technological knowledge transfer. Methodology This study focuses on the extent of technological knowledge transfer in Uganda’s IJV. The conceptualization is underpinned by three fundamental principles: First, the quality of the relationship in terms of trust and communication behavior helps partners to share strategic resources like knowledge without fear of opportunistic behavior. Second, the strength of the relationship emerging as a result of organizational ties sets an organizational climate where there is more interdependency in the relationship and a more likelihood of sharing information and communicating tacit knowledge. This breeds trust, reciprocity, receptivity and transparency (Lyles & Dhanaraj, 2004) that counteract opportunistic hazards and enhances inter-organizational exchanges of strategic resources thereby increasing a firm’s prior related knowledge. Third, firm- level learning capabilities as reflected in the way in which an organization encourages training and development of its staff in addition to supporting creativity and providing a flexible work environment enhances IJV absorptive capacity to recognize, evaluate and utilize foreign technological. Below we present the relationship among variables namely relationship quality, inter-party attachment and firm-level learning capabilities and extent of knowledge transfer as envisaged in our conceptualization that integrates Argote’s (1999) and Luo’s (2002) framework as depicted in Fig. 1.

2039
Independent Variables Dependent Variable
FIG. 1: THEORETICAL FRAMEWORK (Adapted from Muhenda, 2006) The study was conducted in all the districts of Uganda that had IJV and a total of two hundred and fifty six (256) IJV registered with the Uganda Investment Authority between 1995 and 2003 were purposively selected and their CEO interviewed. The IJV being the key decision making entity among alliance partners and where the technological knowledge outcomes could easily be observable and appraised is the main unit of analysis. The instrument used in the questionnaire was adapted from various authors as indicated in Table 1 below. To ensure goodness of measure, the crombach alpha coefficient was computed for all the variables where all the coefficients indicated values above 0.50 which strengthened the reliability of the instruments used in the study.
TABLE 1: SUMMARY OF VARIABLES Variable Number of
items Cronbach’s alpha Source
Communication Behaviour 5 0.95 Mohr & Spekman (1994) Selnes & Sallies (2003)
Trust between IJV & Dominant Partner
2 0.83 Moorman et al.(1992); Selnes & Sallies (2003)
Structural Attachment 3 0.67 Luo (2001) Learning & Development 4 0.85 Hurley & Hult (1998) Creativity & Flexibility 2 0.64 Amabile et al. (1996) Management Support 2 0.57 Amabile et al. (1996) Knowledge Transfer Extent 3 0.80
Results
A total of 103 respondents were used for the purpose of this study that accounts for 62.5% of the response rate. A total of ninety respondents were male 86.4 % whereas female CEO were only fourteen and accounted for 13.6 %. Only 13.6 % of the respondents were expatriate staff as compared to 86.4 % of local staff. Of these managers, the majority 58.3% had worked in the IJV for periods ranging from one to five years and only 3.9 % of the respondents had worked for less than one year in the IJV. Based on the responses from the managers interviewed, majority of the IJV’s in Uganda started their operations from 1990 and account for 58.3%. A total of twenty three or 22.3% of the IJV are Tobacco and Beverages processing industries followed by Chemicals and Chemical Works industries
Extent of Technological
Knowledge Transfer
Relationship Quality • Trust between IJV & partners • Communication behavior
Inter-party Attachment • Structural Attachment
Firm-level Learning Capabilities • Learning & Development
Competency • Capacity to Learn
(Flexibility & creativity)

2040
(19.4%) whereas food processing industries account for (18.4%). The higher percentage of Agro Industries is attributed to Uganda being largely an agricultural country. The smallest group of industries deals in Timber, Paper and Printing and account for 4.9% of the manufacturing industries. Such a low percentage could be attributed to many local firms being involved in the sectors that do not require complex technological knowledge that would have attracted joint partnerships. Majority of the companies earn over 500 million Uganda Shillings (61.2%), which is equivalent to United States dollars $ 300,000. The Uganda Manufacturers’ Association categorizes these as large-scale industries. Majority of IJV employ more than 200 employees, which account for 45.6 %. In our hypothesis generation, we postulated relationships between some factors of relationship quality, inter-party attachment and absorptive capacity on the extent of technological knowledge transfer. Using factor analysis, we were able to identify six dominant factors under each of the three variables namely communication behavior and trust constituting relationship quality; inter-party attachment as a single factor under structural attachment, creativity and flexibility, learning and development and management support factors under firm level learning capabilities. The results of the factor analysis are presented in Table 2 below.
TABLE 2: FACTOR AND RELIABILITY ANALYSIS OF RELATIONSHIP QUALITY, STRUCTURAL ATTACHMENT &
FIRM-LEVEL LEARNING CAPABILITIES VARIABLES 1 2 3 4 5 6 Factor 1- Communication Behavior Our foreign partners always keep us updated with latest technological developments .94 .17 .15 .10 .08 .07
We expect our foreign partners to supply us with accurate information at all times .93 .18 .11 .09 .08 .09 Our foreign partners are very responsive to our organizations information needs .92 .15 .10 .05 -.02 .06 We believe that our partners policies on exchange of ideas and information are transparent
.86 -.01 .10 -.07 -.14 .16
We hold regular meetings to keep each other informed about events or changes that may affect the other party
.83 .12 -.01 .06 .20 .02
Factor 2 – Learning & Development Our organization sponsors staff to attend professional seminars .10 .84 .31 .08 .01 .10 Our organization grants study leave to staff to attend short skills improvement courses .23 .79 .13 .17 .02 .19 There is a training budget to cater for staffs development .10 .79 .10 .03 .08 .25 We provides opportunities for individual development other than informal training .12 .70 .18 .16 .08 .17 Factor 3- Structural Attachment We are able to access our foreign partners sources of information (databases, resource centers, workbooks)
.17 .16 .75 .16 .06 .27
Our organization encourages both formal and informal coordination with our partners .07 .31 .68 -.11 .03 .18 We always make long term plans together with our partners .11 .21 .67 .15 .26 -.11 Factor 4- Trust between IJV & Partners Our partners always follow through on all commitments .01 .07 .02 .94 .02 .04 Our partners devote their time and energy for the good of the IJV .16 .22 .16 .84 .15 .20 Factor 5- Creativity & Flexibility Team members in this organization come from professional backgrounds .06 .05 .04 .02 .87 .09
Employees in our organization are allowed to try solve the same problems in different ways
.05 .03 .28 07 .80 .06
Factor 6- Management Support There is supervisory support for team work and team working in this organization .12 .26 .01 .13 .11 .78 Our organization provides guidance and counseling regarding staffs career .15 .14 .31 .08 .07 .73 Eigenvalue 6.1 2.7 1.6 1.4 1.0 1.0 Percentage of variance 33.68 14.78 8.77 7.85 5.72 5.59 KMO .80 Significance .000

2041
Multiple Regression Analysis To test the simultaneous effects of several independent variables on the extent of technological knowledge transfer, multiple regression was carried out to determine the variance of the effect of the factors mentioned above on the extent of technological knowledge transfer. Table 3 summarizes the results:
TABLE 3: SUMMARY OF REGRESSION ANALYSIS RESULTS Step Variables R square Adjusted R Sig F β 1. Controls 0.09 -0.02 0.70 Control Variables Duration 1.9 1-50 Million 0.13 51- 100 Million 0.1 101-200 Million 0.1 201-500 Million 0.1* Tobacco & Beverages -0.3*** Food Processing -0.2* Textiles & Clothing -0.2* Chemical Works -0.3** Timber & Printing -0.1 Metal Works -0.2* 2. Independent Variables 0.63 0.55 0.00 Relationship Quality Communication Behaviour 0.21 * Trust 0.06 Inter-party Attachment Structural attachment 0.46 *** Learning Capabilities Learning & Develop. 0.32** Creativity & Flexibility 0.10 Management support -0.07 *: significant at 10% level **significant at 5% level and *** significant at 1% level
Discussion Communication behavior, trust between IJV and foreign partners, structural attachment, learning and development and creativity and flexibility have a positive effect on the extent of technological knowledge transfer. Management support is negatively related to the extent of transfer implying that an increase in the degree of management support leads to a decline in the extent of technological knowledge transfer which finding is contrary to our hypotheses. Structural attachment and learning and development have a positive significant relationship with the extent of technological knowledge transfer in Uganda’s IJV. The two variables explain 0.63 of the variance in OBP (R2 =. 63). The following results are obtained: structural attachment (β = .46 at 1% level of confidence) and learning and development (β = .32 at 5% level of confidence). The results imply that IJV that offer more learning and development opportunities to their employees and whose degree of structural attachment is higher are likely to, experience higher extents of technological knowledge transfer from foreign partners. Structural attachment and learning and development have a greater impact on the transfer extent than communication behavior. Extent of Transfer of Technological Knowledge in Uganda’s IJV We sought to find out the extent of technological knowledge transfer in IJV in Uganda. Taking 5.0 as the highest extent of knowledge transfer on our scale and 3.0 as average transfer extent, we can conclude that the extent of knowledge transfer from foreign partners to IJV in Uganda is fairly low. Transfer extent recorded a mean score of 2.97, which is slightly below average level of incidence of transfer performance. Relationship between Independent Variables and Extent of Transfer We attempted to find out how factors such as relationship quality, inter-party attachment and firm level learning capabilities influence transfer of technological knowledge in Uganda’s IJV. The findings are consistent with the

2042
dominant factors that were derived from the factor analysis which include communication behavior, trust between IJV and foreign partners (relationship quality), structural attachment (inter-party attachment), learning and development, creativity and flexibility and management support (firm level learning capabilities). Communication Behavior Contrary to our hypotheses, communication behavior was not significantly associated with the extent of technological knowledge transfer. The results of our study are inconsistent with several other studies that emphasize the importance of sharing high quality information in exploiting knowledge opportunities in alliances (Dyer & Singh, 1998; Child, 2003; Inkpen, 2001; Nonaka, 1994). The studies cited above confirm that availability of information stimulates an awareness of needs and concepts and is also a means by which behavior is modified, change is effected, information made productive and goals achieved (Cole, 2001). The inconsistency in our findings could possibly be attributed to five (four) major reasons, namely underlying national and organizational cultural differences, information overload, failure to adopt adequate institutional mechanism, and level of technicality. Underlying national and organizational cultural differences arise as a result of different cultural orientations of partners and may result in sharing of poor quality information which may have negative impact on the extent of technological knowledge transfer. Information Overload refers to overloading users with unnecessary vast amounts of data may lead to situations where useful information is discarded or ignored and not put to effective use. The failure on the part of the IJV to adopt adequate institutional mechanisms to ensure effective communication behavior in terms of sharing relevant knowledge among employees including those who may not need it immediately. Level of Technicality suggests that a larger component of technological knowledge comprises of tacit elements and finding proper language to articulate what they know and share expertise with novices may often be difficult for the partners to communicate with the IJVs. Trust between IJV and Foreign Partners The contrary results that found no positive and significant relationship between trust and knowledge transfer are similar to earlier findings by Lane et al.(2001) and Lyles et al. (2000). Lane et al. (2001) did not find trust to be directly associated with learning. An earlier study done by Lyles et al. (2000) in Vietnam found that changes in learning structures like parent assistance accounted more for changes in IJV knowledge acquisition than they found for trust. The prevailing logic of why trust does not significantly affect the extent of technological knowledge transfer from foreign partners to IJV in Uganda could be justified by the fact that successful knowledge distribution depends on the amount of explicit knowledge available in the IJV (Davenport & Long, 1998). Technological knowledge comprising largely tacit elements, is difficult to convert to explicit knowledge and therefore difficult to share and adopt even in the presence of a strong relationship commitment. Another possible reason could be due to earlier history experiences that brought anew dictatorial regime to power that summarily expelled the Asian community, thus seriously undermining investor confidence. Though succeeding governments sought to attract foreign investors to Uganda, the confidence of potential Asian investors in particular could not be readily rekindled (UNIDO, 2000). This could partly explain why trust between IJV and foreign partners is not significantly associated with the extent of technological knowledge transfer in Uganda’s IJV given that the most dominant foreign partners are of Indian nationality and account for 49%. Structural Attachment Structural attachment was shown to be positively and significantly related to extent of technological knowledge transfer. Luo (2001) urges that attachments in JV create conducive climate for knowledge exchange because increased trust and commitment that develops between exchange partners facilitates the transfer of embedded knowledge. As a source of enduring commitment from each party over time, attachment helps create a repository of reliable information from exchange partners (Inkpen and Beamesh, 1997). Research on attachment has also investigated the relationship between personal and structural attachment and how they interactively influence performance. Luo (2002) reported that both personal and structural attachments exert a strong positive influence on IJV performance. Luo’s (2002) study further posits that such attachments stimulate IJV sales and profits. Due to increased acquaintance with policies and procedures between exchange partners along with greater understanding of the nuances of each other’s knowledge, the ability to transfer is enhanced. This underlies the positive association between structural attachment and technological knowledge transfer extent in this study.
2043
Learning and Development Learning and development was shown to have a positive significant effect on the extent of technological knowledge transfer as earlier predicted. As already discussed, absorptive capacity requires that a firm develops considerable in-house expertise that complements the technology activities of its alliance partner. Organizations that have clear strategies for learning and staff development acquire knowledge more effectively from their foreign parents (Inkpen & Crossan, 1995). Absorptive capacity of the transferee is reported to be a major influence of knowledge transfer (Gupta & Govindarajan, 2000; Lane et al., 2001). The results from this study are also consistent with Lyles and Salke (1996) who demonstrated empirical support for the linkage between training of local employees by foreign parents and knowledge acquisition. The findings of Hathaivaseawang (2004) also showed that formal training was an important predictor of acquired marketing knowledge. It is thus true to presuppose that IJV in Uganda that support employees’ learning and development initiatives are more likely to exploit any critical external knowledge opportunities. Creativity and Flexibility Surprisingly, creativity and flexibility were found to be positively but not significantly related to enhanced technological knowledge transfer. The inconsistency in our findings could possibly be attributed to some of the following factors. One key influence on the success of any creative enterprise is the acquisition of requisite resources particularly necessary financial support (Damarpour, 1996). Lack of adequate resources that is characteristic of many developing economies could be a major hindrance to creativity and flexibility given that forty percent (40%) of the IJV in Uganda earn less than 300,000 US dollars in gross annual revenue. With insufficient resources, the chances of trying out new ideas and rewarding employees for their innovations are severely curtailed. The situation is further compounded by lack of supervisory and managerial support crucial to the process of ensuring supply of the necessary resources. Interviews with the shop floor staff confirmed inadequate resources and restrictions as being setbacks in the bid to trying out new ideas. For the majority of staff interviewed, experimenting and trying to solve same problems in different ways is considered a waste of resources and is not acceptable in the majority of IJV. Other possible reasons could include some of the following. Conflict of opinion because of diverse professional backgrounds and cultural backgrounds of team players. . In addition, inability to share creative ideas across units and or even within teams could inhibit the extent of technological knowledge transfer. Inherent socio-psychological dynamics also feature. Knowledge that is always considered a source of power which if lost could undermine the experts’ spheres of influence and peer recognition could also be responsible for the inconsistency in our findings. On the other hand, hierarchal extrinsic rewards that breed conformity and conservatism and skill specialization may discourage creativity among IJV staff. Management Support Management support, however, does not affect the extent of technological knowledge transfer in this study yet earlier studies reported significant association between management support and knowledge management product (Davenport & Long, 1998; Rice, 2003). The only prevailing logic as to why executive support does not positively influence the extent of knowledge transfer could be that since knowledge would already be acquired, applied and disseminated, with time it becomes automatically integrated with or without any support. Hence the contrary results. Policy Implications The results confirm a low incidence of the transfer of technological knowledge from foreign partners to IJV in Uganda which findings could guide policy makers. The Uganda Government could encourage, support and strengthen the existing policy on investment in general and IJV in particular There is need to enforce the policy, which encourages the transfer of foreign technology and expertise and lays out all conditions which limit the ways in which technical know how may be used. The Government could institute punitive measures for non- compliance like refusal of license renewal and denial of investment incentives like tax holidays. In addition, the overall findings also suggest that IJV resources also influence the extent of knowledge transfer, hence the need to emphasize IJV earnings in technological knowledge transfer. Government could moderate the erratic high levels of taxation, lower

2044
interest rates on business loans and restrict importation of competing products. The findings of the study also suggest that relationship characteristics among organizations in an alliance may facilitate or inhibit the extent of technological knowledge transfer. Therefore, the government should illustrate to participating firms how the process of technological knowledge transfer could be enhanced and improved to facilitate the transfer of knowledge from foreign partners to IJV. This could be accomplished through seminars and workshops where dissemination of research results could be discussed and stakeholders encouraged to share experiences. Government could also fund or solicit funding for research in technological knowledge transfer fields and ensure that the types of skills that are needed by local industries are generated in adequate numbers through policies that promote firm-level learning and that encourage interaction between educational institutions and industries. Strengthening technology support institutions and establishing new relevant institutions in addition to enforcing science subjects in schools could also be appropriate options. Recommendations for Future Research This study has contributed to the body of knowledge in the area of knowledge management especially in supporting theory development. Further empirical research could explore other variables like technical and organizational infrastructure that has been cited in knowledge management studies (Davenport et al., 1998; Davenport & Marchand, 2000; Shyrme, 1999). The convergence of telecommunications and computing that allow the exchange of knowledge across firms regardless of geographical boundaries could warrant future research. Technologies that support communication building, people networks and on the job learning are considered crucial for organizational learning and knowledge transfer whose influence on technological knowledge transfer could be investigated further. This study confined itself to IJV in the manufacturing sector omitting service industries because it investigated the extent of technological knowledge. More empirical research could be extended to service industries to investigate the transfer of other forms of knowledge. A longitudinal study is recommended for this type of research to address the continual process that takes place during the transfer of technological knowledge. Limitations Several limitations were experienced in research design and methodology, the nature of data collected and the population size. Such limitations have a bearing on result interpretations and generalizations. The first limitation is due to the population size. The IJV were identified from the Uganda Investment Register only. Collecting data from listed and non-listed IJV could strengthen the findings of this research. Another limitation is that one CEO responded to the questionnaire on behalf of the IJV, which makes the responses not fully representative of the views of all employees. Secondly, some methodological problems were encountered. Some data collection methods adopted for the study have inherent disadvantages: questionnaire retrieving requires frequent reminders; and some participants require long distance travels to access them. Another problem could have resulted in the directive from Uganda Investment Authority requesting the CEO’s to fill the questionnaire which directive may have been unwelcome and hence the incomplete 56 questionnaires were returned but could not be used. Lack of understanding of some terminology in the instrument might also have interfered with the interviewees understanding of some questions in the instrument because 58% of the items were discarded after factor analysis. The other problem is that this study was a cross-sectional study where data collected at one point in time might not convey a true picture of the facts on the ground. Conclusion This study investigated the extent to which technological knowledge from foreign partners has transferred to IJV in Uganda. We first examined the extent of technological knowledge transfer from foreign partners to IJV in the Ugandan manufacturing study. The results confirmed a low incidence of extent of transfer of technological

2045
knowledge from foreign partners to IJV in the Ugandan manufacturing sector. This is divergent from government’s effort to encourage joint partnerships aimed at taping into foreign partners technological bases. Secondly, we examined the relationship between a set of factors and the extent of transfer of technological knowledge. Results revealed that learning and development and structural attachment significantly impact the extent of technological knowledge transfer from foreign partners to IJV in Uganda. Results also indicate a non significant relationship between communication behavior, structural attachment, creativity and flexibility and management support and the extent of technological knowledge transfer. Based on the findings, this study calls for concerted efforts on the part of the Government of Uganda to provide a policy and legal framework that will guide the acquisition and adaptation (our term for knowledge transfer)of technological knowledge from foreign partners. The study is very useful because it brings out differences in current thinking, contributes to current discussions, arouses interest to the broader audience and proposes solutions for remedying alleged deficiencies that are in line with current theories.
References
[1] Ahuja, S. (2000). Collaboration networks structural holes and innovation: a longitudinal study.
Administrative Science Quarterly, 45, 425-455. [2] Almeida, P. (1996). Knowledge sourcing by foreign multinationals: Patent citation analysis in the U. S
semiconductor industry. Strategic Management Journal 17 (winter special issue), 155 - 165. [3] Argote, L. (1999). Organisational learning: creativity, retaining and transferring knowledge. Boston:
Kluwer Academic. [4] Argote, L., Beckman, S. L, & Epple, D. (1990). The persistence and transfer of learning in industrial
settings. Management Science, 36, 140-154. [5] Baum, J.A. C., & Ingram, P. (1998). Survival-enhancing learning in the Manhattan hotel industry, 1898-
1980. Management Science, 44, 996-1016. [6] Blau, P. M. (1964). Exchange and power in social life. New York: Wiley. [7] Bloodgood, J. M., & Salisbury, D. W. (2001). Understanding the influence of organisational change
strategies on information technology and knowledge management strategies. Decision Support Systems, 31, 55-69.
[8] Bochel, B., Prange, C, Probst, G. & Ruling, C. (1998). International joint venture management: Learning to cooperate and cooperating to learn. Singapore: John Wiley.
[9] Cohen, W. M. & Levinthal, D.A. (1990). Absorptive capacity: A new perspective on learning and innovation. Administrative Science Quarterly, 35, 128-52.
[10] Cole, G. A. (2001). Management Theory and Practice. London: Educational Law. [11] Dahlan, N., Ramayah, T., Karia, N., Fun, S. W., Asaari, M.H, (2005). Success factors on intra-
organizational knowledge transfer. Paper presented at IRMA Conference. [12] Damanpour, F. (1996). Organizational complexity and innovation: Developing and testing multiple
contingency models. Management Science, 42 (5), 693 - 716. [13] Darr, E. A., Argote, L.& Epple, D. (1995). The acquisition, transfer and depreciation of knowledge in
service organizations, productivity in franchises. Management Science, 4, 1750-1763. [14] De Wulf, K; Odekerken-Schroder, G; Van Kenhove, P (2003). Investments in consumer relationships: a
critical reassessment and model extension. International Review of Retail, Distribution and Consumer Research 13 (30 245–256.
Contact authors for the full list of references

2046
Reconsidering Platform Strategies in the Vertical Interfirm Division of Labor: The Platform Strategies in the Chinese and Japanese Mobile Phone Handset Industries
Jing Ming Shiu
The University of Tokyo, Japan Masanori Yasumoto
Yokohama National University and The University of Tokyo, Japan Abstract The study attempts to elucidate the determinants of multi-layer platform strategies along the vertical interfirm division of labor for product development drawing on the cases of the Chinese and Japanese mobile handset industries. Firms could devise and exploit their proprietary platform designs in pursuit of both product development efficiency and product diversification. Yet, the global surge of product modularization encourages the product development in open interfirm networks. Particularly semiconductor vendors, which integrate product functions on chipsets, are reported to drive the transition. Meanwhile, the study highlights the vertical interfirm division of labor due to the differ ence in required development capabilities between core chipsets and circuit board designs. The vertical interfirm process is not sufficiently open until the chipsets and/or boards each are arranged in the form of technological and/or product platforms. These findings designate that effective product platform strategies resides in the management of vertical interfirm process: vertical architecture. Introduction In the past decade, the vertical disintegration of product development and manufacturing activities has drawn our attention to interfirm modularity (e.g., Chesbrough, 2003; Christensen, Verlinden, and Westerman, 2002; Sturgeon, 2002). Product modularity, which is based on standardized product design rules and elements, enables manufacturers to decompose complex problem-solving into a set of localized problem-solving steps (Baldwin and Clark, 2000). The shift to modular product architecture has even enhanced interfirm modularity. Specialized vendors each cover specific component/technology development activities while manufacturers focus on product design and manufacturing activities.
The vertical disintegration of product development has shaped the global open interfirm product development networks, so that even emergent firms could rapidly develop products at a relatively low cost by adopting element technologies from specialized vendors. For instance, wireless handset manufacturers in China make use of the interfirm modularity in which specialized vendors provide element technologies (i.e., wireless cores/platforms, components, handset designs, software, etc.) to help handset manufacturers quickly release a variety of new models.
Amongst a variety of element technologies, a technology platform, which consists of the wireless chipset, software, reference product design, and related technological supports for the product concerned, plays a critical role to shape the open interfirm networks (Iansiti, 2003; von Hippel, 2005). The technology platform provides a standardized product design to realize a set of core product functions. Manufacturers may easily develop products by using the platform in open product development networks.
However, standardized element technologies such as a technology platform could be transferable and/or shared between firms, so that these technologies would not necessarily secure firms’ competitiveness (Pil and Cohen, 2006). The availability of a technology platform in open product development networks is liable to cause harsh competition, which requires firms to pursue product variety. Thus, assembly product firm relying on interfirm modularity is further required to struggle to both quickly develop a variety of products and distinctive products in the competition (e.g., the Chinese industries).
In carries on both product variety and distinctiveness, a firm attempts to design proprietary product platforms. A product platform is a set of subsystems and interfaces that forms a common structure from which a firm

2047
can efficiently develop a stream of derivative products (Meyer and Lehnerd, 1997). For automobiles, a product platform is generally defined by a combination of chassis, engine, drive train, transmission, and other major subsystems upon which a variety of different models can be based (Nobeoka and Cusumano, 1997). Product platform development requires the architectural knowledge to properly arrange various elements on a platform design particularly when new technologies are introduced into the product platform. Thus, even in interfirm open networks, firms for themselves need to integrate various technologies into products paying sufficient attention to both the uneven changes of various components and the interdependencies between them (Brusoni & Prencipe, 2001; Staudenmayer, Tripas, and Tucci, 2005).
The industrial shift toward interfirm modularity seems to blur the role of close coordination within and between firms, which were once regarded as one of the most critical factors of effective product development (e.g., Japanese automobile firms, Clark and Fujimoto, 1991; Yasumoto and Fujimoto, 2005). In digital electronics industries, open interfirm networks have threatened assembly product manufacturers, which have accumulated both the architectural and component knowledge on their products in close coordination within and between firms. Yet, even in the open interfirm networks of the vertical interfirm division of labor, it would be difficult to develop a novel technology platform into a distinctive proprietary product platform without interfirm collaborations.
Many of past researches discuss product platform designs in terms of the intrafirm perspective view. Meanwhile, we attempt to explore how to design product platforms in the interfirm context of the vertical interfirm division of labor. More specifically, the study will examine how assembly product manufacturers develop external new technology platforms into proprietary product platforms in the collaborative relationships with technology platform vendors. The study would contribute to not only elucidating the role of the interfirm collaborations in open interfirm networks but also drawing the competitive product development strategies in the era of vertical disintegration.
In the section 2, we will review past researches to propose our perspectives. In the section 3, we attempt to consider the generality of successful designing of product platform drawing on three cases: a mobile phone handset manufacturer in Japan, an ODM in Taiwan and a design house in China. In the section 4, we will discuss the results of the comparative study between these cases. Finally, in the section 5, we will present some implications for product platform design of electronic products and show future research issues. Research Perspective The standardized knowledge of product technologies (i.e., open technology platforms), which is independent of firm/product-specific contexts, enhances the open interfirm division of labors for assembly product development. In spite of the openness of technology platforms, each specific product development is context-dependent. Product developers need to not only develop distinctive products but also quickly yield a variety of products in the harsh competition according to open interfirm product development networks (Christensen, Verlinden, and Westerman, 2002). These conflicting requirements encourage product developers to establish proprietary product platforms to achieve both product distinctiveness and variety.
A product platform design needs to cope with both market and technological changes. For instance, the lifecycle of software products are short, software firms need to redesign the product platforms for the next generation of software product development (Cusumano, 2004; MacCormack and Verganti, 2003). The successful product platform development needs a proper organizational coordination within and between firms (Robertson and Ulrich, 1998).
The perspective of “product architecture” explicates the necessity of organizational coordination. Product architecture is characterized in a spectrum from the “modular” to the “integral” according to the “interdependency of functions and components (Ulrich, 1995).” The development activities for integral architecture products are hardly decomposable into independent element development activities as the interdependency of functions and components is relatively high. In contrast, modular architecture products are characterized with the lower technology interdependency of functions and components, so that product designers can easily divide the development activities into relatively independent element development activities. Thus, the coordination between the development

2048
activities of product platforms depends upon the architectural attributes of the platforms (Meyer and Lehnerd, 1997; Sanderson and Uzumeri, 1997).
Modularity is attributed to the architectural stability. The stability enables firms to refurbish modular products by realigning or replacing a part of element technologies without changing the architectural configurations of elements. Yet, even the product development based on interfirm modularity is accompanied by the coordination between product elements (Staudenmayer, Tripas, and Tucci, 2005). Particularly drastic element technology change may cause architectural instability to erode the decomposability between product designs and elements, and thus would enhance collaborative problem-solving within and between firms (Iansiti, 1997; Takeishi, 2002).
High technological uncertainty with new technology introduction sometimes causes the lack of architectural knowledge (Yasumoto and Fujimoto, 2005). Novel core technologies cause high technological uncertainty as the introduction of such technologies may lead to the interdependent changes of functions and components. The technological change will force firms to abandon their accumulated architectural knowledge which defines the interdependency between functions and components.
When technological system is static, open transactions between related firms could serve as a forum for product development. Yet, the cost of creating and maintaining interface standards will be prohibitively high as technological systems are rapidly changing. The logic makes us infer that when adopting novel core technologies, product developers should build information channels to monitor technological changes and have intensive contacts with external specialized vendors. The product development capabilities based on the close collaboration foster the knowledge exchange/sharing (Clark and Fujimoto, 1991; Iansiti, 1997; Takeishi, 2002), which shapes architectural knowledge. Thus, a product platform development accompanied by novel technology platform introduction will necessitate close interfirm coordination even in the vertical interfirm division of product development.
In electronic product industries, a firm attempts to integrate many functions into a product. The continuous improvement of the advanced technology of semiconductor process enhances the innovation for the convergence of functions. On the other hand, specialized chipset vendors (i.e., technology platform vendors) offer technology platforms as nearly total solutions that encapsulate many of product functions into a chip. The progress of function encapsulation built inside System on Chip (SOC) continuously redefines the architectural interdependencies of functions and components. Product developers should pay attention to the changes of the interdependencies in order to effectively renew their product platforms. Such changes resulting from technology platform renewals should call for close interfirm collaborations between technology platform vendors and product developers even in open interfirm product development networks. Case Study Research Focuses and Data Collection The study focuses on the proprietary product platform development in the mobile phone handset industries in Japan, Taiwan, and China. Handset developers in any of these countries have increasingly exploited external technology platforms from vendors though the level of the vertical disintegration of handset development may differ by countries. Any of handset developers may shape proprietary product platforms based on standardized technology platforms. Yet, several prominent handset developers collaborate with technology platform vendors in both technology and product platform developments even in the open interfirm networks.
According to Funk (2002; 2004), in the period from 1994 to 1998, mobile phone handset manufacturers focused on not only product quality but also the variety. He indicated that by offering a variety of mobile phone handsets more than Ericsson and Motorola, Nokia acquired the biggest market share among them. In the initial time of the 2G mobile phone handset industry, manufacturers internally developed mobile phone handsets including core components. However, in the end of the 1990s, many specialized vendors started to offer core components or solutions to mobile phone handset manufacturers. The vertical disintegration occurs in the mobile phone handset industry according to the change raised a new issue to mobile phone handset manufacturers: how to effectively cooperate with external specialized vendors into mobile phone handset development.
The perspective in the previous section makes us infer that the interdependency of technology platform and product platform designs have critical impacts on the coordination between handset developers and vendors. The

2049
interdependency technologies interact with each other. Handset developers’ product platform development would rely on the coordination. The interdependency may often occur in handset platform development even though vendors provide standardized technology platforms to define the interrelations between handset components.
After product functions are defined, product designers translate them into specifications and start to decide which function can be implemented by particular component. Sometimes a function should be implemented by various components. For instance, in the development of the MP3 music function, designers should consider the memory size for storing, the alternative technologies for playing (i.e., software or hardware), the modification of the play settings during calling-in, and other usages of user. These problems require handset developers to consider the NAND memory (hardware), Based Band chip (hardware), Operating System (software), User Interface (software) and other related components so that the MP3 function is achieve by the compatibility between these components. Technology platforms which may relate these elements to the MP3 function could be redeveloped or modified in the process. Such interdependency will encourage the coordination between handset developers and technology platform vendors.
The study sheds lights on how handset developers collaborate with technology platform vendors in handset product platform development. At first, the case attempts to outline the interfirm handset development networks. Following the description, we examine the critical product development capabilities in the networks, which are common to relatively competitive handset development firms, drawing on the cases of handset developers in these regions.
The data of handset development was collected by semi-structured interviews from 2005 to 2007 in China, Japan, and Taiwan. More than 50 firms, which included handset manufacturers, mobile service carriers, wireless core chip vendors, software vendors, component vendors, and design houses, were involved in the study. We focus on a relatively competitive handset developers in each country, who develop proprietary handsets exploiting the close collaborations with technology platform vendors. We also make use of the information appeared in published journals and reports. Technological Structure of Mobile Phone Handset and Vertical Interfirm Division of Labor The technological structure of mobile phone handset is divided roughly into ‘communication part’, ‘signal processing part’, and ‘External I/O part’. ‘Communication part’ implement telecommunication function received from electric wave by antenna etc. and cover the signal to digital data to ‘signal processing part’. ‘Signal processing part’ has its own CPU for controlling all the system which liked INTEL in PC. Finally, ‘External I/O part’ controls each inputs and outputs of source of information from every components, liked display panel, key pad, and others. Finally, these parts are laid out to be a Printed Circuit Board (PCB), which is a terminal main body of mobile phone handset. The display, the key, and the digital camera, etc. are main devices in the circuit of the terminal main body.
In our concern, we choose the ‘signal processing part’ to be mainly analysis, because this part plays the role as the center of the mobile phone handset. In this part, there is a Base Band chip(BB chip) that controls signal and the communication processing. However, recently, the multimedia function has come to be valued in the mobile phone handset. Therefore, the BB chip become not only process the telephone calling function but also executes the multimedia function, liked MP3, high quality of camera imaging, games, video playing, touch panel screen, Global Position System(GPS) and so on. These value added GSM mobile phone handsets have been called feature phone, smartphone, and PDA phone and to fit each market segment. As the various functions required in a mobile phone handset, the development man-hour of software also has been rapidly increasing. These applications, firmware, operating system (OS) software should be designed and assured according to hardware components. Smartphones and PDA phones often use Windows, Linux, and Symbian OS to control the entire system including hardware component drivers, communication, application, and others. Feature phones use the Real Time Operation System (RTOS) that has real time of switching each task at several ten-micro second for controlling the entire system. Usually, these OS are offered to mobile phone handset manufacturers by IC chipset venders together with chipsets.
As multimedia functions have increased in a mobile phone handset, BB chip vendors should consider the product architecture for designing mobile phone handset. Because of advanced semiconductor process technology, BB chip vendors can design powerful BB chips to execute multimedia functions. Furthermore, between BB chip vendor and mobile phone handset developer, there is not a simple buyer-supplier relationship, but a closed relationship with each other. Otherwise, because a BB chip is not a passive component, which received signal and

2050
reactive only, and these passive components are almost standard, that can be purchased from the IC catalogue list of chip vendor.
On the contrary, the design of a BB chip will need system-level knowledge of mobile phone handset, and sometimes need to cooperate with operator if the telecommunication technology is advanced. For instance, Qualcomm cooperates with Japanese Operator ‘au by KDDI’ closely to implement its own telecommunication standard and advanced service based on their advanced technology of BB chips (Inagawa,2006). Because the BB chip can implement the various functions, the developer of mobile phone handset will need to understand the interdependencies of the chip with other components. Learning the interdependencies will become more difficult if BB chip vendor change their design of BB chip that will cause interdependence of other components. According to Clark (1985), we can consider that such innovations in core component design represent a movement ‘up the system hierarchy’ and, sometimes, represent revolutionary changes where system foundations are built afresh.
As we described before, when 2G started booming, Nokia and other major manufacturers tended to handle BB chip and software(RTOS, protocol stack, power management, wireless interface, and UI, etc.) and combine them with other devices for designing product platforms. On the contrary, the Japanese manufacturers also develop these components for themselves but did not design product platforms. While specialized chip vendors(TI, ADI, Philips (present NXP), Qualcomm, etc.) started to offer BB chips from the end of 1990’s, both in 2G and 3G, most of Japanese manufacturers adopted BB chip from outside. Nowadays, most of the mobile phone handsets are using advanced 3G telecommunication technology and developing mobile phone handset based on operators’ services requirement. In Asia, especially in Taiwan, PC manufacturers started duplicate their successful ODM business model for mobile phone handset. They follow the specifications from Motorola, Sony Ericsson, and so on, and develop the detail specifications of their mobile phone handsets. Otherwise, they also elaborate their procurement capability of components and advantage of economies of scale for that Ultra Low Cost (ULC) mobile phone handset outsourced from Motorola, Sony Ericsson and so on.
Finally, China mobile phone handset industry can be regarded as a divergent path of upgrading which is while export growth has been overwhelmingly led by multi-national corporations, increasingly fierce competition in the domestic market ignited by the advent of local mobile phone handset manufacturers have induced unique industrial evolution in the manner of backward linkage effects : (1)outgrowth of design houses specialized in mobile phone handset development and (2)emergence of IC fabless ventures that design core ICs for mobile phone handset. The emergence and evolution of China’s mobile phone handset industry is likely to have international implications as the growth of the global demand for low-cost and multi-function mobile phone handsets is expected to accelerate(Imai and Shiu,2006). There are several types of mobile phone handset development in vertical interfirm division of China mobile phone handset industry, in the case of design house, they only focus on design and rely on the EMS’s volume production(Marukawa, Yasumoto, Imai, and Shiu,2007). Here we choose the design house as analysis because of their benefits of sales are higher than local mobile phone handset manufacturers. The benefits of design house roughly come from design fee which follow customers’(mobile phone handset manufacturers) requirements or specifications. Another benefits come from the PCBA(Printed Circuit Board Assembly) which means design house offer a PCB which components has been mounted on, and this part of benefits have been increasing for design house compared to design fee. In the case of PCBA business model, design house licensed BB chip from external BB chip vendor and provide a list of product functions for their customers. After their customer decide which functions are necessary, design house started to select their pre-verified components to develop a PCBA. Compared to design service by customer’s specifications, PCBA business model needs to do some market research by themselves for their understanding what are the functions will be required in future. In the fast changing market, shorten product life cycle, design house will face the high uncertainty in the PCBA business model. So, in our research, we will take PCBA business model as analysis to find out what is the successful factor for designing product architecture.
In sum, although in the following 3 cases, they implement the same procedure of mobile phone handset development including (1) product definitions, (2) product design, (3) pilot production and review, (4) testing, acquisition of compulsory certification, (5) preparation for volume production (FIG. 1), however, there are different levels of uncertainty from market when they define their product functions and design their product architecture. At PCB level, we can distinguish different levels of market uncertainty influence between Japan, Taiwan, and China.
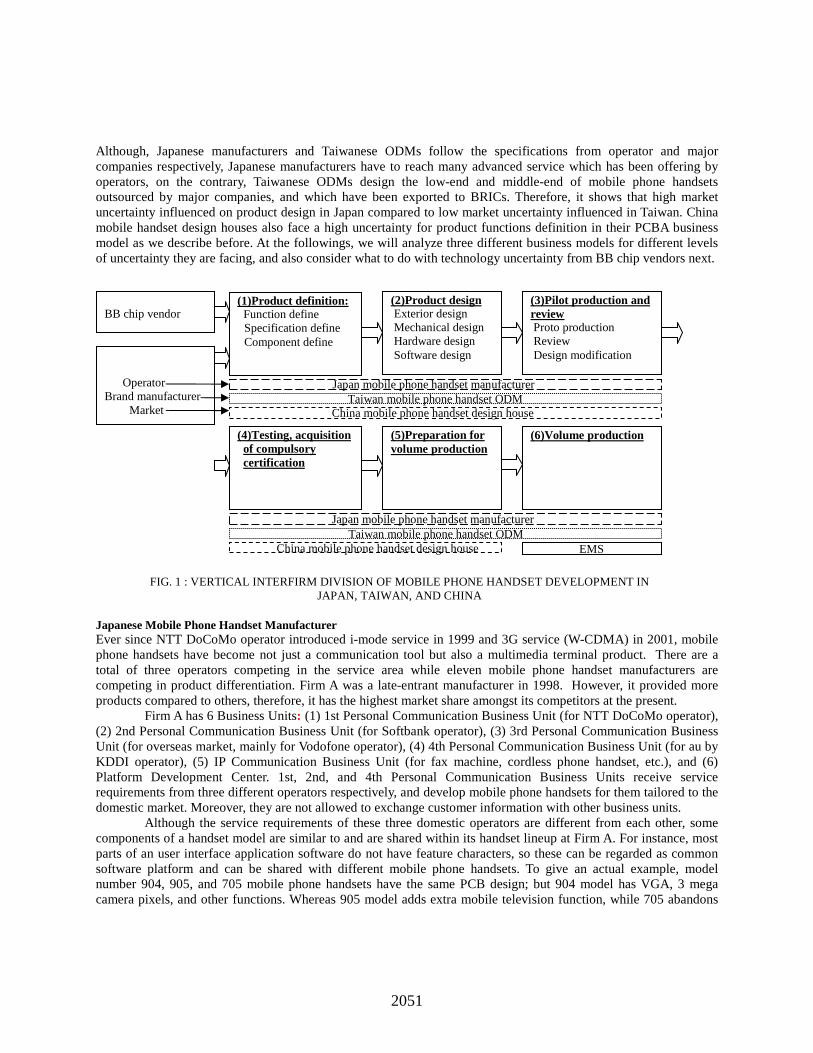
2051
Although, Japanese manufacturers and Taiwanese ODMs follow the specifications from operator and major companies respectively, Japanese manufacturers have to reach many advanced service which has been offering by operators, on the contrary, Taiwanese ODMs design the low-end and middle-end of mobile phone handsets outsourced by major companies, and which have been exported to BRICs. Therefore, it shows that high market uncertainty influenced on product design in Japan compared to low market uncertainty influenced in Taiwan. China mobile handset design houses also face a high uncertainty for product functions definition in their PCBA business model as we describe before. At the followings, we will analyze three different business models for different levels of uncertainty they are facing, and also consider what to do with technology uncertainty from BB chip vendors next.
Japanese Mobile Phone Handset Manufacturer Ever since NTT DoCoMo operator introduced i-mode service in 1999 and 3G service (W-CDMA) in 2001, mobile phone handsets have become not just a communication tool but also a multimedia terminal product. There are a total of three operators competing in the service area while eleven mobile phone handset manufacturers are competing in product differentiation. Firm A was a late-entrant manufacturer in 1998. However, it provided more products compared to others, therefore, it has the highest market share amongst its competitors at the present.
Firm A has 6 Business Units: (1) 1st Personal Communication Business Unit (for NTT DoCoMo operator), (2) 2nd Personal Communication Business Unit (for Softbank operator), (3) 3rd Personal Communication Business Unit (for overseas market, mainly for Vodofone operator), (4) 4th Personal Communication Business Unit (for au by KDDI operator), (5) IP Communication Business Unit (for fax machine, cordless phone handset, etc.), and (6) Platform Development Center. 1st, 2nd, and 4th Personal Communication Business Units receive service requirements from three different operators respectively, and develop mobile phone handsets for them tailored to the domestic market. Moreover, they are not allowed to exchange customer information with other business units.
Although the service requirements of these three domestic operators are different from each other, some components of a handset model are similar to and are shared within its handset lineup at Firm A. For instance, most parts of an user interface application software do not have feature characters, so these can be regarded as common software platform and can be shared with different mobile phone handsets. To give an actual example, model number 904, 905, and 705 mobile phone handsets have the same PCB design; but 904 model has VGA, 3 mega camera pixels, and other functions. Whereas 905 model adds extra mobile television function, while 705 abandons
BB chip vendor
Operator
Brand manufacturer Market
(1)Product definition: Function define Specification define Component define
(2)Product design Exterior design Mechanical design Hardware design Software design
(3)Pilot production and review Proto production Review Design modification
(4)Testing, acquisition of compulsory certification
(5)Preparation for volume production
(6)Volume production
EMS
Japan mobile phone handset manufacturer Taiwan mobile phone handset ODM
China mobile phone handset design house
Japan mobile phone handset manufacturer Taiwan mobile phone handset ODM
China mobile phone handset design house
FIG. 1 : VERTICAL INTERFIRM DIVISION OF MOBILE PHONE HANDSET DEVELOPMENT IN JAPAN, TAIWAN, AND CHINA
2052
high performance in exchange for a slimmer body. However, in order to share these common components with other various mobile phone handsets developed by the business units, Firm A has established ‘Platform Development Center’. This ‘Platform Development Center’ develops common software (the basics of protocol stack, user interface, mailer, browser, etc.) and hardware (display panel, camera module, etc.) that are to be shared, and also manages these common components as libraries with clear specifications and definitions.
The 1st, 2nd, and 4th Personal Communication Business Units also use three different technology platforms respectively for developing mobile phone handsets. When adopting a technology platform for developing mobile phone handsets, technological uncertainty constantly rises. Because technological uncertainty causes unexpected yet unclear software bugs, a long debug process is always required. Without practical usage experiences, a new technology platform includes various unexpected bugs during the development stage of a chipset. Moreover, a technology platform which performs advanced multimedia functions also has compatibility problems with software and hardware components. For example, when Firm A began to use a technology platform that is composed of an NEC-Panasonic BB chip and a TI OMPA application processor to design 900i series mobile phone handsets, they made an effort to debug. Even though Firm A referred to the development board and product design offered by NEC, Panasonic, and TI, it did not secure the right information on the condition of the technology platform. From this experience, they concluded that it was necessary to cooperate with technology platform vendors closely in order to put the required knowledge on the core chipset.
Afterward, Firm A joined the core chipset development project with DoCoMo, Renesas, Fujitsu, and Mitsubishi in 2006. In this project, they developed a comprehensive mobile phone handset platform combining a single-chip LSI for dual mode mobile phone handsets supporting HSDPA/W-CDMA and GSM/GPRS/EDGE. They also developed core software such as operating systems. The new technology platform will help DoCoMo to accelerate their global adoption of W-CDMA services, and to lower the cost of these handsets for mobile phone handset manufacturers at the same time.
This technology platform is built on the previously developed single-chip LSI technology, which is a combination of a BB chip and an application processor; a processor for dual-mode W-CDMA and GSM/GPRS phones from DoCoMo and Renesas since July of 2004. The jointly developed technology platform adds new functions, such as support for HSPDA and EDGE technologies, and full development support including OS, middleware, and drivers. This technology platform also can serve directly as a base system for W-CDMA handsets, and eliminates the need for mobile phone handset manufacturers such as Fujitsu and Mitsubishi to develop separate systems for common handset functions, thus significantly reducing time and cost of development. If the technology platform is further spread and adopted, a further cost reduction of the mobile phone handsets will also be expected.
By joining this cooperation, Firm A can propose their IP (Intellectual Property) into the core chipset and receive royalty fees. Moreover, Firm A also has the benefits of time-to-market compared to its competitors. Usually, a technology platform vendor offers development board and reference design as technical support for saving product development lead time. However, on the contrary, Firm A used to believe that relying on these development supports deeply would not help them understand the interactivity among components. Furthermore Firm A also mentioned that in the past, they did not have such experience in designing core chips while other competitors had, so it was difficult for them to find out problems or to create something new by themselves. As a result, ‘1st Personal Communication Business Unit’ and ‘Platform Development Center’ are mainly responsible for the core chip development project. ‘Platform Development Center’ also verifies the compatibility of components related to the core chipset. Taiwanese Mobile Phone Handset ODM The starting point of Taiwanese mobile phone handset industry was approximately 1994 when BenQ began developing mobile phone handsets. In 2000, PC ODM such as Quanta Computer, Compal Electronics, Inventec, and Arima computer simultaneously began production of mobile phone handsets by investing in their mobile phone handset subsidiaries or in-house divisions. Between 2001 and 2004, Chi-Mei group, Hon Hai Precision Ind., High Tech Computer, Asustek Computer, Mitac International, Wistron, and Gigabyte Technology also entered the market actively. Some companies developed their own brand mobile phone handsets while some duplicated the ODM business model of PC to mobile phone handset business.
Firm B entered the mobile phone handset industry in 1999 and has become the biggest ODM of mobile

2053
phone handset in Taiwan. It receives specifications from Motorola and Sony Ericsson, and then shape detailed mobile phone handset designs and manufacture them. Nowadays, Firm B has 7 product development teams for developing 2G, 2.5G and 3G handsets. In 2006, mobile phone handset models were developed under several different technology platforms including 2G chipset such as, Calypso and LoCosto from TI; and 3G chipset from Qualcomm. In 2006, Firm B used Calypso and Locosto to develop 2~3 product models and 6 derivative models. In its R&D division, ‘New Product Development Team’ keeps surveying on several different technology platforms and propose to their customers to replace present core chips if these technology platforms perform better and show cost advantage.
Firm B develops software (i.e., device drivers, firmware, games, melody, phone address book, file management, MP3 drivers, etc.) for executing multimedia functions or for integrating some other IC chips (i.e., Bluetooth, NAND memory, melody IC, image sensor, etc.) from 3rd parties. However, when they adopt a new TI’s chip for developing mobile phone handsets, they face high technological uncertainty. For instance, at the initial time of adopting one technology platform, they found that there were more than 10,000 software bugs and 1,000 hardware bugs. The reason was that TI could not expect the usage of customers, such as mobile phone running out of battery if it were used to take pictures. Firm B emphasized that in order to overcome these problems, it enhanced their debugging capability by hiring more Quality Assurance Engineers 3 years ago. Furthermore, Firm B also cooperates with TI and became a α site customer of TI. Since the release of LoCosto’ engineering samples in 2005 by TI, Firm B have exerted an effort on debugging capability for their new core chip. Firm B has system-level experience that is similar to the usage of customers, so TI can get feedbacks and continuously upgrades their version of the core chip. On the other hand, through this cooperation Firm B also acquired knowledge regarding the core chip faster than other competitors did, and this also contributed to the saving of the lead time for its mobile phone handset development. Chinese Mobile Phone Handset Design House Beginning in the 90’s, mobile telecommunication service industry started a worldwide full-fledged growth. The trend soon spread to China. Driven by the surge demand both from the world and from its domestic market, China’s mobile phone handset industry has exhibited a spectacular growth since the late 90’s. Export and domestic consumption rose almost parallel until 2003, after which the latter became more or less flat. In 2005, around 75 percent of handsets produced in China were exported. Although local mobile phone handset manufacturers turn increasingly outward-looking recently, multi-national companies altogether still contribute to close to 95 percent of its total export. When we turn our eyes to the domestic market, however, a strikingly distinct picture could be seen. Stating from just around 5 percent in 1999, local brands’ shares increased radically until 2003, when China’s official media triumphantly announced that Chinese mobile phone handset makers had captured more than 50 percent of the domestic market; then almost all of a sudden came the reversal. Since 2004, a majority of local mobile phone handset manufacturers slid into a retreat, which continued until early 2006.
Because of the increasingly heated competition in the domestic market, the advent of local mobile phone handset manufacturers to induce organizational or technological innovations where strong cost sensitivity and enduring quests for novelty coexist has been ignited. These domestic-competition-induced innovations, as we call them, may have international implications as global demand for low-cost and multi-function mobile phone handsets is expected to grow in coming years. According to (Marukawa, Yasumoto, Imai, and Shiu, 2006), there are many phone models in the market, but the number of sales for each model is small. For instance, it is necessary to aim at one million units by the number of sales of one model in Japan, but in China, if 200,000 units were sold, profit would be paid. Therefore, it is thought that the development cost put on one model is far greater in China than in Japan.. In Japan, the life cycle of a model is 6 months, but in China there is no rule on the life cycle of a model. On average, the life cycle of a model is 9 months, but sometimes there would be a model that keeps selling for two years. Recently, a phenomenon can be observed is that if a manufacturer can not release derivative models every month, a fall in its market share would shortly follows.
The domestic market share of a local mobile phone handset manufacturer reaches approximately 50% in 2003. Despite that, its market share has changed radically that it is experiencing a descent. In 2006, even with the achievement on financial affairs, the improvement is still lesser in market share compared to major foreign companies such as Nokia and Motorola. However, the design house industry has not fallen in as extremely as the

2054
local mobile phone handset manufacturers. According to a U.S. research company, iSuppli’s investigation, there are about 50~60 design house companies in China, and it is expected that the products that the design house design will account for 50 percent or more for the volume of shipment of the local mobile phone handset manufacturers. In addition, the top 5 design house companies account for 70 percent of the mobile phone handset design market. The major design house has the ability to implement all processes of the mobile phone handset design composed of the circuit, software, the mechanism, and externals (i.e., case). Moreover, this major PCBA business model is based on its own independent marketing research and then provides solutions to the customers. However, this type of business model has been gradually adopted by other design houses.
It is a conformational change of the chipset market to be changing the business environment for design house companies in China greatly in recent years. Design house companies mainly procured chipset from Europe and America venders such as TI and Phillips until 2004. However, the Taiwanese IC chipset vendor Mediatek suppressed the license fee at about the end of the same year and started to release their new chipset. The adoption with the design house began to extend. As a result, the market share of Mediatek has been increasing radically that it exceeded TI’s market share, and reached about 40% in 2006 (Merrill Lynch,2006).
Compared to the TI’s technology platforms, Mediatek’s technology platforms had more powerful performance on executing multimedia functions. In other words, Mediatek’s technology platforms integrated various multimedia functions such as Bluetooth, camera, etc. more than TI chipset did. However, their new technology platform contained a lot of technological uncertainty. Design house companies did not adopt it except that of Firm C. Firm C believed that Mediatek’s technology platforms would fit the requirements of the market, and began to adopt it since the end of 2004.
Firm C emphasized that a successful mobile phone handset development should match the needs of the market concerned with available related technologies. Firm C mentioned that when they observed a selling point in the market, various divisions including sales division and R&D division would be organized to form a ‘Project Research Committee.’ In other words, these members from each division can give different technology perspectives, market perspectives, or operator perspectives into the discussion on the possibility of commercialization. If the possibility were high, they would start to develop. Unlike other major mobile phone handset manufacturers, ‘Project Research Committee’ in Firm C was not a permanent organization for deepening technology and researches, but mainly for analyzing technical trend and market requirement.
Developing a chipset takes 10 months or more. Firm C cooperates with Mediatek for 6th months. At the time, the chipsets are developed though did not arrive for the mass production test. At this stage, Firm C gives market information to Mediatek on what the architecture of the product would be. Afterward, Mediatek and Firm C decide the interdependencies of other components at system level. Because Firm C has much experiences in contacting customers, they became an important α site customer for Mediatek. The α site customer of Mediatek’s 6217,6218, and 6219 chipset in Taiwan was a design house Darts that was invested by Mediatek before 2004. However, two development teams of Darts have been pulled out to ARIMA and Foxconn respectively. After 2004, Mediatek started to work with Firm C closely to develop 6226,6228, and 6229 chipsets.
In the close cooperation with Mediatek, Firm C has encountered various problems and managed to solve them in early stages since the kick off of the project. In the early problem-solving stage, they verified compatibility and debug not only Mediatek’s chipset but also other components or devices in a laboratory test. The problems of compatibility might be unexpectedly brought up, so it was necessary to fine-tune the settings between Mediatek’s chipset and the components or devices such as image sensors, Flash memory, software drivers, etc. Firm C emphasized that by cooperating with Mediatek, they would acquire knowledge on the interdependencies among components. Moreover, they also pointed out that this cooperation saved the product development lead time and accumulated knowledge on product platform design. As a result, in 2006, Firm C successfully developed nearly 50 types of product platforms, which each used several Mediatek technology platforms. To this date, the amount of mobile phone handsets (i.e., customers) which have been developed by their product platform has exceeded 100 types.

2055
Discussion The communication standards, national factors, and business models may differ between Japan, Taiwan and China. Nevertheless, we observed that the Japanese firm A, Taiwanese firm B and Chinese firm C all faced high technological uncertainty when they adopted new core chipsets. According to our interviews, they also emphasized that the technological uncertainty could be reduced by close cooperation with core chip vendors.
The firm A collaborated with DoCoMo, Fujitsu, Mitsubishi and Renesas to develop a technology platform based on a highly integrated core chipset. DoCoMo intended to establish a common technology platform to accelerate its services. In the past, DoCoMo only cooperated with the chip vendor: Renesasa. Recently Fujitsu, Mitsubishi and the firm A are enrolled in the project. The common technology platform will enhance the benefits of economies of scale. However, the firm A also pointed out that they can learn the characters of core chip and interdependencies among components through the project.
In the case of the firm B and C, they all collaborated with core chip vendors exchanging information with each other. They also emphasized that they solved problems earlier than other competitors by testing their core chipsets and related components and debugging software problems through the collaborative processes with these vendors.
The firm A, B and C represent the leading position in each country’s mobile phone industry respectively, so that the cooperation with core chip vendors is considered as a natural result. However, when we turn our eyes to the Chinese local mobile phone handset manufacturers and design houses, they also show the same perspective, ”the cooperation with core chip vendors will contribute to their product development.” Some of them attempt to be an α site customer while others want deeper cooperation with core chip vendors. For instance, one of the major design houses, Techfaith, established in 2002, mentioned that the firm established a joint venture with a core chip vendor, Qualcomm, in 2006 as the multimedia will be more value-added in the future. A local mobile phone handset manufacturer, AMOI, provides another emblematic case. The firm has been in cooperation with a local IC core chip vendor, Spreadtrum, to develop the Chinese 3G standard TD-SCDMA mobile phone handsets. Moreover, AMOI also worked with Spreadtrum to design GSM/GPRS mobile phone handset, and thereby took the biggest market share in the local made mobile phone handset market in the beginning of 2007. These cases show that, in general, a simple buyer-seller relationship is not proper to related firms especially when technological uncertainty is high.
However, the limited technical support resources encourage core chip vendors to concentrate on a handful of main customers. Our interviews with the Chinese local mobile phone manufacturers and design houses since 2005 provide some evidences. The interviewees all emphasized that, in their handset development projects, sometimes it is difficult to identify where the problems come from and cannot solve them without technical support from core chip vendors. As a result, these problems always delay their product development. A design house, established in 2005, pointed out that it is necessary to be an α site customer of Mediatek not only because the firm can receive lower sell prices but also because the firm could develop their handsets with the latest core chipsets quicker than competitors. However, the firm also emphasized that design capabilities and customer experiences are indispensable for the cooperation with Mediatek.
Past researches indicated that interfirm modularity seems to blur the role of close coordination within and between firms, which were once regarded as one of the most critical factors of effective product development (Clark and Fujimoto, 1991; Yasumoto and Fujimoto, 2005). Takeishi (2002) suggested that boundary spanners or gatekeepers enable intra-firm product developers to acquire external complementary knowledge. Yet, our cases show that bilateral close communication channels between handset developers and technology vendors should be also indispensable when technologies change rapidly. Technologies have the attribute of a “system” in nature (Winter,1987): technologies are embodied in multi-components and interrelated to each other. A set of components together is integrated to provide utilities for customers. The system performance is dependent not only on the performances of individual components but also on the extent of the mutual compatibilities between them (Henderson and Clark, 1990).
In our research, we found that a firm which designs product platforms can be regarded as a system integrator plays the role to deal with the interrelationships between technologies at the product system level. In the

2056
case of the firm A, the specialized platform development center examines components in order to secure high compatibilities between specific core chipsets and common components shared between handset development units. The firm C closely cooperated with core chipset vendor, Mediatek, so that the firm pre-verifies the compatibilities between core chipsets and components.
These cases show that system integrators execute two functions in interfirm product development networks. First, the integrators provide solutions to support product development activities. These solutions reduce technological uncertainty which product developers face in the process of aligning a variety of components from core chip vendors and different 3rd parties. Second, these integrators play the role to maintain the integrity of the systems concerned in case that the systems’ performance slippages (Garud and Kumaraswamy, 1995) could occur due to the incompatibilities created by the technological change of core component.
In the vertical interfirm division of labor, any single firm, even a system integrator, can hardly invest in all complementary technologies. Thus, the close cooperation with complementary vendor is a vehicle to acquire such complementary technologies. Nevertheless, sometimes, it is hard to maintain long term cooperation in the interfirm division of labors. Firms in a strategic alliance are liable to preserve their knowledge within them while always attempting to learn from competitors. Yet, we could scarcely find such tensions between mobile phone handset manufacturers and core chip vendors in our cases.
In contrast, some of the China local mobile phone handset manufacturers emphasized that Mediatek’s total solutions make it difficult to develop distinguished handsets. This situation is also the case in the DVD player industry in China. Mediatek’s total solutions can shorten product development leadtime to market. Yet, companies hardly differentiate their products as Mediatek encapsulates the most of product functions into their chipsets or bundle other components with their solutions. As a result, handset manufacturers could hardly balance the tension between cooperation and competition in the vertical interfirm division of labor. The fact shows that manufacturers can take the most of the values of products only when manufacturers for themselves nurture and hold the capabilities to define and develop the functions or components of the products. Conclusion Nowadays, the industrial structures of many electronics industries have been shifted to the vertical interfirm division of labors. Product developers use even core technologies from specialized vendors. Drawing on the cases of a Chinese, Japanese and Taiwanese handset developers, and the study attempts to elucidate how product developers develop product platforms adopting novel technology platforms from vendors. The cooperation with technology platform vendors in the early stage of product platform development helps shaping architectural knowledge, which is insufficient in the technology uncertainty of novel technology platform application. The collaboration between product developers and vendors enhances effective product platform development even in the vertical division of labors for product development. These finding would contribute to not only explicating the dynamics of the product development in open interfirm networks but also revealing the managerial issues of product platform development in the vertical division labors of product development.
Product developers in the vertical interfirm division should learn how to acquire knowledge from core component or complementary vendors. Cooperation with these complementary vendors also can be regarded as knowledge sharing or exchanging. Past researches indicated that core component vendors have component knowledge while manufacturers have architectural knowledge. Manufacturers and vendors exchange complementary knowledge (i.e., component and architectural knowledge) between them in the collaboration.
However, IC chip vendors will have more possibility to put various functions into their chip in the continuous improvement of the semiconductor process. In this case, bilateral mutual learning will become more difficult. In order to have the chance of mutual learning with core component vendors, manufacturers should make more investment into system level architectural knowledge (Takeishi, 2002). In the future researches, we need to explore whether more architectural knowledge can contribute to the earlier reduction of technological uncertainty to the extent that both technology and product platform design activities are advanced.
Furthermore, the mutual learning is competency-enhancing in the long term. The knowledge of

2057
competency-enhancing is derived from accumulated experiences as both of collaborative firms continuously gain a deeper appreciation of (1) which aspects of platforms will drive future improvements, (2)how core chip and the other components are interdependent, and (3) how complementary component vendors are integrated together to develop or improve product platforms. These management issues of product platform development are also left to the future researches.
References [1] Baldwin, Carliss Y. and Clark, Kim B. (2000). Design Rules : The Power of Modularity, MIT Press.
[2] Brusoni, A., & Prencipe, A. (2001) Managing knowledge in loosely coupled networks: Exploring the
links between product and knowledge dynamics, Journal of Management Studies, 38(7), 1019–1035. [3] Christensen, Clayton M., Verlinden, Matt and Westerman, George (2002). Disruption, Disintegration and
the Dissipation of Differentiability, Industrial and Corporate Change, 11(5), 955-993. [4] Clark, Kim B. and Fujimoto, Takahiro (1991). Product Development Performance: Strategy,
Organization, and Management in the World Auto Industry, Harvard Business School Press. [5] Cusumano, Michael A. (2004). The Business of Software – What Every Manager, Programmer, and
Entrepreneur Must Know to Thrive and Survive in Good Times and Bad, Free Press. [6] Funk, Jeffrey L. (2004). The Product Life Cycle Theory and Product Line Management: The Case of
Mobile Phones, IEEE Transactions on Engineering Management, 51(2), 142-152. [7] Hippel, von E. (2001). Perspective : User Toolkits for Innovation, The Journal of Product Innovation
Management, 18, 247-257. [8] Ken, Imai and Shiu, Jing-Ming (2006). A Divergent Path of Industrial Upgrading?: Emergence and
Evolution of the Mobile Handset Industry in China, Dicussion Paper for Workshop of the Institute of Developing Economies, Chiba, Japan.
[9] MacCormack, Alan and Verganti, Roberto (2003). Managing the Sources of Uncertainty: Matching Process
and Context in Software Development, The Journal of Product Innovation Management, 20, 217-232.
[10] Meyer, M.H. and Lehnerd, A.P. (1997). The Power of Product Platforms: Building Value and Cost
Leadership, New York: Free Press. [11] Nobeoka, Kentaro and Cusumano, Michael A. (1997). Multiproject Strategy and Sales Growth: The Benefits of Rapid Design Tranfer in New Product Development, Strategic Management Journal, 18(3),
169-186.
[12] Sanderson, S. and Uzumeri, M. (1995). Managing product families: The case of the Sony Walkman,
Research Policy, 24(5), 761-782.
[13] Staudenmayer, N., Tripas, M. & Tucci, C. L. (2005) Interfirm modularity and its implications for product development, Journal of Product Innovation Management, 22, 303-321.
[14] Takeishi, Akira (2002). Knowledge Partitioning in the Interfirm Division of Labor : The Case of Automotive Product Development, Organization Science, 13(3), 321-338.
[15] Yasumoto, Masanori and Fujimoto, Takahiro (2005). Does Cross-Functional Integration Lead to Adoptive Capabilities? Lessons from 188 Japanese Product Development Projects, International Journal of Technology Management, 30, issue 3/4 ,p.265-298.
Contact author for the full list of references
End Notes
[1] Design House in the context of the mobile phone handset industry is a firm that is specialized in the development

2058
of mobile phone handsets. Design Houses specialized in the development of electronic devices were born in the US in the trend of design outsourcing beginning in the 1990s. Cellon, a San-Jose-based venture established in 1999 by Chinese and US engineers claims to be the first Design House specialized in mobile phone handset development. For more detailed information about Design House, please refer the Ken and Shiu(2006).

2059
New Managerial Profile: Knowledge Based Approach
Lubica Bajzikova, [email protected] Emil Wojcak, [email protected]
Comenius University in Bratislava, Slovak Republic Helena Sajgalikova, [email protected]
University of Economics, Bratislava, Slovak Republic
Abstract A society of the future is the society of knowledge, in which the capability of knowledge concentration and transformation into innovative and applicative solutions are important and respected values. Knowledge has become the central resource of the new society where knowledge workers are key elements of its work force. There is no limit for knowledge society. Knowledge can be gained faster than ever because it moves faster than any other production factor. Modern communication and information technologies made it easier to get to the information. Yet it is still hard to gain applicable knowledge in this jungle of information. The basic strategy for achieving the knowledge society in Europe was set with the Lisbon strategy (European Commission, 2000). The Lisbon Strategy is focused on investing in people and enhancing their knowledge. The aims of the paper are: to analyze new profile of managers; to identify the new managerial role; to identify changes in education and sustainable development of managers. Introduction Knowledge as a key element of future society differs from all other classical production factors. The resources of knowledge are endless. The use of knowledge does not destroy them; on the contrary, it makes them even more valuable. The knowledge gained in the past sticks around. The Romans would say: Omnia mea mecum porto (I carry everything with me). We can sell it but we still own it. The same knowledge can be shared with many people. The only limitation to it is the human ability. The main objective for the European Union is to find a way to face the challenges of the global economy. Creating a knowledge society is the best and probably the only way how to achieve this. Innovations, technological modernization, applicative use of knowledge and top design will benefit to the European society and all its inhabitants. The basic strategy for achieving the knowledge society was set with the so-called Lisbon goals (European Commission, 2000). At the Lisbon summit in March 2000, Europe’s heads of state declared their ambition to make the European Union “the most competitive and dynamic knowledge-based economy in the world by 2010, capable of sustainable economic growth, with more and better jobs and greater social cohesion”. Knowledge Society and Human Capital Knowledge is an idiosyncratic feature of a human being. Knowledge society thus cannot be built without sufficient and adequate human capital. Human capital refers by definition to the knowledge and skills accumulated by people in the process of their education and training. The pioneer in the field who published “Human capital” in 1964 is professor Gary S. Becker, a Nobel Laureate (1992) from the University of Chicago (Becker, 1993). In his opinion, the new economy has increased the value of education and returns for investment on education. The macroeconomic aspect of education and investment in human capital contribute to economic growth.
Economically, human capital can be measured as “stock” or “flow” type of indicator, where the first one represents the level of education and knowledge of people and the second reflects the process of education. Highly educated and skilled people have an economic advantage on the labor market earning more, which is a return on their investment in education. The income level is a function of education and experience; highly educated people

2060
have a higher price of their skills, thus earning higher income while entering the labour market and experience a more rapid growth during the working life cycle (Samuelson, 1995).
Human capital has become the most important factor and can be effectively used in the economic process only by well-educated and skilled workers.
Economic development is connected to the absorption capability that is defined by the quality of the human capital. Growth conflict is a psychological process in which people due to the lack of knowledge begin to appose the process. Therefore the investment into technology must be necessarily accompanied by investment into human capital. The investment into human capital means education and training of employed people.
The econometric studies (OECD, 2001a) confirm a significant positive impact of human capital accumulation on the productivity (output per employee) and economic growth. Although the human capital theory is clearly defined, some dimensions are more difficult to quantify empirically. The human capital defined as capacity for work has five categories: individual knowledge, experience, skills, capability for work (health), willingness and readiness to work (personality). Some of them can be measured, while others have to be estimated.
Human capital stock is most often measured by the educational attainment of people according to the personal characteristics like age, gender etc. Another method of human capital stock measurement is observation of labor income paid in a year, assessment of the future income for each group of people according to their educational attainment, to sum the estimated aggregate value of human capital. The static model-based estimate origins from current level of education, while the dynamic model takes into account also the education in process (work-study stage and work stage). Education is a foundation of economic and social development, thus the role of human capital is discussed among researchers, economists and politicians.
The new European employment strategy sets ten policy priorities (Commission of the European Communities, 2003):
1. active and preventative measures for the unemployed and inactive, 2. job creation and entrepreneurship, 3. adaptability and mobility, 4. promotion of the development of human capital and lifelong learning, 5. increased labour supply and active ageing, 6. gender equality, 7. combating discrimination, 8. making work pay, 9. transformation of undeclared work, 10. addressing regional employment disparities.
The concept of lifelong learning is an objective of the European employment policy within the fourth policy priority “Promote development of human capital and lifelong learning” that states: “Member states will implement lifelong learning strategies, including the quality and efficiency of education and training systems, in order to equip all individuals with the skills required for a modern workforce in a knowledge-based society, to permit their career development and to reduce skills mismatch and bottlenecks in the labour market.” (Commission of the European Communities, 2003).
A recently adopted EC document “Education and Training 2010” (Commission of the European Communities, 2003) is focused on quality, access and openness of education and training systems. EC DG, Employment “Study on human capital in a global and knowledge based society” (De la Fuente and Ciccone, 2003) claims that average level of education by one year represents a 5% increase in economic growth in the short-term and another 2.5% in the long-term. In addition, the positive impact of education on employment, health, and social inclusion has been shown.
Several factors: economic, social and technological – account for the growing emphasis on the human capital (Commission of the European Communities, 2003):
a) Firstly, in any modern economy today, the production of goods and services increasingly relies on human, rather than physical, capital, i. e. on its workers’ individual and collective endowment of knowledge and skills. For example, Germany’s endowment of human capital is today more than twice the value of its physical capital.

2061
b) Secondly, in the knowledge and information society the quality of education is increasing and directed towards more active and innovative gaining of knowledge and skills.
c) Thirdly, growth of the “new economy” is also seen as a reason for the expansion of knowledge-based jobs. The idea of a “new economy” focuses attention on the role of ICT and its impact on technological progress.
Human Capital for Knowledge Society in Slovakia In the new economy - the information society accompanied by the globalization process - education and training are important not only for individuals, who due to their knowledge and skills become more successful and competitive on a more and more open labour market, but also for enterprises, for which human capital has become an important factor of production. The basic principle is intellectual flexibility and life long learning of adults. The main reasons for lifelong learning can be summarized by the following interrelated functions:
• individual function - individual development and career opportunities, • economic function - productivity and competitiveness of enterprises, • social function - higher living standard, social inclusion, decreasing unemployment, cultural progress, • national function - competitiveness of the national economy. Individual benefits from education and training through better employability, higher productivity, increased
earnings, increased mobility in the labour market and by widening their career opportunities. By investing in the human resources enterprises improve then productivity and competitiveness not only on local markets but also on the global markets. “The economic performance of 62 world wide car assembly plants around 1990, measured in terms of labour productivity and product quality (assembly-related defects per vehicle), proved to be closely associated with the presence of three dimensions of business strategy, lean production, team working and innovative human resource management (HRM) practices. Economic growth and social development of countries are invariably associated with large and sustained investments in education and training; countries with the highest incomes are also those where workers are most educated” (ILO, 2003).
The available data from the employment register that we analyzed for Slovakia include people employed by enterprises, small businesses and institutions. The analysis of the data on employed people by the educational institutions shows that 36 % of them have secondary specialized and secondary general education, 38.7 % are skilled or unskilled workers.
Based on the UNDP report on human resource development in 2004 Slovakia went down at the 42nd position in HDI (from the 39th in 2001). Education that is taken for the top priority in any economy is not recognized in Slovakia. The proof can be seen in the percentage of the GDP invested into the sector. While in the most develop countries it accounts for approx 1.33% (1998) in average and the trends show its growth, in Slovakia the GHP percentage invested into education fell from 1.05% in 1990 to 0.64% in 2001. Slovakia thus stood at the last position of the OECD member countries.
The similar situation is characteristic for research in Slovakia. The GDP percentage invested in research fell down from 1.45% in 1993 to 0.59% in 2002 and contribution from state budget went down from 0.46% to 0.26% in the same period. The average in the EU countries accounts for 1.9% of GDP with the highest investment being in Sweden (3.78%), Finland (3.37%), Germany (2.48%), USA (2.27%), France (2.15%) in 2002.
Following the EU education priorities the most important issue is to increase investment into education. Thus it is particularly important to increase investment in human capital from public funds, the business sector and individuals. The secondary priority is the introduction of lifelong strategies that is the education and training and training of adults. Education of adults is not only an investment by the individuals, but also by enterprises with a view to promote productivity, competitiveness and a more active ageing. The management in progressive companies that is aware that competitiveness can be only achieved with well-educated people, will strive to encourage employees to continue education and training – by entering the long-life learning.
Human capital development – the increase in the educational level and flow of highly educated youth on the labor market – does not only lead to welfare and better living standard of individuals and companies, but it

2062
becomes necessity in the knowledge-based society. High-tech intellectual industries need highly educated people. Human (intellectual) capital is a key factor of productivity. Thus in the new economy human capital has become the only real “wealth of nation”.
The solutions to the above mentioned negative trends in Slovakia have become the top priority for the Slovak government. Along the lines of the Lisabon Strategy they are planning to increase the competitiveness of the Slovak enterprises through highly educated workforce. Increased investment into education and research is the subject to numerous reforms in public finance, education systems and enhanced links between research and educational institutions. The changes should be achieved by 2010 (Strategy of the Slovak Republic’s Competitiveness by 2010 - draft). Managerial Competences in the 21th Century While thoroughly analyzed managerial competences of the 20th century included the combination of hard and soft skills with the focus on the hard ones, ie were assumed to be mastered during studies and short-term practical training and shifted primarily towards the preparatory phase for the managerial role, the new, transformed managerial role requires the combination of the manager’s qualities and knowledge that will allow for integration of individual experts’ efforts and understanding and respecting of customers’ values fro sustainable competitive advantage.
The initial perception of a new managerial role includes the views summarized by Brent, Snow and Miles (1996) and refers to organizational structure. They claim that the shift from the traditional structure (functional, divisional and matrix) towards the structures with higher autonomy, network structures, learning organizations etc. requires new managerial competences including technical specialization based on knowledge, experience in various functional fields including international exposure, collaborative leadership, self-controlling skills, continuous learning, ability to work individually, flexibility, integrity, trustworthiness and the like.
Barlett and Ghoshala (1997) identify different competences for individual managerial echelons. The authors present the change of line managers from operations implementers towards aggressive entrepreneurs characterized by creativity, intuition, persuasiveness, commitment, competitiveness, perseverance, knowledge of company technical characteristics as well as that of competitors and clients, internal and external resources and company operations. In their views, middle managers change from administrative controllers towards supportive coaches. Here, the competences of people-oriented integrator include knowing people, ability to, delegate, develop, empower, enhance relationships, build teams, diminish and resolve conflicts. Top managers are gradually changing from the resource allocators to institutional leaders. Their qualities should include primarily those of an institutionally thinking visioner, ie ability to create interesting (demanding) work environment, enhance trust and belief in the organization, ability to combine conceptual perception with motivational challenges.
Another stream in management theories is represented by the idea of learning organization. For the core competence Bob Garatt (2002) (Figure 1) takes common thinking. This means that managers cannot exercise individualized thinking at the top of the pyramid any more. The new phenomenon could be called a processor of the organization where the information from external and internal sources is processed and becomes part of an efficient information network accessible to all employees. Thus, efficient learning can take place as a basis for strategic decision-making. Employees, participating in the decision-making via contributing and processing information identify with it much more readily. The strategic horizon is shifted towards long-term. The responsibility of individuals is growing and is based on permanent employee development through learning. To be competent under the above conditions, the manager must be equipped with knowledge, skills and other personal qualities, such as ability to attract, educate and retain highly qualified employees, abundant in expert knowledge and skills in the area of his/her field, competences to establish and develop the learning organization (cognitive and behavioral phase followed by results), competences in knowledge management (knowledge as the core competitive advantage) and intercultural managerial competences (communication, listening, empathy, creating atmosphere of trust, efficient feedback and the like).

2063
Responsibility ► Policy setting
▲ Common thinking ▼ Control management ◄ Strategic thinking
FIG. 1: MODEL OF LEARNING TOP MANAGEMENT. ADOPTED FROM GARATT (2002)
Burack, Hochwarter and Matys (1997) recommend step-like model of competences consisting of core competences (necessary for managers at all levels), such as flexibility towards change, customer-orientation, stress management, teamwork, ability to collect new knowledge. In addition, they specify the competences for middle management, such as creativity, strategic thinking, cultural heterogeneity, art in creating teams, support for participation. Here, the art to create heterogeneous teams achieving synergic effect is the most important. Top management should consist of good leaders at change implementation, persuasive communicators and strategic initiators. Managerial Competences in Slovak Companies and Knowledge Society Our research focused on identification of managerial competences as envisaged by Slovak managers in the view of the shift towards knowledge society. Methodology A questionnaire consisting of 3 open-ended questions was distributed to 421 managers (university graduates) in 86 organizations regardless the organization’s size and field of operations with the return of 283 (67.2 %). Descriptive statistics was used to analyze the responses. Discussion The questions in the questionnaire were intended to identify changes in managerial competences in the recent five years, suggestions for adaptation (completion, change) of curricula for to-be managers and balancing of formal and informal learning in the view of needed future managerial competences. Q1: Characterize the change in the profile of a manager (primarily, but not exclusively top and middle management) based on your own experience in the recent 5 years.
The results presented in Figure 2 show the shift from the traditional managerial role of an information and legitimate locus towards permanently learning and developing visionary able to react to changes, set long-term strategies and understand their impact in short- and medium-term horizons and lead continuous human capital development with the aim to build teams aspiring to synergic effect. The changes are expected to result in the transformation leaders capable to persuade others to follow as well as to identify with the objectives to be pursued jointly.
To summarize the results of the survey is not simple due to different requirements set on different levels of management and the individual, subjective wording and phrasing of the responses because of open-ended questions. However, the common grounds were identified and can be presented as follows:
1. Need to increase customer-orientation and focus on satisfaction of the customer’s needs and wants 2. Ability to master various situations and requirements stemming from globalization 3. Continuous attainment and enhancement of skills in ICT applications along with technological progress 4. Ability to persuade and explain 5. Drive for continuous learning and ability to evolve it in one’s subordinates 6. Implementation of individual responsibility for permanent staff growth and effective feedback

2064
7. Development of communication skills (including foreign languages) 8. Ability to envisage impacts of one’s own decisions and enhancement of conceptual skills 9. Ability to vent constructive criticism 10. Ability to resolve conflicts 11. Flexibility and ability to recruit flexible staff as well as enhance flexibility

2065
Ability to m
onitor and reportresults
Good know
ledge of work on the
PC
Fluency in – at least – one
foreign language
Long-term strategy (long-term
goal orientation)
Ability to understand im
pact ofstrategic decisions
Ability to present (explain)
ideas, views etc.
0%
10%
20%
30%
40%
50%
60%
FIG. 2: NEW PROFILE OF A MANAGER Q2: What do you think is missing in the current profile of a manager? What do you suggest to complete (adjust) current curricula for to-be managers in the view of the lacking managerial competences?
In a way, all respondents (Figure 3) suggested closer interlink between theory and practice focused on the customer, not individual measurable outcomes of the daily routine. This requires change of learning processes so that the students could see and understand the outcomes of their decisions to be able and ready to undertake full responsibility for their decisions in practice, furthermore, to be able to think in the context of added value. Over half of the respondents suggest including hands-on practical training in fictitious enterprises.

2066
Closer link to practice
Changes in H
EI curricula so that
the graduates would be m
orecustom
er-oriented than results-oriented
Change in the approach tow
ardslearning so that the graduates
would be aw
are of the fact that,in practice, they w
ill carry outm
eaningful and real tasks, ie thattheir m
anagerial activities will
have to materialize “visible”
added value
Education through m
anagement
of fictitious organizations ratherthan m
emorizing facts that the
graduates are unable to apply inpractice
0%
10%
20%
30%
40%
50%
60%
70%
80%
90%
100%
FIG. 3: CHANGE IN CURRICULA IN MANAGEMENT STUDIES
Q3: Is it feasible for managers to enhance/complete their knowledge and skills in informal education (practice, e-learning, self-study, random courses etc.)?
Over a quarter of respondents (Figure 4) claim that they continuously learn utilizing all above-mentioned ways. However, and it is critical, 60 % of respondents are unable to grow because their business does not leave any space for their self-education in either of the ways. 32% respondents utilize formal educational opportunities for their growth, many of them (18%) organized by their organizations themselves. Systematic knowledge-exchange events (conferences) are stressed by only 10% of respondents.
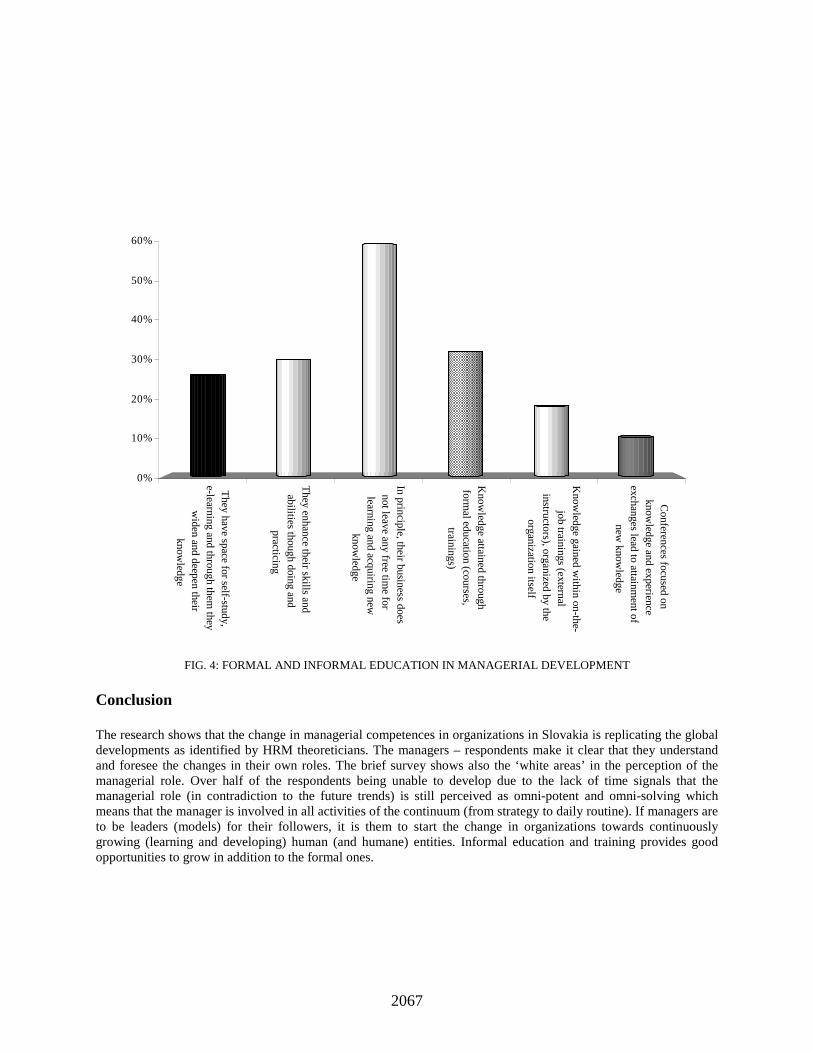
2067
They have space for self-study,
e-learning and through them they
widen and deepen their
knowledge
They enhance their skills andabilities though doing and
practicing
In principle, their business doesnot leave any free tim
e forlearning and acquiring new
knowledge
Know
ledge attained throughform
al education (courses,trainings)
Know
ledge gained within on-the-
job trainings (externalinstructors), organized by the
organization itself
Conferences focused on
knowledge and experience
exchanges lead to attainment of
new know
ledge
0%
10%
20%
30%
40%
50%
60%
FIG. 4: FORMAL AND INFORMAL EDUCATION IN MANAGERIAL DEVELOPMENT
Conclusion The research shows that the change in managerial competences in organizations in Slovakia is replicating the global developments as identified by HRM theoreticians. The managers – respondents make it clear that they understand and foresee the changes in their own roles. The brief survey shows also the ‘white areas’ in the perception of the managerial role. Over half of the respondents being unable to develop due to the lack of time signals that the managerial role (in contradiction to the future trends) is still perceived as omni-potent and omni-solving which means that the manager is involved in all activities of the continuum (from strategy to daily routine). If managers are to be leaders (models) for their followers, it is them to start the change in organizations towards continuously growing (learning and developing) human (and humane) entities. Informal education and training provides good opportunities to grow in addition to the formal ones.

2068
References
[1] Barlett, Ch.A., Ghoshal, S. (1997). The Myth of a Generic Manager: New Personal Competencies for New Management Roles. California Management Review, No. 1., p. 92-116.
[2] Becker, G. (1993). Human Capital: A theorectical and empirical analysis. 3rd ed. Chicago and London. University of Chicago Press.
[3] Burack, E.H., Hochwarter, W., Mathys, N. J. (1997). The New Management Development Paradigm. Human Resource Planning, No. 1., p. 14-21.
[4] Commission of the European Communities. (2003). Education and training 2010: The success of the Lisbon strategy hinges on urgent reforms. 685 final.
[5] Cowan, R., van de Paal, G. (2000). Innovation policy in a knowledge-based economy. EUR 17023. Luxemburg: Office for Official Publications of the European Communities.
[6] De la Fuente, A., Ciccone, A. (2003). Human capital in a global and knowledge-based economy. UFAE and IAE Working paper 562.03.
[7] Drucker, Peter, F. (1999). Management Challenges for the 21st Century. 1999. [8] European Commission. Innovation tomorrow. EUR 17052. Luxemburg: Office for Official Publications of
the European Communities. European Commission. 2002b. Industrial policy in an enlarged Europe. COM. 2002.
[9] European Commission. Lisbon European Council, Presidency conclusions, 23. and 24. March. 2000. [10] European Commission. The Lisbon strategy: Making change happen. COM. 2002. [11] Garatt, B. (2002). Učiaca sa organizácia. In: Heller, R.: Príručka manažéra, Ikar, p. 46-47. [12] ILO (International Labour Office). (2003). Learning and Training for work in the knowledge society.
Report discusses on the International Labour Conference, June 2003. [13] OECD. (2001a). The new economy: Beyond the hype. Financial Report on the OECD Growth Project.
http://www. oecd.org/dataoecd/2/26/2380634.pdf. Date: February, 2007. [14] OECD. (2001b). Experimental estimates of human capital for Australia. STD/NA (2001). [15] Samuelson, P.A. (1995). Economics. 15th ed. Columbus, McGraw-Hill. [16] World Economic Forum. The Lisbon review 2002-2003: An assessment of policies and reforms in Europe.
http://www.weforum.org/pdf/Gcr/LisbonReview/LisbonReview_2002.pdf. Date: February, 2004. [17] Yeung, A., Woolcock, P., Sullivan, J. (1996). Identifying and Developing HR Competencies for the Future:
Keys to Sustaining the Transformation of HR Functions. Human Resource Planning, No. 4, p. 48-58.
![[Updated Constantly] - ITExamAnswers.net](https://static.fdokumen.com/doc/165x107/631602506ebca169bd0b61e0/updated-constantly-itexamanswersnet.jpg)