Obesity-induced overexpression of miRNA143 inhibits insulin-stimulated AKT activation and impairs...
26
ARTICLES Obesity-induced overexpression of miRNA-143 inhibits insulin-stimulated AKT activation and impairs glucose metabolism Sabine D. Jordan 1 , Markus Krüger 2 , Diana M. Willmes 1 , Nora Redemann 1 , F. Thomas Wunderlich 1 , Hella S. Brönneke 3 , Carsten Merkwirth 4 , Hamid Kashkar 5 , Vesa M. Olkkonen 6 , Thomas Böttger 2 , Thomas Braun 2 , Jost Seibler 7 and Jens C. Brüning 1,8 The contribution of altered post-transcriptional gene silencing to the development of insulin resistance and type 2 diabetes mellitus so far remains elusive. Here, we demonstrate that expression of microRNA (miR)-143 and 145 is upregulated in the liver of genetic and dietary mouse models of obesity. Induced transgenic overexpression of miR-143, but not miR-145, impairs insulin-stimulated AKT activation and glucose homeostasis. Conversely, mice deficient for the miR-143–145 cluster are protected from the development of obesity-associated insulin resistance. Quantitative-mass-spectrometry-based analysis of hepatic protein expression in miR-143-overexpressing mice revealed miR-143-dependent downregulation of oxysterol-binding-protein-related protein (ORP) 8. Reduced ORP8 expression in cultured liver cells impairs the ability of insulin to induce AKT activation, revealing an ORP8-dependent mechanism of AKT regulation. Our experiments provide direct evidence that dysregulated post-transcriptional gene silencing contributes to the development of obesity-induced insulin resistance, and characterize the miR-143–ORP8 pathway as a potential target for the treatment of obesity-associated diabetes. Type 2 diabetes mellitus (T2DM) has reached epidemic proportions worldwide. The rapid increase in T2DM over the past decades has been caused by the interaction of genetic susceptibility and environmental factors such as inappropriate diet and sedentary lifestyle 1 . Resistance to the pleiotropic effects of insulin represents a key process in the development of the disease 2–5 , but the underlying molecular mechanism(s) of insulin resistance are only partially understood and heterogeneous in nature. Among these, polymorphisms in genes that encode for proteins of the insulin signalling cascade and transcriptional dysregulation of these genes, and post-translational modifications and protein degradation contribute to the pathogenesis of T2DM (refs 6–11). The discovery of post-transcriptional gene silencing as an additional regulatory principle to control protein expression raises the possibility that microRNAs (miRNAs) are also involved in the development of obesity-induced insulin resistance and T2DM. 1 Department of Mouse Genetics and Metabolism, Institute for Genetics, Cologne Excellence Cluster on Cellular Stress Responses in Aging Associated Diseases (CECAD) and Center of Molecular Medicine Cologne (CMMC) University of Cologne, and Center for Endocrinology, Diabetes and Preventive Medicine (CEDP), University Hospital Cologne, Max Planck Institute for Neurological Research, Zülpicher Straße 47, D-50674 Cologne, Germany. 2 Max Planck Institute for Heart and Lung Research, D-61231 Bad Nauheim, Germany. 3 Phenotyping Facility of the Cologne Excellence Cluster on Cellular Stress Responses in Aging Associated Diseases (CECAD), D-50674 Cologne, Germany. 4 Institute for Genetics, Cologne Excellence Cluster on Cellular Stress Responses in Aging Associated Diseases (CECAD) and Center of Molecular Medicine Cologne (CMMC), University of Cologne, D-50674 Cologne, Germany. 5 Institute for Medical Microbiology, Immunology and Hygiene, Cologne Excellence Cluster on Cellular Stress Responses in Aging Associated Diseases (CECAD) and Center of Molecular Medicine Cologne (CMMC), University of Cologne, D-50674 Cologne, Germany. 6 Minerva Foundation Institute for Medical Research, Biomedicum, FI-00290 Helsinki, Finland. 7 TaconicArtemis Pharmaceuticals GmbH, D-51063 Cologne, Germany. 8 Correspondence should be addressed to J.C.B. (e-mail: [email protected]) Received 12 May 2010; accepted 11 January 2011; published online 27 March 2011; DOI: 10.1038/ncb2211 miRNAs represent a class of small, non-coding RNAs that are widely expressed in all multicellular organisms to regulate gene expression post-transcriptionally by cleavage or translational repression of their specific target mRNAs (refs 12–15). A role for miRNAs in metabolism was first described in Drosophila melanogaster, where loss of miR-14 increases body fat content 16 . In vertebrates, the first miRNA linked to metabolism was the pancreatic-islet-enriched miR-375, which interferes with insulin secretion 17 . Since then, regulatory functions have been described for miRNAs in all tissues directly targeted by insulin, such as brain, skeletal muscle, adipose tissue and liver 18 . Interestingly, whole-genome association studies for T2DM susceptibility genes revealed that most of the associated variants were located in non-coding regions 19,20 , further supporting the possibility that regulatory, non-coding RNAs such as miRNAs may also contribute to the development of insulin resistance and T2DM. 434 NATURE CELL BIOLOGY VOLUME 13 | NUMBER 4 | APRIL 2011 © 2011 Macmillan Publishers Limited. All rights reserved.
-
Upload
independent -
Category
Documents
-
view
3 -
download
0
Transcript of Obesity-induced overexpression of miRNA143 inhibits insulin-stimulated AKT activation and impairs...

ART I C L E S
Obesity-induced overexpression of miRNA-143 inhibitsinsulin-stimulated AKT activation and impairsglucose metabolismSabine D. Jordan1, Markus Krüger2, Diana M. Willmes1, Nora Redemann1, F. Thomas Wunderlich1,Hella S. Brönneke3, Carsten Merkwirth4, Hamid Kashkar5, Vesa M. Olkkonen6, Thomas Böttger2, Thomas Braun2,Jost Seibler7 and Jens C. Brüning1,8
The contribution of altered post-transcriptional gene silencing to the development of insulin resistance and type 2 diabetesmellitus so far remains elusive. Here, we demonstrate that expression of microRNA (miR)-143 and 145 is upregulated in the liverof genetic and dietary mouse models of obesity. Induced transgenic overexpression of miR-143, but not miR-145, impairsinsulin-stimulated AKT activation and glucose homeostasis. Conversely, mice deficient for the miR-143–145 cluster are protectedfrom the development of obesity-associated insulin resistance. Quantitative-mass-spectrometry-based analysis of hepatic proteinexpression in miR-143-overexpressing mice revealed miR-143-dependent downregulation of oxysterol-binding-protein-relatedprotein (ORP) 8. Reduced ORP8 expression in cultured liver cells impairs the ability of insulin to induce AKT activation, revealingan ORP8-dependent mechanism of AKT regulation. Our experiments provide direct evidence that dysregulated post-transcriptionalgene silencing contributes to the development of obesity-induced insulin resistance, and characterize the miR-143–ORP8pathway as a potential target for the treatment of obesity-associated diabetes.
Type 2 diabetes mellitus (T2DM) has reached epidemic proportionsworldwide. The rapid increase in T2DM over the past decades has beencaused by the interaction of genetic susceptibility and environmentalfactors such as inappropriate diet and sedentary lifestyle1. Resistanceto the pleiotropic effects of insulin represents a key process inthe development of the disease2–5, but the underlying molecularmechanism(s) of insulin resistance are only partially understood andheterogeneous in nature. Among these, polymorphisms in genes thatencode for proteins of the insulin signalling cascade and transcriptionaldysregulation of these genes, and post-translational modificationsand protein degradation contribute to the pathogenesis of T2DM(refs 6–11). The discovery of post-transcriptional gene silencing asan additional regulatory principle to control protein expression raisesthe possibility that microRNAs (miRNAs) are also involved in thedevelopment of obesity-induced insulin resistance and T2DM.
1Department of Mouse Genetics and Metabolism, Institute for Genetics, Cologne Excellence Cluster on Cellular Stress Responses in Aging Associated Diseases(CECAD) and Center of Molecular Medicine Cologne (CMMC) University of Cologne, and Center for Endocrinology, Diabetes and Preventive Medicine (CEDP), UniversityHospital Cologne, Max Planck Institute for Neurological Research, Zülpicher Straße 47, D-50674 Cologne, Germany. 2Max Planck Institute for Heart and LungResearch, D-61231 Bad Nauheim, Germany. 3Phenotyping Facility of the Cologne Excellence Cluster on Cellular Stress Responses in Aging Associated Diseases(CECAD), D-50674 Cologne, Germany. 4Institute for Genetics, Cologne Excellence Cluster on Cellular Stress Responses in Aging Associated Diseases (CECAD) andCenter of Molecular Medicine Cologne (CMMC), University of Cologne, D-50674 Cologne, Germany. 5Institute for Medical Microbiology, Immunology and Hygiene,Cologne Excellence Cluster on Cellular Stress Responses in Aging Associated Diseases (CECAD) and Center of Molecular Medicine Cologne (CMMC), University ofCologne, D-50674 Cologne, Germany. 6Minerva Foundation Institute for Medical Research, Biomedicum, FI-00290 Helsinki, Finland. 7TaconicArtemisPharmaceuticals GmbH, D-51063 Cologne, Germany.8Correspondence should be addressed to J.C.B. (e-mail: [email protected])
Received 12 May 2010; accepted 11 January 2011; published online 27 March 2011; DOI: 10.1038/ncb2211
miRNAs represent a class of small, non-coding RNAs that arewidely expressed in all multicellular organisms to regulate geneexpression post-transcriptionally by cleavage or translational repressionof their specific target mRNAs (refs 12–15). A role for miRNAs inmetabolism was first described in Drosophila melanogaster, where lossof miR-14 increases body fat content16. In vertebrates, the first miRNAlinked to metabolism was the pancreatic-islet-enriched miR-375,which interferes with insulin secretion17. Since then, regulatoryfunctions have been described for miRNAs in all tissues directlytargeted by insulin, such as brain, skeletal muscle, adipose tissue andliver18. Interestingly, whole-genome association studies for T2DMsusceptibility genes revealed that most of the associated variants werelocated in non-coding regions19,20, further supporting the possibilitythat regulatory, non-coding RNAs such asmiRNAsmay also contributeto the development of insulin resistance and T2DM.
434 NATURE CELL BIOLOGY VOLUME 13 | NUMBER 4 | APRIL 2011
© 2011 Macmillan Publishers Limited. All rights reserved.

ART I C L E S
As the liver plays a central role in glucose and lipid metabolism,and hepatic insulin resistance is a hallmark feature of T2DM, weanalysed the hepatic miRNA expression pattern in genetically as well asdiet-induced obese insulin-resistant mice and validated the functionalrole of alteredmiRNA expression on glucosemetabolism in vivo.
RESULTSExpression of miR-143 and miR-145 is upregulated in the liverof obese mouse modelsTo identify miRNAs undergoing metabolic regulation and potentiallycontributing to the development of obesity-associated disturbances inglucose and lipid metabolism, we first cloned small RNA moleculesfrom the liver ofmice, which either had free access to food (random fed),had been food restricted (fasted) or had been fasted and refed (refed).Sequencing of 312 concatamers in total, cloned from pooled hepatictotal RNAs obtained under these conditions, revealed 1,070 smallRNA sequences, of which 20.65% represented known miRNAs (seeSupplementary Table S1a). Moreover, sequence analyses revealed thepresence of 40 different miRNAs, with miR-122a as the predominanthepatic miRNA, representing 34.8% of the cloned miRNAs (seeSupplementary Table S1b). Out of 32 miRNAs of which hepaticexpression could be confirmed by northern-blot analysis, expression ofmiR-143 varied with feeding conditions (see Supplementary Table 1band Fig. S1).We next determined the expression of miR-143 in the liver of
db/dbmice, which are obese and diabetic owing to mutations of theleptin receptor gene21,22. This analysis revealed a significant 2.2-foldupregulation of miR-143 expression in the liver of db/dbmice whencompared with control mice (Fig. 1a). Similarly, expression of miR-143was also significantly upregulated twofold in the liver of mice exposedto a high-fat diet when compared with control mice fed with a normalchow diet (Fig. 1b). Increased expression ofmiR-143 in the liver of bothgenetically and diet-induced obese mice was confirmed by quantitativereal-time PCR analysis in independent cohorts of animals (Fig. 1c,d).As miR-143 and miR-145, which form a small gene cluster on mouse
chromosome 18, are co-expressed in several different tissues23, wenext investigated expression of miR-145 in the liver of obese mice.Quantitative real-time PCR analysis revealed significant upregulationof miR-145 expression in the liver of both db/db and diet-inducedobese mice (Fig. 1e,f). Taken together, these experiments revealedupregulation of miR-143 and miR-145 expression in the liver of twodifferent obesity mouse models.To address whether altered expression of miR-143 and miR-145 is
restricted to the liver of obesemice, we next determined their expressionin various organs of db/db mice, compared with control mice. Thisanalysis revealed significant upregulation of miR-143 in the heartand pancreas of db/dbmice, whereas its expression was significantlyreduced in white adipose tissue (Fig. 1g,h). Expression of miR-145 wassignificantly upregulated in skeletal muscle and pancreas of db/dbmice(Fig. 1i,j). Thus, the miR-143–145 cluster is co-regulated in liver andpancreas of obesemice, whereas the regulation differs in other tissues.
Conditional overexpression of miR-143 in mice impairsglucose metabolismTo investigate whether increased hepatic miR-143 expressioncontributes to the metabolic phenotype arising from obesity in vivo,
we next aimed to mimic obesity-associated overexpression of thismiRNA in a transgenic mouse model. As miRNAs have crucial rolesin cellular differentiation and organ development24, we aimed tocircumvent potential developmental effects of upregulated miRNAexpression and thus designed a strategy for time-controlled transgenicmiRNA overexpression. We have previously demonstrated a tightregulation of transgenic short hairpin RNA (shRNa) expressionfrom the Rosa26 locus of mice under the control of a doxycycline-inducible H1 promoter25,26. Thus, we expanded this method to expressmiRNAs from the same locus. The doxycycline-inducible miRNAallele was generated by insertion of the respective miRNA codingsequence flanked by approximately 200 base pairs of the endogenouslocus (Fig. 2a–c). Northern-blot analysis of miR-143 expression incontrol (wild-type) and miR-143 transgenic mice (miR-143DOX) afterfour weeks of doxycycline treatment revealed significant overexpressionof miR-143 in liver and brown adipose tissue of miR-143DOX mice,whereas expression from the H1 promoter failed to raise miR-143concentration above the relatively high endogenous levels in skeletalmuscle and white adipose tissue (Fig. 2d,e). Importantly, in isolatedhepatocytes northern-blot analysis revealed both endogenous miR-143expression in control and doxycycline-induced overexpression intransgenic hepatocytes (Fig. 2f). Comparative time-course analysisof miR-143 expression in liver and skeletal muscle revealed tightdoxycycline-dependent miR-143 overexpression, as in the absenceof doxycycline, basal miR-143 expression was comparable betweenmiR-143DOX and control mice. However, doxycycline administrationled to rapid induction of miR-143 overexpression in the liver ofmiR-143DOX mice after only one day of treatment (Fig. 2g). Thus,our approach provides a versatile tool to conditionally overexpressmiRNAs in mice.As we had identified upregulated miR-143 expression in the
liver of obese mice, we first investigated whether conditionaloverexpression of miR-143, predominantly in liver and brownadipose tissue, affects energy homeostasis. Nevertheless, this analysisrevealed unaltered body weight, fat mass and circulating plasma leptinconcentrations, as an indirect measure of adiposity, in miR-143DOX
mice, compared with control mice (see Supplementary Fig. S2a–c).Moreover, food intake, body temperature and energy expenditureremained unaltered in miR-143DOX mice, compared with control mice(see Supplementary Fig. S2d–f). Analysis of brown-adipose-tissuemorphology and expression of key regulators of brown-adipose-tissue differentiation and function revealed no significant differencesbetween miR-143DOX and control mice (see Supplementary Fig.S2g,h). Thus, conditional overexpression of miR-143 as present inobese mice does not alter energy homeostasis or specifically affectbrown-adipose-tissue function.
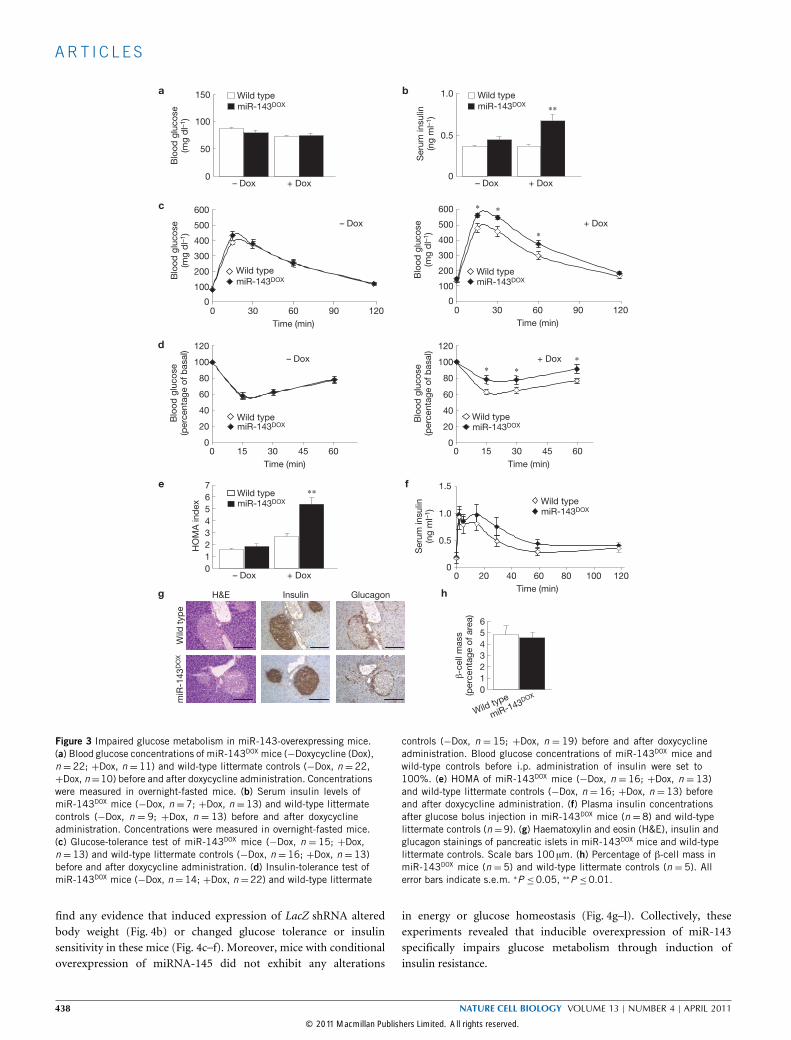
However, doxycycline-induced overexpression of miR-143 resultedin a prominent dysregulation of glucose metabolism. Although fastingblood glucose concentrations did not differ between miR-143DOX andcontrol littermates in either the absence or presence of doxycycline,doxycycline-treated miR-143DOX mice exhibited significantly increasedfasting plasma insulin concentrations (Fig. 3a,b). Moreover, althoughglucose-tolerance tests did not differ between miR-143DOX and controlmice in the absence of doxycycline, we detected a significantly impairedglucose tolerance in miR-143DOX mice after induction of miR-143overexpression (Fig. 3c). Similarly, insulin sensitivity did not differ
NATURE CELL BIOLOGY VOLUME 13 | NUMBER 4 | APRIL 2011 435
© 2011 Macmillan Publishers Limited. All rights reserved.
ART I C L E S
Rel
ativ
e ex
pre
ssio
nm
iR-1
43/5
S r
RN
A
Wild type
Wild type
db/db
db/db
Wild typedb/db
Pancreas
Pancreas
miR-143
5S rRNA
0
1
2
3∗∗ ∗
∗ ∗
NCD HFD
miR-143
5S rRNA
Rel
ativ
e ex
pre
ssio
nm
iR-1
43/5
S r
RN
A 2.5
2.0
1.5
1.0
0.5
0
Rel
ativ
e ex
pre
ssio
nm
iR-1
45/s
no23
4
2.5
2.0
1.5
1.0
0.5
0Rel
ativ
e ex
pre
ssio
nm
iR-1
43/s
no23
4
2.5
2.0
1.5
1.0
0.5
0
Rel
ativ
e ex
pre
ssio
nm
iR-1
43/s
no23
4
Rel
ativ
e ex
pre
ssio
nm
iR-1
43/s
no23
4
2.0
1.5
1.0
0.5
0NCD HFD
NCD HFD
NCD HFD
∗∗ ∗∗
∗
∗
∗
∗
∗
Rel
ativ
e ex
pre
ssio
nm
iR-1
45/s
no23
4 2.0
1.5
1.0
0.5
0
2.5
3.0
2.0
1.5
1.0
0.5
0
Rel
ativ
e ex
pre
ssio
nm
iR-1
45/s
no23
4 2.5
3.0
2.0
1.5
1.0
0.5
0
SM Heart WAT BAT
SM Heart WAT BAT
Rel
ativ
e ex
pre
ssio
nm
iR-1
45/s
no23
4
10
5
0
Rel
ativ
e ex
pre
ssio
nm
iR-1
43/s
no23
4
10
5
0
Wild typedb/db
Wild typedb/db
Wild typedb/db
c
g h
i j
a
d
b
e f
Wild typedb/db
Wild typedb/db
Figure 1 Dysregulated expression of the miR-143–145 cluster in insulintarget tissues of obese and diabetic mice. (a) Northern-blot analysisof hepatic miR-143 expression in db/db mice (n = 5), compared withwild-type controls (n=5). 5S ribosomal RNA was used as a loading control.(b) Northern-blot analysis of hepatic miR-143 expression in mice fedhigh-fat diet (HFD; n=5) or normal chow diet (NCD) (n=5). 5S rRNA wasused as a loading control. (c) Real-time PCR analysis of hepatic miR-143expression in db/db mice (n = 10), compared with wild-type controls(n = 10). (d) Real-time PCR analysis of hepatic miR-143 expression inmice fed high-fat diet (HFD; n = 8) or normal chow diet (NCD; n = 5).(e) Real-time PCR analysis of hepatic miR-145 expression in db/db mice(n = 10), compared with wild-type controls (n = 10). (f) Real-time PCRanalysis of hepatic miR-145 expression in mice fed high-fat diet (HFD; n=8)or normal chow diet (NCD; n =5). (g) Real-time PCR analysis of miR-143
expression in the indicated tissues of db/db mice (skeletal muscle (SM),n=8; heart, n=7; white adipose tissue (WAT), n=7; brown adipose tissue(BAT), n =8), compared with wild-type controls (SM, n =7; heart, n =9;WAT, n=9; BAT, n=9). (h) Real-time PCR analysis of pancreatic miR-143expression in db/db mice (n=6), compared with wild-type controls (n=5).(i) Real-time PCR analysis of miR-145 expression in the indicated tissues ofdb/db mice (SM, n =7; heart, n =6; WAT, n =7; BAT, n =8), comparedwith wild-type controls (SM, n =8; heart, n =7; WAT, n =8; BAT, n =6).(j) Real-time PCR analysis of pancreatic miR-145 expression in db/db mice(n =6, 20 weeks old), compared with wild-type controls (n =5, 20 weeksold). Expression of miRNAs was normalized to that of control RNAs (northernblot, 5S rRNA; real-time PCR, sno234) and set to unity in wild-type controls.All error bars indicate s.e.m. ∗P ≤0.05,∗∗P ≤0.01. Uncropped images ofblots are shown in Supplementary Fig. S9.
between miR-143DOX and control mice in the absence of doxycycline,but doxycycline-treated miR-143DOX mice exhibited significantlyimpaired insulin tolerance (Fig. 3d). Consistently, homeostatic modelassessment (HOMA) indices of doxycycline-treated miR-143DOX
mice were significantly increased, further indicating reduced insulinsensitivity of these mice (Fig. 3e).
Analysis of glucose-stimulated insulin secretion, morphologicalanalysis of pancreatic β-cell islets and determination of pancreaticβ-cell mass revealed no alterations (Fig. 3f–h), further supporting thehypothesis that impaired glucose metabolism in miR-143DOX micearises primarily from insulin resistance rather than impaired insulinsecretion due to β-cell dysfunction.
436 NATURE CELL BIOLOGY VOLUME 13 | NUMBER 4 | APRIL 2011
© 2011 Macmillan Publishers Limited. All rights reserved.

ART I C L E S
∗
SM
F3
H
H
HATG
ATG
SA
pA hGH-pA
itetR
_
Probe
zsgreen PGK-HygR CAGGS-FLP∗
H
Rosa26 (RMCE targeted)
Site-specific recombination by FLP∗
Δ5'neoR H1-tetO miR-143 CAGGS itetR
Exchange vector
Probe
SA hGH-pA
miR-143DOX
itetRCAGGS
CAGGS promoter
CAGGS promoter
itetR
H1-tetO miR-143
miR-143
+ Doxycycline
itetR
itetR
6 kb4 kb
3.9 kb
Wild type 1° 1 2 3 4
ExchangedWild typeTargeted
Wild type
Liver
SM
WAT
BAT
miR-143
5S rRNA
miR-143
5S rRNA
miR-143
5S rRNA
miR-143
5S rRNA
miR-143
5S rRNA
miR-143
5S rRNA
∗
4
3
2
1
0Rel
ativ
e ex
pre
ssio
nm
iR-1
43/5
S r
RN
A
BAT
WATSMLive
r
Wild type miR-143DOX
miR-143DOX
miR-143
5S rRNA
Rosa26 (RMCE exchanged)
H H
Liver
– D
ox
1 d
ay
2 d
ays
4 d
ays
8 d
ays
W T W T W T W T W T
Wild type
a b
c
e
f
g
d
FRT
F3 FRT
H1-tetO miR-143Δ5'neoR
H1-tetO
Figure 2 Conditional overexpression of miR-143 in mice. (a) Scheme of asingle vector configuration for inducible miRNA expression. Recombinase-mediated cassette exchange (RMCE) through Flpe-mediated recombinationusing the exchange vector generates the Rosa26 (RMCE-exchanged) allele.The exchange vector carries the miR-143 coding region under the controlof the H1-tetO promoter, the codon-optimized itetR gene under the controlof the CAGGS promoter (chicken β-actin promoter) and a truncated neoR
gene for positive selection of clones on successful RMCE. (b) Southern-blotanalysis of genomic DNA from embryonic stem cells. In clones 1–4successful RMCE had occurred. The positions of probe and restrictionsites (H=HindIII) are indicated in a. Clone 2 was used for generationof transgenic mice. (c) Schematic representation of transgene for induciblemiR-143 overexpression. Expression of transgenic miR-143 relies onthe RNA polymerase III (polIII)-dependent H1 promoter, containing theoperator sequences (tetO ) of the Escherichia coli tetracycline-resistanceoperon. Binding of the tetracycline-resistance-operon repressor (itetR) to
tetO prevents transcription. Doxycycline sequesters itetR and enables thebinding of polIII to the H1 promoter, resulting in transcription of the extramiR-143 allele. (d) Northern-blot analysis of mature miR-143 and 5S rRNA(loading control) in liver, skeletal muscle (SM) and white (WAT) and brownadipose tissue (BAT) of miR-143DOX mice and wild-type littermate controls.(e) Quantification of northern-blot analysis shown in d (miR-143DOX mice,n =3; wild-type littermate controls, n =3). Expression of miR-143 in theindicated tissues was normalized to that of 5S rRNA and set to unity inthe respective wild-type tissue. All error bars indicate s.e.m. ∗P ≤ 0.05.(f) Northern-blot analysis of mature miR-143 and 5S rRNA (loading control)in hepatocytes isolated from miR-143DOX mice and wild-type littermatecontrols. (g) Northern-blot analysis of mature miR-143 and 5S rRNA(loading control) in liver and skeletal muscle (SM) of miR-143DOX mice(T) and wild-type littermate controls (W) without and after 1, 2, 4 and8 days of doxycycline administration. Uncropped images of blots are shownin Supplementary Fig. S9.
To investigate whether the observed alterations in glucosemetabolism are the specific result of transgenic overexpression ofmiR-143, we carried out the same analyses of energy homeostasis
and glucose metabolism in a second line of transgenic mice, wherean shRNA directed to the β-galactosidase gene (LacZ shRNA)was expressed using the same strategy (Fig. 4a). We did not
NATURE CELL BIOLOGY VOLUME 13 | NUMBER 4 | APRIL 2011 437
© 2011 Macmillan Publishers Limited. All rights reserved.
ART I C L E S
Blo
od g
luco
se
(mg
dl–1
)B
lood
glu
cose
(mg
dl–1
)B
lood
glu
cose
(p
erce
ntag
e of
bas
al)
150
100
50
0– Dox
– Dox + Dox
+ Dox– Dox
+ Dox – Dox + Dox
– Dox + Dox
Wild typemiR-143DOX
Wild typemiR-143DOX
Wild typemiR-143DOX
Wild typemiR-143DOX
Wild typemiR-143DOX
Wild typemiR-143DOX
Wild typemiR-143DOX
Wild type
Wild
typ
e
miR-143DOX
Wild type
miR-143DOXmiR
-143
DO
X
600
500
400
300
200
100
00 30 60
Time (min)
Time (min)
90 120
120
100
80
60
40
20
00 15 30 45 60
Blo
od g
luco
se(p
erce
ntag
e of
bas
al)
Time (min)
120
100
80
60
40
20
0
0
0.5
1.0
1.5
0 15 30 45 60
76543210
HO
MA
ind
ex
∗∗
H&E Insulin Glucagon
1.0
0.5
0
Ser
um in
sulin
(ng
ml–1
)S
erum
insu
lin(n
g m
l–1)
Blo
od g
luco
se(m
g d
l–1)
600
500
400
300
200
100
0
Time (min)
∗
∗ ∗
∗
∗
∗
∗∗
6543210
β-c
ell m
ass
(per
cent
age
of a
rea)
0 30 60 90 120
Time (min)0 20 40 60 80 100 120
a b
c
d
e
g
f
h
Figure 3 Impaired glucose metabolism in miR-143-overexpressing mice.(a) Blood glucose concentrations of miR-143DOX mice (−Doxycycline (Dox),n = 22; +Dox, n = 11) and wild-type littermate controls (−Dox, n = 22,+Dox, n=10) before and after doxycycline administration. Concentrationswere measured in overnight-fasted mice. (b) Serum insulin levels ofmiR-143DOX mice (−Dox, n =7; +Dox, n =13) and wild-type littermatecontrols (−Dox, n = 9; +Dox, n = 13) before and after doxycyclineadministration. Concentrations were measured in overnight-fasted mice.(c) Glucose-tolerance test of miR-143DOX mice (−Dox, n = 15; +Dox,n =13) and wild-type littermate controls (−Dox, n =16; +Dox, n =13)before and after doxycycline administration. (d) Insulin-tolerance test ofmiR-143DOX mice (−Dox, n=14; +Dox, n=22) and wild-type littermate
controls (−Dox, n = 15; +Dox, n = 19) before and after doxycyclineadministration. Blood glucose concentrations of miR-143DOX mice andwild-type controls before i.p. administration of insulin were set to100%. (e) HOMA of miR-143DOX mice (−Dox, n = 16; +Dox, n = 13)and wild-type littermate controls (−Dox, n = 16; +Dox, n = 13) beforeand after doxycycline administration. (f) Plasma insulin concentrationsafter glucose bolus injection in miR-143DOX mice (n = 8) and wild-typelittermate controls (n=9). (g) Haematoxylin and eosin (H&E), insulin andglucagon stainings of pancreatic islets in miR-143DOX mice and wild-typelittermate controls. Scale bars 100 µm. (h) Percentage of β-cell mass inmiR-143DOX mice (n = 5) and wild-type littermate controls (n = 5). Allerror bars indicate s.e.m. ∗P ≤0.05, ∗∗P ≤0.01.
find any evidence that induced expression of LacZ shRNA alteredbody weight (Fig. 4b) or changed glucose tolerance or insulinsensitivity in these mice (Fig. 4c–f). Moreover, mice with conditionaloverexpression of miRNA-145 did not exhibit any alterations
in energy or glucose homeostasis (Fig. 4g–l). Collectively, theseexperiments revealed that inducible overexpression of miR-143specifically impairs glucose metabolism through induction ofinsulin resistance.
438 NATURE CELL BIOLOGY VOLUME 13 | NUMBER 4 | APRIL 2011
© 2011 Macmillan Publishers Limited. All rights reserved.

ART I C L E S
CAGGS promoter
CAGGS promoter
CAGGS promoter
CAGGS promoter
itetR
itetR
itetR
itetR
itetR
itetR
H1-tetO
H1-tetO
H1-tetO
H1-tetO
itetR
itetR
LacZ shRNA
+ Doxycycline
+ Doxycycline
Wild typeLacZ shRNADOX
Wild typeLacZ shRNADOX
Wild type
LacZ shRNADOX
Wild type
LacZ shRNADOX
Wild typemiR-145DOX
Wild type
miR-145DOX
600
500
400
300200
100
0
Blo
od g
luco
se(m
g d
l–1)
0 30 60Time (min) Time (min)
90 120
600
500
400
300200
100
0
Blo
od g
luco
se(m
g d
l–1)
0 30 60Time (min)
90 120
miR-145
miR-145
40
30
20
10
0
2.0
1.5
1.0
0.5
0
2.0
1.5
1.0
0.5
0
Bod
y w
eigh
t (g
)B
ody
wei
ght
(g)
Ser
um in
sulin
(ng
ml–1
)H
OM
A in
dex
120
100
80
60
40
20
0
Blo
od g
luco
se(p
erce
ntag
e of
bas
al)
0 15 30 45 60
Time (min)
120
100
80
60
40
20
0
Blo
od g
luco
se(p
erce
ntag
e of
bas
al)
40
30
20
10
0
Wild type
miR-145DOX
Wild type
miR-145DOX
Ser
um in
sulin
(ng
ml–1
)
10.0
7.5
5.0
2.5
0
0
1
2
3
4
5
HO
MA
ind
ex
0 15 30 45 60
a b c
d e f
g h i
j k lWild typemiR-145DOX
Wild type
LacZ shRNADOX
LacZ shRNA
Figure 4 Conditional overexpression of LacZ shRNA or miR-145 does notimpair glucose homeostasis. (a) Schematic representation of transgenefor inducible LacZ shRNA expression. (b) Body weight of LacZ shRNADOX
mice (n = 10) and wild-type littermate controls (n = 10). (c) Seruminsulin levels of LacZ shRNADOX mice (n = 10) and wild-type littermatecontrols (n =10). Concentrations were measured in overnight-fasted mice.(d) Glucose-tolerance test of LacZ shRNADOX mice (n =10) and wild-typelittermate controls (n = 10). (e) Insulin-tolerance test of LacZ shRNADOX
mice (n = 10) and wild-type littermate controls (n = 10). Blood glucoseconcentrations of LacZ shRNADOX mice and wild-type controls before i.p.administration of insulin were set to 100%. (f) HOMA of LacZ shRNADOX
mice (n = 10) and wild-type littermate controls (n = 10). (g) Schematicrepresentation of transgene for inducible miR-145 overexpression. (h) Bodyweight of miR-145DOX mice (n=6) and wild-type littermate controls (n=7).(i) Serum insulin levels of miR-145DOX mice (n=8) and wild-type littermatecontrols (n =8). Concentrations were measured in overnight-fasted mice.(j) Glucose-tolerance test of miR-145DOX mice (n=6) and wild-type littermatecontrols (n =7). (k) Insulin-tolerance test of miR-145DOX mice (n =6) andwild-type littermate controls (n = 7). Blood glucose concentrations ofmiR-145DOX mice and wild-type controls before i.p. administration of insulinwere set to 100%. (l) Homeostatic model assessment of miR-145DOX mice(n=8) and wild-type littermate controls (n=8). All error bars indicate s.e.m.
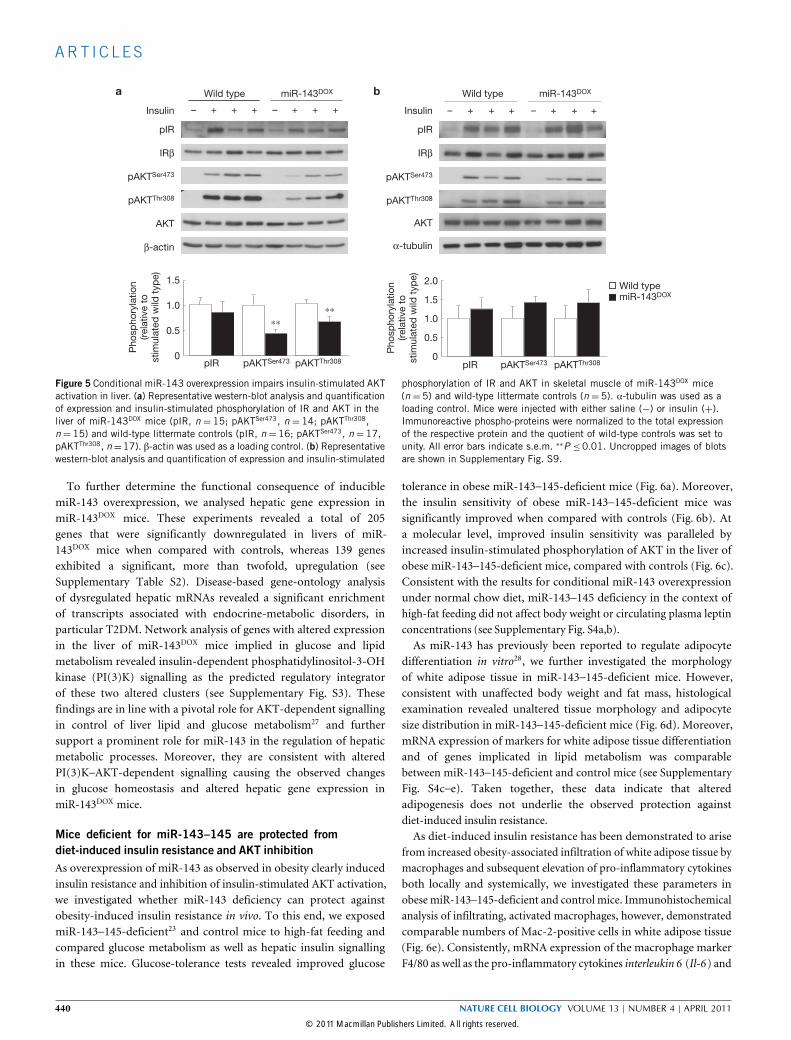
Impaired insulin-stimulated AKT activation in the liver ofmiR-143 transgenic miceTo further investigate the molecular basis of insulin resistancein miR-143DOX mice, we analysed insulin-stimulated signallingin liver and skeletal muscle. Following intravenous (i.v.) insulininjection, tyrosine phosphorylation of the insulin receptor wasunaltered in these organs of miR-143DOX when compared withcontrol mice (Fig. 5a,b). Furthermore, hepatic expression andinsulin-stimulated tyrosine phosphorylation of insulin receptor
substrate 1 (IRS-1) was comparable between miR-143DOX andcontrol mice.In contrast, phosphorylation and thus activation of the downstream
serine/threonine kinase AKT was significantly reduced in liver, butnot skeletal muscle, of miR-143DOX mice (Fig. 5a,b), consistent withincreased miR-143 expression in liver, but not skeletal muscle. Takentogether, these experiments indicate that miR-143 selectively inhibitsinsulin signalling at the level of AKT activation, whereas upstreamreceptor signalling remains intact.
NATURE CELL BIOLOGY VOLUME 13 | NUMBER 4 | APRIL 2011 439
© 2011 Macmillan Publishers Limited. All rights reserved.
ART I C L E S
Wild type miR-143DOX
Insulin + + + + + +– – + + + + + +– –
pIR
IRβ
pAKTSer473
pAKTThr308
AKT
β-actin
Wild type miR-143DOX
Wild typemiR-143DOX
Insulin
pIR
IRβ
pAKTSer473
pAKTThr308
AKT
α-tubulin
Pho
spho
ryla
tion
(rel
ativ
e to
stim
ulat
ed w
ild t
ype) 1.5
1.0
0.5
0 Pho
spho
ryla
tion
(rel
ativ
e to
stim
ulat
ed w
ild t
ype)
pIR pAKTSer473 pAKTThr308 pIR pAKTSer473 pAKTThr308
∗∗∗∗
2.0
1.5
1.0
0.5
0
a b
Figure 5 Conditional miR-143 overexpression impairs insulin-stimulated AKTactivation in liver. (a) Representative western-blot analysis and quantificationof expression and insulin-stimulated phosphorylation of IR and AKT in theliver of miR-143DOX mice (pIR, n = 15; pAKTSer473, n = 14; pAKTThr308,n =15) and wild-type littermate controls (pIR, n =16; pAKTSer473, n =17,pAKTThr308, n=17). β-actin was used as a loading control. (b) Representativewestern-blot analysis and quantification of expression and insulin-stimulated
phosphorylation of IR and AKT in skeletal muscle of miR-143DOX mice(n =5) and wild-type littermate controls (n =5). α-tubulin was used as aloading control. Mice were injected with either saline (−) or insulin (+).Immunoreactive phospho-proteins were normalized to the total expressionof the respective protein and the quotient of wild-type controls was set tounity. All error bars indicate s.e.m. ∗∗P ≤0.01. Uncropped images of blotsare shown in Supplementary Fig. S9.
To further determine the functional consequence of induciblemiR-143 overexpression, we analysed hepatic gene expression inmiR-143DOX mice. These experiments revealed a total of 205genes that were significantly downregulated in livers of miR-143DOX mice when compared with controls, whereas 139 genesexhibited a significant, more than twofold, upregulation (seeSupplementary Table S2). Disease-based gene-ontology analysisof dysregulated hepatic mRNAs revealed a significant enrichmentof transcripts associated with endocrine-metabolic disorders, inparticular T2DM. Network analysis of genes with altered expressionin the liver of miR-143DOX mice implied in glucose and lipidmetabolism revealed insulin-dependent phosphatidylinositol-3-OHkinase (PI(3)K) signalling as the predicted regulatory integratorof these two altered clusters (see Supplementary Fig. S3). Thesefindings are in line with a pivotal role for AKT-dependent signallingin control of liver lipid and glucose metabolism27 and furthersupport a prominent role for miR-143 in the regulation of hepaticmetabolic processes. Moreover, they are consistent with alteredPI(3)K–AKT-dependent signalling causing the observed changesin glucose homeostasis and altered hepatic gene expression inmiR-143DOX mice.
Mice deficient for miR-143–145 are protected fromdiet-induced insulin resistance and AKT inhibitionAs overexpression of miR-143 as observed in obesity clearly inducedinsulin resistance and inhibition of insulin-stimulated AKT activation,we investigated whether miR-143 deficiency can protect againstobesity-induced insulin resistance in vivo. To this end, we exposedmiR-143–145-deficient23 and control mice to high-fat feeding andcompared glucose metabolism as well as hepatic insulin signallingin these mice. Glucose-tolerance tests revealed improved glucose
tolerance in obese miR-143–145-deficient mice (Fig. 6a). Moreover,the insulin sensitivity of obese miR-143–145-deficient mice wassignificantly improved when compared with controls (Fig. 6b). Ata molecular level, improved insulin sensitivity was paralleled byincreased insulin-stimulated phosphorylation of AKT in the liver ofobese miR-143–145-deficient mice, compared with controls (Fig. 6c).Consistent with the results for conditional miR-143 overexpressionunder normal chow diet, miR-143–145 deficiency in the context ofhigh-fat feeding did not affect body weight or circulating plasma leptinconcentrations (see Supplementary Fig. S4a,b).As miR-143 has previously been reported to regulate adipocyte
differentiation in vitro28, we further investigated the morphologyof white adipose tissue in miR-143–145-deficient mice. However,consistent with unaffected body weight and fat mass, histologicalexamination revealed unaltered tissue morphology and adipocytesize distribution in miR-143–145-deficient mice (Fig. 6d). Moreover,mRNA expression of markers for white adipose tissue differentiationand of genes implicated in lipid metabolism was comparablebetween miR-143–145-deficient and control mice (see SupplementaryFig. S4c–e). Taken together, these data indicate that alteredadipogenesis does not underlie the observed protection againstdiet-induced insulin resistance.As diet-induced insulin resistance has been demonstrated to arise
from increased obesity-associated infiltration of white adipose tissue bymacrophages and subsequent elevation of pro-inflammatory cytokinesboth locally and systemically, we investigated these parameters inobese miR-143–145-deficient and control mice. Immunohistochemicalanalysis of infiltrating, activated macrophages, however, demonstratedcomparable numbers of Mac-2-positive cells in white adipose tissue(Fig. 6e). Consistently, mRNA expression of the macrophage markerF4/80 as well as the pro-inflammatory cytokines interleukin 6 (Il-6) and
440 NATURE CELL BIOLOGY VOLUME 13 | NUMBER 4 | APRIL 2011
© 2011 Macmillan Publishers Limited. All rights reserved.

ART I C L E S
500
400
300
200
100
0Blo
od g
luco
se (m
g d
l–1)
Blo
od g
luco
se(p
erce
ntag
e of
bas
al)
Wild typeKnockout
∗∗∗∗
∗∗
0 30 60Time (min)
90 120
120
100
80
60
40Wild typeKnockout20
0
Time (min)0 15 30 45 60
∗ ∗∗∗
Wild type Knockout
Insulin
pIR
p85
pAKT
AKT
ERK1/2
β-actin
IRβ
Wild type
Knockout
H&E
Wild type
Knockout
Mac-2
<0.50.5–1 1–2 2–3 3–4 4–5 5–6
Cell size (μm2)
Per
cent
age
of o
ccur
renc
e
0102030405060 Wild Type
Knockout
4
3
2
1
0Knockout
Knockout
Wild type
Wild type
Wild typeKnockout
Mac
-2-p
ositi
ve c
ells
(per
cent
age
ofco
unte
d c
ells
)
Liver
Liver SM
SM
p-c-Jun
JNK input
0
0.5
1.0
1.5
2.0
2.5
Pho
spho
-c-J
un/J
NK
(rel
ativ
e to
wild
typ
e)
2.5
2.0
1.5
1.0
0.5
0
mR
NA
exp
ress
ion
(rel
ativ
e to
wild
typ
e) Wild typeKnockout
Wild typeKnockout
F4/80 II-6 Tnf- α
3.02.52.01.51.00.5
0Pho
spho
ryla
tion
(rel
ativ
e to
sim
ulat
ed w
ild t
ype)
a b
c
f
d
e
g
pIR pAKT
∗∗
Knockout
Wild type
Figure 6 miR-143–145-deficient mice are protected from diet-inducedinsulin resistance and hepatic AKT inhibition. (a) Glucose-tolerance testof miR-143–145 knockout mice (n=12) and wild-type littermate controls(n = 12), on a high-fat diet. (b) Insulin-tolerance test of miR-143–145knockout mice (n = 12) and wild-type littermate controls (n = 12) on ahigh-fat diet. Blood glucose concentrations of miR-143–145 knockoutmice and wild-type controls before i.p. administration of insulin were setto 100%. (c) Representative western-blot analysis and quantification ofexpression and insulin-stimulated phosphorylation of indicated proteinsin the liver of miR-143–145 knockout mice (pIR, n = 7; pAKT, n = 7)and wild-type controls (pIR, n = 8; pAKT, n = 8) on a high-fat diet.Mice were injected with either saline (−) or insulin (+). Immunoreactivephospho-proteins were normalized to the total expression of the respectiveprotein and the quotient of wild-type controls was set to unity. β-actin wasused as a loading control. (d) Haematoxylin and eosin (H&E) staining andadipocyte size distribution of epigonadal white-adipose-tissue sections from
miR-143–145 knockout mice (n = 3) and wild-type controls (n = 3) on ahigh-fat diet. Scale bar 100 µm. (e) Mac-2 staining and quantification ofwhite adipose tissue sections from miR-143–145 knockout mice (n = 3)and wild-type controls (n = 3) on a high-fat diet. Scale bar 100 µm. Redarrows indicate cells surrounded by a Mac-2-positive area. (f) Real-timePCR analysis of F4/80, Il-6 and Tnf -α mRNA expression in whiteadipose tissue of miR-143–145 knockout mice (n = 5), compared withwild-type controls (n = 5), on a high-fat diet. Expression of mRNAs wasnormalized to Gusb and Hprt mRNA and set to unity in wild-type controls.(g) Representative western-blot analysis of in vitro phosphorylation of c-Jun(p-c-Jun) in liver and skeletal muscle (SM) lysates from miR-143–145knockout mice (n = 4) and wild-type controls (n = 4) on a high-fat diet.Immunoreactive phospho-c-Jun was normalized to total JNK input and thequotient of wild-type controls was set to unity. All error bars indicate s.e.m.∗P ≤0.05, ∗∗P ≤0.01, ∗∗∗P ≤0.001. Uncropped images of blots are shownin Supplementary Fig. S9.
tumour-necrosis factor-α (Tnf -α) was unaltered in white adipose tissueof miR-143–145-deficient mice (Fig. 6f). Activation of inflammatory
signalling cascades such as c-Jun N-terminal kinase (JNK) signallingin liver and skeletal muscle has been demonstrated to be critical in the
NATURE CELL BIOLOGY VOLUME 13 | NUMBER 4 | APRIL 2011 441
© 2011 Macmillan Publishers Limited. All rights reserved.

ART I C L E S
development of insulin resistance; we therefore directly determinedJNK activity in these tissues, but did not detect significant differencesbetweenmiR-143–145-deficient and controlmice (Fig. 6g).Thus, miR-143–145 deficiency in vivo protects from diet-induced
inhibition of AKT activation and partly restores diet-induceddeterioration of glucose metabolism in the absence of alteredadipose-tissue mass, macrophage infiltration or systemic JNKactivation, substantiating that increased expression of miR-143critically contributes to obesity-induced insulin resistance.
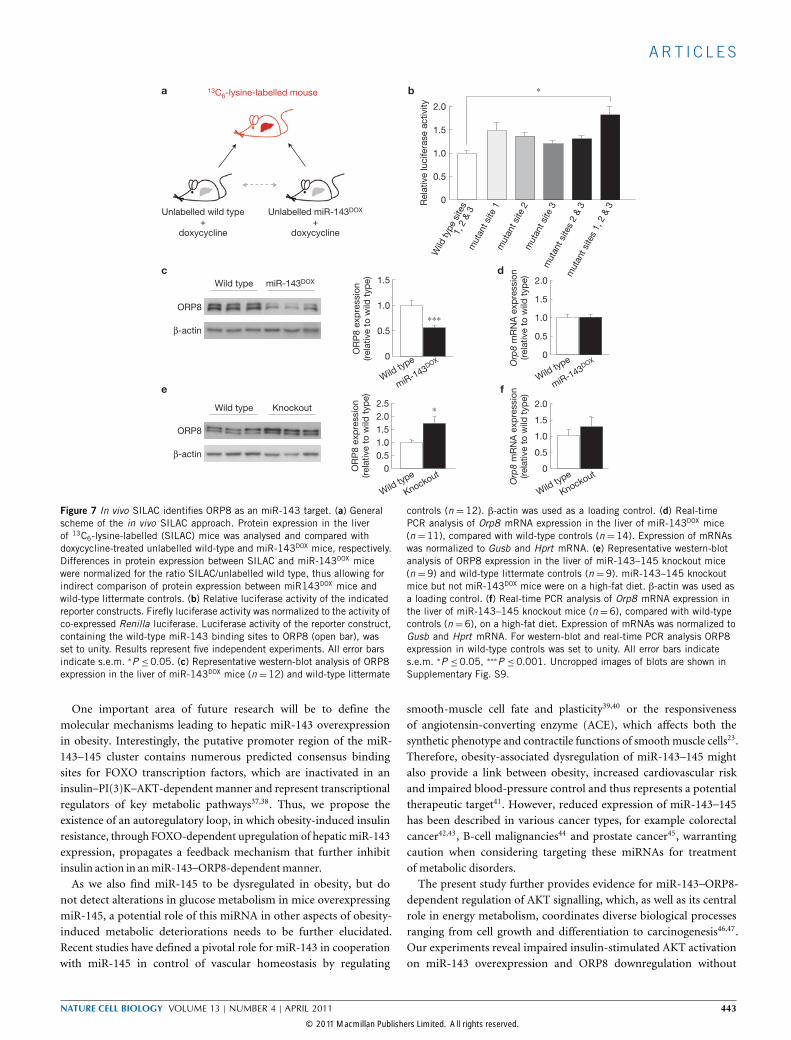
In vivo SILAC identifies ORP8 as an miR-143 targetTo identify the molecular target(s) of miR-143 in the development ofinsulin resistance, we next employed in vivo stable isotope labellingof amino acids (SILAC; ref. 29) for quantitative-mass-spectrometry-based analysis of hepatic protein expression in miR-143DOX mice.Protein lysates extracted from hepatocytes of doxycycline-treatedmiR-143DOX and control mice were mixed 1:1 with extracts ofprimary hepatocytes from mice that had been labelled with 13C6-lysine in vivo (SILAC mice). Mixing lysates of control mice withSILAC lysates and mixing SILAC lysates with miR-143DOX lysatesallowed for indirect comparison of protein expression betweenmiR-143DOX and control mice (Fig. 7a). Independent processingof two samples from miR-143DOX and control mice enabledus to determine the relative abundance of 2,043 proteins. Ofthese, peptide fragments of 1,463 proteins were detectable inboth experiments (72% overlap), of which 214 proteins wereupregulated and 48 were downregulated by 25% or more in liverextracts of miR-143DOX when compared with control mice (seeSupplementary Table S3).In an attempt to identify bona fide targets undergoing miR-143-
dependent post-transcriptional silencing, we analysed the proteinsdownregulated on miR-143 overexpression for predicted miR-143binding sites in their 3′ untranslated region (UTR). Five proteinsexhibited predicted 3′-UTR binding sites for miR-143, and one ofthem—namely ORP8—had three predicted miR-143 binding sites (seeSupplementary Table S4).The functional significance of the predicted ORP8 3′-UTRmiR-
143-interaction sites was tested employing luciferase reporter assays.Overexpressed intact miR-143 target sites, but not mutant miR-143 target sites, were able to mediate repression of reporter-geneactivity (Fig. 7b). Repression of reporter-gene activity was mostefficiently reversed on mutation of target site 1, and mutation ofall three binding sites resulted in a significant twofold increase inluciferase activity. These data indicate that all three binding sites ofmiR-143 in the 3′ UTR of ORP8 cooperatively confer repression ofreporter-gene activity.Analysis of hepatic ORP8 expression confirmed a signif-
icant downregulation of ORP8 protein expression by 50%in miR-143DOX mice when compared with controls (Fig. 7c),whereas Orp8 mRNA expression remained unaltered (Fig. 7d).Conversely, hepatic ORP8 expression in miR-143–145-deficientmice was increased 1.9-fold when compared with controls(Fig. 7e), again in the absence of significant alterations ofOrp8 mRNA expression (Fig. 7f). Taken together, these ap-proaches revealed ORP8 as a target for miR-143-dependent post-transcriptional gene silencing.
ORP8 promotes insulin-stimulated AKT activationORP8 is expressed at high levels in macrophages30, followedby substantial expression in liver and brain and little or noexpression in heart, skeletal muscle and white adipose tissue(Fig. 8a). ORP8 binds 25-OH-cholesterol, which in turn has beenshown to regulate AKT signalling during apoptosis by promotingproteasomal degradation of AKT and/or inhibition of PI(3)Kin macrophages31,32. To directly investigate a potential role forORP8 in control of insulin-stimulated AKT activation, we analysedAKT phosphorylation in insulin-stimulated HepG2 cells transfectedwith short interfering RNAs (siRNAs) directed to human ORP8(Orp8 siRNAs). Western-blot analysis revealed successful reductionof ORP8 protein expression by 80% or more in cells transfectedwith Orp8 siRNAs, whereas no reduction was detected in cellstransfected with control siRNAs (Fig. 8b). Interestingly, insulin-stimulated AKT activation and consistently phosphorylation of theAKT substrate glycogen synthase kinase 3β (GSK3β) were reduced inORP8-depleted cells (Fig. 8c).To further substantiate the requirement of ORP8 expression for
ability of insulin to stimulate AKT phosphorylation, we generatedimmortalized murine liver cells that stably express two differentshRNAs directed to murine ORP8 (Orp8 shRNA) or a control shRNA.Western-blot analysis confirmed that the clones expressing either ofthe Orp8 shRNAs exhibited greatly reduced ORP8 expression (Fig. 8d).Moreover, these cells exhibited a significant reduction of insulin-stimulated AKT activation (Fig. 8e,f). Consistent with impaired AKTactivation, insulin-stimulated phosphorylation of the AKT target, theforkhead O-family (FOXO) transcription factors, was also significantlyimpaired in ORP8-depleted cells (Fig. 8e,g). Taken together, ourresults indicate that OPR8 affects insulin’s ability to regulate AKTphosphorylation and downstream kinase signalling in liver cells.
DISCUSSIONOur finding that miR-143–145 expression is dysregulated in db/dbmice is consistent with other studies describing miR-143 as beingup- or downregulated in tissues of ob/ob (refs 28,33), diet-inducedobese33,34 and diabetic mice35 as well as human patients36. At present itis unclear whether differences in genetic background, diet compositionor miRNA-detection methods account for the variable findingswith respect to miR-143 expression in adipose tissue28,33,34 andliver35 of these models.However, the physiological relevance of dysregulated miR-143
expression in obesity has remained elusive so far. Studies addressingthe role of miR-143 in adipose tissue by gain- or loss-of-functionapproaches provided evidence for an adipocyte-differentiation-promoting effect of miR-143 in vitro28,33. In contrast, our studies inmiR-143–145-deficient mice reveal that both miRNAs seem to bedispensable for adipose-tissue formation and maintenance in vivo.Nevertheless, our finding of increased hepatic miR-143 expressionin two different obesity mouse models and the discovery that miR-143affects hepatic insulin action and systemic glucose homeostasis invivo, as independently demonstrated by overexpression and knockoutmouse models, characterize miR-143 as an integrator of metabolicsignalling. This provides functional evidence for a role of altered post-transcriptional gene silencing in the development of obesity-associatedinsulin resistance in vivo.
442 NATURE CELL BIOLOGY VOLUME 13 | NUMBER 4 | APRIL 2011
© 2011 Macmillan Publishers Limited. All rights reserved.
ART I C L E S
Wild type miR-143DOX
Wild type Knockout
ORP8
β-actin
ORP8
β-actin
Wild
type
site
s1,
2 &
3m
utan
t site
1m
utan
t site
2m
utan
t site
3m
utan
t site
s 2
& 3
mut
ant s
ites
1, 2
& 3
Rel
ativ
e lu
cife
rase
act
ivity 2.0
1.5
1.0
0.5
0
∗
∗∗∗
∗
1.5
1.0
0.5
0OR
P8
exp
ress
ion
(rel
ativ
e to
wild
typ
e)Wild type
miR-143DOXOrp
8 m
RN
A e
xpre
ssio
n(r
elat
ive
to w
ild t
ype)
OR
P8
exp
ress
ion
(rel
ativ
e to
wild
typ
e)
2.5
1.51.0
2.0
0.50
2.0
1.5
1.0
0.5
0
Orp
8 m
RN
A e
xpre
ssio
n(r
elat
ive
to w
ild t
ype)
2.0
1.5
1.0
0.5
0
Wild type
Knockout
a
c d
e f
b
Unlabelled wild type +
doxycycline
Unlabelled miR-143DOX +
doxycycline
13C6-lysine-labelled mouse
Wild type
Knockout
Wild type
miR-143DOX
Figure 7 In vivo SILAC identifies ORP8 as an miR-143 target. (a) Generalscheme of the in vivo SILAC approach. Protein expression in the liverof 13C6-lysine-labelled (SILAC) mice was analysed and compared withdoxycycline-treated unlabelled wild-type and miR-143DOX mice, respectively.Differences in protein expression between SILAC and miR-143DOX micewere normalized for the ratio SILAC/unlabelled wild type, thus allowing forindirect comparison of protein expression between miR143DOX mice andwild-type littermate controls. (b) Relative luciferase activity of the indicatedreporter constructs. Firefly luciferase activity was normalized to the activity ofco-expressed Renilla luciferase. Luciferase activity of the reporter construct,containing the wild-type miR-143 binding sites to ORP8 (open bar), wasset to unity. Results represent five independent experiments. All error barsindicate s.e.m. ∗P ≤0.05. (c) Representative western-blot analysis of ORP8expression in the liver of miR-143DOX mice (n=12) and wild-type littermate
controls (n = 12). β-actin was used as a loading control. (d) Real-timePCR analysis of Orp8 mRNA expression in the liver of miR-143DOX mice(n =11), compared with wild-type controls (n =14). Expression of mRNAswas normalized to Gusb and Hprt mRNA. (e) Representative western-blotanalysis of ORP8 expression in the liver of miR-143–145 knockout mice(n =9) and wild-type littermate controls (n =9). miR-143–145 knockoutmice but not miR-143DOX mice were on a high-fat diet. β-actin was used asa loading control. (f) Real-time PCR analysis of Orp8 mRNA expression inthe liver of miR-143–145 knockout mice (n =6), compared with wild-typecontrols (n=6), on a high-fat diet. Expression of mRNAs was normalized toGusb and Hprt mRNA. For western-blot and real-time PCR analysis ORP8expression in wild-type controls was set to unity. All error bars indicates.e.m. ∗P ≤0.05, ∗∗∗P ≤0.001. Uncropped images of blots are shown inSupplementary Fig. S9.
One important area of future research will be to define themolecular mechanisms leading to hepatic miR-143 overexpressionin obesity. Interestingly, the putative promoter region of the miR-143–145 cluster contains numerous predicted consensus bindingsites for FOXO transcription factors, which are inactivated in aninsulin–PI(3)K–AKT-dependent manner and represent transcriptionalregulators of key metabolic pathways37,38. Thus, we propose theexistence of an autoregulatory loop, in which obesity-induced insulinresistance, through FOXO-dependent upregulation of hepatic miR-143expression, propagates a feedback mechanism that further inhibitinsulin action in anmiR-143–ORP8-dependentmanner.As we also find miR-145 to be dysregulated in obesity, but do
not detect alterations in glucose metabolism in mice overexpressingmiR-145, a potential role of this miRNA in other aspects of obesity-induced metabolic deteriorations needs to be further elucidated.Recent studies have defined a pivotal role for miR-143 in cooperationwith miR-145 in control of vascular homeostasis by regulating
smooth-muscle cell fate and plasticity39,40 or the responsivenessof angiotensin-converting enzyme (ACE), which affects both thesynthetic phenotype and contractile functions of smooth muscle cells23.Therefore, obesity-associated dysregulation of miR-143–145 mightalso provide a link between obesity, increased cardiovascular riskand impaired blood-pressure control and thus represents a potentialtherapeutic target41. However, reduced expression of miR-143–145has been described in various cancer types, for example colorectalcancer42,43, B-cell malignancies44 and prostate cancer45, warrantingcaution when considering targeting these miRNAs for treatmentof metabolic disorders.The present study further provides evidence for miR-143–ORP8-
dependent regulation of AKT signalling, which, as well as its centralrole in energy metabolism, coordinates diverse biological processesranging from cell growth and differentiation to carcinogenesis46,47.Our experiments reveal impaired insulin-stimulated AKT activationon miR-143 overexpression and ORP8 downregulation without
NATURE CELL BIOLOGY VOLUME 13 | NUMBER 4 | APRIL 2011 443
© 2011 Macmillan Publishers Limited. All rights reserved.

ART I C L E S
∗∗∗
∗∗
–
ORP8
AKT
Mac
roph
ages
Live
r
Brain
Heart
SM WAT
ORP8
β-actin
ORP8
β-actin
– Contro
lOrp
8.1
siRNA
Orp8.
2 siR
NA Control
Control
Insulin
pAKT
pGSK3α/β
β-actin
Orp8.1 siRNA
Orp8.1 shRNA
Orp8.2 siRNA
Orp8.2shRNA
pAKT
pFOXO
pGSK3α/β
–Insulin
ControlOrp8 shRNA
ControlOrp8 shRNA
Dos
e-d
epen
den
t p
hosp
hory
latio
n p
FOX
O/β
-act
in
2.0
1.5
1.0
0.5
00.1 1 10
Insulin (nM)100
Dos
e-d
epen
den
t p
hosp
hory
latio
n p
AK
T/β-
actin
4
3
2
1
00.1 1 10
Insulin (nM)100
∗∗∗
Control Orp8.1 shRNA Orp8.2 shRNA
a
b c
d e
f g
β-actin
Figure 8 Downregulation of ORP8 in cultured liver cells impairs insulin-stimulated AKT activation. (a) Western-blot analysis of ORP8 expressionin the indicated tissues of wild-type C57BL/6 mice. AKT was used as aloading control. (b) Western-blot analysis of ORP8 expression in HepG2cells transfected with the indicated siRNA oligonucleotides. β-actin wasused as a loading control. (c) Western-blot analysis of insulin-stimulatedphosphorylation of AKT and GSK3 in HepG2 cells transfected with theindicated siRNA oligonucleotides. β-actin was used as a loading control.Serum-depleted cells were stimulated with either saline (−) or increasingconcentrations of insulin (0.1–100nM). (d) Western-blot analysis of ORP8expression in retroviral-transformed Hepa1–6 cell clones stably expressingthe indicated shRNA. β-actin was used as a loading control. (e) Rep-resentative western-blot analysis of insulin-stimulated phosphorylation of
AKT, GSK3 and FOXO levels in Hepa1–6 cell clones stably expressing theindicated shRNA. β-actin was used as a loading control. Serum-depleted cellswere stimulated with either saline (−) or increasing concentrations of insulin(0.1–100nM). (f) Quantification of dose-dependent insulin-stimulated AKTphosphorylation. Protein expression was quantified in six independentcontrol-shRNA- and Orp8 -shRNA-expressing Hepa1–6 cell clones. Relativevalues represent the average of three independent experiments for each clone.(g) Quantification of dose-dependent insulin-stimulated FOXO phosphoryla-tion. Protein expression was quantified in six independent control-shRNA-and Orp8 -shRNA-expressing Hepa1–6 cell clones. Relative values representthe average of three independent experiments for each clone. All error barsindicate s.e.m. ∗P ≤ 0.05,∗∗P ≤ 0.01,∗∗∗P ≤ 0.001. Uncropped images ofblots are shown in Supplementary Fig. S9.
an impact on insulin receptor–IRS-1 activation, indicating thatORP8 acts closely upstream of or directly at AKT phosphorylation.Although previous work in haematopoetic cells has demonstratedthat 25-OH cholesterol, an ORP8 ligand, inhibits AKT signallingthrough induction of AKT degradation48, we find that in hepatocytes25-OH-cholesterol-dependent inhibition of insulin-stimulated AKTactivation occurs in the absence of altered AKT expression, arguing foran extra regulatory mechanism of oxysterol-dependent AKT inhibitionin liver. However, the exact mechanism of ORP8-mediated AKTinhibition remains enigmatic at this point, as do the functions ofORPs in general.
ORPs act as sterol sensors that relay information to diverse cellularprocesses such as intracellular sterol transport, integration of sterol andsphingomyelin metabolism, regulation of neutral lipid metabolism,secretory vesicle generation and microtubule-based motility of endo-lysosomes49. A direct oxysterol-dependent regulation of kinase activityhas been revealed for oxysterol-binding protein (OSBP)—the ‘foundingmember’ of the ORP family. OSBP interacts with a member ofthe PTPPBS (protein tyrosine phosphatase (PC12, Br7, Sl)) familyof tyrosine phosphatases, the serine–threonine phosphatase proteinphosphatase 2 (PP2A) and cholesterol to regulate extracellular signal-regulated kinase (ERK) phosphorylation. When exposed to oxysterols
444 NATURE CELL BIOLOGY VOLUME 13 | NUMBER 4 | APRIL 2011
© 2011 Macmillan Publishers Limited. All rights reserved.
ART I C L E S
or on low cellular cholesterol levels, the oligomer disassembles andERK phosphorylation increases50. As PP2A activity represents animportant regulator of AKT activation51, we are at present investigatingthe possibility of an oxysterol-ORP8-dependent regulation of AKTphosphatases. In addition, we cannot rule out the existence of furthermiR-143 target(s) that regulate insulin- and AKT-dependent signallingand still await identification.Our study also provides general technical advances in studying
miRNA function in vivo. Given the pleiotropic roles of miRNAs indevelopmental processes, the establishment of a generally applicabletechnology to conditionally overexpress miRNAs in transgenic miceprovides an important tool for miRNA research. Further adaptations ofthe expression system, such as inclusion of a loxP-flanked stop-cassettein the H1 promoter, will further enable inducible tissue-specificmiRNA expression52.The combination of inducible miRNA overexpression in mice
with SILAC-based quantitative mass spectrometry enabled us toidentify ORP8 as an miR-143 target regulated at the level of mRNAtranslation, further underlining large-scale protein quantification as anindispensable tool to unravel miRNA targets.Our present study has identified an miR-143-controlled ORP8-
dependent regulatory pathway of AKT signalling in obesity and thussets the stage to develop miR-143, ORP8 and potentially other miR-143target genes as future therapeutic targets for obesity-associated insulinresistance, diabetes and other obesity-associated diseases. �
METHODSMethods and any associated references are available in the onlineversion of the paper at http://www.nature.com/naturecellbiology/
Note: Supplementary Information is available on the Nature Cell Biology website
ACKNOWLEDGEMENTSWe thank G. Schmall and T. Rayle for secretarial assistance and B. Hampel,S. Irlenbusch and J. Alber for technical assistance. We thank B. Schumacher,M. C. Vogt and P. Frommolt for support with the bioinformatics analysis of geneexpression and SILAC data. This work was supported by the ZMMK (J.C.B.), theEuropeanCommunity’s Seventh Framework Programme (grant FP7/2007–2013, no201608 to J.C.B.), the DFG (grant 1492-7 to J.C.B.), the Academy of Finland (grant121457 to V.M.O.) and the Sigrid Juselius Foundation (V.M.O.).
AUTHOR CONTRIBUTIONSS.D.J. and J.C.B. designed the research; S.D.J. carried out most of the experiments;M.K. carried out in vivo SILAC analyses; D.M.W. and N.R. provided extra technicalassistance; F.T.W. helped to design cloning strategies; H.S.B. analysed energyexpenditure in miR-143DOX mice; C.M. carried out luciferase assays; H.K. helpedwith lentivirus experiments; V.M.O. provided ORP8 antibody and shRNA ORP8lentiviruses. T. Böttger and T. Braun provided miR143–145 knockout mice; J.S. inpart generated miR-143DOX and miR-145DOX mice and provided LacZ shRNADOX
mice. S.D.J. and J.C.B. wrote the manuscript. All authors participated in theinterpretation of the data and production of the final manuscript.
COMPETING FINANCIAL INTERESTSThe authors declare no competing financial interests.
Published online at http://www.nature.com/naturecellbiologyReprints and permissions information is available online at http://npg.nature.com/reprintsandpermissions/
1. Mokdad, A. H. et al. The continuing increase of diabetes in the US. Diabetes Care24, 412 (2001).
2. Froguel, P., Velho, G., Passa, P. & Cohen, D. Genetic determinants of type 2 diabetesmellitus: lessons learned from family studies. Diabete Metab. 19, 1–10 (1993).
3. Bruning, J. C. et al. Development of a novel polygenic model of NIDDM in miceheterozygous for IR and IRS-1 null alleles. Cell 88, 561–572 (1997).
4. Martin, B. C. et al. Role of glucose and insulin resistance in development oftype 2 diabetes mellitus: results of a 25-year follow-up study. Lancet 340,925–929 (1992).
5. Kahn, C. R. Banting Lecture. Insulin action, diabetogenes, and the cause of type IIdiabetes. Diabetes 43, 1066–1084 (1994).
6. Moller, D. E., Yokota, A., White, M. F., Pazianos, A. G. & Flier, J. S. A naturallyoccurring mutation of insulin receptor alanine 1134 impairs tyrosine kinase functionand is associated with dominantly inherited insulin resistance. J. Biol. Chem. 265,14979–14985 (1990).
7. Almind, K. et al. Aminoacid polymorphisms of insulin receptor substrate-1 innon-insulin-dependent diabetes mellitus. Lancet 342, 828–832 (1993).
8. George, S. et al. A family with severe insulin resistance and diabetes due to amutation in AKT2. Science 304, 1325–1328 (2004).
9. Puig, O. & Tjian, R. Transcriptional feedback control of insulin receptor bydFOXO/FOXO1. Genes Lancet Dev. 19, 2435–2446 (2005).
10. Aguirre, V., Uchida, T., Yenush, L., Davis, R. & White, M. F. The c-Jun NH(2)-terminalkinase promotes insulin resistance during association with insulin receptor substrate-1 and phosphorylation of Ser(307). J. Biol. Chem. 275, 9047–9054 (2000).
11. Zhande, R., Mitchell, J. J., Wu, J. & Sun, X. J. Molecular mechanism ofinsulin-induced degradation of insulin receptor substrate 1. Mol. Cell Biol. 22,1016–1026 (2002).
12. Lagos-Quintana, M., Rauhut, R., Lendeckel, W. & Tuschl, T. Identification of novelgenes coding for small expressed RNAs. Science 294, 853–858 (2001).
13. Lau, N. C., Lim, L. P., Weinstein, E. G. & Bartel, D. P. An abundant class oftiny RNAs with probable regulatory roles in Caenorhabditis elegans. Science 294,858–862 (2001).
14. Lee, R. C. & Ambros, V. An extensive class of small RNAs in Caenorhabditis elegans.Science 294, 862–864 (2001).
15. Lee, R. C., Feinbaum, R. L. & Ambros, V. The C. elegans heterochronic genelin-4 encodes small RNAs with antisense complementarity to lin-14. Cell 75,843–854 (1993).
16. Xu, P., Vernooy, S. Y., Guo, M. & Hay, B. A. The Drosophila microRNA Mir-14suppresses cell death and is required for normal fat metabolism. Curr. Biol. 13,790–795 (2003).
17. Poy, M. N. et al. A pancreatic islet-specific microRNA regulates insulin secretion.Nature 432, 226–230 (2004).
18. Poy, M. N., Spranger, M. & Stoffel, M. microRNAs and the regulation of glucose andlipid metabolism. Diabetes Obes. Metab. 9 (Suppl 2), 67–73 (2007).
19. Saxena, R. et al. Genome-wide association analysis identifies loci for type 2 diabetesand triglyceride levels. Science 316, 1331–1336 (2007).
20. Scott, L. J. et al. A genome-wide association study of type 2 diabetes in Finns detectsmultiple susceptibility variants. Science 316, 1341–1345 (2007).
21. Coleman, D. L. Obese and diabetes: two mutant genes causing diabetes-obesitysyndromes in mice. Diabetologia 14, 141–148 (1978).
22. Chen, H. et al. Evidence that the diabetes gene encodes the leptin receptor:identification of a mutation in the leptin receptor gene in db/db mice. Cell 84,491–495 (1996).
23. Boettger, T. et al. Acquisition of the contractile phenotype by murine arterialsmooth muscle cells depends on the Mir143/145 gene cluster. J. Clin. Invest. 119,2634–2647 (2009).
24. Gangaraju, V. K. & Lin, H. MicroRNAs: key regulators of stem cells. Nat. Rev. Mol.Cell Biol. 10, 116–125 (2009).
25. Seibler, J. et al. Reversible gene knockdown in mice using a tight, inducible shRNAexpression system. Nucleic Acids Res. 35, e54 (2007).
26. Koch, L. et al. Central insulin action regulates peripheral glucose and fat metabolismin mice. J. Clin. Invest. 118, 2132–2147 (2008).
27. Leavens, K. F., Easton, R. M., Shulman, G. I., Previs, S. F. & Birnbaum, M. J. Akt2is required for hepatic lipid accumulation in models of insulin resistance. Cell Metab.10, 405–418 (2009).
28. Esau, C. et al. MicroRNA-143 regulates adipocyte differentiation. J. Biol. Chem.279, 52361–52365 (2004).
29. Kruger, M. et al. SILAC mouse for quantitative proteomics uncovers kindlin-3 as anessential factor for red blood cell function. Cell 134, 353–364 (2008).
30. Yan, D. et al. OSBP-related protein 8 (ORP8) suppresses ABCA1 expression andcholesterol efflux from macrophages. J. Biol. Chem. 283, 332–340 (2008).
31. Rusinol, A. E. et al. AKT/protein kinase B regulation of BCL family members duringoxysterol-induced apoptosis. J. Biol. Chem. 279, 1392–1399 (2004).
32. Vejux, A. et al. Phospholipidosis and down-regulation of the PI3-K/PDK-1/Aktsignalling pathway are vitamin E inhibitable events associated with 7-ketocholesterol-induced apoptosis. J. Nutr. Biochem. 20, 45–61 (2009).
33. Xie, H., Lim, B. & Lodish, H. F. MicroRNAs induced during adipogenesis thataccelerate fat cell development are downregulated in obesity. Diabetes 58,1050–1057 (2009).
34. Takanabe, R. et al. Up-regulated expression of microRNA-143 in association withobesity in adipose tissue of mice fed high-fat diet. Biochem. Biophys. Res. Commun.376, 728–732 (2008).
35. Li, S. et al. Differential expression of microRNAs in mouse liver under aberrant energymetabolic status. J. Lipid Res. 50, 1756–1765 (2009).
36. Gallagher, I.J. et al. Integration of microRNA changes in vivo identifies novelmolecular features of muscle insulin resistance in type 2 diabetes. Genome Med.2, 9 (2010).
NATURE CELL BIOLOGY VOLUME 13 | NUMBER 4 | APRIL 2011 445
© 2011 Macmillan Publishers Limited. All rights reserved.

ART I C L E S
37. Brunet, A. et al. Akt promotes cell survival by phosphorylating and inhibiting aForkhead transcription factor. Cell 96, 857–868 (1999).
38. Accili, D. & Arden, K. C. FoxOs at the crossroads of cellular metabolism,differentiation, and transformation. Cell 117, 421–426 (2004).
39. Cordes, K. R. et al. miR-145 and miR-143 regulate smooth muscle cell fate andplasticity. Nature 460, 705–710 (2009).
40. Xin, M. et al. MicroRNAs miR-143 and miR-145 modulate cytoskeletaldynamics and responsiveness of smooth muscle cells to injury. Genes Dev. 23,2166–2178 (2009).
41. Zhou, L. et al. Prevalence, incidence and risk factors of chronic heart failurein the type 2 diabetic population: systematic review. Curr. Diabetes Rev. 5,171–184 (2009).
42. Michael, M. Z., SM, O. C., van Holst Pellekaan, N. G., Young, G. P. & James, R. J.Reduced accumulation of specific microRNAs in colorectal neoplasia. Mol. CancerRes. 1, 882–891 (2003).
43. Slaby, O. et al. Altered expression of miR-21, miR-31, miR-143 and miR-145 is related to clinicopathologic features of colorectal cancer. Oncology 72,397–402 (2007).
44. Akao, Y., Nakagawa, Y., Kitade, Y., Kinoshita, T. & Naoe, T. Downregula-tion of microRNAs-143 and -145 in B-cell malignancies. Cancer Sci. 98,1914–1920 (2007).
45. Clape, C. et al. miR-143 interferes with ERK5 signaling, and abrogates prostatecancer progression in mice. PLoS One 4, e7542 (2009).
46. Whiteman, E. L., Cho, H. & Birnbaum, M. J. Role of Akt/protein kinase B inmetabolism. Trends Endocrinol. Metab. 13, 444–451 (2002).
47. Toker, A. & Yoeli-Lerner, M. Akt signaling and cancer: surviving but not moving on.Cancer Res. 66, 3963–3966 (2006).
48. Liu, J., Netherland, C., Pickle, T., Sinensky, M. S. & Thewke, D. P. Stimulationof Akt poly-ubiquitination and proteasomal degradation in P388D1 cells by7-ketocholesterol and 25-hydroxycholesterol. Arch. Biochem. Biophys. 487,54–58 (2009).
49. Olkkonen, V. M. et al. The OSBP-related proteins (ORPs): global sterol sensorsfor co-ordination of cellular lipid metabolism, membrane trafficking and signallingprocesses? Biochem. Soc. Trans. 34, 389–391 (2006).
50. Wang, P. Y., Weng, J. & Anderson, R. G. OSBP is a cholesterol-regulatedscaffolding protein in control of ERK 1/2 activation. Science 307,1472–1476 (2005).
51. Ugi, S. et al. Protein phosphatase 2A negatively regulates insulin’s metabolicsignaling pathway by inhibiting Akt (protein kinase B) activity in 3T3-L1 adipocytes.Mol. Cell Biol. 24, 8778–8789 (2004).
52. Ventura, A. et al. Cre-lox-regulated conditional RNA interference from transgenes.Proc. Natl Acad. Sci. USA 101, 10380–10385 (2004).
446 NATURE CELL BIOLOGY VOLUME 13 | NUMBER 4 | APRIL 2011
© 2011 Macmillan Publishers Limited. All rights reserved.
DOI: 10.1038/ncb2211 METHODS
METHODSAnimal care. Care of all animals was within institutional animal-care committeeguidelines, and all procedures were approved by local government authorities(Bezirksregierung Köln) and were in accordance with NIH guidelines. Micewere housed in groups of three to five at 22–24 ◦C using a 12 h light–12 hdark cycle with lights on at 06:00. Unless otherwise stated, animals were fednormal chow diet (Teklad Global Rodent no. T.2018.R12; Harlan). Eight-week-olddoxycycline-inducible transgenic mice and C57BL/6 littermates (wild type) wereadministered drinking water supplemented with 10% sucrose (AppliChem) plus4mgml−1 doxycycline hyclate (Sigma-Aldrich) for 4 weeks unless stated otherwise.Doxycycline-supplementedwater was protected from light and changed every 2 days.The animals had ad libitum access to water at all times, and food was only withdrawnif required for an experiment. Diet-induced obesity was obtained by feeding ahigh-fat diet (no. C1057; Altromin) containing 32.7% carbohydrates, 20% proteinand 35.5% fat (55.2% of calories from fat) for at least 8 weeks.
Cloning of small RNAmolecules. Total RNA (600 µg) isolated from the liver wasseparated on a 15% (w/v) denaturing polyacrylamide gel. A total of 19–24 nucleotidesmall RNAs were recovered from the gel and used as input for adaptor ligation.Adaptor ligation and PCRwith reverse transcription (RT–PCR) of the ligation prod-uct (5′ RT–PCR primer first PCR 5′-CAGCCAACGGAATTCCTCACTAAA-3′; 3′
RT–PCR primer first PCR 5′-GACTAGCTTGGTGCCGAATCGCGGTTAAA-3′; 5′
RT–PCR primer second PCR 5′-GAGCCAACAGGCCCGAATTCCTCACTAAA-3′;3′ RT–PCR primer second PCR 5′-GACTAGCTTGGTGCCGAATCGCGGTTAAA-3′) was carried out as described in Current Protocols in Molecular Biology53. Con-catamers containing isolated small RNAs flanked by adapter sequences were clonedinto the pCR2.1 vector (Invitrogen) and automatically sequenced using M13 Fprimer 5′-GTAAAACGACGGCCAG-3′ (MWG).
Northern-blot analysis. Indicated tissues were dissected and homogenized inpeqGOLD TriFast solution (peqLab) with a polytron homogenizer (IKA Werke).RNA was isolated according to the manufacturer’s instructions, separated on a 15%denaturing polyacrylamide gel and electroblotted on a nylon membrane (PerkinElmer). [γ-32P]ATP end-labelled (NEB) oligonucleotide probes (MWG) for maturemiRNAs (mmu-miR-143 5′-TGAGCTACAGTGCTTCATCTCA-3′, mmu-miR-1455′-AGGGATTCCTGGGAAAACTGGAC-3′) were hybridized to the membraneovernight at 50 ◦C. Equal loading was verified using a probe for 5S ribosomal RNA(5′-TCCTGCAATTCACATTAATTCTCGCAGCTAGC-3′).
TaqMan real-time quantitative RT-PCR. Measurements of mature miRNAlevels by quantitative real-time PCR were made using a TaqMan microRNART Kit and TaqMan MicroRNA Assays (Applied Biosystems) according to themanufacturer’s instructions. mRNA levels were determined using EuroScriptReverse Transcriptase (Eurogentec) and TaqMan Assay on Demand kits (AppliedBiosystems) according to the manufacturer’s instructions. Relative expression ofmature miRNAs and mRNAs was determined using a comparative method (2−δδCT)according to the ABI Relative Quantification Method. Assays were linear over fourorders of magnitude.
Generation of miR-143DOX mice. Mice overexpressing miR-143 weregenerated similarly to previously described shRNA-expressing mice25. ThemiR-143 coding region flanked by about 200 base pairs (bp) of the en-dogenous locus was PCR-amplified from mouse genomic DNA using theprimers 5Xba_143_H1 5′-AAATCTAGAAGCCAAGACCCGGATAGGA-3′ and3Xho_143_H1 5′-AAACTCGAGAAAAACAAGCTGCTGGAGCAGAATC-3′. Cor-rect recombinase-mediated cassette exchange (RMCE) in embryonic stem cells wasconfirmed by Southern-blot analysis using a standard protocol. Genomic DNA wasdigested with HindIII. The validated embryonic stem cells were injected into F1blastocytes as previously described25. Doxycycline-treated miRNAmice are referredto as miR-143DOX and doxycycline-treated C57BL/6 littermates as wild type.
Body temperature and indirect calorimetry. Body temperature was determinedanally on three consecutive days at 10:00 using a TH-5 Monitoring Thermometer(Physitemp Intruments). Indirect calorimetry measurements were made in aPhenoMaster System (TSE systems). Mice were placed at room temperature(22–24 ◦C) in 7.1 l chambers of the PhenoMaster open-circuit calorimetry. Micewere allowed to adapt to the chambers for at least 24 h. Food and water wereprovided ad libitum in the appropriate devices. Parameters of indirect calorimetrywere measured for at least the following 48 h.
Analytical procedures. Blood glucose values were determined fromwhole venousblood using an automatic glucose monitor (GlucoMen GlycÓ; A. MenariniDiagnostics). Serum insulin and leptin levels were measured by enzyme-linkedimmunosorbent assay using mouse standards according to the manufacturer’sguidelines (Mouse–Rat Insulin ELISA, Mouse Leptin ELISA, Crystal Chem).
Glucose- and insulin-tolerance tests. Glucose-tolerance tests were carried outon animals that had been fasted overnight for 16 h as previously described54. Afterdetermination of fasted blood glucose levels, each animal received an intraperitoneal(i.p.) injection of 2 g/kg body weight of glucose (20% glucose; Delta Select). Bloodglucose levels were detected after 15, 30, 60 and 120min. Insulin-tolerance testswere carried out on random-fed animals. After determination of random-fed bloodglucose levels, each animal received an i.p. injection of 0.75U kg−1 body weight ofinsulin (Actrapid; Novo Nordisk). Blood glucose levels were detected after 15, 30and 60min.
Glucose-stimulated insulin secretion. All animals were fasted overnight for 16 h.Blood samples were collected from mice before an i.v. injection of 2mg g−1 bodyweight of glucose (20% glucose; Delta Select). Further blood samples were collected2, 5, 15, 30 and 60min after the injection and serum insulin levels were determined.
Immunohistochemistry. Pancreatic tissue was excised, snap-frozen and slicedas previously described26. Haematoxylin and eosin, insulin and glucagonstainings were carried out as previously described26. Stainings were anal-ysed with a Zeiss Axioskop 40 microscope (Carl Zeiss MicroImaging) andcell mass was determined using Zeiss AxioVision 4.2 software (Carl ZeissMicroImaging). Dissected white- and brown-adipose-tissue samples wereincubated in fixation solution containing 4% paraformaldehyde at 4 ◦Covernight, embedded in paraffin and sliced according to a previously de-scribed standard protocol55. Haematoxylin and eosin staining, Mac-2 andUCP-1 immunohistochemistry were carried out after deparaffinization aspreviously described55,56.
Insulin signalling. After an overnight fast, mice were anaesthetized and theabdominal cavity of the mice was opened to inject either 5 units normal humaninsulin (Actrapid;NovoNordisk 40Uml−1) or insulin diluent, diluted in 0.9% saline(final volume 125 µl) into the vena cava inferior. Samples of liver and skeletal musclewere collected 2 and 5min after injection respectively, and proteins were extractedfrom tissues for western-blot analysis.
Western-blot analysis. Indicated tissues were dissected and homogenized inlysis buffer using a Polytron homogenizer (IKA Werke) as previously described54.Western-blot analyses were carried out according to standard protocols withantibodies raised against IR-β (no. sc-711, Santa Cruz Biotechnology, 1:200),pIR (no. CSA-720, Stressgen, 1:500), AKT (no. 9,272, Cell Signaling, 1:1,000),phosphoAKT Ser 473 (no. 9,271, Cell Signaling, 1:1,000), phosphoAKT Thr 308(no. 4,056, Cell Signaling, 1:1,000), p85 (no. 06-195, Upstate, 1:5,000), p44/42(ERK1/2) (no. 9,102, Cell Signaling, 1:1,000) and ORP8 (1:1,000; ref. 30). β-actin (no. A5441, Sigma,1:5,000) and α-tubulin (no. T6074, Sigma, 1:5,000)were used as loading controls. JNK activity was determined using a Kinas-eSTAR JNK activity assay kit (no. K431-40, BioVision) according to themanufacturer’s instructions.
In vivo SILAC. Quantitative-mass-spectrometry analysis was carried out aspreviously described29. Raw data files were converted to Mascot generic formatfiles with in-house software (Raw2MSM), and Mascot (version 2.0) was usedfor database search and protein identification. Only proteins that had at leasttwo peptides with ion scores higher than 20 were considered for identificationand quantification. MSQuant was used to verify and quantify the resultingSILAC-peptide pairs. A target decoy database approach was used to identifyfalse-positive peptides and to set threshold criteria such that fewer than 1% offalse positives were included. Samples were analysed by the software MaxQuant,which carries out a peak list, SILAC- and extracted ion chromatography-based quantification, false-positive rates and peptide identification on the basisof Mascot search results. All data were searched against the InternationalProtein Index sequence database (mouse International Protein Index, version3.24; ref. 29).
Expression microarrays. Biotin-labelled complementary DNA was synthesizedusingGeneChipWhole Transcript Sense Target LabellingAssay (Affymetrix) accord-ing to the manufacturer’s instructions. Following fragmentation, complementaryDNAs were hybridized for 17 h at 45 ◦C on Affymetrix Mouse Gene 1.0 ST Arrays.Arrays were washed and stained in the GeneChip Fluidics Station 450 (Affymetrix)and scanned on a GeneChip Scanner 3000 7G (Affymetrix). Data intensities werelog-transformed and normalizedwith a quantile normalizationmethod using PartekGenomics Suite.
Database accession numbers. Microarray experiments complied with MI-AME (minimum information about microarray experiments) and are availablethrough the public repository Gene Expression Ominibus (GEO) at accessionnumber GSE26460.
NATURE CELL BIOLOGY
© 2011 Macmillan Publishers Limited. All rights reserved.
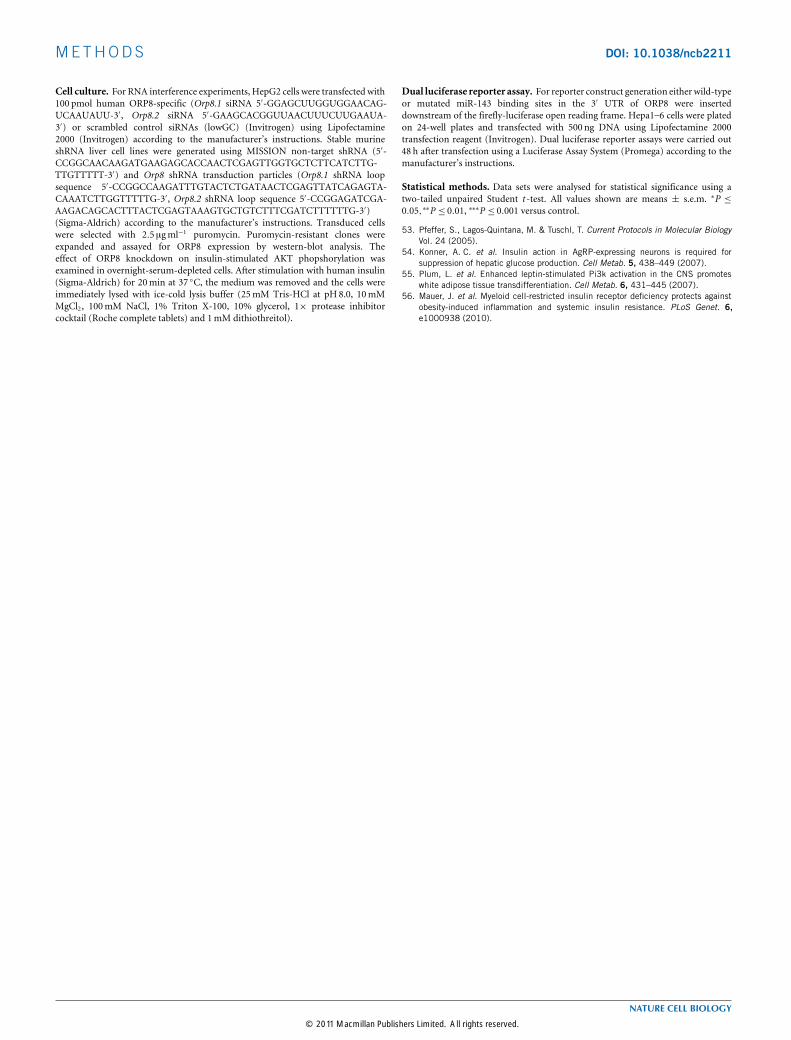
METHODS DOI: 10.1038/ncb2211
Cell culture. For RNA interference experiments, HepG2 cells were transfected with100 pmol human ORP8-specific (Orp8.1 siRNA 5′-GGAGCUUGGUGGAACAG-UCAAUAUU-3′, Orp8.2 siRNA 5′-GAAGCACGGUUAACUUUCUUGAAUA-3′) or scrambled control siRNAs (lowGC) (Invitrogen) using Lipofectamine2000 (Invitrogen) according to the manufacturer’s instructions. Stable murineshRNA liver cell lines were generated using MISSION non-target shRNA (5′-CCGGCAACAAGATGAAGAGCACCAACTCGAGTTGGTGCTCTTCATCTTG-TTGTTTTT-3′) and Orp8 shRNA transduction particles (Orp8.1 shRNA loopsequence 5′-CCGGCCAAGATTTGTACTCTGATAACTCGAGTTATCAGAGTA-CAAATCTTGGTTTTTG-3′, Orp8.2 shRNA loop sequence 5′-CCGGAGATCGA-AAGACAGCACTTTACTCGAGTAAAGTGCTGTCTTTCGATCTTTTTTG-3′)(Sigma-Aldrich) according to the manufacturer’s instructions. Transduced cellswere selected with 2.5 µgml−1 puromycin. Puromycin-resistant clones wereexpanded and assayed for ORP8 expression by western-blot analysis. Theeffect of ORP8 knockdown on insulin-stimulated AKT phopshorylation wasexamined in overnight-serum-depleted cells. After stimulation with human insulin(Sigma-Aldrich) for 20min at 37 ◦C, the medium was removed and the cells wereimmediately lysed with ice-cold lysis buffer (25mM Tris-HCl at pH 8.0, 10mMMgCl2, 100mM NaCl, 1% Triton X-100, 10% glycerol, 1× protease inhibitorcocktail (Roche complete tablets) and 1mM dithiothreitol).
Dual luciferase reporter assay. For reporter construct generation either wild-typeor mutated miR-143 binding sites in the 3′ UTR of ORP8 were inserteddownstream of the firefly-luciferase open reading frame. Hepa1–6 cells were platedon 24-well plates and transfected with 500 ng DNA using Lipofectamine 2000transfection reagent (Invitrogen). Dual luciferase reporter assays were carried out48 h after transfection using a Luciferase Assay System (Promega) according to themanufacturer’s instructions.
Statistical methods. Data sets were analysed for statistical significance using atwo-tailed unpaired Student t -test. All values shown are means ± s.e.m. ∗P ≤0.05,∗∗P ≤ 0.01, ∗∗∗P ≤ 0.001 versus control.
53. Pfeffer, S., Lagos-Quintana, M. & Tuschl, T. Current Protocols in Molecular BiologyVol. 24 (2005).
54. Konner, A. C. et al. Insulin action in AgRP-expressing neurons is required forsuppression of hepatic glucose production. Cell Metab. 5, 438–449 (2007).
55. Plum, L. et al. Enhanced leptin-stimulated Pi3k activation in the CNS promoteswhite adipose tissue transdifferentiation. Cell Metab. 6, 431–445 (2007).
56. Mauer, J. et al. Myeloid cell-restricted insulin receptor deficiency protects againstobesity-induced inflammation and systemic insulin resistance. PLoS Genet. 6,e1000938 (2010).
NATURE CELL BIOLOGY
© 2011 Macmillan Publishers Limited. All rights reserved.

S U P P L E M E N TA RY I N F O R M AT I O N
WWW.NATURE.COM/NATURECELLBIOLOGY 1
DOI: 10.1038/ncb2211
Figure S1 Northern blot analysis of miR-143 expression dependent on feeding conditions. a Northern blot analysis of miR-143 expression in liver of random fed, 12-48 hours fasted and refed mice. 5S rRNA was used as loading control. b Representative Northern blot analyses of miRNA
expression in liver of random fed, 12-48 hours fasted and refed animals using the indicated miRNA probes. 5S rRNA was used as loading control. In total, livers of three mice per condition were analyzed for feeding status-dependent regulation of miRNA expression.
a!
b!
Jordan et al., Supplementary Figure S1 (Brüning)!
fasted!fed! 12 h! 24 h! 48 h! refed!
miR-143!
5S rRNA!
let-7a!
5S rRNA!
miR-103/107!
fasted!fed! 12 h! 24 h! 48 h! refed!
miR-122a!
5S rRNA!
miR-144!
fasted!fed! 12 h! 24 h! 48 h! refed!
miR-126-3p!
5S rRNA!
fasted!fed! 12 h! 24 h! 48 h! refed!
miR-194!
5S rRNA!
fasted!fed! 12 h! 24 h! 48 h! refed!
miR-27a!
5S rRNA!
fasted!fed! 12 h! 24 h! 48 h! refed!
miR-30c!
5S rRNA!
fasted!fed! 12 h! 24 h! 48 h! refed!
© 2011 Macmillan Publishers Limited. All rights reserved.
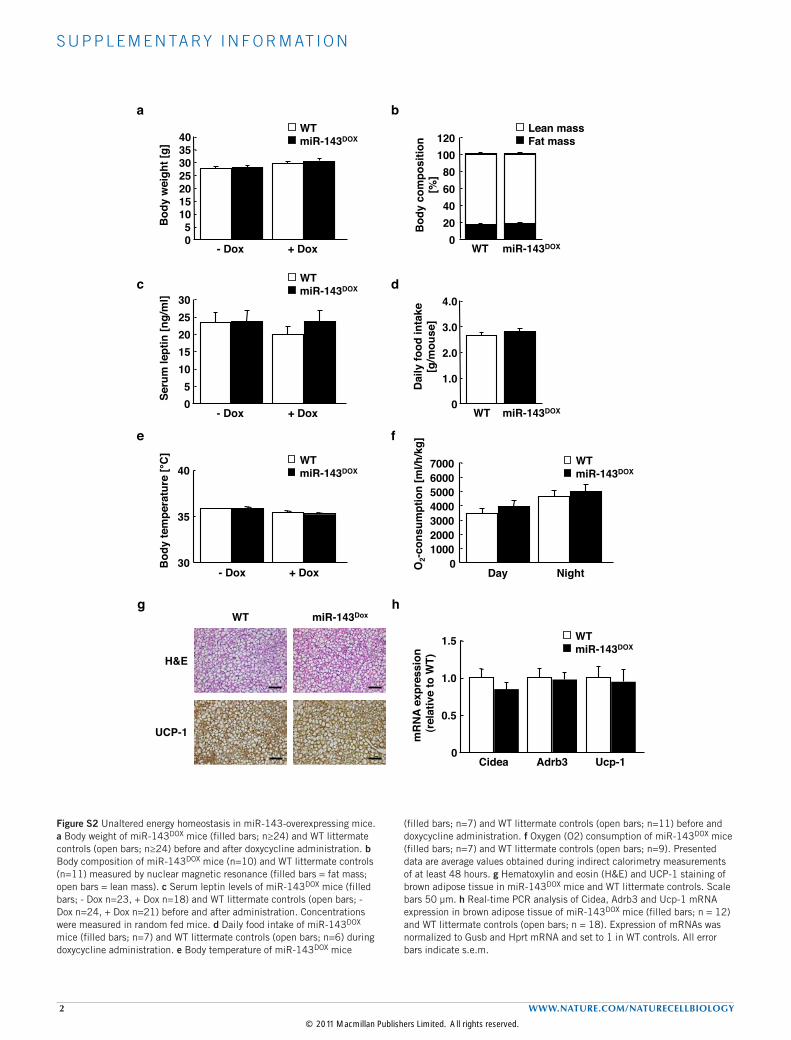
S U P P L E M E N TA RY I N F O R M AT I O N
2 WWW.NATURE.COM/NATURECELLBIOLOGY
Figure S2 Unaltered energy homeostasis in miR-143-overexpressing mice. a Body weight of miR-143DOX mice (filled bars; n≥24) and WT littermate controls (open bars; n≥24) before and after doxycycline administration. b Body composition of miR-143DOX mice (n=10) and WT littermate controls (n=11) measured by nuclear magnetic resonance (filled bars = fat mass; open bars = lean mass). c Serum leptin levels of miR-143DOX mice (filled bars; - Dox n=23, + Dox n=18) and WT littermate controls (open bars; - Dox n=24, + Dox n=21) before and after administration. Concentrations were measured in random fed mice. d Daily food intake of miR-143DOX mice (filled bars; n=7) and WT littermate controls (open bars; n=6) during doxycycline administration. e Body temperature of miR-143DOX mice
(filled bars; n=7) and WT littermate controls (open bars; n=11) before and doxycycline administration. f Oxygen (O2) consumption of miR-143DOX mice (filled bars; n=7) and WT littermate controls (open bars; n=9). Presented data are average values obtained during indirect calorimetry measurements of at least 48 hours. g Hematoxylin and eosin (H&E) and UCP-1 staining of brown adipose tissue in miR-143DOX mice and WT littermate controls. Scale bars 50 µm. h Real-time PCR analysis of Cidea, Adrb3 and Ucp-1 mRNA expression in brown adipose tissue of miR-143DOX mice (filled bars; n = 12) and WT littermate controls (open bars; n = 18). Expression of mRNAs was normalized to Gusb and Hprt mRNA and set to 1 in WT controls. All error bars indicate s.e.m.
c! d!
Seru
m le
ptin
[ng/
ml]!
0!5!
10!15!20!25!30!
- Dox! + Dox!
WT!miR-143DOX!
0!20!40!60!80!
100!120!
WT! miR-143DOX!
Bod
y co
mpo
sitio
n !
[%]!
Lean mass!Fat mass!
0!5!
10!15!20!25!30!35!40!
- Dox! + Dox!
Bod
y w
eigh
t [g]!
WT!miR-143DOX!
a! b!
0!
1.0!
2.0!
3.0!
4.0!
WT! miR-143DOX!D
aily
food
inta
ke !
[g/m
ouse
]!
H&E!
WT! miR-143Dox!
UCP-1!
30!
35!
40!
- Dox! + Dox!
Bod
y te
mpe
ratu
re [°
C] ! WT!
miR-143DOX!
e! f!
g! h!
0!
0.5!
1.0!
1.5!
Cidea! Adrb3! Ucp-1!
mR
NA
expr
essi
on!
(rel
ativ
e to
WT)!
WT!miR-143DOX!
0!1000!2000!3000!4000!5000!6000!7000!
Day! Night!O2-c
onsu
mpt
ion
[ml/h
/kg]!
WT!miR-143DOX!
Jordan et al., Supplementary Figure S2 (Brüning)!
© 2011 Macmillan Publishers Limited. All rights reserved.
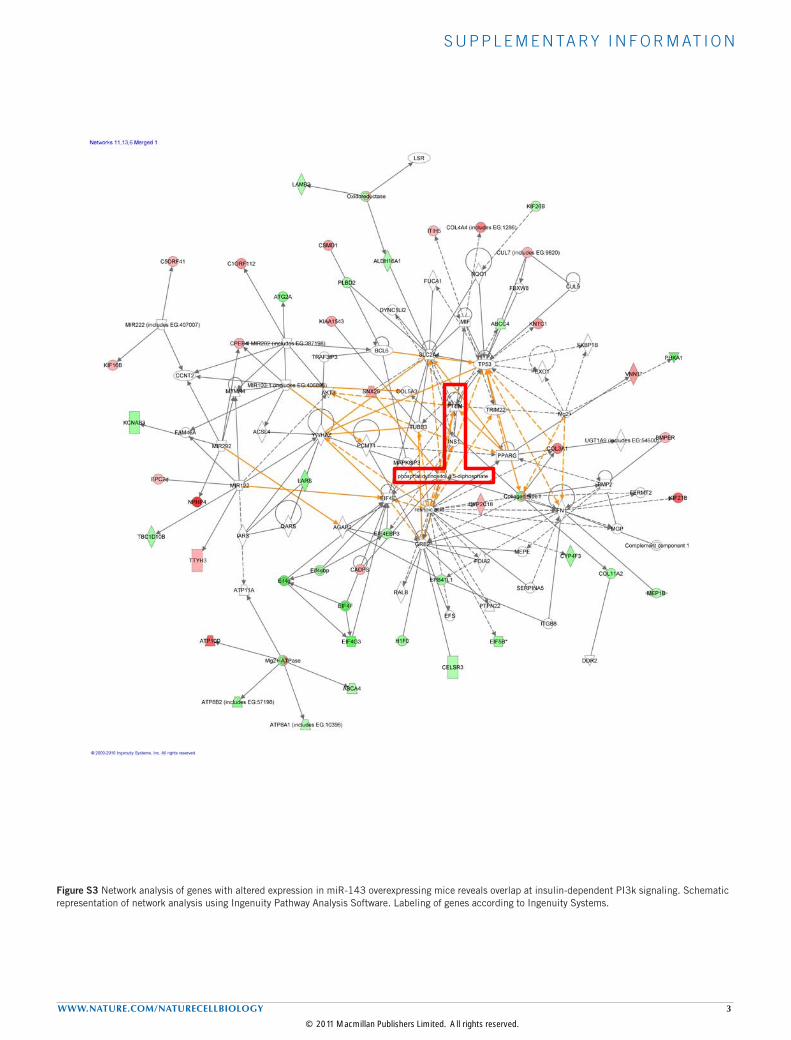
S U P P L E M E N TA RY I N F O R M AT I O N
WWW.NATURE.COM/NATURECELLBIOLOGY 3
Figure S3 Network analysis of genes with altered expression in miR-143 overexpressing mice reveals overlap at insulin-dependent PI3k signaling. Schematic representation of network analysis using Ingenuity Pathway Analysis Software. Labeling of genes according to Ingenuity Systems.
Jordan et al., Supplementary Figure S3 (Brüning)!
© 2011 Macmillan Publishers Limited. All rights reserved.
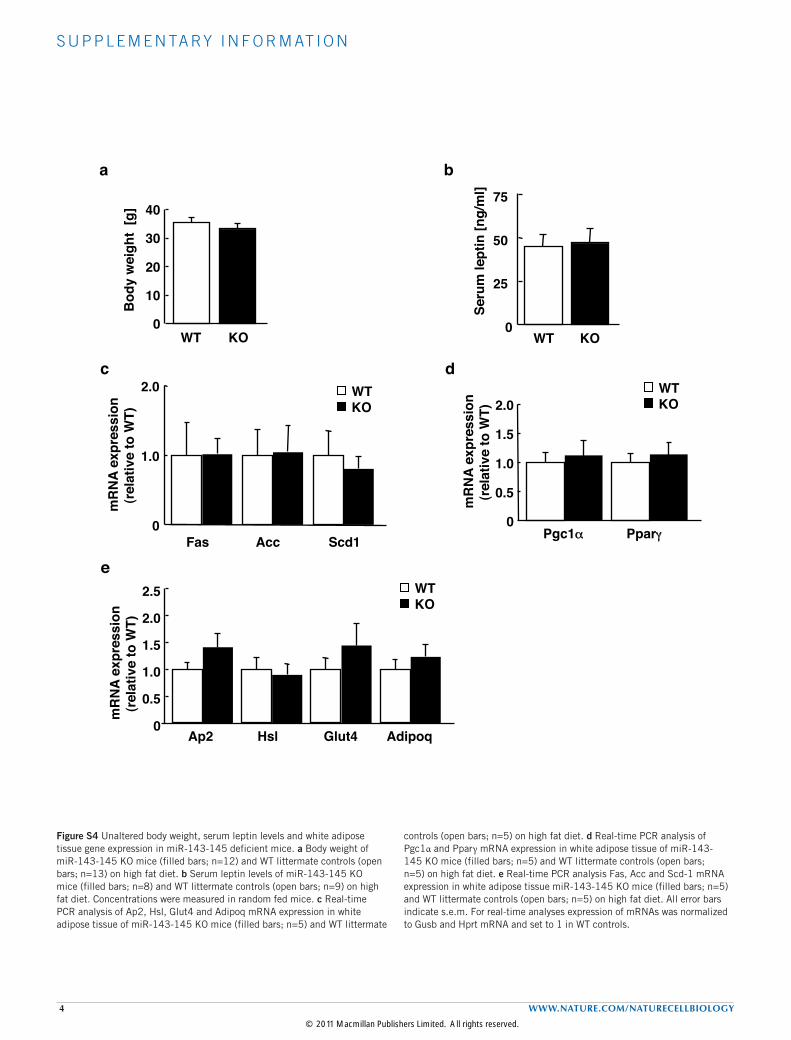
S U P P L E M E N TA RY I N F O R M AT I O N
4 WWW.NATURE.COM/NATURECELLBIOLOGY
Figure S4 Unaltered body weight, serum leptin levels and white adipose tissue gene expression in miR-143-145 deficient mice. a Body weight of miR-143-145 KO mice (filled bars; n=12) and WT littermate controls (open bars; n=13) on high fat diet. b Serum leptin levels of miR-143-145 KO mice (filled bars; n=8) and WT littermate controls (open bars; n=9) on high fat diet. Concentrations were measured in random fed mice. c Real-time PCR analysis of Ap2, Hsl, Glut4 and Adipoq mRNA expression in white adipose tissue of miR-143-145 KO mice (filled bars; n=5) and WT littermate
controls (open bars; n=5) on high fat diet. d Real-time PCR analysis of Pgc1α and Pparγ mRNA expression in white adipose tissue of miR-143-145 KO mice (filled bars; n=5) and WT littermate controls (open bars; n=5) on high fat diet. e Real-time PCR analysis Fas, Acc and Scd-1 mRNA expression in white adipose tissue miR-143-145 KO mice (filled bars; n=5) and WT littermate controls (open bars; n=5) on high fat diet. All error bars indicate s.e.m. For real-time analyses expression of mRNAs was normalized to Gusb and Hprt mRNA and set to 1 in WT controls.
0!
25!
50!
75!
Seru
m le
ptin
[ng/
ml]!
WT! KO!
a! b!
c! d!
e!
0!
1.0!
2.0!
Fas! Acc! Scd1!
mR
NA
expr
essi
on !
(rel
ativ
e to
WT)!
WT!KO!
0!
0.5!
1.0!
1.5!
2.0!
2.5!
Ap2! Hsl! Glut4! Adipoq!
mR
NA
expr
essi
on !
(rel
ativ
e to
WT)!
WT!KO!
0!
0.5!
1.0!
1.5!
2.0!
Pgc1α! Pparγ!
mR
NA
expr
essi
on !
(rel
ativ
e to
WT)!
WT!KO!
WT ! KO!
Bod
y w
eigh
t [g
]!
0!
10!
20!
30!
40!
Jordan et al., Supplementary Figure S4 (Brüning)!
© 2011 Macmillan Publishers Limited. All rights reserved.
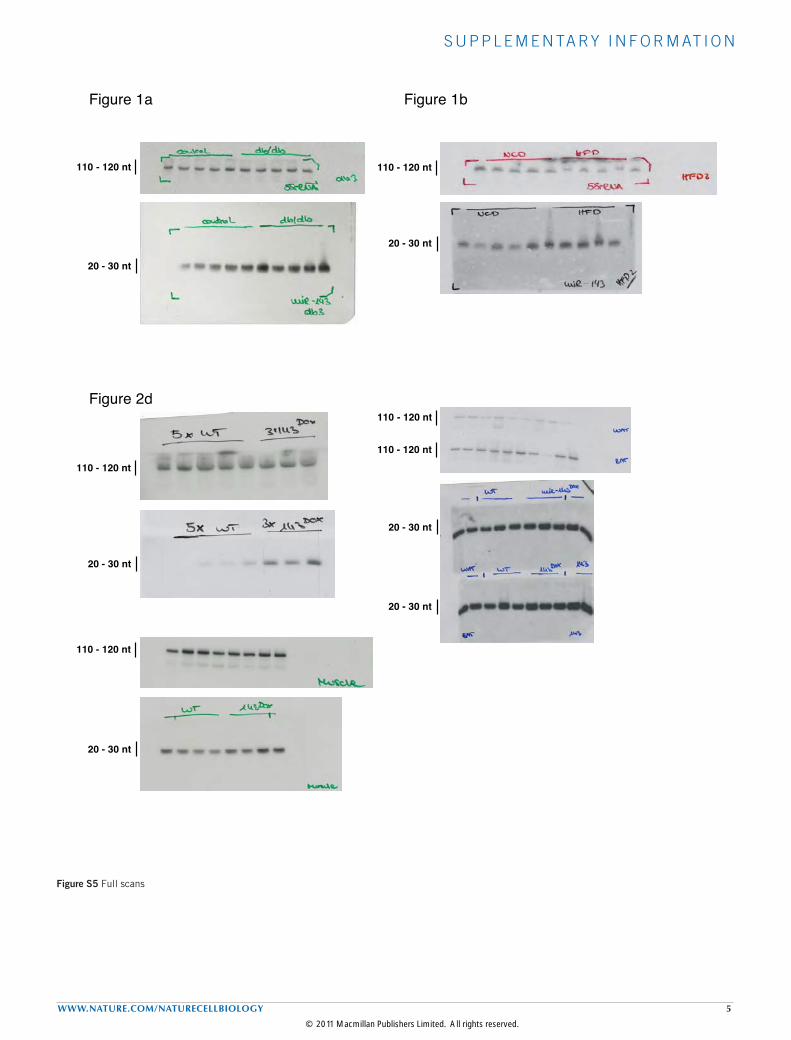
S U P P L E M E N TA RY I N F O R M AT I O N
WWW.NATURE.COM/NATURECELLBIOLOGY 5
Figure S5 Full scans
Jordan et al., Supplementary Full Scans (Brüning)
Figure 1a Figure 1b
Figure 2d
110 - 120 nt
20 - 30 nt
20 - 30 nt
110 - 120 nt
20 - 30 nt
110 - 120 nt
110 - 120 nt
110 - 120 nt
20 - 30 nt
20 - 30 nt
20 - 30 nt
110 - 120 nt
© 2011 Macmillan Publishers Limited. All rights reserved.
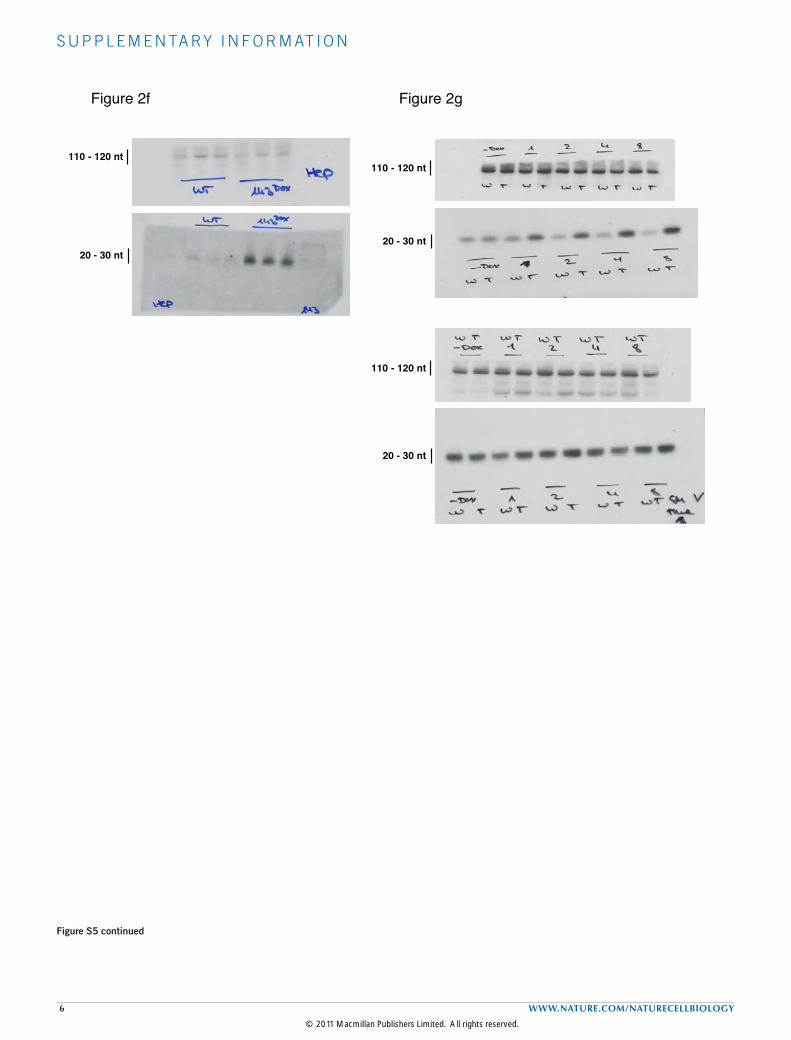
S U P P L E M E N TA RY I N F O R M AT I O N
6 WWW.NATURE.COM/NATURECELLBIOLOGY
Jordan et al., Supplementary Full Scans (Brüning)
Figure 2f Figure 2g
110 - 120 nt
20 - 30 nt
110 - 120 nt
20 - 30 nt
110 - 120 nt
20 - 30 nt
Figure S5 continued
© 2011 Macmillan Publishers Limited. All rights reserved.
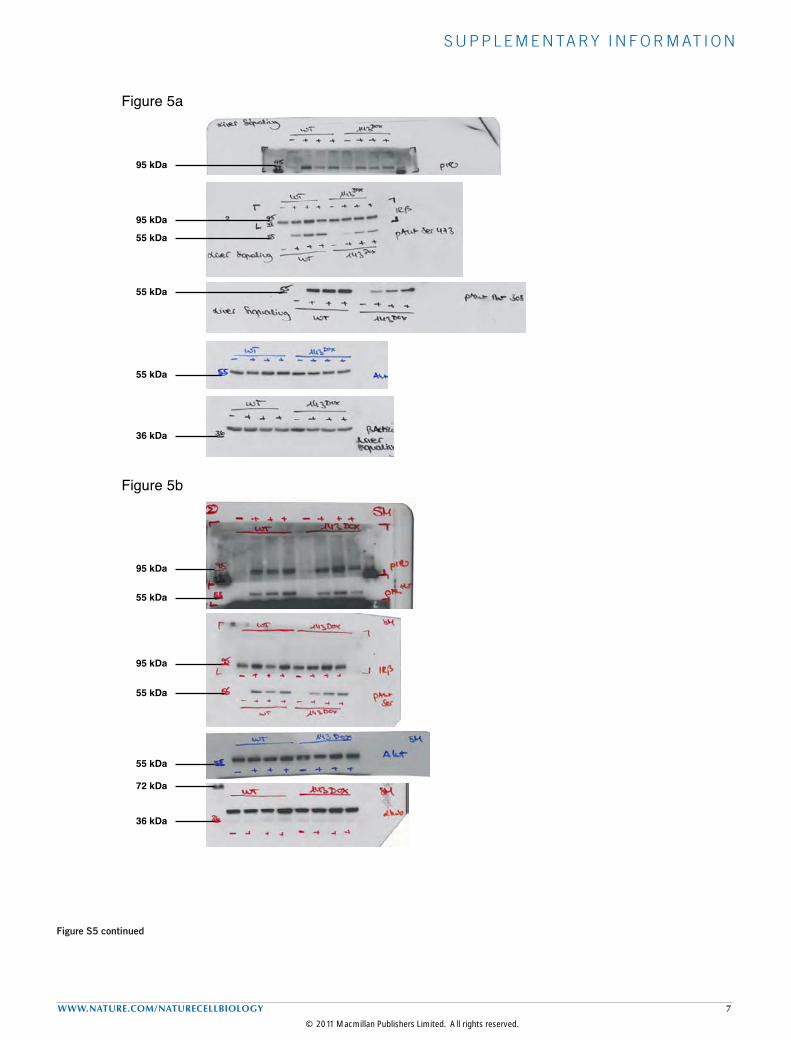
S U P P L E M E N TA RY I N F O R M AT I O N
WWW.NATURE.COM/NATURECELLBIOLOGY 7
Jordan et al., Supplementary Full Scans (Brüning)
Figure 5a
Figure 5b
95 kDa
95 kDa
55 kDa
55 kDa
55 kDa
36 kDa
95 kDa
55 kDa
95 kDa
55 kDa
55 kDa
36 kDa
72 kDa
Figure S5 continued
© 2011 Macmillan Publishers Limited. All rights reserved.
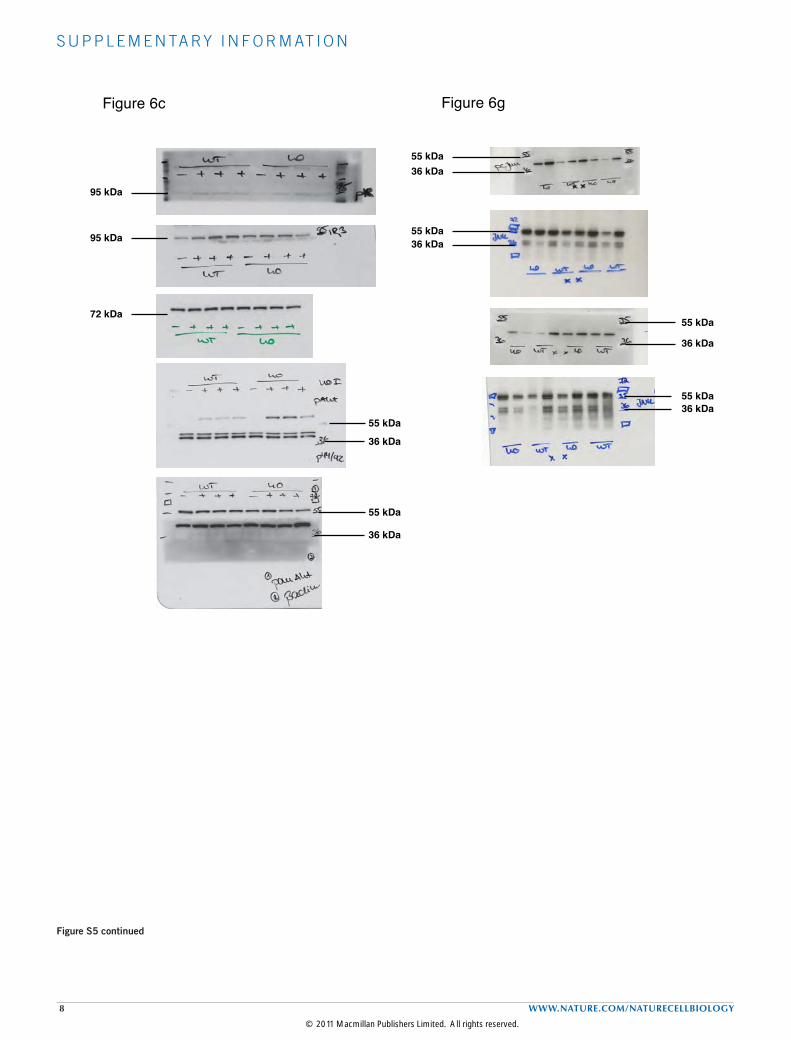
S U P P L E M E N TA RY I N F O R M AT I O N
8 WWW.NATURE.COM/NATURECELLBIOLOGY
Jordan et al., Supplementary Full Scans (Brüning)
Figure 6c Figure 6g
95 kDa
95 kDa
55 kDa
72 kDa
36 kDa
55 kDa
36 kDa
55 kDa36 kDa
55 kDa36 kDa
55 kDa
36 kDa
55 kDa36 kDa
Figure S5 continued
© 2011 Macmillan Publishers Limited. All rights reserved.

S U P P L E M E N TA RY I N F O R M AT I O N
WWW.NATURE.COM/NATURECELLBIOLOGY 9
Jordan et al., Supplementary Full Scans (Brüning)
Figure 7c
Figure 7e
95 kDa
36 kDa
95 kDa
36 kDa
Figure S5 continued
© 2011 Macmillan Publishers Limited. All rights reserved.

S U P P L E M E N TA RY I N F O R M AT I O N
10 WWW.NATURE.COM/NATURECELLBIOLOGY
Jordan et al., Supplementary Full Scans (Brüning)
Figure 8a Figure 8b
Figure 8c Figure 8d
Figure 8e
95 kDa
55 kDa
95 kDa
36 kDa
95 kDa
36 kDa
55 kDa
36 kDa
72 kDa
36 kDa
72 kDa55 kDa
72 kDa
36 kDa
Figure S5 continued
© 2011 Macmillan Publishers Limited. All rights reserved.

S U P P L E M E N TA RY I N F O R M AT I O N
11 WWW.NATURE.COM/NATURECELLBIOLOGY
Supplementary table legends
Table S1a Bioinformatic analyses of cloned small RNAs Table S1b Summary of cloned and verified hepatic miRNAsTable S2 Gene expression analyses of miR-143 overexpressing mice (.xls file)Table S3 In vivo SILAC analyses of miR-143 overexpressing mice (.xls file)Table S4 Potential hepatic miR-143 targets identified by in vivo SILAC
© 2011 Macmillan Publishers Limited. All rights reserved.