Oxidation characteristics of Ti25Al10Nb3V-1Mo
14
Oxidation of Metals, Vol. 37, Nos. 3/4, 1992 Oxidation Characteristics of Ti-25AI-10Nb-3V-1Mo T. A. Wallace,* R. K. Clark,* K. E. Wiedemann,t and S. N. Sankaran'~ Received May 17, 1991;revisedNovember 4, 1991 Static oxidation kinetics of Ti-25Al-IONb-3V-IMo (atomic percent) were investigated in air over the temperature range of 650-I000~ using thermo- grav#netric analysis'. The oxidation kinetics were complex at all exposure temperatures and displayed up to two distinct stages of parabolic oxidation. Breakaway oxidation occurred after long exposure times at high temperatures. Oxidation products were determined using x-ray diffraction techniques, elec- tron microprobe analysis, and energy dispersive x-rgly analysis. Oxide scale morphology was examined using scanning electron microscopy of the surfaces and cross-sections of oxidation specimens. The oxides during the parabolic stages were compact and multilayered, consisting prbnarily of Ti02 doped with Nb, a top layer of Al203 and a thin bottom layer of TiN. The transition between the first and second parabolic stage is linked to the formation of a TiAI layer at the oxide-metal intelface. Porosity also formed in the Ti02 layer during the second stage, causing degradation of the oxide and breakaway oxidation. KEY WORDS: oxidation; titanium aluminide; oxidation kinetics; oxidation products. INTRODUCTION Titanium-aluminide intermetallic alloys, such as Ti3A1, are candidate mat- erials for use in hypersonic structures and advanced engines because of their high specific strength and excellent high-temperature properties. Stoichi- ometric Ti3A1, however, has poor room-temperature ductility. To improve ductility Ti3AI has been alloyed with beta-stabilizing elements such as tungsten, molybdenum, niobium, tantalum, and vanadium. The alloy Ti- *NASA LangleyResearch Center, Mail Stop 194, Hampton, Virginia 23665-5225. tAnalytical Servicesand Materials, Inc., 107 Research Drive, Hampton, Virginia 23666. I11 0030-770X/92/0400-0111 $06.50/0 1992 Plenum Publishing Corporation
-
Upload
independent -
Category
Documents
-
view
0 -
download
0
Transcript of Oxidation characteristics of Ti25Al10Nb3V-1Mo
Oxidation of Metals, Vol. 37, Nos. 3/4, 1992
Oxidation Characteristics of Ti-25AI-10Nb-3V-1Mo
T. A. Wallace,* R. K. Clark,* K. E. Wiedemann,t and S. N. Sankaran'~
Received May 17, 1991; revised November 4, 1991
Static oxidation kinetics of Ti-25Al-IONb-3V-IMo (atomic percent) were investigated in air over the temperature range of 650-I000~ using thermo- grav#netric analysis'. The oxidation kinetics were complex at all exposure temperatures and displayed up to two distinct stages of parabolic oxidation. Breakaway oxidation occurred after long exposure times at high temperatures. Oxidation products were determined using x-ray diffraction techniques, elec- tron microprobe analysis, and energy dispersive x-rgly analysis. Oxide scale morphology was examined using scanning electron microscopy of the surfaces and cross-sections of oxidation specimens. The oxides during the parabolic stages were compact and multilayered, consisting prbnarily of Ti02 doped with Nb, a top layer of Al203 and a thin bottom layer of TiN. The transition between the first and second parabolic stage is linked to the formation of a TiAI layer at the oxide-metal intelface. Porosity also formed in the Ti02 layer during the second stage, causing degradation of the oxide and breakaway oxidation.
KEY WORDS: oxidation; titanium aluminide; oxidation kinetics; oxidation products.
INTRODUCTION
Titanium-aluminide intermetallic alloys, such as Ti3A1, are candidate mat- erials for use in hypersonic structures and advanced engines because of their high specific strength and excellent high-temperature properties. Stoichi- ometric Ti3A1, however, has poor room-temperature ductility. To improve ductility Ti3AI has been alloyed with beta-stabilizing elements such as tungsten, molybdenum, niobium, tantalum, and vanadium. The alloy Ti-
*NASA Langley Research Center, Mail Stop 194, Hampton, Virginia 23665-5225. tAnalytical Services and Materials, Inc., 107 Research Drive, Hampton, Virginia 23666.
I11 0030-770X/92/0400-0111 $06.50/0 �9 1992 Plenum Publishing Corporation

112 Wallace et aL
25Al-10Nb-3V-1Mo (at.%), referred to as super-a2, is one such modifi- cation of Ti3AI that is being considered for aerospace applications.
The oxidation resistance of titanium-aluminide alloys is also of concern because of titanium's high susceptibility to oxidation. The limited informa- tion available on the oxidation characteristics of Ti3Al-based alloys shows that they do not form a protective alumina scale, but rather form oxides which are primarily TiO2 and exhibit complex oxidation kinetics. 1-5 Alloying with beta-stabilizers has been shown to lower the overall rate of oxidation, 5'6 hence it would be expected that Ti-25AI-10Nb-3V-1 Mo would have better oxidation resistance than stoichiometric Ti3AI.
The present study characterized the oxidation behavior of Ti-25A1- 10Nb-3V-1Mo. Samples were oxidized in air at 650-1000~ using a thermo- gravimetric apparatus (TGA). Selected samples were metallurgically ana- lyzed to characterize the oxide composition and morphology and the microstructural changes in the metal.
EXPERIMENTAL PROCEDURES
Specimens and Materials
The chemical analysis of the ingot Ti-25AI 10Nb-3V-1Mo in atomic percent is 25.3 A1, 10.2 Nb, 2.96 V, 0.979 Mo, 0.048 Fe, 0.091 C, and 0.209 O with the balance being Ti. The alloy in the as-received condition had been processed into a forged pancake shape (4-in thick and 15-in diameter) and heat treated as follows: 1121~ for 2 hr, direct transfer to 732~ salt bath for 1/2 hr, direct transfer to 816~ salt bath for 1/2 hr, and air cooled.
TGA samples were machined to the dimensions of 1-cm width, 1.5-cm length, and 0.12-cm thick with a 0.16-cm diameter hole through the thickness at one end for suspending the sample during the test. Sample surfaces were ground to a uniform finish using silicon carbide paper through 2400 grit. Samples were first detergent cleaned, then ultrasonically cleaned in acetone and ethyl alcohol, and air dried. The dimensions of finished samples were measured to the nearest 0.001 cm and weights were recorded before and after exposure to the nearest 0.05 mg.
Oxidation Tests
Oxidation tests were conducted in high-purity air (true hydrocarbon content less than 0.1 ppm) from 650 to 1000~ for times up to 100 hr. The sample weight change was recorded continuously during exposure using a Cahn C2000 microbalance with an accuracy of 1/lg. Samples were sus- pended by quartz fibers in a mullite tube inside a vertical tubular furnace, and the temperature was monitored continuously with a R-type thermo-

Characteristics of Ti-25Al-10Nb-3V-1Mo 113
couple located just below the suspended specimen. A low flow of air (1 cc/ sec) through the mullite tube was maintained during the test. Duplicate or triplicate tests were performed at each temperature to evaluate data reproducibility.
Characterization Studies
Specimens were examined before and after oxidation using scanning electron microscopy (SEM), energy dispersive x-ray spectroscopy (EDS), and x-ray diffraction (XRD) to characterize the microstructure and identify oxide phases. The distribution and morphology of the oxide phases was determined by examining cross-sectioned specimens using SEM, EDS, and electron microprobe. These specimens were prepared by mounting in plastic, cross-sectioning, then polishing and lightly etching using Kroll's reagent (2%, HNO3, 1% HF, and 97% H20), and finally coating with a thin layer of gold to minimize charging.
RESULTS
Oxidation Kinetics
The oxidation of titanium alloys involves both oxide formation and dissolution of gas into the metal, producing parabolic weight gains] This means that the total weight gain can be expressed by the equation m 2= kpt where m is the weight gain per unit surface area, t is the time of exposure, and kp is the parabolic rate coefficient. How well actual weight gain data fit this parabolic equation can be evaluated by calculating the instantaneous value of the rate coefficient using the expression k;, = mdm/dt. Ifkp is constant with respect to time, then the oxidation is truly parabolic and kp = 2k'p.
Examination of the weight gain data using this analysis showed that the oxidation kinetics of Ti 25Al-10Nb-3V-1Mo were complex and depended on the temperature of exposure. Figure 1 is a schematic diagram showing the variations in k~ encountered below 900~ and above or equal to 900~ For oxidation below 900~ the instantaneous rate coefficient initially decreases with time before becoming constant. This means that parabolic oxidation is preceded by an initial period of nonparabolic weight gain. The duration of the nonparabolic period varied with temperature from 20 hours at 700~ to 2 hours at 900~ For oxidation at or above 900~ two distinct periods of parabolic oxidation separated by a nonparabolic transitio n period were observed. After the second stage, the instantaneous rate coefficient begins to increase, indicating breakaway oxidation.
Table I shows TGA results, including total weight gain and parabolic rate coefficient data, for each time-temperature condition investigated.

114 Wallace et aL
I"- Z i l l
i
I J _ 1.1_ ILl 0 o ILl I-- < r r ( /)
O I.U Z < I-- Z < I--- 0O Z
S~age 1, Parabolic Oxidation w
- ~ , Non-Parabolic Transition
Stage 2, Parabolic Oxidation
Breakaway Oxidation
~/Non-Parabolic Oxidation
Paraboli~ Oxidation
900~
< 900~
TIME
Fig. 1. Schematic of TGA results for Ti-25AI 10Nb-3V-IMo showing instantaneous rate coefficient variations with time in two temperature ranges.
Table I. Thermogravimetric Analysis Results for Ti 25AI-10Nb-3V-I Mo
Parabolic rate coefficient Exposure conditions Total weight (mg2/cm4/hr)
Temp, ~ Time, hr gain (mg/cm z) Stage I Stage II
650 100 0.101 0.0000785 700 100 0.216 0.000228 750 100 0.49l 0.00147 800 24 0.406 0.00859 850 24 0.704 0.0215 900 24 1.08 0.0351 900 100 2.18 0.02941 950 24 1.88" 0.142 975 50 3.42" 0.185
1000 24 2.52 a 0.474
0.0498 0.0732 0.0747 0.128
aOxide spalled during cooling.
Figure 2 is an Arrhenius plot of parabol ic rate coefficients as a funct ion o f
temperature . D a t a for Ti 24A1 10Nb 2 and Ti -25AI 3 are included for refer-
ence. The act ivat ion energies for super-a2 are 59.2 kca l /mo l for the first
stage, and 27.4 k c a l / m o l for the second stage. The oxidat ion rates for super-
a2 are similar to those for Ti 24A1 10Nb, but the rates for both are much
lower than those for Ti-25A1.

Characteristics of Ti-25AI-10Nb-3V-IMo
lx10 ~
s= lx10_1 E O
~ l x 1 0 -2
z uJ ~O lx10-3 I..1_ LI..
m lx10_ 4 0 UJ
< lx10-5
l x 1 0 -6 0.7
' ~ Ti-25AI (ref. 3)
T ,-10.b (ref. 2) " ' ' ' ~ \ \ ~ . . ~
\ \
\ Ti-25AI- 10Nb-3V-1 Mo \
�9 Stage 1 \ 0 Stage 2
I I ] r I I I I t I I I I I I I I I I
0.8 0.9 1
103/T, K -1
Fig. 2. Arrhenius plot of oxidation rates for Ti -25Al-10Nb-3V-1Mo.
!15
1.1
Oxidation Products
The XRD analysis, Table II, revealed that TiO2 was the primary oxide phase formed on super-a2 at all exposure temperatures. TiN was identified in the oxide of all specimens oxidized above 700~ The presence of A1203 in the oxide varied with the oxidation temperature: none was identified for samples oxidized at 700~ trace amounts were observed for samples oxb dized at 800~ and significant amounts were observed for samples oxidized
Table 1I. Oxide Composit ion of Ti-25AI 10Nb-3V IMo from X-ray Diffraction Data
Measured intensities ~
Exposure Ti3AI M2AI b M2A1 ~' TiA1 /3-Ti TiN TiO2 A1203
As-received VS S 700~ 100 hr VS S S 800~ 24 hr VS W S S W 850~ 24 hr S S W S S S 900~ 24 hr S S S VS S 900~ 100 hr W W S VS S 975~ 50 hr S S S W VS VS S
1000~ 24 hr VS S W W VS VS S
"VS = very strong, S = strong, W = weak. bM2A1 found in as-received specimen. CM2AI exhibiting slightly shifted peaks and intensities.

!16 Wallace et aL
at temperatures above 800~ The amount of TiA1 phase detected also varied with the oxidation temperature: trace amounts were identified in samples oxidized at lower temperatures where only the first oxidation stage occurs (850~ and below) ; strong TiAI signals were identified for samples exhibiting the two-stage behavior, for instance the samples exposed at 900~ after 24 hr and 975~ for 50 hr. It must be noted that the TiAI signal intensity for samples oxidized at 900~ for 100 hr and at 1000~ was weak due to the thickness of the overlying oxide.
The oxides formed during the first and second parabolic stages were compact and multilayered. Figure 3a is a micrograph of the cross-sectioned oxide formed after 24 hr oxidation at 900~ (first oxidation stage); Fig. 3b shows the oxide formed after 100 hr oxidation at 900~ (second oxidation stage). The oxide formed during the first stage at 900~ consists of three layers; the top layer is 1.8/~m thick, the middle layer is 4.7/tm thick, and the bottom layer is 1.1/lm thick. Evaluation using XRD and electron micro- probe identified the top layer as A1203, the middle as TiO2 doped with Nb, and the bottom layer as TiN. Examination of the surface of this specimen using SEM and EDS identified particles of both Al203 and TiO2, indicating that the A1203 does not form a continuous, protective layer. The oxide formed during the second stage at 900~ has the same phase distribution as the first stage: a bottom layer of TiN, a top layer of A1203, and a middle layer of TiO2 doped with niobium. The TiN layer did not grow in thickness between 24 and 100 hours, although the A1203 and TiO2 layers have grown from 1.8/~m to 2.8/3m and from 4.7/lm to 6.2 pm, respectively. Although the oxide is still relatively compact, some limited porosity has formed in the TiO2 layer. Additionally, a new phase, identified as TiA1, has formed beneath the TiN layer.
Oxides of samples exposed at higher temperatures, which had undergone breakaway oxidation, had significantly more porosity than oxides formed during the first and second parabolic stages. Figure 4 shows the micrograph of a cross-sectioned specimen exposed at 1000~ for 24 hours, representing a sample which had just started breakaway oxidation. Large amounts of porosity are visible in the oxide. The cracks joining this porosity probably formed during cooling or metallographic preparation.
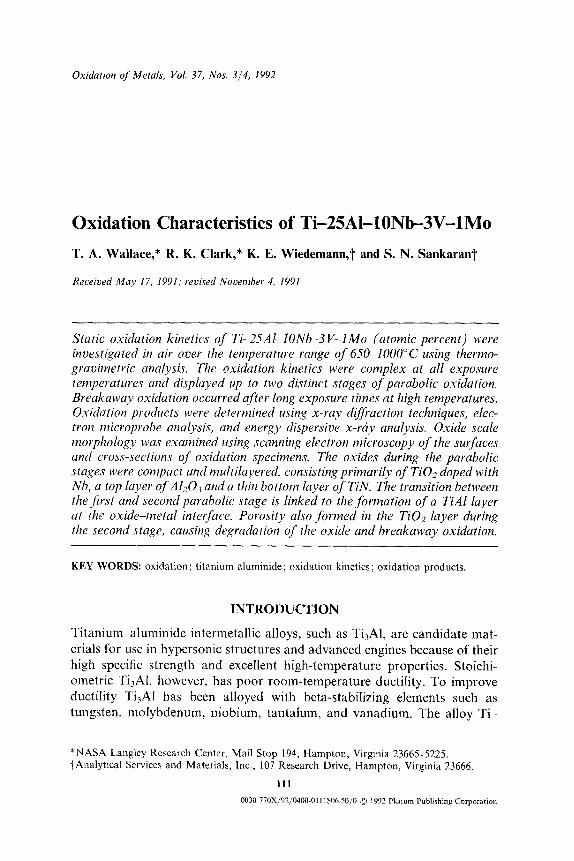
New compact oxides were found to be forming beneath the oxides of specimens which had undergone long periods of breakaway oxidation. A micrograph of such a sample (oxidized for 50 hours at 975~ is shown in Fig. 5a. The sample experienced breakaway oxidation beginning at about 25 hours and continuing for the remainder of the exposure. The TiO2 layer had a layer of extensive porosity similar to that seen at the beginning of breakaway oxidation (Fig. 4). The elemental map for aluminium (Fig. 5b) reveals a high concentration of aluminum along the dark line visible in the

T"
t~ ,Y.
i
Fig.
3.
SE
M m
icro
grap
hs f
or T
i-25
Al-
10N
b-3V
-IM
o ex
pose
d at
900
~ fo
r (a
) 24
hr,
(b)
100
hr.

118 Wa|laee et al.
Fig. 4. SEM micrograph of Ti-25Al-10Nb-3V-1Mo exposed at 1000~ for 24 hr.
oxide near the oxide-metal interface; the titanium map (Fig. 5c) shows a depletion of titanium in this region. These data indicate that a second genera- tion compact oxide, with the same three-layer distribution of earlier compact oxides, is starting to grow beneath the original oxide.
Microstructure of Alloy
The SEM micrograph of the as-received super-a2 (Fig. 6) shows an acicular, two-phase microstructure. The thin, light phase was identified by XRD and TEM as Ti3A1. The XRD pattern of the dark phase was not found in the literature; however, from XRD and TEM, it appears that this phase is isostructural with Nb2A1 with some substitution by Ti, Mo, and V. This phase is therefore referred to as M2A1 in this paper.
Results from XRD analysis of selected oxidized samples are presented in Table II. The XRD analysis showed Ti3Al and M2Al was present after all exposures. The M2A1 phase was slightly modified (compared to the phase
,-]
rd
v
Fig.
5.
(a)
SEM
mic
rogr
aph
of T
i-25
AI-
10N
b 3V
-IM
o ex
pose
d at
975
~ fo
r 50
hr,
(b)
ele
men
tal
map
of
alum
iniu
m,
(c)
elem
enta
l m
ap o
f ti
tani
um.

120 Wallace et al.
Fig. 6. SEM micrograph of Ti-25Al-10Nb 3V-IMo as-received microstructure.
in the as-received material) after exposure at the higher temperatures (975~ and 1000~ as revealed by different XRD extinctions and intensities. Trace amounts of p-Ti were also detected after exposure at 975~ and 1000~
XRD peak scans can also be used to determine the concentration profile for shallow interstitial contamination, since both interstitial nitrogen and oxygen distort the hexagonal unit-cell of a and a2 titanium. The x-ray diffraction peak will contain intensity from the undistorted titanium unit- cell continuously through all levels of contamination (and therefore distor- tion) up to the solubility limit. Although it is difficult to distinguish between oxygen and nitrogen since they produce similar distortions below 20 atomic percent, this compositionally-broadened XRD peak can be analyzed for a interstitial solubility limit. It can also be used to construct a composition- depth profile from which a diffusion coefficient can be readily calculated)
This analysis was applied to the a2 <002> peak to determine the interstitial concentration profile for a sample exposed at 650~ for 100 hours (Fig. 7). The solubility limit was estimated to be 7.5 atomic percent, and

C h a r a c t e r i s t i c s o f Ti-25AI-10Nb-3V-IMo 121
8
z" o_ 6 I"- �9 < n.- 5 I-- z ILl (5 4 z o (5 3 , - - I _< _ 2 I.--
n-- 1 LU I-- Z - - 0 , , , I , , r I , r , I , , , I , , , I ,
2 4 6 8 10
DISTANCE FROM OXIDE-METAL INTERFACE, lam
i t
0 12
Fig. 7 Composition-depth profile of oxygen in Ti-25Al-10Nb-3V-1 Mo deter- mined from compositional broadening of an x-ray diffraction peak. Specimen exposed for 100 hr at 650 ~
the diffusion coefficient 5.6 x 10 14 cm2/sec. Contrasted with results for Ti 24Al-10Nb (12.5 atomic percent solubility and 4 x 10-14 cm2/sec diffusion coefficient at 650~ 2 the maximum solubility in Ti 25Al-10Nb-3V-1Mo is lower, but the diffusion coefficient is similar.
DISCUSSION
Study of the oxidation kinetics of super-a2 revealed complex behavior: two distinct stages of parabolic oxidation, separated by periods of nonpara- bolic behavior, were identified. Although similar multiple-stage oxidation behavior has been observed in other titanium-aluminide alloys, the exact mechanisms have yet to be fully identified. In the present study, the oxide morphology of representative samples was examined in some detail to better understand the operative oxidation mechanisms.
The first stage of parabolic oxidation began after an initial period of transient oxidation characterized by a decreasing instantaneous rate coefficient, kp. The duration of this initial period decreased as the oxidation temperature increased so that it was not evident above 900~ but the first parabolic oxidation stage was identified at all exposure temperatures.
Similar decreases in the instantaneous parabolic rate coefficient have been identified in studies of the oxidation characteristics of nickel. ~~ The

122 Wallace et aL
decrease in k~ in these studies was attributed to a decreasing density of easy diffusion paths as oxidation progressed. It is probable that a similar phenom- enon occurs in super-a2.
At higher temperatures the oxidation kinetics were more complex and could not be described by a single parabolic relationship. The first parabolic stage was brief, lasting only 2 hours at 1000~ It was followed first by a period of nonparabolic oxidation, then by a second parabolic stage, and finally by breakaway oxidation.
Examination of oxide morphology showed that super-a2 formed a com- pact oxide during the first and second parabolic oxidation stages. Results from SEM (Fig. 3) and XRD (Table II) analysis indicate the oxide consisted primarily of TiO2 doped with niobium, with a thin layer of TiN at the oxide- metal interface. Although an outer layer of A1203 was also identified, further analysis showed that it was neither protective nor rate controlling.
The presence of the TiN layer has important implications on the nature of the oxide. For the reaction 2TiN + 02 = 2TiO + N2 to be in equilibrium, Po2/PN2 must be equal to 5 x 10 -16 at 9 8 2 ~ 9 The presence of TiN at the oxide-metal interface, therefore, implies that the ratio of oxygen pressure to nitrogen pressure is below this value in this region. This means that there is a strong activity gradient across the oxide, as would be present in a compact (void-free) oxide.
Analysis Of samples using XRD and SEM showed that the primary difference between the first and second parabolic periods was the presence of a TiAI layer beneath the TiN layer at the metal-oxide interface. Only trace amounts of TiA1 were found in samples within the first stage. Although a stronger XRD signal from TiA1 was identified at the end of this period (900~ 24 hours), it was not until the second parabolic stage (900~ 100 hours) that a layer of TiA1 was visible in the cross-sectional micrographs (Fig. 3b). This suggests that the formation of TiAI disrupts the processes governing the first parabolic stage. As the TiA1 begins to form, most likely due to a surplus of A1 at the oxide metal interface, diffusion across the oxide is altered and parabolic growth cannot continue. Instead, further growth occurs in a nonparabolic manner as the TiAI continues to form and cover the oxide metal interface. Once this layer is complete, however, parabolic growth resumes, but at a new rate.
SEM examination of cross-sectioned second stage specimens also revealed porosity in the oxide (Fig. 3b), in contrast to the compact oxides formed during the first stage. Layered porosity in oxides formed on titanium alloys has been attributed to successive spallation events caused by stresses between the growing oxide and the oxygen saturated metal substrate. ~ The weight gain data for super-a2 does not exhibit the sharp changes characteris- tic of oxide spallation. This is most likely due to the lower oxygen solubility

Characteristics of Ti-25AI-I 0Nb-3V-1Mo 123
of super-a2 compared to titanium alloys. The formation of the TiA1 at the oxide-metal interface, however, would introduce a complicated stress situation which may be linked to the formation of porosity.
Extensive porosity was associated with breakaway oxidation (975~ and 1000~ This suggests that porosity continues to form during the second parabolic oxidation stage, eventually reducing the protectiveness of the oxide until breakaway oxidation begins. In fact, at 975~ after 20 hours of break- away oxidation the protectiveness of the oxide was degraded to the point that a second-generation oxide was able to form at the oxide-metal interface. (Fig 5).
The final conclusion from this analysis is that super-a2 has complex oxidation kinetics caused by the multiplicity of oxidation products and reac- tions at the metal-oxide interface. Oxidation of this material is controlled primarily by the formation of TiOz, but formation of TiA1 at the oxide- metal interface, as well as porosity in the oxide, lead to nonparabolic tran- sitions and the eventual degradation of the protectiveness of the oxide.
CONCLUDING REMARKS
Super-a2 titanium-aluminide Ti 25A1-10Nb-3V- 1Mo is a modification of the stoichiometric alloy Ti3AI that was developed to improve room tem- perature ductility for aerospace applications. Additions of vanadium and molybdenum do not significantly alter the oxidation characteristics of the alloy compared to Ti-24AI-10Nb. Noteworthy features of the oxidation behavior of super-a2 are as follows:
1. The overall oxidation rate is much lower than that for stoichiometric Ti3A1 and about the same as for Ti-24Al-10Nb.
2. The oxidation kinetics are marked by up to two distinct periods of parabolic oxidation. The time of transition between the first and second stage depends on the exposure temperature,
3. The oxidation products are TiO2 doped with niobium, A1203, and TiN. The overall kinetics are characteristic of TiO2 control.
4. Oxidation during the parabolic stages is controlled by the presence of compact oxides. The transition between the first and second stage is linked to the formation of a TiAI layer at the oxide-metal interface.
5. Breakaway oxidation occurs after long times at high temperatures. The oxides, primarily TiO2, during this stage exhibit large amounts of porosity which reduce their protectiveness.
6. Oxygen dissolution in the alloy must be considered during the oxida- tion of super-or2. The solubility of oxygen in the alloy is lower than that of Ti-24AI-10Nb, but their diffusivities are similar.

124 Wallace et al.
R E F E R E N C E S
1. R. A. Perkins, K. T. Chiang, and G. H. Meier, Scripta Metall. 21, [505-1510 (1987). 2. S. N. Sankaran, R. K. Clark, J. Unnam, and K. E. Wiedemann, Oxidation Characteristics
ofTi 14A1-21Nb (wt.%) Ingot Alloy, NASA TP 30[2, 1990. 3. G. H. Meier, D. Appalonia, R. A. Perkins, and K. T. Chiang, in Oxidation of High-
Temperature lntermetallics, T. Grobstein and J. Doychak, eds. (The Minerals, Metals & Materials Society, 1989), pp. [85-193.
4. G. Welsch and A. I. Kahveci, in Oxidation of Higll- Temperature lntermetallics, T. Grobstein and J. Doychak, eds. (The Minerals, Metals & Materials Society, 1989), pp. 207 2[8.
5. R. A. Perkins and K. T. Chiang, in Oxidation of High-Temperature Intermetallics, T. Grobstein and J. Doychak, eds. (The Minerals, Metals & Materials Society, 1989), pp. 157- 169.
6. M. Khobaib and F. W. Vahldiek, in Space Age Metals Technology: Proceedings of the Second hzternational SAMPE Metals and Metals Processing Conference, F. H. Froes and Ray A. Cull, eds. (Society for the Advancement of Material and Process Engineering, Covina, CA, 1988), pp. 262-270.
7. P. Kofstad, P. B. Anderson, and O. J. Krudtaa, J. Less-Common Met~ 3, 89-97 (196[). 8. K. E. Wiedemann and J. Unnam, J. Appl. Phys. 58, 1095 (I985). 9. K. E. Wiedmann, S. N. Sankaran, R. K. Clark, and T. A. Wallace, in Oxidation of High-
Temperature hltermetallics, T. Grobstein and J. Doychak, eds. (The Minerals, Metals & Materials Society, 1989), pp. 195-206.
10. M. J. Graham, D. Caplan, and M. Cohen, J. Electrochem. Soc. 1119, 1265-1267 (1972). 11. G. Bertrand, K. Jarraya, and J. M. Chaix, Oxid. Met. 21, 1 [9 (1983L