Electrochemical Oxidation Pathway of the Anti-Cancer Agent ...
12
Bayraktepe, Polat, and Yazan. JOTCSA. 2018; 5(2): 381-392. RESEARCH ARTICLE 381 Electrochemical Oxidation Pathway of the Anti-Cancer Agent Dasatinib Using Disposable Pencil Graphite Electrode and its Adsorptive Stripping Voltammetric Determination in Biological Samples Dilek ESKİKÖY BAYRAKTEPE , Kamran POLAT , and Zehra YAZAN * Ankara University, Faculty of Science, Department of Chemistry, Ankara, TURKEY, 06560 Abstract: The present study describes the use of pencil graphite electrode (PGE) so as to investigate the electro-oxidation mechanism and voltammetric stripping determination of dasatinib (DST) in Britton-Robinson buffer solution (BR). Relating to cyclic voltammetric studies, an irreversible oxidation signal was obtained at about 1.0 V. The oxidation electrode process is adsorption-controlled and pH-dependent. For quantitative determination of DST, square wave adsorptive stripping voltammetry (AdsSWV) was employed in BR of pH 3.0. The oxidation signal varies linearly with the DST concentration in the range of 0.0092 – 1.0 µM. Detection and quantification (LOD and LOQ) values are founded as 0.0028 µM and 0.0092 µM, respectively. The developed AdsSWV method based on disposible and cheap PGE was applied successfully to the real human urine samples and the recovery results are given in the range of 97.94% to 100.82%. Keywords: Dasatinib, pencil graphite electrode, voltammetry, urine. Submitted: October 19, 2017. Accepted: February 06, 2018. Cite this: Eskiköy Bayraktepe D, Polat K, Yazan Z. Electrochemical Oxidation Pathway of the Anti- Cancer Agent Dasatinib Using Disposable Pencil Graphite Electrode and its Adsorptive Stripping Voltammetric Determination in Biological Samples. JOTCSA. 2018;5(2):381–92. DOI: To be assigned. *Corresponding author: E-mail: [email protected]
-
Upload
khangminh22 -
Category
Documents
-
view
1 -
download
0
Transcript of Electrochemical Oxidation Pathway of the Anti-Cancer Agent ...
Bayraktepe, Polat, and Yazan. JOTCSA. 2018; 5(2): 381-392. RESEARCH ARTICLE
381
Electrochemical Oxidation Pathway of the Anti-Cancer Agent Dasatinib
Using Disposable Pencil Graphite Electrode and its Adsorptive Stripping Voltammetric Determination in Biological Samples
Dilek ESKİKÖY BAYRAKTEPE , Kamran POLAT , and Zehra YAZAN*
Ankara University, Faculty of Science, Department of Chemistry, Ankara, TURKEY, 06560
Abstract: The present study describes the use of pencil graphite electrode (PGE) so as to
investigate the electro-oxidation mechanism and voltammetric stripping determination of dasatinib
(DST) in Britton-Robinson buffer solution (BR). Relating to cyclic voltammetric studies, an
irreversible oxidation signal was obtained at about 1.0 V. The oxidation electrode process is
adsorption-controlled and pH-dependent. For quantitative determination of DST, square wave
adsorptive stripping voltammetry (AdsSWV) was employed in BR of pH 3.0. The oxidation signal
varies linearly with the DST concentration in the range of 0.0092 – 1.0 µM. Detection and
quantification (LOD and LOQ) values are founded as 0.0028 µM and 0.0092 µM, respectively. The
developed AdsSWV method based on disposible and cheap PGE was applied successfully to the real
human urine samples and the recovery results are given in the range of 97.94% to 100.82%.
Keywords: Dasatinib, pencil graphite electrode, voltammetry, urine.
Submitted: October 19, 2017. Accepted: February 06, 2018.
Cite this: Eskiköy Bayraktepe D, Polat K, Yazan Z. Electrochemical Oxidation Pathway of the Anti-
Cancer Agent Dasatinib Using Disposable Pencil Graphite Electrode and its Adsorptive Stripping
Voltammetric Determination in Biological Samples. JOTCSA. 2018;5(2):381–92.
DOI: To be assigned.
*Corresponding author: E-mail: [email protected]

Bayraktepe, Polat, and Yazan. JOTCSA. 2018; 5(2): 381-392. RESEARCH ARTICLE
382
INTRODUCTION
Dasatinib (DST), N-(2-chloro-6-methylphenyl)-2-[[6-[4-(2-hydroxyethyl)-1-piperazinyl]-2-methyl-
4-pyrimidinyl]amino]-5-thiazole, inset in Fig. 1, is a multiple target tyrosine kinase inhibitor, forceful
against the proliferation of cells expressing mutant kinases. DST is synthesized from a 2-
aminothiazole that is taken in consideration the atypical Src family kinase inhibitor template (1).
DST is displayed for the treatment of different myeloid leukaemia types (2-5). Also, DST used for
treatment of nonHodgkin’s lymphoma, prostate cancer and metastatic breast cancer.
Up to now, there are a few methods described for the determination of DST only including
chromatography (6-10), spectroscopy (11,12) and voltammetry (16,17). However,
chromatographic and spectroscopic methods have some disadvantages like that they are time-
consuming procedures, using expensive equipment and sample pre-treatments. In this context,
electroanalytical methods are very good alternatives and more in particular, stripping techniques
provide immense properties for determination of metal ions and some organic substances with
excellent detection limits (13,14). Also, voltammetric techniques are relatively of low cost, sensitive
and selective. Due to these advantages, voltammetric techniques has been used widely in the
investigation of redox reactions and analysis of organic and inorganic substances using various
electrodes. Nowadays carbon-based electrodes are available for electroanalytical applications by the
reason of their lower background current, extensive potential window, low price, and inertness. In
particular, pencil graphite electrode has been used as working electrode because of high
electrochemical reactivity, low cost and ease of modification, ease of miniaturization, no need to
time consuming processes (15).
There are few studies on the voltammetric analysis of DST. Jesus et al. and Karimi-Maleh et al.
reported that DST was electrochemically analyzed at glassy carbon electrode and modified carbon
paste electrode by square wave voltammetry. The values of LOD were found to be 0.13 and 1.0 µM
in the other works (16, 17). However, a survey of literature reveals that not much work has been
performed on electrochemical oxidation mechanism and adsorptive stripping voltammetric analysis
of DST in the low limit of detection at the disposable pencil graphite electrode.
Thus, the goal of current study was to investigate the voltammetric oxidation mechanism of
dasatinib by using disposable pencil graphite electrode and to develop a new sensitive voltammetric
stripping method for the rapid, cheap and sensitive analysis in human urine samples.

Bayraktepe, Polat, and Yazan. JOTCSA. 2018; 5(2): 381-392. RESEARCH ARTICLE
383
EXPERIMENTAL
Chemicals and Apparatus
Standard DST powder was taken from Nobel© and all other solvents purchased from Sigma
Company 1.0 mM stock solution of DST was prapared by dissolving a known amount of DST in a
mixture of 40% DMSO and 60% double distilled water and kept in the fridge at +4 °C until assay.
0.02 M Britton- Robinson buffer solution was used as supporting electrolyte and 0.1 M NaOH solution
was used to adjust the pH of medium.
Cyclic voltammetric (CV), square wave adsorptive stripping voltammetric (AdsSWV) and
Electrochemical Empedance Spectroscopic (EIS) measurements were carried out on a CHI 760B
(USA) Workstation with BAS C3 cell stand. A traditional three electrode system was used and pencil
graphite electrode (PGE) was used as working electrode, Ag/AgCl (in 3.0 mol L-1 NaCl, BAS MW-
1032) was used as reference and platinum wire was used as an auxiliary electrode (BAS MF-2052).
A pencil lead with 0.5 mm diameter (2B) and 60 mm a total length (Tombow, Japan). A pencil of
Rotring from Germany was used as a holder for the pencil lead and all of them were taken from a
local bookstore. Electrical contact was provided by wrapping a metalic wire to the metallic part of
the holder. 12 mm of lead was measured with a ruler and then immersed into the solution before
each measurement. pH measurements were carried out with a HANNA Instruments HI2211 pH/ORP
meter.
Analytical procedure
All electrochemical measurements (CV, AdsSWV, EIS) were made in a 10 mL-voltammetric cell. A
known volume of stock solution was mixed with the required volume of BR buffer with the
determined pH. Before all measurements, the solution inside the cell was purged with ultra-pure
nitrogen (99.99 %) for a period of 60 s to expel the dissolved oxygen. The voltammograms were
recorded after a 2- second quiet time, in the potential range, (+0.4) (+1.40) V.
Calibration solutions
By using the stock 1.0 mM DST solution, calibration solutions at the concentrations of 0.010, 0.050,
0.10, 0.30, 0.50, 0.80, and 1.0 M were prepared in the volumetric cell, then the current of each
solution were measured by AdsSWV method.
The calibration of the pH electrode were done by commercial buffer solutions at the pH values of
4.0, 7.0, and 10. Double-distilled water was supplied from a Human Power I+, Ultra-Pure Water
System. All measurements were performed at room temperature.
Bayraktepe, Polat, and Yazan. JOTCSA. 2018; 5(2): 381-392. RESEARCH ARTICLE
384
Biological sample preparation
Human urine samples were taken from healthy volunteers. As soon as the urine sample was taken,
calculated amount of supporting electrolyte was mixed with 20 L of urine in the voltammetric cell.
To this mixture, a sufficient volume of DST stock solution was added to make the final volume
exactly to 10.0 mL.
RESULT and DISCUSSION
Electrochemical behavior of DST on PGE
Electrochemical redox behavior, adsorption, and diffusion properties of DST on PGE were studied
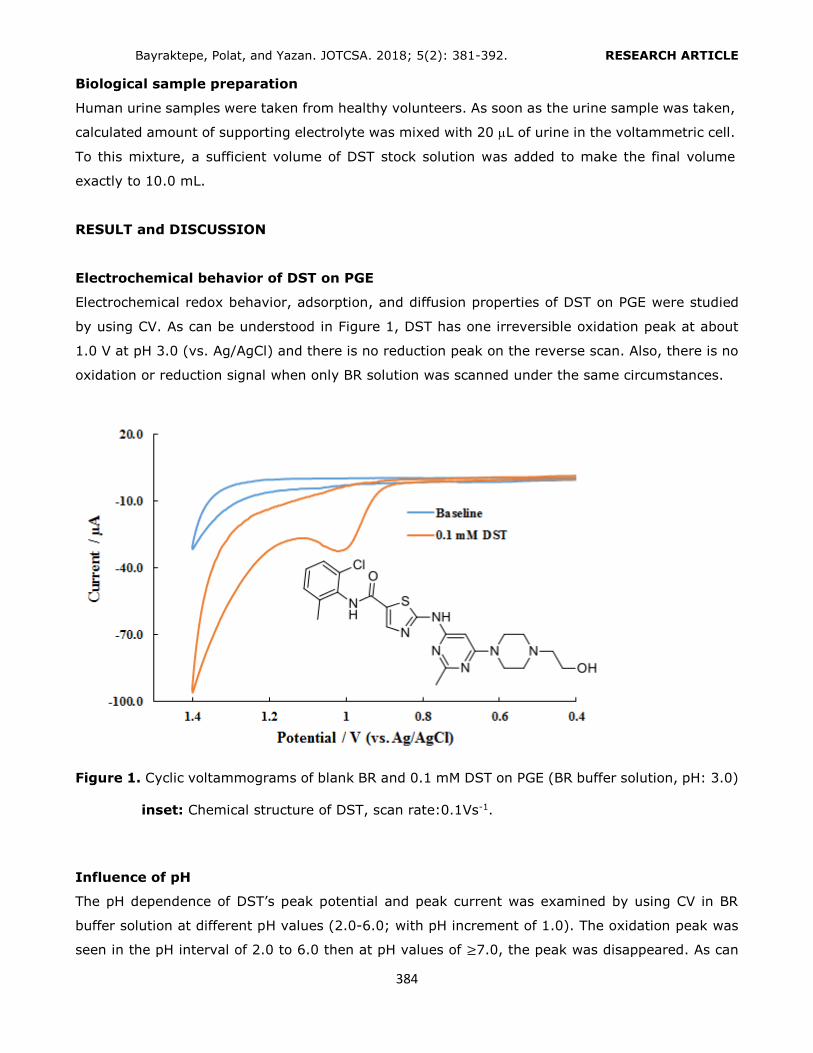
by using CV. As can be understood in Figure 1, DST has one irreversible oxidation peak at about
1.0 V at pH 3.0 (vs. Ag/AgCl) and there is no reduction peak on the reverse scan. Also, there is no
oxidation or reduction signal when only BR solution was scanned under the same circumstances.
Figure 1. Cyclic voltammograms of blank BR and 0.1 mM DST on PGE (BR buffer solution, pH: 3.0)
inset: Chemical structure of DST, scan rate:0.1Vs-1.
Influence of pH
The pH dependence of DST’s peak potential and peak current was examined by using CV in BR
buffer solution at different pH values (2.0-6.0; with pH increment of 1.0). The oxidation peak was
seen in the pH interval of 2.0 to 6.0 then at pH values of ≥7.0, the peak was disappeared. As can

Bayraktepe, Polat, and Yazan. JOTCSA. 2018; 5(2): 381-392. RESEARCH ARTICLE
385
be understood in Fig. 2, the relevant peak was reached maximum current value at pH 3.0. Thereby,
pH 3.0 was chosen as optimum pH for analysis of DST.
Figure 2. Cyclic voltammograms of 0.1 mM DST on different pH values in BR buffer solution. Inset
a. pH-ip graph, inset b. pH-Ep graph of DST (scan rate:0.1 Vs-1).
The peak potential of DST moves more negative potential values with increasing pHs (Fig. 2b). This
behavior indicates that, the oxidation mechanism of DST includes proton transfer as well as electron
transfer. The peak potential of the linear relation relates (Ep) to the pH value:
Ep = -0.0511pH + 1.1905 (R2=0.9232).
Slope of this equation (0.0511 V/pH) ) is nearly the same with the theoretical value of 0.059 V/pH
and this result shows that, in the electrode reaction mechanism, transferred electron and proton
numbers are equal (18).

Bayraktepe, Polat, and Yazan. JOTCSA. 2018; 5(2): 381-392. RESEARCH ARTICLE
386
Influence of scan rate
The voltammograms obtained by using CV were recorded at various scan rates to see the differences
in the peak potential and current in 0.02 M BR buffer solution at pH 3.0 (0.1 mmolL-1 DST, Fig.3).
The scan rates were changed in the interval v=0.05-0.50 Vs-1. The voltammograms show that, with
increasing scan rate, the peak current permanently increases and the peak potential moves in values
that are more positive. As can be seen in the inset of Figure 3, the equation between the peak
current and the scan rate for oxidation peak is given below:
ip = 122.26ʋ + 3.48 (R2 = 0.9893)
The linearity of ipa vs. v graphs specified that the reaction is adsorption-controlled process (19).
The logipa vs. logv is presented in Fig.3 for DST. The slope of the graph is 0.82. This result indicates
that the adsorption phenomenon is dominant (18).
To find out the transferred electron numbers of oxidation mechanism, the following equation for
irreversible reactions is used (19):
|𝐸𝑝 − 𝐸𝑝/2|= 48
𝛼𝑐𝑛𝛼 mV (1)
According to this equation, n is the transferred electron numbers, Ep represents the peak potential,
Ep/2 represents the half peak potential, and α represents the electron transfer coefficient. By using
corresponding equation, the number of electrons (n) transferred in the oxidation of DST occurring
at the potential value of about 1.0 V is 1.99 ± 0.18.
According to all these results, in oxidation mechanism of DST, 2eand 2H+ are transferred. This
may be attributed to the fact that the sulfur group of the thiazole ring is oxidized to sulfonyl group
(16) and tentative reaction mechanism is suggested as follows:
Scheme 1. Elecro-oxidation mechanism of DST on PGE.

Bayraktepe, Polat, and Yazan. JOTCSA. 2018; 5(2): 381-392. RESEARCH ARTICLE
387
Figure 3. Cyclic voltammograms of 0.1 mmolL-1 DST at different scan rate values in BR buffer
solution pH 3.0 Insets a. ip ˗ ʋ and Insets b. logʋ ˗ logip plots.
Analytical procedure
The AdsSWV method with the PGE indicates some prospects for the quantitative determination of
DST in real human urine samples. The circumstances of the determination studies are given below.
Optimization of experimental conditions
The applicability of adsorptive stripping square wave voltammetry (AdsSWV) procedure as analytical
methods for the analysis of DST was examined by measuring the anodic peak current as a function
of the concentration of DST. The linear concentration range, LOD and LOQ were determined from
the calibration graph obtained by measuring the anodic peak current as a function of concentration.
For this reason, the effects of accumulation time and accumulation potentials on the peak currents
obtained with 1.0×10⁻⁶ molL-1 DST were investigated by using AdsSWV. Accumulation potentials
were changed in the range (0.0) – (+1.0 V) with 0.1 V increments. Accumulation times were in the
range 0 – 90.0 s (15s increments). The results are summarized in Figure 4. The graphs show that
the optimum accumulation potential and accumulation time values are 0.2 V and 30.0 s,
respectively.

Bayraktepe, Polat, and Yazan. JOTCSA. 2018; 5(2): 381-392. RESEARCH ARTICLE
388
Figure 4. The effect of accumulation potential (a) and accumulation time (b) on AdsSW
voltammograms of DST (CDST: 1.0 µmolL-1, pH 3.0).
Calibration studies
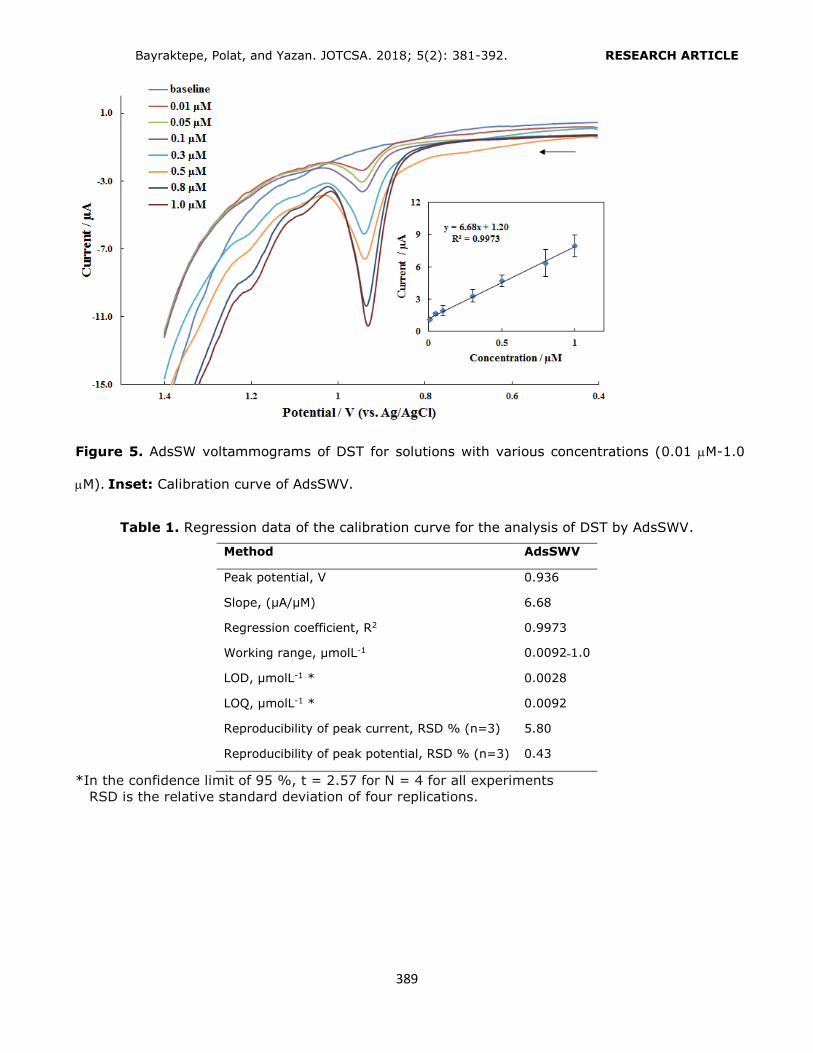
Under optimum experimental conditions, the calibration graph is established. As it can be seen in
Figure 5, DST’s oxidation peak current linear with DST concentration in the concentration range of
0.01 – 1.0 µM. The regression equation of calibration graph is given below:
ip (µA) = 6.68CDST (µM) + 1.20 (R² = 0.9973).
The values of LOD and LOQ were calculated using the equations are mentioned below (19-21);
LOD and LOQ values were calculated using the following Equation;
LOD = 3s/m; LOQ = 10s/m
where s is the standard deviation for the peak currents of lowest DST concentration studied and m
is the slope of the calibration graph.
By using corresponding equations, LOD and LOQ values were calculated as 0.0028 µmolL-1 and
0.0092 µmolL-1, respectively. According to our literature knowledge, the obtained limits are the
lowest results notch up to now (16, 17). A comparison of our study with literature reports is shown
in Table 1 and validation parameters of proposed method are shown in Table 2.
Bayraktepe, Polat, and Yazan. JOTCSA. 2018; 5(2): 381-392. RESEARCH ARTICLE
389
Figure 5. AdsSW voltammograms of DST for solutions with various concentrations (0.01 M-1.0
M). Inset: Calibration curve of AdsSWV.
Table 1. Regression data of the calibration curve for the analysis of DST by AdsSWV.
Method AdsSWV
Peak potential, V 0.936
Slope, (µA/µM) 6.68
Regression coefficient, R2 0.9973
Working range, µmolL-1 0.0092˗1.0
LOD, µmolL-1 * 0.0028
LOQ, µmolL-1 * 0.0092
Reproducibility of peak current, RSD % (n=3) 5.80
Reproducibility of peak potential, RSD % (n=3) 0.43
*In the confidence limit of 95 %, t = 2.57 for N = 4 for all experiments
RSD is the relative standard deviation of four replications.

Bayraktepe, Polat, and Yazan. JOTCSA. 2018; 5(2): 381-392. RESEARCH ARTICLE
390
Table 2. Comparison of the successes of different voltammetric methods for the analysis of DST.
Technique Electrode
Working range
(µmol L-1)
LOD (µmol
L-1) Sample Reference
AdsSWV PGE 0.0092 – 1.0 0.0028 Urine This work
DPV GCE 0.43-2.0 0.13 Serum (16)
SWV Pt/MWCNTs-BMIHFP-
CPE 5.0 - 500 1.0
Urine and
tablets (17)
DPV: Differential pulse voltammetry, SWV: Square wave voltammetry, PGE: pencil graphite electrode, GCE: glassy carbon electrode, Pt/MWCNTs-BMIHFP-CPE: platininum/multiwalled carbon nanotubes-1- butyl-3-methylimidazolium hexafluorophosphate-modified carbon paste electrode.
Real sample application
In order to demonstrate the applicability of developed method, DST was analyzed in human urine
by using AdsSWV. The analysis procedure was given in Experimental part (in Real sample
preparation section). According to the calculated recovery results, DST can be analyzed in urine
samples with high accuracy. The results of recovery are given in Table 3.
Table 3. Recovery results for DST in urine samples.
Added, µM Found, µM Recovery, % %RSD
0.300 0.302 100.82∓7.01 2.80
0.500 0.494 98.71∓10.03 4.09
0.800 0.783 97.94∓6.67 4.37
Interferences
The impact of interferents that can be present in human urine samples were examined. In this
context, 0.3 µmolL-1 DST sample was mixed with known amounts of uric acid, ascorbic acid,
glucose, L-glutamic acid and L-cysteine for the purpose of adjust their concentrations to 30 µmolL-
1 (100 times higher than DST). Present responses obtained from only DST and samples blended
with DST and components were compared. Calculated differences between the peak currents were
found to be less than 10% of the signal obtained with DST solution.
CONCLUSION
This work has demonstrated that DST has only one oxidation peak at about +1.0 V at PG electrode
in Britton Robinson buffer solution, pH 3.0. The electrochemical oxidation occurs through step by
two electrons and two protons. For the quantification analysis of DST with AdsSWV method was
optimized to voltammetric parameters. The oxidation signal is linearly related to DST in the
Bayraktepe, Polat, and Yazan. JOTCSA. 2018; 5(2): 381-392. RESEARCH ARTICLE
391
concentrations range of 0.0092–1.0 µmolL-1, with a LOD of 0.0028 µmolL-1 and a LOQ of 0.0092
µmolL-1. To the best of our literature knowledge, these values are the lowest detection limits ever.
Moreover, the method was applied successfully to real human urine sample.
ACKNOWLEDGMENTS
Our research group is grateful to Ankara University Research Fund (Project numbers of
13L4240009 and 15L0430006) for financial support.
REFERENCES
1. Das J, Chen P, Norris D, Padmanabha R, Lin J, Moquin RV and Pang S. 2-Aminothiazole as a novel kinase inhibitor template. Structure− activity relationship studies toward the discovery of N-(2-chloro-6-methylphenyl)-2-[[6-[4-(2-hydroxyethyl)-1-piperazinyl)]-2-methyl-4-pyrimidinyl] amino)]-1, 3-thiazole-5-carboxamide (dasatinib, BMS-354825) as a potent pan-Src kinase inhibitor. Journal of medicinal chemistry 2006; 49(23):6819-6832.
2. Montero JC, Seoane S. Ocaña A and Pandiella A. Inhibition of SRC family kinases and receptor tyrosine kinases by dasatinib: possible combinations in solid tumors. Clinical cancer research, 2011; 17(17):5546-5552. 3. Steinberg, M. Dasatinib: A tyrosine kinase inhibitor for the treatment of chronic myelogenous leukemia and philadelphia chromosome—positive acute lymphoblastic leukemia. Clinical therapeutics 2007; 29(11):2289-
2308. 4. Tokarski JS, Newitt JA, Chang CYJ, Cheng JD, Wittekind M, Kiefer SE and Xie D. The structure of Dasatinib
(BMS-354825) bound to activated ABL kinase domain elucidates its inhibitory activity against imatinib-resistant ABL mutants. Cancer research 2006; 66(11):5790-5797.
5. Vandyke K, Fitter S and Zannettino ACW. The tyrosine kinase inhibitor dasatinib (SPRYCEL) inhibits chondrocyte activity and proliferation. Blood cancer journal 2011; 1(2), e2. 6. Lankheet NA, Hillebrand MJ, Rosing H, Schellens JH, Beijnen JH and Huitema AD. Method development and validation for the quantification of dasatinib, erlotinib, gefitinib, imatinib, lapatinib, nilotinib, sorafenib and sunitinib in human plasma by liquid chromatography coupled with tandem mass spectrometry. Biomedical Chromatography 2013; 27(4):466-476.
7. Kralj E, Trontelj J, Pajič T and Kristl A. Simultaneous measurement of imatinib, nilotinib and dasatinib in dried blood spot by ultra high performance liquid chromatography tandem mass spectrometry. Journal of Chromatography B 2012; 903:150-156.
8. De Francia S, D’Avolio A, De Martino F, Pirro E, Baietto L, Siccardi M and Di Perri G. New HPLC–MS method for the simultaneous quantification of the antileukemia drugs imatinib, dasatinib, and nilotinib in human
plasma. Journal of Chromatography B 2009; 877(18), 1721-1726. 9. Hsieh Y, Galviz G, Zhou Q and Duncan C. Hydrophilic interaction liquid chromatography/tandem mass spectrometry for the simultaneous determination of dasatinib, imatinib and nilotinib in mouse plasma. Rapid Communications in Mass Spectrometry 2009; 23(9); 1364-1370.
10. Roche S, McMahon G, Clynes M and O’Connor R. Development of a high-performance liquid chromatographic–mass spectrometric method for the determination of cellular levels of the tyrosine kinase inhibitors lapatinib and dasatinib. Journal of Chromatography B 2009; 877(31):3982-3990.
Bayraktepe, Polat, and Yazan. JOTCSA. 2018; 5(2): 381-392. RESEARCH ARTICLE
392
11. Vadia N and Rajput S. Development of colorimetric method for determination of dasatinib in bulk and in
tablet formulation. International Journal of Pharmacy and Pharmaceutical Sciences 2011; 3(2):188-190.
12. Sankar, DG, Rajeswari A, Babu AN and Krishna MV. UV-spectrophotometric determination of dasatinib in pharmaceutical dosage forms. Asian Journal of Chemistry 2009; 21(7): 5777 – 5779. 13. Tığ GA, Günendi G and Pekyardımcı Ş. A selective sensor based on Au nanoparticles-graphene oxide-poly
(2, 6-pyridinedicarboxylic acid) composite for simultaneous electrochemical determination of ascorbic acid, dopamine, and uric acid. Journal of Applied Electrochemistry 2017; 47(5):607-618. 14. Pekin M, Bayraktepe DE and Yazan Z. Electrochemical sensor based on a sepiolite clay nanoparticle-based electrochemical sensor for ascorbic acid detection in real-life samples. Ionics 2017; 1-9. 15. Gao W, Song J and Wu N. Voltammetric behavior and square-wave voltammetric determination of
trepibutone at a pencil graphite electrode. Journal of Electroanalytical Chemistry 2005; 576(1):1-7. 16. Jesus CS and Diculescu VC. Redox mechanism, spectrophotometrical characterisation and voltammetric
determination in serum samples of kinases inhibitor and anticancer drug dasatinib. Journal of Electroanalytical Chemistry 2015; 752:47-53. 17. Karimi-Maleh H, Shojaei AF, Tabatabaeian K, Karimi F. Shakeri S and Moradi R. Simultaneous
determination of 6-mercaptopruine, 6-thioguanine and dasatinib as three important anticancer drugs using nanostructure voltammetric sensor employing Pt/MWCNTs and 1-butyl-3-methylimidazolium hexafluoro phosphate. Biosensors and Bioelectronics 2016; 86:879-884. 18. Zare HR, Rajabzadeh N, Nasirizadeh N and Ardakani MM. Voltammetric studies of an oracet blue modified glassy carbon electrode and its application for the simultaneous determination of dopamine, ascorbic acid and
uric acid. Journal of Electroanalytical Chemistry 2006; 589(1):60-69. 19. Bayraktepe DE, Yazan Z and Polat K. Sensitive and selective voltammetric determination of anti˗ cancer
agent shikonin on sepiolite clay/TiO2 nanoparticle/MWCNTs composite carbon paste sensor and investigation of its electro˗ oxidation mechanism. Journal of Electroanalytical Chemistry 2016; 780:38-45.
20. Tığ GA. Development of electrochemical sensor for detection of ascorbic acid, dopamine, uric acid and l-tryptophan based on Ag nanoparticles and poly (l-arginine)-graphene oxide composite. Journal of Electroanalytical Chemistry 2017; 807:19-28. 21. Guzmán A, Agüí L, Pedrero M, Yáñez‐Sedeño P and Pingarron JM. Voltammetric Determination of
Antibacterial Nitro‐Compounds at Activated Carbon Fibre Microelectrodes. Electroanalysis 2004; 16(21):1763-
1770.