Truncated hexa-octahedral magnetite crystals in ALH84001: Presumptive biosignatures
Upload
georgetownCategory
view
1download
0
RSC Advances
PAPER
Publ
ishe
d on
01
May
201
4. D
ownl
oade
d by
Geo
rget
own
Uni
vers
ity L
ibra
ry o
n 28
/05/
2014
05:
12:0
8.
View Article OnlineView Journal | View Issue
Department of Chemistry, Georgetown Unive
20057, USA. E-mail: [email protected];
5872
Cite this: RSC Adv., 2014, 4, 21284
Received 28th January 2014Accepted 29th April 2014
DOI: 10.1039/c4ra00815d
www.rsc.org/advances
21284 | RSC Adv., 2014, 4, 21284–2129
Electrochemical and in situ ATR-SEIRASinvestigations of methanol and CO electro-oxidation on PVP-free cubic and octahedral/tetrahedral Pt nanoparticles
Augusta M. Levendorf, De-Jun Chen, Christopher L. Rom, Yangwei Liuand YuYe J. Tong*
Most wet-chemical methods that synthesizemetal nanoparticles (NPs) of a particular size and desired shape
include the use of a stabilizing surfactant, such as poly(vinylpyrrolidone) (PVP). The latter has the ability to
prohibit and/or promote surface sites from participating in electrocatalytic reactions, i.e. the methanol
oxidation reaction (MOR). In light of our recent findings that adsorbed PVP can enhance the MOR on Pt
NPs, a strong effort was made herein to separate the NP surface orientation effect from that of surface-
bound PVP. We report the in situ ATR-SEIRAS (attenuated total reflection-surface enhanced infrared
reflection absorption spectroscopy) and electrochemical (EC) studies of MOR and CO oxidation reaction
(COR) performed on PVP-free cubic and octahedral/tetrahedral (O/T) Pt NPs that were obtained using
an adapted liquid phase UV photo-oxidation (UVPO) technique. Transmission electron microscope (TEM)
images showed no observable changes of shape and size after the elimination of the PVP, while the
integrity of the atomic surface structure was further confirmed by the orientation-dependent EC
stripping analysis of irreversibly adsorbed adatoms, i.e. Bi and Ge. The MOR activity was enhanced by the
preferential surface orientation of the O/T Pt NPs compared to commercial Pt black and the cubic Pt
NPs. The in situ ATR-SEIRAS measurements showed that the PVP-free Pt NPs adsorbed more bridge-
bound gaseous CO than those with residual PVP and the weakly hydrogen-bound interfacial water
played an important role for the orientation dependent enhancement in MOR activity. Additionally, the
findings of this work are coupled with previously published investigations regarding the influence that
PVP exerts on the ultimate activity of the Pt NPs, i.e., the adsorbed PVP enhances further the MOR
activity on the O/T but suppresses it on the cubic Pt NPs.
1. Introduction
Among the various small alcohol fuel cells, which efficientlyconvert chemical energy into electrical energy, the directmethanol fuel cell (DMFC) offers promising technical advan-tages in terms of energy density and facile fuel distribution forfuture implementation.1–3 Single crystal Pt studies have servedas the foundation for understanding the methanol oxidationreaction (MOR) occurring at the anode, which is sensitive to thesurface morphology as dened by the exposed crystallographicplanes.2,4,5 These single crystal studies have established that theactivity for MOR in acidic media, i.e. HClO4 or H2SO4, increasesin the order of Pt(111) < Pt (110) < Pt(100) for the bulk surfaces.In practice, however, metallic nanoparticles (NPs) are theeconomically viable form of electrocatalysts for catalyzing
rsity, 37th & O Street NW, Washington DC,
Fax: +1-202-687-5591; Tel: +1-202-687-
3
DMFC reactions in fuel cells because they offer an efficient wayof utilizing expensive materials due to large surface area tovolume ratios and unique catalytic properties due to theirreduced dimensions.6 Extrapolating the results obtained onmacroscopic single crystal surfaces to the nanoscale electro-catalysts, however, is not as straightforward as it appears sincethe reduced dimensions of metal NPs can introduce unexpectedgeometric and electronic effects that can alter substantially thecatalytic behavior of the exposed nanofacets.7–9 For example, theMOR trends in acidic media on Pt NPs are different from thetrends observed on bulk crystals, i.e. the activity increases in theorder of Pt NPs enclosed by Pt(100) < Pt(110) < Pt(111)nanofacets.8,10
Since the pioneering work of El-Sayed et al. in 1996 tosynthesize preferentially shape-controlled Pt NPs, sophisticatedinvestigations by Feliu et al., Sun et al. and others continue toelucidate the relationships between structure and catalyticactivity at the nanoscale as well as correlations betweenmacroscopic and nanoscopic systems.9–15 The advances in NP
This journal is © The Royal Society of Chemistry 2014
Paper RSC Advances
Publ
ishe
d on
01
May
201
4. D
ownl
oade
d by
Geo
rget
own
Uni
vers
ity L
ibra
ry o
n 28
/05/
2014
05:
12:0
8.
View Article Online
research allow NPs of unique shapes and sizes to be synthesizedfrom a diverse array of techniques ranging from thermaldecomposition to potentiometric methods.9,14,16 In the polyol-based synthetic approaches, surfactants are frequently used assize stabilizing and/or shape-controlling agents, where poly(-vinylpyrrolidone) (PVP) is among the most popular used.Following the synthesis, the remaining surface-site-blockingsurfactants are usually considered reaction inhibitors andconsequently become the targets of elimination. The eradica-tion of PVP without damaging the structural integrity of the NPshas been a challenging endeavor for the community.17–19
In addition to synthetic control of the shape that has beencorrelated qualitatively to the exposed crystallographic planesvia TEM, evaluating the atomic arrangement at the surfacequantitatively is of paramount importance.6 Among the detailedelectrochemical (EC) investigations reported by Feliu et al., theyhave developed methods that allow for in situ characterizationof the surface order using irreversible adatom adsorptionthat more accurately describes the surface atomicarrangement.10,12,20
In view of the recent investigations that adsorbed PVP canimprove the MOR on Pt through surface water activation and anenhanced direct pathway,21,22 more specically, an unexpectedlarge enhancement in MOR was observed on the octahedral/tetrahedral (O/T) Pt NPs that had �16 wt% residual PVP aer astrong base treatment.8 Our subsequent studies21,22 have alsoshown that adsorbing PVP onto Pt black and carbon-supportedPt NPs can substantially enhance the MOR and formic acidoxidation reaction activities. In this follow-up study to recentlypublished works focused on PVP-protected NPs, we investigatewhether the MOR activity enhancement observed on these PVP-protected systems is purely a PVP induced effect or a combi-nation of the former with the surface orientation effect atnanoscale.8,33 This paper reports the results obtained from theEC and in situ SEIRAS (surface enhanced IR reection absorp-tion spectroscopy) investigations of MOR and carbon monoxide(CO) oxidation reaction (COR) performed on the PVP-free cubicand O/T Pt NPs. The shape-controlled Pt NPs were synthesizedemploying an established polyol method that uses PVP as thesize stabilizer as done previously, however we were able toachieve complete removal of surface-bound PVP with an opti-mized liquid phase UV treatment combined with oxygenatedH2O2 (UVPO).17,19 TEM and adatom adsorption that will bediscussed later, were used to qualitatively and quantitativelyprobe the atomic surface arrangement of the Pt NPs to ensurestructural integrity prior to the EC and in situ SEIRASmeasurements.
2. Materials and methods2.1. Synthesis of shape-controlled Pt NPs
The shape-controlled Pt NPs of �11 nm were synthesized in aone-step procedure according to the established polyol basedprocedures as done previously.23,24 In a round bottom ask, 2.5mL of ethylene glycol (EG) was reuxed for ca. 20 min. Subse-quently, 0.5 mL of 0.002 M or 0.06 M AgNO3 in EG were added tothe boiling EG in order to achieve Pt (100) bound NPs (cubes) or
This journal is © The Royal Society of Chemistry 2014
Pt (111) bound NPs (octahedrons/tetrahedrons), respectively.Alternating 94 mL of 0.375 M PVP (55 000 Mw – 3 mL total) and47 mL of 0.0675 M H2PtCl6$6H2O (1.5 mL total) in EG wereadded to the boiling EG solution at 30 s intervals. The reactionsolution was reuxed for an additional 10 min then allowed tocool to room temperature.
In general, the reaction solution was centrifuged for 20 minat 6000 rpm to remove the AgCl precipitate if required. In orderto remove the excess EG and PVP, the supernatant was centri-fuged with a triple volume of acetone for 20 min at 6000 rpmuntil the NCs were clearly separated. The resulting Pt NPs wasdispersed into ca. 5 mL EtOH via sonication and then 20 mL ofhexanes were added before centrifugation for 20 min at 6000rpm, which was repeated at least 3 times until nal dispersioninto EtOH.
A modied procedure of liquid phase UV combined withoxygenated H2O2 (UVPO) was optimized to remove the residualPVP from the surface.17,19 Briey, a small proportion of theethanolic-suspension of NPs was dispersed into about 2 mL ofH2O with 200–250 mg NaOH to yield a basic environment.Separately, a basic solution of 10 mL of H2O2 was prepared byadding 200–250 mg NaOH and then the solution was bubbledfor at least 10 min with O2 gas. The basic solution of NPsunderwent UV irradiation (254 nm) for 1 h with the addition ofca. 1 mL of O2-saturated H2O2 solution at specic time intervals,i.e. every 10 min. Aer UV exposure, the resultant solution waspuried by the repetitive centrifugation and precipitationprocess with EtOH and ultimately dispersed in EtOH beforedrying overnight in the oven at 60 �C.
2.2. Transmission electron microscopy (TEM)
The resultant NPs were characterized by a JEOL-2100 LaB6
microscope at the Nanoscale Imaging and Spectroscopy Labo-ratory at UMD College Park. Shape and size distributions werebased on a minimum of 150 counts with the aid of the ImageJsoware.
2.3. Thermogravimetric analysis (TGA)
TGA experiments were performed on a SDTQ600 or Q50TA Instrument. The data was analyzed with Universal TAAnalysis 2000 soware to determine weight percent of PVP onthe particle surface. Typically, at least 2 mg of sample wasplaced into a ceramic pan at room temperature (RT)before the temperature was increased at a rate of 10 �C min�1
to a minimum of 600 �C under a steady ow of nitrogen(20 mL min�1).
2.4. Electrochemical (EC) analysis
EC measurements were performed in an Ar-blanketed conven-tional three electrode EC cell using a CHI potentiostat (CHInstrument, Inc) that was controlled with CHI soware. Thesupporting electrolyte solution was 0.5 M H2SO4 (GFS Chem-icals, double distilled). Commercial Ag/AgCl (1 M) (CH Instru-ment, Inc) and Pt gauze electrodes were used as the referenceand counter electrodes, respectively. The working electrode wascomprised of NPs that were deposited onto a well-polished 3
RSC Adv., 2014, 4, 21284–21293 | 21285
RSC Advances Paper
Publ
ishe
d on
01
May
201
4. D
ownl
oade
d by
Geo
rget
own
Uni
vers
ity L
ibra
ry o
n 28
/05/
2014
05:
12:0
8.
View Article Online
mm commercial glassy carbon electrode (GCE) (BioAnalyticalSystems, Inc). The NP deposition involved a dilute suspensionof NPs in water, usually 2 mg mL�1 that was drop cast onto theGCE and allowed to air dry.
Cyclic voltammetry (CV) and chronoamperometry (CA) werecommonly used to assess the electrocatalytic activity of thesamples. CVs were recorded with a 50 mV s�1 scan rate unlessotherwise stated. The electrode potentials are given in referenceto the reversible hydrogen electrode (RHE), although all datawere collected using the Ag/AgCl reference electrode. Thecurrents reported are normalized with respect to the Pt elec-trochemical surface area (ECSA) determined by the hydrogendesorption charge per area. The charge densities, based on Ptsingle crystal measurements, were 220, 208 and 240 mC cm�2 forpolycrystalline, (100) and (111) atomic arrangements,respectively.25
The atomic surface structure was also investigated using theaforementioned irreversible adsorption of Bi or Ge, the detailsof which can be found elsewhere.10,20 In brief, Bi was sponta-neously adsorbed onto a freshly rinsed Pt sample by immersioninto a 0.001 M Bi2O3 in 0.6 MHClO4 then placed into the EC cellat 0.3 V aer being rinsed. Similarly, the rinsed sample wasimmersed into a 0.01 M GeO2 in 1.0 M NaOH solution to adsorbGe, but the electrode was not rinsed following adsorption. Ineach case, the sample was rst cycled in 0.5 M H2SO4 below 0.9V to achieve a stable CV, then cycled up to 1.0 V for 2 cycles andnally cycled with an upper potential of 0.9 V before adsorptionof Bi or Ge. The adsorption experiments were performed intriplicate on the Pt black, cubic NPs and O/T NPs for eachadatom.
In a typical catalytic experiment, the blank CV was recordedin a potential window until a stable curve was obtained in thesupporting electrolyte. For the shape controlled NPs, it wasimportant to minimize the surface restructuring due to oxideformation, thus the potential limit was 0.9 VRHE prior to furthermeasurements. Oxidation of adsorbed gaseous CO was per-formed by holding the potential at 0.3 V while rst saturatingthe electrolyte with CO gas for 5–10 min, then purging thesolution with Ar gas for 15–25 min. Finally, a CV was recordedwithin a specic potential window to oxidize or strip the COfrom the Pt surface. CV was employed to measure the intrinsicactivity of the Pt NPs for the MOR at 0.5 M CH3OH concentra-tions in the supporting electrolytes described above. Followingthe MOR CV, the CA current was measured over a 30 min periodwith the potential held at 0.5 V in the CH3OH-containing elec-trolyte solution. Lastly, a CV was collected in pure electrolyte toensure catalyst stability.
2.5. Attenuated total reection (ATR)-surface enhancedinfrared reection adsorption spectroscopy (ATR-SEIRAS)
The ATR-SEIRAS measurements were collected on a BrukerVector-22 IR Spectrometer that was modied to house an ECapparatus.26–28 The in situ EC measurements were performed ina modied three electrode EC cell using a potentiostat (CHInstrument, Inc) that was controlled by a computer with CHIsoware. Commercial Ag/AgCl (1 M) (CH Instrument, Inc) and
21286 | RSC Adv., 2014, 4, 21284–21293
Pt gauze electrodes were used as the reference and counterelectrodes, respectively. The working electrode was comprisedof a well-polished Si prism that had a thin Au lm chemicallydeposited onto one surface.29 The NP catalysts were depositeddirectly onto the Au lm as onto the GCE described above. Thepotential difference spectra were collected during a potentialstair step experiment over the designated potential range. Thespectra are shown in the absorbance units dened as �log(I �IR)/IR, where I and IR are the spectra taken at the measured andthe reference potentials, respectively. The electrocatalysts weremonitored between the potential-step experiments via CV inorder to ensure that the system was stable.
3. Results and discussion3.1. Physical characterization
Size and shape distributions of the synthesized Pt NPs are dis-played in Fig. 1 along with representative TEM images. Theshape of the NPs suggests the existence of preferential surfaceplanes, i.e. the cubic NPs display (100) planes, whereas O/T NPsexhibit (111) planes. The average size of the cubic and O/T PtNPs were 10.9 � 1.4 nm and 11.6 � 2.0 nm, respectively, withover 70% yield of the desired shape obtained. More specically,71.2% of the NPs from the cubic sample were cubes with (100)facets, while 73.2% of the O/T sample were either octahedronsor tetrahedrons with (111) facets.
The high degree of monodispersity of the synthesized NPs inFig. 1 is attributed to the presence of PVP during the synthesis.Using thermal analysis, the weight loss due to the decomposi-tion and/or desorption of the PVP as a function of increasingtemperature provides insight into the amount of PVP present onthe NP, i.e. surface-bound and vicinal units of the polymer.Fig. 2 summarizes the TGA measurements performed on the as-synthesized and UVPO treated Pt NPs. Pure PVP desorbsbetween 400 and 450 �C in the TGA as indicated by the inset ofFig. 2B. Thus, the surfactant accounts for 7 wt% and 12 wt% onthe as-synthesized cubic and O/T Pt NPs as seen by the weightloss from 375 to 425 �C in Fig. 2A. Following the adapted liquidphase UVPO treatment, the NPs in Fig. 2B exhibit no majorweight loss in this temperature range expected for the desorp-tion of PVP, which strongly suggests that no polymer waspresent on the surfaces and were similar to as-receivedcommercial Pt black.
Despite the effectiveness of the UVPO method at removingthe surface-bound PVP, the adverse effect of UV exposure on thesurface atomic arrangement has been cautioned in the litera-ture.18,30 There were no observable changes of the size and shapeof the NPs before and aer the UVPO treatment as noted by theTEM measurements, although the particles became moreagglomerated. As mentioned shape suggests surface arrange-ment of the NPs only qualitatively and is by no means a quan-titative description for the surface atomic arrangement.30
Moreover, TEM is an ex situ method with a sample size that ismuch smaller than the number of NPs that are used for elec-trocatalysis. In order to measure the Pt surface structure morequantitatively, we adopted the irreversible adsorption/ECstripping methods developed by Feliu et al.10,12,20
This journal is © The Royal Society of Chemistry 2014

Fig. 1 Representative TEM images of the cubic Pt NPs (A) and O/T NPs (B) synthesized along with size and shape distributions based on aminimum of 150 counts. S, C, O and T denote spherical and random shapes, cubes, octahedrons and tetrahedrons, respectively.
Fig. 2 TGA curves of as-synthesized (A) and UVPO treated (B) cubic(red) and O/T (blue) Pt NPs along with the unaltered Pt black (black).The inset of B displays the TGA curve for pure PVP (purple), whichhighlights the absence of PVP weight loss at 400 to 450 �C on theUVPO treated compared to the 7 wt% and 12 wt% presence of PVP onthe as-synthesized cubic and O/T Pt NPs, respectively (A).
Paper RSC Advances
Publ
ishe
d on
01
May
201
4. D
ownl
oade
d by
Geo
rget
own
Uni
vers
ity L
ibra
ry o
n 28
/05/
2014
05:
12:0
8.
View Article Online
CV was performed on the Pt black, cubic and O/T Pt NPs in0.5 M H2SO4 to quantitatively infer the surface structure basedon the charge distribution of peaks related to hydrogen and the(bi)sulfate adsorptions on various sites. The CV proles for thesamples in Fig. 3A are normalized using single crystal hydrogen
Fig. 3 (A) CVs of the Pt black (black), cubic (red) and O/T Pt NPs (blue) (Aand O/T (C) Pt NPs with CVs after germanium (dot) and bismuth (dash)
This journal is © The Royal Society of Chemistry 2014
charge density values of 220, 208 and 240 mC cm�2 for poly-crystalline, (100) and (111) atomic arrangements of Pt, respec-tively.25 Foremost, the symmetry and clearly dened peaks oneach sample in Fig. 3A further supports the cleanliness of thesamples, especially the synthesized NPs because surfactantstend to eliminate the sharpness of the associated peaks aspreviously reported.22,24,31
Upon visual inspection of Fig. 3A, there are four principalpeaks, whose charges depend on the exposed surface struc-ture.20,24 The dominant peaks at ca. 0.09 V and ca. 0.22 V on Ptblack are associated with hydrogen redox processes on (110)-and (100)-like step sites, whereas the hump around 0.5 V isindicative of (bi)sulfate adsorption on ordered (111) terracedomains. The increase of the hump at ca. 0.5 V on the O/T PtNPs corresponds nicely to the presumed increase of (111) facetsdue to their shape. Moreover, the relative increase at the (110)-like step sites, which occur at step sites nearby (111) terracedomains, and negligible change at the (100) sites due to edgesand corners demonstrates the preferential orientation of thesurface as (111) facets. In contrast, the cubic Pt NPs show hardlyany anion adsorption current hump at �0.5 V indicating the
) in 0.5 M H2SO4. Comparison of CV profiles of pristine (solid) cubic (B)adsorption in 0.5 M H2SO4.
RSC Adv., 2014, 4, 21284–21293 | 21287
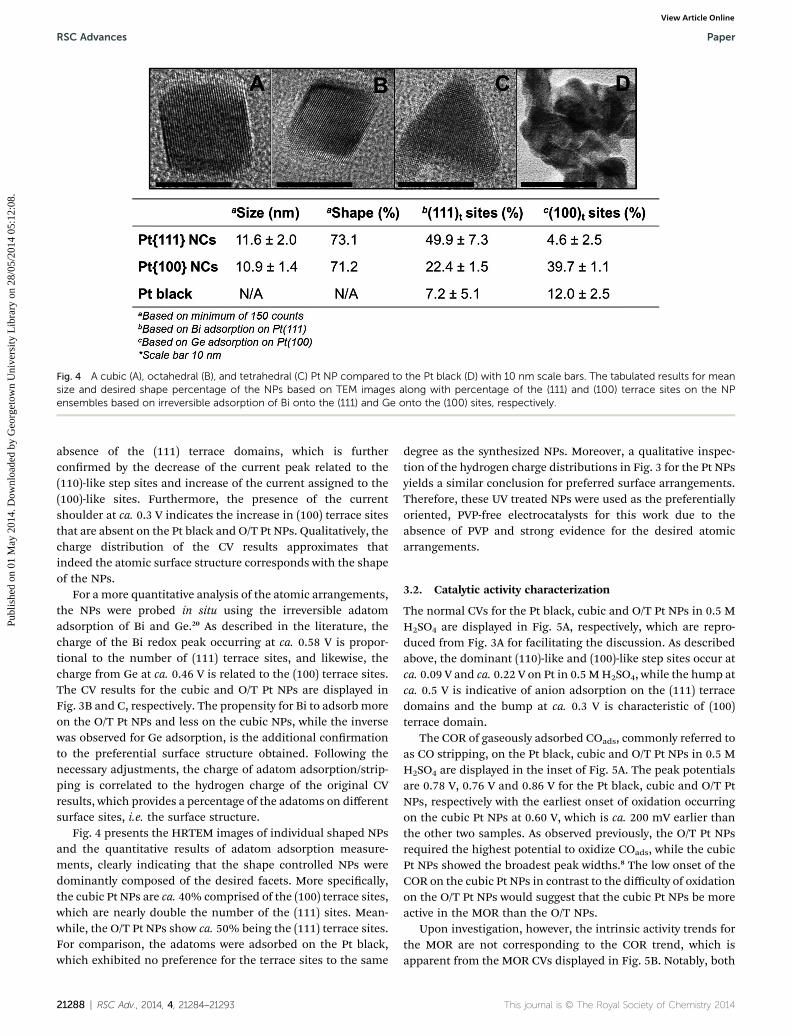
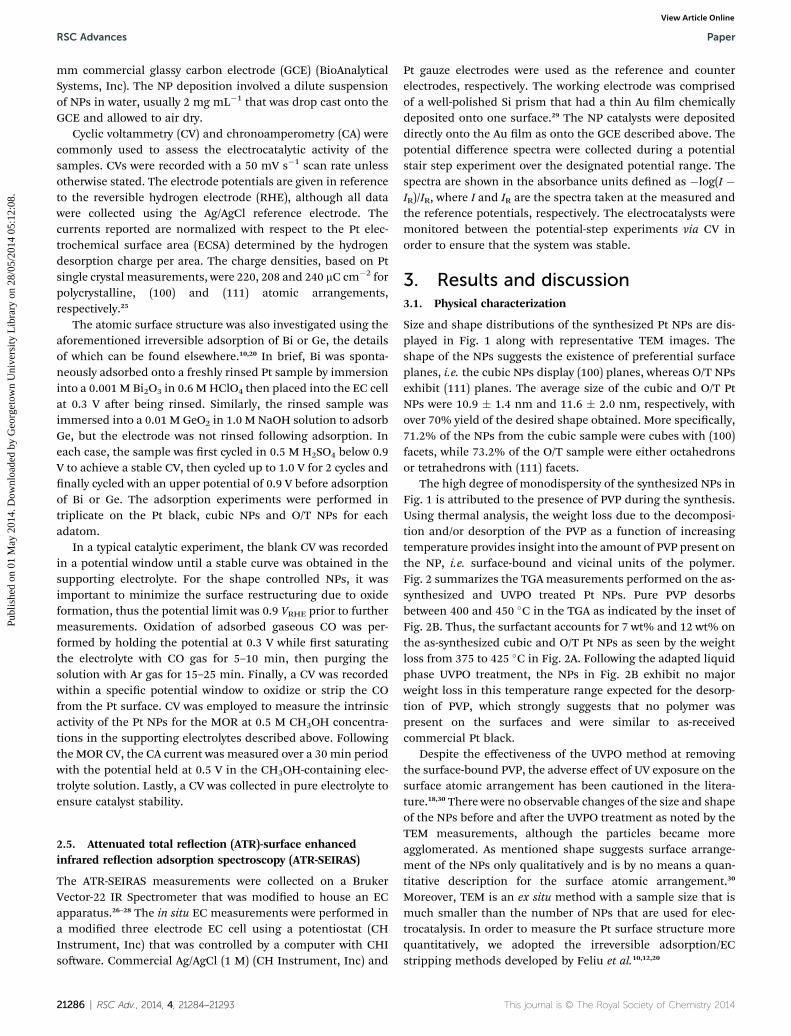
Fig. 4 A cubic (A), octahedral (B), and tetrahedral (C) Pt NP compared to the Pt black (D) with 10 nm scale bars. The tabulated results for meansize and desired shape percentage of the NPs based on TEM images along with percentage of the (111) and (100) terrace sites on the NPensembles based on irreversible adsorption of Bi onto the (111) and Ge onto the (100) sites, respectively.
RSC Advances Paper
Publ
ishe
d on
01
May
201
4. D
ownl
oade
d by
Geo
rget
own
Uni
vers
ity L
ibra
ry o
n 28
/05/
2014
05:
12:0
8.
View Article Online
absence of the (111) terrace domains, which is furtherconrmed by the decrease of the current peak related to the(110)-like step sites and increase of the current assigned to the(100)-like sites. Furthermore, the presence of the currentshoulder at ca. 0.3 V indicates the increase in (100) terrace sitesthat are absent on the Pt black and O/T Pt NPs. Qualitatively, thecharge distribution of the CV results approximates thatindeed the atomic surface structure corresponds with the shapeof the NPs.
For a more quantitative analysis of the atomic arrangements,the NPs were probed in situ using the irreversible adatomadsorption of Bi and Ge.20 As described in the literature, thecharge of the Bi redox peak occurring at ca. 0.58 V is propor-tional to the number of (111) terrace sites, and likewise, thecharge from Ge at ca. 0.46 V is related to the (100) terrace sites.The CV results for the cubic and O/T Pt NPs are displayed inFig. 3B and C, respectively. The propensity for Bi to adsorb moreon the O/T Pt NPs and less on the cubic NPs, while the inversewas observed for Ge adsorption, is the additional conrmationto the preferential surface structure obtained. Following thenecessary adjustments, the charge of adatom adsorption/strip-ping is correlated to the hydrogen charge of the original CVresults, which provides a percentage of the adatoms on differentsurface sites, i.e. the surface structure.
Fig. 4 presents the HRTEM images of individual shaped NPsand the quantitative results of adatom adsorption measure-ments, clearly indicating that the shape controlled NPs weredominantly composed of the desired facets. More specically,the cubic Pt NPs are ca. 40% comprised of the (100) terrace sites,which are nearly double the number of the (111) sites. Mean-while, the O/T Pt NPs show ca. 50% being the (111) terrace sites.For comparison, the adatoms were adsorbed on the Pt black,which exhibited no preference for the terrace sites to the same
21288 | RSC Adv., 2014, 4, 21284–21293
degree as the synthesized NPs. Moreover, a qualitative inspec-tion of the hydrogen charge distributions in Fig. 3 for the Pt NPsyields a similar conclusion for preferred surface arrangements.Therefore, these UV treated NPs were used as the preferentiallyoriented, PVP-free electrocatalysts for this work due to theabsence of PVP and strong evidence for the desired atomicarrangements.
3.2. Catalytic activity characterization
The normal CVs for the Pt black, cubic and O/T Pt NPs in 0.5 MH2SO4 are displayed in Fig. 5A, respectively, which are repro-duced from Fig. 3A for facilitating the discussion. As describedabove, the dominant (110)-like and (100)-like step sites occur atca. 0.09 V and ca. 0.22 V on Pt in 0.5 MH2SO4, while the hump atca. 0.5 V is indicative of anion adsorption on the (111) terracedomains and the bump at ca. 0.3 V is characteristic of (100)terrace domain.
The COR of gaseously adsorbed COads, commonly referred toas CO stripping, on the Pt black, cubic and O/T Pt NPs in 0.5 MH2SO4 are displayed in the inset of Fig. 5A. The peak potentialsare 0.78 V, 0.76 V and 0.86 V for the Pt black, cubic and O/T PtNPs, respectively with the earliest onset of oxidation occurringon the cubic Pt NPs at 0.60 V, which is ca. 200 mV earlier thanthe other two samples. As observed previously, the O/T Pt NPsrequired the highest potential to oxidize COads, while the cubicPt NPs showed the broadest peak widths.8 The low onset of theCOR on the cubic Pt NPs in contrast to the difficulty of oxidationon the O/T Pt NPs would suggest that the cubic Pt NPs be moreactive in the MOR than the O/T NPs.
Upon investigation, however, the intrinsic activity trends forthe MOR are not corresponding to the COR trend, which isapparent from the MOR CVs displayed in Fig. 5B. Notably, both
This journal is © The Royal Society of Chemistry 2014

Fig. 5 Normal CVs in 0.5 M H2SO4 (A) and MOR CVs in 0.5 M H2SO4 + 0.5 M CH3OH (B) of the Pt black (black), cubic (red) and O/T (blue) Pt NPs.The higher peak currents for the negative scans had to do with that the NP surface started with no CO poisoning while this was not the case forthe positive scans. Insets show the gaseous CO oxidation in 0.5 M H2SO4 (A) and the CAmeasurements over 1800 s at 0.5 V in 0.5 M H2SO4 + 0.5M CH3OH (B).
Fig. 6 Potential dependent ATR-SEIRAS spectra for gaseouslyadsorbed CO on the Pt black (A), O/T (B) and cubic (C) Pt NPs in 0.5 MH2SO4 with the reference spectra recorded at 1.2 V.
Paper RSC Advances
Publ
ishe
d on
01
May
201
4. D
ownl
oade
d by
Geo
rget
own
Uni
vers
ity L
ibra
ry o
n 28
/05/
2014
05:
12:0
8.
View Article Online
the CV and CA measurements showed that the O/T Pt NPs hadthe highest MOR activity, followed sequentially by the Pt blackand cubic Pt NPs. This is the same order as observed previouslyon the shape-controlled Pt NPs,8,10 but different from the singlecrystal surfaces.5,10,32 Notice that the higher backward potentialscan peak current is much higher than that of the forward scanfor the O/T Pt NPs. This was caused by the relatively low uppotential limit in an attempt to alter less the surface structure.Because of lower up potential limit, the oxidized Pt surfacecould be reduced at a higher potential on the backward scan,which led to a small potential window in which the Pt surfacewas largely reduced but not yet poisoned severely by the CO thushigher peak current.
Returning briey to the activity dependence of surfaceorientation on the presence or absence of PVP, we shallcompare data obtained using the Pt black as a reference (bysetting its values to 1). The activity enhancements in the orderof O/T : black : cubic Pt NPs as measured in Fig. 5B are1.5 : 1 : 0.97 in CV (using the peak currents of positive scans)and 4.5 : 1 : 0.32 in CA (using the currents measured at 1800 s,inset in Fig. 5B), respectively. These PVP-free values comparedto the corresponding values for the shape-controlled Pt NPswith residual PVP8 were 2.9 : 1 : 0.46 in CV and 12 : 1 : 0.15 inCA, respectively. Interestingly, the MOR activity of the PVP-freeO/T Pt NPs is about half of the O/T Pt NPs with residual PVP,while that of the PVP-free cubic Pt NPs is about twice of the PVP-protected cubic Pt NPs. In other words, the presence of PVPenhances the MOR activity on the O/T Pt NPs, but suppressesthe activity on the cubic Pt NPs as compared to the PVP-freecounterparts. Notice that even without residual PVP, i.e. onlybased on the morphology, the O/T Pt NPs showed �50%increase in the MOR activity as compared to the commercial Ptblack.
3.3. ATR-SEIRAS characterization
3.3.1. CO oxidation reaction. The potential differencespectra for the oxidation of gaseous COads in 0.5 MH2SO4 on thePt black, O/T and cubic Pt NPs during potential stair-step
This journal is © The Royal Society of Chemistry 2014
measurements with a 0.1 V potential step from 0 V to 1.2 V aredisplayed in Fig. 6 with 1.2 V as the reference. The spectraexhibit the characteristic linearly bound CO (COL) and bridgebound CO (COB) with frequency ranges from ca. 2000 cm�1 to2050 cm�1 and ca. 1850 cm�1 to 1900 cm�1, respectively,independent of surface structure. Note the amount of bridgebound CO, however, was much higher here on the PVP-free NPsthan that on the PVP-protected shape-controlled Pt NPs, whichis most likely a manifestation of the availability of vicinal Ptsites on the clean PVP-free surface.33 The small band centeredabout 1700 cm�1 on the O/T and cubic Pt NPs can be assigned tomulti-bound CO (COM).34 There is a strong bending watervibrational band on the Pt surfaces between 1610 cm�1 and1615 cm�1 labeled as d(HOH) that is strongest on the Pt blackand weakest on the cubic Pt NPs.
Additional conrmation of surface cleanliness is seen by thecomparable spectral features on the Pt NPs to Pt black, i.e. theabsence of polymeric bands. PVP has been shown to interactmostly through the carbonyl, >C]O, group on the surface ofPt.35 If the polymer were present, the >C]O stretch vibrationwould exhibit a prominent IR band between 1660 cm�1 and1680 cm�1 as previously reported.22 No such band was observedon the PVP-free Pt surfaces studied here.
Fig. 7 summaries the COR trends for the normalized (by therespective ECSA) integrated band intensities for the COL, COB
RSC Adv., 2014, 4, 21284–21293 | 21289
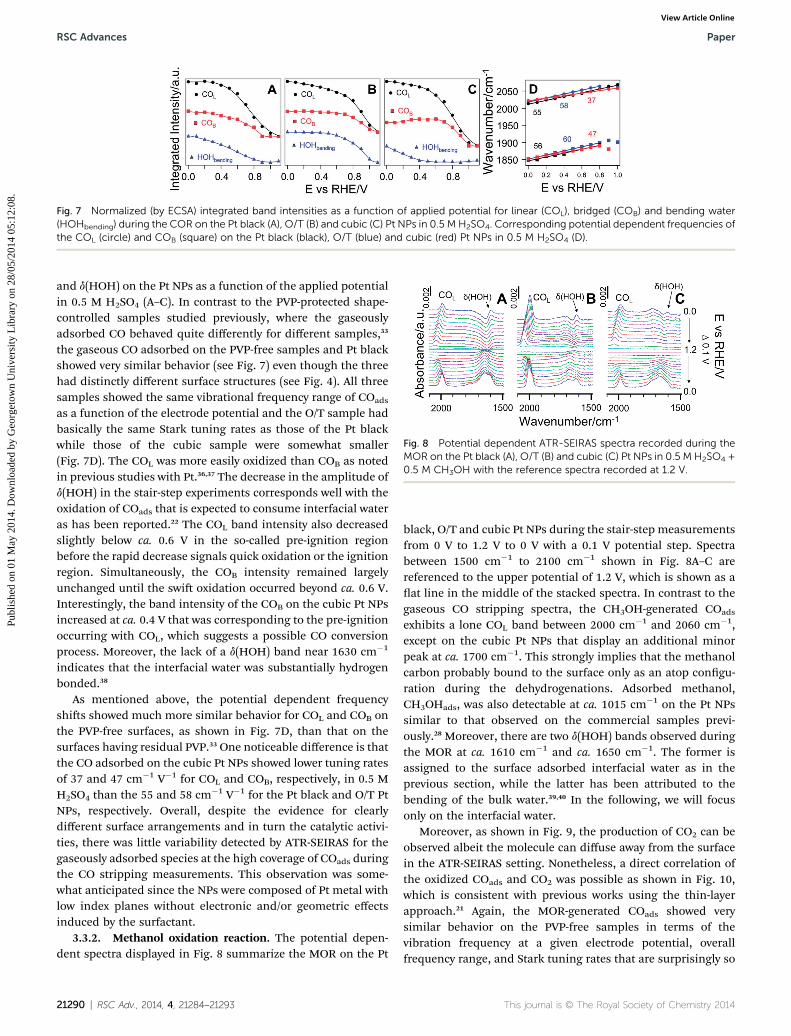
Fig. 7 Normalized (by ECSA) integrated band intensities as a function of applied potential for linear (COL), bridged (COB) and bending water(HOHbending) during the COR on the Pt black (A), O/T (B) and cubic (C) Pt NPs in 0.5 M H2SO4. Corresponding potential dependent frequencies ofthe COL (circle) and COB (square) on the Pt black (black), O/T (blue) and cubic (red) Pt NPs in 0.5 M H2SO4 (D).
Fig. 8 Potential dependent ATR-SEIRAS spectra recorded during theMOR on the Pt black (A), O/T (B) and cubic (C) Pt NPs in 0.5 M H2SO4 +0.5 M CH3OH with the reference spectra recorded at 1.2 V.
RSC Advances Paper
Publ
ishe
d on
01
May
201
4. D
ownl
oade
d by
Geo
rget
own
Uni
vers
ity L
ibra
ry o
n 28
/05/
2014
05:
12:0
8.
View Article Online
and d(HOH) on the Pt NPs as a function of the applied potentialin 0.5 M H2SO4 (A–C). In contrast to the PVP-protected shape-controlled samples studied previously, where the gaseouslyadsorbed CO behaved quite differently for different samples,33
the gaseous CO adsorbed on the PVP-free samples and Pt blackshowed very similar behavior (see Fig. 7) even though the threehad distinctly different surface structures (see Fig. 4). All threesamples showed the same vibrational frequency range of COads
as a function of the electrode potential and the O/T sample hadbasically the same Stark tuning rates as those of the Pt blackwhile those of the cubic sample were somewhat smaller(Fig. 7D). The COL was more easily oxidized than COB as notedin previous studies with Pt.36,37 The decrease in the amplitude ofd(HOH) in the stair-step experiments corresponds well with theoxidation of COads that is expected to consume interfacial wateras has been reported.22 The COL band intensity also decreasedslightly below ca. 0.6 V in the so-called pre-ignition regionbefore the rapid decrease signals quick oxidation or the ignitionregion. Simultaneously, the COB intensity remained largelyunchanged until the swi oxidation occurred beyond ca. 0.6 V.Interestingly, the band intensity of the COB on the cubic Pt NPsincreased at ca. 0.4 V that was corresponding to the pre-ignitionoccurring with COL, which suggests a possible CO conversionprocess. Moreover, the lack of a d(HOH) band near 1630 cm�1
indicates that the interfacial water was substantially hydrogenbonded.38
As mentioned above, the potential dependent frequencyshis showed much more similar behavior for COL and COB onthe PVP-free surfaces, as shown in Fig. 7D, than that on thesurfaces having residual PVP.33 One noticeable difference is thatthe CO adsorbed on the cubic Pt NPs showed lower tuning ratesof 37 and 47 cm�1 V�1 for COL and COB, respectively, in 0.5 MH2SO4 than the 55 and 58 cm�1 V�1 for the Pt black and O/T PtNPs, respectively. Overall, despite the evidence for clearlydifferent surface arrangements and in turn the catalytic activi-ties, there was little variability detected by ATR-SEIRAS for thegaseously adsorbed species at the high coverage of COads duringthe CO stripping measurements. This observation was some-what anticipated since the NPs were composed of Pt metal withlow index planes without electronic and/or geometric effectsinduced by the surfactant.
3.3.2. Methanol oxidation reaction. The potential depen-dent spectra displayed in Fig. 8 summarize the MOR on the Pt
21290 | RSC Adv., 2014, 4, 21284–21293
black, O/T and cubic Pt NPs during the stair-step measurementsfrom 0 V to 1.2 V to 0 V with a 0.1 V potential step. Spectrabetween 1500 cm�1 to 2100 cm�1 shown in Fig. 8A–C arereferenced to the upper potential of 1.2 V, which is shown as aat line in the middle of the stacked spectra. In contrast to thegaseous CO stripping spectra, the CH3OH-generated COads
exhibits a lone COL band between 2000 cm�1 and 2060 cm�1,except on the cubic Pt NPs that display an additional minorpeak at ca. 1700 cm�1. This strongly implies that the methanolcarbon probably bound to the surface only as an atop congu-ration during the dehydrogenations. Adsorbed methanol,CH3OHads, was also detectable at ca. 1015 cm�1 on the Pt NPssimilar to that observed on the commercial samples previ-ously.28 Moreover, there are two d(HOH) bands observed duringthe MOR at ca. 1610 cm�1 and ca. 1650 cm�1. The former isassigned to the surface adsorbed interfacial water as in theprevious section, while the latter has been attributed to thebending of the bulk water.39,40 In the following, we will focusonly on the interfacial water.
Moreover, as shown in Fig. 9, the production of CO2 can beobserved albeit the molecule can diffuse away from the surfacein the ATR-SEIRAS setting. Nonetheless, a direct correlation ofthe oxidized COads and CO2 was possible as shown in Fig. 10,which is consistent with previous works using the thin-layerapproach.21 Again, the MOR-generated COads showed verysimilar behavior on the PVP-free samples in terms of thevibration frequency at a given electrode potential, overallfrequency range, and Stark tuning rates that are surprisingly so
This journal is © The Royal Society of Chemistry 2014

Fig. 9 Potential dependent ATR-SEIRAS spectra of CO2 producedduring the MOR on the Pt black (A), O/T (B) and cubic (C) Pt NPs in 0.5MH2SO4 + 0.5 M CH3OHwith the reference spectra recorded at 0.0 V.
Paper RSC Advances
Publ
ishe
d on
01
May
201
4. D
ownl
oade
d by
Geo
rget
own
Uni
vers
ity L
ibra
ry o
n 28
/05/
2014
05:
12:0
8.
View Article Online
close to those for the gaseous COads (Fig. 7D). Again, this is incontrast to PVP-protected,33 where different vibrationalfrequencies at a given electrode potential were observed for thethree samples and different corresponding Stark tuning rateswere noted.33 Since the Stark tuning rates for the anodic (Ano)and cathodic (Cath) directions are almost the same, this indi-cates that the COads was generated in the same way independentof the direction of electrode potential scan during the MOR.Moreover, since they are also very close to those of gaseouslyadsorbed CO (Fig. 7D) also implies that the MOR-generatedCOads formed closely packed islands. This suggests that thelinearity of the Stark tuning was maintained beyond the peak
Fig. 10 Normalized peak intensities as a function of applied potential foCO2 (red squares) during the MOR on the Pt black (A), O/T (B) and cufrequencies of the anodic COL (solid-circle) and cathodic COL (open-circH2SO4 (D).
Fig. 11 Potential dependent ATR–SEIRAS spectra of the water stretching(100) NCs (C) in 0.5 M H2SO4 + 0.5 M CH3OH with the reference spectrapotential at the respective frequencies indicated by the dashed arrows f
This journal is © The Royal Society of Chemistry 2014
potentials of CO2 production meaning that the COR took placemainly at the peripheries of the COads islands as it implies thatthe local coverage of the remaining COads was maintained.
Alternatively, the peak potential for the CO2 production forthe O/T Pt NPs was about 50 mV and 90 mV less positive thanthose for the Pt black and cubic Pt NPs respectively (red squaresand the vertical dashed lines in Fig. 10A to C), which is inagreement with the EC observation of the enhanced MOR onthe former (Fig. 5B). The in situ SEIRAS data, however, do notprovide a clearly distinguishable evidence as to what is the exactmechanism for the MOR enhancement observed on the PVP-free O/T Pt NPs. One plausible indication may be gleaned by therate of decrease of the interfacial water during the MOR byfollowing the band at 1610 cm�1 as presented in Fig. 10A to C(blue triangles). The O/T Pt NPs showed the fastest decrease asthe electrode potential scanned positively, followed in therespective order by Pt black and cubic Pt NPs, suggesting thatthe interfacial water may play a differentiating role here.
It was observed previously27 that among the three possibletypes of interracial water, i.e. the strongly hydrogen-bound(�3200 cm�1), weakly hydrogen-bound (�3400 cm�1), and non-hydrogen-bound water (�3600 cm�1), the weakly hydrogen-bound water was identied as the active water species thatparticipates the MOR as the oxygen-containing species. Fig. 11presents the water stretching vibrational bands for the Pt black(A), O/T (B), and cubic Pt NPs observed during the MOR stair-
r linear CO (black circles), interfacial bending water (blue triangles) andbic (C) Pt NPs in 0.5 M H2SO4. Corresponding potential dependent
le) on the Pt black (black), O/T (blue) and cubic (red) Pt NPs (red) in 0.5 M
vibrations (n(OH)) during the MOR on Pt black (A), Pt (111) NCs (B) and Ptrecorded at 0.0 V. (D) The SEIRAIS amplitude as a function of electrodeor Pt black (circles), O/T (diamonds), and cubic (cubes) Pt NPs.
RSC Adv., 2014, 4, 21284–21293 | 21291

RSC Advances Paper
Publ
ishe
d on
01
May
201
4. D
ownl
oade
d by
Geo
rget
own
Uni
vers
ity L
ibra
ry o
n 28
/05/
2014
05:
12:0
8.
View Article Online
step measurements as those in Fig. 8 and 9. For the O/T and Ptblack samples, there was indeed a well-dened, negative goingpeak at �3435 cm�1 (indicated by the corresponding dashedarrows in Fig. 11A and B) during the rst positive potential scan.By the end of the negative potential scan, this peak eventuallybecame a positive-going peak for the Pt black, but a less well-dened shoulder for the O/T Pt NPs. For lack of a such well-dened peak for the cubic sample during the positive potentialscan, the spectral shoulder at 3388 cm�1 in the IR spectrumrecorded at the end of the negative potential scan, as indicatedby the dashed arrow in Fig. 11C, was used to dene and gaugethe behavior of the weakly hydrogen-bound water in thissample.
When the respective SEIRAS amplitudes at these frequenciesas a measure of the weakly hydrogen-bounded water are plottedas a function of the electrode potential during the stair-stepmeasurements, as presented in Fig. 11D, it becomes clear thatthe O/T sample behaved distinguishably different from the Ptblack and cubic samples. The much larger variation in the IRamplitude of the weakly hydrogen-bound water observed on theformer sample during the positive potential scan can be takenas an evidence of having more such type of interfacial wateravailable on the sample surface for the MOR thus leading tohigher activity. Although, the continuous increase in IR ampli-tude during the subsequent negative potential scan is not wellunderstood at this moment. Using the variation in IR amplitudeduring the positive potential scan as a measure for the MORactivity, one would expect that the cubic sample have the leastactivity and the Pt black sit in the middle, which is exactly whatwas observed electrochemically (Fig. 5B).
4. Conclusions
In summary, the purpose of this investigation was to distin-guish the PVP effect from the nanoscale surface orientationeffect of the shape-controlled Pt NPs on the MOR activity. Thiswas made possible by our optimizing a UV-based treatment ofthe as-synthesized Pt NPs that can completely eliminate thestrongly surface-bound PVP and produce PVP-free shape-controlled Pt NPs. It was observed that the O/T Pt NPs couldenhance MOR by �50% as compared to the commercial Ptblack while the cubic Pt NPs had slightly lower MOR activitythan the latter. By comparing to the MOR activity data availableon the similar shape-controlled Pt NPs, but in the presence ofPVP, it was concluded that the surface-bound residual PVPfurther enhances the MOR activity on the O/T Pt NPs, butsuppresses it on the cubic particles. The in situ SEIRAS study ofthe MOR on the PVP-free shape-controlled Pt NPs stronglysuggests that the observed enhancement in MOR was probablyrelated to more weakly hydrogen-bound water available on thesurface of the O/T sample than on the other two samples. Whilethis is in agreement with previous observation27 that has iden-tied the weakly hydrogen-bound interfacial water as the activeoxygen-containing species for the MOR, it is mechanisticallydifferent from the PVP effect that has more to do with enablinga different (i.e. direct) reaction pathway.21,33 Further mecha-nistic investigation into the reason for PVP displays selective
21292 | RSC Adv., 2014, 4, 21284–21293
MOR enhancement on the O/T, but suppresses activity on thecubic Pt NPs is warranted and being pursued in our laboratory.
Acknowledgements
This research has been supported by the NSF (CHE-0923910)and the DOE (DE-FG02-07ER15895). A.M.L. received supportfrom the NSF (OISE-1130454) and was a Washington MetroScholar (2012-2013) by the ARCS Foundation and C.L.R. wassupported by a GUROP 2013 summer research grant. TEMimages were taken at the NISP Lab at UMD at College Park, MD.
References
1 J. L. Cohen, D. J. Volpe and H. D. Abruna, Phys. Chem. Chem.Phys., 2007, 9, 49–77.
2 T. H. M. Housmans, A. H. Wonders and M. T. M. Koper,J. Phys. Chem. B, 2006, 110, 10021–10031.
3 M. Neurock, M. Janik and A. Wieckowski, Faraday Discuss.,2009, 140, 363–378.
4 E. Herrero, K. Franaszczuk and A. Wieckowski, J. Phys.Chem., 1994, 98, 5074–5083.
5 N. M. Markovic and P. N. Ross Jr, Surf. Sci. Rep., 2002, 45,117–229.
6 J. Solla-Gullon, F. J. Vidal-Iglesias and J. M. Feliu, Annu. Rep.Prog. Chem., Sect. C: Phys. Chem., 2011, 107, 263–297.
7 Y.-W. Lee, S.-B. Han, D.-Y. Kim and K.-W. Park, Chem.Commun., 2011, 47, 6296–6298.
8 C. Susut, G. B. Chapman, G. Samjeske, M. Osawa andY. Y. J. Tong, Phys. Chem. Chem. Phys., 2008, 10, 3712–3721.
9 N. Tian, Z.-Y. Zhou, S.-G. Sun, Y. Ding and Z. L. Wang,Science, 2007, 316, 732–735.
10 J. Solla-Gullon, F. J. Vidal-Iglesias, A. Lopez-Cudero,E. Garnier, J. M. Feliu and A. Aldaz, Phys. Chem. Chem.Phys., 2008, 10, 3689–3698.
11 T. S. Ahmadi, Z. L. Wang, T. C. Green, A. Henglein andM. A. El-Sayed, Science, 1996, 272, 1924–1925.
12 F. J. Vidal-Iglesias, R. M. Aran-Ais, J. Solla-Gullon, E. Herreroand J. M. Feliu, ACS Catal., 2012, 2, 901–910.
13 Z.-Y. Zhou, N. Tian, J.-T. Li, I. Broadwell and S.-G. Sun, Chem.Soc. Rev., 2011, 40, 4167–4185.
14 G. Fu, K. Wu, X. Jiang, L. Tao, Y. Chen, J. Lin, Y. Zhou, S. Wei,Y. Tang, T. Lu and X. Xia, Phys. Chem. Chem. Phys., 2013, 15,3793–3802.
15 A. X. Yin, X. Q. Min, Y. W. Zhang and C. H. Yan, J. Am. Chem.Soc., 2011, 133, 3816–3819.
16 Z. Peng, C. Kisielowski and A. T. Bell, Chem. Commun., 2012,48, 1854–1856.
17 B. N. Johnson and R. Mutharasan, J. Phys. Chem. C, 2013,117, 1335–1341.
18 J. Monzo, M. T. M. Koper and P. Rodriguez, ChemPhysChem,2012, 13, 709–715.
19 M. Crespo-Quesada, J.-M. Andanson, A. Yarulin, B. Lim,Y. Xia and L. Kiwi-Minsker, Langmuir, 2011, 27, 7909–7916.
20 P. Rodriguez, E. Herrero, J. Solla-Gullon, F. J. Vidal-Iglesias,A. Aldaz and J. M. Feliu, Electrochim. Acta, 2005, 50, 4308–4317.
This journal is © The Royal Society of Chemistry 2014
Paper RSC Advances
Publ
ishe
d on
01
May
201
4. D
ownl
oade
d by
Geo
rget
own
Uni
vers
ity L
ibra
ry o
n 28
/05/
2014
05:
12:0
8.
View Article Online
21 C. Susut, D.-J. Chen, S.-G. Sun and Y. J. Tong, Phys. Chem.Chem. Phys., 2011, 13, 7467–7474.
22 A. M. Hofstead-Duffy, D.-J. Chen and Y. J. Tong, Electrochim.Acta, 2012, 82, 543–549.
23 H. Song, F. Kim, S. Connor, G. A. Somorjai and P. Yang,J. Phys. Chem. B, 2004, 109, 188–193.
24 C. Susut, T. D. Nguyen, G. B. Chapman and Y. Tong,Electrochim. Acta, 2008, 53, 6135–6142.
25 B. E. Conway and G. Jerkiewicz, J. Electroanal. Chem., 1992,339, 123–146.
26 M. Osawa, Bull. Chem. Soc. Jpn., 1997, 70, 2861–2880.27 D. J. Chen, A. M. Hofstead-Duffy, I. S. Park, D. O. Atienza,
C. Susut, S. G. Sun and Y. Y. J. Tong, J. Phys. Chem. C,2011, 115, 8735–8743.
28 A. M. Hofstead-Duffy, D.-J. Chen, S.-G. Sun and Y. Y. J. Tong,J. Mater. Chem., 2012, 22, 5205–5208.
29 H. Miyake, S. Ye and M. Osawa, Electrochem. Commun., 2002,4, 973–977.
30 F. J. Vidal-Iglesias, J. Solla-Gullon, E. Herrero, V. Montiel,A. Aldaz and J. M. Feliu, Electrochem. Commun., 2011, 13,502–505.
This journal is © The Royal Society of Chemistry 2014
31 D. S. Gatewood, T. L. Schull, O. Baturina, J. J. Pietron,Y. Garsany, K. E. Swider-Lyons and D. E. Ramaker, J. Phys.Chem. C, 2008, 112, 4961–4970.
32 X. H. Xia, T. Iwasita, F. Ge andW. Vielstich, Electrochim. Acta,1996, 41, 711–718.
33 A. M. Levendorf, S.-G. Sun and Y. Y. J. Yong, Electrocatalysis,2014, DOI: 10.1007/s12678-014-0186-1.
34 H. Miyake, T. Okada, G. Samjeske and M. Osawa, Phys.Chem. Chem. Phys., 2008, 10, 3662–3669.
35 Y. Borodko, S. E. Habas, M. Koebel, P. Yang, H. Frei andG. A. Somorjai, J. Phys. Chem. B, 2006, 110, 23052–23059.
36 G. Samjeske, K.-i. Komatsu and M. Osawa, J. Phys. Chem. C,2009, 113, 10222–10228.
37 Y.-G. Yan, Y.-Y. Yang, B. Peng, S. Malkhandi, A. Bund,U. Stimming and W.-B. Cai, J. Phys. Chem. C, 2011, 115,16378–16388.
38 M. Osawa, M. Tsushima, H. Mogami, G. Samjeske andA. Yamakata, J. Phys. Chem. C, 2008, 112, 4248–4256.
39 K.-I. Ataka and M. Osawa, Langmuir, 1998, 14, 951–959.40 Y.-G. Yan, Q.-X. Li, S.-J. Huo, M. Ma, W.-B. Cai andM. Osawa,
J. Phys. Chem. B, 2005, 109, 7900–7906.
RSC Adv., 2014, 4, 21284–21293 | 21293
Copyright © 2022 FDOKUMEN


![The influence of organic agents on the resultant crystal structure in the reactions of the [Re 4Te 4(CN) 12] 4− tetrahedral cluster anion with Nd 3+ cations](https://static.fdokumen.com/doc/165x107/63459427df19c083b108211a/the-influence-of-organic-agents-on-the-resultant-crystal-structure-in-the-reactions.jpg)