Enumeration of periodic tetrahedral frameworks. II. Polynodal graphs
34
Enumeration of periodic tetrahedral frameworks. II. Polynodal graphs. M. M. J. Treacy Arizona State University Department of Physics and Astronomy P.O. Box 871504 Tempe, AZ 85287, USA I. Rivin Temple University Department of Mathematics 1805 North Broad Street Philadelphia, PA 19122, USA E. Balkovsky Rutgers University Department of Physics and BioMaPS Institute 136 Frelinghuysen Rd Piscataway, NJ 08854, USA K. H. Randall Google, Inc. 2400 Bayshore Parkway Mountain View, CA 94043, USA 1
Transcript of Enumeration of periodic tetrahedral frameworks. II. Polynodal graphs
Enumeration of periodic tetrahedral frameworks.
II. Polynodal graphs.
M. M. J. Treacy
Arizona State University
Department of Physics and Astronomy
P.O. Box 871504
Tempe, AZ 85287, USA
I. Rivin
Temple University
Department of Mathematics
1805 North Broad Street
Philadelphia, PA 19122, USA
E. Balkovsky
Rutgers University
Department of Physics and BioMaPS Institute
136 Frelinghuysen Rd
Piscataway, NJ 08854, USA
K. H. Randall
Google, Inc.
2400 Bayshore Parkway
Mountain View, CA 94043, USA
1
Abstract
In a previous study, we developed a database of periodic 4-connected graphs (M. M. J. Treacy,
K. H. Randall and S. Rao, Zeit. Kristallogr., 212, 768–791, (1997)). The database was built using
a symmetry constrained intersite bonding search (SCIBS) method. This method enumerates all
possible 4-connected nets within each space group type given the number of unique tetrahedral
vertices, nT. Approximately 107 graphs were obtained, mostly for nT = 1, 2. nT = 4 was achieved
for some space groups that were rich in mirror symmetry. There was a combinatorial explosion
of graphs with increasing nT in some space groups, which ultimately limited the method. The
uninodal graphs, nT = 1, were refined by simulated annealing. A simple cost function was used
that favoured a regular tetrahedral arrangement of neighbouring silicon atoms to emulate zeolite
frameworks. Many plausible hypothetical uninodal zeolitic frameworks were reported.
Since that report, we have improved the efficiency of the combinatorial search, and extended
the range of our graph database to nT = 7 for some high mirror symmetry space groups. We
have also implemented a more sophisticated Monte Carlo strategy for imbedding graphs in real
space as an SiO2 composition. Plausible refinements are then further optimized using the GULP
program. Presently, there are almost 1010 graphs in our database, and the number of plausible
regular tetrahedral SiO2 frameworks identified now exceeds 10,000.
2
1. Introduction
There has been significant progress in recent years in the development of efficient com-
puter methods for discovering new hypothetical zeolite frameworks [1–13]. Several databases
now exist that exhaustively list the uninodal 4-connected frameworks, which are those that
contain one crystallographically unique tetrahedral atom [2, 3, 8, 9]. However, comprehen-
sive enumeration of more complicated polynodal frameworks remains a challenging problem.
There are two main motivations behind such enumerative efforts. First, a database of
hypothetical frameworks, complete with their structural attributes, can help identify inter-
esting synthetic targets. Secondly, such a database will greatly assist the structure deter-
mination of new materials by providing a reference set of unit cell dimensions, framework
densities and diffraction patterns. A third motivation relates to the intrinsic mathemati-
cal and visual beauty of these framework materials. The complexity of framework materials
presents an ongoing challenge to topologists, crystallographers and structural chemists alike.
A number of framework databases now exist, typically containing fewer than about 1,000
frameworks. The Atlas of Zeolite Framework Types [14], produced under the auspices of the
Structure Commission of the International Zeolite Association, is perhaps the best-known
database. It lists and describes in detail most of the known microporous frameworks that
have been synthesized to date, and is available online. Presently, there are 145 recognized
Framework Types that are thermally stable and are sufficiently microporous to allow water
to enter and leave. This number is presently growing at the rate of about 6 new frameworks
per year. However, this database includes only the known, thermally stable, tetrahedrally
connected microporous frameworks. Dense nets, such as quartz and cristobalite are not
microporous and are not considered to be zeolites, despite possessing regular tetrahedral
frameworks.
Most of the early progress in the discovery of hypothetical frameworks was based mainly
on intuitive model building. Wells [15, 16] described a prodigious number of frameworks.
Because they were discovered by hand, rather than by systematic algorithm, there are many
omissions from the families of structures he describes. By examining ways in which sodalite
3

cages could interconnect, Breck [17], in his book, predicted the existence of the enigmatic
“Breck Structure 6”. This recurrently twinned polytype of the FAU framework was an
eagerly sought synthetic target for over 2 decades, until Delprato et al [18] found a creative
synthetic route to produce the material EMC-2. This is now known as the EMT framework
type.
Smith [19] has described a prolific number of frameworks that were discovered mostly
by hand using systematic methods. Such methods include permutation of up-down linkages
between identifiable 2-dimensional layers in zeolites, as well as permutations of linkages
between identifiable polyhedra.
Significant progress has been made recently by methods that cross-link polyhedra and
secondary building units. Delgado-Friedrichs and coworkers [12, 20] have built a database of
graphs corresponding to space-filling tilings of polyhedra. Many of these graphs have been
refined to produce low energy structures [9]. Mellot-Draznieks and coworkers [21–23] have
built novel frameworks by automated assembly of secondary building units. Zwijnenburg
and coworkers [11] examine the energetics of polyhedral silicate units to predict relative
stability of large pore zeolite structures.
Akporiaye and Price [24], and Shannon [25], describe an extension of the layer building
method by allowing topological operators to connect sheets. Most of the known zeolite
frameworks could be generated by this method. O’Keeffe and Brese [2] generated a listing
of uninodal zeolite topologies (frameworks containing one crystallographically distinct tetra-
hedral atom, or T-atom) by systematically moving the T-atom within the crystallographic
fundamental region, and looking for configurations corresponding to regular 4-connected
nets. This dense-grid method is computationally prohibitive for frameworks containing
more than one crystallographically unique T-atom. Koch and Fisher [26] described a com-
binatorial method for identifying uninodal 3-connected sphere packings by permuting all
possible symmetry operators in the presence of an atom and searching for 3-dimensionally
connected, 3-connected, periodic frameworks. Clearly, their methods could be extended to
higher coordination numbers.
4
In an earlier prototypical version of the present study [8], we first described how frame-
works can be systematically enumerated by permuting over all possible topological connec-
tions within the crystallographic fundamental region and identifying the purely 4-connected
graphs [6]. The graphs were then imbedded in real space by distance least squares methods.
The original method was applied to the problem of space group P6/mmm (No. 191) for two
unique T-atoms. The presence of strong mirror symmetry limits the number of possibilities,
and, in principle, made this particular problem manageable “by hand”. In that study, 2
out of 48 legitimate frameworks were overlooked, highlighting the difficulties of tackling this
problem manually. The method was later generalized for all space groups and the search
implemented on a computer. Klein [3] presented a similar method for enumerating the
uninodal frameworks. In the study by Treacy et al [8], it was found that for more than one
unique T-atom, there is a combinatorial explosion of graphs.
Since that earlier report [8] significant progress has been made. The combinatorial
search has been made more efficient, allowing a complete listing of graphs up to nT = 7
for some high-symmetry space groups that are rich in mirror symmetry. nT = 4 is the
practical limit for most other space groups. An improved simulated annealing method for
imbedding graphs in space has been implemented, that can anneal bridging oxygen atoms
as well as multiple Si atoms and the unit cell dimensions. In this report, we outline some
of the methods used and highlight some of the interesting frameworks discovered.
2. Graph Generation
The details of our graph generation method were published elsewhere [8]. However, for
completeness, we present a summary of the procedure.
The problem of graph generation depends on two input variables; the space group type,
and the number of unique vertices which in this instance are 4-connected tetrahedral atoms,
or T-atoms. For each space group, all possible connections between basis atoms in the
fundamental region, and their images in neighbouring symmetry-generated copies of the
fundamental region, are identified.
5

The surfaces, edges and vertices of each fundamental region generally correspond to spe-
cial sites, which are the invariant subspaces of the general atom position within the volume
of the fundamental region. These are known in the International tables for Crystallography
as the Wyckoff sites [27]. A set of intersite connection tables are built for each space group.
These list the number of bonds that are committed when a vertex on a special site makes
a connection to a vertex on a second site. A distinction must be made between homobonds
(connections between images of the same atoms) and heterobonds (connections between
images of dissimilar atoms).
The nT atoms are systematically distributed over the Wyckoff sites of the fundamental
region. Then all combinations of bonds between atoms on their various sites are explored,
carefully accounting for all symmetry-related bonds using the intersite connection tables.
This is the symmetry constrained intersite bonding search (SCIBS). In our implementation
of the SCIBS algorithm, we restricted the search to those images of the fundamental region
that are physically in contact with the basis fundamental region (i.e. the neighbouring
images of the fundamental region). Some space groups permit bonding between non-adjacent
fundamental regions, and those graphs are missed by our algorithm for that particular space
group. However, we conjecture that the missing graphs are captured in lower-symmetry
space groups. This conjecture is supported by empirical evidence. Some space groups do
not have a uniquely defined fundamental region, and it was found that viable graphs can
be overlooked. The missing graphs can be recaptured by exploring all topologically distinct
alternative settings of the fundamental region.
Graphs are generated as labelled lists of connections of the type, ip On jq. i and j are
the atom labels (1 ≤ i, j ≤ nT). p and q are site labels, and On is a label for the symmetry
operator that generates the neighbouring fundamental region in which the bonded atom
resides. In this study, those graphs that have exactly four connections to each atom are
retained. In principle, other connectivities, such as mixed tetrahedral/octahedral could be
kept. Degenerate labelling combinations are avoided by permuting the labelling to see if
it can be remapped onto an earlier instance of the graph. However, degeneracies due to
6
special combinations of symmetry operators are not detected at this combinatorial stage.
Such degeneracies can be detected by computing topological properties of the graph, such
as the coordination sequences and vertex symbols of each graph. However, in this study,
such apparently topologically degenerate graphs were retained because it was found that
they did not always correspond to the same structure when refined under the rules of the
space group. Further, graphs with the same vertex symbol and coordination sequences are
not necessarily identical graphs. The SYSTRE program of Delgado-Friedrichs can establish
topological uniqueness [28], but this was not used in the present study.
Not all graphs are three-dimensionally connected. Sheet, tubular and ball assemblies
frequently occur. These are easily identified and listed separately. Interthreaded graphs are
also easily identified.
Frequently, the same graph is found under more than one space group. These degeneracies
were retained since they do not always refine to the same framework energy under the rules
of each space group.
For this study, the combinatorial search algorithm was optimized, greatly accelerating its
performance. Results up to nT = 7 for space group Pm3m (No. 225) and nT = 6 for space
group P6/mmm (No. 191) have now been obtained. In our earlier report, [8] the limit was
nT = 4 for these space groups. For many of the lower symmetry space groups, however,
results are still limited to nT ≤ 4 due to the combinatorial explosion of graphs that exist.
Each successful refinement is saved as a CIF file [29], and given a numeric label that
incorporates the space group number, the number of unique T-atoms, and the graph
number. Thus, 191 2 14.cif corresponds to result number 14 in space group P6/mmm (No.
191), for two unique T-atoms. This particular instance is the LTL framework.
3. Graph Refinement
In the earlier study, the uninodal graphs were refined by simulated annealing using a
cost function that favoured a regular tetrahedral arrangement of T-atoms. This method
satisfactorily obtained unit cell dimensions and T-atom coordinates for the regular uninodal
7
4-connected frameworks. The 48 binodal graphs found for the specific case of space group
P6/mmm (No. 191) for nT = 2 were refined by hand using the DLS76 distance-least-squares
computer program [30]. For the present study, the simulated annealing method has been
extended to handle multiple T-atoms (as silicon atoms) as well as the bridging oxygen atoms.
The refinement procedure has multiple stages. First the coordination sequence and vertex
symbol for the graph are examined. If the topological density TD10, as measured by the sum
of the vertices out to the tenth coordination shell, exceeds that of quartz (TD10 = 1230),
then the graph is rejected as being an unlikely candidate for an open framework structure.
Graphs corresponding to simple polyhedral tilings can be identified by examining the vertex
symbols. It was noticed that there is a rough correlation between framework energy and the
number of rings included in the vertex symbol. Simple polyhedral tilings tend to have the
fewest rings in the vertex symbols.
The first stage of the refinement is to place each atom at the geometric center of its
bonded neighbours, while maintaining the local site symmetry [28]. Next, the unit cell
dimensions alone are annealed. It was found that for the low-energy uninodal graphs, this
step produces excellent starting positions that are frequently close to optimal for the atom
locations. However, for polynodal graphs this procedure appeared to offer no discernible
advantage over the alternative method of simply placing atoms at the geometric center of
its site. However, because of its elegant simplicity, we default to the first method. In some
instances, there is no unique solution for the first method, in which case we revert to the
second method for generating starting positions.
Once a starting configuration has been chosen, the T-atom framework positions and unit
cell dimensions are annealed together. The bridging oxygen atoms are implicitly held at the
mid points of each T–T bond. This step can reduce the degrees of freedom by up to a factor
of three.
If a satisfactorily low energy is obtained in the T-atom only anneal, the structure is re-
annealed with the oxygen atoms included. For this step we used a modified version of the
cost function devised by Boisen, Gibbs and Bukowinski (mBGB) that was optimized for the
8
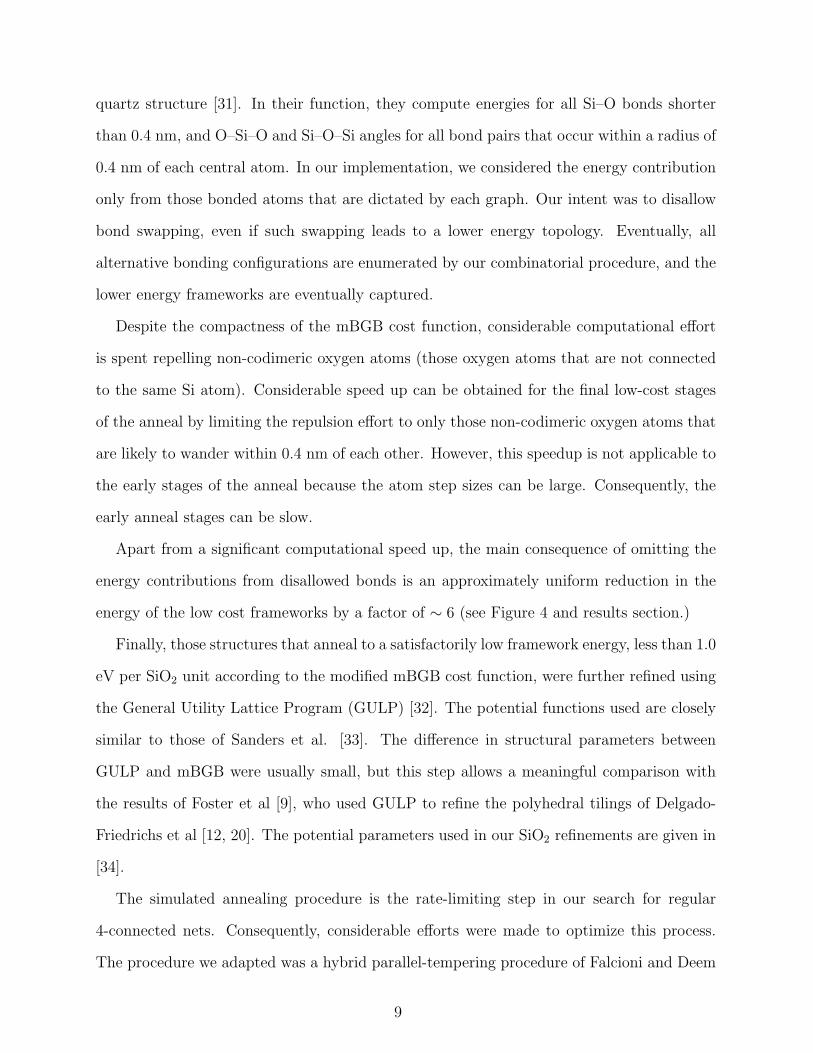
quartz structure [31]. In their function, they compute energies for all Si–O bonds shorter
than 0.4 nm, and O–Si–O and Si–O–Si angles for all bond pairs that occur within a radius of
0.4 nm of each central atom. In our implementation, we considered the energy contribution
only from those bonded atoms that are dictated by each graph. Our intent was to disallow
bond swapping, even if such swapping leads to a lower energy topology. Eventually, all
alternative bonding configurations are enumerated by our combinatorial procedure, and the
lower energy frameworks are eventually captured.
Despite the compactness of the mBGB cost function, considerable computational effort
is spent repelling non-codimeric oxygen atoms (those oxygen atoms that are not connected
to the same Si atom). Considerable speed up can be obtained for the final low-cost stages
of the anneal by limiting the repulsion effort to only those non-codimeric oxygen atoms that
are likely to wander within 0.4 nm of each other. However, this speedup is not applicable to
the early stages of the anneal because the atom step sizes can be large. Consequently, the
early anneal stages can be slow.
Apart from a significant computational speed up, the main consequence of omitting the
energy contributions from disallowed bonds is an approximately uniform reduction in the
energy of the low cost frameworks by a factor of ∼ 6 (see Figure 4 and results section.)
Finally, those structures that anneal to a satisfactorily low framework energy, less than 1.0
eV per SiO2 unit according to the modified mBGB cost function, were further refined using
the General Utility Lattice Program (GULP) [32]. The potential functions used are closely
similar to those of Sanders et al. [33]. The difference in structural parameters between
GULP and mBGB were usually small, but this step allows a meaningful comparison with
the results of Foster et al [9], who used GULP to refine the polyhedral tilings of Delgado-
Friedrichs et al [12, 20]. The potential parameters used in our SiO2 refinements are given in
[34].
The simulated annealing procedure is the rate-limiting step in our search for regular
4-connected nets. Consequently, considerable efforts were made to optimize this process.
The procedure we adapted was a hybrid parallel-tempering procedure of Falcioni and Deem
9
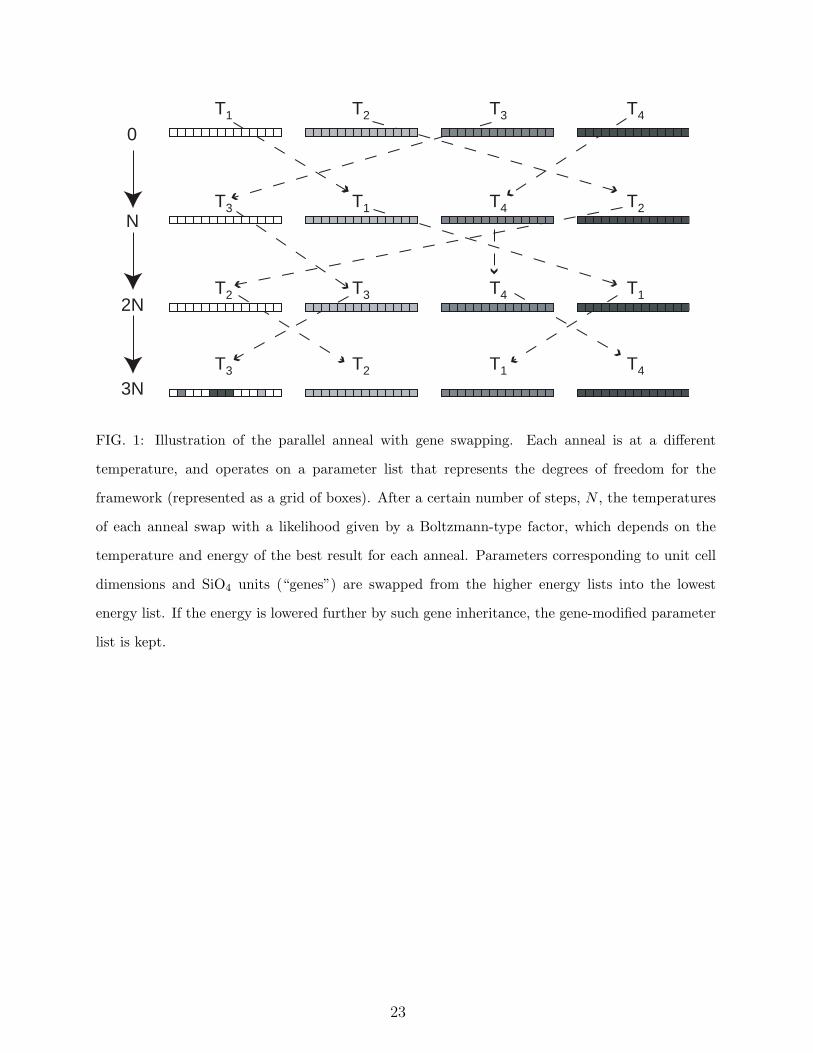
[13] and a simple genetic algorithm. Figure 1 outlines the procedure. A number of parallel
anneals, n, are conducted at various temperatures between 0 and Tmax. The n initial tem-
peratures are chosen according to Tm = [1 − (m − 1)/(n − 1)]4Tmax, (m = 1, ...n), and are
reduced to zero according to a similar fourth-power law as the anneal progresses. The tem-
peratures for each anneal are randomly swapped according to a Boltzmann-type probability
factor. This factor is obtained in the usual way using the ratios of the lowest energy and
temperature for each anneal. Consequently, the best result tends to be annealed at zero
temperature, which corresponds to a steepest descent refinement. However, it will also be
annealed periodically at a higher temperature, or even replaced by a better result obtained
at higher temperature by one of the other annealing processes. Testing shows that this par-
allel tempering method, offers no advantage over our earlier method of sequential tempering
with random temperature spikes [8]. However, the parallel mode has the advantage of allow-
ing a simple genetic algorithm to be applied as well. At a pre-ordained number of anneals,
the parameters corresponding to unit cell lengths, cell angles and complete SiO4 units are
swapped between anneals, and the costs are compared. Frequently, this “gene inheritance”
method finds a lower cost framework and can accelerate the refinement.
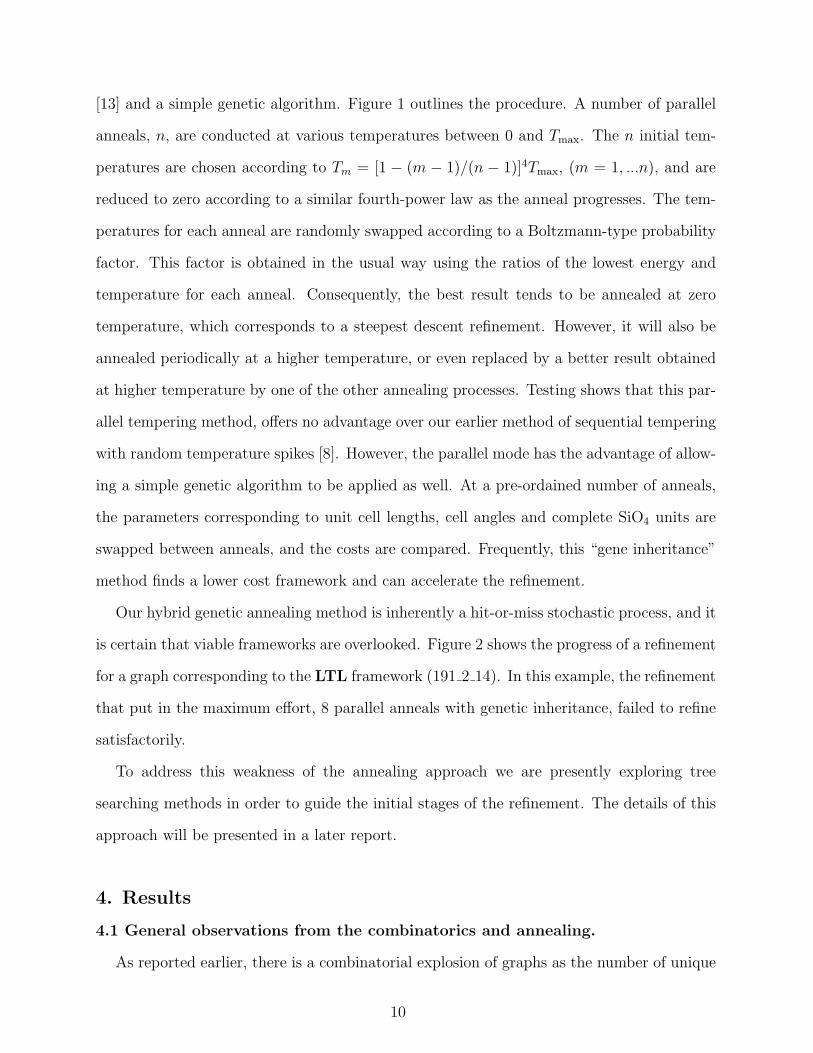
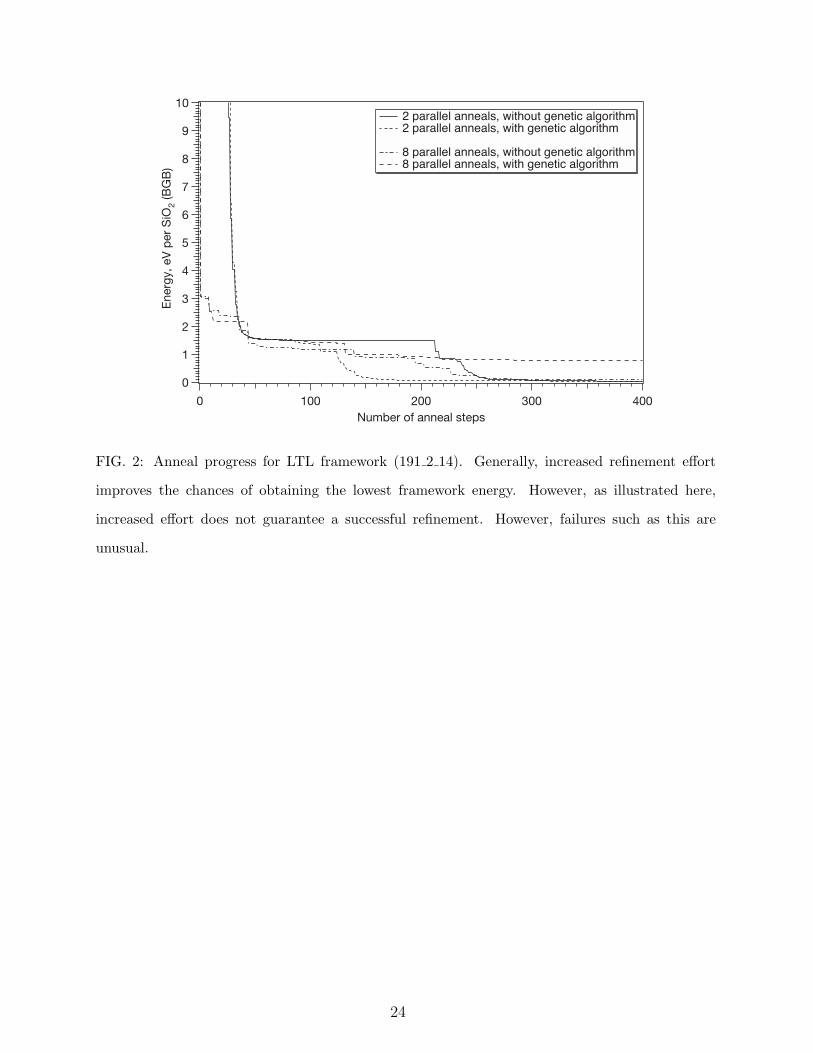
Our hybrid genetic annealing method is inherently a hit-or-miss stochastic process, and it
is certain that viable frameworks are overlooked. Figure 2 shows the progress of a refinement
for a graph corresponding to the LTL framework (191 2 14). In this example, the refinement
that put in the maximum effort, 8 parallel anneals with genetic inheritance, failed to refine
satisfactorily.
To address this weakness of the annealing approach we are presently exploring tree
searching methods in order to guide the initial stages of the refinement. The details of this
approach will be presented in a later report.
4. Results
4.1 General observations from the combinatorics and annealing.
As reported earlier, there is a combinatorial explosion of graphs as the number of unique
10
T-atoms is increased. A complete listing of graphs has been obtained for all space groups
up to nT = 2, excluding space group P1 (No. 2). The accumulation of results for this space
group was terminated after the results file passed 40 Gigabytes in size.
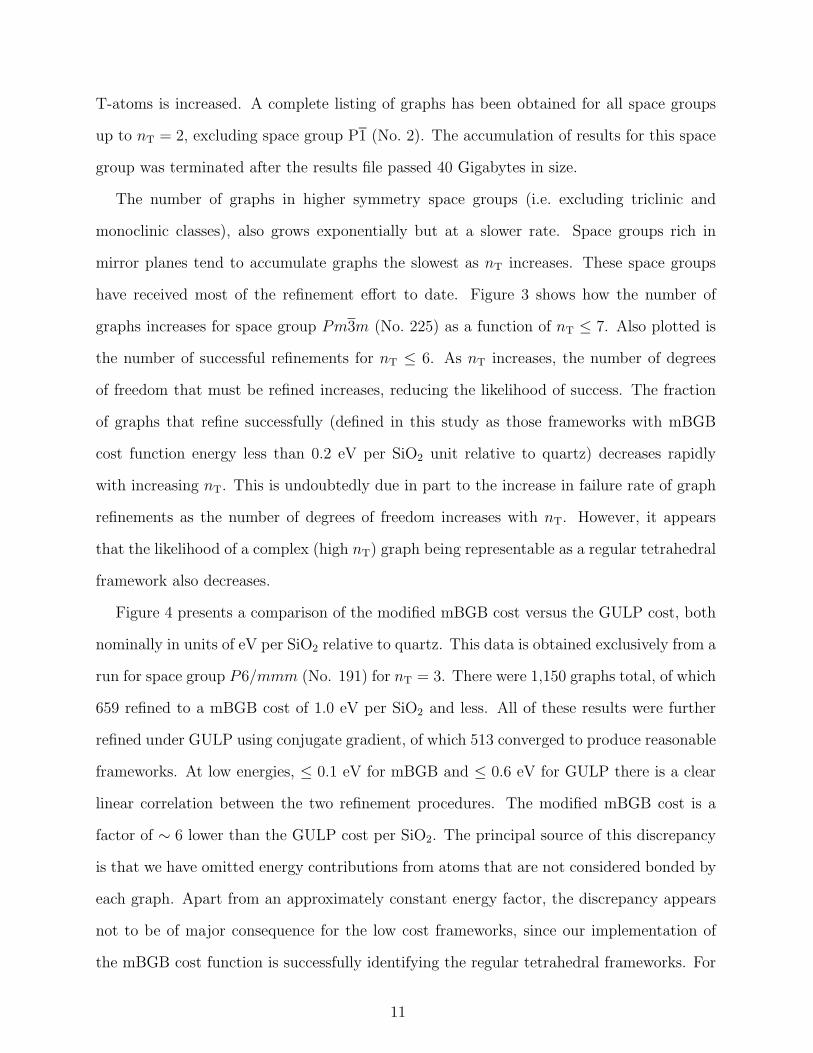
The number of graphs in higher symmetry space groups (i.e. excluding triclinic and
monoclinic classes), also grows exponentially but at a slower rate. Space groups rich in
mirror planes tend to accumulate graphs the slowest as nT increases. These space groups
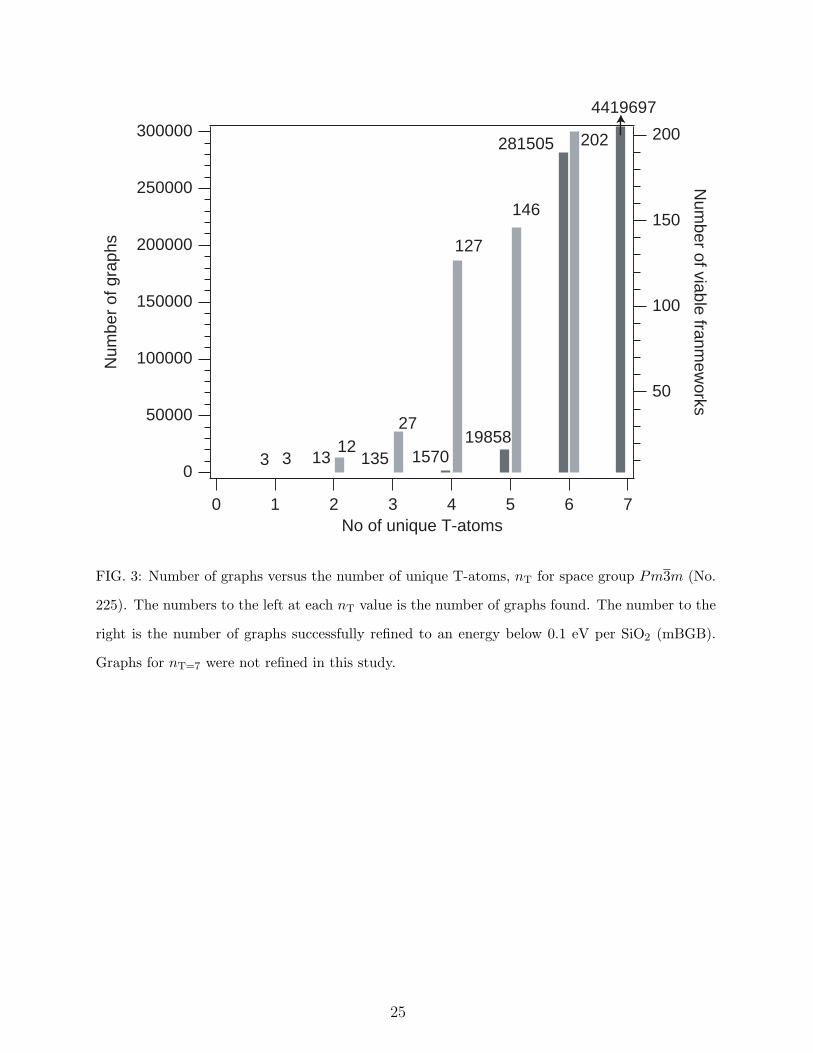
have received most of the refinement effort to date. Figure 3 shows how the number of
graphs increases for space group Pm3m (No. 225) as a function of nT ≤ 7. Also plotted is
the number of successful refinements for nT ≤ 6. As nT increases, the number of degrees
of freedom that must be refined increases, reducing the likelihood of success. The fraction
of graphs that refine successfully (defined in this study as those frameworks with mBGB
cost function energy less than 0.2 eV per SiO2 unit relative to quartz) decreases rapidly
with increasing nT. This is undoubtedly due in part to the increase in failure rate of graph
refinements as the number of degrees of freedom increases with nT. However, it appears
that the likelihood of a complex (high nT) graph being representable as a regular tetrahedral
framework also decreases.
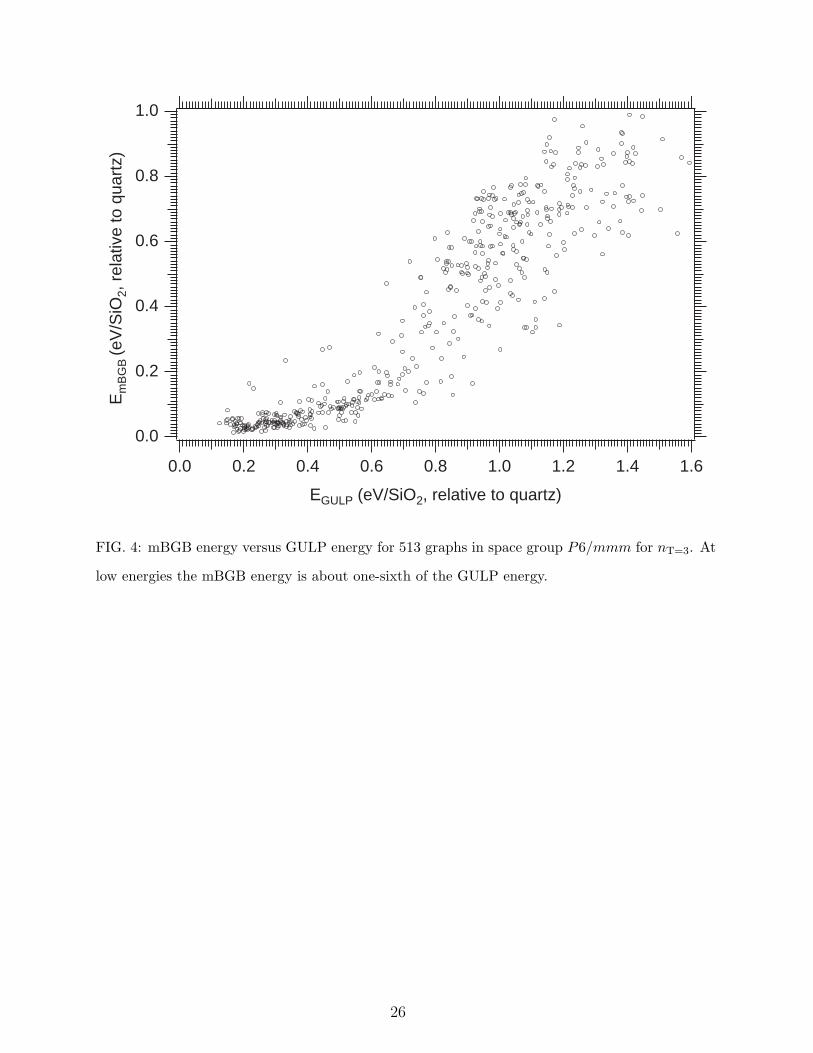
Figure 4 presents a comparison of the modified mBGB cost versus the GULP cost, both
nominally in units of eV per SiO2 relative to quartz. This data is obtained exclusively from a
run for space group P6/mmm (No. 191) for nT = 3. There were 1,150 graphs total, of which
659 refined to a mBGB cost of 1.0 eV per SiO2 and less. All of these results were further
refined under GULP using conjugate gradient, of which 513 converged to produce reasonable
frameworks. At low energies, ≤ 0.1 eV for mBGB and ≤ 0.6 eV for GULP there is a clear
linear correlation between the two refinement procedures. The modified mBGB cost is a
factor of ∼ 6 lower than the GULP cost per SiO2. The principal source of this discrepancy
is that we have omitted energy contributions from atoms that are not considered bonded by
each graph. Apart from an approximately constant energy factor, the discrepancy appears
not to be of major consequence for the low cost frameworks, since our implementation of
the mBGB cost function is successfully identifying the regular tetrahedral frameworks. For
11
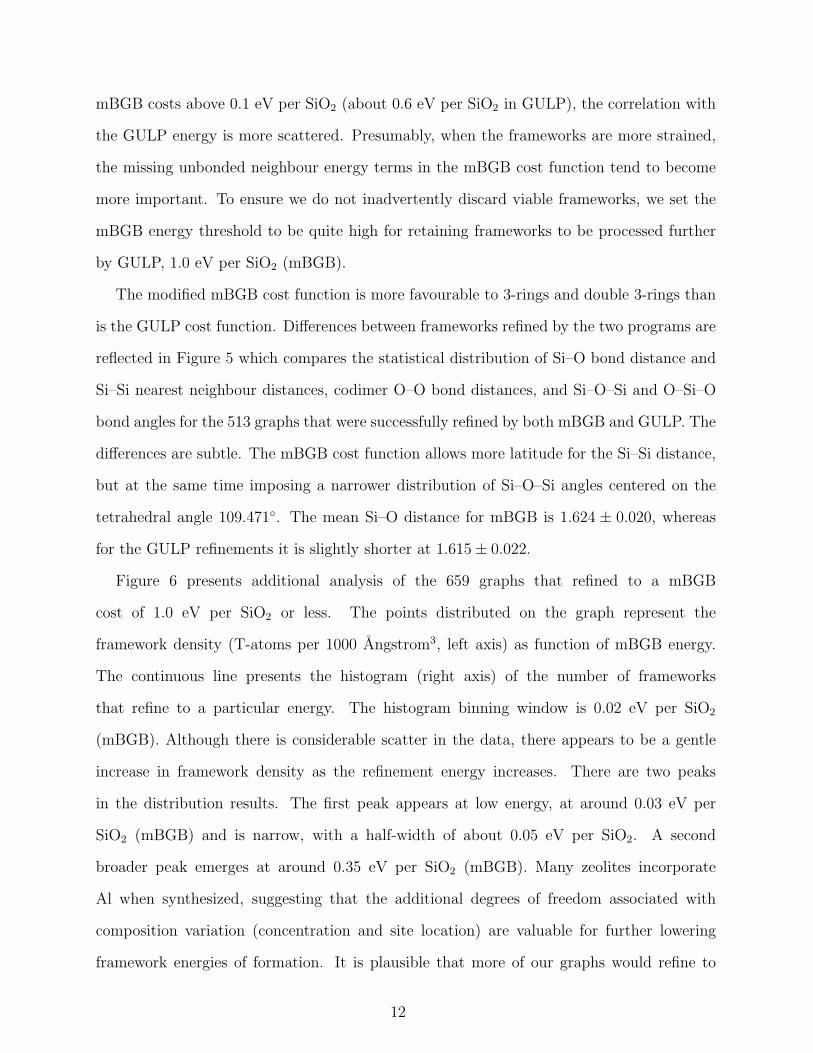
mBGB costs above 0.1 eV per SiO2 (about 0.6 eV per SiO2 in GULP), the correlation with
the GULP energy is more scattered. Presumably, when the frameworks are more strained,
the missing unbonded neighbour energy terms in the mBGB cost function tend to become
more important. To ensure we do not inadvertently discard viable frameworks, we set the
mBGB energy threshold to be quite high for retaining frameworks to be processed further
by GULP, 1.0 eV per SiO2 (mBGB).
The modified mBGB cost function is more favourable to 3-rings and double 3-rings than
is the GULP cost function. Differences between frameworks refined by the two programs are
reflected in Figure 5 which compares the statistical distribution of Si–O bond distance and
Si–Si nearest neighbour distances, codimer O–O bond distances, and Si–O–Si and O–Si–O
bond angles for the 513 graphs that were successfully refined by both mBGB and GULP. The
differences are subtle. The mBGB cost function allows more latitude for the Si–Si distance,
but at the same time imposing a narrower distribution of Si–O–Si angles centered on the
tetrahedral angle 109.471◦. The mean Si–O distance for mBGB is 1.624 ± 0.020, whereas
for the GULP refinements it is slightly shorter at 1.615 ± 0.022.
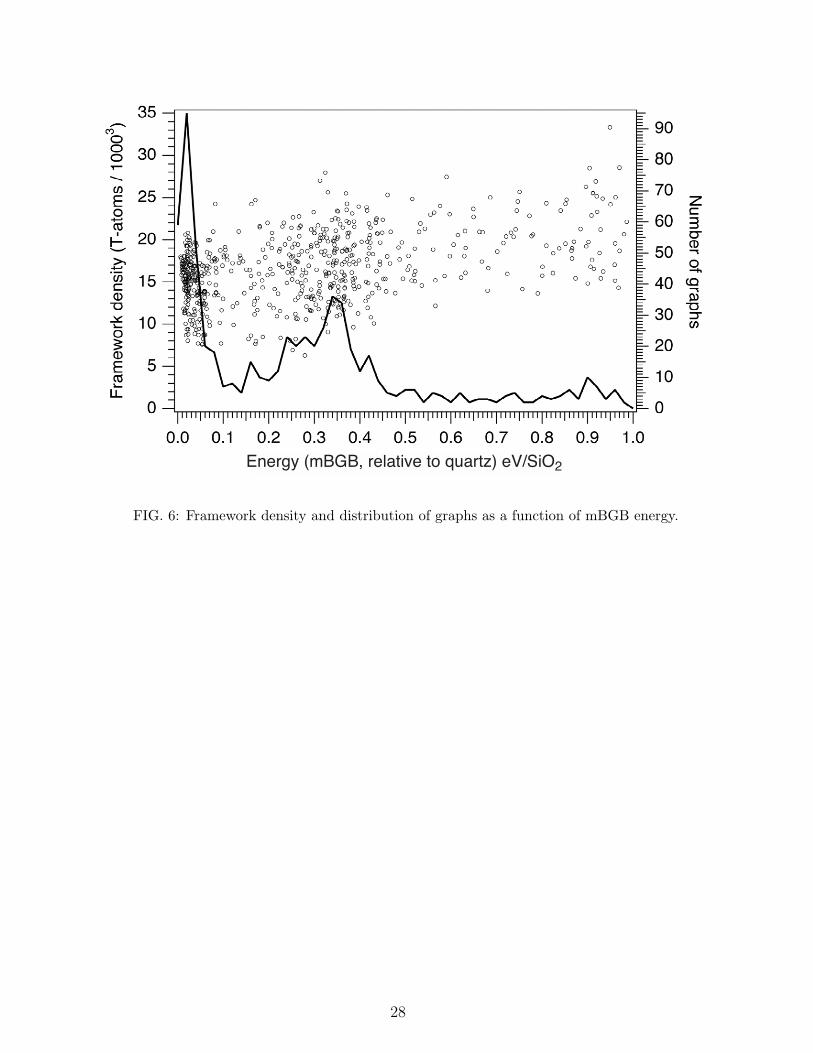
Figure 6 presents additional analysis of the 659 graphs that refined to a mBGB
cost of 1.0 eV per SiO2 or less. The points distributed on the graph represent the
framework density (T-atoms per 1000 Angstrom3, left axis) as function of mBGB energy.
The continuous line presents the histogram (right axis) of the number of frameworks
that refine to a particular energy. The histogram binning window is 0.02 eV per SiO2
(mBGB). Although there is considerable scatter in the data, there appears to be a gentle
increase in framework density as the refinement energy increases. There are two peaks
in the distribution results. The first peak appears at low energy, at around 0.03 eV per
SiO2 (mBGB) and is narrow, with a half-width of about 0.05 eV per SiO2. A second
broader peak emerges at around 0.35 eV per SiO2 (mBGB). Many zeolites incorporate
Al when synthesized, suggesting that the additional degrees of freedom associated with
composition variation (concentration and site location) are valuable for further lowering
framework energies of formation. It is plausible that more of our graphs would refine to
12
lower energies if we allowed the framework composition to vary from a pure SiO2 com-
position, such as by the incorporation of Al. However, we have not yet explored that avenue.
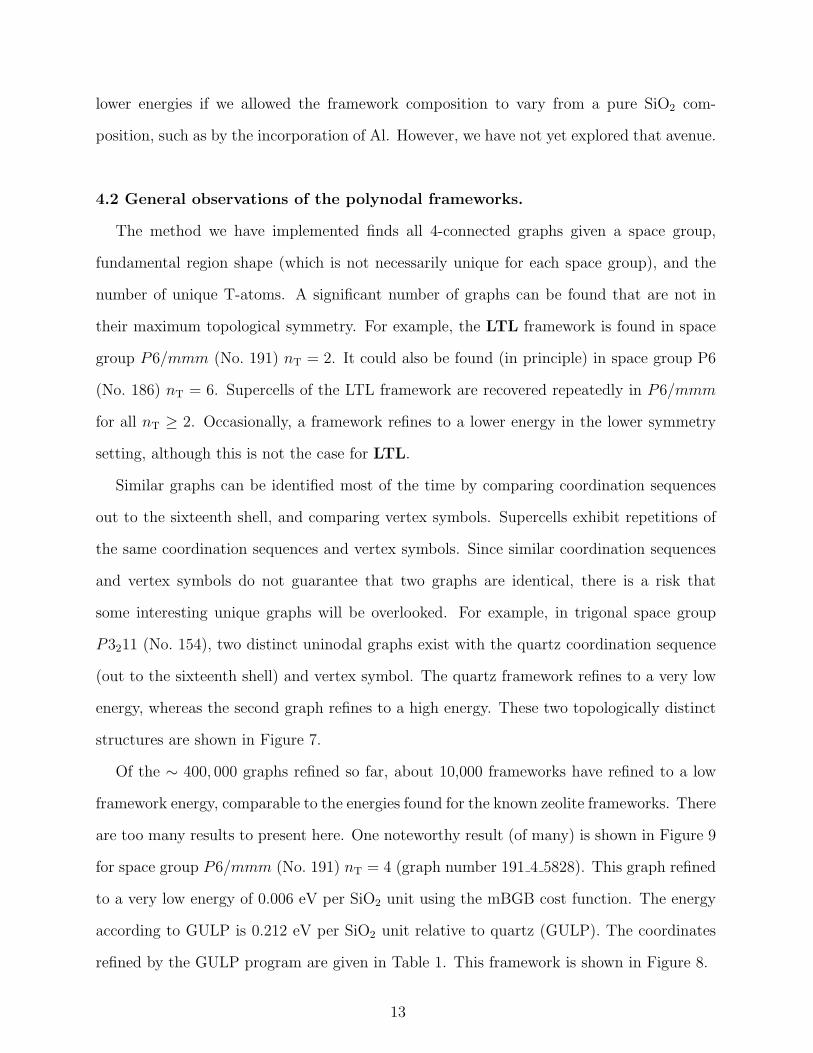
4.2 General observations of the polynodal frameworks.
The method we have implemented finds all 4-connected graphs given a space group,
fundamental region shape (which is not necessarily unique for each space group), and the
number of unique T-atoms. A significant number of graphs can be found that are not in
their maximum topological symmetry. For example, the LTL framework is found in space
group P6/mmm (No. 191) nT = 2. It could also be found (in principle) in space group P6
(No. 186) nT = 6. Supercells of the LTL framework are recovered repeatedly in P6/mmm
for all nT ≥ 2. Occasionally, a framework refines to a lower energy in the lower symmetry
setting, although this is not the case for LTL.
Similar graphs can be identified most of the time by comparing coordination sequences
out to the sixteenth shell, and comparing vertex symbols. Supercells exhibit repetitions of
the same coordination sequences and vertex symbols. Since similar coordination sequences
and vertex symbols do not guarantee that two graphs are identical, there is a risk that
some interesting unique graphs will be overlooked. For example, in trigonal space group
P3211 (No. 154), two distinct uninodal graphs exist with the quartz coordination sequence
(out to the sixteenth shell) and vertex symbol. The quartz framework refines to a very low
energy, whereas the second graph refines to a high energy. These two topologically distinct
structures are shown in Figure 7.
Of the ∼ 400, 000 graphs refined so far, about 10,000 frameworks have refined to a low
framework energy, comparable to the energies found for the known zeolite frameworks. There
are too many results to present here. One noteworthy result (of many) is shown in Figure 9
for space group P6/mmm (No. 191) nT = 4 (graph number 191 4 5828). This graph refined
to a very low energy of 0.006 eV per SiO2 unit using the mBGB cost function. The energy
according to GULP is 0.212 eV per SiO2 unit relative to quartz (GULP). The coordinates
refined by the GULP program are given in Table 1. This framework is shown in Figure 8.
13
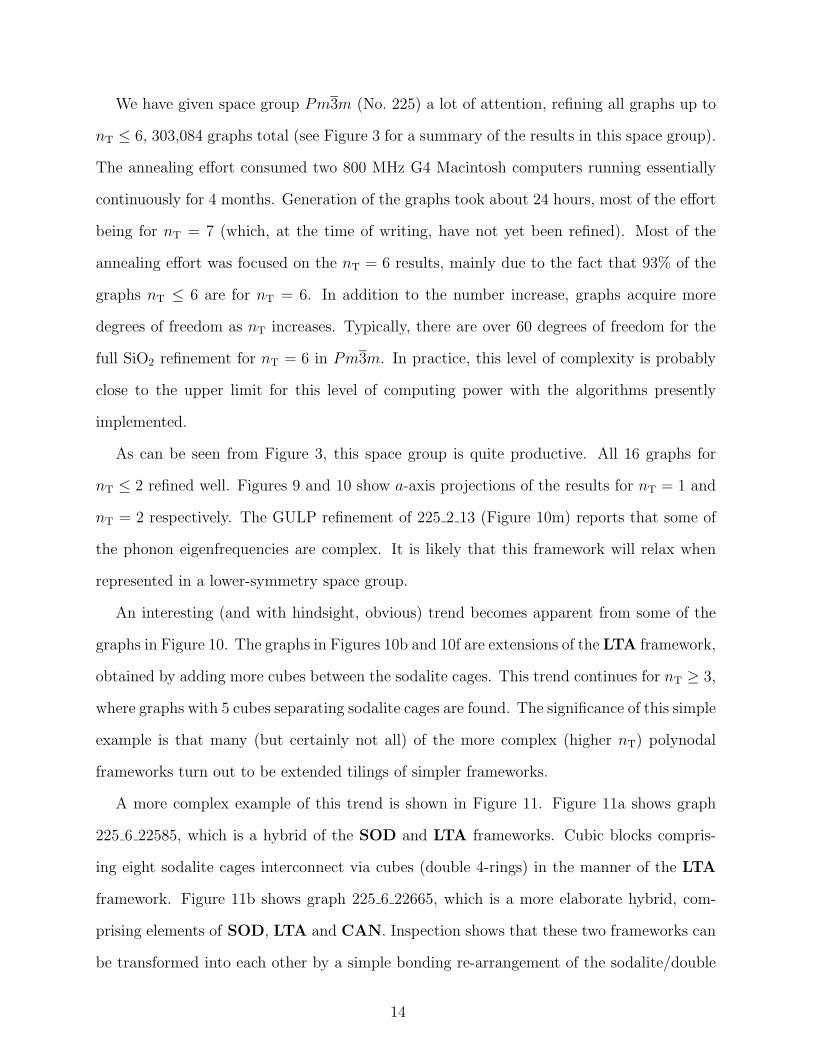
We have given space group Pm3m (No. 225) a lot of attention, refining all graphs up to
nT ≤ 6, 303,084 graphs total (see Figure 3 for a summary of the results in this space group).
The annealing effort consumed two 800 MHz G4 Macintosh computers running essentially
continuously for 4 months. Generation of the graphs took about 24 hours, most of the effort
being for nT = 7 (which, at the time of writing, have not yet been refined). Most of the
annealing effort was focused on the nT = 6 results, mainly due to the fact that 93% of the
graphs nT ≤ 6 are for nT = 6. In addition to the number increase, graphs acquire more
degrees of freedom as nT increases. Typically, there are over 60 degrees of freedom for the
full SiO2 refinement for nT = 6 in Pm3m. In practice, this level of complexity is probably
close to the upper limit for this level of computing power with the algorithms presently
implemented.
As can be seen from Figure 3, this space group is quite productive. All 16 graphs for
nT ≤ 2 refined well. Figures 9 and 10 show a-axis projections of the results for nT = 1 and
nT = 2 respectively. The GULP refinement of 225 2 13 (Figure 10m) reports that some of
the phonon eigenfrequencies are complex. It is likely that this framework will relax when
represented in a lower-symmetry space group.
An interesting (and with hindsight, obvious) trend becomes apparent from some of the
graphs in Figure 10. The graphs in Figures 10b and 10f are extensions of the LTA framework,
obtained by adding more cubes between the sodalite cages. This trend continues for nT ≥ 3,
where graphs with 5 cubes separating sodalite cages are found. The significance of this simple
example is that many (but certainly not all) of the more complex (higher nT) polynodal
frameworks turn out to be extended tilings of simpler frameworks.
A more complex example of this trend is shown in Figure 11. Figure 11a shows graph
225 6 22585, which is a hybrid of the SOD and LTA frameworks. Cubic blocks compris-
ing eight sodalite cages interconnect via cubes (double 4-rings) in the manner of the LTA
framework. Figure 11b shows graph 225 6 22665, which is a more elaborate hybrid, com-
prising elements of SOD, LTA and CAN. Inspection shows that these two frameworks can
be transformed into each other by a simple bonding re-arrangement of the sodalite/double
14
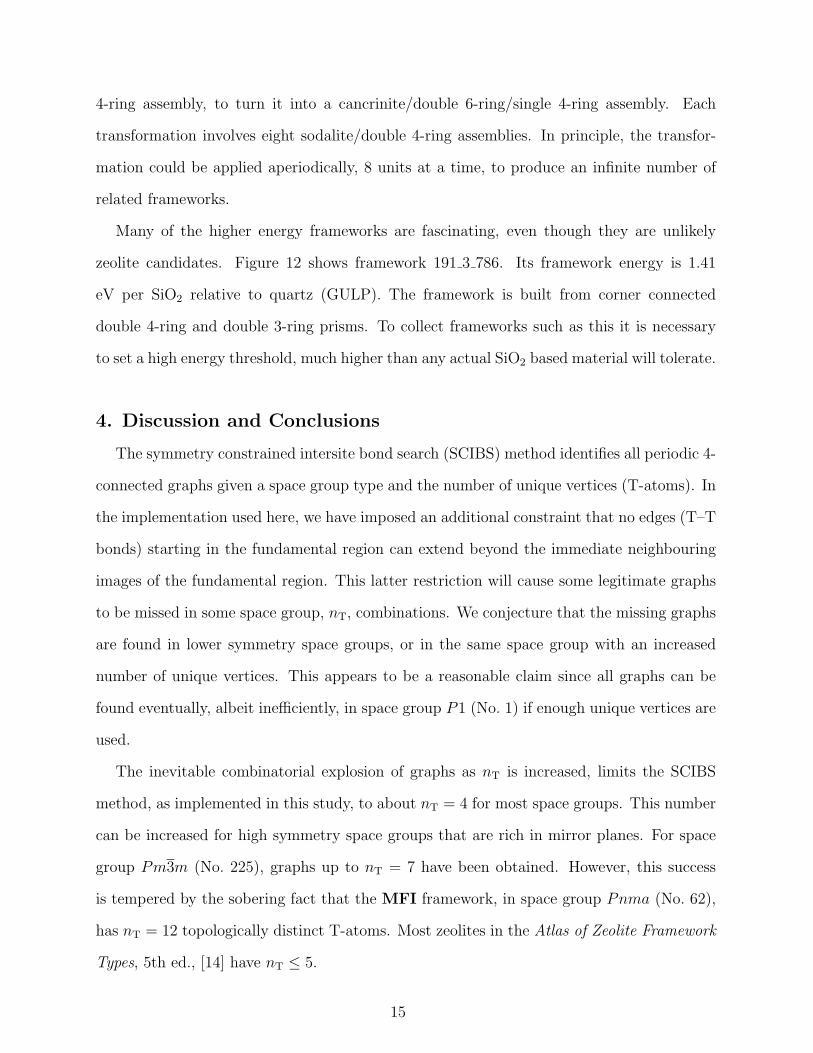
4-ring assembly, to turn it into a cancrinite/double 6-ring/single 4-ring assembly. Each
transformation involves eight sodalite/double 4-ring assemblies. In principle, the transfor-
mation could be applied aperiodically, 8 units at a time, to produce an infinite number of
related frameworks.
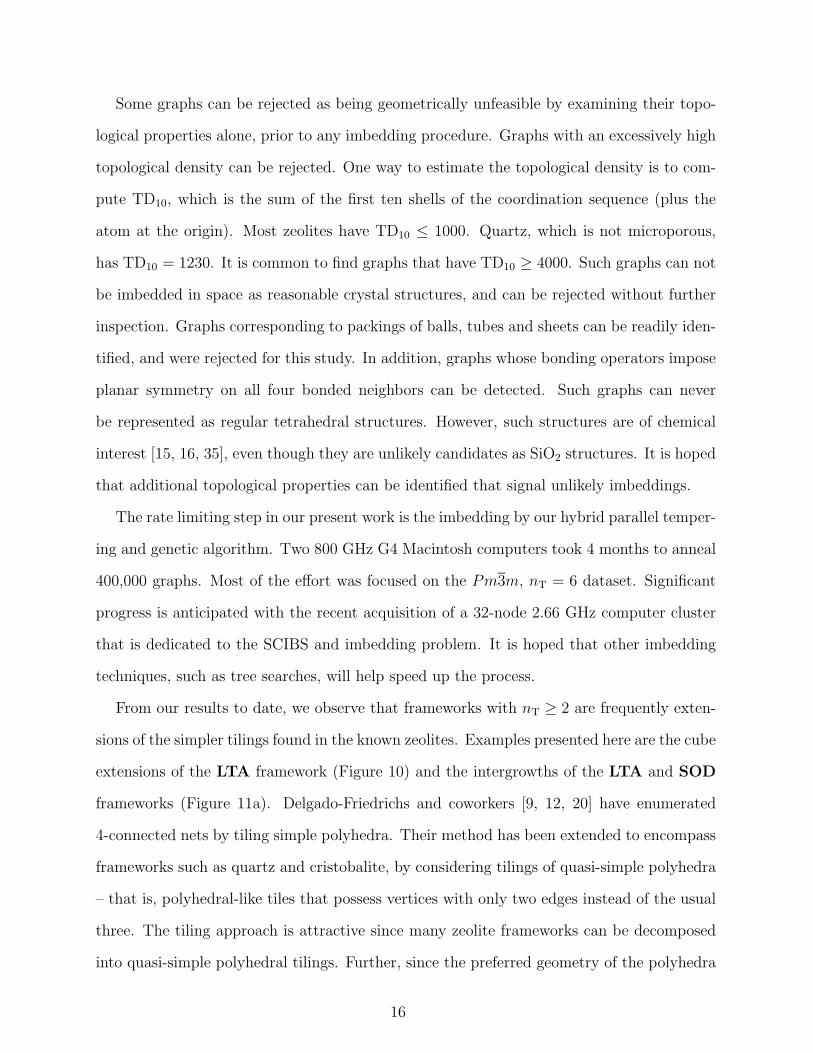
Many of the higher energy frameworks are fascinating, even though they are unlikely
zeolite candidates. Figure 12 shows framework 191 3 786. Its framework energy is 1.41
eV per SiO2 relative to quartz (GULP). The framework is built from corner connected
double 4-ring and double 3-ring prisms. To collect frameworks such as this it is necessary
to set a high energy threshold, much higher than any actual SiO2 based material will tolerate.
4. Discussion and Conclusions
The symmetry constrained intersite bond search (SCIBS) method identifies all periodic 4-
connected graphs given a space group type and the number of unique vertices (T-atoms). In
the implementation used here, we have imposed an additional constraint that no edges (T–T
bonds) starting in the fundamental region can extend beyond the immediate neighbouring
images of the fundamental region. This latter restriction will cause some legitimate graphs
to be missed in some space group, nT, combinations. We conjecture that the missing graphs
are found in lower symmetry space groups, or in the same space group with an increased
number of unique vertices. This appears to be a reasonable claim since all graphs can be
found eventually, albeit inefficiently, in space group P1 (No. 1) if enough unique vertices are
used.
The inevitable combinatorial explosion of graphs as nT is increased, limits the SCIBS
method, as implemented in this study, to about nT = 4 for most space groups. This number
can be increased for high symmetry space groups that are rich in mirror planes. For space
group Pm3m (No. 225), graphs up to nT = 7 have been obtained. However, this success
is tempered by the sobering fact that the MFI framework, in space group Pnma (No. 62),
has nT = 12 topologically distinct T-atoms. Most zeolites in the Atlas of Zeolite Framework
Types, 5th ed., [14] have nT ≤ 5.
15
Some graphs can be rejected as being geometrically unfeasible by examining their topo-
logical properties alone, prior to any imbedding procedure. Graphs with an excessively high
topological density can be rejected. One way to estimate the topological density is to com-
pute TD10, which is the sum of the first ten shells of the coordination sequence (plus the
atom at the origin). Most zeolites have TD10 ≤ 1000. Quartz, which is not microporous,
has TD10 = 1230. It is common to find graphs that have TD10 ≥ 4000. Such graphs can not
be imbedded in space as reasonable crystal structures, and can be rejected without further
inspection. Graphs corresponding to packings of balls, tubes and sheets can be readily iden-
tified, and were rejected for this study. In addition, graphs whose bonding operators impose
planar symmetry on all four bonded neighbors can be detected. Such graphs can never
be represented as regular tetrahedral structures. However, such structures are of chemical
interest [15, 16, 35], even though they are unlikely candidates as SiO2 structures. It is hoped
that additional topological properties can be identified that signal unlikely imbeddings.
The rate limiting step in our present work is the imbedding by our hybrid parallel temper-
ing and genetic algorithm. Two 800 GHz G4 Macintosh computers took 4 months to anneal
400,000 graphs. Most of the effort was focused on the Pm3m, nT = 6 dataset. Significant
progress is anticipated with the recent acquisition of a 32-node 2.66 GHz computer cluster
that is dedicated to the SCIBS and imbedding problem. It is hoped that other imbedding
techniques, such as tree searches, will help speed up the process.
From our results to date, we observe that frameworks with nT ≥ 2 are frequently exten-
sions of the simpler tilings found in the known zeolites. Examples presented here are the cube
extensions of the LTA framework (Figure 10) and the intergrowths of the LTA and SOD
frameworks (Figure 11a). Delgado-Friedrichs and coworkers [9, 12, 20] have enumerated
4-connected nets by tiling simple polyhedra. Their method has been extended to encompass
frameworks such as quartz and cristobalite, by considering tilings of quasi-simple polyhedra
– that is, polyhedral-like tiles that possess vertices with only two edges instead of the usual
three. The tiling approach is attractive since many zeolite frameworks can be decomposed
into quasi-simple polyhedral tilings. Further, since the preferred geometry of the polyhedra
16
is known, it is relatively straightforward to confirm whether or not the tiling can be realized
as a regular tetrahedral framework. It seems that the tiling method should be more efficient
at finding frameworks of the type shown in Figures 11 and 12. The subset of graphs that
are simple polyhedral tilings can be identified in our lists of SCIBS generated graphs since
they tend to have the simplest vertex symbols, with few multiple rings subtending any one
intervertex angle. However, not all low energy frameworks are simple tilings.
Clearly, the SCIBS method of this study, and the tiling method of Delgado-Friedrichs
and coworkers, represent different strategies for searching the same graph space. From the
viewpoint of this study, the tiling method offers an efficient pre-filter of graphs, selecting
only that subset that conform to the polyhedral tilings that are commonly observed in the
known zeolite frameworks. It is our observation that graphs with simple vertex symbols tend
to refine well to make nice frameworks, but not always. However, graphs with complicated
vertex symbols (quartz and cristobalite are examples) also refine well. Although it has been
shown that tilings of quasi-simple polyhedra can capture these latter two frameworks, it is
not clear if the tiling technique can effectively identify all the regular tetrahedral frameworks.
The SCIBS method clearly does, but with the penalty that only a small fraction of graphs
encode regular tetrahedral frameworks.
Both methods require an imbedding step. Foster and coworkers used the GULP program
to refine the tilings of Delgado-Friedrichs et al [9]. Here we used a series of refinement
procedures, finishing with a GULP refinement of the likely candidates. Repeated test runs
of our refinement procedures on a subset of the Pm3m, nT = 6 graphs (with over 60
degrees of freedom), show that our refinement method is probably missing as many as 50%
of the plausible graphs in this dataset. We are exploring methods to improve the starting
configuration of refinements, such as the aforementioned tree searches, which may improve
convergence rates of the annealing step.
The ∼10,000 successfully refined frameworks obtained in this study are being assembled
into a web-based database. It is expected that this core database, along with the additional
frameworks found by the computer cluster, will soon be made publicly available.
17

Acknowledgments
The authors wish to thank Mike O’Keeffe and Martin Foster of Arizona State University
for useful feedback.
18
[1] M. W. Deem and J. M. Newsam, Nature 342, 260 (1989).
[2] M. O’Keeffe, Z. Kristallogr. 196, 21 (1991).
[3] H.-J. Klein, in 10th International Conference on Mathematical Modelling and Scientific Com-
puting, July 1995, Boston, edited by X. J. Avula and A. Nerodi (Principia Scientia, St. Louis,
1996), vol. 6, pp. 940–945.
[4] M. W. Deem and J. M. Newsam, J. Amer. Chem. Soc. 114, 7189 (1992).
[5] I. G. Wood and G. D. Price, Zeolites 12, 320 (1992).
[6] M. M. J. Treacy, S. Rao, and I. Rivin, in Proceedings of the 9th International Zeolite Con-
ference, Montreal 1992, edited by R. von Ballmoos, J. B. Higgins, and M. M. J. Treacy
(Butterworth-Heinemann, Stoneham, Massachusetts, 1993), vol. 1, pp. 381–388.
[7] K. J. Andries and J. V. Smith, Proc. R. Soc. Lond A 444, 217 (1994).
[8] M. M. J. Treacy, K. H. Randall, S. Rao, J. A. Perry, and D. J. Chadi, zeit 212, 768 (1997).
[9] M. D. Foster, O. D. Friedrichs, R. G. Bell, F. A. A. Paz, and J. Klinowski, Angew. Chemie
Int. Ed. 42, 3896 (2003).
[10] Y. Li, J. Yu, D. Liu, W. Yan, R. Xu, and Y. Xu, Chem. Mater. 15, 2780 (2003).
[11] M. A. Zwijnenburg, S. T. Bromley, J. C. Jansen, and T. Maschmeyer, Chem. Mater. 16, 12
(2004).
[12] O. Delgado-Friedrichs, A. W. M. Dress, D. H. Huson, J. Klinowski, and A. L. Mackay, Nature
400, 644 (1999).
[13] M. Falcioni and M. W. Deem, J. Chem. Phys. 110, 1754 (1999).
[14] C. Baerlocher, W. M. Meier, and D. H. Olson, Atlas of Zeolite Framework Types, 5th ed.
(Elsevier, Amsterdam, 2001).
[15] A. F. Wells, Three-Dimensional Nets and Polyhedra (Wiley, New York, 1977).
[16] A. F. Wells, Further Studies of Three-Dimensional Nets (American Crystallographic Associ-
ation, Monograph No. 8, Polycrystal Book Service, Pittsburgh, 1979).
[17] D. W. Breck, Zeolite Molecular Sieves. Structure, Chemistry and Use (Wiley-Interscience,
New York, 1974).
[18] F. Delprato, L. Delmotte, J.-L. Guth, and L. Huve, Zeolites 10, 546 (1990).
[19] J. V. Smith, Chemical Reviews 88, 149 (1988).
19
[20] O. Delgado-Friedrichs and D. H. Huson, Discrete Comput. Geom. 24, 279 (2000).
[21] C. Mellot-Draznieks, J. M. Newsam, A. M. Gorman, C. M. Freeman, and G. Ferey, Angew.
Chem. Int. Ed. Engl. 39, 2270 (2000).
[22] C. Mellot-Draznieks, S. Girard, G. Ferey, J. C. Schon, Z. Cancarevic, and M. Jansen, Chem.
Eur. J. 8, 4102 (2002).
[23] C. Mellot-Draznieks, S. Girard, and G. Ferey, Chem. Eur. J. Am. Chem. Soc. 124, 15326
(2002).
[24] D. E. Akporiaye and G. D. Price, Zeolites 9, 23 (1989).
[25] M. D. Shannon, in Proceedings of the 9th International Zeolite Conference, Montreal 1992,
edited by R. von Ballmoos, J. B. Higgins, and M. M. J. Treacy (Butterworth-Heinemann,
Stoneham, Massachusetts, 1993), vol. 1, pp. 389–398.
[26] E. Koch and W. Fisher, Z. Kristallogr. 210, 407 (1995).
[27] T. Hahn, International Tables for Crystallography, vol. A (Kluwer Academic Publishers, Dor-
drecht/Boston/London, 1995), 4th ed.
[28] O. Delgado-Friedrichs and M. O’Keeffe, Acta Crystallogr. A A59, 351 (2003).
[29] I. D. Brown, S. R. Hall, P. R. Edington, P. M. D. Fitzgerald, B. H. Toby, B. McMahon,
G. M. Sheldrick, H. Flack, P. Murray-Rust, P. E. Bourne, et al., A Guide to CIF for authors
(International Union of Crystallography, Chester, United Kingdom, 1995).
[30] C. Baerlocher, A. Hepp, and W. M. Meier, DLS-76 – A program for simulation of crystal
structures by geometric refinement (ETH Report, Zurich, 1977).
[31] G. V. G. M. B. Boisen and M. S. T. Bukowinski, Physics and Chemistry of Minerals 21, 269
(1994).
[32] J. D. Gale, J. Chem. Soc., Faraday Trans. 93, 629 (1997).
[33] M. J. Sanders, M. Leslie, and C. R. A. Catlow, J. Chem. Soc., Chem. Commun. 19, 1271
(1984).
[34] GULP potentials used in this study,
Si core 4.00000O core 0.86902O shel -2.86902buckSi core O shel 1283.907 0.32052 10.66158 0.0 10.0O shel O shel 22764.00 0.14900 27.87900 0.0 12.0three
20
Si core O shel O shel 2.09724 109.47 1.9 1.9 3.5springO 74.92.
[35] M. O’Keeffe and B. G. Hyde, Crystal Structures. I. Patterns and Symmetry (Mineralogical
Society of America, Washington, 1996).
[36] M. O’Keeffe, Acta Crystallogr. A47, 748 (1991).
[37] M. O’Keeffe and N. E. Brese, Acta Crystallogr. A48, 663 (1992).
[38] M. O’Keeffe, Acta Crystallogr. A48, 670 (1992).
[39] M. O’Keeffe, Acta Crystallogr. A51, 916 (1995).
[40] M. D. Foster, Personal communication (2004).
21
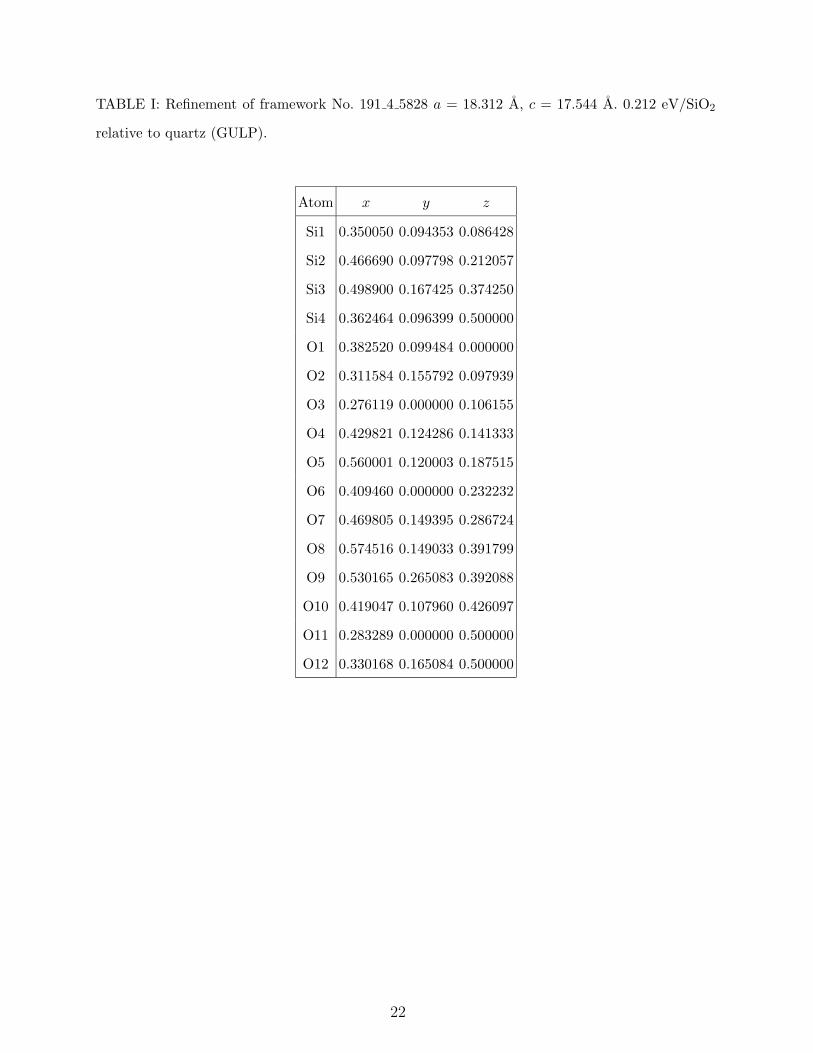
TABLE I: Refinement of framework No. 191 4 5828 a = 18.312 A, c = 17.544 A. 0.212 eV/SiO2
relative to quartz (GULP).
Atom x y z
Si1 0.350050 0.094353 0.086428
Si2 0.466690 0.097798 0.212057
Si3 0.498900 0.167425 0.374250
Si4 0.362464 0.096399 0.500000
O1 0.382520 0.099484 0.000000
O2 0.311584 0.155792 0.097939
O3 0.276119 0.000000 0.106155
O4 0.429821 0.124286 0.141333
O5 0.560001 0.120003 0.187515
O6 0.409460 0.000000 0.232232
O7 0.469805 0.149395 0.286724
O8 0.574516 0.149033 0.391799
O9 0.530165 0.265083 0.392088
O10 0.419047 0.107960 0.426097
O11 0.283289 0.000000 0.500000
O12 0.330168 0.165084 0.500000
22
T1 T2 T3 T4
T3 T1 T4 T2
T2 T3 T4 T1
T3 T2 T1 T4
0
N
2N
3N
FIG. 1: Illustration of the parallel anneal with gene swapping. Each anneal is at a different
temperature, and operates on a parameter list that represents the degrees of freedom for the
framework (represented as a grid of boxes). After a certain number of steps, N , the temperatures
of each anneal swap with a likelihood given by a Boltzmann-type factor, which depends on the
temperature and energy of the best result for each anneal. Parameters corresponding to unit cell
dimensions and SiO4 units (“genes”) are swapped from the higher energy lists into the lowest
energy list. If the energy is lowered further by such gene inheritance, the gene-modified parameter
list is kept.
23
10
9
8
7
6
5
4
3
2
1
0
Energ
y, eV
per
SiO
2 (B
GB
)
4003002001000
Number of anneal steps
2 parallel anneals, without genetic algorithm 2 parallel anneals, with genetic algorithm
8 parallel anneals, without genetic algorithm 8 parallel anneals, with genetic algorithm
FIG. 2: Anneal progress for LTL framework (191 2 14). Generally, increased refinement effort
improves the chances of obtaining the lowest framework energy. However, as illustrated here,
increased effort does not guarantee a successful refinement. However, failures such as this are
unusual.
24
300000
250000
200000
150000
100000
50000
0
Num
ber
of g
raph
s
76543210No of unique T-atoms
200
150
100
50
Num
ber of viable franmew
orks
3 13 135 157019858
281505
4419697
312
27
127
146
202
FIG. 3: Number of graphs versus the number of unique T-atoms, nT for space group Pm3m (No.
225). The numbers to the left at each nT value is the number of graphs found. The number to the
right is the number of graphs successfully refined to an energy below 0.1 eV per SiO2 (mBGB).
Graphs for nT=7 were not refined in this study.
25
1.0
0.8
0.6
0.4
0.2
0.0
Em
BG
B (e
V/S
iO2,
rel
ativ
e to
qua
rtz)
1.61.41.21.00.80.60.40.20.0
EGULP (eV/SiO2, relative to quartz)
FIG. 4: mBGB energy versus GULP energy for 513 graphs in space group P6/mmm for nT=3. At
low energies the mBGB energy is about one-sixth of the GULP energy.
26

120
100
80
60
40
20
0
12011010090O–Si–O angle (°)
GULP BGB
120
100
80
60
40
20
0
1.751.701.651.601.551.50Si–O distance, Å
GULP BGB
150
100
50
0
2.82.72.62.52.42.3Codimer O–O distance, Å
GULP BGB
35
30
25
20
15
10
5
0
3.43.23.02.82.6Si–Si distance, Å
GULP BGB
35
30
25
20
15
10
5
0
160140120100Si–O–Si angle (°)
GULP BGB
a b c
d e
FIG. 5: Comparison of framework statistics under mBGB and GULP refinements. The mBGB
cost function favors slightly longer Si–O bond distances, and a narrower spread in O–Si–O angles,
than does the potential function used in GULP.
27
Energy (mBGB, relative to quartz) eV/SiO2
FIG. 6: Framework density and distribution of graphs as a function of mBGB energy.
28
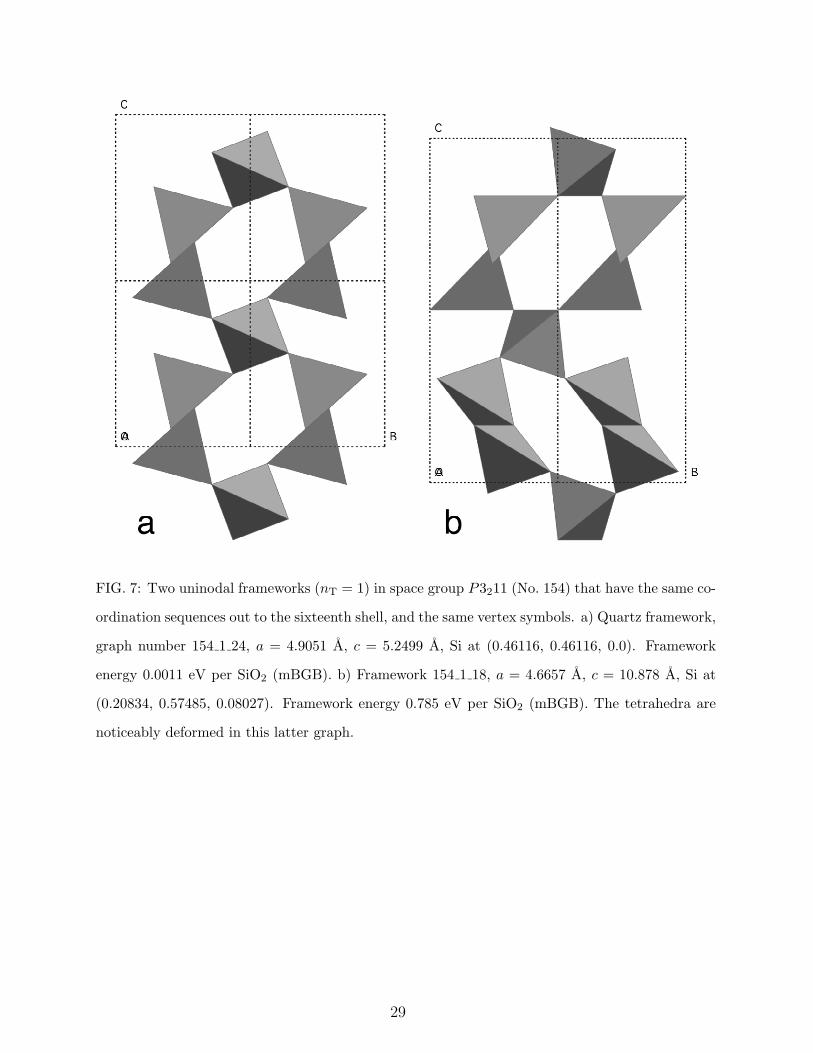
FIG. 7: Two uninodal frameworks (nT = 1) in space group P3211 (No. 154) that have the same co-
ordination sequences out to the sixteenth shell, and the same vertex symbols. a) Quartz framework,
graph number 154 1 24, a = 4.9051 A, c = 5.2499 A, Si at (0.46116, 0.46116, 0.0). Framework
energy 0.0011 eV per SiO2 (mBGB). b) Framework 154 1 18, a = 4.6657 A, c = 10.878 A, Si at
(0.20834, 0.57485, 0.08027). Framework energy 0.785 eV per SiO2 (mBGB). The tetrahedra are
noticeably deformed in this latter graph.
29
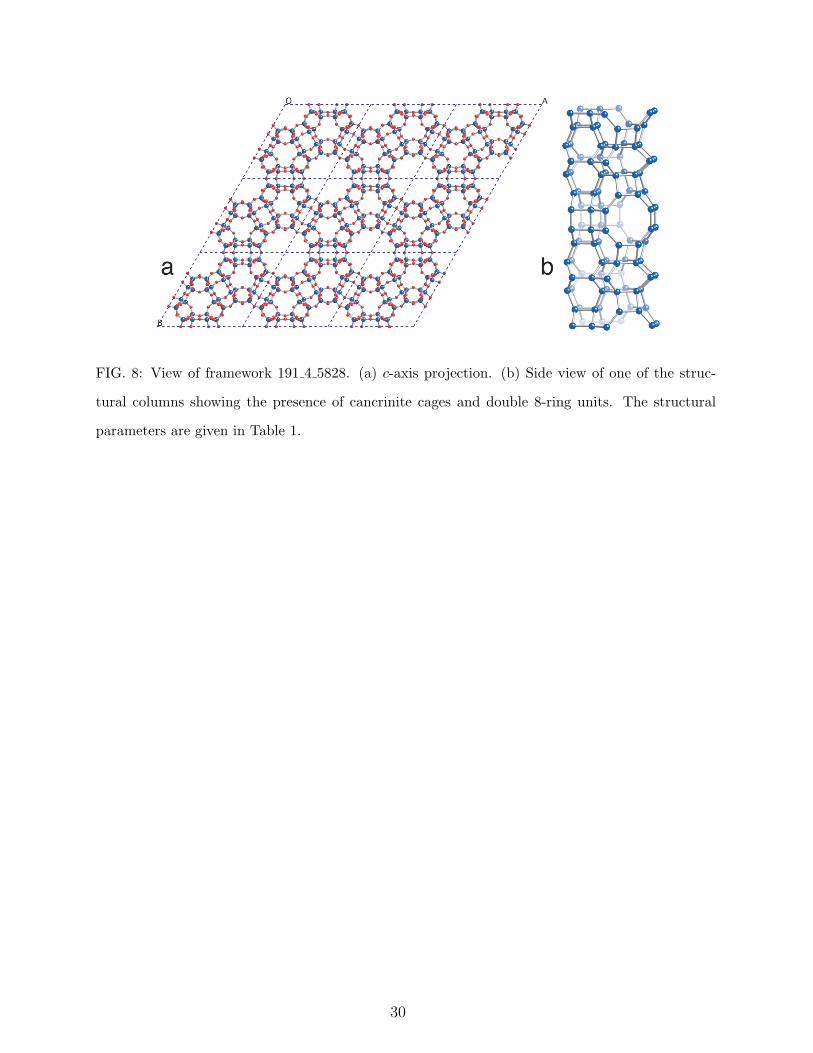
FIG. 8: View of framework 191 4 5828. (a) c-axis projection. (b) Side view of one of the struc-
tural columns showing the presence of cancrinite cages and double 8-ring units. The structural
parameters are given in Table 1.
30
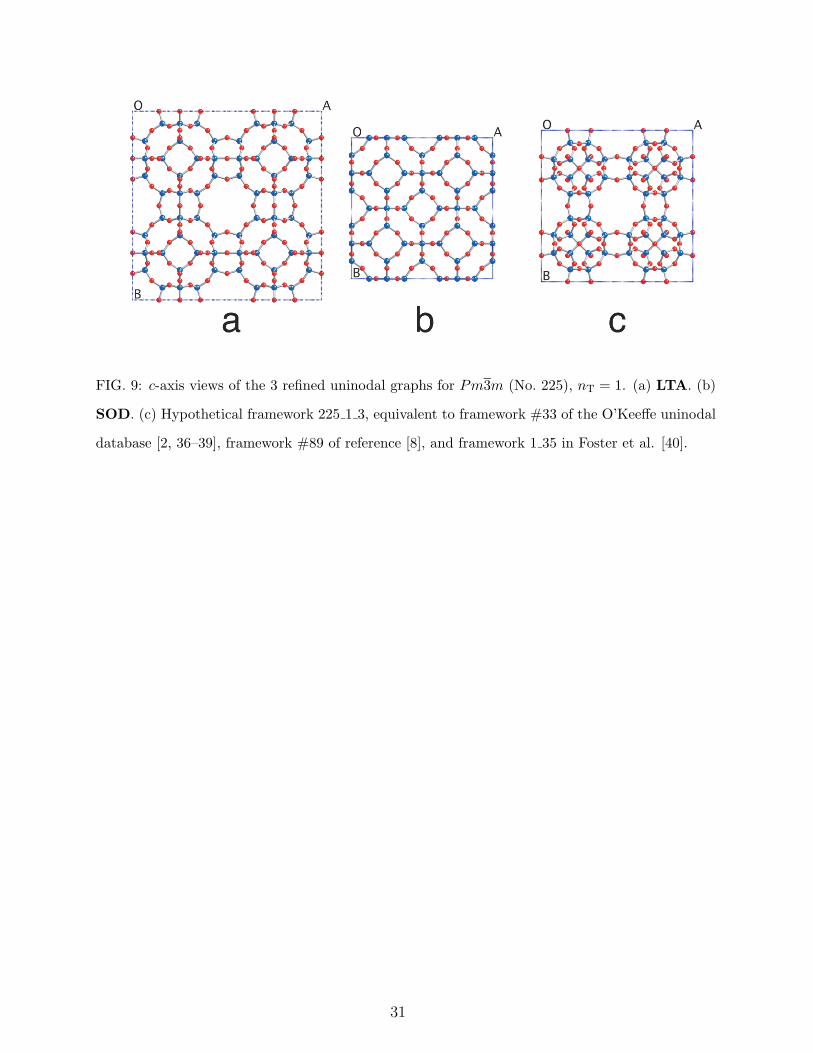
FIG. 9: c-axis views of the 3 refined uninodal graphs for Pm3m (No. 225), nT = 1. (a) LTA. (b)
SOD. (c) Hypothetical framework 225 1 3, equivalent to framework #33 of the O’Keeffe uninodal
database [2, 36–39], framework #89 of reference [8], and framework 1 35 in Foster et al. [40].
31

FIG. 10: c-axis views of the 13 refined graphs 225 2 1 to 225 2 13 for space group Pm3m (No.
225), nT = 2.
32
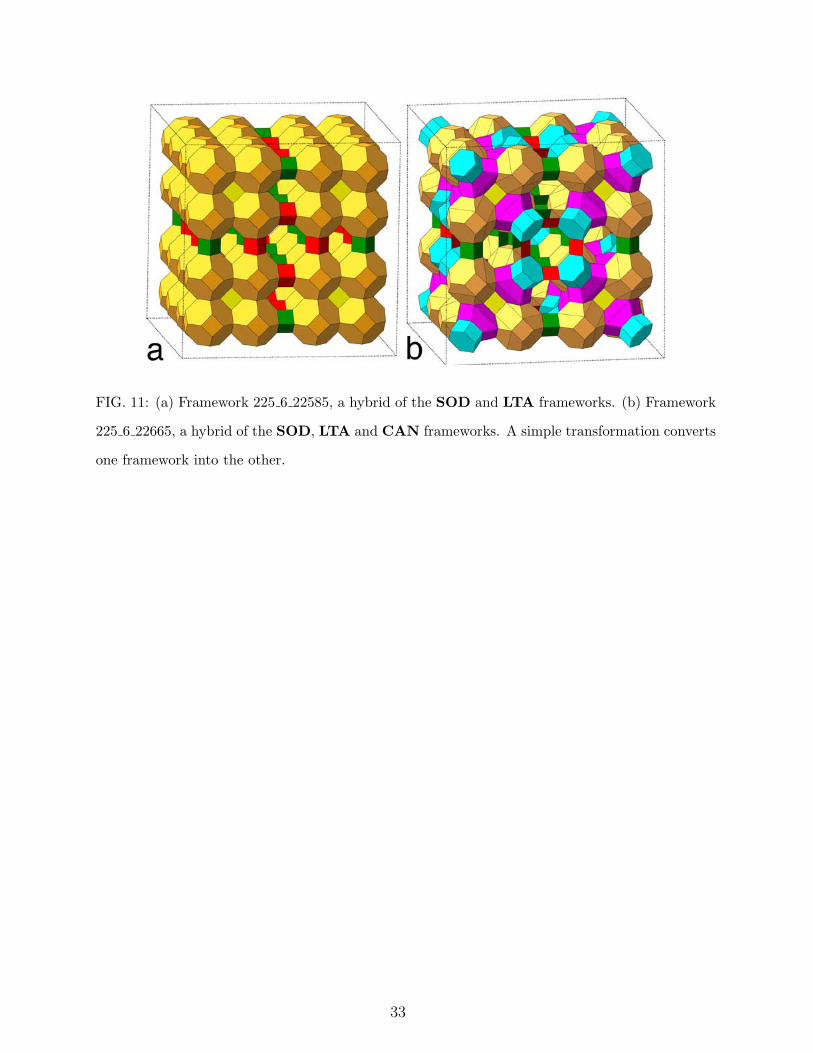
FIG. 11: (a) Framework 225 6 22585, a hybrid of the SOD and LTA frameworks. (b) Framework
225 6 22665, a hybrid of the SOD, LTA and CAN frameworks. A simple transformation converts
one framework into the other.
33
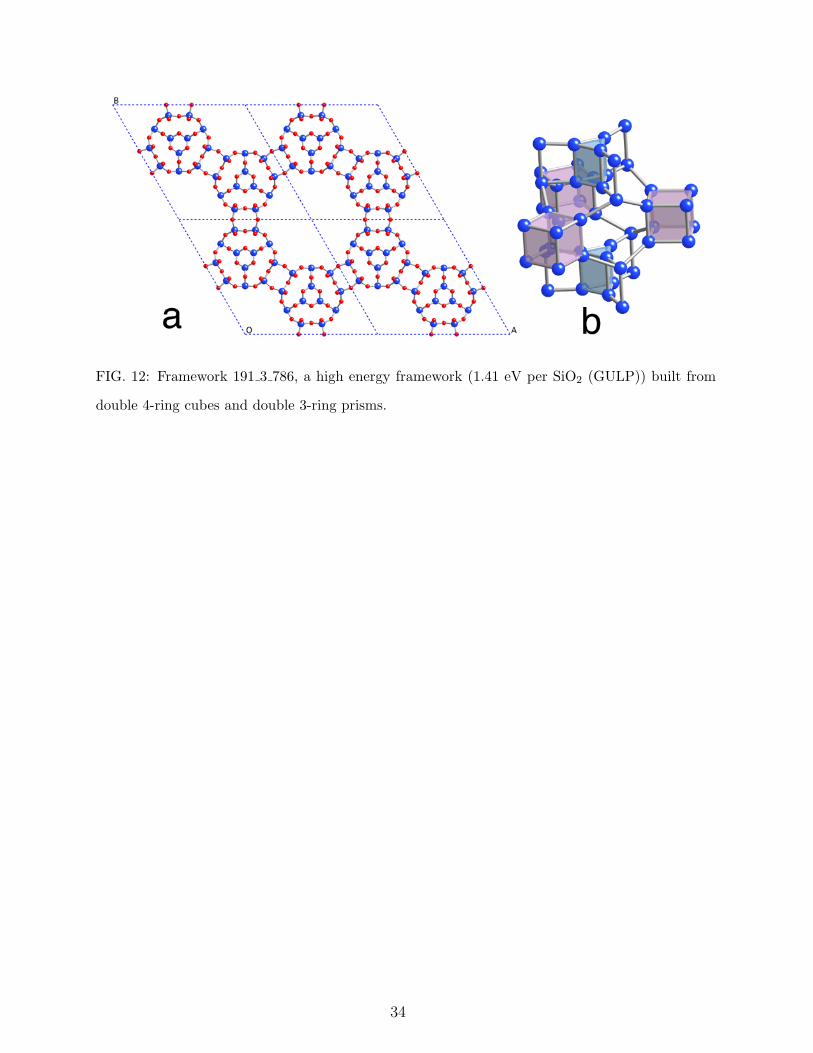
FIG. 12: Framework 191 3 786, a high energy framework (1.41 eV per SiO2 (GULP)) built from
double 4-ring cubes and double 3-ring prisms.
34