street people enumeration 18/19 - City of Cape Town
26
STREET PEOPLE ENUMERATION 18/19 SOCIAL DEVELOPMENT & EARLY CHILDHOOD DEVELOPMENT
-
Upload
khangminh22 -
Category
Documents
-
view
1 -
download
0
Transcript of street people enumeration 18/19 - City of Cape Town

STREET PEOPLE ENUMERATION 18/19
SOCIAL DEVELOPMENT & EARLY CHILDHOOD DEVELOPMENT

Terms and Definitions
• Street Person:
Refers to an individual, who for any reason use the outdoors as a place of abode for a lengthy period of time. The term “street” includes all areas of open spaces and river banks
• Day stroller:
Children and unemployed adults who come on to the streets during the day for the purpose of supplementing their income and go back to their community at night.
• Skarrel:
A colloquial term used by street persons to describe a method of income creation. This may include begging, washing and parking cars, collecting refuse items, digging through bins and pushing trolleys collecting items to be sold or recycled.
• Hot spot:
An area where there are regular complaints about street people or large concentrations of street people. For this study a hotspot refers to a space occupied by 30 or more street people.
• Shelter:
Temporary residence for homeless people.
2
Background
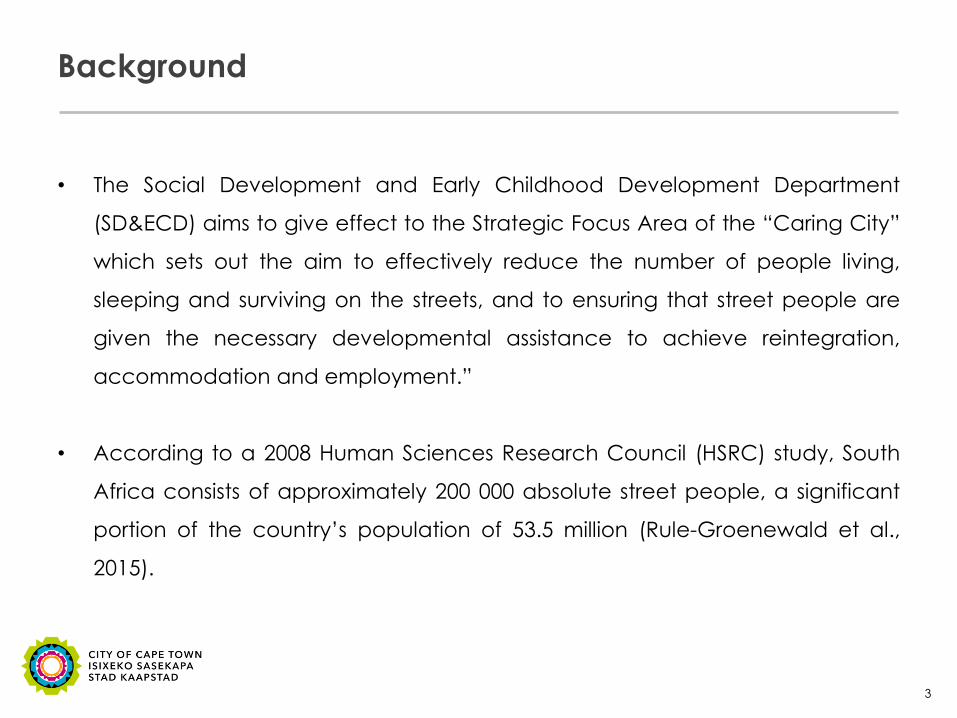
• The Social Development and Early Childhood Development Department
(SD&ECD) aims to give effect to the Strategic Focus Area of the “Caring City”
which sets out the aim to effectively reduce the number of people living,
sleeping and surviving on the streets, and to ensuring that street people are
given the necessary developmental assistance to achieve reintegration,
accommodation and employment.”
• According to a 2008 Human Sciences Research Council (HSRC) study, South
Africa consists of approximately 200 000 absolute street people, a significant
portion of the country’s population of 53.5 million (Rule-Groenewald et al.,
2015).
3

Aims and Objectives
• The objectives of the study were to:
Determine the number of people living and sleeping on the streets or shelters
in the City of Cape Town.
Determine the hotspot locations of street people in the City of Cape Town
4

Research Design
• Cross-sectional observational approach:
A cross-sectional study measures the prevalence of a population of interest at a specific
point in time. Often described as a “snapshot” of a population and is conducted in the
form of a survey.
Observational research is an approach in which descriptive information is recorded by
observing subjects in their natural setting, with no interaction required between the
observer and the subject.
Period Prevalence Count: minimize the risk of a misrepresentation of homeless populations
as the extended timeframe allows for a more thorough coverage of an area when
searching for homeless persons (NCH, 2007)
• Target Population:
Individuals who sleep on the street one or more nights of the week
Individuals utilizing shelters or transitional facilities (Ark, MES, Safe Space)
5

Data Collection
• The Enumeration took place between the 13th-30th November 2018.
• Enumeration teams were divided in the following way:
6
Team 1
•SDECD Research Staff
•1 EPWP Team Leader
•10 EPWP Fieldworkers
Team 2
•SDECD Research Staff
•1 EPWP Team Leader
•10 EPWP Fieldworkers
Team 3
•SDECD Research Staff
•1 EPWP Team Leader
•10 EPWP Fieldworkers
Team 4
•SDECD Research Staff
•1 EPWP Team Leader
•10 EPWP Fieldworkers
Support Staff
Safety and Security Staff
SDECD Field Officers
GIS Support

KEY FINDINGS

Overview
8
64.8%
33.7%
1.5%Street homeless
Sheltered homeless
Estimated homeless personsin crime hotspots
Total Homeless Persons Enumerated
Frequency Percentage of
Enumerated
Street homeless 3 999 64.8
Estimated homeless persons in
crime hotspots
92 1.5
Sheltered homeless 2 084 33.7
Grand Total 6 175 100.0

Crime Suburbs
9
• Suburbs not entered
• Estimates provided by Law Enforcement and SPU officials
• Zero denotes that
no estimate was available
Area Suburb Estimated Total
Area Central
Manenberg 50
Bonteheuwel 7
Belhar 5
Delft 5
Area North Kraaifontein 25
Area East Macassar 0
Area South
Pelikan Park 0
Philipi 0
Lavender Hill 0
Strandfontein 0
Total 92

Demographics: Living and sleeping on the street
10
7.3%
33.7%
29.0%
8.6%
2.5%0.2%
18 - 25 26 - 35 36 - 45 46 - 55 56 - 65 66+
Age
26.1%
55.1%
4.0%
14.7%
0.0
10.0
20.0
30.0
40.0
50.0
60.0
Black African Coloured White Unspecified
Race

Area Stats
11
Area North
reportedly has the
highest number of
street people (45%)
1796
292
965 946
0
200
400
600
800
1000
1200
1400
1600
1800
2000
AREA NORTH AREA EAST AREA CENTRAL AREA SOUTH
Per Area

Top 20 Wards
12

Top 5 Subcouncils
13
307
1275
358292 276
20 (SOUTH) 16 (NORTH) 6 (CENTRAL) 12 (SOUTH) 4 (CENTRAL)
No. of Street
People
Subcouncil
Top 5 Subcouncils

Top 3 Major Suburbs Comparison
14
MAJOR SUBURB NO OF STREET PEOPLE
Cape Town 871
Mitchells Plain 368
Bellville 333

Top 3 Sub-Places
15
No. of Street People
Major Suburb Suburb 2018
Cape Town Cape Town City Centre
Foreshore
Zonnebloem
377
178
118
Mitchells Plain Mitchells Plain CBD
Tafelsig
Lentegeur
134
106
54
Bellville Transnet Marshalling Yard
Hardekraaltjie
205
74
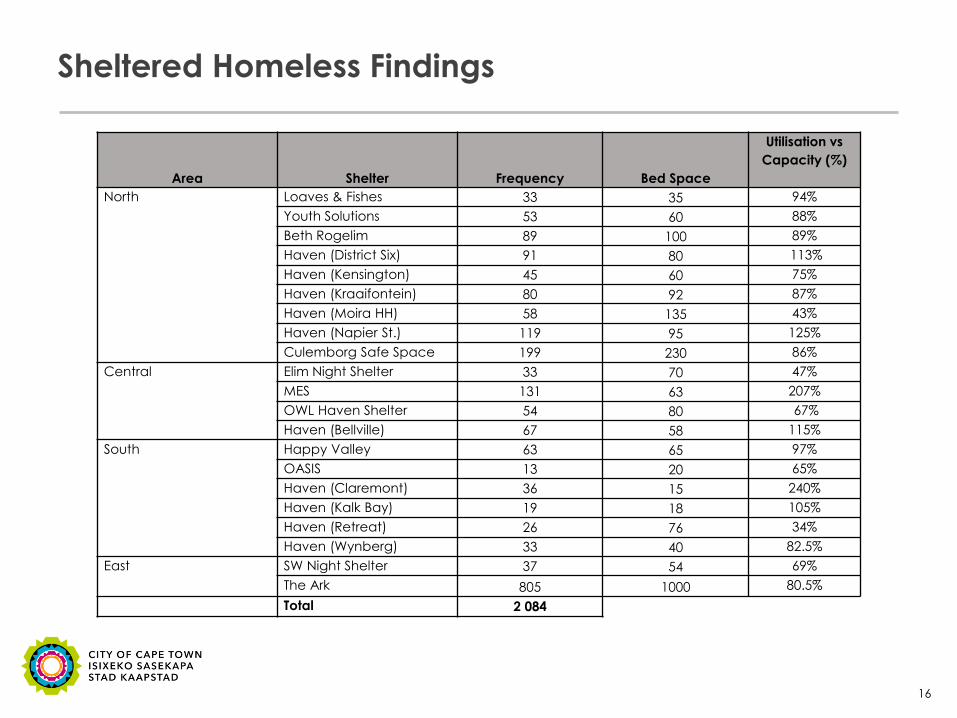
Sheltered Homeless Findings
16
Area Shelter Frequency Bed Space
Utilisation vs
Capacity (%)
North Loaves & Fishes 33 35 94%
Youth Solutions 53 60 88%
Beth Rogelim 89 100 89%
Haven (District Six) 91 80 113%
Haven (Kensington) 45 60 75%
Haven (Kraaifontein) 80 92 87%
Haven (Moira HH) 58 135 43%
Haven (Napier St.) 119 95 125%
Culemborg Safe Space 199 230 86%
Central Elim Night Shelter 33 70 47%
MES 131 63 207%
OWL Haven Shelter 54 80 67%
Haven (Bellville) 67 58 115%
South Happy Valley 63 65 97%
OASIS 13 20 65%
Haven (Claremont) 36 15 240%
Haven (Kalk Bay) 19 18 105%
Haven (Retreat) 26 76 34%
Haven (Wynberg) 33 40 82.5%
East SW Night Shelter 37 54 69%
The Ark 805 1000 80.5%
Total 2 084

Demographics: Sheltered homeless
17
The majority of homeless persons utilizing shelters are males (78%), adults and reported to be
predominantly Coloured.
.2%
23.4%
46.8%
3.8%.6%
25.3%
.0
5.0
10.0
15.0
20.0
25.0
30.0
35.0
40.0
45.0
50.0
ASIAN BLACK
AFRICAN
COLOURED FOREIGNER INDIAN WHITE
Race
6.6%
21.7%24.2% 23.6%
15.2%
7.5%
.9%
0.0
5.0
10.0
15.0
20.0
25.0
30.0
18-25 26-35 36-45 46-55 56-65 66+ UNKNOWN
Age

Location & Activity Observed
18
Places observed Frequency Percent
Abandoned
building94 2.4
Beach 62 1.6
Bus shelter 130 3.3
Bush 150 3.8
Fountains 6 .2
Intersection 12 .3
Liquor store 9 .2
Monuments 8 .2
Open Spaces 484 12.2
Other 65 1.6
Outside Police
Station45 1.1
Parking lot 312 7.8
Pavement 1 627 40.9
Religious institution 10 .3
Shopfront 60 1.5
Shopping mall 60 1.5
Taxi rank 43 1.1
Tourism Hotspots 17 .4
Traffic lights 22 .6
Train station 103 2.6
Bridge 566 14.2
Unspecified 114 2.9
Total 3 999 100.0
Activity observed Frequency Percent
Aggression15 .4
Begging37 .9
Gambling8 .2
Inebriated6 .2
Openly using
substances 50 1.3
Other23 .6
Sitting632 15.9
Skarreling501 12.6
Sleeping2 036 51.1
Strolling448 11.3
Unspecified123 3.1
Waste Picking120 3.0
Total3 999 100.0

EPIC Complaints Record – Nov 2018
19
Major Suburb Complaints
AIRPORT 1
ATHLONE 28
BELLVILLE 24
BERGVLIET 17
BISHOP LAVIS 1
BLACKHEATH 3
BLOUBERG 6
BRACKENFELL 3
BROOKLYN 6
CAMPS BAY 8
CAPE FARMS 3
CAPE POINT 1
CAPE TOWN 193
CONSTANTIA 3
DURBANVILLE 23
EERSTE RIVER 1
ELSIES RIVER 9
EVERSDAL 5
FISH HOEK 5
GOODWOOD 61
GORDONS BAY 9
GRASSY PARK 6
GREEN POINT 8
HOUT BAY 14
JOOSTENBERG VLAKTE 1
KALKSTEENFONTEIN 3
KENRIDGE 8
KOMMETJIE 2
KRAAIFONTEIN 12
KUILS RIVER 15
KUILSRIVER 4
LANSDOWNE 1
MAITLAND 3
MILNERTON 31
MITCHELLS PLAIN 10
MUIZENBERG 17
NEWLANDS 65
OBSERVATORY 7
OTTERY 11
PAARDEN EILAND 1
PAROW 34
PELIKAN PARK 1
PINELANDS 4
PLATTEKLOOF 5
PLUMSTEAD 34
RETREAT 4
RONDEBOSCH 4
SEA POINT 18
SIMONS TOWN 5
SOMERSET WEST 28
STRAND 20
TABLE MOUNTAIN 3
TABLE VIEW 26
TOKAI 1
VREDEKLOOF 2
WELGEMOED 15
WYNBERG 27
TOTAL 629

Top 10 areas with highest EPIC Complaints vs Enumerated
Street People
20
193
65 6134 34 31 28 28 27 26
871
31
170125
830
307
113
170136
0
100
200
300
400
500
600
700
800
900
1000
EPIC Complaints vs Enumerated
Complaints Enumerated

LIMITATIONS
• Areas or spaces that Law Enforcement advised as dangerous, due to high
levels of crime or gang violence, were entered with caution or completely
avoided wherein homeless persons could not be enumerated. However, the
SD&ECD Street People Unit provided the Research Unit with an estimated
number of street people found in the areas that were not covered
• As street people move around, there is a possibility that some individuals may
have relocated to previously enumerated areas, resulting in an under-count
or over-count in certain areas
• The number of street people counted in this study is a reflection of the
homeless situation during the month of November 2018. These numbers may
fluctuate seasonally and therefore cannot be generalized
22

RECOMMENDATIONS

• Policy Improvement
▫ Homelessness enumeration findings can be used to drive policy change
and identify where funds and resources need to be allocated e.g. safe
spaces.
▫ Homeless population statistics will enable all levels of government to make
necessary policy changes aimed at increasing or improving initiatives to
manage the homeless situation in the City of Cape Town.
24

• Future Interventions
▫ Future initiatives should focus on the holistic development of street people in order to increase
reintegration rates.
▫ Initiatives should be tailored to address newly homeless people to avoid them acclimatizing to
the streets vs chronic homeless persons requiring intense and prolonged assistance.
▫ An effective crisis response system and emergency beds should be implemented for newly
homeless people with an established point of contact
▫ Initiatives should provide assistance for the most vulnerable through long term social housing
and support services.
• Future Enumerations
▫ It is recommended for future research that biannual or seasonal Point-in-Time (PIT) counts be
conducted in order to make a comparison of findings.
25