PA 20, a semi-selective medium for isolation and enumeration of Pantoea ananatis
Upload
khangminh22Category
view
1download
0
ADGENE LABORATOIRE 1 rue des conquérants -14 220 THURY-HARCOURT www.adgene.fr – [email protected] – 02 31 15 62 80
RAPID’E.coli 2 for water testing for the enumeration of
Escherichia coli and coliforms in drinking water for human
consumption
Summary report- V0
April 2019
Quantitative method
Attestation n° BRD 07/20-03/11
BIORAD
3 boulevard Raymond Poincaré
92430 MARNES - LA - COQUETTE
FRANCE
This report includes 74 pages, including 9 appendices. Reproduction of this report is only permitted in
its full form
AFNOR Validation
Summary report
RAPID’ E.coli 2
V0 April 2019
2
PREAMBLE 4
1. DEFINITIONS 5
2. INTRODUCTION 6
3. MODIFICATIONS CHANGES SINCE THE PREVIOUS VALIDATION 7
3.1. HISTORY OF VALIDATION 7
3.2. MODIFICATIONS OR CHANGES 7
3.3. RECLAMATION 7
4. METHOD PROTOCOLS 8
4.1. REFERENCE METHOD 8
4.2. ALTERNATIVE METHOD 8
4.2.1. PRINCIPE OF ALTERNATIVE METHOD 8
4.2.2. PROTOCOL OF ALTERNATIVE METHOD 8
5. SUMMARY OF RESULTS OBTAINED DURING INITIAL VALIDATION AND RENEWAL 9
5.1. COMPARATIVE STUDY 9
5.1.1. RELATIVE ACCURACY 9
5.1.2. LINEARITY 15
5.1.3. DETECTION AND QUANTIFICATION LIMITS 17
5.1.4. INCLUSIVITY AND EXCLUSIVITY 19
5.1.5. PRACTICABILITY 21
5.1.6. CONCLUSION OF THE COMPARATIVE STUDY 23
5.2. INTERLABORATORY STUDY 25
5.2.1. STUDY ORGANIZATION 25
5.2.2. CONTROL OF EXPERIMENTAL PARAMETERS 25
5.2.3. RESULTS 27
5.2.4. CALCULATIONS 29
5.2.5. CONCLUSION OF THE INTERLABORATORY STUDY 33
APPENDIX 1 – NF EN ISO 9308-1:2000 STANDARD “WATER QUALITY 34
APPENDIX 2- FLOW DIAGRAM RAPID‘E.COLI 2 35
APPENDIX 3 – RELATIVE ACCURACY : ARTIFICIAL CONTAMINATIONS 36

AFNOR Validation
Summary report
RAPID’ E.coli 2
V0 April 2019
3
APPENDIX 4 – RELATIVE ACCURACY : RESULTS ET STATISTICS 39
APPENDIX 5– LINEARITY RAW DATA 56
APPENDIX 6 – RELATIVE LEVEL OF DETECTION STUDY RAW DATA: LOD-LOQ RESULTS 62
APPENDIX 7 – RELATIVE LEVEL OF DETECTION STUDY RAW DATA: SELECTIVITY
(INCLUSIVITY/EXCLUSIVITY) 63
APPENDIX 8 – ENUMERATIONS OF CULTURABLE MICRO-ORGANISMS (AT 22°C AND 36°C) 67
APPENDIX 9 – COLLABORATIVE LABORATORIES RESULTS AND SYNTHESIS 68

AFNOR Validation
Summary report
RAPID’ E.coli 2
V0 April 2019
4
Preamble
Studied method:
Rapid’E.coli 2
Validation standard:
Protocol for the validation of alternative (proprietary) methods against a reference method
Revision 2 – May 2013
Reference method:
NF EN ISO 9308-1:2000 standard “Water quality – Detection and enumeration of Escherichia
coli and coliform bacteria - Part 1: Membrane filtration method”.
Scope:
Waters for human consumption, with three types of matrices:
Water from wells, prings and boreholes
Bottled water : spring water, mineral and other water
Mains and drinking fountain water
Certification body:
AFNOR Certification (http://nf-validation.afnor.org/)
AFNOR Validation
Summary report
RAPID’ E.coli 2
V0 April 2019
5
1. Definitions
Comparative study:
The aim of the study is to measure the performance of the alternative method and, if neces-
sary, the reference method for the following parameters:
o Relative accuracy,
o Linearity,
o Detection and quantification limits, o Inclusivity and exclusivity.
Relative Detection Level (RLOD) study:
The detection level (LOD) is defined as the minimum concentration of organisms that gives
evidence of growth in a liquid medium, with a probability of P = 0.95 when they are inoculat-
ed in a defined culture medium and incubated under defined conditions. The relative detec-
tion level (RLOD) is defined as the ratio of the LOD of the alternative method to that of the
reference method.
Inclusivity and exclusivity study:
Inclusivity is the ability of the alternative method to detect the target analyte from a wide
range of strains. Exclusivity is the absence of interference by an appropriate range of non-
target strains of the alternative method.
Relative accuracy:
The relative accuracy is the level of correspondence between the response obtained with the
reference method and the response obtained with the alternative method on the same sam-
ples.
Practicability:
Practicability is the ability to use a method, defined by a set of criteria instructed by
the user’s name.

AFNOR Validation
Summary report
RAPID’ E.coli 2
V0 April 2019
6
2. Introduction
The report present the renewal study of the RAPID’E.coli 2 method for water testing for the
enumeration of Escherichia coli and coliforms
The RAPID’E.coli 2 for water method has been validated in March 2011 with certificate num-
ber BRD 07/20 – 03/11 for the detection and enumeration of E. coli and coliforms bacteria in
waters for human consumption with low levels of suspended solids, treated or not, according
to the validation protocol for an alternative commercial method as compared with a reference
method.
The method was compared to the method described in the standard NF EN ISO 9308-
1:2000.
The method has been renewed in June 2015. All raw results were reinterpreted according to
the version in force of the validation protocol, dated May 2013.
Results reported in the present report were obtained during the validation assays conducted
by the IPL Santé, Environnement Durables Nord within the framework of the NF Validation
trademark, according to the current requirements.
The following criteria were assessed during the study:
o Relative accuracy,
o Linearity,
o Detection and quantification limits,
o Inclusivity and exclusivity,
o Practicability.
The validation scope corresponds to waters for human consumption, with three types of ma-
trices:
o Water from wells, springs and boreholes
o Bottled water: spring water, mineral and other water
o Mains and drinking fountain water

AFNOR Validation
Summary report
RAPID’ E.coli 2
V0 April 2019
7
3. Modifications changes since the previous validation
3.1. History of validation Table 1: History of validation
Date Expert lab. Comments
March 2011 I.P.L Initial study
Validation on
o Water from wells, springs and boreholes
o Bottled water: spring water, mineral and
other water
o Mains and drinking fountain water
June 2015 I.S.H.A Renewal
New validation following AFNOR validation pro-
tocol V2.0 (10/2013) with data from I.P.L
March 2019 AdGENE Renewal
Reconduction with a minor modification The conditionnement of supplement is now pos-sible in 6 vials, for 200 ml bottles
3.2. Modifications or changes
The protocol of validation (AFNOR Validation Revision 2.0 from 10/2013) is the same as dur-
ing the previous renewal.
Commercial analysis method modification:
Bio-Rad now proposes a dehydrated supplement format allowing supplement 200 mL of agar
in addition to the supplement to supplement 100 mL of agar.
This modification is a minor modification. No additional test was done.
.
3.3. Reclamation
No complaint reached AFNOR since the last renewal validation.
AFNOR Validation
Summary report
RAPID’ E.coli 2
V0 April 2019
8
4. Method protocols
4.1. Reference method The reference method corresponds to NF EN ISO 9308-1:2000 standard “Water quality –
detection and enumeration of Escherichia coli and coliform bacteria - Part 1: Membrane filtra-
tion method”. (Appendix 1)
The standard test is based on membrane filtration, subsequent culture on a differential agar
medium and calculation of the number of target organisms in the sample.
4.2. Alternative method
4.2.1. Principe of alternative method
RAPID’E.coli 2 agar for water testing allows the direct and simultaneous enumeration (with-
out confirmation) of Escherichia coli and the total coliforms, by membrane filtration method.
The principle of the complete medium (supplemented RAPID’E.coli 2) relies on the simulta-
neous detection of two enzymatic activities: -D-Galactosidase (GAL) and -D-
Glucuronidase (GLUC) by two chromogenic substrates:
Cleavage of the GAL specific substrate leads to the formation of a precipitate giving a
green coloration of the positive colonies for this enzyme (coliforms),
Cleavage of the GLUC specific substrate leads to the formation of a precipitate giving
a pink coloration of the positive colonies for this enzyme (E. coli).
Coliforms (GAL+/GLUC-) form green colonies, and E. coli (GAL+/GLUC+) form blue to violet
colonies due to the superposition of both colorations.
4.2.2. Protocol of alternative method
The protocol of the alternative method is the following (Appendix 2):
Filtration of 100 mL of drinking tap water or 250 mL of bottled water on sterile filter
membrane (Ø 47 mm, 0.45 µm Millipore HAWG 047 Type HA),
Deposit of the membrane on the surface of the agar RAPID’E. coli 2 medium (square
side upper most),
Incubation of dishes at 36± 2°C for 21 ± 3 h,
Reading and interpretation: After incubation, read the dishes membranes upside and
proceed to count characteristic colonies:
o green colonies = coliforms (GAL+) other than E. coli,
o dark blue to violet/grey-blue colonies with possible violet halo surround-
ing the typical colonies = E. coli (GLA+/GLUC+)
Note: Total coliforms are enumerated by adding together blue and dark blue to violet
colonies and green colonies.
Within the framework of the study, the minimum time of incubation of 18 hours was
followed.

AFNOR Validation
Summary report
RAPID’ E.coli 2
V0 April 2019
9
5. Summary of results obtained during initial validation
and renewal
5.1. Comparative study
5.1.1. Relative accuracy
The accuracy is the closeness of agreement between a test result and the accepted refer-
ence value.
The relative accuracy is the level of connection between the answer obtained with the refer-
ence method and the answer obtained with the alternative method on the same samples.
The value of the accepted reference is chosen as being the value obtained by the reference
method.
Number and nature of samples
In 2011, according to the reference document in force, two categories of water (naturally con-
taminated or spiked samples with E. coli or coliform bacteria) have been analyzed in dupli-
cate according to the two methods:
o Reference method: NF EN ISO 9308-1 :2000,
o Alternative method: RAPID’E.coli 2 for Water method.
The categories and the types of samples studied were the following:
o Treated waters with low levels of suspended solids (mains water),
o Not treated waters with low levels of suspended solids (mineral water, source water,
well water/groundwater).
In total, 66 samples were analyzed so as to obtain at least 20 usable results per method in
each water type and per tested parameter.
According to the updated validation repository, these two categories merged in only one:
waters for human consumption. The samples are distributed as following:
Table 2: Samples distribution for coliform bacteria and Escherichia coli
Parameter Analyzed samples Exploited samples
Total coliforms 66 43
Escherichia coli 66 36
AFNOR Validation
Summary report
RAPID’ E.coli 2
V0 April 2019
10
The samples for which the results were uninterpretable, presented:
o Uninterpretable enumerations on the standard agar, due to an important interfering
flora on 3 samples (B07, B09 and B10),
o An uninterpretable enumeration on the standard agar and <1 CFU/100 mL for a repli-
cate of the alternative method on 1 sample (B08),
o Enumerations higher than 100 CFU/100 mL or 250 mL with both methods on 6 sam-
ples (B01, B34, B44, B45, B112 and B113),
o Enumerations higher than 100 CFU/100 mL with the standard agar and uninterpreta-
ble with alternative method on 3 samples (B114, B115, B119),
o Enumerations <1 CFU/100 mL with both methods on 5 samples (B35, B122, B123,
B126 and B132).
o Enumerations inferior to 1 CFU/100 mL or 250 mL with the reference method on 5
samples (B11, B12, B13, B14 and B43),
o Interpretable enumerations with the reference method and <1 CFU/100 mL for one
replicate of the alternative method on 1 sample (B161).
o Results inferior to 4 CFU/100 or 250 mL (presence of the bacteria but not quantifiable)
by any method for the other non-exploited results.
Artificial contamination of the samples
In a mandatory point of view, according to the 2009/54/CE Directive on June 18th 2009, bot-
tled waters have to be free of E. coli and coliforms in a 250 mL water sample (threshold <1
UFC in 250 mL).
In the context of the validation study, artificial spikings were thus necessary to obtain a suffi-
cient number of positive water samples.
Artificial contaminations were achieved by using:
o Stressed contaminating suspensions of E. coli or coliform bacteria, whose stress
treatment and efficiency were determined,
o Naturally contaminated waters (contamination by mix).
For coliforms parameter, 48 out of 50 results were processed with artificial spikings, repre-
sented a percentage of artificial spiking of 96%.
For E. coli parameter, all results were processed with artificial spikings (100% of artificial
spiking).
The detail of the artificial contaminations is in Appendix 3.
Raw data
Each sample was analyzed in duplicate by the alternative method and the reference method.
Following the EN ISO 16140 standard, the values for each sample were plotted on a two-
dimensional graph. The vertical axis (y) is used for the alternative method and the horizontal
axis (x) for the reference method.
AFNOR Validation
Summary report
RAPID’ E.coli 2
V0 April 2019
11
The data were then tested by a linear regression program in order to determine the intercept
value (a) and the slope value (b).
The relative accuracy relationship is evaluated according to the model: y = bx + a.
For each of the two methods, robust repeatability standard deviations were calculated (sr(x)
and Rob.sr(x) & sr(y) and Rob.sr(y)).
As a function of the ratio of these standard deviations, R = sr(y) / sr(x) and Rob.R = Rob.sr(y)
/ Rob.sr(x), the linear regression to be used for the interpretation is defined in the EN ISO
16140 standard.
Synthesis of results is presented in Appendix 4.
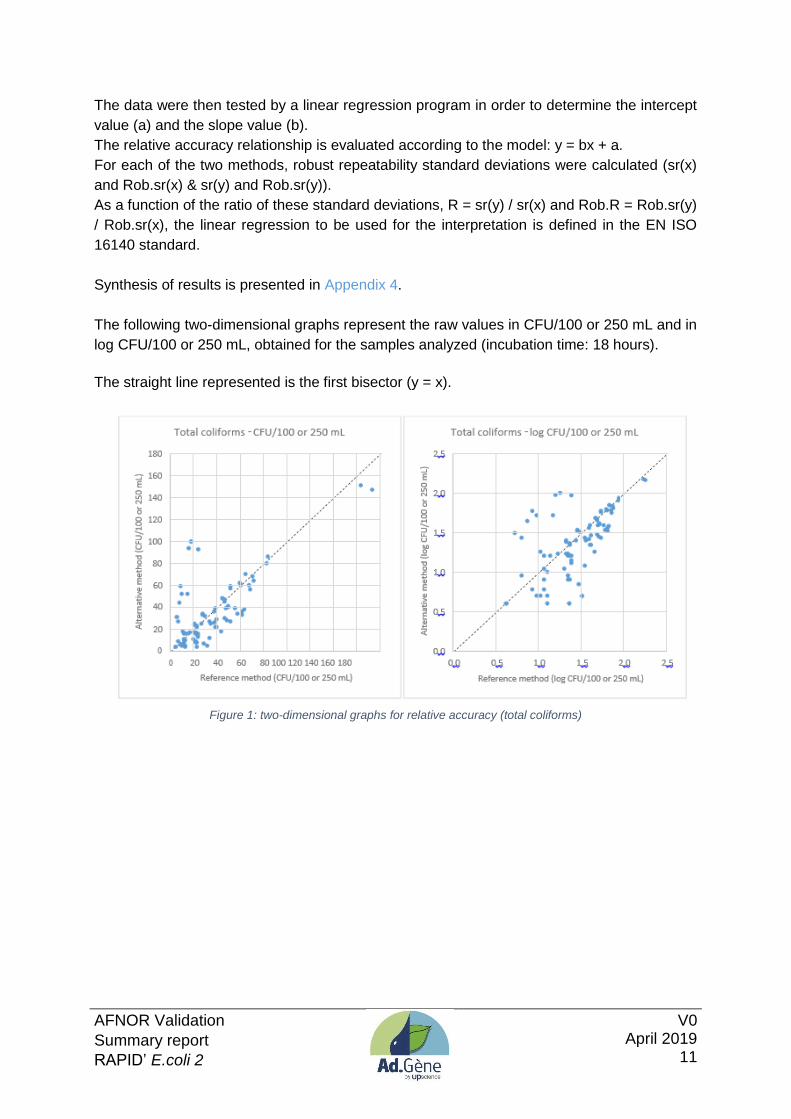
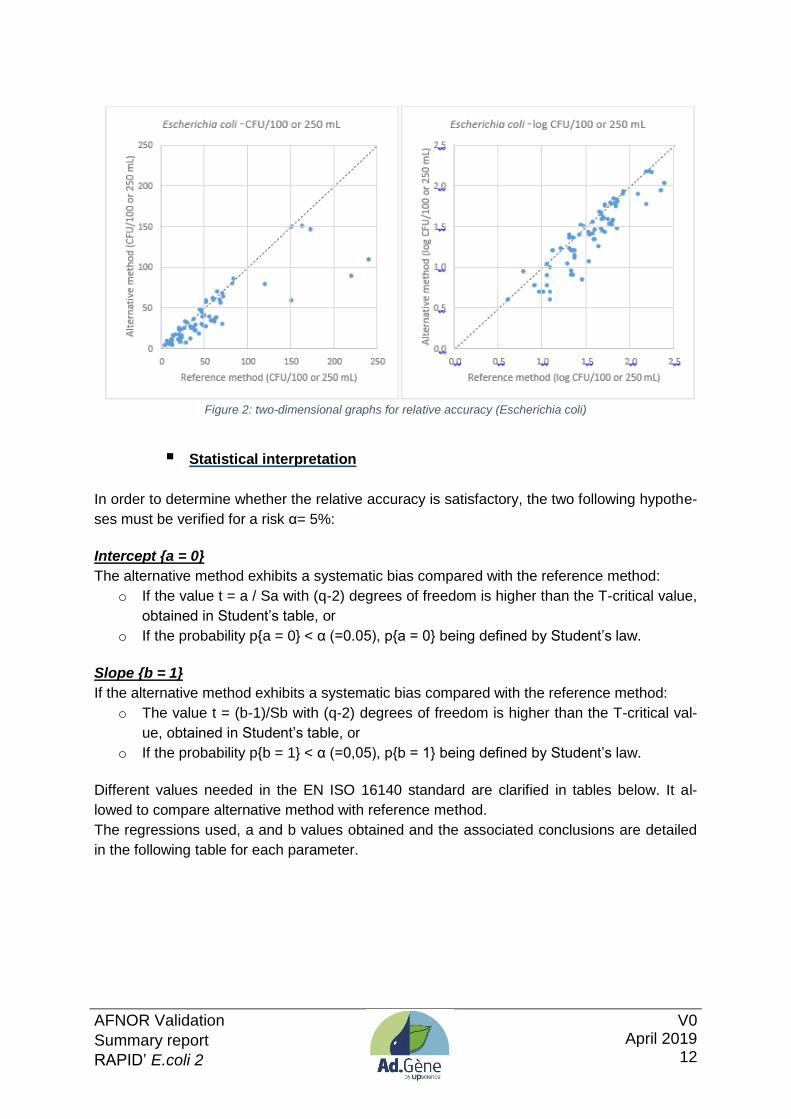
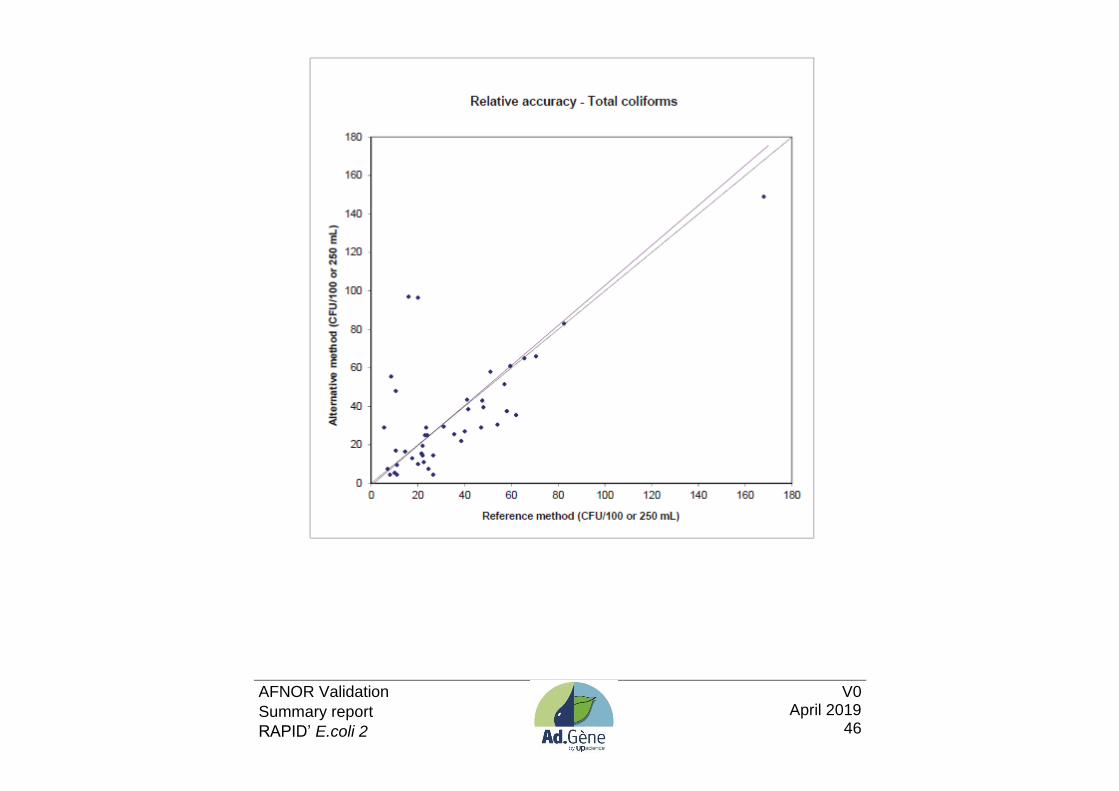
The following two-dimensional graphs represent the raw values in CFU/100 or 250 mL and in
log CFU/100 or 250 mL, obtained for the samples analyzed (incubation time: 18 hours).
The straight line represented is the first bisector (y = x).
Figure 1: two-dimensional graphs for relative accuracy (total coliforms)
AFNOR Validation
Summary report
RAPID’ E.coli 2
V0 April 2019
12
Figure 2: two-dimensional graphs for relative accuracy (Escherichia coli)
Statistical interpretation
In order to determine whether the relative accuracy is satisfactory, the two following hypothe-
ses must be verified for a risk α= 5%:
Intercept {a = 0}
The alternative method exhibits a systematic bias compared with the reference method:
o If the value t = a / Sa with (q-2) degrees of freedom is higher than the T-critical value,
obtained in Student’s table, or
o If the probability p{a = 0} < α (=0.05), p{a = 0} being defined by Student’s law.
Slope {b = 1}
If the alternative method exhibits a systematic bias compared with the reference method:
o The value t = (b-1)/Sb with (q-2) degrees of freedom is higher than the T-critical val-
ue, obtained in Student’s table, or
o If the probability p{b = 1} < α (=0,05), p{b = 1} being defined by Student’s law.
Different values needed in the EN ISO 16140 standard are clarified in tables below. It al-
lowed to compare alternative method with reference method.
The regressions used, a and b values obtained and the associated conclusions are detailed
in the following table for each parameter.

AFNOR Validation
Summary report
RAPID’ E.coli 2
V0 April 2019
13
Table 3: Coliforms and E.coli relative accuracy parameters per 100 or 250 ml of water (R: regression used)
Parameter
Rob.
R
R
a
t(a)
p
(t;a=0)
%
b
t(b)
p
(t;b=1)
%
Conclusion
Coliforms
(CFU)
1,333 GMF
R
-1,154 0,217 82,8 1,040 0,322 74,9 {a=0} accepted
{b=1} accepted
Coliforms
(log CFU)
1,044 GMF
R
-0,246 0,450 65,4 1,154 0,948 34,6 {a=0} accepted
{b=1} accepted
E. coli
(CFU)
1,333 GMF
R
1,875 0,598 55,2 0,710 5,661 0,0 {a=0} accepted
{b=1} rejected
E. coli
(log CFU)
1,665 GMF
R
-0,263 1,294 20 1,080 1,168 24,7 {a=0} accepted
{b=1} accepted
The equations of regression lines obtained are the following:
o coliform bacteria: Alt = 1,040 Ref – 1,154
log(Alt) = 1,154 log(Ref) – 0,246
o Escherichia coli: Alt = 0,710 Ref + 1,875
log(Alt) = 1,080 log(Ref) – 0,263
Other parameters were presented in the following tables:
o the limits of robust repeatability (log values) obtained for the alternative method and
the reference method,
o the bias between the two methods (alternative method –reference method)
They are presented in the tables below for the two parameters: coliform bacteria and Esche-
richia coli. Table 4: Limits of robust repeatability (log values) and biais
Parameter
Robust repeatability Bias (D) (alternative-
reference)
r
Rob.r
Average
Median Ref. Alt. Ref. Alt.
Coliforms
UFC/100 or 250 mL 11,8 13,8 8,8 11,7 0,2 -4,5
Coliforms
log UFC/100 or 250
mL
0,243 0,254 0,150 0,213 -0,028 -0,052
E. coli
UFC/100 or 250 mL 42,8 32,9 8,8 11,7 -12,6 -6,0
E. coli
log UFC/100 or 250
mL
0,258 0,284 0,137 0,228 -0,140 -0,131

AFNOR Validation
Summary report
RAPID’ E.coli 2
V0 April 2019
14
For coliforms, the hypothesis is statistically accepted at a 5% α risk both for results ex-
pressed in CFU/100 or 250 mL and in log CFU/100 or 250 mL. The calculated limits of re-
peatability are similar for both methods (0,15 log CFU/100 mL or 250mL for reference method
and 0,21 log CFU/ 100 or 250 mL for alternative method). The median bias calculated be-
tween the alternative method and the reference method is about -0,05 log CFU/100 or 250
mL.
For E. coli, only the hypothesis {b=1} is statistically rejected for an expression of the results in
CFU/100 or 250 mL. For this parameter, the correlation coefficient is however quite good (r =
0,907).Other hypotheses are accepted. The calculated limits of repeatability are similar for
both methods (0,14 log CFU/100 mL or 250mL for reference method and 0,23 log CFU/ 100
or 250 mL for alternative method). The median bias calculated between the alternative meth-
od and the reference method is about -0,13 log CFU/100 or 250 mL.
In conclusion for the both parameters, the correlation between the reference method
and the alternative method is satisfactory even if a weak but systematic bias is ob-
served between the two methods.
Limits of repeatability are between 0,21 – 0,23 log CFU/100 or 250 mL and 0,14 – 0,15
log CFU/100 or 250 mL respectively for the alternative method and the reference meth-
od.
The bias are between -0,13 and -0,05 log CFU/100 or 250 mL.

AFNOR Validation
Summary report
RAPID’ E.coli 2
V0 April 2019
15
5.1.2. Linearity
The linearity is the ability of the method when used with a given matrix to give results that are
in proportion to the amount of analyte present in the sample, that is an increase in analyte
corresponds to a linear or proportional increase in results.
Nature of the tests
In 2011, two types of water were chosen in both categories of waters with a low level of sus-
pended solids, in order to determine two levels of contamination by category, homogeneous-
ly distributed in the whole range of contaminations usually found in these waters for human
consumption and including mandatory limits if existing and the maximum of the scope of ap-
plication.
No statistical interpretation was realized from the data obtained. The following waters were
contaminated by coliform bacteria:
Table 5: Matrix and strains for linearity
Water Origin Strain Origin
Tap water Laboratory, Lille E. coli Mains water, Bruille St Amand (59)
Mineral water Mineral water E. coli Well water, Lille (59)
The contamination levels were distributed between 5 and 200 in 100 or 250 mL according to
the type of water:
o Level 1:
o Level 2:
5 to 10
20
bacteria/100 mL and bacteria/250 mL
bacteria /100 mL and bacteria/250 mL
o Level 3: 200 bacteria /100 mL and bacteria/250 mL
For each category of water and each contamination level, the alternative and the reference
methods were performed with two repetitions.
For the renewal study of 2015, the two kinds of water were kept to realize a statistical inter-
pretation.
Raw data
Raw results are presented in Appendix 5.
The values for each sample were plotted on a two-dimensional graph. The vertical axis (y) is
used for the alternative method and the horizontal axis (x) for the reference method. The data
were then tested by a linear regression program in order to determine the intercept value (a)
and the slope value (b), like in the relative accuracy part.
The following graphs represent the raw values obtained for each water testing.

AFNOR Validation
Summary report
RAPID’ E.coli 2
V0 April 2019
16
Figure 3: two-dimensional graphs for linearity (Escherichia coli in mineral water)
Statistical interpretation
Statistical analysis is presented in Appendix 6. Table 6: Linearity statistical data of the couple matrix-strains analyzes
Type
Rob.
R
Regres
gres-
sion
used
F
criti-
cal
Rob. F P
(Rob.F)
Correla-
tion
coefficient
(r)
Regression
line
Tap water –
CFU/100 mL 0,429 OLS2 4,53 66,1 0,004 0,999
0,998 Ref +
4,313
Tap water – log
CFU/100 mL 0,460 OLS2 4,53 69,9 0,004 0,995
0,935 log
Ref + 0,158
Mineral water -
CFU/250 mL 0,333 OLS2 4,53 256,1 0,001 1,000
1,054 Ref –
4,347
Mineral water –
log CFU/250 mL 0,719 GMFR 4,53 30,4 0,012 0,994
1,030 log
Ref – 0,083
The relationship between the 2 methods is not linear:
o if Rob.F > critical F or,
o if P (Rob.F) < α (= 0,05).
In conclusion, the relationships between the two methods are not linear for the two
kinds of matrices tested. However, the correlation coefficient between the two sets of
results and the equation for the regression line are satisfactory.
The linearity of the alternative method is satisfactory.

AFNOR Validation
Summary report
RAPID’ E.coli 2
V0 April 2019
17
5.1.3. Detection and quantification limits
Detection and quantification limits were studied according to EN ISO 16140 standard on
Technical Committee request.
Detection (LOD) and quantification (LOQ) limits were determined by analysis of pure culture
of E. coli with alternative method.
Overall, the critical level (LC) and the detection limit (LOD) involved two types of statistical
errors: α (to detect a difference which doesn’t exist (false positive) and (to not detect a true
difference (false negative)).
The power 1- is the probability to detect a value higher than LC.
The critical level is LC: 1,65.s0 (+ x0 for the alternative method), with = 5% (and 1-= 50%).
The detection limit is LOD: 3,3.s0 (+ x0 for the alternative method), with = 5 % and 1-= 95 %.
The determination (or quantification) limit is LOQ = 10.s0 (+ x0 for the alternative method),
with s0 corresponding to the standard deviation of determinations and x0 to the bias.
Five levels of inoculation were tested, with six replicates by level. Results are synthesized in
tables below and raw results are in Appendix 7.
Results
Results for tap water Table 7: Detection results for the enumeration of E.coli in tap water
Level / 100 mL Positive samples number Standard deviation s0 Bias x0 (x0i median)
0,00 0/6 / /
0,18 0/6 0,00 0,00
0,22 1/6 0,41 0,00
0,50 4/6 1,38 1,50
1,44 6/6 1,05 2,50
From s0 and x0 values obtained for the first level, the critical limit (LC), the detection limit
(LOD) and the quantification limit (LOQ) were determined: Table 8: Results of LC, LOD and LOQ for the detection of E.coli in tap water
Formula Value obtained (CFU/100 mL)
LC 1,65 s0 + x0 4
LOD 3,3 s0 + x0 6
LOQ 10 s0 + x0 15

AFNOR Validation
Summary report
RAPID’ E.coli 2
V0 April 2019
18
Results for mineral water Table 9: Detection results for the enumeration of E.coli in mineral water
Level / 250
mL
Positive samples number Standard deviation s0 Bias x0 (x0i median)
0,00 0/6 / /
0,05 2/6 0,52 0,00
0,52 2/6 0,52 0,00
0,71 4/6 0,75 1,00
1,03 6/6 1,21 2,50
From s0 and x0 values obtained for the first level, the critical limit (LC), the detection limit
(LOD) and the quantification limit (LOQ) were determined: Table 10: Results of LC, LOD and LOQ for the detection of E.coli in mineral water
Formula Value obtained (CFU/250 ml)
LC 1,65 s0 + x0 2
LOD 3,3 s0 + x0 3
LOQ 10 s0 + x0 9
AFNOR Validation
Summary report
RAPID’ E.coli 2
V0 April 2019
19
5.1.4. Inclusivity and exclusivity
Inclusivity and exclusivity of the alternative method were studied by analysis of 20 strains of
E. coli and 23 strains of coliform bacteria other than E. coli (target microorganisms) and 32
strains known to cause interference or naturally present in test material (non-target microor-
ganisms).
Protocol
Protocol for inclusivity
Each strain of E. coli or coliform has been cultivated in TCS broth for 20 hours at 37°C.
Different dilutions were realized in tryptone-salt, to obtain between 10 and 100 cells in 100
mL before application of RAPID’E.coli 2 for Water method and reference method.
Note: When the alternative method gives false negative or doubtful results, the strain shall be
tested once more with the reference method.
Protocol for exclusivity
The different strains were cultivated and diluted in TCS broth (20 h at 37°C), to obtain 103-
105 cells in 100 mL before analysis according to RAPID’E.coli 2 for Water method.
Note: When the alternative method gives positive or doubtful results with non-target microor-
ganisms, the test shall be repeated using the complete protocol of RAPID’E.coli 2 for Water
method. The reference method shall be performed only once.
Results and interpretation
Results are listed in Appendix 7.
The 20 E. coli strains tested were detected by the RAPID’E.coli 2 for Water method.
Among the 23 coliforms strains other than E. coli, one strain was not detected. It was a Haf-
nia alvei strain, isolated from food, which had already given similar results with non-
supplemented RAPID’E.coli 2 in food microbiology (renewal of alternative method in 2008,
reference document REC2 Coliforms-renewal 2008-11 v01).
This strain presented non characteristic white colonies (GAL-/GLUC-). On TTC-tergitol agar,
colonies were characteristic (lactose +).
Two Hafnia alvei strains (isolated from parsley) presented characteristic colonies colored in
pale turquoise.
An Escherichia hermanii strain presented pale blue colonies.
AFNOR Validation
Summary report
RAPID’ E.coli 2
V0 April 2019
20
Out of the 32 non target strains tested, 3 strains were detected by the RAPID’E.coli 2 for Wa-
ter method. The strains were the following:
One Erwinia spp strain from food origin (green colonies GAL+/GLUC- on RAP-
ID’E.coli 2 and non characteristic on TTC-tergitol),
One Salmonella enterica subsp.diarizonae strain (characteristic violet colonies
GAL+/GLUC+, and non characteristic on TTC-tergitol),
One Shigella sonnei strain from food origin (dark blue colonies GAL+/GLUC+, non
characteristic on TTC-tergitol).
The 2 Salmonella and Shigella strains gave similar results on non-supplemented RAP-
ID’E.coli 2 (renewal of alternative method 2008 – food testing scope).
And the Erwinia strain presented grey-white colonies on non-supplemented RAPID’E.coli 2.
All the 29 other strains did not present any characteristic aspect on RAPID’E.coli 2 for Water
Testing method, either there was no growth (18 strains), or they presented very small non
characteristic colonies (11 strains).
In conclusion , the Inclusivity is then satisfactory and In exclusivity, cross-reactions
were observed with a Salmonella strain and a Shigella sonnei strain owning -D-
Galactosidase and -D-Glucuronidase activities (GAL+/GLUC+), and an Erwinia spp
strain
AFNOR Validation
Summary report
RAPID’ E.coli 2
V0 April 2019
21
5.1.5. Practicability
Practicability is assessed according to criteria which are defined by the AFNOR Technical
Committee. The RAPID’E.coli 2 for water method is compared to the reference method NF
EN ISO 9308-1 in terms of 13 criteria. They are informed below:
Criterion Communication on the criterion
Packaging
Reagents volumes
RAPID’E.coli 2 Agar
Ø 55 mm × 20 Petri dishes (code 3563982)
- 100 ml x 6 vials (code 3555299)
- 200 ml x 6 vials (code 3555297)
- 500 g (code 3554024)
6 vials of supplement × 1 box (code 3555298) RAPID’E.coli 2 kit for
water testing (code 3555296) :
6 vials × 100 mL RAPID’E.coli 2 medium
6 vials of supplement × 1 box (1 vial contains lyophilized in sufficient
quantity for 100 mL of RAPID’E.coli 2 medium
3.Storage conditions –
Expiration date of uno-
pened
tests)
Ready-to-use plates and lyophilized must be kept at +2-8°C in a
dark place. Expiration date and batch number are shown on each
plate or vial.
4.Utilization procedure
after first utilization
Re-hydrated vial must be kept 7 days at +2 - 8°C in a dark place.
Petri dishes prepared by the user must be kept 3 days at +2-8°C in a
dark place.
5. Specific necessary
Equipment and premis-
es
Normal configuration of and common material of a laboratory of
microbiology.
6. Ready for use rea-
gents or to restore
Reconstitution of supplement RAPID’E.coli 2: addition of 1.1 mL of
distilled water to the bottle under aseptic conditions, shaking until the
lyophilisat is completely dissolved.
Preparation of complete medium (RAPID’E.coli 2 + supplement):
under aseptic conditions, addition of 1.0 mL of rehydrated (or unfro-
zen) RAPID’E.coli
2 supplement to 100 mL of sterile RAPID’E.coli 2 medium cooled
and maintained at 47±2 °C. Note: 0.1 mL remains in the vial.
Shake as to homogenize thoroughly. Pour approximatively 9 mL of
the complete medium per sterile Petri dish (Ø 55 mm). Leave to so-
lidify on a cool, level surface.
7. Duration of training
for a non-initiated opera-
tor
For an operator trained in standard techniques of water microbiolo-
gy,training in the technique requires less than 1 day.
AFNOR Validation
Summary report
RAPID’ E.coli 2
V0 April 2019
22
Criterion
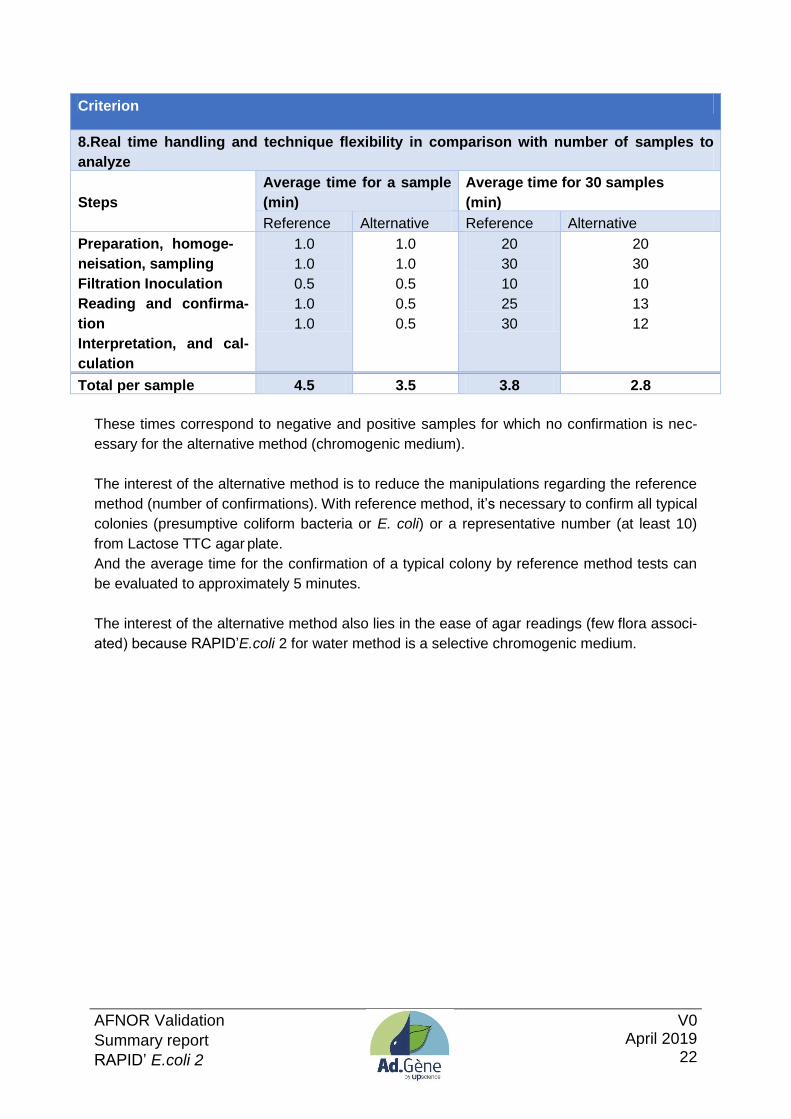
8.Real time handling and technique flexibility in comparison with number of samples to
analyze
Steps
Average time for a sample
(min)
Average time for 30 samples
(min)
Reference Alternative Reference Alternative
Preparation, homoge-
neisation, sampling
Filtration Inoculation
Reading and confirma-
tion
Interpretation, and cal-
culation
1.0
1.0
0.5
1.0
1.0
1.0
1.0
0.5
0.5
0.5
20
30
10
25
30
20
30
10
13
12
Total per sample 4.5 3.5 3.8 2.8
These times correspond to negative and positive samples for which no confirmation is nec-
essary for the alternative method (chromogenic medium).
The interest of the alternative method is to reduce the manipulations regarding the reference
method (number of confirmations). With reference method, it’s necessary to confirm all typical
colonies (presumptive coliform bacteria or E. coli) or a representative number (at least 10)
from Lactose TTC agar plate.
And the average time for the confirmation of a typical colony by reference method tests can
be evaluated to approximately 5 minutes.
The interest of the alternative method also lies in the ease of agar readings (few flora associ-
ated) because RAPID’E.coli 2 for water method is a selective chromogenic medium.
AFNOR Validation
Summary report
RAPID’ E.coli 2
V0 April 2019
23
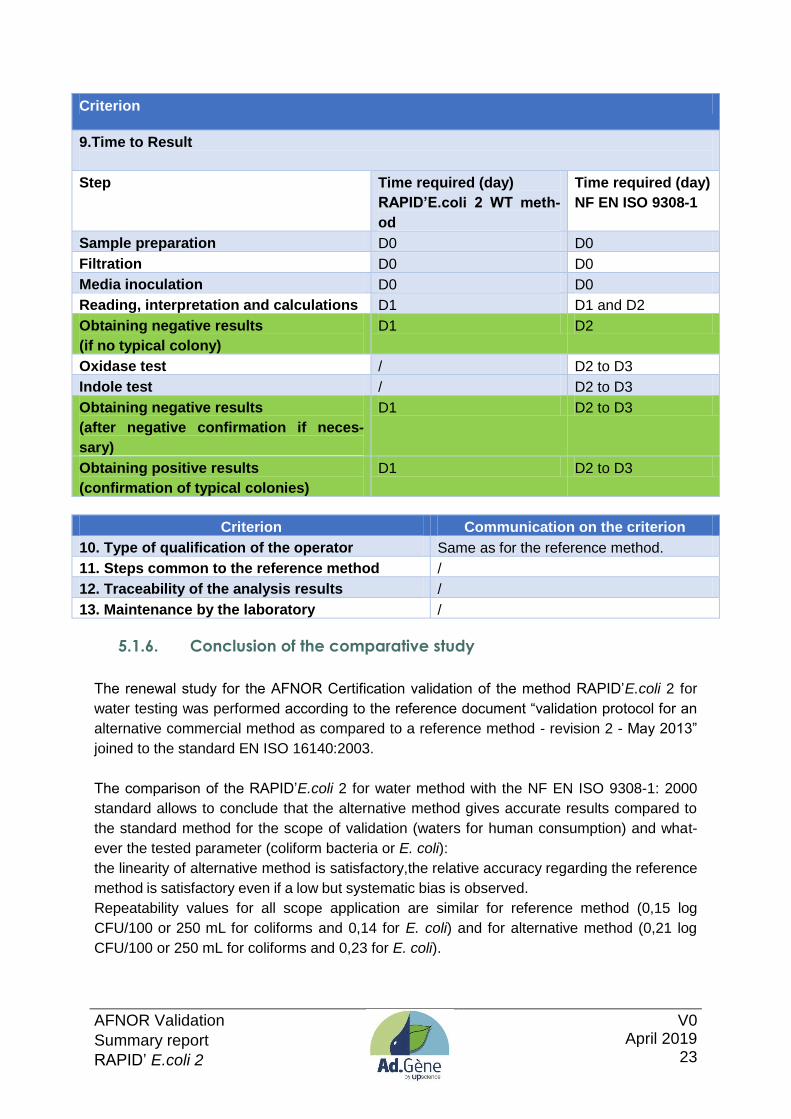
Criterion
9.Time to Result
Step Time required (day)
RAPID’E.coli 2 WT meth-
od
Time required (day)
NF EN ISO 9308-1
Sample preparation D0 D0
Filtration D0 D0
Media inoculation D0 D0
Reading, interpretation and calculations D1 D1 and D2
Obtaining negative results
(if no typical colony)
D1 D2
Oxidase test / D2 to D3
Indole test / D2 to D3
Obtaining negative results
(after negative confirmation if neces-
sary)
D1 D2 to D3
Obtaining positive results
(confirmation of typical colonies)
D1 D2 to D3
Criterion Communication on the criterion
10. Type of qualification of the operator Same as for the reference method.
11. Steps common to the reference method /
12. Traceability of the analysis results /
13. Maintenance by the laboratory /
5.1.6. Conclusion of the comparative study
The renewal study for the AFNOR Certification validation of the method RAPID’E.coli 2 for
water testing was performed according to the reference document “validation protocol for an
alternative commercial method as compared to a reference method - revision 2 - May 2013”
joined to the standard EN ISO 16140:2003.
The comparison of the RAPID’E.coli 2 for water method with the NF EN ISO 9308-1: 2000
standard allows to conclude that the alternative method gives accurate results compared to
the standard method for the scope of validation (waters for human consumption) and what-
ever the tested parameter (coliform bacteria or E. coli):
the linearity of alternative method is satisfactory,the relative accuracy regarding the reference
method is satisfactory even if a low but systematic bias is observed.
Repeatability values for all scope application are similar for reference method (0,15 log
CFU/100 or 250 mL for coliforms and 0,14 for E. coli) and for alternative method (0,21 log
CFU/100 or 250 mL for coliforms and 0,23 for E. coli).
AFNOR Validation
Summary report
RAPID’ E.coli 2
V0 April 2019
24
The average bias between the two methods (alternative method-reference method) is nega-
tive but quite low (-0,05 log CFU/100 or 250 mL for coliforms and -0,13 log CFU/100 or 250
mL for E. coli).
Twenty strains of E. coli and 22 coliforms strains (target strains) were detected, except one
strain of Hafnia alvei (foodborne origin).
In exclusivity, among 32 strains of non-target microorganisms, three cross reactions were
observed with one strain of Salmonella enterica subsp.diarizonae (IIIb), one strain of Shigella
sonnei, and one strain of Erwinia spp.

AFNOR Validation
Summary report
RAPID’ E.coli 2
V0 April 2019
25
5.2. Interlaboratory study
The aim of the interlaboratory study was to determine the variability of the results obtained in
different laboratories using identical samples and to compare these results with those ob-
tained during the methods comparison study.
The interlaboratory study was conducted in 2011 according to the validation protocol applied
to microbiological water analysis – revision 1 – May 2010.
5.2.1. Study organization
Sixteen (16) laboratories took part in the interlaboratory study.
Spring water has been inoculated by an E. coli strain, isolated from a non-bottled spring wa-
ter.
Sixteen samples were prepared per laboratory (4 levels of contamination, two samples per
inoculation level and for each method).
Interlaboratory study laboratories and the expert laboratory have carried out the analyses with
the alternative and reference methods.
The analyses have been performed one day after sending the samples.According to shipping
and temperature conditions, the results of 13 laboratories have been included in the statisti-
cal interpretations.
5.2.2. Control of experimental parameters
Strain stability during transport
In order to evaluate the E. coli strain variability during transport, bacterial counts of inoculat-
ed water have been checked at different time, during storage at 4°C.
Results (CFU/100 mL) on Lactose TTC agar (TTC) and RAPID’E.coli 2 for water (REC2
supp), are reported in CFU/100 mL in the following table:
Table 11: Stability of E.coli strain à 4°C (*average of 2 replicates, ** beginning of interlaboratory study)
Level D0 D+1** D+2
TTC* REC2supp* TTC REC2supp TTC REC2supp
Level 1 11 7 9 7 6 3
Level 2 26 23 16 9 15 11
Level 3 81 67 72 44 63 19
AFNOR Validation
Summary report
RAPID’ E.coli 2
V0 April 2019
26
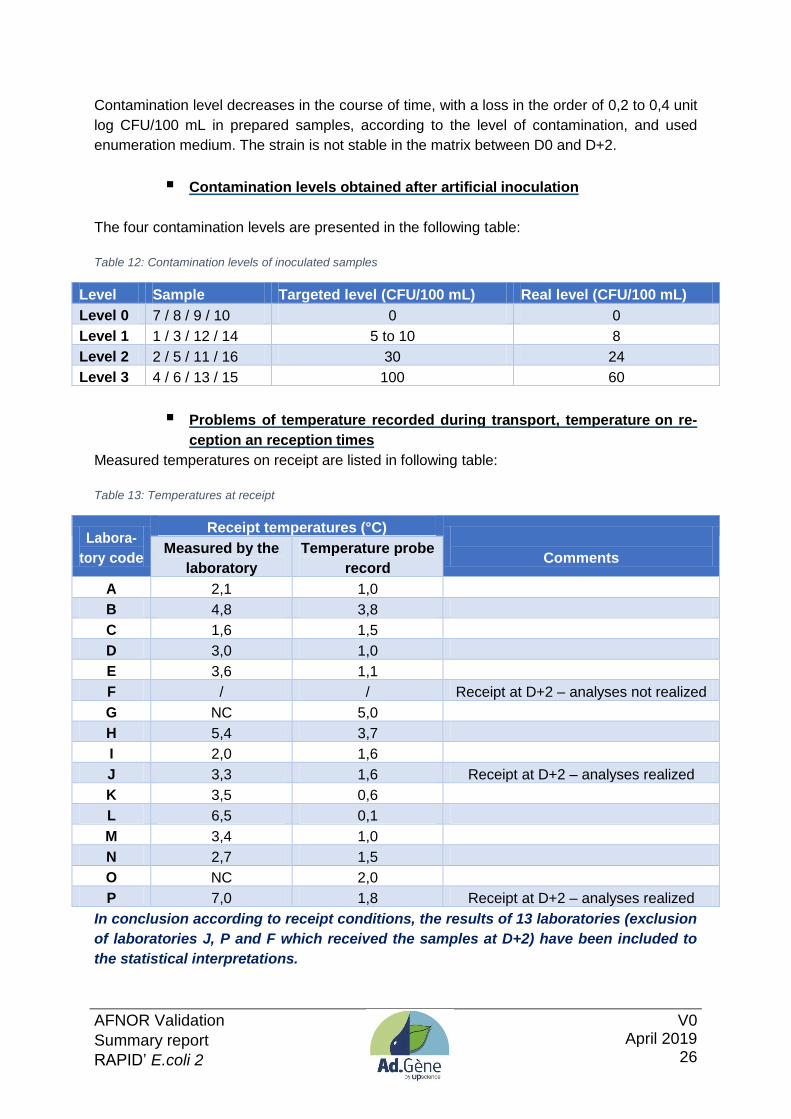
Contamination level decreases in the course of time, with a loss in the order of 0,2 to 0,4 unit
log CFU/100 mL in prepared samples, according to the level of contamination, and used
enumeration medium. The strain is not stable in the matrix between D0 and D+2.
Contamination levels obtained after artificial inoculation
The four contamination levels are presented in the following table:
Table 12: Contamination levels of inoculated samples
Level Sample Targeted level (CFU/100 mL) Real level (CFU/100 mL)
Level 0 7 / 8 / 9 / 10 0 0
Level 1 1 / 3 / 12 / 14 5 to 10 8
Level 2 2 / 5 / 11 / 16 30 24
Level 3 4 / 6 / 13 / 15 100 60
Problems of temperature recorded during transport, temperature on re-
ception an reception times
Measured temperatures on receipt are listed in following table:
Table 13: Temperatures at receipt
Labora-
tory code
Receipt temperatures (°C)
Comments Measured by the
laboratory
Temperature probe
record
A 2,1 1,0
B 4,8 3,8
C 1,6 1,5
D 3,0 1,0
E 3,6 1,1
F / / Receipt at D+2 – analyses not realized
G NC 5,0
H 5,4 3,7
I 2,0 1,6
J 3,3 1,6 Receipt at D+2 – analyses realized
K 3,5 0,6
L 6,5 0,1
M 3,4 1,0
N 2,7 1,5
O NC 2,0
P 7,0 1,8 Receipt at D+2 – analyses realized
In conclusion according to receipt conditions, the results of 13 laboratories (exclusion
of laboratories J, P and F which received the samples at D+2) have been included to
the statistical interpretations.

AFNOR Validation
Summary report
RAPID’ E.coli 2
V0 April 2019
27
5.2.3. Results
Expert laboratory
Results obtained by the expert laboratory with NF EN ISO 9308-1 method and RAPID’E.coli
2 for water method are presented in the following table.
Table 14: Resultst of expert laboratory
Level Reference method NF EN ISO 9308-1 Alternative method
Duplicate 1 Duplicate 2 Duplicate1 Duplicate 2
Level 0 <1 <1 <1 <1
Level 1 10 9 5 8
Level 2 30 21 24 22
Level 3 91 71 62 71
Results according to standard NF EN ISO 9308-1 and alternative method were in agreement.
Results obtained by collaborative laboratories
Results of the 15 laboratories which realized the analyses are presented in the tables below
and in Appendix 8 and 9. Overall, enumeration in E. coli and total coliforms reported by la-
boratories are of the same range.
Note: Two laboratories (K and M) detected some green colonies on RAPID’E.coli 2 medium,
which were identified as E. coli.
For level 0, all results for both methods were inferior to 1 CFU/100 mL. The results for the
three other levels are presented in the table 15.

AFNOR Validation
Summary report
RAPID’ E.coli 2
V0 April 2019
28
Table 15: Results of the interlaboratory study (CFU/100 ml, RM: reference method,AM: alternative method, a: error of the laboratory b: empty flask, numbers between brackets : number of green colonies in surface, violet under the membrane, identified as E.coli, included in the total number of typical colonies)
Labo-
ratory
Level 1 Level 2 Level 3
RM AM RM AM RM AM
R1 R2 R1 R2 R1 R2 R1 R2 R1 R2 R1 R2
A 7 13 1 9 24 21 13 14 64 62 40 48
B 3 9 10 1 17 21 15 10 82 71 59 39
C 2 6 5 6 23 19 11 16 46 48 41 41
D 6 9 4 2 28 14 11 12 68 83 /b 50
F 8 7 6 9 25 13 7 17 88 71 44 60
G 8 4 5 8 17 26 6 21 65 64 44 61
H 3 7 9 9 28 18 14 16 79 69 66 20
I 9 14 7 7 18 17 11 16 50 78 47 45
J 2 10 3 4 18 10 11 11 58 73 35 30
K 11 9 7 21
(14) 30 /a 11
12
(3) 76 72
45
(17)
50
(28)
L 5 11 2 2 12 18 8 4 68 76 35 22
M 8 8 3 6 13 28 13 5 68 74 51 61
(1)
N 8 7 5 4 32 17 11 16 65 76 42 43
O 14 7 2 6 28 22 13 9 77 63 19 38
P 2 7 2 4 19 20 2 2 77 64 43 35
The data obtained by the thirteen remaining laboratories are presented in the two dimen-
sional graph of the figure 3 in CFU/100 mL and in log CFU/100 mL for a better appreciation
of the data (y = x in dotted line).
AFNOR Validation
Summary report
RAPID’ E.coli 2
V0 April 2019
29
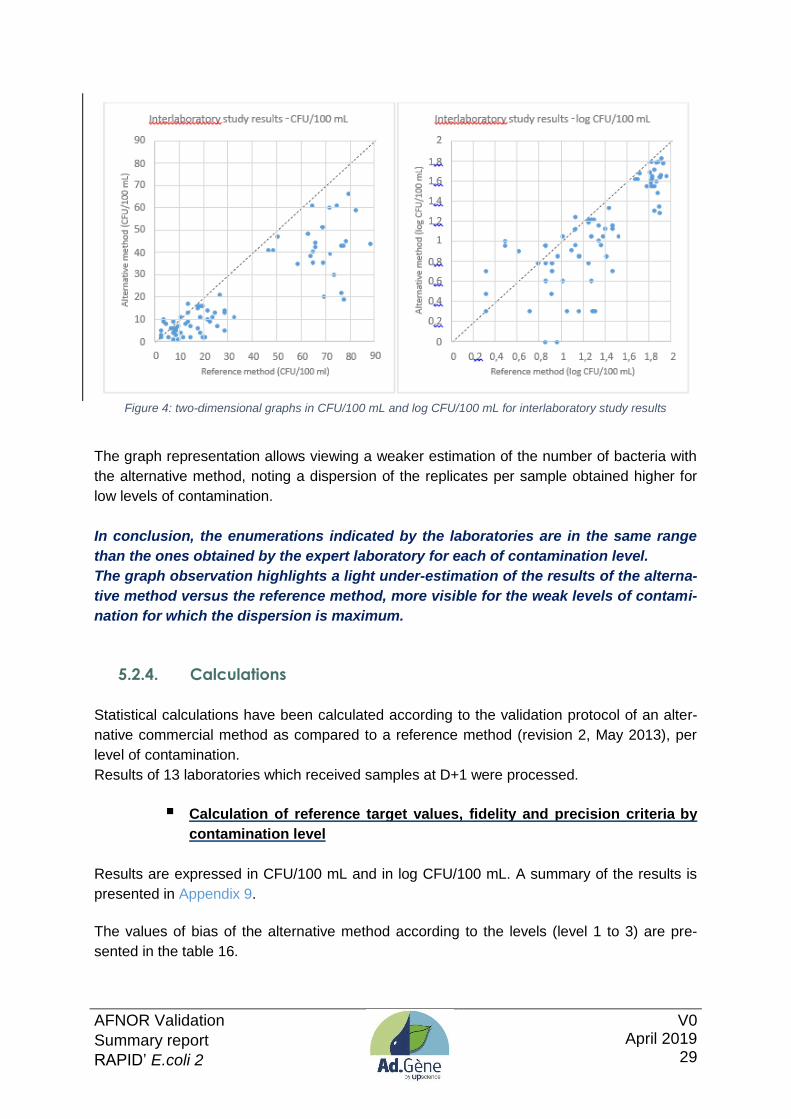
Figure 4: two-dimensional graphs in CFU/100 mL and log CFU/100 mL for interlaboratory study results
The graph representation allows viewing a weaker estimation of the number of bacteria with
the alternative method, noting a dispersion of the replicates per sample obtained higher for
low levels of contamination.
In conclusion, the enumerations indicated by the laboratories are in the same range
than the ones obtained by the expert laboratory for each of contamination level.
The graph observation highlights a light under-estimation of the results of the alterna-
tive method versus the reference method, more visible for the weak levels of contami-
nation for which the dispersion is maximum.
5.2.4. Calculations
Statistical calculations have been calculated according to the validation protocol of an alter-
native commercial method as compared to a reference method (revision 2, May 2013), per
level of contamination.
Results of 13 laboratories which received samples at D+1 were processed.
Calculation of reference target values, fidelity and precision criteria by
contamination level
Results are expressed in CFU/100 mL and in log CFU/100 mL. A summary of the results is
presented in Appendix 9.
The values of bias of the alternative method according to the levels (level 1 to 3) are pre-
sented in the table 16.
AFNOR Validation
Summary report
RAPID’ E.coli 2
V0 April 2019
30
Table 16: target and mean values and biais for the three levels of the interlaboratory study
Values CFU/100 mL log CFU/100 mL
Levels 1 - Low 2 - Medium 3 - High 1 - Low 2 - Medium 3 - High
Target value 7,5 19,0 68,5 0,845 1,279 1,836
Mean level 5,2 11,2 42,7 0,638 0,991 1,610
Relative bias -0,3 -0,4 -0,4 -24,5% -22,5% -12,3%
Bias 0,7 0,6 0,6 -0,207 -0,288 -0,226
The bias varies from -0,288 log CFU/100 mL to -0,207 log CFU/100 mL. In the comparative
study, the median bias was -0,131 log CFU/100 or 250 mL for the parameter Escherichia
coli.
Accuracy profile
Table 17 shows the tolerance values and limits of the alternative method for the different val-
ues of probability of tolerance () and the limits of acceptability (). Table 17: Tolerance values for the alternative method
Tolerance probability
and acceptability limit Levels
CFU/100 mL log CFU/100 mL
Low Medium High Low Medium High
= 80%
= 80% in CFU/100 mL
or
0,7 log CFU/100 mL
Low tolerance value 20% 25% 38% -0,617 -0,654 -0,414
High tolerance value 118
% 93% 86% 0,202 0,079 -0,037
Low tolerance limit 20% 20% 20% -0,700 -0,700 -0,700
High tolerance limit 180
% 180%
180
% 0,700 0,700 0,700
= 90%
= 95% in CFU/100 mL
or
0,8 log CFU/100 mL
Low tolerance value 6% 15% 31% -0,739 -0,765 -0,470
High tolerance value 133
% 104% 94% 0,324 0,190 0,019
Low tolerance limit 5% 5% 5% -0,800 -0,800 -0,800
High tolerance limit 195
% 195%
195
% 0,800 0,800 0,800
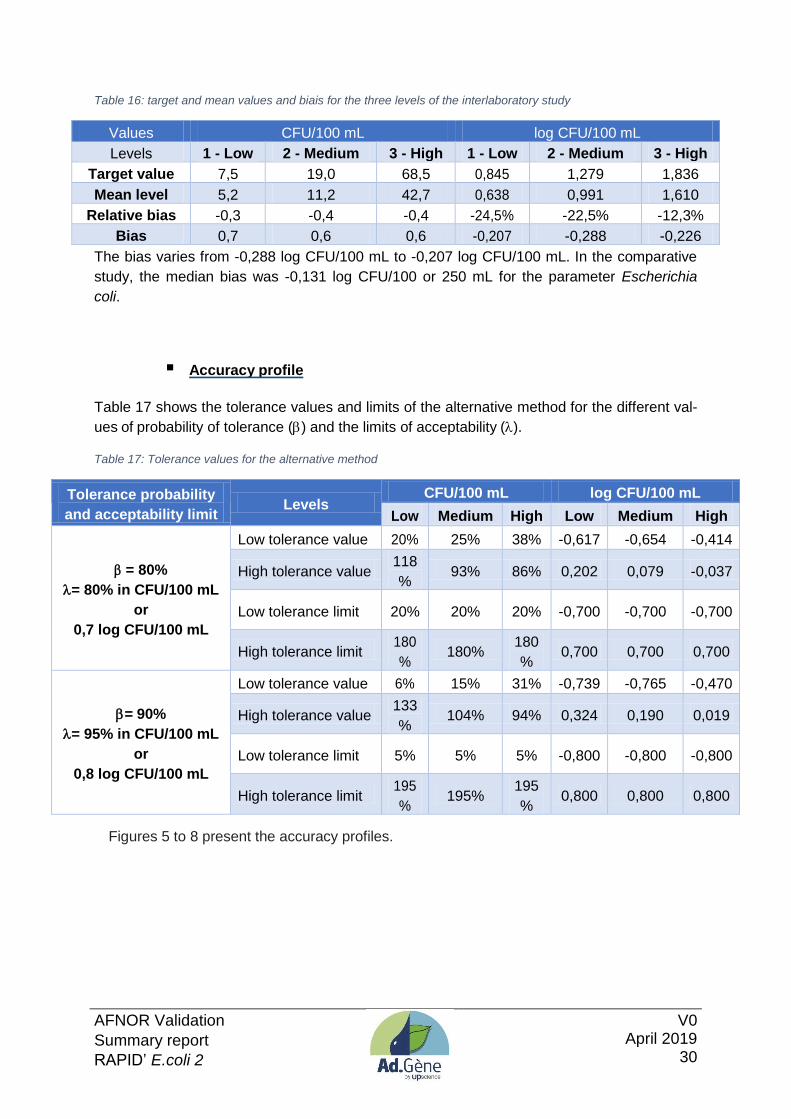
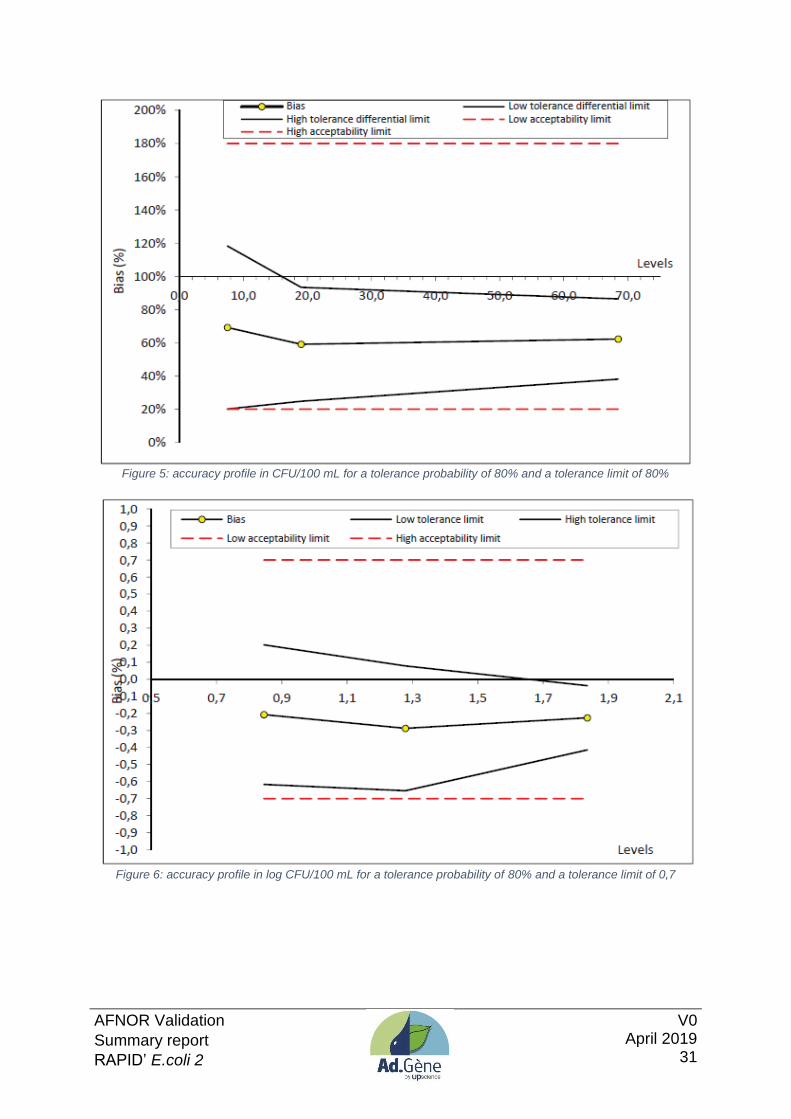
Figures 5 to 8 present the accuracy profiles.
AFNOR Validation
Summary report
RAPID’ E.coli 2
V0 April 2019
31
Figure 5: accuracy profile in CFU/100 mL for a tolerance probability of 80% and a tolerance limit of 80%
Figure 6: accuracy profile in log CFU/100 mL for a tolerance probability of 80% and a tolerance limit of 0,7
AFNOR Validation
Summary report
RAPID’ E.coli 2
V0 April 2019
32
Figure 7: accuracy profile in CFU/100 mL for a tolerance probability of 90% and a tolerance limit of 95%
Figure 8: accuracy profile in log CFU/100 mL for a tolerance probability of 90% and a tolerance limit of 0,8

AFNOR Validation
Summary report
RAPID’ E.coli 2
V0 April 2019
33
In conclusion, the bias of the alternative method is negative but stable from the low to
the high level of contamination.
For all the contamination levels, the tolerance interval is comprised between the ac-
ceptability interval for a 80% tolerance probability and a limit at 0,7 log CFU/100 ml or
80% in CFU/100 mL.
5.2.5. Conclusion of the interlaboratory study
The interlaboratory study showed that the bias of the alternative method is negative but rela-
tively stable from the low level of contamination to the high level of contamination.
For all levels of contamination, the tolerance limits are between the limits of acceptability,
meaning that:
o At least 90% of the results will be between the limits of acceptability as defined at 0,8
log CFU/100 mL,
o Or at least 80% of the results will be between the limits of acceptability as defined at
0,7 log CFU/100 mL.

AFNOR Validation
Summary report
RAPID’ E.coli 2
V0 April 2019
34
Appendix 1 – NF EN ISO 9308-1:2000 standard “Water
quality Detection and enumeration of Escherichia coli and coliform bacteria - Part 1: Mem-
brane filtration method”

AFNOR Validation
Summary report
RAPID’ E.coli 2
V0 April 2019
35
Appendix 2- Flow diagram RAPID‘E.coli 2
GAL : activité -D-Galactosidase GLUC : activité -D-Glucuronidase

AFNOR Validation
Summary report
RAPID’ E.coli 2
V0 April 2019
36
Appendix 3 – Relative accuracy : artificial contaminations
Echantillon d'eau Souche
Type de stress Evaluation
du stress UFC/100mL
Détection
Coliformes
Détection E.
coli Code Type d'eau Catégorie Référence Nom Origine
B07 Eau de réseau (Evin Malmaison) 1a / / / Contamination par mélange + 750 l Eau réf
B01
/ / + +
B08 Eau de réseau (Montigny en Go-
helle)
1a / / / Contamination par mélange + 500 l Eau réf
B01
/ / +/- +/-
B09 Eau de réseau (Onnaing) 1a / / / Contamination par mélange + 250 l Eau réf
B01
/ / + +
B10 Eau de réseau (Raismes) 1a / / / Contamination par mélange + 1 ml Eau réf B01 / / + +
B12 Eau de réseau (Fresnes) 1a / / / Contamination par mélange : 20 ml d'eau de
source de Bruille St Amand dans 100 ml
/ / + +
B13 Eau minérale (R30) 2a / / / Contamination par mélange : 40 ml d'eau de
source de Bruille St Amand dans 250 ml
/ / + +
B34 Eau de forage (Baives) 2a / / / Contamination par mélange : 10 ml d'eau de
source
/ /
B35 Eau de réseau (Renty) 1a Cit3e C. youngae Eau de cressonnière (Lillers) 30 min. à 55°C - 30 mi n. à -80°C 0.48 0.3 + -
B43 Eau de surface (Renty) 2a / / / Contamination par mélange : 1 ml d'eau de
source
/ / + -
B44 Eau de réseau (Baisieux) 1a / / / Contamination par mélange / / >100
>100
>100
>100 B45 Eau de réseau (Annezin) 1a / / / Contamination par mélange / /
B64 Eau minérale (R12) 1,5 L 2a EC18e E. coli Eau d'alimentation 35 min. à 55°C - 30 min. à -80°C 0.97 10.5 + +
B65 Eau de source (R20) 1,5 L 2a EC16e E. coli Eau de forage (Noyelles-S-Selles) 35 min. à 55°C - 30 min. à -80°C 0.83 14.5 + +
B66 Eau de source (R16) 1,5 L 2a EC18e E. coli Eau d'alimentation 35 min. à 55°C - 30 min. à -80°C 0.97 21.0 + +
B67 Eau minérale (R6) 1,5 L 2a EC16e E. coli Eau de forage (Noyelles-S-Selles) 35 min. à 55°C - 30 min. à -80°C 0.83 29.0 + +
B68 Eau de réseau (Hallines) 1a EC18e E. coli Eau d'alimentation 35 min. à 55°C - 30 min. à -80°C 0.97 10.5 + +
B69 Eau de réseau Aire sur la Lys 1a EC16e E. coli Eau de forage (Noyelles-S-Selles) 35 min. à 55°C - 30 min. à -80°C 0.83 29.0 + +
B70 Eau de forage (Caullery) 2a EC18e E. coli Eau d'alimentation 35 min. à 55°C - 30 min. à -80°C 0.97 16.8 + +

AFNOR Validation
Summary report
RAPID’ E.coli 2
V0 April 2019
37
Echantillon d'eau Souche
Type de stress Evaluation
du stress UFC/100mL
Détection
Coliformes
Détection E.
coli Code Type d'eau Catégorie Référence Nom Origine
B71 Eau de forage (Preures) 2a EC16e E. coli Eau de forage (Noyelles-S-Selles) 35 min. à 55°C - 30 min. à -80°C 0.83 20.3 + +
B72 Eau minérale (R7) 1,5 L 2a EC19e E. coli Eau d'alimentation (Mouveaux) 35 min. à 55°C - 30 m in. à -80°C 0.81 36.0 + +
B73 Eau minérale (R25) 1,5 L 2a EC19e E. coli Eau d'alimentation (Mouveaux) 35 min. à 55°C - 30 m in. à -80°C 0.81 30.0 + +
B74 Eau de réseau (Béthune) 1a EC19e E. coli Eau d'alimentation (Mouveaux) 35 min. à 55°C - 30 m in. à -80°C 0.81 31.5 + +
B75 Eau de forage (Noyelles) 2a EC19e E. coli Eau d'alimentation (Mouveaux) 35 min. à 55°C - 30 m in. à -80°C 0.81 45.0 + +
B76 Eau de forage (Halluin) 2a EC3e E. coli Eau de réseau (Bruille St Amand) 35 min. à 55°C - 3 0 min. à -80°C 0.50 16.0 + +
B77 Eau de réseau (Baines) 1a EC26e E. coli Eau d'alimentation (Liencourt) 35 min. à 55°C - 30 min. à -80°C 0.47 6.3 + +
B78 Eau de forage (Fruges) 2a EC3e E. coli Eau de réseau (Bruille St Amand) 35 min. à 55°C - 3 0 min. à -80°C 0.50 12.0 + +
B79 Eau de réseau (Renty) 1a EC26e E. coli Eau d'alimentation (Liencourt) 35 min. à 55°C - 30 min. à -80°C 0.47 4.7 + +
B80 Eau de forage (Beuvry) 2a EC3e E. coli Eau de réseau (Bruille St Amand) 35 min. à 55°C - 3 0 min. à -80°C 0.50 8.0 + +
B81 Eau de forage (Camblain) 2a EC26e E. coli Eau d'alimentation (Liencourt) 35 min. à 55°C - 30 min. à -80°C 0.47 12.6 + +
B82 Eau de réseau (La loge) 1a EC3e E. coli Eau de réseau (Bruille St Amand) 35 min. à 55°C - 3 0 min. à -80°C 0.50 48.0 + +
B83 Eau de forage (Malincourt) 2a EC26e E. coli Eau d'alimentation (Liencourt) 35 min. à 55°C - 30 min. à -80°C 0.47 37.8 + +
B84 Eau de source (R1) 2a EC3e E. coli Eau de réseau (Bruille St Amand) 48h à -20°C - 20 mi n. à 55°C 0.54 4.3 + +
B85 Eau de source (R8) 2a EC26e E. coli Eau d'alimentation (Liencourt) 48h à -20°C - 20 min. à 55°C 0.63 33.0 + +
B86 Eau minérale (R9) 2a EC3e E. coli Eau de réseau (Bruille St Amand) 48h à -20°C - 20 mi n. à 55°C 0.54 12.9 + +
B87 Eau minérale (R14) 2a EC26e E. coli Eau d'alimentation (Liencourt) 48h à -20°C - 20 min. à 55°C 0.63 22.0 + +
B88 Eau minérale (R30) 2a EC3e E. coli Eau de réseau (Bruille St Amand) 48h à -20°C - 20 mi n. à 55°C 0.54 21.5 + +
B89 Eau minérale (R21) 2a EC26e E. coli Eau d'alimentation (Liencourt 48h à -20°C - 20 min. à 55°C 0.63 11.0 + +
B90 Eau minérale (R29) 2a EC3e E. coli Eau de réseau (Bruille St Amand) 48h à -20°C - 20 min. à 55°C 0.54 30.1 + +
B91 Eau minérale (R31) 2a EC26e E. coli Eau d'alimentation (Liencourt) 48h à -20°C - 20 min. à 55°C 0.63 2.8 + +
B112 Eau de réseau (Baives) 1a EC2e E. coli Eau de puits - Lille (59) 40 min. à 55°C - 30 min. à -80°C 1.31 1183 >100 >100
B113 Eau de réseau (Evin Malmaison) 1a EC2e E. coli Eau de puits - Lille (59) 40 min. à 55°C - 30 min. à -80°C 1.31 845 >100 >100
B114 Eau de réseau (Montigny en Gohelle) 1a EC2e E. coli Eau de puits - Lille (59) 40 min. à 55°C - 30 min. à -80°C 1.31 507 + +
B115 Eau de réseau (Raismes) 1a EC2e E. coli Eau de puits - Lille (59) 40 min. à 55°C - 30 min. à -80°C 1.31 254 + +
B116 Eau de réseau (Fresnes) 1a EC4e E. coli Eau de lac (Villeneuve d'Ascq) 7 jours à 4°C - 15 mi n. à -80°C 0.47 50.0 + +
B117 Eau de réseau (Loison-sous-Lens) 1a EC4e E. coli Eau de lac (Villeneuve d'Ascq) 7 jours à 4°C - 15 mi n. à -80°C 0.47 75.0 + +

AFNOR Validation
Summary report
RAPID’ E.coli 2
V0 April 2019
38
B118 Eau de réseau (Marcq-en-Baroeul) 1a EC4e E. coli Eau de lac (Villeneuve d'Ascq) 7 jours à 4°C - 15 mi n. à -80°C 0.47 150 + +
B119 Eau de réseau (Annoeullin) 1a EC4e E. coli Eau de lac (Villeneuve d'Ascq) 7 jours à 4°C - 15 mi n. à -80°C 0.47 250 + +
B122 Eau de réseau (Fresnes F3) 1a Ser 3e Serratia marcescens Eau 28 h à 4°C - 35 min. à 55°C - 20 min. à -80°C 0.46 <1 - -
B123 Eau de réseau (Baisieux) 1a Ser 3e Serratia marcescens Eau 28 h à 4°C - 35 min. à 55°C - 20 min. à -80°C 0.46 <1 - -
B124 Eau de source (R18) 2a Ser 3e Serratia marcescens Eau 28 h à 4°C - 35 min. à 55°C - 20 min. à -80°C 0.46 3.4
B125 Eau de source (R11) 2a Ser 3e Serratia marcescens Eau 28 h à 4°C - 35 min. à 55°C - 20 min. à -80°C 0.46 13.2
B126 Eau de réseau (Tourcoing) 1a Ser 3e Serratia marcescens Eau 28 h à 4°C - 35 min. à 55°C - 20 min. à -80°C 0.46 6.8 + -
B127 Eau de fontaine (Bray-Dunes) 2a Ser 3e Serratia marcescens Eau 28 h à 4°C - 35 min. à 55°C - 20 min. à -80°C 0.46 13.6
B128 Eau de réseau (Loison-sous-Lens) 1a EC21e E. coli Eau d'alimentation (Megève) 24 h à 4°C - 30 min. à 5 5°C - 30 min. à -80°C 0.73 13.5 + +
B129 Eau de réseau (Roncq) 1a EC21e E. coli Eau d'alimentation (Megève) 24 h à 4°C - 30 min. à 5 5°C - 30 min. à -80°C 0.73 8.1 + +
B130 Eau de réseau (La Loge) 1a EC21e E. coli Eau d'alimentation (Megève) 24 h à 4°C - 30 min. à 5 5°C - 30 min. à -80°C 0.73 16.2 + +
B131 Eau de réseau (Fresnes F2) 1a EC21e E. coli Eau d'alimentation (Megève) 24 h à 4°C - 30 min. à 5 5°C - 30 min. à -80°C 0.73 21.6 + +
B150 Eau de réseau (Bois Grenier) 1a / / / Contamination par mélange avec de l'eau de source de Bruille St Amand (dilution 1/2)
/ / + 1+ /1-
B151 Eau de réseau (Roubaix) 1a / / / Contamination par mélange avec de l'eau de source de Bruille St Amand (dilution 1/2)
/ / + +
B154 Eau de réseau (Tourcoing) 1a EC26e E. coli Eau d'alimentation (Liencourt) 18h à -20°C-4h à +20° C-18h à -20°C-4h à +20°C 0.61 200.0 + +
B155 Eau de réseau (Pecquencourt) 1a EC26e E. coli Eau d'alimentation (Liencourt) 18h à -20°C-4h à +20° C-18h à -20°C-4h à +20°C 0.61 150.0 + +
B156 Eau de réseau (Liessies) 1a EC26e E. coli Eau d'alimentation (Liencourt) 18h à -20°C-4h à +20° C-18h à -20°C-4h à +20°C 0.61 100.0 + +
B157 Eau de réseau (Marcq en Baroeul) 1a EC26e E. coli Eau d'alimentation (Liencourt) 18h à -20°C-4h à +20° C-18h à -20°C-4h à +20°C 0.61 50.0 + +
B160 Eau de réseau (Roubaix) 1a / / / Contamination par mélange avec de l'eau de source de Bruille St Amand - Chauffage 10 min. à 55°C
/ / + +
B161 Eau de réseau (Marcq en Baroeul) 1a / / / Contamination par mélange avec de l'eau de source de Bruille St Amand - Chauffage 10 min. à 55°C
/ / + +
Rx : référence de l'eau embouteillée testée (marque commerciale)
Résultat non exploité

AFNOR Validation
Summary report
RAPID’ E.coli 2
V0 April 2019
39
Appendix 4 – Relative accuracy : results et statistics
Legend
cat : catégorie du domaine d'application
CA : contamination artificielle
o : oui (réalisation d'une CA)
n : non (échantillon naturellement contaminé)
lac+ : fermentation du lactose positive
ox+ : test oxydase positif
indole + : test indole positif
-D-Galactosidase (Gal) positive
-D-Glucuronidase (Gluc) positive
CT : coliformes totaux
EC : E. coli
INC : incomptable (flore interférente importante)
Eau minérale ou eau de source (R1 à R36) = Eau embouteillée (analyse de 250 mL)
Eau de source (nom de la localité de prélèvement) = eau non embouteillée (analyse de 100 mL)
AFNOR Validation
Summary report
RAPID’ E.coli 2
V0 April 2019
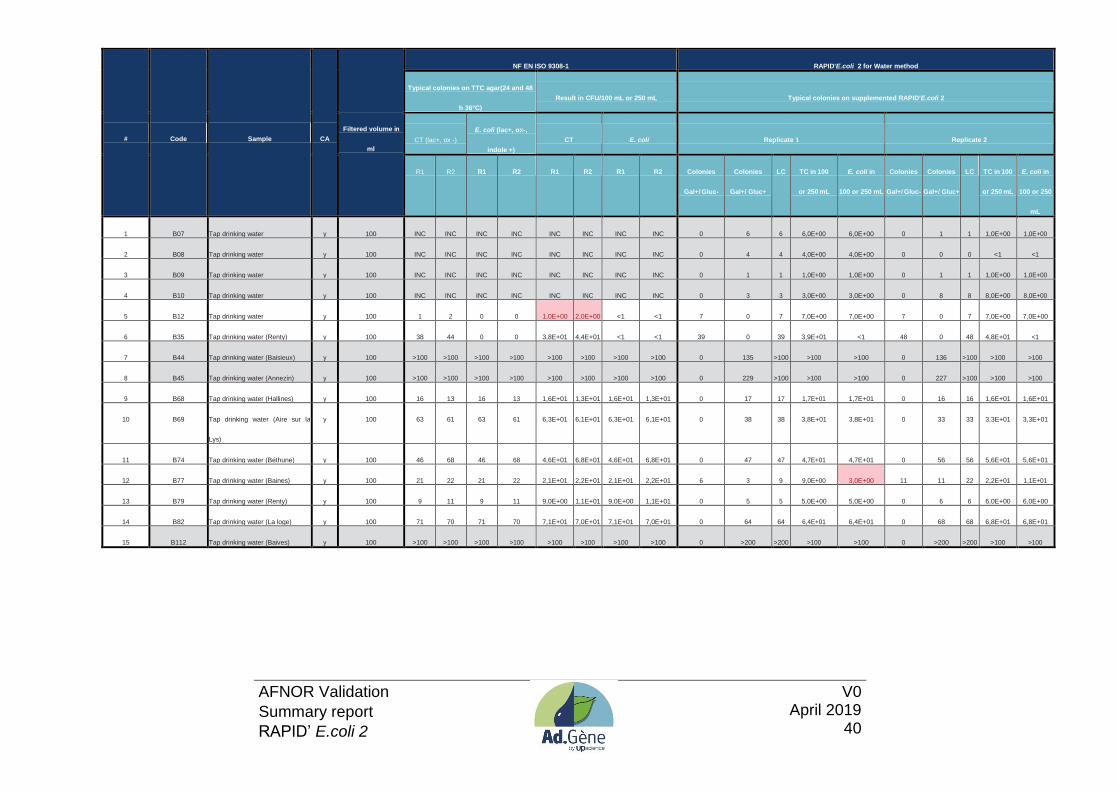
40
# Code Sample CA
Filtered volume in
ml
NF EN ISO 9308-1 RAPID'E.coli 2 for Water method
Typical colonies on TTC agar(24 and 48
h 36°C)
Result in CFU/100 mL or 250 mL Typical colonies on supplemented RAPID'E.coli 2
CT (lac+, ox -)
E. coli (lac+, ox-,
indole +)
CT E. coli Replicate 1 Replicate 2
R1 R2 R1 R2 R1 R2 R1 R2 Colonies
Gal+/ Gluc-
Colonies
Gal+/ Gluc+
LC TC in 100
or 250 mL
E. coli in
100 or 250 mL
Colonies
Gal+/ Gluc-
Colonies
Gal+/ Gluc+
LC TC in 100
or 250 mL
E. coli in
100 or 250
mL
1 B07 Tap drinking water y 100 INC INC INC INC INC INC INC INC 0 6 6 6,0E+00 6,0E+00 0 1 1 1,0E+00 1,0E+00
2 B08 Tap drinking water y 100 INC INC INC INC INC INC INC INC 0 4 4 4,0E+00 4,0E+00 0 0 0 <1 <1
3 B09 Tap drinking water y 100 INC INC INC INC INC INC INC INC 0 1 1 1,0E+00 1,0E+00 0 1 1 1,0E+00 1,0E+00
4 B10 Tap drinking water y 100 INC INC INC INC INC INC INC INC 0 3 3 3,0E+00 3,0E+00 0 8 8 8,0E+00 8,0E+00
5 B12 Tap drinking water y 100 1 2 0 0 1,0E+00 2,0E+00 <1 <1 7 0 7 7,0E+00 7,0E+00 7 0 7 7,0E+00 7,0E+00
6 B35 Tap drinking water (Renty) y 100 38 44 0 0 3,8E+01 4,4E+01 <1 <1 39 0 39 3,9E+01 <1 48 0 48 4,8E+01 <1
7 B44 Tap drinking water (Baisieux) y 100 >100 >100 >100 >100 >100 >100 >100 >100 0 135 >100 >100 >100 0 136 >100 >100 >100
8 B45 Tap drinking water (Annezin) y 100 >100 >100 >100 >100 >100 >100 >100 >100 0 229 >100 >100 >100 0 227 >100 >100 >100
9 B68 Tap drinking water (Hallines) y 100 16 13 16 13 1,6E+01 1,3E+01 1,6E+01 1,3E+01 0 17 17 1,7E+01 1,7E+01 0 16 16 1,6E+01 1,6E+01
10 B69 Tap drinking water (Aire sur la
Lys)
y 100 63 61 63 61 6,3E+01 6,1E+01 6,3E+01 6,1E+01 0 38 38 3,8E+01 3,8E+01 0 33 33 3,3E+01 3,3E+01
11 B74 Tap drinking water (Béthune) y 100 46 68 46 68 4,6E+01 6,8E+01 4,6E+01 6,8E+01 0 47 47 4,7E+01 4,7E+01 0 56 56 5,6E+01 5,6E+01
12 B77 Tap drinking water (Baines) y 100 21 22 21 22 2,1E+01 2,2E+01 2,1E+01 2,2E+01 6 3 9 9,0E+00 3,0E+00 11 11 22 2,2E+01 1,1E+01
13 B79 Tap drinking water (Renty) y 100 9 11 9 11 9,0E+00 1,1E+01 9,0E+00 1,1E+01 0 5 5 5,0E+00 5,0E+00 0 6 6 6,0E+00 6,0E+00
14 B82 Tap drinking water (La loge) y 100 71 70 71 70 7,1E+01 7,0E+01 7,1E+01 7,0E+01 0 64 64 6,4E+01 6,4E+01 0 68 68 6,8E+01 6,8E+01
15 B112 Tap drinking water (Baives) y 100 >100 >100 >100 >100 >100 >100 >100 >100 0 >200 >200 >100 >100 0 >200 >200 >100 >100
AFNOR Validation
Summary report
RAPID’ E.coli 2
V0 April 2019
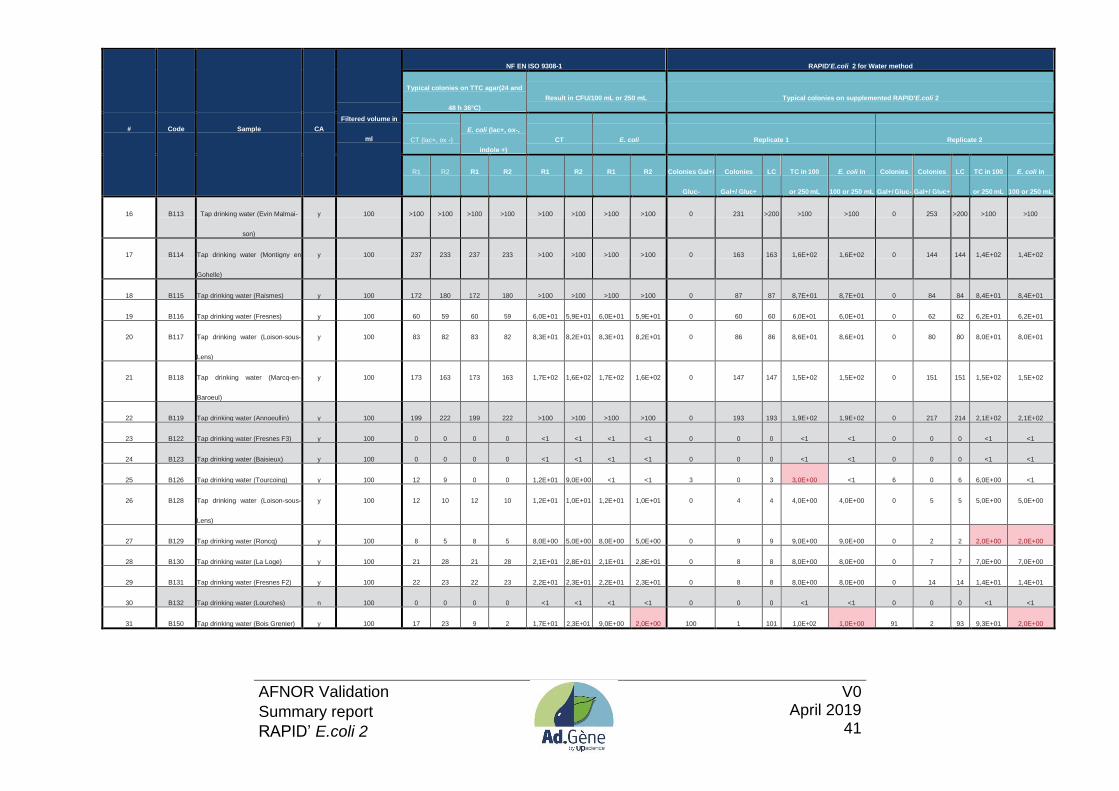
41
# Code Sample CA
Filtered volume in
ml
NF EN ISO 9308-1 RAPID'E.coli 2 for Water method
Typical colonies on TTC agar(24 and
48 h 36°C)
Result in CFU/100 mL or 250 mL Typical colonies on supplemented RAPID'E.coli 2
CT (lac+, ox -)
E. coli (lac+, ox-,
indole +)
CT E. coli Replicate 1 Replicate 2
R1 R2 R1 R2 R1 R2 R1 R2 Colonies Gal+/
Gluc-
Colonies
Gal+/ Gluc+
LC TC in 100
or 250 mL
E. coli in
100 or 250 mL
Colonies
Gal+/ Gluc-
Colonies
Gal+/ Gluc+
LC TC in 100
or 250 mL
E. coli in
100 or 250 mL
16 B113 Tap drinking water (Evin Malmai-
son)
y 100 >100 >100 >100 >100 >100 >100 >100 >100 0 231 >200 >100 >100 0 253 >200 >100 >100
17 B114 Tap drinking water (Montigny en
Gohelle)
y 100 237 233 237 233 >100 >100 >100 >100 0 163 163 1,6E+02 1,6E+02 0 144 144 1,4E+02 1,4E+02
18 B115 Tap drinking water (Raismes) y 100 172 180 172 180 >100 >100 >100 >100 0 87 87 8,7E+01 8,7E+01 0 84 84 8,4E+01 8,4E+01
19 B116 Tap drinking water (Fresnes) y 100 60 59 60 59 6,0E+01 5,9E+01 6,0E+01 5,9E+01 0 60 60 6,0E+01 6,0E+01 0 62 62 6,2E+01 6,2E+01
20 B117 Tap drinking water (Loison-sous-
Lens)
y 100 83 82 83 82 8,3E+01 8,2E+01 8,3E+01 8,2E+01 0 86 86 8,6E+01 8,6E+01 0 80 80 8,0E+01 8,0E+01
21 B118 Tap drinking water (Marcq-en-
Baroeul)
y 100 173 163 173 163 1,7E+02 1,6E+02 1,7E+02 1,6E+02 0 147 147 1,5E+02 1,5E+02 0 151 151 1,5E+02 1,5E+02
22 B119 Tap drinking water (Annoeullin) y 100 199 222 199 222 >100 >100 >100 >100 0 193 193 1,9E+02 1,9E+02 0 217 214 2,1E+02 2,1E+02
23 B122 Tap drinking water (Fresnes F3) y 100 0 0 0 0 <1 <1 <1 <1 0 0 0 <1 <1 0 0 0 <1 <1
24 B123 Tap drinking water (Baisieux) y 100 0 0 0 0 <1 <1 <1 <1 0 0 0 <1 <1 0 0 0 <1 <1
25 B126 Tap drinking water (Tourcoing) y 100 12 9 0 0 1,2E+01 9,0E+00 <1 <1 3 0 3 3,0E+00 <1 6 0 6 6,0E+00 <1
26 B128 Tap drinking water (Loison-sous-
Lens)
y 100 12 10 12 10 1,2E+01 1,0E+01 1,2E+01 1,0E+01 0 4 4 4,0E+00 4,0E+00 0 5 5 5,0E+00 5,0E+00
27 B129 Tap drinking water (Roncq) y 100 8 5 8 5 8,0E+00 5,0E+00 8,0E+00 5,0E+00 0 9 9 9,0E+00 9,0E+00 0 2 2 2,0E+00 2,0E+00
28 B130 Tap drinking water (La Loge) y 100 21 28 21 28 2,1E+01 2,8E+01 2,1E+01 2,8E+01 0 8 8 8,0E+00 8,0E+00 0 7 7 7,0E+00 7,0E+00
29 B131 Tap drinking water (Fresnes F2) y 100 22 23 22 23 2,2E+01 2,3E+01 2,2E+01 2,3E+01 0 8 8 8,0E+00 8,0E+00 0 14 14 1,4E+01 1,4E+01
30 B132 Tap drinking water (Lourches) n 100 0 0 0 0 <1 <1 <1 <1 0 0 0 <1 <1 0 0 0 <1 <1
31 B150 Tap drinking water (Bois Grenier) y 100 17 23 9 2 1,7E+01 2,3E+01 9,0E+00 2,0E+00 100 1 101 1,0E+02 1,0E+00 91 2 93 9,3E+01 2,0E+00
AFNOR Validation
Summary report
RAPID’ E.coli 2
V0 April 2019
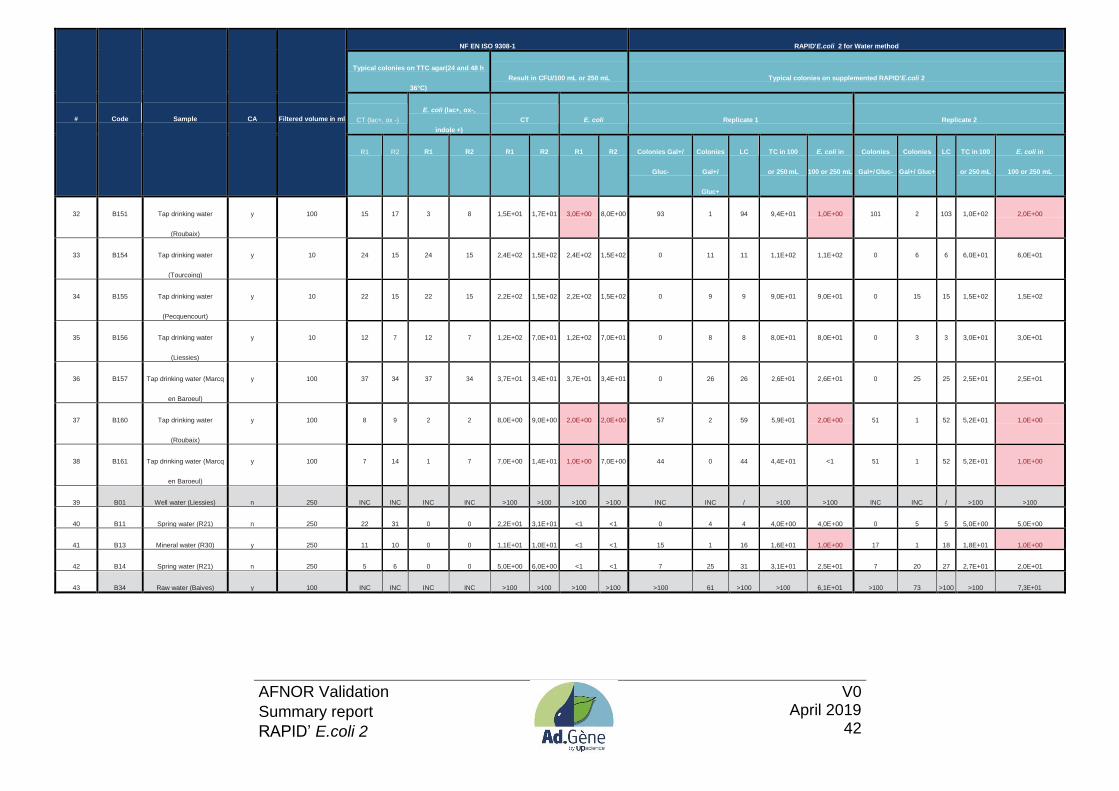
42
# Code Sample CA Filtered volume in ml
NF EN ISO 9308-1 RAPID'E.coli 2 for Water method
Typical colonies on TTC agar(24 and 48 h
36°C)
Result in CFU/100 mL or 250 mL Typical colonies on supplemented RAPID'E.coli 2
CT (lac+, ox -)
E. coli (lac+, ox-,
indole +)
CT E. coli Replicate 1 Replicate 2
R1 R2 R1 R2 R1 R2 R1 R2 Colonies Gal+/
Gluc-
Colonies
Gal+/
Gluc+
LC TC in 100
or 250 mL
E. coli in
100 or 250 mL
Colonies
Gal+/ Gluc-
Colonies
Gal+/ Gluc+
LC TC in 100
or 250 mL
E. coli in
100 or 250 mL
32 B151 Tap drinking water
(Roubaix)
y 100 15 17 3 8 1,5E+01 1,7E+01 3,0E+00 8,0E+00 93 1 94 9,4E+01 1,0E+00 101 2 103 1,0E+02 2,0E+00
33 B154 Tap drinking water
(Tourcoing)
y 10 24 15 24 15 2,4E+02 1,5E+02 2,4E+02 1,5E+02 0 11 11 1,1E+02 1,1E+02 0 6 6 6,0E+01 6,0E+01
34 B155 Tap drinking water
(Pecquencourt)
y 10 22 15 22 15 2,2E+02 1,5E+02 2,2E+02 1,5E+02 0 9 9 9,0E+01 9,0E+01 0 15 15 1,5E+02 1,5E+02
35 B156 Tap drinking water
(Liessies)
y 10 12 7 12 7 1,2E+02 7,0E+01 1,2E+02 7,0E+01 0 8 8 8,0E+01 8,0E+01 0 3 3 3,0E+01 3,0E+01
36 B157 Tap drinking water (Marcq
en Baroeul)
y 100 37 34 37 34 3,7E+01 3,4E+01 3,7E+01 3,4E+01 0 26 26 2,6E+01 2,6E+01 0 25 25 2,5E+01 2,5E+01
37 B160 Tap drinking water
(Roubaix)
y 100 8 9 2 2 8,0E+00 9,0E+00 2,0E+00 2,0E+00 57 2 59 5,9E+01 2,0E+00 51 1 52 5,2E+01 1,0E+00
38 B161 Tap drinking water (Marcq
en Baroeul)
y 100 7 14 1 7 7,0E+00 1,4E+01 1,0E+00 7,0E+00 44 0 44 4,4E+01 <1 51 1 52 5,2E+01 1,0E+00
39 B01 Well water (Liessies) n 250 INC INC INC INC >100 >100 >100 >100 INC INC / >100 >100 INC INC / >100 >100
40 B11 Spring water (R21) n 250 22 31 0 0 2,2E+01 3,1E+01 <1 <1 0 4 4 4,0E+00 4,0E+00 0 5 5 5,0E+00 5,0E+00
41 B13 Mineral water (R30) y 250 11 10 0 0 1,1E+01 1,0E+01 <1 <1 15 1 16 1,6E+01 1,0E+00 17 1 18 1,8E+01 1,0E+00
42 B14 Spring water (R21) n 250 5 6 0 0 5,0E+00 6,0E+00 <1 <1 7 25 31 3,1E+01 2,5E+01 7 20 27 2,7E+01 2,0E+01
43 B34 Raw water (Baives) y 100 INC INC INC INC >100 >100 >100 >100 >100 61 >100 >100 6,1E+01 >100 73 >100 >100 7,3E+01

AFNOR Validation
Summary report
RAPID’ E.coli 2
V0 April 2019
43
# Code Sample CA
Filtered
volume in
ml
NF EN ISO 9308-1 RAPID'E.coli 2 for Water method
Typical colonies on TTC agar(24 and 48 h 36°C) Result in CFU/100 mL or 250 mL Typical colonies on supplemented RAPID'E.coli 2
CT (lac+, ox -)
E. coli (lac+, ox-,
indole +)
CT E. coli Replicate 1 Replicate 2
R1 R2 R1 R2 R1 R2 R1 R2 Colonies Gal+/ Gluc- Colonies
Gal+/
Gluc+
LC TC in 100
or 250 mL
E. coli in
100 or 250
mL
Colonies
Gal+/ Gluc-
Colonies
Gal+/ Gluc+
LC TC in 100
or 250 mL
E. coli in
100 or 250 mL
44 B43 Raw water (Renty) y 100 27 21 0 0 2,7E+01 2,1E+01 <1 <1 26 7 33 3,3E+01 7,0E+00 14 3 17 1,7E+01 3,0E+00
45 B64 Mineral water - 1,5 L (R12) y 250 11 11 11 11 1,1E+01 1,1E+01 1,1E+01 1,1E+01 0 11 11 1,1E+01 1,1E+01 0 8 8 8,0E+00 8,0E+00
46 B65 Spring water - 1,5 L (R20) y 250 20 33 20 33 2,0E+01 3,3E+01 2,0E+01 3,3E+01 0 17 17 1,7E+01 1,7E+01 0 12 12 1,2E+01 1,2E+01
47 B66 Spring water - 1,5 L (R16) y 250 43 37 43 37 4,3E+01 3,7E+01 4,3E+01 3,7E+01 0 18 18 1,8E+01 1,8E+01 0 36 36 3,6E+01 3,6E+01
48 B67 Mineral water - 1,5 L (R6) y 250 51 57 51 57 5,1E+01 5,7E+01 5,1E+01 5,7E+01 0 27 27 2,7E+01 2,7E+01 0 34 34 3,4E+01 3,4E+01
49 B70 Raw water (Caullery) y 100 12 4 12 4 1,2E+01 4,0E+00 1,2E+01 4,0E+00 0 5 5 5,0E+00 5,0E+00 0 4 4 4,0E+00 4,0E+00
50 B71 Raw water (Preures) y 100 38 39 38 39 3,8E+01 3,9E+01 3,8E+01 3,9E+01 0 22 22 2,2E+01 2,2E+01 0 22 22 2,2E+01 2,2E+01
51 B72 Mineral water - 1,5 L (R7) y 250 51 51 51 51 5,1E+01 5,1E+01 5,1E+01 5,1E+01 0 59 59 5,9E+01 5,9E+01 0 57 57 5,7E+01 5,7E+01
52 B73 Mineral water - 1,5 L (R25) y 250 39 44 39 44 3,9E+01 4,4E+01 3,9E+01 4,4E+01 0 29 29 2,9E+01 2,9E+01 0 48 48 4,8E+01 4,8E+01
53 B75 Raw water (Noyelles) y 100 67 64 67 64 6,7E+01 6,4E+01 6,7E+01 6,4E+01 0 60 60 6,0E+01 6,0E+01 0 70 70 7,0E+01 7,0E+01
54 B76 Raw water (Halluin) y 100 20 27 20 27 2,0E+01 2,7E+01 2,0E+01 2,7E+01 1 23 24 2,4E+01 2,3E+01 1 33 34 3,4E+01 3,3E+01
55 B78 Raw water (Fruges) y 100 20 26 20 26 2,0E+01 2,6E+01 2,0E+01 2,6E+01 0 25 25 2,5E+01 2,5E+01 0 25 25 2,5E+01 2,5E+01
56 B80 Raw water (Beuvry) y 100 19 21 19 21 1,9E+01 2,1E+01 1,9E+01 2,1E+01 0 11 11 1,1E+01 1,1E+01 0 9 9 9,0E+00 9,0E+00
57 B81 Raw water (Camblain) y 100 21 23 21 23 2,1E+01 2,3E+01 2,1E+01 2,3E+01 0 16 16 1,6E+01 1,6E+01 0 13 13 1,3E+01 1,3E+01
58 B83 Raw water (Malincourt) y 100 61 55 61 55 6,1E+01 5,5E+01 6,1E+01 5,5E+01 0 36 36 3,6E+01 3,6E+01 0 39 39 3,9E+01 3,9E+01
59 B84 Spring water (R1) y 250 8 6 8 6 8,0E+00 6,0E+00 8,0E+00 6,0E+00 0 6 6 6,0E+00 6,0E+00 0 9 9 9,0E+00 9,0E+00
60 B85 Spring water (R8) y 250 47 49 47 49 4,7E+01 4,9E+01 4,7E+01 4,9E+01 0 39 39 3,9E+01 3,9E+01 0 40 40 4,0E+01 4,0E+01
61 B86 Mineral water (R9) y 250 22 22 22 22 2,2E+01 2,2E+01 2,2E+01 2,2E+01 0 16 16 1,6E+01 1,6E+01 0 23 23 2,3E+01 2,3E+01
62 B87 Mineral water (R14) y 250 33 29 33 29 3,3E+01 2,9E+01 3,3E+01 2,9E+01 0 27 27 2,7E+01 2,7E+01 0 32 32 3,2E+01 3,2E+01
63 B88 Mineral water (R30) y 250 46 48 46 48 4,6E+01 4,8E+01 4,6E+01 4,8E+01 0 30 30 3,0E+01 3,0E+01 0 28 28 2,8E+01 2,8E+01
64 B89 Mineral water (R21) y 250 12 23 12 23 1,2E+01 2,3E+01 1,2E+01 2,3E+01 0 10 10 1,0E+01 1,0E+01 0 16 16 1,6E+01 1,6E+01
65 B90 Mineral water (R29) y 250 46 49 46 49 4,6E+01 4,9E+01 4,6E+01 4,9E+01 0 45 45 4,5E+01 4,5E+01 0 41 41 4,1E+01 4,1E+01
66 B91 Mineral water (R31) y 250 1 5 1 5 1,0E+00 5,0E+00 1,0E+00 5,0E+00 0 1 1 1,0E+00 1,0E+00 0 4 4 4,0E+00 4,0E+00

AFNOR Validation
Summary report
RAPID’ E.coli 2
V0 April 2019
44
Reference method Alternative method
Sample Replicate 1 Replicate 2 M SD Sample Replicate 1 Replicate 2 M SD
1 38 44 41,0 4,2 1 39 48 43,5 6,4
2 16 13 14,5 2,1 2 17 16 16,5 0,7
3 63 61 62,0 1,4 3 38 33 35,5 3,5
4 46 68 57,0 15,6 4 47 56 51,5 6,4
5 21 22 21,5 0,7 5 9 22 15,5 9,2
6 9 11 10,0 1,4 6 5 6 5,5 0,7
7 71 70 70,5 0,7 7 64 68 66,0 2,8
8 60 59 59,5 0,7 8 60 62 61,0 1,4
9 83 82 82,5 0,7 9 86 80 83,0 4,2
10 173 163 168,0 7,1 10 147 151 149,0 2,8
11 12 10 11,0 1,4 11 4 5 4,5 0,7
12 21 28 24,5 4,9 12 8 7 7,5 0,7
13 22 23 22,5 0,7 13 8 14 11,0 4,2
14 17 23 20,0 4,2 14 100 93 96,5 4,9
15 15 17 16,0 1,4 15 94 100 97,0 4,2
16 37 34 35,5 2,1 16 26 25 25,5 0,7
17 8 9 8,5 0,7 17 59 52 55,5 4,9
18 7 14 10,5 4,9 18 44 52 48,0 5,7
19 22 31 26,5 6,4 19 4 5 4,5 0,7
20 11 10 10,5 0,7 20 16 18 17,0 1,4
21 5 6 5,5 0,7 21 31 27 29,0 2,8
22 27 21 24,0 4,2 22 33 17 25,0 11,3
23 11 11 11,0 0,0 23 11 8 9,5 2,1
24 20 33 26,5 9,2 24 17 12 14,5 3,5
25 43 37 40,0 4,2 25 18 36 27,0 12,7
26 51 57 54,0 4,2 26 27 34 30,5 4,9
27 12 4 8,0 5,7 27 5 4 4,5 0,7
28 38 39 38,5 0,7 28 22 22 22,0 0,0
29 51 51 51,0 0,0 29 59 57 58,0 1,4
30 39 44 41,5 3,5 30 29 48 38,5 13,4
31 67 64 65,5 2,1 31 60 70 65,0 7,1
32 20 27 23,5 4,9 32 24 34 29,0 7,1
33 20 26 23,0 4,2 33 25 25 25,0 0,0
34 19 21 20,0 1,4 34 11 9 10,0 1,4
35 21 23 22,0 1,4 35 16 13 14,5 2,1
36 61 55 58,0 4,2 36 36 39 37,5 2,1
37 8 6 7,0 1,4 37 6 9 7,5 2,1
38 47 49 48,0 1,4 38 39 40 39,5 0,7
39 22 22 22,0 0,0 39 16 23 19,5 4,9
40 33 29 31,0 2,8 40 27 32 29,5 3,5
41 46 48 47,0 1,4 41 30 28 29,0 1,4
42 12 23 17,5 7,8 42 10 16 13,0 4,2
43 46 49 47,5 2,1 43 45 41 43,0 2,8
Difference
2,5
2,0
-26,5
-5,5
-6,0
-4,5
-4,5
1,5
0,5
-19,0
-6,5
-17,0
-11,5
76,5
81,0
-10,0
47,0
37,5
-22,0
6,5
23,5
1,0
-1,5
-12,0
-13,0
-23,5
-3,5
-16,5
7,0
-3,0
-0,5
5,5
2,0
-10,0
-7,5
-20,5
0,5
-8,5
-2,5
-1,5
-18,0
-4,5
-4,5
Relative accuracy - Total coliforms
q= 43 Mx= 35,0 My= 35,2 M= 0,2
n= 2 MEDx= 24,5 MEDy= 29,0 MED= -4,5
N=qn= 86 SDbx= 28,7 SDby= 29,8 Bias
MEDwx = 2,1 MEDwy = 2,8
SDwx= 4,2 SDwy= 4,9
rob. SDwx= 3,1 rob. SDwy= 4,2
AFNOR Validation
Summary report
RAPID’ E.coli 2
V0 April 2019
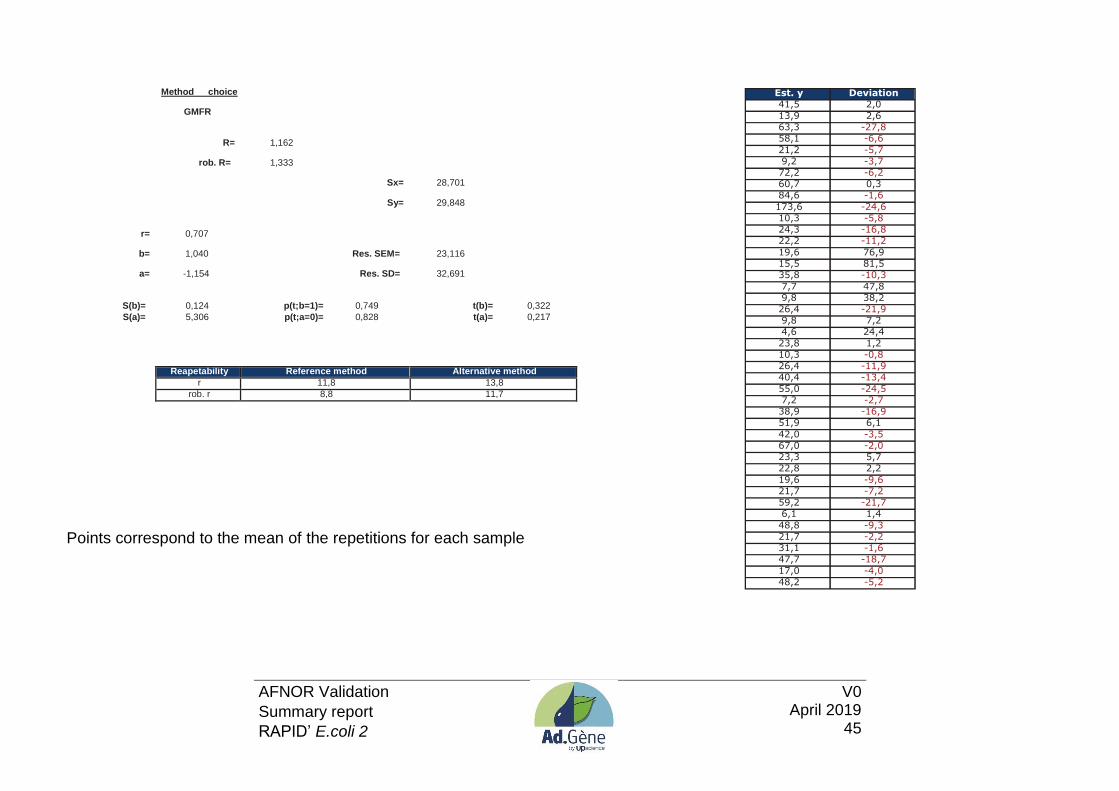
45
Method choice
GMFR
R= 1,162
rob. R= 1,333
Sx= 28,701
Sy= 29,848
r= 0,707
b= 1,040 Res. SEM= 23,116
a= -1,154 Res. SD= 32,691
S(b)= 0,124 p(t;b=1)= 0,749 t(b)= 0,322
S(a)= 5,306 p(t;a=0)= 0,828 t(a)= 0,217
Reapetability Reference method Alternative method
r 11,8 13,8
rob. r 8,8 11,7
Points correspond to the mean of the repetitions for each sample
Est. y Deviation
41,5 2,0
13,9 2,6
63,3 -27,8
58,1 -6,6
21,2 -5,7
9,2 -3,7
72,2 -6,2
60,7 0,3
84,6 -1,6
173,6 -24,6
10,3 -5,8
24,3 -16,8
22,2 -11,2
19,6 76,9
15,5 81,5
35,8 -10,3
7,7 47,8
9,8 38,2
26,4 -21,9
9,8 7,2
4,6 24,4
23,8 1,2
10,3 -0,8
26,4 -11,9
40,4 -13,4
55,0 -24,5
7,2 -2,7
38,9 -16,9
51,9 6,1
42,0 -3,5
67,0 -2,0
23,3 5,7
22,8 2,2
19,6 -9,6
21,7 -7,2
59,2 -21,7
6,1 1,4
48,8 -9,3
21,7 -2,2
31,1 -1,6
47,7 -18,7
17,0 -4,0
48,2 -5,2
AFNOR Validation
Summary report
RAPID’ E.coli 2
V0 April 2019
46

AFNOR Validation
Summary report
RAPID’ E.coli 2
V0 April 2019
47
Reference method Alternative method
Sample Replicate 1 Replicate 2 M SD Sample Replicate 1 Replicate 2 M SD
1 1,580 1,643 1,612 0,045 1 1,591 1,681 1,636 0,064
2 1,204 1,114 1,159 0,064 2 1,230 1,204 1,217 0,019
3 1,799 1,785 1,792 0,010 3 1,580 1,519 1,549 0,043
4 1,663 1,833 1,748 0,120 4 1,672 1,748 1,710 0,054
5 1,322 1,342 1,332 0,014 5 0,954 1,342 1,148 0,274
6 0,954 1,041 0,998 0,062 6 0,699 0,778 0,739 0,056
7 1,851 1,845 1,848 0,004 7 1,806 1,833 1,819 0,019
8 1,778 1,771 1,775 0,005 8 1,778 1,792 1,785 0,010
9 1,919 1,914 1,916 0,004 9 1,934 1,903 1,919 0,022
10 2,238 2,212 2,225 0,018 10 2,167 2,179 2,173 0,008
11 1,079 1,000 1,040 0,056 11 0,602 0,699 0,651 0,069
12 1,322 1,447 1,385 0,088 12 0,903 0,845 0,874 0,041
13 1,342 1,362 1,352 0,014 13 0,903 1,146 1,025 0,172
14 1,230 1,362 1,296 0,093 14 2,000 1,968 1,984 0,022
15 1,176 1,230 1,203 0,038 15 1,973 2,000 1,987 0,019
16 1,568 1,531 1,550 0,026 16 1,415 1,398 1,406 0,012
17 0,903 0,954 0,929 0,036 17 1,771 1,716 1,743 0,039
18 0,845 1,146 0,996 0,213 18 1,643 1,716 1,680 0,051
19 1,342 1,491 1,417 0,105 19 0,602 0,699 0,651 0,069
20 1,041 1,000 1,021 0,029 20 1,204 1,255 1,230 0,036
21 0,699 0,778 0,739 0,056 21 1,491 1,431 1,461 0,042
22 1,431 1,322 1,377 0,077 22 1,519 1,230 1,374 0,204
23 1,041 1,041 1,041 0,000 23 1,041 0,903 0,972 0,098
24 1,301 1,519 1,410 0,154 24 1,230 1,079 1,155 0,107
25 1,633 1,568 1,601 0,046 25 1,255 1,556 1,406 0,213
26 1,708 1,756 1,732 0,034 26 1,431 1,531 1,481 0,071
27 1,079 0,602 0,841 0,337 27 0,699 0,602 0,651 0,069
28 1,580 1,591 1,585 0,008 28 1,342 1,342 1,342 0,000
29 1,708 1,708 1,708 0,000 29 1,771 1,756 1,763 0,011
30 1,591 1,643 1,617 0,037 30 1,462 1,681 1,572 0,155
31 1,826 1,806 1,816 0,014 31 1,778 1,845 1,812 0,047
32 1,301 1,431 1,366 0,092 32 1,380 1,531 1,456 0,107
33 1,301 1,415 1,358 0,081 33 1,398 1,398 1,398 0,000
34 1,279 1,322 1,300 0,031 34 1,041 0,954 0,998 0,062
35 1,322 1,362 1,342 0,028 35 1,204 1,114 1,159 0,064
36 1,785 1,740 1,763 0,032 36 1,556 1,591 1,574 0,025
37 0,903 0,778 0,841 0,088 37 0,778 0,954 0,866 0,125
38 1,672 1,690 1,681 0,013 38 1,591 1,602 1,597 0,008
39 1,342 1,342 1,342 0,000 39 1,204 1,362 1,283 0,111
40 1,519 1,462 1,490 0,040 40 1,431 1,505 1,468 0,052
41 1,663 1,681 1,672 0,013 41 1,477 1,447 1,462 0,021
42 1,079 1,362 1,220 0,200 42 1,000 1,204 1,102 0,144
43 1,663 1,690 1,676 0,019 43 1,653 1,613 1,633 0,029
Difference
0,025
0,058
-0,243
-0,037
-0,184
-0,259
-0,029
0,011
0,002
-0,052
-0,389
-0,511
-0,327
0,688
0,783
-0,143
0,815
0,684
-0,766
0,209
0,723
-0,002
-0,069
-0,255
-0,195
-0,250
-0,190
-0,243
0,056
-0,045
-0,005
0,090
0,040
-0,303
-0,183
-0,189
0,026
-0,085
-0,059
-0,022
-0,210
-0,118
-0,043
Relative accuracy - Total coliforms - Logarithmic data
q= 43 Mx= 1,421 My= 1,393 M= -0,028
n= 2 MEDx= 1,385 MEDy= 1,456 MED= -0,052
N=qn= 86 SDbx= 0,333 SDby= 0,385 Bias
MEDwx = 0,036 MEDwy = 0,051
SDwx= 0,087 SDwy= 0,091
rob. SDwx= 0,054 rob. SDwy= 0,076

AFNOR Validation
Summary report
RAPID’ E.coli 2
V0 April 2019
48
Method choice
GMFR
R= 1,044
rob. R= 1,418
Sx= 0,337
Sy= 0,389
r= 0,588
b= 1,154 Res. SEM= 0,354
a= -0,246 Res. SD= 0,500
S(b)= 0,162 p(t;b=1)= 0,346 t(b)= 0,948
S(a)= 0,548 p(t;a=0)= 0,654 t(a)= 0,450
Reapetability Reference method Alternative method
r 0,243 0,254
rob. r 0,150 0,213
Points correspond to the mean of the repetitions for each sample
Est. y Deviation
1,613 0,023 1,091 0,126
1,821 -0,272
1,770 -0,060
1,291 -0,142
0,905 -0,166
1,886 -0,066
1,801 -0,016
1,965 -0,046
2,321 -0,148
0,953 -0,303
1,351 -0,477
1,314 -0,289
1,249 0,735
1,142 0,845
1,542 -0,135
0,825 0,918
0,902 0,777
1,388 -0,738
0,931 0,298
0,606 0,856
1,342 0,032
0,955 0,017
1,380 -0,225
1,601 -0,195
1,752 -0,270
0,724 -0,073
1,583 -0,240
1,724 0,040
1,619 -0,048
1,849 -0,037
1,330 0,126
1,320 0,078
1,254 -0,256
1,302 -0,143
1,787 -0,214
0,724 0,143
1,693 -0,097
1,302 -0,019
1,473 -0,005
1,683 -0,220
1,162 -0,060
1,688 -0,055

AFNOR Validation
Summary report
RAPID’ E.coli 2
V0 April 2019
49

AFNOR Validation
Summary report
RAPID’ E.coli 2
V0 April 2019
50
Reference method Alternative method
Sample Replicate 1 Replicate 2 M SD Sample Replicate 1 Replicate 2 M SD
1 16 13 14,500 2,121 1 17 16 16,500 0,707
2 63 61 62,000 1,414 2 38 33 35,500 3,536
3 46 68 57,000 15,556 3 47 56 51,500 6,364
4 9 11 10,000 1,414 4 5 6 5,500 0,707
5 71 70 70,500 0,707 5 64 68 66,000 2,828
6 60 59 59,500 0,707 6 60 62 61,000 1,414 7 83 82 82,500 0,707 7 86 80 83,000 4,243
8 173 163 168,000 7,071 8 147 151 149,000 2,828
9 12 10 11,000 1,414 9 4 5 4,500 0,707
10 21 28 24,500 4,950 10 8 7 7,500 0,707
11 22 23 22,500 0,707 11 8 14 11,000 4,243
12 240 150 195,000 63,640 12 110 60 85,000 35,355
13 220 150 185,000 49,497 13 90 150 120,000 42,426
14 120 70 95,000 35,355 14 80 30 55,000 35,355
15 37 34 35,500 2,121 15 26 25 25,500 0,707
16 11 11 11,000 0,000 16 11 8 9,500 2,121
17 20 33 26,500 9,192 17 17 12 14,500 3,536
18 43 37 40,000 4,243 18 18 36 27,000 12,728
19 51 57 54,000 4,243 19 27 34 30,500 4,950
20 12 4 8,000 5,657 20 5 4 4,500 0,707
21 38 39 38,500 0,707 21 22 22 22,000 0,000
22 51 51 51,000 0,000 22 59 57 58,000 1,414
23 39 44 41,500 3,536 23 29 48 38,500 13,435
24 67 64 65,500 2,121 24 60 70 65,000 7,071
25 20 27 23,500 4,950 25 23 33 28,000 7,071
26 20 26 23,000 4,243 26 25 25 25,000 0,000
27 19 21 20,000 1,414 27 11 9 10,000 1,414
28 21 23 22,000 1,414 28 16 13 14,500 2,121
29 61 55 58,000 4,243 29 36 39 37,500 2,121
30 8 6 7,000 1,414 30 6 9 7,500 2,121
31 47 49 48,000 1,414 31 39 40 39,500 0,707
32 22 22 22,000 0,000 32 16 23 19,500 4,950
33 33 29 31,000 2,828 33 27 32 29,500 3,536
34 46 48 47,000 1,414 34 30 28 29,000 1,414
35 12 23 17,500 7,778 35 10 16 13,000 4,243
36 46 49 47,500 2,121 36 45 41 43,000 2,828
Difference
2,0
-26,5
-5,5
-4,5
-4,5
1,5
0,5
-19,0
-6,5
-17,0
-11,5
-110,0
-65,0
-40,0
-10,0
-1,5
-12,0
-13,0
-23,5
-3,5
-16,5
7,0
-3,0
-0,5
4,5
2,0
-10,0
-7,5
-20,5
0,5
-8,5
-2,5
-1,5
-18,0
-4,5
-4,5
Relative accuracy - E. coli
q= 36 Mx= 49,9 My= 37,3 M= -12,6 n= 2 MEDx= 39,3 MEDy= 28,5 MED= -6,0
N=qn= 72 SDbx= 46,2 SDby= 32,6 Bias
MEDwx = 2,1 MEDwy = 2,8
SDwx= 15,3 SDwy= 11,8
rob. SDwx= 3,1 rob. SDwy= 4,2
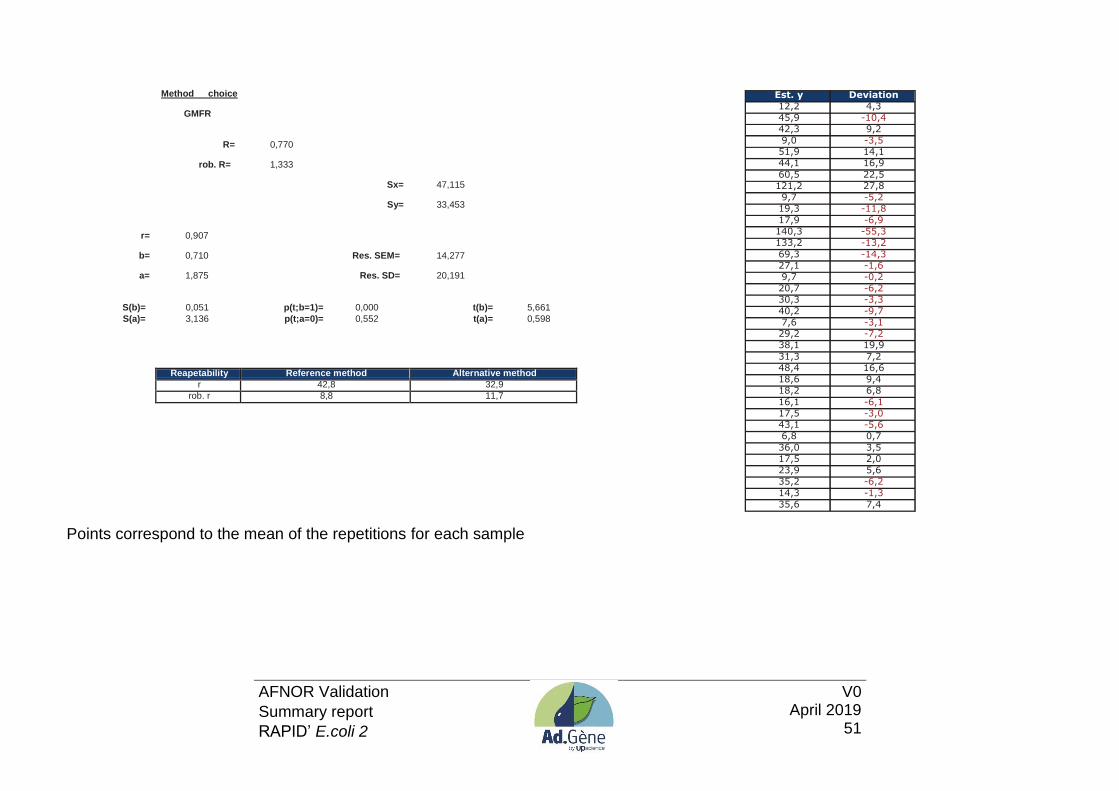
AFNOR Validation
Summary report
RAPID’ E.coli 2
V0 April 2019
51
Method choice
GMFR
R= 0,770
rob. R= 1,333
Sx= 47,115
Sy= 33,453
r= 0,907
b= 0,710 Res. SEM= 14,277
a= 1,875 Res. SD= 20,191
S(b)= 0,051 p(t;b=1)= 0,000 t(b)= 5,661
S(a)= 3,136 p(t;a=0)= 0,552 t(a)= 0,598
Reapetability Reference method Alternative method
r 42,8 32,9
rob. r 8,8 11,7
Points correspond to the mean of the repetitions for each sample
Est. y Deviation
12,2 4,3
45,9 -10,4
42,3 9,2
9,0 -3,5
51,9 14,1
44,1 16,9
60,5 22,5
121,2 27,8
9,7 -5,2
19,3 -11,8
17,9 -6,9
140,3 -55,3
133,2 -13,2
69,3 -14,3
27,1 -1,6
9,7 -0,2
20,7 -6,2
30,3 -3,3
40,2 -9,7
7,6 -3,1
29,2 -7,2
38,1 19,9
31,3 7,2
48,4 16,6
18,6 9,4
18,2 6,8
16,1 -6,1
17,5 -3,0
43,1 -5,6
6,8 0,7
36,0 3,5
17,5 2,0
23,9 5,6
35,2 -6,2
14,3 -1,3
35,6 7,4

AFNOR Validation
Summary report
RAPID’ E.coli 2
V0 April 2019
52

AFNOR Validation
Summary report
RAPID’ E.coli 2
V0 April 2019
53
Reference method Alternative method
Sample Replicate 1 Replicate 2 M SD Sample Replicate 1 Replicate 2 M SD
1 1,204 1,114 1,159 0,064 1 1,230 1,204 1,217 0,019
2 1,799 1,785 1,792 0,010 2 1,580 1,519 1,549 0,043
3 1,663 1,833 1,748 0,120 3 1,672 1,748 1,710 0,054
4 0,954 1,041 0,998 0,062 4 0,699 0,778 0,739 0,056
5 1,851 1,845 1,848 0,004 5 1,806 1,833 1,819 0,019
6 1,778 1,771 1,775 0,005 6 1,778 1,792 1,785 0,010
7 1,919 1,914 1,916 0,004 7 1,934 1,903 1,919 0,022
8 2,238 2,212 2,225 0,018 8 2,167 2,179 2,173 0,008
9 1,079 1,000 1,040 0,056 9 0,602 0,699 0,651 0,069
10 1,322 1,447 1,385 0,088 10 0,903 0,845 0,874 0,041
11 1,342 1,362 1,352 0,014 11 0,903 1,146 1,025 0,172
12 2,380 2,176 2,278 0,144 12 2,041 1,778 1,910 0,186
13 2,342 2,176 2,259 0,118 13 1,954 2,176 2,065 0,157
14 2,079 1,845 1,962 0,166 14 1,903 1,477 1,690 0,301
15 1,568 1,531 1,550 0,026 15 1,415 1,398 1,406 0,012
16 1,041 1,041 1,041 0,000 16 1,041 0,903 0,972 0,098
17 1,301 1,519 1,410 0,154 17 1,230 1,079 1,155 0,107
18 1,633 1,568 1,601 0,046 18 1,255 1,556 1,406 0,213
19 1,708 1,756 1,732 0,034 19 1,431 1,531 1,481 0,071
20 1,079 0,602 0,841 0,337 20 0,699 0,602 0,651 0,069
21 1,580 1,591 1,585 0,008 21 1,342 1,342 1,342 0,000
22 1,708 1,708 1,708 0,000 22 1,771 1,756 1,763 0,011
23 1,591 1,643 1,617 0,037 23 1,462 1,681 1,572 0,155
24 1,826 1,806 1,816 0,014 24 1,778 1,845 1,812 0,047
25 1,301 1,431 1,366 0,092 25 1,362 1,519 1,440 0,111
26 1,301 1,415 1,358 0,081 26 1,398 1,398 1,398 0,000
27 1,279 1,322 1,300 0,031 27 1,041 0,954 0,998 0,062
28 1,322 1,362 1,342 0,028 28 1,204 1,114 1,159 0,064
29 1,785 1,740 1,763 0,032 29 1,556 1,591 1,574 0,025
30 0,903 0,778 0,841 0,088 30 0,778 0,954 0,866 0,125
31 1,672 1,690 1,681 0,013 31 1,591 1,602 1,597 0,008
32 1,342 1,342 1,342 0,000 32 1,204 1,362 1,283 0,111
33 1,519 1,462 1,490 0,040 33 1,431 1,505 1,468 0,052
34 1,663 1,681 1,672 0,013 34 1,477 1,447 1,462 0,021
35 1,079 1,362 1,220 0,200 35 1,000 1,204 1,102 0,144
36 1,663 1,690 1,676 0,019 36 1,653 1,613 1,633 0,029
Difference
0,058
-0,243
-0,037
-0,259
-0,029
0,011
0,002
-0,052
-0,389
-0,511
-0,327
-0,368
-0,194
-0,272
-0,143
-0,069
-0,255
-0,195
-0,250
-0,190
-0,243
0,056
-0,045
-0,005
0,074
0,040
-0,303
-0,183
-0,189
0,026
-0,085
-0,059
-0,022
-0,210
-0,118
-0,043
Relative accuracy - E. coli - Logarithmic data
q= 36 Mx= 1,547 My= 1,407 M= -0,140
n= 2 MEDx= 1,593 MEDy= 1,451 MED= -0,131
N=qn= 72 SDbx= 0,365 SDby= 0,394 Bias
MEDwx = 0,033 MEDwy = 0,055
SDwx= 0,092 SDwy= 0,102
rob. SDwx= 0,049 rob. SDwy= 0,081
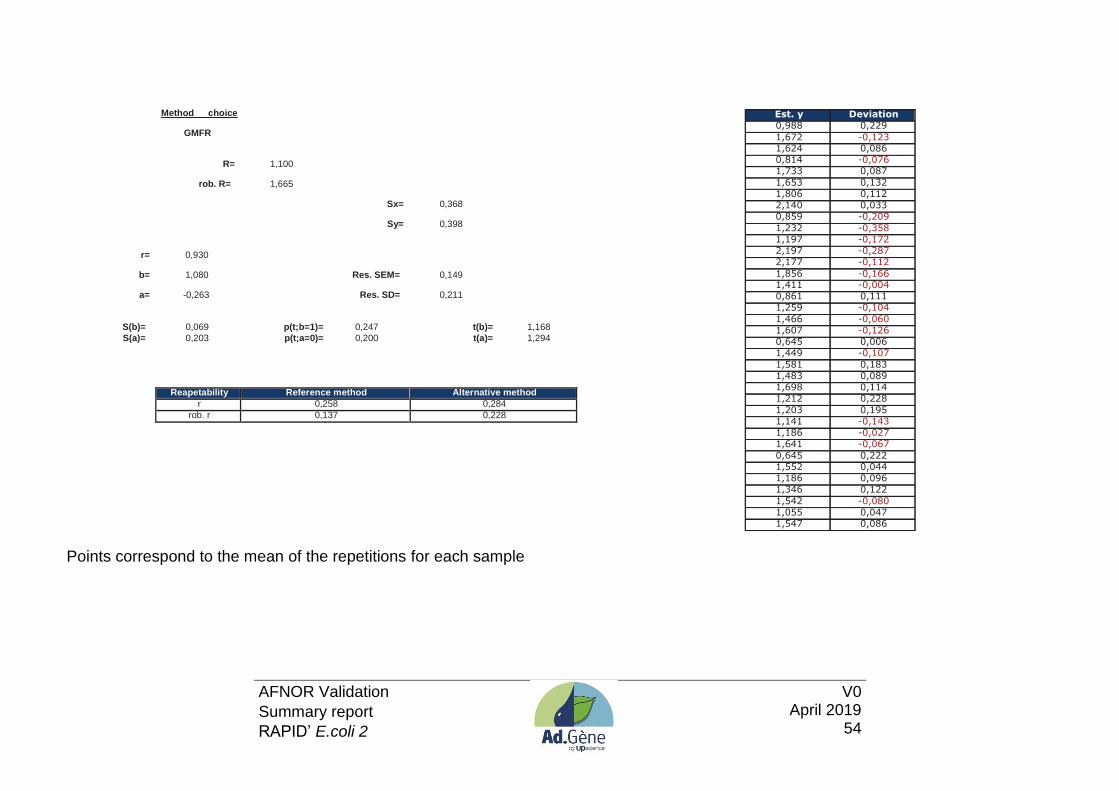
AFNOR Validation
Summary report
RAPID’ E.coli 2
V0 April 2019
54
Method choice
GMFR
R= 1,100
rob. R= 1,665
Sx= 0,368
Sy= 0,398
r= 0,930
b= 1,080 Res. SEM= 0,149
a= -0,263 Res. SD= 0,211
S(b)= 0,069 p(t;b=1)= 0,247 t(b)= 1,168
S(a)= 0,203 p(t;a=0)= 0,200 t(a)= 1,294
Reapetability Reference method Alternative method
r 0,258 0,284
rob. r 0,137 0,228
Points correspond to the mean of the repetitions for each sample
Est. y Deviation
0,988 0,229
1,672 -0,123 1,624 0,086
0,814 -0,076
1,733 0,087
1,653 0,132
1,806 0,112
2,140 0,033
0,859 -0,209
1,232 -0,358
1,197 -0,172
2,197 -0,287
2,177 -0,112
1,856 -0,166 1,411 -0,004
0,861 0,111
1,259 -0,104
1,466 -0,060
1,607 -0,126
0,645 0,006
1,449 -0,107
1,581 0,183
1,483 0,089
1,698 0,114
1,212 0,228
1,203 0,195
1,141 -0,143
1,186 -0,027
1,641 -0,067
0,645 0,222
1,552 0,044
1,186 0,096
1,346 0,122
1,542 -0,080
1,055 0,047
1,547 0,086

AFNOR Validation
Summary report
RAPID’ E.coli 2
V0 April 2019
55

AFNOR Validation
Summary report
RAPID’ E.coli 2
V0 April 2019
56
Appendix 5– Linearity raw data
Legend
cat : catégorie du domaine d'application
CA : contamination artificielle
lac+ : fermentation du lactose positive
ox+ : test oxydase positif
indole + : test indole positif
GAL : souche ayant (+) ou non (-) une activité -D-Galactosidase
GLUC : souche ayant (+) ou non (-) une activité -D-Glucuronidase
R1 : réplicat 1
R2 : réplicat 2 C : somme des colonies sur la boîte comptée
Ctot : coliformes totaux
EC : E. coli
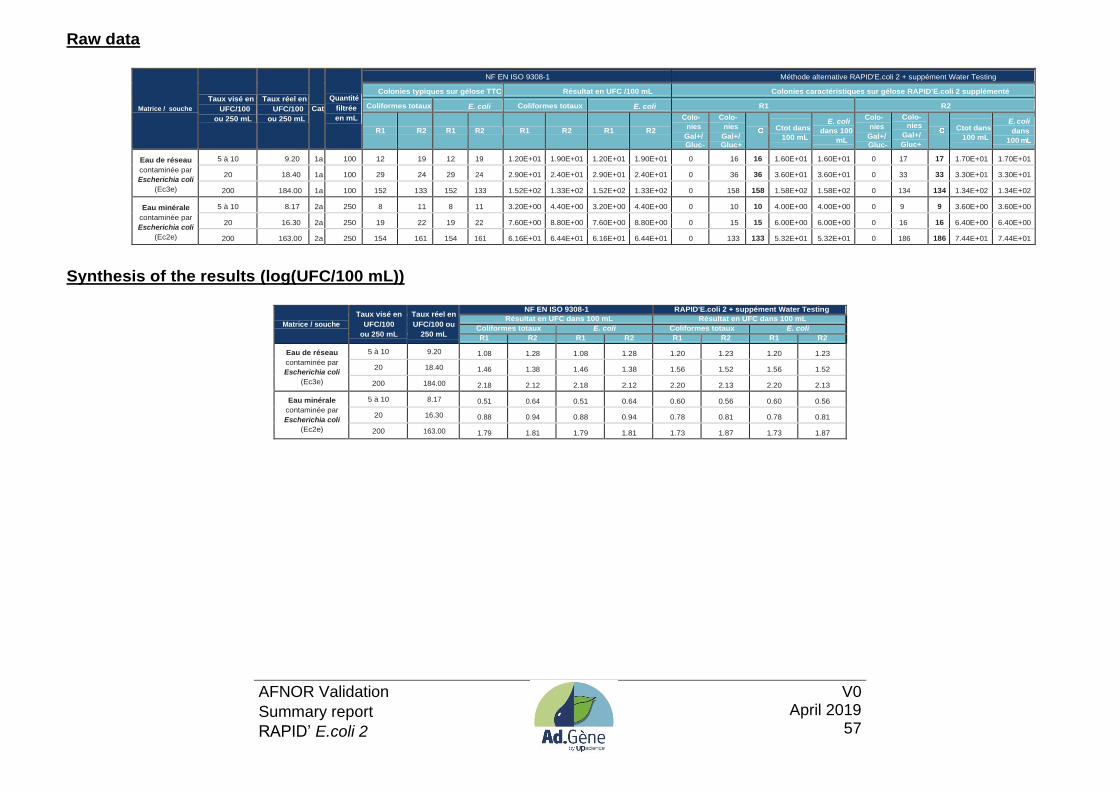
AFNOR Validation
Summary report
RAPID’ E.coli 2
V0 April 2019
57
Raw data
Matrice / souche
Taux visé en
UFC/100
ou 250 mL
Taux réel en
UFC/100
ou 250 mL
Cat
Quantité
filtrée
en mL
NF EN ISO 9308-1 Méthode alternative RAPID'E.coli 2 + suppément Water Testing
Colonies typiques sur gélose TTC Résultat en UFC /100 mL Colonies caractéristiques sur gélose RAPID'E.coli 2 supplémenté
Coliformes totaux E. coli Coliformes totaux E. coli R1 R2
R1 R2 R1 R2 R1 R2 R1 R2
Colo-
nies
Gal+/
Gluc-
Colo-
nies
Gal+/
Gluc+
Ctot dans
100 mL
E. coli
dans 100
mL
Colo-
nies
Gal+/
Gluc-
Colo-nies
Gal+/
Gluc+
Ctot dans
100 mL
E. coli
dans
100 mL
Eau de réseau
contaminée par
Escherichia coli
(Ec3e)
5 à 10 9.20 1a 100 12 19 12 19 1.20E+01 1.90E+01 1.20E+01 1.90E+01 0 16 16 1.60E+01 1.60E+01 0 17 17 1.70E+01 1.70E+01
20 18.40 1a 100 29 24 29 24 2.90E+01 2.40E+01 2.90E+01 2.40E+01 0 36 36 3.60E+01 3.60E+01 0 33 33 3.30E+01 3.30E+01
200 184.00 1a 100 152 133 152 133 1.52E+02 1.33E+02 1.52E+02 1.33E+02 0 158 158 1.58E+02 1.58E+02 0 134 134 1.34E+02 1.34E+02
Eau minérale
contaminée par
Escherichia coli
(Ec2e)
5 à 10 8.17 2a 250 8 11 8 11 3.20E+00 4.40E+00 3.20E+00 4.40E+00 0 10 10 4.00E+00 4.00E+00 0 9 9 3.60E+00 3.60E+00
20 16.30 2a 250 19 22 19 22 7.60E+00 8.80E+00 7.60E+00 8.80E+00 0 15 15 6.00E+00 6.00E+00 0 16 16 6.40E+00 6.40E+00
200 163.00 2a 250 154 161 154 161 6.16E+01 6.44E+01 6.16E+01 6.44E+01 0 133 133 5.32E+01 5.32E+01 0 186 186 7.44E+01 7.44E+01
Synthesis of the results (log(UFC/100 mL))
Matrice / souche
Taux visé en
UFC/100
ou 250 mL
Taux réel en
UFC/100 ou
250 mL
NF EN ISO 9308-1 RAPID'E.coli 2 + suppément Water Testing
Résultat en UFC dans 100 mL Résultat en UFC dans 100 mL
Coliformes totaux E. coli Coliformes totaux E. coli
R1 R2 R1 R2 R1 R2 R1 R2
Eau de réseau
contaminée par
Escherichia coli
(Ec3e)
5 à 10 9.20 1.08 1.28 1.08 1.28 1.20 1.23 1.20 1.23
20 18.40 1.46 1.38 1.46 1.38 1.56 1.52 1.56 1.52
200 184.00 2.18 2.12 2.18 2.12 2.20 2.13 2.20 2.13
Eau minérale
contaminée par
Escherichia coli
(Ec2e)
5 à 10 8.17 0.51 0.64 0.51 0.64 0.60 0.56 0.60 0.56
20 16.30 0.88 0.94 0.88 0.94 0.78 0.81 0.78 0.81
200 163.00 1.79 1.81 1.79 1.81 1.73 1.87 1.73 1.87
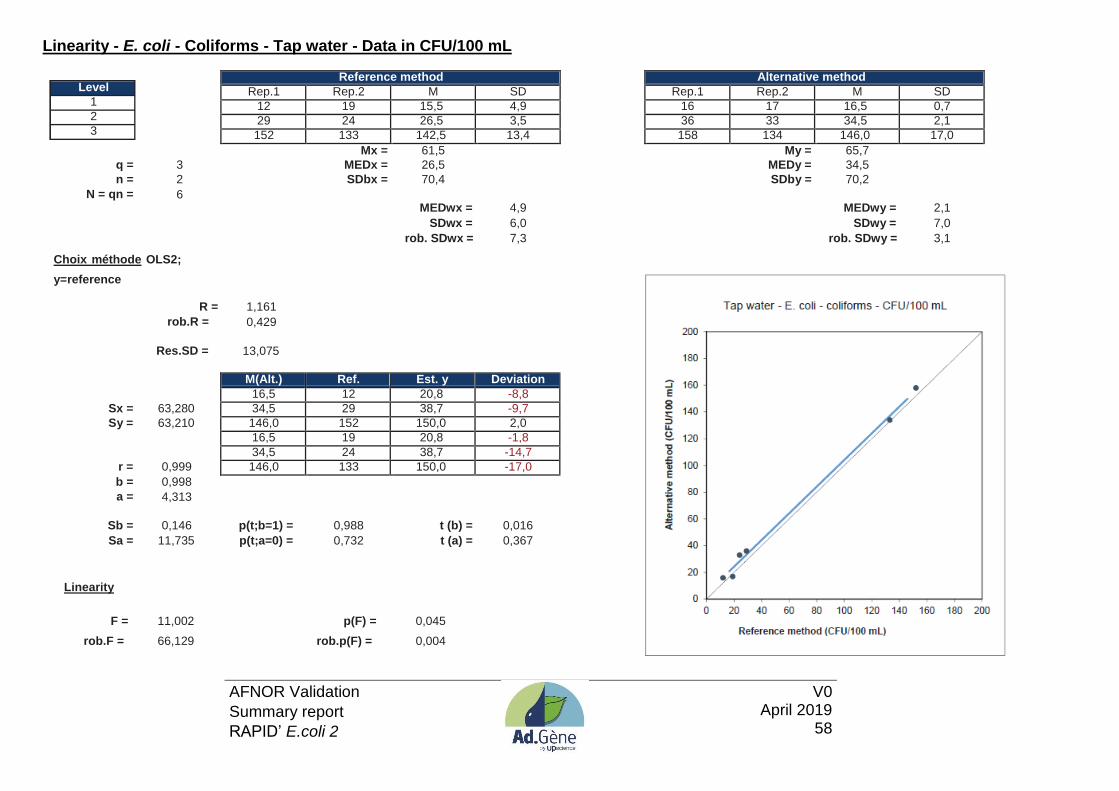
AFNOR Validation
Summary report
RAPID’ E.coli 2
V0 April 2019
58
Linearity - E. coli - Coliforms - Tap water - Data in CFU/100 mL
Reference method Alternative method Rep.1 Rep.2 M SD Rep.1 Rep.2 M SD 12 19 15,5 4,9 16 17 16,5 0,7 29 24 26,5 3,5 36 33 34,5 2,1 152 133 142,5 13,4 158 134 146,0 17,0 Mx = 61,5 My = 65,7
q = 3 MEDx = 26,5 MEDy = 34,5
n = 2 SDbx = 70,4 SDby = 70,2
N = qn = 6 MEDwx =
4,9
MEDwy =
2,1
SDwx = 6,0 SDwy = 7,0 rob. SDwx = 7,3 rob. SDwy = 3,1
Choix méthode OLS2;
y=reference
R = 1,161
rob.R = 0,429
Res.SD = 13,075
M(Alt.) Ref. Est. y Deviation 16,5 12 20,8 -8,8
Sx = 63,280 34,5 29 38,7 -9,7
Sy = 63,210 146,0 152 150,0 2,0 16,5 19 20,8 -1,8 34,5 24 38,7 -14,7
r = 0,999 146,0 133 150,0 -17,0
b = 0,998
a = 4,313
Sb = 0,146 p(t;b=1) = 0,988 t (b) = 0,016
Sa = 11,735 p(t;a=0) = 0,732 t (a) = 0,367
Linearity
F = 11,002 p(F) = 0,045
rob.F = 66,129 rob.p(F) = 0,004
Level
1
2
3
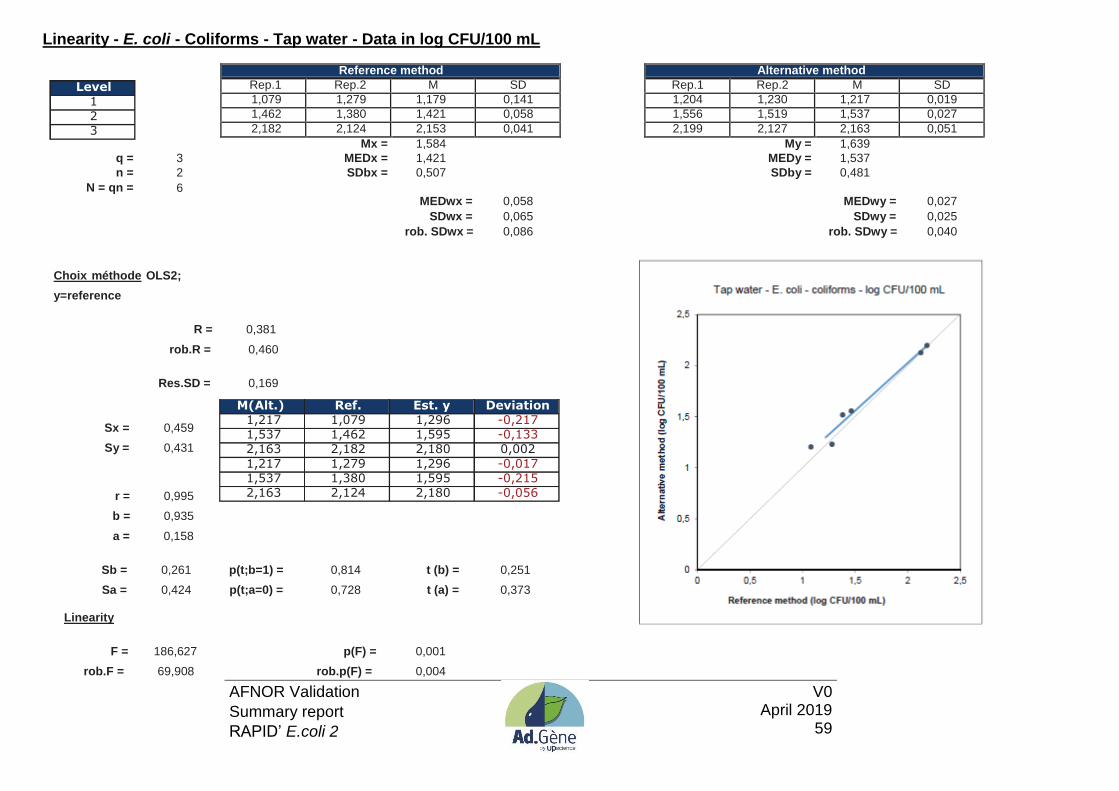
AFNOR Validation
Summary report
RAPID’ E.coli 2
V0 April 2019
59
Linearity - E. coli - Coliforms - Tap water - Data in log CFU/100 mL
Reference method Alternative method Rep.1 Rep.2 M SD Rep.1 Rep.2 M SD 1,079 1,279 1,179 0,141 1,204 1,230 1,217 0,019 1,462 1,380 1,421 0,058 1,556 1,519 1,537 0,027 2,182 2,124 2,153 0,041 2,199 2,127 2,163 0,051 Mx = 1,584 My = 1,639
q = 3 MEDx = 1,421 MEDy = 1,537
n = 2 SDbx = 0,507 SDby = 0,481
N = qn = 6 MEDwx =
0,058
MEDwy =
0,027
SDwx = 0,065 SDwy = 0,025 rob. SDwx = 0,086 rob. SDwy = 0,040
Choix méthode OLS2;
y=reference
R = 0,381
rob.R = 0,460
Res.SD = 0,169
Sx = 0,459
Sy = 0,431
r = 0,995
b = 0,935
a = 0,158
Sb = 0,261 p(t;b=1) = 0,814 t (b) = 0,251
Sa = 0,424 p(t;a=0) = 0,728 t (a) = 0,373
Linearity
F = 186,627 p(F) = 0,001
rob.F = 69,908 rob.p(F) = 0,004
Level 1
2 3
M(Alt.) Ref. Est. y Deviation 1,217 1,079 1,296 -0,217 1,537 1,462 1,595 -0,133 2,163 2,182 2,180 0,002
1,217 1,279 1,296 -0,017 1,537 1,380 1,595 -0,215
2,163 2,124 2,180 -0,056
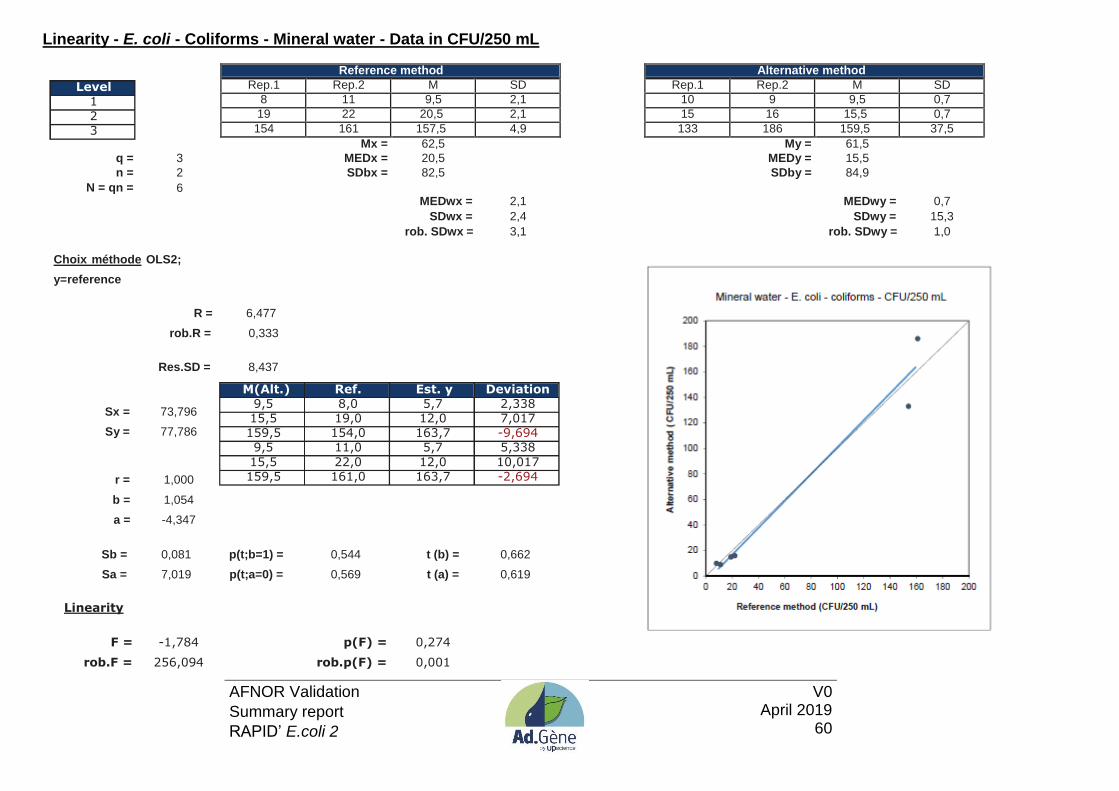
AFNOR Validation
Summary report
RAPID’ E.coli 2
V0 April 2019
60
Linearity - E. coli - Coliforms - Mineral water - Data in CFU/250 mL
Reference method Alternative method Rep.1 Rep.2 M SD Rep.1 Rep.2 M SD 8 11 9,5 2,1 10 9 9,5 0,7 19 22 20,5 2,1 15 16 15,5 0,7 154 161 157,5 4,9 133 186 159,5 37,5 Mx = 62,5 My = 61,5
q = 3 MEDx = 20,5 MEDy = 15,5
n = 2 SDbx = 82,5 SDby = 84,9
N = qn = 6 MEDwx =
2,1
MEDwy =
0,7
SDwx = 2,4 SDwy = 15,3 rob. SDwx = 3,1 rob. SDwy = 1,0
Choix méthode OLS2;
y=reference
R = 6,477
rob.R = 0,333
Res.SD = 8,437
Sx = 73,796
Sy = 77,786
r = 1,000
b = 1,054
a = -4,347
Sb = 0,081 p(t;b=1) = 0,544 t (b) = 0,662
Sa = 7,019 p(t;a=0) = 0,569 t (a) = 0,619
Linearity
F = -1,784 p(F) = 0,274
rob.F = 256,094 rob.p(F) = 0,001
Level 1
2 3
M(Alt.) Ref. Est. y Deviation 9,5 8,0 5,7 2,338 15,5 19,0 12,0 7,017 159,5 154,0 163,7 -9,694 9,5 11,0 5,7 5,338
15,5 22,0 12,0 10,017 159,5 161,0 163,7 -2,694

AFNOR Validation
Summary report
RAPID’ E.coli 2
V0 April 2019
61
Linearity - E. coli - Coliforms - Mineral water - Data in log CFU/250 mL
Reference method Alternative method Rep.1 Rep.2 M SD Rep.1 Rep.2 M SD 0,903 1,041 1,0 0,098 1,000 0,954 1,0 0,032 1,279 1,342 1,3 0,045 1,176 1,204 1,2 0,020 2,188 2,207 2,2 0,014 2,124 2,270 2,2 0,103 Mx = 1,493 My = 1,455
q = 3 MEDx = 1,311 MEDy = 1,190
n = 2 SDbx = 0,633 SDby = 0,651
N = qn = 6 MEDwx =
0,045
MEDwy =
0,032
SDwx = 0,044 SDwy = 0,045 rob. SDwx = 0,067 rob. SDwy = 0,048
Choix méthode GMFR
R = 1,011
rob.R = 0,719
Res.SEM = 0,098
Res.SD = 0,139
Sx = 0,568
Sy = 0,585
r = 0,994
b = 1,030
a = -0,083
Sb = 0,122 p(t;b=1) = 0,820 t (b) = 0,242
Sa = 0,191 p(t;a=0) = 0,687 t (a) = 0,434
Linearity
F = 35,311 p(F) = 0,010
rob.F = 30,432 rob.p(F) = 0,012
Level 1 2
3
Est y Déviation 0,918 0,059 1,266 -0,076 2,179 0,017
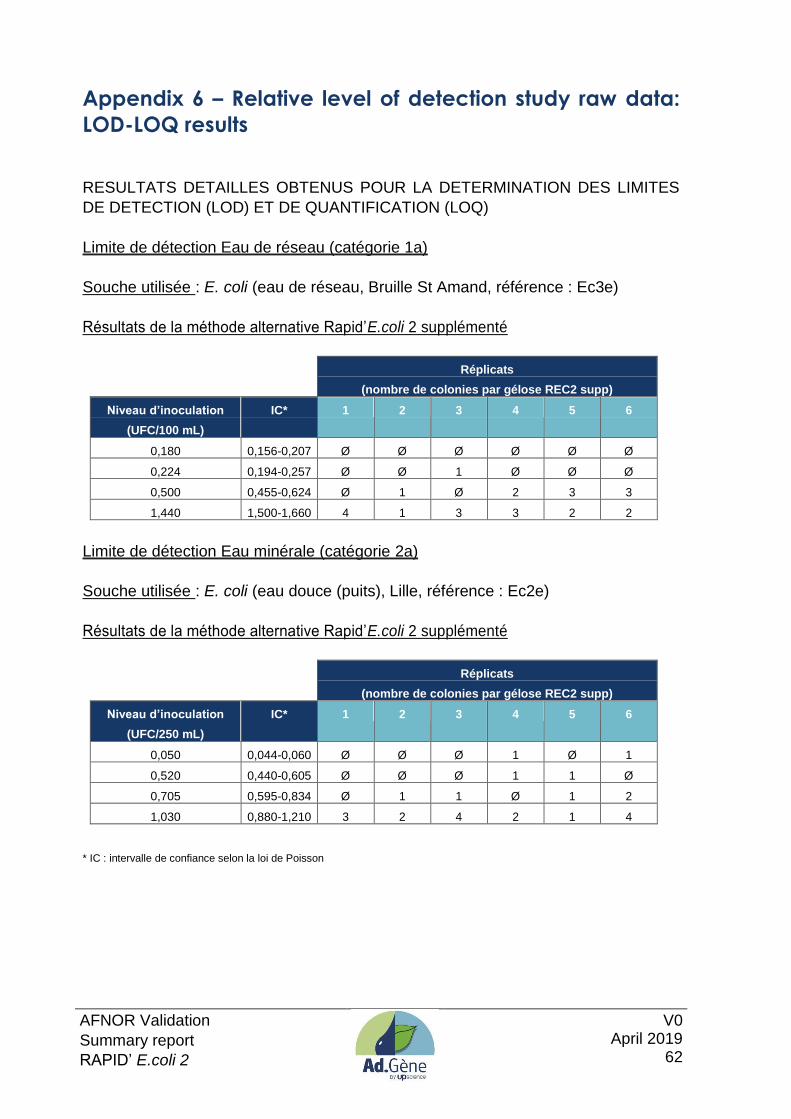
AFNOR Validation
Summary report
RAPID’ E.coli 2
V0 April 2019
62
Appendix 6 – Relative level of detection study raw data:
LOD-LOQ results
RESULTATS DETAILLES OBTENUS POUR LA DETERMINATION DES LIMITES
DE DETECTION (LOD) ET DE QUANTIFICATION (LOQ)
Limite de détection Eau de réseau (catégorie 1a)
Souche utilisée : E. coli (eau de réseau, Bruille St Amand, référence : Ec3e)
Résultats de la méthode alternative Rapid’E.coli 2 supplémenté
Réplicats
(nombre de colonies par gélose REC2 supp)
Niveau d’inoculation
(UFC/100 mL)
IC* 1 2 3 4 5 6
0,180 0,156-0,207 Ø Ø Ø Ø Ø Ø
0,224 0,194-0,257 Ø Ø 1 Ø Ø Ø
0,500 0,455-0,624 Ø 1 Ø 2 3 3
1,440 1,500-1,660 4 1 3 3 2 2
Limite de détection Eau minérale (catégorie 2a)
Souche utilisée : E. coli (eau douce (puits), Lille, référence : Ec2e)
Résultats de la méthode alternative Rapid’E.coli 2 supplémenté
Réplicats
(nombre de colonies par gélose REC2 supp)
Niveau d’inoculation
(UFC/250 mL)
IC* 1 2 3 4 5 6
0,050 0,044-0,060 Ø Ø Ø 1 Ø 1
0,520 0,440-0,605 Ø Ø Ø 1 1 Ø
0,705 0,595-0,834 Ø 1 1 Ø 1 2
1,030 0,880-1,210 3 2 4 2 1 4
* IC : intervalle de confiance selon la loi de Poisson
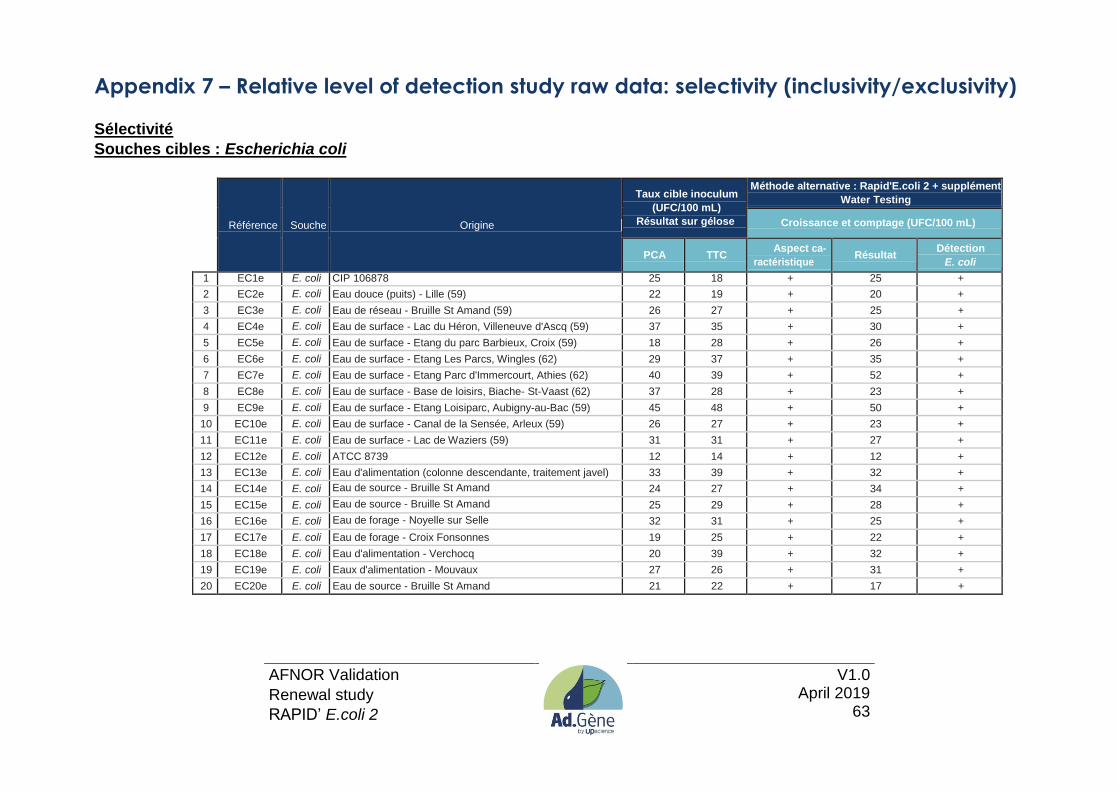
AFNOR Validation
Renewal study
RAPID’ E.coli 2
V1.0 April 2019
63
Appendix 7 – Relative level of detection study raw data: selectivity (inclusivity/exclusivity)
Sélectivité
Souches cibles : Escherichia coli
Référence Souche Origine
Taux cible inoculum
(UFC/100 mL)
Résultat sur gélose
Méthode alternative : Rapid'E.coli 2 + supplément
Water Testing
Croissance et comptage (UFC/100 mL)
PCA TTC Aspect ca-
ractéristique Résultat
Détection
E. coli
1 EC1e E. coli CIP 106878 25 18 + 25 +
2 EC2e E. coli Eau douce (puits) - Lille (59) 22 19 + 20 +
3 EC3e E. coli Eau de réseau - Bruille St Amand (59) 26 27 + 25 +
4 EC4e E. coli Eau de surface - Lac du Héron, Villeneuve d'Ascq (59) 37 35 + 30 +
5 EC5e E. coli Eau de surface - Etang du parc Barbieux, Croix (59) 18 28 + 26 +
6 EC6e E. coli Eau de surface - Etang Les Parcs, Wingles (62) 29 37 + 35 +
7 EC7e E. coli Eau de surface - Etang Parc d'Immercourt, Athies (62) 40 39 + 52 +
8 EC8e E. coli Eau de surface - Base de loisirs, Biache- St-Vaast (62) 37 28 + 23 +
9 EC9e E. coli Eau de surface - Etang Loisiparc, Aubigny-au-Bac (59) 45 48 + 50 +
10 EC10e E. coli Eau de surface - Canal de la Sensée, Arleux (59) 26 27 + 23 +
11 EC11e E. coli Eau de surface - Lac de Waziers (59) 31 31 + 27 +
12 EC12e E. coli ATCC 8739 12 14 + 12 +
13 EC13e E. coli Eau d'alimentation (colonne descendante, traitement javel) 33 39 + 32 +
14 EC14e E. coli Eau de source - Bruille St Amand 24 27 + 34 +
15 EC15e E. coli Eau de source - Bruille St Amand 25 29 + 28 +
16 EC16e E. coli Eau de forage - Noyelle sur Selle 32 31 + 25 +
17 EC17e E. coli Eau de forage - Croix Fonsonnes 19 25 + 22 +
18 EC18e E. coli Eau d'alimentation - Verchocq 20 39 + 32 +
19 EC19e E. coli Eaux d'alimentation - Mouvaux 27 26 + 31 +
20 EC20e E. coli Eau de source - Bruille St Amand 21 22 + 17 +
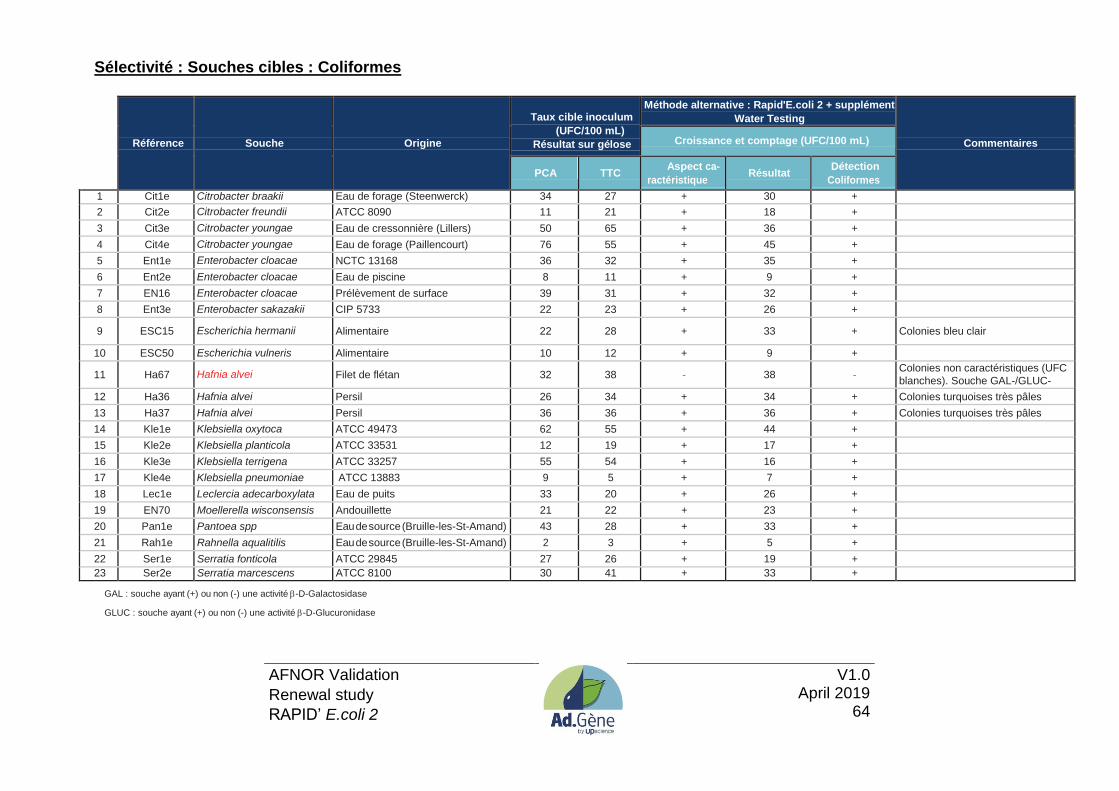
AFNOR Validation
Renewal study
RAPID’ E.coli 2
V1.0 April 2019
64
Sélectivité : Souches cibles : Coliformes
Référence Souche Origine
Taux cible inoculum
(UFC/100 mL)
Résultat sur gélose
Méthode alternative : Rapid'E.coli 2 + supplément
Water Testing
Commentaires Croissance et comptage (UFC/100 mL)
PCA TTC Aspect ca-
ractéristique Résultat
Détection
Coliformes
1 Cit1e Citrobacter braakii Eau de forage (Steenwerck) 34 27 + 30 +
2 Cit2e Citrobacter freundii ATCC 8090 11 21 + 18 +
3 Cit3e Citrobacter youngae Eau de cressonnière (Lillers) 50 65 + 36 +
4 Cit4e Citrobacter youngae Eau de forage (Paillencourt) 76 55 + 45 +
5 Ent1e Enterobacter cloacae NCTC 13168 36 32 + 35 +
6 Ent2e Enterobacter cloacae Eau de piscine 8 11 + 9 +
7 EN16 Enterobacter cloacae Prélèvement de surface 39 31 + 32 +
8 Ent3e Enterobacter sakazakii CIP 5733 22 23 + 26 +
9 ESC15 Escherichia hermanii Alimentaire 22 28 + 33 + Colonies bleu clair
10 ESC50 Escherichia vulneris Alimentaire 10 12 + 9 +
11 Ha67 Hafnia alvei Filet de flétan 32 38 - 38 - Colonies non caractéristiques (UFC
blanches). Souche GAL-/GLUC-
12 Ha36 Hafnia alvei Persil 26 34 + 34 + Colonies turquoises très pâles
13 Ha37 Hafnia alvei Persil 36 36 + 36 + Colonies turquoises très pâles
14 Kle1e Klebsiella oxytoca ATCC 49473 62 55 + 44 +
15 Kle2e Klebsiella planticola ATCC 33531 12 19 + 17 +
16 Kle3e Klebsiella terrigena ATCC 33257 55 54 + 16 +
17 Kle4e Klebsiella pneumoniae ATCC 13883 9 5 + 7 +
18 Lec1e Leclercia adecarboxylata Eau de puits 33 20 + 26 +
19 EN70 Moellerella wisconsensis Andouillette 21 22 + 23 +
20 Pan1e Pantoea spp Eau de source (Bruille-les-St-Amand) 43 28 + 33 +
21 Rah1e Rahnella aqualitilis Eau de source (Bruille-les-St-Amand) 2 3 + 5 +
22 Ser1e Serratia fonticola ATCC 29845 27 26 + 19 +
23 Ser2e Serratia marcescens ATCC 8100 30 41 + 33 +
GAL : souche ayant (+) ou non (-) une activité -D-Galactosidase
GLUC : souche ayant (+) ou non (-) une activité -D-Glucuronidase

AFNOR Validation
Renewal study
RAPID’ E.coli 2
V1.0 April 2019
65
Sélectivité : Souches non cibles
Référence Souche Origine
Taux cible ino-
culum (UFC/100
mL)
sur PCA
Méthode alternative
Rapid'E.coli 2 + supplément Water Testing Commentaires
Colonies sur gélose REC2 supp Détection
E.coli /Coliformes
1 Aci1e Acinetobacter johnsonii CIP 64.6T 5.00E+03 pas de croissance -
2 Aer1e Aeromonas hydro/caviae Eau de forage (Wattrelos) 2.50E+04 colonies non caractéristiques -
3 Aer2e Aeromonas sp ATCC 7966 2.40E+06 pas de croissance -
4 Ba 47 Bacillus badius Environnement 1.80E+04 pas de croissance -
5 Ba1e Bacillus cereus CIP 64.52 2.80E+03 pas de croissance -
6 Ba 26 Bacillus circulans Environnement 3.20E+05 pas de croissance -
7 Ba 24 Bacillus mycoides Environnement (sol) 7.00E+04 pas de croissance -
8 Ba2e Bacillus subtilis ATCC 6633 1.00E+03 pas de croissance -
9 Cor1e Corynebacterium propinquum IPL, eau douce (réseau) 7.80E+04 pas de croissance -
10 17 Erwinia spp Alimentaire 9.10E+02 colonies vertes + Colonies non caractéristiques sur
TTC. GAL+/GLUC-
11 Prot1e Proteus mirabilis Eau de rivière 7.80E+03 petites colonies non caractéristiques -
12 Prot2e Proteus vulgaris Eau de rivière 5.60E+03 petites colonies non caractéristiques -
13 Prov1e Providencia stuartii Eau de rivière 5.90E+03 petites colonies non caractéristiques -
14 Ps1e Pseudomonas aeruginosa ATCC 9027 3.90E+03 pas de croissance -
15 Ps2e Pseudomonas aeruginosa Eau de thermes 4.70E+03 pas de croissance -
16 Ps4e Pseudomonas fluorescens Eau douce (La Chapelle St Hersin)
1.20E+05 pas de croissance -
17 PS12 Pseudomonas fluorescens Eau minérale 5.80E+05 pas de croissance -
18 Ps7e Pseudomonas mendocina / 1.00E+02 pas de croissance -
19 Ps5e Pseudomonas putida CIP 103281 1.50E+05 pas de croissance -
20 Ps3e Pseudomonas stutzeri Effluent (Harnes) 6.30E+03 pas de croissance -
21 S162 Salmonella IIIb 16:z10:e,n,x,z15 Boue station d'épuration 4.10E+03 présence de colonies violettes + Souche GAL+/GLUC+. Colonies
non caractéristiques sur TTC
22 Sal1e Salmonella enterica Eaude forage 5.50E+03 petites colonies non caractéristiques -
23 Sal2e Salmonella enterica ATCC 13311 6.70E+03 petites colonies non caractéristiques -
24 Sal3e Salmonella enterica Eau de forage 4.80E+03 petites colonies non caractéristiques -
25 Sal4e Salmonella Enteritidis Collection 2.20E+03 petites colonies non caractéristiques -
26 Sal5e Salmonella Typhimurium ATCC 14028 6.10E+03 petites colonies non caractéristiques -
27 S53 Salmonella umbilo Eau (flaque) 8.40E+03 petites colonies non caractéristiques -
28 EN72 Shigella flexneri Alimentaire 1.70E+04 colonies blanches non caractéristiques -

AFNOR Validation
Renewal study
RAPID’ E.coli 2
V1.0 April 2019
66
Référence Souche Origine
Taux cible
inoculum
(UFC/100 mL)
sur PCA
Méthode alternative Rapid'E.coli 2 + supplément
Water Testing Commentaires
Colonies sur gélose REC2 supp Détection
E.coli /Coliformes
29 EN73 Shigella sonnei Alimentaire 1.90E+04 colonies bleu marine + Souche GAL+/GLUC+. Colonies non ca-
ractéristiques sur TTC
30 Sta1e Staphylococcus aureus ATCC 9144 1.05E+04 pas de croissance -
31 Vib1e Vibrio fluvialis Eau de rivière 8.00E+03 pas de croissance -
32 Vib2e Vibrio parahaemolyticus Eau de réseau 1.00E+03 pas de croissance -
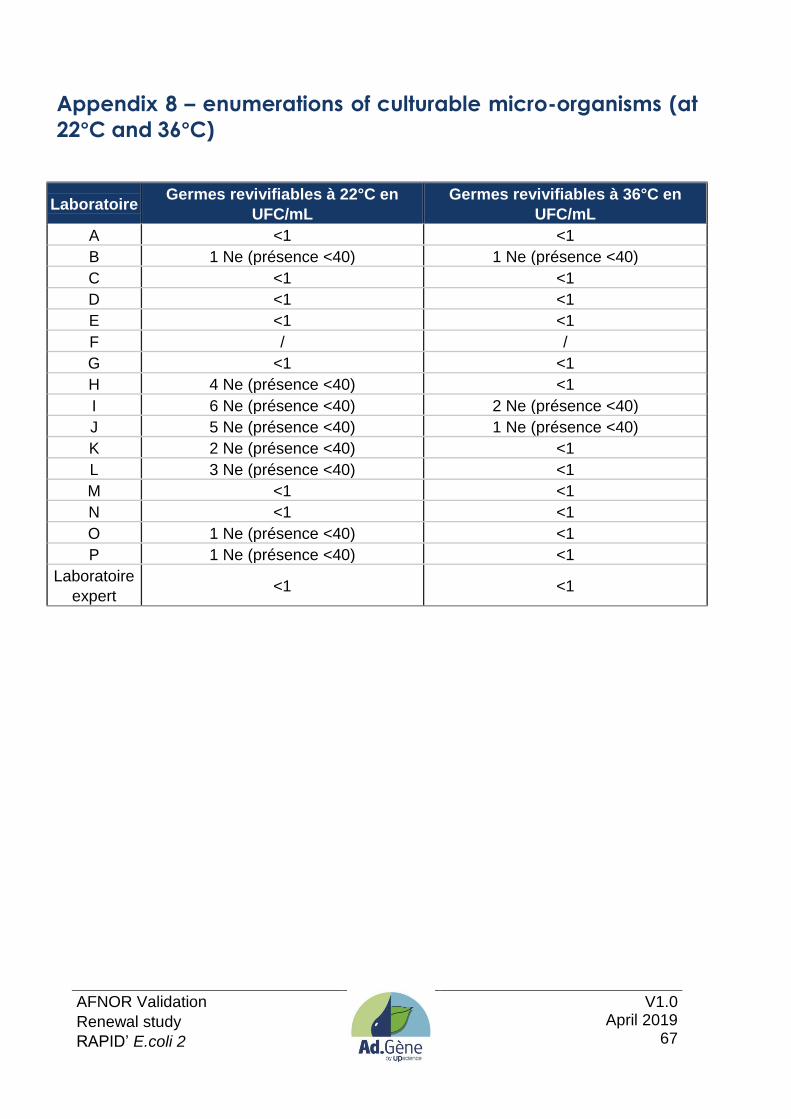
AFNOR Validation
Renewal study
RAPID’ E.coli 2
V1.0 April 2019
67
Appendix 8 – enumerations of culturable micro-organisms (at
22°C and 36°C)
Laboratoire Germes revivifiables à 22°C en
UFC/mL
Germes revivifiables à 36°C en
UFC/mL
A <1 <1
B 1 Ne (présence <40) 1 Ne (présence <40)
C <1 <1
D <1 <1
E <1 <1
F / /
G <1 <1
H 4 Ne (présence <40) <1
I 6 Ne (présence <40) 2 Ne (présence <40)
J 5 Ne (présence <40) 1 Ne (présence <40)
K 2 Ne (présence <40) <1
L 3 Ne (présence <40) <1
M <1 <1
N <1 <1
O 1 Ne (présence <40) <1
P 1 Ne (présence <40) <1
Laboratoire
expert <1 <1

AFNOR Validation
Renewal study
RAPID’ E.coli 2
V1.0 April 2019
68
Appendix 9 – collaborative laboratories results and synthesis
LEVEL 0
Laboratoire
Méthode de référence NF EN ISO 9308-1 - Filtration 100 mL
21 ± 3 heures d'incubation
Réplicat 1 Réplicat 2
Nombre de colonies typiques sur TTC Résultats en UFC / 100 mL
Nombre de colonies typiques sur TTC Résultats en UFC / 100 mL
Comptées Confirmées Ct E. coli Comptées Confirmées Ct E. coli
A 0 0 <1 <1 0 0 <1 <1
B 0 0 <1 <1 0 0 <1 <1
C 0 0 <1 <1 0 0 <1 <1
D 0 0 <1 <1 0 0 <1 <1
E 0 0 <1 <1 0 0 <1 <1
G 0 0 <1 <1 0 0 <1 <1
H 0 0 <1 <1 0 0 <1 <1
I 0 0 <1 <1 0 0 <1 <1
J 0 0 <1 <1 0 0 <1 <1
K 0 0 <1 <1 0 0 <1 <1
L 0 0 <1 <1 0 0 <1 <1
M 0 0 <1 <1 0 0 <1 <1
N 0 0 <1 <1 0 0 <1 <1
O 0 0 <1 <1 0 0 <1 <1
P 0 0 <1 <1 0 0 <1 <1 Laboratoire expert 0 0 <1 <1 0 0 <1 <1
Laboratoire
Méthode de référence NF EN ISO 9308-1 - Filtration 100 mL
44 ± 4 heures d'incubation
Réplicat 1 Réplicat 2
Nombre de colonies typiques sur TTC Résultats en UFC / 100 mL
Nombre de colonies typiques sur TTC Résultats en UFC / 100 mL
Comptées Confirmées Ct E. coli Comptées Confirmées Ct E. coli
A 0 0 <1 <1 0 0 <1 <1
B 0 0 <1 <1 0 0 <1 <1
C 0 0 <1 <1 0 0 <1 <1
D 0 0 <1 <1 0 0 <1 <1
E 0 0 <1 <1 0 0 <1 <1
G 0 0 <1 <1 0 0 <1 <1
H 0 0 <1 <1 0 0 <1 <1
I 0 0 <1 <1 0 0 <1 <1
J 0 0 <1 <1 0 0 <1 <1
K 0 0 <1 <1 0 0 <1 <1
L 0 0 <1 <1 0 0 <1 <1
M 0 0 <1 <1 0 0 <1 <1
N 0 0 <1 <1 0 0 <1 <1
O 0 0 <1 <1 0 0 <1 <1
P 0 0 <1 <1 0 0 <1 <1
Laboratoire expert 0 0 <1 <1 0 0 <1 <1
Ct : coliformes totaux
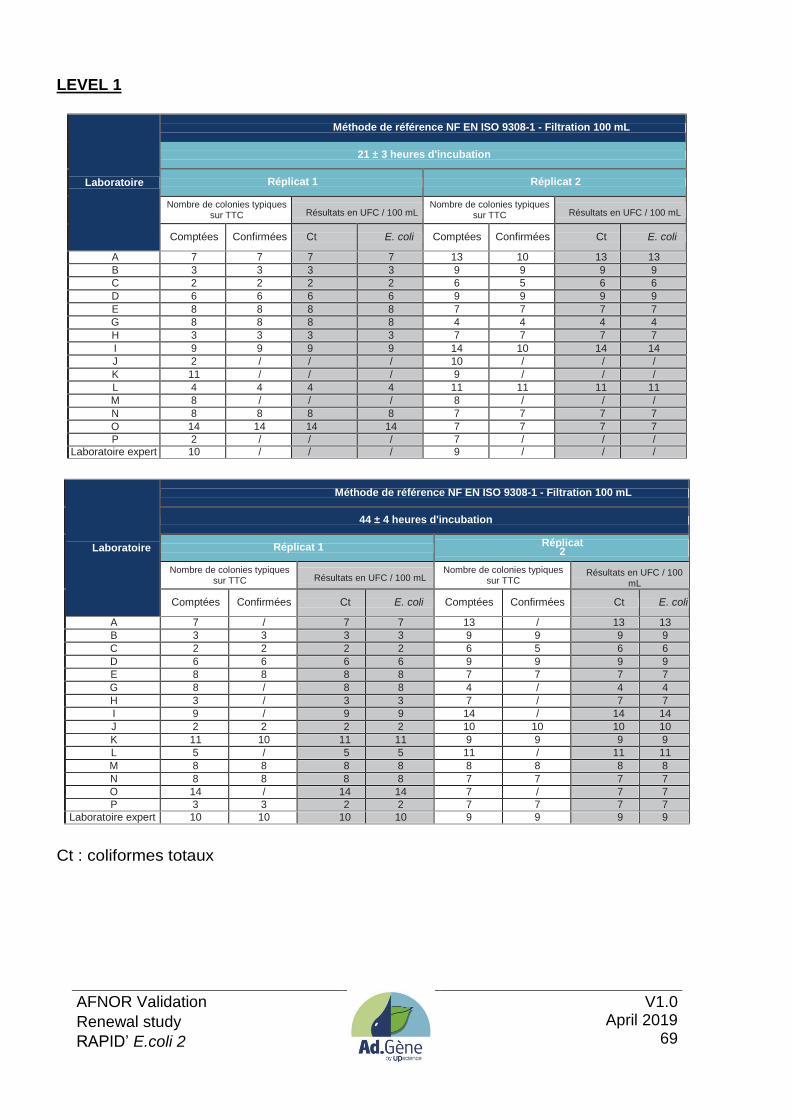
AFNOR Validation
Renewal study
RAPID’ E.coli 2
V1.0 April 2019
69
LEVEL 1
Laboratoire
Méthode de référence NF EN ISO 9308-1 - Filtration 100 mL
21 ± 3 heures d'incubation
Réplicat 1 Réplicat 2
Nombre de colonies typiques sur TTC Résultats en UFC / 100 mL
Nombre de colonies typiques sur TTC Résultats en UFC / 100 mL
Comptées Confirmées Ct E. coli Comptées Confirmées Ct E. coli
A 7 7 7 7 13 10 13 13
B 3 3 3 3 9 9 9 9
C 2 2 2 2 6 5 6 6
D 6 6 6 6 9 9 9 9
E 8 8 8 8 7 7 7 7
G 8 8 8 8 4 4 4 4
H 3 3 3 3 7 7 7 7
I 9 9 9 9 14 10 14 14
J 2 / / / 10 / / /
K 11 / / / 9 / / /
L 4 4 4 4 11 11 11 11
M 8 / / / 8 / / /
N 8 8 8 8 7 7 7 7
O 14 14 14 14 7 7 7 7
P 2 / / / 7 / / / Laboratoire expert 10 / / / 9 / / /
Laboratoire
Méthode de référence NF EN ISO 9308-1 - Filtration 100 mL
44 ± 4 heures d'incubation
Réplicat 1 Réplicat 2
Nombre de colonies typiques sur TTC Résultats en UFC / 100 mL
Nombre de colonies typiques sur TTC
Résultats en UFC / 100
mL
Comptées Confirmées Ct E. coli Comptées Confirmées Ct E. coli
A 7 / 7 7 13 / 13 13
B 3 3 3 3 9 9 9 9
C 2 2 2 2 6 5 6 6
D 6 6 6 6 9 9 9 9
E 8 8 8 8 7 7 7 7
G 8 / 8 8 4 / 4 4
H 3 / 3 3 7 / 7 7
I 9 / 9 9 14 / 14 14
J 2 2 2 2 10 10 10 10
K 11 10 11 11 9 9 9 9
L 5 / 5 5 11 / 11 11
M 8 8 8 8 8 8 8 8
N 8 8 8 8 7 7 7 7
O 14 / 14 14 7 / 7 7
P 3 3 2 2 7 7 7 7
Laboratoire expert 10 10 10 10 9 9 9 9
Ct : coliformes totaux
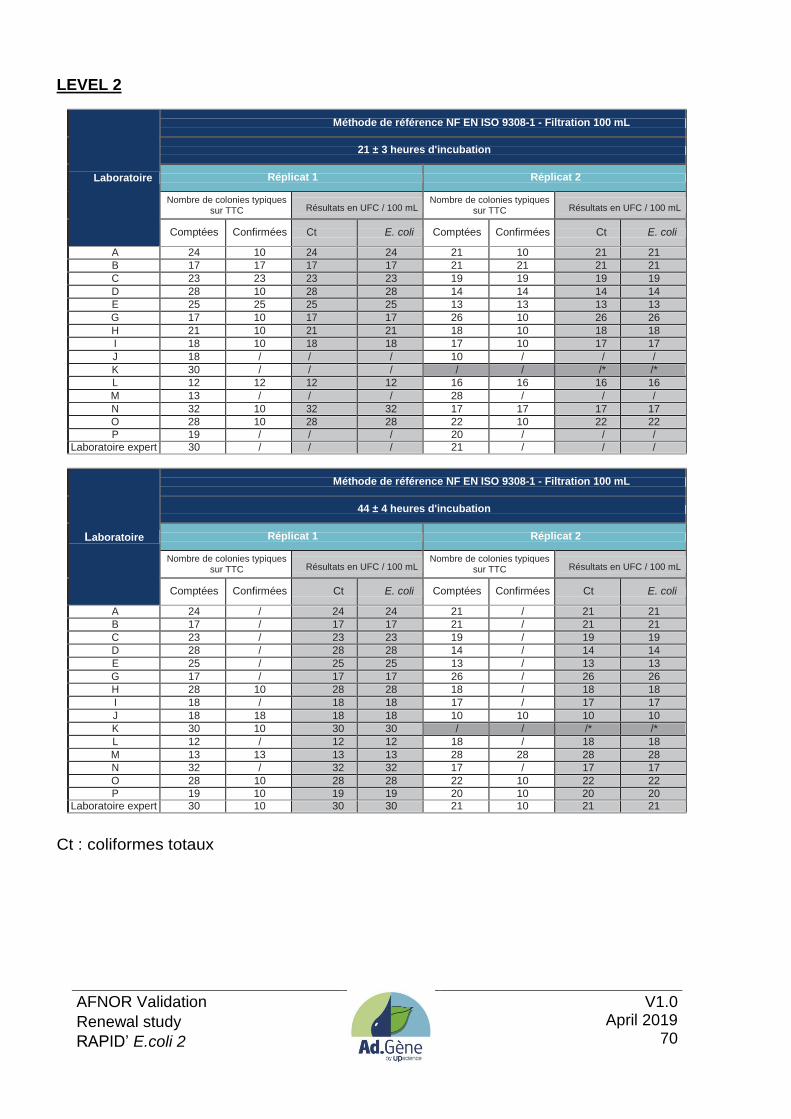
AFNOR Validation
Renewal study
RAPID’ E.coli 2
V1.0 April 2019
70
LEVEL 2
Laboratoire
Méthode de référence NF EN ISO 9308-1 - Filtration 100 mL
21 ± 3 heures d'incubation
Réplicat 1 Réplicat 2
Nombre de colonies typiques sur TTC Résultats en UFC / 100 mL
Nombre de colonies typiques sur TTC Résultats en UFC / 100 mL
Comptées Confirmées Ct E. coli Comptées Confirmées Ct E. coli
A 24 10 24 24 21 10 21 21
B 17 17 17 17 21 21 21 21
C 23 23 23 23 19 19 19 19
D 28 10 28 28 14 14 14 14
E 25 25 25 25 13 13 13 13
G 17 10 17 17 26 10 26 26
H 21 10 21 21 18 10 18 18
I 18 10 18 18 17 10 17 17
J 18 / / / 10 / / /
K 30 / / / / / /* /*
L 12 12 12 12 16 16 16 16
M 13 / / / 28 / / /
N 32 10 32 32 17 17 17 17
O 28 10 28 28 22 10 22 22
P 19 / / / 20 / / /
Laboratoire expert 30 / / / 21 / / /
Laboratoire
Méthode de référence NF EN ISO 9308-1 - Filtration 100 mL
44 ± 4 heures d'incubation
Réplicat 1 Réplicat 2
Nombre de colonies typiques sur TTC Résultats en UFC / 100 mL
Nombre de colonies typiques sur TTC Résultats en UFC / 100 mL
Comptées Confirmées Ct E. coli Comptées Confirmées Ct E. coli
A 24 / 24 24 21 / 21 21
B 17 / 17 17 21 / 21 21
C 23 / 23 23 19 / 19 19
D 28 / 28 28 14 / 14 14
E 25 / 25 25 13 / 13 13
G 17 / 17 17 26 / 26 26
H 28 10 28 28 18 / 18 18
I 18 / 18 18 17 / 17 17
J 18 18 18 18 10 10 10 10
K 30 10 30 30 / / /* /*
L 12 / 12 12 18 / 18 18
M 13 13 13 13 28 28 28 28
N 32 / 32 32 17 / 17 17
O 28 10 28 28 22 10 22 22
P 19 10 19 19 20 10 20 20 Laboratoire expert 30 10 30 30 21 10 21 21
Ct : coliformes totaux
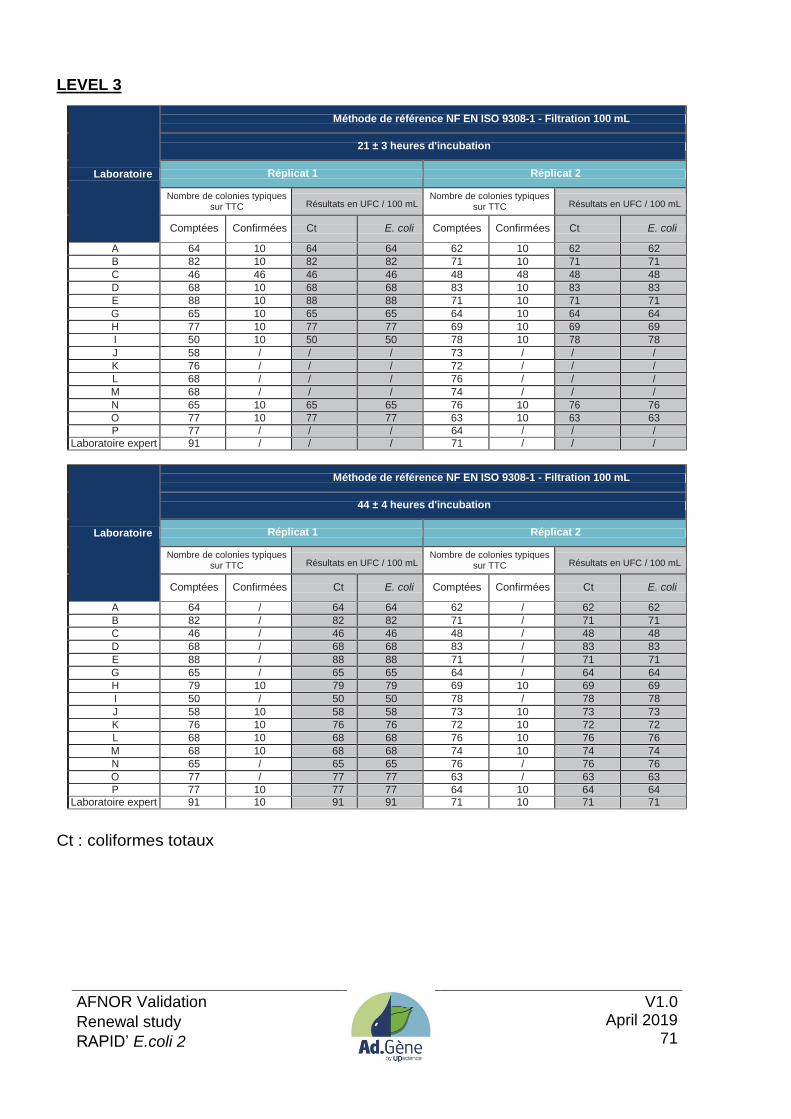
AFNOR Validation
Renewal study
RAPID’ E.coli 2
V1.0 April 2019
71
LEVEL 3
Laboratoire
Méthode de référence NF EN ISO 9308-1 - Filtration 100 mL
21 ± 3 heures d'incubation
Réplicat 1 Réplicat 2
Nombre de colonies typiques sur TTC Résultats en UFC / 100 mL
Nombre de colonies typiques sur TTC Résultats en UFC / 100 mL
Comptées Confirmées Ct E. coli Comptées Confirmées Ct E. coli
A 64 10 64 64 62 10 62 62
B 82 10 82 82 71 10 71 71
C 46 46 46 46 48 48 48 48
D 68 10 68 68 83 10 83 83
E 88 10 88 88 71 10 71 71
G 65 10 65 65 64 10 64 64
H 77 10 77 77 69 10 69 69
I 50 10 50 50 78 10 78 78
J 58 / / / 73 / / /
K 76 / / / 72 / / /
L 68 / / / 76 / / /
M 68 / / / 74 / / /
N 65 10 65 65 76 10 76 76
O 77 10 77 77 63 10 63 63
P 77 / / / 64 / / /
Laboratoire expert 91 / / / 71 / / /
Laboratoire
Méthode de référence NF EN ISO 9308-1 - Filtration 100 mL
44 ± 4 heures d'incubation
Réplicat 1 Réplicat 2
Nombre de colonies typiques sur TTC Résultats en UFC / 100 mL
Nombre de colonies typiques sur TTC Résultats en UFC / 100 mL
Comptées Confirmées Ct E. coli Comptées Confirmées Ct E. coli
A 64 / 64 64 62 / 62 62
B 82 / 82 82 71 / 71 71
C 46 / 46 46 48 / 48 48
D 68 / 68 68 83 / 83 83
E 88 / 88 88 71 / 71 71
G 65 / 65 65 64 / 64 64
H 79 10 79 79 69 10 69 69
I 50 / 50 50 78 / 78 78
J 58 10 58 58 73 10 73 73
K 76 10 76 76 72 10 72 72
L 68 10 68 68 76 10 76 76
M 68 10 68 68 74 10 74 74
N 65 / 65 65 76 / 76 76
O 77 / 77 77 63 / 63 63
P 77 10 77 77 64 10 64 64 Laboratoire expert 91 10 91 91 71 10 71 71
Ct : coliformes totaux

AFNOR Validation
Renewal study
RAPID’ E.coli 2
V1.0 April 2019
72
LEVEL 0
Laboratoire
Méthode alternative RAPID'E. coli 2 supp - Filtration 100 mL
21 ± 3 heures d'incubation
Réplicat 1 Réplicat 2
Nombre de colonies typiques sur REC2 Supp Résultats en UFC / 100 mL
Nombre de colonies typiques sur REC2 Supp Résultats en UFC / 100 mL
C* E. coli Ct E. coli C* E. coli Ct E. coli
A 0 0 <1 <1 0 0 <1 <1
B 0 0 <1 <1 0 0 <1 <1
C 0 0 <1 <1 0 0 <1 <1
D 0 0 <1 <1 0 0 <1 <1
E 0 0 <1 <1 0 0 <1 <1
G 0 0 <1 <1 0 0 <1 <1
H 0 0 <1 <1 0 0 <1 <1
I 0 0 <1 <1 0 0 <1 <1
J 0 0 <1 <1 0 0 <1 <1
K 0 0 <1 <1 0 0 <1 <1
L 0 0 <1 <1 0 0 <1 <1
M 0 0 <1 <1 0 0 <1 <1
N 0 0 <1 <1 0 0 <1 <1
O 0 0 <1 <1 0 0 <1 <1
P 0 0 <1 <1 0 0 <1 <1
Laboratoire expert 0 0 <1 <1 0 0 <1 <1
C : coliformes autres que E. coli
Ct : coliformes totaux
LEVEL 1
Laboratoire
Méthode alternative RAPID'E. coli 2 supp - Filtration 100 mL
21 ± 3 heures d'incubation
Réplicat 1 Réplicat 2
Nombre de colonies typiques sur REC2 Supp Résultats en UFC / 100 mL
Nombre de colonies typiques sur REC2 Supp Résultats en UFC / 100 mL
C* E. coli Ct E. coli C* E. coli Ct E. coli
A 0 1 1 1 0 9 9 9
B 0 10 10 10 0 1 1 1
C 0 5 5 5 0 6 6 6
D 0 4 4 4 0 2 2 2
E 0 6 6 6 0 9 9 9
G 0 5 5 5 0 8 8 8
H 0 9 9 9 0 9 9 9
I 0 7 7 7 0 7 7 7
J 0 3 3 3 0 4 4 4
K 0 7 7 7 14* 7 21 21
L 0 2 2 2 0 2 2 2
M 0 3 3 3 0 6 6 6
N 0 5 5 5 0 4 4 4
O 0 2 2 2 0 6 6 6
P 0 2 2 2 0 4 4 4 Laboratoire expert 0 5 5 5 0 8 8 8
C : coliformes autres que E. coli (colonies vertes)
Ct : coliformes totaux
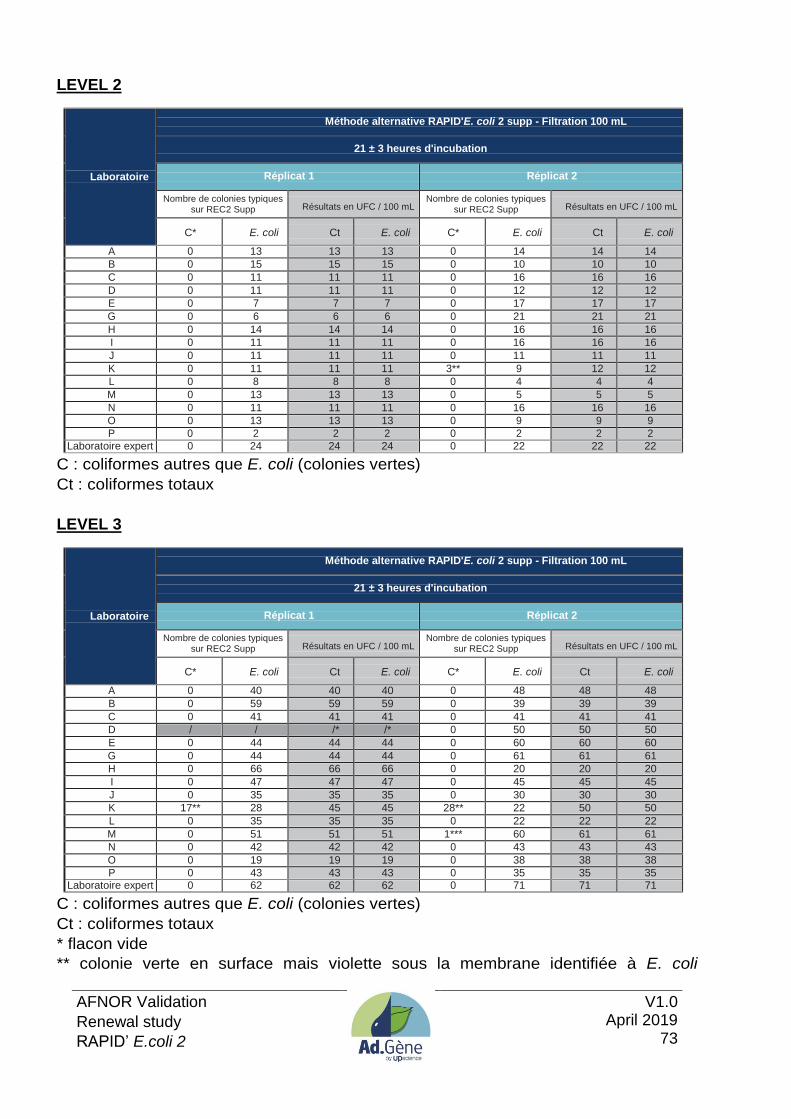
AFNOR Validation
Renewal study
RAPID’ E.coli 2
V1.0 April 2019
73
LEVEL 2
Laboratoire
Méthode alternative RAPID'E. coli 2 supp - Filtration 100 mL
21 ± 3 heures d'incubation
Réplicat 1 Réplicat 2
Nombre de colonies typiques sur REC2 Supp Résultats en UFC / 100 mL
Nombre de colonies typiques sur REC2 Supp Résultats en UFC / 100 mL
C* E. coli Ct E. coli C* E. coli Ct E. coli
A 0 13 13 13 0 14 14 14
B 0 15 15 15 0 10 10 10
C 0 11 11 11 0 16 16 16
D 0 11 11 11 0 12 12 12
E 0 7 7 7 0 17 17 17
G 0 6 6 6 0 21 21 21
H 0 14 14 14 0 16 16 16
I 0 11 11 11 0 16 16 16
J 0 11 11 11 0 11 11 11
K 0 11 11 11 3** 9 12 12
L 0 8 8 8 0 4 4 4
M 0 13 13 13 0 5 5 5
N 0 11 11 11 0 16 16 16
O 0 13 13 13 0 9 9 9
P 0 2 2 2 0 2 2 2
Laboratoire expert 0 24 24 24 0 22 22 22
C : coliformes autres que E. coli (colonies vertes)
Ct : coliformes totaux
LEVEL 3
Laboratoire
Méthode alternative RAPID'E. coli 2 supp - Filtration 100 mL
21 ± 3 heures d'incubation
Réplicat 1 Réplicat 2
Nombre de colonies typiques sur REC2 Supp Résultats en UFC / 100 mL
Nombre de colonies typiques sur REC2 Supp Résultats en UFC / 100 mL
C* E. coli Ct E. coli C* E. coli Ct E. coli
A 0 40 40 40 0 48 48 48
B 0 59 59 59 0 39 39 39
C 0 41 41 41 0 41 41 41
D / / /* /* 0 50 50 50
E 0 44 44 44 0 60 60 60
G 0 44 44 44 0 61 61 61
H 0 66 66 66 0 20 20 20
I 0 47 47 47 0 45 45 45
J 0 35 35 35 0 30 30 30
K 17** 28 45 45 28** 22 50 50
L 0 35 35 35 0 22 22 22
M 0 51 51 51 1*** 60 61 61
N 0 42 42 42 0 43 43 43
O 0 19 19 19 0 38 38 38
P 0 43 43 43 0 35 35 35 Laboratoire expert 0 62 62 62 0 71 71 71
C : coliformes autres que E. coli (colonies vertes)
Ct : coliformes totaux
* flacon vide
** colonie verte en surface mais violette sous la membrane identifiée à E. coli
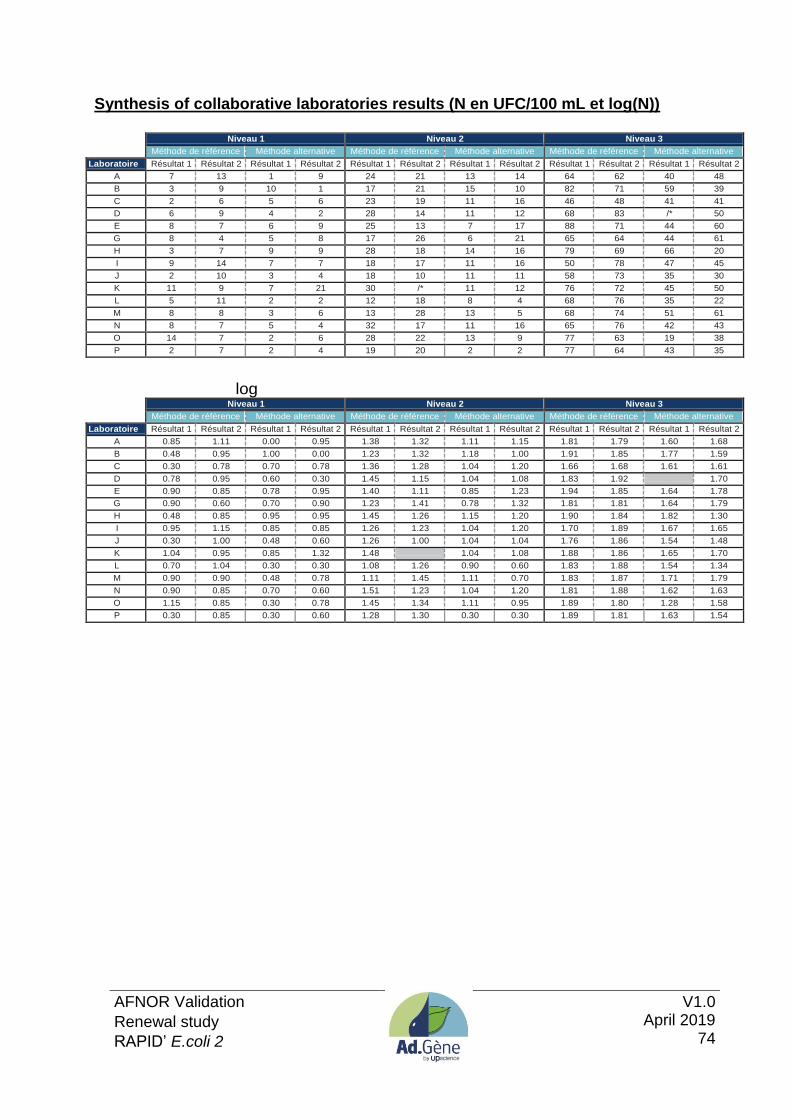
AFNOR Validation
Renewal study
RAPID’ E.coli 2
V1.0 April 2019
74
Synthesis of collaborative laboratories results (N en UFC/100 mL et log(N))
Niveau 1 Niveau 2 Niveau 3
Méthode de référence Méthode alternative Méthode de référence Méthode alternative Méthode de référence Méthode alternative
Laboratoire Résultat 1 Résultat 2 Résultat 1 Résultat 2 Résultat 1 Résultat 2 Résultat 1 Résultat 2 Résultat 1 Résultat 2 Résultat 1 Résultat 2
A 7 13 1 9 24 21 13 14 64 62 40 48
B 3 9 10 1 17 21 15 10 82 71 59 39
C 2 6 5 6 23 19 11 16 46 48 41 41
D 6 9 4 2 28 14 11 12 68 83 /* 50
E 8 7 6 9 25 13 7 17 88 71 44 60
G 8 4 5 8 17 26 6 21 65 64 44 61
H 3 7 9 9 28 18 14 16 79 69 66 20
I 9 14 7 7 18 17 11 16 50 78 47 45
J 2 10 3 4 18 10 11 11 58 73 35 30
K 11 9 7 21 30 /* 11 12 76 72 45 50
L 5 11 2 2 12 18 8 4 68 76 35 22
M 8 8 3 6 13 28 13 5 68 74 51 61
N 8 7 5 4 32 17 11 16 65 76 42 43
O 14 7 2 6 28 22 13 9 77 63 19 38
P 2 7 2 4 19 20 2 2 77 64 43 35
log Niveau 1 Niveau 2 Niveau 3
Méthode de référence Méthode alternative Méthode de référence Méthode alternative Méthode de référence Méthode alternative
Laboratoire Résultat 1 Résultat 2 Résultat 1 Résultat 2 Résultat 1 Résultat 2 Résultat 1 Résultat 2 Résultat 1 Résultat 2 Résultat 1 Résultat 2
A 0.85 1.11 0.00 0.95 1.38 1.32 1.11 1.15 1.81 1.79 1.60 1.68
B 0.48 0.95 1.00 0.00 1.23 1.32 1.18 1.00 1.91 1.85 1.77 1.59
C 0.30 0.78 0.70 0.78 1.36 1.28 1.04 1.20 1.66 1.68 1.61 1.61
D 0.78 0.95 0.60 0.30 1.45 1.15 1.04 1.08 1.83 1.92 1.70
E 0.90 0.85 0.78 0.95 1.40 1.11 0.85 1.23 1.94 1.85 1.64 1.78
G 0.90 0.60 0.70 0.90 1.23 1.41 0.78 1.32 1.81 1.81 1.64 1.79
H 0.48 0.85 0.95 0.95 1.45 1.26 1.15 1.20 1.90 1.84 1.82 1.30
I 0.95 1.15 0.85 0.85 1.26 1.23 1.04 1.20 1.70 1.89 1.67 1.65
J 0.30 1.00 0.48 0.60 1.26 1.00 1.04 1.04 1.76 1.86 1.54 1.48
K 1.04 0.95 0.85 1.32 1.48 1.04 1.08 1.88 1.86 1.65 1.70
L 0.70 1.04 0.30 0.30 1.08 1.26 0.90 0.60 1.83 1.88 1.54 1.34
M 0.90 0.90 0.48 0.78 1.11 1.45 1.11 0.70 1.83 1.87 1.71 1.79
N 0.90 0.85 0.70 0.60 1.51 1.23 1.04 1.20 1.81 1.88 1.62 1.63
O 1.15 0.85 0.30 0.78 1.45 1.34 1.11 0.95 1.89 1.80 1.28 1.58
P 0.30 0.85 0.30 0.60 1.28 1.30 0.30 0.30 1.89 1.81 1.63 1.54
Copyright © 2022 FDOKUMEN