Colloidal Synthesis of Cuprite (Cu 2 O) Octahedral Nanocrystals and Their Electrochemical Lithiation
7
Colloidal Synthesis of Cuprite (Cu 2 O) Octahedral Nanocrystals and Their Electrochemical Lithiation Andrea Paolella, Rosaria Brescia, Mirko Prato, Mauro Povia, Sergio Marras, Luca De Trizio, Andrea Falqui, Liberato Manna, and Chandramohan George* Nanochemistry, Istituto Italiano di Tecnologia, Via Morego 30, 16163 Genova, Italy * S Supporting Information ABSTRACT: We report a facile colloidal route to prepare octahedral- shaped cuprite (Cu 2 O) nanocrystals (NCs) of ∼40 nm in size that exploits a new reduction pathway, i.e., the controlled reduction of a cupric ion by acetylacetonate directly to cuprite. Detailed structural, morphological, and chemical analyses were carried on the cuprite NCs. We also tested their electrochemical lithiation, using a combination of techniques (cyclic voltammetry, galvanostatic, and impedance spectroscopy), in view of their potential application as anodes for Li ion batteries. Along with these characterizations, the morphological, structural, and chemical analyses (via high-resolution electron microscopy, electron energy loss spectroscopy, and X-ray photoelectron spectroscopy) of the cycled Cu 2 O NCs (in the lithiated stage, after ∼50 cycles) demonstrate their partial conversion upon cycling. At this stage, most of the NCs had lost their octahedral shape and had evolved into multidomain particles and were eventually fragmented. Overall, the shape changes (upon cycling) did not appear to be concerted for all the NCs in the sample, suggesting that different subsets of NCs were characterized by different lithiation kinetics. We emphasize that a profound understanding of the lithiation reaction with NCs defined by a specific crystal habit is still essential to optimize nanoscale conversion reactions. KEYWORDS: copper oxide, colloidal nanocrystals, lithium ion batteries, anodes 1. INTRODUCTION Cuprous oxide, or cuprite (Cu 2 O), is a naturally occurring ore of copper that finds applications in a wide range of fields. Cuprite has been in fact exploited in electronics and photovoltaics 1 (as it has a direct band gap of 2.17 eV), photo- induced water splitting, 2,3 catalysis, 4 gas sensors, 5 and Li-ion batteries, 6 which clearly demonstrates its importance among the transition metal oxides. Various laboratory scale synthetic routes to cuprite nanocrystals (NCs) have been reported to date, based on aqueous 7 and hydrothermal methods, 8 micro- emulsion, 9 polyol, 10 oxidation of colloidal Cu NCs, 11 high- temperature decomposition routes, 12 electro-deposition, 13 syn- thesis in supercritical water, 14 microemulsion γ-ray irradi- ation, 15 metallic copper oxidation, 16 reduction by hydrazine, 17 chemical vapor deposition (CVD), 18 and reduction by glucose. 19 Several studies also report on the electrochemical performance of cuprite in lithium ion batteries, on both micrometer 20 and sub-micrometer crystals. 21 It is well known that the lithiation of transition metal (such as Fe, Cu, Co, and Ni) oxides often involves a reversible conversion type of reaction, as reported by Tarascon and co-workers. 22 In the case of cuprite, the simplified cell reaction can be expressed as + + ⇔ + + − Cu O 2Li 2e Li O 2Cu 2 2 0 On the other hand, alloying/de-alloying and insertion/de- insertion (of Li + ions) processes were reported on other types of oxides, for example, SnO 2 - and TiO 2 -based nanostructures. 23 Recently, Luo et al. have shown that CuO-based nanostructures could be directly deposited on copper electrodes, exhibiting a significant capacity retention, 24 and similarly Barreca et al. have also shown that both CuO and Cu 2 O could be deposited on Ti substrates 25 as electrode structures. Concerning the specific capacity values of cuprite (as reported from the literature), electrodeposited thin film 6 electrodes exhibited ∼210−350 mAh/g, porous thin films with polystyrene 26 ∼336−213 mAh/ g, microsized cubic particles 20 ∼390 mAh/g, and cuprite on Ti substrates 25 ∼400−325 mA h/g (the theoretical capacity of cuprite is 374 mAh/g). Grugeon et al. investigated the electrochemical lithiation of micrometer and sub-micrometer cuprite particles (down to 100 nm). 21 In these systems, a complete conversion of the starting material into metallic nanoparticles (1−2 nm in size) dispersed in a Li 2 O matrix was observed already upon the first discharge. Also, the smaller the particles, the larger was the capacity fading (however, based on comparing ∼1 μm and 0.15 μm sized nearly spherical particles), which raises interesting questions regarding whether cuprite NCs smaller than 100 nm would bring any advantage in lithium ion batteries as anodes and how the lithiation reactions can affect the NCs in electrodes during a conversion reaction. Parallel to these issues, the study of how the NC shape 19,20,27 can influence the overall electrochemical properties has also Received: January 30, 2013 Accepted: March 6, 2013 Published: March 6, 2013 Research Article www.acsami.org © 2013 American Chemical Society 2745 dx.doi.org/10.1021/am4004073 | ACS Appl. Mater. Interfaces 2013, 5, 2745−2751
Transcript of Colloidal Synthesis of Cuprite (Cu 2 O) Octahedral Nanocrystals and Their Electrochemical Lithiation
Colloidal Synthesis of Cuprite (Cu2O) Octahedral Nanocrystals andTheir Electrochemical LithiationAndrea Paolella, Rosaria Brescia, Mirko Prato, Mauro Povia, Sergio Marras, Luca De Trizio, Andrea Falqui,Liberato Manna, and Chandramohan George*
Nanochemistry, Istituto Italiano di Tecnologia, Via Morego 30, 16163 Genova, Italy
*S Supporting Information
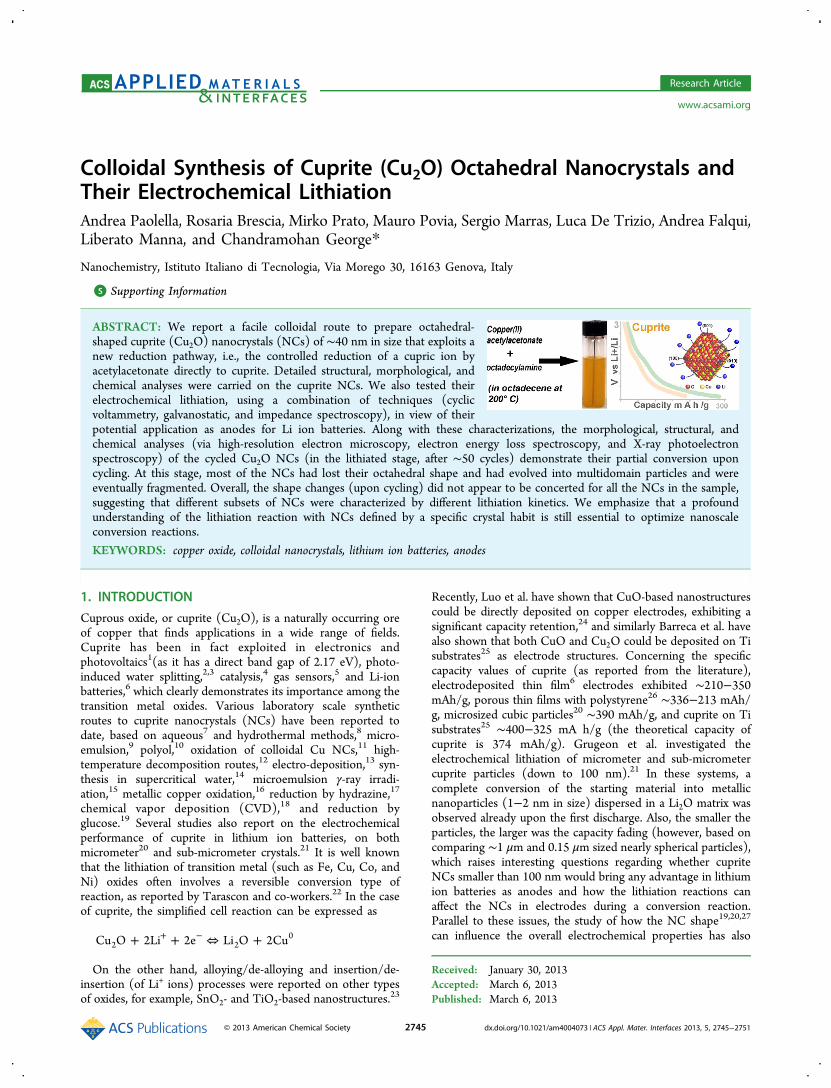
ABSTRACT: We report a facile colloidal route to prepare octahedral-shaped cuprite (Cu2O) nanocrystals (NCs) of ∼40 nm in size that exploits anew reduction pathway, i.e., the controlled reduction of a cupric ion byacetylacetonate directly to cuprite. Detailed structural, morphological, andchemical analyses were carried on the cuprite NCs. We also tested theirelectrochemical lithiation, using a combination of techniques (cyclicvoltammetry, galvanostatic, and impedance spectroscopy), in view of theirpotential application as anodes for Li ion batteries. Along with these characterizations, the morphological, structural, andchemical analyses (via high-resolution electron microscopy, electron energy loss spectroscopy, and X-ray photoelectronspectroscopy) of the cycled Cu2O NCs (in the lithiated stage, after ∼50 cycles) demonstrate their partial conversion uponcycling. At this stage, most of the NCs had lost their octahedral shape and had evolved into multidomain particles and wereeventually fragmented. Overall, the shape changes (upon cycling) did not appear to be concerted for all the NCs in the sample,suggesting that different subsets of NCs were characterized by different lithiation kinetics. We emphasize that a profoundunderstanding of the lithiation reaction with NCs defined by a specific crystal habit is still essential to optimize nanoscaleconversion reactions.
KEYWORDS: copper oxide, colloidal nanocrystals, lithium ion batteries, anodes
1. INTRODUCTION
Cuprous oxide, or cuprite (Cu2O), is a naturally occurring oreof copper that finds applications in a wide range of fields.Cuprite has been in fact exploited in electronics andphotovoltaics1(as it has a direct band gap of 2.17 eV), photo-induced water splitting,2,3 catalysis,4 gas sensors,5 and Li-ionbatteries,6 which clearly demonstrates its importance among thetransition metal oxides. Various laboratory scale syntheticroutes to cuprite nanocrystals (NCs) have been reported todate, based on aqueous7 and hydrothermal methods,8 micro-emulsion,9 polyol,10 oxidation of colloidal Cu NCs,11 high-temperature decomposition routes,12 electro-deposition,13 syn-thesis in supercritical water,14 microemulsion γ-ray irradi-ation,15 metallic copper oxidation,16 reduction by hydrazine,17
chemical vapor deposition (CVD),18 and reduction byglucose.19 Several studies also report on the electrochemicalperformance of cuprite in lithium ion batteries, on bothmicrometer20 and sub-micrometer crystals.21 It is well knownthat the lithiation of transition metal (such as Fe, Cu, Co, andNi) oxides often involves a reversible conversion type ofreaction, as reported by Tarascon and co-workers.22 In the caseof cuprite, the simplified cell reaction can be expressed as
+ + ⇔ ++ −Cu O 2Li 2e Li O 2Cu2 20
On the other hand, alloying/de-alloying and insertion/de-insertion (of Li+ ions) processes were reported on other typesof oxides, for example, SnO2- and TiO2-based nanostructures.23
Recently, Luo et al. have shown that CuO-based nanostructurescould be directly deposited on copper electrodes, exhibiting asignificant capacity retention,24 and similarly Barreca et al. havealso shown that both CuO and Cu2O could be deposited on Tisubstrates25 as electrode structures. Concerning the specificcapacity values of cuprite (as reported from the literature),electrodeposited thin film6 electrodes exhibited ∼210−350mAh/g, porous thin films with polystyrene26 ∼336−213 mAh/g, microsized cubic particles20 ∼390 mAh/g, and cuprite on Tisubstrates25 ∼400−325 mA h/g (the theoretical capacity ofcuprite is 374 mAh/g). Grugeon et al. investigated theelectrochemical lithiation of micrometer and sub-micrometercuprite particles (down to 100 nm).21 In these systems, acomplete conversion of the starting material into metallicnanoparticles (1−2 nm in size) dispersed in a Li2O matrix wasobserved already upon the first discharge. Also, the smaller theparticles, the larger was the capacity fading (however, based oncomparing ∼1 μm and 0.15 μm sized nearly spherical particles),which raises interesting questions regarding whether cupriteNCs smaller than 100 nm would bring any advantage in lithiumion batteries as anodes and how the lithiation reactions canaffect the NCs in electrodes during a conversion reaction.Parallel to these issues, the study of how the NC shape19,20,27
can influence the overall electrochemical properties has also
Received: January 30, 2013Accepted: March 6, 2013Published: March 6, 2013
Research Article
www.acsami.org
© 2013 American Chemical Society 2745 dx.doi.org/10.1021/am4004073 | ACS Appl. Mater. Interfaces 2013, 5, 2745−2751

triggered special interest in the conversion electrodes. Bao etal.28 have shown for example that the (111) facets of cupriteNCs (which are well developed in octahedral-shaped particles)are much more reactive than the (100) facets in reactionsinvolving H2 or CO, but it is not clear if the same enhancedreactivity would be expected in electrochemical reactions withLi+ ions. It is however well known that poor lithiation kinetics,poor capacity retention, and large voltage hysteresis (betweenthe charge/discharge cycles) are still the main issues inelectrochemical lithiation that exploit in particular a con-version/displacement reaction. Along these lines, it isinteresting to study the lithiation properties of NCs with veryspecific size and shape, and this will help better exploredifferent aspects of electrochemical lithiation including: (i) howthe NC original shape/morphology evolves upon theirlithiation; (ii) their reactivity with Li ions; (iii) the reversibilityof conversion reactions. For these objectives, it is critical tomaintain the original NC size and shape unaltered in theelectrodes prior to cycling. We therefore made a composite inwhich the octahedral NCs could remain well dispersed andaccessible to the electrolytes. In this way we avoided anypossible sintering or coalescence of particles that may arise ifthey were directly deposited and annealed on substrates.We report in this work a nonhydrolytic colloidal route to
cuprite NCs, based on thermal decomposition of organo-metallic precursors in surfactants; i.e., Cu-acetylacetonatecontrolled the reduction of the cupric ion to cuprite. SuchNCs were characterized by a uniform octahedral shape, narrowsize distribution, and sizes around ∼40 nm. With the aim ofelucidating electrochemical lithiation processes on theseoctahedral ∼40 nm cuprite NCs, we carefully monitored theformation of the lithiation products during the conversionprocesses and the morphological changes of the initial NCs.This was done via a combination of electrochemical techniques(cyclic voltammetry, galvanostatic, impedance spectroscopy)and by analyzing the cycled NCs via high-resolution trans-mission electron microscopy (HRTEM), electron energy lossspectroscopy (EELS), and X-ray photoelectron spectroscopy(XPS). Upon cycling, a progressively larger number of NCswere characterized by severe morphological changes, and manyof them were eventually fragmented. The shape changes (uponconversion) did not occur uniformly for all the NCs in thesample, suggesting that different NCs presented differentlithiation kinetics. Although the NC electrodes exhibited alower capacity than what was previously reported in theliterature, our study on ∼40 nm octahedral NCs will contributeto the understanding of lithiation reactions at the nanoscale andin particular of the lithiation reactions on NCs that are limitedto a specific crystal plane (as in our case mainly the {111}ones).
2. EXPERIMENTAL SECTIONMaterials. Octadecylamine (99.0%), oleylamine (70%), and 1-
octadecene (95%) were purchased from Sigma Aldrich. Tetrachloro-ethylene was purchased from Sigma Aldrich >99% pure andanhydrous. Copper(II) acetylacetonate (purity >99.99%) waspurchased from Strem. Toluene (anhydrous, analytical standard) andethanol (anhydrous, analytical standard) were purchased from CarloErba. Cell components for coin type 2032 were purchased fromHohsen Corporation. Polypropylene microporous matrixes werepurchased from Cellguard. Li metal foils were purchased fromGoodfellow. Ethylene carbonate, diethyl carbonate, N-methyl-2-pyrrolidone, (poly)vinylidene difluoride, and carbon powder were
purchased from Aldrich and Alfa Aesar. All the solvents used werethoroughly degassed.
Characterization Techniques. High-resolution scanning electronmicroscopy (HRSEM) investigations were carried out using a JEOLJSM 7500FA instrument, equipped with a cold field emission gun(FEG), operating at 5 kV accelerating voltage. Energy-dispersive X-rayspectroscopy (EDX) was performed using a JEOL Hyper Nine EnergySi(Li) EDX Detector EX-64195JNH (10 mm2 effective area ofdetecting device, ultrathin window for detection of elements from Beto U, energy resolution (FWHM): 133 eV for Mn Kα X-rays). Bright-field transmission electron microscopy (BF-TEM) images and selectedarea electron diffraction (SAED) patterns were recorded on a JEOLJEM-1011 microscope, equipped with a thermionic W source andoperated at 100 kV. HRTEM, energy filtered TEM (EFTEM), EELS,and scanning TEM (STEM) analysesthe latter in high angle annulardark field (HAADF) geometrywere performed with a JEOL JEM-2200FS microscope working at an accelerating voltage of 200 kV,equipped with a Schottky FEG, a CEOS spherical aberration correctorof the objective lens allowing us to reach a spatial resolution of 0.9 Å,and an in-column Omega filter. Chemical compositions weredetermined for several particles by quantification of the EEL spectra,using the Cu-L23 and the O−K edges. The spectra used forquantification were recorded in diffraction mode using a 5.1 mradcollection semiangle and with a convergence semiangle of 2.5 mradand with an energy dispersion of 0.4 eV/channel. For both core lossedges the quantification was done by subtracting a power lawbackground, by deconvoluting the low loss spectrum for thecorresponding region, and by assuming a hydrogenic model for thecross section.29 In addition, the energy loss near edge structure(ELNES) in the EEL spectra acquired from the particles wascompared to the one observed for a Cu2O standard powder sample(Sigma-Aldrich, purity >99.99%). The EELS near-edge structure wascompared for spectra acquired with a 0.2 eV/channel energyresolution. EFTEM elemental maps were acquired for oxygen (Kedge at 532 eV, 30 eV slit width) and Cu (L23 edge at 931 eV, 50 eVslit width). All the samples analyzed by TEM were prepared bydropcasting a solution of NCs onto copper grids covered with anultrathin carbon film on top of a lacey carbon film. The samples forEELS quantification were instead deposited onto holey carbon films.The specimens were prepared under nitrogen and transferred into themicroscope using a vacuum transfer holder to avoid air exposure priorto investigation.
X-ray diffraction (XRD) measurements were obtained using aSmartlab 9 kW Rigaku diffractometer equipped with a copper rotatinganode. The X-ray source was operated at 40 kV and 150 mA. A Gobelmirror was used to obtain a parallel beam and to suppress Cu Kβradiation (1.392 Å). The 2 theta/omega scan was performed with tworadiations, Cu Kα1 (1.544 Å) and Cu Kα2 (1.541 Å), with a step of0.05° (2 theta) and with a scan speed of 3°/min. The specimens forXRD measurements were prepared in a glovebox, under nitrogenatmosphere, and inserted inside the DHS900 sample holder (AntonPaar), allowing us to transfer the samples to the diffractometer in inertatmosphere and to perform the measurements under vacuumcondition. In this way the sample was never exposed to the air. Thesoftware PDXL by Rigaku was used for qualitative analysis.
XPS and X-ray induced Auger electron spectroscopy (XAES)measurements were performed on a Kratos Axis Ultra DLDspectrometer, using a monochromatized Al Kα source operating at15 kV and 20 mA. Samples were prepared by drop casting a solution ofNCs onto highly oriented pyrolytic graphite (HOPG) substrates underinert atmosphere, in a glovebox, and were then transferred to the XPSanalysis chamber through a transfer vessel, to avoid any air exposure.Wide scans were acquired at an analyzer pass energy of 160 eV. High-resolution narrow scans on both as-synthesized and lithiated sampleswere performed at constant pass energy of 10 eV and steps of 0.1 eV.Kratos charge neutralizer system was used on all the samples forcharge compensation. The binding energy (BE) scale was internallyreferenced to the C 1s peak (BE for C−C = 284.6 eV). Thephotoelectrons were detected at a take-off angle Φ = 0° with respect tothe surface normal. The pressure in the analysis chamber was
ACS Applied Materials & Interfaces Research Article
dx.doi.org/10.1021/am4004073 | ACS Appl. Mater. Interfaces 2013, 5, 2745−27512746
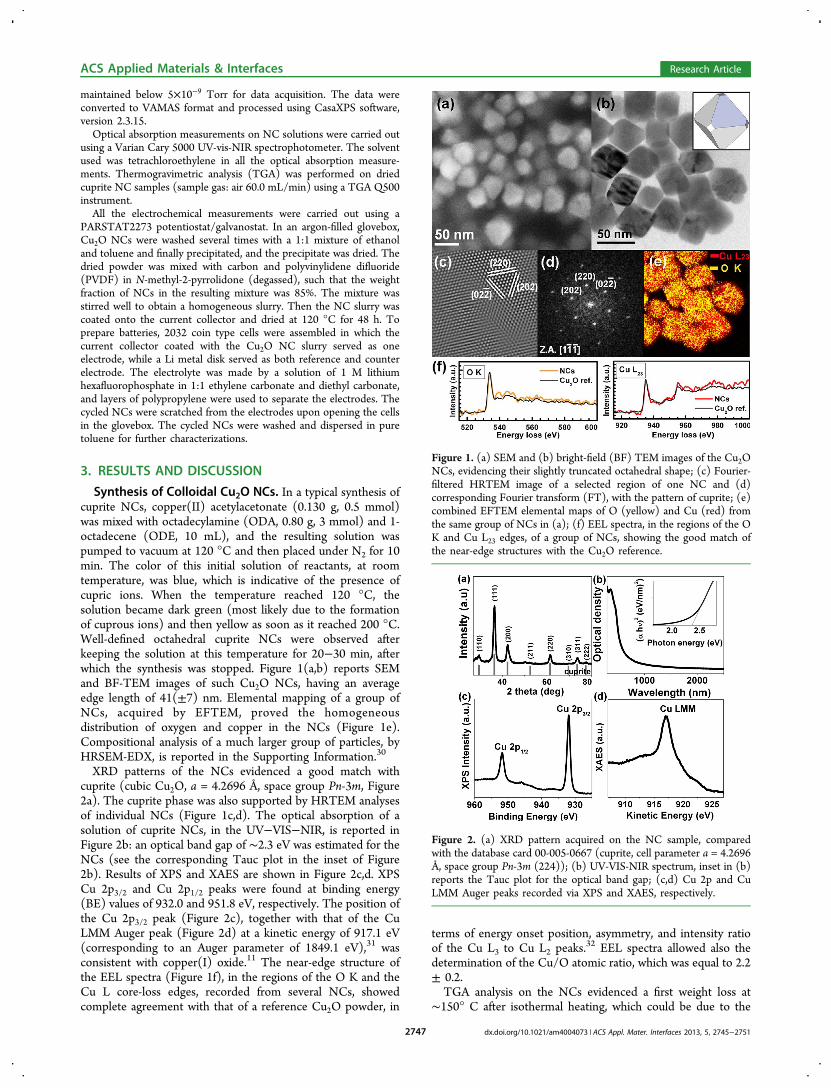
maintained below 5×10⁻⁹ Torr for data acquisition. The data wereconverted to VAMAS format and processed using CasaXPS software,version 2.3.15.Optical absorption measurements on NC solutions were carried out
using a Varian Cary 5000 UV-vis-NIR spectrophotometer. The solventused was tetrachloroethylene in all the optical absorption measure-ments. Thermogravimetric analysis (TGA) was performed on driedcuprite NC samples (sample gas: air 60.0 mL/min) using a TGA Q500instrument.All the electrochemical measurements were carried out using a
PARSTAT2273 potentiostat/galvanostat. In an argon-filled glovebox,Cu2O NCs were washed several times with a 1:1 mixture of ethanoland toluene and finally precipitated, and the precipitate was dried. Thedried powder was mixed with carbon and polyvinylidene difluoride(PVDF) in N-methyl-2-pyrrolidone (degassed), such that the weightfraction of NCs in the resulting mixture was 85%. The mixture wasstirred well to obtain a homogeneous slurry. Then the NC slurry wascoated onto the current collector and dried at 120 °C for 48 h. Toprepare batteries, 2032 coin type cells were assembled in which thecurrent collector coated with the Cu2O NC slurry served as oneelectrode, while a Li metal disk served as both reference and counterelectrode. The electrolyte was made by a solution of 1 M lithiumhexafluorophosphate in 1:1 ethylene carbonate and diethyl carbonate,and layers of polypropylene were used to separate the electrodes. Thecycled NCs were scratched from the electrodes upon opening the cellsin the glovebox. The cycled NCs were washed and dispersed in puretoluene for further characterizations.
3. RESULTS AND DISCUSSION
Synthesis of Colloidal Cu2O NCs. In a typical synthesis ofcuprite NCs, copper(II) acetylacetonate (0.130 g, 0.5 mmol)was mixed with octadecylamine (ODA, 0.80 g, 3 mmol) and 1-octadecene (ODE, 10 mL), and the resulting solution waspumped to vacuum at 120 °C and then placed under N2 for 10min. The color of this initial solution of reactants, at roomtemperature, was blue, which is indicative of the presence ofcupric ions. When the temperature reached 120 °C, thesolution became dark green (most likely due to the formationof cuprous ions) and then yellow as soon as it reached 200 °C.Well-defined octahedral cuprite NCs were observed afterkeeping the solution at this temperature for 20−30 min, afterwhich the synthesis was stopped. Figure 1(a,b) reports SEMand BF-TEM images of such Cu2O NCs, having an averageedge length of 41(±7) nm. Elemental mapping of a group ofNCs, acquired by EFTEM, proved the homogeneousdistribution of oxygen and copper in the NCs (Figure 1e).Compositional analysis of a much larger group of particles, byHRSEM-EDX, is reported in the Supporting Information.30
XRD patterns of the NCs evidenced a good match withcuprite (cubic Cu2O, a = 4.2696 Å, space group Pn-3m, Figure2a). The cuprite phase was also supported by HRTEM analysesof individual NCs (Figure 1c,d). The optical absorption of asolution of cuprite NCs, in the UV−VIS−NIR, is reported inFigure 2b: an optical band gap of ∼2.3 eV was estimated for theNCs (see the corresponding Tauc plot in the inset of Figure2b). Results of XPS and XAES are shown in Figure 2c,d. XPSCu 2p3/2 and Cu 2p1/2 peaks were found at binding energy(BE) values of 932.0 and 951.8 eV, respectively. The position ofthe Cu 2p3/2 peak (Figure 2c), together with that of the CuLMM Auger peak (Figure 2d) at a kinetic energy of 917.1 eV(corresponding to an Auger parameter of 1849.1 eV),31 wasconsistent with copper(I) oxide.11 The near-edge structure ofthe EEL spectra (Figure 1f), in the regions of the O K and theCu L core-loss edges, recorded from several NCs, showedcomplete agreement with that of a reference Cu2O powder, in
terms of energy onset position, asymmetry, and intensity ratioof the Cu L3 to Cu L2 peaks.
32 EEL spectra allowed also thedetermination of the Cu/O atomic ratio, which was equal to 2.2± 0.2.TGA analysis on the NCs evidenced a first weight loss at
∼150° C after isothermal heating, which could be due to the
Figure 1. (a) SEM and (b) bright-field (BF) TEM images of the Cu2ONCs, evidencing their slightly truncated octahedral shape; (c) Fourier-filtered HRTEM image of a selected region of one NC and (d)corresponding Fourier transform (FT), with the pattern of cuprite; (e)combined EFTEM elemental maps of O (yellow) and Cu (red) fromthe same group of NCs in (a); (f) EEL spectra, in the regions of the OK and Cu L23 edges, of a group of NCs, showing the good match ofthe near-edge structures with the Cu2O reference.
Figure 2. (a) XRD pattern acquired on the NC sample, comparedwith the database card 00-005-0667 (cuprite, cell parameter a = 4.2696Å, space group Pn-3m (224)); (b) UV-VIS-NIR spectrum, inset in (b)reports the Tauc plot for the optical band gap; (c,d) Cu 2p and CuLMM Auger peaks recorded via XPS and XAES, respectively.
ACS Applied Materials & Interfaces Research Article
dx.doi.org/10.1021/am4004073 | ACS Appl. Mater. Interfaces 2013, 5, 2745−27512747

solvent evaporation, then a gradual loss until ∼300 °C, whichcould be due to the surfactant removal from the NC surface.30
In the synthesis, ODA acted both as a surfactant and as aregulator of the reduction of Cu2+: when Cu(II) acetylaceto-nate was heated in 1-octadecene at 200°C in the absence ofODA, mostly submicrometer sized metallic copper particleswere found. Therefore, while acetylacetonate was the mainagent responsible for the reduction of cupric ions, thisreduction, in the absence of ODA, did not stop at cuprousions but in part went further to Cu(0) (the reducing ability ofacetylacetone, i.e., the conjugated acid of acetylacetonate, wasalready demonstrated by Tollan et al.33). On the other hand,when the concentration of ODA was increased considerably insolution (∼10 times), in addition to obtaining smaller NCs(average size: 5−10 nm), which is understandable given therole of ODA as surfactant, also a fraction of metal copper NCswere formed. Therefore, when present at high concentrations,ODA competed with acetylacetonate in the reduction of Cu2+.We also tested syntheses using copper(II) acetate instead ofcopper(II) acetylacetonate, which yielded only metallic copperNCs. This indicates that acetate is a stronger reducing agentthan acetylacetonate, and its reducing ability cannot beregulated by the alkylamine. Additional tests (and controlexperiments) are found in the Supporting Information.30 Thelength of the alkyl chain in the amine was critical for thesynthesis of octahedral particles with narrow size distributions.For example, when using octylamine instead of ODA,irregularly shaped cuprite NCs with broad size distributionswere formed. Replacing ODA with other surfactants, forexample, oleic acid, yielded only micrometer and submicrom-eter particles of metallic copper. It appears then that analkylamine of suitable chain length is required to stabilize thereaction towards the sole formation of cuprite NCs withspecific size and shape and narrow size distribution. Theoctahedral habit for these NCs can be rationalized by thegenerally high thermodynamic stability of the nonpolar Cu2O(111) facets over the (100) and (110) ones,34 which mostlikely is further enhanced by the passivation with ODA.Electrochemical Lithiation. Electrodes were then pre-
pared by coating current collectors with a homogeneous slurrycontaining the NCs. TEM analysis of the slurry showed auniform distribution of the particles (NCs) throughout thesample.30 Figure 3a reports typical discharge curves from theCu2O NC electrodes in a half cell with a Li metal counter-electrode at a current density of 1 mA. After a fast slopingvoltage plateau at about 1.8−1.5 V (corresponding to the firstlithiation step of cuprite NCs vs Li/Li+), there was another fairvoltage plateau at about 0.7−0.5 V (Cu2O → Cu),26 and thelast plateau was below 0.5 V, where the deep lithiation beginsand the electrolyte reduction leads to the formation of a solidelectrolyte interface (SEI). The three voltage plateaus indicatethat the process of Li+ ion intake occurs in steps. In the firstcycle, these voltage plateaus together could deliver a capacity of280 mA h g−1 at a current density of 1 mA (we recall here thatthe theoretical capacity of Cu2O is ∼374 mA h g−1),26 fromwhich about 60% was retained in the second cycle. Theirreversible loss of capacity is typically attributed to theformation of a SEI,35 with the subsequent consumption of Li+
ions from the electrolyte. In the successive discharge cycles, thecapacity gradually faded but stabilized at about 100 mAh/gfrom the 40th cycle (and the 50th cycle is also reported inFigure 3b). This can be seen in the inset of Figure 3a where thedischarge capacity versus number of cycles is reported.
Nevertheless, the NCs used in the cells with Li exhibitedoverall a low capacity.To better understand the lithiation/delithiation processes at
the electrode/electrolyte interface, electrochemical impedancespectroscopy (EIS) was performed on the cells in the lithiatedstate. Figure 3c reports the Nyquist plot of the lithiated Cu2ONCs, where the complex impedance curve represents variousinterfacial processes at the electrode/electrolyte interface,36
which appear as a semicircle in the high frequency region and alinear portion in the low frequency domain. In other words, inthe high frequency region (100−1 kHz), the intercept on theZreal axis corresponds to the electrolyte resistance (Re). Thedepressed semicircle in the middle high frequency region is dueto the presence of SEI (Rsf) combined with the charge-transferresistance (Rct) for the transfer of Li
+ ions across the SEI to theelectrode bulk. In the low frequency region (from 1 Hz to1mHz) the spike-like line (a resistive component associatedwith Warburg impedance (Zw)) at a slope of 45° is a signatureof the Li+ ion diffusion in solids. The onset of conversionprocesses associated with Li+ ion insertion kinetics could beobserved by the reduction of the initially broad semicircle uponcycling. The variations of semicircle diameter (from which theRct derived)
37 could also refer to the result of fragmentation ofthe NCs in the successive conversion processes, which modifiesthe electronic conductive paths in NC electrodes. Besides, it isalso plausible that while the NCs are being lithiated anddelithiated (upon cycling) the ionic diffusion36 on those NCsfluctuates due to the varied amount of Li+ ions in the lithiatedphases of the NCs.We additionally performed cyclic voltammetry (CV) on the
electrodes at a scan rate of 5 mV/s (Figure 3d). In the firstcycle, the lithiation at the surface level started at about 1.6 V,leading to a prominent peak at 1.5 V. After this first insertionpotential, the broad shoulders appeared in steps at 1.0 and 0.6V for the second step of lithiation. At potentials below 0.5 V, astrong reduction current indicated the occurrence of severalpossible processes, such as the onset of a deep discharge zone,the passivation of the NC surface due to the formation of the
Figure 3. (a) First three discharge curves from the Cu2O NC electrodeat 1 mA (the inset graph shows discharge curves for later selectedcycles). (b) The charge/discharge in the 50th cycle; (c) Nyquist plot(for impedance curves) of a typical Cu2O NC electrode upon cycling;(d) CV response of the Cu2O NC electrode at 5 mV/s (first andsecond cycle), the dotted CV curves from after 45 cycles.
ACS Applied Materials & Interfaces Research Article
dx.doi.org/10.1021/am4004073 | ACS Appl. Mater. Interfaces 2013, 5, 2745−27512748

SEI layer, the extrusion of copper ions from NCs, and theformation of lithium oxides. The buildup of an SEI on the NCs(as a result of the reduction of electrolytes near the surface ofthe particles during the initial discharges)38 could be seen fromthe CV data (Figure 3d) in the potential range around 0.3 V asa broad sloping peak. Indications of such surface coating on theNC surface can be inferred from HRTEM (Figure 5a). On thereverse scan, the oxidation process was evidenced by two broadshoulders at about 1.5 and 2.6 V, which were attributed to thedecomposition of the lithium oxides, SEI phases,26 and partiallylithiated phases. All these processes were evident as voltageplateaus in the discharge process (Figure 3a). Along the cycles(for instance after the 45th cycle), the recorded CV (Figure 3d,dotted curves) already revealed that the peak potential wasslightly shifted in the forward scan (insertion) due toconversion effect, which suggests that several NCs in theelectrode could have been chemically altered.To study the structural evolution of the Cu2O NCs after
cycling, we first carefully performed the ex situ BF-TEM surveyanalysis (for cycles terminated in the deep lithiation stage) asreported in Figure 4a,b and then performed a detailed HRTEM
and EELS investigation. The overall results suggest that in theearly cycles the products of such a conversion process might beextremely small, below the detection limit of our character-ization techniques. Moreover, the diffraction features from suchtiny conversion products, in case they are arranged in crystallinestructures, might be negligible with respect to those of theunconverted Cu2O NCs, in XRD and electron diffractionanalyses.30 After about 40 cycles, instead, some of the NCswere severely damaged, and several ≈1 nm sized crystallinegrains started to appear (Figure 4a, see also Figures S11 andS12 of the Supporting Information30), probably resulting fromfragmentation of the cuprite NCs. HRTEM analyses allowed usto identify some of them as metallic copper and Li2O.
30 Still, atthis stage, most of the NCs had preserved their pristineoctahedral shape and cuprite structure (Figure 5a−c). Similarobservations were reported on lithiation of hollow iron oxidenanocrystals39 by Koo et al., showing that the nanocrystals wereable to retain their overall shape. On the other hand, in cupriteno evidence of lithiation mechanisms other than conversion hasbeen reported to date.One plausible explanation of why the NCs did not change
much even after many cycles is that they were characterized bya poor lithiation kinetics, and most likely this is the reason why
their overall capacity was low. This in turn might be due tovarious factors, related for example to a different surfacetermination or passivation of these NCs with respect to cupriteparticles of previous works. Furthurmore, it is conceivable thatat this stage the NCs exhibited progressively poorerinterparticle connectivity and loss of electrical pathways,40
which indeed would explain a fading in the capacity (thecorresponding charge/discharge cycles of the cuprite samplesare reported in the Supporting Information, S13).30 Thefraction of the severely damaged and eventually thefragmentation of NCs increased considerably after 50 cycles(Figures 4b and 6). At this stage, the cycling stress apparentlycaused cracks on all the NCs, such that they were transformedinto multidomain particles (Figure 6b). HRTEM investigationsindicated that still the larger NCs had retained the cupritestructure.30 Many of the smaller particles (≤10 nm) thatpopulated the sample at this stage exhibited a crystallinestructure (Figure 6d, e, g−l) and were ascribed to a variety ofphases. Besides tiny metallic Cu NCs (Figure 6g,h), incompleteconversion products were identified, such as nonstoichiometricCu oxide (orthorhombic Cu8O)
41 (Figure 6d−e) and mixedCu−Li oxide (tetragonal LiCuO)42 NCs (Figure 5i−l). Inagreement with HRTEM, XPS analysis of those NCs alsoconfirmed the presence of several Cu compounds. Cu peaks infact were broader than those of the starting NCs, and nosatellites typical of Cu(II) species appeared,30 as expected in thecase of lithiated samples. The detection by HRTEM of verysmall domains either poorly structured or with structuredifferent from that of the large cuprite NCs was notstraightforward. Therefore, it cannot be ruled out that suchnanometer-sized domains containing Li or metallic Cu ormixed Li−Cu oxides are also present on the surface and/orwithin the bulk of the larger NCs. Indeed, a low Li content was
Figure 4. Representative BF-TEM survey image showing the Cu2ONCs after different cycle number, stopped in the lithiation stage: (a)∼40 and (b) ∼50, respectively, indicating the morphological changeson the NCs. The scale bars correspond to 50 nm in each panel and 10nm in each inset.
Figure 5. Representative TEM images of cuprite NCs after 40 cycles.(a) BF-TEM image of an area showing nanometer-sized NCs besidesthe large octahedrons, the latter more or less damaged; (b,c)combinations of the EFTEM elemental map of Cu (red) with (b)EFTEM map of O (yellow) and (c) BF-TEM image (gray scale) of thesame region, showing that Cu is contained in some of the tinyparticles.
ACS Applied Materials & Interfaces Research Article
dx.doi.org/10.1021/am4004073 | ACS Appl. Mater. Interfaces 2013, 5, 2745−27512749

detected by EELS in an area including ∼10 of the larger NCs,showing a weak signal corresponding to the Li K core-loss edgeat ∼55 eV (Figure 6c).
4. CONCLUSIONWe have reported a facile synthesis route to prepare octahedralshaped cuprite (Cu2O) NCs and presented their extensivecharacterizations. The electrochemical lithiation properties ofthe NCs as anodes (in Li ion batteries) were studied bygalvanostatic, cyclic voltammetry, and electrochemical impe-dance spectroscopy. We also followed the morpho-structuraland chemical modifications of cuprite NCs upon cycling via exsitu HRTEM, EELS, and XPS (on lithiated NCs). Afterprolonged cycling, in the lithiated state, most of the NCsshowed severe morphological changes evidencing theirconversion reaction. However, it is interesting to notice thatsome of the initial NCs were able to preserve their octahedralshape even after 40−50 cycles, which clearly points to poorlithiation kinetics. Additionally, different subsets of NCsappeared to be characterized by different lithiation kinetics.Clearly, it would be interesting to compare the results on thepresent octahedral-shaped cuprite NCs with those of cupriteNCs of other morphologies, for example, nanocubes exposing(001) facets, in a similar range of sizes, to study in depth theNC morphology-dependent lithiation reactions. However, sofar our synthesis approaches did not allow us to access suchshapes, and work is in progress in our group to try to tackle thisissue. A possible future implementation of the present NCs as
anode materials could be their integration with suitable elasticbuffers (for example graphene layers) or a formation ofpercolating networks of NCs directly on metal substrates. Atpresent, studies on interfacing the NCs with suitable polymericnanostructures in combination with efficient elastic buffers areunderway in our group.
■ ASSOCIATED CONTENT*S Supporting InformationControl synthesis experiments and additional data on TEM,XRD, TGA, HRSEM-EDX, and XPS analysis. This material isavailable free of charge via the Internet at http://pubs.acs.org.
■ AUTHOR INFORMATIONCorresponding Author*Tel.: +39 010 71781 979. E-mail: [email protected] authors declare no competing financial interest.
■ ACKNOWLEDGMENTSThe authors acknowledge financial support from EuropeanUnion through the FP7 starting ERC grant NANO-ARCH(contract #240111) and the Italian FIRB grant (contract#RBAP115AYN). Dr. Tania Montanari is acknowledged forhelp with TGA analysis.
■ REFERENCES(1) Lee, Y. S.; Winkler, M. T.; Siah, S. C.; Brandt, R.; Buonassisi, T.Appl. Phys. Lett. 2011, 98, 192115.(2) de Jongh, P. E.; Vanmaekelbergh, D.; Kelly, J. J. Chem. Commun.1999, 1069−1070.(3) Barreca, D.; Carraro, G.; Gombac, V.; Gasparotto, A.; Maccato,C.; Fornasiero, P.; Tondello, E. Adv. Funct. Mater. 2011, 21, 2611−2623.(4) Bordiga, S.; Paze, C.; Berlier, G.; Scarano, D.; Spoto, G.;Zecchina, A.; Lamberti, C. Catal. Today 2001, 70, 91−105.(5) Barreca, D.; Comini, E.; Gasparotto, A.; Maccato, C.; Sada, C.;Sberveglieri, G.; Tondello, E. Sens. Actuators, B 2009, 141, 270−275.(6) Morales, J.; Sanchez, L.; Bijani, S.; Martinez, L.; Gabas, M.;Ramos-Barrado, J. R. Electrochem. Solid State Lett. 2005, 8, A159−A162.(7) Gou, L. F.; Murphy, C. J. Nano Lett. 2003, 3, 231−234.(8) Tan, Y.; Xue, X.; Peng, Q.; Zhao, H.; Wang, T.; Li, Y. Nano Lett.2007, 7, 3723−3728.(9) Dodoo-Arhin, D.; Leoni, M.; Scardi, P.; Garnier, E.; Mittiga, A.Mater. Chem. Phys. 2010, 122, 602−608.(10) Kim, M. H.; Lim, B.; Lee, E. P.; Xia, Y. J. Mater. Chem. 2008, 18,4069−4073.(11) Yin, M.; Wu, C. K.; Lou, Y. B.; Burda, C.; Koberstein, J. T.; Zhu,Y. M.; O’Brien, S. J. Am. Chem. Soc. 2005, 127, 9506−9511.(12) Yao, K. X.; Yin, X. M.; Wang, T. H.; Zeng, H. C. J. Am. Chem.Soc. 2010, 132, 6131−6144.(13) Siegfried, M. J.; Choi, K. S. Adv. Mater. 2004, 16, 1743−1746.(14) Ziegler, K. J.; Doty, R. C.; Johnston, K. P.; Korgel, B. A. J. Am.Chem. Soc. 2001, 123, 7797−7803.(15) He, P.; Shen, X. H.; Gao, H. C. J. Colloid Interface Sci. 2005, 284,510−515.(16) Ng, C. H. B.; Fan, W. Y. J. Phys. Chem. B 2006, 110, 20801−20807.(17) Xu, H.; Wang, W.; Zhu, W. J. Phys. Chem. B 2006, 110, 13829−13834.(18) Barreca, D.; Gasparotto, A.; Maccato, C.; Tondello, E.; Lebedev,O. I.; Van Tendeloo, G. Cryst. Growth Des. 2009, 9, 2470−2480.(19) Gao, X. P.; Bao, J. L.; Pan, G. L.; Zhu, H. Y.; Huang, P. X.; Wu,F.; Song, D. Y. J. Phys. Chem. B 2004, 108, 5547−5551.
Figure 6. Representative HRTEM and EELS results obtained on the∼50 times cycled sample in the lithiated stage. (a) Overview BF-TEMimage of a group of NCs, indicating the presence of smaller particlesbesides the ∼40 nm ones; (b) STEM-HAADF image of an individualNC, clearly showing cracks within its volume; (c) EEL spectrumcollected over a group of ∼10 large NCs in the region of the Li Kedge; (d,e) HRTEM image and corresponding FT of a region of thefilament-like feature seen in (a), from which it can be concluded thatthis feature was made of orthorhombic Cu8O (a = 5.47 Å, b = 6.02 Å, c= 9.34 Å). (f) BF-TEM image of a region where smaller particles arevisible besides large cuprite NCs; (g) HRTEM image and (h) relativeFT of the particle indicated with an arrow in (f), which shows thestructure of metallic Cu. (i−l) HRTEM image and FT of a ∼4 nmdiameter particle. The FT is compatible with tetragonal LiCuO (a = b= 8.514 Å, c = 3.809 Å).
ACS Applied Materials & Interfaces Research Article
dx.doi.org/10.1021/am4004073 | ACS Appl. Mater. Interfaces 2013, 5, 2745−27512750
(20) Zhang, C. Q.; Tu, J. P.; Huang, X. H.; Yuan, Y. F.; Chen, X. T.;Mao, F. J. Alloys Compd. 2007, 441, 52−56.(21) Grugeon, S.; Laruelle, S.; Herrera-Urbina, R.; Dupont, L.;Poizot, P.; Tarascon, J. M. J. Electrochem. Soc. 2001, 148, A285−A292.(22) Poizot, P.; Laruelle, S.; Grugeon, S.; Dupont, L.; Tarascon, J. M.Nature 2000, 407, 496−499.(23) Wu, H. B.; Chen, J. S.; Hng, H. H.; Wen David Lou, X.Nanoscale 2012, 4, 2526−2542.(24) Wang, Z.; Su, F.; Madhavi, S.; Lou, X. W. Nanoscale 2011, 3,1618−1623.(25) Barreca, D.; Carraro, G.; Gasparotto, A.; Maccato, C.; Cruz-Yusta, M.; Gomez-Camer, J. L.; Morales, J.; Sada, C.; Sanchez, L. ACSAppl. Mater. Interfaces 2012, 4, 3610−3619.(26) Xiang, J. Y.; Wang, X. L.; Xia, X. H.; Zhang, L.; Zhou, Y.; Shi, S.J.; Tu, J. P. Electrochim. Acta 2010, 55, 4921−4925.(27) Park, J. C.; Kim, J.; Kwon, H.; Song, H. Adv. Mater. 2009, 21,803−807.(28) Bao, H.; Zhang, W.; Shang, D.; Hua, Q.; Ma, Y.; Jiang, Z.; Yang,J.; Huang, W. J. Phys. Chem. C 2010, 114, 6676−6680.(29) Egerton, R. F. Electron Energy-Loss Spectroscopy in the ElectronMicroscope, 2nd ed.; Plenum Press: New York, 1996.(30) See Supporting Information for additional details.(31) Gaarenstroom, S. W.; Winograd, N. J. Chem. Phys. 1977, 67,3500−3506.(32) Ngantcha, J. P.; Gerland, M.; Kihn, Y.; Riviere, A. Eur. Phys. J.Appl. Phys. 2005, 29, 83−89.(33) Tollan, C. M.; Echeberria, J.; Marcilla, R.; Pomposo, J. A.;Mecerreyes, D. J. Nanopart. Res. 2009, 11, 1241−1245.(34) Zheng, Z.; Huang, B.; Wang, Z.; Guo, M.; Qin, X.; Zhang, X.;Wang, P.; Dai, Y. J. Phys. Chem. C 2009, 113, 14448−14453.(35) Chung, K. Y.; Yoon, W.-S.; Kim, K.-B.; Cho, B.-W.; Yang, X.-Q.J. Appl. Electrochem. 2011, 41, 1295−1299.(36) Dilena, E.; Dorfs, D.; George, C.; Miszta, K.; Povia, M.;Genovese, A.; Casu, A.; Prato, M.; Manna, L. J. Mater. Chem. 2012, 22,13023−13031.(37) Kang, J.-G.; Ko, Y.-D.; Park, J.-G.; Kim, D.-W. Nanoscale Res.Lett. 2008, 3, 390−394.(38) Zhang, S. S. J. Power Sources 2006, 162, 1379−1394.(39) Koo, B.; Xiong, H.; Slater, M. D.; Prakapenka, V. B.;Baasubramanian, M.; Podsiadlo, P.; Johnson, C. S.; Rajh, T.;Shevchenko, E. V. Nano Lett. 2012, 12, 2429−2435.(40) Song, M.-K.; Park, S.; Alamgir, F. M.; Cho, J.; Liu, M. Mater. Sci.Eng., R 2011, 72, 203−252.(41) Guan, R.; Hashimoto, H.; Kuo, K. H. Acta Crystallogr., Sect. B:Struct. Sci. 1984, 40, 560−566.(42) Migeon, H. N.; Zanne, M.; Gleitzer, C. J. Solid State Chem.1976, 16, 325−330.
ACS Applied Materials & Interfaces Research Article
dx.doi.org/10.1021/am4004073 | ACS Appl. Mater. Interfaces 2013, 5, 2745−27512751