Promising Strategies of Colloidal Drug Delivery-Based ... - MDPI
Upload
khangminh22Category
view
1download
0
A Colloidal Drug Delivery System for Antiallergic Drug
A Thesis submitted to Gujarat Technological University
for the Award of
Doctor of Philosophy
in
Pharmacy
by
Ms. Jaswandi Udhav Girme
[Enrollment No. : 119997290027]
under supervision of
Dr. Naazneen Surti
GUJARAT TECHNOLOGICAL UNIVERSITY
AHMEDABAD
December - 2019

ii
© Jaswandi Girme

iii
DECLARATION
I declare that the thesis entitled ―A Colloidal Drug Delivery System for Antiallergic Drug”
submitted by me for the degree of Doctor of Philosophy is the record of research work carried
out by me during the period from July 2011 to Dec 2019 under the supervision of Dr. Naazneen
Surti and this has not formed the basis for the award of any degree, diploma, associateship,
fellowship, titles in this or any other University or other institution of higher learning.
I further declare that the material obtained from other sources has been duly acknowledged in
the thesis. I shall be solely responsible for any plagiarism or other irregularities, if noticed in
the thesis.
Signature of the Research Scholar: Date: 21/7/2020
Name of Research Scholar: Ms. Jaswandi U. Girme
Place: Vadodara, Gujarat, India.

iv
CERTIFICATE
I certify that the work incorporated in the thesis ―A Colloidal Drug Delivery System for
Antiallergic Drug” submitted by Ms. Jaswandi U. Girme was carried out by the candidate
under my supervision/guidance. To the best of my knowledge: (i) the candidate has not
submitted the same research work to any other institution for any degree/diploma,
Associateship, Fellowship or other similar titles (ii) the thesis submitted is a record of original
research work done by the Research Scholar during the period of study under my supervision,
and (iii) the thesis represents independent research work on the part of the Research Scholar.
Signature of Supervisor: Date: 21/7/2020
Name of Supervisor: Dr. Naazneen Surti
Place: Vadodara, Gujarat, India.

v
Originality Report Certificate
It is certified that PhD Thesis titled ―A Colloidal Drug Delivery System for Antiallergic
Drug” by Ms. Jaswandi U. Girme has been examined by us. We undertake the following:
a. Thesis has significant new work / knowledge as compared already published or are
under consideration to be published elsewhere. No sentence, equation, diagram, table,
paragraph or section has been copied verbatim from previous work unless it is placed
under quotation marks and duly referenced.
b. The work presented is original and own work of the author (i.e. there is no plagiarism).
No ideas, processes, results or words of others have been presented as Author own
work.
c. There is no fabrication of data or results which have been compiled / analysed.
d. There is no falsification by manipulating research materials, equipment or processes, or
changing or omitting data or results such that the research is not accurately represented
in the research record.
e. The thesis has been checked using ―Urkund‖ (copy of originality report attached) and
found within limits as per GTU Plagiarism Policy and instructions issued from time to
time (i.e. permitted similarity index <= 10 %).
Signature of the Research Scholar: Date: 21/7/2020
Name of Research Scholar: Ms. Jaswandi U. Girme
Place: Vadodara, Gujarat, India.
Signature of Supervisor: Date: 21/7/2020
Name of Supervisor: Dr. Naazneen Surti
Place: Vadodara, Gujarat, India.

vi

vii
PhD THESIS Non-Exclusive License to
GUJARAT TECHNOLOGICAL UNIVERSITY
In consideration of being a PhD Research Scholar at GTU and in the interests of the facilitation
of research at GTU and elsewhere, I, Ms. Jaswandi U. Girme (Enrollment No. : 119997290027)
hereby grant a non-exclusive, royalty free and perpetual license to GTU on the following terms:
a) GTU is permitted to archive, reproduce and distribute my thesis, in whole or in part, and/or
my abstract, in whole or in part ( referred to collectively as the ―Work‖) anywhere in the
world, for non-commercial purposes, in all forms of media;
b) GTU is permitted to authorize, sub-lease, sub-contract or procure any of the acts
mentioned in paragraph (a);
c) GTU is authorized to submit the Work at any National / International Library, under the
authority of their ―Thesis Non-Exclusive License‖;
d) The Universal Copyright Notice (©) shall appear on all copies made under the authority of
this license;
e) I undertake to submit my thesis, through my University, to any Library and Archives. Any
abstract submitted with the thesis will be considered to form part of the thesis.
f) I represent that my thesis is my original work, does not infringe any rights of others,
including privacy rights, and that I have the right to make the grant conferred by this
non-exclusive license.
g) If third party copyrighted material was included in my thesis for which, under the terms of
the Copyright Act, written permission from the copyright owners is required, I have
obtained such permission from the copyright owners to do the acts mentioned in paragraph
(a) above for the full term of copyright protection.
h) I retain copyright ownership and moral rights in my thesis, and may deal with the
copyright in my thesis, in any way consistent with rights granted by me to my University
in this non-exclusive license.
i) I further promise to inform any person to whom I may hereafter assign or license my
copyright in my thesis of the rights granted by me to my University in this non exclusive

viii
license.
j) I am aware of and agree to accept the conditions and regulations of PhD including all
policy matters related to authorship and plagiarism.
Signature of the Research Scholar: Date: 21/7/2020
Name of Research Scholar: Ms. Jaswandi U. Girme
Place: Vadodara, Gujarat, India.
Signature of Supervisor: Date: 21/7/2020
Name of Supervisor: Dr. Naazneen Surti
Place: Vadodara, Gujarat, India
Seal

ix
(briefly specify the modifications suggested by the panel)
(The panel must give justifications for rejecting the research work)
Thesis Approval Form
The viva-voce of the PhD Thesis submitted by Ms. Jaswandi U. Girme (Enrollment No.
119997290027) entitled ―A Colloidal Drug Delivery System for Antiallergic Drug” was
conducted on Tuesday, 21/7/2020 (day and date) at Gujarat Technological University.
(Please tick any one of the following option)
The performance of the candidate was satisfactory. We recommend that he/she be awarded
the PhD degree.
Any further modifications in research work recommended by the panel after 3 months
from the date of first viva-voce upon request of the Supervisor or request of Independent
Research Scholar after which viva-voce can be re-conducted by the same panel again.
The performance of the candidate was unsatisfactory. We recommend that he/she should not be awarded the PhD degree.
Dr. Naazneen Surti Dr. Brahmeshwar Mishra
Name and Signature of Supervisor with Seal 1) (External Examiner 1) Name and Signature
Dr. Chandrakant Kokare
2) (External Examiner 2) Name and Signature
X
X
√
x
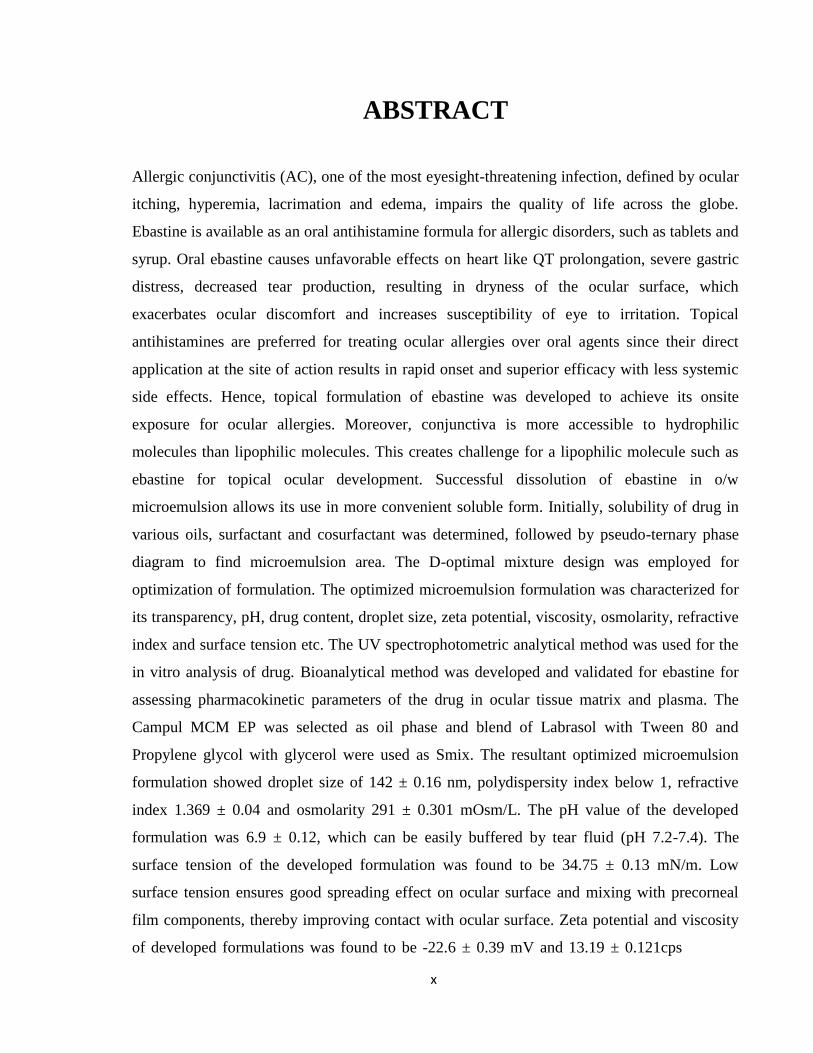
ABSTRACT
Allergic conjunctivitis (AC), one of the most eyesight-threatening infection, defined by ocular
itching, hyperemia, lacrimation and edema, impairs the quality of life across the globe.
Ebastine is available as an oral antihistamine formula for allergic disorders, such as tablets and
syrup. Oral ebastine causes unfavorable effects on heart like QT prolongation, severe gastric
distress, decreased tear production, resulting in dryness of the ocular surface, which
exacerbates ocular discomfort and increases susceptibility of eye to irritation. Topical
antihistamines are preferred for treating ocular allergies over oral agents since their direct
application at the site of action results in rapid onset and superior efficacy with less systemic
side effects. Hence, topical formulation of ebastine was developed to achieve its onsite
exposure for ocular allergies. Moreover, conjunctiva is more accessible to hydrophilic
molecules than lipophilic molecules. This creates challenge for a lipophilic molecule such as
ebastine for topical ocular development. Successful dissolution of ebastine in o/w
microemulsion allows its use in more convenient soluble form. Initially, solubility of drug in
various oils, surfactant and cosurfactant was determined, followed by pseudo-ternary phase
diagram to find microemulsion area. The D-optimal mixture design was employed for
optimization of formulation. The optimized microemulsion formulation was characterized for
its transparency, pH, drug content, droplet size, zeta potential, viscosity, osmolarity, refractive
index and surface tension etc. The UV spectrophotometric analytical method was used for the
in vitro analysis of drug. Bioanalytical method was developed and validated for ebastine for
assessing pharmacokinetic parameters of the drug in ocular tissue matrix and plasma. The
Campul MCM EP was selected as oil phase and blend of Labrasol with Tween 80 and
Propylene glycol with glycerol were used as Smix. The resultant optimized microemulsion
formulation showed droplet size of 142 ± 0.16 nm, polydispersity index below 1, refractive
index 1.369 ± 0.04 and osmolarity 291 ± 0.301 mOsm/L. The pH value of the developed
formulation was 6.9 ± 0.12, which can be easily buffered by tear fluid (pH 7.2-7.4). The
surface tension of the developed formulation was found to be 34.75 ± 0.13 mN/m. Low
surface tension ensures good spreading effect on ocular surface and mixing with precorneal
film components, thereby improving contact with ocular surface. Zeta potential and viscosity
of developed formulations was found to be -22.6 ± 0.39 mV and 13.19 ± 0.121cps

xi
respectively. The optimum physicochemical properties were found to be eye-fitting. Carboxy
methyl cellulose and sodium hyaluronate were used as gelling agents at different
concentrations to prepare microemulsion based gel with a goal of increasing residential time at
the site of action. The ebastine microemulsion based gel was evaluated for various parameters
like pH, rheological assessment, drug content, mucoadhesive strength and spreadability. The
antiallergic potential of optimized formulation was assessed by performing in vitro study like
hen's egg chorioallantoic membrane test (HET-CAM) for tolerability and in vivo efficacy
study in ovalbumin (OA)-induced allergic conjunctivitis (AC) with acute ocular irritation
study and blinking index. Eye scratching behavior and edema were evaluated after topical
antigen challenge followed by histopathology. The results showed that developed formulation
was effective in inhibiting symptoms of eye inflammation induced by ovalbumin. Acute
ocular irritation test was performed using rabbits and results showed that developed
formulation was non-irritant to the eye. The in-vivo pharmacokinetic studies revealed
increased concentration of the drug in ocular tissue matrix with negligible systemic
absorption. The study revealed that the developed formulation of ebastine was retained at
ocular site up to 8 hr., showing ocular tissue concentration in multiples of IC 50 (oral) reported
for antihistaminic and rest of late phase allergy mediator‘s antagonistic action. Hence,
prepared microemulsion based gel of ebastine has great potential for treating early as well as
late allergy symptoms and can be considered as an great alternative to customary oral
formulations of poorly soluble antiallergic drug, exhibiting site specific delivery.

xii
ACKNOWLEDGEMENT
The satisfaction that accompanies the successful completion of any task would be incomplete without
mentioning the peoples who made it possible and whose constant guidance and encouragement crown
all the efforts with success. It is not a fair task to acknowledge all the peoples who made this PhD
thesis possible with few words, However I will try to do my best to extend my great appreciation to
everyone who helped me scientifically and emotionally throughout this journey. Although, it is just my
name on the cover, many peoples have contributed to the research in their own particular way and for
that I want to give them special thanks.
I offer prayer of thanksgiving to the almighty God for being the source of strength throughout the years
of my research work to reach this day of success.
With a deep sense of respect and gratitude, I would like to express my sincere thanks to my esteemed
guide, Dr. Naazneen Surti, Professor & Vice- Principal, Babaria Institute of Pharmacy, Vadodara, for
giving me the opportunity to work in the field of colloidal drug delivery. Without her perpetual
encouragement, constructive, prompt, timely and helpful guidance throughout my journey of the
doctoral research, I would never have succeeded in accomplishing the work.
With great reverence, I take this opportunity to express my debt of gratitude to the DPC (Doctoral
Progress committee) members, Dr. M.C. Gohel, research director, Anand Pharmacy College, Anand,
Gujarat & consultant, Alembic Pharmaceuticals Ltd. and Dr. Tejal Mehta, Professor & Head, Institute of
Pharmacy, Nirma University, Ahmadabad for providing their valuable insights, their critical review,
guidance and support during the work.

xiii
I wish to express my heartiest thanks Dr. Vimal Kumar, Dean, ITM School of Pharmacy, ITMBU
University, Dr. Abhay Dharamsi, Dean, Faculty of Pharmacy, Parul University, Dr. Umesh
Upadhay, Principal, Sigma Institute of Pharmacy, Dr. Falguni Tandel, Head of the Pharmaceutical
Analysis department, Parul University, Dr. Shweta Gupta, Associate Professor, Parul University, Dr.
Asha Patel, Associate Professor, Parul University, for providing me the infrastructural and other
direct or indirect support for the successful completion of research work.
I am immensely thankful to Mr. Sameer Mehetre, Senior manager, Drug discovery, SPARC, Mr.
Prashant Bahekar, Senior, manager, Drug discovery, SPARC, Dr. Gajanan Shinde, Senior manager,
F&D, Mil Laboratories Pvt. Ltd for their kind help in data analysis.
It would be remiss on my part if I don’t acknowledge the help and support of all my friends especially
Dr. Prachi Karia, research scholar, M.S. University, Ms. Meenakshi Sharma and other colleagues
for their wonderful company, unending inspirations, motivations, constant encouragement, technical
assistance throughout the research work.
I am also thankful to SICART (Sophisticated Instrumentation Centre for Applied Research and
Testing) for providing me the technical and infrastructural support for carrying out the DSC analysis,
TEM analysis.
I wish to express my sincere thanks to all editors, publishers and their honorable referees who have
published our research papers.
I am immensely thankful to M/s Bal Pharma Pvt. Ltd, Bommasandra, Bangalore, India, for providing
the gift sample of drug, M/s Gattefosse, Saint-Priest, France, M/s Abitec Corp, Ohio, USA for
providing the gift samples of excipients for the study, Government Poultry House, Vadodara for
providing fertilized eggs for CAM assay.
I would also like to put in record my thanks to Honorable Vice Chancellor Prof. (Dr.) Navin Sheth,
Ex-Vice-Chancellor Dr. C.N. Patel, BOG member, Dr. Rakesh Patel, BOG member Mr. J.C. Lilani,
Research Coordinator, Ms. Mona Chaurasiya, Mr. Dhaval Gohil and other Staff Members of Ph.D
section for their co-operative assistance and support.
At the last, I would like to thank my daughter for kind support and patience showed by her during the
years of PhD. I apologize to my daughter, Sanvi for not giving her time; I am amazed with the level of
understanding shown by her during my research work. And finally, I would like to thank my truly
amazing husband, Mr. Sameer Mehetre, whose love and encouragement allowed me to finish this
journey. He supported me every step of the way with patience, great insight, humor and knowledge.
xiv
Gratitude is not just an action, not just saying thank you to animate object, few inanimate objects are
also paramount significant like my shelter, my untired laptop, my unwater logged plants n rest of all
to whom I should apologize……….
Thanks to one & all… Ms. Jaswandi u. Girme
Date: December, 2019
Place: Vadodara

xv
Dedicated to my Beloved
Family Members
& The Saraswati Mata…
xvi
Table of Contents
S.No. Contents P. No.
i Title Page. i
ii Declaration iii
iii Certificate iv
iv Originality Report Certificate v
v Non-Exclusive License Certificate. vii
vi Thesis Approval Certificate ix
vii Abstract x
viii Acknowledgement xii
ix Dedication page xv
x Table of Contents xvi
xi List of Abbreviation xxiv
xii List of Symbols xxvii
xiii List of Figures xxix
xiv List of Tables xxxii
xv List of Appendices xxxv
Chapter 1 Introduction 1-13
1.1 Definition of Problem 3
1.2 Aim of the Research Work 4
1.3 Objective and Scope of Research Work 5
1.4 Scope of Research Work 5
1.5 Rationale of Research Work 5
1.5.1 Rational for Selection of Ocular Route of Drug Delivery 5
1.5.2 Rationale for Selection of Microemulsion Drug Delivery System 6
1.5.3 Rationale for Selection of Drug 7
1.6 Proposed Plan of Work 7
1.7 Original Contribution by the Thesis 8

xvii
1.8 Outline of Thesis 8
1.9 References 9
Chapter 2 Literature Review 14-55
2.1 Overview 15
2.2 Allergic Conjunctivitis 17
2.2.1 Types of Allergic Conjunctivitis 17
2.2.2 Complications of Allergic Conjunctivitis 21
2.2.3 Treatment of Allergic Conjunctivitis 22
2.3 Microemulsion as Colloidal Drug Delivery for Ocular Therapy 25
2.3.1 Anatomy & Physiology of Eye as Barriers for Ocular Drug
Delivery
25
2.3.2 Conventional Vs. Colloidal Drug Delivery Platform 26
2.3.3 Microemulsion 27
2.3.4 Theories of Microemulsion Formation 28
2.3.5 Components of Microemulsion 29
2.4 Literature Survey 32
2.5 Drug and Excipients Profile 35
2.5.1 Ebastine 35
2.5.2 Campul MCM EP 36
2.5.3 Tween 80 37
2.5.4 Labrasol 38
2.5.5 Glycerol 39
2.5.6 Propylene glycol 41
2.5.7 Sodium Hyaluronate 42
2.5.8 Carboxy methyl cellulose 43
2.5.9 Sodium perborate 44
2.6 References 45
Chapter 3 Materials and Methods 56-93
3.1 Material and Equipment Used 57
3.2 Identification of Drug 59

xviii
3.2.1 Physical Appearance of Drug 60
3.2.2 Melting Point 60
3.2.3 Solubility 60
3.2.4 FT-IR Study 60
3.2.5 Differential Scanning Calorimetry 61
3.3 Analytical Method 61
3.3.1 Estimation of Ebastine using UV Spectrophotometry 61
3.3.1.1 Calibration Curve of Ebastine in Methanol as a Solvent 61
3.3.1.2 Calibration Curve of Ebastine in Methanolic Phosphate
Buffered Saline (PBS, pH 7.4, 30% v/v) 62
3.3.2 High Performance Liquid Chromatography (HPLC) Method Development 63 and Validation
3.3.2.1 Analytical Method Development 64
3.3.2.2 Analytical Method Validation 66
a. Linearity and Range 66
b. Precision 66
c. Accuracy 66
d. Sensitivity 67
e. Extraction Recovery 67
f. Robustness 67
g. Stability 68
h. System Suitability 68
i Statistical Analysis 68
3.4 Screening of Components of Microemulsion Formulation17
69
3.4.1 Selection of Oil 69
3.4.2 Selection of Surfactants 69
3.4.3 Selection of Co-surfactants 70
3.4.4 Drug Excipients Compatibility Study 70
3.5 Construction of Pseudo- Ternary Phase Diagrams 70
3.6 Preparation of Microemulsion 71

xix
3.7 Optimiza tion of Microemulsion by D-Optimal Mixture Design 72
3.7.1 Preparation of drug loaded microemulsion 73
3.8 Formulat ion and Optimization of Microemulsion Based Gel 73
3.9 Evaluatio n of Optimized Microemulsion Formulation 74
3.9.1 Measurement of pH 74
3.9.2 Droplet size, Zeta potential and Viscosity measurement 74
3.9.3 Measurement of Refractive Index 74
3.9.4 Measurement of Osmolarity 75
3.9.5 Measurement of Surface Tension 75
3.9.6 Determination of Drug Content 75
3.9.7 Transmission Electron Microscopy 75
3.9.8 Measurement of % Transmittance 76
3.10 Evaluati on of Microemulsion Based Gel 76
3.10.1 Measurement of pH 76
3.10.2 Rheology study 76
3.10.3 Mucoadhesive strength 76
3.10.4 Spreadability 77
3.10.5 Drug Content 77
3.10.6 In vitro Drug Release Study 77
3.10.7 Kinetics of Drug Release Study 78
3.10.7.1 Zero Order Release Equation 78
3.10.7.2 First Order Release Equation 78
3.10.7.3 Higuchi Square Root of Time Model 78
3.10.7.4 Korsmeyer-Peppas Model 79
3.11 Steriliza tion and Sterility Testing 80
3.11.1 Sterilization 80
3.11.2 Sterility Testing 80
3.12 In vitro / In vivo studies 80
3.12.1 Ocular Irritation Study by Hen‘s Egg Chorioallantoic Membrane
(HET-CAM) Test
81
3.12.2 Ocular Tolerability Study by Blinking index 81
xx
3.12.3 Acute Ocular Irritation Study 82
3.12.4 Efficacy Study by Ovalbumin Induced Allergic Conjunctivitis
Model
82
3.12.4.1 Edema Scoring 83
3.12.4.2 Scratching Behavior 83
3.12.5 Histopathological Study 83
3.13 Pharmacokinetic Study 84
3.14 Stability Studies 84
3.14.1 Accelerated Stability Study by Centrifugation Stress Test 84
3.14.2 Stability Study as per ICH guidelines 84
3.15 Data Analysis 85
3.16 References 85
Chapter 4 Results and Discussion 90-180
4.1 Identification of Drug 91
4.1.1 Identification of Drug by Physical Attributes 91
4.1.2 Identification of Drug by FTIR 91
4.1.3 Identification of Drug by DSC 94
4.2 Analytical Method 94
4.2.1 UV Spectrophotometric Estimation of Ebastine 95
4.2.1.1 Calibration Curve in Methanol as Solvent 95
4.2.1.2 Calibration Curve in Methanolic Phosphate Buffer (PBS, pH 97 7.4 , 30% v/v) as solvent
4.2.2 HPLC Method Development and Validation 98
4.2.2.1 RP- HPLC Method development for Pure Ebastine 98
a. System Suitability Test 99
b. Linearity and Range 100
c. Repeatability 101
d. Precision 102
e. Accuracy 103
f. Limit of Detection (LOD) and Limit of Quantification
(LOQ) 104
g. Robustness 104

xxi
e
4 .2.2.2 Bioanalytical Method Development in Ocular Tissue 105
a. System Suitability Test for Drug with Internal Standard 107
b. Linearity and Range 108
c. Extraction Trials in Ocular Tissue 110
d. System Suitability Test for Drug with Internal Standard
in Ocular Tissue 111
e. Sensitivity 112
f. Linearity and Range 113
g Accuracy 115
h. Precision 115
i. Recovery 116
j. Stability Study 118
4 .2.2.3 Bioanalytical Study of Plasma Sample 121
a. System Suitability Test for the Drug with Internal
Standard in Plasma 122
b. Linearity and Range 123
4.3 Screening of Components of Microemulsion 125
4.3.1 Sel ection of Oil 125
4.3.2 Sel ection of Surfactant 127
4.3.3 Sel ection of Co-surfactant 128
4.3.4 Dr ug Excipient Compatibility Study 130
4.3.5 Dif ferential Scanning Calorimetry Study 131
4.4 Constructi on of Pseudo- ternary Phase Diagrams 132
4.5 Optimizati on of Microemulsion by D-Optimal Mixture Design 136
4.5.1 Ex perimental Validation of Design Space 145
4.6 Formulatio n and Optimization of Microemulsion Based Gel 146
4.7 Evaluation of Optimized Microemulsion Formulation 148
4.7.1 pH 148
4.7.2 Dr oplet size, Zeta Potential and Viscosity Measurement 148
4.7.3 M asurement of Refractive Index 150
4.7.4 Me asurement of Osmolarity 150

xxii
4.7.5 Measurement of Surface Tension 151
4.7.6 Drug Content 151
4.7.7 Transmission Electron Microscopy 151
4.7.8 Measurement of % Transmittance 152
4.8 Evaluati on of Microemulsion Based Gel 152
4.8.1 pH 152
4.8.2 Rheology Study 153
4.8.3 Mucoadhesive Strength 156
4.8.4 Spreadability 156
4.8.5 Drug content determination 156
4.8.6 In vitro Drug Release Study 156
4.8.7 Kinetics of Drug Release Study 158
4.9 Steriliza tion and Sterility Testing 161
4.10 In vitro / In vivo studies 163
4.10.1 Ocular Irritation Study by Hen‘s Egg Chorioallantoic Membrane (HET-
CAM) Test 163
4.10.2 Ocular Tolerability Study by Blinking index 165
4.10.3 Acute Ocular Irritation Study 165
4.10.4 Efficacy Study by Ovalbumin Induced Allergic Conjunctivitis Model 166
4.10.4.1 Edema scoring 166
4.10.4.2 Scratching Behavior 169
4.11 Histopa thological Study 169
4.12 Pharma cokinetic Study 171
4.13 Stability Studies 173
4.13.1 Accelerated Stability Test by Centrifugation Stress Test 173
4.13.2 Stability study as per ICH guidelines 173
4.14 Referenc es 176
Chapter 5 Summa ry and Conclusion 181-189
5.1 Summar y of the Work 182
5.2 Achieve ment with Respect to the Objective 188
xxiii
5.3 Conclusion 188
Appendices
190-191
Appendix I: Approval Certificate from CPCSEA & IAEC Committee for
Animal Study
190
Appendix II: Dose Calculation Method 191
List of Publications 192

xxiv
List of Abbreviations
Abbreviations Full form
AC Allergic conjunctivitis
SAC Seasonal allergic conjunctivitis
PAC Perennial allergic conjunctivitis
VKC Vernal keratoconjunctivitis
AKC Atopic keratoconjunctivitis
GPC Giant papillary conjunctivitis
BCS Biopharmaceutical classification system
ICAM Intercellular adhesion molecule
VCAM Vascular cell adhesion molecule
MCP Monocyte chemo attractant protein
IL Interleukin
MIP Macrophage inflammatory protein
TAB Tablet
SOLN Solution
OD Once daily
BID Twice daily
BW Body weight
CMC Critical micelle concentration
HLB Hydrophilic lipophilic balance
IOP Intraocular pressure
ME Microemulsion
BRB Blood retinal barrier
BAB Blood aqueous humor Barrier
CFR Code of federal regulations
CPCSEA Committee for the Purpose of Control and Supervision of Experiments on Animals
Da Dalton
DLS Dynamic light scattering
DoE Design of experiment
EBA Ebastine

xxv
Abbreviations Full form
FDA Food and drug administration
PEG Polyethylene glycol
GIT Gastro- Intestinal Tract
GRAS Generally regarded as safe
HED Human equivalent dose
HPLC High performance liquid chromatography
RP-HPLC Reversed Phase - high Performance liquid chromatography
UV Ultra-violet
FT-IR Fourier transform infrared
IAEC Institutional animal ethics committee
ICH International council for harmonization
IUPAC International union of pure and applied chemistry
IV Intra-venous
LLOQ Lower Limit of quantification
LOD Limit of detection
LOQ Limit of quantification
QC Quality control
LQC Low quality control
MQC Medium quality control
HQC High quality control
% CV Percentage coefficient of variance
FT Freeze thaw
ISTD Internal standard
ANOVA Analysis of variance
RT Room temperature
%RSD Percentage relative standard deviation
SD Standard deviation
NMT Not more than
PBS Phosphate-buffered Saline
PDI Poly dispersity index
HET-CAM Hen‘s egg chorioallantoic membrane
B.I. Blinking index
xxvi
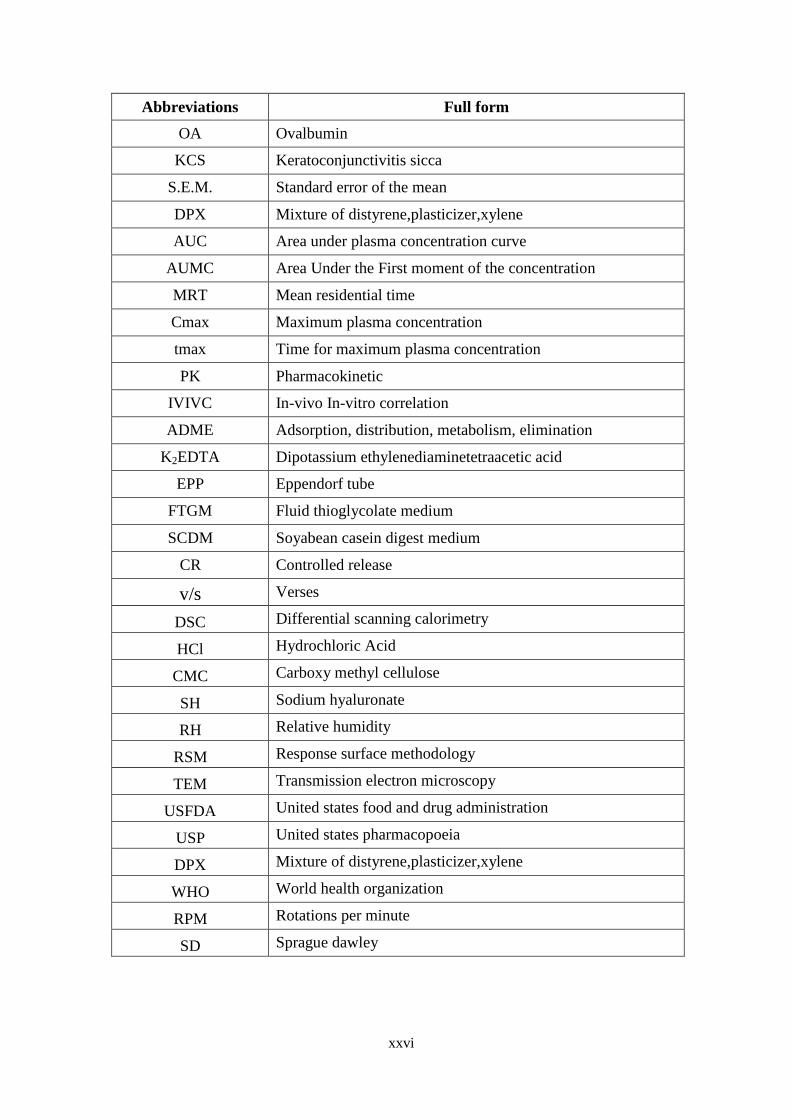
Abbreviations Full form
OA Ovalbumin
KCS Keratoconjunctivitis sicca
S.E.M. Standard error of the mean
DPX Mixture of distyrene,plasticizer,xylene
AUC Area under plasma concentration curve
AUMC Area Under the First moment of the concentration
MRT Mean residential time
Cmax Maximum plasma concentration
tmax Time for maximum plasma concentration
PK Pharmacokinetic
IVIVC In-vivo In-vitro correlation
ADME Adsorption, distribution, metabolism, elimination
K2EDTA Dipotassium ethylenediaminetetraacetic acid
EPP Eppendorf tube
FTGM Fluid thioglycolate medium
SCDM Soyabean casein digest medium
CR Controlled release
v/s Verses
DSC Differential scanning calorimetry
HCl Hydrochloric Acid
CMC Carboxy methyl cellulose
SH Sodium hyaluronate
RH Relative humidity
RSM Response surface methodology
TEM Transmission electron microscopy
USFDA United states food and drug administration
USP United states pharmacopoeia
DPX Mixture of distyrene,plasticizer,xylene
WHO World health organization
RPM Rotations per minute
SD Sprague dawley

xxvii
List of Symbols
Symbol Meaning
hr. Hour
s-1 Per second
min Minute
µg Microgram
gm Gram
mg Milligram
ng Nanogram
cm Centimeter
nm Nanometer
± Positive or Negative
λmax Maximum wavelength
°C Degree Celsius
°F Degree Fahrenheit
K Kelvin
mV Millivolts
R2 Linear correlation coefficient
T Time
% Percent
mM Milimole
Q Amount of drug released
K0 Zero order release constant
K1 First order release constant
Kh Higuchi square root of time release constant
Q∞ Total drug released after infinite time
n Diffusion exponents that characterizes the
mechanism of drug release
Qt Drug released at time t
kh Higuchi Square Root constant
kKP Korsmeyer-Peppas constant
KDa Kilo Dalton
v/w Volume/weight fraction
w/w Weight/weight fraction
gm/ml Gram /milliliter fraction
Pka Degree of ionization
Psi Pounds per square inch

xxviii
Symbol Meaning
Conc. Concentration
pH Potential hydrogen
pKa Acid dissociation constant
Smix Mixture/Blend of surfactant &co-surfactant
ppm Parts per million
γ Shear strain
𝜏 Shear stress
M Torque
Pa Pascal
cP Centipoise
xxix
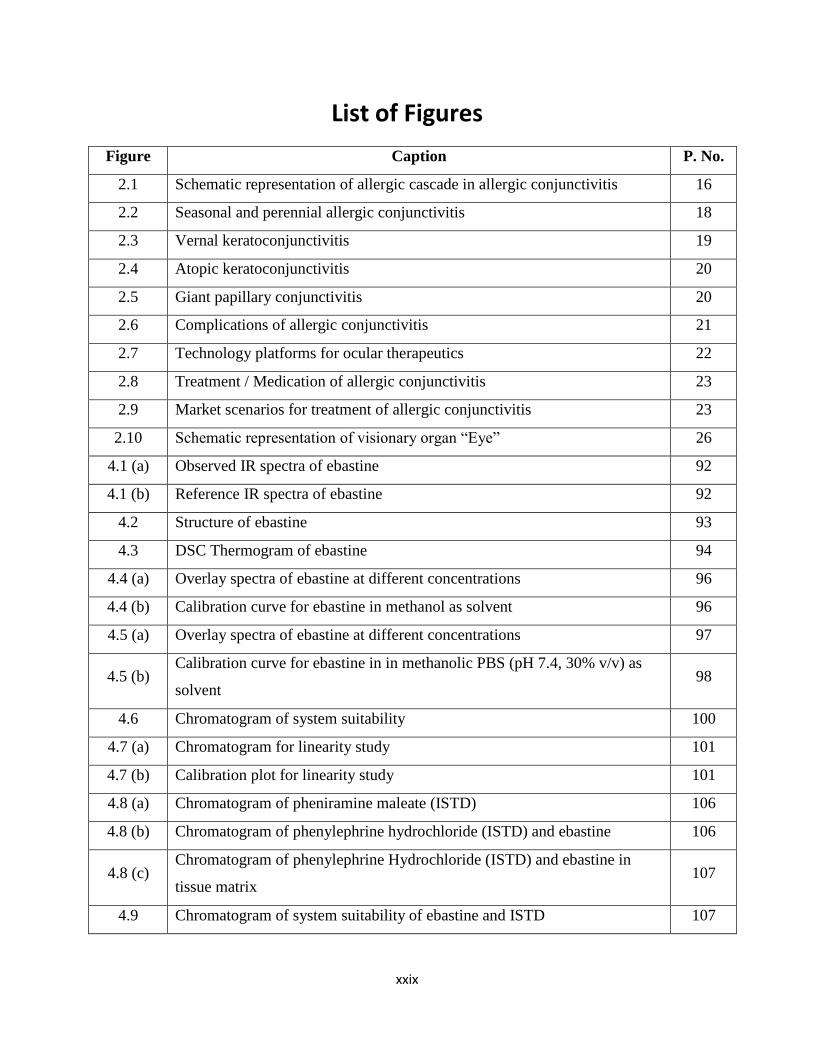
List of Figures
Figure Caption P. No.
2.1 Schematic representation of allergic cascade in allergic conjunctivitis 16
2.2 Seasonal and perennial allergic conjunctivitis 18
2.3 Vernal keratoconjunctivitis 19
2.4 Atopic keratoconjunctivitis 20
2.5 Giant papillary conjunctivitis 20
2.6 Complications of allergic conjunctivitis 21
2.7 Technology platforms for ocular therapeutics 22
2.8 Treatment / Medication of allergic conjunctivitis 23
2.9 Market scenarios for treatment of allergic conjunctivitis 23
2.10 Schematic representation of visionary organ ―Eye‖ 26
4.1 (a) Observed IR spectra of ebastine 92
4.1 (b) Reference IR spectra of ebastine 92
4.2 Structure of ebastine 93
4.3 DSC Thermogram of ebastine 94
4.4 (a) Overlay spectra of ebastine at different concentrations 96
4.4 (b) Calibration curve for ebastine in methanol as solvent 96
4.5 (a) Overlay spectra of ebastine at different concentrations 97
4.5 (b) Calibration curve for ebastine in in methanolic PBS (pH 7.4, 30% v/v) as
solvent 98
4.6 Chromatogram of system suitability 100
4.7 (a) Chromatogram for linearity study 101
4.7 (b) Calibration plot for linearity study 101
4.8 (a) Chromatogram of pheniramine maleate (ISTD) 106
4.8 (b) Chromatogram of phenylephrine hydrochloride (ISTD) and ebastine 106
4.8 (c) Chromatogram of phenylephrine Hydrochloride (ISTD) and ebastine in
tissue matrix 107
4.9 Chromatogram of system suitability of ebastine and ISTD 107

xxx
4.10 (a) Chromatogram for linearity study of drug with ISTD 109
4.10 (b) Calibration plot for linearity study of drug with ISTD 110
4.11 Chromatogram of drug with ISTD in ocular tissue 111
4.12 Chromatogram of system suitability of drug with ISTD in ocular tissue 112
4.13 (a) Overlay chromatogram for linearity study of drug with ISTD in ocular
tissue 114
4.13 (b) Calibration plot for linearity study of drug with ISTD in ocular tissue 115
4.14 Chromatogram of drug with ISTD in plasma 122
4.15 Chromatogram of system suitability of drug with ISTD in plasma 122
4.16(a) Overlay chromatogram for linearity study of drug with ISTD in plasma 124
4.16(b) Calibration plot for linearity study of drug with ISTD in plasma 125
4.17 Solubility of ebastine in different oils 126
4.18 Solubility of ebastine in different surfactants 128
4.19 Solubility of ebastine in different co-surfactants 129
4.20 IR spectra for drug excipient compatibility 130
4.21 DSC Thermogram of physical mixture (drug + polymers) 131
4.22 (a) Pseudo Ternary Diagram of Oil: Smix individual system (1:1), (2:1), (3:1) 135
4.22 (b) Pseudo Ternary Diagram of Oil: Smix Blend system 2(1:1):1, 2(1:1):
1(1:1). 135
4.23 (a) Response variable globule size (Y1) 140
4.23 (b) Response variable viscosity (Y2) 142
4.23 (c) Response variable % transmittance (Y3) 144
4.24 Overlay plot 145
4.25 IR Spectra for drug excipient compatibility 148
4.26 Globule size measurement of optimized formulation 149
4.27 Zeta potential measurement of optimized formulation 150
4.28 Transmission Electron Microscopy (TEM) of optimized formulation 152
4.29 (a) Rheogram of microemulsion based gel 154
4.29 (b) Rheogram of microemulsion based gel diluted with tear fluid 155
4.30 In vitro release profiles of microemulsion and microemulsion based gel 157

xxxi
4.31 (a) Models for drug release kinetics, Zero order release kinetics (Microemulsion) 159
4.31 (b) Models for drug release kinetics, First order release kinetics
(Microemulsion) 159
4.31 (c) Models for drug release kinetics, Higuchi Model of release kinetics
(Microemulsion) 159
4.31 (d) Models for drug release kinetics, Korsemeyer - Pepppa‘s Model of release
kinetics (Microemulsion) 159
4.32 (a) Models for drug release kinetics, Zero order release kinetics
(Microemulsion based gel) 160
4.32 (b) Models for drug release kinetics, First order release kinetics
(Microemulsion based gel)x`x 160
4.32 (c) Models for drug release kinetics, Higuchi Model of release kinetics
(Microemulsion based gel) 160
4.32 (d) Models for drug release kinetics, Korsemeyer - Pepppa‘s Model of release
kinetics (Microemulsion based gel) 160
4.33 Sterility testing of optimized microemulsion formulation using soybean-
casein digest medium and fluid thioglycolate medium 162
4.34 Ocular irritation study by Chorioallantoic Membrane Test 164
4.35 Acute ocular irritation study 165
4.36(a) Effect of optimized formulation on ovalbumin-induced conjunctivitis in
guinea pigs, Time point: 0.5 hr. 167
4.36(b) Effect of optimized formulation on ovalbumin-induced conjunctivitis in
guinea pigs, Time point: 24 hr. 167
4.37 Edema response 168
4.38 Scratching response 169
4.39 Histopathological photomicrographs of the conjunctival tissues in
ovalbumin induced allergic conjunctivitis 170
4.40 Fitting the experimental data to Pharmacokinetic Model (PK Solver 2.0) 171
xxxii
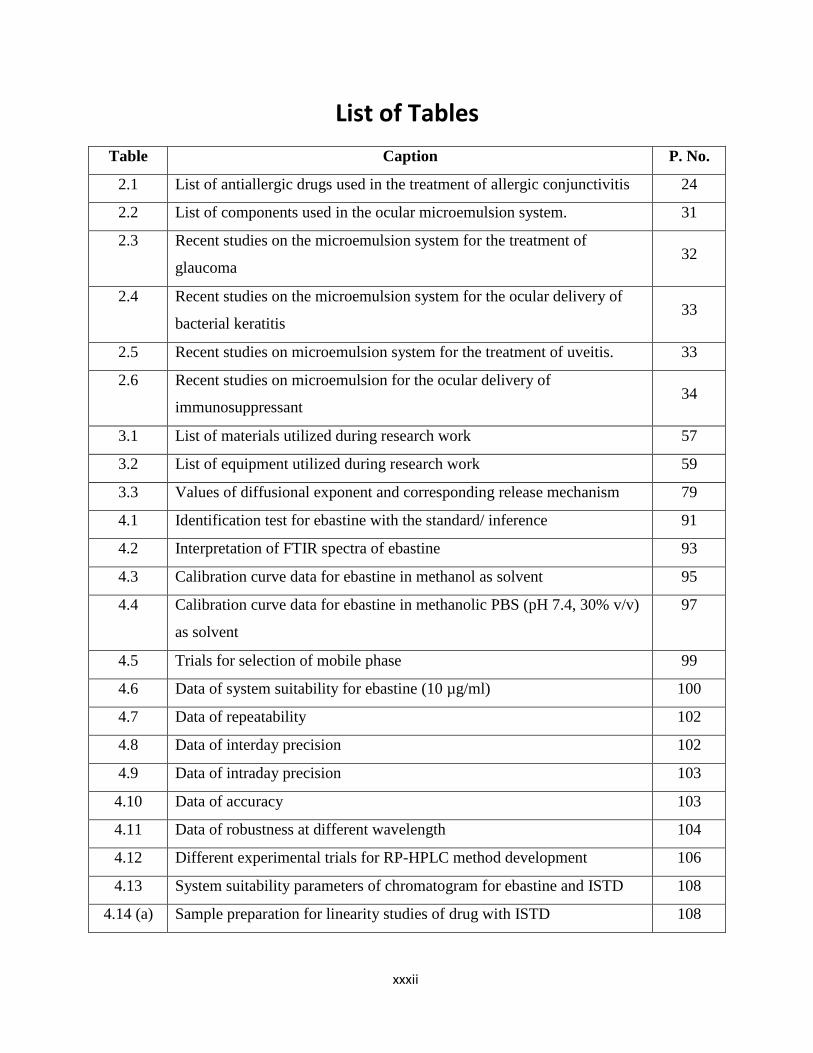
List of Tables
Table Caption P. No.
2.1 List of antiallergic drugs used in the treatment of allergic conjunctivitis 24
2.2 List of components used in the ocular microemulsion system. 31
2.3 Recent studies on the microemulsion system for the treatment of
glaucoma 32
2.4 Recent studies on the microemulsion system for the ocular delivery of
bacterial keratitis 33
2.5 Recent studies on microemulsion system for the treatment of uveitis. 33
2.6 Recent studies on microemulsion for the ocular delivery of
immunosuppressant 34
3.1 List of materials utilized during research work 57
3.2 List of equipment utilized during research work 59
3.3 Values of diffusional exponent and corresponding release mechanism 79
4.1 Identification test for ebastine with the standard/ inference 91
4.2 Interpretation of FTIR spectra of ebastine 93
4.3 Calibration curve data for ebastine in methanol as solvent 95
4.4 Calibration curve data for ebastine in methanolic PBS (pH 7.4, 30% v/v)
as solvent
97
4.5 Trials for selection of mobile phase 99
4.6 Data of system suitability for ebastine (10 µg/ml) 100
4.7 Data of repeatability 102
4.8 Data of interday precision 102
4.9 Data of intraday precision 103
4.10 Data of accuracy 103
4.11 Data of robustness at different wavelength 104
4.12 Different experimental trials for RP-HPLC method development 106
4.13 System suitability parameters of chromatogram for ebastine and ISTD 108
4.14 (a) Sample preparation for linearity studies of drug with ISTD 108

xxxiii
4.14 (b) Concentration, area and area ratio for linearity study of drug with ISTD 109
4.15 Data obtained for extraction trials in ocular tissue 111
4.16 System suitability parameters of drug with ISTD in ocular tissue 112
4.17 Sensitivity data for LLOQ samples 113
4.18 Concentration, area and area ratio for linearity study of drug with ISTD
in ocular tissue
124
4.19 Data of accuracy for ebastine 115
4.20 Data of precision for ebastine 116
4.21 (a) Data of recovery at LQC 117
4.21 (b) Data of recovery at MQC 117
4.21 (c) Data of recovery at HQC 118
4.22 (a) Data of short term stability 119
4.22 (b) Data of freeze thaw stability 119
4.22 (c) Data of long term stability 120
4.22 (d) Data of stock solution stability at room temperature after 6 hours 120
4.22 (e) Data of stock solution stability at refrigerated condition (2-8˚C) for 7
days
121
4.23 Data of system suitability parameters of ebastine with ISTD in plasma 123
4.24 Concentration, area and area ratio for linearity study of drug with ISTD
in plasma
124
4.25 Selection of oil based on solubility of drug in oil 126
4.26 Selection of surfactant based on solubility of drug in surfactant 127
4.27 Selection of co-surfactant based on solubility of drug in co-surfactant 129
4.28 (a) Trial compositions of preliminary pseudo ternary batches of Oil: Smix
Individual system
132
4.28 (b) Trial compositions of preliminary pseudo ternary batches of Oil: Smix
Blend system
134
4.29 Compositions of design matrix batches with responses 136
4.30 Coefficients of Cubic equation for each independent variable 137
4.31 Summary of regression analysis for all responses 138

xxxiv
4.32(a) Data of ANOVA table for globule size (Y1) 139
4.32(b) Data of ANOVA table for viscosity (Y2) 141
4.32(c) Data of ANOVA table for % transmittance (Y3) 143
4.33 Checkpoint analysis of optimized formulation 145
4.34 Different trial batches for selection of gelling/ mucoadhesive polymers 147
4.35 Different trials batches for microemulsion based gel 147
4.36 Regression coefficients for release kinetics 160
4.37 (a) Results of sterility testing in FTGM (Fungi) 161
4.37 (b) Results of sterility testing in SCDM (Bacteria) 161
4.38 Blinking index and clinical symptoms 165
4.39 Edema scoring (At 0.5 h and 24 h after Topical Antigen Challenge) 166
4.40 Single dose pharmacokinetic study parameters 172
4.41 (a) Stability study data for microemulsion formulation 174
4.41 (b) Stability study data for microemulsion based gel formulation 175

xxxv
List of Appendices
Appendix I: Approval Certificate from CPCSEA & IAEC Committee for Animal Study
Appendix II: Dose Calculation Method

Chapter 1 Introduction
119997290027 / Gujarat Technological University Page 1
CHAPTER 1
Introduction

Chapter 1 Introduction
119997290027 / Gujarat Technological University Page 2
Allergic diseases like atopic dermatitis, contact dermatitis, conjunctivitis, allergic rhinitis and
rhinoconjuctivitis are a major public health burden worldwide. As the prevalence of these dis-
eases is increasing, novel and improved therapies become prime need. Conjunctivitis is a
global disease encountered in clinical practice all over the world especially higher rate of in-
fection was found in developing countries. Recent studies suggest that up to 40% of the popu-
lation in developed countries experience symptoms of allergic conjunctivitis (AC) and endure
vision threatening ailments that offer a lower quality of life. They can range from ocular dis-
comfort to vision loss. The ophthalmic medical product market continues to grow at a strong
pace, from approximately $30 billion in 2016 to an estimated $42 billion by 2023 registering
compound annual growth rate of 5.3 from 2017 to 2023.1
Allergic conjunctivitis (AC), defined by ocular itching, hyperemia, lacrimation and edema. It
is caused by inappropriate response of the ocular surface to various environmental allergens.
As most of the inflammation affects the conjunctiva, the word "allergic conjunctivitis" is in-
terchangeably used with ocular allergies. The different types of ocular allergies include pre-
dominantly ocular itch-inducing seasonal allergic conjunctivitis (SAC) and perennial allergic
conjunctivitis (PAC) to more severe sight-threatening vernal keratoconjunctivitis (VKC) and
atopic keratoconjunctivitis (AKC).2-4
The pathophysiology of allergic cascade include early
phase symptoms and late phase responses.5 Current therapy available in market becoming the
drug of choice for treating only immediate early phase symptomatic relief for patients with
allergic conjunctivitis. On this background, necessity emerges for selection of drug acting on
early as well as late phase of allergy cascade as well as designing formulation strategies with
desired ocular attributes.
Colloidal drug delivery systems have been widely studied and explored in the field of ocular
drug delivery.6 These dosage forms include liposomes
7-9, nanoparticles
10-13, microemulsions
14-
19 and niosomes
20-21 etc. Oral delivery was considered as a possible noninvasive and patient
preferred route to treat chronic ocular diseases as compared to injectable route. However, re-
stricted accessibility to the targeted ocular tissues limits the utility of oral administration
which demands high dosage to give significant therapeutic efficacy. This can result in system-
ic side effects. Hence, parameters like safety and toxicity need to be considered when expected
to obtain a therapeutic response at the eye site upon oral administration.22
On another side,
topical eye drops, being conventional drug delivery systems are bounded with their own tradi-
Chapter 1 Introduction
119997290027 / Gujarat Technological University Page 3
tional shortfalls. This shortcoming has led to the evolution of potential use of microemulsions
as an ocular drug delivery carrier as it offers several favorable pharmaceutical and biopharma-
ceutical attributes such as excellent thermodynamic stability, phase transition into liquid-
crystal state, less surface tension, and small droplet size, which may result in improved ocular
drug retention, extended/sustained duration of action and high ocular absorption.23
This research project was undertaken to design ocular microemulsion as colloidal drug deliv-
ery system for increasing solubility of model drug, ebastine and formulating into microemul-
sion based gel for increasing its residential time at the site of action in order to achieve the
therapeutic level of drug for prolong time.
1.1 Definition of Problem
From the literature review on the subject related to ocular delivery and their available thera-
pies, the challenges associated with the current therapies were identified, and from the review
emerged the research problem to be addressed.
A major problem in ocular therapeutics is the attainment of an optimal drug concentration at
the site of action. Poor bioavailability of drugs from ocular dosage forms is mainly due to the
precorneal loss factors which include tear dynamics, non-productive absorption, transient resi-
dence time in the cul-de-sac and relative impermeability of the corneal epithelial membrane. 24
Additionally, most drugs with ocular therapeutic potential have the problem of poor solubility
and hence less bioavailability. To overcome it, various technological strategies are reported in
the literature including micronization, nanosuspension, polymeric micelles and cyclodextrin
based formulation.25
Among various approaches, microemulsions are promising alternative to enhance the ocular
bioavailability of drugs by improved ocular retention, increased corneal/conjunctival drug ab-
sorption and reduced systemic side effects and maintain the simplicity and convenience of the
dosage form as eye drops. Microemulsions are thermodynamically stable, surfactant-
cosurfactant based system, form at low interfacial tension. They are good alternative for oph-
thalmic delivery as it offers the pseudo plastic rheology with increased viscosity after applica-
tion and increased ocular retention and possibility of releasing drug in sustained and controlled
way, increased shelf life, lastly reducing dose and dosing frequency. Microemulsions are also

Chapter 1 Introduction
119997290027 / Gujarat Technological University Page 4
used to formulate poorly water-soluble drugs since their structure allows solubilization of lip-
ophilic drugs in the oil phase.26-27
Ebastine is a BCS Class II drug. Ebastine is available as an oral antihistamine formula, such as
tablets and syrup, for allergic disorders. But there is no topical formulation. Oral ebastine
causes unfavorable effects on heart like QT prolongation, severe gastric distress, decreased
tear production, resulting in dryness of the ocular surface, which exacerbates ocular discom-
fort and increasing susceptibility of eye to irritation.28,
29
Topical antihistamines are preferred
over oral agents since their direct application at the site of action results in rapid onset and su-
perior efficacy with less systemic side effects. To avoid systemic side effects and ocular dis-
comfort, topical ocular therapy could prove to be superior to systemic therapy in treating ocu-
lar allergies30
. Hence, topical formulation was developed to achieve onsite exposure of ebas-
tine for ocular allergies. Moreover, conjunctiva is more accessible to hydrophilic molecules
than lipophilic molecules. This creates challenge for a lipophilic molecule such as ebastine for
topical ocular development. Successful dissolution of ebastine in o/w microemulsion allows its
use in more convenient soluble form.
Hence, the objective of the present investigation was to design and develop microemulsion
based gel of antiallergic drug ebastine with view to increase the topical bioavailability, im-
prove residence time at eye site and provide sustained delivery of drug for longer period of
time. This formulation offered as a promising strategy for topical drug delivery rather than
systemic drug delivery for ocular allergic manifestation.
1.2 Aim of Research Work
The aim of present work was to design and evaluate the potential of colloidal dispersion sys-
tem ―Microemulsion‖ for ebastine, to treat disorders of the anterior segment of eye via topical
route with following goals,
To prohibit the complications and unfavorable effects of systemic route of drug admin-
istration
To increase bioavailability by topical exposure
Ease of drug application and increased patient compliance

Chapter 1 Introduction
119997290027 / Gujarat Technological University Page 5
1.3 Objective and Scope of Research Work
This research work was undertaken to design microemulsion based gel of antiallergic drug for
ocular application. The overall objectives of the underlying research work are,
To select the right material, process and optimization design for preparation of Micro-
emulsion
To optimize the formulation of microemulsion with low level of surfactants and the char-
acterization of microemulsion, the characterized parameters need to be eye fitting
To get prolonged drug release, reducing the need for repeated instillation
To target toward affected tissues, reducing possible side effects and required dose
To increase bioavailability of the drug
To prove ocular tolerability and efficacy of said formulation
To estimate the drug concentration in ocular tissue matrix post-instillation of formulation
1.4 Scope of Research Work
In recent years, a dramatically occurrence of ocular diseases reaches to height. Hence, allergic
conjunctivitis demands an urgent need of a novel ocular drug delivery system, which can be
effective and capable of providing sustained therapeutic effect and better patient compliance.
After clinical trials and fulfillment of other regulatory requirements, the developed formula-
tion may prove to be a boon to the society at large for the complete treatment of the allergic
conjunctivitis.
1.5 Rationale of Research Work
1.5.1 Rational for selection of ocular route of drug delivery
Challenges associated with the systemic/oral route31,
32
1. Low and variable oral Bioavailability
The antiallergic drugs including ebastine are reported to have low oral bioavailability be-
cause of the following mentioned reasons
Blood/retinal barrier (BRB)
Blood/aqueous humor barrier (BAB)

Chapter 1 Introduction
119997290027 / Gujarat Technological University Page 6
Extensive first pass metabolism
Low solubility
High protein binding
Powerful metabolizing enzymes
Variable bioavailability depending on their site of absorption
2. Lack of site specificity
3. Probability of systemic toxicity
4. Requirement of High dose
5. Long term therapy
6. Unfavorable side effect of ebastine like QT prolongation, severe gastric dis-
tress, dryness of eye etc.
To avoid systemic side effects and ocular discomfort, topical ocular therapy could prove to be
superior to systemic therapy in treating ocular allergies
Benefits associated with the topical/ocular route33
The topical application of drug for treatment of ocular diseases are reported to have following
benefits
1) High patient compliance
Self-administrable
Noninvasive
2) Onsite exposure
3) Dose reduction
4) Avoidance systemic toxicity
1.5.2 Rationale for Selection of Microemulsion Drug Delivery System
34,35
Microemulsions are thermodynamically stable, surfactant-cosurfactant based system,
form at low interfacial tension and exhibit high solubilizing potential for hydrophobic
drugs. Successful dissolution of ebastine in microemulsion allows its use in more
convenient soluble form.
Microemulsion are promising alternative to enhance the ocular bioavailability of drugs
by improved ocular retention, increased corneal drug absorption and reduced systemic
side effects and maintain the simplicity and convenience of the dosage form as eye
drops.

Chapter 1 Introduction
119997290027 / Gujarat Technological University Page 7
Microemulsion show possibility of releasing drug in sustained and controlled way, in-
creased shelf life, lastly reducing dose and dosing frequency.
Microemulsion is good alternative for ophthalmic delivery as it offers the pseudo plas-
tic rheology with increased viscosity after application and increased ocular retention.
The retention period of microemulsion formulation further increased by incorporation
of gelling agent to microemulsion based gel.
1.5.3 Rational for Selection of Drug
Ebastine is the drug which is most benefited if prepared in the form of topical dosage form
because of its variable and less oral bioavailability due to its site specific absorption limitation
and solubility problem. Moreover, ebastine has a high therapeutic index, potency, effective-
ness and differ radically from other existing antihistaminic compounds to give H1 receptor
antagonist action which manages symptoms of early phase of allergy. But, for eradication of
late phase, severe symptoms of allergy, very high drug concentrations are needed and it is un-
likely that this concentration is achieved with oral therapeutic doses. Thus, topical formulation
of said drug could prove to be clinically advantageous.
1.6 Proposed Plan of Work
Ebastine loaded microemulsion and microemulsion based gel were prepared with following
plan of work,
1. Extensive literature survey, selection of drug and excipients, procurement of drug and
excipients.
2. Preformulation study of drug.
3. Formulation development of ebastine loaded microemulsion, screening of microemul-
sion components, development of pseudo ternary phase diagrams using single Smix
system and blend Smix system.
4. Optimization of ebastine loaded microemulsion by applying Design Expert.
5. Characterization of the optimized formulation for globule size, zeta potential, Polydis-
persity index, pH, viscosity, drug content, transmittance, refractive index, osmolarity,
surface tension, electron microscopic studies, in- vitro release study.

Chapter 1 Introduction
119997290027 / Gujarat Technological University Page 8
6. Formulation development of ebastine loaded microemulsion based Gel.
7. Characterization of microemulsion based gel for appearance, pH, viscosity, drug con-
tent, mucoadhesive strength, spreadability, in- vitro release study.
8. Determination of the in vitro drug release profile of drug loaded microemulsion and
microemulsion based gel.
9. Study of stability profile of drug loaded microemulsion and microemulsion based gel.
10. To perform blinking index and acute irritation study in order to evaluate the in vivo oc-
ular tolerability of formulation.
11. To perform chorioallantoin membrane study in order to evaluate the in vitro ocular irri-
tation potential of formulation.
12. To determine the in vivo performance of formulation by efficacy study using allergic
conjunctivitis animal model.
13. To develop and validate bioanalytical method for determination of drug concentration
in ocular tissue matrix, plasma and measurement of pharmacokinetic parameters.
1.7 Original Contribution by the Thesis
The exclusive work in this research dissertation is authentic. Extensive literature survey was
done to pinpoint the challenges and/or difficulty associated with the complete cure of allergic
conjunctivitis and approaches which overcome them. Although many researchers have been
working on development of microemulsion for various drugs, the idea of the development of
microemulsion of anti-allergic drug by systematic approach of design of experiment for opti-
mization of various parameters which fitted to ocular administration. To head off multiple oral
route-related drawbacks, for treating disease of anterior chamber of eye, has not been investi-
gated till date.
1.8 Outline of Thesis
The overall account on the present research work has been divided into five basic chapters of
the thesis. The introduction, being first chapter includes background, problem definition, aim,
objectives, rationale behind selection of problem, proposed plan of work and origi-
nal/significant contribution by the present research work. The Literature survey, being second
chapter brief about ocular drug delivery, its benefits and challenges, description about disease,

Chapter 1 Introduction
119997290027 / Gujarat Technological University Page 9
pathophysiology of disease, types of disease, available therapy for treatment, associated chal-
lenges and approaches to overcome them, details of selected dosage form, literature/profile of
model drug and excipients screened for final formulation. The materials and methods, being
third chapter extrapolates as name suggests various materials procured with their resources,
details of equipments used in research work. Beside this, it also includes methodology used in
preformulation studies, analytical and bioanalytical tool, formulation designing with their
evaluation, experimental protocols for in vivo and pharmacokinetic studies. While the results
and discussion, being fourth chapter includes results/ output of experiments performed in pre-
vious chapter and extrapolates inference/significance from them. Lastly fifth chapter conclud-
ed the thesis with summary and discussion.
1.9 References
1. Bielory, L., Katelaris, C.H., Lightman, S. and Naclerio, R.M., 2007. Treating the ocular
component of allergic rhinoconjunctivitis and related eye disorders. Medscape General
Medicine, 9(3), p.35.
2. La Rosa M, Lionetti E, Reibaldi M, Russo A, Longo A, Leonardi S, Tomarchio S, Avita-
bile T, Reibaldi A, 2013, Allergic conjunctivitis: a comprehensive review of the literature.
Italian journal of pediatrics, 1;39(1):18
3. Chowdhury, B., 2013. Allergic conjunctivitis–A review. Dehli Ophthalmogical Society
Times, 19, pp.41-47.
4. Bielory, L., 2000. Allergic and immunologic disorders of the eye. Part II: ocular allergy.
Journal of Allergy and Clinical Immunology, 106(6), pp.1019-1032.
5. Ono, S.J. and Abelson, M.B., 2005. Allergic conjunctivitis: update on pathophysiology and
prospects for future treatment. Journal of Allergy and Clinical Immunology, 115(1),
pp.118-122.
6. Ameeduzzafar, Ali, J., Fazil, M., Qumbar, M., Khan, N. and Ali, A., 2016. Colloidal drug

Chapter 1 Introduction
119997290027 / Gujarat Technological University Page 10
delivery system: amplify the ocular delivery. Drug delivery, 23(3), pp.700-716.
7. Fujisawa, T., Miyai, H., Hironaka, K., Tsukamoto, T., Tahara, K., Tozuka, Y., Ito, M. and
Takeuchi, H., 2012. Liposomal diclofenac eye drop formulations targeting the retina: for-
mulation stability improvement using surface modification of liposomes. International jour-
nal of pharmaceutics, 436(1-2), pp.564-567.
8. Dai, Y., Zhou, R., Liu, L., Lu, Y., Qi, J. and Wu, W., 2013. Liposomes containing bile salts
as novel ocular delivery systems for tacrolimus (FK506): in vitro characterization and im-
proved corneal permeation. International journal of nanomedicine, 8, p.1921.
9. Kaiser, J.M., Imai, H., Haakenson, J.K., Brucklacher, R.M., Fox, T.E., Shanmugavelandy,
S.S., Unrath, K.A., Pedersen, M.M., Dai, P., Freeman, W.M. and Bronson, S.K., 2013.
Nanoliposomal minocycline for ocular drug delivery. Nanomedicine: Nanotechnology, Bi-
ology and Medicine, 9(1), pp.130-140.
10. Jain, K., Suresh Kumar, R., Sood, S. and Dhyanandhan, G., 2013. Betaxolol hydrochloride
loaded chitosan nanoparticles for ocular delivery and their anti-glaucoma efficacy. Current
drug delivery, 10(5), pp.493-499.
11. Wadhwa, S., Paliwal, R., Paliwal, S.R. and Vyas, S.P., 2009. Nanocarriers in ocular drug
delivery: an update review. Current Pharmaceutical Design, 15(23), pp.2724-2750.
12. Wadhwa, S., Paliwal, R., Paliwal, S.R. and Vyas, S.P., 2010. Hyaluronic acid modified chi-
tosan nanoparticles for effective management of glaucoma: development, characterization,
and evaluation. Journal of drug targeting, 18(4), pp.292-302.
13. Başaran, E., Yenilmez, E., Berkman, M.S., Büyükköroğlu, G. and Yazan, Y., 2014. Chi-
tosan nanoparticles for ocular delivery of cyclosporine A. Journal of microencapsulation,
31(1), pp.49-57.

Chapter 1 Introduction
119997290027 / Gujarat Technological University Page 11
14. Ma, S.W., Gan, Y., Gan, L., Zhu, C.L. and Zhu, J.B., 2008. Preparation and in vitro corneal
retention behavior of novel cationic microemulsion/in situ gel system. Yao xue xue bao=
Acta pharmaceutica Sinica, 43(7), pp.749-755.
15. Kesavan, K., Kant, S., Singh, P.N. and Pandit, J.K., 2013. Mucoadhesive chitosan-coated
cationic microemulsion of dexamethasone for ocular delivery: in vitro and in vivo evalua-
tion. Current eye research, 38(3), pp.342-352.
16. Fialho, S.L. and Da Silva‐Cunha, A., 2004. New vehicle based on a microemulsion for top-
ical ocular administration of dexamethasone. Clinical & experimental ophthalmology,
32(6), pp.626-632.
17. Üstündag-Okur, N., Gökçe, E.H., Eğrilmez, S., Özer, Ö. and Ertan, G., 2014. Novel ofloxa-
cin-loaded microemulsion formulations for ocular delivery. Journal of Ocular Pharmacolo-
gy and Therapeutics, 30(4), pp.319-332
18. Ince, I., Karasulu, E., Ates, H., Yavasoglu, A. and Kirilmaz, L., 2015. A novel pilocarpine
microemulsion as an ocular delivery system: in vitro and in vivo studies. J. Clin. Exp. Oph-
thalmol, 6, p.408.
19. Kalam, M.A., Alshamsan, A., Aljuffali, I.A., Mishra, A.K. and Sultana, Y., 2016. Delivery
of gatifloxacin using microemulsion as vehicle: formulation, evaluation, transcorneal per-
meation and aqueous humor drug determination. Drug delivery, 23(3), pp.886-897.
20. Aggarwal, D., Pal, D., Mitra, A.K. and Kaur, I.P., 2007. Study of the extent of ocular ab-
sorption of acetazolamide from a developed niosomal formulation, by microdialysis sam-
pling of aqueous humor. International journal of pharmaceutics, 338(1-2), pp.21-26.
21. Kaur, I.P., Aggarwal, D., Singh, H. and Kakkar, S., 2010. Improved ocular absorption ki-
netics of timolol maleate loaded into a bioadhesive niosomal delivery system. Graefe's Ar-
chive for Clinical and Experimental Ophthalmology, 248(10), pp.1467-1472.
Chapter 1 Introduction
119997290027 / Gujarat Technological University Page 12
22. Abelson, M.B., Chapin, M.J., Gomes, P., Minno, G. and Nice, J., Aciex Therapeutics Inc,
2013. Ophthalmic formulations of cetirizine and methods of use. U.S. Patent 8,569,273.
23. Hegde, R.R., Verma, A. and Ghosh, A., 2013. Microemulsion: new insights into the ocular
drug delivery. ISRN pharmaceutics, 2013.
24. Kawakami, K., Yoshikawa, T., Hayashi, T., Nishihara, Y. and Masuda, K., 2002. Micro-
emulsion formulation for enhanced absorption of poorly soluble drugs: II. In vivo study.
Journal of controlled Release, 81(1-2), pp.75-82.
25. Gautam, N. and Kesavan, K., 2017. Development of microemulsions for ocular delivery.
Therapeutic delivery, 8(5), pp.313-330.
26. Gaudana, R., Ananthula, H.K., Parenky, A. and Mitra, A.K., 2010. Ocular drug delivery.
The AAPS journal, 12(3), pp.348-360.
27. Mohan, K., Pravin, S. and Atul, B., 2012. Ophthalmic microemulsion: a comprehensive
review. Int J Pharm Bio Sci, 3(3), pp.1-13.
28. Rico, S., Antonijoan, R.M. and Barbanoj, M.J., 2009. Ebastine in the light of CONGA rec-
ommendations for the development of third-generation antihistamines. Journal of asthma
and allergy, 2, pp.73
29. Mashige KP., 2017. Ocular allergy. Health sa gesondheid.; 22(1), pp 112-122.
30. Chang, C.M., Farnes, E.Q., Olejnik, O. and Chang, J.N., Allergan Inc, 2003. Ophthalmic
compositions containing loratadine. U.S. Patent 6,635,654.
31. Yavuz, B. and Kompella, U.B., 2016. Ocular drug delivery. In Pharmacologic Therapy of
Ocular Diseases , pp. 57-93. Springer, Cham.

Chapter 1 Introduction
119997290027 / Gujarat Technological University Page 13
32. Chemuturi, N. and Yanez, J.A., 2013. The role of xenobiotic transporters in ophthalmic
drug delivery. Journal of Pharmacy & Pharmaceutical Sciences, 16(5), pp.683-707.
33. Saettone, M.F., 2002. Progress and problems in ophthalmic drug delivery. Business Brief-
ing: Pharmatech, 1, pp.167-71.
34. Chandrakar, S., Roy, A., Choudhury, A., Saha, S., Bahadur, S. and Prasad, P., 2014. Micro-
emulsion: A Versatile Tool for Ocular Drug Delivery. Asian Journal of Pharmacy and
Technology, 4(3), pp.147-150.
35. Vandamme, T.F., 2002. Microemulsions as ocular drug delivery systems: recent develop-
ments and future challenges. Progress in retinal and eye research, 21(1), pp.15-34.

119997290027 / Gujarat Technological University Page 14
CHAPTER 2 Literature Review
CHAPTER 2
Literature Review

119997290027 / Gujarat Technological University Page 15
CHAPTER 2 Literature Review
2.1 Overview
Over the last decades, allergic disorders have increased dramatically. Out of different allergic
manifestation, ocular allergy is one of the most common eye disorders in clinical practice.1
with up to 40% of the general population reporting ocular symptoms consistent with allergic
conjunctivitis (AC). In the United States alone, approximately 74 million adults suffer from
AC. Drug delivery in ocular therapeutics is a challenging problem and is considered as an area
of interest to researchers working in the multi-disciplinary areas pertaining to the visionary
organ ―Eye‖, including chemical, biochemical, pharmaceutical, medical, clinical and toxico-
logical sciences. Recently, there has been increased attention focused on following objectives
in this era.2
(a) To tailor newer, effective and safe drug substances for different ocular diseases that are
poorly controlled for conventional formulation like eye drops.
(b) To improve existing ocular dosage forms.
(c) To exploits newer delivery systems for improving the ocular bioavailability of existing
molecules.
(d) To optimized the site specific ocular delivery for attaining site exposure result in dose re-
duction.
Conjunctivitis is inflammation (swelling) of the conjunctiva. The conjunctiva is the transpar-
ent membrane (thin layer of cells) that covers the white part of the eyeball and the inner sur-
faces of the eyelids.3-6
There are three different types of conjunctivitis, each with a different cause. The three types
are:
Irritant conjunctivitis
Infective conjunctivitis
Allergic conjunctivitis

119997290027 / Gujarat Technological University Page 16
CHAPTER 2 Literature Review
Irritant conjunctivitis
Irritant conjunctivitis occurs when an irritant, such as chlorine (a chemical that is often used to
purify water) or an eyelash, gets into the eyes and makes them sore. Rubbing the eyes can
make the condition worse. The conjunctivitis should settle once the irritant is removed. If the
eyes are very red and painful, medical attention should be sought immediately.7, 8
Infective conjunctivitis
Infective conjunctivitis is caused by a virus, bacteria or a sexually transmitted infection (STI),
such as chlamydia or gonorrhoea. The most common symptoms include reddening and water-
ing of the eyes and a sticky coating on the eyelashes. 7,
8
Allergic conjunctivitis
Allergic conjunctivitis occurs when the eyes come into contact with an allergen. An allergen is
a substance, such as pollen or animal fur, that makes the immune system (the body's defence
system) react abnormally. This causes irritation and inflammation, known as an allergic reac-
tion. Allergic conjunctivitis causes itchy, swollen eyes. 7,
8
FIGURE 2.1 Schematic representation of allergic cascade in Allergic conjunctivitis8

119997290027 / Gujarat Technological University Page 17
CHAPTER 2 Literature Review
2.2 Allergic Conjunctivitis
Ocular allergy also called allergic conjunctivitis represents a group of hypersensitivity disor-
ders where the eyes produce an abnormal immunological response to normally harmless anti-
gens (allergens) resulting in symptoms such as itching, tearing, burning, foreign-body sensa-
tion and ocular dryness.9 The last four decades have actually seen an exponential increase in
allergic diseases with about 15–20 % of the world‗s population suffering ocular allergies
alone. It is reported that up to 40 % of people of all age groups across the globe are affected by
allergic diseases in its various forms. The estimated cost burden in treating ocular allergy in
the United States alone is approximately 5.9 billion dollars.10
Allergic conjunctivitis affects up
to 40% of the general population. It is also called as ―pink eye." it is an inflammation of the
conjunctiva, the tissue that lines the inside of the eyelid and helps keep the eyelid and eyeball
moist.11
Symptoms usually consist of low-grade ocular and periocular itching (pruritus), red-
ness in the white of the eye or inner eyelid, tearing (epiphora), burning, stinging, photophobia,
watery discharge and swelling of the eyelid. Redness, itching and edema seem to be the most
consistent symptoms of allergic conjunctivitis.12,
13
The conjunctiva can be triggered by allergy
factors like airborne pollens, animal dander, and other environmental antigens.14
2.2.1 Types of Allergic Conjunctivitis
Allergic conjunctivitis involves seasonal allergic conjunctivitis (SAC), perennial allergic con-
junctivitis (PAC), vernal keratoconjunctivitis (VKC), atopic keratocongiunctivitis (AKC) and
giant papillary conjunctivitis (GPC).15-21
These are caused by different allergens and may have
slightly different symptoms.
Seasonal and perennial allergic conjunctivitis
Seasonal allergic conjunctivitis (SAC) and perennial allergic conjunctivitis (PAC) are the most
common forms of ocular allergies. These types of allergy are said to affect at least 15–20%
of the population. The presence of specific IgE antibodies to seasonal or perennial aller-
gen can be documented in almost all cases of SAC and PAC.
Seasonal and perennial allergic conjunctivitis are usually caused by
Pollen from grass, trees or flowers
Dust mites
119997290027 / Gujarat Technological University Page 18
CHAPTER 2 Literature Review
Flakes of dead animal skin
The pathogenesis of allergic conjunctivitis is predominantly an IgE-mediated hypersen-
sitivity reaction. It is caused by an allergen-induced inflammatory response in which al-
lergens interact with IgE bound to sensitized mast cells resulting in the clinical ocular al-
lergic expression. Activation of mast cells induces enhanced tear levels of histamine, tryp-
tase, prostaglandins and leukotrienes. This immediate or early response lasts clinically for 20–
30 min. Mast cell degranulation also induces activation of vascular endothelial cells, which in
turn expresses chemokine‗s and adhesion molecules such as intercellular adhesion molecule
(ICAM), vascular cell adhesion molecule (VCAM). Other chemokines secreted include chem-
okines, monocyte chemo attractant protein (MCP), interleukin (IL)- 8, eotaxin, macrophage
inflammatory protein (MIP)-1 alpha. These factors initiate the recruitment phase of inflamma-
tory cells in the conjunctival mucosa, which leads to the ocular late-phase reaction (Figure 2.2)
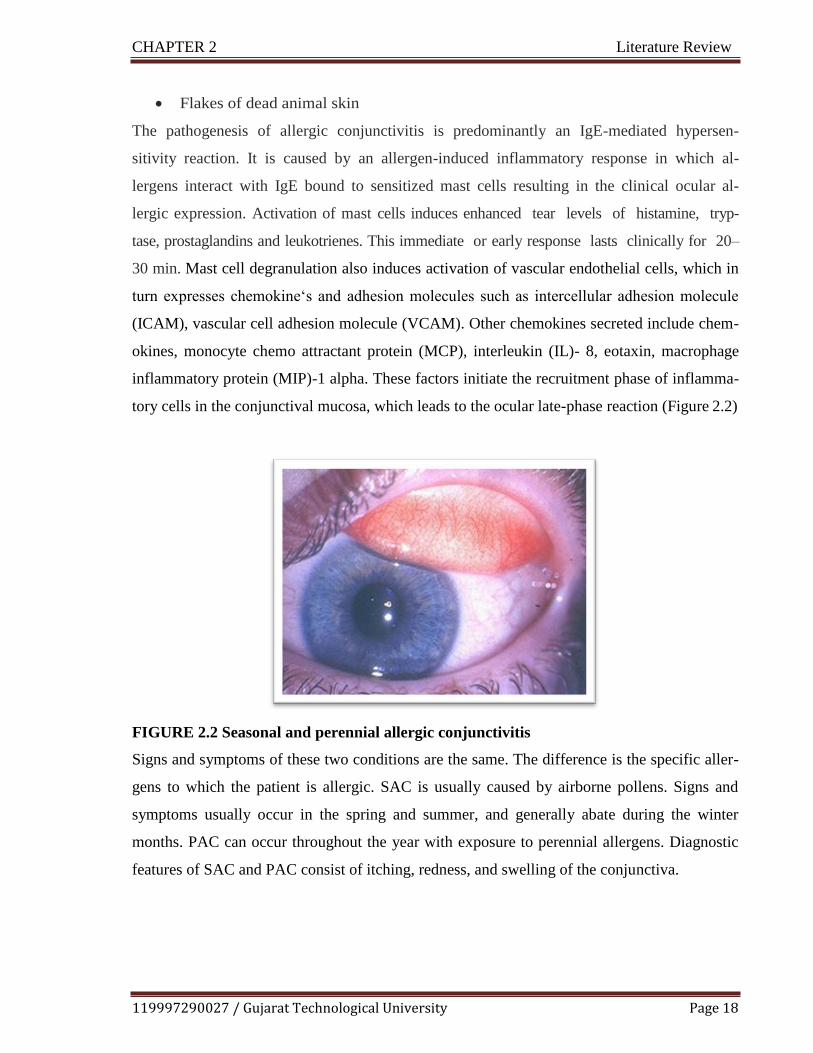
FIGURE 2.2 Seasonal and perennial allergic conjunctivitis
Signs and symptoms of these two conditions are the same. The difference is the specific aller-
gens to which the patient is allergic. SAC is usually caused by airborne pollens. Signs and
symptoms usually occur in the spring and summer, and generally abate during the winter
months. PAC can occur throughout the year with exposure to perennial allergens. Diagnostic
features of SAC and PAC consist of itching, redness, and swelling of the conjunctiva.

119997290027 / Gujarat Technological University Page 19
CHAPTER 2 Literature Review
Vernal keratoconjunctivitis
In this type of allergic conjunctivitis, a nonspecific hyper reactivity occurs that exhibit the
ocular symptoms induced by nonspecific stimuli such as wind, dust and sunlight as well as
their variability, which is not related to allergen levels in the environment.
VKC is a chronic allergic inflammation of the ocular surface mediated mainly by Th2-
lymphocyte. It also have a role in a complex pathogenesis by the over-expressing mast cells,
eosinophil‗s, neutrophils, Th2-derived cytokines, chemokines, adhesion molecules, growth
factors, fibroblast and lymphocytes.
Symptoms include ocular itching, redness, swelling and discharge. Itching may be quite severe
and even incapacitating, if untreated, result in photophobia. The most characteristic sign is gi-
ant papillae on the upper tarsal conjunctiva as shown in Fig. 2.3. The giant papillae is
‗cobblestone-like‗ swellings of several millimeters in diameter.
FIGURE 2.3 Vernal keratoconjunctivitis
Atopic keratoconjunctivitis
Atopic keratoconjunctivitis (AKC) is a bilateral chronic inflammatory disease of the ocular
surface and eyelid. Its pathogenesis mechanism involves both a chronic degranulation of the
mast cell mediated by IgE, and immune mechanisms mediated by Th1- and Th2-lymphocyte
derived cytokines, eosinophils and other inflammatory cells also play a role in its pathogene-
sis. It is considered as ocular counterpart of atopic dermatitis, or atopic eczema. Eczematous

119997290027 / Gujarat Technological University Page 20
CHAPTER 2 Literature Review
lesions can be found on the eyelids, they are itchy The eyelid skin may be chemotic with a
fine sandpaper-like texture as shown in Fig. 2.4.
FIGURE 2.4 Atopic keratoconjunctivitis
Giant papillary conjunctivitis
Giant papillary conjunctivitis is caused by
Contact lenses
Stitches (sutures) used in eye surgery
Prostheses (artificial) part of the eye that is fitted during eye surgery
GPC is not an allergic disease. Giant papillary conjunctivitis (GPC) is an inflammatory disease
characterized by papillary hypertrophy of the superior tarsal conjunctiva.
Tear samples of patients suffering from GPC do not show increase in IgE or histamine.
While, release of some mediators (CXCL8 and TNF-α) from injured conjunctival epithelial
cells due to mechanical trauma and chronic irritation observed in tear samples. (Fig. 2.5)
FIGURE 2.5 Giant papillary conjunctivitis

119997290027 / Gujarat Technological University Page 21
CHAPTER 2 Literature Review
2.2.2 Complications of Allergic Conjunctivitis22-24
Allergic conjunctivitis is a condition caused due to the allergy which can lead to lot of site
specific and nonspecific complications in long term. Eventually, allergic conjunctivitis may
be disabling or even sight-threatening. Some of the possible complications are discussed be-
low
Cluster headache: Allergic conjunctivitis dramatically increases the risk of migraine due to
cluster headache.
Keratitis: Cornea (the clear layer at the front of the eye) becomes inflamed (swollen), leading
to the formation of ulcers (open sores).
Iritis: A type of uveitis (inflammation of the middle layer of eye) that causes pain, headache.
Dry eye syndrome: Prolonged untreated allergic conjunctivitis may become cause of second-
ary anterior disease of eye called as dry eye syndrome also known as keratoconjunctivitis sicca
(KCS). It shows similar symptoms like irritation, redness, discharge, and easily fatigued eyes.
Conjunctivitis affect function of goblet cells, eye does not produce enough tears results in dry
eye syndrome.
Complete blindness: Untreated allergic conjunctivitis may lead to permanent blindness.

119997290027 / Gujarat Technological University Page 22
CHAPTER 2 Literature Review
Oral
Oral antiallergic thera-
peutics reduces symp-
toms of conjunctivitis,
but required therapeu-
tic drug concentration
can‗t be achieved at
site and leads to dry
eye syndrome.28
Injectables
• Injectable delivery
is not well tolerated
by patient.
• Systemic absorp-
tion.28
Topical
• The topical admin-
istration gives ad-
vantage of quicker
onset and better effi-
cacy.
• It also adds site spec-
ificity
• Offer patient com-
pliance.28
FIGURE 2.6 Complications of allergic conjunctivitis
2.2.3 Treatment of Allergic Conjunctivitis
Allergic conjunctivitis can be managed by self-help like avoiding long term use of contact
lenses, avoiding exposure to allergen triggering factors, prohibiting excessive rubbing the af-
fected area etc. However, if this does fail to work, the only way is to take antiallergic medica-
tion and in uncontrolled and/or severe case ocular surgery is required followed by immuno-
therapy.25-27
The various technology platforms available in market for treatment of allergic
conjunctivitis are given in Fig.2.7.
FIGURE 2.7 Technology platforms for ocular therapeutics
The mainstay of the management of ocular allergy involves the use of anti-allergic therapeutic
agents such as ocular decongestant, mast cell stabilizers, antihistamine and multiple action an-
ti-allergic agents known as Novel antihistamines.29,30
The novel antihistamines proved their
dual action, they provide mast cell stabilization to avoid release of allergy mediators as well as
exhibit inhibitory effect on released allergy mediators.31
The model drug selected in research
project ―Ebastine‖ categorized under novel antihistamines.

119997290027 / Gujarat Technological University Page 23
CHAPTER 2 Literature Review
FIGURE 2.8 Treatment / Medication of allergic conjunctivitis
As per the literature, of all treatment, antihistamines predominantly capture the market for
treatment of allergic conjunctivitis. 32
(Fig.2.9)
FIGURE 2.9 Market scenario for treatment of allergic conjunctivitis
OPHTHALMIC/ORAL ANTIHISTAMINE
OCULAR DECONGESANT TREATMENT
OPHTHALMIC MAST CELL
STABILIZERS
ANTI-INFLAMMATORY

119997290027 / Gujarat Technological University Page 24
CHAPTER 2 Literature Review
The list of antiallergic drugs used in the treatment of allergic conjunctivitis is given in Table
2.1
TABLE 2.1 List of antiallergic drugs used in the treatment of allergic conjunctivitis
Drug Dosage Availability
Ophthalmic Antihistamines
Alcaftadine
(lastacaft)
One drop once daily 0.25% solution (3mL)
Azelastine (optivar) One drop twice daily 0.05% solution (6 mL)
Bepotastine (bepreve) One drop twice daily 1.5% solution (10 mL)
Emedastine (emadine) One drop up to four times daily 0.05% solution (5 mL)
Epinastine (elestat) One drop twice daily 0.05% solution (5 mL)
Ketotifen One drop twice daily every eight
to 12 hours
0.025% solution (Zadi-
tor/OTC: 5 mL; Ala-
way/OTC: 10 mL
Olopatadine (patanol) One drop twice daily at an inter-
val of six to eight hours
0.1% solution (5 mL)
Olopatadine (pataday) One drop once daily 0.2% solution (2.5 mL)
Ophthalmic Mast Cell Stabilizers
Cromolyn (crolom) One to two drops four to six
times daily
4% solution (10 mL)
Lodoxamide (alomide) One to two drops four times dai-
ly for up to three months
0.1% solution (10 mL)
Nedocromil (alocril) One to two drops twice a day 2% solution (5 mL)
Pemirolast (alamast) One to two drops four times dai-
ly
0.1% solution (10 mL)
Orally administered 'classic' antihistamines
Astemizole 10mg tab Syrup 2 mg/ml 10 mg OD
Cetrizine 10mg tab, Syrup 0.5 mg/drop 10 mg OD
Ketotifen 1mg tab, Syrup 0.02% soln 1 mg bid
Lortadine 10mg tab, Syrup 0.1% 10 mg OD
Oxatomide 30mg tab, Syrup 2.5% 1 mg/kg BW
Terfenadine 60, 120mg tab, Syrup 0.6% soln 60 mg BID, 120 OD
Others
Ketorolac (acular) One drop four times a day
For cataracts: One drop four
times daily
0.5% solution (3, 5, 10 mL)
Loteprednol (alrex) One drop four times daily (shake
well)
0.2% suspension (5, 10 mL)
119997290027 / Gujarat Technological University Page 25
CHAPTER 2 Literature Review
Abbreviations used: tab = tablet; soln = solution; OD = once daily; BID = twice daily; BW = body weight
2.3 Microemulsion as Colloidal Drug Delivery for Ocular Therapy
2.3.1 Anatomy & Physiology of Eye as Barriers for Ocular Drug Delivery
As the eye is a very complex and sensitive organ, for development an effective ophthalmic
delivery system, thorough knowledge of the structure/anatomy and physiology of the eye is
crucial. The human eye is an approximately spherical, three-layered structure with a diameter
of 24 mm and a mass of about 7.5 g The anatomical section of the eyeball consist of two parts,
anterior segment consisting of two major salient structures, the cornea and the conjunctiva and
the posterior portion consists of the vitreous body, retina, choroid and back of the sclera.
Accordingly, there are two main purposes of ocular drug applications for treatment of ocular
diseases that emerges on the surface (conjunctivitis, keratitis, etc.) and treatment of ocular dis-
eases that emerges in deeper layers (glaucoma, uveitis, etc.).33
The whole spherical structure is divided into three chambers
Anterior chamber positioned between cornea and iris
Posterior chamber, situated between iris and lens
Vitreous chamber extending from lens back to retina
Cornea and conjunctiva are major epithelial barriers for the topically applied drug molecules.
The conjunctiva is a thin translucent layer situated superficially on the sclera. Tight junctions
are present in the conjunctival epithelium that prevents easy penetration of the molecule
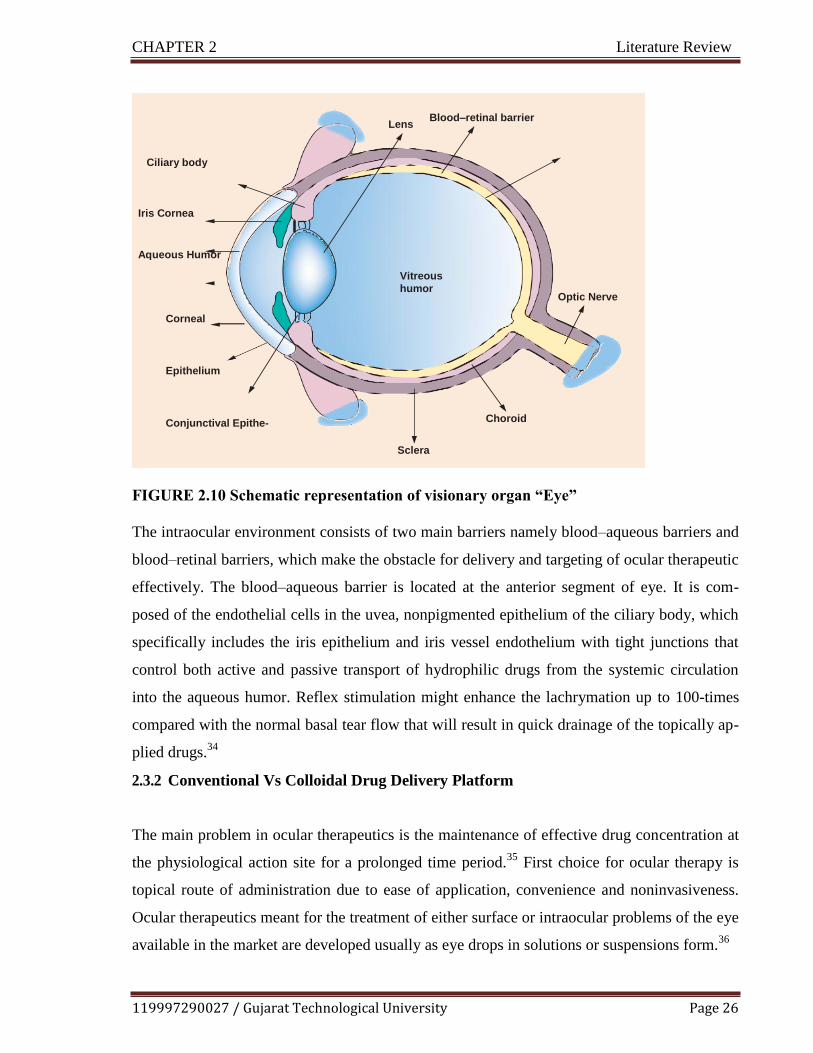
119997290027 / Gujarat Technological University Page 26
CHAPTER 2 Literature Review
FIGURE 2.10 Schematic representation of visionary organ “Eye”
The intraocular environment consists of two main barriers namely blood–aqueous barriers and
blood–retinal barriers, which make the obstacle for delivery and targeting of ocular therapeutic
effectively. The blood–aqueous barrier is located at the anterior segment of eye. It is com-
posed of the endothelial cells in the uvea, nonpigmented epithelium of the ciliary body, which
specifically includes the iris epithelium and iris vessel endothelium with tight junctions that
control both active and passive transport of hydrophilic drugs from the systemic circulation
into the aqueous humor. Reflex stimulation might enhance the lachrymation up to 100-times
compared with the normal basal tear flow that will result in quick drainage of the topically ap-
plied drugs.34
2.3.2 Conventional Vs Colloidal Drug Delivery Platform
The main problem in ocular therapeutics is the maintenance of effective drug concentration at
the physiological action site for a prolonged time period.35
First choice for ocular therapy is
topical route of administration due to ease of application, convenience and noninvasiveness.
Ocular therapeutics meant for the treatment of either surface or intraocular problems of the eye
available in the market are developed usually as eye drops in solutions or suspensions form.36
Lens Blood–retinal barrier
Ciliary body
Iris Cornea
Aqueous Humor
Vitreous
humor Optic Nerve
Corneal
Epithelium
Conjunctival Epithe- Choroid
Sclera

119997290027 / Gujarat Technological University Page 27
CHAPTER 2 Literature Review
However, the competent protective barrier mechanism of the eye result in reduced ocular bio-
availability of the therapeutic agents.
As a part of in build defensive mechanism, applied drugs are shortly eliminated from the eye
surface via the process of blinking, baseline and reflex lachrymation, and drainage Precorneal
deficit factors affects bioavailability of a ocular therapeutics. It includes tear dynamics, im-
permeability of the corneal epithelium membranes, momentary residence in the fornix con-
junctiva and nonspecific absorption. Whatever quantity of dose administered, only a minute
quantity of drug (less than 5%) is accessible for its therapeutic activity to the desired eye
site.37
Repeated installation of eye drop is necessary for the maintenance of the required ther-
apeutic drug level in the tear film or at the targeted site, but on contrary side the repeated in-
stallation of highly concentrated solutions may cause ocular surface cellular damage and asso-
ciated toxic side effects.
Hence, in order to conquer these physiological barriers, various advances in formulation strat-
egies have been made for the achieving targeted ocular delivery of drugs. Currently, several
approaches are come into view, including hydro-gels, polymeric micelles, microemulsion,
nanoemulsions, nanosuspensions and lipid-based nanocarriers.38
A series of significant
advantages are presented by lipid-based nanocarriers including microemulsions, liposomes,
nanoparticles, cubosomes and niosomes, as ocular therapeutics, such as improving the bioa-
vailability of poorly soluble drugs, sustaining the release, site specificity and the reduction of
dose and side effects as well.39
2.3.3 Microemulsion
The ―Microemulsion‖ concept was introduced in 1940 by Hoar and Schulman. In 1955, he
subsequently coined the term ―Microemulsion‖. Microemulsion is single optically isotropic
fluid, transparent, thermodynamically stable oil and water system and stabilized by a surfac-
tant usually in conjunction with co-surfactant. The diameter of droplets in microemulsion may
be in the range of 20-200 nm.40
Microemulsions are particularly suitable for ocular drug delivery since these can be formulat-
ed to deal with many challenges including increasing residence time, improving ocular tissue
penetration and sustained release. Moreover, microemulsion can be administered through eye
drops and the small droplet size ensures that there is a negligible problem in visibility on ap-

119997290027 / Gujarat Technological University Page 28
CHAPTER 2 Literature Review
plication. Furthermore, microemulsions are simple, inexpensive, hence, these are easy to pre-
pare and sterilize also.41
They are stabilized pharmaceutical systems consisting of an oil phase, an aqueous phase and a
combination of surfactant and co-surfactant in appropriate ratios. Microemulsions are trans-
parent systems with low viscosity, exhibiting newtonian flow behavior, low surface tension,
and can incorporate both hydrophilic and hydrophobic drugs simultaneously. The role of sur-
factants is to enhance the drug permeability across the ocular tissue and cornea and serve as
permeation enhancers. Accordingly, microemulsion assures good spreading capability onto the
ocular surface and proper mixing with tears. Therefore, microemulsion can be delivered as eye
drops and will result in better patient compliance.42,
43
Selection of aqueous phase, organic phase and surfactant/co-surfactant systems is the im-
portant parameter for the stability of the microemulsion system and their optimization leads to
a considerable improvement in the drug solubility.
2.3.4 Theories of Microemulsion Formation
There are three major theories of microemulsion formation as discussed below
Interfacial or mixed film theory
This theory implies that the interfacial film is responsible for dissimilar behavior of the aque-
ous and oily segments of the interface.44,
45
Thermodynamic theory
According to this theory, spontaneous formation of microemulsion correlated to the low value
of interfacial tension on account of the interface diffusion of surfactant, as well as to the major
entropy contribution that depends on the homogeneous mixing of one phase in the other phase
in the form of numerous small droplets. 44,
45
Solubilization theory
In this theory, microemulsion are considered as swollen micellar systems, in which water or
oil is solubilized in the ―Reverse Micelle‖ structure to form an one-phase system. 44,
45

119997290027 / Gujarat Technological University Page 29
CHAPTER 2 Literature Review
2.3.5 Components of microemulsion
Oil phase
The physicochemical parameters of the oil phase / lipid phase must be identified and clearly
understood as they play key role for the existence of microemulsion area and solubilization of
model drug as well. Various kinds of vegetable oils/lipids are available for microemulsion
formation including glycerides, partial glyceride of medium-chain and unsaturated long-chain
fatty acids, and polyalcohol esters of medium-chain fatty acids.46
Oils/ lipids consisting exces-
sive long chain of hydrocarbons are found to be incompatible to penetrate the interfacial film
formed by surfactants/co-surfactant form at interface, as compared with those with short chain
of hydrocarbons, whereas the solubilization capability substantially increases with the increase
in the hydrocarbon chain length. Therefore, small-chain oils/lipids are preferred; however,
medium-chain oils/ lipids are frequently used for ocular microemulsion as they are more suit-
able for the formulation of microemulsion.47
Surfactants
It is important to select the appropriate surfactant to design the stable microemulsion system.
The surfactant should be capable of solubilizing and maintaining a very lower level the inter-
facial tension between oil and aqueous phases. Generally, it is observed that surfactants with
low hyrophilic–lipophilc balance (HLB) used prepare of water-in-oil (w/o) microemulsion
system and high HLB (>12) surfactants are used to prepare oil-in-water (o/w) microemulsion
system. Surfactant having HLB value more than 20 requires additionally co-surfactants to re-
duce efficient hyrophilic–lipophilc balance (HLB) up to a range needed for microemulsion
formation.48
All the experimental trials of phase behavior needed to be carried out at surfac-
tant‗s concentrations higher than the critical micelle concentration (CMC) value of the surfac-
tant(s) under study. Additional important characteristics mandatory to keep in view is no or
very low ocular toxicity and quick biodegradation of the surfactant(s) under study. Both ionic
agents, nonionic agents and their combination type of surfactant can be used. Preferentially,
nonionic surfactants, recognized as ―GRAS‖, owing to their properties like improving solubil-
ization, nonirritating, and ability to sustain precorneal retention with enhanced permeability.
Hence, they find most utility in ocular surfactant based formulation.49

119997290027 / Gujarat Technological University Page 30
CHAPTER 2 Literature Review
Co-surfactant
Apart from proper selection of oil and surfactant(s), formation of stable microemulsion also
correlated with the flexibility of the interface which can be accomplished by adding co-
surfactant to the formulation. On the basis of the virtual significance of presence of polar
groups, they have ability to change the curvature of the interface. The prime functions of co-
surfactants are to offer very low interfacial tension needed for the development of colloidal
dispersions and maintenance of their thermodynamic stability.
In general, for the stable microemulsion preparation, alcohols with low-molecular-weight and
glycols with chain length ranging from C2 to C10 are considered as co-surfactants. 50
As per lit-
erature, ocular irritation potential is inversely related on the chain length of the alcohols,
whereas some study finding revealed that aliphatic n-alcohols with chain length 3 to 8 were
strong irritants as comparative to ethanol. Ruth et al. in their study compared the efficacy of
alcohols, butanol and ethanol as co-surfactants in microemulsion consisting oil phase (isopro-
pyl myristate), surfactant (egg lecithin) and water. They found that amount of ethanol em-
ployed for the development of microemulsion was higher than that of butanol, and variation in
efficacy was due to difference in the length of the carbon chain.51
Aqueous phase
Water, being universal solvent is mostly used as the aqueous phase in microemulsion prepa-
ration. The aqueous phase pH has a great impact on the phase behavior of the microemulsion,
so it is necessary to maintain the required pH. Generally phosphate buffer pH. 7.4, artificial
trea fluid, purified or sterile water used as aqueous phase in most of ophthalmic microemul-
sion. Numerous excipients such as buffers, antibacterial and isotonic agents are retained by the
aqueous phase. Phase diagrams are influenced by the presence of saline when ionic surfactant
is added and reduces the phase inversion temperature of the nonionic surfactants. The preserv-
atives that are usually used in eye drop formulations cannot be incorporated in microemulsion.
They must not interact with surfactants and result in complexes, nor should they be absorbed
in nanodroplets, which would considerably decrease their antibacterial activity.52
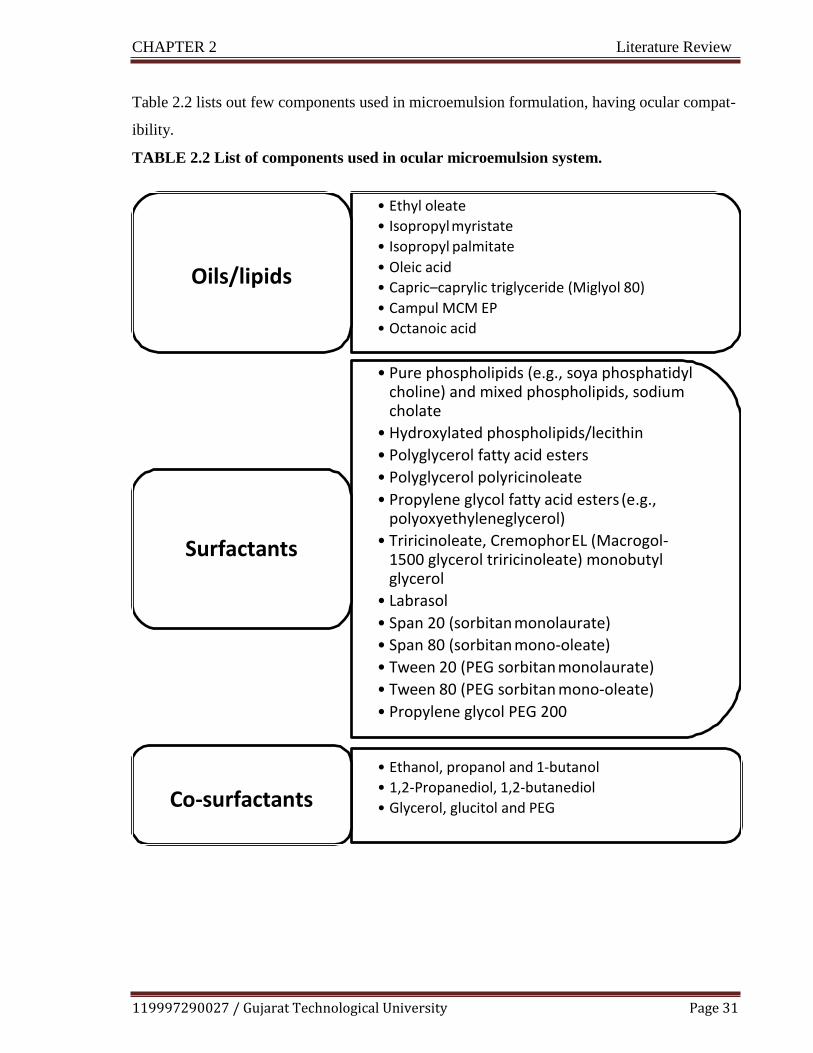
119997290027 / Gujarat Technological University Page 31
CHAPTER 2 Literature Review
Table 2.2 lists out few components used in microemulsion formulation, having ocular compat-
ibility.
TABLE 2.2 List of components used in ocular microemulsion system.
Oils/lipids
• Ethyl oleate
• Isopropyl myristate
• Isopropyl palmitate
• Oleic acid
• Capric–caprylic triglyceride (Miglyol 80)
• Campul MCM EP
• Octanoic acid
Surfactants
• Pure phospholipids (e.g., soya phosphatidyl choline) and mixed phospholipids, sodium cholate
• Hydroxylated phospholipids/lecithin
• Polyglycerol fatty acid esters
• Polyglycerol polyricinoleate
• Propylene glycol fatty acid esters (e.g., polyoxyethyleneglycerol)
• Triricinoleate, Cremophor EL (Macrogol- 1500 glycerol triricinoleate) monobutyl glycerol
• Labrasol
• Span 20 (sorbitan monolaurate)
• Span 80 (sorbitan mono-oleate)
• Tween 20 (PEG sorbitan monolaurate)
• Tween 80 (PEG sorbitan mono-oleate)
• Propylene glycol PEG 200
Co-surfactants
• Ethanol, propanol and 1-butanol
• 1,2-Propanediol, 1,2-butanediol
• Glycerol, glucitol and PEG
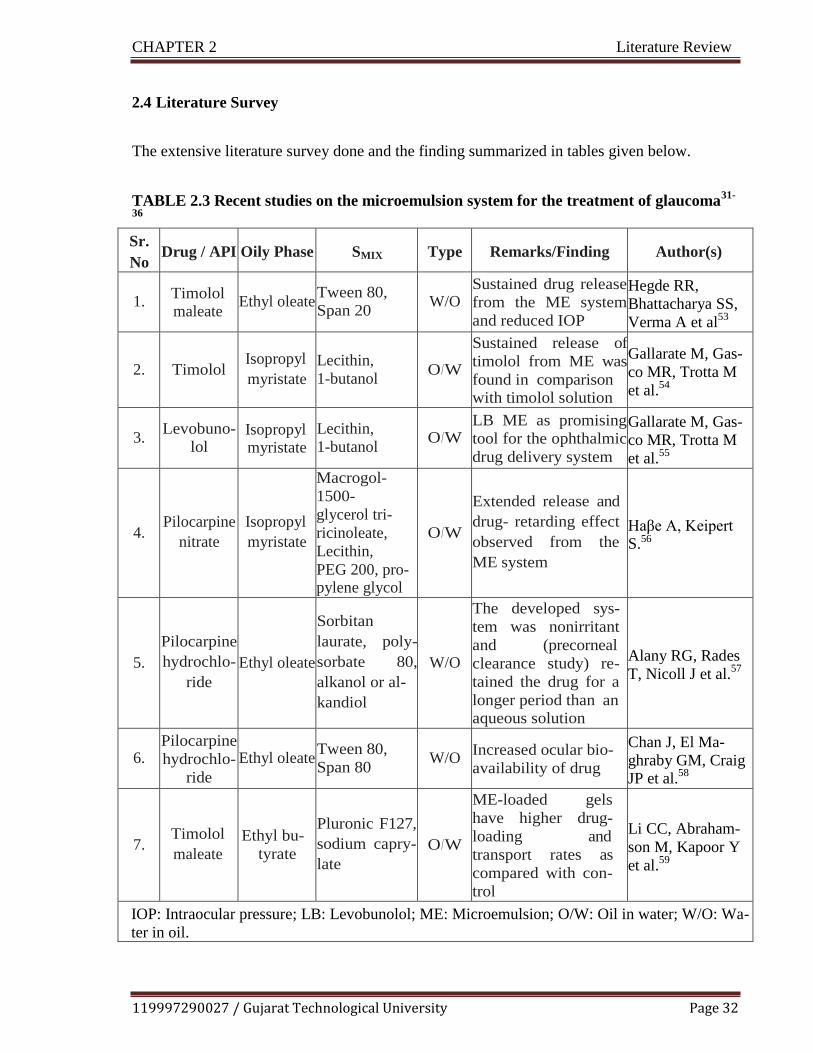
119997290027 / Gujarat Technological University Page 32
CHAPTER 2 Literature Review
2.4 Literature Survey
The extensive literature survey done and the finding summarized in tables given below.
TABLE 2.3 Recent studies on the microemulsion system for the treatment of glaucoma31-
36
Sr.
No Drug / API Oily Phase SMIX Type Remarks/Finding Author(s)
1.
Timolol maleate
Ethyl oleate
Tween 80,
Span 20
W/O
Sustained drug release
from the ME system
and reduced IOP
Hegde RR,
Bhattacharya SS,
Verma A et al53
2.
Timolol
Isopropyl
myristate
Lecithin,
1-butanol
O/W
Sustained release of
timolol from ME was
found in comparison with timolol solution
Gallarate M, Gas-
co MR, Trotta M
et al.54
3.
Levobuno-
lol Isopropyl myristate
Lecithin,
1-butanol
O/W
LB ME as promising
tool for the ophthalmic
drug delivery system
Gallarate M, Gas-
co MR, Trotta M
et al.55
4.
Pilocarpine
nitrate
Isopropyl
myristate
Macrogol-
1500-
glycerol tri-
ricinoleate,
Lecithin,
PEG 200, pro- pylene glycol
O/W
Extended release and
drug- retarding effect
observed from the
ME system
Haβe A, Keipert S.56
5.
Pilocarpine
hydrochlo-
ride
Ethyl oleate
Sorbitan
laurate, poly-
sorbate 80,
alkanol or al-
kandiol
W/O
The developed sys-
tem was nonirritant
and (precorneal
clearance study) re-
tained the drug for a
longer period than an aqueous solution
Alany RG, Rades
T, Nicoll J et al.57
6.
Pilocarpine
hydrochlo-
ride
Ethyl oleate
Tween 80,
Span 80
W/O
Increased ocular bio-
availability of drug
Chan J, El Ma-
ghraby GM, Craig JP et al.
58
7.
Timolol
maleate
Ethyl bu-
tyrate
Pluronic F127,
sodium capry-
late
O/W
ME-loaded gels
have higher drug-
loading and
transport rates as
compared with con-
trol
Li CC, Abraham-
son M, Kapoor Y
et al.59
IOP: Intraocular pressure; LB: Levobunolol; ME: Microemulsion; O/W: Oil in water; W/O: Wa-
ter in oil.
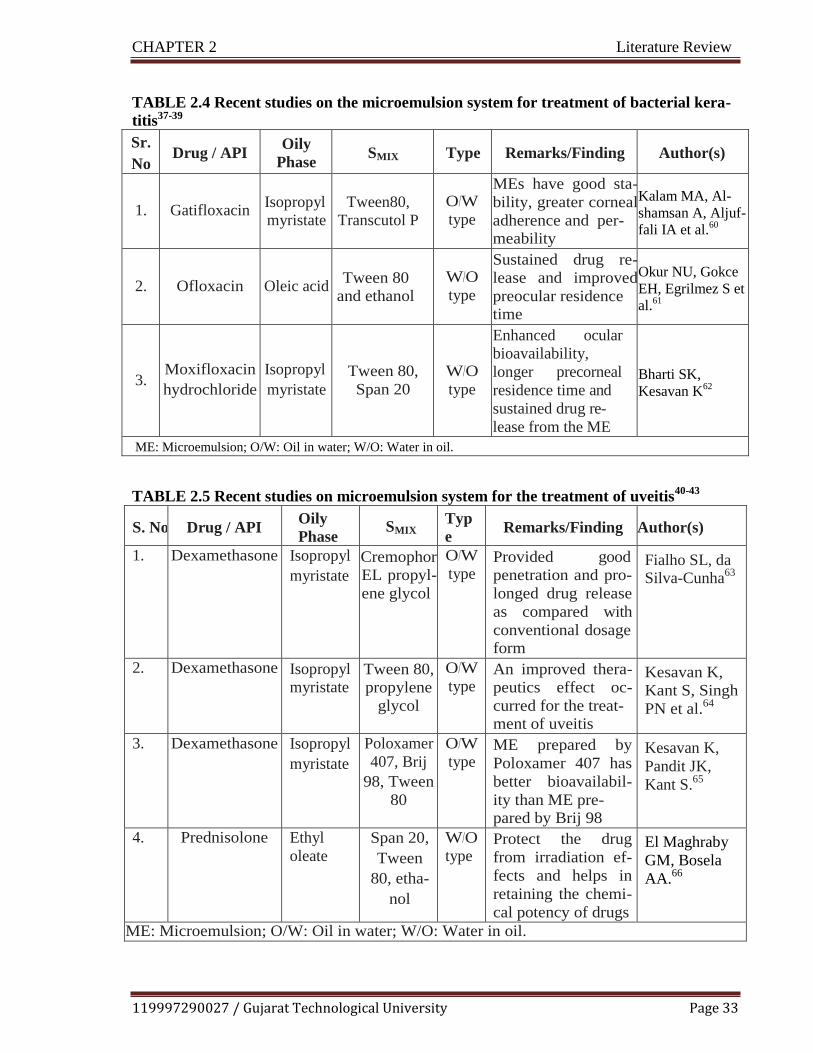
119997290027 / Gujarat Technological University Page 33
CHAPTER 2 Literature Review
TABLE 2.4 Recent studies on the microemulsion system for treatment of bacterial kera-
titis37-39
Sr.
No Drug / API
Oily
Phase SMIX Type Remarks/Finding Author(s)
1.
Gatifloxacin
Isopropyl
myristate
Tween80,
Transcutol P
O/W
type
MEs have good sta-
bility, greater corneal
adherence and per- meability
Kalam MA, Al-
shamsan A, Aljuf-
fali IA et al.60
2.
Ofloxacin
Oleic acid
Tween 80
and ethanol
W/O
type
Sustained drug re-
lease and improved
preocular residence time
Okur NU, Gokce
EH, Egrilmez S et
al.61
3.
Moxifloxacin
hydrochloride
Isopropyl
myristate
Tween 80,
Span 20
W/O
type
Enhanced ocular
bioavailability,
longer precorneal
residence time and
sustained drug re-
lease from the ME
Bharti SK,
Kesavan K62
ME: Microemulsion; O/W: Oil in water; W/O: Water in oil.
TABLE 2.5 Recent studies on microemulsion system for the treatment of uveitis
40-43
S. No Drug / API Oily
Phase SMIX
Typ
e Remarks/Finding Author(s)
1. Dexamethasone Isopropyl
myristate
Cremophor
EL propyl-
ene glycol
O/W
type Provided good
penetration and pro-
longed drug release
as compared with
conventional dosage form
Fialho SL, da Silva-Cunha
63
2. Dexamethasone Isopropyl
myristate Tween 80,
propylene
glycol
O/W
type An improved thera-
peutics effect oc-
curred for the treat- ment of uveitis
Kesavan K,
Kant S, Singh
PN et al.64
3. Dexamethasone Isopropyl
myristate
Poloxamer
407, Brij
98, Tween
80
O/W
type ME prepared by
Poloxamer 407 has
better bioavailabil-
ity than ME pre- pared by Brij 98
Kesavan K,
Pandit JK,
Kant S.65
4. Prednisolone Ethyl
oleate
Span 20,
Tween
80, etha-
nol
W/O
type Protect the drug
from irradiation ef-
fects and helps in
retaining the chemi-
cal potency of drugs
El Maghraby
GM, Bosela
AA.66
ME: Microemulsion; O/W: Oil in water; W/O: Water in oil.

119997290027 / Gujarat Technological University Page 34
CHAPTER 2 Literature Review
TABLE 2.6 Recent studies on microemulsion for the ocular delivery of immunosup-
presants44-47
S.No. Drug / API Oily
Phase
SMIX Remarks/Finding Author(s)
1. Sirolimus Triacetin Poloxamer 184,
propylene glycol
Suitable for the immuno-
modulatory treatment of
ocular surface disorders
Buech G, Bertelmann E, Pleyer U et al.
67
2. Tacrolimus Isopropyl
myristate
Tween 80, PEG–
block-
poly(propylene
glycol)–block-
PEG
Prepared MEs were nonir- ritating, nontoxic and showed higher values of AUC and Cmax leading to reduced systemic side ef- fects
Silva-Cunha A, da Silva GR, de Castro WV et al.
68
3. Everolimus Triacetin Poloxamer 184, propylene glycol
Developed system suitable
for preventing corneal-
graft rejection
Baspinar Y, Bertelmann E, Pleyer U et al.
69
4. Cyclosporine
A
Ethyl
butyrate
Brij-97 Slow and sustained release
of drugs observed from
surfactant or ME-laden
gels
Kapoor Y, Chauhan A
70
ME: Microemulsion.
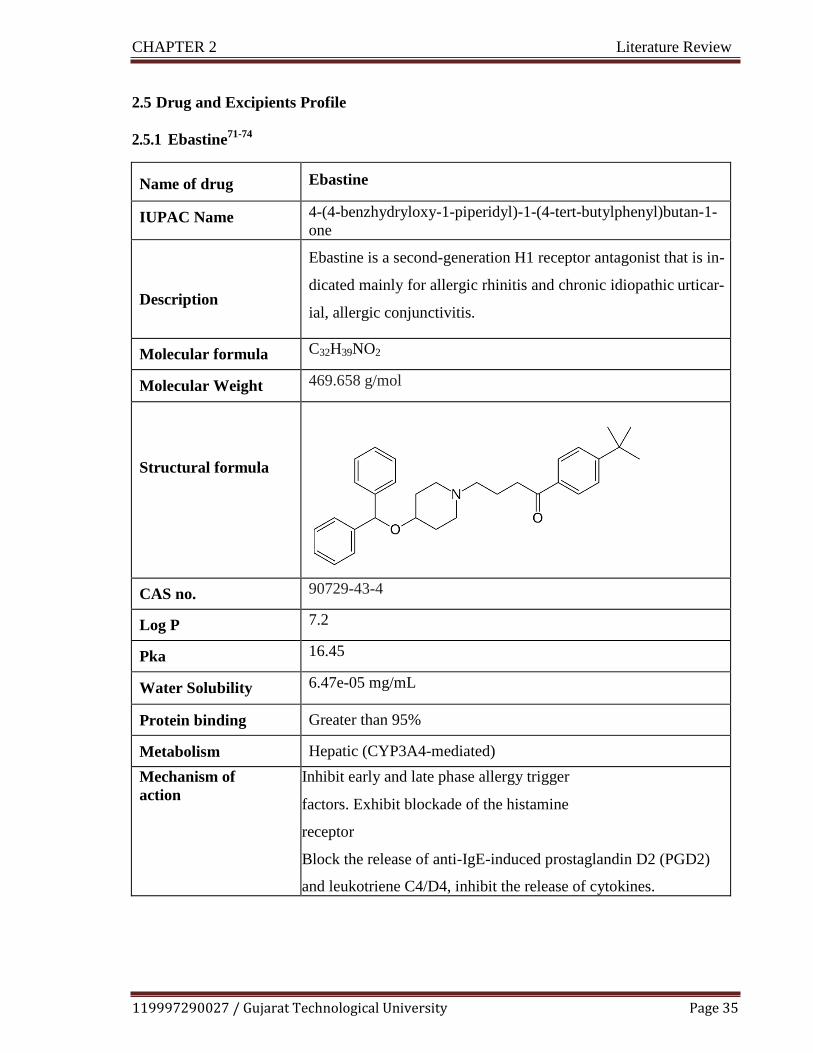
119997290027 / Gujarat Technological University Page 35
CHAPTER 2 Literature Review
2.5 Drug and Excipients Profile
2.5.1 Ebastine71-74
Name of drug Ebastine
IUPAC Name 4-(4-benzhydryloxy-1-piperidyl)-1-(4-tert-butylphenyl)butan-1-
one
Description
Ebastine is a second-generation H1 receptor antagonist that is in-
dicated mainly for allergic rhinitis and chronic idiopathic urticar-
ial, allergic conjunctivitis.
Molecular formula C32H39NO2
Molecular Weight 469.658 g/mol
Structural formula
CAS no. 90729-43-4
Log P 7.2
Pka 16.45
Water Solubility 6.47e-05 mg/mL
Protein binding Greater than 95%
Metabolism Hepatic (CYP3A4-mediated)
Mechanism of
action
Inhibit early and late phase allergy trigger
factors. Exhibit blockade of the histamine
receptor
Block the release of anti-IgE-induced prostaglandin D2 (PGD2)
and leukotriene C4/D4, inhibit the release of cytokines.
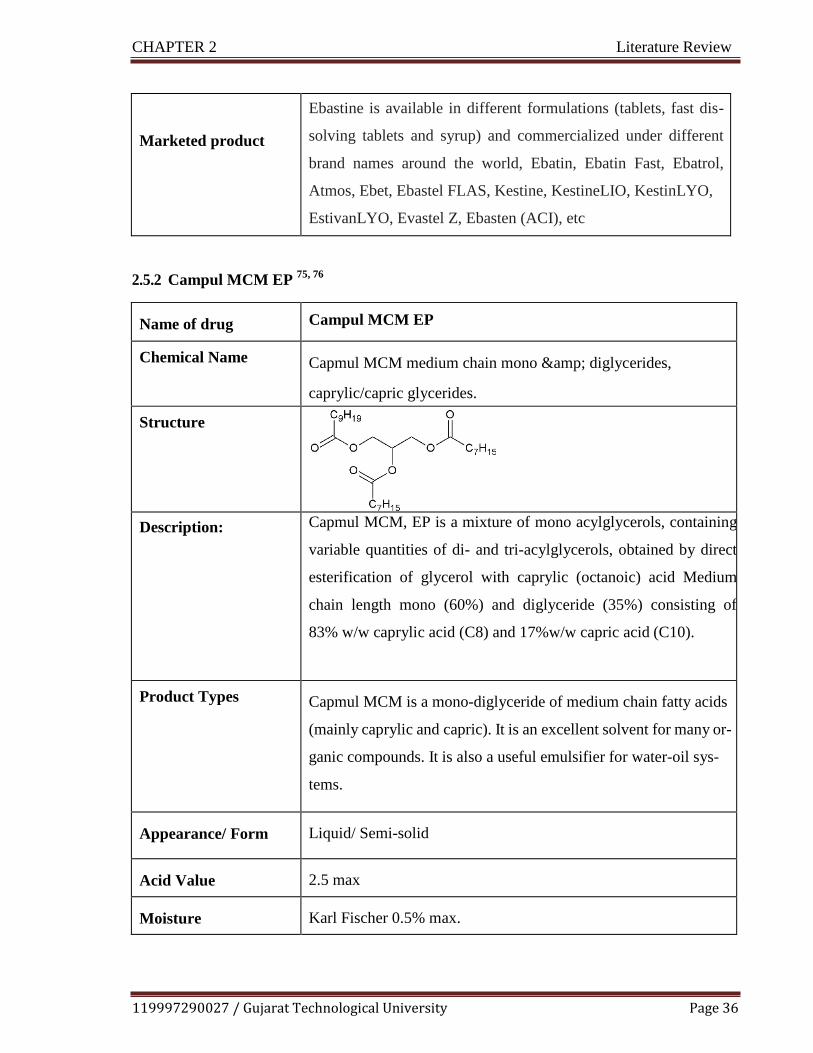
119997290027 / Gujarat Technological University Page 36
CHAPTER 2 Literature Review
Marketed product
Ebastine is available in different formulations (tablets, fast dis-
solving tablets and syrup) and commercialized under different
brand names around the world, Ebatin, Ebatin Fast, Ebatrol,
Atmos, Ebet, Ebastel FLAS, Kestine, KestineLIO, KestinLYO,
EstivanLYO, Evastel Z, Ebasten (ACI), etc
2.5.2 Campul MCM EP 75,
76
Name of drug Campul MCM EP
Chemical Name Capmul MCM medium chain mono & diglycerides,
caprylic/capric glycerides.
Structure
Description: Capmul MCM, EP is a mixture of mono acylglycerols, containing
variable quantities of di- and tri-acylglycerols, obtained by direct
esterification of glycerol with caprylic (octanoic) acid Medium
chain length mono (60%) and diglyceride (35%) consisting of
83% w/w caprylic acid (C8) and 17%w/w capric acid (C10).
Product Types Capmul MCM is a mono-diglyceride of medium chain fatty acids
(mainly caprylic and capric). It is an excellent solvent for many or-
ganic compounds. It is also a useful emulsifier for water-oil sys-
tems.
Appearance/ Form Liquid/ Semi-solid
Acid Value 2.5 max
Moisture Karl Fischer 0.5% max.

119997290027 / Gujarat Technological University Page 37
CHAPTER 2 Literature Review
Alpha Monocaprylate 48% min.
Free Glycerol max. 2.5%
Storage Store in a dry place at 68-77ºF.
Pharmaceutical and
Nutritional Applica-
tions
Carrier (vehicle)
Solubilizer
Emulsifier/ Co-emulsifier
Bioavailability enhancer
Penetration enhancer
2.5.3 Tween 80 77-80
Name of drug Tween 80
Chemical Name Polyoxyethylene 20 sorbitan monooleate; Polyethylene oxide sor-
bitan mono-oleate; Polyoxyethylene sorbitan monooleate; Polyox-
yethylene sorbitan oleate; Sorbitan mono-9- octadecenoate poly
(oxy-1, 2-ethanediyl) derivatives; Sorethytan (20) monooleat
Structure
Appearance/ Form Liquid. (Oily liquid.)
Odour fatty (Slight.)
Colour Clear Amber. Yellow.
pH (1% soln/water) 7 [Neutral.]
Specific gravity at 2o°c
(d20/4)
1.06 - 1.10 (Water = 1)
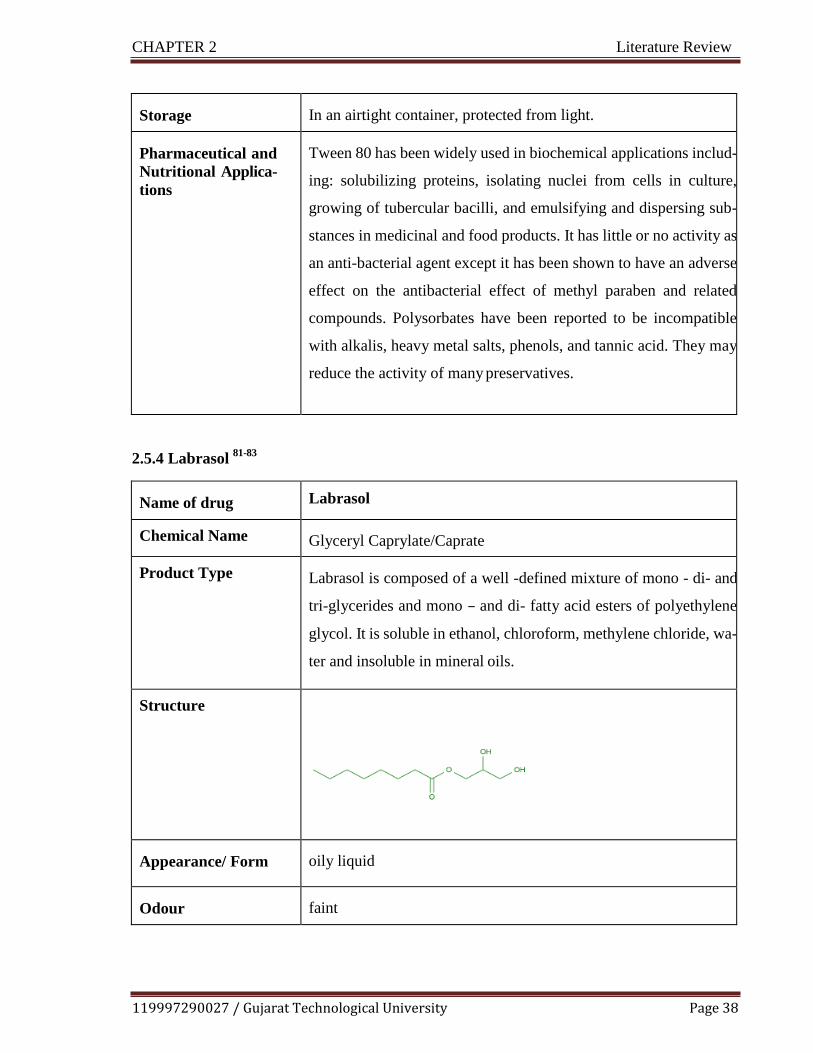
119997290027 / Gujarat Technological University Page 38
CHAPTER 2 Literature Review
Storage In an airtight container, protected from light.
Pharmaceutical and
Nutritional Applica-
tions
Tween 80 has been widely used in biochemical applications includ-
ing: solubilizing proteins, isolating nuclei from cells in culture,
growing of tubercular bacilli, and emulsifying and dispersing sub-
stances in medicinal and food products. It has little or no activity as
an anti-bacterial agent except it has been shown to have an adverse
effect on the antibacterial effect of methyl paraben and related
compounds. Polysorbates have been reported to be incompatible
with alkalis, heavy metal salts, phenols, and tannic acid. They may
reduce the activity of many preservatives.
2.5.4 Labrasol 81-83
Name of drug Labrasol
Chemical Name Glyceryl Caprylate/Caprate
Product Type Labrasol is composed of a well -defined mixture of mono - di- and
tri-glycerides and mono – and di- fatty acid esters of polyethylene
glycol. It is soluble in ethanol, chloroform, methylene chloride, wa-
ter and insoluble in mineral oils.
Structure
Appearance/ Form oily liquid
Odour faint

119997290027 / Gujarat Technological University Page 39
CHAPTER 2 Literature Review
Colour (gardner scale) < 2.5
Specific gravity at 2o°c
(d20/4)
1.060 to 1.070
Water content < 1.00 %
Storage Preserve in its original container and prevent exposure to air, light,
heat and moisture
Pharmaceutical and
Nutritional Applica-
tions
High HLB non-ionic amphiphilic excipient for pharmaceutical
preparations, used as solubilizing agent and bioavailability enhanc-
er for poorly soluble drugs in oral liquid and capsule formulations,
permeation enhancer in topical preparations, surfactant in
nanoemulsions.
2.5.5 Glycerol 84
Name of drug Glycerol
Chemical Name Croderol; E422; glicerol; glycerine; glycerolum; Glycon G-
100;Kemstrene; Optim; Pricerine; 1,2,3-propanetriol; trihydroxy-
propaneglycerol. Propane-1,2,3-triol
Structure
Product Type Glycerin is a clear, colorless, odorless, viscous, hygroscopic liquid;
ithas a sweet taste, approximately 0.6 times as sweet as sucrose
119997290027 / Gujarat Technological University Page 40
CHAPTER 2 Literature Review
Appearance/ Form Clear viscous liquid
Odour odorless,
Colour colorless,
Density 1.2656 g/cm3 at 150C;
1.2636 g/cm3 at 200C;
1.2620 g/cm3 at 250C
Hygroscopicity Hygroscopic
Storage Glycerin is hygroscopic. Pure glycerin is not prone to oxidation by
the atmosphere under ordinary storage conditions, but it decom-
poseson heating with the evolution of toxic acrolein. Mixtures of
glycerin with water, ethanol (95%), and propylene glycol are
chemically stable Glycerin may crystallize if stored at low tem-
peratures; the crystals do not melt until warmed to 200C. Glycerin
should be stored in an airtight container, in a cool, dry place.
Pharmaceutical and
Nutritional Applica-
tions
In topical pharmaceutical formulations and cosmetics, glycerin is
used primarily for its humectant and emollient properties. Used as
a solvent or cosolvent in creams, emulsions and parenteral formu-
lations. Also used in gels and as anadditivein patch applications. In
oral solutions, used as a solvent, sweetening agent, antimicrobial
preservative, and viscosity-increasing agent. It is also used as a
plasticizer, in film coatings and in production of softgelatin cap-
sules and gelatin suppositories.
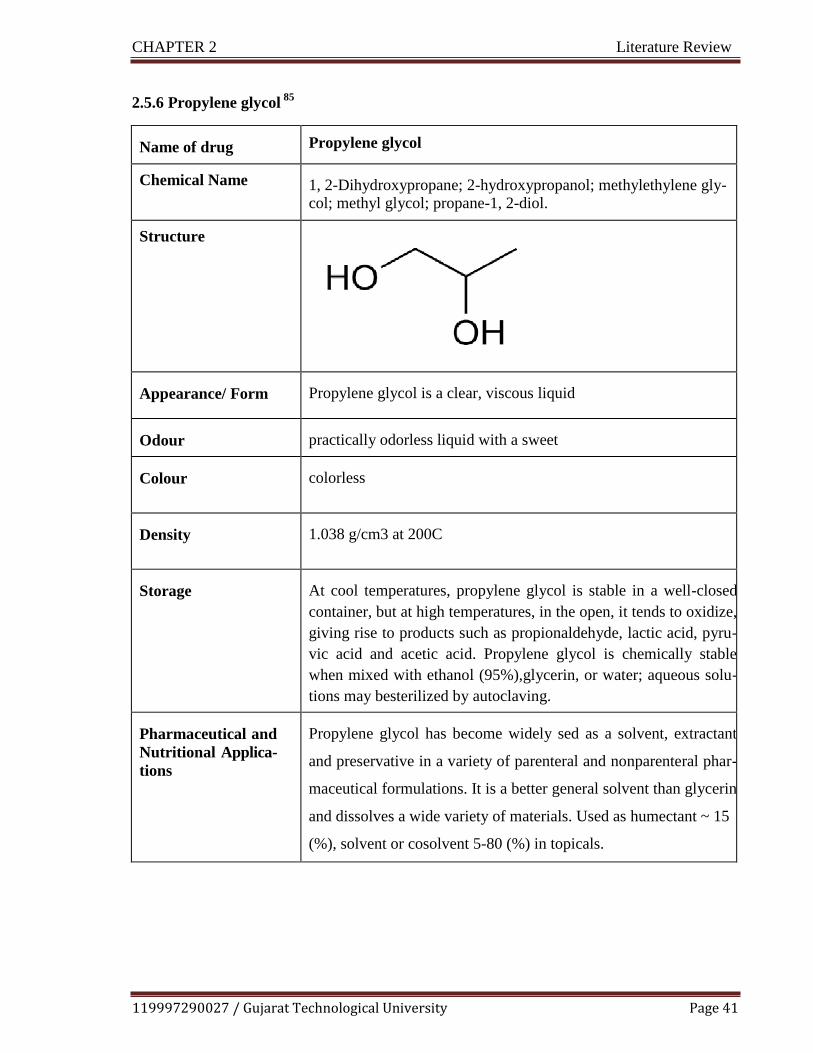
119997290027 / Gujarat Technological University Page 41
CHAPTER 2 Literature Review
2.5.6 Propylene glycol 85
Name of drug Propylene glycol
Chemical Name 1, 2-Dihydroxypropane; 2-hydroxypropanol; methylethylene gly- col; methyl glycol; propane-1, 2-diol.
Structure
Appearance/ Form Propylene glycol is a clear, viscous liquid
Odour practically odorless liquid with a sweet
Colour colorless
Density 1.038 g/cm3 at 200C
Storage At cool temperatures, propylene glycol is stable in a well-closed
container, but at high temperatures, in the open, it tends to oxidize,
giving rise to products such as propionaldehyde, lactic acid, pyru-
vic acid and acetic acid. Propylene glycol is chemically stable
when mixed with ethanol (95%),glycerin, or water; aqueous solu-
tions may besterilized by autoclaving.
Pharmaceutical and
Nutritional Applica-
tions
Propylene glycol has become widely sed as a solvent, extractant
and preservative in a variety of parenteral and nonparenteral phar-
maceutical formulations. It is a better general solvent than glycerin
and dissolves a wide variety of materials. Used as humectant ~ 15
(%), solvent or cosolvent 5-80 (%) in topicals.

119997290027 / Gujarat Technological University Page 42
CHAPTER 2 Literature Review
2.5.7 Sodium Hyaluronate 86,
87
Name of drug Sodium Hyaluronate
Chemical Name 3S,4R,6R)-3-[[(2R,4R,5S)-3-acetamido-4-[[(2R,4R,5S)-6-carboxy-
3,4,5-trihydroxyoxan-2-yl]oxymethyl]-5-hydroxy-6-
(hydroxymethyl)oxan-2-yl]methoxymethyl]-6-[[(2R,4R,5S)-3-
acetamido-2,5-dihydroxy-6-(hydroxymethyl)oxan-4-yl]methoxy]-
4,5-dihydroxy-5-methyloxane-2-carboxylic acid
Structure
Product Type Hyaluronic acid (HA) is a naturally-occurring glycosaminoglycan and a major component of the extracellular matrix.
Appearance/ Form Salt
Odour NA
Water Solubility 46.6 mg/mL
Storage Preserve in its original container and prevent exposure to air, light, heat and moisture

119997290027 / Gujarat Technological University Page 43
CHAPTER 2 Literature Review
Pharmaceutical and
Nutritional Applica-
tions
Hyaluronic acid performs its activities as a tissue lubricant and
hence,. It forms a viscoelastic solution in water which makes it suit-
able for aqueous and vitreous humor in ophthalmic surgery. It is
suggested to provide mechanical protection for ocular tissues and
cell layers due to its high viscosity. The elasticity of the solutions of
hyaluronic acid can assist in the absorption of mechanical stress and
the generation of a protective buffer for the tissues. This viscoelas-
ticity enables maintenance of a deep chamber during surgical ma-
nipulation since the solution does not flow out of the open anterior
chamber.
2.5.8 Carboxy methyl cellulose 87,
88
Name of drug Carboxy methyl cellulose
Chemical Name Carboxymethyl ether, sodium salt, cellulose.
Structure
Appearance/ Form Granular Powder
Odour Odourless.
Colour Almost white colored
Density 0.75 g / cm3
Storage Preserve in its original container and prevent exposure to air, light,
heat and moisture
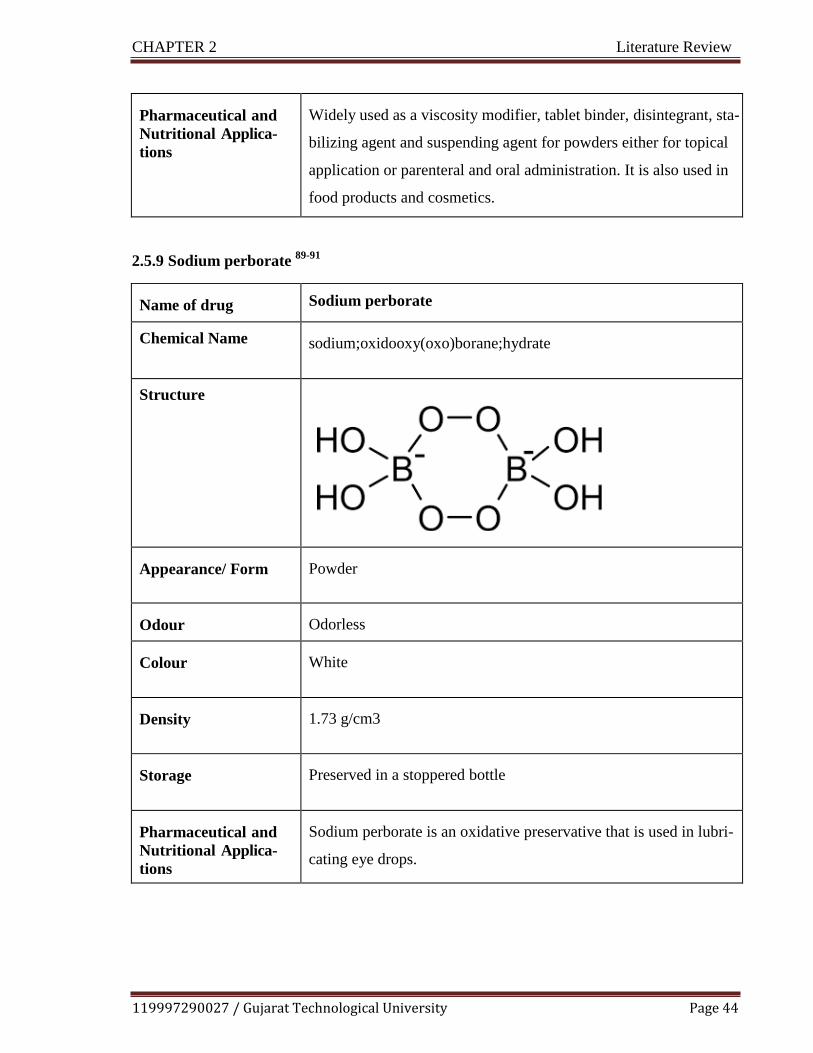
119997290027 / Gujarat Technological University Page 44
CHAPTER 2 Literature Review
Pharmaceutical and
Nutritional Applica-
tions
Widely used as a viscosity modifier, tablet binder, disintegrant, sta-
bilizing agent and suspending agent for powders either for topical
application or parenteral and oral administration. It is also used in
food products and cosmetics.
2.5.9 Sodium perborate 89-91
Name of drug Sodium perborate
Chemical Name sodium;oxidooxy(oxo)borane;hydrate
Structure
Appearance/ Form Powder
Odour Odorless
Colour White
Density 1.73 g/cm3
Storage Preserved in a stoppered bottle
Pharmaceutical and
Nutritional Applica-
tions
Sodium perborate is an oxidative preservative that is used in lubri-
cating eye drops.

119997290027 / Gujarat Technological University Page 45
CHAPTER 2 Literature Review
2.6 References
1. Narayanan V., 2018. Pharmaceutical ophthalmic market perspectives in India and emerg-
ing trends. Clinical and Experimental Vision and Eye Research 1, pp. 35–37.
2. Lang JC, Roehrs RE, Rodeheaver DP, Missel PJ, Jani R, Chowhan MA, 2002 Design and
evaluation of ophthalmic pharmaceutical products. In: G.S. banker, C.T. Rhodes (4th ed.),
Modern Pharmaceutics, Marcel Dekker, New York, Basel, p. 489-547.
3. Van Wyk, H., 2018. Allergic conjunctivitis. SA Pharmacist's Assistant, 18(3), pp.22-24.
4. Elyse LC, Tammy T, 2015. Sneak Peek at Next-gen Drugs to Treat Allergic Conjunctivi-
tis,Pharma Science and Practice. Available:
https://www.reviewofcontactlenses.com/article/a-sneak-peek-at-nextgen-drugs-to-treat-
allergic-conjunctivitis
5. Yeung, K., 2017. Bacterial Conjunctivitis (Pink Eye). Available: Medscape.com. Oct 5.
6. Friedlaender M.H, 1995. A review of the causes and treatment of bacterial and allergic
conjunctivitis. Clinical therapeutics.17 (5) pp 800-810.
7. La Rosa, M., Lionetti, E., Reibaldi, M., Russo, A., Longo, A., Leonardi, S., Tomarchio,
S., Avitabile, T. and Reibaldi, A., 2013. Allergic conjunctivitis: a comprehensive review
of the literature. Italian journal of pediatrics, 39(1), p.18.
8. Rathi, V.M. and Murthy, S.I., 2017. Allergic conjunctivitis. Community eye health,
30(99), p.S7.
9. Rosario, N. and Bielory, L., 2011. Epidemiology of allergic conjunctivitis. Current opin-
ion in allergy and clinical immunology, 11(5), pp.471-476.
10. Chowdhury B, 2013. Allergic Conjunctivitis–A Review, DOS Times, Vol. 19(4) pp 41-47

119997290027 / Gujarat Technological University Page 46
CHAPTER 2 Literature Review
11. Ackerman, S., Smith, L.M. and Gomes, P.J., 2016. Ocular itch associated with allergic
conjunctivitis: latest evidence and clinical management. Therapeutic advances in chronic
disease, 7(1), pp.52-67.
12. Sánchez-Hernández, M.C., Montero, J., Rondon, C., del Castillo Benitez, J.M., Veláz-
quez, E., Herreras, J.M., Fernández-Parra, B., Merayo-Lloves, J., Del, A.C., Vega, F. and
Valero, A., 2015. Consensus document on allergic conjunctivitis (DECA). Journal of in-
vestigational allergology & clinical immunology, 25(2), pp.94-106.
13. Yoshida S., 2019. Allergic Ocular Diseases. Allergy and Asthma: The Basics to Best
Practices. pp 113-42.
14. Alfonso S.A, Fawley J.D, Lu X.A, 2015. Conjunctivitis, Primary Care: Clinics in Office
Practice. 1;42(3), pp 325-345.
15. Kyei, S., Tettey, B., Asiedu, K. and Awuah, A., 2016. Knowledge and awareness of ocu-
lar allergy among undergraduate students of public universities in Ghana. BMC ophthal-
mology, 16(1), p.190.
16. Centers for Disease Control and Prevention. Conjunctivitis (pink eye). Available
https://www.cdc.gov/conjunctivitis/. Accessed November 02, 2019.
17. Mayo Clinic. Pink eye (conjunctivitis). Available: https://www.mayoclinic.org/diseases-
conditions/pink-eye/symptoms-causes/syc-20376355. Accessed September 23, 2019.
18. American Academy of Ophthalmology. Conjunctivitis. Available:
http://eyewiki.aao.org/Conjunctivitis. Accessed September 23, 2019.
19. Centers for Disease Control and Prevention. Conjunctivitis (pink eye) in newborns.
Available: https://www.cdc.gov/conjunctivitis/newborns.html. Accessed October 26,
2019.

119997290027 / Gujarat Technological University Page 47
CHAPTER 2 Literature Review
20. Schultz, B.L., 2006. Pharmacology of ocular allergy. Current opinion in allergy and clini-
cal immunology, 6(5), pp.383-389.
21. Azari, A.A. and Barney, N.P., 2013. Conjunctivitis: a systematic review of diagnosis and
treatment. Jama, 310(16), pp.1721-1730.
22. Villani, E., Rabbiolo, G. and Nucci, P., 2018. Ocular allergy as a risk factor for dry eye in
adults and children. Current opinion in allergy and clinical immunology, 18(5), pp.398-
403.
23. https://www.hse.ie/eng/health/az/c/conjunctivitis,-allergic/complications-of-allergic-
conjunctivitis.html, Accessed October 26, 2019.
24. Alipour, F., Khaheshi, S., Soleimanzadeh, M., Heidarzadeh, S. and Heydarzadeh, S.,
2017. Contact lens-related complications: A review. Journal of ophthalmic & vision re-
search, 12(2), p.193.
25. P Mishra, G., Tamboli, V., Jwala, J. and K Mitra, A., 2011. Recent patents and emerging
therapeutics in the treatment of allergic conjunctivitis. Recent patents on inflammation &
allergy drug discovery, 5(1), pp.26-36.
26. Van Eyk, A.D., 2018. Pharmacotherapeutic options for ophthalmic conjunctivitis. South
African Family Practice, 60(2), pp.18-23.
27. Van Eyk, A.D., 2019. Pharmacotherapeutic options for ophthalmic conjunctivitis. South
African Family Practice, 61(3), pp.46-50.
28. Davis S., 2015. Topical treatment options for allergic conjunctivitis. South African Fami-
ly Practice. 57(4) pp 10-15.

119997290027 / Gujarat Technological University Page 48
CHAPTER 2 Literature Review
29. Fromstein S., 2016. Current and emerging therapies for allergic conjunctivitis: with so
many tools at your disposal, knowing the right treatment strategy can be challenging. Re-
view of Optometry; 153(4) pp 94-100.
30. Bielory, L., 2002. Update on ocular allergy treatment. Expert opinion on pharmacothera-
py, 3(5), pp.541-553.
31. Salmun, L.M., 2002. Antihistamines in late-phase clinical development for allergic dis-
ease. Expert opinion on investigational drugs, 11(2), pp.259-273.
32. Bielory, L., Meltzer, E.O., Nichols, K.K., Melton, R., Thomas, R.K. and Bartlett, J.D.,
2013, September. An algorithm for the management of allergic conjunctivitis. In Allergy
and asthma proceedings (Vol. 34, No. 5, pp. 408-420). OceanSide Publications, Inc.
33. Gautam, N. and Kesavan, K., 2017. Development of microemulsions for ocular delivery.
Therapeutic delivery, 8(5), pp.313-330.
34. Patel, A., Cholkar, K., Agrahari, V. and Mitra, A.K., 2013. Ocular drug delivery systems:
an overview. World journal of pharmacology, 2(2), pp.47.
35. Mainardes, R.M., Urban, M.C., Cinto, P.O., Khalil, N.M., Chaud, M.V., Evangelista, R.C.
and Daflon Gremiao, M.P., 2005. Colloidal carriers for ophthalmic drug delivery. Current
Drug Targets, 6(3), pp.363-371.
36. Mohan, K., Pravin, S. and Atul, B., 2012. Ophthalmic microemulsion: a comprehensive
review. Int J Pharm Bio Sci, 3(3), pp.1-13.
37. Chandrakar, S., Roy, A., Choudhury, A., Saha, S., Bahadur, S. and Prasad, P., 2014. Mi-
croemulsion: A Versatile Tool for Ocular Drug Delivery. Asian Journal of Pharmacy and
Technology, 4(3), pp.147-150.

119997290027 / Gujarat Technological University Page 49
CHAPTER 2 Literature Review
38. Weng, Y., Liu, J., Jin, S., Guo, W., Liang, X. and Hu, Z., 2017. Nanotechnology-based
strategies for treatment of ocular disease. Acta pharmaceutica sinica B, 7(3), pp.281-291.
39. Ako-Adounvo, A.M., C Nagarwal, R., Oliveira, L., HS Boddu, S., S Wang, X., Dey, S.
and K Karla, P., 2014. Recent patents on ophthalmic nanoformulations and therapeutic
implications. Recent patents on drug delivery & formulation, 8(3), pp.193-201.
40. Habib, F., El-Mahdy, M. and Maher, S., 2011. Microemulsions for ocular delivery: evalu-
ation and characterization. Journal of Drug Delivery Science and Technology, 21(6),
pp.485-489.
41. Gupta, S. and Moulik, S.P., 2008. Biocompatible microemulsions and their prospective
uses in drug delivery. Journal of pharmaceutical sciences, 97(1), pp.22-45.
42. Peng, C.C., Bengani, L.C., Jung, H.J., Leclerc, J., Gupta, C. and Chauhan, A., 2011.
Emulsions and microemulsions for ocular drug delivery. Journal of Drug Delivery Sci-
ence and Technology, 21(1), pp.111-121.
43. Prince, L.M., 1997. A theory of aqueous emulsions I. Negative interfacial tension at the
oil/water interface. Journal of Colloid and Interface Science, 23(2), pp.165-173.
44. Singh, P.K., Iqubal, M.K., Shukla, V.K. and Shuaib, M., 2014. Microemulsions: current
trends in novel drug delivery systems. J Pharm Chem Biol Sci, 1(1), pp.39-51.
45. Kumar, K.S., Dhachinamoorthi, D., Saravanan, R., Gopal, U. and Shanmugam, V., 2011.
Microemulsions as carrier for novel drug delivery: a review. Structure, 10(2), p.007.
46. Gurram, A.K., Deshpande, P.B., Kar, S.S., Nayak, U.Y., Udupa, N. and Reddy, M.S.,
2015. Role of components in the formation of self-microemulsifying drug delivery sys-
tems. Indian journal of pharmaceutical sciences, 77(3), p.249.

119997290027 / Gujarat Technological University Page 50
CHAPTER 2 Literature Review
47. Hegde, R.R., A. Verma, and A. Ghosh, 2013..Microemulsion: new insights into the ocular
drug delivery. ISRN pharmaceutics
48. Mohamed, A.I., Sultan, A.S., Hussein, I.A. and Al-Muntasheri, G.A., 2017. Influence of
surfactant structure on the stability of water-in-oil emulsions under high-temperature
high-salinity conditions. Journal of Chemistry.
49. Sahoo, R.K., Biswas, N., Guha, A., Sahoo, N. and Kuotsu, K., 2014. Nonionic surfactant
vesicles in ocular delivery: innovative approaches and perspectives. BioMed research in-
ternational.
50. Ibrahim, S.S., 2019. The Role of Surface Active Agents in Ophthalmic Drug Delivery: A
Comprehensive Review. Journal of pharmaceutical sciences.
51. Souto, E.B., Dias-Ferreira, J., López-Machado, A., Ettcheto, M., Cano, A., Camins
Espuny, A., Espina, M., Garcia, M.L. and Sánchez-López, E., 2019. Advanced Formula-
tion approaches for Ocular Drug Delivery: State-Of-The-Art and Recent Patents. Pharma-
ceutics, 11(9), p.460.
52. Noecker, R., 2001. Effects of common ophthalmic preservatives on ocular health. Ad-
vances in therapy, 18(5), pp.205-215.
53. Hegde, R.R., Bhattacharya, S.S., Verma, A. and Ghosh, A., 2014. Physicochemical and
pharmacological investigation of water/oil microemulsion of non-selective beta blocker
for treatment of glaucoma. Current eye research, 39(2), pp.155-163.
54. Gallarate, M., Gasco, M.R. and Trotta, M., 1998. Influence of octanoic acid on membrane
permeability of timolol from solutions and from microemulsions.

119997290027 / Gujarat Technological University Page 51
CHAPTER 2 Literature Review
55. Gallarate, M.M.R.M.P.M.F., Gasco, M.R., Trotta, M., Chetoni, P. and Saettone, M.F.,
1993. Preparation and evaluation in vitro of solutions and o/w microemulsions containing
levobunolol as ion-pair. International journal of pharmaceutics, 100(1-3), pp.219-225.
56. Haβe, A. and Keipert, S., 1997. Development and characterization of microemulsions for
ocular application. European Journal of Pharmaceutics and Biopharmaceutics, 43(2),
pp.179-183.
57. Alany, R.G., Rades, T., Nicoll, J., Tucker, I.G. and Davies, N.M., 2006. W/O microemul-
sions for ocular delivery: Evaluation of ocular irritation and precorneal retention. Journal
of controlled release, 111(1-2), pp.145-152.
58. Chan, J., El Maghraby, G.M., Craig, J.P. and Alany, R.G., 2007. Phase transition water-
in-oil microemulsions as ocular drug delivery systems: in vitro and in vivo evaluation. In-
ternational journal of pharmaceutics, 328(1), pp.65-71.
59. Li, C.C., Abrahamson, M., Kapoor, Y. and Chauhan, A., 2007. Timolol transport from
microemulsions trapped in HEMA gels. Journal of colloid and interface science, 315(1),
pp.297-306
60. Kalam MA, Alshamsan A, Aljuffali IA, Mishra AK, Sultana Y. Delivery of gatifloxacin
using microemulsion as vehicle: formulation, evaluation, transcorneal permeation and
aqueous humor drug determination. Drug delivery. 2016 Mar 23;23(3):886-97.
61. Üstündag-Okur, N., Gökçe, E.H., Eğrilmez, S., Özer, Ö. and Ertan, G., 2014. Novel of-
loxacin-loaded microemulsion formulations for ocular delivery. Journal of Ocular Phar-
macology and Therapeutics, 30(4), pp.319-332.
62. Bharti, S.K. and Kesavan, K., 2017. Phase-transition W/O Microemulsions for ocular de-
livery: Evaluation of antibacterial activity in the treatment of bacterial keratitis. Ocular
immunology and inflammation, 25(4), pp.463-474.

119997290027 / Gujarat Technological University Page 52
CHAPTER 2 Literature Review
63. Fialho, S.L. and Da Silva‐Cunha, A., 2004. New vehicle based on a microemulsion for
topical ocular administration of dexamethasone. Clinical & experimental ophthalmology,
32(6), pp.626-632.
64. Kesavan, K., Kant, S., Singh, P.N. and Pandit, J.K., 2013. Mucoadhesive chitosan-coated
cationic microemulsion of dexamethasone for ocular delivery: in vitro and in vivo evalua-
tion. Current eye research, 38(3), pp.342-352.
65. Kesavan, K., Pandit, J.K., Kant, S. and Muthu, M.S., 2013. Positively charged microemul-
sions of dexamethasone: comparative effects of two cosurfactants on ocular drug delivery
and bioavailability. Therapeutic delivery, 4(11), pp.1385-1395.
66. El Maghraby, G.M. and Bosela, A.A., 2011. Investigation of self-microemulsifying and
microemulsion systems for protection of prednisolone from gamma radiation. Pharmaceu-
tical development and technology, 16(3), pp.237-242.
67. Buech G, Bertelmann E, Pleyer U, Siebenbrodt I, Borchert HH. Formulation of sirolimus
eye drops and corneal permeation studies. Journal of ocular pharmacology and therapeu-
tics. 2007 Jun 1;23(3):292-303.
68. Silva-Cunha, A., da Silva, G.R., de Castro, W.V. and Fialho, S.L., 2014. Evaluation of the
pharmacokinetics and ocular tolerance of a microemulsion containing tacrolimus. Journal
of Ocular Pharmacology and Therapeutics, 30(1), pp.59-65.
69. Baspinar, Y., Bertelmann, E., Pleyer, U., Buech, G., Siebenbrodt, I. and Borchert, H.H.,
2008. Corneal permeation studies of everolimus microemulsion. Journal of ocular pharma-
cology and therapeutics, 24(4), pp.399-402.
70. Kapoor, Y. and Chauhan, A., 2008. Ophthalmic delivery of Cyclosporine A from Brij-97
microemulsion and surfactant-laden p-HEMA hydrogels. International journal of pharma-
ceutics, 361(1-2), pp.222-229.

119997290027 / Gujarat Technological University Page 53
CHAPTER 2 Literature Review
71. PubchemBank: Ebatine(Online) .Available: https://pubchem.ncbi.nlm.nih.gov/compound/
Ebastine .[Accessed November 12, 2019].
72. Drug Bank: Ebastine. (Online). Available: https://www.drugbank.ca/drugs/DB11742.
[Accessed November 01, 2019].
73. Wedi, B., Fuchs, T., Kleine-Tebbe, J., Mosges, R. and Ring, J., 2004. Ebastine-review of
the efficacy and safety profile of a nonsedating antihistamine.
74. Rico, S., Antonijoan, R.M. and Barbanoj, M.J., 2009. Ebastine in the light of CONGA
recommendations for the development of third-generation antihistamines. Journal of
asthma and allergy, 2, p.73.
75. Delivery-Technologies/12092913-Capmul-MCM-EP-NF, Available:
https://www.americanpharmaceuticalreview.com/25280-Pharmaceutical-Drug- [Accessed
September 29, 2019].
76. Shabaik Y, Jiao J, Pujara C, inventors; Allergan Inc, assignee. Self-emulsifying drug de-
livery (sedds) for ophthalmic drug delivery. United States patent application US
15/554,983. 2018 Feb 8.
77. Drug Bank: Tween 80. (Online). Available: https://www.drugbank.ca/drugs/DB11063
[Accessed November 12, 2019].
78. Sahoo, R.K., Biswas, N., Guha, A., Sahoo, N. and Kuotsu, K., 2014. Nonionic surfactant
vesicles in ocular delivery: innovative approaches and perspectives. BioMed research in-
ternational, 2014.
79. Jiao, J., 2008. Polyoxyethylated nonionic surfactants and their applications in topical ocu-
lar drug delivery. Advanced drug delivery reviews, 60(15), pp.1663-1673.

119997290027 / Gujarat Technological University Page 54
CHAPTER 2 Literature Review
80. Shah, J., Nair, A.B., Jacob, S., Patel, R.K., Shah, H., Shehata, T.M. and Morsy, M.A.,
2019. Nanoemulsion Based Vehicle for Effective Ocular Delivery of Moxifloxacin Using
Experimental Design and Pharmacokinetic Study in Rabbits. Pharmaceutics, 11(5), p.230.
81. Liu, Z., Zhang, X., Li, J., Liu, R., Shu, L. and Jin, J., 2009. Effects of Labrasol on the cor-
neal drug delivery of baicalin. Drug delivery, 16(7), pp.399-404.
82. Moiseev, R.V., Morrison, P.W., Steele, F. and Khutoryanskiy, V.V., 2019. Penetration
enhancers in ocular drug delivery. Pharmaceutics, 11(7), p.321.
83. Gupta, A., Nayak, K. and Misra, M., 2019. Cow ghee fortified ocular topical microemul-
sion; in vitro, ex vivo, and in vivo evaluation. Journal of microencapsulation, 36(7),
pp.603-621.
84. Habib F, El-Mahdy M, Maher S. Microemulsions for ocular delivery: evaluation and
characterization. Journal of Drug Delivery Science and Technology. 2011 Jan
1;21(6):485-9
85. Bodkhe, A.A., Bedi, R.S., Upadhayay, A. and Kale, M.K., 2018. Ophthalmic Microemul-
sion: Formulation Design and Process Optimization. Research Journal of Pharmacy and
Technology, 11(12), pp.5474-5482.
86. Salzillo, R., Schiraldi, C., Corsuto, L., D‗Agostino, A., Filosa, R., De Rosa, M. and La
Gatta, A., 2016. Optimization of hyaluronan-based eye drop formulations. Carbohydrate
polymers, 153, pp.275-283.
87. Wagh, V.D., Inamdar, B. and Samanta, M.K., 2014. Polymers used in ocular dosage form
and drug delivery systems. Asian Journal of Pharmaceutics (AJP): Free full text articles
from Asian J Pharm, 2(1).

119997290027 / Gujarat Technological University Page 55
CHAPTER 2 Literature Review
88. Zambito, Y. and Di Colo, G., 2011. Polysaccharides as excipients for ocular topical for-
mulations. Biomaterials Applications for Nanomedicine; Pignatello, R., Ed.; In Tech: Ri-
jeka, Croatia, pp.253-280.
89. Epstein, S.P., Ahdoot, M., Marcus, E. and Asbell, P.A., 2009. Comparative toxicity of
preservatives on immortalized corneal and conjunctival epithelial cells. Journal of ocular
pharmacology and therapeutics, 25(2), pp.113-119.
90. Noecker, R., 2001. Effects of common ophthalmic preservatives on ocular health. Ad-
vances in therapy, 18(5), pp.205-215.
91. Walsh, K. and Jones, L., 2019. The use of preservatives in dry eye drops. Clinical oph-
thalmology (Auckland, NZ), 13, p.1409.

119997290027 / Gujarat Technological University Page 56
CHAPTER 3 Materials and Methods
CHAPTER 3
Materials and Methods
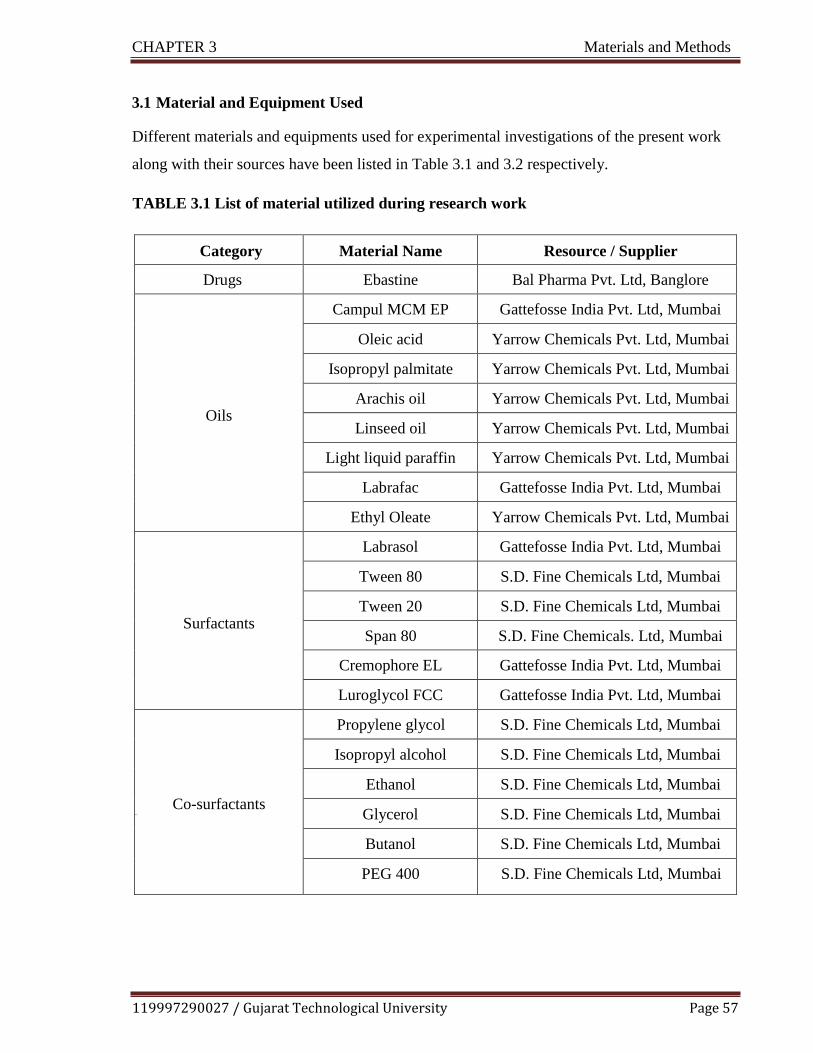
119997290027 / Gujarat Technological University Page 57
CHAPTER 3 Materials and Methods
3.1 Material and Equipment Used
Different materials and equipments used for experimental investigations of the present work
along with their sources have been listed in Table 3.1 and 3.2 respectively.
TABLE 3.1 List of material utilized during research work
Category Material Name Resource / Supplier
Drugs Ebastine Bal Pharma Pvt. Ltd, Banglore
Oils
Campul MCM EP Gattefosse India Pvt. Ltd, Mumbai
Oleic acid Yarrow Chemicals Pvt. Ltd, Mumbai
Isopropyl palmitate Yarrow Chemicals Pvt. Ltd, Mumbai
Arachis oil Yarrow Chemicals Pvt. Ltd, Mumbai
Linseed oil Yarrow Chemicals Pvt. Ltd, Mumbai
Light liquid paraffin Yarrow Chemicals Pvt. Ltd, Mumbai
Labrafac Gattefosse India Pvt. Ltd, Mumbai
Ethyl Oleate Yarrow Chemicals Pvt. Ltd, Mumbai
Surfactants
Labrasol Gattefosse India Pvt. Ltd, Mumbai
Tween 80 S.D. Fine Chemicals Ltd, Mumbai
Tween 20 S.D. Fine Chemicals Ltd, Mumbai
Span 80 S.D. Fine Chemicals. Ltd, Mumbai
Cremophore EL Gattefosse India Pvt. Ltd, Mumbai
Luroglycol FCC Gattefosse India Pvt. Ltd, Mumbai
Co-surfactants
Glyc
Propylene glycol S.D. Fine Chemicals Ltd, Mumbai
Isopropyl alcohol S.D. Fine Chemicals Ltd, Mumbai
Ethanol S.D. Fine Chemicals Ltd, Mumbai
Glycerol S.D. Fine Chemicals Ltd, Mumbai
Butanol S.D. Fine Chemicals Ltd, Mumbai
PEG 400 S.D. Fine Chemicals Ltd, Mumbai
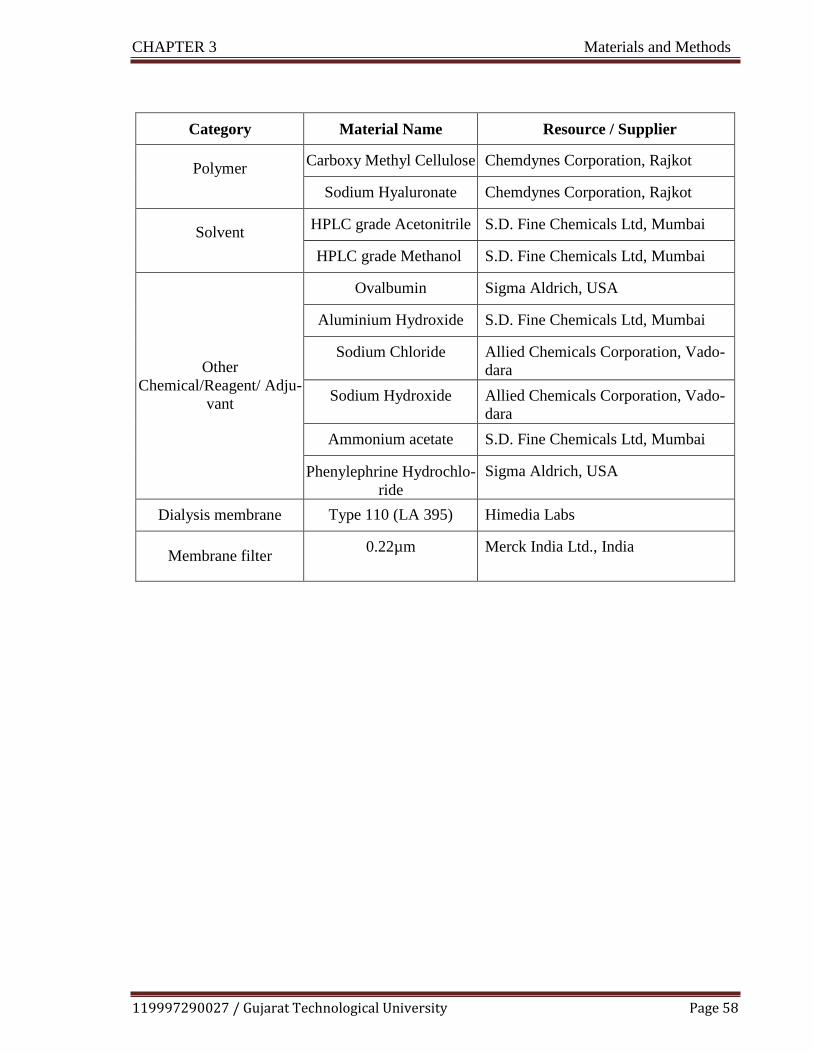
119997290027 / Gujarat Technological University Page 58
CHAPTER 3 Materials and Methods
Category Material Name Resource / Supplier
Polymer Carboxy Methyl Cellulose Chemdynes Corporation, Rajkot
Sodium Hyaluronate Chemdynes Corporation, Rajkot
Solvent HPLC grade Acetonitrile S.D. Fine Chemicals Ltd, Mumbai
HPLC grade Methanol S.D. Fine Chemicals Ltd, Mumbai
Other
Chemical/Reagent/ Adju-
vant
Ovalbumin Sigma Aldrich, USA
Aluminium Hydroxide S.D. Fine Chemicals Ltd, Mumbai
Sodium Chloride Allied Chemicals Corporation, Vado-
dara
Sodium Hydroxide Allied Chemicals Corporation, Vado-
dara
Ammonium acetate S.D. Fine Chemicals Ltd, Mumbai
Phenylephrine Hydrochlo-
ride
Sigma Aldrich, USA
Dialysis membrane Type 110 (LA 395) Himedia Labs
Membrane filter 0.22µm Merck India Ltd., India
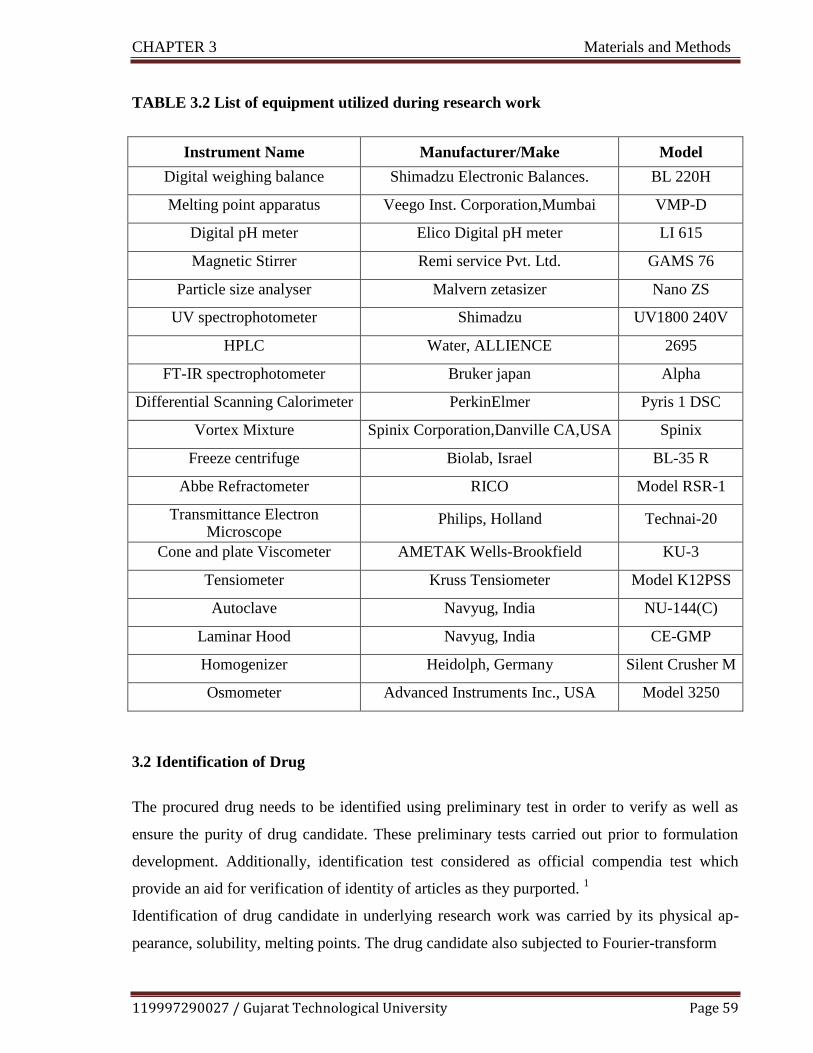
119997290027 / Gujarat Technological University Page 59
CHAPTER 3 Materials and Methods
TABLE 3.2 List of equipment utilized during research work
Instrument Name Manufacturer/Make Model
Digital weighing balance Shimadzu Electronic Balances. BL 220H
Melting point apparatus Veego Inst. Corporation,Mumbai VMP-D
Digital pH meter Elico Digital pH meter LI 615
Magnetic Stirrer Remi service Pvt. Ltd. GAMS 76
Particle size analyser Malvern zetasizer Nano ZS
UV spectrophotometer Shimadzu UV1800 240V
HPLC Water, ALLIENCE 2695
FT-IR spectrophotometer Bruker japan Alpha
Differential Scanning Calorimeter PerkinElmer Pyris 1 DSC
Vortex Mixture Spinix Corporation,Danville CA,USA Spinix
Freeze centrifuge Biolab, Israel BL-35 R
Abbe Refractometer RICO Model RSR-1
Transmittance Electron Microscope
Philips, Holland Technai-20
Cone and plate Viscometer AMETAK Wells-Brookfield KU-3
Tensiometer Kruss Tensiometer Model K12PSS
Autoclave Navyug, India NU-144(C)
Laminar Hood Navyug, India CE-GMP
Homogenizer Heidolph, Germany Silent Crusher M
Osmometer Advanced Instruments Inc., USA Model 3250
3.2 Identification of Drug
The procured drug needs to be identified using preliminary test in order to verify as well as
ensure the purity of drug candidate. These preliminary tests carried out prior to formulation
development. Additionally, identification test considered as official compendia test which
provide an aid for verification of identity of articles as they purported. 1
Identification of drug candidate in underlying research work was carried by its physical ap-
pearance, solubility, melting points. The drug candidate also subjected to Fourier-transform

119997290027 / Gujarat Technological University Page 60
CHAPTER 3 Materials and Methods
infrared (FT-IR) spectroscopic study as well as differential scanning calorimetry (DSC) study.
3.2.1 Physical Appearance of Drug
The drug candidate was visually observed for physiochemical properties like color, odour, and
physical state then after compared with the reported same parameters of drug.2
3.2.2 Melting Point
Melting point is prime recognition/identification test for several organic substances.
3 The
melting point of drug candidate was determined by using melting point apparatus. The thin
walled capillary tube which is closed at its one end was filled with small amount of drug sam-
ple and kept in the melting point apparatus. The apparatus was programmed to increase the
temperature gradually. The temperatures range over which drug sample melt was observed
and reported.
3.2.3 Solubility
Solubility test was carried as a test for purity. Quantitative solubility of drug was determined
in water and methanol. For this, 10 mg drug sample was taken in a clean test tube, diluted with
solvent by 0.1 ml increment with continuous shaking.4 The solvent requirement for complete
solubilization of drug sample was noted and the solubility was compared with reported values.
3.2.4 FT-IR Study
Fourier transform infrared (FT-IR) spectroscopy is vital tool for characterization of pharma-
ceutical solids in their solid state.5 The identification of the drug sample was carried using Al-
pha Bruker FTIR spectrophotometer. The sample was prepared by KBr pellets technique. The
pellet was prepared with previously uniform mixer of drug sample and potassium bromide in
ratio of 1:20 in mortar pestle, further the mixture compressed at 20 psi for 10 min using KBr
press. The pellet was kept in sample compartment and scanned at transmission mode in the
region of 4000-400 cm-1
.6 The resultant IR spectrum of drug sample was compared with

119997290027 / Gujarat Technological University Page 61
CHAPTER 3 Materials and Methods
standard spectrum of drug.
3.2.5 Differential Scanning Calorimetry
The Differential scanning calorimetry (DSC) study performed to determine thermal behavior
of pure drug ebastine, physical mixture of drug with polymers.7 The study was carried using
PerkinElmer Pyris 1 DSC. The samples were sealed in aluminium pans, heated in a nitrogen
atmosphere and thermograms obtained at heating rate 10.000C/min in the range of 50.00
0C to
300.000C.
3.3 Analytical Method
Adequate analytical method development is of prime concern, when it comes to active ingre-
dient or drug content quantification. Beside this, analytical method also required at different
stages of formulation development like preformulation, evaluation and in vitro-in vivo quanti-
fication. At preformulation stage, it was used for selection of excipients. The suitable analyti-
cal method was not only needed for the in vitro drug release study but also for determination
of active ingredient in biological sample. The available method should be accurate, precise
and convenient while the developed method should be additionally validated for different ana-
lytical parameters.
3.3.1 Estimation of Ebastine using UV Spectrophotometry
For the estimation of ebastine in theformulations, UV spectrophotometric methods were alread
y reported in the literature.8-9
Calibration curves were plotted in methanol and methanolic
phosphate –buffered saline (PBS, pH 7.4, 30% v/v) using UV- 1800 spectrophotometer (Shi-
madzu) at 252 nm. The former used for selection of excipients in formulation design, drug
content determination and the later was used for in- vitro release study of formulation.
3.3.1.1 Calibration Curve of Ebastine in Methanol as a Solvent
The calibration curve of ebastine in methanol as a solvent found application in drug content
determination, excipients selection and stability sample analysis.
119997290027 / Gujarat Technological University Page 62
CHAPTER 3 Materials and Methods
Preparation of stock solution
Accurately weighed 10 mg of ebastine was transferred to 100 ml volumetric flask. The drug
sample dissolved and volume was made up with methanol up to the mark in order to obtain
stock solution of 100µg/ml.
Preparation of solution for calibration plot
Aliquots of the stock solution of ebastine in methanol (0.2, 0.4, 0.6, 0.8, 1ml) were accurately
pippeted out into 10 ml volumetric flasks and were diluted with methanol up to mark in order
to obtain final concentration in the range of 2-10 μg /ml. The working λmax of drug sample
was determined by scanning in the range of 200-400 nm. The UV absorption of previously
freshly prepared solutions of calibration plot was noted at λmax. The experimental protocol
carried out in triplicate. Mean value of the absorbance (n=3) verses concentration plotted to
obtain calibration curve using drug free solvent as a blank to avoid solvent effect.
3.3.1.2 Calibration Curve of Ebastine in Methanolic Phosphate Buffered Saline (PBS, pH
7.4, 30% v/v)
Preparation of Phosphate –buffered saline pH 7.410
1.44 g of disodium hydrogen phosphate, 0.24 g of potassium dihydrogen phosphate, 8.02 g of
sodium chloride and 0.2 gm potassium chloride was dissolved in sufficient water to produce
1000 ml.
Preparation of stock solution
Accurately weighed 10 mg of ebastine was transferred to 100 ml volumetric flask. The drug
sample dissolved and volume was made up with methanolic PBS (pH 7.4, 30% v/v) up to the
mark in order to obtain stock solution of 100µg/ml.
119997290027 / Gujarat Technological University Page 63
CHAPTER 3 Materials and Methods
Preparation of solution for calibration plot
Aliquots of the stock solution of ebastine in methanolic phosphate buffer (1, 1.5, 2, 2.5, 3ml)
were accurately pippetted out into 10 ml volumetric flasks and were diluted with methanol up
to mark in order to obtain final concentration in the range of 10-30 μg /ml. The working λmax
of drug sample was determined by scanning in the range of 200-400 nm. The UV absorption
of previously freshly prepared solutions of calibration plot was noted at λmax. The experi-
mental protocol carried out in triplicate. Mean value of the absorbance (n=3) verses concentra-
tion plotted to obtain calibration curve using drug free methanolic PBS (pH 7.4) as a blank to
avoid solvent effect.
3.3.2 High Performance Liquid Chromatography (HPLC) Method Development and
Validation
High performance liquid chromatography (HPLC) method was developed and validated using
HPLC with UV detectors. (Water, ALLIENCE, 2695) for determination of concentration of
ebastine in ocular tissue matrix and plasma for pharmacokinetic/ ocular tissue distribution
studies. Phenylephrine hydrochloride was used as an internal standard (ISTD) in the said
study.
Preparation of Standard solution
Accurately weighed quantity of 100 mg of ebastine was transferred into 100 ml volumetric
flask. Dissolved and diluted up to the mark with methanol. It gave standard stock solution with
strength of 1000 µg/ml of ebastine. From the standard stock solution (1000 µg/ml), 10 ml of
aliquot was pipetted out and transferred into 100 ml volumetric flask and diluted up to mark
with methanol. It gave working stock solution with strength 100µg/ml of ebastine. From the
working stock solution (100 µg/ml), 1 ml of aliquot was pipetted out and transferred into 10
ml volumetric flask and diluted up to mark with methanol. It gave working stock solution hav-
ing strength of 10 µg/ml of ebastine.

119997290027 / Gujarat Technological University Page 64
CHAPTER 3 Materials and Methods
Preparation of Internal standard solution
Accurately weighed quantity of 100 mg of Phenylephrine HCl (ISTD) was transferred into
100 ml volumetric flask. Dissolved and diluted up to the mark with methanol. It gave stock
solution with strength of 1000 µg/ml of ISTD. From the standard stock solution (1000 µg/ml),
10 ml of aliquot was pipetted out and transferred into 100 ml volumetric flask and diluted up
to mark with methanol. It gave working stock solution with strength of 100µg/ml of ISTD.
From the working stock solution (100 µg/ml), 0.025 ml of aliquot was pipetted out and trans-
ferred into 10 ml volumetric flask and diluted up to mark with methanol. It gave working
stock solution having strength of 0 . 2 5 µg/ml of ISTD.
Preparation of Quality control samples
Quality control samples like LQC, MQC and HQC were prepared by taking the suitable ali-
quots of from the stock solutions of 100 µg/ml of ebastine and final volume make upto 10 ml
with methanol.
3.3.2.1 Analytical Method Development
Standard solution of ebastine and phenylephrine HCL were scanned in the range of 200-400
nm for determination of detection wavelength in HPLC. Different HPLC trial runs were taken
by varying the columns, mobile phase, mobile phase pH, flow rate at selected λmax for optimi-
zation of analytical method to get properly resolved peaks with suitable and appropriate reten-
tion time.
Optimization of chromatographic conditions
Selection of Internal Standard
Various trials for selection of internal standards like pheniramine maleate, fexofenadine hy-
drochloride, and montelukast etc conducted for development of analytical method for estima-
tion ebastine in tissue matrix but their peaks were not shown or not resolved properly at detec-
tion wavelength of ebastine. Of all trials, phenylephrine HCL was selected as an internal
standard as it shown better resolution with peak symmetry.

119997290027 / Gujarat Technological University Page 65
CHAPTER 3 Materials and Methods
Procedure for extraction of drug from ocular tissue matrix
Drug content in ocular tissues was determined after the extraction of the drug from the tissues
by liquid-liquid extraction. An excised ocular tissue subjected to homogenization with acetoni-
trile in 1:5 ratio at 2000 rpm using Silent crusher M homogenizer. The lysed samples were
centrifuged for 10,000 rpm at 40C for 10 min. A 500 µl ocular tissue sample was aliquoted in-
to 5ml eppendorf tube. To it 50µl ISTD was added, required volume of standard solution of
required concentration was spiked. All samples were treated with different protein precipitat-
ing solvents and subjected to vortexing for 2 min and centrifuged at 5000 RPM for 10 min at
4ºC. The supernant was carefully separated, transferred to test tube and injected in to HPLC
system.11-12
Procedure for extraction of drug from plasma
Based on the method developed by Kadam et.al, for extraction of ebastine from rat plasma,
liquid-liquid extraction method was used. A 500 µl aliquot of plasma sample was mixed with
50 µl of ISTD working solution and required concentration standard solution of drugs was
spiked. To this, 1 ml of acetonitrile was added. Resulting solution was mixed on vortex mixer
for 2 min followed by centrifugation at 5000 rpm for 10min at 4ºC. The supernant was careful-
ly separated, transferred to test tube and injected to HPLC system.13-14
Bioanalysis of ebastine by RP-HPLC method in ocular tissue matrix and plasma
The chromatographic separation was achieved on Waters X-Terra Shield, Phenomenex C18
(250 mm x 4.5 mm, 5 µm particle size) equipped with guard column. The mobile phase con-
sisted of Methanol: Acetonitrile: Ammonium acetate buffer (80:10:10), 5.5 pH adjusted with
glacial acetic acid. The HPLC system was operated at a flow rate of 1.2 ml/min in the isocratic
mode and 244nm was used as a detection wavelength. Mobile phase utilized for bioanalytical
method for estimation of ebastine in tissue is tried for plasma. All the peaks were resolved
with all the system suitability parameters in limit hence the same method was validated in
plasma.

119997290027 / Gujarat Technological University Page 66
CHAPTER 3 Materials and Methods
3.3.2.2 Analytical Method Validation
The bioanalytical method was validated as per ICH guidelines. The validation parameters in-
clude linearity, precision, accuracy, specificity and robustness. Data obtained were analyzed
statistically.15-16
a. Linearity and Range
The linearity for developed HPLC method was established in the range of 3-400 ng/ml of
ebastine (3, 6, 20, 60,200,300,360,400 ng/ml). The concentration of phenylephrine hydrochlo-
ride taken as internal standard was 1 μg /ml. All the experimental trials were replicated thrice.
The linearity regression analysis of the area ratios (analyte /internal standard) Vs. concentra-
tion curve was obtained. The correlation coefficient value used for verification of the linearity.
b. Precision
Precision was determined by replicate analysis of five determinations of three concentration
levels LQC, MQC and HQC. These QC samples were analyzed against the calibration curve
and obtained concentrations compared with the nominal value. The precision was evaluated as
intraday precision and interday precision. The % coefficient of variation (% CV) was calculat-
ed as per following equation.
Intra-day precision: Five replicates of three different concentrations, (LQC, MQC and HQC)
total 15 determinations were analyzed on a single day.
Inter-day precision: Five replicates of three different concentrations, (LQC, MQC and HQC)
total 15 determinations were analyzed on three consecutive days.
c. Accuracy
Accuracy was determined as intraday and interday analysis of five replicates of three concen-
tration levels of LQC, MQC and HQC. These QC samples were prepared from separately pre-

119997290027 / Gujarat Technological University Page 67
CHAPTER 3 Materials and Methods
pared stock solutions. They are analyzed against the calibration curve and mean concentra-
tions compared with the nominal value. % Accuracy was calculated as per following equation.
Intra-day precision: Five replicates of three different concentrations, (LQC, MQC and HQC)
total 15 determinations were analyzed on a single day.
Inter-day precision: Five replicates of three different concentrations, (LQC, MQC and HQC)
total 15 determinations were analyzed on three consecutive days.
d. Sensitivity
Sensitivity was carried out by injecting repeatedly Lower Limit of Quantification (LLOQ)
which is the lowest concentration of the standard curve and that can be measured with ac-
ceptable accuracy and precision. The 6 replicates of extracted LLOQ samples (mixture of
0.003 and 0.025µg/ml of ebastine and phenylephrine respectively) were injected repeatedly at
the same chromatographic condition and measurements of retention time, peak area, mean and
%CV were calculated.
e. Extraction Recovery
Recoveries of ebastine and internal standard were determined at 3 concentration levels, HQC,
MQC and LQC. % Recovery of analyte and internal standard were determined after pro-
cessing and inject 6 replicates of QC samples (Extracted samples) and unextracted at same
chromatographic condition. The % recovery was calculated by comparing extracted and unex-
tracted area response of analyte and internal standard as per following equation.
% Recovery = Mean of area ratio of extracted sample × 100
Mean of area ratio of post extracted spiked sample
f. Robustness
The robustness of the analytical procedure was measured from its capacity to remain unaffect-
ed by small but deliberate variations in method parameters like wavelength change (+ 2)

119997290027 / Gujarat Technological University Page 68
CHAPTER 3 Materials and Methods
which provided an indication of its reliability during its normal usage.
g. Stability
Short term stability, freeze thaw stability, long term stability and stock solution stability were
performed as per USFDA Guidelines. Short term stability of drugs was determined by com-
paring the mean area ratio of fresh solutions of five replicates of LQC and HQC and stability
samples after 6 hours. Dilutions were stored at room temperature. Stability solutions were in-
jected and analyze against fresh QC samples. For Freeze thaw stability, five replicates of
LQC and HQC were stored in deep freezer for 24 hours and after that thawed it unassisted at
bench top (FT Cycle -1). Refreeze the samples after complete thawing. Withdraw these sam-
ples after a period of minimum of 12 hours and thawed (FT Cycle-2) Refreeze the samples
after complete thawing. Again withdraw these samples after a period of minimum of 12 hours
and after thawing (FT Cycle-3) the samples were analyzed. QC samples were processed and
analyzed, along with freshly prepared calibration curve standards.
Long-term stability is performed to assess the stability of analyte in biological fluids during its
storage in deep freezer below -50°C. It was determined by comparing the mean concentration
of five replicates of LQC and HQC from the freshly prepared calibration curve and stability
samples those that were kept in deep freezer. The stability of stock solutions of drug and the
internal standard should be evaluated for at least 6 hours at room temperature and at refriger-
ated condition (2-8˚C) for 7 days.
h. System suitability
System suitability is the test for checking the system to ensure system performance prior to or
during the analysis of unknown sample. For system suitability test, six replicates of drug sam-
ples were run and repeatability with the parameters like theoretical plate count, tailing factors,
resolution and reproducibility in retention time (RT) were determined. The % RSD was calcu-
lated.
i Statistical Analysis
The experimental data obtained were statistically assessed with the aid of Microsoft Excel.
Linearity was checked by determination of standard deviation, correlation coefficient and line-

119997290027 / Gujarat Technological University Page 69
CHAPTER 3 Materials and Methods
ar regression equation. Moreover, accuracy of the developed analytical method was assessed
by % recovery method, standard deviation (SD) and relative standard deviation (% RSD) and
confirmed the precision, robustness, etc. Intraday and interday precision was statistically ana-
lyzed by utilizing ANOVA from Analysis Toolpak, Microsoft Excel. Signal-to-noise ratios
were determined for determination of LOD and LOQ.
3.4 Screening of Components of Microemulsion Formulation17
The major components for microemulsion system include drug, surfactants, and cosurfactants.
Followed by identification of drug, various formulation materials were screened for their suit-
ability for proposed system. The screening of these materials based on maximum solubility of
the drug. Beside, safety profile, compatibility and approval status were also taken into consid-
eration.
3.4.1 Selection of Oil
The solubility of ebastine in different oils was determined by adding excess amount of the
drug to 1 ml of oil in separate stopper glass vials and mixing by vortex mixture. The resultant
mixture was then shaken for 24 hr. in an orbital shaker at 37±20C to reach equilibrium. The
equilibrated samples were removed from the shaker and subjected to centrifugation for 20 min
at 3000 RPM. The aliquots of supernatant were filtered through 0.45 μm membrane filters and
the solubility of ebastine was determined by analyzing the filtrate spectrophotometrically
(Shimadzu 1800, Japan) after dilution with methanol at 252 nm. Appropriately diluted solu-
tions of oils in methanol were taken as blank.
3.4.2 Selection of Surfactants
The selection of surfactants mainly depends on the HLB value, non irritancy and compatibility
of surfactants with each other and oil. The solubility of ebastine in different surfactants was
determined by adding excess amount of the drug to 1 ml of surfactants in separate stopper
glass vials and mixing by vortex mixture. The resultant mixture was then shaken for 24 hr. in
an orbital shaker at 37±20C to reach equilibrium. The equilibrated samples were removed from
the shaker and subjected to centrifugation for 20 min at 3000 RPM. The aliquots of superna-

119997290027 / Gujarat Technological University Page 70
CHAPTER 3 Materials and Methods
tant were filtered through 0.45 μm membrane filters and the solubility of ebastine was deter-
mined by analyzing the filtrate spectrophotometrically (Shimadzu 1800, Japan) after dilution
with methanol at 252 nm. Appropriately diluted solutions of surfactants in methanol were tak-
en as blank.
3.4.3 Selection of Co-surfactants
Selection of co-surfactant is based on their capability to form the stable micro-emulsion with
the selected surfactant at minimum concentration. The solubility of ebastine in different co
surfactants was determined by adding excess amount of the drug to 1 ml of co surfactants in
separate stopper glass vials and mixing by vortex mixture. The resultant mixture was then
shaken for 24 hr. in an orbital shaker at 37±20C to reach equilibrium. The equilibrated samples
were removed from the shaker and subjected to centrifugation for 20 min at 3000 RPM. The
aliquots of supernatant were filtered through 0.45 μm membrane filters and the solubility of
ebastine was determined by analyzing the filtrate spectrophotometrically (Shimadzu 1800, Ja-
pan) after dilution with methanol at 252 nm. Appropriately diluted solutions of co-surfactants
in methanol were taken as blank.
3.4.4 Drug Excipients Compatibility Study
Drug excipients compatibility study was performed to ensure the physical and chemical com-
patibility of components of formulation. The screened components of formulation surfactants,
cosurfactants were considered for further development only if physically and chemically com-
patibility with drug was observed.
FT-IR spectra of pure drug , drug with oil/surfactants/co surfactants, drug with polymers
stored at 25 ± 2 0 C, 60% ±5% relative humidity for a period of 7 days were recorded in the
range of 4000-400 cm-1
using FT-IR Spectrophotomer (Bruker Alpha-one, Bruker Optik,
Germany).18-19
A FT-IR spectrum gives the identification of specific functional group and so
that from this any chemical incompatibility if occurred can be easily identified by change or
shift in the peak of specific functional groups of drug.
3.5 Construction of Pseudo- Ternary Phase Diagrams
Pseudo ternary phase diagrams were used to determine the existence of microemulsion region.

119997290027 / Gujarat Technological University Page 71
CHAPTER 3 Materials and Methods
After selection of appropriate microemulsion components, the pseudo ternary phase diagrams
were constructed to identify the nature of microemulsion regions at ambient temperature
(25°C). Large number of batches of different composition must be prepared to construct the
phase diagram. Pseudo-ternary phase diagrams were constructed using previously screened
components by Prosim software.20
Various phase diagrams were prepared with weight ratios
of surfactant to cosurfactant (Smix) individual and blend system. Individual Smix system con-
sist of Labrasol and Propylene glycol while blend Smix system consist of mixture of two sur-
factants viz. Labrasol and Tween 80 as well as mixture of two co- surfactants viz. Propylene
glycol and Glycerol. Double distilled water was used as an aqueous phase. The selected indi-
vidual Smix ratio (2:1) was further studied by blend Smix ratios 2(1:1):1, using mixtures of
surfactants and 2(1:1): 1(1:1), using mixtures of surfactants and co-surfactants. The Smix
blend ratio which produced broader microemulsion region was selected for formulation opti-
mization. This attempt was made to keep the surfactants concentration as low as possible in
the ophthalmic formulation to avoid any associated toxicity and ensure eye fitting. A blend of
surfactants with an HLB that matches that of the oil phase will provide better solubilization
and stability of the dispersion system produced.21
For each phase diagram at a specific surfac-
tant/cosurfactant weight ratio, the ratios of oil to the mixture of surfactant and cosurfactant
were varied as 1:9, 2:8, 3:7, 4:6, 5:5, 6:4, 7:3, 8:2, 9:1. The mixtures of oil, surfactant and
cosurfactant at certain weight ratios were diluted with water drop wise, under moderate mag-
netic stirring. After being equilibrated, the mixtures were assessed visually and determined as
being microemulsion, crude emulsions or gels. Gels were defined for those clear and highly
viscous mixtures that failed to show any change in the meniscus after tilted to an angle of 90°.
The concentration of water at which transparency to turbidity transition occurred was derived
from the weight measurement. These obtained values further used to determine the boundaries
of the microemulsion domain corresponding to the value of oil, as well as surfactants and co
surfactants ratio.
3.6 Preparation of Drug Loaded Microemulsion
Based on the solubility data, Capmul MCM EP, Tween 80 and Labrasol, Propylene Glycol
and Glycerol were selected as oil, surfactant blend and co-surfactant blend respectively. The
microemulsion was prepared by water titration method. The following scheme was used to

119997290027 / Gujarat Technological University Page 72
CHAPTER 3 Materials and Methods
Drug dissolved in an appropriate quantity of oil phase
In this mixture, add weighed quantity of mixture of surfactant and co-surfactant (Smix)
Double distilled water was added drop by drop to the oil and Smix mixture under magnetic stirring at ambient temperature.
Transparent and clear microemulsion was taken as the end point of aqueous titration method.
prepared microemulsion,
3.7 Optimization of Microemulsion by D-Optimal Mixture Design
D-optimal mixture design (Design-Expert 7.0.0 (Stat-Ease Inc., Minneapolis, USA) was se-
lected because the generalized variance of the estimates of the coefficients is minimized.22
The
software selected a set of candidate points as a base design included factorial points (high and
low level from the constraints on each factor, centers of edges, constraint plane centroids, axi-
al checkpoint, and an overall center point).
It is commonly used to reveal main effects and interaction effects between the independent
variables of the experiment. Moreover, the numbers of trials required are less. Twelve runs
were carried out to optimize microemulsion formulation. Different design constraints, i.e. A
(amount of oil), B (amount of Smix), and C (amount of water) were taken at high and low lev-
els. The sum of A, B, and C were kept fixed at 100%. The effect of these formulation variables
was studied on the % Transmittance, Globule size and Viscosity. Validity of experimental de-
sign was confirmed by plotting a standard error of design graph. The probability value (α) for
determination of statistical significance was set at 0.05, which indicated that a ―hypothesis‖
theory would be rejected if their corresponding p-values were ≤ 0.05.23
Models were selected
on the basis of sequential comparison and lack of fit test. Significance of the models was fur-
ther confirmed by statistical analysis. Response surface, contour plot, residual plot and overlay
plots were constructed for the response variables.

119997290027 / Gujarat Technological University Page 73
CHAPTER 3 Materials and Methods
3.7.1 Preparation of Drug Loaded Microemulsion
The D-optimal design suggested different combinations of oil, Smix, and water. The suggested
quantity of oil and Smix was mixed using a magnetic stirrer to produce the oily phase, at this
stage the ebastine was dissolved in the oily phase. Finally aqueous phase was added drop wise
to obtain drug loaded microemulsion formulation.
3.8 Formulation and Optimization of Microemulsion Based Gel
The optimized microemulsion has very low viscosity, which may restrict its topical applica-
tion. To overcome this, gelling agents were incorporated into formulation. The ocular delivery
improved by adding mucoadhesive polymer in previously made microemulsion formulation.
The weight ratio of Carboxy methyl cellulose (CMC 1%) and Sodium Hyaluronate (SH 1.5%)
was found satisfactory based on proper gel formation. The former polymer used in commercial
ocular formulations, as it has desirable mucoadhesive and a high retention time on the ocular
surface and the latter one exhibit excellent viscoelastic, lubricating and water retention proper-
ties. The literature revealed that, this combination benefited with high viscosity under low fric-
tion conditions (between blinking) which stabilizes the tear film and low viscosity under high
friction conditions (during the blinking) which reduces discomfort in animal as well as hu-
mans.24
The microemulsion formulation made as per previously optimized formulation and processing
constraints were subjected to sterilization by membrane filter. Then after, polymer dispersion
was formed by suspending polymers in water. The polymer dispersion kept for overnight to
form viscous gel matrix. Prepared microemulsion and polymer dispersion was mixed in 1:1
v/w ratio.25
Smooth viscous, transparent gel was formed. The underlying procedure for prepa-
ration of microemulsion based gel was carried out strictly in aseptic area to maintain the steril-
ity of overall formulation.
119997290027 / Gujarat Technological University Page 74
CHAPTER 3 Materials and Methods
3.9 Evaluation of Optimized Microemulsion Formulation
3.9.1 Measurement of pH
The pH of the ocular formulation is very important for avoiding the irritation to ocular tissue.
For optimized formulation, pH was measured using pH meter (Li 615, Elico, India, Hydera-
bad) which was previously calibrated using standard buffers of pH 4 and pH 7 as per the es-
tablished procedure.26-
27
3.9.2 Droplet size, Zeta Potential and Viscosity Measurement
The droplet size of the microemulsion was determined by photon correlation spectroscopy
(which analyzes the fluctuations in light scattering due to the Brownian motion of the parti-
cles) using a Malvern zeta sizer (Nano ZS, Malvern instruments, UK), Zeta sizer able to
measure sizes between 10 and 5000 nm. The measurements were performed at 25 °C at a 90 °
angle. 28
Each size value reported was the average of at least three independent measurements.
Samples were suitably diluted with double distilled filtered water to avoid multi-scattering
phenomena and then placed in quartz cuvettes. The real and imaginary refractive indexes were
set at 1.59 and 0.0, respectively. Zeta Potential was determined by Zeta sizer (Malvern instru-
ments UK) using clear disposable zeta cell and filed strength of 20 V/cm was employed. The
electrophoretic mobility was converted into to the zeta potential. The viscosity of microemul-
sion was determined by Ostwald type capillary viscometer at room temperature.29
3.9.3 Measurement of Refractive Index
After application of eye drops, possible impairments of vision or discomfort to the patient is
detected by refractive index measurements. Refractive index indicates the isotropic behavior
of formulation and also proved the transparency of formulation. The refractive index of the
system was measured by Abbe Refractometer (RICO, Model RSR-1) by placing one drop of
the formulation on the slide in triplicate at 250C and compared it with water.
30-32

119997290027 / Gujarat Technological University Page 75
CHAPTER 3 Materials and Methods
3.9.4 Measurement of Osmolarity
Evaluation of osmolarity using an osmometer is of vital importance for physiological ac-
ceptance of the formulation by ocular tissues. Osmolarity of optimized formulation measured
using Osmometer (Advanced Instruments Inc., USA; Model 3250).32-33
3.9.5 Measurement of Surface Tension
Surface tension determination ensures the uniform spreading of the formulation on the corneal
and conjunctival surface. Surface tension of optimized formulation measured using Tensiome-
ter (Kruss Tensiometer; Dimensions: 19.900 mm*0.200mm*10.00mm, Model K12PSS).32,
34
3.9.6 Determination of Drug Content
The drug content of the optimized microemulsion formulation was determined by extracting
0.5 ml formulation containing drug equivalent to 5 mg with methanol. After suitable dilutions
with methanol, absorbance was determined using UV spectrophotometer35
(Shimadzu UV-
1800, Japan) at 252 nm.
3.9.7 Transmission Electron Microscopy
To study the microstructures of microemulsion, transmission electron microscopy is the most
important technique as it directly produces high-resolution images. It can capture any co-
existent structure and microstructural transitions36
. The morphology of formulation was per-
formed using TEM (Technai-20, Phillips, Holland, Electron source: LaB6, Tungsten Fila-
ment). A drop of sample was placed onto a carbon coated grid on a single tilt sample holder to
form a thin liquid film. The excess solution was removed followed by negative staining with
1% phophotungstic acid. The sample was examined and simultaneously photographed at an
accelerating voltage with point resolution 0.27nm and magnification up to 25x to 7, 50,000x.

119997290027 / Gujarat Technological University Page 76
CHAPTER 3 Materials and Methods
3.9.8 Measurement of % Transmittance
The microemulsion formulation was diluted (10 times dilution) with distilled water. Thereaf-
ter, transparency of formulation was determined at 650 nm with purified water taken as blank
using UV spectrophotometer.37
3.10 Evaluation of Microemulsion Based Gel
The formulated microemulsion based gel evaluated for physical examination like pH, rheolog-
ical assessment, mucoadhesive strength, drug content, spreadability and in vitro release study.
3.10.1 Measurement of pH
As discussed previously, pH of the ocular formulation is very important for avoiding the irrita-
tion to ocular tissue. The pH of 1% w/v aqueous solution of the prepared microemulsion based
gel was measured using pH meter (Li 615, Elico, India, Hyderabad) which was previously cal-
ibrated using standard buffers of pH 4 and pH 7 as per the established procedure.
3.10.2 Rheology Study
Viscosity is most important parameter for topical formulation.
38 The viscosity of the formula-
tion should be such that it not only improves the therapeutic performance of formulation but
also convenient during instillation at desired site. The rheograms of microemulsion gel and
microemulsion based gel diluted with tear fluid in a ratio of 40:7 were determined at different
shear stress using Plane and cone viscometer.39
3.10.3 Mucoadhesive Strength
The mucoadhesive force was determined using modified two-pan balance method.40
As per
the literature review, in spite of numerous studies concerning the in-vitro and in-vivo perfor-
mance of mucoadhesive drug delivery systems, surprisingly, there has not been any standard
technique designed for mucoadhesive measurement or any analytical method that can be em-
ployed to qualify mucoadhesive strength. In-vitro tests including two-pan balance method are
the most common and convenient methods to assess the mucoadhesive properties of formula-

119997290027 / Gujarat Technological University Page 77
CHAPTER 3 Materials and Methods
tions.41
In this method, one side of the balance was provided with blocks at the top for balanc-
ing and the other side had a receptacle for water. 20 µl gel test sample was applied on the per-
fectly horizontal surface and was just touched with the cellophane membrane (1 cm2) sticked
at the horizontal end opposite to that of water receptacle. Gradually water was added drop by
drop till the cellophane membrane got detached from the gel. Weight in grams of water re-
quired to separate the two surfaces was measured and mucoadhesive force was calculated us-
ing following equation,
F = w x g
Where F is the mucoadhesion force (dynes / cm2),
w is the minimum weight required to break the bond (grams), g is the
acceleration due to gravity (cm/s2).
3.10.4 Spreadability
Spreadability of the gel was determined by taking 0.5 g gel between two cellophane mem-
branes and placing 100 g weight on it for 1 minute to make simulated blinking response.42
The
diameter of the area in which the gel got spread was measured.
3.10.5 Drug Content
The drug content of the microemulsion based gel formulation was determined by extracting
formulation containing drug equivalent to 10 mg with methanol. After suitable dilutions with
methanol, absorbance was determined using UV spectrophotometer43
(Shimadzu UV-1800,
Japan) at 252 nm.
3.10.6 In vitro Drug Release Study
In-vitro drug release profile of the microemulsion and microemulsion based gel were studied
by dialysis bag/ dialysis sac technique.44,
45
In this method, microemulsion and microemulsion based gel were filled in the activated dialy-
sis bag (Dialysis membrane 110, LA 395, Himedia, 12 kDa) and suspended in a glass beaker
containing 50 ml of methanolic phosphate buffered saline (pH 7.4, 30% v/v).46
The system

119997290027 / Gujarat Technological University Page 78
CHAPTER 3 Materials and Methods
was maintained at 32 ± 0.50C to mimic physiological condition of eye surface temperature
with continuous stirring on magnetic stirrer at 150 rpm. The system was covered with paraffin
film during experiment to prevent any evaporative loss.47
At periodic time interval, the ali-
quots were withdrawn from the receptor compartment for 24 hrs. The samples were analyzed
spectrophotometrically at 254 nm. Sink condition was maintained in the receptor compartment
during in vitro release studies. Each sample analysis was performed in triplicate.
3.10.7 Kinetics of Drug Release Study
To study the release kinetics of microemulsion and microemulsion based gel formulation, re-
lease data fitted to the following equations 48-50
3.10.7.1 Zero Order Release Equation
Qt = k0.t
Where Qt is the percentage of drug released at time t and k0 is the zero order release rate con-
stant.
The Regression coefficient (R2) value of plot of amount of drug released (Qt) verses time (t),
nearer to unity indicates zero order, concentration independent release pattern.
3.10.7.2 First Order Release Equation
ln (100-Qt) = ln 100 – k1.t
Where Qt is the percentage of drug released at time t and k1 is the first order release rate con-
stant.
The Regression coefficient (R2) value of plot of log cumulative % drug remaining verses time,
nearer to unity indicates first order, concentration dependent release pattern.
3.10.7.3 Higuchi Square Root of Time Model
Qt = kh.t1/2
Where Qt is the percentage of drug released at time t and kh is the Higuchi square root of time
release rate constant.
The regression coefficient (R2) value of plot of percentage drug release verses square root of
time nearer to unity indicates Fickian diffusional release mechanism.

119997290027 / Gujarat Technological University Page 79
CHAPTER 3 Materials and Methods
3.10.7.4 Korsmeyer-Peppas Model
Qt/Q∞= kKP . tn
Where Q∞ is the total drug released after infinity, Qt/Q∞ is the fraction of drug released at time
t, kKP a constant compromising the structural and geometric characteristics of the device, and
n, the release exponent, which is indicative of the mechanism of drug release.
A plot of log (Qt/ Q∞) versus log t gives straight line of gradient n and an intercept of log K.
Values of exponent n and the corresponding release mechanism are given in Table 3.3
TABLE 3.3. Values of diffusional exponent and corresponding release mechanism
Diffusional Exponent, n Type of Transport (release ) Time Dependence
n=0.5
0.5<n<1
n = 1
n>1
Fickian diffusion
Anomalous transport
Case II transport
Super case II transport
t1/2
tn-1
time independent
tn-1
119997290027 / Gujarat Technological University Page 80
CHAPTER 3 Materials and Methods
3.11 Sterilization and Sterility Testing
3.11.1 Sterilization
The optimized microemulsion formulation was subjected to sterilization using membrane fil-
tration unit by passing it through 0.22 µm membrane filter maintaining aseptic condition.51
3.11.2 Sterility Testing
Sterility testing of microemulsion formulation was performed by direct inoculation method to
examine growth of bacteria and fungi. The media used to detect aerobic and anaerobic bacteria
was fluid thioglycolate medium and the media used to detect fungal organism was soyabean
casein digest medium as per IP standards. Three test tubes were taken for negative control,
positive control and sample testing for both medium. For negative control, both sterilized (au-
toclaving at 1210C, 15 psi) medias were taken separately, while for positive control, aerobic
bacteria Staphylococcus aureus and fungal organism Candida Albicans were inoculated in flu-
id thioglycolate media and soyabean casein digest media respectively.52
With the help of ster-
ile syringe, 1 ml of sample was transferred aseptically to both media separately. The samples
were incubated for at 35 ± 10C and 25 ± 1
0C for FTM and SCDM media for 14 days and
checked for turbidity on everyday which is indicate the of microbial growth. As discussed pre-
viously, the gelling agent incorporated into microemulsion system in aseptic cabinet in to
avoid further possible contamination.
3.12 In vitro / In vivo studies
The experimental protocol was approved by the Institutional Animal Ethics Committee
(IAEC) Reference No. 984/01/2017-07 for the use of animal in the study. Utmost care was
taken to ensure that animals were treated in the most human and ethically acceptable manner.
The ocular potential of optimized ocular formulation was assessed by performing in vitro
study like hen's egg chorioallantoic membrane test (HET-CAM), blinking index for tolerabil-
ity, acute ocular irritation study and in vivo antiallergic efficacy study in ovalbumin (OA)-
induced allergic conjunctivitis (AC) in guinea pig model followed by histopathology.
119997290027 / Gujarat Technological University Page 81
CHAPTER 3 Materials and Methods
3.12.1 Ocular Irritation Study by Hen’s Egg Chorioallantoic Membrane (HET-CAM)
Test
Selection of Eggs
The eggs were collected less than 1 week after lying and incubated for about 9 days; on 10th
day, their blunt ends are tested by the candling lamp. Only the eggs with emergent vascular
system were selected for the test.
Preparation of the Eggs for Test
Candling procedure helps in identifying the air space and it was marked on the eggs. Then,
after wiping with 70% IPA and a small window was made on the shell at the pointed end of
the egg. The shells of the egg are opened at that marked portion on the blunt ends. The under-
lying membrane was carefully removed in such a way that underlying blood vessels are not
damaged. Exposed chorioallantoic membrane (CAM) was treated with 10 μL of the optimized
formulation. The chorioallantoic membrane was also treated with 10 μL of 1 N NaOH and
considered as positive control and 10 μL of 0.9% w/v NaCl as negative control. The effects
were observed near the surroundings of the applied sample within 5 min. After 5 min, change
in CAM was observed for parameters like hemorrhage, coagulation and lysis.53-55
3.12.2 Ocular Tolerability Study by Blinking index
Testing Protocol for Blinking Index (B.I.)
The animals were held on top of a lab table with a thick absorbent paper. Blinking counts were
performed with an electronic count-up timer over a 5-minute period. Using an adjustable vol-
ume digital pipette, saline and optimized formulation were applied to the lower cul-de-sac
while pulling the upper eyelid gently and tilting the head of the animal slightly, making sure
that the formulation did not spill out before the first blink. A volume of 25 μL was used here
as a substantial stimulus for blinking. The right and left eyes were tested with saline, and the
test solution was tested 30-60 minutes later.56
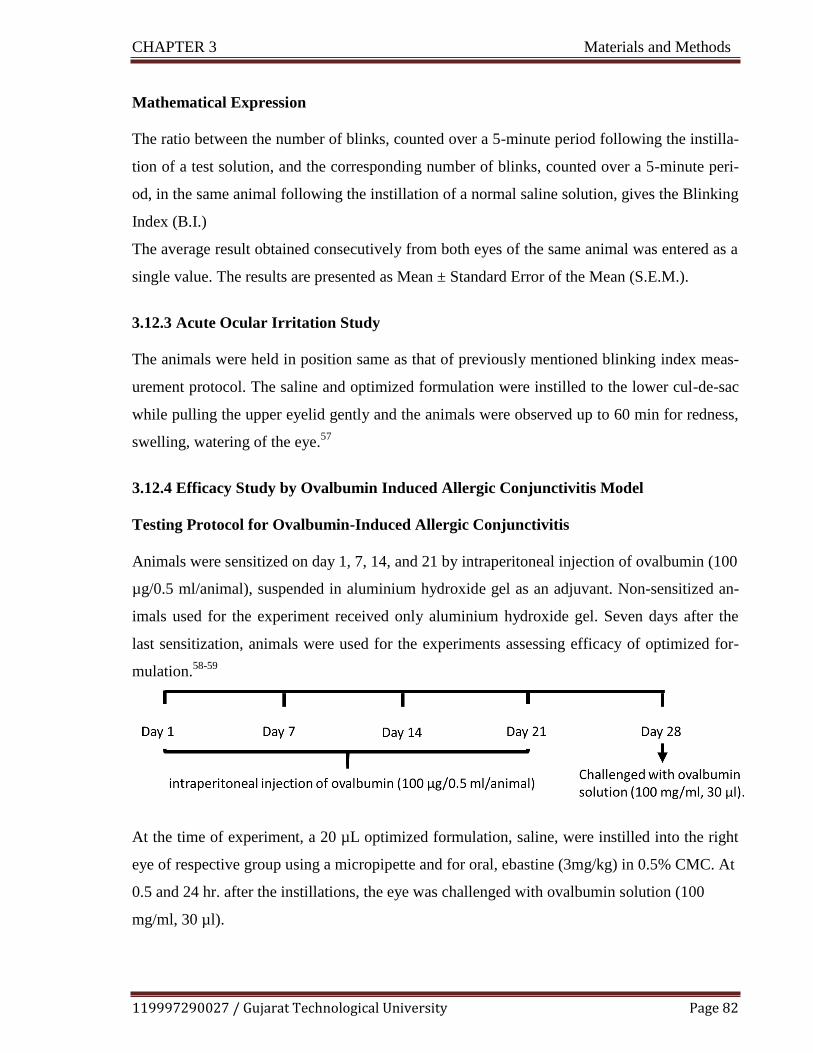
119997290027 / Gujarat Technological University Page 82
CHAPTER 3 Materials and Methods
Mathematical Expression
The ratio between the number of blinks, counted over a 5-minute period following the instilla-
tion of a test solution, and the corresponding number of blinks, counted over a 5-minute peri-
od, in the same animal following the instillation of a normal saline solution, gives the Blinking
Index (B.I.)
The average result obtained consecutively from both eyes of the same animal was entered as a
single value. The results are presented as Mean ± Standard Error of the Mean (S.E.M.).
3.12.3 Acute Ocular Irritation Study
The animals were held in position same as that of previously mentioned blinking index meas-
urement protocol. The saline and optimized formulation were instilled to the lower cul-de-sac
while pulling the upper eyelid gently and the animals were observed up to 60 min for redness,
swelling, watering of the eye.57
3.12.4 Efficacy Study by Ovalbumin Induced Allergic Conjunctivitis Model
Testing Protocol for Ovalbumin-Induced Allergic Conjunctivitis
Animals were sensitized on day 1, 7, 14, and 21 by intraperitoneal injection of ovalbumin (100
µg/0.5 ml/animal), suspended in aluminium hydroxide gel as an adjuvant. Non-sensitized an-
imals used for the experiment received only aluminium hydroxide gel. Seven days after the
last sensitization, animals were used for the experiments assessing efficacy of optimized for-
mulation.58-59
At the time of experiment, a 20 µL optimized formulation, saline, were instilled into the right
eye of respective group using a micropipette and for oral, ebastine (3mg/kg) in 0.5% CMC. At
0.5 and 24 hr. after the instillations, the eye was challenged with ovalbumin solution (100
mg/ml, 30 µl).

119997290027 / Gujarat Technological University Page 83
CHAPTER 3 Materials and Methods
3.12.4.1 Edema Scoring
Edema was scored at 15, 30, 60, 90, and 120 min after the instillation of ovalbumin. For eval-
uation of edema, scoring system used.60
The edema scoring was done according to graded scale. Following system was used for as-
signing the edema scores
0- No edema
1- Slight edema
2- Partial eversion of eye
3-Eyelid half-closed
4-Eye swelling, more than half eyelid closed
3.12.4.2 Scratching Behavior
Eye scratching behavior was defined as fore-limb movements over two times directed to the
ocular surface.61
In the same sensitization protocol as describe in 3.12.4. Along with edema,
the number of eye scratches was counted for 30 min. The scratching response was assessed
after topical antigen challenge at 0.5hr.62
3.12.5 Histopathological Study
The eyeballs together with the conjunctiva and lids of animals from the saline, saline + oval-
bumin and optimized formulation group were exenterated and fixed in 10% buffered formalin.
Tissues were subsequently processed for dehydration in a series of ascending alcohol concen-
trations. The samples embedded into paraffin wax and stained with hematoxylin and eosin.63-64
DPX was used as mounting medium and micro toming was performed using microtome (mod-
el 0126, Yorco, India). The histopathological examinations for determination of dam-
age/irritation due to the formulation were performed using inverted microscope. (Nikon TS-
100)

119997290027 / Gujarat Technological University Page 84
CHAPTER 3 Materials and Methods
3.13 Pharmacokinetic Study
Pharmacokinetic parameters give valuable information of formulation and can serve as an im-
portant tool in an establishment of IVIVC, which is an important quality attribute.
From a high level perspective, ocular PK studies help to elucidate ADME of formulation. It gives
information about absorption into, distribution and metabolism within and elimination from the
eye (ADME). More precise objectives for these studies typically center on determining ability of
drug to penetrate the target tissue, and determine its concentration, by a specified dosing method.65
Single dose pharmacokinetic study was performed by measuring drug concentration in ocular tis-
sues. For reliable data quality, sampling time should be chosen carefully, 6-8 time-points with bal-
anced sampling may be appropriate. For small molecules (≤1,000 Da), 1, 2, 4, and 8 hr. sampling
point recommended.66 The animal experiment was carried out on SD rat. In study protocol, 10 μL
optimized formulation was instilled into rat eyes. At 0.5, 1, 2, 4, and 8 h after the instillations (N=3
rats/time point), blood samples were withdrawn in microfuge tubes containing K2EDTA (20
μL/mL of blood, 200 mM) as anticoagulant from tail vein and the eyes were removed followed by
euthanasia at respective time points. The plasma samples were harvested from blood by centrifu-
gation of samples at 7500 RPM for 10 min at 4°C and stored below -60°C until bioanalysis.
Ocular tissue samples were weighed and homogenized using a pre-chilled micro homogenizer.
Protein extraction reagent was added with a ratio of tissue to reagent of 1:5 (1g of tissue/5 ml of
reagent). The lysed samples were centrifuged for 10,000 rpm at 40C for 10 min and supernatant
was transferred to a chilled EPP tube.67 The resultant samples were analyzed by developed and
validated HPLC method.
3.14 Stability Studies
3.14.1 Accelerated Stability Study by Centrifugation Stress Test
Stress stability study of the microemulsion formulation was carried out by subjecting it to centrif-
ugation. The formulation was centrifuged at 9,000 rpm for 20 min by Centrifuge (Make Remi) and
examined for phase separation.68
3.14.2 Stability Study as per ICH guidelines
The stability of the microemulsion and microemulsion based gel were assessed under different
storage conditions as per International Conference of Harmonization (ICH ) guidelines, at room
119997290027 / Gujarat Technological University Page 85
CHAPTER 3 Materials and Methods
temperature (250C ± 20C / 60% RH ± 5% RH), at refrigeration condition (2-80C/45% RH ± 5%
RH), at 400C ± 20C / 75% RH ± 5%RH.69
The samples of microemulsion were evaluated at 0, 1, 2, 3 and 6 months for pH, viscosity, globule
size, zeta potential. Further, the samples of microemulsion based gel were evaluated at 0, 1, 2, and
3 months for pH, viscosity and drug content. All the stability parameters were determined in tripli-
cate.
3.15 Data Analysis
Pseudoternary phase diagrams were plotted using Prosim software. The data obtained were
analyzed statistically using t-test and ANOVA. The data obtained for the optimization of pro-
cess and formulation variables were statistically analyzed by analysis of variance (ANOVA)
with in-built software design of Design Expert 7.0.0 software (Stat-Ease, Inc., USA). It was
used to determine the significance and the magnitude of the effects of different variables and
their interactions. Probability values less than 0.0500 were considered as statistically signifi-
cant. Pharmacokinetic data fitted to PK Solver 2.0 software for determination various parame-
ters.
3.16 References
1. The United States Pharmacopoeial convention, 2011, Standards A. General Notices and
Requirements. USP 34; 6.
2. Martindale. The complete drug reference, 36th edition, 2009, RPS Publication, pp 1324
3. Knox, C., Law, V., Jewison, T., Liu, P., Ly, S., Frolkis, A., Pon, A., Banco, K., Mak, C.,
Neveu, V. and Djoumbou, Y., 2010. Drug Bank 3.0: a comprehensive resource for ‗om-
ics‗ research on drugs. Nucleic Acids Research, 39(1), pp.D1035-D1041.

119997290027 / Gujarat Technological University Page 86
CHAPTER 3 Materials and Methods
4. The National Toxicology Program (NTP) Interagency Center for the Evaluation of Alter-
native Toxicological Methods (NICEATM). Test Method Protocol for Solubility Deter-
mination Phase III. 2003:1-10.
5. Dole, M.N., Patel, P.A., Sawant, S.D. and Shedpure, P.S., 2011. Advance applications of
Fourier transform infrared spectroscopy. Int. J. Pharm. Sci. Rev. Res, 7(2), pp.159-166.
6. Fialho, S.L. and Da SilvaCunha, A., 2004. New vehicle based on a microemulsion for
topical ocular administration of dexamethasone. Clinical & experimental ophthalmology,
32(6), pp.626-632.
7. Ford, J.L. and Timmins, P., 1989. Pharmaceutical thermal analysis: techniques and appli-
cations. Ellis Horwood.
8. Dahivadkar, M.S., Jain, H.K. and Gujar, K.N., 2013. Development and Validation of UV
Spectrophotometric Estimation of Ebastine in Bulk and Tablet Dosage Form Using Area
Under Curve Method. International Research Journal of Pharmacy, 4(6), pp.201-204.
9. Nelofer, S.M. and Janardhan, M., 2012. Analytical method development and validation
for the assay of ebastine in ebastine mouth dissolving tablets. Int J Pharm Clin Res, 4(4),
pp.56-60.
10. Government of India, Ministry of Health and Family Welfare. Indian Pharmacopoeia.
1996, The Indian Pharmacopoeia commission; A-147.
11. Tan, A.Y., LeVatte, T.L., Archibald, M.L., Tremblay, F., Kelly, M.E. and Chauhan, B.C.,
2002. Timolol concentrations in rat ocular tissues and plasma after topical and intraperi-
toneal dosing. Journal of glaucoma, 11(2), pp.134-142..
12. Birkebak, T.A., Yamazaki, S., Adams, L.A., Shawer, M., Singh, S., Norris, L., Jones,
B.W., VandeGiessen, T.L. and Vrbanac, J.J., 2003. Drug Pharmacokinetics in Rat Eye
Tissues Following Topical Administration: Brimonidine. Investigative Ophthalmology &
Visual Science, 44(13), pp.1305-1305..
13. Kadam, R.S., Jadhav, G., Ogidigben, M. and Kompella, U.B., 2011. Ocular pharmacoki-

119997290027 / Gujarat Technological University Page 87
CHAPTER 3 Materials and Methods
netics of dorzolamide and brinzolamide after single and multiple topical dosing: implica-
tions for effects on ocular blood flow. Drug Metabolism and Disposition, 39(9), pp.1529-
1537.
14. Sanson, A.L., Silva, S.C.R., Martins, M.C.G., Giusti-Paiva, A., Maia, P.P. and Martins, I.,
2011. Liquid-liquid extraction combined with high performance liquid chromatography-
diode array-ultra-violet for simultaneous determination of antineoplastic drugs in plasma.
Brazilian Journal of Pharmaceutical Sciences, 47(2), pp.363-371.
15. ICH Topic Q2 (R1) Validation of Analytical Procedures: Text and Methodology, 2005.Int
Conf Harmon;1994 (November 1996):17.
16. Ramaswamy, A. and Dhas, A.S.A.G., 2018. Development and validation of analytical
method for quantitation of Emtricitabine, Tenofovir, Efavirenz based on HPLC. Arabian
journal of chemistry, 11(2), pp.275-281.
17. Azeem, A., Rizwan, M., Ahmad, F.J., Iqbal, Z., Khar, R.K., Aqil, M. and Talegaonkar, S.,
2009. Nanoemulsion components screening and selection: a technical note. Aaps
Pharmscitech, 10(1), pp.69-76.
18. Pani, N.R., Nath, L.K., Acharya, S. and Bhuniya, B., 2011. Application of DSC, IST, and
FTIR study in the compatibility testing of nateglinide with different pharmaceutical excip-
ients. Journal of Thermal analysis and Calorimetry, 108(1), pp.219-226..
19. Bozdağ-Pehlivan, S., Subaşi, B., Vural, I., Unlü, N. and Capan, Y., 2011. Evaluation of
drug-excipient interaction in the formulation of celecoxib tablets. Acta poloniae pharma-
ceutica, 68(3), pp.423-433.
20. Patel, T.B., Patel, T.R. and Suhagia, B.N., 2018. Preparation, characterization, and opti-
mization of microemulsion for topical delivery of itraconazole. Journal of Drug Delivery
and Therapeutics, 8(2), pp.136-145.

119997290027 / Gujarat Technological University Page 88
CHAPTER 3 Materials and Methods
21. Mahdi, E.S., Sakeena, M.H., Abdulkarim, M.F., Abdullah, G.Z., Sattar, M.A. and Noor,
A.M., 2011. Effect of surfactant and surfactant blends on pseudoternary phase diagram
behavior of newly synthesized palm kernel oil esters. Drug design, development and ther-
apy, 5, p.311.
22. Gohel M, Patel, A., Patel, A. and Hingorani, L., 2016. Optimization of Bacoside, a loaded
SNEDDS, using D-optimal mixture design for enhancement in solubility and bio-
availability. Int J Pharm Pharm Sci, 8(12), pp.213-220.
23. Chouhan, P. and Saini, T.R., 2016. D-optimal design and development of microemulsion
based transungual drug delivery formulation of ciclopirox olamine for treatment of ony-
chomycosis. Indian Journal of Pharmaceutical Sciences, 78(4), pp.498-511.
24. She, Y., Li, J., Xiao, B., Lu, H., Liu, H., Simmons, P.A., Vehige, J.G. and Chen, W.,
2015. Evaluation of a novel artificial tear in the prevention and treatment of dry eye in an
animal model. Journal of Ocular Pharmacology and Therapeutics, 31(9), pp.525-530.
25. Shah D.P., Chhatrani B.M., 2017. A Review on Microemulsion Based Gel: A Novel Ap-
proach for Enhancing Topical Delivery of Hydrophobic Drug.; 8(4) pp 19-35.
26. Fialho, S.L. and Da Silva‐ Cunha, A., 2004. New vehicle based on a microemulsion for
topical ocular administration of dexamethasone. Clinical & experimental ophthalmology,
32(6), pp.626-632.
27. Üstündag-Okur, N., Gökçe, E.H., Eğrilmez, S., Özer, Ö. and Ertan, G., 2014. Novel of-
loxacin-loaded microemulsion formulations for ocular delivery. Journal of Ocular Phar-
macology and Therapeutics, 30(4), pp.319-332.
28. Kesavan, K., Kant, S., Singh, P.N. and Pandit, J.K., 2013. Mucoadhesive chitosan-coated
cationic microemulsion of dexamethasone for ocular delivery: in vitro and in vivo evalua-
tion. Current eye research, 38(3), pp.342-352.
29. Jain, J., Fernandes, C. and Patravale, V., 2010. Formulation development of parenteral

119997290027 / Gujarat Technological University Page 89
CHAPTER 3 Materials and Methods
phospholipid-based microemulsion of etoposide. Aaps Pharmscitech, 11(2), pp.826-831.
30. Ammar HO, Salama HA, Ghorab M, Mahmoud AA. Nanoemulsion as a potential oph-
thalmic delivery system for dorzolamide hydrochloride. Aaps Pharmscitech. 2009 Sep
1;10(3):808.
31. Ince, I., Karasulu, E., Ates, H., Yavasoglu, A. and Kirilmaz, L., 2015. A novel pilocarpine
microemulsion as an ocular delivery system: in vitro and in vivo studies. J. Clin. Exp.
Ophthalmol, 6, p.408.
32. G. Hecht, R. E. Roehrs, J. C. Lang, D. P. Rodheaver, and M. A. Chowhan., 1996. Design
and evaluation of ophthalmic pharmaceutical products, in Modern Pharmaceutics, 3rd ed.
(G. S. Banker and C. T. Rhodes, Eds.), Marcel Dekker, New York, pp. 489–546.
33. Baranowski, P., Karolewicz, B., Gajda, M. and Pluta, J., 2014. Ophthalmic drug dosage
forms: characterisation and research methods. The Scientific World Journal, 2014.
34. Han, K., Woghiren, O.E. and Priefer, R., 2016. Surface tension examination of various
liquid oral, nasal, and ophthalmic dosage forms. Chemistry Central Journal, 10(1), p.31.
35. Gupta, A., Nayak, K. and Misra, M., 2019. Cow ghee fortified ocular topical microemul-
sion; in vitro, ex vivo, and in vivo evaluation. Journal of microencapsulation, 36(7),
pp.603-621.
36. Kalam, M.A., Alshamsan, A., Aljuffali, I.A., Mishra, A.K. and Sultana, Y., 2016. Deliv-
ery of gatifloxacin using microemulsion as vehicle: formulation, evaluation, transcorneal
permeation and aqueous humor drug determination. Drug delivery, 23(3), pp.886-897.
37. Nemichand, S.K. and Laxman, S.D., 2016. Solubility Enhancement of Nebivolol by Mi-
cro Emulsion Technique. Journal of Young Pharmacists, 8(4).

119997290027 / Gujarat Technological University Page 90
CHAPTER 3 Materials and Methods
38. Rawat, A., Gupta, S.S., Kalluri, H., Lowenborg, M., Bhatia, K. and Warner, K., 2019.
Rheological Characterization in the Development of Topical Drug Products. In The Role
of Microstructure in Topical Drug Product Development (pp. 3-45). Springer, Cham.
39. Shah, P.A., Gevariya, N.R., Christian, J.R., Patel, K.G., Thakkar, V.T., Gohel, M.C. and
Gandhi, T.R., 2018. Science based Development of Viscous Eye Drop of Dorzolamide
Hydrochloride and Timolol Maleate using Full Factorial Design. Pharmaceutical Meth-
ods, 9(2).
40. Naik, A. and Nair, H., 2014. Formulation and evaluation of thermosensitive biogels for
nose to brain delivery of doxepin. BioMed research international, 2014.
41. Morsi, N., Ghorab, D., Refai, H. and Teba, H., 2016. Ketoroloac tromethamine loaded
nanodispersion incorporated into thermosensitive in situ gel for prolonged ocular delivery.
International journal of pharmaceutics, 506(1-2), pp.57-67.
42. Chen, M.X., Alexander, K.S. and Baki, G., 2016. Formulation and evaluation of antibac-
terial creams and gels containing metal ions for topical application. Journal of pharmaceu-
tics, pp.1-10.
43. Gohil R, Patel A, Pandya T, Dharamsi A., 2019. Optimization of Brinzolamide Loaded
Microemulsion using Formulation by Design Approach: Characterization and In-vitro
Evaluation. Current Drug Therapy, 14 pp 1-18.
44. Gupta S, Chavhan S, Sawant KK., (2011). Self-nanoemulsifying drug delivery system for
adefovir dipivoxil: Design, characterization, in vitro and ex vivo evaluation. Colloids Sur-
faces A Physicochem Eng Asp.;392 (1):145-155.
45. Üstündag-Okur, N., Gökçe, E.H., Eğrilmez, S., Özer, Ö. and Ertan, G., 2014. Novel of-
loxacin-loaded microemulsion formulations for ocular delivery. Journal of Ocular Phar-
macology and Therapeutics, 30(4), pp.319-332.
119997290027 / Gujarat Technological University Page 91
CHAPTER 3 Materials and Methods
46. Ashara, K.C. and Shah, K.V., 2017. Emulsion of chloramphenicol: an overwhelming ap-
proach for ocular delivery. Folia medica, 59(1), pp.23-30.
47. Avachat AM, Parpani SS., 2015. Formulation and development of bicontinuous
nanostructured liquid crystalline particles of efavirenz. Colloids Surfaces B Biointerfac-
es.; 126:87-97.
48. Grassi, M., Coceani, N. and Magarotto, L., 2000. Mathematical modeling of drug release
from microemulsions: theory in comparison with experiments. Journal of colloid and in-
terface science, 228(1), pp.141-150.
49. Singhvi, G. and Singh, M., 2011. In-vitro drug release characterization models. Int J
Pharm Stud Res, 2(1), pp.77-84.
50. Hilip, LR, Peppas A., 1997. Fickian and anomalous release from swellable devices. J
Control Release.;5 pp 37-42.
51. Sandle, T., 2014. Sterile ophthalmic preparations and contamination control. J GXP Com-
pliance, 18(3), pp.1-5.
52. Gohil R, Patel A*, Pandya T, Dharamsi A, 2019, Optimization of Brinzolamide Loaded
Microemulsion using Formulation by Design Approach: Characterization and In-vitro
Evaluation,Current Drug Therapy, 14, pp1-18.
53. Daniel, M.B., Perveen, Y.R., Betty, M.K. and De Salva, S.J., 1991. Factors affecting use
of the hen's egg chorioallantoic membrane as a model for predicting eye irritation poten-
tial: I. Journal of toxicology: Cutaneous and Ocular Toxicology, 10(1-2), pp.95-104.
54. Daniel, M.B., Perveen, Y.R., Betty, M.K. and De Salva, S.J., 1991. Evaluation of the vas-
cular components of the chorioallantoic membrane assay as a model for eye irritation po-

119997290027 / Gujarat Technological University Page 92
CHAPTER 3 Materials and Methods
tential: II. Journal of Toxicology: Cutaneous and Ocular Toxicology, 10(1-2), pp.105-113.
55. Deepthi, S. and Jose, J., 2019. Novel hydrogel-based ocular drug delivery system for the
treatment of conjunctivitis. International ophthalmology, 39(6), pp.1355-1366..
56. BAR-ILAN, A.M.I.R., 1997. The Guinea Pig Blinking Test: A Comparison with Human
Responses. Journal of Ocular Pharmacology and Therapeutics, 13(3), pp.207-212.
57. Alany, R.G., Rades, T., Nicoll, J., Tucker, I.G. and Davies, N.M., 2006. W/O microemul-
sions for ocular delivery: Evaluation of ocular irritation and precorneal retention. Journal
of controlled release, 111(1-2), pp.145-152.
58. Satyam, S.M., Adiga, S., Chogtu, B., Bairy, K.L., Pirasanthan, R. and Vaishnav, R.L.,
2014. Effect of fucithalmic and sofinox eye drops on experimental allergic conjunctivitis
in rats. International Journal of Pharmacy and Pharmaceutical Sciences, 6(11), pp.458-
460.
59. Groneberg, D.A., Bielory, L., Fischer, A., Bonini, S. and Wahn, U., 2003. Animal models
of allergic and inflammatory conjunctivitis. Allergy, 58(11), pp.1101-1113.
60. Yanni, J.M., Stephens, D.J., Parnell, D.W. and Spellman, J.M., 1994. Preclinical efficacy
of emedastine, a potent, selective histamine H1 antagonist for topical ocular use. Journal
of Ocular Pharmacology and Therapeutics, 10(4), pp.665-675.
61. Nakazawa, Y., Oka, M. and Takehana, M., 2017. Model for studying anti-allergic drugs
for allergic conjunctivitis in animals. Open Medicine, 12(1), pp.231-238.
62. Minami, K. and Kamei, C., 2004. A chronic model for evaluating the itching associated
with allergic conjunctivitis in rats. International immunopharmacology, 4(1), pp.101-108..
63. Shoji, J., Inada, N., Takaura, N. and Sawa, M., 1995. Histological study of allergic con-

119997290027 / Gujarat Technological University Page 93
CHAPTER 3 Materials and Methods
junctivitis--1. Study on the adhesion molecules to allergic conjunctivitis. Nippon Ganka
Gakkai zasshi, 99(2), pp.129-134..
64. Shoji, J., 1995. Histological study of allergic conjunctivitis report 2. Time course of aller-
gic conjunctival inflammation. Nihon Ganka Kiyo (Folia Ophthalmol Jpn), 46, pp.1015-
1020.
65. Agrahari V, Mandal A, Agrahari V, Trinh HM, Joseph M, Ray A, Hadji H, Mitra R, Pal
D, Mitra AK. A comprehensive insight on ocular pharmacokinetics. Drug delivery and
translational research. 2016 Dec 1; 6(6):735-54.
66. Ahn, S.J., Hong, H.K., Na, Y.M., Park, S.J., Ahn, J., Oh, J., Chung, J.Y., Park, K.H. and
Woo, S.J., 2016. Use of rabbit eyes in pharmacokinetic studies of intraocular drugs. JoVE
(Journal of Visualized Experiments), (113), p.e53878.
67. Brime, B., Moreno, M.A., Frutos, G., Ballesteros, M.P. and Frutos, P., 2002. Amphoteri-
cin B in oil–water lecithin-based microemulsions: formulation and toxicity evaluation.
Journal of pharmaceutical sciences, 91(4), pp.1178-1185.
68. Guidance for Industry Q1A(R2) Stability Testing of New Drug Substances and Prod-
ucts., (2003), U.S. Department of Health and Human Services, Food and Drug Admin-
istration, Center for Drug Evaluation and Research (CDER) Center for Biologics Evalua-
tion and Research (CBER); pp 1–22.
69. SADC. Registration of Medicines Stability, 2004. SADC Guidelines Stability Test, pp 1-
44.

CHAPTER 4 Results and Discussion
119997290027 / Gujarat Technological University Page 90
CHAPTER 4
Results and Discussion

CHAPTER 4 Results and Discussion
119997290027 / Gujarat Technological University Page 91
4.1 Identification of Drug
4.1.1 Identification of Drug by Physical Attributes
Before preceding the formulation development, identification of drug and ensuring its purity is
prerequisite. The identification test of ebastine based on physical examination like appearance,
solubility and melting point are given in following Table 4.1
TABLE 4.1 Identification test for ebastine with the standard/ inference
Sr.
No. Properties Specification
1 Observation Inference
1. Appearance White or almost
white powder White powder Complies
2. State Crystalline Crystalline Complies
3. Melting Point 80-820C 84-87
0C Complies
4.
Solubility
Practically in-
soluble in water,
freely soluble in methanol
Practically in-
soluble in water,
freely soluble in methanol
Complies
Table 4.1 shows that all the observations in term of melting point, solubility and physical ex-
amination like color, state complies with their reported specifications. This indicates the purity
of procured drug sample.
4.1.2 Identification of Drug by FTIR
Fourier Transform Infrared spectroscopy (FTIR) study of drug sample was performed to de-
termine various functional groups into it. FTIR spectra was obtained and compared with refer-
ence spectra available in literature.2 The obtained and reference spectra of ebastine are shown
in Fig 4.1
The major IR peaks obtained and reported for ebastine molecule (as shown in Fig 4.2) is sum-
marized in Table 4.2

CHAPTER 4 Results and Discussion
119997290027 / Gujarat Technological University Page 92
FIGURE 4.1 (a) Observed IR spectra of ebastine
FIGURE 4.1 (b) Reference IR spectra of ebastine

CHAPTER 4 Results and Discussion
119997290027 / Gujarat Technological University Page 93
FIGURE 4.2 Structure of ebastine
TABLE 4.2 Interpretation of FTIR spectra of ebastine
Observed (cm-1
) Reported (cm-1
) Inferences3
3084, 3052 3000-3100 CH-Aromatic
2955,2943
2854 -2926 CH-Aliphatic
1678 1670-1820 C=O (Ketone)
1604, 1452 1495 -1562 C=C (Aromatic)
1359 1350-1000 C-N
1070 1300-1000 C-O
Interpretation of FTIR spectra of ebastine suggest that major peaks observed in procured as
well as reference spectra. The observations provide confirmation of purity of sample.
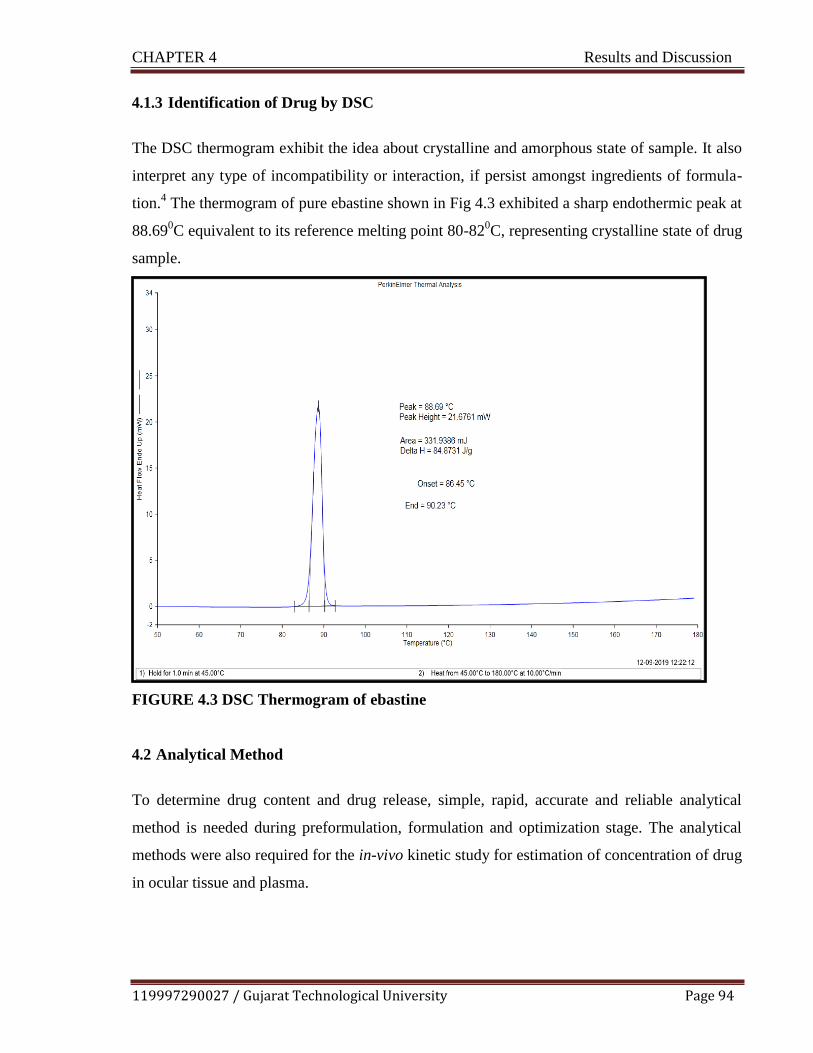
CHAPTER 4 Results and Discussion
119997290027 / Gujarat Technological University Page 94
4.1.3 Identification of Drug by DSC
The DSC thermogram exhibit the idea about crystalline and amorphous state of sample. It also
interpret any type of incompatibility or interaction, if persist amongst ingredients of formula-
tion.4 The thermogram of pure ebastine shown in Fig 4.3 exhibited a sharp endothermic peak at
88.690C equivalent to its reference melting point 80-82
0C, representing crystalline state of drug
sample.
FIGURE 4.3 DSC Thermogram of ebastine
4.2 Analytical Method
To determine drug content and drug release, simple, rapid, accurate and reliable analytical
method is needed during preformulation, formulation and optimization stage. The analytical
methods were also required for the in-vivo kinetic study for estimation of concentration of drug
in ocular tissue and plasma.
CHAPTER 4 Results and Discussion
119997290027 / Gujarat Technological University Page 95
4.2.1 UV Spectrophotometric Estimation of Ebastine
Development and validation of simple, accurate and rapid UV spectrophotometric analytical
methods have been reported for the estimation of ebastine in formulation and stability sam-
ples.5,
6
Hence, calibration curves were obtained using methanol and methanolic phosphate buffered
saline (PBS), pH 7.4, 30% v/v as solvents for determining the solubility of drug in microemul-
sion components and in vitro release studies.
4.2.1.1 Calibration Curve in Methanol as Solvent
Calibration curve was plotted in methanol in the range of 2-10µg/ml of ebastine at 252 nm us-
ing UV spectrophotometer (UV-1800, Shimadzu) for determining the solubility of drug and
drug content. The calibration curve data is shown in Table 4.3 and the overlay spectra of ebas-
tine at different concentrations and the calibration curve is depicted in Fig. 4.4 (a) and (b) re-
spectively.
TABLE 4.3 Calibration curve data for ebastine in methanol as solvent
Sr. No. Conc. (mcg/ml) Absorbance
(Mean ± SD)
1 2 0.044 ± 0.001
2 4 0.172 ± 0.007
3 6 0.290 ± 0.001
4 8 0.397 ± 0.078
5 10 0.512 ± 0.004

CHAPTER 4 Results and Discussion
119997290027 / Gujarat Technological University Page 96
FIGURE 4.4 (a) Overlay spectra of ebastine at different concentrations
FIGURE 4.4 (b) Calibration curve for ebastine in methanol as solvent
The calibration plot was found to be linear in concentration range of 2-10 µg/ml of ebastine
with correlation coefficient value (R2) of 0.9990
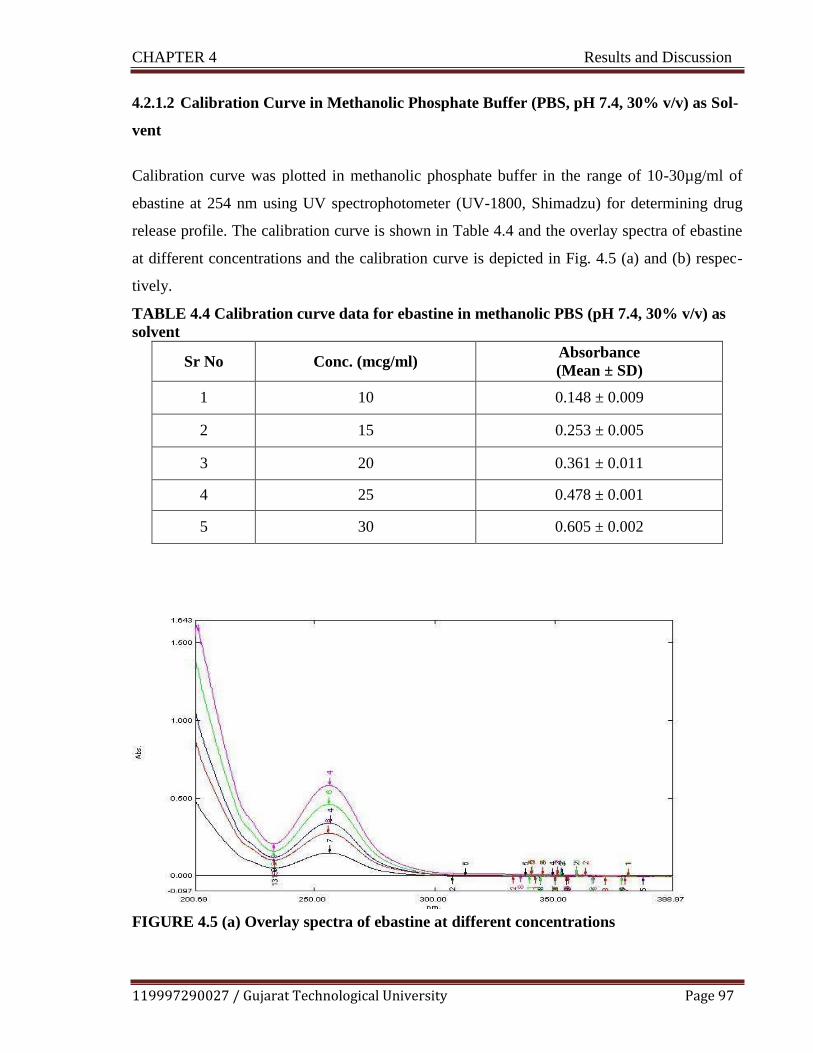
CHAPTER 4 Results and Discussion
119997290027 / Gujarat Technological University Page 97
4.2.1.2 Calibration Curve in Methanolic Phosphate Buffer (PBS, pH 7.4, 30% v/v) as Sol-
vent
Calibration curve was plotted in methanolic phosphate buffer in the range of 10-30µg/ml of
ebastine at 254 nm using UV spectrophotometer (UV-1800, Shimadzu) for determining drug
release profile. The calibration curve is shown in Table 4.4 and the overlay spectra of ebastine
at different concentrations and the calibration curve is depicted in Fig. 4.5 (a) and (b) respec-
tively.
TABLE 4.4 Calibration curve data for ebastine in methanolic PBS (pH 7.4, 30% v/v) as
solvent
Sr No Conc. (mcg/ml) Absorbance
(Mean ± SD)
1 10 0.148 ± 0.009
2 15 0.253 ± 0.005
3 20 0.361 ± 0.011
4 25 0.478 ± 0.001
5 30 0.605 ± 0.002
FIGURE 4.5 (a) Overlay spectra of ebastine at different concentrations

CHAPTER 4 Results and Discussion
119997290027 / Gujarat Technological University Page 98
FIGURE 4.5 (b) Calibration curve for ebastine in in methanolic PBS (pH 7.4, 30% v/v) as
solvent
The calibration plot was found to be linear in concentration range of 10-30 µg/ml of ebastine
with correlation coefficient value (R2) of 0.9984. The pH was selected based on the ocular site
pH 6.5-7.6. Ebastine has limited solubility in buffer but is soluble in methanol, hence meth-
anolic PBS pH 7.4 used to maintain the perfect sink conditions.7,
8
4.2.2 HPLC Method Development and Validation
4.2.2.1. RP- HPLC Method development for Pure Ebastine
Standard solution of ebastine (100 ppm) was scanned in the range of 200-400 nm and from that
the detection wavelength (λmax) was selected at 244 nm. Different mobile phases were tried to
obtained good peak shape with sufficient theoretical plates and minimum asymmetry. Mobile
phase was selected that give shorter run time, retention time, more than 2000 theoretical plates
and less than 1.5 tailing factor and reproducible results. Summary of all mobile phase trials are
reported in Table 4.5.

CHAPTER 4 Results and Discussion
119997290027 / Gujarat Technological University Page 99
Table 4.5 Trials for selection of mobile phase
Trial Mobile phase
1 Methanol: Water ( 80:20 %v/v)
2 Methanol: Water: Acetic acid (70:20:10 %v/v)
4 Acetonitrile: Water (50:50 %v/v)
5 Acetonitrile: Water (80:20 %v/v) pH adjusted 2.5 with glacial acetic acid
6 Acetonitrile: water: methanol (70:20:10 %v/v)
7 Acetonitrile: water: methanol (70:20:10 %v/v) pH adjusted 2.5 with glacial ace-
tic acid
8 Methanol: acetonitrile: ammonium acetate buffer (80:10:10)
9 Methanol: acetonitrile: ammonium acetate buffer (80:10:10), pH adjusted 5.5
with glacial acetic acid
Various trials were taken by using different columns and mobile phase, by changing the pH of
the mobile phase to select the appropriate chromatographic conditions giving good resolving
peak characteristics. The optimized chromatographic conditions were,
Elution: Isocratic
Column/ Stationary phase: Waters X-Terra Shield, Phenomenex C18 (250 mm x 4.5
mm, 5 µm particle size)
Mobile phase: Methanol: Acetonitrile: Ammonium acetate buffer (80:10:10), pH ad-
justed 5.5 with glacial acetic acid
Flow rate: 1.2 ml/min
Detection wavelength: 244nm
Injection volume: 20µL
Run time: 10 min.
a. System Suitability Test
System suitability parameters like theoretical plates, tailing factor and retention time were
studied by injecting 6 replicates of standard stock concentration (10 µg/ml of Ebastine) and

CHAPTER 4 Results and Discussion
119997290027 / Gujarat Technological University Page 100
%RSD for retention time was calculated. Chromatogram of system suitability is shown in
Fig.4.6 and Table 4.6 mentioned the data of system suitability.
FIGURE 4.6 Chromatogram of system suitability
TABLE 4.6 Data of system suitability for ebastine (10 µg/ml)
Sr. No. Retention time(min) Theoretical plates Tailing factor
1 7.363 2009 1.687
2 7.347 2035 1.678
3 7.320 2056 1.647
4 7.320 2056 1.686
5 7.330 2061 1.686
6 7.350 2073 1.634
Mean 7.33833333 Theoretical plates
are more than 2000
Tailing factor is less than
2 S.D. 0.01767107
%RSD 0.24080493
Tailing factor for ebastine was found to be less than 2 which depicts that shape of ebastine
peak was symmetrical. Theoretical plates were found to more than 2000 and % RSD of reten-
tion time is less than 2 which show the column efficiency. The developed analytical method
validated as per ICH guidelines.9
b. Linearity and Range
For underlying study, the calibration curve of ebastine was obtained in range of 2-10µg/ml.
The good linear relationship in the range of the calibration curve constructed was showed by
the linear regression data. The value of correlation coefficient (r2) was found to be 0.9993 indi-
cating that method is linear with straight line equation of y = 34.561x+19.191. The overlay

CHAPTER 4 Results and Discussion
119997290027 / Gujarat Technological University Page 101
chromatogram obtained for linearity study is shown in Fig. 4.7 (a) and the calibration plot with
regression equation and correlation coefficient was determined as shown in Fig. 4.7 (b).
FIGURE 4.7 (a) Chromatogram for linearity study
FIGURE 4.7 (b) Calibration plot for linearity study
c. Repeatability
Standard stock solution (10 µg/ml of ebastine) was injected six times, area of each peak was
measured and %RSD was calculated. The data of repeatability is shown in Table 4.7

CHAPTER 4 Results and Discussion
119997290027 / Gujarat Technological University Page 102
TABLE 4.7 Data of repeatability
Sr. No. Concentration (µg/ml) Area
1 10 127.918
2 10 127.907
3 10 128.299
4 10 125.489
5 10 126.905
6 10 124.863
Mean 126.8968
S.D. 1.424628
%RSD 1.122667
As depicted in above table, %RSD found to be 1.122667%, which was less than 2 indicating
that the developed method is precise.
d. Precision
Interday Precision
Three concentrations of working standard solutions of ebastine 4, 6, 8µg/ml were analyzed at
three consecutive days and %RSD was calculated. The data of interday precision is shown in
Table 4.8.
TABLE 4.8 Data of interday precision
Concentration
(µg/ml)
Area
MEAN
S.D.
%RSD Day 1 Day 2 Day 3
4 90.151 91.156 88.357 89.888 1.4179129 1.57742179
6 123.839 125.996 124.878 124.9043 1.07874109 0.86365385
8 156.107 154.978 157.134 156.073 1.07840206 0.69096004

CHAPTER 4 Results and Discussion
119997290027 / Gujarat Technological University Page 103
Intraday Precision
Three concentrations of working standard solutions of ebastine 4, 6, 8 µg/ml were analyzed at
three times on the same day and %RSD was calculated. The data of intraday precision is
shown in Table 4.9.
TABLE 4.9 Data of intraday precision
Concen-
tration
(µg/ml)
Area
MEAN
S.D.
%RSD Time 1 Time 2 Time 3
4 90.151 92.153 91.153 91.152 1.41562778 1.55304083
6 123.839 126.012 124.674 124.9255 1.53654304 1.22996749
8 156.107 154.078 155.386 155.0925 1.43471966 0.92507353
The % RSD values of inter and intraday precision lies within the acceptance limit concluding
that method is precise.
e. Accuracy
Accuracy was determined by taking known drug sample at 50, 100 and 150% level of the spec-
ification was spiked to 4µg/ml. The amount of ebastine was calculated at each level and % re-
coveries were computed. The data of accuracy reported is shown in Table 4.10.
TABLE 4.10 Data of accuracy
Level
Amount of
sample
(µg/ml)
Amt of std.
spiked
(µg/ml)
Total
amount
(µg/ml)
Total Mean recov-
ered amount
(µg/ml)
%recovery
50% 4 2 6 5.9505 99.1750
100% 4 4 8 8.0734 100.9186
150% 4 6 10 10.0526 100.5260
Accuracy is the degree of agreement between the observed value and true value. The accuracy
of developed method was assessed by performing recovery study. The mean % recovery at
three different concentrations was found to be 99.1750%, 100.9186% and 100.5260% at 50%,

CHAPTER 4 Results and Discussion
119997290027 / Gujarat Technological University Page 104
100% and 150% respectively. The results of recovery study fall within the acceptance limit
indicating that developed method is accurate.
f. Limit of Detection (LOD) and Limit of Quantification (LOQ)
LOD is the minimum concentration of an analyte that can be detected by developed method
and LOQ is the lowest concentration of an analyte that can be quantified by method with accu-
racy and precision. LOD and LOQ were found by injecting lower concentrations like
0.1μg/mL, 0.01μg/mL, 0.001μg/mL, 0.0001 μg/mL. At 0.001μg/mL, the peak is detectable
which is considered as LOD. At 0.003μg/mL (3:1, Signal: Noise), the drug was quantifiable
with suitable accuracy and precision, hence 0.003 μg /mL was considered as LOQ.
g. Robustness
Robustness of the developed method was assessed to determine the capacity of method to re-
main less/ unaffected by small, but purposely changes brought about in various method param-
eters. Robustness is criteria of the reliability of method during its routine use. In this, three
concentrations of working standard solutions of ebastine 4, 6, 8µg/ml was analyzed at three
different wavelengths (243nm, 244nm, 245nm) and %RSD was calculated. The data of robust-
ness is shown in Table 4.11
.
TABLE 4.11 Data of robustness at different wave length
Concentration
(µg/ml)
Area MEAN S.D. %RSD
243nm 244nm 245nm
4 90.151 89.156 92.001 90.436 1.44375 1.5964
6 125.839 123.996 124.02 124.618 1.0572 0.8483
8
156.107
153.978
155.134
155.073
1.06581
0.6873
The %RSD of different wavelength was found to be 0.6873-1.5964%. It was found to be less
than 2 indicating that developed method is robust.
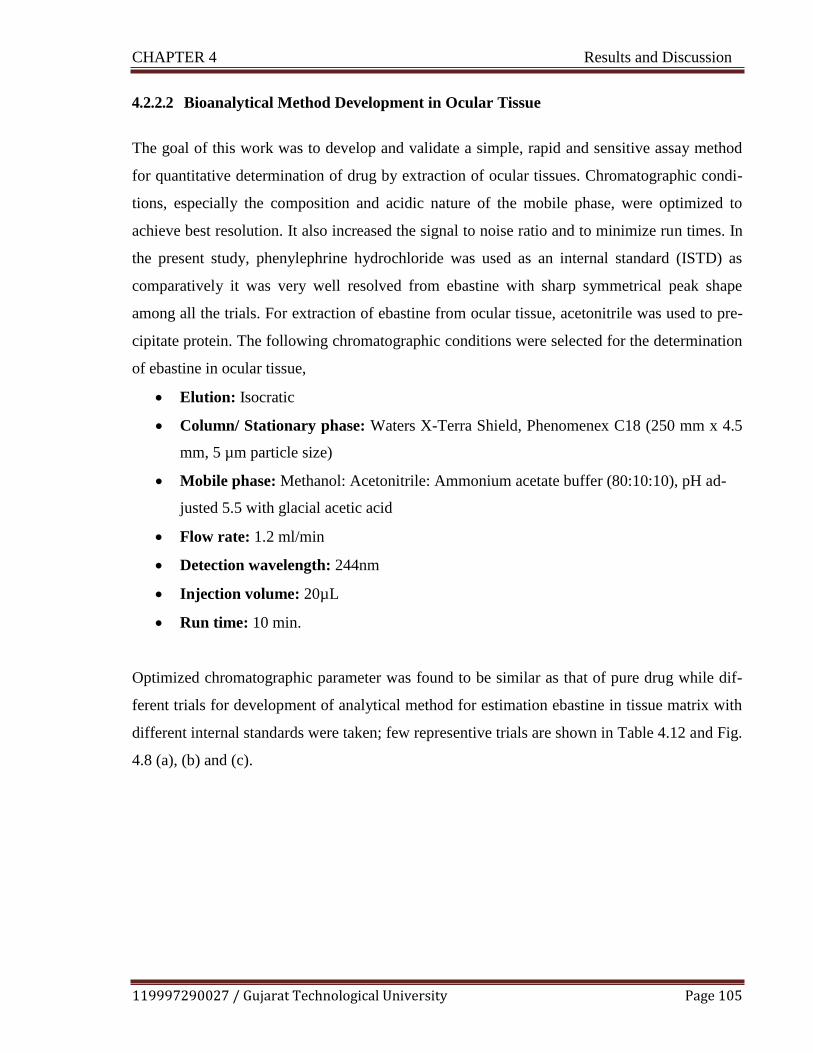
CHAPTER 4 Results and Discussion
119997290027 / Gujarat Technological University Page 105
4.2.2.2 Bioanalytical Method Development in Ocular Tissue
The goal of this work was to develop and validate a simple, rapid and sensitive assay method
for quantitative determination of drug by extraction of ocular tissues. Chromatographic condi-
tions, especially the composition and acidic nature of the mobile phase, were optimized to
achieve best resolution. It also increased the signal to noise ratio and to minimize run times. In
the present study, phenylephrine hydrochloride was used as an internal standard (ISTD) as
comparatively it was very well resolved from ebastine with sharp symmetrical peak shape
among all the trials. For extraction of ebastine from ocular tissue, acetonitrile was used to pre-
cipitate protein. The following chromatographic conditions were selected for the determination
of ebastine in ocular tissue,
Elution: Isocratic
Column/ Stationary phase: Waters X-Terra Shield, Phenomenex C18 (250 mm x 4.5
mm, 5 µm particle size)
Mobile phase: Methanol: Acetonitrile: Ammonium acetate buffer (80:10:10), pH ad-
justed 5.5 with glacial acetic acid
Flow rate: 1.2 ml/min
Detection wavelength: 244nm
Injection volume: 20µL
Run time: 10 min.
Optimized chromatographic parameter was found to be similar as that of pure drug while dif-
ferent trials for development of analytical method for estimation ebastine in tissue matrix with
different internal standards were taken; few representive trials are shown in Table 4.12 and Fig.
4.8 (a), (b) and (c).

CHAPTER 4 Results and Discussion
119997290027 / Gujarat Technological University Page 106
TABLE 4.12 Different experimental trials for RP-HPLC method development
Trials Mobile Phase ISTD Remarks
Trial-1
Methanol:ACN:Ammonium
acetate buffer (80:10:10)
Pheniramine
maleate alone
Peak shape of Pheniramine
maleate was not proper.
Trial-2
Methanol:ACN:Ammonium
acetate buffer (80:10:10)
Phenylephrine
HCL+ Drug
All system suitability param-
eters are in limit.
Trial-3
Methanol:ACN:Ammonium
acetate (80:10:10)
Phenylephrine
HCL + Drug
+Tissue
All three Peaks of drug,
ISTD and tissue were well
separated.
Trial 1:
RP-HPLC Trial of Pheniramine maleate (ISTD) and Ebastine
FIGURE 4.8 (a) Chromatogram of Pheniramine maleate (ISTD)
Trial 2:
RP-HPLC Trial of Phenylephrine Hydrochloride (ISTD) and Ebastine
FIGURE 4.8 (b) Chromatogram of Phenylephrine Hydrochloride (ISTD) and Ebastine

CHAPTER 4 Results and Discussion
119997290027 / Gujarat Technological University Page 107
Trial 3:
RP-HPLC Trial of Phenylephrine Hydrochloride (ISTD), ocular tissue and Ebastine
FIGURE 4.8 (c) Chromatogram of phenylephrine hydrochloride (ISTD) and ebastine in
tissue matrix
a. System Suitability Test for Drug with Internal Standard
System suitability is the test for checking of a system to ensure system performance prior to or
during the analysis of unknown sample. For system suitability test, six chromatogram were tak-
en and observed the parameters like theoretical plate count, tailing factors, resolution and re-
producibility in retention time (RT). The %RSD was calculated. The chromatogram is recorded
in Fig.4.9 and the data of system suitability is shown in Table 4.13.
FIGURE 4.9 Chromatogram of system suitability of ebastine and ISTD

CHAPTER 4 Results and Discussion
119997290027 / Gujarat Technological University Page 108
TABLE 4.13 System suitability parameters of chromatogram for ebastine & ISTD
Inj
no.
RT –
EBA
RT-
ISTD
RESOLUTION
-EBA
Tailing Factor Theoretical Plate
EBA ISTD EBA ISTD
1 7.34 4.06 6.56 1.945 1.421 2532 2501
2 7.347 4.063 6.53 1.972 1.482 2488 2503
3 7.287 4.033 6.696 1.944 1.473 2595 2609
4 7.283 4.037 6.682 1.957 1.411 2645 2567
5 7.353 4.07 6.642 1.972 1.446 2591 2550
6 7.397 4.107 6.543 1.959 1.431 2522 2536
AVG 7.3345 4.06166
Greater
than 2
Less
than 2
Less
than 2
Greater
than
2000
Greater
than 2000
SD 0.0432284 0.02668
RSD 0.5893852 0.65689
Less than 2
Less than 2
b. Linearity and Range
The linearity of an analytical procedure is its ability (within a given range) to obtain test results
which are directly proportional to the concentration (amount) of analyte in the sample. Calibra-
tion curve was constructed by plotting the peak area ratios (analyte/internal standard) v/s con-
centration. The overlay chromatogram obtained for linearity study is shown in Fig. 4.10 (a) and
the calibration plot with regression equation and correlation coefficient was determined as
shown in Fig. 4.10 (b). The calibration plot revealed linearity in the concentration range of 3-
400 ng /ml with the correlation coefficient of 0.991. Table 4.14(a) and 4.14(b) indicate the
sample preparation and area ratios obtained for linearity study respectively.
TABLE 4.14 (a) Sample preparation for linearity study of drug with ISTD
Standard
Working Stock
conc.(µg/ml)
Volume of stock
solution (in µl)
Volume
make up to
Final
Conc.
(ng/ml)
Std 1 100 40 10ml 400
Std 2 100 36 10ml 360
Std 3 100 30 10ml 300
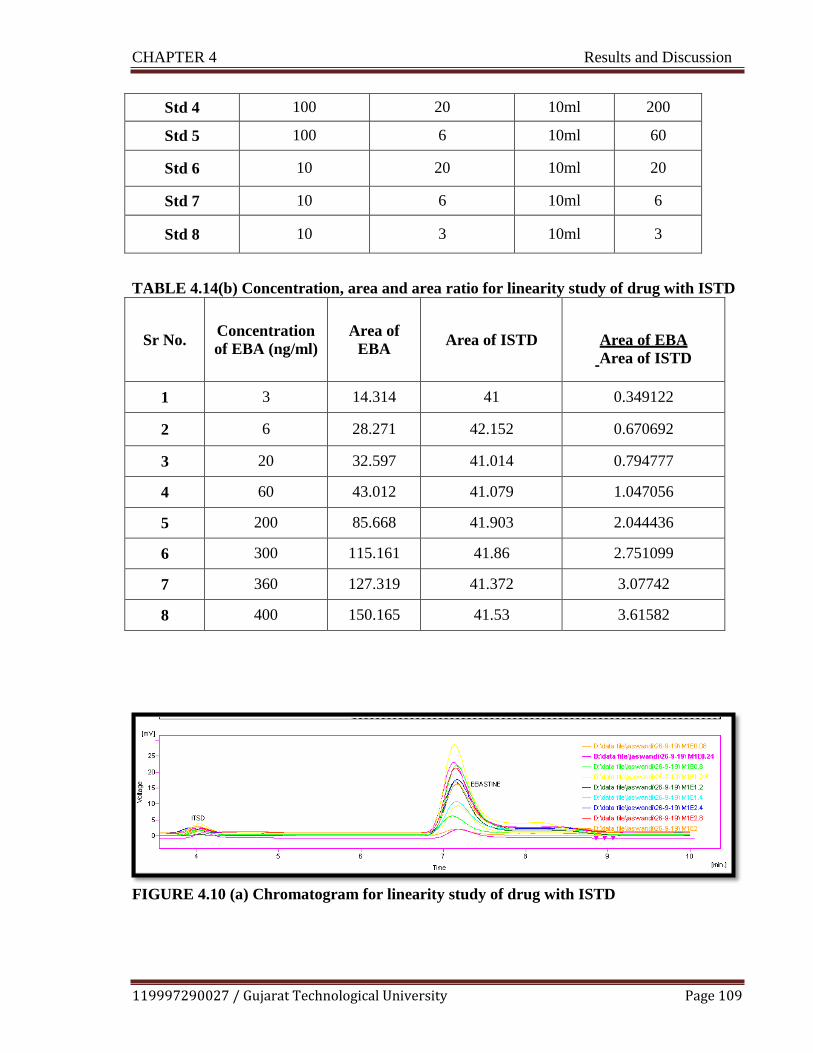
CHAPTER 4 Results and Discussion
119997290027 / Gujarat Technological University Page 109
Std 4 100 20 10ml 200
Std 5 100 6 10ml 60
Std 6 10 20 10ml 20
Std 7 10 6 10ml 6
Std 8 10 3 10ml 3
TABLE 4.14(b) Concentration, area and area ratio for linearity study of drug with ISTD
Sr No.
Concentration
of EBA (ng/ml)
Area of
EBA
Area of ISTD
Area of EBA
Area of ISTD
1 3 14.314 41 0.349122
2 6 28.271 42.152 0.670692
3 20 32.597 41.014 0.794777
4 60 43.012 41.079 1.047056
5 200 85.668 41.903 2.044436
6 300 115.161 41.86 2.751099
7 360 127.319 41.372 3.07742
8 400 150.165 41.53 3.61582
FIGURE 4.10 (a) Chromatogram for linearity study of drug with ISTD

CHAPTER 4 Results and Discussion
119997290027 / Gujarat Technological University Page 110
FIGURE 4.10 (b) Calibration plot for linearity study of drug with ISTD
C. Extraction Trials in Ocular Tissue10,
11
Trial 1:
A 500 µl ocular sample was aliquoted into 5ml eppendorf tube .After that 50µl ISTD was
added, spiked required volume of standard solution of required concentration. All samples
were treated with 1 ml of acetone, vortexed for 2 min and centrifuged for 10min at 5000
RPM at 40C. The supernant was transferred to test tube and injected in to HPLC system.
Trial 2:
A 500 µl ocular sample was aliquoted into 5ml eppendorf tube. After that 50 µl ISTD was
added, spiked required volume of standard solution of required concentration. All samples
were treated with 1 ml of ethyl acetate, vortexed for 2 min and centrifuged for 10 min at
5000 RPM at 40C. The supernant was transferred to test tube and injected in to HPLC sys-
tem.
Trial 3:
A 500 µl ocular sample sample was mixed with 50 µl of ISTD working solution and spiked
required concentration standard solution of drugs. To this, 1 ml of acetonitrile was added.

CHAPTER 4 Results and Discussion
119997290027 / Gujarat Technological University Page 111
After vortex mixing for 2 min and centrifuging at 5000 RPM for 10min at 40C. The super-
nant was transferred to test tube and injected to HPLC system. The observed data for all tri-
als with justification are given below in Table 4.15. The representive chromatogram of drug
in ocular tissue with ISTD is depicted in Fig.4.11.
TABLE 4.15: Data obtained for extraction trails in ocular tissue
Extraction method
Trials
Protein pre-
cipitation
Result
Protein Precipita-
tion method
Trial 1 Acetone Interference of solvent
was observed
Trial 2 Ethyl Acetate Low recovery of ana-
lytes
Trial 3 (Op-
timized
Trial)
Acetonitrile
Good recovery of ana-
lytes and ISTD.
FIGURE 4.11: Chromatogram of drug with ISTD in ocular tissue
Extraction method with acetonitrile as precipitating agent was selected as it gives maximum
recovery as compare to other two solvents.
d. System Suitability Test for Drug with Internal Standard in Ocular Tissue
System suitability is the checking of a system to ensure system performance prior to or during
the analysis of unknowns. For system suitability test the mixture was prepared containing solu-
tion of 4 µg /ml, 8 µg /ml, 12 µg /ml, 4 µg /ml of ebastine and ISTD respectively. The solu-
tions were extracted from ocular tissue by protein precipitation method. After that the six
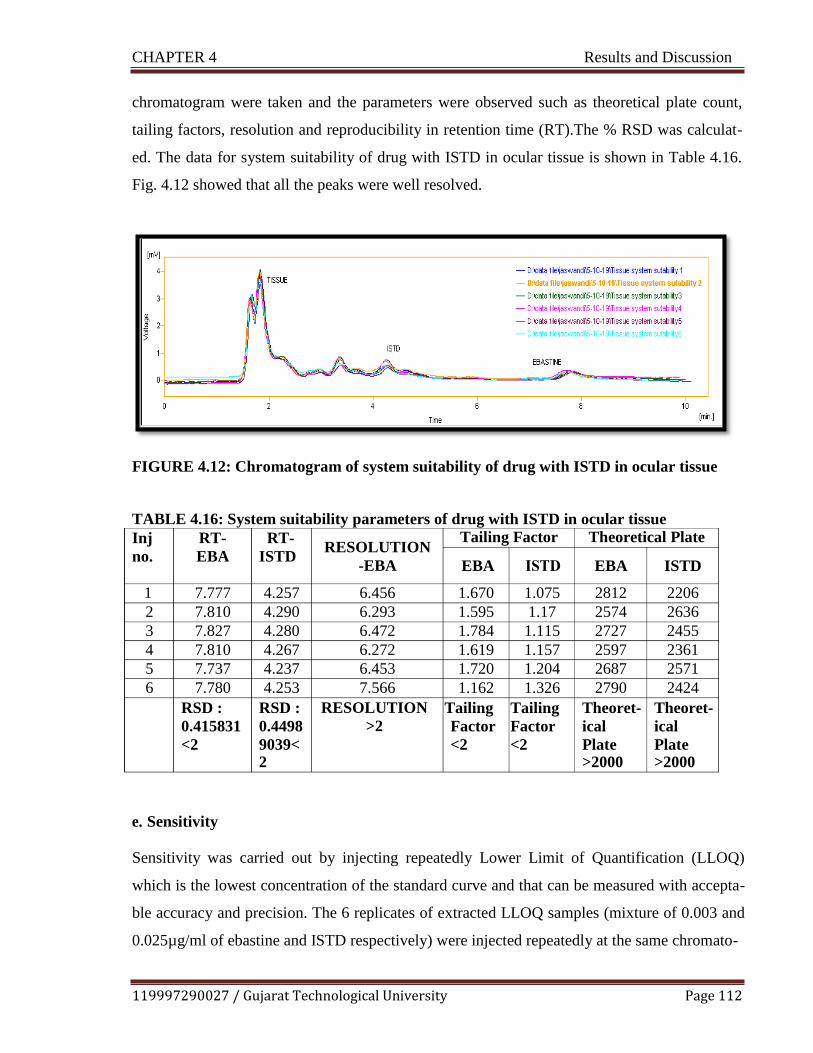
CHAPTER 4 Results and Discussion
119997290027 / Gujarat Technological University Page 112
chromatogram were taken and the parameters were observed such as theoretical plate count,
tailing factors, resolution and reproducibility in retention time (RT).The % RSD was calculat-
ed. The data for system suitability of drug with ISTD in ocular tissue is shown in Table 4.16.
Fig. 4.12 showed that all the peaks were well resolved.
FIGURE 4.12: Chromatogram of system suitability of drug with ISTD in ocular tissue
TABLE 4.16: System suitability parameters of drug with ISTD in ocular tissue
e. Sensitivity
Sensitivity was carried out by injecting repeatedly Lower Limit of Quantification (LLOQ)
which is the lowest concentration of the standard curve and that can be measured with accepta-
ble accuracy and precision. The 6 replicates of extracted LLOQ samples (mixture of 0.003 and
0.025µg/ml of ebastine and ISTD respectively) were injected repeatedly at the same chromato-
Inj
no.
RT-
EBA
RT-
ISTD RESOLUTION
-EBA
Tailing Factor Theoretical Plate
EBA EBA ISTD
1 7.777 4.257 6.456 1.670 1.075 2812 2206
2 7.810 4.290 6.293 1.595 1.17 2574 2636
3 7.827 4.280 6.472 1.784 1.115 2727 2455
4 7.810 4.267 6.272 1.619 1.157 2597 2361
5 7.737 4.237 6.453 1.720 1.204 2687 2571
6 7.780 4.253 7.566 1.162 1.326 2790 2424
RSD :
0.415831
<2
RSD :
0.4498
9039< 2
RESOLUTION
>2
Tailing
Factor
<2
Tailing
Factor
<2
Theoret-
ical
Plate >2000
Theoret-
ical
Plate >2000

CHAPTER 4 Results and Discussion
119997290027 / Gujarat Technological University Page 113
graphic condition and measurements of retention time, peak area, mean and % CV were calcu-
lated. The data of sensitivity is shown in Table 4.17.
TABLE 4.17 Sensitivity data for LLOQ samples
ISTD EBA
RT Area RT Area
1 4.316 15.59 7.075 9.276
2 4.329 13.15 7.391 8.26
3 4.239 17.491 7.14 9.226
4 4.239 11.831 7.377 8.98
5 4.329 10.999 7.375 6.487
6 4.330 12.457 7.47 7.524
%CV 0.9518 18.1794 1.7631 13.3887
It is observed from result table that %CV of RT less than 2 and area for LLOQ sample was
observed within the acceptance range.
f. Linearity and Range
The calibration curve was containing at least 8 non-zero samples, zero sample (matrix
processed with Internal standard) and blank matrix sample. Eight non-zero samples of
0.0625-8 µg/ml and 0.09375-12 µg/ml ebastine and ISTD respectively and each pro-
cessed with 4 µg/ml of ISTD and inject. The blank and zero samples were injected and
analyzed to confirm the absence of direct interference. The non-zero samples analyzed
and plotted. The calibration curve was prepared by area ratio v/s concentration. Table
4.18 indicates area ratios obtained for linearity study in ocular tissue. The overlay chro-
matogram obtained for linearity study is shown in Fig.4.13 (a) and the calibration plot
with regression equation and correlation coefficient was determined as shown in Fig. 4.13
(b).

CHAPTER 4 Results and Discussion
119997290027 / Gujarat Technological University Page 114
TABLE 4 .18 Concentration, area and area ratio for linearity study of drug with ISTD
in ocular tissue
Sr No.
Concentration
of EBA (ng/ml)
Area of EBA
Area of ISTD
Area of EBA
Area of ISTD
1 3 7.314 33.633 0.217465
2 6 24.271 33.881
0.71636
3 20 28.597 32.878 0.869791
4 60 39.012 32.691 1.193356
5 200 81.668 33.643 2.427489
6 300 114.161 34.763 3.28398
7 360 123.319 32.981 3.739092
8 400 146.165 33.803 4.324024
FIGURE 4.13 (a) Overlay chromatogram for linearity study of drug with ISTD in ocular
tissue
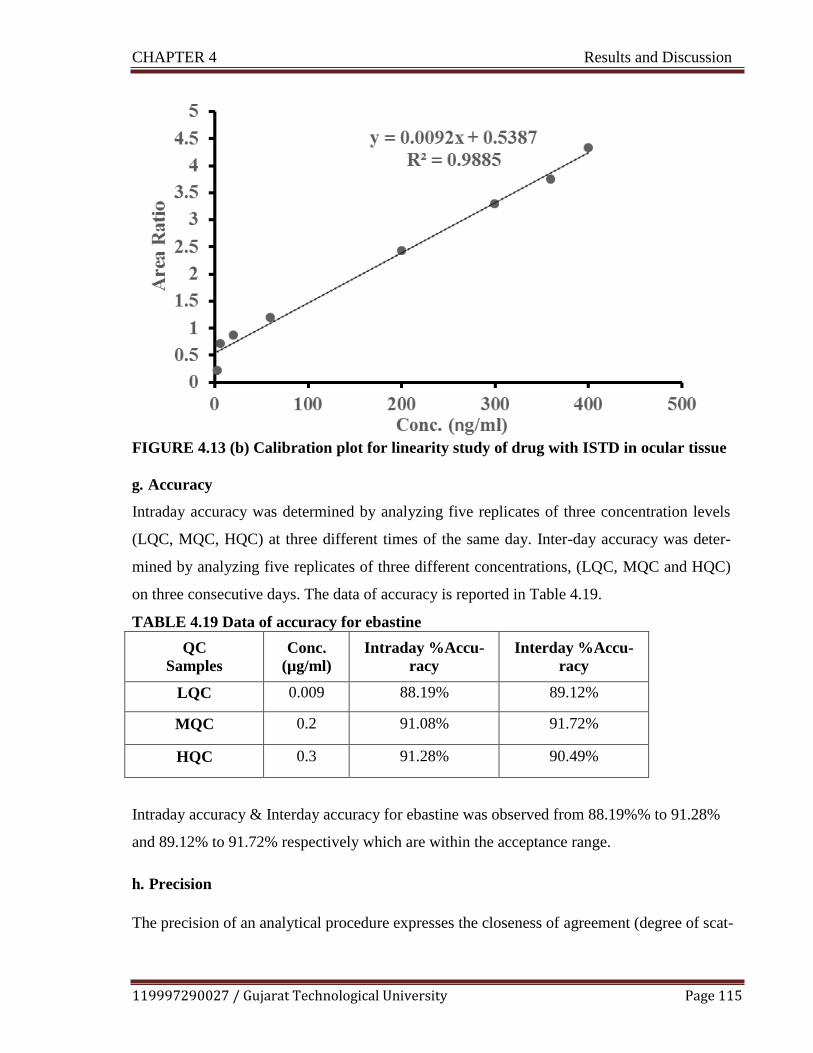
CHAPTER 4 Results and Discussion
119997290027 / Gujarat Technological University Page 115
FIGURE 4.13 (b) Calibration plot for linearity study of drug with ISTD in ocular tissue
g. Accuracy
Intraday accuracy was determined by analyzing five replicates of three concentration levels
(LQC, MQC, HQC) at three different times of the same day. Inter-day accuracy was deter-
mined by analyzing five replicates of three different concentrations, (LQC, MQC and HQC)
on three consecutive days. The data of accuracy is reported in Table 4.19.
TABLE 4.19 Data of accuracy for ebastine
QC
Samples
Conc.
(µg/ml)
Intraday %Accu-
racy
Interday %Accu-
racy
LQC 0.009 88.19% 89.12%
MQC 0.2 91.08% 91.72%
HQC 0.3 91.28% 90.49%
Intraday accuracy & Interday accuracy for ebastine was observed from 88.19%% to 91.28%
and 89.12% to 91.72% respectively which are within the acceptance range.
h. Precision
The precision of an analytical procedure expresses the closeness of agreement (degree of scat-

CHAPTER 4 Results and Discussion
119997290027 / Gujarat Technological University Page 116
ter) between a series of measurements obtained from multiple sampling of the same homoge-
neous sample under the prescribed conditions. Intra-day precision was determined by analyz-
ing five replicates of three different concentrations, (LQC, MQC and HQC) on a single day.
Inter-day precision was determined by analyzing five replicates of three different concentra-
tions, (LQC, MQC and HQC) on three consecutive days. The data of precision is reported in
Table 4.20.
TABLE 4.20 Data of precision for ebastine
QC
Samples
Conc.
(µg/ml)
% CV
(Intra-day precision)
% CV
(Inter-day precision)
LQC 0.009 7.8925 7.6895
MQC 0.2 5.7594 8.1787
HQC 0.3 6.7259 6.6719
The precision determined at each concentration level should not exceed 15% of the coefficient
of variation (%CV) except for the LLOQ, where it should not exceed 20% of the %CV. The
%CV of Intraday precision & Interday precision for HQC, MQC and LQC was observed to be
within acceptance criteria. The data thus obtained demonstrates that method is accurate and
precise for the quantification of ebastine from ocular tissue.
i. Recovery
The extraction recovery was performed to evaluate extraction procedure used to extract ebas-
tine from ocular tissue by developed bioanalytical method. The % recovery determined at
LQC, MQC and HQC are given in Table 4.21 (a), (b) and (c) respectively.

CHAPTER 4 Results and Discussion
119997290027 / Gujarat Technological University Page 117
TABLE 4.21 (a) Data of recovery at LQC
Sr. No
LQC
Area Ratio of Extracted
Area ratio
post extracted % Recovery
1 0.6923 0.7791 88.86%
2 0.6715 0.7801 86.08%
3 0.6801 0.7681 88.55%
4 0.6690 0.7698 86.91%
5 0.6714 0.7618 88.13%
6 0.6800 0.7519 90.44%
Mean 0.677389483 0.768466667 88.16%
SD 0.008686909 0.010669708 0.01531038
%CV 1.282409778 1.388441212 1.73665105
TABLE 4.21 (b) Data of recovery at MQC
Sr. No
MQC
Area
Ratio of Extracted
Area ratio
post extracted
%Recovery
1 2.2272 2.4012 92.75%
2 2.1487 2.3123 92.92%
3 2.1479 2.4012 89.45%
4 2.3442 2.5012 93.72%
5 2.0472 2.2012 93.00%
6 2.2478 2.4005 93.64%
Mean 2.19383333 2.3696 92.58%
SD 0.10225859 0.1018944 0.01584
%CV 4.66118304 4.30006737 1.71097

CHAPTER 4 Results and Discussion
119997290027 / Gujarat Technological University Page 118
TABLE 4.21 (c) Data of recovery at HQC
Sr. No
HQC
Area
Ratio of Extracted
Area ratio
post extracted
%Recovery
1 2.9272 3.2688 89.55%
2 2.8787 3.2674 88.10%
3 2.8981 3.2582 88.95%
4 2.8429 3.2782 86.72%
5 2.9478 3.2682 90.20%
6 2.9471 3.2699 90.13%
Mean 2.906966667 3.26845 88.94%
SD 0.041640349 0.00638 0.013404
%CV 1.432432972 0.195196 1.5071
The overall mean recovery of ebastine was found to be 88.16%, 92.58%, 88.94% at LQC,
MQC and HQC level respectively. The % recovery was observed within range of 15% for
MQC, HQC and within range of 20% for LQC which is within acceptance criteria, indicat-
ing that said extraction procedure used was suitable for measurement of ebastine from tis-
sue matrix.
j. Stability Study
Short term stability, freeze thaw stability, long term stability and stock solution stability
studies were performed as per USFDA Guidelines. The data obtained for different stability
studies are shown in Table 4.22 (a-e)
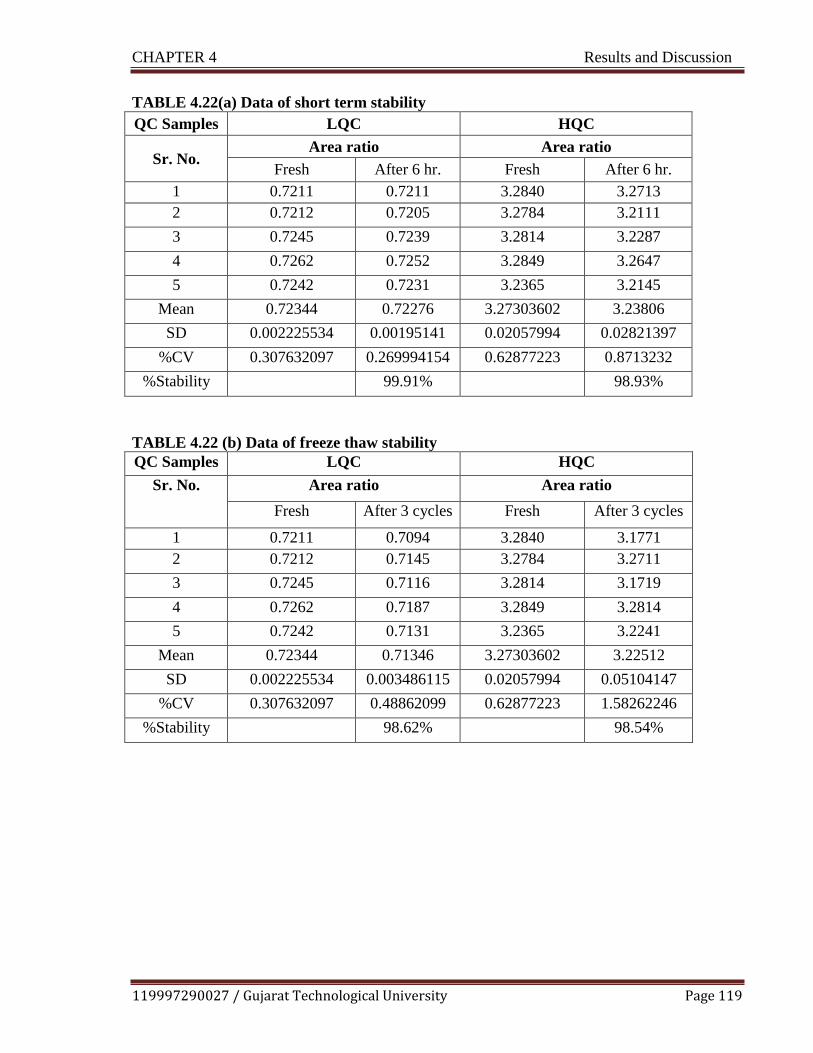
CHAPTER 4 Results and Discussion
119997290027 / Gujarat Technological University Page 119
TABLE 4.22(a) Data of short term stability
QC Samples LQC HQC
Sr. No. Area ratio Area ratio
Fresh After 6 hr. Fresh After 6 hr.
1 0.7211 0.7211 3.2840 3.2713
2 0.7212 0.7205 3.2784 3.2111
3 0.7245 0.7239 3.2814 3.2287
4 0.7262 0.7252 3.2849 3.2647
5 0.7242 0.7231 3.2365 3.2145
Mean 0.72344 0.72276 3.27303602 3.23806
SD 0.002225534 0.00195141 0.02057994 0.02821397
%CV 0.307632097 0.269994154 0.62877223 0.8713232
%Stability 99.91% 98.93%
TABLE 4.22 (b) Data of freeze thaw stability
QC Samples LQC HQC
Sr. No. Area ratio Area ratio
Fresh After 3 cycles Fresh After 3 cycles
1 0.7211 0.7094 3.2840 3.1771
2 0.7212 0.7145 3.2784 3.2711
3 0.7245 0.7116 3.2814 3.1719
4 0.7262 0.7187 3.2849 3.2814
5 0.7242 0.7131 3.2365 3.2241
Mean 0.72344 0.71346 3.27303602 3.22512
SD 0.002225534 0.003486115 0.02057994 0.05104147
%CV 0.307632097 0.48862099 0.62877223 1.58262246
%Stability 98.62% 98.54%

CHAPTER 4 Results and Discussion
119997290027 / Gujarat Technological University Page 120
TABLE 4.22 (c) Data of long term stability
QC Samples LQC HQC
Sr. No. Area ratio Area ratio
Fresh After 7 days Fresh After 7 days
1 0.7211 0.7012 3.2840 3.0547
2 0.7212 0.6991 3.2784 3.0158
3 0.7245 0.6956 3.2814 3.0147
4 0.7262 0.7084 3.2849 3.099483
5 0.7242 0.7019 3.2365 3.2145
Mean 0.72344 0.70124 3.27303602 3.0798366
SD 0.002225534 0.004692867 0.02057994 0.08290887
%CV 0.307632097 0.669224078 0.62877223 2.69198929
%Stability 96.93% 94.10%
TABLE 4.22 (d) Stock solution stability at room temperature after 6 hours
QC Samples LQC HQC
Sr. No. Area ratio Area ratio
Fresh After 6 hr. at
RT
Fresh After 6 hr. at
RT
1 0.7211 0.7059 3.2840 3.1543
2 0.7212 0.7029 3.2784 3.1147
3 0.7245 0.6989 3.2814 3.0258
4 0.7262 0.6859 3.2849 3.1268
5 0.7242 0.7126 3.2365 3.1549
Mean 0.72344 0.70124 3.27303602 3.1153
SD 0.002225534 0.009928645 0.02057994 0.05299061
%CV 0.307632097 1.415869806 0.62877223 1.70097944
%Stability 96.93% 95.18%

CHAPTER 4 Results and Discussion
119997290027 / Gujarat Technological University Page 121
TABLE 4.22 (e) Data of stock solution stability at refrigerated condition (2-8˚C) for 7
days
QC Sam-
ples LQC HQC
Sr. No.
Area ratio Area ratio
Fresh After 7 days at 2-8˚C Fresh After 7 days at
2-8˚C
1 0.7211 0.6933 3.2840 3.1478
2 0.7212 0.6881 3.2784 3.1258
3 0.7245 0.7021 3.2814 3.1879
4 0.7262 0.6981 3.2849 3.1873
5 0.7242 0.6925 3.2365 3.142
Mean 0.72344 0.69482 3.27303602 3.15816
SD 0.002225534 0.005399259 0.02057994 0.0280591
%CV 0.307632097 0.777073085 0.62877223 0.88846348
%Stability 96.04% 96.49%
The data obtained from different stability studies showed that % stability of the mean calcu-
lated concentration of fresh and stability quality control samples found to be ≤ 15% of nomi-
nal value which is within acceptance criteria.
4.2.2.3 Bioanalytical Study of Plasma Sample12
Plasma samples are also subjected to analytical evaluation for determination of drug concentra-
tion using developed HPLC method. As the undertaken drug delivery is categorized under top-
ical, it is necessary to determine of drug concentration in plasma hypothesizing that negligible
or very less drug reaches systemic drug delivery, proving topical utility of undertaken formula-
tion
All chromatographic parameters are same as the method of estimation of drug in tissue except
flow rate. It was from 1.2 ml/min to 0.8 ml/min because at this flow rate, plasma peak was well
resolved from ISTD peak.

CHAPTER 4 Results and Discussion
119997290027 / Gujarat Technological University Page 122
FIGURE 4.14 Chromatogram of drug with ISTD in plasma
a. System Suitability Test for the Drug with Internal Standard in Plasma
System suitability is the checking of a system to ensure system performance prior to or during
the analysis of unknowns. For system suitability test the mixture was prepared containing of
ebastine and ISTD. The solutions were extracted from plasma by protein precipitation meth-
od. After that the six chromatogram were taken and the parameters were observed such as
theoretical plate count, tailing factors, resolution and reproducibility in retention time (RT).
The % RSD was calculated. The data for system suitability of drug with ISTD in plasma is
shown in Table 4.23. Fig. 4.15 showed that all the peaks were well resolved.
FIGURE 4.15 Chromatogram of system suitability of drug with ISTD in plasma
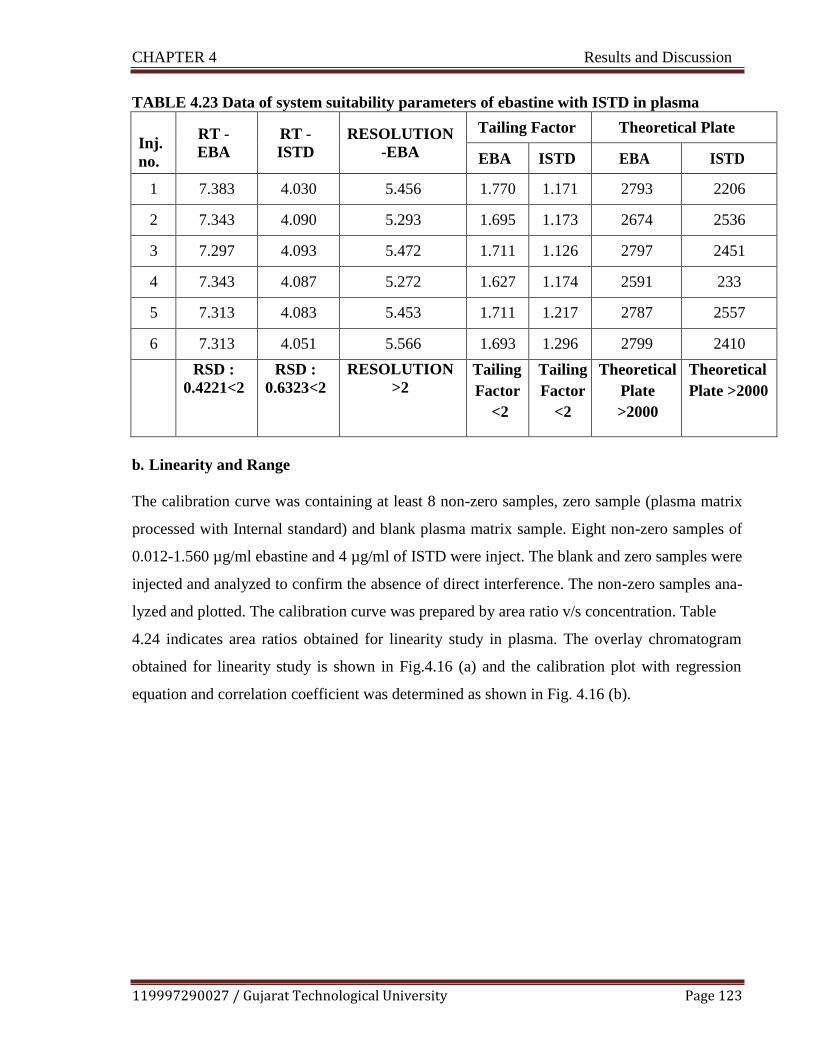
CHAPTER 4 Results and Discussion
119997290027 / Gujarat Technological University Page 123
TABLE 4.23 Data of system suitability parameters of ebastine with ISTD in plasma
Inj.
no.
RT -
EBA
RT -
ISTD
RESOLUTION
-EBA
Tailing Factor Theoretical Plate
EBA ISTD EBA ISTD
1 7.383 4.030 5.456 1.770 1.171 2793 2206
2 7.343 4.090 5.293 1.695 1.173 2674 2536
3 7.297 4.093 5.472 1.711 1.126 2797 2451
4 7.343 4.087 5.272 1.627 1.174 2591 233
5 7.313 4.083 5.453 1.711 1.217 2787 2557
6 7.313 4.051 5.566 1.693 1.296 2799 2410
RSD :
0.4221<2
RSD :
0.6323<2
RESOLUTION
>2
Tailing
Factor
<2
Tailing
Factor
<2
Theoretical
Plate
>2000
Theoretical
Plate >2000
b. Linearity and Range
The calibration curve was containing at least 8 non-zero samples, zero sample (plasma matrix
processed with Internal standard) and blank plasma matrix sample. Eight non-zero samples of
0.012-1.560 µg/ml ebastine and 4 µg/ml of ISTD were inject. The blank and zero samples were
injected and analyzed to confirm the absence of direct interference. The non-zero samples ana-
lyzed and plotted. The calibration curve was prepared by area ratio v/s concentration. Table
4.24 indicates area ratios obtained for linearity study in plasma. The overlay chromatogram
obtained for linearity study is shown in Fig.4.16 (a) and the calibration plot with regression
equation and correlation coefficient was determined as shown in Fig. 4.16 (b).

CHAPTER 4 Results and Discussion
119997290027 / Gujarat Technological University Page 124
TABLE 4.24 Concentration, area and area ratio for linearity study drug with ISTD in
plasma
Sr
No.
Concentration of
EBA(µg/ml)
Area of EBA
Area of ISTD
Area of EBA
Area of ISTD
1 0.012 41 8.314 0.20278
2 0.024 42.152 24.271 0.575797
3 0.078 41.014 32.597 0.794777
4 0.234 41.079 48.012 1.168772
5 0.780 41.903 90.668 2.163759
6 1.170 41.86 114.161 2.72721
7 1.404 41.372 127.319 3.07742
8 1.560 41.53 150.165 3.61582
FIGURE 4.16(a) Overlay chromatogram for linearity study of drug with ISTD in plasma

CHAPTER 4 Results and Discussion
119997290027 / Gujarat Technological University Page 125
FIGURE 4.16(b) Calibration plot for linearity study of drug with ISTD in plasma
The developed method validated for different validation parameters like accuracy, precision,
sensitivity, recovery and stability.
4.3 Screening of Components of Microemulsion
The most primary criteria for selection of the components were that all the components are
pharmaceutically acceptable for ocular administration and fall under GRAS (generally recog-
nized as safe) category. The major components for microemulsion formulation include the
drug, oil, surfactants and cosurfactants.13
After performing preliminary identification test on
drug, various components were screened for further proposed formulation. The rationale be-
hind selection based on maximum solubility of drug, compatibility and safety status.
4.3.1 Selection of Oil
The selection of the oil was primarily depends on the solubility of the drug in oil in order to
increase maximum drug loading potential. The solubility of drug was determined in eight dif-
ferent oils- Campul MCM EP, Oleic acid, Isopropyl palmitate, Arachis oil, Linseed oil, Light
liquid paraffin, Labrafac and ethyl oleate. The result obtained are summarized in Table 4.25

CHAPTER 4 Results and Discussion
119997290027 / Gujarat Technological University Page 126
and Fig 4.17.
TABLE 4.25 Selection of oil based on solubility of drug in oil
Sr No Oil Solubility (mg/ml)
Mean ± SD
1 Capmul MCM EP 28.5 ± 0.2
2 Oleic acid 15 ± 0.1
3 Isopropyl palmitate 10 ± 0.11
4 Arachis oil 08 ± 0.2
5 Linseed oil 11.5 ± 0.3
6 Light liq. Paraffin 14.3 ± 0.12
7 Labrafac 11.6 ± 0.2
8 Ethyl Oleate 12.4 ± 0.92
FIGURE 4.17 Solubility of ebastine in different oils
Amongst various oils tested, ebastine showed maximum solubility in Campul MCM EP (28.5
± 0.2 mg/ ml). While light liquid paraffin and ethyl oleate showed next highest solubilizing
capacity of 14.3 ± 0.12 mg/ml, 12.4 ± 0.92mg/ml respectively. Campul MCM EP is reported
to be used for ophthalmic microemulsion formulation.14,15
High molecular weight oil exhibit
difficulty in formation of microemulsion as they contain long chain fatty acids which shows
difficulty in penetration of the interfacial film formed by surfactant and cosurfactant which

CHAPTER 4 Results and Discussion
119997290027 / Gujarat Technological University Page 127
assist in optimal curvature formation. Campul MCM EP is a mono-diglyceride of medium
chain fatty acids (mainly caprylic and capric) and categorized as small molecular weight tri-
glycerides.
4.3.2 Selection of Surfactant
The most critical problem related to the microemulsion formulation is the toxicity of the sur-
factants that may cause ocular irritation. Therefore, it is very important to select suitable sur-
factant as well as use the minimum concentration of it in the formulation. Non-ionic surfac-
tants are comparatively less toxic and have minimum irritation potential than their ionic coun-
terpart. They are also less affected by pH and changes in ionic strength. Another important
parameter need to consider during selection of surfactant is the HLB value.16,
17
Once oil has
been selected, next goal was to identify the surfactant that has highest capacity for solubiliza-
tion of drug. In this study, various surfactants were tried for maximum solubility potential of
drug- Labrasol, Tween 80, tween 20, Span 80, Cremophore EL, and Lauroglycol FCC. The
results are summarized in Table 4.26 and Fig. 4.18
TABLE 4.26 Selection of surfactant based on solubility of drug in surfactant
Sr No Surfactant Solubility (mg/ml)
Mean ± SD
1 Labrasol 23.1 ± 0.3
2 Tween 80 19.8 ± 0.1
3 Tween 20 12.3 ± 0.4
4 Span 80 9.2 ± 0.21
5 Cremophor EL 14.7 ± 0.29
6 Lauroglycol FCC 15.5 ± 0.58
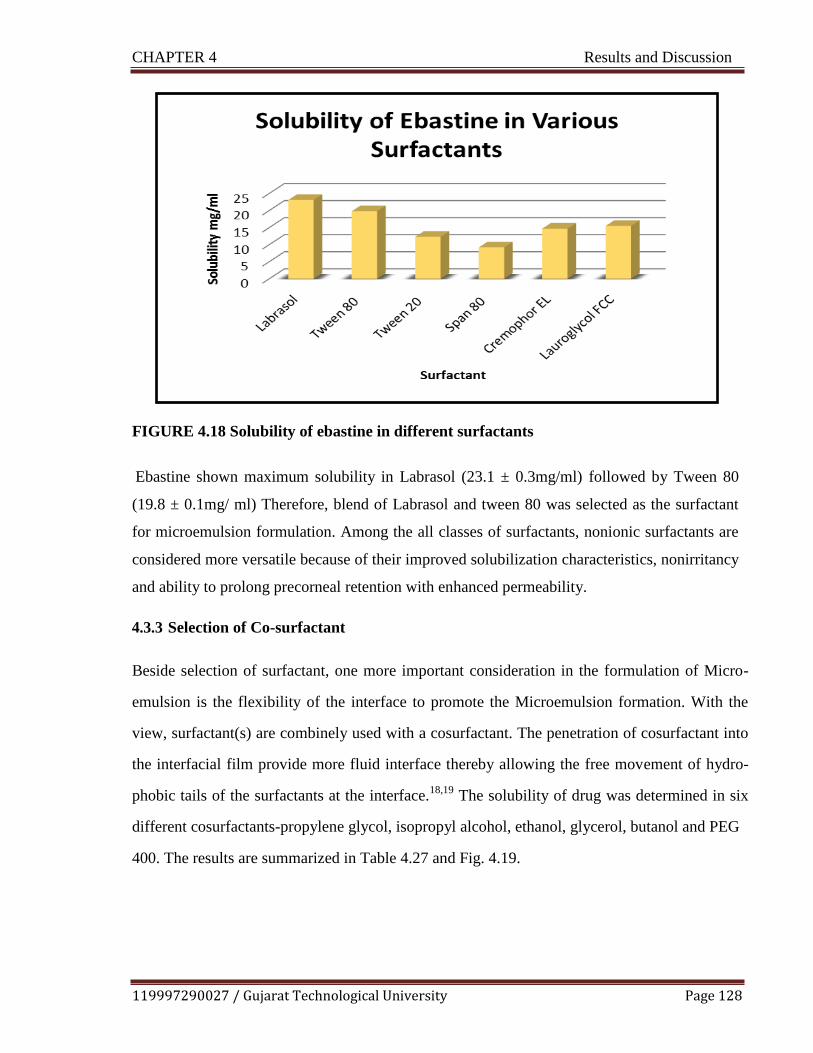
CHAPTER 4 Results and Discussion
119997290027 / Gujarat Technological University Page 128
FIGURE 4.18 Solubility of ebastine in different surfactants
Ebastine shown maximum solubility in Labrasol (23.1 ± 0.3mg/ml) followed by Tween 80
(19.8 ± 0.1mg/ ml) Therefore, blend of Labrasol and tween 80 was selected as the surfactant
for microemulsion formulation. Among the all classes of surfactants, nonionic surfactants are
considered more versatile because of their improved solubilization characteristics, nonirritancy
and ability to prolong precorneal retention with enhanced permeability.
4.3.3 Selection of Co-surfactant
Beside selection of surfactant, one more important consideration in the formulation of Micro-
emulsion is the flexibility of the interface to promote the Microemulsion formation. With the
view, surfactant(s) are combinely used with a cosurfactant. The penetration of cosurfactant into
the interfacial film provide more fluid interface thereby allowing the free movement of hydro-
phobic tails of the surfactants at the interface.18,19
The solubility of drug was determined in six
different cosurfactants-propylene glycol, isopropyl alcohol, ethanol, glycerol, butanol and PEG
400. The results are summarized in Table 4.27 and Fig. 4.19.

CHAPTER 4 Results and Discussion
119997290027 / Gujarat Technological University Page 129
TABLE 4.27 Selection of co-surfactant based on solubility of drug in co-surfactant
Sr. No. Co-Surfactant Solubility (mg/ml)
Mean ± SD
1 Propylene glycol 18.2 ± 0.1
2 Isopropyl alcohol 14.7 ± 0.2
3 Ethanol 12.9 ± 0.11
4 Glycerol 11.9 ± 0.25
5 Butanol 13.7 ± 0.36
6 PEG 400 11.1 ± 0.72
FIGURE 4.19 Solubility of ebastine in different co-surfactants
Amongst co surfactant tested, maximum solubility of drug obtained in propylene glycol (18.2 ±
0.1mg/ml) followed by alcohols. Amongst various S mix blends, propylene glycol, isopropyl
alcohol and ethanol forms transparent system with 98.21%T, 99.01%T, and 99.17% T respec-
tively compared to other tested cosurfactants with selected surfactant. Due to ocular compatibil-
ity and volatility issue, selection of any alcohol as microemulsion component was prohibited.
Therefore, blend propylene glycol and glycerol was selected as the co-surfactant for microemul-
sion formulation. Moreover, glycerol will help in maintaining osmolarity of formulation.20

CHAPTER 4 Results and Discussion
119997290027 / Gujarat Technological University Page 130
4.3.4 Drug Excipient Compatibility Study
IR spectra of pure drug ebastine, optimized formulation and physical mixture of ebastine and
gelling polymer, methyl cellulose, sodium hyaluronate are shown in Fig. 4.20.
a. Drug + Oil (Campul MCM EP) b. Drug+ surfactant ( Labrasol)
c. Drug+ surfactant (Tween 80) d. Drug+ co surfactant (propylene glycol)
e. Drug+ co surfactant (Glycerol) f. Optimized Microemulsion formulation
FIGURE 4.20 IR spectra for drug excipient compatibility

CHAPTER 4 Results and Discussion
119997290027 / Gujarat Technological University Page 131
It was observed from Fig.4.20, that all characteristic peaks of the ebastine were found in the IR
spectra of screened excipient and drug mixture as well as optimized formulation indicating the
compatibility/no interaction of the drug with the screened excipients.
4.3.5 Differential Scanning Calorimetry Study
The Differential scanning calorimetry (DSC) thermograms are taken to characterize the physical
state of drug in the polymer matrix, temperature dependent conformational changes and to as-
sess incompatibility, if any. In the present work, thermal behavior of drug and physical mixture
of drug and polymer determined by DSC. The thermogram of pure ebastine (Fig 4.3 as shown
previous) exhibited a sharp endothermic peak at 88.690C equivalent to its reference melting
point 80-820C, representing crystalline state of drug sample. The thermogram of physical mix-
ture of polymer (sodium hyaluronate and carboxyl methyl cellulose) and drug (ebastine) showed
the peaks at 252.30 °C and 273.64 °C. Appearance of no new peak and absence of any potential
shift in peak of drug in physical mixture shown in Fig.4.21 indicates compatibility of ebastine with
polymers and was confirmed FTIR as well as DSC study
FIGURE 4.21 DSC Thermogram of physical mixture (drug + polymers
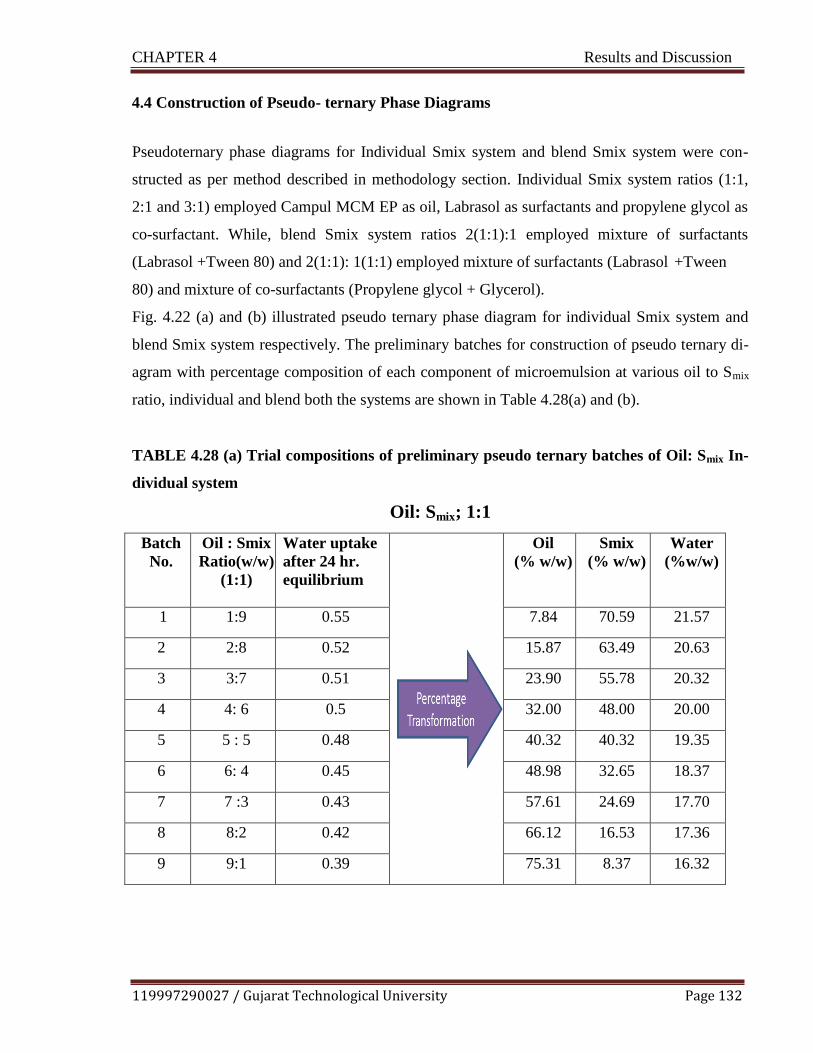
CHAPTER 4 Results and Discussion
119997290027 / Gujarat Technological University Page 132
4.4 Construction of Pseudo- ternary Phase Diagrams
Pseudoternary phase diagrams for Individual Smix system and blend Smix system were con-
structed as per method described in methodology section. Individual Smix system ratios (1:1,
2:1 and 3:1) employed Campul MCM EP as oil, Labrasol as surfactants and propylene glycol as
co-surfactant. While, blend Smix system ratios 2(1:1):1 employed mixture of surfactants
(Labrasol +Tween 80) and 2(1:1): 1(1:1) employed mixture of surfactants (Labrasol +Tween
80) and mixture of co-surfactants (Propylene glycol + Glycerol).
Fig. 4.22 (a) and (b) illustrated pseudo ternary phase diagram for individual Smix system and
blend Smix system respectively. The preliminary batches for construction of pseudo ternary di-
agram with percentage composition of each component of microemulsion at various oil to Smix
ratio, individual and blend both the systems are shown in Table 4.28(a) and (b).
TABLE 4.28 (a) Trial compositions of preliminary pseudo ternary batches of Oil: Smix In-
dividual system
Oil: Smix; 1:1
Batch
No.
Oil : Smix
Ratio(w/w)
(1:1)
Water uptake
after 24 hr.
equilibrium
Oil
(% w/w)
Smix
(% w/w)
Water
(%w/w)
1 1:9 0.55 7.84 70.59 21.57
2 2:8 0.52 15.87 63.49 20.63
3 3:7 0.51 23.90 55.78 20.32
4 4: 6 0.5 32.00 48.00 20.00
5 5 : 5 0.48 40.32 40.32 19.35
6 6: 4 0.45 48.98 32.65 18.37
7 7 :3 0.43 57.61 24.69 17.70
8 8:2 0.42 66.12 16.53 17.36
9 9:1 0.39 75.31 8.37 16.32
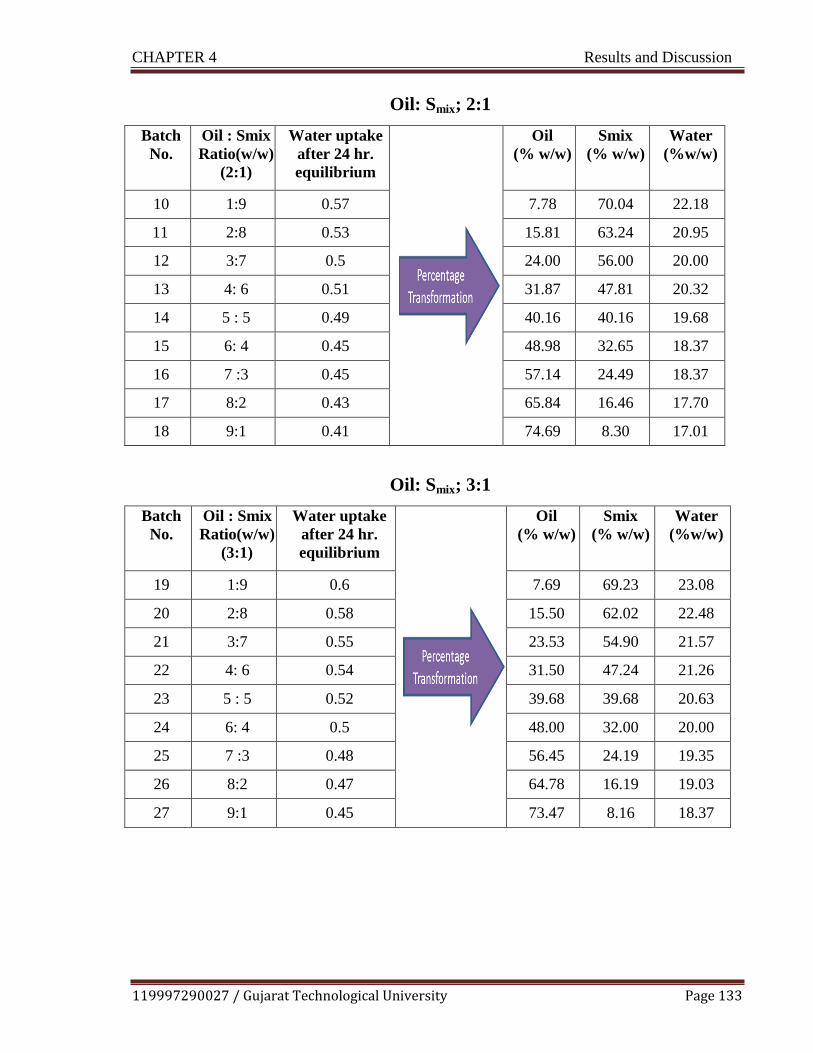
CHAPTER 4 Results and Discussion
119997290027 / Gujarat Technological University Page 133
Oil: Smix; 2:1
Batch
No.
Oil : Smix
Ratio(w/w)
(2:1)
Water uptake
after 24 hr.
equilibrium
Oil
(% w/w)
Smix
(% w/w)
Water
(%w/w)
10 1:9 0.57 7.78 70.04 22.18
11 2:8 0.53 15.81 63.24 20.95
12 3:7 0.5 24.00 56.00 20.00
13 4: 6 0.51 31.87 47.81 20.32
14 5 : 5 0.49 40.16 40.16 19.68
15 6: 4 0.45 48.98 32.65 18.37
16 7 :3 0.45 57.14 24.49 18.37
17 8:2 0.43 65.84 16.46 17.70
18 9:1 0.41 74.69 8.30 17.01
Oil: Smix; 3:1
Batch
No.
Oil : Smix
Ratio(w/w)
(3:1)
Water uptake
after 24 hr.
equilibrium
Oil
(% w/w)
Smix
(% w/w)
Water
(%w/w)
19 1:9 0.6 7.69 69.23 23.08
20 2:8 0.58 15.50 62.02 22.48
21 3:7 0.55 23.53 54.90 21.57
22 4: 6 0.54 31.50 47.24 21.26
23 5 : 5 0.52 39.68 39.68 20.63
24 6: 4 0.5 48.00 32.00 20.00
25 7 :3 0.48 56.45 24.19 19.35
26 8:2 0.47 64.78 16.19 19.03
27 9:1 0.45 73.47 8.16 18.37
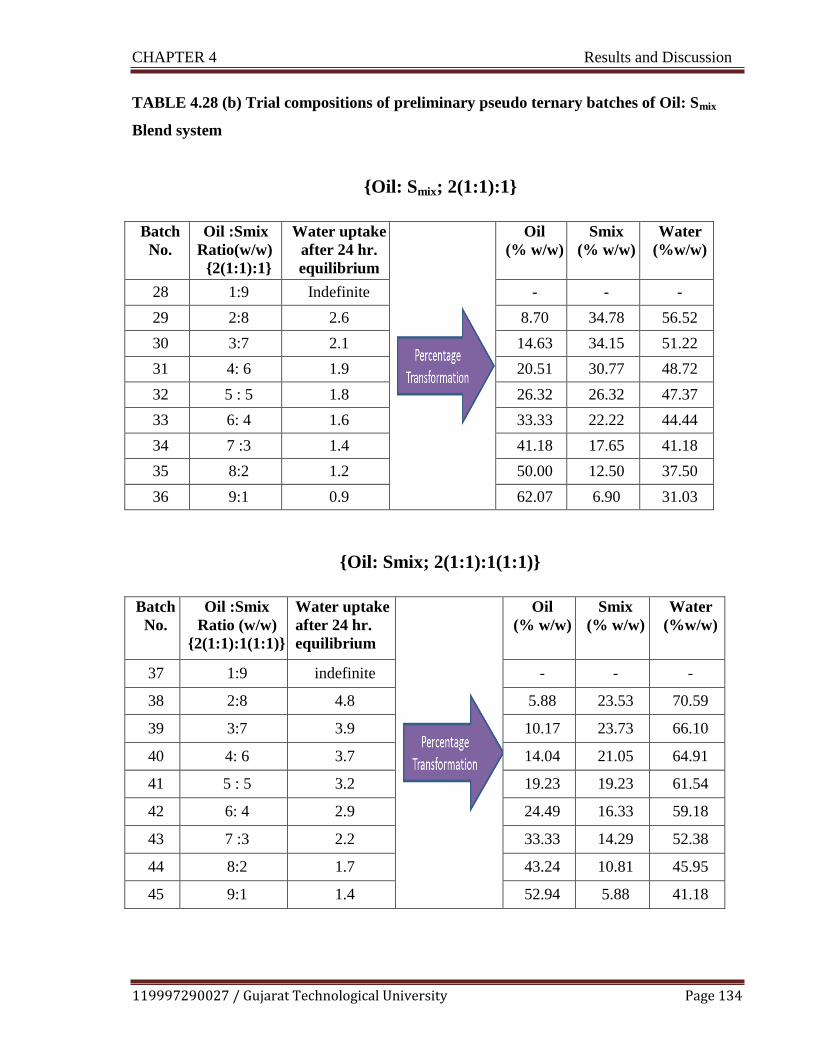
CHAPTER 4 Results and Discussion
119997290027 / Gujarat Technological University Page 134
TABLE 4.28 (b) Trial compositions of preliminary pseudo ternary batches of Oil: Smix
Blend system
{Oil: Smix; 2(1:1):1}
Batch
No.
Oil :Smix
Ratio(w/w)
{2(1:1):1}
Water uptake
after 24 hr.
equilibrium
Oil
(% w/w)
Smix
(% w/w)
Water
(%w/w)
28 1:9 Indefinite - - -
29 2:8 2.6 8.70 34.78 56.52
30 3:7 2.1 14.63 34.15 51.22
31 4: 6 1.9 20.51 30.77 48.72
32 5 : 5 1.8 26.32 26.32 47.37
33 6: 4 1.6 33.33 22.22 44.44
34 7 :3 1.4 41.18 17.65 41.18
35 8:2 1.2 50.00 12.50 37.50
36 9:1 0.9 62.07 6.90 31.03
{Oil: Smix; 2(1:1):1(1:1)}
Batch
No.
Oil :Smix
Ratio (w/w)
{2(1:1):1(1:1)}
Water uptake
after 24 hr.
equilibrium
Oil
(% w/w)
Smix
(% w/w)
Water
(%w/w)
37 1:9 indefinite - - -
38 2:8 4.8 5.88 23.53 70.59
39 3:7 3.9 10.17 23.73 66.10
40 4: 6 3.7 14.04 21.05 64.91
41 5 : 5 3.2 19.23 19.23 61.54
42 6: 4 2.9 24.49 16.33 59.18
43 7 :3 2.2 33.33 14.29 52.38
44 8:2 1.7 43.24 10.81 45.95
45 9:1 1.4 52.94 5.88 41.18

CHAPTER 4 Results and Discussion
119997290027 / Gujarat Technological University Page 135
FIGURE 4.22 (a) Pseudo Ternary Diagram of Oil: Smix individual system (1:1), (2:1),
(3:1), composed of oil (Campul MCM EP), surfactant (Labrasol) and co-surfactant (pro-
pylene glycol)
FIGURE 4.22 (b) Pseudo Ternary Diagram of Oil: Smix Blend system 2(1:1):1, composed
of oil (Campul MCM EP), surfactants (Labrasol +Tween 8) and co-surfactant (propylene
glycol); 2(1:1): 1(1:1), composed of oil (Campul MCM EP), surfactants (Labrasol +Tween
8) and co-surfactants (propylene glycol+ Glycerol)
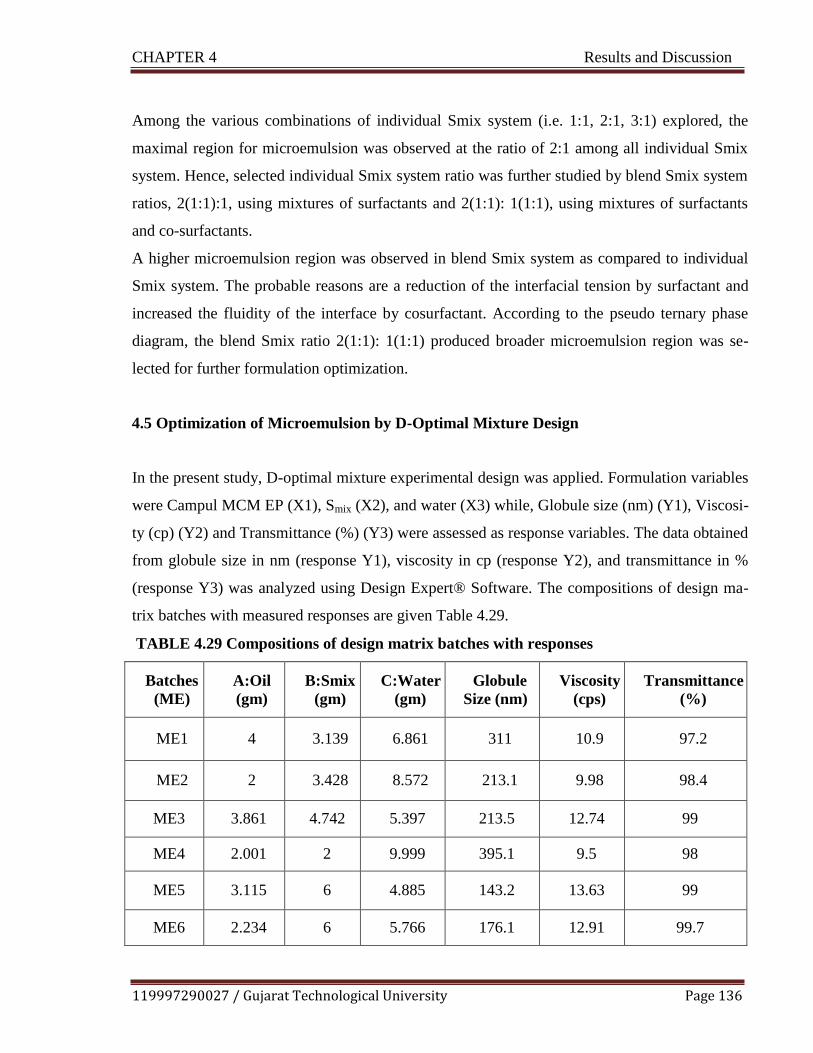
CHAPTER 4 Results and Discussion
119997290027 / Gujarat Technological University Page 136
Among the various combinations of individual Smix system (i.e. 1:1, 2:1, 3:1) explored, the
maximal region for microemulsion was observed at the ratio of 2:1 among all individual Smix
system. Hence, selected individual Smix system ratio was further studied by blend Smix system
ratios, 2(1:1):1, using mixtures of surfactants and 2(1:1): 1(1:1), using mixtures of surfactants
and co-surfactants.
A higher microemulsion region was observed in blend Smix system as compared to individual
Smix system. The probable reasons are a reduction of the interfacial tension by surfactant and
increased the fluidity of the interface by cosurfactant. According to the pseudo ternary phase
diagram, the blend Smix ratio 2(1:1): 1(1:1) produced broader microemulsion region was se-
lected for further formulation optimization.
4.5 Optimization of Microemulsion by D-Optimal Mixture Design
In the present study, D-optimal mixture experimental design was applied. Formulation variables
were Campul MCM EP (X1), Smix (X2), and water (X3) while, Globule size (nm) (Y1), Viscosi-
ty (cp) (Y2) and Transmittance (%) (Y3) were assessed as response variables. The data obtained
from globule size in nm (response Y1), viscosity in cp (response Y2), and transmittance in %
(response Y3) was analyzed using Design Expert® Software. The compositions of design ma-
trix batches with measured responses are given Table 4.29.
TABLE 4.29 Compositions of design matrix batches with responses
Batches
(ME)
A:Oil
(gm)
B:Smix
(gm)
C:Water
(gm)
Globule
Size (nm)
Viscosity
(cps)
Transmittance
(%)
ME1 4 3.139 6.861 311 10.9 97.2
ME2 2 3.428 8.572 213.1 9.98 98.4
ME3 3.861 4.742 5.397 213.5 12.74 99
ME4 2.001 2 9.999 395.1 9.5 98
ME5 3.115 6 4.885 143.2 13.63 99
ME6 2.234 6 5.766 176.1 12.91 99.7
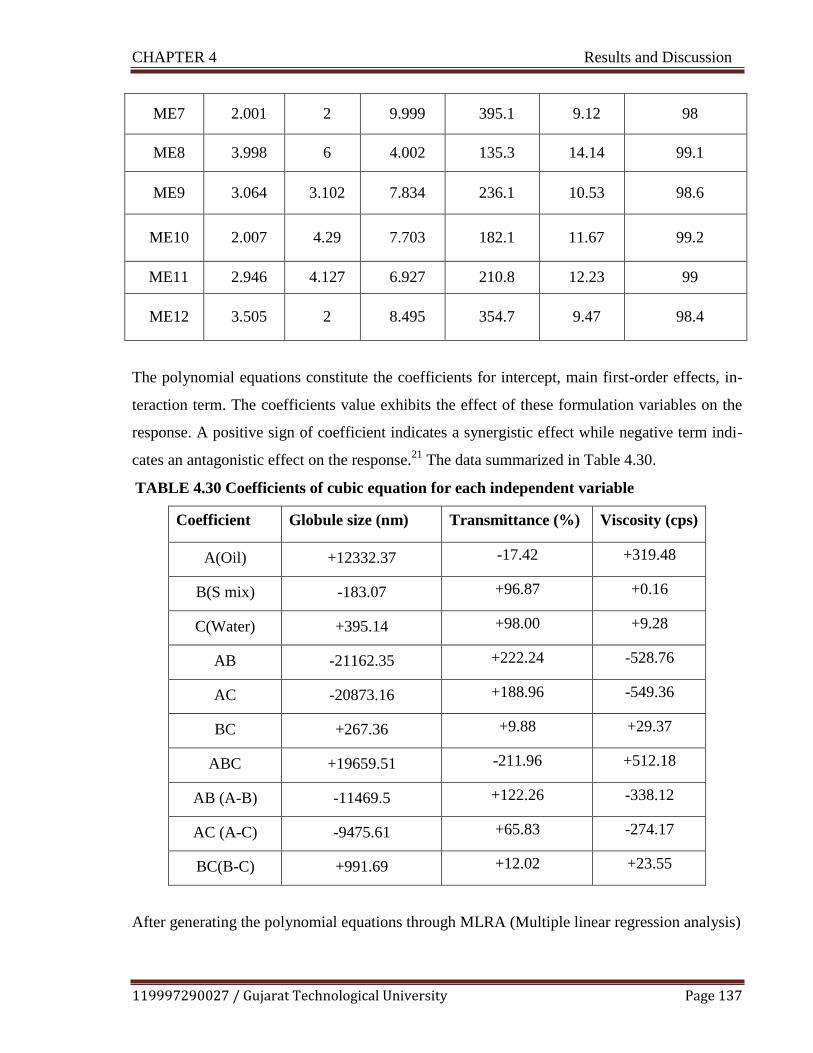
CHAPTER 4 Results and Discussion
119997290027 / Gujarat Technological University Page 137
ME7 2.001 2 9.999 395.1 9.12 98
ME8 3.998 6 4.002 135.3 14.14 99.1
ME9 3.064 3.102 7.834 236.1 10.53 98.6
ME10 2.007 4.29 7.703 182.1 11.67 99.2
ME11 2.946 4.127 6.927 210.8 12.23 99
ME12 3.505 2 8.495 354.7 9.47 98.4
The polynomial equations constitute the coefficients for intercept, main first-order effects, in-
teraction term. The coefficients value exhibits the effect of these formulation variables on the
response. A positive sign of coefficient indicates a synergistic effect while negative term indi-
cates an antagonistic effect on the response.21
The data summarized in Table 4.30.
TABLE 4.30 Coefficients of cubic equation for each independent variable
Coefficient Globule size (nm) Transmittance (%) Viscosity (cps)
A(Oil) +12332.37 -17.42 +319.48
B(S mix) -183.07 +96.87 +0.16
C(Water) +395.14 +98.00 +9.28
AB -21162.35 +222.24 -528.76
AC -20873.16 +188.96 -549.36
BC +267.36 +9.88 +29.37
ABC +19659.51 -211.96 +512.18
AB (A-B) -11469.5 +122.26 -338.12
AC (A-C) -9475.61 +65.83 -274.17
BC(B-C) +991.69 +12.02 +23.55
After generating the polynomial equations through MLRA (Multiple linear regression analysis)

CHAPTER 4 Results and Discussion
119997290027 / Gujarat Technological University Page 138
relating the dependent and independent variables, mixture components were optimized for the
responses. The values of all the responses were fitted to models viz. linear, quadratic, special
cubic and cubic model where the best fit model was found to be cubic model for all the re-
sponses as compared to other models as shown in Table 4.31.
TABLE 4.31 Summary of regression analysis for all responses
Model Std. Dev. R-Squared Adjusted R-
Squared
Predicted
R-Squared Remark
Response 1 Globule size(nm)
Linear 41.60808297 0.837278282 0.8011179 0.715878822
Quadratic 32.84677275 0.932394153 0.876055946 0.63422757
Special Cubic 14.55714352 0.988934528 0.975655962 0.936588798
Cubic 1.573384878 0.999948293 0.999715613 0.881835238 Suggested
Response 2 Viscosity (cps)
Linear 0.356569823 0.965192595 0.957457616 0.941721624
Quadratic 0.364390049 0.975766049 0.955571089 0.933770144
Special Cubic 0.392523532 0.976566273 0.948445801 0.904700682
Cubic 0.321333363 0.993718236 0.9654503 0.954526667 Suggested
Response 3 Transmittance (%)
Linear 0.438370154 0.65729547 0.581138908 0.327795929
Quadratic 0.476286834 0.730298239 0.505546771 -0.52049235
Special Cubic 0.459194362 0.791090361 0.540398794 -0.90850877
Cubic 0.024307431 0.999765845 0.998712147 0.464988912 Suggested
R
2 values were reported resemble to unity indicating the high predictive ability of Response
Surface Methodology (RSM) of underlying study. Further, the higher values (>4) of ―Adequate
Precision‖ indicate adequate signal for suitable model selection.22
Fig. 4.23 (a-i, ii), 4.23 (b-i, ii) and 4.23 (c-i, ii) shows contour, 3D response curve for depend-
ent variables viz. globule size (nm), viscosity (cps) and transmittance (%) respectively. It can
be observed from the response variables plots of Globule size that as the concentration of oil

CHAPTER 4 Results and Discussion
119997290027 / Gujarat Technological University Page 139
increases, globule size also increases while the concentration of Smix increase then globule
size decreases. It can be observed from the response variables plots of viscosity that as the
concentration of Smix increases and decrease in amount of water, viscosity increases. It can be
observed from the response variables plots of transmittance that as the concentration of oil in-
creases % transmittance decreases and Smix increases % transmittance increases. Moreover,
linear correlation was found analogous for actual response and predicated response {Figure
4.23 (a-iii), 4.23 (b-iii), 4.23 (c-iii)}. The reliability of these response surfaces was also con-
firmed by the corresponding residual plot between the experimental run and the internally stu-
dentized residuals for all response variables, as shown in Figure {Figure 4.23 (a-iv), 4.23 (b-
iv), 4.23 (c-iv) } The vertical distribution of the internally studentized residuals was in line
from top to bottom under the completely randomized run. These findings revealed that all
points fall within a confidence interval of 95 %. The ANOVA analysis for globule size, viscos-
ity, % transmittance shown in Table 4.32 (a), (b) and (c).
TABLE 4.32(a) Data of ANOVA table for globule size (Y1)
ANOVA for Response Surface Cubic Model
Source Sum of
Squares
df Mean
Square
F
Value
p-value
Prob > F
Model 95748.05 9 10638.67 4297.52 0.0002 significant
Linear Mix-
ture 80171.91 2 40085.95 16192.81 < 0.0001
AB 486.77 1 486.77 196.63 0.005
AC 468.72 1 468.72 189.34 0.0052
BC 43.71 1 43.71 17.66 0.0522
ABC 459.21 1 459.21 185.5 0.0053
AB(A-B) 399.41 1 399.41 161.34 0.0061
AC(A-C) 399.22 1 399.22 161.26 0.0061
BC(B-C) 974.32 1 974.32 393.58 0.0025
Residual 4.95 2 2.48
Lack of Fit 4.95 1 4.95

CHAPTER 4 Results and Discussion
119997290027 / Gujarat Technological University Page 140
FIGURE 4.23 (a) Response variable globule size (Y1)
i. Contour plot ii. Surface response curve
iii. Predicted Vs. Actual response
iv. Residual Vs. run
iv
iii
ii
i
C: Water
B: Smix
357.728
Globule Size
395.1
135.3
X1 = A: Oil
X2 = B: Smix
X3 = C: Water
A: Oil 8

CHAPTER 4 Results and Discussion
119997290027 / Gujarat Technological University Page 141
TABLE 4.32(b) Data of ANOVA table for viscosity (Y2)
ANOVA for Response Surface Cubic Model
Source
Sum of
Squares
df
Mean
Square
F
Value
p-value
Prob > F
Model 32.67 9 3.63 35.15 0.028 significant
Linear Mix-
ture 31.73 2 15.87 153.65 0.0065
AB 0.3 1 0.3 2.94 0.2284
AC 0.32 1 0.32 3.14 0.2182
BC 0.53 1 0.53 5.11 0.1522
ABC 0.31 1 0.31 3.02 0.2245
AB(A-B) 0.35 1 0.35 3.36 0.2082
AC(A-C) 0.33 1 0.33 3.24 0.2138
BC(B-C) 0.55 1 0.55 5.32 0.1474
Residual 0.21 2 0.1
Lack of Fit 0.13 1 0.13 1.86 0.4028 not signif-
icant

CHAPTER 4 Results and Discussion
119997290027 / Gujarat Technological University Page 142
FIGURE 4.23 (b) Response variable viscosity (Y2)
i. Contour plot ii. Surface response curve
iii. Predicted Vs. Actual response
iv. Residual Vs. run
iv
iii
Viscosity:
14.14
9.12
Viscosity
ii
X1 = A: Oil
X2 = B: Smix
9.12
8.000
B: Smix i
9.12
X1 = A: Oil X2 = B: Smix
X3 = C: Water
A: Oil
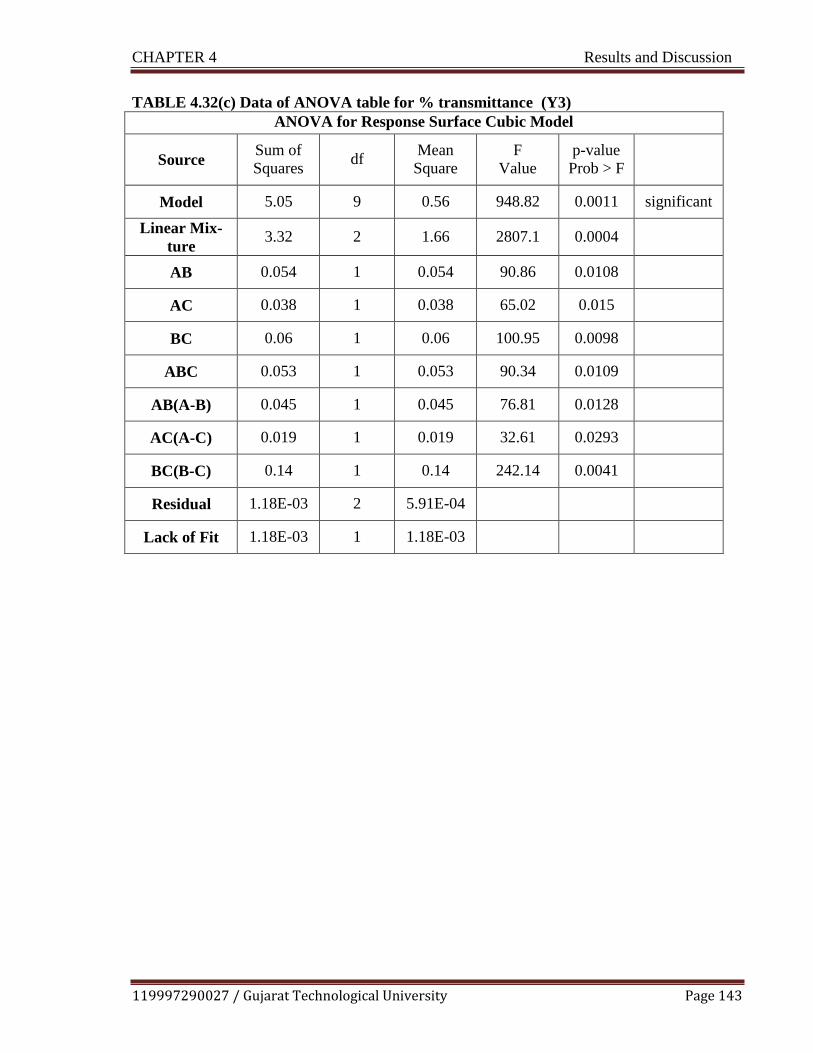
CHAPTER 4 Results and Discussion
119997290027 / Gujarat Technological University Page 143
TABLE 4.32(c) Data of ANOVA table for % transmittance (Y3)
ANOVA for Response Surface Cubic Model
Source Sum of
Squares
df Mean
Square
F
Value
p-value
Prob > F
Model 5.05 9 0.56 948.82 0.0011 significant
Linear Mix-
ture 3.32 2 1.66 2807.1 0.0004
AB 0.054 1 0.054 90.86 0.0108
AC 0.038 1 0.038 65.02 0.015
BC 0.06 1 0.06 100.95 0.0098
ABC 0.053 1 0.053 90.34 0.0109
AB(A-B) 0.045 1 0.045 76.81 0.0128
AC(A-C) 0.019 1 0.019 32.61 0.0293
BC(B-C) 0.14 1 0.14 242.14 0.0041
Residual 1.18E-03 2 5.91E-04
Lack of Fit 1.18E-03 1 1.18E-03

CHAPTER 4 Results and Discussion
119997290027 / Gujarat Technological University Page 144
FIGURE 4.23 (c) Response variable % transmittance (Y3)
i. Contour plot ii. Surface response curve
iii. Predicted Vs. Actual response
iv. Residual Vs. run
iv
iii
Color points by value of
Transmittance:
99.7
97.2
Transmittance
ii
C: Water
8.000
B: Smix i
97.4572
99.181 98.6064
99.7
97.2
X1 = A: Oil
X2 = B: Smix
X3 = C: Water
A: Oil

CHAPTER 4 Results and Discussion
119997290027 / Gujarat Technological University Page 145
4.5.1 Experimental Validation of Design Space
Experimental validation of DoE trials for formulation variables was undertaken by formulation
and characterization of microemulsion formulation at the check point batch suggested by the
software. Figure 4.24 shows the overlay plot displaying the design space and optimized param-
eters as check point suggested by DoE software to obtain the desired responses. The observed
values were comparable with the predicted values establishing the reliability of the optimiza-
tion procedure as shown in Table 4.33. Calculated percentage prediction error was found to be
less than 5 percent, confirming the validity of D- optimal mixture design for microemulsion
formulation optimization.
Figure 4.24 Overlay plot
TABLE 4.33 Checkpoint analysis of optimized formulation
Parameters Predicted value Experimental value % Error
Globule Size (nm) 143.33 142 ± 0.16 0.92
Viscosity(cps) 13.51 13.19± 0.121 2.36
Transmittance (%) 99.09 99.79± 0.134 0.70
Error (%) = (predicted value – experimental value)/ predicted value × 100.
Data expressed were of mean ±SEM (n=3)
CHAPTER 4 Results and Discussion
119997290027 / Gujarat Technological University Page 146
4.6 Formulation and Optimization of Microemulsion Based Gel
The topical application of optimized microemulsion is restricted due to low viscosity resulted
in less residential time of formulation. To overcome this, as well as for maintaining the ease of
formulation application, gelling agents were incorporated into formulation. The ocular delivery
improved by adding mucoadhesive polymer in formulation. The weight ratio of CMC (1%) and
SH (1.5%) was found satisfactory based on proper gel formation. The former polymer used in
commercial ocular formulations, as it has desirable mucoadhesive and a high retention time on
the ocular surface and the latter one exhibit excellent viscoelastic, lubricating and water reten-
tion properties. The literature reveled that, this combination benefited with high viscosity under
low friction conditions (between blinking) which stabilizes the tear film and low viscosity un-
der high friction conditions (during the blinking) which reduces discomfort in animal as well as
humans23
.
A specified amount of drug consisting of the chosen oil and Smix was magnetically stirred un-
til the drug completely dissolved; microemulsion was prepared by adding aqueous phase. 1%
CMC and 1.5% SH polymers dispersion was formed by suspending in water. The polymer dis-
persion kept for overnight to form viscous gel matrix. Prepared microemulsion and polymer
dispersion was mixed in 1:1 v/w ratio 24
. Smooth viscous, transparent gel was formed. The trial
batches conducted for selection of gelling/ mucoadhesive polymers are shown in Table 4.34.
While, Table 4.35 depicted different trials taken for preparation of microemulsion based gel
formulation. All the characteristic peak of pure ebastine (CH-Aromatic, CH-Aliphatic, C=O (Ketone),
C=C (Aromatic), C-N, C-O) observed in IR spectra of physical mixtures. Hence, no significant in-
compatibility was seen between drug and the screened excipients as observed with IR spectra
of pure drug ebastine, physical mixtures of ebastine with polymers and that of with preserva-
tive. (shown in Fig. 4.25).
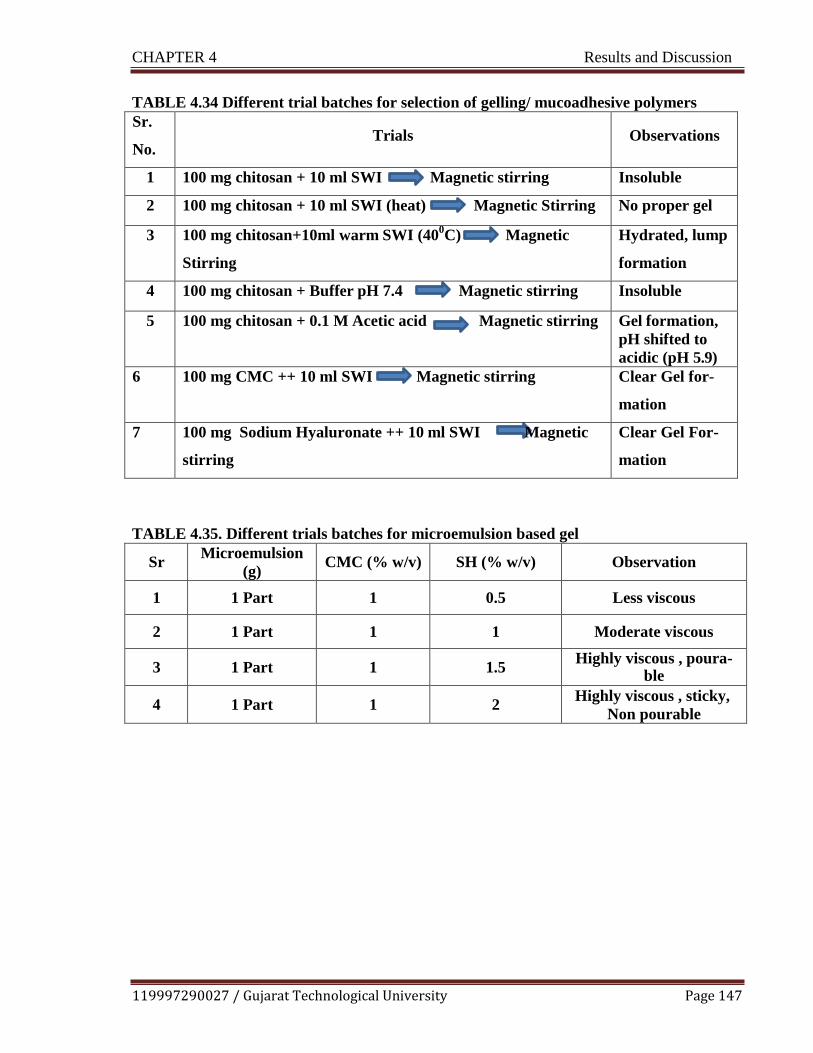
CHAPTER 4 Results and Discussion
119997290027 / Gujarat Technological University Page 147
TABLE 4.34 Different trial batches for selection of gelling/ mucoadhesive polymers
Sr.
No. Trials Observations
1 100 mg chitosan + 10 ml SWI Magnetic stirring Insoluble
2 100 mg chitosan + 10 ml SWI (heat) Magnetic Stirring No proper gel
3 100 mg chitosan+10ml warm SWI (400C) Magnetic
Stirring
Hydrated, lump
formation
4 100 mg chitosan + Buffer pH 7.4 Magnetic stirring Insoluble
5 100 mg chitosan + 0.1 M Acetic acid Magnetic stirring Gel formation,
pH shifted to
acidic (pH 5.9)
6 100 mg CMC ++ 10 ml SWI Magnetic stirring Clear Gel for-
mation
7 100 mg Sodium Hyaluronate ++ 10 ml SWI Magnetic
stirring
Clear Gel For-
mation
TABLE 4.35. Different trials batches for microemulsion based gel
Sr Microemulsion
(g) CMC (% w/v) SH (% w/v) Observation
1 1 Part 1 0.5 Less viscous
2 1 Part 1 1 Moderate viscous
3 1 Part 1 1.5 Highly viscous , poura-
ble
4 1 Part 1 2 Highly viscous , sticky,
Non pourable

CHAPTER 4 Results and Discussion
119997290027 / Gujarat Technological University Page 148
(b) Physical mixture of drug and polymers (c) Physical mixture of drug and preservative
FIGURE 4.25 IR Spectra for drug excipient compatibility
(a) IR spectra of drug (ebastine) (refer Fig. 4.20) (b) IR spectra of physical mixture of
drug and polymers (ebastine+ Carboxyl methyl cellulose + Sodium Hyaluronate) (c) IR
spectra of physical mixture of drug and preservative (Sodium perborate)
4.7 Evaluation of Optimized Microemulsion Formulation
4.7.1 pH
The pH of the optimized formulation was determined to be 6.9 ± 0.12, which can be easily
buffered by tear fluid (pH 6.5-7.6) which indicated non irritancy of formulation; hence it is ad-
equate to instilled into the eye without reflex tear and rapid tear blinking. Moreover, the eye
can tolerate pH of 6.5 -8.0 without any discomfort.
4.7.2 Droplet size, Zeta Potential and Viscosity Measurement
The globule size that human eyes can tolerate is about 10 micrometer
25, indicating suitability
of developed formulation for ocular use. The Polydispersity Index (PDI) was found to be well
below 1.0 which confirms monodispersed (narrow size distribution) nature of formulation, it
also indicate that the optimized microemulsion remains stable upon dilution. Zeta potential is
crucial physicochemical parameter that correlated with stability of dispersed system. Zeta po-
tential determines aggregation potential of the globules. The droplet size of optimized micro-
emulsion formulation was determined by Malvern Zetasizer Nanoseries Nano –ZS and found
to be 142± 0.16 nm as shown in the Figure 4.26. Zeta potential of optimized microemulsion
formulations was found to be -22.6 ± 0.39 mV as shown in the Figure 4.27. Viscosity is im-

CHAPTER 4 Results and Discussion
119997290027 / Gujarat Technological University Page 149
portant parameter need to be assessed since highly viscous formulation exhibit interference
with normal functioning like blinking, vision, ease of application etc., while very less viscous
formulation will show lack of residential time at the site of instillation. The Viscosity of opti-
mized formulation was found to be 13.19 ± 0.121cps at room temperature. Owing to less vis-
cosity, the residential capacity of formulation at physiological site (eye) can be increased by
adding gelling agent.
FIGURE 4.26 Globule size measurement of optimized formulation
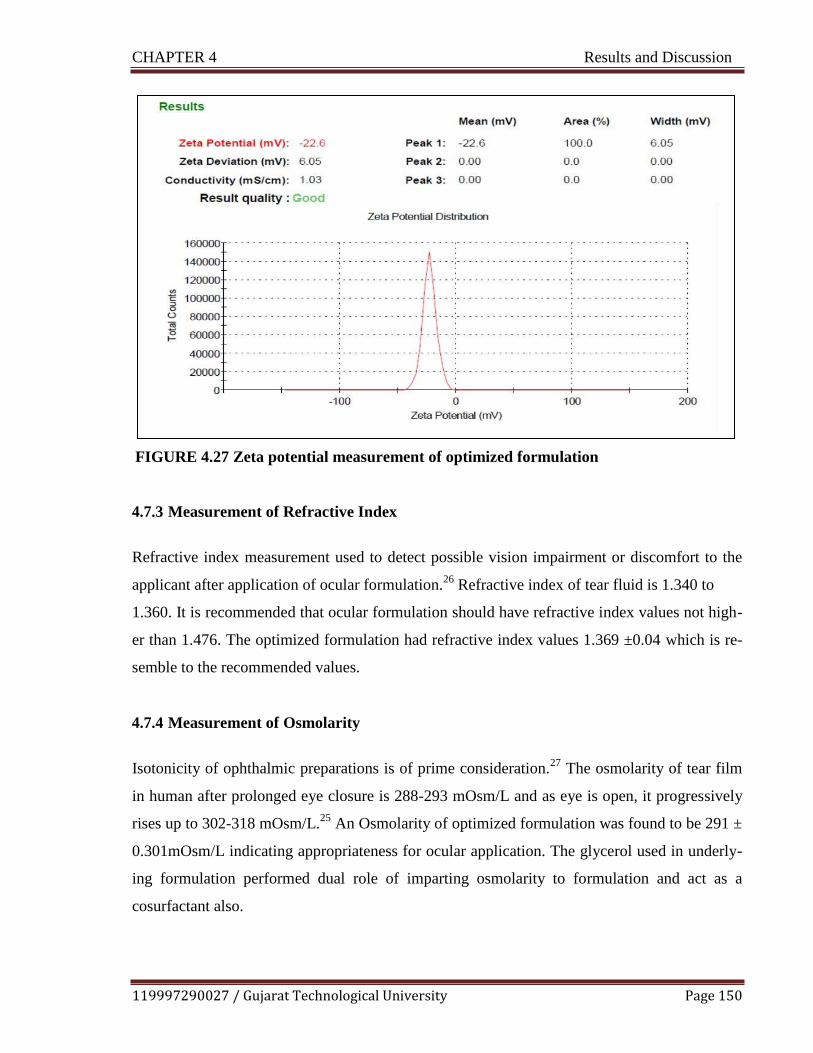
CHAPTER 4 Results and Discussion
119997290027 / Gujarat Technological University Page 150
FIGURE 4.27 Zeta potential measurement of optimized formulation
4.7.3 Measurement of Refractive Index
Refractive index measurement used to detect possible vision impairment or discomfort to the
applicant after application of ocular formulation.26
Refractive index of tear fluid is 1.340 to
1.360. It is recommended that ocular formulation should have refractive index values not high-
er than 1.476. The optimized formulation had refractive index values 1.369 ±0.04 which is re-
semble to the recommended values.
4.7.4 Measurement of Osmolarity
Isotonicity of ophthalmic preparations is of prime consideration.
27 The osmolarity of tear film
in human after prolonged eye closure is 288-293 mOsm/L and as eye is open, it progressively
rises up to 302-318 mOsm/L.25
An Osmolarity of optimized formulation was found to be 291 ±
0.301mOsm/L indicating appropriateness for ocular application. The glycerol used in underly-
ing formulation performed dual role of imparting osmolarity to formulation and act as a
cosurfactant also.

CHAPTER 4 Results and Discussion
119997290027 / Gujarat Technological University Page 151
4.7.5 Measurement of Surface Tension
Ophthalmic formulation should have the surface tension range at the surface to air interface of
34.3-70.9mN/m. The surface tension of the optimized microemulsion formulation was found to
be 34.75 ±0.13 mN/m. Low microemulsion surface tension ensures good spreading effect on
the conjunctive, cornea and mixing with precorneal film components, thereby improving con-
tact between the drug and the conjunctival tissue.28
4.7.6 Drug Content
Microemulsion of ebastine with blend of surfactant and cosurfactant were prepared by Phase
Titration Method (Water titration) method. The percentage of drug content of optimized for-
mulations was found to be 97.09 ± 0.12%
4.7.7 Transmission Electron Microscopy
The surface morphology of the droplets of optimized formulation measured using Transmis-
sion electron microscope (TEM). The pictorial image taken using transmission electron micro-
scope with CCD camera (TEM Philips Tecnai 20, Holland). The Figure 4.28 showed spherical
shape and uniform droplet size of optimized microemulsion. As the loaded ebastine micro-
emulsion globules are nanometric and morphologically spherical, they are not expected to
cause ocular irritation.

CHAPTER 4 Results and Discussion
119997290027 / Gujarat Technological University Page 152
FIGURE 4.28 Transmission Electron Microscopy (TEM) of optimized formulation
4.7.8 Measurement of % Transmittance
Microemulsion loaded with ebastine diluted with distilled water for 10 times. The % transmit-
tance was found 99.79 ± 0.134 with reference to purified water as blank at 650 nm using UV
spectrophotometer. (UV-1800, Shimadzu)
4.8 Evaluation of Microemulsion Based Gel
4.8.1 pH
The pH of the 1% w/v aqueous solution of the prepared microemulsion based gels was meas-
ured by digital pH meter. The pH value was found to be is 6.8 ± 0.44.

CHAPTER 4 Results and Discussion
119997290027 / Gujarat Technological University Page 153
4.8.2 Rheology Study
The Rheograms of microemulsion gel and microemulsion based gel diluted with tear fluid in a
ratio of 40:7 were determined at different shear stress using Plate and cone viscometer. Proper
spread of the gels on the ocular surface will ensure increased absorption of the drug after ocu-
lar administration. The pseudo plastic character of precorneal tear film should be disturbed
less/or not disturbed by the administration of ophthalmic products. The ocular shear rate is
about 0.03 s-1 during interblinking periods and 4250 – 2850 s-1 during blinking. The viscoe-
lastic fluid having high viscosity under low shear rates providing a higher retention time for
therapeutic treatment and low viscosity under high shear rates providing comfort, called as
pseudo plastic fluid, is often preferred for ophthalmic application. The Rheogram of micro-
emulsion gel and microemulsion gel diluted with tear fluid (To mimic physiological condition,
formulations were mixed with artificial tear fluid (ATF) in a ratio of 40:7) exhibited pseudo-
plastic behavior, i.e., decrease in the viscosity with increase in angular velocity exhibiting its
suitability for ophthalmic use. The Rheogram of microemulsion gel and microemulsion gel
shear rate and shear stress are depicted in Fig. 4.29 (a) and (b).

CHAPTER 4 Results and Discussion
119997290027 / Gujarat Technological University Page 154
FIGURE 4.29 (a) Rheogram of microemulsion based gel

CHAPTER 4 Results and Discussion
119997290027 / Gujarat Technological University Page 155
FIGURE 4.29 (b) Rheogram of microemulsion based gel diluted with tear fluid

CHAPTER 4 Results and Discussion
119997290027 / Gujarat Technological University Page 156
4.8.3 Mucoadhesive Strength
Modified two-pan balance method was used to determine mucoadhesive strength
29. 15.7 ml of
water was required to be added to detach the cellophane membrane from the gel. Hence, the
mucoadhesive force was calculated as 15,401.7 dynes/cm2 using Equation
F = w x g
=15.7 x 981 dynes/cm2
= 15,401.7 dynes/cm2
Where F is the mucoadhesion force (dynes / cm2),
w is the minimum weight required to break the bond (grams), g
is the acceleration due to gravity (cm/s2).
4.8.4 Spreadability
The gel spreadability was measured by placing 0.5 g gel between two cellophane membranes
and placing 100gm weight on it for one min. The spreadability of the gel was found to be 2.8
cm/gm gel. Uniform and effective spreading of the gel on ocular surface will ensure increased ab-
sorption of drug after ocular application.
4.8.5 Drug Content Determination
The optimized microemulsion formulation converted into final microemulsion based gel for-
mulation. The ebastine content in the optimized microemulsion based gel formulation was
found to be 98.22 ± 0.40 %
4.8.6 In vitro Drug Release Study
In vitro release profiles of drug loaded microemulsion and microemulsion based gel were de-
termined by dialysis bag method shown in Fig. 4.30. It is difficult to mimic diffusion cell in
vitro method with the real situation in vivo because cellulose membrane cannot exhibit the bar-
riers of ocular multilayered epithelium as well as the constant volume of diffusion cell will not
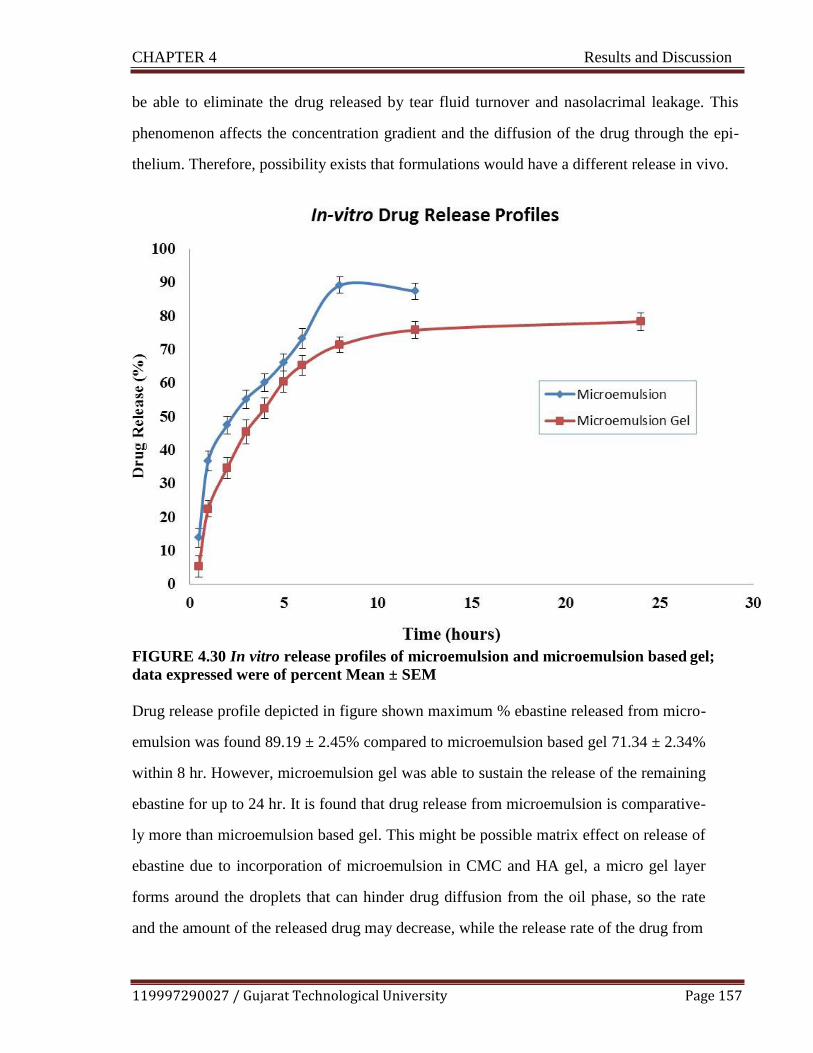
CHAPTER 4 Results and Discussion
119997290027 / Gujarat Technological University Page 157
be able to eliminate the drug released by tear fluid turnover and nasolacrimal leakage. This
phenomenon affects the concentration gradient and the diffusion of the drug through the epi-
thelium. Therefore, possibility exists that formulations would have a different release in vivo.
FIGURE 4.30 In vitro release profiles of microemulsion and microemulsion based gel;
data expressed were of percent Mean ± SEM
Drug release profile depicted in figure shown maximum % ebastine released from micro-
emulsion was found 89.19 ± 2.45% compared to microemulsion based gel 71.34 ± 2.34%
within 8 hr. However, microemulsion gel was able to sustain the release of the remaining
ebastine for up to 24 hr. It is found that drug release from microemulsion is comparative-
ly more than microemulsion based gel. This might be possible matrix effect on release of
ebastine due to incorporation of microemulsion in CMC and HA gel, a micro gel layer
forms around the droplets that can hinder drug diffusion from the oil phase, so the rate
and the amount of the released drug may decrease, while the release rate of the drug from

CHAPTER 4 Results and Discussion
119997290027 / Gujarat Technological University Page 158
microemulsion depends on the rate of diffusion of the drug from oil droplets. The possi-
bility of the drug partition between the oil and the water phases in the presence of the sur-
factant positioned at the oil–water interface prior to release. Formulation provided the
highest in vitro drug release with the ability of providing a sustained release over 24 hr.,
thus reducing frequency of application and improving patient compliance.
4.8.7 Kinetics of Drug Release Study
The mechanism of drug release from ebastine loaded microemulsion and microemulsion based
gel was determined from in vitro data. The obtained data was fitted to various kinetic models
(Zero order, First order, Higuchi model, Korsmeyer peppas model) and the best fit model was
obtained by regression analysis. Fig. 4.31 (a), (b), (c), (d) and 4.32 (a), (b) , (c), (d) depicts
graphs for various kinetics model fitting for microemulsion and microemulsion based gel for-
mulation respectively.

CHAPTER 4 Results and Discussion
119997290027 / Gujarat Technological University Page 159
a. Zero order release kinetics b. First order release kinetics
c. Higuchi Model of release kinetics d. Korsemeyer -Pepppa’s Model of release
FIGURE 4.31 Models for drug release kinetic (Microemulsion)

CHAPTER 4 Results and Discussion
119997290027 / Gujarat Technological University Page 160
a. Zero order release kinetics b. First order release kinetics
c. Higuchi Model of release kinetics d. Korsemeyer -Pepppa’s Model of release
FIGURE 4.32 Models for drug release kinetic (Microemulsion based gel)
The in vitro release studies data was fitted into various mathematical models to determine the
best fit model as shown in Table 4.36
TABLE 4.36 Regression coefficients for release kinetics
Release Kinetic of Microemulsion
Zero order re-
lease
First order
release
Higuchi
model
Korsmeyer peppas Release mecha-
nism
R 2 R 2 R 2 N R 2 Anomalous
0.8662 0.958 0.971 0.76 0.978 transport
Release Kinetic of Microemulsion based gel
Zero order re-
lease
First order
release
Higuchi
model
Korsmeyer peppas Release mecha-
nism
R 2 R 2 R 2 N R 2 Anomalous
0.943 0.988 0.970 0.43 0.959 transport

CHAPTER 4 Results and Discussion
119997290027 / Gujarat Technological University Page 161
The R2 value is considered as the tool for representing the best fitting of kinetic model. Ac-
cording to data obtained from in vitro release study of ebastine from microemulsion shows Hi-
guchi Patten and the release mechanism expected to be anomalous diffusion. The release of
dug from microemulsion based gel best fits in the first order release kinetics indicating concen-
tration dependent diffusion controlled release pattern. The results were found in accordance
with investigations by other researchers.30, 31
, 32
4.9 Sterilization and Sterility Testing
Sterility testing is crucial requisite for clinical use of an ophthalmic drug delivery. The various
methods used are moist heat sterilization, gamma radiation and sterile filtration. Of all meth-
ods, sterile filtration method predominantly used for chemically or thermally sensitive materi-
al. Sterilization of prepared microemulsion formulation was carried out by membrane filtra-
tion using 0.22μm membrane filter. Sterility testing of optimized microemulsion formulation
was performed by direct inoculation method. The result of sterility testing is shown in Table
4.37 (a), (b) and Fig. 4.33.
TABLE 4.37 (a) Results of sterility testing in FTGM (Fungi)
No. of
days 1 2 3 4 5 6 7 8 9 10 11 12 13 14
Sample -ve -ve -ve -ve -ve -ve -ve -ve -ve -ve -ve -ve -ve -ve
Negative control
-ve -ve -ve -ve -ve -ve -ve -ve -ve -ve -ve -ve -ve -ve
Positive control
-ve -ve +ve +ve +ve +ve +ve +ve +ve +ve +ve +ve +ve +ve
FTGM: Fluid Thioglycolate Medium
TABLE 4.37 (b) Results of sterility testing in SCDM (Bacteria)
No. of
days
1
2
3
4
5
6
7
8
9
10
11
12
13
14
Sample -ve -ve -ve -ve -ve -ve -ve -ve -ve -ve -ve -ve -ve -ve
Negative control
-ve
-ve -ve -ve -ve -ve -ve -ve -ve -ve -ve -ve -ve -ve
Positive
control
-ve -ve +ve +ve +ve +ve +ve +ve +ve +ve +ve +ve +ve +ve
SCDM: Soyabean Casein Digest Medium
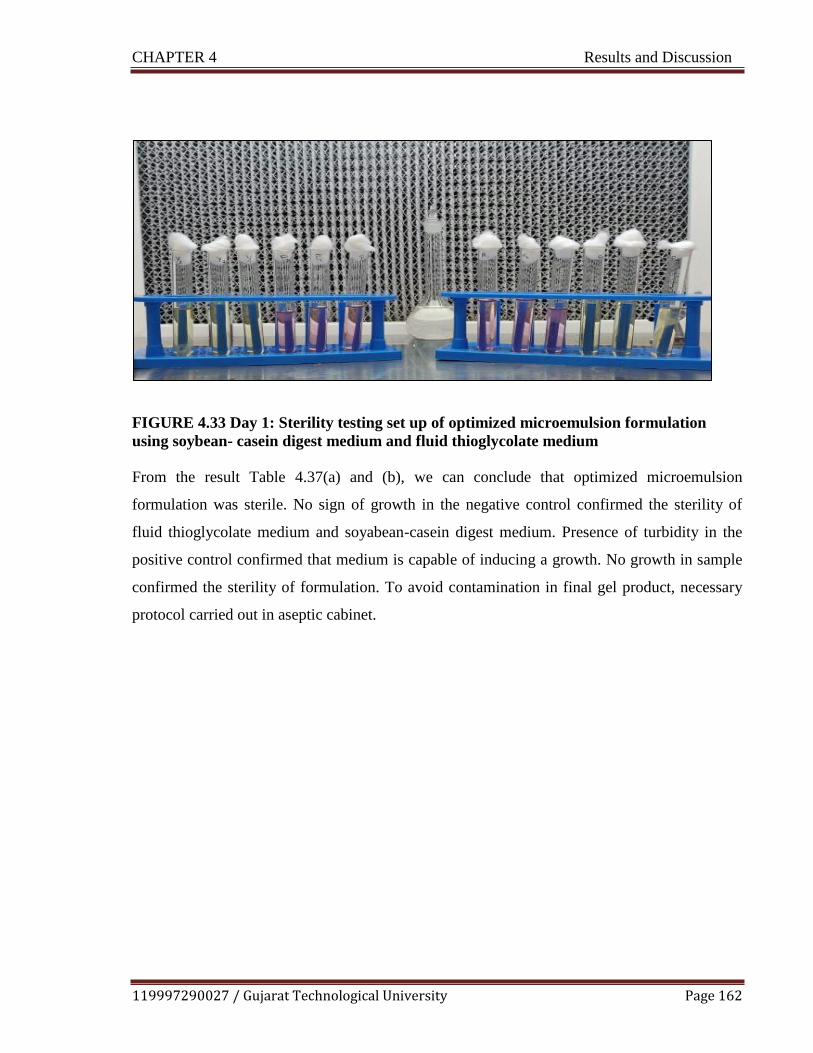
CHAPTER 4 Results and Discussion
119997290027 / Gujarat Technological University Page 162
FIGURE 4.33 Day 1: Sterility testing set up of optimized microemulsion formulation
using soybean- casein digest medium and fluid thioglycolate medium
From the result Table 4.37(a) and (b), we can conclude that optimized microemulsion
formulation was sterile. No sign of growth in the negative control confirmed the sterility of
fluid thioglycolate medium and soyabean-casein digest medium. Presence of turbidity in the
positive control confirmed that medium is capable of inducing a growth. No growth in sample
confirmed the sterility of formulation. To avoid contamination in final gel product, necessary
protocol carried out in aseptic cabinet.
CHAPTER 4 Results and Discussion
119997290027 / Gujarat Technological University Page 163
4.10 In vitro / In vivo studies
4.10.1 Ocular Irritation Study by Hen’s Egg Chorioallantoic Membrane (HET-CAM)
Test
HET- CAM (Hen‗s chorioallantoic membrane) experiment used for testing the potential of op-
timized formulation for eye irritation as per literature.33
The effects of optimized formulation
as well as positive and negative controls on the chorioallantoic membrane were noted before
and after the treatment as shown in Fig 4.34. There was a remarkable difference between the
optimized formulation and positive control by observing the changes in the chorioallantoic
membrane. The positive control (0.1 N NaOH) induced major damage to the CAM. The 0.1 N
NaOH causes hemorrhage followed by the lysis of blood vessels, whereas optimized formula-
tion and negative control (0.9% NaCl) does not show severe changes in the chorioallantoic
membrane after the application. The severity of ocular irritation of the formulations was com-
pared with that of positive and negative controls. The images showed that there was no consid-
erable change in the blood vessel morphology of isolated CAM and formulation did not cause
any damage or irritation to the eye upon application.

CHAPTER 4 Results and Discussion
119997290027 / Gujarat Technological University Page 164
Before Treatment 5 min After Treatment
a. Optimized formulation a. Optimized formulation
b. Positive Control (0.1N NaOH) b. Positive Control (0.1N NaOH)
c. Negative Control (0.9% NaCl) c. Negative Control (0.9% NaCl)
FIGURE 4.34 Ocular irritation study by Chorioallantoic Membrane Test
a. CAM treated with Optimized formulation b. CAM treated with positive control (0.1 N
NaOH)
c. CAM treated with Negative control (0.9% NaCl)
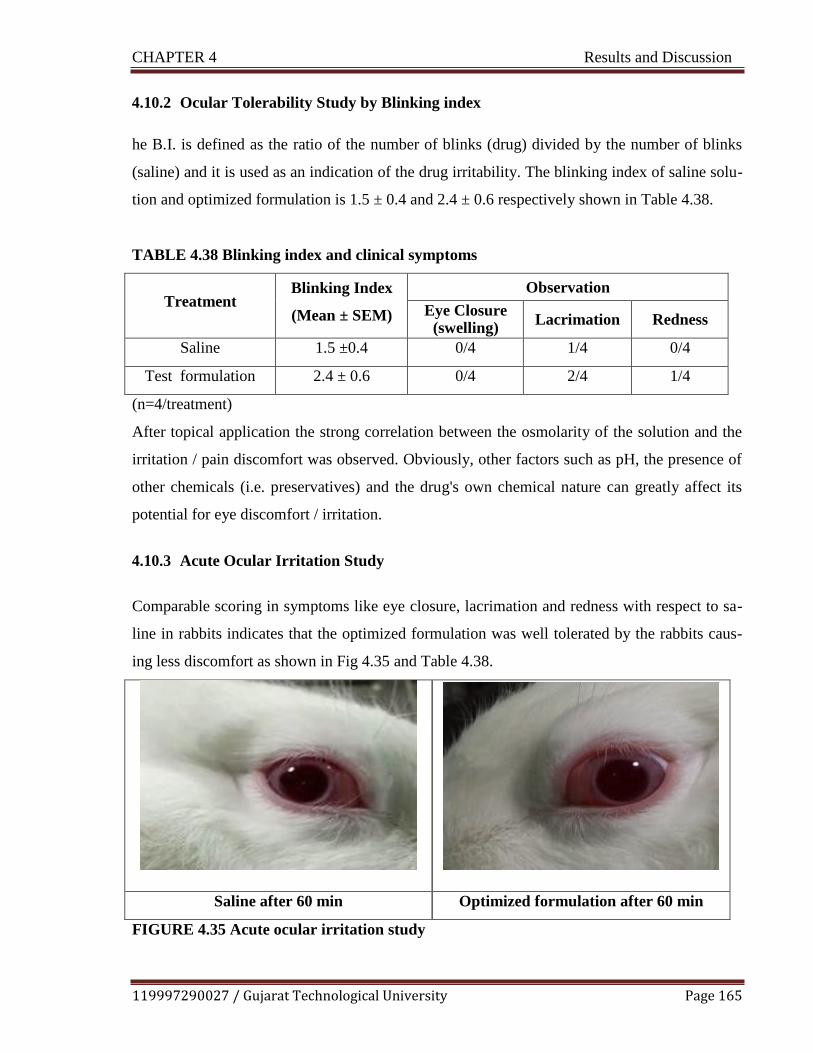
CHAPTER 4 Results and Discussion
119997290027 / Gujarat Technological University Page 165
4.10.2 Ocular Tolerability Study by Blinking index
he B.I. is defined as the ratio of the number of blinks (drug) divided by the number of blinks
(saline) and it is used as an indication of the drug irritability. The blinking index of saline solu-
tion and optimized formulation is 1.5 ± 0.4 and 2.4 ± 0.6 respectively shown in Table 4.38.
TABLE 4.38 Blinking index and clinical symptoms
Treatment Blinking Index
(Mean ± SEM)
Observation
Eye Closure (swelling)
Lacrimation Redness
Saline 1.5 ±0.4 0/4 1/4 0/4
Test formulation 2.4 ± 0.6 0/4 2/4 1/4
(n=4/treatment)
After topical application the strong correlation between the osmolarity of the solution and the
irritation / pain discomfort was observed. Obviously, other factors such as pH, the presence of
other chemicals (i.e. preservatives) and the drug's own chemical nature can greatly affect its
potential for eye discomfort / irritation.
4.10.3 Acute Ocular Irritation Study
Comparable scoring in symptoms like eye closure, lacrimation and redness with respect to sa-
line in rabbits indicates that the optimized formulation was well tolerated by the rabbits caus-
ing less discomfort as shown in Fig 4.35 and Table 4.38.
Saline after 60 min Optimized formulation after 60 min
FIGURE 4.35 Acute ocular irritation study

CHAPTER 4 Results and Discussion
119997290027 / Gujarat Technological University Page 166
Thus the optimized formulation was found to be nonirritating with no ocular damage or ab-
normal clinical signs to the cornea, iris or conjunctiva observed. Hence the optimized formula-
tion was suitable for the eye instillation and viable alternative to conventional ocular formula-
tion.
4.10.4 Efficacy Study by Ovalbumin Induced Allergic Conjunctivitis Model
4.10.4.1 Edema scoring
Allergic conjunctivitis was induced as per protocol discussed in previous chapter.
34,
35 At 0.5
and 24 hr. after the instillations, the eye was challenged with ovalbumin solution (100 mg/ml,
30 µl). Edema was scored at 15, 30, 60, 90, and 120 min after the instillation of ovalbumin as
shown in Table 4.39. The edema scoring was done according to graded scale.
Following system was used for assigning the edema scores
0-No edema
1- Slight edema
2- Partial eversion of eye
3-Eyelid half-closed
4-Eye swelling, more than half eyelid closed
The observations which did not match exactly with the score mentioned in the following scor-
ing system were assigned a value between two adjacent scores up to 0.5. E.g. for scoring eyelid
edema a value of 1.5 was assigned in case of the score falling between 1 and 2.
TABLE 4.39 Edema scoring (At 0.5 h and 24 h after topical antigen challenge)
Group Treatment Sum of edema score (Mean ± SEM)
0.5 hr. 24 hr.
Non sensitized Saline + ovalbumin 0.00 ± 0.00 0.00 ± 0.00
Sensitized Saline + ovalbumin 17.66 ± 0.56 16.39 ± 0.02
Sensitized Ebastine (1% w/v) ocular formu-
lation + ovalbumin 3.56 ± 0.02* 9.43 ± 0.14*
Sensitized Ebastine (3 mg/kg) suspension in
0.5% CMC oral + ovalbumin 11.53 ± 0.16* 14.48 ± 0.14

CHAPTER 4 Results and Discussion
119997290027 / Gujarat Technological University Page 167
*Significant compared to saline + ovalbumin treated sensitized animals, ANOVA followed by
Dunett‗s test, p<0.05. Each value represents mean ± SEM of 4 animals /treatment
FIGURE 4.36(a) Effect of optimized formulation on ovalbumin-induced conjunctivitis in
guinea pigs Onset of effect- Time point: 0.5 hr. *Significant compared to saline + Oval-
bumin treated animals, ANOVA followed by Dunett’s test, p<0.05. Each value represents
mean ± SEM.
FIGURE 4.36(b) Effect of optimized formulation on ovalbumin-induced conjunctivitis in
guinea pigsDuration of effect- Time point: 24 hr., *Significant compared to saline +
Ovalbumin treated animals, ANOVA followed by Dunett’s test, p<0.05. Each value rep-
resents mean ± SEM.
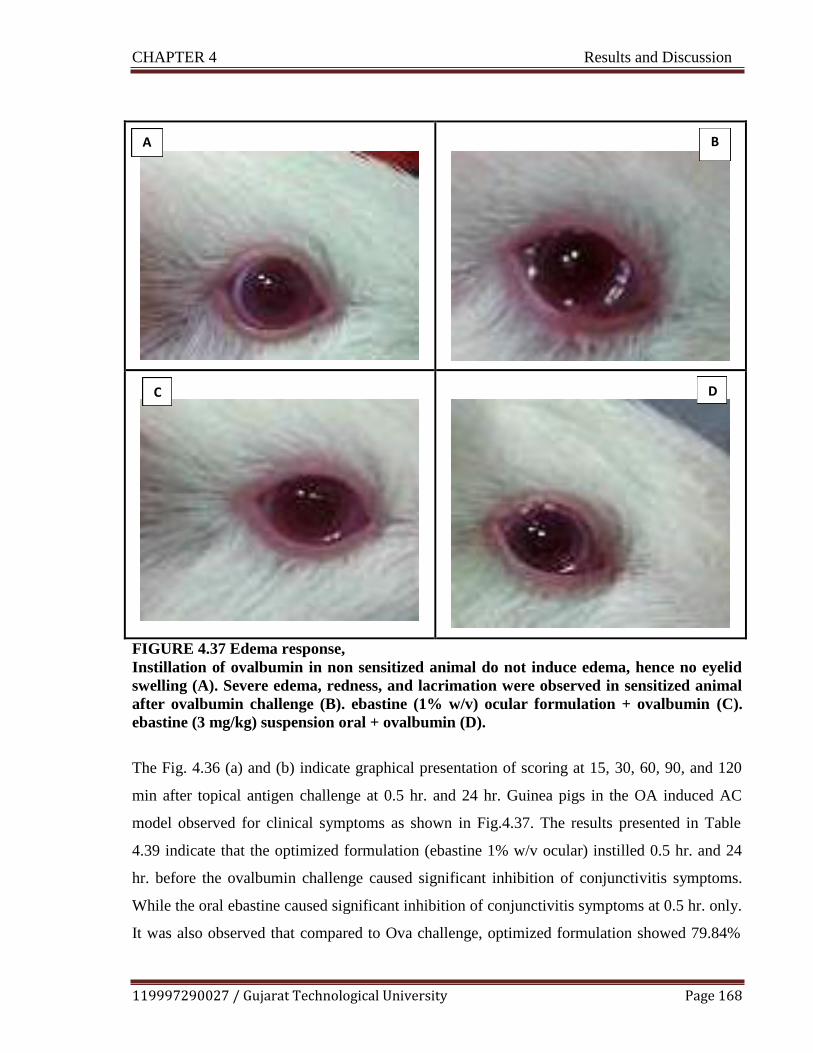
CHAPTER 4 Results and Discussion
119997290027 / Gujarat Technological University Page 168
A B
C D
FIGURE 4.37 Edema response,
Instillation of ovalbumin in non sensitized animal do not induce edema, hence no eyelid
swelling (A). Severe edema, redness, and lacrimation were observed in sensitized animal
after ovalbumin challenge (B). ebastine (1% w/v) ocular formulation + ovalbumin (C).
ebastine (3 mg/kg) suspension oral + ovalbumin (D).
The Fig. 4.36 (a) and (b) indicate graphical presentation of scoring at 15, 30, 60, 90, and 120
min after topical antigen challenge at 0.5 hr. and 24 hr. Guinea pigs in the OA induced AC
model observed for clinical symptoms as shown in Fig.4.37. The results presented in Table
4.39 indicate that the optimized formulation (ebastine 1% w/v ocular) instilled 0.5 hr. and 24
hr. before the ovalbumin challenge caused significant inhibition of conjunctivitis symptoms.
While the oral ebastine caused significant inhibition of conjunctivitis symptoms at 0.5 hr. only.
It was also observed that compared to Ova challenge, optimized formulation showed 79.84%

CHAPTER 4 Results and Discussion
119997290027 / Gujarat Technological University Page 169
inhibition at 0.5 hr., the effect persist up to 24 hr. with 42.46 % inhibition while oral ebastine
showed 34.71% inhibition at 0.5 hr. This result indicates that topical formulation of ebastine
showed better efficacy in ova induce conjunctivitis model at very low dose as compared to oral
4.10.4.2 Scratching Behavior
After the instillation of 30 μL /site of ovalbumin dissolved in normal saline solution (0.9%
NaCl) into the eye, guinea pigs were placed into the observation cage (1 animal/cage), and the
number of eye scratches was counted for 30 min. The scratching response was assessed after
topical antigen challenge at 0.5 hr. Animals treated with topical ebastine showed a significant
reduction in itch-scratch response as compared to ova challenge and oral ebastine as shown in
Fig 4.38.
FIGURE 4.38 Scratching response *Significant compared to saline + Ovalbumin treated
animals, ANOVA followed by Dunett‗s test, p<0.05. Each value represents mean ± SEM.
4.11 Histopathological Study
Histopathological conditions of conjunctiva after treatment with saline (negative control), sa-
line+ ovalbumin (positive control), and optimized formulation are shown in Fig. 4.39. No sig-
nificant damage/harmful or mild epithelium damage effects on the microscopic structure of the

CHAPTER 4 Results and Discussion
119997290027 / Gujarat Technological University Page 170
conjunctiva treated with optimized formulation was observed in comparison to that of sample
treated with topical allergen ovalbumin indicating the safety of the optimized formulation for
ocular application. This was in accordance with the results obtained by Kyei et al. Conjunctiva
treated with topical allergen showed severe damage epithelium cellular layer and edema, as
well as neutrophil and eosinophil infiltration.
Saline (Negative Control)
Normal epithelium cell layer and no edema, as
well as neutrophil and eosinophil exudations in
the proper lamina.(40x)
Saline + Ovalbumin (positive control)
Damage epithelium cellular layer and edema, as
well as neutrophil and eosinophil infiltration.
(40x)
Optimized formulation (ebastine 1% w/v ocular formulation) + Ovalbumin
Mild epithelium damage and very less eosinophil infiltration than in conjunctiva of guinea pigs treat-
ed with ovalbumin alone. (40x)
FIGURE 4.39 Histopathological photomicrographs of the conjunctival tissues in ovalbu-
min induced allergic conjunctivitis in guinea pigs treated with (a) Saline (b) Saline +
Ovalbumin (c) Optimized formulation (ebastine 1% w/v ocular formulation) + Ovalbu-
min.

CHAPTER 4 Results and Discussion
119997290027 / Gujarat Technological University Page 171
4.12 Pharmacokinetic Study
Single dose pharmacokinetic study was performed by measuring drug concentration in ocular
tissues. The blood and tissue samples collected from the rats were extracted, following the
method given in previous chapter. The analysis of the tissue samples were performed on
HPLC, according to the bioanalytical method of ebastine explained in previous chapter. The
pharmacokinetic parameters like Tmax, Cmax, and AUC were obtained by fitting the
experimental data to the pharmacokinetic model and explored using PK Solver software (Fig.
4.40). The formulation achieved peak drug concentration (Tmax) within 30 min. The Cmax
value was found 62.48 μg/g. The AUC of formulation was found 202.12 μg/gm*h. The higher
AUC of formulation may contribute to better clinical efficacy.
FIGURE 4.40 Fitting the experimental data to Pharmacokinetic Model (PK Solver 2.0)
Non-Compartmental Analysis of Ocular Tissue Data after Topical Input. Data represent
Mean Concentration (n=3/time point)
After single ocular instillation of 10 μl dose of 1% w/v ebastine ophthalmic formulation, the
concentrations in the ocular tissue were more than that in the plasma showing negligible sys-
temic absorption. These results are desirable for the ocular distribution of ebastine, because
0
10
20
30
40
50
60
70
80
0 0.5 1 2 3 4 8
Co
nce
ntr
atio
n (μ
g/g
)
Time (h)

CHAPTER 4 Results and Discussion
119997290027 / Gujarat Technological University Page 172
high-level distribution of ebastine was observed in the ocular tissue, which is a target tissue for
pharmacologic effect (i.e. efficacy). The obtained pharmacokinetic parameters are summarized
in Table 4.40.
TABLE 4.40 Single dose pharmacokinetic study parameters
Sr. No.
Parameter Unit Value
1.
Time to reach peak Tissue
concentration
(Tmax )
h
0.5
2. Peak Tissue concentration
(Cmax) μg/gm 62.48
3. Area under the curve
(AUC 0-t) μg/gm*
h
202.12
4. Area under the curve
(AUC 0-inf_obs) μg/gm*
h
212.54
5. MRT 0-inf_obs h 2.78
The pharmacokinetic study conducted in rats revealed that the developed microemulsion gel
formulation of ebastine could retain at ocular tissue site up to 8 hr., which supports the in vivo
pharmacodynamics study conducted earlier. While systemic blood ebastine concentration after
ocular administration was extremely low or undetectable obviating concerns about systemic
toxicity. The developed formulation is successful in staying at the site of absorption for pro-
longed time thereby maintaining the drug concentration at tissue site, giving better topical
pharmacodynamic effect.

CHAPTER 4 Results and Discussion
119997290027 / Gujarat Technological University Page 173
4.13 Stability Studies
4.13.1 Accelerated Stability Test by Centrifugation Stress Test
Stress stability study of the microemulsion sample was carried out by subjecting to centrifuga-
tion. A formulation shows no sign of phase separation when subjected to centrifugation at
9,000 rpm for 20 minutes. Thus, it was concluded that the microemulsion formulation was sta-
ble under stressful conditions.
4.13.2 Stability study as per ICH guidelines`
The stability studies of microemulsion and microemulsion based gel formulations were as-
sessed under various storage conditions as per ICH guidelines and the results are summarized
in Table 4.41 (a) and (b).

CHAPTER 4 Results and Discussion
119997290027 / Gujarat Technological University Page 174
TABLE 4.41 (a) Stability study data for microemulsion formulation {*Data expressed as
mean ± SD (n = 3)}
Sampling
time (Month)
Visual assessment
pH Viscosity (cP)
at 25o
C
Globule size
(nm)
Zeta poten-
tial (meV)
0 No phase separation 6.9 ± 0.12 13.19 ± 0.121 142 ± 0.16 -22.6 ± 0.39
At room temperature (25o
C ± 2o
C / 60% RH ± 5% RH)
1 No phase separation 6.8 ± 0.87 14.22 ± 0.345 140 ± 0.28 -21.8 ± 0.01
2 No phase separation 7.0 ± 0.34 13.91 ± 0.422 138 ± 0.78 -24.9 ± 0.78
3 No phase separation 6.9 ± 0.10 14.01 ± 0.265 143 ± 0.23 -23.0 ± 0.75
6 No phase separation 6.4 ± 0.17 15.09 ± 0.001 148 ± 0.12 -22.0 ±0.89
At refrigeration condition (2-8oC)
1 No phase separation 6.9 ± 0.32 12.39 ± 0.161 144 ± 0.89 -24.9 ± 0.67
2 No phase separation 6.9 ± 0.02 13.19 ± 0.825 145 ± 0.34 -23.8 ± 0.90
3 No phase separation 7.1 ± 0.12 15.02 ± 0.224 139 ± 0.56 -23.7 ± 0.34
6 No phase separation 6.8 ± 0.31 14.09± 0.224 147 ± 0.56 -25.7 ± 0.34
At 40oC ± 2
oC / 75% RH ± 5% RH
1 No phase separation 6.9 ± 0.01 15.56 ± 0.001 137 ± 0.90 -22.9 ± 0.11
2 No phase separation 6.8 ± 0.16 14.56 ± 0.671 149 ± 0.87 -23.0 ± 0.31
3 No phase separation 6.8 ± 0.87 15.29 ± 0.789 147 ± 0.45 -21.2 ± 0.53
6 No phase separation 7.1± 0.19 13.29 ± 0.249 145 ± 0.04 -24.0 ± 0.06

CHAPTER 4 Results and Discussion
119997290027 / Gujarat Technological University Page 175
TABLE 4.41 (b) Stability study data for microemulsion based gel formulation {*Data
expressed as mean ± SD (n = 3)}
Sampling
time (Month)
pH Viscosity
(cP) at 25oC, 100 γ (s-1)
Drug content
(%)
0 6.8 ± 0.44 1611.1 ± 20.14 98.22 ± 0.40
At room temperature (250C ± 2
0C / 60% RH ± 5% RH)
1 6.7 ± 0.09 1629.1 ± 18.19 98.22 ± 0.40
2 6.9 ± 0.51 1591.1 ± 17.12 97.13 ± 0.24
3 7.0 ± 0.87 1607.1 ± 14.19 96.56 ± 0.78
At refrigeration condition (2-80C)
1 6.4 ± 0.67 1705.1 ± 12.34 97.42 ± 0.56
2 6.6 ± 0.87 1639.1 ± 21.19 95.67 ± 0.89
3 6.3 ± 0.43 1714.1 ± 19.11 95.89 ± 0.01
At 400C ± 2
0C / 75% RH ± 5% RH
1 6.6 ± 0.02 1411.1 ± 13.13 97.67 ± 0.21
2 6.3 ± 0.89 1311.1 ± 10.18 96.91 ± 0.67
3 6.2 ± 0.30 1211.1 ± 17.17 96.97 ± 0.01

CHAPTER 4 Results and Discussion
119997290027 / Gujarat Technological University Page 176
4.14 References
1. World Health Organization, 2005. International pharmacopoeia monograph on ebastine.
2005 pp 5-8.
2. USP Medicines Compendium, Monograph. Ebastine Final Authorized Version 2.0.
[Online]. Available: https://mc.usp.org/monographs/ebastine-2-0. [Accessed 15 Novem-
ber, 2019]
3. Robert, M.S, Francis, X.W, David, J.K., 2014. Spectrometric Identification of Organic
Compounds. 8th ed. Wiley Publisher.
4. Ford, J.L., Timmins, P., 1989. Pharmaceutical Thermal Analysis: Techniques and Applica-
tions. Halsted Press
5. Nelofer, S.M. and Janardhan, M., 2012. Analytical method development and validation for
the assay of ebastine in ebastine mouth dissolving tablets. Int J Pharm Clin Res, 4(4),
pp.56-60.
6. Dahivadkar, M.S., Jain, H.K. and Gujar, K.N., 2013. Development and Validation of UV
Spectrophotometric Estimation of Ebastine in Bulk and Tablet Dosage Form Using Area
Under Curve Method. International Research Journal of Pharmacy, 4(6), pp.201-204.
7. Seju, U., Kumar, A. and Sawant, K.K., 2011. Development and evaluation of olanzapine-
loaded PLGA nanoparticles for nose-to-brain delivery: in vitro and in vivo studies. Acta
biomaterialia, 7(12), pp.4169-4176.
8. Sharma, D., Maheshwari, D., Philip, G., Rana, R., Bhatia, S., Singh, M., Gabrani, R.,
Sharma, S.K., Ali, J., Sharma, R.K. and Dang, S., 2014. Formulation and optimization of
polymeric nanoparticles for intranasal delivery of lorazepam using Box-Behnken design:
in vitro and in vivo evaluation. BioMed research international, 2014.

CHAPTER 4 Results and Discussion
119997290027 / Gujarat Technological University Page 177
9. ICH, I., 2005. Q2 (R1): Validation of analytical procedures: text and methodology. In In-
ternational Conference on Harmonization, Geneva.
10. Earla, R., Cholkar, K., Gunda, S., Earla, R.L. and Mitra, A.K., 2012. Bioanalytical method
validation of rapamycin in ocular matrix by QTRAP LC–MS/MS: Application to rabbit
anterior tissue distribution by topical administration of rapamycin nanomicellar formula-
tion. Journal of Chromatography B, 908, pp.76-86.
11. Smith, K.M. and Xu, Y., 2012. Tissue sample preparation in bioanalytical assays. Bioa-
nalysis, 4(6), pp.741-749.
12. Wichitnithad, W., Jithavech, P., Sanphanya, K., Vicheantawatchai, P. and Rojsitthisak, P.,
2015. Determination of Levocetirizine in Human Plasma by LC–MS-MS: Validation and
Application in a Pharmacokinetic Study. Journal of chromatographic science, 53(10),
pp.1663-1672.
13. Azeem, A., Rizwan, M., Ahmad, F.J., Iqbal, Z., Khar, R.K., Aqil, M. and Talegaonkar, S.,
2009. Nanoemulsion components screening and selection: a technical note. Aaps
Pharmscitech, 10(1), pp.69-76.
14. Habib, F., El-Mahdy, M. and Maher, S., 2011. Microemulsions for ocular delivery: eval-
uation and characterization. Journal of Drug Delivery Science and Technology, 21(6),
pp.485-489.
15. Mishra, D.K., Kumar, A., Raj, R. and Chaturvedi, A., 2013. Capmul MCM based
nanoemulsion for intranasal delivery of an antidepressant. Bulletin of Pharmaceutical Re-
search, 3(1), pp.34-39.
16. Lawrence, M.J., 1994. Surfactant systems: microemulsions and vesicles as vehicles for
drug delivery. European journal of drug metabolism and pharmacokinetics, 19(3), pp.257-
269.

CHAPTER 4 Results and Discussion
119997290027 / Gujarat Technological University Page 178
17. Aboofazeli, R., Patel, N., Thomas, M. and Lawrence, M.J., 1995. Investigations into the
formation and characterization of phospholipid microemulsions. IV. Pseudo-ternary phase
diagrams of systems containing water-lecithin-alcohol and oil; the influence of oil. Inter-
national Journal of Pharmaceutics, 125(1), pp.107-116.
18. Kumar, G.P. and Rajeshwarrao, P., 2011. Nonionic surfactant vesicular systems for effec-
tive drug delivery—an overview. Acta pharmaceutica sinica B, 1(4), pp.208-219.
19. Jiao, J., 2008. Polyoxyethylated nonionic surfactants and their applications in topical ocu-
lar drug delivery. Advanced drug delivery reviews, 60(15), pp.1663-1673.
20. Rowe, R.C., Sheskey, P.J. and Owen, S.C. eds., 2006. Handbook of pharmaceutical excip-
ients (Vol. 6, pp. 517-522). London: Pharmaceutical press.
21. Chouhan, P. and Saini, T.R., 2016. D-optimal design and development of microemulsion
based transungual drug delivery formulation of ciclopirox olamine for treatment of ony-
chomycosis. Indian Journal of Pharmaceutical Sciences, 78(4), pp.498-511.
22. Duangjit, S., Chairat, W., Opanasopit, P., Rojanarata, T. and Ngawhirunpat, T., 2016. Ap-
plication of Design Expert for the investigation of capsaicin-loaded microemulsions for
transdermal delivery. Pharmaceutical development and technology, 21(6), pp.698-705.
23. She, Y., Li, J., Xiao, B., Lu, H., Liu, H., Simmons, P.A., Vehige, J.G. and Chen, W.,
2015. Evaluation of a novel artificial tear in the prevention and treatment of dry eye in an
animal model. Journal of Ocular Pharmacology and Therapeutics, 31(9), pp.525-530.
24. Shah D.P., Chhatrani B.M., 2017. A Review on Microemulsion Based Gel: A Novel Ap-
proach for Enhancing Topical Delivery of Hydrophobic Drug.; 8(4) pp 19-35.

CHAPTER 4 Results and Discussion
119997290027 / Gujarat Technological University Page 179
25. Kalam, M.A., Alshamsan, A., Aljuffali, I.A., Mishra, A.K. and Sultana, Y., 2016. Delivery
of gatifloxacin using microemulsion as vehicle: formulation, evaluation, transcorneal per-
meation and aqueous humor drug determination. Drug delivery, 23(3), pp.886-897.
26. Ammar, H.O., Salama, H.A., Ghorab, M. and Mahmoud, A.A., 2009. Nanoemulsion as a
potential ophthalmic delivery system for dorzolamide hydrochloride. Aaps Pharmscitech,
10(3), p.808.
27. Reddy, M.H., Sambasivarao. K., Baru, C R., 2016. Methods of adjusting tonicity and pH
values of some drugs and substances. International Journal of Advanced Research in Bio-
logical Sciences, 3(10) pp 207-212.
28. Han, K., Woghiren, O.E. and Priefer, R., 2016. Surface tension examination of various
liquid oral, nasal, and ophthalmic dosage forms. Chemistry Central Journal, 10(1), p.31.
29. Naik, A. and Nair, H., 2014. Formulation and evaluation of thermosensitive biogels for
nose to brain delivery of doxepin. BioMed research international, pp 1-10‗
30. Mohammed, W.H., Ali, W.K. and Al-Awady, M.J., 2018. Evaluation of in vitro drug re-
lease kinetics and antibacterial activity of vancomycin HCl-loaded nanogel for topical ap-
plication. Journal of Pharmaceutical Sciences and Research, 10(11), pp.2747-2756.
31. Cojocaru, V., Ranetti, A.E., Hinescu, L.G., Ionescu, M., Cosmescu, C., Poștoarcă, A.G.
and Cinteză, L.O., 2015. Formulation and evaluation of in vitro release kinetics of
Na3CaDTPA decorporation agent embedded in microemulsion-based gel formulation for
topical delivery. Farmacia, 63(5), pp.656-664.
32. Grassi, M., Coceani, N. and Magarotto, L., 2000. Mathematical modeling of drug release
from microemulsions: theory in comparison with experiments. Journal of colloid and inter-
face science, 228(1), pp.141-150.

CHAPTER 4 Results and Discussion
119997290027 / Gujarat Technological University Page 180
33. ICCVAM-Recommended Test Method Protocol: Hen‗s Egg Test – Chorioallantoic Mem-
brane (HET-CAM) Test Method Originally published as Appendix B3 of ―ICCVAM Test
Method Evaluation Report: Current Validation Status of In Vitro Test Methods Proposed
for Identifying Eye Injury Hazard Potential of Chemicals and Products‖ NIH Publication
No. 10-7553 – Published 2010 Available at:
http://iccvam.niehs.nih.gov/methods/ocutox/MildMod-TMER.ht pp B30-B38
34. Groneberg, D.A., Bielory, L., Fischer, A., Bonini, S. and Wahn, U., 2003. Animal models
of allergic and inflammatory conjunctivitis. Allergy, 58(11), pp.1101-1113.
35. Yanni, J.M., Stephens, D.J., Parnell, D.W. and Spellman, J.M., 1994. Preclinical efficacy
of emedastine, a potent, selective histamine H1 antagonist for topical ocular use. Journal
of Ocular Pharmacology and Therapeutics, 10(4), pp.665-675.
36. Kyei, S., Koffuor, G.A., Ramkissoon, P., Abokyi, S., Owusu-Afriyie, O. and Wiredu,
E.A., 2015. Possible mechanism of action of the antiallergic effect of an aqueous extract of
Heliotropium indicum L. in ovalbumin-induced allergic conjunctivitis. Journal of allergy,
2015 pp 1 to 8.

CHAPTER 5 Summary and Conclusion
119997290027 / Gujarat Technological University Page 181
CHAPTER 5
Summary and Conclusion

CHAPTER 5 Summary and Conclusion
119997290027 / Gujarat Technological University Page 182
5.1 Summary of the Work
Allergy is not a disease itself, but a mechanism leading to disease. Ocular allergy is wide-
spread and growing healthcare problem that has a significant negative impact on quality of life
both in adults and children. A major problem in ocular therapeutics is the attainment of an op-
timal drug concentration at the site of action. Poor bioavailability of drugs from ocular dosage
forms is mainly due to the precorneal loss factors which include tear dynamics, non-
productive absorption, transient residence time in the cul-de-sac and relative impermeability of
the corneal epithelial membrane. Oral antihistamines cause unfavorable effects on heart like
QT prolongation, severe gastric distress, decreased tear production, resulting in dryness of the
ocular surface, which exacerbates ocular discomfort and increasing susceptibility of eye to ir-
ritation. Topical antihistamines are preferred for treating ocular allergies over oral agents since
their direct application at the site of action results in rapid onset and superior efficacy with less
systemic side effects. Hence, topical formulation was developed to achieve onsite exposure of
ebastine for ocular allergies.
The procured drug sample was visually observed for its color and was compared with the re-
ported appearance of the drug. Melting point is one of the identification test method for organ-
ic substances. Hence, it was determined for the sample by capillary method using melting
point apparatus (VMP-D, Veego). The IR spectroscopy was conducted using an FTIR spectro-
photometer and the spectrum was recorded in the wavelength region of 4000– 400 cm−1
IR
spectroscopy and DSC study of pure ebastine and physical mixtures with excipients were con-
ducted using an FTIR spectrophotometer (Bruker Alpha-one, Bruker Optik, Germany) and
DSC analyzer (Pyris-1 DSC, PerkinElmer) in order to detect the existence of a possible inter-
action between drug and excipients. IR study revealed that there is no interaction between
drug and excipients as all characteristic peaks of pure ebastine were found in the physical mix-
ture. The DSC thermogram of the pure ebastine and physical mixture exhibited the character-
istic endothermic peaks at 88.69 °C and 87.50 °C respectively, indicating the absence of inter-
action between the drugs thereby proving drug-excipient compatibility. UV analytical method
was used for determination of drug content, % drug release and stability samples. HPLC ana-
lytical methods were developed and validated for estimation of ebastine in ocular tissue.

CHAPTER 5 Summary and Conclusion
119997290027 / Gujarat Technological University Page 183
The solubility of ebastine was determined in various oils, surfactants and cosurfactants. Drug
powder was added in excess to each of the oils, surfactants and cosurfactants, thereafter sub-
jected to vortexing. After vortexing, the samples were kept for 24 h at ambient temperature for
attaining equilibrium. The equilibrated samples were then centrifuged at 3000 rpm for 20 min
to remove the undissolved drug. The aliquots of supernatant were filtered through 0.45 μm
membrane filters and solubility of ebastine was determined by analyzing the filtrate spectro-
photometrically (UV1800, Shimadzu) after dilution with methanol at 252 nm. Campul MCM
EP was selected as the oil phase. The blend of Labrasol with Tween 80 and blend of Propylene
glycol with glycerol were selected as surfactant and co surfactant, respectively. Double dis-
tilled water was used as an aqueous phase. Pseudo ternary phase diagrams were constructed
using aqua- titration method at ambient temperature (25°C) by Prosim software. Three phase
diagrams were obtained for three different Smix individual ratios 1:1, 2:1, and 3:1. The com-
paratively maximum microemulsion area was obtained in 2:1 Smix ratio. The selected Smix
ratio was further studied by Smix blend, 2(1:1):1, 2(1:1): 1(1:1).
D-optimal mixture design (Design-Expert 7.0.0 (Stat-Ease Inc., Minneapolis, USA) was se-
lected because the generalized variance of the estimates of the coefficients is minimized. Dif-
ferent design constraints, i.e. A (amount of oil), B (amount of Smix), and C (amount of water)
were taken at high and low levels. The sum of A, B, and C were kept fixed at 100%. The ef-
fect of these formulation variables was studied on response variables like % Transmittance,
globule size and viscosity. ANOVA was applied to determine the significance and the magni-
tude of the effects of the variables and their interactions. The probability value (α) for deter-
mination of statistical significance was set at 0.05, which indicated that a ―hypothesis‖ theory
would be rejected if their corresponding p-values were ≤ 0.05. Models were selected on the
basis of sequential comparison and lack of fit test.
Response surface, contour plot, residual plot and overlay plots were constructed for the re-
sponse variables. It was observed from the response variables plots of Globule size that as the
concentration of oil increases, globule size also increases while the concentration of Smix in-
crease then globule size decreases. It was observed from the response variables plots of vis-

CHAPTER 5 Summary and Conclusion
119997290027 / Gujarat Technological University Page 184
cosity that as the concentration of Smix increases and decreases amount of water, viscosity
increases. It was observed from the response variables plots of % transmittance that as the
concentration of oil increases % transmittance decreases and as Smix increases % transmit-
tance increases. Further, linear correlation was found analogous for actual response and predi-
cated response. The reliability of these response surfaces was also confirmed by the corre-
sponding residual plot between the experimental run and the internally studentized residuals
for all response variables. These findings revealed that all points fall within a confidence in-
terval of 95%. Experimental validation of DOE trials for formulation variables was undertaken
by formulation and characterization of microemulsion formulation at the check point batch
suggested by the software. The observed values of globule size (nm), viscosity (cps) and
transmittance (%) were comparable with the predicted values of same responses establishing
the reliability of the optimization procedure. Calculated percentage prediction error was found
to be less than 5 percent, confirming the validity of D- optimal mixture design for microemul-
sion formulation optimization.
Resultant developed formulation shows droplet size (142 ± 0.16 nm), Polydispersity Index
(below 1), refractive index (1.369 ± 0.04). The pH value of the developed formulation was 6.9
± 0.12, which can be easily buffered by tear fluid (pH 7.2-7.4), consequently, it is adequate to
apply to the eye without causing irritation, reflex tear and rapid tear blinking. An Osmolarity
of developed formulation was found to be 291±0.301mOsm/L. Low microemulsion surface
tension ensures good spreading effect on ocular surface and mixing with precorneal film com-
ponents, thereby improving contact with ocular surface. The surface tension of the developed
formulation was found to be 34.75 ±0.13 mN/m. Zeta potential and viscosity of developed
formulations was found to be -22.6 ± 0.39 mV and 13.19 ± 0.121cps respectively. The per-
centage of drug content of optimized formulations was found to be 97.09 ± 0.12%. The devel-
oped microemulsion was found in the limit of acceptable droplet size range for ocular use and
presented physical stability. Physicochemical parameters like pH, osmolarity, surface tension
were found in the range which favors its ophthalmic suitability. Microstructures of micro-
emulsion was studied by transmission electron microscopy, it directly produces high-
resolution images. It can capture any co-existent structure and microstructural transitions, per-
formed using Technai-20, Phillips, Holland, Electron source: LaB6, Tungsten Filament. The

CHAPTER 5 Summary and Conclusion
119997290027 / Gujarat Technological University Page 185
morphology of the droplets of optimized formulation measured using TEM showed spherical
shape and uniform droplet size of optimized microemulsion. Because the loaded ebastine mi-
croemulsion globules are nanometric and morphologically spherical, they are not expected to
cause ocular irritation. Further, the optimized microemulsion formulation was sterilized using
membrane filtration unit by passing the formulation through 0.22 μm membrane filter under
aseptic conditions. The optimized formulation was found to pass the sterility test carried out
using fluid thioglycolate media and soyabean casein digest media to detect aerobic, anaerobic
bacteria and fungal organisms respectively.
The optimized microemulsion was converted into microemulsion based gel. The addition of
the gelling agent increased the viscosity in comparison to parent microemulsion. Different gel-
ling and mucoadhesive agents were screened based on desired viscosity. Carboxy Methyl Cel-
lulose and Sodium hyaluronate were selected as polymers based on literature. Based on pre-
liminary trial, 1% CMC and 1.5% SH polymers dispersion was found satisfactory to get opti-
mum viscosity. The dispersion was formed by suspending the polymers in water. The polymer
dispersion kept for overnight to form viscous gel matrix. Prepared microemulsion and polymer
dispersion was mixed in 1:1 w/w ratio. Smooth viscous, transparent gel was formed. The un-
derlying procedure for preparation of microemulsion based gel was carried out strictly in asep-
tic area to maintain the sterility of overall formulation.
The microemulsion based gel was evaluated for physical examinations like homogeneity, con-
sistency, texture, etc. Gel was also evaluated for appearance, pH, rheology, drug content, mu-
coadhesive strength (determined by modified two-pan balance method) and spreadability (de-
termined by taking 0.5 g gel between two cellophane membranes and placing 100 g weight on
it for 1 minute. The diameter of the area in which the gel got spread was measured). The rheo-
logical analysis was done by means of Plate and cone Viscometer at different shear stress. The
pH value of the 1% w/v aqueous solution of the prepared microemulsion based gel was found
to be is 6.8 ± 0.44. The percentage of drug content was found to be 98.22 ± 0.40 %. The mu-
coadhesive strength and spreadability of the gel was found to be 2.8 cm/gm gel and 15,401.7
dynes/cm2 respectively. Proper spread of the gels on the ocular surface will ensure increased
absorption of the drug after ocular administration. The pseudo plastic character of precorneal

CHAPTER 5 Summary and Conclusion
119997290027 / Gujarat Technological University Page 186
tear film should be disturbed less/or not disturbed by the administration of ophthalmic prod-
ucts. The ocular shear rate is about 0.03 s-1
during interblinking periods and 4250 – 2850 s-1
during blinking. The viscoelastic fluid having high viscosity under low shear rates and low
viscosity under high shear rates, called as pseudo plastic fluid, is often preferred for ophthal-
mic application. The Rheogram of microemulsion gel and microemulsion gel diluted with tear
fluid (To mimic physiological condition, formulations were mixed with artificial tear fluid
(ATF) in a ratio of 40:7) exhibited pseudo-plastic behavior, i.e., decrease in the viscosity with
increase in angular velocity exhibiting its suitability for ophthalmic use.
The in vitro drug release study was carried out using the dialysis bag method. Higher % ebas-
tine released from microemulsion (89.19 ± 2.45%) was found as compared to microemulsion
based gel (71.34 ± 2.34%) within 8 hr. However, microemulsion gel was able to sustain the
release of the remaining ebastine for up to 24 h. This might be due to possible matrix effect on
release of ebastine due to incorporation of microemulsion in CMC and SH gel, a micro gel
layer forms around the droplets that can hinder drug diffusion from the oil phase, so the rate
and the amount of the released drug may decrease, while the release rate of the drug from mi-
croemulsion depends on the rate of diffusion of the drug from oil droplets. The possibility of
the drug partition between the oil and the water phases in the presence of the surfactant posi-
tioned at the oil–water interface prior to release. Formulation provided the highest in vitro
drug release with the ability of providing a sustained release over 24 hr., thus reducing fre-
quency of application and improving patient compliance.
For In-vivo study, the animal experimental protocol was approved by the Institutional Animal
Ethics Committee (IAEC) Reference No. 984/01/2017-07 for the use of animals in the study.
Utmost care was taken to ensure that animals were treated in the most human and ethically
acceptable manner. The ocular potential of optimized ocular formulation assessed by perform-
ing in vitro study like hen's egg chorioallantoic membrane test (HET-CAM) and blinking in-
dex for tolerability and in vivo antiallergic efficacy study in ovalbumin (OA)-induced allergic
conjunctivitis (AC) in guinea pigs followed by histopathology. After sensitization period, an-
imals were used for the experiments assessing efficacy of formulation. The optimized formu-
lation (20μL), saline, (20μL) was instilled into the right eye of respective group and for oral;
CHAPTER 5 Summary and Conclusion
119997290027 / Gujarat Technological University Page 187
ebastine (3 mg/kg) in 0.5% CMC was given. At 0.5 and 24 hr. after the instillations, the eye
was challenged with ovalbumin solution (100 mg/ml, 30μl). Edema was scored at 15, 30, 60,
90, and 120 min after the instillation of ovalbumin. For evaluation of edema, scoring system
was used. In the same sensitization protocol, eye scratching behavior and edema were scored
at periodic interval after the topical antigen challenge (instillation of ovalbumin) followed by
histopathology. Eye scratching behavior was defined as fore-limb movements over two times
directed to the ocular surface. The results shown that the optimized formulation instilled 0.5
hr. and 24 hr. before the ovalbumin challenge caused significant inhibition of conjunctivitis
symptoms. While the oral ebastine caused significant inhibition of conjunctivitis symptoms at
0.5 hr. only. It was also observed that compared to ova challenge, test formulation showed
79.84% inhibition at 0.5 hr., the effect persisted up to 24 hr. with 42.46% inhibition while oral
ebastine showed 34.71% inhibition at 0.5 hr. This result indicates that topical formulation of
ebastine showed better efficacy in ova induce conjunctivitis model at very low dose as com-
pared to oral. Further, the study indicated that said formulation has a quick onset and the dura-
tion of effect sufficient to provide relief from symptoms for 24 hr.
Ocular irritation studies by HET-CAM assay showed that the developed formulation does not
cause any irritation to the blood vessels. Acute ocular irritation test was performed using rab-
bits; the animals were observed up to 60 min for redness, swelling, watering of the eye and
results showed that developed formulation was non-irritant to the eye. In histopathological
evaluation, ocular formulation caused mild epithelium damage with less eosinophil infiltration
than in conjunctiva treated with ovalbumin alone. Data obtained in different groups expressed
as mean ± Standard error of mean (SEM) were analyzed using one-way ANOVA followed by
Dunett's test. Statistical significance was considered as p value < 0.05. Statistical analysis was
performed using the Sigma Stat, Version 3.1. (SPSS Inc., USA)
Further, the optimized formulation was subjected to pharmacokinetic study. Single dose
pharmacokinetic study was performed by measuring drug concentration in ocular tissues. The
formulation achieved peak drug concentration (Tmax) within 30 min. The Cmax value was
found 62.48 μg/ml. The AUC of formulation was found 202.12 μg/ml*h. The higher AUC of
formulation may contribute to better clinical efficacy. After single ocular instillation of 10 μL

CHAPTER 5 Summary and Conclusion
119997290027 / Gujarat Technological University Page 188
dose of 1% w/v ebastine ophthalmic formulation, the concentrations in the ocular tissue were
higher than that in the plasma showing negligible or no systemic absorption. These results are
desirable for the ocular distribution of ebastine, because high-level distribution of ebastine was
observed in the ocular tissue, which is a target tissue for pharmacologic effect (i.e., efficacy).
Stress stability study of the microemulsion formulation was carried out by subjecting it to cen-
trifugation. The stability of the microemulsion and microemulsion based gel were assessed
under different storage conditions as per ICH guidelines, at room temperature (250C ± 2
0C /
60% RH ± 5% RH), at refrigeration condition (2-80C), at 40
0C ± 2
0C / 75% RH ± 5%RH. No
significant changes were observed during the stability studies in measured parameters, while
the microemulsion gel shown slight change in viscosity under accelerated temperature and
humidity condition, hence recommended condition for proper storage for developed formula-
tion is at room temperature and /or refrigeration.
5.2 Achievement with Respect to the Objective
Topical ocular therapy could prove to be superior to systemic therapy in treating ocular aller-
gies. Hence, topical formulation was successfully developed to achieve onsite exposure of
ebastine for ocular allergies. The use of surfactant –cosurfactant blend system resulted in for-
mulation of drug delivery system with low surfactant level. The design expert allowed optimi-
zation of formulation and response variables as per ocular site application requisite. By the use
of gelling and mucoadhesive polymer, the formulation residential time was successfully in-
creased and the drug released for prolong period. The ocular presentation of model drug
through micro emulsified form shown tolerability and efficacy as well as increased bioavaila-
bility due to site specificity. The analytical method was successfully developed and validated
for the estimation of ebastine in ocular tissues.
5.3 Conclusion
With the present investigations, it may be concluded that microemulsion of a poorly soluble
drug ebastine was successfully formulated and optimized using the systematic approach of de-
sign of experiments (DOE) by water titration method. Studies of equilibrium solubility were
conducted in different oils, surfactants and co- surfactants to rationally optimize the formula-

CHAPTER 5 Summary and Conclusion
119997290027 / Gujarat Technological University Page 189
tion using D- optimum mixture design. The developed microemulsion was found in the limit
of acceptable droplet size range for ocular use and presented physical stability. Physicochemi-
cal parameters like pH, osmolarity, isotonocity were found in the range which favors its oph-
thalmic suitability.
Mucoadhesive gel was prepared with the optimized microemulsion. The addition of the gel-
ling agent increased the viscosity in comparison to parent microemulsion. The results of the
release study indicated that formulation prolonged the precorneal retention owing to mucoad-
hesion by polymer. Hence, bioavailability at the site of action of said drug was found to be
significantly increased. Further, formulation also proved its tolerability (no signs of irritation,
bleeding, vessel lysis and coagulation) in vitro HET-CAM assay by preserving normal archi-
tecture of blood vessels and in vivo acute irritation study showed reduced lacrimation, blinking
index and redness. The in vivo efficacy study proved that the formulation to be superior in
treating allergic conjunctivitis by exhibiting statistically significant reduction in conjunctivitis
symptoms like edema and scratching as compared to oral ebastine. In histopathological evalu-
ation, ocular formulation caused mild epithelium damage with less eosinophil infiltration than
in conjunctiva treated with ovalbumin alone.
In a nutshell, the microemulsion based gel formulation developed using the design expert ap-
proach held great potential as a possible alternative to traditional oral formulations of poorly
soluble ebastine to improve solubility and bioavailability due to site specificity as well, fitting
ocular application prerequisite. These data from in vitro, pharmacodynamics, nonclinical stud-
ies indicate effective topical delivery of ebastine to desired target tissues along with a favora-
ble safety profile, making 1 % w/v ebastine ophthalmic microemulsion based gel a promising
treatment for allergic conjunctivitis. These findings further warrant clinical investigation.

Appendices
119997290027 / Gujarat Technological University Page 190
Appendix I
Approval Certificate from CPCSEA & IAEC Committee for Animal Study

Appendices
119997290027 / Gujarat Technological University Page 191
Appendix II
Dose Calculation Method
Molecular Weight of Ebastine: 469.7gm/mol
4697 µg-1000 mL =1 µM,
4697 ng -1000 mL = 1 nM,
Therefore, 0.4697 ng/ml = 1 nM,
H1 histamine antagonist, IC50 (Antihistaminic effect) = 45 nM
Therefore, concentration required to give effect is 0.470 x 45 nM = 21.13 ng/mL
Inhibit T cell proliferation and the production of Th2-type pro-inflammatory
cytokines by macrophages, IC50= 10 μM
Therefore, concentration required to give effect is 469.7 x 10= 4697 ng/mL
Dose instilled is 10 µL of 1% w/v optimized formulation containing 100 µg of drug.
Thus, as per the pharmacokinetic data, significant tissue concentration was observed up to 8 hr.
of dosing. The study revealed that ebastine concentration in targeted ocular tissue is >>>> IC 50
(oral) values to inhibit H1 histamine antagonist and inhibition of T cell proliferation, the
production of Th2-type pro-inflammatory cytokines by macrophages.
119997290027 / Gujarat Technological University Page 192
List of Publications
Publications from Research Work
A research article titled ―Rationalized Approach for Formulation and Optimization of
Ebastine Microemulsion Using Design Expert for Solubility Enhancement‖ Mehetre J,
Vimal K, Mehta T, Gohel M, Surti N, Journal of Drug Delivery and Therapeutics, 2019;
9(3-s):386-397.
A research article titled ―Ocular Tolerability and Efficacy of Ebastine Colloidal
Formulation in Allergic Conjunctivitis‖ Mehetre J, Vimal K, Mehta T, Gohel M, Surti N,
International Journal of Pharmaceutical Sciences and Drug Research, 2019; 11(4): 129-
136.
Copyright © 2022 FDOKUMEN