Synthesis and optical properties of colloidal core-shell semiconductor nanocrystals quantum dots for...
6
Synthesis and optical properties of colloidal CuO nanoparticles Sawsan Dagher a , Yousef Haik a , Ahmad I. Ayesh b,n , Nacir Tit b a Department of Mechanical Engineering, UAE University, P.O. Box 15551, Al-Ain, United Arab Emirates b Department of Physics, UAE University, P.O. Box 15551, Al-Ain, United Arab Emirates article info Article history: Received 7 March 2013 Received in revised form 8 January 2014 Accepted 7 February 2014 Available online 22 February 2014 Keywords: Optical properties of nanoparticles Photoluminescence CuO nanoparticles Excitation-dependent fluorescence shift abstract Copper oxide nanoparticles of sizes ranging from 1 to 25 nm were synthesized using a colloid microwave-thermal method, where the average size of CuO nanoparticles can be tailored by controlled microwave treatment time. The particle size was found to significantly decrease as the microwave processing time increases and can be controlled to have narrow size distributions. Both scanning electron microscopy (SEM) and transmission electron microscopy (TEM) were used to characterize the sizes of the prepared nanoparticles. The UV–visible absorption spectra of the nanoparticles are blue-shifted with the size reduction, and this is attributed to quantum-confinement (QC) effect. Furthermore, the photo- luminescence spectra showed UV and visible emissions, and were red shifted with increasing particles size and excitation wavelength. While the former observation confirms the QC effect and corroborates the results of UV–visible absorption spectra, the latter one is attributed to selective near band-edge excitonic transitions associated with defect states. & 2014 Elsevier B.V. All rights reserved. 1. Introduction CuO is an attractive p-type metal oxide semiconductor that has unique electrical, optical and catalytic properties [1]. CuO is widely used in electrochemical cells [2], gas sensors [3–5], magnetic storage media [6,7], photovoltaic cells [8], light emitters [9], thermoelectric materials [10,11], heat transfer nanofluids and for catalysis [12–14]. Using CuO nanoparticles with narrow size distribution for these applications would further promote the chemical reactivity of the nanoparticles because as the particle's size reduces the surface-to- volume ratio increases, and consequently the number of reactive sites increases [15–19]. Thus, CuO nanoparticles exhibit improved electronic and optical properties compared to their bulk equiva- lent [20–22]. As a result, many methods have been developed to synthesize CuO nanoparticles with different sizes as shown in Table 1. Microwave radiation generates heat by interacting with the solution molecules and causing friction between them due to the reorientation of their electric dipoles [37]. This leads to an increase in the reaction kinetics, by one to two orders of magnitude, and efficient volumetric heating compared to conventional heating. In addition, microwave-thermal method has many advantages such as: low synthesis temperatures, reduced reaction time, small particle size, narrow particle size distribution, high purity, low power consumption, and environment friendly [38–40]. In this paper CuO nanoparticles were synthesized using the colloid microwave-thermal process that allows the formation of nano- particles with an excellent size control. In addition, the variation of the optical behavior as a function of CuO nanoparticles' size has been investigated in this work. 2. Experimental CuO nanoparticle colloids were synthesized in dimethylformamide (CH 3 ) 2 NC(O)H (DMF) with purity of 99.0% (Sigma-Aldrich) using a microwave reactor (CEM, Discover-SP system, 909156, USA). The procedure is described as follows: 60 mg of copper(II) acetate mono- hydrate (Cu(CH 3 COO) 2 H 2 O) with purity of 99.8% (Sigma-Aldrich), was dissolved in 50 ml of DMF under rigorous magnetic stirring for about 3 h at room temperature. The produced solution was aged for 24 h before exposing it to microwave radiations at 45 1C with full power of 300 W and operating frequency of 2455 MHz. The solution was kept under rigorous magnetic stirring repeatedly to complete the reaction and the nucleation process. The working cycle of the microwave reactor was set as 30 s on and 15 s off. In order to monitor the particles size, the on/off heating procedure was repeated 36 times and the average particles size measurement was performed every 30 s. The particles size was found, in general, to decrease by increasing the reaction time. CuO nanoparticle formation can be described according to the following reaction [41,42]: Cu(CH 3 COO) 2 H 2 O þ (CH 3 ) 2 NC(O)H-CuO þ CH 3 COO 2 CHN (CH 3 ) 2 þ H 2 O Contents lists available at ScienceDirect journal homepage: www.elsevier.com/locate/jlumin Journal of Luminescence http://dx.doi.org/10.1016/j.jlumin.2014.02.015 0022-2313 & 2014 Elsevier B.V. All rights reserved. n Corresponding author. E-mail address: [email protected] (A.I. Ayesh). Journal of Luminescence 151 (2014) 149–154
-
Upload
independent -
Category
Documents
-
view
1 -
download
0
Transcript of Synthesis and optical properties of colloidal core-shell semiconductor nanocrystals quantum dots for...
Synthesis and optical properties of colloidal CuO nanoparticles
Sawsan Dagher a, Yousef Haik a, Ahmad I. Ayesh b,n, Nacir Tit b
a Department of Mechanical Engineering, UAE University, P.O. Box 15551, Al-Ain, United Arab Emiratesb Department of Physics, UAE University, P.O. Box 15551, Al-Ain, United Arab Emirates
a r t i c l e i n f o
Article history:Received 7 March 2013Received in revised form8 January 2014Accepted 7 February 2014Available online 22 February 2014
Keywords:Optical properties of nanoparticlesPhotoluminescenceCuO nanoparticlesExcitation-dependent fluorescence shift
a b s t r a c t
Copper oxide nanoparticles of sizes ranging from 1 to 25 nm were synthesized using a colloidmicrowave-thermal method, where the average size of CuO nanoparticles can be tailored by controlledmicrowave treatment time. The particle size was found to significantly decrease as the microwaveprocessing time increases and can be controlled to have narrow size distributions. Both scanning electronmicroscopy (SEM) and transmission electron microscopy (TEM) were used to characterize the sizes of theprepared nanoparticles. The UV–visible absorption spectra of the nanoparticles are blue-shifted with thesize reduction, and this is attributed to quantum-confinement (QC) effect. Furthermore, the photo-luminescence spectra showed UV and visible emissions, and were red shifted with increasing particlessize and excitation wavelength. While the former observation confirms the QC effect and corroboratesthe results of UV–visible absorption spectra, the latter one is attributed to selective near band-edgeexcitonic transitions associated with defect states.
& 2014 Elsevier B.V. All rights reserved.
1. Introduction
CuO is an attractive p-type metal oxide semiconductor that hasunique electrical, optical and catalytic properties [1]. CuO is widelyused in electrochemical cells [2], gas sensors [3–5], magnetic storagemedia [6,7], photovoltaic cells [8], light emitters [9], thermoelectricmaterials [10,11], heat transfer nanofluids and for catalysis [12–14].Using CuO nanoparticles with narrow size distribution for theseapplications would further promote the chemical reactivity of thenanoparticles because as the particle's size reduces the surface-to-volume ratio increases, and consequently the number of reactivesites increases [15–19]. Thus, CuO nanoparticles exhibit improvedelectronic and optical properties compared to their bulk equiva-lent [20–22]. As a result, many methods have been developed tosynthesize CuO nanoparticles with different sizes as shown inTable 1.
Microwave radiation generates heat by interacting with thesolution molecules and causing friction between them due to thereorientation of their electric dipoles [37]. This leads to an increasein the reaction kinetics, by one to two orders of magnitude, andefficient volumetric heating compared to conventional heating.In addition, microwave-thermal method has many advantagessuch as: low synthesis temperatures, reduced reaction time, smallparticle size, narrow particle size distribution, high purity, lowpower consumption, and environment friendly [38–40]. In this
paper CuO nanoparticles were synthesized using the colloidmicrowave-thermal process that allows the formation of nano-particles with an excellent size control. In addition, the variation ofthe optical behavior as a function of CuO nanoparticles' size hasbeen investigated in this work.
2. Experimental
CuO nanoparticle colloids were synthesized in dimethylformamide(CH3)2NC(O)H (DMF) with purity of 99.0% (Sigma-Aldrich) using amicrowave reactor (CEM, Discover-SP system, 909156, USA). Theprocedure is described as follows: 60 mg of copper(II) acetate mono-hydrate (Cu(CH3COO)2 �H2O) with purity of 99.8% (Sigma-Aldrich),was dissolved in 50 ml of DMF under rigorous magnetic stirring forabout 3 h at room temperature. The produced solution was aged for24 h before exposing it to microwave radiations at 45 1C with fullpower of 300W and operating frequency of 2455MHz. The solutionwas kept under rigorous magnetic stirring repeatedly to complete thereaction and the nucleation process. The working cycle of themicrowave reactor was set as 30 s on and 15 s off. In order to monitorthe particles size, the on/off heating procedure was repeated 36 timesand the average particles size measurement was performed every 30 s.The particles size was found, in general, to decrease by increasing thereaction time. CuO nanoparticle formation can be described accordingto the following reaction [41,42]:
Cu(CH3COO)2 �H2Oþ(CH3)2NC(O)H-CuOþ CH3COO2CHN(CH3)2þH2O
Contents lists available at ScienceDirect
journal homepage: www.elsevier.com/locate/jlumin
Journal of Luminescence
http://dx.doi.org/10.1016/j.jlumin.2014.02.0150022-2313 & 2014 Elsevier B.V. All rights reserved.
n Corresponding author.E-mail address: [email protected] (A.I. Ayesh).
Journal of Luminescence 151 (2014) 149–154
The morphology and the size of the prepared CuO nanoparti-cles were visualized by a scanning electron microscope (SEM, JEOL,JSM- 5600) and a transmission electron microscope (TEM, FEI,Tecnai G20), respectively. The nanoparticles size distributionswere determined by a dynamic light scattering (DLS) techniqueusing Zeta Sizer (Malvern Instruments, Model ZEN360, England).UV–visible absorption spectrum was measured using a UV–visiblespectrophotometer (Shimdzu, UV-2450). The photoluminescencemeasurements were carried out using a spectrofluorimeter(Varian, Cary Eclipse Fluorescence Spectrophotometer).
3. Results and discussions
3.1. Morphology and size distribution
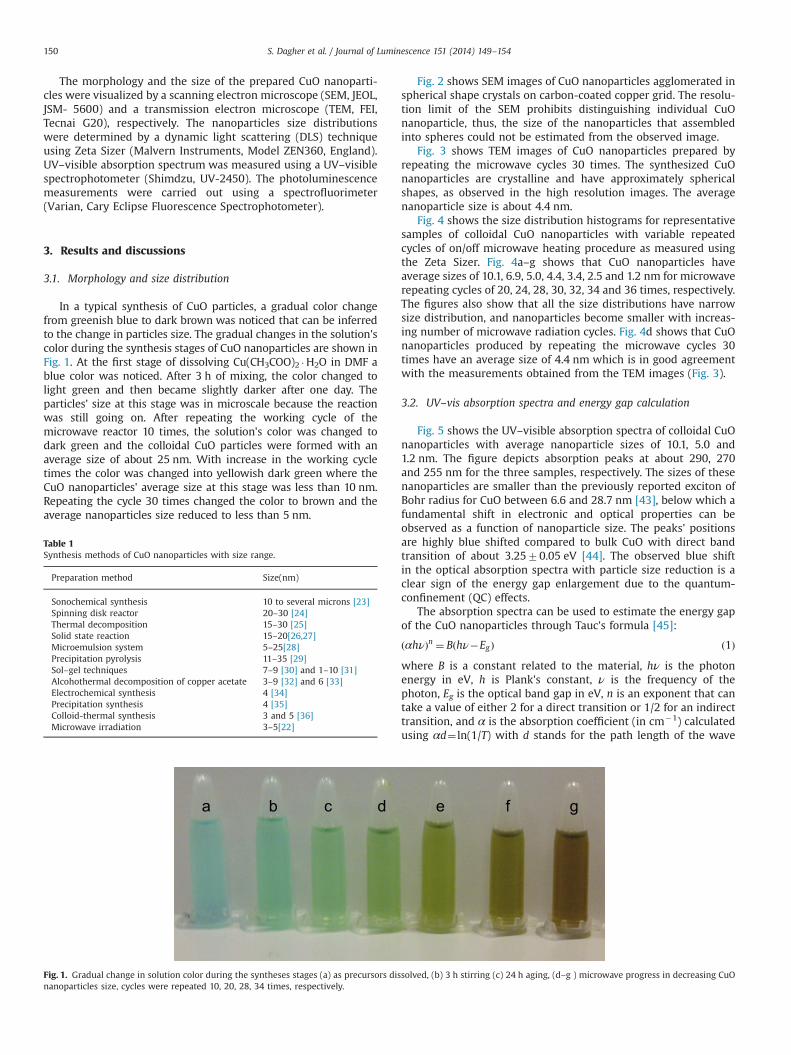
In a typical synthesis of CuO particles, a gradual color changefrom greenish blue to dark brown was noticed that can be inferredto the change in particles size. The gradual changes in the solution'scolor during the synthesis stages of CuO nanoparticles are shown inFig. 1. At the first stage of dissolving Cu(CH3COO)2 �H2O in DMF ablue color was noticed. After 3 h of mixing, the color changed tolight green and then became slightly darker after one day. Theparticles' size at this stage was in microscale because the reactionwas still going on. After repeating the working cycle of themicrowave reactor 10 times, the solution's color was changed todark green and the colloidal CuO particles were formed with anaverage size of about 25 nm. With increase in the working cycletimes the color was changed into yellowish dark green where theCuO nanoparticles' average size at this stage was less than 10 nm.Repeating the cycle 30 times changed the color to brown and theaverage nanoparticles size reduced to less than 5 nm.
Fig. 2 shows SEM images of CuO nanoparticles agglomerated inspherical shape crystals on carbon-coated copper grid. The resolu-tion limit of the SEM prohibits distinguishing individual CuOnanoparticle, thus, the size of the nanoparticles that assembledinto spheres could not be estimated from the observed image.
Fig. 3 shows TEM images of CuO nanoparticles prepared byrepeating the microwave cycles 30 times. The synthesized CuOnanoparticles are crystalline and have approximately sphericalshapes, as observed in the high resolution images. The averagenanoparticle size is about 4.4 nm.
Fig. 4 shows the size distribution histograms for representativesamples of colloidal CuO nanoparticles with variable repeatedcycles of on/off microwave heating procedure as measured usingthe Zeta Sizer. Fig. 4a–g shows that CuO nanoparticles haveaverage sizes of 10.1, 6.9, 5.0, 4.4, 3.4, 2.5 and 1.2 nm for microwaverepeating cycles of 20, 24, 28, 30, 32, 34 and 36 times, respectively.The figures also show that all the size distributions have narrowsize distribution, and nanoparticles become smaller with increas-ing number of microwave radiation cycles. Fig. 4d shows that CuOnanoparticles produced by repeating the microwave cycles 30times have an average size of 4.4 nm which is in good agreementwith the measurements obtained from the TEM images (Fig. 3).
3.2. UV–vis absorption spectra and energy gap calculation
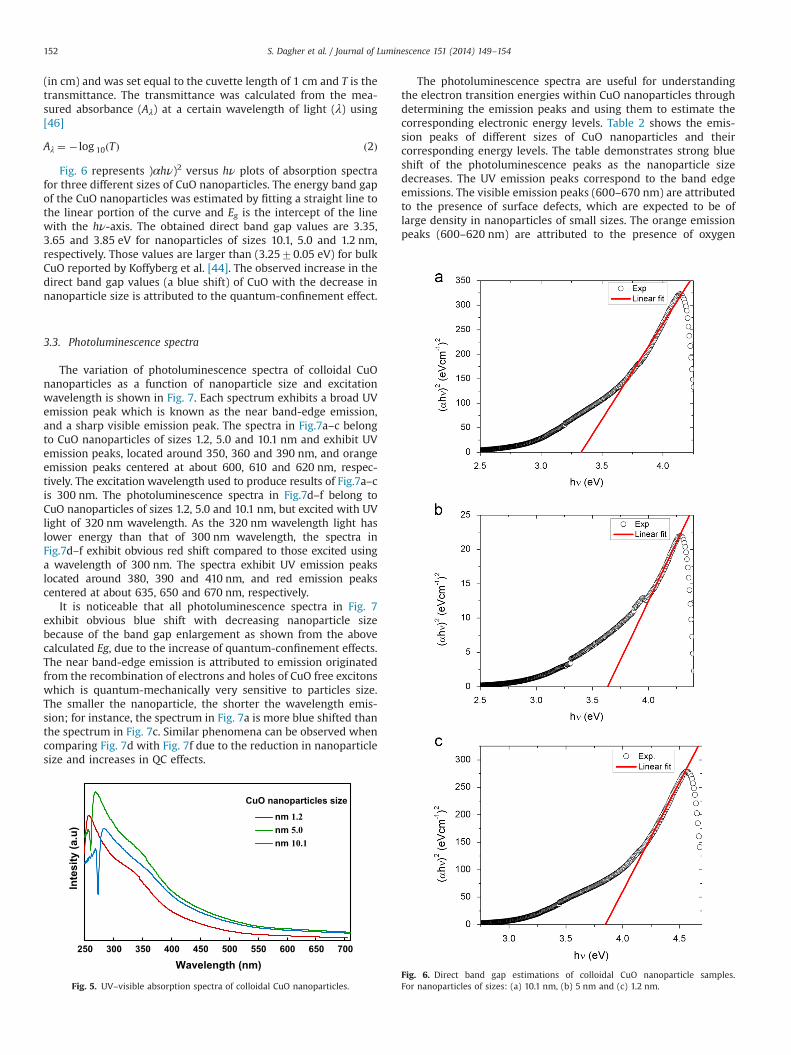
Fig. 5 shows the UV–visible absorption spectra of colloidal CuOnanoparticles with average nanoparticle sizes of 10.1, 5.0 and1.2 nm. The figure depicts absorption peaks at about 290, 270and 255 nm for the three samples, respectively. The sizes of thesenanoparticles are smaller than the previously reported exciton ofBohr radius for CuO between 6.6 and 28.7 nm [43], below which afundamental shift in electronic and optical properties can beobserved as a function of nanoparticle size. The peaks' positionsare highly blue shifted compared to bulk CuO with direct bandtransition of about 3.2570.05 eV [44]. The observed blue shiftin the optical absorption spectra with particle size reduction is aclear sign of the energy gap enlargement due to the quantum-confinement (QC) effects.
The absorption spectra can be used to estimate the energy gapof the CuO nanoparticles through Tauc's formula [45]:
ðαhνÞn ¼ Bðhν�EgÞ ð1Þwhere B is a constant related to the material, hν is the photonenergy in eV, h is Plank's constant, ν is the frequency of thephoton, Eg is the optical band gap in eV, n is an exponent that cantake a value of either 2 for a direct transition or 1/2 for an indirecttransition, and α is the absorption coefficient (in cm�1) calculatedusing αd¼ ln(1/T) with d stands for the path length of the wave
Table 1Synthesis methods of CuO nanoparticles with size range.
Preparation method Size(nm)
Sonochemical synthesis 10 to several microns [23]Spinning disk reactor 20–30 [24]Thermal decomposition 15–30 [25]Solid state reaction 15–20[26,27]Microemulsion system 5–25[28]Precipitation pyrolysis 11–35 [29]Sol–gel techniques 7–9 [30] and 1–10 [31]Alcohothermal decomposition of copper acetate 3–9 [32] and 6 [33]Electrochemical synthesis 4 [34]Precipitation synthesis 4 [35]Colloid-thermal synthesis 3 and 5 [36]Microwave irradiation 3–5[22]
Fig. 1. Gradual change in solution color during the syntheses stages (a) as precursors dissolved, (b) 3 h stirring (c) 24 h aging, (d–g ) microwave progress in decreasing CuOnanoparticles size, cycles were repeated 10, 20, 28, 34 times, respectively.
S. Dagher et al. / Journal of Luminescence 151 (2014) 149–154150
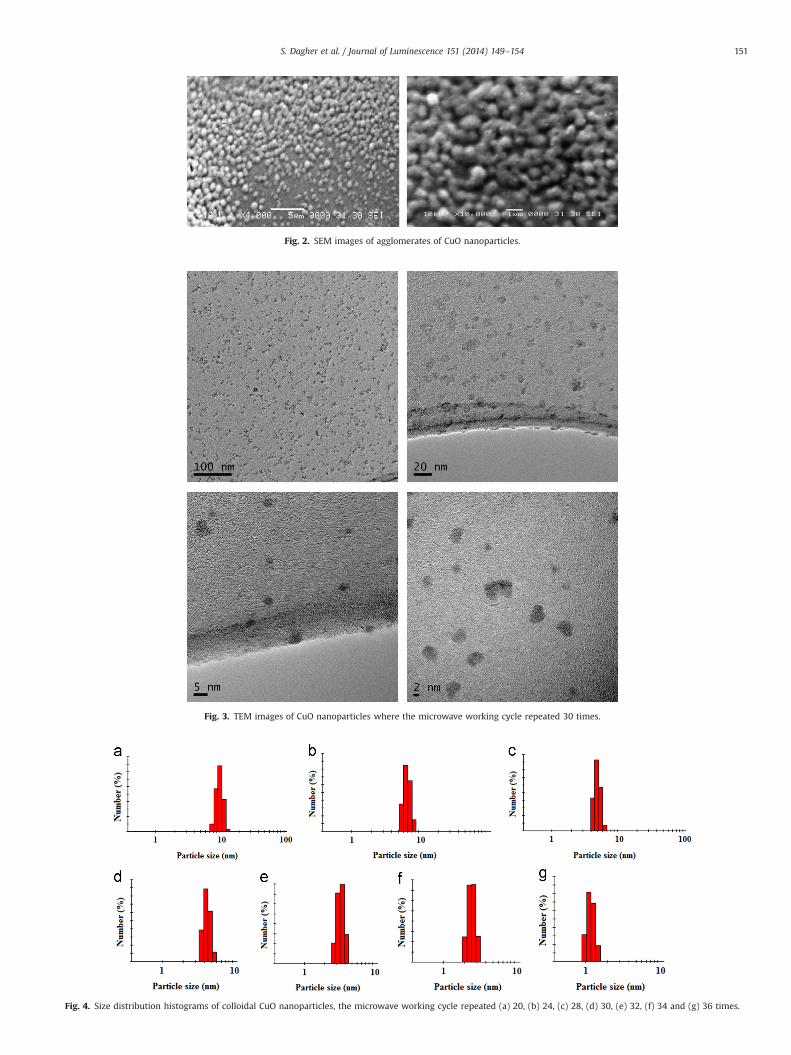
Fig. 2. SEM images of agglomerates of CuO nanoparticles.
Fig. 3. TEM images of CuO nanoparticles where the microwave working cycle repeated 30 times.
Fig. 4. Size distribution histograms of colloidal CuO nanoparticles, the microwave working cycle repeated (a) 20, (b) 24, (c) 28, (d) 30, (e) 32, (f) 34 and (g) 36 times.
S. Dagher et al. / Journal of Luminescence 151 (2014) 149–154 151
(in cm) and was set equal to the cuvette length of 1 cm and T is thetransmittance. The transmittance was calculated from the mea-sured absorbance (Aλ) at a certain wavelength of light (λ) using[46]
Aλ ¼ � log 10ðTÞ ð2Þ
Fig. 6 represents )αhν)2 versus hν plots of absorption spectrafor three different sizes of CuO nanoparticles. The energy band gapof the CuO nanoparticles was estimated by fitting a straight line tothe linear portion of the curve and Eg is the intercept of the linewith the hν-axis. The obtained direct band gap values are 3.35,3.65 and 3.85 eV for nanoparticles of sizes 10.1, 5.0 and 1.2 nm,respectively. Those values are larger than (3.2570.05 eV) for bulkCuO reported by Koffyberg et al. [44]. The observed increase in thedirect band gap values (a blue shift) of CuO with the decrease innanoparticle size is attributed to the quantum-confinement effect.
3.3. Photoluminescence spectra
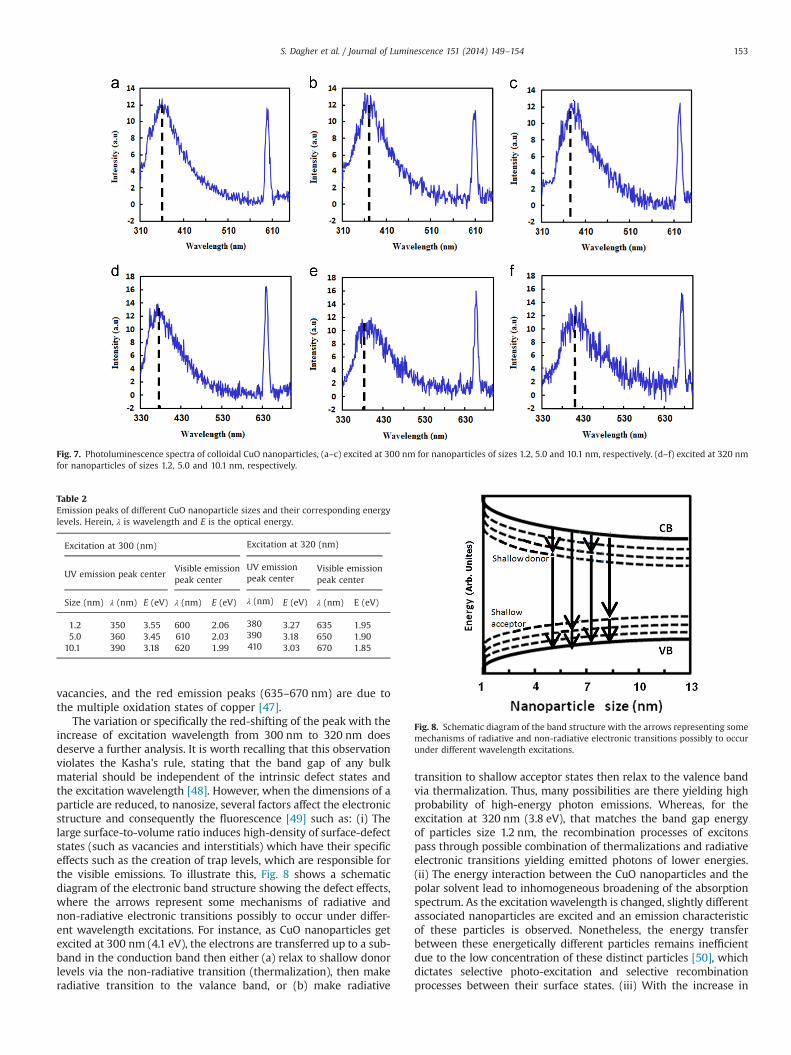
The variation of photoluminescence spectra of colloidal CuOnanoparticles as a function of nanoparticle size and excitationwavelength is shown in Fig. 7. Each spectrum exhibits a broad UVemission peak which is known as the near band-edge emission,and a sharp visible emission peak. The spectra in Fig.7a–c belongto CuO nanoparticles of sizes 1.2, 5.0 and 10.1 nm and exhibit UVemission peaks, located around 350, 360 and 390 nm, and orangeemission peaks centered at about 600, 610 and 620 nm, respec-tively. The excitation wavelength used to produce results of Fig.7a–cis 300 nm. The photoluminescence spectra in Fig.7d–f belong toCuO nanoparticles of sizes 1.2, 5.0 and 10.1 nm, but excited with UVlight of 320 nm wavelength. As the 320 nm wavelength light haslower energy than that of 300 nm wavelength, the spectra inFig.7d–f exhibit obvious red shift compared to those excited usinga wavelength of 300 nm. The spectra exhibit UV emission peakslocated around 380, 390 and 410 nm, and red emission peakscentered at about 635, 650 and 670 nm, respectively.
It is noticeable that all photoluminescence spectra in Fig. 7exhibit obvious blue shift with decreasing nanoparticle sizebecause of the band gap enlargement as shown from the abovecalculated Eg, due to the increase of quantum-confinement effects.The near band-edge emission is attributed to emission originatedfrom the recombination of electrons and holes of CuO free excitonswhich is quantum-mechanically very sensitive to particles size.The smaller the nanoparticle, the shorter the wavelength emis-sion; for instance, the spectrum in Fig. 7a is more blue shifted thanthe spectrum in Fig. 7c. Similar phenomena can be observed whencomparing Fig. 7d with Fig. 7f due to the reduction in nanoparticlesize and increases in QC effects.
The photoluminescence spectra are useful for understandingthe electron transition energies within CuO nanoparticles throughdetermining the emission peaks and using them to estimate thecorresponding electronic energy levels. Table 2 shows the emis-sion peaks of different sizes of CuO nanoparticles and theircorresponding energy levels. The table demonstrates strong blueshift of the photoluminescence peaks as the nanoparticle sizedecreases. The UV emission peaks correspond to the band edgeemissions. The visible emission peaks (600–670 nm) are attributedto the presence of surface defects, which are expected to be oflarge density in nanoparticles of small sizes. The orange emissionpeaks (600–620 nm) are attributed to the presence of oxygen
250 300 350 400 450 500 550 600 650 700
Inte
sity
(a.u
)
Wavelength (nm)
CuO nanoparticles size
nm 1.2nm 5.0nm 10.1
Fig. 5. UV–visible absorption spectra of colloidal CuO nanoparticles.Fig. 6. Direct band gap estimations of colloidal CuO nanoparticle samples.For nanoparticles of sizes: (a) 10.1 nm, (b) 5 nm and (c) 1.2 nm.
S. Dagher et al. / Journal of Luminescence 151 (2014) 149–154152
vacancies, and the red emission peaks (635–670 nm) are due tothe multiple oxidation states of copper [47].
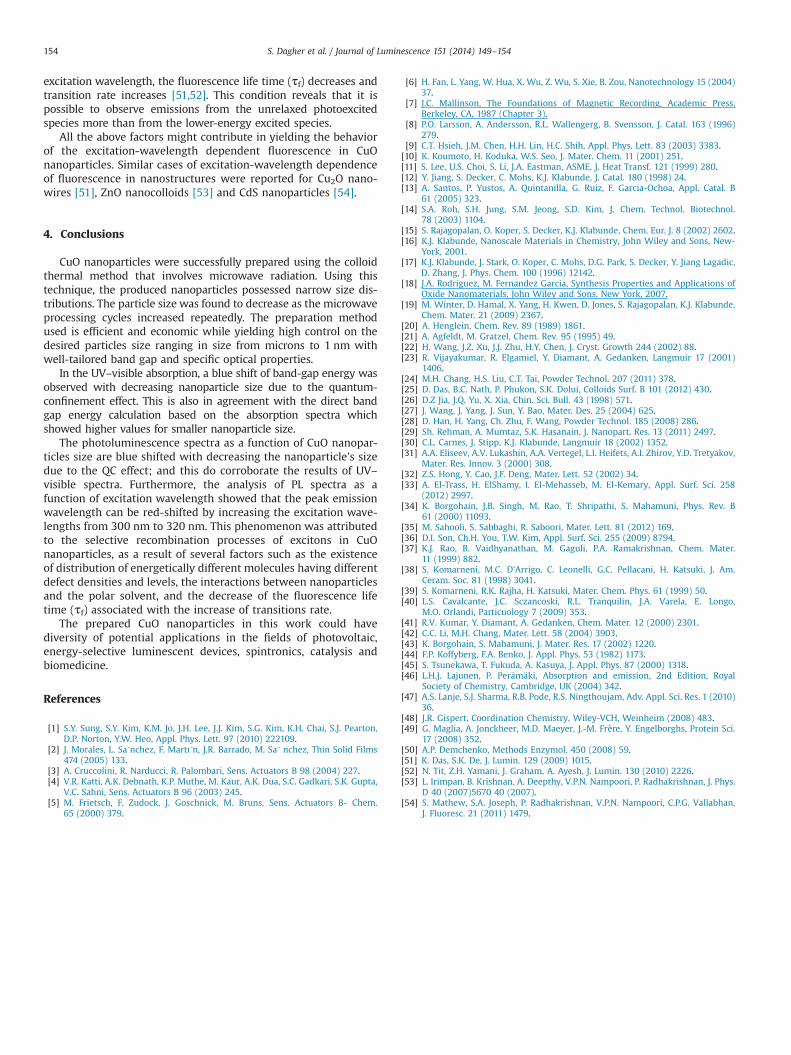
The variation or specifically the red-shifting of the peak with theincrease of excitation wavelength from 300 nm to 320 nm doesdeserve a further analysis. It is worth recalling that this observationviolates the Kasha's rule, stating that the band gap of any bulkmaterial should be independent of the intrinsic defect states andthe excitation wavelength [48]. However, when the dimensions of aparticle are reduced, to nanosize, several factors affect the electronicstructure and consequently the fluorescence [49] such as: (i) Thelarge surface-to-volume ratio induces high-density of surface-defectstates (such as vacancies and interstitials) which have their specificeffects such as the creation of trap levels, which are responsible forthe visible emissions. To illustrate this, Fig. 8 shows a schematicdiagram of the electronic band structure showing the defect effects,where the arrows represent some mechanisms of radiative andnon-radiative electronic transitions possibly to occur under differ-ent wavelength excitations. For instance, as CuO nanoparticles getexcited at 300 nm (4.1 eV), the electrons are transferred up to a sub-band in the conduction band then either (a) relax to shallow donorlevels via the non-radiative transition (thermalization), then makeradiative transition to the valance band, or (b) make radiative
transition to shallow acceptor states then relax to the valence bandvia thermalization. Thus, many possibilities are there yielding highprobability of high-energy photon emissions. Whereas, for theexcitation at 320 nm (3.8 eV), that matches the band gap energyof particles size 1.2 nm, the recombination processes of excitonspass through possible combination of thermalizations and radiativeelectronic transitions yielding emitted photons of lower energies.(ii) The energy interaction between the CuO nanoparticles and thepolar solvent lead to inhomogeneous broadening of the absorptionspectrum. As the excitation wavelength is changed, slightly differentassociated nanoparticles are excited and an emission characteristicof these particles is observed. Nonetheless, the energy transferbetween these energetically different particles remains inefficientdue to the low concentration of these distinct particles [50], whichdictates selective photo-excitation and selective recombinationprocesses between their surface states. (iii) With the increase in
Fig. 7. Photoluminescence spectra of colloidal CuO nanoparticles, (a–c) excited at 300 nm for nanoparticles of sizes 1.2, 5.0 and 10.1 nm, respectively. (d–f) excited at 320 nmfor nanoparticles of sizes 1.2, 5.0 and 10.1 nm, respectively.
Table 2Emission peaks of different CuO nanoparticle sizes and their corresponding energylevels. Herein, λ is wavelength and E is the optical energy.
Excitation at 300 (nm) Excitation at 320 (nm)
UV emission peak centerVisible emissionpeak center
UV emissionpeak center
Visible emissionpeak center
Size (nm) λ (nm) E (eV) λ (nm) E (eV) λ (nm) E (eV) λ (nm) E (eV)
1.2 350 3.55 600 2.06 380 3.27 635 1.955.0 360 3.45 610 2.03 390 3.18 650 1.90
10.1 390 3.18 620 1.99 410 3.03 670 1.85
Fig. 8. Schematic diagram of the band structure with the arrows representing somemechanisms of radiative and non-radiative electronic transitions possibly to occurunder different wavelength excitations.
S. Dagher et al. / Journal of Luminescence 151 (2014) 149–154 153
excitation wavelength, the fluorescence life time (τf) decreases andtransition rate increases [51,52]. This condition reveals that it ispossible to observe emissions from the unrelaxed photoexcitedspecies more than from the lower-energy excited species.
All the above factors might contribute in yielding the behaviorof the excitation-wavelength dependent fluorescence in CuOnanoparticles. Similar cases of excitation-wavelength dependenceof fluorescence in nanostructures were reported for Cu2O nano-wires [51], ZnO nanocolloids [53] and CdS nanoparticles [54].
4. Conclusions
CuO nanoparticles were successfully prepared using the colloidthermal method that involves microwave radiation. Using thistechnique, the produced nanoparticles possessed narrow size dis-tributions. The particle size was found to decrease as the microwaveprocessing cycles increased repeatedly. The preparation methodused is efficient and economic while yielding high control on thedesired particles size ranging in size from microns to 1 nm withwell-tailored band gap and specific optical properties.
In the UV–visible absorption, a blue shift of band-gap energy wasobserved with decreasing nanoparticle size due to the quantum-confinement effect. This is also in agreement with the direct bandgap energy calculation based on the absorption spectra whichshowed higher values for smaller nanoparticle size.
The photoluminescence spectra as a function of CuO nanopar-ticles size are blue shifted with decreasing the nanoparticle's sizedue to the QC effect; and this do corroborate the results of UV–visible spectra. Furthermore, the analysis of PL spectra as afunction of excitation wavelength showed that the peak emissionwavelength can be red-shifted by increasing the excitation wave-lengths from 300 nm to 320 nm. This phenomenon was attributedto the selective recombination processes of excitons in CuOnanoparticles, as a result of several factors such as the existenceof distribution of energetically different molecules having differentdefect densities and levels, the interactions between nanoparticlesand the polar solvent, and the decrease of the fluorescence lifetime (τf) associated with the increase of transitions rate.
The prepared CuO nanoparticles in this work could havediversity of potential applications in the fields of photovoltaic,energy-selective luminescent devices, spintronics, catalysis andbiomedicine.
References
[1] S.Y. Sung, S.Y. Kim, K.M. Jo, J.H. Lee, J.J. Kim, S.G. Kim, K.H. Chai, S.J. Pearton,D.P. Norton, Y.W. Heo, Appl. Phys. Lett. 97 (2010) 222109.
[2] J. Morales, L. Sa´nchez, F. Martı´n, J.R. Barrado, M. Sa´ nchez, Thin Solid Films474 (2005) 133.
[3] A. Cruccolini, R. Narducci, R. Palombari, Sens. Actuators B 98 (2004) 227.[4] V.R. Katti, A.K. Debnath, K.P. Muthe, M. Kaur, A.K. Dua, S.C. Gadkari, S.K. Gupta,
V.C. Sahni, Sens. Actuators B 96 (2003) 245.[5] M. Frietsch, F. Zudock, J. Goschnick, M. Bruns, Sens. Actuators B- Chem.
65 (2000) 379.
[6] H. Fan, L. Yang, W. Hua, X. Wu, Z. Wu, S. Xie, B. Zou, Nanotechnology 15 (2004)37.
[7] J.C. Mallinson, The Foundations of Magnetic Recording, Academic Press,Berkeley, CA, 1987 (Chapter 3).
[8] P.O. Larsson, A. Andersson, R.L. Wallengerg, B. Svensson, J. Catal. 163 (1996)279.
[9] C.T. Hsieh, J.M. Chen, H.H. Lin, H.C. Shih, Appl. Phys. Lett. 83 (2003) 3383.[10] K. Koumoto, H. Koduka, W.S. Seo, J. Mater. Chem. 11 (2001) 251.[11] S. Lee, U.S. Choi, S. Li, J.A. Eastman, ASME, J. Heat Transf. 121 (1999) 280.[12] Y. Jiang, S. Decker, C. Mohs, K.J. Klabunde, J. Catal. 180 (1998) 24.[13] A. Santos, P. Yustos, A. Quintanilla, G. Ruiz, F. Garcia-Ochoa, Appl. Catal. B
61 (2005) 323.[14] S.A. Roh, S.H. Jung, S.M. Jeong, S.D. Kim, J. Chem. Technol. Biotechnol.
78 (2003) 1104.[15] S. Rajagopalan, O. Koper, S. Decker, K.J. Klabunde, Chem. Eur. J. 8 (2002) 2602.[16] K.J. Klabunde, Nanoscale Materials in Chemistry, John Wiley and Sons, New-
York, 2001.[17] K.J. Klabunde, J. Stark, O. Koper, C. Mohs, D.G. Park, S. Decker, Y. Jiang Lagadic,
D. Zhang, J. Phys. Chem. 100 (1996) 12142.[18] J.A. Rodriguez, M. Fernandez Garcia, Synthesis Properties and Applications of
Oxide Nanomaterials, John Wiley and Sons, New York, 2007.[19] M. Winter, D. Hamal, X. Yang, H. Kwen, D. Jones, S. Rajagopalan, K.J. Klabunde,
Chem. Mater. 21 (2009) 2367.[20] A. Henglein, Chem. Rev. 89 (1989) 1861.[21] A. Agfeldt, M. Gratzel, Chem. Rev. 95 (1995) 49.[22] H. Wang, J.Z. Xu, J.J. Zhu, H.Y. Chen, J. Cryst. Growth 244 (2002) 88.[23] R. Vijayakumar, R. Elgamiel, Y. Diamant, A. Gedanken, Langmuir 17 (2001)
1406.[24] M.H. Chang, H.S. Liu, C.T. Tai, Powder Technol. 207 (2011) 378.[25] D. Das, B.C. Nath, P. Phukon, S.K. Dolui, Colloids Surf. B 101 (2012) 430.[26] D.Z Jia, J.Q. Yu, X. Xia, Chin. Sci. Bull. 43 (1998) 571.[27] J. Wang, J. Yang, J. Sun, Y. Bao, Mater. Des. 25 (2004) 625.[28] D. Han, H. Yang, Ch. Zhu, F. Wang, Powder Technol. 185 (2008) 286.[29] Sh. Rehman, A. Mumtaz, S.K. Hasanain, J. Nanopart. Res. 13 (2011) 2497.[30] C.L. Carnes, J. Stipp, K.J. Klabunde, Langmuir 18 (2002) 1352.[31] A.A. Eliseev, A.V. Lukashin, A.A. Vertegel, L.I. Heifets, A.I. Zhirov, Y.D. Tretyakov,
Mater. Res. Innov. 3 (2000) 308.[32] Z.S. Hong, Y. Cao, J.F. Deng, Mater. Lett. 52 (2002) 34.[33] A. El-Trass, H. ElShamy, I. El-Mehasseb, M. El-Kemary, Appl. Surf. Sci. 258
(2012) 2997.[34] K. Borgohain, J.B. Singh, M. Rao, T. Shripathi, S. Mahamuni, Phys. Rev. B
61 (2000) 11093.[35] M. Sahooli, S. Sabbaghi, R. Saboori, Mater. Lett. 81 (2012) 169.[36] D.I. Son, Ch.H. You, T.W. Kim, Appl. Surf. Sci. 255 (2009) 8794.[37] K.J. Rao, B. Vaidhyanathan, M. Gaguli, P.A. Ramakrishnan, Chem. Mater.
11 (1999) 882.[38] S. Komarneni, M.C. D’Arrigo, C. Leonelli, G.C. Pellacani, H. Katsuki, J. Am.
Ceram. Soc. 81 (1998) 3041.[39] S. Komarneni, R.K. Rajha, H. Katsuki, Mater. Chem. Phys. 61 (1999) 50.[40] L.S. Cavalcante, J.C. Sczancoski, R.L. Tranquilin, J.A. Varela, E. Longo,
M.O. Orlandi, Particuology 7 (2009) 353.[41] R.V. Kumar, Y. Diamant, A. Gedanken, Chem. Mater. 12 (2000) 2301.[42] C.C. Li, M.H. Chang, Mater. Lett. 58 (2004) 3903.[43] K. Borgohain, S. Mahamuni, J. Mater. Res. 17 (2002) 1220.[44] F.P. Koffyberg, F.A. Benko, J. Appl. Phys. 53 (1982) 1173.[45] S. Tsunekawa, T. Fukuda, A. Kasuya, J. Appl. Phys. 87 (2000) 1318.[46] L.H.J. Lajunen, P. Perämäki, Absorption and emission, 2nd Edition, Royal
Society of Chemistry, Cambridge, UK (2004) 342.[47] A.S. Lanje, S.J. Sharma, R.B. Pode, R.S. Ningthoujam, Adv. Appl. Sci. Res. 1 (2010)
36.[48] J.R. Gispert, Coordination Chemistry, Wiley-VCH, Weinheim (2008) 483.[49] G. Maglia, A. Jonckheer, M.D. Maeyer, J.-M. Frère, Y. Engelborghs, Protein Sci.
17 (2008) 352.[50] A.P. Demchenko, Methods Enzymol. 450 (2008) 59.[51] K. Das, S.K. De, J. Lumin. 129 (2009) 1015.[52] N. Tit, Z.H. Yamani, J. Graham, A. Ayesh, J. Lumin. 130 (2010) 2226.[53] L. Irimpan, B. Krishnan, A. Deepthy, V.P.N. Nampoori, P. Radhakrishnan, J. Phys.
D 40 (2007)5670 40 (2007).[54] S. Mathew, S.A. Joseph, P. Radhakrishnan, V.P.N. Nampoori, C.P.G. Vallabhan,
J. Fluoresc. 21 (2011) 1479.
S. Dagher et al. / Journal of Luminescence 151 (2014) 149–154154