Binding of chloroquine–conjugated gold nanoparticles with bovine serum albumin

Synthesis and optical properties of colloidal gold nanoparticles
This article has been downloaded from IOPscience. Please scroll down to see the full text article.
2009 J. Phys.: Conf. Ser. 187 012026
(http://iopscience.iop.org/1742-6596/187/1/012026)
Download details:
IP Address: 58.187.66.152
The article was downloaded on 20/02/2013 at 07:40
Please note that terms and conditions apply.
View the table of contents for this issue, or go to the journal homepage for more
Home Search Collections Journals About Contact us My IOPscience
Synthesis and optical properties of colloidal gold nanoparticles
Nguyen Ngoc Long, Le Van Vu, Chu Dinh Kiem, Sai Cong Doanh, Cao Thi Nguyet, Pham Thi Hang, Nguyen Duy Thien, Luu Manh Quynh
Faculty of Physics, Hanoi University of Science, 334 Nguyen Trai, Thanh Xuan, Hanoi, Vietnam
E-mail: [email protected]
Abstract. Colloidal gold nanoparticles (spheres) have been prepared from HAuCl4 containing aqueous solution by using X-ray irradiation and by chemical reduction method. Gold nanorods were synthesized according to the seed-mediated growth method. The colloidal gold nanoparticles were characterized by using transmission electron microscopy, X-ray diffraction, and UV-VIS absorption spectroscopy. It was found that the concentration of the precursors affects the size of the nanoparticles. In the chemical reduction approach the size of nanoparticles can be controlled by varying amount of trisodium citrate, but in the photochemical method the size of nanoparticles can been controlled by varying the ratio of HAuCl4 to TX-100 and X-ray irradiation duration. Gold nanorods have been synthesized according to the seed-mediated growth method with two steps. The effect of silver acetate and CTAB on formation of gold nanorods has been studied.
Keywords: Metallic nanoparticles, gold nanoparticles, chemical reduction method, photochemical method.
1. Introduction Metal nanoparticles, in general, and gold nanoparticles, in particular, are very attractive because of their size- and shape-dependent properties [1]. For example, gold nanospheres have a characteristic red colour, but anisotropic gold nanorods have a dramatically changed colour. More recent treatments have shown that the colour is due to the collective oscillation of the electrons in the conduction band, known as the surface plasmon oscillation [2]. The oscillation frequency is usually in the visible region for gold giving rise to the strong surface plasmon resonance absorption. The plasmon resonance absorption of gold nanospheres has an absorption coefficient orders of magnitude larger than strongly absorbing dyes. Anisotropic shapes like nanorods have plasmon resonance absorptions that are even stronger, leading to increased detection sensitivity. Gold nanoparticles generate enhanced electromagnetic fields that affect the local environment. The field is determined by the geometry of the nanoparticle and can enhance fluorescence of the gold itself, the Raman signal of a molecule on the surface, and the scattering of light. Because of the mentioned above factors, many applications in biomedicine of gold nanoparticles became possible [3, 4]. In the existing literature Au nanoparticles have been prepared using various methods such as chemical reduction [5, 6], photochemical using UV irradiation [7, 8], sonochemical [9, 10], sonoelectrochemical, etc [11, 12]. Gold nanorods have been synthesized by the seed-mediated growth method [13-15].
APCTP–ASEAN Workshop on Advanced Materials Science and Nanotechnology (AMSN08) IOP PublishingJournal of Physics: Conference Series 187 (2009) 012026 doi:10.1088/1742-6596/187/1/012026
c© 2009 IOP Publishing Ltd 1
In this work we present the size- and shape-controlled synthesis of gold nanoparticles by chemical reduction method and in particular, we first time report on synthesis of gold nanoparticles by photochemical approach using X-ray irradiation. Structural property, morphology and absorption spectra of the gold nanoparticles are discussed.
2. Experimental Using chemical reduction method, synthesis of gold nanospheres was carried out as follows: 50 ml of 0.01 wt.% chlorauric acid (HAuCl4.3H2O) solution was heated to boiling while stirring in a 100 ml beaker. Then a few hundred microlitres (μl) of 1 wt.% trisodium citrate dihydrate (Na3C6H5O7.2H2O) solution was quickly added to the auric solution. The solution changed color within several minutes from yellow to black and then to red or purple color depending on the size of the nanoparticles.
Gold nanoparticles were also synthesized via a photochemical approach by using X-ray irradiation. In this approach, a few μl of 1 mM triton X-100 (TX-100) solution was mixed with 3 ml of 1 mM HAuCl4.3H2O solution. Pure HAuCl4 solution without TX-100 addition was also prepared for comparison. The X-ray radiation was Cu-Ka radiation of an X-ray diffractometer Siemens D5005 with the parameters of 40 kV and 40 mA. The X-ray irradiation time was set up to 40 or 60 minutes to guarantee the complete reduction of gold precursor solution.
Gold nanorods were synthesized according to the seed-mediated growth method [13, 14]. The synthesis of gold nanorods was divided into two steps.
Step 1: Preparation of seed solution: 2.5 ml of 1 mM chlorauric acid solution was mixed with 7.5 ml of 0.2 M cetyltrimettyammonium bromide (CTAB: C19H42NBr) solution and stirred. To the stirred solution, 0.6 ml of ice-cold 0.01 M sodium borohydride (NaBH4) solution was added. The final solution had a brownish yellow color. Stirring the seed solution was continued for 2 minutes. After that, the seed solution was kept at room temperature.
Step 2: Growth of nanorods: 5 ml of 0.2 M CTAB solution was added to 5 ml of 1 mM chlorauric acid solution. Then a few hundred μl of 4 mM silver acetate (AgC2H3O2) solution was added and gently mixed. After that, to this solution, 70 μl of 0.08 M ascorbic acid (C6H8O6) solution and 12 μl of the seed solution were added (see table 1). By changing the amount of silver acetate, the aspect ratio defined as the length of the major axis divided by the width of the minor axis of the nanorods can be varied. To separate nanorods from nanospheres, the solution was centrifuged at 3000 rpm for 10 min.
Table 1. Preparation of gold nanorods
Chemicals Sample 1 Sample 2 Sample 3 Sample 4 Sample 5 CTAB 5 ml 5 ml 5 ml 5 ml 5 ml AgC2H3O2 50 μl 100 μl 150 μl 200 μl 250 μl HAuCl4 5 ml 5 ml 5 ml 5 ml 5 ml Ascorbic acid 70 μl 70 μl 70 μl 70 μl 70 μl Seed solution 12 μl 12 μl 12 μl 12 μl 12 μl
The obtained products were characterized by X-ray diffraction (XRD) by using a Brucker D5005 diffractometer and transmission electron microscopy (TEM) by using a JEOL JEM1010 electron microscope. UV-VIS absorption spectra of the nanoparticle solutions were collected with a Shimadzu UV 2450 PC spectrometer.
3. Results and discussion We have prepared the gold nanoparticles by adding different amounts (200, 240, 280, 320, 360, and 400 μl) of 1 wt.% trisodium citrate solution to 50 ml of 0.01 wt.% chlorauric acid solution while heating to boiling.
Figure 1 illustrates a typical XRD pattern of the gold nanoparticles obtained from the solution with 400 μl of trisodium citrate. It can be seen from the figure that all the diffraction peaks corresponding to the diffraction planes (111), (200), and (220) were indexed to the gold metal with face centered cubic
APCTP–ASEAN Workshop on Advanced Materials Science and Nanotechnology (AMSN08) IOP PublishingJournal of Physics: Conference Series 187 (2009) 012026 doi:10.1088/1742-6596/187/1/012026
2

structure. Lattice constant determined from XRD pattern is a = 4.078 Ǻ in good agreement with the standard diffraction pattern of cubic gold metal (Pattern 4-784).
Figure 1. XRD pattern of the gold nanoparticles prepared by chemical reduction technique.
Figure 2. Surface plasmon absorption spectra of spherical gold nanoparticles prepared with different amounts of 1 wt.% trisodium citrate solution: 200, 240, 280, 320, 360, and 400 μl.
Surface plasmon absorption spectra of spherical gold nanoparticles prepared with different amounts of 1 wt.% trisodium citrate solution are shown in figure 2. As seen from the figure, the maximum of the absorption spectrum is shifted to the short wavelength side (from 539.9 to 521.1 nm) and the full width at half maximum (FWHM) of the spectrum is decreased with increasing amount of trisodium citrate from 200 to 400 μl. Thus, the amount of citrate solution determines the size of the nanoparticles. The faster the capping of the nanoparticles by the citrate, the smaller the resulting nanoparticles.
Typical TEM images of the gold nanoparticles prepared with different amounts of 1 wt.% trisodium citrate solution are shown in figure 3. From the figure one can see that when the amount of trisodium citrate increases from 200 to 400 μl, the size of the synthesized gold nanoparticles decreases from 60 to 30 nm. That means the more amount of trisodium citrate, the smaller obtained nanoparticles are.
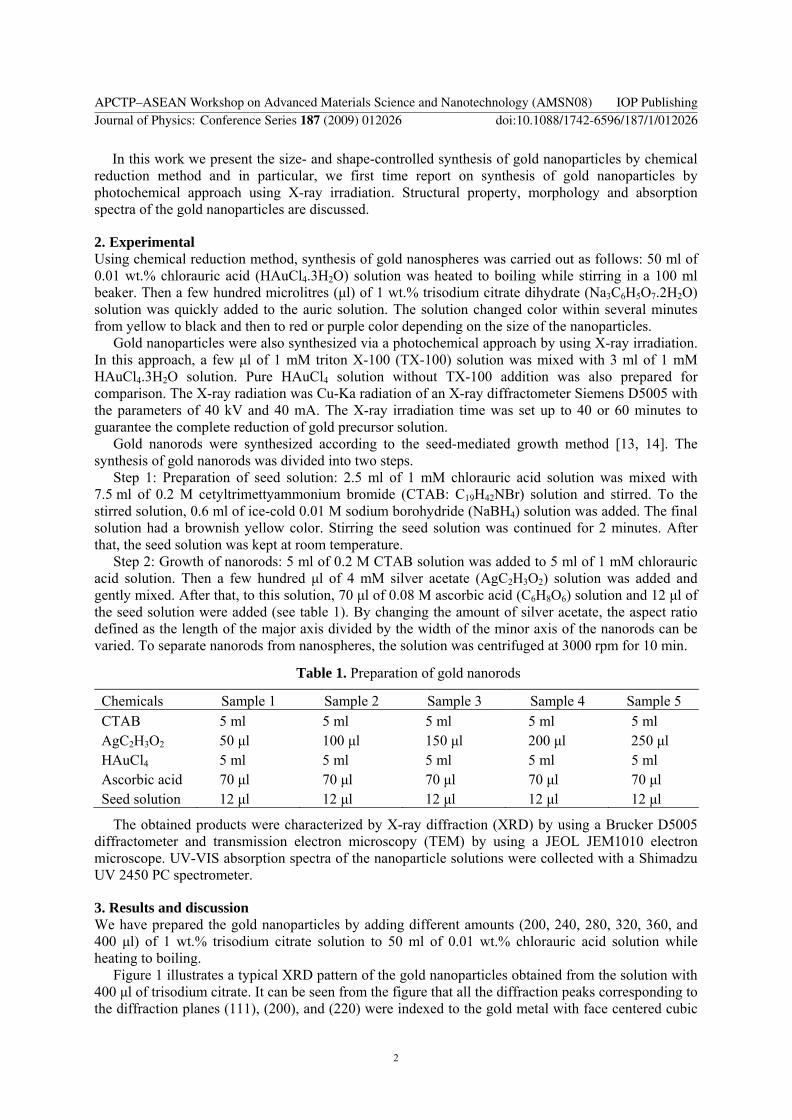
Gold nanoparticles were also synthesized via a photochemical approach by using X-ray irradiation as mentioned above. Figure 4a shows the TEM image of the gold nanoparticles for the sample prepared from HAuCl4 solution without TX-100 with the corresponding selected area electron diffraction (SAED) pattern in the inset. It can be seen that the gold nanoparticles with the size about 7-10 nm are aggregated. From the SAED pattern one can see that the diffraction rings were indexed to (111), (220), and (311) diffraction planes of the cubic structure of gold metal in agreement with the XRD pattern (not shown here). The TEM image of the gold nanoparticles for the sample prepared from the mixed solution of HAuCl4 and TX-100 is illustrated in figure 4b. As seen from this figure, the gold nanoparticles are spherical and well dispersed.
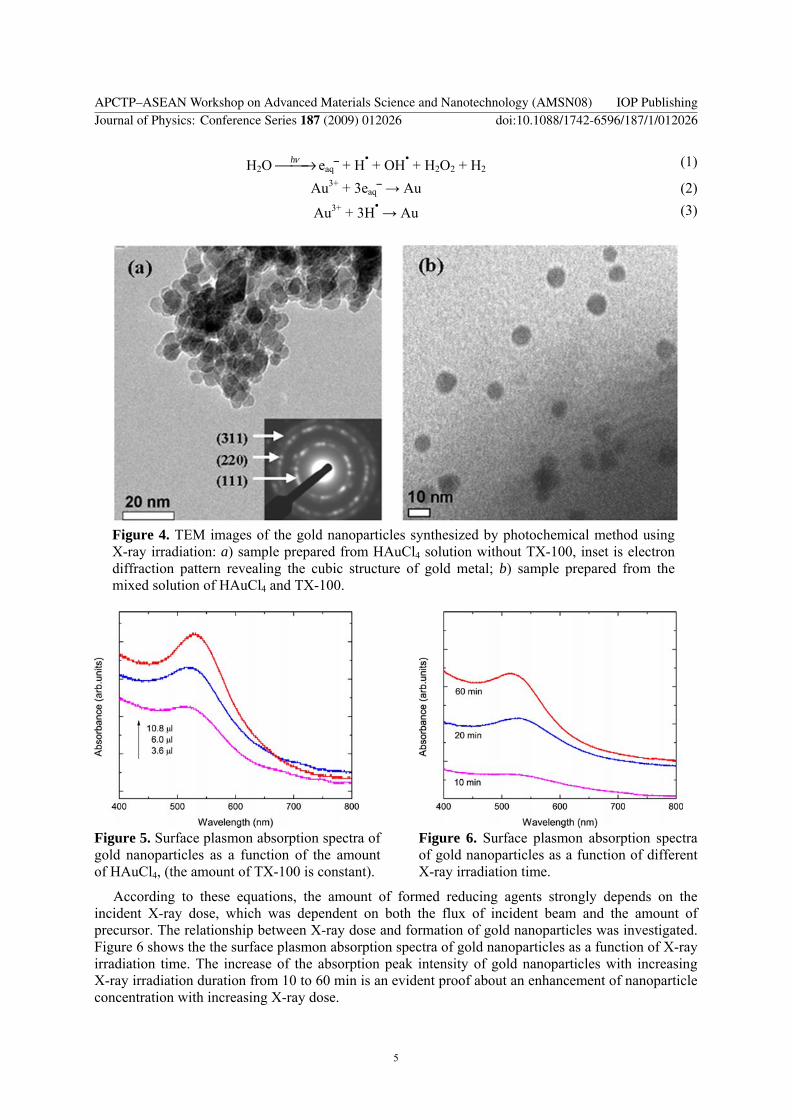
It is found that the addition of TX-100 behaving as a particle stabilizer and reducing agent into HAuCl4 solution tremendously affected the formation and growth of the gold nanoparticles. Figure 5 shows the surface plasmon absorption spectra of gold nanoparticles as a function of amount of HAuCl4 solution. When the amount of HAuCl4 is increased from 3.6 to 10.8 μl, while the amount of TX-100 is kept constant, the intensity of absorption band is much stronger.
APCTP–ASEAN Workshop on Advanced Materials Science and Nanotechnology (AMSN08) IOP PublishingJournal of Physics: Conference Series 187 (2009) 012026 doi:10.1088/1742-6596/187/1/012026
3

Figure 3. TEM images of the gold nanoparticles prepared with different amounts (200, 280, 360, and 400 μl) of 1 wt.% trisodium citrate solution. All the scale bars are 100 nm. On the pictures are shown the size of the nanoparticles and the wavelength of the maximum of surface plasmon absorption spectra.
When trivalent gold ions AuIIICl4− are irradiated by an intensive X-ray beam, the reduction occurs
as follows: Under the effect of the X-ray radiation, hydrated electrons produced from water molecules contributes to the reduction of AuCl4
− ions [16]. The free radical (H•) and solvated electrons (eaq) are powerful reducing agents and easily reduce metallic ions to zero valence gold through the below reactions:
APCTP–ASEAN Workshop on Advanced Materials Science and Nanotechnology (AMSN08) IOP PublishingJournal of Physics: Conference Series 187 (2009) 012026 doi:10.1088/1742-6596/187/1/012026
4
H2O hν⎯⎯→ eaq⎯ + H• + OH• + H2O2 + H2 (1)
Au3+ + 3eaq⎯ → Au (2)
Au3+ + 3H• → Au (3)
Figure 4. TEM images of the gold nanoparticles synthesized by photochemical method using X-ray irradiation: a) sample prepared from HAuCl4 solution without TX-100, inset is electron diffraction pattern revealing the cubic structure of gold metal; b) sample prepared from the mixed solution of HAuCl4 and TX-100.
Figure 5. Surface plasmon absorption spectra of gold nanoparticles as a function of the amount of HAuCl4, (the amount of TX-100 is constant).
Figure 6. Surface plasmon absorption spectra of gold nanoparticles as a function of different X-ray irradiation time.
According to these equations, the amount of formed reducing agents strongly depends on the incident X-ray dose, which was dependent on both the flux of incident beam and the amount of precursor. The relationship between X-ray dose and formation of gold nanoparticles was investigated. Figure 6 shows the the surface plasmon absorption spectra of gold nanoparticles as a function of X-ray irradiation time. The increase of the absorption peak intensity of gold nanoparticles with increasing X-ray irradiation duration from 10 to 60 min is an evident proof about an enhancement of nanoparticle concentration with increasing X-ray dose.
APCTP–ASEAN Workshop on Advanced Materials Science and Nanotechnology (AMSN08) IOP PublishingJournal of Physics: Conference Series 187 (2009) 012026 doi:10.1088/1742-6596/187/1/012026
5

Gold nanorods were synthesized according to the seed-mediated growth method with two steps. By changing silver acetate content (from 50 to 250 μl of 4 mM solution), the aspect ratio of the nanorods can be varied. Table 1 shows the content of the solutions in different samples. Typical XRD pattern of the gold nanorods obtained from the solution with 200 μl of silver acetate solution is shown in figure 7. It can be seen from the figure that all the diffraction peaks were indexed to the gold metal with face centered cubic structure. Lattice constant computed from the diffraction peak (111) is a = 4.083 Ǻ.
Figure 7. XRD pattern of the gold nanorods prepared by the seed-mediated growth method.
Figure 8. Surface plasmon absorption spectra of the gold nanorods prepared with different amounts (50, 100, 150, and 200 μl) of 4 mM silver acetate solution.
Figure 9. TEM images of gold nanostructures for sample 1: a) as-synthesized produce; b) produce after centrifugation at 3000 rpm for 10 min.
APCTP–ASEAN Workshop on Advanced Materials Science and Nanotechnology (AMSN08) IOP PublishingJournal of Physics: Conference Series 187 (2009) 012026 doi:10.1088/1742-6596/187/1/012026
6

Surface plasmon absorption spectra of anisotropic gold nanorods prepared with different amounts of 4 mM silver acetate solution are shown in figure 8. As seen from the figure, when the shape of the nanoparticles changes from nanospheres to nanorods, the surface plasmon absorption spectra also change. The surface plasmon absorption spectra of gold nanorods have two bands: one band in the blue-green region around 525 nm due to the transverse oscillation of electrons and another band in the red-near infrared region due to the longitudinal electronic oscillation. In addition, the position of the band due to the transverse electronic oscillation is almost unvaried; meanwhile the position of the band due to the longitudinal oscillation is increased from 643.6 to 674.3 nm with increasing the silver acetate content from 50 to 250 μl.
Typical TEM image of gold nanostructures for the as-prepared sample 1 (table 1) with 50 μl of 4 mM silver acetate solution is shown in figure 9a. Two major components of the sample are spherical nanoparticles and nanorods. After centrifugation at 3000 rpm for 10 min, the nanorods were separated from spherical nanoparticles (figure 9b).
Our experimental results indicated that if no amount of silver acetate was added to the growth solution, no rods were formatted (inset in figure 10). In this case, the increase of CTAB amount made the particle size slightly decrease. It can be seen from figure 10 that for the samples prepared without silver acetate, there are no absorption bands due to the longitudinal oscillation of electrons in the visible spectra.
Figure 10. Visible absorption spectra of gold nanoparticles prepared with 2.5, 5, 7.5, 10, 15 μl of 0.05 M CTAB solution in the absence of silver ions. Inset shows a TEM image of the sample containing 15μl CTAB.
Figure 11. Visible absorption spectra of gold nanoparticles prepared with 2.5, 5, 7.5, 10, 15 μl of 0.05 M CTAB solution and 300 μl of 4 mM silver acetate solution.
In addition, the position of the absorption bands due to the transverse oscillation is almost kept constant. When a certain amount of silver acetate was added to the growth solution, gold nanorods were easily formatted. In this case, the increase of CTAB amount resulted in increasing aspect ratio of nanorods. This fact is clearly illustrated in figure 11. When 300 μl of 4 mM silver acetate solution are added to the growth solution, the absorption bands due to the longitudinal oscillation of electrons appear in the visible spectra, that is obvious evidence on the formation of gold nanorods. In addition, with increasing the content of CTAB from 2.5 to 15 μl of 0.05 M CTAB solution, the position of the longitudinal oscillation absorption bands is shifted from 681.6 to 721.0 nm, corresponding to the enhance of the aspect ratio of gold nanorods.
4. Conclusion The colloidal gold nanoparticles have been prepared by chemical reduction method and by photochemical method using X-ray irradiation. In the chemical reduction approach the size of
APCTP–ASEAN Workshop on Advanced Materials Science and Nanotechnology (AMSN08) IOP PublishingJournal of Physics: Conference Series 187 (2009) 012026 doi:10.1088/1742-6596/187/1/012026
7

nanoparticles can been controlled by varying amount of trisodium citrate, but in the photochemical method the size of nanoparticles can been controlled by varying the ratio between the amount of HAuCl4 and TX-100, and X-ray irradiation duration. The gold nanorods have been prepared by the seed-mediated growth method. The aspect ratio of nanorods can be controlled by varying amount of silver acetate and CTAB.
References [1] Eustis S and El-Sayed M A 2006 Chemical Society Review 35 209 [2] Liz-Marzan L M 2004 Materialstoday 7 26 [3] Jain P K, El-Sayed I H and El-Sayed M A 2007 Nanotoday 2 18 [4] Rayavarapu R G, Petersen W, Ungureanu C, Post J N, van Leeuwen T G and Manohar S 2007
International Journal of Biomedical Imaging Article ID 29817 [5] Frens G 1973 Nature 241 20 [6] Leff D V, Ohara P C, Heath J R and Gelbart W M 1995 J. Phys. Chem. 99 7036 [7] Kaushik Mallick, Wang Z L and Tarasankar Pal 2001 Journal of Photochemistry and
Photobiology A: Chemistry 140 75 [8] Sau T K, Anjali P, Jana N R, Wang Z L and Tarasankar P 2001 Journal of Nanoparticle
Research 3 257 [9] Kenji O, Yoshiteru M, Yamamoto T A, Yasuaki M and Yoshio Na 2007 Materials Letters 61
3429 [10] Cuncheng L, Weiping C, Caixia K, Ganhua F and Lide Z 2003 Materials Letters 58 196 [11] Liping W, Wei M, Dandan N, Junwei D, Ying W and Yifeng T 2008 Electrochemistry
Communications 10 673 [12] Min Z, Shenhao C, Shiyong Z and Houyi M 2006 Physica E 33 28 [13] Nikoobakht B and El-Sayed M A 2001 Langmuir 17 6368 [14] Sau T K and Murphy C J 2004 Langmuir 20 6414 [15] Jorge P-J, Isabel P-S, Luis M L-M and Paul M 2005 Coordination Chemistry Reviews 249 1870 [16] Gachard E, Remita H, Khatouri J, Keita B, Nadjo L, Belloni J 1998 New J. Chem. 22 1257
Acknowledgements This work is financially supported by Ministry of Science and Technology of Vietnam (Project 405506 and Task of Protocol with Israel) and Vietnam National University, Hanoi (Key Project QGTD 0805 and QG 07-03).
APCTP–ASEAN Workshop on Advanced Materials Science and Nanotechnology (AMSN08) IOP PublishingJournal of Physics: Conference Series 187 (2009) 012026 doi:10.1088/1742-6596/187/1/012026
8
Copyright © 2022 FDOKUMEN