Your perfect laundry companion. - BSH CDN Service - Bosch ...
Effect of Laundry Surfactants on Surface Charge and ColloidalStability of Silver NanoparticlesSara Skoglund,*,† Troy A. Lowe,†,‡ Jonas Hedberg,† Eva Blomberg,*,†,§ Inger Odnevall Wallinder,†
Susanna Wold,‡ and Maria Lundin†,‡
KTH Royal Institute of Technology, School of Chemical Science and Engineering, †Surface and Corrosion Science, and ‡AppliedPhysical Chemistry, SE-100 44 Stockholm, Sweden§Chemistry, Materials and Surfaces, SP Technical Research Institute of Sweden, Box 5607, SE-114 86 Stockholm, Sweden
*S Supporting Information
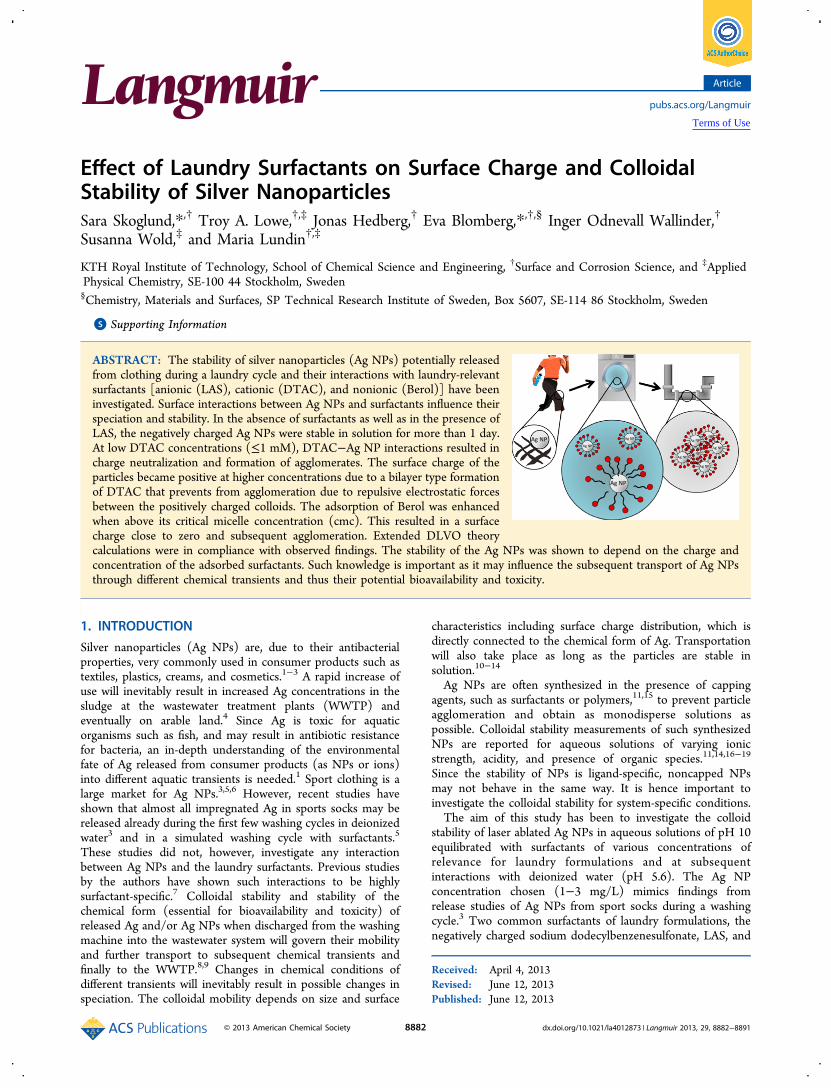
ABSTRACT: The stability of silver nanoparticles (Ag NPs) potentially releasedfrom clothing during a laundry cycle and their interactions with laundry-relevantsurfactants [anionic (LAS), cationic (DTAC), and nonionic (Berol)] have beeninvestigated. Surface interactions between Ag NPs and surfactants influence theirspeciation and stability. In the absence of surfactants as well as in the presence ofLAS, the negatively charged Ag NPs were stable in solution for more than 1 day.At low DTAC concentrations (≤1 mM), DTAC−Ag NP interactions resulted incharge neutralization and formation of agglomerates. The surface charge of theparticles became positive at higher concentrations due to a bilayer type formationof DTAC that prevents from agglomeration due to repulsive electrostatic forcesbetween the positively charged colloids. The adsorption of Berol was enhancedwhen above its critical micelle concentration (cmc). This resulted in a surfacecharge close to zero and subsequent agglomeration. Extended DLVO theorycalculations were in compliance with observed findings. The stability of the Ag NPs was shown to depend on the charge andconcentration of the adsorbed surfactants. Such knowledge is important as it may influence the subsequent transport of Ag NPsthrough different chemical transients and thus their potential bioavailability and toxicity.
1. INTRODUCTION
Silver nanoparticles (Ag NPs) are, due to their antibacterialproperties, very commonly used in consumer products such astextiles, plastics, creams, and cosmetics.1−3 A rapid increase ofuse will inevitably result in increased Ag concentrations in thesludge at the wastewater treatment plants (WWTP) andeventually on arable land.4 Since Ag is toxic for aquaticorganisms such as fish, and may result in antibiotic resistancefor bacteria, an in-depth understanding of the environmentalfate of Ag released from consumer products (as NPs or ions)into different aquatic transients is needed.1 Sport clothing is alarge market for Ag NPs.3,5,6 However, recent studies haveshown that almost all impregnated Ag in sports socks may bereleased already during the first few washing cycles in deionizedwater3 and in a simulated washing cycle with surfactants.5
These studies did not, however, investigate any interactionbetween Ag NPs and the laundry surfactants. Previous studiesby the authors have shown such interactions to be highlysurfactant-specific.7 Colloidal stability and stability of thechemical form (essential for bioavailability and toxicity) ofreleased Ag and/or Ag NPs when discharged from the washingmachine into the wastewater system will govern their mobilityand further transport to subsequent chemical transients andfinally to the WWTP.8,9 Changes in chemical conditions ofdifferent transients will inevitably result in possible changes inspeciation. The colloidal mobility depends on size and surface
characteristics including surface charge distribution, which isdirectly connected to the chemical form of Ag. Transportationwill also take place as long as the particles are stable insolution.10−14
Ag NPs are often synthesized in the presence of cappingagents, such as surfactants or polymers,11,15 to prevent particleagglomeration and obtain as monodisperse solutions aspossible. Colloidal stability measurements of such synthesizedNPs are reported for aqueous solutions of varying ionicstrength, acidity, and presence of organic species.11,14,16−19
Since the stability of NPs is ligand-specific, noncapped NPsmay not behave in the same way. It is hence important toinvestigate the colloidal stability for system-specific conditions.The aim of this study has been to investigate the colloid
stability of laser ablated Ag NPs in aqueous solutions of pH 10equilibrated with surfactants of various concentrations ofrelevance for laundry formulations and at subsequentinteractions with deionized water (pH 5.6). The Ag NPconcentration chosen (1−3 mg/L) mimics findings fromrelease studies of Ag NPs from sport socks during a washingcycle.3 Two common surfactants of laundry formulations, thenegatively charged sodium dodecylbenzenesulfonate, LAS, and
Received: April 4, 2013Revised: June 12, 2013Published: June 12, 2013
Article
pubs.acs.org/Langmuir
© 2013 American Chemical Society 8882 dx.doi.org/10.1021/la4012873 | Langmuir 2013, 29, 8882−8891
Terms of Use
nonionic Berol 266, Berol, were selected for investigation.20
The interaction of positively charged surfactants was alsoinvestigated as they often are used in softeners. Positivelycharged dodecyl trimethylammonium chloride, DTAC, wasselected as a model component since it has the same chainlength as LAS and properties resembling surfactants used infabric softeners. A multianalytical approach was employed,combining dynamic light scattering (DLS), ζ-potentialmeasurements, and adsorption studies with quartz crystalmicrobalance with dissipation (QCM-D). This enabled in-depth studies of the kinetics of colloidal stability and changes insize distribution and surface charge upon surfactant−Ag NPinteractions. DLS was performed using photon cross-correlation spectroscopy (PCCS). The particles in solutionwere characterized by means of transmission electronmicroscopy (TEM). Atomic absorption spectroscopy (AAS)was used to determine the total silver concentration in solution.
2. MATERIAL AND METHODS2.1. Particles, Surfactants, and Solutions. Ag NPs, produced by
laser ablation, were purchased from EV Nano Technology CompanyLtd., China, with a specified mean particle diameter of 10 nm. Thepowder was investigated as-received, at a concentration of 3 mg/L indeionized water (pH 5.6) and at 1 mg/L in synthetic laundry-relevantwater solutions (pH 10, 2 mM Na2CO3 adjusted to pH 10 by HNO3).These particle concentrations were similar to measured Agconcentrations in the laundry water (up to 1.3 mg/L) released fromAg-impregnated clothing.3 The particle suspensions were freshlyprepared by dispersing 1 g/L Ag NPs in the relevant solution followedby sonication (5 min, Branson sonifier 250, 30% duty cycle) andsubsequent filtration (0.45 μm cellulose acetate filter, Whatman) toremove large agglomerates and dust from solution. The final particleconcentration was determined by means of AAS. All solutions werefreshly prepared in ultrapure water (resistivity 18.2 MΩ cm, MilliporeSweden).The charged surfactants (DTAC and LAS) were purchased from
Sigma-Aldrich, Sweden (reagent grade). Berol 266 (Berol), an alcoholethoxylate with a chain length of C9−11 and 4−7 ethylene oxidegroups (molecular weight range of 320−480 g/mol with median 402g/molsupplier information), was purchased from Akzo Nobel,Sweden.The critical micelle concentrations (cmc) in water according to
literature values, or supplier information, are approximately 20(DTAC), 1.2 (LAS), and 0.075 mM (Berol).20 The cmc was expectedto be slightly lower (for LAS and DTAC) in the presence of Na2CO3and HNO3 (used to adjust the solution pH to 10). The investigatedsurfactant concentrations were varied between 0.01 and 28 mM toinvestigate concentrations below and above the cmc of each surfactant.The differently concentrated samples were prepared separately, andnot by continuous addition of surfactants to the solution to increasethe concentration. The latter preparation procedure has recently beenreported to influence the interaction between oppositely chargedspecies and their long-term stability.21
2.2. Transmission Electron Microscopy. Transmission electronmicroscopy (TEM) imaging was performed using a JEOL JEM 2100Finstrument operating at 200 kV. The samples were prepared bydispersing 1 g/L Ag NPs in a pH 10 water solution followed bysonication (5 min, Sonifier 250, 30% duty cycle). The solution wasthen pipetted onto TEM copper grids coated with holey carbon films,and the liquid was evaporated at ambient air conditions (25 °C)leaving the NPs on the support. Measurements were done on bothnonfiltered and filtered particle dispersions. Both TEM and scanningtransmission electron microscopy (STEM) mode were used to analyzethe samples (within an hour from sample preparation). TEM imageswere recorded in bright field (BF), and STEM images were recordedboth in bright field and dark field (DF). Analysis with energy-dispersive X-ray spectroscopy (EDS) was performed in STEM mode.
2.3. Surface Potential. The ζ-potential, related to the surfacepotential, was determined by means of laser Doppler micro-electrophoresis using a Zetasizer Nano ZS instrument (MalvernInstruments, U.K.) at 25 °C. The results are presented as averagevalues of two replica samples measured twice per sample, if nototherwise stated. Standard latex samples (Malvern Instruments) weretested prior to analysis to ensure the accuracy of the measurements.
2.4. Particle Size Distribution. Particle size distribution measure-ments were conducted by DLS on an instrument employing PCCS(NanoPhox, Sympatec, Germany). Single samples were measuredthree times each at 25 °C, and data from the unique measurementswas integrated to produce a single distribution with the PCCSsoftware. To verify the results, spot checks were performed on randomsamples. Standard latex samples (20 ± 2 nm) (Sympatec) and blanksamples were tested prior to analysis to ensure the accuracy of themeasurements.
2.5. Atomic Absorption Spectroscopy. Determination of totalinvestigated Ag NP concentrations was performed by means of atomicabsorption spectroscopy (Perkin-Elmer AAnalyst 800) using a graphitefurnace accessory. Calibration was conducted using 30, 200, 500 μg/LAg standards (Perkin-Elmer). All samples were acidified with 65%HNO3 to a pH <0.5 before measurement. Triplicate samples wereprepared for each Ag NP concentration. Blank (test solution withoutAg NPs) and standard samples were measured throughout the analysisand all samples were diluted to fall within the calibration range (30−500 μg/L).
2.6. Quartz Crystal Microbalance. Quartz crystal microbalancemeasurements were conducted using a QCM-D E4 from Q-sense AB(Sweden). The sensed mass of surfactant molecules onto evaporatedAg surfaces (QSX 322, Biolin AB, Sweden) was estimated with theSauerbrey equation.22 Measurements were performed at 25 °C with acontinuous surfactant solution flow rate of 200 μL/min during theentire measurement. The QCM Ag surfaces were ultrasonicallycleaned for 10 min in isopropyl alcohol followed by 5 min in absoluteethanol prior to use. The surface roughness (Rq equals 3 nm) wasestimated by means of atomic force microscopy imaging (tappingmode) using a silicon nitride cantilever (MicroMasch) with a scan sizearea of 5 μm × 5 μm (see Supporting Information Figure S1).
3. RESULTS AND DISCUSSION
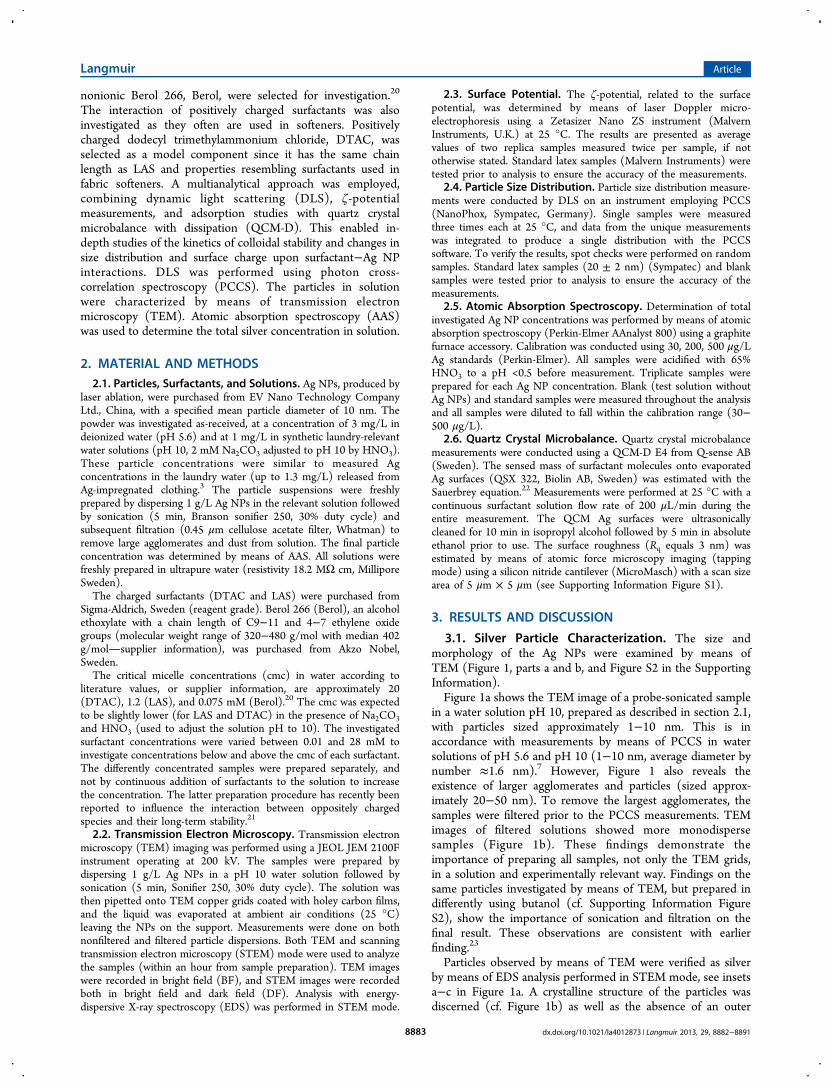
3.1. Silver Particle Characterization. The size andmorphology of the Ag NPs were examined by means ofTEM (Figure 1, parts a and b, and Figure S2 in the SupportingInformation).Figure 1a shows the TEM image of a probe-sonicated sample
in a water solution pH 10, prepared as described in section 2.1,with particles sized approximately 1−10 nm. This is inaccordance with measurements by means of PCCS in watersolutions of pH 5.6 and pH 10 (1−10 nm, average diameter bynumber ≈1.6 nm).7 However, Figure 1 also reveals theexistence of larger agglomerates and particles (sized approx-imately 20−50 nm). To remove the largest agglomerates, thesamples were filtered prior to the PCCS measurements. TEMimages of filtered solutions showed more monodispersesamples (Figure 1b). These findings demonstrate theimportance of preparing all samples, not only the TEM grids,in a solution and experimentally relevant way. Findings on thesame particles investigated by means of TEM, but prepared indifferently using butanol (cf. Supporting Information FigureS2), show the importance of sonication and filtration on thefinal result. These observations are consistent with earlierfinding.23
Particles observed by means of TEM were verified as silverby means of EDS analysis performed in STEM mode, see insetsa−c in Figure 1a. A crystalline structure of the particles wasdiscerned (cf. Figure 1b) as well as the absence of an outer
Langmuir Article
dx.doi.org/10.1021/la4012873 | Langmuir 2013, 29, 8882−88918883
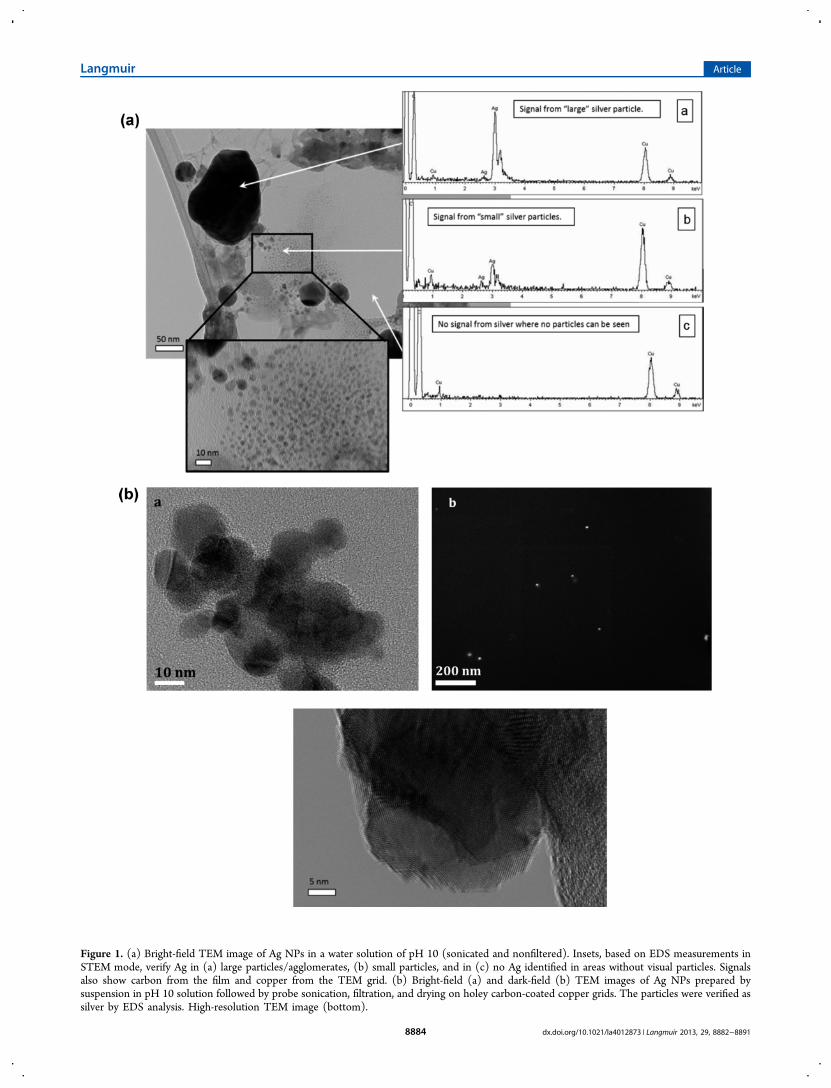
Figure 1. (a) Bright-field TEM image of Ag NPs in a water solution of pH 10 (sonicated and nonfiltered). Insets, based on EDS measurements inSTEM mode, verify Ag in (a) large particles/agglomerates, (b) small particles, and in (c) no Ag identified in areas without visual particles. Signalsalso show carbon from the film and copper from the TEM grid. (b) Bright-field (a) and dark-field (b) TEM images of Ag NPs prepared bysuspension in pH 10 solution followed by probe sonication, filtration, and drying on holey carbon-coated copper grids. The particles were verified assilver by EDS analysis. High-resolution TEM image (bottom).
Langmuir Article
dx.doi.org/10.1021/la4012873 | Langmuir 2013, 29, 8882−88918884
oxygen-rich layer, which is in accordance with earlier findingsby the authors.7 When comparing the TEM images with PCCSfindings it should be kept in mind that DLS is measuring thehydrodynamic size in solution rather than a silver core diameterin vacuum. It should also be noted that the silver dissolves tosome extent in solution over time.14,24 All stability studiespresented below are based on filtered sample dispersions.3.2. Ag NP Stability with Time in Water Solutions of
pH 5.6 and pH 10. To assess the surface charge andagglomeration capability of Ag NPs in solution, changes in ζ-potential and particle size as a function of time and solutionwere monitored in a laundry-relevant aqueous solution withoutsurfactants (pH 10) and in deionized water (pH 5.6), Figure 2.
The Ag NPs showed negative surface potentials in bothsolutions independent of pH and exposure period. Measured ζ-potentials changed from initial values of −33 (pH 5.6) and −47mV (pH 10) directly after preparation of the Ag NPdispersions, to relatively stable values of −25 and −40 mV,respectively, after 24 h. The major change (increase) in ζ-potential occurred in both solutions during the first 24 h andmost drastically within the first 5 h followed by a nonsignificantchange during subsequent time periods up to 1 week. An
almost identical ζ-potential time dependence has been reportedin the literature for chemically synthesized Ag NPs in water forwhich the ζ-potential increased from −45 to −39 mV duringthe first 4 h. This was attributed to surface adsorption of Ag+
ions.14 The observed surface charge was less negative in thesolution of lowest pH (pH 5.6), findings in agreement with theliterature for the same and other commercial and synthesizedAg NPs.7,25,26 This is explained by the fact that more protonscan coordinate with the particle surface in less alkalinesolutions. Previous findings by the authors reveal negativesurface potentials of the same Ag NPs at pH values higher than3 (the isoelectric point) in pH-adjusted water solutions.7
Transitions from negative to positive values of other Ag NPs inacidic water solutions of pH 2.726 and pH 1.525 have beenreported. Colloidal metal particles in contact with watersolutions develop a charge due to the adsorption of ionsand/or by ionization of surface functional groups.27 The reasonfor the observed negative charge of Ag NPs in solutionsexceeding pH 3 may possibly be a result of a strongcoordination of reversibly adsorbed oxygen7 or of a strongcoordination of nucleophilic molecules (water and OH− ions)that donates electrons to the Ag NP surface.15
It is often stated for NPs in general that a particle suspensionwith a ζ-potential less than ±20 mV (in the absence of otherstabilizing factors) is considered unstable and may result inparticle sedimentation.15 Findings of this study, Figure 2, showthat the Ag NPs are sufficiently charged (>|20| mV) to avoidagglomeration and sedimentation and are stable also after 1week in both solutions at given conditions.
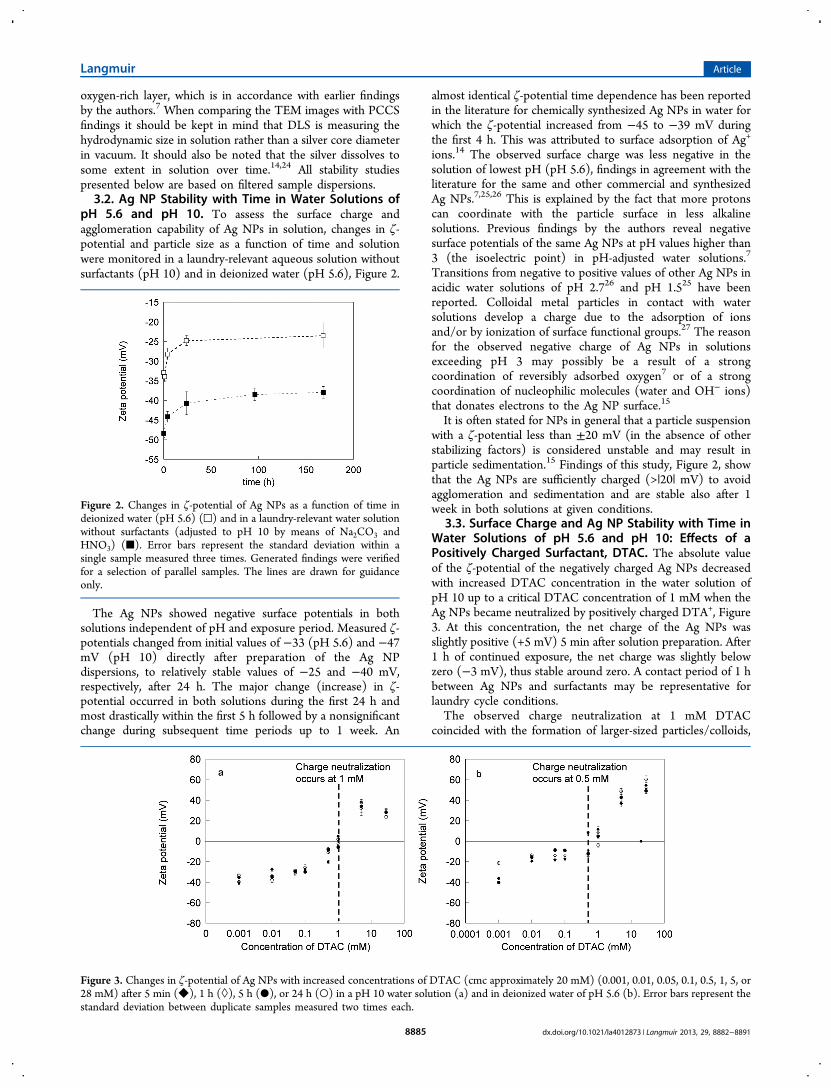
3.3. Surface Charge and Ag NP Stability with Time inWater Solutions of pH 5.6 and pH 10: Effects of aPositively Charged Surfactant, DTAC. The absolute valueof the ζ-potential of the negatively charged Ag NPs decreasedwith increased DTAC concentration in the water solution ofpH 10 up to a critical DTAC concentration of 1 mM when theAg NPs became neutralized by positively charged DTA+, Figure3. At this concentration, the net charge of the Ag NPs wasslightly positive (+5 mV) 5 min after solution preparation. After1 h of continued exposure, the net charge was slightly belowzero (−3 mV), thus stable around zero. A contact period of 1 hbetween Ag NPs and surfactants may be representative forlaundry cycle conditions.The observed charge neutralization at 1 mM DTAC
coincided with the formation of larger-sized particles/colloids,
Figure 2. Changes in ζ-potential of Ag NPs as a function of time indeionized water (pH 5.6) (□) and in a laundry-relevant water solutionwithout surfactants (adjusted to pH 10 by means of Na2CO3 andHNO3) (■). Error bars represent the standard deviation within asingle sample measured three times. Generated findings were verifiedfor a selection of parallel samples. The lines are drawn for guidanceonly.
Figure 3. Changes in ζ-potential of Ag NPs with increased concentrations of DTAC (cmc approximately 20 mM) (0.001, 0.01, 0.05, 0.1, 0.5, 1, 5, or28 mM) after 5 min (◆), 1 h (◊), 5 h (●), or 24 h (○) in a pH 10 water solution (a) and in deionized water of pH 5.6 (b). Error bars represent thestandard deviation between duplicate samples measured two times each.
Langmuir Article
dx.doi.org/10.1021/la4012873 | Langmuir 2013, 29, 8882−88918885
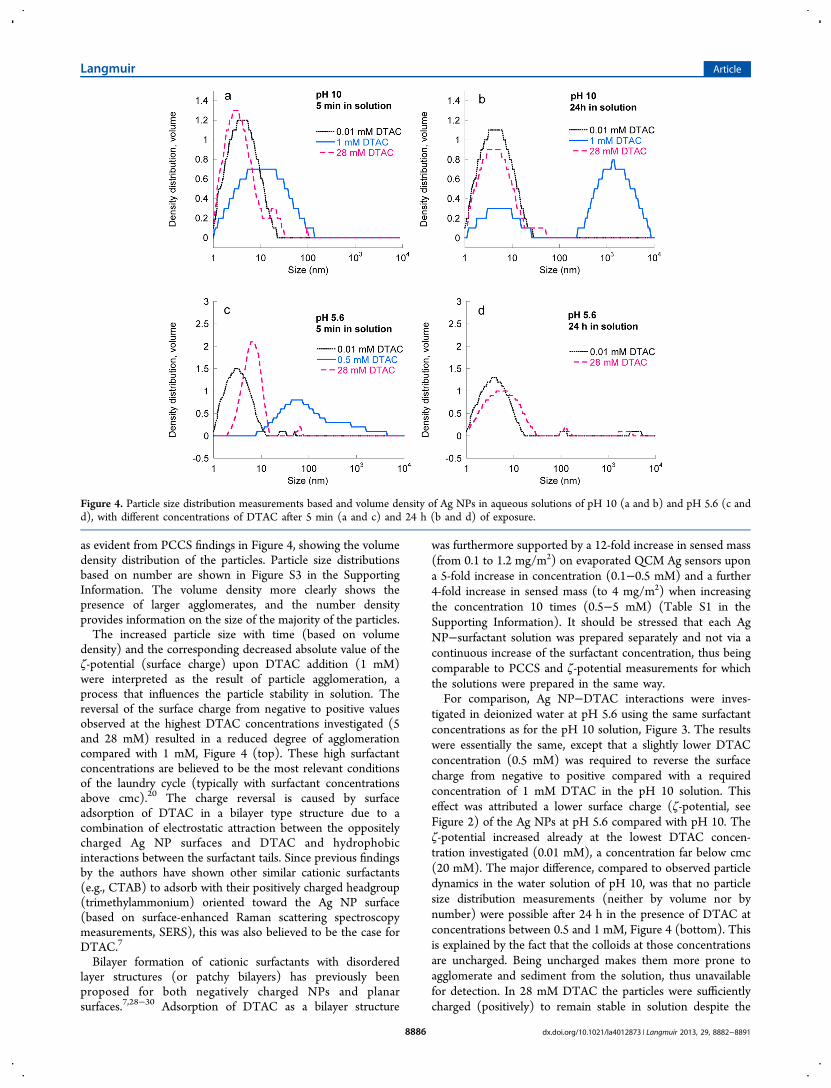
as evident from PCCS findings in Figure 4, showing the volumedensity distribution of the particles. Particle size distributionsbased on number are shown in Figure S3 in the SupportingInformation. The volume density more clearly shows thepresence of larger agglomerates, and the number densityprovides information on the size of the majority of the particles.The increased particle size with time (based on volume
density) and the corresponding decreased absolute value of theζ-potential (surface charge) upon DTAC addition (1 mM)were interpreted as the result of particle agglomeration, aprocess that influences the particle stability in solution. Thereversal of the surface charge from negative to positive valuesobserved at the highest DTAC concentrations investigated (5and 28 mM) resulted in a reduced degree of agglomerationcompared with 1 mM, Figure 4 (top). These high surfactantconcentrations are believed to be the most relevant conditionsof the laundry cycle (typically with surfactant concentrationsabove cmc).20 The charge reversal is caused by surfaceadsorption of DTAC in a bilayer type structure due to acombination of electrostatic attraction between the oppositelycharged Ag NP surfaces and DTAC and hydrophobicinteractions between the surfactant tails. Since previous findingsby the authors have shown other similar cationic surfactants(e.g., CTAB) to adsorb with their positively charged headgroup(trimethylammonium) oriented toward the Ag NP surface(based on surface-enhanced Raman scattering spectroscopymeasurements, SERS), this was also believed to be the case forDTAC.7
Bilayer formation of cationic surfactants with disorderedlayer structures (or patchy bilayers) has previously beenproposed for both negatively charged NPs and planarsurfaces.7,28−30 Adsorption of DTAC as a bilayer structure
was furthermore supported by a 12-fold increase in sensed mass(from 0.1 to 1.2 mg/m2) on evaporated QCM Ag sensors upona 5-fold increase in concentration (0.1−0.5 mM) and a further4-fold increase in sensed mass (to 4 mg/m2) when increasingthe concentration 10 times (0.5−5 mM) (Table S1 in theSupporting Information). It should be stressed that each AgNP−surfactant solution was prepared separately and not via acontinuous increase of the surfactant concentration, thus beingcomparable to PCCS and ζ-potential measurements for whichthe solutions were prepared in the same way.For comparison, Ag NP−DTAC interactions were inves-
tigated in deionized water at pH 5.6 using the same surfactantconcentrations as for the pH 10 solution, Figure 3. The resultswere essentially the same, except that a slightly lower DTACconcentration (0.5 mM) was required to reverse the surfacecharge from negative to positive compared with a requiredconcentration of 1 mM DTAC in the pH 10 solution. Thiseffect was attributed a lower surface charge (ζ-potential, seeFigure 2) of the Ag NPs at pH 5.6 compared with pH 10. Theζ-potential increased already at the lowest DTAC concen-tration investigated (0.01 mM), a concentration far below cmc(20 mM). The major difference, compared to observed particledynamics in the water solution of pH 10, was that no particlesize distribution measurements (neither by volume nor bynumber) were possible after 24 h in the presence of DTAC atconcentrations between 0.5 and 1 mM, Figure 4 (bottom). Thisis explained by the fact that the colloids at those concentrationsare uncharged. Being uncharged makes them more prone toagglomerate and sediment from the solution, thus unavailablefor detection. In 28 mM DTAC the particles were sufficientlycharged (positively) to remain stable in solution despite the
Figure 4. Particle size distribution measurements based and volume density of Ag NPs in aqueous solutions of pH 10 (a and b) and pH 5.6 (c andd), with different concentrations of DTAC after 5 min (a and c) and 24 h (b and d) of exposure.
Langmuir Article
dx.doi.org/10.1021/la4012873 | Langmuir 2013, 29, 8882−88918886
higher ionic strength from the counterions in the solution,known to decrease particle stability.31
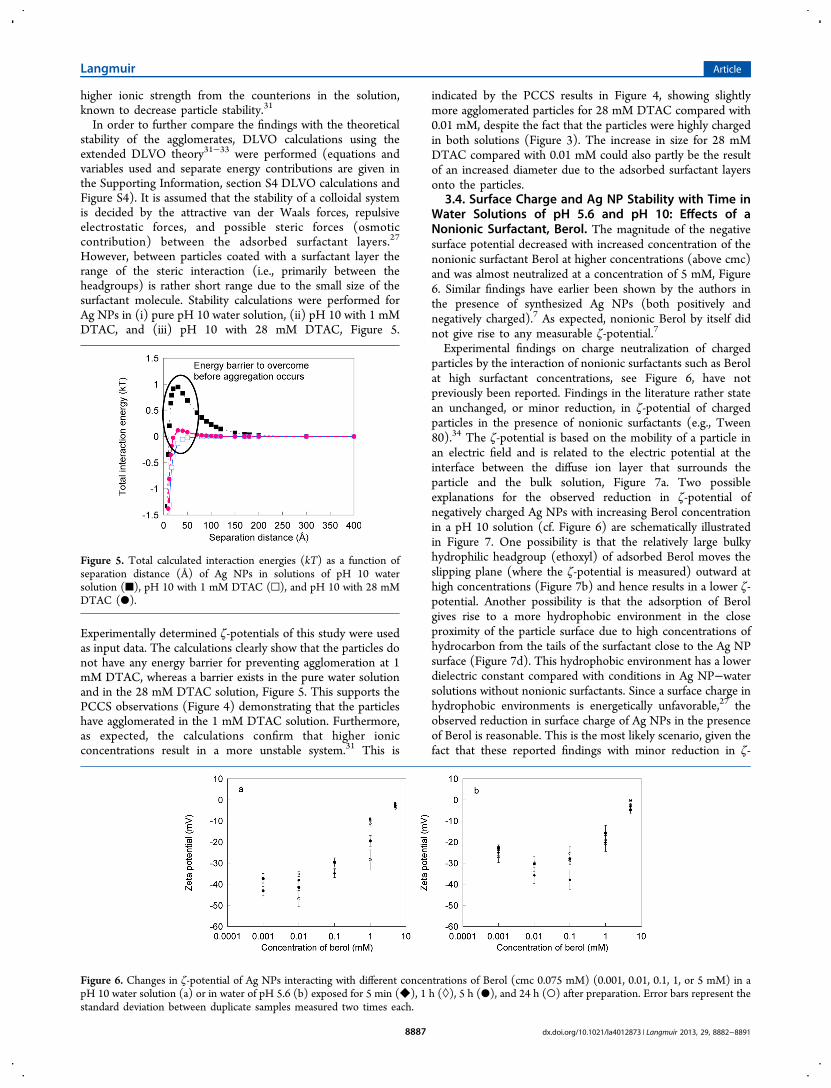
In order to further compare the findings with the theoreticalstability of the agglomerates, DLVO calculations using theextended DLVO theory31−33 were performed (equations andvariables used and separate energy contributions are given inthe Supporting Information, section S4 DLVO calculations andFigure S4). It is assumed that the stability of a colloidal systemis decided by the attractive van der Waals forces, repulsiveelectrostatic forces, and possible steric forces (osmoticcontribution) between the adsorbed surfactant layers.27
However, between particles coated with a surfactant layer therange of the steric interaction (i.e., primarily between theheadgroups) is rather short range due to the small size of thesurfactant molecule. Stability calculations were performed forAg NPs in (i) pure pH 10 water solution, (ii) pH 10 with 1 mMDTAC, and (iii) pH 10 with 28 mM DTAC, Figure 5.
Experimentally determined ζ-potentials of this study were usedas input data. The calculations clearly show that the particles donot have any energy barrier for preventing agglomeration at 1mM DTAC, whereas a barrier exists in the pure water solutionand in the 28 mM DTAC solution, Figure 5. This supports thePCCS observations (Figure 4) demonstrating that the particleshave agglomerated in the 1 mM DTAC solution. Furthermore,as expected, the calculations confirm that higher ionicconcentrations result in a more unstable system.31 This is
indicated by the PCCS results in Figure 4, showing slightlymore agglomerated particles for 28 mM DTAC compared with0.01 mM, despite the fact that the particles were highly chargedin both solutions (Figure 3). The increase in size for 28 mMDTAC compared with 0.01 mM could also partly be the resultof an increased diameter due to the adsorbed surfactant layersonto the particles.
3.4. Surface Charge and Ag NP Stability with Time inWater Solutions of pH 5.6 and pH 10: Effects of aNonionic Surfactant, Berol. The magnitude of the negativesurface potential decreased with increased concentration of thenonionic surfactant Berol at higher concentrations (above cmc)and was almost neutralized at a concentration of 5 mM, Figure6. Similar findings have earlier been shown by the authors inthe presence of synthesized Ag NPs (both positively andnegatively charged).7 As expected, nonionic Berol by itself didnot give rise to any measurable ζ-potential.7
Experimental findings on charge neutralization of chargedparticles by the interaction of nonionic surfactants such as Berolat high surfactant concentrations, see Figure 6, have notpreviously been reported. Findings in the literature rather statean unchanged, or minor reduction, in ζ-potential of chargedparticles in the presence of nonionic surfactants (e.g., Tween80).34 The ζ-potential is based on the mobility of a particle inan electric field and is related to the electric potential at theinterface between the diffuse ion layer that surrounds theparticle and the bulk solution, Figure 7a. Two possibleexplanations for the observed reduction in ζ-potential ofnegatively charged Ag NPs with increasing Berol concentrationin a pH 10 solution (cf. Figure 6) are schematically illustratedin Figure 7. One possibility is that the relatively large bulkyhydrophilic headgroup (ethoxyl) of adsorbed Berol moves theslipping plane (where the ζ-potential is measured) outward athigh concentrations (Figure 7b) and hence results in a lower ζ-potential. Another possibility is that the adsorption of Berolgives rise to a more hydrophobic environment in the closeproximity of the particle surface due to high concentrations ofhydrocarbon from the tails of the surfactant close to the Ag NPsurface (Figure 7d). This hydrophobic environment has a lowerdielectric constant compared with conditions in Ag NP−watersolutions without nonionic surfactants. Since a surface charge inhydrophobic environments is energetically unfavorable,27 theobserved reduction in surface charge of Ag NPs in the presenceof Berol is reasonable. This is the most likely scenario, given thefact that these reported findings with minor reduction in ζ-
Figure 5. Total calculated interaction energies (kT) as a function ofseparation distance (Å) of Ag NPs in solutions of pH 10 watersolution (■), pH 10 with 1 mM DTAC (□), and pH 10 with 28 mMDTAC (●).
Figure 6. Changes in ζ-potential of Ag NPs interacting with different concentrations of Berol (cmc 0.075 mM) (0.001, 0.01, 0.1, 1, or 5 mM) in apH 10 water solution (a) or in water of pH 5.6 (b) exposed for 5 min (◆), 1 h (◊), 5 h (●), and 24 h (○) after preparation. Error bars represent thestandard deviation between duplicate samples measured two times each.
Langmuir Article
dx.doi.org/10.1021/la4012873 | Langmuir 2013, 29, 8882−88918887
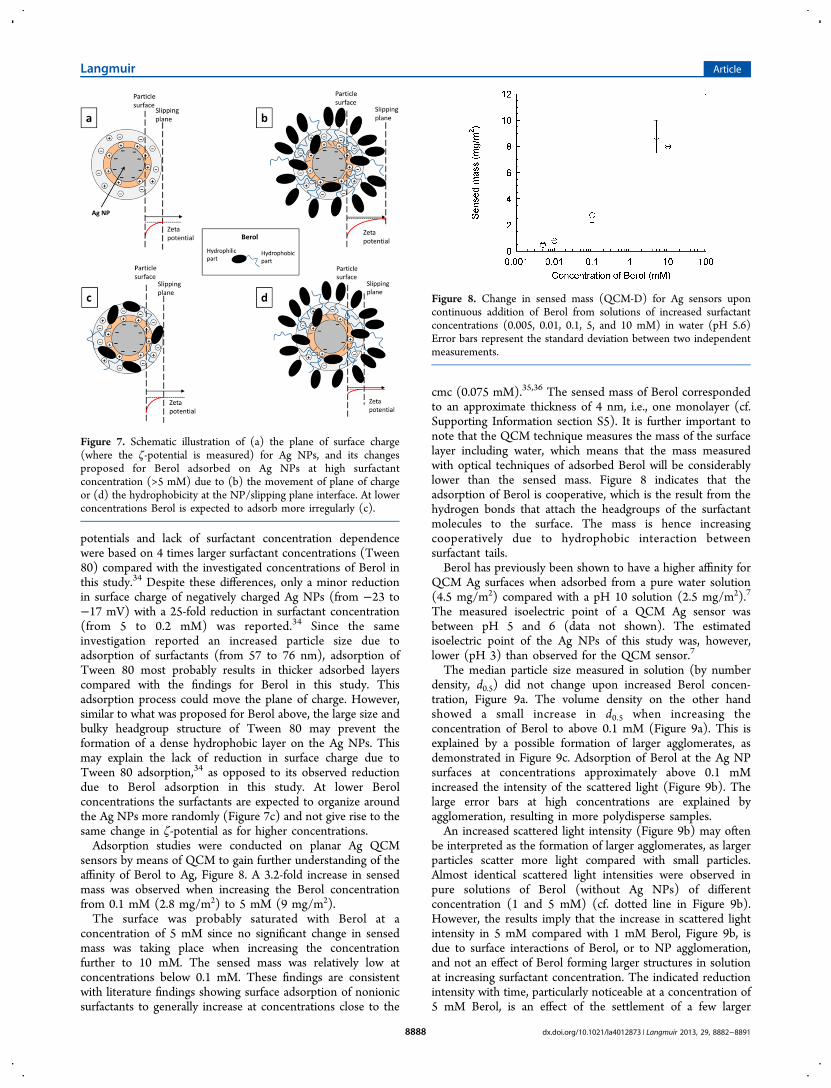
potentials and lack of surfactant concentration dependencewere based on 4 times larger surfactant concentrations (Tween80) compared with the investigated concentrations of Berol inthis study.34 Despite these differences, only a minor reductionin surface charge of negatively charged Ag NPs (from −23 to−17 mV) with a 25-fold reduction in surfactant concentration(from 5 to 0.2 mM) was reported.34 Since the sameinvestigation reported an increased particle size due toadsorption of surfactants (from 57 to 76 nm), adsorption ofTween 80 most probably results in thicker adsorbed layerscompared with the findings for Berol in this study. Thisadsorption process could move the plane of charge. However,similar to what was proposed for Berol above, the large size andbulky headgroup structure of Tween 80 may prevent theformation of a dense hydrophobic layer on the Ag NPs. Thismay explain the lack of reduction in surface charge due toTween 80 adsorption,34 as opposed to its observed reductiondue to Berol adsorption in this study. At lower Berolconcentrations the surfactants are expected to organize aroundthe Ag NPs more randomly (Figure 7c) and not give rise to thesame change in ζ-potential as for higher concentrations.Adsorption studies were conducted on planar Ag QCM
sensors by means of QCM to gain further understanding of theaffinity of Berol to Ag, Figure 8. A 3.2-fold increase in sensedmass was observed when increasing the Berol concentrationfrom 0.1 mM (2.8 mg/m2) to 5 mM (9 mg/m2).The surface was probably saturated with Berol at a
concentration of 5 mM since no significant change in sensedmass was taking place when increasing the concentrationfurther to 10 mM. The sensed mass was relatively low atconcentrations below 0.1 mM. These findings are consistentwith literature findings showing surface adsorption of nonionicsurfactants to generally increase at concentrations close to the
cmc (0.075 mM).35,36 The sensed mass of Berol correspondedto an approximate thickness of 4 nm, i.e., one monolayer (cf.Supporting Information section S5). It is further important tonote that the QCM technique measures the mass of the surfacelayer including water, which means that the mass measuredwith optical techniques of adsorbed Berol will be considerablylower than the sensed mass. Figure 8 indicates that theadsorption of Berol is cooperative, which is the result from thehydrogen bonds that attach the headgroups of the surfactantmolecules to the surface. The mass is hence increasingcooperatively due to hydrophobic interaction betweensurfactant tails.Berol has previously been shown to have a higher affinity for
QCM Ag surfaces when adsorbed from a pure water solution(4.5 mg/m2) compared with a pH 10 solution (2.5 mg/m2).7
The measured isoelectric point of a QCM Ag sensor wasbetween pH 5 and 6 (data not shown). The estimatedisoelectric point of the Ag NPs of this study was, however,lower (pH 3) than observed for the QCM sensor.7
The median particle size measured in solution (by numberdensity, d0.5) did not change upon increased Berol concen-tration, Figure 9a. The volume density on the other handshowed a small increase in d0.5 when increasing theconcentration of Berol to above 0.1 mM (Figure 9a). This isexplained by a possible formation of larger agglomerates, asdemonstrated in Figure 9c. Adsorption of Berol at the Ag NPsurfaces at concentrations approximately above 0.1 mMincreased the intensity of the scattered light (Figure 9b). Thelarge error bars at high concentrations are explained byagglomeration, resulting in more polydisperse samples.An increased scattered light intensity (Figure 9b) may often
be interpreted as the formation of larger agglomerates, as largerparticles scatter more light compared with small particles.Almost identical scattered light intensities were observed inpure solutions of Berol (without Ag NPs) of differentconcentration (1 and 5 mM) (cf. dotted line in Figure 9b).However, the results imply that the increase in scattered lightintensity in 5 mM compared with 1 mM Berol, Figure 9b, isdue to surface interactions of Berol, or to NP agglomeration,and not an effect of Berol forming larger structures in solutionat increasing surfactant concentration. The indicated reductionintensity with time, particularly noticeable at a concentration of5 mM Berol, is an effect of the settlement of a few larger
Figure 7. Schematic illustration of (a) the plane of surface charge(where the ζ-potential is measured) for Ag NPs, and its changesproposed for Berol adsorbed on Ag NPs at high surfactantconcentration (>5 mM) due to (b) the movement of plane of chargeor (d) the hydrophobicity at the NP/slipping plane interface. At lowerconcentrations Berol is expected to adsorb more irregularly (c).
Figure 8. Change in sensed mass (QCM-D) for Ag sensors uponcontinuous addition of Berol from solutions of increased surfactantconcentrations (0.005, 0.01, 0.1, 5, and 10 mM) in water (pH 5.6)Error bars represent the standard deviation between two independentmeasurements.
Langmuir Article
dx.doi.org/10.1021/la4012873 | Langmuir 2013, 29, 8882−88918888
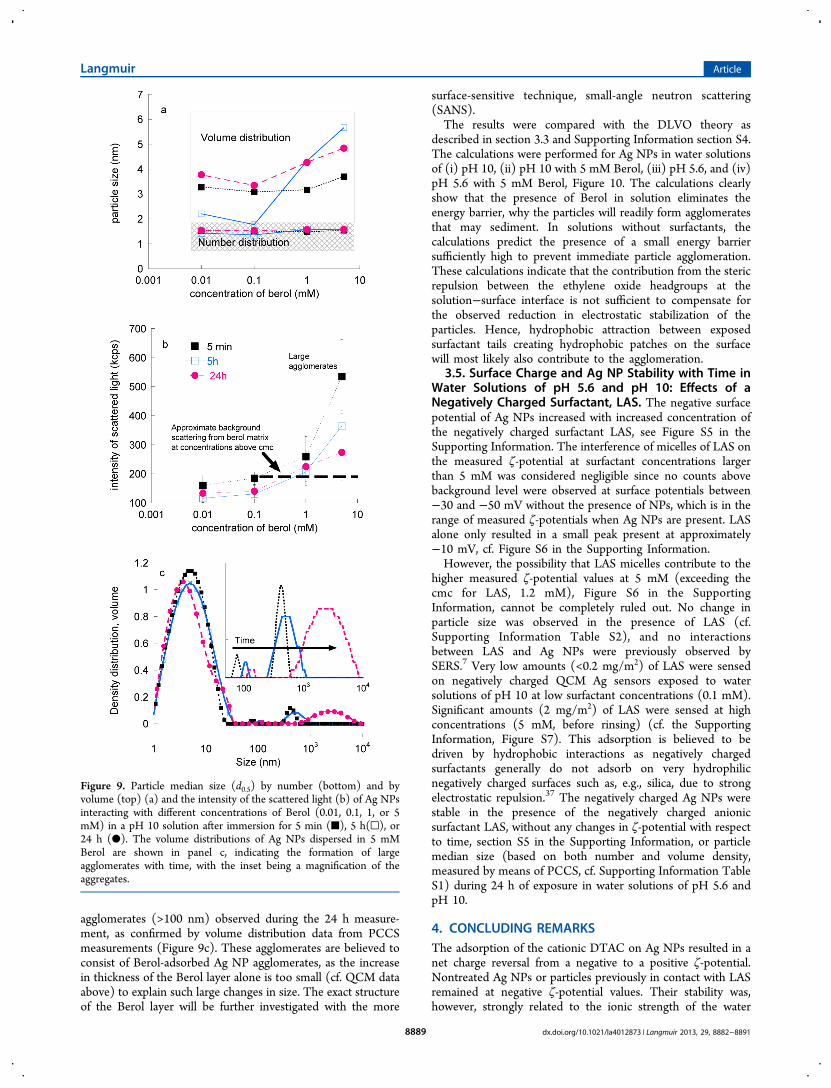
agglomerates (>100 nm) observed during the 24 h measure-ment, as confirmed by volume distribution data from PCCSmeasurements (Figure 9c). These agglomerates are believed toconsist of Berol-adsorbed Ag NP agglomerates, as the increasein thickness of the Berol layer alone is too small (cf. QCM dataabove) to explain such large changes in size. The exact structureof the Berol layer will be further investigated with the more
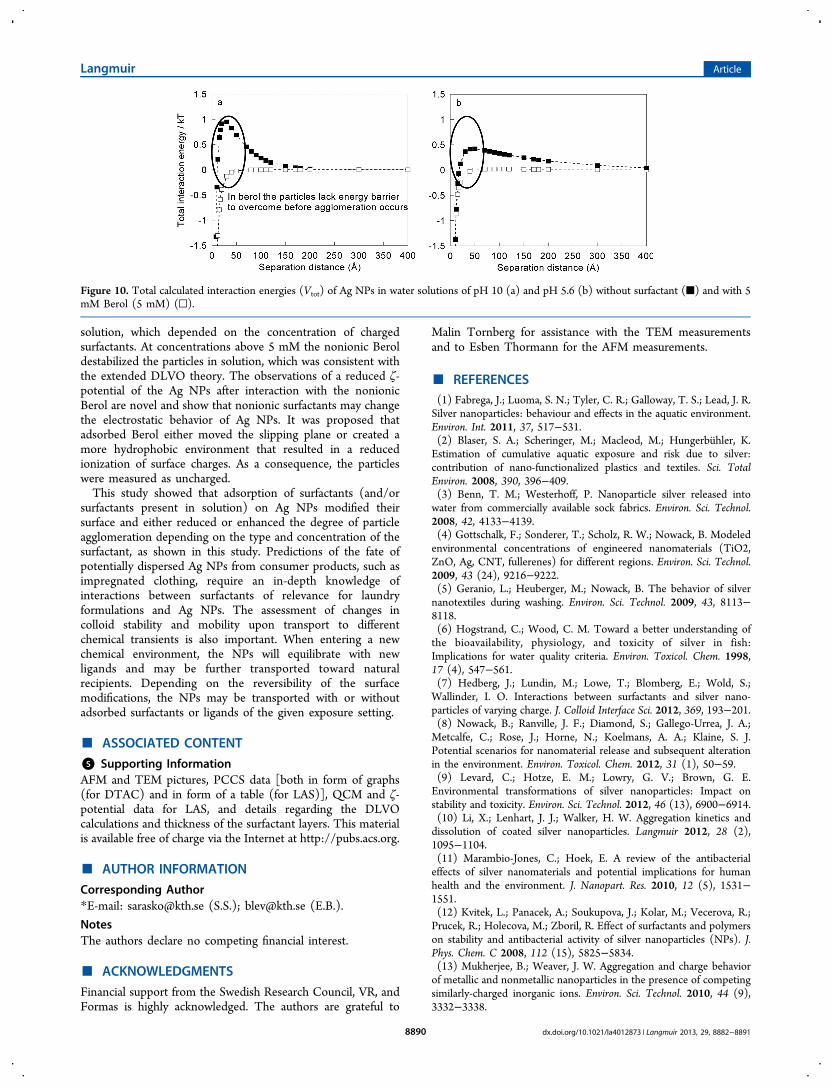
surface-sensitive technique, small-angle neutron scattering(SANS).The results were compared with the DLVO theory as
described in section 3.3 and Supporting Information section S4.The calculations were performed for Ag NPs in water solutionsof (i) pH 10, (ii) pH 10 with 5 mM Berol, (iii) pH 5.6, and (iv)pH 5.6 with 5 mM Berol, Figure 10. The calculations clearlyshow that the presence of Berol in solution eliminates theenergy barrier, why the particles will readily form agglomeratesthat may sediment. In solutions without surfactants, thecalculations predict the presence of a small energy barriersufficiently high to prevent immediate particle agglomeration.These calculations indicate that the contribution from the stericrepulsion between the ethylene oxide headgroups at thesolution−surface interface is not sufficient to compensate forthe observed reduction in electrostatic stabilization of theparticles. Hence, hydrophobic attraction between exposedsurfactant tails creating hydrophobic patches on the surfacewill most likely also contribute to the agglomeration.
3.5. Surface Charge and Ag NP Stability with Time inWater Solutions of pH 5.6 and pH 10: Effects of aNegatively Charged Surfactant, LAS. The negative surfacepotential of Ag NPs increased with increased concentration ofthe negatively charged surfactant LAS, see Figure S5 in theSupporting Information. The interference of micelles of LAS onthe measured ζ-potential at surfactant concentrations largerthan 5 mM was considered negligible since no counts abovebackground level were observed at surface potentials between−30 and −50 mV without the presence of NPs, which is in therange of measured ζ-potentials when Ag NPs are present. LASalone only resulted in a small peak present at approximately−10 mV, cf. Figure S6 in the Supporting Information.However, the possibility that LAS micelles contribute to the
higher measured ζ-potential values at 5 mM (exceeding thecmc for LAS, 1.2 mM), Figure S6 in the SupportingInformation, cannot be completely ruled out. No change inparticle size was observed in the presence of LAS (cf.Supporting Information Table S2), and no interactionsbetween LAS and Ag NPs were previously observed bySERS.7 Very low amounts (<0.2 mg/m2) of LAS were sensedon negatively charged QCM Ag sensors exposed to watersolutions of pH 10 at low surfactant concentrations (0.1 mM).Significant amounts (2 mg/m2) of LAS were sensed at highconcentrations (5 mM, before rinsing) (cf. the SupportingInformation, Figure S7). This adsorption is believed to bedriven by hydrophobic interactions as negatively chargedsurfactants generally do not adsorb on very hydrophilicnegatively charged surfaces such as, e.g., silica, due to strongelectrostatic repulsion.37 The negatively charged Ag NPs werestable in the presence of the negatively charged anionicsurfactant LAS, without any changes in ζ-potential with respectto time, section S5 in the Supporting Information, or particlemedian size (based on both number and volume density,measured by means of PCCS, cf. Supporting Information TableS1) during 24 h of exposure in water solutions of pH 5.6 andpH 10.
4. CONCLUDING REMARKSThe adsorption of the cationic DTAC on Ag NPs resulted in anet charge reversal from a negative to a positive ζ-potential.Nontreated Ag NPs or particles previously in contact with LASremained at negative ζ-potential values. Their stability was,however, strongly related to the ionic strength of the water
Figure 9. Particle median size (d0.5) by number (bottom) and byvolume (top) (a) and the intensity of the scattered light (b) of Ag NPsinteracting with different concentrations of Berol (0.01, 0.1, 1, or 5mM) in a pH 10 solution after immersion for 5 min (■), 5 h(□), or24 h (●). The volume distributions of Ag NPs dispersed in 5 mMBerol are shown in panel c, indicating the formation of largeagglomerates with time, with the inset being a magnification of theaggregates.
Langmuir Article
dx.doi.org/10.1021/la4012873 | Langmuir 2013, 29, 8882−88918889
solution, which depended on the concentration of chargedsurfactants. At concentrations above 5 mM the nonionic Beroldestabilized the particles in solution, which was consistent withthe extended DLVO theory. The observations of a reduced ζ-potential of the Ag NPs after interaction with the nonionicBerol are novel and show that nonionic surfactants may changethe electrostatic behavior of Ag NPs. It was proposed thatadsorbed Berol either moved the slipping plane or created amore hydrophobic environment that resulted in a reducedionization of surface charges. As a consequence, the particleswere measured as uncharged.This study showed that adsorption of surfactants (and/or
surfactants present in solution) on Ag NPs modified theirsurface and either reduced or enhanced the degree of particleagglomeration depending on the type and concentration of thesurfactant, as shown in this study. Predictions of the fate ofpotentially dispersed Ag NPs from consumer products, such asimpregnated clothing, require an in-depth knowledge ofinteractions between surfactants of relevance for laundryformulations and Ag NPs. The assessment of changes incolloid stability and mobility upon transport to differentchemical transients is also important. When entering a newchemical environment, the NPs will equilibrate with newligands and may be further transported toward naturalrecipients. Depending on the reversibility of the surfacemodifications, the NPs may be transported with or withoutadsorbed surfactants or ligands of the given exposure setting.
■ ASSOCIATED CONTENT
*S Supporting InformationAFM and TEM pictures, PCCS data [both in form of graphs(for DTAC) and in form of a table (for LAS)], QCM and ζ-potential data for LAS, and details regarding the DLVOcalculations and thickness of the surfactant layers. This materialis available free of charge via the Internet at http://pubs.acs.org.
■ AUTHOR INFORMATION
Corresponding Author*E-mail: [email protected] (S.S.); [email protected] (E.B.).
NotesThe authors declare no competing financial interest.
■ ACKNOWLEDGMENTS
Financial support from the Swedish Research Council, VR, andFormas is highly acknowledged. The authors are grateful to
Malin Tornberg for assistance with the TEM measurementsand to Esben Thormann for the AFM measurements.
■ REFERENCES(1) Fabrega, J.; Luoma, S. N.; Tyler, C. R.; Galloway, T. S.; Lead, J. R.Silver nanoparticles: behaviour and effects in the aquatic environment.Environ. Int. 2011, 37, 517−531.(2) Blaser, S. A.; Scheringer, M.; Macleod, M.; Hungerbuhler, K.Estimation of cumulative aquatic exposure and risk due to silver:contribution of nano-functionalized plastics and textiles. Sci. TotalEnviron. 2008, 390, 396−409.(3) Benn, T. M.; Westerhoff, P. Nanoparticle silver released intowater from commercially available sock fabrics. Environ. Sci. Technol.2008, 42, 4133−4139.(4) Gottschalk, F.; Sonderer, T.; Scholz, R. W.; Nowack, B. Modeledenvironmental concentrations of engineered nanomaterials (TiO2,ZnO, Ag, CNT, fullerenes) for different regions. Environ. Sci. Technol.2009, 43 (24), 9216−9222.(5) Geranio, L.; Heuberger, M.; Nowack, B. The behavior of silvernanotextiles during washing. Environ. Sci. Technol. 2009, 43, 8113−8118.(6) Hogstrand, C.; Wood, C. M. Toward a better understanding ofthe bioavailability, physiology, and toxicity of silver in fish:Implications for water quality criteria. Environ. Toxicol. Chem. 1998,17 (4), 547−561.(7) Hedberg, J.; Lundin, M.; Lowe, T.; Blomberg, E.; Wold, S.;Wallinder, I. O. Interactions between surfactants and silver nano-particles of varying charge. J. Colloid Interface Sci. 2012, 369, 193−201.(8) Nowack, B.; Ranville, J. F.; Diamond, S.; Gallego-Urrea, J. A.;Metcalfe, C.; Rose, J.; Horne, N.; Koelmans, A. A.; Klaine, S. J.Potential scenarios for nanomaterial release and subsequent alterationin the environment. Environ. Toxicol. Chem. 2012, 31 (1), 50−59.(9) Levard, C.; Hotze, E. M.; Lowry, G. V.; Brown, G. E.Environmental transformations of silver nanoparticles: Impact onstability and toxicity. Environ. Sci. Technol. 2012, 46 (13), 6900−6914.(10) Li, X.; Lenhart, J. J.; Walker, H. W. Aggregation kinetics anddissolution of coated silver nanoparticles. Langmuir 2012, 28 (2),1095−1104.(11) Marambio-Jones, C.; Hoek, E. A review of the antibacterialeffects of silver nanomaterials and potential implications for humanhealth and the environment. J. Nanopart. Res. 2010, 12 (5), 1531−1551.(12) Kvitek, L.; Panacek, A.; Soukupova, J.; Kolar, M.; Vecerova, R.;Prucek, R.; Holecova, M.; Zboril, R. Effect of surfactants and polymerson stability and antibacterial activity of silver nanoparticles (NPs). J.Phys. Chem. C 2008, 112 (15), 5825−5834.(13) Mukherjee, B.; Weaver, J. W. Aggregation and charge behaviorof metallic and nonmetallic nanoparticles in the presence of competingsimilarly-charged inorganic ions. Environ. Sci. Technol. 2010, 44 (9),3332−3338.
Figure 10. Total calculated interaction energies (Vtot) of Ag NPs in water solutions of pH 10 (a) and pH 5.6 (b) without surfactant (■) and with 5mM Berol (5 mM) (□).
Langmuir Article
dx.doi.org/10.1021/la4012873 | Langmuir 2013, 29, 8882−88918890
(14) Liu, J.; Hurt, R. H. Ion release kinetics and particle persistencein aqueous nano-silver colloids. Environ. Sci. Technol. 2010, 44, 2169−2175.(15) El Badawy, A. M.; Luxton, T. P.; Silva, R. G.; Scheckel, K. G.;Suidan, M. T.; Tolaymat, T. M. Impact of environmental conditions(pH, ionic strength, and electrolyte type) on the surface charge andaggregation of silver nanoparticles suspensions. Environ. Sci. Technol.2010, 44 (4), 1260−1266.(16) Pungor, E.; Toth, K.; Hrabeczypall, A. Selectivity coefficients ofion-selective electrodes. Pure Appl. Chem. 1979, 51, 1915−1980.(17) Whitlow, S. I.; Rice, D. L. Silver complexation in river waters ofcentral New York. Water Res. 1985, 19 (5), 619−626.(18) Rogers, K. R.; Bradham, K.; Tolaymat, T.; Thomas, D. J.;Hartmann, T.; Ma, L.; Williams, A. Alterations in physical state ofsilver nanoparticles exposed to synthetic human stomach fluid. Sci.Total Environ. 2012, 420 (0), 334−339.(19) MacCuspie, R. I.; Allen, A. J.; Hackley, V. A. Dispersionstabilization of silver nanoparticles in synthetic lung fluid studiedunder in situ conditions. Nanotoxicology 2011, 5 (2), 140−156.(20) Smulders, E.; Rybinski, W.; Sung, E.; Rahse, W.; Steber, J.;Nordskog, A. Laundry Detergents. Ullmann’s Encyclopedia of IndustrialChemistry [CD-ROM]; Wiley-VCH: Weinheim, Germany, 2007.(21) Kaegi, R.; Voegelin, A.; Sinnet, B.; Zuleeg, S.; Hagendorfer, H.;Burkhardt, M.; Siegrist, H. Behavior of metallic silver nanoparticles in apilot wastewater treatment plant. Environ. Sci. Technol. 2011, 45 (9),3902−3908.(22) Sauerbrey, G. Verwendung von schwingquarzen zur wagungdunner schichten und zur mikrowagung. Z. Phys. A: Hadrons Nucl.1959, 155 (2), 206−222.(23) Taurozzi, J. S.; Hackley, V. A.; Wiesner, M. R. A standardisedapproach for the dispersion of titanium dioxide nanoparticles inbiological media. Nanotoxicology 2013, 7 (4), 389−401.(24) Liu, J.; Sonshine, D. A.; Shervani, S.; Hurt, R. H. Controlledrelease of biologically active silver from nanosilver surfaces. ACS Nano2010, 4, 6903−6913.(25) Elzey, S.; Grassian, V. H. Agglomeration, isolation anddissolution of commercially manufactured silver nanoparticles inaqueous environments. J. Nanopart. Res. 2010, 12 (5), 1945−1958.(26) Alvarez-Puebla, R. A.; Arceo, E.; Goulet, P. J. G.; Garrido, J. J.;Aroca, R. F. Role of nanoparticle surface charge in surface-enhancedRaman scattering. J. Phys. Chem. B 2005, 109 (9), 3787−3792.(27) Evans, D. F.; Wennerstrom, H. The Colloidal Domain: WherePhysics, Chemistry, Biology and Technology Meet, 2nd ed.; John Wiley &Sons: New York, 1999.(28) Sui, Z.; Chen, X.; Wang, L.; Chai, Y.; Yang, C.; Zhao, J. Animproved approach for synthesis of positively charged silvernanoparticles. Chem. Lett. 2005, 34, 100−101.(29) Sui, Z.; Chen, X.; Wang, L.; Xu, L.; Zhuang, W.; Chai, Y.; Yang,C. Capping effect of CTAB on positively charged Ag nanoparticles.Phys. E (Amsterdam, Neth.) 2006, 33, 308−314.(30) Penfold, J.; Staples, E. J.; Tucker, I.; Thomas, R. K. Adsorptionof mixed cationic and nonionic surfactants at the hydrophilic siliconsurface from aqueous solution: The effect of solution composition andconcentration. Langmuir 2000, 16 (23), 8879−8883.(31) Stebounova, L. V.; Guio, E.; Grassian, V. H. Silver nanoparticlesin simulated biological media: A study of aggregation, sedimentation,and dissolution. J. Nanopart. Res. 2011, 13, 233−244.(32) Shah, P. S.; Holmes, J. D.; Johnston, K. P.; Korgel, B. A. Size-selective dispersion of dodecanethiol-coated nanocrystals in liquid andsupercritical ethane by density tuning. J. Phys. Chem. B 2002, 106 (10),2545−2551.(33) Vincent, B.; Edwards, J.; Emmett, S.; Jones, A. Depletionflocculation in dispersions of sterically-stabilized particles (softspheres). Colloids Surf. 1986, 18 (2−4), 261−281.(34) Soukupova, J.; Kvítek, L.; Panacek, A.; Nevecna, T.; Zboril, R.Comprehensive study on surfactant role on silver nanoparticles (NPs)prepared via modified Tollens process. Mater. Chem. Phys. 2008, 111(1), 77−81.
(35) Brinck, J.; Jonsson, B.; Tiberg, F. Kinetics of nonionic surfactantadsorption and desorption at the silica−water interface: Onecomponent. Langmuir 1998, 14 (5), 1058−1071.(36) Tiberg, F.; Brinck, J.; Grant, L. Adsorption and surface-inducedself-assembly of surfactants at the solid−aqueous interface. Curr. Opin.Colloid Interface Sci. 1999, 4 (6), 411−419.(37) Bastardo, L. A.; Iruthayaraj, J.; Lundin, M.; Dedinaite, A.;Vareikis, A.; Makuska, R.; van der Wal, A.; Furo, I.; Garamus, V. M.;Claesson, P. M. Soluble complexes in aqueous mixtures of low chargedensity comb polyelectrolyte and oppositely charged surfactant probedby scattering and NMR. J. Colloid Interface Sci. 2007, 312 (1), 21−33.
Langmuir Article
dx.doi.org/10.1021/la4012873 | Langmuir 2013, 29, 8882−88918891
Copyright © 2022 FDOKUMEN