
PVP-coated, negatively charged silver nanoparticles: A multi-center study of their physicochemical...
22
1944 PVP-coated, negatively charged silver nanoparticles: A multi-center study of their physicochemical characteristics, cell culture and in vivo experiments Sebastian Ahlberg, Alexandra Antonopulos, Jörg Diendorf, Ralf Dringen, Matthias Epple * , Rebekka Flöck, Wolfgang Goedecke, Christina Graf, Nadine Haberl, Jens Helmlinger, Fabian Herzog, Frederike Heuer, Stephanie Hirn, Christian Johannes, Stefanie Kittler, Manfred Köller, Katrin Korn, Wolfgang G. Kreyling, Fritz Krombach, Jürgen Lademann, Kateryna Loza, Eva M. Luther, Marcelina Malissek, Martina C. Meinke, Daniel Nordmeyer, Anne Pailliart, Jörg Raabe, Fiorenza Rancan, Barbara Rothen-Rutishauser, Eckart Rühl, Carsten Schleh, Andreas Seibel, Christina Sengstock, Lennart Treuel, Annika Vogt, Katrin Weber and Reinhard Zellner Review Open Access Address: See end of main text. Email: Matthias Epple * - [email protected] * Corresponding author Keywords: aerosols; biological properties; cell biology; nanoparticles; nanotoxicology; silver Beilstein J. Nanotechnol. 2014, 5, 1944–1965. doi:10.3762/bjnano.5.205 Received: 18 March 2014 Accepted: 07 October 2014 Published: 03 November 2014 This article is part of the Thematic Series "Biological responses to NPs". Guest Editor: R. Zellner © 2014 Ahlberg et al; licensee Beilstein-Institut. License and terms: see end of document. Abstract PVP-capped silver nanoparticles with a diameter of the metallic core of 70 nm, a hydrodynamic diameter of 120 nm and a zeta potential of −20 mV were prepared and investigated with regard to their biological activity. This review summarizes the physico- chemical properties (dissolution, protein adsorption, dispersability) of these nanoparticles and the cellular consequences of the exposure of a broad range of biological test systems to this defined type of silver nanoparticles. Silver nanoparticles dissolve in water in the presence of oxygen. In addition, in biological media (i.e., in the presence of proteins) the surface of silver nanoparti- cles is rapidly coated by a protein corona that influences their physicochemical and biological properties including cellular uptake. Silver nanoparticles are taken up by cell-type specific endocytosis pathways as demonstrated for hMSC, primary T-cells, primary monocytes, and astrocytes. A visualization of particles inside cells is possible by X-ray microscopy, fluorescence microscopy, and combined FIB/SEM analysis. By staining organelles, their localization inside the cell can be additionally determined. While prima- ry brain astrocytes are shown to be fairly tolerant toward silver nanoparticles, silver nanoparticles induce the formation of DNA
-
Upload
independent -
Category
Documents
-
view
0 -
download
0
Transcript of PVP-coated, negatively charged silver nanoparticles: A multi-center study of their physicochemical...

1944
PVP-coated, negatively charged silver nanoparticles:A multi-center study of their physicochemical characteristics,cell culture and in vivo experimentsSebastian Ahlberg, Alexandra Antonopulos, Jörg Diendorf, Ralf Dringen, Matthias Epple*,Rebekka Flöck, Wolfgang Goedecke, Christina Graf, Nadine Haberl, Jens Helmlinger,Fabian Herzog, Frederike Heuer, Stephanie Hirn, Christian Johannes, Stefanie Kittler,Manfred Köller, Katrin Korn, Wolfgang G. Kreyling, Fritz Krombach, Jürgen Lademann,Kateryna Loza, Eva M. Luther, Marcelina Malissek, Martina C. Meinke,Daniel Nordmeyer, Anne Pailliart, Jörg Raabe, Fiorenza Rancan,Barbara Rothen-Rutishauser, Eckart Rühl, Carsten Schleh, Andreas Seibel,Christina Sengstock, Lennart Treuel, Annika Vogt, Katrin Weber and Reinhard Zellner
Review Open Access
Address:See end of main text.
Email:Matthias Epple* - [email protected]
* Corresponding author
Keywords:aerosols; biological properties; cell biology; nanoparticles;nanotoxicology; silver
Beilstein J. Nanotechnol. 2014, 5, 1944–1965.doi:10.3762/bjnano.5.205
Received: 18 March 2014Accepted: 07 October 2014Published: 03 November 2014
This article is part of the Thematic Series "Biological responses to NPs".
Guest Editor: R. Zellner
© 2014 Ahlberg et al; licensee Beilstein-Institut.License and terms: see end of document.
AbstractPVP-capped silver nanoparticles with a diameter of the metallic core of 70 nm, a hydrodynamic diameter of 120 nm and a zeta
potential of −20 mV were prepared and investigated with regard to their biological activity. This review summarizes the physico-
chemical properties (dissolution, protein adsorption, dispersability) of these nanoparticles and the cellular consequences of the
exposure of a broad range of biological test systems to this defined type of silver nanoparticles. Silver nanoparticles dissolve in
water in the presence of oxygen. In addition, in biological media (i.e., in the presence of proteins) the surface of silver nanoparti-
cles is rapidly coated by a protein corona that influences their physicochemical and biological properties including cellular uptake.
Silver nanoparticles are taken up by cell-type specific endocytosis pathways as demonstrated for hMSC, primary T-cells, primary
monocytes, and astrocytes. A visualization of particles inside cells is possible by X-ray microscopy, fluorescence microscopy, and
combined FIB/SEM analysis. By staining organelles, their localization inside the cell can be additionally determined. While prima-
ry brain astrocytes are shown to be fairly tolerant toward silver nanoparticles, silver nanoparticles induce the formation of DNA
Beilstein J. Nanotechnol. 2014, 5, 1944–1965.
1945
double-strand-breaks (DSB) and lead to chromosomal aberrations and sister-chromatid exchanges in Chinese hamster fibroblast cell
lines (CHO9, K1, V79B). An exposure of rats to silver nanoparticles in vivo induced a moderate pulmonary toxicity, however, only
at rather high concentrations. The same was found in precision-cut lung slices of rats in which silver nanoparticles remained mainly
at the tissue surface. In a human 3D triple-cell culture model consisting of three cell types (alveolar epithelial cells, macrophages,
and dendritic cells), adverse effects were also only found at high silver concentrations. The silver ions that are released from silver
nanoparticles may be harmful to skin with disrupted barrier (e.g., wounds) and induce oxidative stress in skin cells (HaCaT). In
conclusion, the data obtained on the effects of this well-defined type of silver nanoparticles on various biological systems clearly
demonstrate that cell-type specific properties as well as experimental conditions determine the biocompatibility of and the cellular
responses to an exposure with silver nanoparticles.
Beilstein J. Nanotechnol. 2014, 5, 1944–1965.
1945
ReviewIntroductionSilver in the form of ions and nanoparticles is extensively used
in consumer products and medical devices [1-11]. This is due to
its well-known antibacterial action. However, there are
increasing concerns about potential risks to humans and to the
environment, especially in the case of silver nanoparticles [12-
19]. The assessment of the physicochemical and biological
properties of silver nanoparticles is complicated because these
properties depend on a number of parameters, such as size,
shape, charge, dispersion state, and surface functionality. There-
fore, the comparison of the results from different groups is typi-
cally difficult because either different particles were used or
different chemical or biological methods were applied (see
[1,20] for literature surveys). We have therefore performed a
multi-center study in which the same kind of silver nanoparti-
cles was applied by different groups. It is expected, therefore,
that the obtained results have a high degree of comparability.
The silver nanoparticles were chemically characterized, puri-
fied from synthesis by-products and the silver content in the
dispersions was measured for each batch. Unless otherwise
noted, in all cases in which silver nanoparticles are referred to
in the following sections, they are PVP-coated with a negative
zeta potential of −20 mV and a metallic core diameter of about
70 nm. All concentrations given refer to the amount of silver.
This review article summarizes the results of all groups who
participated in this study.
Synthesis and colloid-chemical characteriza-tion of silver nanoparticlesThe synthesis of silver nanoparticles with defined shapes and
sizes is extensively described in the literature, with more than
50 publications alone by the group of Xia et al. [21]. The most
common and best examined method is the polyol process during
which an ionic silver salt (typically silver nitrate or silver triflu-
oroacetate) is reduced by the solvent ethylene glycol at
temperatures of 140–180 °C in the presence of poly(N-
vinylpyrrolidone); PVP) [22]. PVP serves as capping agent and
stabilizes the formed nanoparticles against agglomeration, but
also plays a role in the formation of specific shapes such as
cubes or wires [23]. The purity of the products formed can be
increased by the addition of trace amounts of HCl or NaHS that
are believed to adsorb on specific crystal surfaces and thereby
to control the crystal growth. They may also lead to the forma-
tion of sub-microscopic nuclei onto which silver nanoparticles
sequentially grow [24,25]. Nevertheless, these syntheses are
very sensitive towards almost every possible reaction para-
meter, e.g., temperature, concentration, but also the shape of the
stirring bar or the manufacturer of the chemicals used [26,27]
and therefore lack a reliable reproducibility. Figure 1 shows
typical results of two identical syntheses.
Although it would be of interest to examine the influence of the
shape on the biological impact of silver nanoparticles, it is
crucial for biological experiments to choose a synthetic pathway
that reliably produces particles of high quality and in large
quantities over a large number of experiments. Because of this,
we decided to synthesize our particles by the reduction of silver
nitrate with glucose in the presence of PVP according to Wang
et al. [28]. This leads to high yields of spherical silver nanopar-
ticles with diameters of around 70–120 nm and a few triangular
particles as byproduct [29].
Figure 2A shows a typical SEM image of our silver nanoparti-
cles. The diameter of the metallic core is about 70 nm. The
hydrodynamic diameter as determined through dynamic light
scattering is about 120 nm. The polydispersity index (PDI) was
lower than 0.3 in all cases, which is indicative for a monodis-
perse system. The particles were negatively charged with a
zetapotential of −20 mV. These particles were used in all
described experiments after thorough chemical and colloid-
chemical characterization.
Dissolution of dispersed silver nanoparticlesSilver nanoparticles undergo dissolution in water due to oxi-
dation by dissolved oxygen [30-33]. This leads to the release of

Beilstein J. Nanotechnol. 2014, 5, 1944–1965.
1946
Figure 1: SEM images of silver nanocubes (A) and a mixture of silver nanoparticles with different shapes and sizes (B), both obtained from the polyolsynthesis as described by Xia et al. [24] and carried out under exactly the same conditions.
Figure 2: Representative scanning electron microscopy image of PVP-coated silver nanoparticles (A) and particle size distribution as measured bydynamic light scattering (B). These particles were used in all described experiments.
silver ions, which are the toxic agent towards cells and bacteria
[20,29,33-36]. The dissolution of silver nanoparticles in water
and other media has been studied by a number of groups [20,30-
33,37-41]. Typically, the dissolution is fast at the beginning of
the experiment and slows down over time, leading to incom-
pletely dissolved particles [33]. In the absence of oxygen, no
dissolution occurs [20]. As a consequence, there is also no
bactericidal effect in the absence of oxygen as shown by a very
elegant experiment by Xiu et al. [34].
We extended our studies by the addition of a number of essen-
tial components of biological media, such as inorganic salts that
can lead to the precipitation of sparingly soluble silver salts
(AgCl and Ag3PO4), glucose as reducing sugar, and cysteine as
a model compound for sulfur-containing proteins. H2O2 was
used as strongly oxidizing compound. Furthermore, we
analyzed the behavior of silver nanoparticles after their immer-
sion in cell culture media (DMEM, RPMI and LB medium)
[20].
Figure 3A shows that the dissolution requires the presence of
dissolved oxygen. If no oxygen is available, i.e., under argon
atmosphere while using degassed water as solvent, only a very
small fraction of silver is dissolved. This is probably due to
traces of oxygen in the system. If a strongly oxidizing agent
such as H2O2 is present, the dissolution rate is strongly
increased. On the other hand, the dissolution is significantly
slower in the presence of dissolved NaCl, a fact that may be due
to the formation of insoluble silver chloride. An even stronger
inhibiting effect is exerted by the sulfur-containing amino acid
cysteine. We assume that this is due to a strong binding of the
thiol group to the silver metal surface, which prevents the disso-
lution by passivation. Glucose, which is often used in syntheses
to reduce silver ions to silver metal, has a decelerating effect but
leads to a similar fraction of silver being finally dissolved
(Figure 3B). This suggests that it either reduces some of the
released silver ions or reduces the dissolved oxygen. Summa-
rizing all these data, we have formulated a model for the oxida-
tive dissolution of silver nanoparticles, based on the dissolution

Beilstein J. Nanotechnol. 2014, 5, 1944–1965.
1947
Figure 3: Dissolution of silver nanoparticles immersed in pure water, argon-saturated water under argon atmosphere, and in water with 10 mM H2O2(A), in aqueous NaCl (0.9%), and in the presence of either cysteine (aq; 1 g L−1) or glucose (aq; 1 g L−1) (B). The data were taken from [20,33].
data of our group and of other groups. This model is discussed
in detail in [20]. It mainly involves an oxidative dissolution of
silver nanoparticles, typically by dissolved oxygen, and a passi-
vation of the surface by chloride and sulfur-containing biomole-
cules.
So far, there are no quantitative data on the dissolution of silver
nanoparticles in complex biological media. Considering the
available literature data (see [1,12,20,31,42,43]), it can be
assumed that silver ions are complexed by biomolecules and
that silver nanoparticles are passivated in the presence of
sulfide, sulfur-containing components and chloride. This passi-
vation slows down the release of the toxic silver ions. The for-
mation of nanoscopic silver chloride may also be responsible
for the cytotoxicity of silver [44].
The protein corona around silvernanoparticlesIt is now well accepted that nanoparticles acquire a protein
corona after contact with biological media [45-47]. This influ-
ences their dispersability in biological media, as we have shown
for this particular kind of silver nanoparticles, and also their
cytotoxicity [48]. This effect is, of course, not limited to silver
nanoparticles [45,49-53]. The quantitative description of protein
adsorption onto nanoparticle surfaces is a critical step towards
understanding the formation of the protein corona at the full
complexity of the physiological situation [45,54-58]. We have
investigated the formation of a protein corona of serum albumin
around silver nanoparticles [56]. Specifically, we have
addressed the effect of a PVP coating around the metallic
surface of silver and, for comparison, gold nanoparticles, on the
adsorption/desorption equilibrium of serum albumin molecules
– an established model protein [57,59-62].
To quantify this equilibrium, we have used circular dichroism
(CD) spectroscopy in a quantitative approach allowing for the
determination of equilibrium constants or binding affinities
(transition midpoints) [55,59,63]. Circular dichroism signals of
proteins arise from electronic transitions in specific secondary
structural elements (e.g., α-helix or random coil), and we moni-
tored them in dependence of the specific nanoparticle surface
area as present in solution at a constant protein concentration.
Making use of the fact that proteins can undergo substantial
structural changes upon adsorption onto many nanoparticle
surfaces [59,63-68], the quantitative analysis of the corres-
ponding CD signals has been shown to be a good indicator for
the overall extent to which the original secondary structure of
serum albumin is preserved in the "equilibrated" corona
[54,69,70]. The exact mechanisms of partial or full protein
denaturation on such surfaces remain elusive, but first insights
have been provided for insulin adsorption onto gold nanoshells
[54].
By expressing the equilibrium constant in terms of the number
of surface sites, as determined by the sum over all particles
multiplied by the maximum number of protein molecules that
can fit on this surface, and the protein content in solution, we
have derived an equation which links the experimental parame-
ters of the CD measurements to the equilibrium constant, KD
[54,63,69]. Figure 4 shows typical CD spectra determined for
pure serum albumin and the same protein solution containing
PVP-coated silver nanoparticles at various concentrations as
well as the corresponding analytical plot.
Equilibrium constants for the adsorption of albumin to silver
and gold nanoparticles with and without a PVP coating were
determined, revealing the influence of the polymer coating on
the ability of the nanoparticles to adsorb proteins on their
surface [69]. The results of these experiments are summarized
in Table 1.
For citrate-stabilized nanoparticles, we found affinities in the
low nanomolar concentration regime, indicating a very high
affinity of proteins to the nanoparticle surface. The affinities

Beilstein J. Nanotechnol. 2014, 5, 1944–1965.
1948
Figure 4: (A) CD spectra of pure dissolved bovine serum albumin (thick black line) and in the presence of different concentrations of PVP-coatedsilver nanoparticles. The concentration of the nanoparticles ranged from 1.20·1011 to 1.91·1011 nanoparticles mL−1. (B) Linear fit to the evaluateddata for the determination of a KD value for these nanoparticles according to the equation given in [63,69]. Note that the accuracy of the computed KDvalue is determined by the accuracy of the CD spectra and the resulting values for the occupation of surface sites by the protein.
Table 1: Equilibrium constants KD for PVP-coated silver nanoparticles and for silver nanoparticles stabilized by citrate ligands. Nanoparticle diame-ters were measured as indicated in the table, KD values were determined from CD spectroscopic measurements [69]. For comparison, the same dataare given for gold nanoparticles with the same surface functionalization.
nanoparticle diameter [nm] KD [µM]
Ag (PVP; particles described in this article) 70 ± 6 (DLS) 0.5 ± 0.05Au (PVP) 39 ± 3 (DLS) 0.2 ± 0.05Ag (citrate) 40 ± 10 (SEM) 0.020 ± 0.0011Au (citrate) 13 ± 2 (SEM) 0.033 ± 0.0032
were one order of magnitude lower when PVP coatings were
applied to the nanoparticles prior to protein adsorption, irre-
spective of the metallic core (silver or gold). This is a good in-
dication of how PVP can shield the metallic surface of the
nanoparticle and shows how the coating mediates the particle
interaction with the environment.
The persistence of such a coating under physiological condi-
tions emerges as an important aspect for understanding interac-
tions between nanoparticles and biological entities in general
[70]. Polymer coatings are frequently stable under such condi-
tions but other ligands can well be replaced in equilibrium-type
reactions even under chemically less complex conditions
[54,71].
Uptake of silver nanoparticles by various celltypesThe exact fate of silver nanoparticles after uptake in cells is still
unclear. This includes questions such as where they are located
in cells and how they move within cells. Another question of
interest concerns where the dissolution takes place. Are silver
ions found in cells in the vicinity of the nanoparticles or are
they broadly distributed over the entire cytoplasm or even
within the cell nucleus? These observations have to be corre-
lated with morphological changes of cells as well as biochem-
ical reactions in cellular media, such as changes in the intracel-
lular distribution of Ca2+ during apoptosis. Such investigations
require spectroscopic methods which permit high resolution
imaging combined with selective probing. Imaging by conven-
tional methods, such as optical microscopy, cannot be applied
because the spatial resolution is not sufficient to probe sub-
cellular details (except for novel super-resolution microscopic
techniques like STED, PALM or NSOM). While such a resolu-
tion is easily provided by transmission electron microscopy
(TEM), this technique requires thin samples and, hence, slicing
of the samples as well as additional staining, which both might
change the properties of the samples. Furthermore, energy
dispersive X-ray spectroscopy (EDX) combined with TEM has
only limited spectral and spatial resolution and sensitivity to
provide an accurate local elemental analysis. The requirements
mentioned are fulfilled, however, by scanning transmission
X-ray microscopy (STXM) [72-74].

Beilstein J. Nanotechnol. 2014, 5, 1944–1965.
1949
Figure 5: A: STXM images at 510 eV of human mesenchymal stem cells (hMSC) after 24 h of incubation with spherical silver nanoparticles (A). B:Enlarged view from image A. C: TEM image and D: STXM image at 375 eV of the same batch of silver particles before incubation.
In this technique, high-brilliance, tunable synchrotron radiation
in the soft X-ray regime is tightly focused, and the specimen is
raster-scanned while the intensity of transmitted X-rays is
recorded so that two-dimensional images are obtained. Besides
a high spatial resolution (15 nm), X-ray microscopy provides a
chemical contrast because of the strong variation of the absorp-
tion cross section in core level absorption. This also permits to
probe a sample without the necessity to stain the local chemical
environment of the absorbing site. The spectral resolution of
STXM is about three orders of magnitude higher than that of
EDX. Hence, chemical information of the sample with high
spatial resolution is obtained. In addition, even thick (up to
10 µm) and wet samples can be studied. In spite of these advan-
tages, the number of available setups is limited, so that STXM
has only been applied to a small number of biological or
biomedical samples in the past, including the investigation of
local morphological changes in cells [75].
We have investigated whether STXM can be applied to investi-
gate the cellular uptake process of silver nanoparticles in human
mesenchymal stem cells (hMSC). For this purpose, hMSC were
grown on collagen-coated Si3N4-membranes and incubated for
24 h with O2-free aqueous dispersions of silver particles
(c = 25 µg mL−1). After incubation, the loaded cells were dried
and fixed [75]. Subsequently, STXM-images were recorded at
the PolLux scanning transmission soft X-ray microscopy
(STXM) microscope at the Swiss Light Source in the water
window at 510 eV below the O K-edge, where the contrast for
organic material is optimal. Imaging at the Ag M4,5-edges
(360–390 eV) was successful for pure silver particles in the
absence of any biological material (i.e., just the dried nanopar-
ticle dispersion) on a thin (10 nm) carbon grid (Figure 5D), but
failed for samples with cells. This was likely due to the insuffi-
cient contrast of the relatively low concentrated silver nanopar-
ticles compared to the strong background signal from the bio-
logical material. Unfortunately, imaging at the Ag L3,2 edges
(3.3–3.5 keV) with higher absorption contrast for silver was not
possible at the PolLux-instrument. A strong localization of
silver in the perinuclear region was observed (Figure 5A). In
none of the investigated cells an indication for uptake into the
nucleus was found, which is in agreement with a quantitative
TEM analysis of citrate- or polyethylene glycol (PEG)-stabi-
lized gold nanoparticles, in which no particles were identified in
the nucleus [76]. Within the resolution of STXM no morpholog-
ical changes of the cells were found. The particles that were
taken up into the cells appear to be slightly aggregated or at
least associated to larger units (see Figure 5B in comparison to
particles imaged by TEM or STXM before cell incubation:
Figures 5C and 5D). Probably, the particles were taken up into
lysosomes and slightly aggregated therein. It is not possible to
resolve individual small silver particles in cells because the
spatial resolution of STXM is 15 nm.
In conclusion, the results from STXM measurements show that
this method can be successfully applied to investigate uptake
processes of silver nanoparticles in entire cells. However,
spectro-microscopic studies are still challenging if the particle
size is small and the particle concentration is low. For the
imaging of the silver nanoparticle dissolution process in cells
(including the localization of low concentrations of small
nanoparticles as well as silver ions) imaging at the Ag L3,2
edges is a promising option for future work.
Focused ion beam (FIB) and optical microscopy (phase contrast
microscopy; fluorescence microscopy; confocal laser scanning
microscopy) are other techniques that permit to visualize
nanoparticles in cells. Therefore, hMSC were cultured in the
presence of either 20 µg mL−1 silver (as nanoparticles) or 2 µg
mL−1 silver ions (as silver acetate; control to separate the
nanoparticle and the ion effect) at 37 °C for 24 h under cell
culture conditions. This distinction was made in order to sepa-
rate the effect of particles from that of ions. In the presence of
silver nanoparticles, agglomerated nanoparticles were
detectable in a region close to the cell nucleus (Figure 6B). In
contrast, agglomerates were not observed outside the cells
within the cell culture medium. Again, this is in agreement with

Beilstein J. Nanotechnol. 2014, 5, 1944–1965.
1950
Figure 6: Agglomeration of internalized silver nanoparticles in hMSC analyzed by phase contrast microscopy (B), FIB/SEM (C), and EDX (D). hMSCwere incubated for 24 h in the presence of 2 µg mL−1 silver acetate (A) as control or 20 µg mL−1 silver nanoparticles (B–D). Accumulated nanoparti-cles were detected in perinuclear areas (B, white arrow). Cell nuclei were stained with blue-fluorescent Hoechst33342 (A, black arrow; B). A singlecell was cross-cut by FIB milling and the cut interface was analyzed by SEM to visualize the internalized particles (C, white arrow). The corres-ponding EDX spectrum of the sectioned cell shows silver signals (D, grey arrow).
a quantitative study performed with gold nanoparticles that
showed that the agglomeration of particles occurred after uptake
within 1–24 h [76]. A similar culture of hMSC in the presence
of silver acetate as control did not reveal any formation of silver
agglomerates (Figure 6A). In order to prove that the silver
agglomerates are located inside the cells, focused ion beam
milling (FIB) was applied which permits the view on cross
sections of various materials by a beam of high-energy gallium
ions [77,78]. After culturing hMSC in the presence of silver
nanoparticles, the cells were sputtered with gold and subse-
quently with a tungsten layer to protect the cut surface from
gallium contamination. Then the cross-sectional cutting area
was analyzed by scanning electron microscopy (SEM). In
different areas of silver nanoparticle-treated hMSC, silver
agglomerates were detected in different areas inside individual
cells (Figure 6C) in contrast to hMSC which were not exposed
to silver nanoparticles (data not shown). An additional EDX-
analysis confirmed the presence of silver at the intracellular
agglomerate sites (Figure 6D).
Here, we demonstrated that hMSC internalize silver nanoparti-
cles, detectable as agglomerates in the perinuclear region. Previ-
ously we have shown that in the presence of 10% fetal calf
serum within the cell culture medium, the particles do not
agglomerate [48]. Thus, the molecular basis of this intracellular
agglomeration of silver nanoparticles is still unknown; however,
as reported by Dausend et al. [79] and Harush-Frenkel et al.
[80] it is likely that encapsulation in a membrane vesicle (endo-
some/lysosome) is involved.
Different pathways were suggested for the uptake of nanoparti-
cles into cells such as macropinocytosis, clathrin- and caveolin-
mediated endocytosis, and clathrin- and caveolin-independent
endocytosis [81-83]. Other possible mechanisms such as
receptor-mediated diffusion through membrane pores and
passive uptake by van der Waals or steric interactions (summa-
rized as adhesive interactions) have been suggested [84]. As we
have reported, silver nanoparticles were mostly taken up by
hMSC through clathrin-dependent endocytosis and
macropinocytosis but not through caveolin-dependent endocy-
tosis, as shown by flow cytometry (scattergram analysis) [77].
From the literature it is known that the uptake of nanoparticles
is dependent on different factors such as cell type, size or func-
tionalization of nanoparticles [81,82]. Thus, we analyzed the
uptake of silver nanoparticles into human peripheral blood
mononuclear cells (PBMC). These cells are host-defense cells
and mainly consist of monocytes and lymphocytes (mainly
T-cells). For the analysis of a cell type-specific uptake of silver
nanoparticles, isolated PBMC were cultured in the presence of a
Beilstein J. Nanotechnol. 2014, 5, 1944–1965.
1951
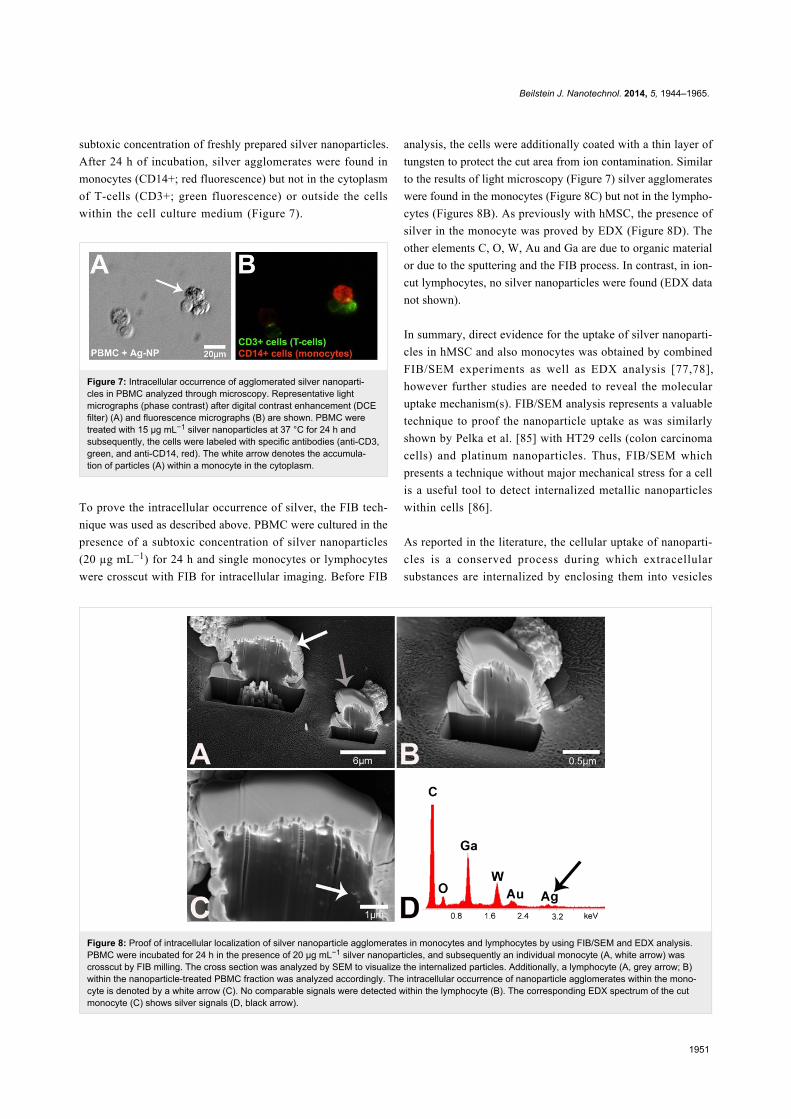
Figure 8: Proof of intracellular localization of silver nanoparticle agglomerates in monocytes and lymphocytes by using FIB/SEM and EDX analysis.PBMC were incubated for 24 h in the presence of 20 µg mL−1 silver nanoparticles, and subsequently an individual monocyte (A, white arrow) wascrosscut by FIB milling. The cross section was analyzed by SEM to visualize the internalized particles. Additionally, a lymphocyte (A, grey arrow; B)within the nanoparticle-treated PBMC fraction was analyzed accordingly. The intracellular occurrence of nanoparticle agglomerates within the mono-cyte is denoted by a white arrow (C). No comparable signals were detected within the lymphocyte (B). The corresponding EDX spectrum of the cutmonocyte (C) shows silver signals (D, black arrow).
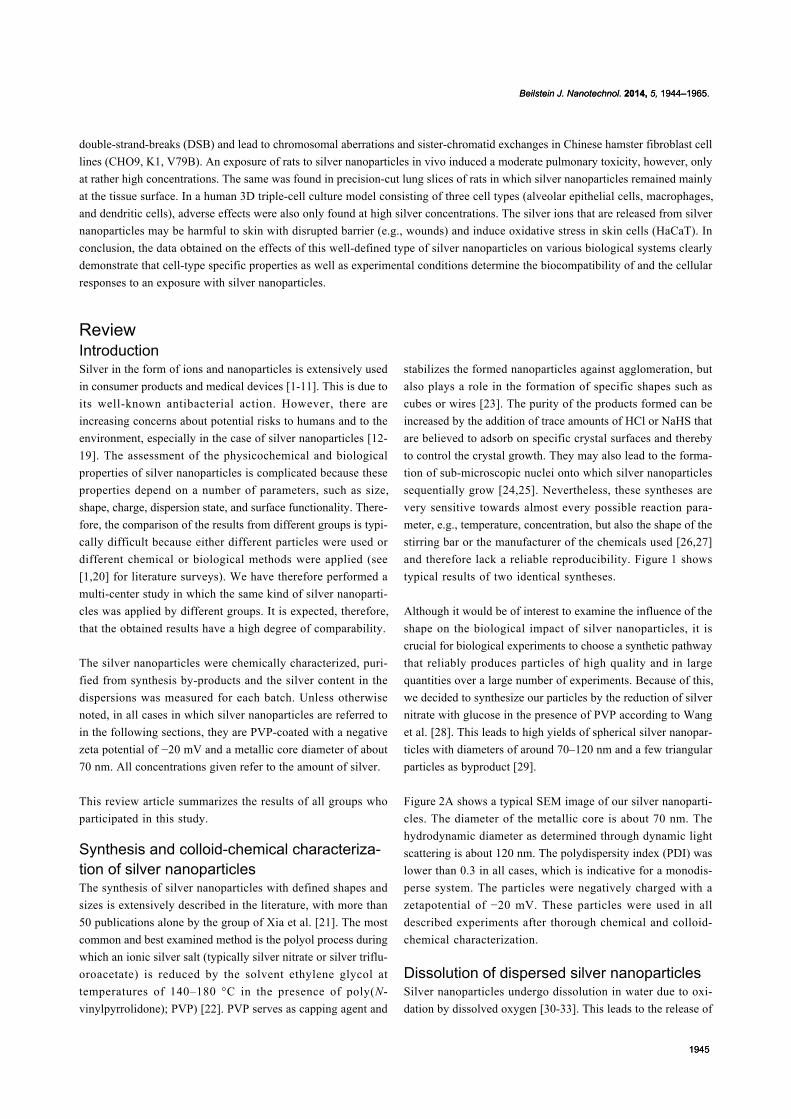
subtoxic concentration of freshly prepared silver nanoparticles.
After 24 h of incubation, silver agglomerates were found in
monocytes (CD14+; red fluorescence) but not in the cytoplasm
of T-cells (CD3+; green fluorescence) or outside the cells
within the cell culture medium (Figure 7).
Figure 7: Intracellular occurrence of agglomerated silver nanoparti-cles in PBMC analyzed through microscopy. Representative lightmicrographs (phase contrast) after digital contrast enhancement (DCEfilter) (A) and fluorescence micrographs (B) are shown. PBMC weretreated with 15 µg mL−1 silver nanoparticles at 37 °C for 24 h andsubsequently, the cells were labeled with specific antibodies (anti-CD3,green, and anti-CD14, red). The white arrow denotes the accumula-tion of particles (A) within a monocyte in the cytoplasm.
To prove the intracellular occurrence of silver, the FIB tech-
nique was used as described above. PBMC were cultured in the
presence of a subtoxic concentration of silver nanoparticles
(20 µg mL−1) for 24 h and single monocytes or lymphocytes
were crosscut with FIB for intracellular imaging. Before FIB
analysis, the cells were additionally coated with a thin layer of
tungsten to protect the cut area from ion contamination. Similar
to the results of light microscopy (Figure 7) silver agglomerates
were found in the monocytes (Figure 8C) but not in the lympho-
cytes (Figures 8B). As previously with hMSC, the presence of
silver in the monocyte was proved by EDX (Figure 8D). The
other elements C, O, W, Au and Ga are due to organic material
or due to the sputtering and the FIB process. In contrast, in ion-
cut lymphocytes, no silver nanoparticles were found (EDX data
not shown).
In summary, direct evidence for the uptake of silver nanoparti-
cles in hMSC and also monocytes was obtained by combined
FIB/SEM experiments as well as EDX analysis [77,78],
however further studies are needed to reveal the molecular
uptake mechanism(s). FIB/SEM analysis represents a valuable
technique to proof the nanoparticle uptake as was similarly
shown by Pelka et al. [85] with HT29 cells (colon carcinoma
cells) and platinum nanoparticles. Thus, FIB/SEM which
presents a technique without major mechanical stress for a cell
is a useful tool to detect internalized metallic nanoparticles
within cells [86].
As reported in the literature, the cellular uptake of nanoparti-
cles is a conserved process during which extracellular
substances are internalized by enclosing them into vesicles

Beilstein J. Nanotechnol. 2014, 5, 1944–1965.
1952
Figure 9: Localization of silver nanoparticles agglomerates in hMSC. A representative light micrograph after digital contrast enhancement (DCE filter;the black arrow denotes silver accumulation) (A), a fluorescence micrograph (B) and a combination of both (C) are shown. The white arrow denotesthe intracellular accumulation of silver particles inside the endo-lysosomes (C). The blue fluorescence of Hoechst33342, the green fluorescence ofBODIPY FL C5-ceramide and the red fluorescence of Lyso Tracker Red DND 99, were used as probes of cell nucleus, Golgi complex and endo-lyso-somes, respectively.
called early endosomes [87]. These early endosomes mature
into late endosomes after a number of steps and tend to fuse
later with the acidic lysosomes [88]. Within these cell compart-
ments, some particles may be degraded by lysosomal enzymes
or they may escape from the acidic lysosomes and travel to
other intracellular organelles, e.g., the Golgi complex or the
endoplasmic reticulum [89].
To analyze the intracellular location of agglomerated silver
nanoparticles in more detail, the Golgi apparatus, the cell
nucleus and the endo-lysosomes were marked by specific fluo-
rescent dyes. Previously, the hMSC were cultured with
20 µg mL−1 silver nanoparticles at 37 °C for 24 h. Phase mi-
croscopy (Figure 9A) and fluorescence microscopy (Figure 9B)
images were taken of identical cell areas (merge, Figure 9C).
Agglomerated silver nanoparticles were detected in perinuclear
regions (Figure 9A; black arrow). As shown in Figure 9C, silver
agglomerates were mainly associated with the endo-lysosomes
but not with the Golgi apparatus or inside the cell nucleus.
It is known that the intracellular fate of particles depends on the
size of the particles [90]. Berry et al. suggested that the uptake
of nanoparticles into the cell nucleus is constrained by the pore
dimension of the nucleus, because 5 nm gold nanoparticles
entered the cell nucleus of human fibroblasts whereas particles
larger than 30 nm were retained in the cytoplasm [91]. The
silver nanoparticles used in our study have a size of 70 nm and
thus, it is understandable that no silver agglomerates were found
in the cell nucleus of hMSC. In addition to the particle size, the
intracellular fate of nanoparticles within the cells is time- and
dose-dependent [92]. As was shown by Cartiera et al. PLGA-
nanoparticles were mainly found within early endosomes after
2 h of incubation in OK-cells (renal tubulus cells) but also
within other compartments after a longer incubation time
(4–24 h). Additionally, it is known that the endocytosis rates are
specific to the cell type [93].
We also demonstrated that after prolonged cell culture periods
(72 h) in the absence of extracellular silver nanoparticles, the
intracellular occurrence of silver agglomerates of silver-pulsed
cells had decreased in a process which was clearly not related to
cell proliferation under these conditions (Figure 10). Interest-
ingly, the decrease in the number of particles was almost
completely inhibited when the medium was depleted of serum
(data not shown), indicating that at least the discharge of parti-
cles or ions from vesicles or other pathways at the cell surface
membrane requires carrier molecules outside the cells. Interest-
ingly, Panyam et al. have previously shown that the exocytosis
of PLGA-nanoparticles in vascular smooth muscle cells was
induced by the addition of BSA [94].
Figure 10: Decrease in the amount of silver agglomerates withinhMSC after prolonged cell culture. hMSC were pre-incubated for 24 hwith the silver nanoparticles (A), then, the cells were washed and incu-bated with fresh growth medium for further 72 h (B). The white arrowdenotes the intracellular accumulation of silver particles.
The understanding of the dissemination of silver nanoparticles
must be related either to exoxytosis and/or to dissolution. It is
complicated by the coexistence of silver in nanoparticulate and
in ionic form, which will likely possess different transport char-
acteristics. This may lead to independent or synergistic cell
responses [95]. Thus, the dissemination of ingested intracel-
lular silver nanoparticles to other cells is a critical process that
obviously involves intercellular trafficking of particles fol-

Beilstein J. Nanotechnol. 2014, 5, 1944–1965.
1953
lowed by exocytosis and/or intracellular dissolution of silver
nanoparticles to silver ions.
Silver nanoparticles and brain cells (astro-cytes)Silver nanoparticles have been reported to damage the
blood–brain barrier, to enter the brain and to cause neurotoxi-
city [96-98]. In addition, once nanoparticles have entered the
brain, they are not efficiently cleared from the brain, in contrast
to other organs, even during a long recovery period [99]. After
crossing the blood–brain barrier into the brain, silver nanoparti-
cles will immediately encounter astrocytes as these cells almost
completely cover the brain capillaries with their endfeet [100].
Astrocytes are the most abundant cell type in the brain [101]
and are considered to be key regulators of the homeostasis of
the essential metals iron and copper in the brain [102-104]. In
addition, astrocytes have the potential to accumulate toxic
metals and are therefore considered to be a metal sink that
protects neurons and other brain cell types against toxic metals
[105]. Due to their important functions in brain metal homeo-
stasis among the different types of brain cells, the astrocytes
have recently been especially in the focus of studies on uptake
and metabolism of metal-containing nanoparticles [103,104].
As model systems for brain astrocytes, primary astrocyte
cultures from rat brain have frequently been used to study the
consequences of an exposure of astrocytes to metal-containing
nanoparticles [106,107], including silver nanoparticles
[104,108,109]. The current knowledge about uptake and metab-
olism of silver nanoparticles in cultured astrocytes is summa-
rized in Figure 11.
Cultured astrocytes are remarkably resistant to the potential
toxicity of silver nanoparticles. Even exposure for 24 h to
100 µM (10.8 µg mL−1) silver as silver nanoparticles neither
caused toxicity nor oxidative stress, while an incubation for 4 h
with 100 µM (10.8 µg mL−1) silver in the form of silver nitrate
strongly damaged cultured astrocytes and deprived these cells
almost completely of the important antioxidant glutathione
[108]. The high resistance of cultured astrocytes against silver
nanoparticle-induced toxicity is consistent with the reported
tolerance of astrocytes against the potential toxicity of large
amounts of accumulated iron oxide nanoparticles [107],
whereas astrocytes are quite vulnerable to copper oxide
nanoparticles [106].
Cultured astrocytes efficiently accumulate silver nanoparticles
in a process that increases their silver content proportional to
the concentration of particles applied at least for incubations
with silver nanoparticle dispersions containing silver concentra-
tions of up to 300 µM (32.4 µg mL−1) [108]. After 4 h of incu-
Figure 11: Uptake and metabolism of silver nanoparticles in brainastrocytes. Data from cultured astrocytes suggest that endocytosiscontributes to the internalization of silver nanoparticles by astrocytes.Silver ions are slowly liberated from accumulated silver nanoparticlesand induce the upregulation of the metal storage proteins, metallo-thioneins (MTs). The upregulation of these protective proteins will helpto prevent severe toxicity of silver ions that are liberated from the accu-mulated silver nanoparticles. The mechanisms involved in the releaseof silver ions from internalized silver nanoparticles and in the export ofsuch ions from the endosomes remain to be elucidated.
bation with 100 µM (10.8 µg mL−1) silver nanoparticles,
cultured astrocytes contained a specific silver content of around
50 nmol (5.4 µg) per mg of protein [104,108]. Compared to an
incubation at 37 °C, the specific cellular silver content is
decreased to one fifth if the exposition temperature is lowered
to 4 °C [108]. This indicates that the majority of silver deter-
mined in astrocytes after incubation with silver nanoparticles at
37 °C represents material that has been internalized by an active
transport process through the plasma membrane. Endocytotic
processes are likely to contribute to the internalization of silver
nanoparticles in astrocytes as in the cell types discussed above
(Figure 11), inhibitors of macropinocytosis and endosomal traf-
ficking (chloroquine and amiloride) at least partially lower the
accumulation of silver nanoparticles [108].
Accumulated silver nanoparticles appear to be quite stable in
cultured astrocytes as no substantial reduction of the cellular
silver content was found during a 7 d incubation of cultured
astrocytes that had been loaded for 4 h with silver nanoparticles
and as no delayed toxicity was found under such conditions
[104]. However, some release of silver ions from internalized
silver nanoparticles appears to take place in astrocytes
(Figure 11), as these cells upregulate the synthesis of the metal
storage proteins, i.e., metallothioneins (MTs), after exposure to
PVP-coated silver nanoparticles [104]. The strong upregulation
of the cellular content of these protective proteins is likely to

Beilstein J. Nanotechnol. 2014, 5, 1944–1965.
1954
contribute to the observed high resistance of cultured astrocytes
against the potential toxicity of internalized silver nanoparticles.
The efficient accumulation of silver nanoparticles in cultured
astrocytes as well as the high resistance of these cells against
the potential toxicity of internalized silver nanoparticles suggest
that astrocytes will also cope well in the brain with silver
nanoparticles that have crossed the blood–brain barrier and
further support the proposed function of astrocytes in protecting
the brain against toxic metals.
Genotoxicity of silver nanoparticlesThe increasing use of silver in the form of nanoparticles raises
the question whether these compounds are potentially harmful
to the health of living organisms in terms of genotoxicity.
Experiments were therefore also carried out with Chinese
hamster fibroblasts to explore the genotoxic effects of silver
nanoparticles. In mammalian cells, the toxic effects of silver
nanoparticles have been explored in various cell culture systems
[1]. In contrast to acute toxic effects, much less effort has been
directed towards the investigation of genotoxic consequences,
although these have the capacity to increase the risk of human
cancer [110].
Permanent fibroblast cell lines from ovaries (CHO9, K1) and
lung tissue (V79B) of Chinese hamsters are well-established in
the cytogenetic analysis of potentially mutagenic triggers that
induce chromosomal aberrations (CA) [111] or sister-chro-
matid exchanges (SCE) in mammalian cells [112]. Ionizing
radiation and radiomimetic chemicals like bleomycin are potent
inducers of such genome modifications, and it is generally
believed that double-strand breaks (DSB) represent the central
intermediate structure of such events. This model is supported
by the observation that mutants that are defective in double-
strand-break repair (DSB-repair) also have elevated levels of
spontaneous CA and SCE and an increased sensitivity to
radiomimetic drugs and ionizing radiation [113].
Although it is not yet entirely clear by which mechanisms
radiomimetic drugs and ionizing radiation induce genomic
DSB, there is evidence in both cases that radicals are involved
[114,115]. In the case of bleomycin, reasonable models suggest
that metal ions play a role during DSB formation [116]. In the
case of silver nanoparticles, it has also been proposed that DNA
damage may result from radicals whose formation is catalyzed
from silver ions generated after uptake of silver by phagocy-
tosis [110].
In contrast to chemical modifications of genomic DNA by reac-
tive oxygen species (ROS) which are difficult to prove, the
presence of DSB that result from a radical attack are more
Figure 12: Damaged cells given in percent by scoring for CA in CHO9(n = 816, p > 0.999), K1 (n = 1851, p > 0.999) and V79B (n = 726,p = 0.714). Black bars show data of untreated cultures and grey barsrepresent data observed in cultures treated with 5 µg mL−1 of silvernanoparticles. The asterisks indicate data that are significant whenusing a single sided Χ2 four field test. Mock = control (untreated cells).
easily to detect. As an early response to genomic DSB, a variant
of histone H2A becomes phosphorylated at amino acid 139 by
members of the PI3-kinase family in the direct vicinity of the
break. The phosphorylated form of H2AX (γ-H2AX) is neces-
sary to activate the DSB-repair machinery [117] and therefore,
it can be used as a tool to detect DNA-DSB by specific anti-
bodies recognizing γ-H2AX. Staining of cells with antibodies
directed against γ-H2AX results in a speckled staining of the
nucleus. It is generally accepted that a single focus is repre-
senting a single DSB [118]. In the following, we describe
experiments with silver nanoparticles at sub-lethal concentra-
tions to explore the induction of CA and SCE in first metaphase
chromosomes and the formation of γ-H2AX foci.
During initial experiments, we found that a concentration of
5 µg mL−1 silver nanoparticles added to the culture medium
represented a good compromise between toxicity on the one
hand and a reasonable number of chromosomal aberrations on
the other hand. In preliminary lethality tests we determined the
number of dead cells to less than 15% in exponentially growing
CHO9 cultures (data not shown). Therefore, all further experi-
ments were performed at a silver nanoparticle concentration of
5 µg mL−1. Neither a change in shape nor a detachment of cells
from the dish was observed during the experiment.
The frequency of cells containing chromosomal aberrations
(CA) was significantly increased in CHO9 and K1 cells
(Figure 12). In contrast to the genotoxic effect observed in these
strains, no significant increase in CA was found in the third
strain V79B (Figure 12). The absence of CA in V79B is inter-
preted as a resistance to silver nanoparticles. Although we have
not yet analyzed this phenomenon in detail, we propose that a
multi-drug resistance phenomenon is most likely to be respon-
sible for the observed results [119]. This assumption is

Beilstein J. Nanotechnol. 2014, 5, 1944–1965.
1955
Figure 13: The diagram shows the distribution of sister-chromatidexchanges (SCE) in untreated cells (black bars) and silver nanopar-ticle treated cells (grey bars). The average number of SCE per cellincreased from 5.50 in untreated cells to 7.26 in silver nanoparticle-treated cells. This shift of the average number of SCE was significant(p = 0.998) when using a single-sided unpaired t-test. In total therewere 407 SCE scored in 74 untreated cells and 537 SCE in 75 silvernanoparticle-treated cells.
supported by the fact that bleomycin is also unable to induce
chromosome mutations in V79B (data not shown) and there-
fore, we can exclude an effect restricted to silver nanoparticles.
In contrast, the mechanism is probably affecting multiple chem-
ical mutagens, including silver nanoparticles.
We conclude that at the sublethal silver concentration of
5 µg mL−1, silver nanoparticles already have the capacity to in-
duce genotoxic effects in Chinese hamster cells. Furthermore, in
a recent study it has been shown that DNA-PKcs, which plays
an important role in non-homologous-end-joining (NHEJ), is
essential for the repair of DSB caused by silver nanoparticles
[120]. In this study, normal human cells (IMR-90), DNA-PKcs-
proficient (AA8) and DNA-PKcs-deficient (V33) Chinese
hamster cell lines and human cell lines (MO59K) were exposed
to silver nanoparticles. The DNA damage was greater in the
normal and in the DNA-PKcs-deficient cells. Therefore this
study shows the importance of DNA-PKcs in the repair of
DNA-damage caused by silver nanoparticles. It also shows that
a combination of silver nanoparticles and DNA-PKcs inhibition
could be very interesting in the development of new anticancer
therapies.
Since all known drugs that are mutagenic are also capable of
inducing SCE, we explored levels of SCE in K1 in cells treated
with silver nanoparticles and untreated cells (Figure 13) and
found a significant increase in the average number of SCE in
silver nanoparticle-treated cells. Since it is known that SCE and
CA are both induced by DSB-forming agents, we propose that
DSB play a central role in the genotoxic impact of silver
nanoparticles. The formation of SCE in CHO-9 and V79B was
not investigated.
Confluent silver nanoparticle-treated cells have been stained
after 10 h and 22 h with a monoclonal antibody recognizing
γ-H2AX. The quantifications of the number of foci induced in
the three cell lines CHO9, K1 and V79B are given in Figure 14.
About 100 nuclei were scored at each time point, and the
number of foci in each nucleus was counted. The cells were
treated with either silver nanoparticles (Figure 14A, 14C, 14E)
or with bleomycin (Figure 14B, 14D, 14F). The distribution of
foci formation is shown in each figure. Cells with more than ten
foci are rare in untreated cells but this fraction is significantly
increased in CHO9 and K1 cells which were treated with either
silver nanoparticles or bleomycin for 10 h, respectively. To our
surprise, this pattern did not hold for the third cell line V79B,
neither for silver nanoparticles nor for bleomycin. We conclude
that DSB are not formed in V79B and that this cell line is resis-
tant against mutagenesis caused by silver nanoparticles and
bleomycin at the concentration levels applied during this study.
This finding also confirms the coincidence of the lack in DSB
formation with the absence of CA in V79B. To test this hypoth-
esis and to exclude any technical problems (e.g., with the anti-
body used), we induced γ-H2AX by using X-rays instead of
radiomimetic treatment or silver nanoparticle exposure
(Figure 14G). Untreated cells (black bars) and cells treated with
1 Gy (grey bars) and 3 Gy (open bars) were collected and fixed
30 min after irradiation and stained for γ-H2AX foci. As shown
in Figure 14G, γ-H2AX foci have been detected also in V79B
cells after irradiation. Therefore, we can exclude technical
reasons for the deficiency of γ-H2AX foci in V79B cells
following treatment with silver nanoparticles or bleomycin. Last
but not least, multidrug resistance has been reported earlier for
the V79 cell line, which is a related cell line to V79B used
during this study [121]. It is not clear whether the resistance
found in V79B compared to the other two cell lines CHO9 and
K1 is related to the origin of the cell line or whether V79B has
acquired this phenotype during cell culture processing. While
V79B was originally isolated from lung tissue, the two other
cell lines used in our study were derived from ovaries. The
observed data raise the question whether tissues have a different
sensitivity towards silver nanoparticles or possibly against free
radicals.
In CHO K1 cells treated with silver nanoparticles, a significant
number of cells with endoreplicated (ER) chromosomes was
found. ER chromosomes result from aberrant cell cycles
by two rounds of replication without chromatid separation in
between. Although cells with ER chromosomes were already
detectable during regular experiments with cell cultivation
times of 22 h, the number of those cells could be further
increased by extending the cultivation time to 40 h. Under these
conditions, 10 to 20% of all metaphases contained ER chromo-
somes.

Beilstein J. Nanotechnol. 2014, 5, 1944–1965.
1956
Figure 14: These diagrams summarize the quantification of foci formation in CHO9, K1 and V79B. Data derived from silver nanoparticle-treated cellcultures are given in Figure (A), (C), and (E) and control experiments treated with bleomycin are shown in Figure (B), (D), and (F). Panel (G) showsthe proficiency of γ-H2AX foci formation in V79B cells after irradiation. These foci were not detectable in V79B cells after silver nanoparticle treatment(E) or treatment with bleomycin (F).
We do not yet know the reason for this phenomenon so far, but
we used this as a tool to explore SCE frequencies taking place
during the first (twins) and the second round of replication
(singles), following differential staining of the sister chro-
matids. The distribution of single SCE and twin SCE is shown
in Figure 15. It turned out that there was a significant increase

Beilstein J. Nanotechnol. 2014, 5, 1944–1965.
1957
in single SCE compared to twin SCE. We assume that the
difference in the number of single SCE and twin SCE results
from different frequencies of SCE formation during the first and
second round of replication and is a consequence of the geno-
toxic effect caused by the silver nanoparticles.
Figure 15: The diagram shows the distribution of twin SCE (blackbars) and single SCE (grey bars) in CHO K1 cells, treated with silvernanoparticles. The average number of SCE per cell changes fromµ = 0.612 for twin SCE (n = 214) to 3.115 for single SCE (n = 208;p > 0.999). Images on the right side show examples for twin SCE andsingle SCE.
This is possible because SCE events from the first replication
result in twin SCE, while in the second round of replication,
SCE result in single SCE. To our surprise, the frequency of
single SCE was strongly increased compared to the frequency
of twin SCE. We explain this by an increase of the mutagen
concentration inside the cell, which is controlled by a rate-
limiting and relatively slow process. Therefore, the concentra-
tion of mutagen increases inside the cell between the first and
second round of replication.
We propose that there are two possibilities for the nature of the
rate-limiting component. Firstly, the uptake mechanism might
be slow. This would be consistent with the model that silver
nanoparticles are transported into the cell by endocytosis. Alter-
natively, the dissolution of silver nanoparticles might be rate-
limiting due to the moderate stability of the particles at least
outside the cell. Last but not least, a combination of both effects
also cannot be excluded. Further experiments are necessary to
understand this phenomenon in more detail.
The lung and silver nanoparticlesThe wide variety of silver nanoparticles applications allows for
different routes of entry into the human body [122]. Silver
nanoparticle exposures to humans can occur orally, e.g., by
colloidal solutions, dermally, e.g., in contact with jewelry or
burn creams, and by inhalation of dusts or fumes. The latter is a
major concern in occupational settings when handling silver
nanoparticles at the point of production and the manufacture of
nanoparticle-containing materials. However, since the antibacte-
rial properties of silver nanoparticles and silver salts promote an
increased use in personal care products, aerosolized silver
nanoparticles and silver salts in spray products such as deodor-
ants or pharmaceuticals are therefore of particular significance
to the lung [1,12,13,123].
In vivo studies using animals or humans provide the benefit of
having a complete organism displaying the full range of bio-
logical responses to a given treatment. Human case studies on
silver nanoparticles are only performed to reveal the side effects
of an unintended exposure to silver, misuse of colloidal silver
solutions, or work-related exposure and not to investigate the
toxic mechanisms of newly developed materials. A recently
published animal study suggests that exposure of rats to silver
nanoparticles (50 and 250 µg) by intratracheal instillation can
cause moderate pulmonary toxicity in vivo, but only at rather
high concentrations [124].
Ex vivo approaches, such as isolated-perfused lungs or preci-
sion-cut lung slices (PCLS), have been developed as an alter-
native to in vivo studies [125]. They allow for a more detailed
view on the direct interaction of nanoparticles with whole
organs or parts of them. Moreover, they can contribute to the
reduction of animal experiments and also have a better cost and
benefit ratio, as in the case of PCLS one organ can be used for
several exposure conditions. The exposure of cultured rat PCLS
to silver nanoparticles (10, 20 and 30 µg mL−1) under
submerged conditions for 4 and 24 h resulted in only weak
cytotoxicity (LDH release), but did not induce a proinflamma-
tory response (CXCL-1 and TNF-α release). Interestingly,
multiphoton microscopy revealed that the silver nanoparticles
were localized predominantly at the cut surface but not inside
PCLS, indicating that the particles did not reach the inner PCLS
tissue regions [126].
However, ex vivo approaches are complex and difficult to
control in a standardized laboratory environment, therefore
sample administration might not reflect the original conditions
anymore. Furthermore, they experience similar disadvantages as
in vivo experiments due to the fact that the source is still an
animal. Following the aforementioned considerations, another
approach to assess possible risks of silver nanoparticles by
inhalation was to use a cellular model of the human airway/
alveolar epithelial barrier. The human 3D cell culture model
consists of three cell types, i.e., alveolar epithelial cells,
macrophages, and dendritic cells as described in [127]. To
imitate the lung organ structure, an A549 cell layer was cultured
on porous membranes with human monocyte-derived
macrophages (MDMs) on top on the apical side and monocyte-

Beilstein J. Nanotechnol. 2014, 5, 1944–1965.
1958
Table 2: Comparison of the cytotoxic and (pro-)inflammatory responses induced in different model systems exposed to PVP-coated silver nanoparti-cles.
model species dose (silver) cytotoxic response (pro)-inflammatoryresponse
in vitro epithelial airway barrier model, culturedat the air-liquid interface
human 0.03 µg cm−2
0.3 µg cm−2
3 µg cm−2
nonenonenone
nonenonetransienta
ex vivo precision-cut lung slices (PCLS) rat 10 µg mL−1
20 µg mL−1
30 µg mL−1
noneweakweak
nonenonenoneb
in vivo intratracheal instillation rat 50 µg250 µg
nonemoderate
nonemoderatec
aSignificant increase in mRNA for TNF-α after 4 h, which decreased to control values after 24 h. No increase in TNF-α protein after 4 h and 24 h asdetermined by ELISA [125]. bSignificant, but weak increase in LDH release after incubation for 4 h and 24 h. No increase in CXCL-1 or TNF-α proteinas determined by ELISA [126]. cSignificant increases in BALF LDH, total protein, and cytokine levels as well as in BALF neutrophil numbers 24 h afterintratracheal instillation of 250 µg silver nanoparticles [124].
derived dendritic cells (MDDCs) underneath on the basal side.
This 3D co-culture system was further cultivated at the
air–liquid interface to approximate the in vivo situation in the
lungs [128]. Although essential parts are missing like the lymph
and blood circulation, muscles, connective tissue, or the respira-
tion movement, it permits to investigate the interaction of silver
nanoparticles with lung cells at a higher complexity through an
in vitro method without using invasive animal model tests. To
make use of the realistic culture conditions, a specifically
designed exposure system was employed which allows the
nebulization of a defined nanoparticle suspension onto the cells
at the air–liquid interface (ALI), mimicking the inhalation of
nanoparticles (Figure 16).
Figure 16: Schematic image of the triple-cell co-culture modelconsisting of MDMs (blue), A549 cells (red), a porous membrane(grey), and dendritic cells (yellow). The cells were cultured at the air-liquid interface for exposure of silver nanoparticle suspensions bynebulization. Reproduced from [125].
This air–liquid interface cell exposure (ALICE) system has
been intensively characterized [129] and allows for exact
measurements of the deposited amount of nanoparticles
revealing direct dose–response relations, which can be more
difficult to achieve through in vivo experiments. In a previous
study with 20 nm citrate-coated silver nanoparticles, no effects
were observed in cultures exposed to 0.03 and 0.3 µg silver
cm−2 [130].
In a further study, PVP-coated silver nanoparticles were used
with the same cell and exposure system [125]. The cells were
exposed to three different concentrations of silver nanoparticles
resulting in a final deposition of 0.03, 0.3, and 3 µg silver cm−2.
A transient increase of mRNA expression encoding tumor-
necrosis factor-alpha (TNF-α) could be detected after 4 h only
for the highest silver nanoparticle concentration. The protein
levels of TNF-α were, however, not increased after 4 and 24 h,
and moreover, no other effects, i.e., oxidative stress and
different pro-inflammatory cytokines/chemokines, were
observed. Compared to a representative lung deposition attribut-
able to occupational exposure of 5–100 nm silver nanoparticles
calculated after 24 h, as described by Gangwal et al. [131], an
expected deposited dose in elevated atmospheric concentra-
tions of 1 mg silver m−3 varies between 0.061–0.15 µg silver
cm−2. Consequently, the highest dose applied to cells at ALI in
this study (i.e., 3 µg silver cm−2) suggests to be more accurate,
according to [131], a working lifetime or higher concentration.
Concluding these in vitro experiments, representative silver
nanoparticle concentrations are not expected to induce acute
cytotoxic or pro-inflammatory effects after 24 h exposure in a
realistic environmental setting, therefore implicating to have a
low impact on the human health. However, bioaccumulation of
silver nanoparticles over time may induce secondary effects,
which cannot be ruled out by such in vitro studies. Chronic
exposure and inhalation studies need to address this issue in the
future.
As summarized in Table 2, the effects induced by the PVP-
coated silver nanoparticles in three different lung systems, i.e., a
3D lung model composed of human cells, PCLS from rat, and
intratracheal instillation to rats, are difficult to directly compare

Beilstein J. Nanotechnol. 2014, 5, 1944–1965.
1959
and interpret. Several reasons can explain the observed differ-
ences, such as the different species used (human, rat) as well as
differences in cell numbers and types. In addition, the expo-
sures were also different and carried out once at the air–liquid
interface, once in submerged conditions, and once through
instillation. In the latter two methods, the determination of the
exact dose deposited per area is not possible. Nevertheless, one
observation is similar, namely that effects, such as cytotoxicity
and/or (pro-)inflammatory responses are only induced by higher
concentrations of silver nanoparticles.
Interaction of silver nanoparticles with thehuman skin barrier and keratinocytesSilver is widely used in dermatology and health care as antibac-
terial and anti-inflammatory agent [132]. Especially wound
dressings and gels containing nanoscale silver particles are an
achievement of biomedical engineering to prevent and handle
wound infections. Silver nanoparticles slowly and continuously
release silver ions, thus providing a sustained antibacterial
effect [1,133]. Especially when applied to inflamed skin and
wounds, however, the topically applied particles also have easy
access to living skin cells and may easily enter the systemic
circulation [134,135]. For a proper risk assessment and in order
to improve the therapeutic window of such antimicrobial ma-
terials, possible cytotoxic effects need to be carefully distin-
guished. For instance, Foldbjerg et al. showed in studies with
70 nm sized silver nanoparticles and silver nitrate on THP-1
monocytes that Ag+ ions from silver nitrate were much more
toxic than the particles although a particle-related toxicity was
not studied [136]. We have investigated the interaction of silver
nanoparticles (10–50 µg mL−1) on porcine ear skin samples and
on the human keratinocyte cell line HaCaT. The interaction of
silver nanoparticles with the skin barrier (i.e., the stratum
corneum) was investigated by confocal Raman microscopy.
The mean measured penetration depth in intact skin was
4.4 ± 1.5 µm, which is in accordance with other investigations
on solid particles in this size range showing that solid particles
remain, to a large extent, in the superficial stratum corneum
[137]. However, even in intact skin, when measurements were
carried out by exploiting the surface-enhanced Raman scat-
tering (SERS) effect which is typical for silver nanoparticles in
this size range, a SERS signal was detected down to a depth of
10–18 µm [138].
Especially with regard to repetitive applications on inflamed
skin and wounds, direct silver nanoparticle exposure of vital
epidermis cells and cellular uptake is very likely to occur. We
therefore investigated possible biological effects of such a
cellular uptake in in vitro experiments on silver nanoparticle-
treated HaCaT cells by transmission electron microscopy and
XTT viability assay. We showed that a decrease of the cell
viability depended on the silver nanoparticle concentration and
the percentage of fetal calf serum in cell incubation media
[139]. When toxic concentrations of silver nanoparticles were
applied to HaCaT cells (nanoparticles stored for a long time
under oxygen atmosphere) a degeneration of the cell nuclei and
the cell membranes was observed, leading to cell death [139].
Concentration-dependent effects of 80 nm-sized nanoparticles
on human epidermal keratinocytes have also been studied by
Samberg et al. [140]. Similar results were published by Miura et
al., who compared the toxicity of silver nanoparticles to that of
silver nitrate on HeLa cells [141].
Because the main mechanism of silver nanoparticles cytotoxi-
city was reported to be related to free radical species produced
by the interaction of silver ions with the cell component, we
used EPR spectroscopy to detect the silver nanoparticle-medi-
ated intracellular production of reactive oxygen species (ROS).
To differentiate between the effects of silver ions released
during particle storage and those of silver ions released after
particle intracellular uptake, we investigated two different silver
nanoparticle dispersions: One produced and stored under air
(O2), with a comparatively high silver ion (Ag+) concentration
due to oxidative dissolution, and one produced and stored under
argon (Ar) with a low silver ion content [20]. One hour after
incubation with the cells, significant differences were found
between the two silver nanoparticle samples at the different
concentrations used [139]. Particles produced and stored under
air induced ROS to a significantly higher extent than silver
nanoparticle stored under argon. These findings indicate that the
silver ions released during particle storage are responsible for
most of the intracellular radicals induced by the investigated
silver nanoparticle dispersions and confirm the role of silver
ions in silver nanoparticle-mediated cytotoxicity (Figure 17).
Hence, despite the substantial value of silver particle-containing
formulations for skin surface antisepsis, the cytotoxicity of
silver nanoparticles towards skin cells is detrimental to their
broad use in wound treatment. This needs to be carefully
considered especially when repetitive applications on skin with
a disrupted barrier are required over longer period of times.
Storage of silver nanoparticle formulations under inert atmos-
phere might be an option to avoid side effects due to high
concentrations of silver ions and to take advantage of the slow-
release properties of particulate silver.
Topically applied solid particles largely remain in the superfi-
cial horny layers of skin which provides a strong rationale for
the use of silver nanoparticles in skin surface antisepsis.
However, skin barrier translocation at natural interruptions such
as hair follicles has been reported [134,135], and especially
when applied on inflamed skin and wounds, contact to viable
epidermis and cellular uptake inevitably occur.

Beilstein J. Nanotechnol. 2014, 5, 1944–1965.
1960
Figure 17: Cytotoxic effects and free radical production by silver nanoparticles per se versus the effects due to secondary Ag+ ion release.
Table 3: Summary of all results obtained for PVP-coated silver nanoparticles.
investigated property results reference
physical properties diameter of the metallic core of 70 nm; hydrodynamic diameter of 120 nm;zeta potential of −20 mV
[33]
dispersability dispersable in water; agglomeration in salt-containing solutions; gooddispersability in the presence of proteins
[48]
dissolution dissolves in the presence of oxygen under the release of silver ions [20,33]protein adsorption enclosed by a protein corona in biological media [55,69]uptake by cells endocytosis (hMSC, primary T-cells, primary monocytes, astrocytes) [77,78,108]visualization inside cells fluorescence microscopy; X-ray microscopy; FIB/SEM [77,78]; this workcytotoxicity (particlesprepared and storedunder air)
hMSC: 25–50 µg mL−1; primary T-cells: >50 µg mL−1; primary monocytes:50 µg mL−1; astrocytes: no toxicity after 24 h exposure to 10 µg mL−1 andafter 4 h incubation with up to 30 µg mL−1 for 4 h; HaCaT cells: ≥30 µg mL−1
[33,48,108,109,139,142]
bactericidal effect E. coli: 12.5 to 50 µg mL−1; S. aureus: 20–50 µg mL−1 [142]genotoxicity induces the formation of DNA double strand breaks (DSB), chromosomal
aberrations and sister-chromatid exchanges (CHO9, K1, V79B cell lines) at5 µg mL−1
this work
intratracheal instillationof rats
moderate pulmonary toxicity (250 µg Ag) [124]
precision-cut lung slices(PCLS) (rat)
moderate pulmonary toxicity (30 µg Ag mL−1) [126]
epithelial airway barriermodel, cultured at theair–liquid interface
transient increase in mRNA for TNF-α after 4 h for 3 µg Ag cm−2 [125]
skin exposure penetration to 10–18 µm on porcine ear skin 16 h after application of 12 µgAg cm−2
[138]
ConclusionThe results from all studies are summarized in Table 3.
As demonstrated above, we conclude that well-defined and
well-characterized nanoparticles are necessary in targeted
investigations to permit a comparison of the results from
different laboratories.
Within the Priority Program SPP1313 of the Deutsche For-
schungsgemeinschaft (DFG) we had the opportunity to use thor-
oughly characterized PVP-capped silver nanoparticles that were
stored and characterized under well-defined conditions. This
particle type was then distributed to different laboratories to test
the possible interaction of the particles with various biological
systems, i.e., single cell cultures (mesenchymal cells, astro-
cytes, keratinocytes, fibroblasts), more complex cell models
(3D model of the human epithelial airway wall, PCLS, porcine
ear skin samples), or in animals (rats). Although the same silver
nanoparticles were used, quite different responses in the bio-
logical systems were observed. This can be explained by the use
of different cell species, the different endpoints that were
assessed, and also the different exposure routes of the particles.

Beilstein J. Nanotechnol. 2014, 5, 1944–1965.
1961
In general, it can be said that only higher concentrations of
silver nanoparticles induced biological responses in single cell
cultures, in more complex systems and in animal experiments.
Only for the fibroblast cultures, a genotoxicity was observed at
rather low concentrations. Further coordinated efforts will be
needed to explore the possible effects that silver nanoparticles
can induce in (human) cells.
ExperimentalSynthesis of silver nanoparticles [20]PVP-coated silver nanoparticles were synthesized by reduction
with glucose in the presence of PVP according to Wang et al.
[28]. Briefly, 2 g glucose and 1 g PVP were dissolved in 40 g
water and heated to 90 °C. Then 0.5 g AgNO3 dissolved in
1 mL water were quickly added. The dispersion was kept at
90 °C for 1 h and then let to cool to room temperature. The
particles were collected by ultracentrifugation (29,400g;
30 min), redispersed in pure water and collected again by ultra-
centrifugation. Thereby NO3−, excess glucose and its oxidation
products, excess PVP, and excess Ag+ were removed. The
silver nanoparticles were then redispersed in water by ultrasoni-
cation. The final silver concentration in all dispersions was
determined by atomic absorption spectroscopy (AAS). Poly(N-
vinylpyrrolidone) (PVP K30, Povidon 30; Fluka, molecular
weight 40,000 g mol−1), silver nitrate (Roth, p.a), D-(+)-glucose
(Fluka, p.a.) were used.
Scanning electron microscopy (SEM) was performed with a FEI
Quanta 400 ESEM instrument in high vacuum without sput-
tering. The 10 µL of dispersion was dripped on silicon wafer
and dried at room temperature in air. The hydrodynamic diam-
eter and the zeta potential of the nanoparticles were measured
through dynamic light scattering (DLS) by using a Malvern
ZetasizerNano ZS. The polydispersity index (PDI) was below
0.3 in all cases. The concentration of silver was determined by
atomic absorption spectroscopy (AAS; Thermo Electron Corpo-
ration, M-Series). The detection limit was 1 µg L−1. Dialysis
experiments were carried out as described earlier [20,33].
Circular dichroism spectroscopyExperimental details of the circular dichroism (CD) experi-
ments were described earlier [54,63,69]. Briefly, measurements
were carried out with an AVIV 62 A DS CD spectrometer with
a slit width of 1 µm and a scanning step size of 0.1 nm.
Measurements were performed in a 1 mm path length Suprasil®
quartz cuvette which was carefully cleaned between the indi-
vidual measurements with Hellmanex® (Hellma) cuvette
cleaning agent and subsequently with deionized water. Protein
concentrations were kept constant throughout the measure-
ments at 0.52 or 0.052 mg mL−1 and the total volume of the
combined protein/nanoparticle solution was also kept constant
by adding deionized water. Nanoparticles and proteins were in-
cubated for 3 h at room temperature prior to the measurements
to ensure the formation of an "equilibrated" protein corona. All
nanoparticles remained stable in solution on the timescale of
our experiments with no sign of agglomeration.
Scanning transmission X-ray microscopy25 µg mL−1 of O2-free aqueous dispersions with silver nanopar-
ticles were incubated for 24 h with human mesenchymal stem
cells (hMSC) and HaCaT cells (human keratinocytes) grown on
collagen-coated Si3N4-membranes [75]. After incubation the
cells were dried and fixed [75]. The measurements were
performed at the PolLux scanning transmission soft X-ray mi-
croscopy (STXM) microscope at the Swiss Light Source.
Details on the microscope and the beam line are given in [143]
and [137]. Images were recorded at selected photon energies
between 270 and 550 eV. Image processing was carried out by
using the aXis2000 software (http://unicorn.mcmaster.ca/
aXis2000.html).
Biological studiesHuman mesenchymal stem cells were cultured and incubated as
reported earlier [77,78]. Astrocytes were cultured and incu-
bated as reported earlier [108,109]. For genotoxicity assays, we
used three different permanent Chinese hamster cell lines
(CHO9, CHOK1 V79B). Cells were cultivated in McCoy’s 5A
Medium supplemented with 10% fetal calf serum, penicillin
(100 units mL−1), streptomycin (100 µg mL−1), and L-glutamin
(7.5 mL L−1). Cells, cell culture conditions and the preparation
of metaphase chromosomes were described earlier [144,145].
Metaphase plates scored for sister-chromatid exchanges are
stained by using the Fluorescence-plus-Giemsa (FPG) protocol.
Briefly, the slides from cells grown in 20 Mol-6 for two rounds
of DNA replication were incubated for 8 min in Hoechst 33258
(4.5 mg mL−1 in PBS) followed by UV (260 nm) irradiation at
60 °C and finally staining with Giemsa (5%). All other
metaphases were uniformly stained with Giemsa. A BX-60
fluorescence microscope (Olympus Optical Co, Japan) was used
for scoring CA and SCE from metaphase spreads. Double-
strand breaks were induced either by addition of bleomycin to
cultured cells for 12 h at a final concentration of 100 µg mL−1
or by irradiation with X-rays at 1 Gy. Detection with antibodies
was performed as described [145] using anti-γ-H2AX primary
antibody (1:400) (Millipore, USA) and Alexa-Fluor®594-
conjugated goat anti-mouse secondary antibody (1:2000) (Invit-
rogen, Darmstadt). The cells were mounted in Vectashield
(Invitrogen, Darmstadt).
Details on the in vivo intratracheal rat installation experiments
are given in [124]. Details on the experiments with precision-
cut lung slices (PCLS) are given in [126]. Details on the triple-

Beilstein J. Nanotechnol. 2014, 5, 1944–1965.
1962
cell 3D culture are described in [125,127-129]. Details on the
interaction of silver nanoparticles with the human skin barrier
and keratinocytes are described in [135,137,139].
AcknowledgementsWe thank the Deutsche Forschungsgemeinschaft für generous
funding within the Priority Program BioNanoResponses (SPP
1313) and the Zentrum für Wasser und Umweltforschung
(ZWU) of the University of Duisburg-Essen for financial
support. E. M. Luther would like to thank the Hans-Böckler-
Stiftung (Düsseldorf, Germany) for a Ph.D. fellowship. B.
Rothen-Rutishauser and F. Herzog acknowledge support by the
Federal Office of Public Health and the Adolphe Merkle Foun-
dation.
AuthorsSebastian Ahlberg1, Alexandra Antonopulos2, Jörg Diendorf3,
Ralf Dringen4, Matthias Epple3*, Rebekka Flöck2, Wolfgang
Goedecke2, Christina Graf5, Nadine Haberl6, Jens Helmlinger3,
Fabian Herzog7, Frederike Heuer2, Stephanie Hirn6, Christian
Johannes2, Stefanie Kittler3, Manfred Köller8, Katrin Korn2,
Wolfgang G. Kreyling9, Fritz Krombach6, Jürgen Lademann1,
Kateryna Loza3, Eva M. Luther4,10, Marcelina Malissek11,
Martina C. Meinke1, Daniel Nordmeyer5, Anne Pailliart2, Jörg
Raabe12, Fiorenza Rancan1, Barbara Rothen-Rutishauser7,
Eckart Rühl5, Carsten Schleh13, Andreas Seibel2, Christina
Sengstock8, Lennart Treuel11,14, Annika Vogt1, Katrin Weber2
and Reinhard Zellner11
Addresses1Department of Dermatology and Allergy, Charité-
Universitätsmedizin Berlin, Berlin, Germany, 2Genetics and
Center for Medical Biotechnology (ZMB), University of Duis-
burg-Essen, Universitaetsstr. 5–7, 45117 Essen, Germany,3Inorganic Chemistry and Center for Nanointegration Duisburg-
Essen (CeNIDE), University of Duisburg-Essen, Universi-
taetsstr. 5–7, 45117 Essen, Germany, 4Center for Biomolecular
Interactions Bremen and Center for Environmental Research
and Sustainable Technology, Faculty 2 (Biology/Chemistry),
University of Bremen, PO. Box 330440, 28334 Bremen,
Germany, 5Free University of Berlin, Physical and Theoretical
Chemistry, Takustr. 3, 14195 Berlin, Germany, 6Walter Brendel
Centre of Experimental Medicine, Ludwig-Maximilians-
Universität München, 81377 Munich, Germany, 7Adolphe
Merkle Institute, Université de Fribourg, 1723 Marly, Switzer-
land, 8Bergmannsheil University Hospital/Surgical Research,
Ruhr-University Bochum, Bürkle-de-la-Camp-Platz 1, 44789
Bochum, Germany, 9Institute of Epidemiology 2 and Institute
of Lung Biology and Disease, Helmholtz Center Munich, 85764
Neuherberg/Munich, Germany, 10nanoTherics Ltd, Innovation
Centre 4, Keele University Science and Business Park, Keele,
Staffordshire, ST5 5NL, United Kingdom, 11Physical Chem-
istry, University of Duisburg-Essen, Universitaetsstr. 5–7,
45117 Essen, Germany, 12Swiss Light Source, Paul Scherrer
Institut (PSI), 5232 Villigen, Switzerland, 13Abteilung Gesund-
heitsschutz, Berufsgenossenschaft Holz und Metall, 81241
Munich, Germany and 14Fraunhofer ICT-IMM, Carl-Zeiss-Str.
18–20, 55219 Mainz, Germany
References1. Chernousova, S.; Epple, M. Angew. Chem., Int. Ed. 2013, 52,
1636–1653. doi:10.1002/anie.2012059232. Galdiero, S.; Falanga, A.; Vitiello, M.; Cantisani, M.; Marra, V.;
Galdiero, M. Molecules 2011, 16, 8894–8918.doi:10.3390/molecules16108894
3. Beattie, M.; Taylor, J. J. Clin. Nurs. 2011, 20, 2098–2108.doi:10.1111/j.1365-2702.2010.03561.x
4. Simoncic, B.; Tomsic, B. Text. Res. J. 2010, 80, 1721–1737.doi:10.1177/0040517510363193
5. Chaloupka, K.; Malam, Y.; Seifalian, A. M. Trends Biotechnol. 2010,28, 580–588. doi:10.1016/j.tibtech.2010.07.006
6. Vasilev, K.; Cook, J.; Griesser, H. J. Expert Rev. Med. Devices 2009,6, 553–567. doi:10.1586/erd.09.36
7. Alexander, J. W. Surg. Infect. 2009, 10, 289–292.doi:10.1089/sur.2008.9941
8. Chen, X.; Schluesener, H. J. Toxicol. Lett. 2008, 176, 1–12.doi:10.1016/j.toxlet.2007.10.004
9. Dowsett, C. Nurs. Stand. 2004, 19, 56–60.doi:10.7748/ns2004.10.19.7.56.c3736
10. Klasen, H. J. Burns 2000, 26, 131–138.doi:10.1016/S0305-4179(99)00116-3
11. Klasen, H. J. Burns 2000, 26, 117–130.doi:10.1016/S0305-4179(99)00108-4
12. Nowack, B.; Ranville, J. F.; Diamond, S.; Gallego-Urrea, J. A.;Metcalfe, C.; Rose, J.; Horne, N.; Koelmans, A. A.; Klaine, S. J.Environ. Toxicol. Chem. 2012, 31, 50–59. doi:10.1002/etc.726
13. Hansen, S. F.; Baun, A. Nat. Nanotechnol. 2012, 7, 409–411.doi:10.1038/nnano.2012.115
14. Nowack, B.; Krug, H. F.; Height, M. Environ. Sci. Technol. 2011, 45,1177–1183. doi:10.1021/es103316q
15. Gottschalk, F.; Nowack, B. J. Environ. Monit. 2011, 13, 1145–1155.doi:10.1039/c0em00547a
16. Quadros, M. E.; Marr, L. C. J. Air Waste Manage. Assoc. 2010, 60,770–781. doi:10.3155/1047-3289.60.7.770
17. Marambio-Jones, C.; Hoek, E. M. V. J. Nanopart. Res. 2010, 12,1531–1551. doi:10.1007/s11051-010-9900-y
18. Wijnhoven, S. W. P.; Peijnenburg, W. J. G. M.; Herberts, C. A.;Hagens, W. I.; Oomen, A. G.; Heugens, E. H. W.; Roszek, B.;Bisschops, J.; Gosens, I.; Van De Meent, D.; Dekkers, S.;De Jong, W. H.; van Zijverden, M.; Sips, A. J. A. M.; Geertsma, R. E.Nanotoxicology 2009, 3, 109–138. doi:10.1080/17435390902725914
19. Panyala, N. R.; Pena-Mendez, E. M.; Havel, J. J. Appl. Biomed. 2008,6, 117–129.
20. Loza, K.; Diendorf, J.; Greulich, C.; Ruiz-Gonzales, L.;Gonzalez-Calbet, J. M.; Vallet-Regi, M.; Köller, M.; Epple, M.J. Mater. Chem. B 2014, 2, 1634–1643. doi:10.1039/c3tb21569e
21. Xia, Y.; Xiong, Y.; Lim, B.; Skrabalak, S. E. Angew. Chem., Int. Ed.2009, 48, 60–103. doi:10.1002/anie.200802248

Beilstein J. Nanotechnol. 2014, 5, 1944–1965.
1963
22. Kittler, S.; Greulich, C.; Köller, M.; Epple, M.Materialwiss. Werkstofftech. 2009, 40, 258–264.doi:10.1002/mawe.200800437
23. Wiley, B.; Sun, Y.; Mayers, B.; Xia, Y. Chem. – Eur. J. 2005, 11,454–463. doi:10.1002/chem.200400927
24. Im, S. H.; Lee, Y. T.; Wiley, B.; Xia, Y. Angew. Chem., Int. Ed. 2005,44, 2154–2157. doi:10.1002/anie.200462208
25. Wang, Y.; Zheng, Y.; Huang, C. Z.; Xia, Y. J. Am. Chem. Soc. 2013,135, 1941–1951. doi:10.1021/ja311503q
26. Skrabalak, S. E.; Au, L.; Li, X.; Xia, Y. Nat. Protoc. 2007, 2,2182–2190. doi:10.1038/nprot.2007.326
27. Panfilova, E. V.; Khlebtsov, B. N.; Burov, A. M.; Khlebtsov, N. G.Colloid J. 2012, 74, 99–109. doi:10.1134/S1061933X11060147
28. Wang, H.; Qiao, X.; Chen, J.; Ding, S. Colloids Surf., A 2005, 256,111–115. doi:10.1016/j.colsurfa.2004.12.058
29. Banerjee, S.; Loza, K.; Meyer-Zaika, W.; Prymak, O.; Epple, M.Chem. Mater. 2014, 26, 951–957. doi:10.1021/cm4025342
30. Ho, C.-M.; Yau, S. K.-W.; Lok, C.-N.; So, M.-H.; Che, C.-M.Chem. – Asian J. 2010, 5, 285–293. doi:10.1002/asia.200900387
31. Liu, J.; Wang, Z.; Liu, F. D.; Kane, A. B.; Hurt, R. H. ACS Nano 2012,6, 9887–9899. doi:10.1021/nn303449n
32. Liu, J.; Hurt, R. H. Environ. Sci. Technol. 2010, 44, 2169–2175.doi:10.1021/es9035557
33. Kittler, S.; Greulich, C.; Diendorf, J.; Köller, M.; Epple, M.Chem. Mater. 2010, 22, 4548–4554. doi:10.1021/cm100023p
34. Xiu, Z.-m.; Zhang, Q.-b.; Puppala, H. L.; Colvin, V. L.; Alvarez, P. J. J.Nano Lett. 2012, 12, 4271–4275. doi:10.1021/nl301934w
35. Hahn, A.; Fuhlrott, J.; Loos, A.; Barcikowski, S. J. Nanopart. Res.2012, 14, No. 686. doi:10.1007/s11051-011-0686-3
36. Boenigk, J.; Beisser, D.; Zimmermann, S.; Bock, C.; Jakobi, J.;Grabner, D.; Großmann, L.; Rahmann, S.; Barcikowski, S.; Sures, B.PLoS One 2014, 9, e95340. doi:10.1371/journal.pone.0095340
37. Sotiriou, G. A.; Pratsinis, S. E. Environ. Sci. Technol. 2010, 44,5649–5654. doi:10.1021/es101072s
38. Sotiriou, G. A.; Pratsinis, S. E. Curr. Opin. Chem. Eng. 2011, 1, 3–10.doi:10.1016/j.coche.2011.07.001
39. Levard, C.; Reinsch, B. C.; Michel, F. M.; Oumahi, C.; Lowry, G. V.;Brown, G. E., Jr. Environ. Sci. Technol. 2011, 45, 5260–5266.doi:10.1021/es2007758
40. Liu, J.; Sonshine, D. A.; Shervani, S.; Hurt, R. H. ACS Nano 2010, 4,6903–6913. doi:10.1021/nn102272n
41. Grade, S.; Eberhard, J.; Jakobi, J.; Winkel, A.; Stiesch, M.;Barcikowski, S. Gold Bull. 2014, 47, 83–93.doi:10.1007/s13404-013-0125-6
42. Caballero-Díaz, E.; Pfeiffer, C.; Kastl, L.; Rivera-Gil, P.; Simonet, B.;Valcárcel, M.; Jiménez-Lamana, J.; Laborda, F.; Parak, W. J.Part. Part. Syst. Charact. 2013, 30, 1079–1085.doi:10.1002/ppsc.201300215
43. Zhang, H.; Smith, J. A.; Oyanedel-Craver, V. Water Res. 2012, 46,691–699. doi:10.1016/j.watres.2011.11.037
44. Loza, K.; Sengstock, C.; Chernousova, S.; Koeller, M.; Epple, M.RSC Adv. 2014, 4, 35290–35297. doi:10.1039/C4RA04764H
45. Tenzer, S.; Docter, D.; Kuharev, J.; Musyanovych, A.; Fetz, V.;Hecht, R.; Schlenk, F.; Fischer, D.; Kiouptsi, K.; Reinhardt, C.;Landfester, K.; Schild, H.; Maskos, M.; Knauer, S. K.; Stauber, R. H.Nat. Nanotechnol. 2013, 8, 772–781. doi:10.1038/nnano.2013.181
46. Walkey, C. D.; Chan, W. C. W. Chem. Soc. Rev. 2012, 41,2780–2799. doi:10.1039/c1cs15233e
47. Monopoli, M. P.; Bombelli, F. B.; Dawson, K. A. Nat. Nanotechnol.2011, 6, 11–12. doi:10.1038/nnano.2010.267
48. Kittler, S.; Greulich, C.; Gebauer, J. S.; Diendorf, J.; Treuel, L.;Ruiz, L.; Gonzalez-Calbet, J. M.; Vallet-Regi, M.; Zellner, R.;Köller, M.; Epple, M. J. Mater. Chem. 2010, 20, 512–518.doi:10.1039/b914875b
49. Treuel, L.; Brandholt, S.; Maffre, P.; Wiegele, S.; Shang, L.;Nienhaus, G. U. ACS Nano 2014, 8, 503–513.doi:10.1021/nn405019v
50. Salvati, A.; Pitek, A. S.; Monopoli, M. P.; Prapainop, K.;Bombelli, F. B.; Hristov, D. R.; Kelly, P. M.; Åberg, C.; Mahon, E.;Dawson, K. A. Nat. Nanotechnol. 2013, 8, 137–143.doi:10.1038/nnano.2012.237
51. Mirshafiee, V.; Mahmoudi, M.; Lou, K.; Cheng, J.; Kraft, M. L.Chem. Commun. 2013, 49, 2557–2559. doi:10.1039/c3cc37307j
52. Kozlova, D.; Epple, M. BioNanoMater. 2013, 14, 161–170.doi:10.1515/bnm-2013-0020
53. Lesniak, A.; Fenaroli, F.; Monopoli, M. R.; Åberg, C.; Dawson, K. A.;Salvati, A. ACS Nano 2012, 6, 5845–5857. doi:10.1021/nn300223w
54. Grass, S.; Treuel, L. J. Nanopart. Res. 2014, 16, No. 2254.doi:10.1007/s11051-014-2254-0
55. Treuel, L.; Malissek, M. Interactions of nanoparticles with proteins:Determination of equilibrium constants. In Cellular and SubcellularNanotechnology - Methods and Protocols; Weissig, V.; Elbayoumi, T.;Olsen, M., Eds.; Springer Science+Business Media: New York, NY,USA, 2013; pp 225–235.
56. Treuel, L.; Nienhaus, G. U. Biophys. Rev. 2012, 4, 137–147.doi:10.1007/s12551-012-0072-0
57. Tenzer, S.; Docter, D.; Rosfa, S.; Wlodarski, A.; Kuharev, J.;Rekik, A.; Knauer, S. K.; Bantz, C.; Nawroth, T.; Bier, C.;Sirirattanapan, J.; Mann, W.; Treuel, L.; Zellner, R.; Maskos, M.;Schild, H.; Stauber, R. H. ACS Nano 2011, 5, 7155–7167.doi:10.1021/nn201950e
58. Kreyling, W. G.; Fertsch-Gapp, S.; Schäffler, M.; Johnston, B. D.;Haberl, N.; Pfeiffer, C.; Diendorf, J.; Schleh, C.; Hirn, S.;Semmler-Behnke, M.; Epple, M.; Parak, W. J.Beilstein J. Nanotechnol. 2014, 5, 1699–1711.doi:10.3762/bjnano.5.180
59. Gebauer, J. S.; Malissek, M.; Simon, S.; Knauer, S. K.; Maskos, M.;Stauber, R. H.; Peukert, W.; Treuel, L. Langmuir 2012, 28,9673–9679. doi:10.1021/la301104a
60. Shang, L.; Wang, Y.; Jiang, J.; Dong, S. Langmuir 2007, 23,2714–2721. doi:10.1021/la062064e
61. Röcker, C.; Pötzl, M.; Zhang, F.; Parak, W. J.; Nienhaus, G. U.Nat. Nanotechnol. 2009, 4, 577–580. doi:10.1038/nnano.2009.195
62. Maffre, P.; Nienhaus, K.; Amin, F.; Parak, W. J.; Nienhaus, G. U.Beilstein J. Nanotechnol. 2011, 2, 374–383. doi:10.3762/bjnano.2.43
63. Treuel, L.; Malissek, M.; Gebauer, J. S.; Zellner, R. ChemPhysChem2010, 11, 3093–3099. doi:10.1002/cphc.201000174
64. Zhou, H. S.; Aoki, S.; Honma, I.; Hirasawa, M.; Nagamune, T.;Komiyama, H. Chem. Commun. 1997, 605–606.doi:10.1039/a607451k
65. Peng, Z. G.; Hidajat, K.; Uddin, M. S. Colloids Surf., B 2004, 35,169–174. doi:10.1016/j.colsurfb.2004.03.010
66. Aubin-Tam, M.-E.; Hamad-Schifferli, K. Langmuir 2005, 21,12080–12084. doi:10.1021/la052102e
67. Medintz, I. L.; Konnert, J. H.; Clapp, A. R.; Stanish, I.; Twigg, M. E.;Mattoussi, H.; Mauro, J. M.; Deschamps, J. R.Proc. Natl. Acad. Sci. U. S. A. 2004, 101, 9612–9617.doi:10.1073/pnas.0403343101
68. Jiang, X.; Jiang, J.; Jin, Y.; Wang, E.; Dong, S. Biomacromolecules2005, 6, 46–53. doi:10.1021/bm049744l

Beilstein J. Nanotechnol. 2014, 5, 1944–1965.
1964
69. Treuel, L.; Malissek, M.; Grass, S.; Diendorf, J.; Mahl, D.;Meyer-Zaika, W.; Epple, M. J. Nanopart. Res. 2012, 14, No. 1102.doi:10.1007/s11051-012-1102-3
70. Treuel, L.; Jiang, X.; Nienhaus, G. U. J. R. Soc., Interface 2013, 10,No. 20120939. doi:10.1098/rsif.2012.0939
71. Rostek, A.; Mahl, D.; Epple, M. J. Nanopart. Res. 2011, 13,4809–4814. doi:10.1007/s11051-011-0456-2
72. Hitchcock, A. P.; Dynes, J. J.; Johansson, G.; Wang, J.; Botton, G.Micron 2008, 39, 741–748. doi:10.1016/j.micron.2007.09.010
73. Ade, H.; Hitchcock, A. P. Polymer 2008, 49, 643–675.doi:10.1016/j.polymer.2007.10.030
74. Eichert, D.; Gregoratti, L.; Kaulich, B.; Marcello, A.; Melpignano, P.;Quaroni, L.; Kiskinova, M. Anal. Bioanal. Chem. 2007, 389,1121–1132. doi:10.1007/s00216-007-1532-4
75. Sedlmair, J.; Gleber, S.-C.; Mert, S. O.; Bertilson, M.; von Hofsten, O.;Thieme, J.; Pfohl, T. Microsc. Microanal. 2011, 17, 991–1001.doi:10.1017/S1431927611012165
76. Brandenberger, C.; Mühlfeld, C.; Ali, Z.; Lenz, A.-G.; Schmid, O.;Parak, W. J.; Gehr, P.; Rothen-Rutishauser, B. Small 2010, 6,1669–1678. doi:10.1002/smll.201000528
77. Greulich, C.; Diendorf, J.; Simon, T.; Eggeler, G.; Epple, M.; Köller, M.Acta Biomater. 2011, 7, 347–354. doi:10.1016/j.actbio.2010.08.003
78. Greulich, C.; Diendorf, J.; Geßmann, J.; Simon, T.; Habijan, T.;Eggeler, G.; Schildhauer, T. A.; Epple, M.; Köller, M. Acta Biomater.2011, 7, 3505–3514. doi:10.1016/j.actbio.2011.05.030
79. Dausend, J.; Musyanovych, A.; Dass, M.; Walther, P.;Schrezenmeier, H.; Landfester, K.; Mailänder, V. Macromol. Biosci.2008, 8, 1135–1143. doi:10.1002/mabi.200800123
80. Harush-Frenkel, O.; Debotton, N.; Benita, S.; Altschuler, Y.Biochem. Biophys. Res. Commun. 2007, 353, 26–32.doi:10.1016/j.bbrc.2006.11.135
81. Canton, I.; Battaglia, G. Chem. Soc. Rev. 2012, 41, 2718–2739.doi:10.1039/c2cs15309b
82. Sahay, G.; Alakhova, D. Y.; Kabanov, A. V. J. Controlled Release2010, 145, 182–195. doi:10.1016/j.jconrel.2010.01.036
83. Doherty, G. J.; McMahon, H. T. Annu. Rev. Biochem. 2009, 78,857–902. doi:10.1146/annurev.biochem.78.081307.110540
84. Rothen-Rutishauser, B.; Blank, F.; Mühlfeld, C.; Gehr, P.Nanoparticle-cell membrane interactions. Particle-lung interactions;Informa Healthcare: New York, NY, USA, 2009; pp 226–242.
85. Pelka, J.; Gehrke, H.; Esselen, M.; Türk, M.; Crone, M.; Bräse, S.;Muller, T.; Blank, H.; Send, W.; Zibat, V.; Brenner, P.; Schneider, R.;Gerthsen, D.; Marko, D. Chem. Res. Toxicol. 2009, 22, 649–659.doi:10.1021/tx800354g
86. Heymann, J. A. W.; Shi, D.; Kim, S.; Bliss, D.; Milne, J. L. S.;Subramaniam, S. J. Struct. Biol. 2009, 166, 1–7.doi:10.1016/j.jsb.2008.11.005
87. Hu, L.; Mao, Z.; Gao, C. J. Mater. Chem. 2009, 19, 3108–3115.doi:10.1039/b815958k
88. Rivera Gil, P.; Nazarenus, M.; Ashraf, S.; Parak, W. J. Small 2012, 8,943–948. doi:10.1002/smll.201101780
89. Nam, H. Y.; Kwon, S. M.; Chung, H.; Lee, S.-Y.; Kwon, S.-H.;Jeon, H.; Kim, Y.; Park, J. H.; Kim, J.; Her, S.; Oh, Y.-K.; Kwon, I. C.;Kim, K.; Jeong, S. Y. J. Controlled Release 2009, 135, 259–267.doi:10.1016/j.jconrel.2009.01.018
90. Fröhlich, E.; Samberger, C.; Kueznik, T.; Absenger, M.; Roblegg, E.;Zimmer, A.; Pieber, T. R. J. Toxicol. Sci. 2009, 34, 363–375.doi:10.2131/jts.34.363
91. Berry, C. C.; de la Fuente, J. M.; Mullin, M.; Chu, S. W. L.;Curtis, A. S. G. IEEE Trans. NanoBiosci. 2007, 6, 262–269.doi:10.1109/TNB.2007.908973
92. Cartiera, M. S.; Johnson, K. M.; Rajendran, V.; Caplan, M. J.;Saltzman, W. M. Biomaterials 2009, 30, 2790–2798.doi:10.1016/j.biomaterials.2009.01.057
93. Alberts, B. Molecular biology of the cell, 4th ed.; Garland Science:New York, 2002.
94. Panyam, J.; Labhasetwar, V. Adv. Drug Delivery Rev. 2003, 55,329–347. doi:10.1016/S0169-409X(02)00228-4
95. Liu, W.; Wu, Y.; Wang, C.; Li, H. C.; Wang, T.; Liao, C. Y.; Cui, L.;Zhou, Q. F.; Yan, B.; Jiang, G. B. Nanotoxicology 2010, 4, 319–330.doi:10.3109/17435390.2010.483745
96. Sharma, H. S.; Sharma, A. CNS Neurol. Disord.: Drug Targets 2012,11, 65–80. doi:10.2174/187152712799960817
97. Sharma, H. S.; Hussain, S.; Schlager, J.; Ali, S. F.; Sharma, A.Acta Neurochir. Suppl. 2010, 106, 359–364.doi:10.1007/978-3-211-98811-4_65
98. Tang, J.; Xiong, L.; Wang, S.; Wang, J.; Liu, L.; Li, J.; Yuan, F.; Xi, T.J. Nanosci. Nanotechnol. 2009, 9, 4924–4932.doi:10.1166/jnn.2009.1269
99. Lee, J. H.; Kim, Y. S.; Song, K. S.; Ryu, H. R.; Sung, J. H.; Park, J. D.;Park, H. M.; Song, N. W.; Shin, B. S.; Marshak, D.; Ahn, K.; Lee, J. E.;Yu, I. J. Part. Fibre Toxicol. 2013, 10, No. 36.doi:10.1186/1743-8977-10-36
100.Mathiisen, T. M.; Lehre, K. P.; Danbolt, N. C.; Ottersen, O. P. Glia2010, 58, 1094–1103. doi:10.1002/glia.20990
101.Lin, C.-C. J.; Deneen, B. Semin. Pediatr. Neurol. 2013, 20, 236–241.doi:10.1016/j.spen.2013.10.004
102.Dringen, R.; Bishop, G. M.; Koeppe, M.; Dang, T. N.; Robinson, S. R.Neurochem. Res. 2007, 32, 1884–1890.doi:10.1007/s11064-007-9375-0
103.Hohnholt, M. C.; Dringen, R. Biochem. Soc. Trans. 2013, 41,1588–1592.
104.Hohnholt, M. C.; Geppert, M.; Luther, E. M.; Petters, C.; Bulcke, F.;Dringen, R. Neurochem. Res. 2013, 38, 227–239.doi:10.1007/s11064-012-0930-y
105.Tiffany-Castiglion, E.; Qian, Y. NeuroToxicology 2001, 22, 577–592.doi:10.1016/S0161-813X(01)00050-X
106.Bulcke, F.; Thiel, K.; Dringen, R. Nanotoxicology 2014, 8, 775–785.doi:10.3109/17435390.2013.829591
107.Lamkowsky, M.-C.; Geppert, M.; Schmidt, M. M.; Dringen, R.J. Biomed. Mater. Res., Part A 2012, 100, 323–334.doi:10.1002/jbm.a.33263
108.Luther, E. M.; Koehler, Y.; Diendorf, J.; Epple, M.; Dringen, R.Nanotechnology 2011, 22, 375101.doi:10.1088/0957-4484/22/37/375101
109.Luther, E. M.; Schmidt, M. M.; Diendorf, J.; Epple, M.; Dringen, R.Neurochem. Res. 2012, 37, 1639–1648.doi:10.1007/s11064-012-0767-4
110.Asharani, P. V.; Low Kah Mun, G.; Hande, M. P.; Valiyaveettil, S.ACS Nano 2009, 3, 279–290. doi:10.1021/nn800596w
111.Obe, G.; Pfeiffer, P.; Savage, J. R. K.; Johannes, C.; Goedecke, W.;Jeppesen, P.; Natarajan, A. T.; Martinez-López, W.; Folle, G. A.;Drets, M. E. Mutat. Res. 2002, 504, 17–36.doi:10.1016/S0027-5107(02)00076-3
112.Wojcik, A.; Obe, G. Sister-Chromatid Exchanges. In ChromosomalAlterations; Obe, G.; Vijayalaxami, Eds.; Springer: Heidelberg, 2007;pp 271–283.

Beilstein J. Nanotechnol. 2014, 5, 1944–1965.
1965
113.Natarajan, A. T.; Palitti, F. Mutat. Res. 2008, 657, 3–7.doi:10.1016/j.mrgentox.2008.08.017
114.Povirk, L. F. Mutat. Res. 1996, 355, 71–89.doi:10.1016/0027-5107(96)00023-1
115.Roots, R.; Holley, W.; Chatterjee, A.; Irizarry, M.; Kraft, G.Int. J. Radiat. Biol. 1990, 58, 55–69. doi:10.1080/09553009014551431
116.Pitié, M.; Pratviel, G. Chem. Rev. 2010, 110, 1018–1059.doi:10.1021/cr900247m
117.Kinner, A.; Wu, W.; Staudt, C.; Iliakis, G. Nucleic Acids Res. 2008, 36,5678–5694. doi:10.1093/nar/gkn550
118.Rothkamm, K.; Horn, S. Ann. Ist. Super. Sanita 2009, 45, 265–271.119.Watson, M. B.; Lind, M. J.; Cawkwell, L. Anti-Cancer Drugs 2007, 18,
749–754. doi:10.1097/CAD.0b013e3280a02f43120.Lim, H. K.; Asharani, P. V.; Hande, M. P. Front. Genet. 2012, 3,
No. 104. doi:10.3389/fgene.2012.00104121.Butryn, R. K.; Smith, K. S.; Adams, E. G.; Abraham, I.; Stackpole, J.;
Sampson, K. E.; Bhuyan, B. K. Cancer Chemother. Pharmacol. 1994,34, 44–50. doi:10.1007/BF00686110
122.Schluesener, J. K.; Schluesener, H. J. Arch. Toxicol. 2013, 87,569–576. doi:10.1007/s00204-012-1007-z
123.Teow, Y.; Asharani, P. V.; Hande, M. P.; Valiyaveettil, S.Chem. Commun. 2011, 47, 7025–7038. doi:10.1039/c0cc05271j
124.Haberl, N.; Hirn, S.; Wenk, A.; Diendorf, J.; Epple, M.; Johnston, B. D.;Krombach, F.; Kreyling, W. G.; Schleh, C. Beilstein J. Nanotechnol.2013, 4, 933–940. doi:10.3762/bjnano.4.105
125.Herzog, F.; Loza, K.; Balog, S.; Clift, M. J. D.; Epple, M.; Gehr, P.;Petri-Fink, A.; Rothen-Rutishauser, B. Beilstein J. Nanotechnol. 2014,5, 1357–1370. doi:10.3762/bjnano.5.149
126.Hirn, S.; Haberl, N.; Loza, K.; Epple, M.; Schleh, C.; Kreyling, W. G.;Rothen-Rutishauser, B.; Rehberg, M.; Krombach, F.Beilstein J. Nanotechnol. 2014, 5, in press.
127.Rothen-Rutishauser, B. M.; Kiama, S. G.; Gehr, P.Am. J. Respir. Cell Mol. Biol. 2005, 32, 281–289.doi:10.1165/rcmb.2004-0187OC
128.Blank, F.; Rothen-Rutishauser, B.; Gehr, P.Am. J. Respir. Cell Mol. Biol. 2007, 36, 669–677.doi:10.1165/rcmb.2006-0234OC
129.Lenz, A. G.; Karg, E.; Lentner, B.; Dittrich, V.; Brandenberger, C.;Rothen-Rutishauser, B.; Schulz, H.; Ferron, G. A.; Schmid, O.Part. Fibre Toxicol. 2009, 6, No. 32. doi:10.1186/1743-8977-6-32
130.Herzog, F.; Clift, M. J. D.; Piccapietra, F.; Behra, R.; Schmid, O.;Petri-Fink, A.; Rothen-Rutishauser, B. Part. Fibre Toxicol. 2013, 10,No. 11. doi:10.1186/1743-8977-10-11
131.Gangwal, S.; Brown, J. S.; Wang, A.; Houck, K. A.; Dix, D. J.;Kavlock, R. J.; Cohen Hubal, E. A. Environ. Health Perspect. 2011,119, 1539–1546. doi:10.1289/ehp.1103750
132.Kim, J. S.; Kuk, E.; Yu, K. N.; Kim, J.-H.; Park, S. J.; Lee, H. J.;Kim, S. H.; Park, Y. K.; Park, Y. H.; Hwang, C.-Y.; Kim, Y.-K.;Lee, Y.-S.; Jeong, D. H.; Cho, M.-H. Nanomedicine 2007, 3, 95–101.doi:10.1016/j.nano.2006.12.001
133.Rai, M.; Yadav, A.; Gade, A. Biotechnol. Adv. 2009, 27, 76–83.doi:10.1016/j.biotechadv.2008.09.002
134.Mahe, B.; Vogt, A.; Liard, C.; Duffy, D.; Abadie, V.; Bonduelle, O.;Boissonnas, A.; Sterry, W.; Verrier, B.; Blume-Peytavi, U.;Combadiere, B. J. Invest. Dermatol. 2009, 129, 1156–1164.doi:10.1038/jid.2008.356
135.Vogt, A.; Combadiere, B.; Hadam, S.; Stieler, K. M.; Lademann, J.;Schaefer, H.; Autran, B.; Sterry, W.; Blume-Peytavi, U.J. Invest. Dermatol. 2006, 126, 1316–1322. doi:10.1038/sj.jid.5700226
136.Foldbjerg, R.; Olesen, P.; Hougaard, M.; Dang, D. A.; Hoffmann, H. J.;Autrup, H. Toxicol. Lett. 2009, 190, 156–162.doi:10.1016/j.toxlet.2009.07.009
137.Graf, C.; Meinke, M.; Gao, Q.; Hadam, S.; Raabe, J.; Sterry, W.;Blume-Peytavi, U.; Lademann, J.; Rühl, E.; Vogt, A. J. Biomed. Opt.2009, 14, 021015. doi:10.1117/1.3078811
138.Vogt, A.; Rancan, F.; Ahlberg, S.; Nazemi, B.; Choe, C. S.;Darvin, M. E.; Blume-Peytavi, U.; Loza, K.; Diendorf, J.; Epple, M.;Graf, C.; Rühl, E.; Meinke, M. C.; Lademann, J.Beilstein J. Nanotechnol. 2014, 5, in press.
139.Ahlberg, S.; Meinke, M. C.; Werner, L.; Epple, M.; Diendorf, J.;Blume-Peytavi, U.; Lademann, J.; Vogt, A.; Rancan, F.Eur. J. Pharm. Biopharm. 2014, in press.doi:10.1016/j.ejpb.2014.07.012
140.Samberg, M. E.; Oldenburg, S. J.; Monteiro-Riviere, N. A.Environ. Health Perspect. 2010, 118, 407–413.doi:10.1289/ehp.0901398
141.Miura, N.; Shinohara, Y. Biochem. Biophys. Res. Commun. 2009,390, 733–737. doi:10.1016/j.bbrc.2009.10.039
142.Greulich, C.; Braun, D.; Peetsch, A.; Diendorf, J.; Siebers, B.;Epple, M.; Köller, M. RSC Adv. 2012, 2, 6981–6987.doi:10.1039/c2ra20684f
143.Degueldre, C.; Raabe, J.; Kuri, G.; Abolhassani, S. Talanta 2008, 75,402–406. doi:10.1016/j.talanta.2007.11.052
144.Martinez-López, W.; Porro, V.; Folle, G. A.; Mendez-Acuña, L.;Savage, J. R. K.; Obe, G. Genet. Mol. Biol. 2000, 23, 1071–1076.doi:10.1590/S1415-47572000000400053
145.Kuhfittig-Kulle, S.; Feldmann, E.; Odersky, A.; Kuliczkowska, A.;Goedecke, W.; Eggert, A.; Pfeiffer, P. Mutagenesis 2007, 22,217–233. doi:10.1093/mutage/gem007
License and TermsThis is an Open Access article under the terms of the
Creative Commons Attribution License
(http://creativecommons.org/licenses/by/2.0), which
permits unrestricted use, distribution, and reproduction in
any medium, provided the original work is properly cited.
The license is subject to the Beilstein Journal of
Nanotechnology terms and conditions:
(http://www.beilstein-journals.org/bjnano)
The definitive version of this article is the electronic one
which can be found at:
doi:10.3762/bjnano.5.205