Investigation of physicochemical characteristics of selected ...
Upload
khangminh22Category
view
4download
0
Physicochemical Characterization and Food Application Potential of Pumpkin
(Cucurbita Sp.) Fruit and Seed Kernel Flours
Monicah Salano Fedha
A thesis submitted in partial fulfilment for the Degree of
Master of Science in Food Science and Postharvest Technology
in the Jomo Kenyatta University of Agriculture and Technology
2008

ii
DECLARATION
This thesis is my original work and has not been presented for a degree in any other
University
Signature.................................................. Date......................................
Monicah Salano Fedha
This thesis has been submitted for examination with our approval as University
supervisors:
1. Signature.............................................. Date.........................................
Prof. Mwanjala A. Mwasaru
JKUAT, Kenya
2. Signature............................................ Date..........................................
Prof. Charles K. Njoroge
JKUAT, Kenya
3. Signature……………………………. Date……………………………
Prof. Nelson O. Ojijo
JKUAT, Kenya

iii
DEDICATION
To my late father, Abraham Fedha Waiti, who was called to rest by our Lord in
November, 2006.
iv
ACKNOWLEDGEMENT I am greatly indebted to several people for the success of this work. I wish to thank
my supervisors, Professor M.A. Mwasaru, Professor C. K. Njoroge and Professor N.
O. Ojijo for their advice, guidance and willingness to listen to me at all times. My
gratitude goes to Mr. Karanja, Mr. Votha of the Department of Food Science and
Postharvest Technology, JKUAT, and Phyllis Ngunjiri of Kenya Industrial Research
and Development Institute (K.I.R.D.I.) for their assistance.
My heartfelt thanks go to my loving husband, Edward, and our children Bill,
Cassandra and Morgan for their support, encouragement, and endurance of my long
absence from home. Not forgetting my dear mum who always called to greet and
cheer me up. My lecturers, colleagues in the Food Science department, and
acquaintances in the JKUAT fraternity deserve my praise because they made my
stay at JKUAT worth remembering.
This work would not have been possible without the financial support of the African
Institute for Capacity Building (AICAD). I am very much grateful to them. I also
thank the Food Science and Nutrition Network of Africa (FOSNNA) for their
exchange programme award which enabled me to do part of my research at
Makerere University, Uganda. In this regard I wish to thank my supervisor in the
Food Science Department at Makerere University, Prof. Joyce Kikafunda, and the
Chief Technician Mr. Benjamin Sentongo for their valuable assistance.
Above all, I thank God my creator for his grace and great mercies.

v
TABLE OF CONTENTS
DEDICATION..................... ........................................................................................................ iii
ACKNOWLEDGEMENT .......................................................................................................... iv
TABLE OF CONTENTS ............................................................................................................. v
LIST OF TABLES............... ......................................................................................................... x
LIST OF FIGURES........... .......................................................................................................... xi
ABSTRACT........................ ......................................................................................................... xv
CHAPTER 1: INTRODUCTION ................................................................................................ 1
1.1. Background of the Study ......................................................................................................... 1
1.2. Problem Statement .................................................................................................................. 4
1.3. Justification............ ................................................................................................................. 5
1.4. Objectives............. ................................................................................................................... 7
1.4.1. Main objective ......... ............................................................................................................. 7
1.4.2. Specific objectives ................................................................................................................ 7
1.5. Hypothesis............... ................................................................................................................ 7
CHAPTER 2: LITERATURE REVIEW .................................................................................... 8
2.1. Crop description ..................................................................................................................... 8
2.2. Importance of pumpkin in the human diet. ............................................................................... 9
2.2.1. Starch content in the fruit...................................................................................................... 9
2.2.2. Micronutrient content in pumpkin fruit and seed kernels ...................................................... 11
2.2.2.1. Vitamins.................. ..................................................................................................... 11
2.2.2.1.1. Stability of carotenoids .............................................................................................. 13
2.2.2.1.2. Role of carotenes in the diet ...................................................................................... 14
2.2.2.1.3. Beta-carotene as a functional food ingredient in wheat products. ............................... 15

vi
2.2.2.2. Minerals.................... ................................................................................................... 16
2.2.3. Proteins and oils in pumpkin seed kernels and their role in human diet ................................ 20
2.3. Technology for processing fruit vegetable into powder ........................................................... 21
2.4. Drying pre-treatments ............................................................................................................. 22
2.4.1. Heat blanching .................................................................................................................... 22
2.4.2. Sulphur dioxide treatment .................................................................................................... 23
CHAPTER 3: MATERIALS AND METHODS ........................................................................ 24
3.1. Research design....... ............................................................................................................... 24
3.2. Materials.................. ............................................................................................................... 24
3.3. Methods…………… .............................................................................................................. 26
3.3.1. Proximate composition of fresh and dried pumpkin fruit. ..................................................... 26
3.3.2. Starch isolation and quantification in raw pumpkin fruits ..................................................... 26
3.3.3. Flour preparation from pumpkin fruits and seed kernels ....................................................... 26
3.3.3.1. Flour from fruits ......................................................................................................... 26
3.3.3.2. Flour from seed kernels ................................................................................................ 27
3.3.4. Physicochemical analysis of fresh and processed pumpkin fruits ......................................... 28
3.3.4.1. Material yield.......... ..................................................................................................... 28
3.3.4.2. β-Carotene content in fresh and dried pumpkin fruits ................................................... 28
3.3.4.3. Analysis of specific minerals ........................................................................................ 31
3.3.5. Extraction and characterization of kernel oils....................................................................... 31
3.3.5.1. Lipid extraction........ .................................................................................................... 31
3.3.5.2. Specific gravity and refractive index ............................................................................ 32
3.3.5.3. Peroxide value.......... .................................................................................................... 32
3.3.5.4. Acid value................. ................................................................................................... 34

vii
3.3.5.6. Saponification value ..................................................................................................... 34
3.3.5.7. Fatty acid profile ......................................................................................................... 35
3.3.6.1. Extraction of proteins ................................................................................................... 36
3.3.6.2. Water and oil absorption capacity ................................................................................ 36
3.3.6.3. Emulsifying activity and emulsion stability .................................................................. 36
3.3.6.4. Foaming capacity and foam stability ............................................................................ 37
3.3.6.5. Gelation properties ....................................................................................................... 37
3.3.6.6. Nitrogen solubility ....................................................................................................... 38
3.3.6.7. The pH of the pumpkin seed flours .............................................................................. 38
3.3.8. Food application potential of pumpkin flour ........................................................................ 39
3.3.8.1. Cake preparation ......................................................................................................... 39
3.3.8.2. Beta-carotene content, colour and sensory evaluation of cake ....................................... 40
3.3.10. Statistical analysis. ............................................................................................................. 40
CHAPTER 4: RESULTS AND DISCUSSION .......................................................................... 41
4.1. Proximate composition of fresh and processed pumpkin fruits and seeds ................................ 41
4.1.1. Moisture content of fruits and seeds under different treatments ............................................ 41
4.1.2. Comparison of moisture content in fruits of two pumpkin species........................................ 42
4.1.3. Crude protein content of raw and dried pumpkin fruits and seeds ........................................ 43
4.1.4. Comparison of crude protein content in different parts of pumpkin fruit .............................. 45
4.1.5. Crude fat content of raw and processed pumpkin fruits and seeds ........................................ 46
4.1.6. Comparison of crude fat content in different parts of pumpkin fruit ..................................... 47
4.1.7. Crude ash content of raw and processed pumpkin fruits and seeds ....................................... 48
4.1.8. Comparison of crude ash content in different fruit parts ....................................................... 49
4.1.9. Crude fibre content of fruits and seeds of raw and processed pumpkins ............................... 50

viii
4.1.10. Crude fibre content in different fruit and seed parts............................................................ 52
4.1.11. Carbohydrate content of raw and dry pumpkin fruits and seeds .......................................... 53
4.1.12. Carbohydrate content in different parts of pumpkin fruit .................................................... 55
4.2. Hunter (L*, a*, b*) colour and hue angle values for pumpkin fruit flours ................................. 55
4.3. Beta-carotene content in raw and dried pumpkin fruits ........................................................... 58
4.3.1. Beta-carotene content in raw pumpkins ............................................................................... 58
4.3.2. Beta carotene content of flours from blanched and un-blanched dried pumpkin fruits .......... 60
4.4. Starch content in pumpkin fruits ............................................................................................. 62
4.5. Elemental mineral content of pumpkin fruit and seed flours.................................................... 63
4.5.1. Mineral content of pumpkin fruit and seed flours of C. moschata ........................................ 63
4.5.2. Mineral composition of pumpkin fruit and seed flours of C. maxima ................................... 65
4.5.3. Relative mineral content in fruit flours of C. moschata and C. maxima ................................ 66
4.5.3.1. Macro-minerals in fruit flours ...................................................................................... 66
4.5.3.2. Micro-minerals in fruit flours ....................................................................................... 67
4.5.4. Mineral content in seed flours of C. moschata and C. maxima ............................................. 68
4.5.4.1. Macro-minerals in seed flours ...................................................................................... 68
4.5.4.2. Micro-minerals in seed flours ....................................................................................... 69
4.6. Characteristics of pumpkin seed oils ....................................................................................... 70
4.6.1. Physicochemical properties of pumpkin seed oil .................................................................. 70
4.6.2. Fatty acid profile of pumpkin seed oil .................................................................................. 71
4.7. Functional properties of pumpkin seed flours and protein isolates .......................................... 73
4.7.1. Protein solubility profile ...................................................................................................... 73
4.7.2. pH values of pumpkin seed kernel flours and protein isolates .............................................. 75
4.7.3. Water- and oil-holding capacity ........................................................................................... 75

ix
4.7.4. Emulsifying activity and emulsion stability ......................................................................... 76
4.7.5. Whipping properties ............................................................................................................ 77
4.7.6. Gelation Properties .............................................................................................................. 78
4.8. Food application potential of pumpkin fruit flour.................................................................... 79
4.8.1. Colour of pumpkin flour-wheat flour cakes ......................................................................... 79
4.8.2. Beta-carotene content in cakes with blending of pumpkin flour with wheat flour ................. 83
4.8.3. Sensory Evaluation of cakes ................................................................................................ 84
CHAPTER 5: CONCLUSION AND RECOMMENDATIONS ................................................ 86
5.1. Conclusion................ .............................................................................................................. 86
5.2. Recommendations .................................................................................................................. 88
REFERENCES.................... ........................................................................................................ 89
x
LIST OF TABLES
Table1: Cake formulation………………………………………………………...… 39
Table 2: Moisture content of fruits and seeds of two pumpkin species……...……… 42
Table 3: Crude protein content in raw and processed fruits and seeds…………..…. 44
Table 4: Crude fat content in raw and processed fruits and seeds …………………. 46
Table 5: Crude ash content in raw and processed fruits and seeds ………….……… 49
Table 6: Crude fibre content in raw and processed fruits and seeds ……….....…….. 51
Table 7: Carbohydrate content of fresh and dry pumpkin fruits and seeds ……........ 54
Table 8: Hunter L,*a*, b* and Hue angle values of pumpkin fruit flours……………. 56
Table 9: Beta-carotene content in raw pumpkin fruits ………………………...…… 58
Table 10: Beta-carotene content in processed pumpkin fruits…………………...…… 61
Table 11: Mineral composition of pumpkin fruit and seed flours of C. moschata…… 64
Table 12: Mineral composition of pumpkin fruit and seed flours of C. maxima…...… 66
Table 13: Physicochemical properties of pumpkin seed oil…………………………... 71
Table 14: Functional properties of pumpkin seed flours and protein isolates............... 76
Table 15: Gelation properties of pumpkin seed flours and protein isolates................... 78
Table 16: Mean values of crust and crumb cake colours............................................... 80
Table 17: Sensory evaluation of cakes........................................................................... 85

xi
LIST OF FIGURES
Figure 1: Standard calibration curve for beta-carotene ……………………………..30
Figure 2: Relative moisture content in pumpkin fruits and seeds……………………43
Figure 3 : Crude protein content in different parts of pumpkin fruit………………….45
Figure 4: Crude fat content in different parts of pumpkin fruit………………………48
Figure 5: Crude ash content in different parts of pumpkin fruit……………………..49
Figure 6: Crude fibre content in different parts of pumpkin fruit................................53
Figure 7: Carbohydrate content in different parts of pumpkin fruit.............................55
Figure 8: Macro-minerals in C. moschata and C. maxima fruit flours….....................67
Figure 9: Micro-minerals in C. moschata and C. maxima fruit flours…………….....68
Figure10: Macro-minerals in C. moschata and C. maxima seed flours……………....69
Figure11: Micro-minerals in C moschata and C. maxima seed flours………………..70
Figure12: Relative fatty acid content in C. moschata and C. maxima seed oils……...72
Figure13: Protein solubility profiles of protein isolates and defatted flours……….....74
Figure 14: Beta-carotene concentration in cakes ..........................................................83
xii
LIST OF PLATES Plate 1: Cucurbita moschata fruits……………………………………….….25
Plate 2: Cucurbita maxima fruits…………………………………………… 25
Plate 3: Effect of pumpkin flour addition on cake colour…………….....….. 82
Plate 4: A cross section of cakes with added pumpkin flour ………………. 85

xiii
ABBREVIATIONS
AOAC Association of Official Analytical Chemists
AACC American Association of Cereal Chemists
AAS Atomic Absorption Spectrophotometer
ACC Administrative Committee on Co-ordination
ANOVA Analysis of Variance
ASALs Arid and Semi Arid Lands
AVRDC Asian Vegetable Research and Development Centre
CAAMS Chinese Academy of Agricultural Machinery Sciences
CIAT International Centre for Tropical Agriculture
CPC Corn Products Company
FAO Food and Agriculture Organization
FEWS NET Famine Early Warning Systems Network
GC Gas chromatography
HPLC High Performance Liquid Chromatography
IFPRI International Food Policy Research Institute.
ILSI International Life Sciences Institute
MT Metric Tons
LSD Least Significant Differences
MOA Ministry of Agriculture
SCN Standing Committee on Nutrition
VAD Vitamin A Deficiency
OMNI Opportunities for Micronutrient Interventions

xiv
Rpm Revolutions per minute
RE Retinol Equivalent
WHO World Health Organization
xv
ABSTRACT The purpose of this work was to study the effect of drying on physicochemical
properties and nutritional quality of fruits, seeds and seed kernels of two species of
pumpkin; isolate and quantify their fruit starch; characterize the functional
properties of the seed oils and proteins; carry out elemental mineral analysis and
lastly formulate a food product based on pumpkin fruit flour-wheat flour blend. The
investigation was done on samples of Cucurbita maxima and Cucurbita moschata.
The treatment structure involved fruits with rind and those without rind (fruit pulp),
whole seeds and seed kernels, and raw and dry samples (flours). Proximate
composition of raw C. moschata fruit with rind was 87.9 % moisture (fresh weight),
1.6 g/100g crude ether extract, 4.9 g/100g crude protein, 10.9 g/100g crude fibre, 6.7
g/100g crude ash, and 76.0 g/100g nitrogen free extract (by difference) on dry
weight basis. The corresponding values for C. maxima were 87.0 g/100g, 2.0
g/100g, and 3.9 g/100g, 9.6 g/100g, 6.9 g/100g, and 77.6 g/100g respectively. C.
moschata fruit with rind contained significantly (p<0.05) higher crude protein and
crude fibre than C. maxima. Proximate analysis of the seeds showed that C. maxima
whole seeds had significantly (p<0.05) higher moisture, crude fat and crude protein
content than C. moschata seeds. The results indicated that the pumpkin seeds are
rich in lipids and proteins. Physicochemical analysis of oil extracted from C.
maxima and C. moschata seeds showed that they are highly unsaturated. The lipid
profile of the pumpkin seed oil indicated that the major unsaturated fatty acids were
oleic and linoleic. Fruits and seeds contained varying amounts of potassium (K),
phosphorus (P), magnesium (Mg), zinc (Zn), manganese (Mn), Iron (Fe), calcium

xvi
(Ca), copper (Cu) and sodium (Na). The fresh fruits with rind of C. maxima had
significantly (p<0.05) higher amounts of starch (9.5 % f. w) and β-carotene (582.7 ±
3.9 µg/g d.w) than C. moschata fruit with rind that had corresponding values of 3.8
mg/100g and 534.5±10.2 µg/g on dry weight basis respectively. Emulsifying activity
of pumpkin seed proteins ranged between 42-46 %, while foaming activity ranged
between 26-43 %. The cake flavour at 5% pumpkin flour replacement level was the
most acceptable. The results show that pumpkin seeds and fruits could be processed
and potentially added to various food systems to improve nutrient content and as
functional ingredients, hence their increased production, processing and utilization
should be encouraged.

1
CHAPTER 1: INTRODUCTION
1.1. Background of the Study
Food and nutrition security, a situation in which all people, at all times, have
physical and economic access to sufficient, safe and nutritious food to meet their
dietary needs and food preferences for an active healthy life, is affected by a
complexity of factors. These factors include unstable social and political
environments that preclude sustainable economic growth, war and civil strife,
macroeconomic imbalances in trade, natural resource constraints, poor human
resource base, gender inequality, inadequate education, poor health, natural
disasters, such as floods and locust infestation, and the absence of good governance
(IFPRI, 2004). All these factors contribute to either insufficient national food
availability or insufficient access to food by households and individuals.
Africa, in particular Sub-Saharan Africa, continues to lag behind in making progress
in solving the food and nutrition problem due to the high prevalence of HIV/AIDS;
civil war, strive and poor governance; frequent drought and famine; and agricultural
dependency on the climate and environment. Food security on the continent has
worsened since 1970 and the proportion of the malnourished population has
remained within the 33 to 35 percent range in Sub-Saharan Africa (IFPRI, 2004).
The major challenge to food security in Africa is its underdeveloped agricultural
sector that is characterized by over-reliance on primary agriculture, low fertility
soils, minimal use of external farm inputs, environmental degradation, significant
food crop loss both pre- and post- harvest, minimal value addition and product
2
differentiation, and inadequate food storage and preservation that result in
significant commodity price fluctuation.
Nearly half of the world's population suffers from malnutrition and an estimated two
billion people are at risk of diseases resulting from deficiencies of the micronutrient
iron, vitamin A, and iodine (UNICEF/MI, 2004). These deficiencies often referred
to as ‘hidden hunger’; affect predominantly women, infants, and children in
developing countries, impairing both physical and intellectual development. Food-
based systems approaches offer sustainable solutions to problems of malnutrition,
including health problems caused by micronutrient deficiencies. Food-based
approaches include all activities affecting human nutrition and health, which are
associated with the production, acquisition, preservation, and utilization of food
(FAO, 1997).
Pumpkin (Cucurbita sp.) is a fruit vegetable, which belongs to the family
Cucurbitaceae that also includes gourds, melons and squashes. The varieties of
pumpkin grown widely in Kenya are of the species C. moschata (butternut squash)
and C. maxima (squash pumpkin). Pumpkins are a native of Central America but
have been domesticated in several tropical and sub tropical countries. In Kenya the
crop is now regarded as a traditional vegetable (Chweya and Eyzaguirre, 1999) that
is grown in the high potential areas as well as the arid and semi arid lands (ASALs).
In Cameroon (West Africa) the species of Cucurbitaceae family are widely
consumed and are commonly known as egusi (Achu et al., 2005).

3
The pumpkin has great economic potential for use both as a food and an industrial
crop. It is utilized for its leaves, marrow, fruit pulp and seeds. The stem could be
used as livestock feed. It has health enhancing properties and could also be used for
ecological balance (FAO, 2005), since it provides good groundcover (Vodouhe and
Capo-Chichi, 1998). Its cultivation and utilization in Kenya follows the rich
ecological, cultural and ethnic diversity of the country (Chweya and Eyzaguirre,
1999). Exploitation of pumpkin as a food crop has been limited to a large extent by
lack of sufficient information on the physicochemical, nutritional and functional
properties of its fruits and seeds. Just like other traditional vegetables, the pumpkin
is associated with poor rural lifestyles and low status.
Cultural change and urbanization have led to further neglect of this crop.
Governments tend not to include traditional vegetable species, including pumpkins
in their agricultural or food security policy strategy papers. They are seldom counted
in agricultural statistics (Chweya and Eyzaguirre, 1999). Studies have shown that
pumpkin fruit flesh contains β-carotene in amounts ranging between 0.06- 7.4 mg /
100g. This is important in mitigating the problem of vitamin A deficiency (VAD),
which is the second most deficient micronutrient after iron that affects the
vulnerable group that includes women and children (Murkovic et al., 2001). The
fruit also contains fibre and acetylated pectin present as 30% of the dry matter
(Morris et al., 1998). It contains riboflavin, vitamins C and E, plus other carotenoid
pigments. Although classified as a fruit vegetable, pumpkins have been found to
contain dry matter starch ranging from 3% to 60% (Corrigan et al., 2001).

4
Pumpkin fruit could be consumed as a staple, providing substantial amounts of
carbohydrates to the human diet. Studies done in Asia have shown that pumpkin
seed kernel contains proteins (25-37%), lipids (33%), as well as minerals such as Fe,
Zn, P, K, Mn, and Ca. (El-Adawy et al., 2001). The enormous benefits
notwithstanding, pumpkin remains an under exploited crop and it does not benefit
widely from national or international research activities (Achu et al., 2005).
Production of pumpkins has not yet reached plantation scale, unlike in the Peoples
Republic of China where production and processing is about 500 tons per year and
the fruit pulp is processed into flour and instant powder that is added to food
products in various ways (CAAMS, 2004). The pumpkin varieties grown in Kenya
are similar to those grown in other parts of the world, with minimal variation in
cultivars, therefore, they have similar potential for agro-processing and utilization.
The purpose of this work, therefore, was to study the chemical, physical, nutritional
and functional characteristics of raw and processed pumpkin fruit and seeds of two
species grown in Kenya with a view to applying them in food systems.
1.2. Problem Statement
Processing and utilization of pumpkin fruits and seeds in Kenya is currently low.
The pumpkin fruit is utilized in its primary form by boiling, adding to stews or
mashing with maize and beans before consumption. The seeds are edible though
they are not widely consumed. Agro-processing has concentrated on common foods
such as cassava, maize and recently sweet potatoes, while neglecting others

5
including pumpkins. Production of this crop by farmers in the region is still
minimal since it has not been promoted as an enterprise that can fetch income as
well as provide family food and nutrition security. Its post harvest handling and
utilization have not been given adequate attention by both research and extension
organizations, despite its enormous potential. Research has been done extensively on
agronomic and phenotypic characteristics of pumpkin, but this has not benefited the
crop since it is still a marginalized one.
1.3. Justification
Due to the nutritional quality of pumpkins in terms of beta-carotene content and
minerals, there is need to process it for preservation. The processed pumpkin
products could be applied to various foods to enhance their nutritional quality for the
target population.
Agro-processing helps to diversify the range of consumable farm products. There
are compelling reasons therefore for encouraging agro-processing. Firstly, it
improves rural incomes by adding value to produce, thereby saving on transport
costs by delivering high value/ low volume products and creating opportunities for
the use of by-products as inputs in other farm operations such as animal feeds,
manure and fuel. Secondly, it provides an opportunity for reducing farm losses
through the conversion of perishable commodities into more durable products.
Thirdly, agro-processing helps create jobs in the rural areas, thereby contributing to
the reduction of both poverty and rural-urban migration (MOA / GoK, 2004)

6
The successful characterization of the pumpkin fruit and seed kernel flours is
intended to provide information that is expected to enhance production, processing
and utilization of this crop. Adding value to the pumpkin will help improve its
image because it is currently considered a minor crop, whose production statistics
are not widely documented. Substantial amounts of starch contained in the pumpkin
fruit pulp makes it suitable for agro-processing as a source of starch, alongside other
crops such as cassava and sweet potatoes which are currently used. The possible
outcome of this research will be more consumption of the pumpkin fruit and seeds,
processing of the pumpkin fruit through drying, and utilization of pumpkin seeds at
household level and at industrial level as functional ingredients in various food
systems. The research findings will be published in scientific journals hence will add
to the body of knowledge especially on the nutritional and physicochemical
properties of the two species of pumpkin, notably C. moschata and C. maxima that
would influence their utilization in food systems.
A more sustainable way to mitigate the food and nutrition problem that afflicts the
population is to improve the production, processing and utilization of locally
available resources, in the form of indigenous crops. This is a food-based approach
recommended by the Food and Agriculture Organization (FAO) of the United
Nations (FAO, 1997).

7
1.4. Objectives
1.4.1. Main objective
To carry out physicochemical characterization of flour from pumpkin fruit and
pumpkin seed kernels and recommend their potential for application in food
systems.
1.4.2. Specific objectives
a) Assess the effect of drying on the physicochemical and nutritional properties
of fruit and seed kernel of C. moschata and C. maxima pumpkin species.
b) Isolate and quantify starch from the two species of pumpkin.
c) Characterize the functional properties of proteins and oils from the seed
kernels of the two species of pumpkin.
d) Assess the effect of pumpkin flour on β-carotene content and sensory
characteristics of cakes.
1.5. Hypothesis
The flour products of pumpkin fruit pulp and seed kernel are potentially nutritious
and could be incorporated into food systems for fortification and as functional food
ingredients.

8
CHAPTER 2: LITERATURE REVIEW 2.1. Crop description
The pumpkin is an angiosperm belonging to the Cucurbitaceae family that is
characterized by prostrate or climbing herbaceous vines with tendrils and large,
fleshy fruits containing numerous seeds (Acquaah, 2004). Pumpkin of the genus C.
maxima is also called squash guard. The common names are Chinese pumpkin or
crookneck squash and winter squash (Tindall, 1983). Its centre of origin is South
America, possibly Peru, now widely distributed throughout the tropics. The areas of
cultivation are tropical Asia (India, Indonesia, Malaysia, and the Philippines),
tropical Africa, Central and South America, particularly Mexico and the Caribbean.
Botanically the squash guard can be described as an annual herb, rarely upright,
generally trailing, and vines up to 3 m in length. Stems are slightly hairy, soft, and
cylindrical in cross-section and tendrils are branched. Leaves are dark green mainly
reniform, cordate, and rarely lobed, sometimes with white markings, 15-30 cm in
diameter. Flowers are monoecious, female flowers are 15cm in diameter, yellow-
orange; male flowers are smaller, 8.5cm in diameter with long upright thin pedicels,
calyx of 5 sepals, fused at base, stamens 3, short fused, and stigmas small and
yellow. The fruits are large, variable in shape, round or oblong, covered with small
raised spots, weighing 2-5 kg. The rind may be soft or hard, sometimes brightly
coloured. The flesh is yellow. Seeds are white or brown, ovoid, 1.3cm x 0.9cm,
flattened, narrow towards point of attachment, (Rice, 1973; Tindall, 1983).

9
The environmental response of the crop is varied. Plants require a fairly high
temperature, above 25-270C, during the growing period with fairly low humidity
(Tindall, 1983). Soils with a high organic content are preferable, but in general,
pumpkins are tolerant to a wide range of soil conditions. Fruits may be harvested 80-
140 days from sowing or planting. The optimum harvesting stage is before the seeds
ripen and when the skin of the fruit begins to harden. Maturity indices include a well
corked stem, development of abscission layer and subtle changes in rind colour
depending on variety (Cantwell and Suslow, 2002). Yields are 3-6 fruits per plant
and individual fruits may weigh 2-5 kg.
Cucurbita moschata is closely related to C. maxima. Its other names are winter
squash or butternut squash. Its origin is tropical South or Central America. It is the
most widely grown species of the Cucurbita. It is an annual vine; stems grow up to 3
m. It is generally lacking in bristly hairs on leaves and stems, which mainly
distinguishes it from C. maxima (Rice, 1973; Tindall, 1983). The flesh of the fruit is
yellow to orange. The seeds are either white or brown in colour. The environmental
response is such that C. moschata is more tolerant than most species of Cucurbita to
high temperatures and is well adapted to the environment of the lowland tropics. The
cultural requirements and growth period are similar to those for C. maxima.
2.2. Importance of pumpkin in the human diet.
2.2.1. Starch content in the fruit
Although pumpkin is botanically classified as a fruit vegetable, it is consumed by
many communities as a staple, providing a substantial amount of calories on

10
consumption. Pumpkin fruit is a storage organ and has been found to contain starch
in amounts that may go up to 60% (Corrigan et al., 2001).
Starch is the major carbohydrate in plant storage organs. Starch and cellulose are the
most important biopolymers on the planet. Calculated as calories, starch represents
80% of the world food supply (Guan et al., 1998). Published data on the amount of
starch contained in the Kenyan varieties of pumpkin is lacking yet this would serve
as a basis for its inclusion in national crop statistics. Currently over 30% of children
in Kenya are stunted, an indication of chronic malnutrition, and a further 6% are
wasted, indicating acute malnutrition which is associated with situations of hunger
and under nutrition (UNICEF, 2000).
Starch is also extensively used as animal feed and as an important industrial raw
material. Starch is produced as an end product of carbon fixation during
photosynthesis and is accumulated in storage organs. Most plant starches consist of
a mixture of essentially linear (amylose) and highly branched (amylopectin)
polymers in the ratio of approximately 1:3. The molecular weight and degree of
branching of amylopectin vary widely and it is this structural variety which
contributes to the differences in the chemical and physical properties of starches
from diverse plant sources (Guan et al., 1998).
Starches from wheat, maize, and potato continue to dominate the lucrative world
markets in food and non-food industries yet alternative starch sources could be
explored in order to increase their potential contribution to agricultural development

11
and general economic growth. Studies have shown that starch processing is more
profitable when conducted alongside flour processing, which employs similar
equipment. Waste from starch processing could be incorporated into flour. Since
margins are small, the sales of waste materials from starch are an important factor in
longer term sustainability of the process. In Kenya, a starch factory known as Kenya
Corn Products Company (CPC) exports 2O, 000 MT / year of starch products to
Uganda, and this implies that utilization of pumpkin starch would diversify starch
sources. It is with this in mind that this research involved the isolation and
quantification of starch from the pumpkin fruits of C. maxima and C. moschata
species.
2.2.2. Micronutrient content in pumpkin fruit and seed kernels
2.2.2.1. Vitamins
Pumpkin fruit pulp contains beta-carotene, a pro-vitamin A, which plays a major
role in human nutrition. Beta-carotene has been used for many years as a food
colouring agent, pro-vitamin A in food and animal feed, an additive to cosmetics,
multivitamin preparations, and in the last decades as a health food product under the
claim ‘anti-oxidant’ (Ben Amotz and Fishler, 1997). Murkovic et al., (2001)
reported that β-carotene content in pumpkins ranged between 0.06 and 7.4 mg per
100 g. This study aimed at analysing and quantifying the amounts of β-carotene in
the two species of pumpkins.
Vitamin A occurs only in animal tissues such as fish liver oil, livers of animals, milk
fat and in egg yolk (Belitz and Grosch, 1985). Plants are devoid of vitamin A.
12
Vitamin A in nature originates from carotenes, which are the yellow and red
pigments responsible for colour of many vegetables and fruits. Of the 500 or so
naturally occurring carotenoids, about 60 posses the vitamin A activity in varying
degrees but only 5 or 6 of these are commonly found in food. The major carotenoids
are β- carotene, α-carotene, cryptoxanthin, lutein, zeaxanthin, and lycopene. The
most common and active of the pro-vitamins is β-carotene, found in fruits and
vegetables. It exists naturally as the all–trans isomer (Frigg, 1999). One of the most
important features of carotenoids is that they are organic compounds with long
unsaturated chains. These chains are responsible for their bright colour. The
unsaturated property is easily destroyed by oxidation in air or by hydrogenation
(Ihekororonye and Ngoddy, 1985).
The carotenoids yield vitamin A by cleavage of the centrally located double bond
(Belitz and Grosch, 1986). The carotenoids which have the unsubstituted β-ionone
ring can be cleaved oxidatively to yield retinaldehyde which is reduced to retinol
(Bender, 1992). Once ingested, β-carotene and other pro-vitamin A carotenoids are
cleaved in the intestinal mucosa by carotene dioxygenase yielding retinaldehyde
(Combs, 1992). Central oxidative cleavage of β-carotene gives rise to two molecules
of retinaldehyde. The retinaldehyde is reduced to retinol, which is esterified and
enters the circulation in chylomicrons. Animals are unable to biosynthesize
carotenoids, but assimilate them through their diet in the form of vitamin A (Woolfe,
1992).

13
Pro-vitamin A accounts for 60-90% of vitamin A intake. Populations depending on
it as dietary source of vitamin A are in South East Asia, Africa and West Pacific,
where animal sources of vitamin A are out of reach. The biological value of dietary
carotene varies widely depending on the efficiency of absorption but it is taken as an
average of one-sixth that of all trans-retinols (Woolfe, 1992). This disparity in
biological activity is primarily due to inefficiency of carotene absorption and
subsequent bioconversion to retinol. The bioavailability is greatly influenced by the
nature of the embedding matrix (fibre) and the composition of the accompanying
meal (Bender, 1992).
2.2.2.1.1. Stability of carotenoids
In general carotenoids are destroyed or altered by acids and free halogens,
particularly in the presence of light and high temperatures (Latham, 1997). The
carotenes are easily oxidized in the presence of oxygen or oxidizing agents, in
conjunction with co-oxidation of unsaturated fatty acids. In foods the carotenoids are
mostly dissolved in the fat matrix where they are protected from the oxidizing action
of atmospheric oxygen by vitamin E and other anti-oxidants (Latham, 1997).
Carotenoids are susceptible to isomerization and oxidation during processing and
storage (Rodriguez-Amaya, 2001). The practical consequences are loss of colour
and biological activity and the formation of volatile compounds that impart
undesirable flavour in some foods, especially in fruits. The occurrence of oxidation
depends on the presence of oxygen, metals, unsaturated lipids, enzymes, oxidants;
type and physical state of the carotenoid present and the severity of treatment during

14
food preparation (Bender, 1992). Oxidation of the pro-vitamin A carotenoids may
occur when the ultra structure that protects the carotenoid is destroyed, when the
surface area is increased and during heat treatment. Heating promotes trans-cis
isomerization and therefore the duration and temperature used in food preparation
should be controlled (Rodriguez-Amaya, 2001).
2.2.2.1.2. Role of carotenes in the diet
Some of the most severe nutritional problems the world over have been caused by
the so called ‘hidden hunger’. This is malnutrition caused by micronutrient
deficiencies. One such micronutrient is vitamin A. Most of the vitamin A
requirements of man, which are less than a milligram per day, are met in large part
by green and yellow vegetables, such as lettuce, spinach, sweet potatoes, pumpkins
and carrots, which are rich in carotenes (Leninger, 1992). On consumption, the
carotenoids are converted to vitamin A. This vitamin is an essential micronutrient
for the normal functioning of the visual system, growth and development,
maintenance of the epithelial cellular integrity, immune function and reproduction
(ACC/SCN, 2000). Food-based approaches used to mitigate this problem include
diet diversification and food fortification. One important advantage of food-based
strategies is that foods provide several essential micronutrients, simultaneously
addressing a combination of deficiency problems. In addition, physiological
interactions between vitamins and minerals can enhance the body’s ability to absorb
essential micronutrients.

15
Promoting consumption of micronutrient- rich foods fosters better overall health for
all members of the society. Most importantly, food-based strategies promote
sustainable improvements by encouraging market solutions and long term behaviour
change in food preference among high-risk groups. This is more so because some
foods, like the pumpkin, have a sweetish taste that may not be liked by many people.
Processing it into flour for addition to various food products is one way of
increasing their utilization. In addition, food based strategies are often linked to
income generating activities (FAO, 1997).
2.2.2.1.3. Beta-carotene as a functional food ingredient in wheat products
Wheat is a major component of most diets of the world. Throughout the centuries,
wheat has been used in variety of human foods such as breads, cakes, crackers, pasta
and noodles. (Cho-Ho Lee et al., 2002). In Kenya, wheat flour is consumed mainly
as bread and cakes. Wheat and other grains contain a limited amount of naturally
occurring β-carotene. In Asian countries, synthetic β-carotene has been used for
providing colour and vitamin A in a variety of bakery products including sweet rolls,
Danish pastries, frozen waffles, bagels, soft cookies and snack foods (Gordon et al.,
1985 and Heinonen et al., 1989). Bakery products in Kenya are coloured using
permitted food colourings to enhance acceptability without adding any nutritional or
functional value. Although pumpkin is a good source of β-carotene and is served on
its own, it has not yet been added to cakes. This study will assess the effect that
pumpkin flour added to cake mixtures will have on β-carotene content and sensory
properties of cakes.

16
2.2.2.2. Minerals
The pumpkin seed and seed kernels contain substantial amounts of minerals such as
phosphorus, magnesium, potassium and calcium. Other minerals that are available in
small amounts are zinc, iron and sodium (El-Adawy, 2001). Minerals are important
for enzymatic activity and normal physiological function in the human body.
Calcium is a macro- mineral that is required in amounts of more than 1mg per day.
The recommended daily allowance (RDA) is 1000-1200 mg for adults and 1300mg
for those aged between 9-18 years. Calcium is important in the formation and
maintenance of strong bones and teeth throughout the life cycle. It is also involved
in blood clotting and aids in nerve impulse transmission, muscle contractions and
contributes to cell permeability (Fawzi and Hunter, 1998). Calcium deficiency can
cause osteoporosis. Vitamin D is needed for the body to absorb Ca from the diet.
People most at risk of deficiencies are women. Good sources of dietary calcium are
dairy products, fish, leafy vegetables and nuts.
Phosphorus is a micro-mineral that participates in the energy cycle that turns the
food we eat into energy in form of Adenosine Triphosphate (ATP), for use by the
body. Like calcium, phosphorus is also involved in muscle contraction and nerve
transmission, and it is needed in protein synthesis. Phosphorus is part of
deoxyribonucleic acid (DNA) which controls heredity. Phosphorus is required for
bone and tooth strength. As part of cell membranes, phosphorus plays a protective
role by regulating what comes in and goes out. The RDA for phosphorus is 700 mg
for those aged above 18 and 1250 mg for those aged between 9-18 years.

17
Phosphorus is found in nearly all foods and dietary deficiency is unknown, though
too much phosphorus can cause calcium deficiency, leading to osteoporosis. Besides
carbonated drinks, phosphorus is found in milk and milk products, meat, fish, nuts
and legumes (Wardlaw and Kessel, 2002)
Magnesium provides bone strength and is a component of enzymes involved in
energy production. Magnesium also helps in nerve and heart function. Women and
patients on thiazide diuretics are at risk of magnesium deficiency. The RDA is 450
mg for men and 350 mg for women. Dietary sources of magnesium are whole
grains, legumes, leafy green vegetables, nuts and chocolate. Deficiencies can cause
muscle spasms, tremor, convulsions and mental derangement. The mineral is not
toxic, and unlike calcium it is not given up by bones for all the functions it has to
perform. If it is not supplied by food or supplements there is risk of a deficiency
state (Fawzi and Hunter, 1998).
Sodium and potassium are also macro minerals that are required by the human body
in amounts of more than 1mg per day. They both function as major cations of
intracellular fluid and aid in nerve impulse transmission. They are important in
maintaining the water balance in the body and controlling the composition of blood
and other body fluids (Gibson, 2003). Sodium chloride is present in processed foods
and in small amounts in vegetables, fruits and grains, condiments, soups, sauces and
chips. The RDA of sodium is 500 mg. Deficiency leads to muscle cramps. The RDA
of potassium is 2000 mg and deficiency leads to irregular heartbeat, loss of appetite
and muscle cramps. Foods rich in potassium include spinach, pumpkin, bananas,

18
orange juice, other vegetables and fruits, milk, meat, legumes and whole grains
(Gibson, 2003).
The key micro- minerals also referred to as trace elements that were studied include
zinc, iron, copper and manganese. Zinc is significant in the human diet since it is
required in more than 100 enzymes involved in growth, immunity, alcohol
metabolism, sexual development and reproduction. The human body contains 2-3 g
of zinc (Gibson, 2003). There are no specific storage sites for zinc hence a regular
supply in the diet is required. Zinc is found in all parts of the body, 60% is found in
muscle, 30% in bone and about 5% in our skin (Gibson, 2003). Particularly high
concentrations are in the prostate gland and semen. The RDA for zinc is 11 mg for
men and 8mg for women (Wardlaw and Kessel, 2002).
The first signs of zinc deficiency are impairment of taste, a poor immune response
and skin problems. Other symptoms of zinc deficiency include hair loss, diarrhoea,
fatigue, delayed wound healing, and decreased growth rate and mental development
in infants (Wardlaw and Kessel, 2002). Zinc supplementation can help skin
conditions such as acne and eczema, prostate problems, anorexia nervosa, alcoholics
and those suffering from trauma or post surgery. Zinc is present in a variety of
foods, particularly in association with protein foods. A vegetarian diet contains less
zinc than a meat based diet and so it is important for vegetarians to eat plenty of
foods that are rich in this vital mineral (Gibson, 2003). Good sources of zinc for
vegetarians include dairy products, beans, sesame, lentils, whole grain cereals and
green vegetables. Pumpkin seeds provide one of the most concentrated vegetarian
19
food sources of zinc. All meats and sea foods are rich sources of zinc (Wardlaw and
Kessel, 2002).
Iron is a functional component of haemoglobin and other key compounds used in
respiration, immune function and cognitive development. Iron plays an important
role in changes in some neurotransmitters in the brain and brain development
(Latunde-Dada, 2000). People most at risk are infants, preschool children,
adolescents and women in child bearing age (Dallman, 1992). The RDA for men is 8
mg and 18 mg for women Nutrient dense dietary sources include meats, sea food,
broccoli, peas, pumpkin seeds, bran and enriched breads. Vitamin C helps in iron
absorption. Deficiency symptoms include fatigue, small pale, red blood cells and
low blood haemoglobin values (Levin, 1996).
The trace element copper is important in iron metabolism, works with many
antioxidant enzymes and those involved in protein metabolism and hormone
synthesis. Deficiency symptoms are anaemia, low white blood cell count and poor
growth. The RDA for humans is 900 µg. Dietary sources are liver, cocoa, beans,
whole grains and dried fruits.
Manganese is a micro- mineral that is a co-factor of some enzymes such as those
involved in carbohydrate metabolism. There are no known deficiency symptoms in
man. The RDA or adequate intake is 1.8-2.3 mg. Rich dietary sources are nuts, oats,
beans and tea. The mineral content of the fruits, seeds and seed kernels of the two of
pumpkin species were analysed in this study. Comparison was made between the
20
elemental mineral content of fruit and seed flours for each of the pumpkin species
(Wardlaw and Kessel, 2002).
2.2.3. Proteins and oils in pumpkin seed kernels and their role in human diet
Pumpkin seeds are utilized directly for human consumption as snacks after salting
and roasting in Arabian countries (Al-Khalifa, 1996). The seeds have been found to
contain high levels of protein, in amounts of 35-37% and oil (50-51%) on dry
weight basis (El- Adawy and Taha, 2001). A review of literature on functional
properties of the pumpkin seed kernel proteins which include protein solubility in
distilled water, water and oil absorption capacities, foam capacity and stability
found them to be 24.3%, 2.55 g H 2O/g flour, 3.85 ml oil/ g flour, 18.2% volume
increase, 15.9 ml, respectively, and these values were excellent when compared to
those of watermelon seed flour (El- Adawy and Taha, 2001), which were found to
be 23.9%, 2.51g H 2O, 3.89 ml oil/ g flour, 18.2% volume increase 15.2 ml, and
paprika seed flour which had values of 24.9%, 2.10 g H 2O/g flour,3.10 ml oil/ g
flour, 12.8% volume increase, and 10.1 ml respectively (El- Adawy and Taha,
2001).
Flour samples of the seeds and seed kernels could be potentially added to food
systems such as bakery products and ground meat formulations, not only as nutrient
supplements, but also as functional ingredients in these formulations (El-Adawy and
Taha, 2001). Pumpkin seed oil has been produced in the southern parts of Austria,
Slovenia and Hungary (Murkovic et al., 1996). These oils are used in cooking in
some countries of West Africa and the Middle East. The physicochemical properties

21
of these oils have been found to be comparable to the conventional oils frequently
consumed in the human diet. Several reports exist on the nutritive values of proteins
and oils of pumpkin seeds (Al-Khalifa, 1996 and Lazos, 1986).
However, more information needs to be reported on the physicochemical and
functional properties of pumpkin oils and seed proteins because the varieties within
the pumpkin species are many and research on them is not yet exhaustive.
Furthermore, no work has been reported on the physicochemical properties of the
two species of the pumpkin studied. Characterization of pumpkin proteins arises
from the need to develop other sources of concentrated plant proteins other than
those which are extracted from soybean, pigeon pea and cowpeas.
Properties of the proteins from these cereals have been reported by Mwasaru et al.,
(1999). Proteins are an important component of the human diet. They are
macromolecules made up of small units called amino acids. They are essential for
growth, tissue repair and replacement. Besides their nutritional importance, proteins
can be applied in food systems as functional ingredients that serve as soup
thickeners or meat replacers (El-Adawy and Taha, 2001).
2.3. Technology for processing fruit vegetable into powder
Drying of fruits and vegetables is important in that it reduces bulkiness, adds value,
and diversifies their utilization. The technology for processing vegetable into
powder has been developed in recent years with applications mainly for potatoes
(flour, flakes, granulated); carrots (powder) and red tomatoes (powder) (FAO,

22
1995). The vegetables are either dried to a final water content of below 4% followed
by grinding, sieving and packing of products or they are transformed by boiling and
sieving into purées which are then dried on heated surfaces (under vacuum
preferably) or by spraying in hot air. The pumpkin fruit has been found to be
suitably dried to a moisture content of 10% while the seeds are stable at final
moisture of between 5% and 6%.
2.4. Drying pre-treatments
2.4.1. Heat blanching
The pumpkin fruit is blanched before drying. Blanching is an important step which
involves exposing the vegetable very quickly to heat (around 1000C) to inactivate
the naturally occurring enzymes. Exposure for a particular vegetable should not be
too short to be ineffective or too long to soften the tissue due to excessive cooking
(AVRDC, 1992). It is recommended that before drying pumpkins, the fruits should
be cut into stripes and peeled. The peeled stripes are cut into slices of about 0.6cm
thick after which they are immersed in 2% common salt solution for about 10
minutes, blanched in 2% boiling common salt solution for 3 to 4 minutes and dried
(AVRDC, 1992).
Two of the more heat resistant enzymes important in vegetables are catalase and
peroxidase. If these are destroyed then the other significant enzymes in vegetables
will also have been inactivated. The heat treatment to destroy catalase and
peroxidase in different vegetables are known, and sensitive chemical tests have been

23
developed to detect the amounts of these enzymes that might survive a blanching
treatment (AVRDC, 1992).
2.4.2. Sulphur dioxide treatment
Sulphur dioxide may function in several ways (FAO, 1995):
(a). Sulphur dioxide is an enzyme poison against common oxidising enzymes;
(b). It also has antioxidant properties; i.e., it is an oxygen acceptor (as is ascorbic
acid);
(c). SO2 minimises non enzymatic maillard type browning by reacting with aldehyde
groups of sugars so that they are no longer free to combine with amino acids;
(d). Sulphur dioxide inhibits microbial growth
In many processing pre-treatments two factors must be considered:
Sulphur dioxide must be given time to penetrate the fruit or vegetable tissues; SO2
must not be used in excess because it has a characteristic unpleasant taste, odour and
causes allergenic reactions. International food laws limit the SO2 content of fruit
products, especially of those which are consumer oriented (except semi-processed
products oriented to further industrial utilisation). Commonly a 0.25% solution
(except for semi-processed fruit products which are industry oriented and use a 6%
solution) of SO2 or its SO2 equivalent in the form of solutions of sodium sulphite,
sodium bisulphite or sodium/potassium metabisulphite are used (FAO, 1995).

24
CHAPTER 3: MATERIALS AND METHODS
3.1. Research design
The research involved dehydrating two species of pumpkin (C. moschata and C.
maxima) and grinding them into flour for physicochemical analysis. The treatment
structure involved fresh and dry samples, fruit with rind and without rind (pulp),
whole seeds and seed kernels. For each treatment, three pumpkins were analyzed
each one in duplicate. A completely randomised design (CRD) was employed in the
study, where treatments were allocated at random to experimental units.
3.2. Materials
1. Chemicals were purchased from Kobian Chemicals Suppliers Limited, Nairobi.
2. Pumpkins were sourced from farmers in Machakos District Matungulu Division.
Selection of the pumpkin fruit samples was based on maturity. Fully ripe pumpkins
were used in the study. They were stored at temperatures of 100C before analysis.

25
Plate 1: Cucurbita moschata fruits
Plate 2: Cucurbita maxima fruits

26
3.3. Methods
3.3.1. Proximate composition of fresh and dried pumpkin fruit.
Moisture content was determined by AOAC method 930.04, (AOAC, 1995) total
ash by AOAC method 930.05, crude fibre by AACC method 32-06, crude fat by
AACC method 30-25 and crude protein (N% x 6.25) by AOAC method 978.04
(AACC, 1995). The carbohydrate was calculated by the difference.
3.3.2. Starch isolation and quantification in raw pumpkin fruits
Starch was isolated from the pumpkin fruits using the method reported by
Badenhuizen (1964) with slight modification (Kasemsuwan et al., 1995). Two fruits
per species were used for starch isolation. Squash pulp was ground in distilled water
and filtered through 106µm mesh. The starch residue was washed three times with
distilled water, twice with ethanol then recovered by filtration using Whatman No.1
filter paper. Purified starch cake was dried in an air oven at 350C for 24 hours then
quantified using an analytical weighing balance.
3.3.3. Flour preparation from pumpkin fruits and seed kernels
3.3.3.1. Flour from fruits
Mature pumpkins of C. moschata and C. maxima species grown in Machakos
District were used. The fruits were sourced from the farmer’s fields. Processing of
the fruits was done at Kenya Industrial Research and Development Institute
(KIRDI), Nairobi. The fresh pumpkins were cleaned, peeled (some fruits were not
peeled) seeds removed, and chipped into pieces of 2.5cm length and 0.31cm thick

27
using a motorized electric chipper (Model Skymsen PA-7C, Brazil). Different
known weights of slices were subjected to four treatments: (blanching and treating
with 0.5% sodium metabisulfite, blanching only, sulfiting only, and no treatment).
Drying was done using an electrical drier (KIRDI- EDSC Division, Nairobi) to a
moisture content of 10%. This was achieved by drying at a temperature of 490C for
4 hours. The dried fruits were then ground into flour using a fine mill (Model
Bauermeister, Hamburg-Altona, Germany) after which the flour samples were
subjected to physicochemical analysis.
3.3.3.2. Flour from seed kernels
This was done according to a method described by El-Adawy and Taha (2001).
Pumpkins were cut by a sharp knife and the seeds hand collected washed with water,
then oven dried at 600C for 12 hours using an Isuzu hot air rapid drying oven
(Soyokaze type ASF-113S). The dried seeds were shelled to remove the kernels,
which were ground to pass through a 60 mesh (British standard screen). The fine
flour of the whole seeds and seed kernels were put in an air tight jar and kept in a
refrigerator (100C) until analysis.

28
3.3.4. Physicochemical analysis of fresh and processed pumpkin fruits
3.3.4.1. Material yield
The material (dry matter) yield was calculated by finding the weight of flour relative
to the original weight of the fruit for samples not subjected to any drying pre-
treatment; this was expressed as a percentage.
3.3.4.2. ββββ-Carotene content in fresh and dried pumpkin fruits
This was determined by AOAC Official Methods (Method 941.15), (AOAC, 1995)
and procedures similar to those described by Murkovic et al., (2002) using HPLC
and modified by (Rodriguez-Amaya and Kimura, 2004) as follows:
In the case of fresh fruits the material was finely cut with a knife and ground in a
food chopper (waring blender) to achieve a homogenous sample. If analysis could
not be performed immediately the samples were blanched in boiling water for 5
minutes and stored in frozen condition (-40C) . About 5g of the homogenous
representative sample was weighed in a beaker. It was then transferred to a mortar
and 3g of hyflosupercel (celite) added. The mixture was ground with 50 ml of cold
acetone (acetone refrigerated for about 2 h). Filtration was done with suction
through a Buchner funnel with 2 µm filter membranes.
The second step after extraction is partitioning to petroleum ether (PE). Twenty five
millilitres PE was put in a 500 ml separatory funnel with Teflon stop-cock and the
acetone extract added in amounts of 20 ml. Distilled water (200 ml each time) was
slowly added, letting it flow along the walls of the funnel. The two phases were

29
allowed to separate and the lower aqueous phase discarded. The washings were done
3 times to remove residual acetone.
The third step is saponification. Saponification is an effective means of removing
chlorophylls and unwanted lipids, which may interfere with the chromatographic
separation and shorten the column’s life. The PE phase was collected in a volumetric
flask and an equal volume of 10% methanolic potassium hydroxide added. Also
added was a few drops of 0.1% butylated hydroxytoluene (BHT) and the mixture let
to stand overnight in the dark at room temperature. After overnight saponification,
the solution was again washed with distilled water to remove the alkali. It was dried
with anhydrous sodium sulphate and concentrated. It was made up to 100 ml volume
then it was ready for HPLC analysis. For dry samples, 2 g of the material was
weighed and soaked in water for 30 minutes, after which 20 ml of cold acetone
added and let to stand for 15 minutes. The same steps were then followed as for
fresh samples before HPLC analysis.
The samples in volumes of 10 µL were injected onto a reversed phase column
(HPLC mode: Shimadzu, column packing size: 150 cm x 4.6 mm). The columns
were eluted with a mobile phase of acetonitrile/methanol/dichloromethane
(70/10/20). The flow rate was 1.0 ml per minute and the absorption of the effluent
was monitored at a wavelength of 450 nm.
Identification of the peaks for beta-carotene was done using pure beta-carotene
standard that was injected into the HPLC. The retention time for the sample was

30
similar to that of the pure standard. A solution of a pure standard of beta-carotene
with concentrations ranging from 0 ppm to 2.5 ppm were injected into the HPLC
and from the peak areas a calibration curve was drawn and the regression equation
calculated (Figure 1). Concentration of beta-carotene (x) in ppm in the samples was
calculated by dividing the peak area (y) by the regression constant, 41944.
y = 41944x
R2 = 1
0
10000
20000
30000
40000
50000
60000
70000
80000
90000
0 0.5 1 1.5 2 2.5
Beta-carotene conc. (ppm)
Pea
k A
rea
Figure 1: Standard calibration curve for β-carotene determination in pumpkin fruit
samples

31
3.3.4.3. Analysis of specific minerals
The pumpkin fruits, seeds and seed kernels were analysed for elemental mineral
content of Ca, Zn, and Fe Mg, Mn, Na, K, and Cu using an Atomic Absorption
Flame Emission Spectrophotometer (Shimadzu Corp., Kyoto Japan, Model AA-
6200) using the respective cathode lamps (AOAC, 1995) while P was determined by
the Ascorbic acid method using UV-Visible spectrophotometer. Two grams of each
of the samples were dry-ashed in a muffle furnace at 5500C for about ten hours. The
ash was dissolved in 1% HCl acid in a conical flask and made up to 100 ml mark
using a standard volumetric flask. The individual mineral element composition was
calculated from the AAS or U-Visible spectrometer readings obtained for both the
blank and the test solution. Analyses were done in triplicate.
3.3.5. Extraction and characterization of kernel oils
3.3.5.1. Lipid extraction
Crude oil extraction was done using petroleum ether (boiling point 60-800C) in a
soxhlet extractor for 16 h (Pearson, 1976). The preparation of the sample for solvent
extraction involved drying followed by grinding. It is often necessary to dry
samples prior to solvent extraction, because many organic solvents cannot easily
penetrate into foods containing water, and therefore extraction would be inefficient.
Dried samples were then finely ground prior to solvent extraction to produce a more
homogeneous sample and to increase the surface area of lipid exposed to the solvent.

32
3.3.5.2. Specific gravity and refractive index
The specific gravity of the oil was determined using a 25 ml pycnometer at 15.50C
while refractive index was determined using Abbe refractometer at 250C. The
specific gravity was calculated by dividing the weight of the sample by the weight of
the equal volume of water.
3.3.5.3. Peroxide value
One of the most commonly used methods to determine peroxide value utilizes the
ability of peroxides to liberate iodine from potassium iodide (Pearson, 1976). The
lipids were dissolved in a solvent mixture of acetic acid and carbon tetrachloride,
warmed with saturated potassium iodide (13 g KI dissolved in 7 ml of hot water):
ROOH + KIexcess → ROH + KOH + I2
Once the reaction had gone to completion, the amount of ROOH that had reacted
was determined by measuring the amount of iodine that was formed. This was done
by titration with 0.01 N sodium thiosulphate and a starch indicator (1% starch
solution):
I2 + starch + 2Na2S2O3 (blue) → 2NaI + starch + Na2S4O6
(colourless)
The amount of sodium thiosulphate required to titrate the reaction is related to the
concentration of peroxides in the original sample.

33
3.3.5.4. Iodine value
The iodine value is expressed as the grams of iodine absorbed per 100g of lipid. One
of the most commonly used methods for determining the iodine value of lipids is
"Wij’s method" (Pearson, 1976). The lipid to be analyzed was weighed and
dissolved in carbon tetrachloride, to which iodine chloride was added. Some of the
ICl reacted with the double bonds in the unsaturated lipids, while the rest remained:
R-CH=CH-R + IClexcess → R-CHI-CHCl-R + IClremaining
The amount of ICl that reacted was determined by measuring the amount of ICl that
remained after the reaction had gone to completion (IClreacted =IClexcess - IClremaining).
The amount of ICl that remained was then determined by adding excess potassium
iodide to the solution to liberate iodine, and then titrating with a 0.1N sodium
thiosulfate (Na2S2O3) solution in the presence of starch to determine the
concentration of iodine released:
IClremaining + 2KI → KCl + KI + I2
I2 + starch + 2Na2S2O3 (blue) → 2NaI + starch + Na2S4O6
(colourless)
Iodine itself has a reddish brown colour, but this is often not intense enough to be
used as a good indication of the end-point of the reaction. For this reason, starch is
usually used as an indicator because it forms a molecular complex with the iodine
that has a deep blue colour. Initially, starch was added to the solution that contained
the iodine and the solution turned dark blue. Then, the solution was titrated 0.1N
sodium thiosulphate solution.

34
While there is any I2 remaining in the solution it stays blue, but once all of the I2 has
been converted to I− it turns colourless. Thus, a change in solution appearance from
blue to colourless was used as the end-point of the titration.
The concentration of C=C in the original sample was therefore calculated by
measuring the amount of sodium thiosulphate that was needed to complete the
titration. The higher the degree of un-saturation, the more iodine absorbed, and the
higher the iodine value (Pearson, 1976).
3.3.5.4. Acid value
The acid value is a measure of the amount of free acids present in a given amount of
fat. The lipids were extracted from the food sample and then dissolved in an ethanol
solution containing a phenolphthalein indicator. This solution was then titrated with
alkali (0.5 N KOH) until a pinkish colour appeared. The acid value is defined as the
mg of KOH necessary to neutralize the fatty acids present in 1g of lipid (Pearson,
1976).
3.3.5.6. Saponification value
The lipid was first extracted and then dissolved in an ethanol solution which
contained a known excess of KOH. This solution was then heated so that the
reaction could go to completion. The un-reacted KOH was then determined by
adding an indicator and titrating the sample with HCl. The saponification number
was then calculated from knowledge of the weight of sample and the amount of
KOH which reacted (Pearson, 1976). The smaller the saponification number the
larger the average molecular weight of the triacyl-glycerols present. The

35
saponification value content of the oil was obtained by refluxing the alcoholic
potassium hydroxide solution of the oil and then titrated with 0.5 M HCL using
Phenolphthalein indicator (Pearson, 1976).
3.3.5.7. Fatty acid profile
The fatty acid profile of pumpkin seed oil was determined using the Gas
Chromatograph (Shimadzu GC 9A, Kyoto, Japan). The lipid sample of 3 g was
pipetted into a flask. Five percent of methanolic- HCl was added and the mixture
heated under reflux for 1 hour for methylation of fatty acids. After cooling the
sample, it was transferred to a glass stoppered tube and methyl esters extracted with
3 portions (1 ml) of hexane. The hexane layer was washed with 1 portion (3-4 ml) of
distilled water.
The hexane layer was transferred to a flask and the solvent evaporated with
evaporator. The residue was dissolved using a drop of hexane then it was ready for
injection into the GC. A Shimadzu gas chromatograph with a flame ionization
detector was used in the presence of nitrogen as a carrier gas. The stationery phase
was diethylene glycosuccinate (DEGS 15%). Standard fatty acid methyl esters were
used for identification. The area under each peak was expressed as a percentage in
regard to the total area as explained by El-Adawy and Taha (1999).
36
3.3.6. Extraction and Characterization of seed kernel proteins
3.3.6.1. Extraction of proteins
The protein extraction technique described by Mwasaru et al., (1999) and adopted
from methods described by Lopez and Ordorica- Falomir (1986) were applied. The
protein isolates were obtained by extracting pumpkin seed kernel meal with 0.1 M
NaOH (1:10: meal: solvent, w/v) adjusted to pH value of 8.5. The suspension was
homogenized (Ultra Turrax T 25 Janke and Kunkel & Co., Stauffen, Germany) at
8500 rpm for 30 min followed by centrifugation at 1500 rpm for 15 min. The
supernatant was filtered and protein precipitated by adjusting the pH to 4.5 using 0.5
M HCl. The precipitated protein was recovered by centrifuging at 1500 rpm for 10
min followed by washing three times in excess water. The protein isolate was dried
at 50 0C for 48 h and was kept in air tight jars and refrigerated until analysis.
3.3.6.2. Water and oil absorption capacity
This was determined by the centrifugation method of Lin et al., (1974), as explained
by Mwasaru et al., (1999). One gram of flour was mixed with 10ml of distilled
water or sunflower oil and centrifuged at 6600 rpm for 30 min. The volume of the
supernatant was measured. The water holding capacity was expressed as the number
of grams of water held by 1 g of flour. The oil-holding capacity was expressed as the
number of ml of oil held by 1 g of flour.
3.3.6.3. Emulsifying activity and emulsion stability
Emulsifying properties were determined according to the method of Sathe et al.,
(1983). One hundred millilitres of 7% (w/v) flour suspension at pH 7 was
37
homogenized at 11000 rpm for 30s using a warring blender. One hundred millilitres
of sunflower oil was then added, and homogenized for a further one minute. The
emulsions were centrifuged in 50 ml graduated centrifuge tubes at 1200 x g for 5
minutes and the volume of the remaining emulsion was measured. Emulsifying
activity (EA) was calculated as follows:
EA% = (volume of emulsified layer / volume of whole layer in centrifuge tube) x
100. To determine emulsion stability (ES), emulsions prepared by the above
procedures were heated at 800C for 30 min, cooled to room temperature and
centrifuged at 1200 x g for 5 min. ES was calculated as follows: ES% = (volume of
remaining emulsified layer / original volume of emulsion) x 100.
3.3.6.4. Foaming capacity and foam stability
Whipping properties (foam expansion and stability) were determined according to
the method described by Kabirulla and Willis (1982). One hundred ml of 2.5% (w/v)
flour suspension was whipped at ‘low’ speed in a 250 ml waring blender for 5 min,
and foam volumes were recorded after 30 seconds. Foam capacity (FC) was
expressed as percent increase in foam volume measured after 30 seconds, and foam
stability (FS) was determined by measuring the FC after standing for 60 min.
3.3.6.5. Gelation properties
Gelation properties were determined according to the method described by Carcea
and Bencini (1986) with slight modifications. Flour suspensions of 2-20% (w/v)
were prepared in 100 ml distilled water by mixing in a 250 ml waring blender

38
(Model: HPB 300 U, Waring, UK) at the ‘Hi’speed for 2 min. The suspensions were
boiled in test tubes in a water bath for 1 hour, followed by rapid cooling under
running cold tap water. The lowest concentration at which the gel formed was
regarded as the Least Gelation Concentration (LGC).
3.3.6.6. Nitrogen solubility
Nitrogen solubility of the flours and protein isolates in distilled water at 5% (w/v)
was determined over a pH range of 2-12 according to the method described by
Narayana and Narasinga Rao, (1982): 1 g of flour was used with a flour or isolate:
water ratio of 1: 60 and shaking for 2 h at room temperature. The pH of the
suspension was adjusted by the addition of 2 M HCl or 2 M NaOH. After extraction,
the suspension was centrifuged (Sorvall WX 80 Ultra Series Centrifuge, USA) for
20 min at 400 rpm at room temperature, and Nitrogen in the supernatant was
estimated by the micro-Kjeldahl method (Pearson, 1976). Nitrogen extracted was
expressed as percentage of the flour or isolate nitrogen content. Analyses were done
in triplicate.
3.3.6.7. The pH of the pumpkin seed flours
The pH of the flours and protein isolates was measured using a pH meter
(conductivity meter and pH meter, Sartorious Mechatronics, UK) after dispersing
the solids in water at 10% w/v.

39
3.3.8. Food application potential of pumpkin flour
3.3.8.1. Cake preparation
Cakes were prepared by using the modified AACC method 10-90 (AACC, 1995).
Pumpkin flour was added to wheat flour at 0, 5, 10, and 15% replacement levels of
wheat flour, with the control having no pumpkin flour added (0%). Initially, 50 ml
of water was added in the first mixing stage, with subsequent additions being
adjusted commensurate with the percentage of pumpkin flour added. The batters
weighing between 496-606 g were scaled into each of the 20 cm diameter cake pans
and baked at 180 OC for 45 minutes in an electric oven. Baking trials were replicated
two times. Cakes were cooled for 60 minutes, stored in plastic bags overnight and
evaluated the next day.
Table 1: Cake formulation
Pumpkin flour replacement level Ingredient 0% 5% 10% 15% 20%
Wheat Flour 200g 190g 180g 170g 160g
Pumpkin flour 0g 10g 20g 30g 40g
Sugar 100g 100g 100g 100g 100g
Shortening(margarine) 100g 100g 100g 100g 100g
Baking powder 4g 4g 4g 4g 4g
Whole eggs 2 2 2 2 2
Water 90 ml 90 ml 90 ml 90 ml 90 ml

40
3.3.8.2. Beta-carotene content, colour and sensory evaluation of cake
Beta-carotene retained in the cake was analysed by HPLC method 941-15 (AOAC,
1995), as detailed in section 3.3.4.2. Crumb and crust colour measurement was done
using a Minolta Colour Difference Meter (Model C-R -200, Osaka, Japan) to obtain
L, a, b values. Hue angle, Ө, (tan-1 b/a) was calculated to define the actual colour for
the cakes (Lee et al., 1991)
Laboratory consumer testing using a sensory panel was done using nine untrained
participants who included staff and graduate students from the Department of Food
Science and Postharvest Technology at Jomo Kenyatta University of Agriculture
and Technology. The panellists were presented with coded samples of the cakes and
asked to check the category on a hedonic scale that indicated how much they liked
the samples in terms of colour, flavour, texture, appearance and general acceptability
as described by Meiselman (1984) (1=dislike extremely, 2=dislike very much,
3=dislike moderately, 4=dislike slightly, 5=neither like or dislike, 6=like slightly,
7=like moderately, 8=like very much, 9=like extremely). Immediately before
sensory tests, cakes were cut into 25 mm cubes. Cake samples were served on white
plastic plates labelled with three-digit codes from a random number table.
3.3.10. Statistical analysis
Analysis of variance (ANOVA) was done using the GenStat Discovery 5th edition
(Roger, et al., 2001). The level of significance was 5%.

41
CHAPTER 4: RESULTS AND DISCUSSION
4.1. Proximate composition of fresh and processed pumpkin fruits and seeds
4.1.1. Moisture content of fruits and seeds under different treatments
The moisture content of the fruits and seeds under study are presented in Table 2.
The results show that both species have high moisture content. One way analysis of
variance showed that there were significant (P<0.05) differences between moisture
levels of fruits with rind and those without rind for both species. The latter were
found to contain less moisture
Table 2 also presents the moisture content of seeds and seed kernels of pumpkins. A
one-way analysis of variance showed that there were no significant (P<0.05)
differences between moisture levels of sun dried seeds and seed kernels for the C.
moschata species and the inverse was true for the C. maxima species.
These values for dry seeds are similar to those obtained by Kershaw and Hackett
(1987) for other edible oilseeds such as cottonseeds (6.46%), peanuts (4.58%), palm
kernel (5.31%), sesame (4.60%), and sunflower seeds (6.58%). They are lower than
those of soybean (11.07%) and coconut seeds, 14.3% (FAO, 1982). The low
moisture levels of pumpkin seeds enable them to be preserved for long periods.
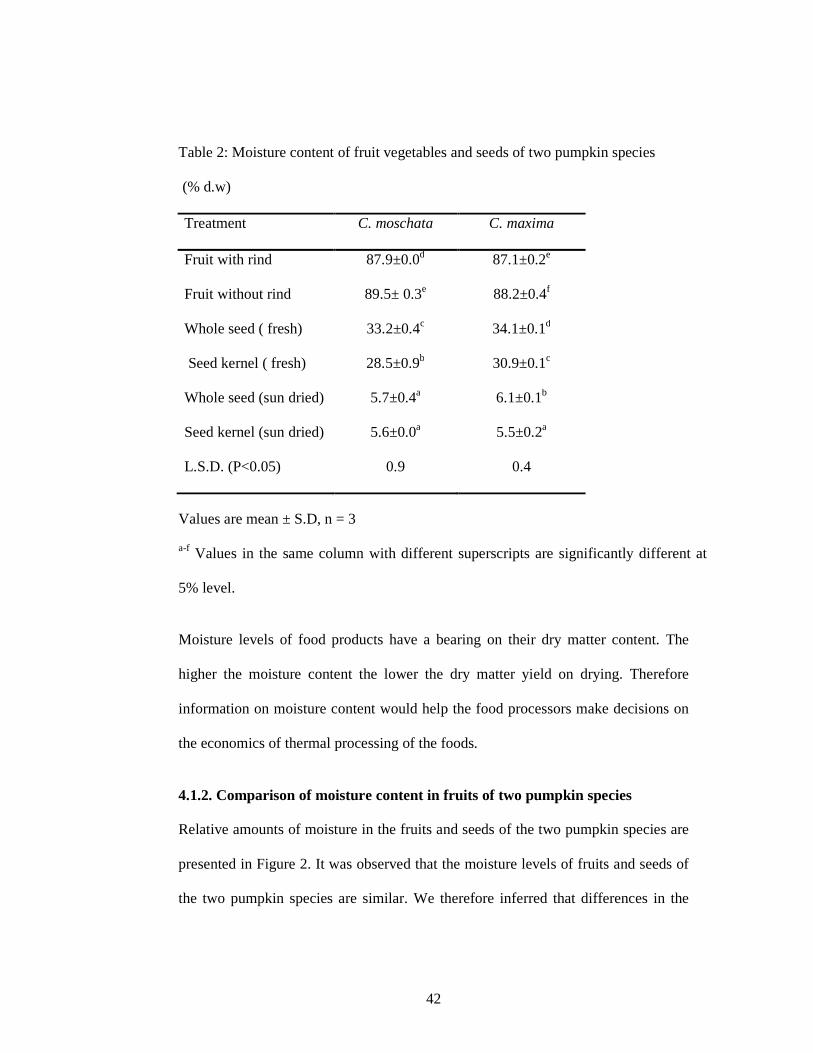
42
Table 2: Moisture content of fruit vegetables and seeds of two pumpkin species
(% d.w) Treatment C. moschata C. maxima
Fruit with rind 87.9±0.0d 87.1±0.2e
Fruit without rind 89.5± 0.3e 88.2±0.4f
Whole seed ( fresh) 33.2±0.4c 34.1±0.1d
Seed kernel ( fresh) 28.5±0.9b 30.9±0.1c
Whole seed (sun dried) 5.7±0.4a 6.1±0.1b
Seed kernel (sun dried) 5.6±0.0a 5.5±0.2a
L.S.D. (P<0.05) 0.9 0.4
Values are mean ± S.D, n = 3
a-f Values in the same column with different superscripts are significantly different at
5% level.
Moisture levels of food products have a bearing on their dry matter content. The
higher the moisture content the lower the dry matter yield on drying. Therefore
information on moisture content would help the food processors make decisions on
the economics of thermal processing of the foods.
4.1.2. Comparison of moisture content in fruits of two pumpkin species
Relative amounts of moisture in the fruits and seeds of the two pumpkin species are
presented in Figure 2. It was observed that the moisture levels of fruits and seeds of
the two pumpkin species are similar. We therefore inferred that differences in the

43
physicochemical properties of the samples analyzed were not dependent on the
moisture levels.
0
20
40
60
80
100
Fruit withrind
Fruit pulp Whole seed(fresh)
Seed kernel(fresh)
Whole seed(sun dried)
Seed kernel(sun dried)
Moisture content (%)
C. moschata
C. maxima
Figure 2: Moisture content of fruits and seeds of two pumpkin species. Vertical bars
are Mean ±S.D
4.1.3. Crude protein content of raw and dried pumpkin fruits and seeds
The protein content of fruits and seeds of pumpkins studied are presented in Table 3.
One way ANOVA showed that no significant (P<0.05) differences exist between
protein contents of raw and dry samples for fruit with rind of the C. moschata
species. For the other treatments it was found that drying and grinding either
reduced or increased the protein content of the samples. Seed kernels contained
significantly (p<0.05) higher protein than seeds. C. maxima seed kernels contained
higher protein than C. moschata kernels. The values obtained for whole seeds are
similar to those of Achu et al., (2005), who found them to contain 29-35%. Martin
(1998) got 35%, which was higher than cashew nuts (22.8%) and sesame (18.8%).
The fluted pumpkin (Telfairia occidentalis) seed was found to contain 30.1g/100g
protein (Asiegbu, 1987).

44
Table 3: Crude protein content of raw and processed samples of fruits and seeds of
two species of pumpkins (g/100g d.w)
Treatment Raw samples Dry samples L.S.D.
C. moschata C. maxima C. moschata C. maxima P<0.05 Fruit with rind 4.9±0.2c 3.9±0.1a 4.9±0.0c 4.0±0.0b 0.1
Fruit without rind 4.0±0.1c 3.6±0.0a 4.3±0.0d 3.7±0.0b 0.1
Whole seed 36.2±0.3c 35.8±0.1b 35.4±0.3a 36.3±0.2c 0.3
Seed kernel 37.7±0.3a 39.5±0.2c 37.4±0.2a 40.3±0.3b 0.4
Values are mean ± S.D, n = 3
a-d Values in the same row with different superscripts are significantly different at 5% level.
An adult male of about 70 kg body weight requires 35 g of protein daily, therefore,
only 98.93 g of C. moschata seed would be required to provide the minimum daily
protein need. However, 122 g should be consumed to meet the requirement; if an
allowance of 25% is made to take care of digestibility and the limiting sulphur
amino acid (Fagbemi and Oshodi, 1991).
The proteins are of the globulin type and are deficient in lysine and sulphur bearing
amino acids (Vodouhe and Capo-Chichi, 1998). The results show that these Kenyan
species of pumpkins are rich in proteins hence good for children, lactating mothers
and old people who need more proteins for growth, maintenance and repair of worn
out tissues. These substantial amounts of proteins led us further to extract them and
subject them to analysis of their functional properties which are important in their
utilization in food systems.

45
4.1.4. Comparison of crude protein content in different parts of pumpkin fruit
The levels of crude protein contained in the different parts of pumpkin fruit of the
two varieties is shown in Figure 3 below. Analysis of variance showed that
significant differences existed between the different fruit parts. Highly significant
differences (P<0.05) were observed between fruits and seeds, with the latter
containing higher amounts of crude protein. Both raw and dry samples showed a
similar trend in the amounts of the crude protein contained in the different parts of
the pumpkin fruit.
0
5
10
15
20
25
30
35
40
45
C. moschata C. maxima
g/10
0g d
.w
Fruit with rind
Fruit without rind
Whole seed
Seed kernel
Figure 3: Crude protein content in different parts of pumpkin fruit
These results show that pumpkin fruits contain less amounts of crude protein than
the seeds and seed kernels. A review of existing literature does not show any work
that has involved comparison of nutritional content between different plant parts.
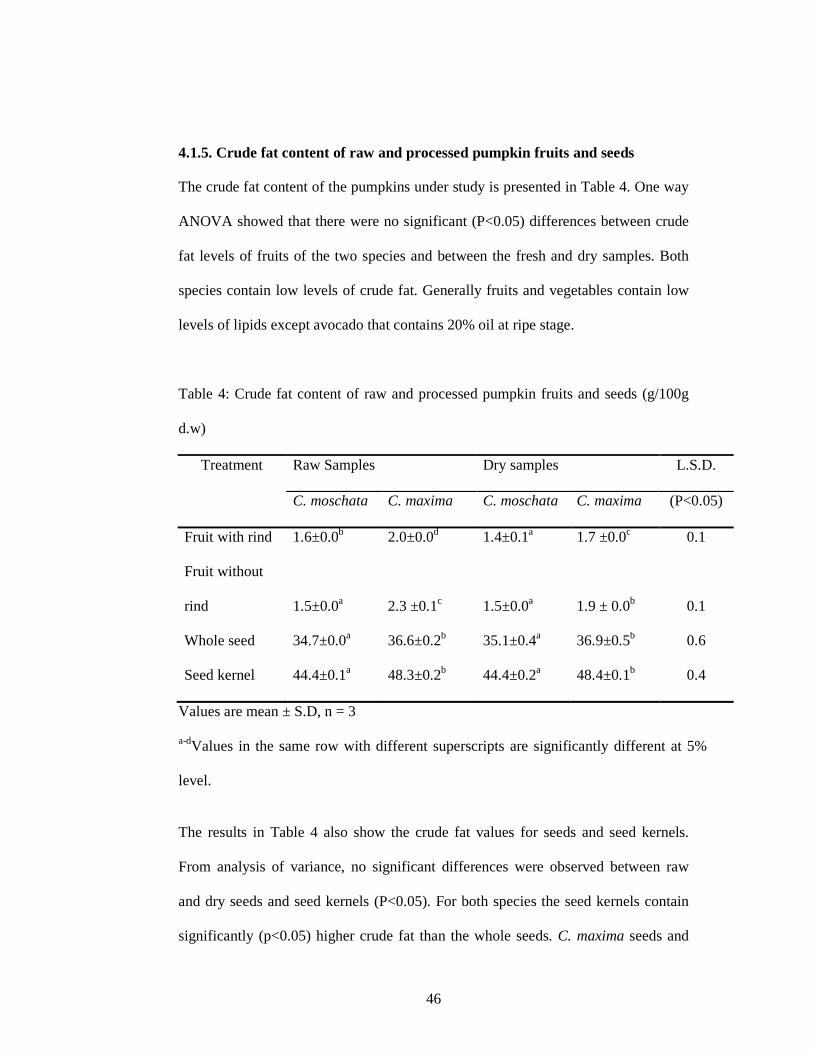
46
4.1.5. Crude fat content of raw and processed pumpkin fruits and seeds
The crude fat content of the pumpkins under study is presented in Table 4. One way
ANOVA showed that there were no significant (P<0.05) differences between crude
fat levels of fruits of the two species and between the fresh and dry samples. Both
species contain low levels of crude fat. Generally fruits and vegetables contain low
levels of lipids except avocado that contains 20% oil at ripe stage.
Table 4: Crude fat content of raw and processed pumpkin fruits and seeds (g/100g
d.w)
Treatment Raw Samples Dry samples L.S.D.
C. moschata C. maxima C. moschata C. maxima (P<0.05)
Fruit with rind 1.6±0.0b 2.0±0.0d 1.4±0.1a 1.7 ±0.0c 0.1
Fruit without
rind 1.5±0.0a 2.3 ±0.1c 1.5±0.0a 1.9 ± 0.0b 0.1
Whole seed 34.7±0.0a 36.6±0.2b 35.1±0.4a 36.9±0.5b 0.6
Seed kernel 44.4±0.1a 48.3±0.2b 44.4±0.2a 48.4±0.1b 0.4
Values are mean ± S.D, n = 3
a-dValues in the same row with different superscripts are significantly different at 5%
level.
The results in Table 4 also show the crude fat values for seeds and seed kernels.
From analysis of variance, no significant differences were observed between raw
and dry seeds and seed kernels (P<0.05). For both species the seed kernels contain
significantly (p<0.05) higher crude fat than the whole seeds. C. maxima seeds and

47
seed kernels contain significantly higher (p<0.05) crude fat than those of C.
moschata. On average, the seed kernels contain high lipid levels (46.3%).
These values are close to those obtained by El- Adawy et al., (2001) for C. pepo
seeds with oil content of 51.01%. Martin (1998) found cucurbit seeds to contain
50% lipids while Achu et al., (2005) found the seeds to contain 41-54 % lipids.
These lipid values are similar to those of sunflower (45.6%), sesame (53.5%), and
peanuts (47.5%) (FAO, 1982), but lower than those for soybean 19.1%
(Oyenuga,1968).These seeds can be considered good sources of vegetable oils.
Fats provide more energy than proteins and carbohydrates; they make a meal more
satisfying, enrich its flavor and delay onset of hunger, and more importantly, are a
medium of fat soluble vitamins (A, D, E, K) and are a source of antioxidants and
bioactive compounds. Fats are also incorporated as structural components of the
brain and cell membranes (Wardlaw and Kessel, 2002).
4.1.6. Comparison of crude fat content in different parts of pumpkin fruit
The crude fat content in fruits and seeds of pumpkin is represented in Figure 4
below. The trend is similar to what was observed for crude protein. The fruits
contained significantly lower (p<0.05) amounts of crude fat than the seeds. The raw
and dry samples both exhibited the same trend in amounts of the crude fat in the
different treatments of the pumpkin fruit parts. Fruits and vegetables have been
found to contain less fat than nutty seeds (Wardlaw and Kessel, 2002).
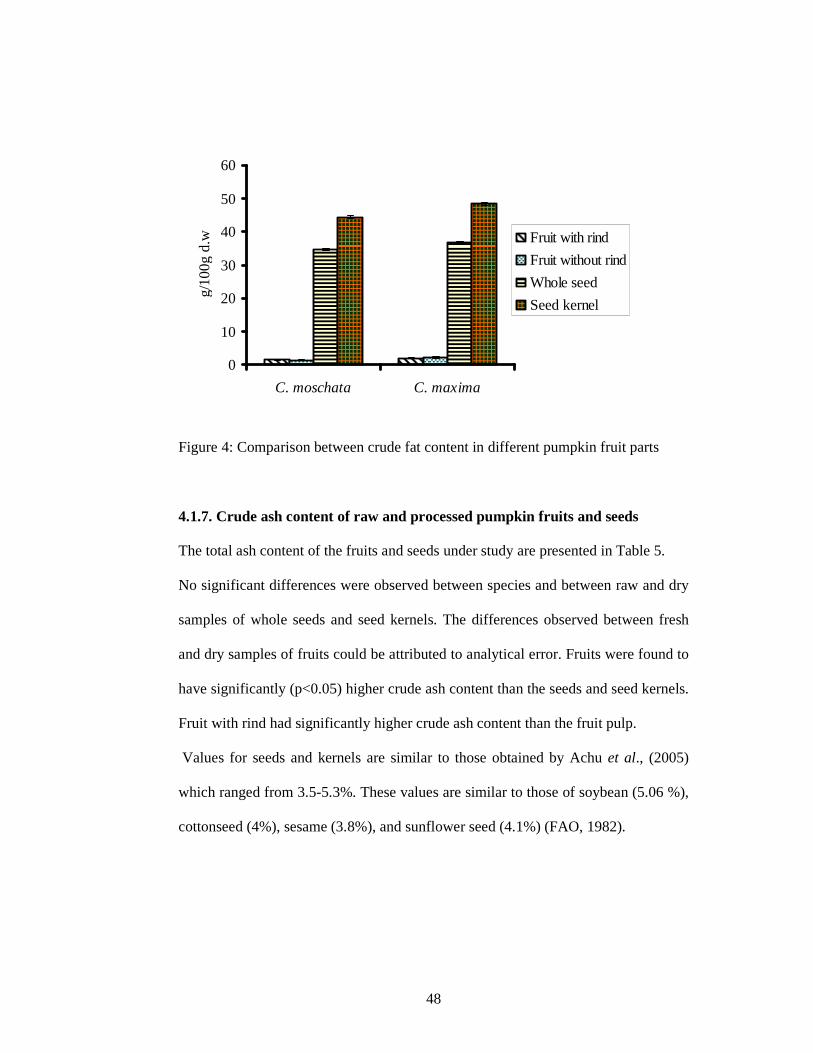
48
0
10
20
30
40
50
60
C. moschata C. maxima
g/10
0g d
.w Fruit with rind
Fruit without rind
Whole seed
Seed kernel
Figure 4: Comparison between crude fat content in different pumpkin fruit parts
4.1.7. Crude ash content of raw and processed pumpkin fruits and seeds
The total ash content of the fruits and seeds under study are presented in Table 5.
No significant differences were observed between species and between raw and dry
samples of whole seeds and seed kernels. The differences observed between fresh
and dry samples of fruits could be attributed to analytical error. Fruits were found to
have significantly (p<0.05) higher crude ash content than the seeds and seed kernels.
Fruit with rind had significantly higher crude ash content than the fruit pulp.
Values for seeds and kernels are similar to those obtained by Achu et al., (2005)
which ranged from 3.5-5.3%. These values are similar to those of soybean (5.06 %),
cottonseed (4%), sesame (3.8%), and sunflower seed (4.1%) (FAO, 1982).

49
Table 5: Crude ash content of raw and processed fruits and seeds of pumpkin
(g/100g d.w)
Treatment Raw Samples Flour Samples L.S.D.
C. moschata C. maxima C. moschata C. maxima (P<0.05)
Fruit with rind 6.7±0.1a 6.9±0.3ab 7.1±0.2bc 6.8±0.1ac 0.3
Fruit pulp 5.9±0.1b 6.5±0.1c 5.6±0.4a 5.9±0.1b 0.2
Whole seed 4.0±0.1bc 3.7±0.3a 4.1±0.3c 3.7±0.4a 0.2
Seed kernel 4.4±0.4bc 4.1±0.1a 4.4 ±0.2c 4.3±0.1ab 0.2
Values are mean ± S.D, n = 3
a-cValues in the same row with different superscripts are significantly different at 5% level.
4.1.8. Comparison of crude ash content in different fruit parts
The crude ash content in the different parts of pumpkin fruit is presented in figure 5
below. The fruit with rind had the highest amount of crude ash while whole seed
contained the lowest amounts. The fruit with rind contained significantly higher
(p<0.05) amounts of crude ash than the fruit pulp. Conversely, the seed kernels
contained higher amounts of crude ash than the whole seed. This trend implies that the
rind of pumpkin fruit contains mineral elements while the seed hull does not contain
significant levels of minerals. A review of literature does not find any work done to
compare amounts of ash in the pumpkin rind as compared to the respective levels in the
fruit pulp. The seed kernels of pumpkin have been found to contain more crude ash
levels than the whole seed (Achu et al., 2005)
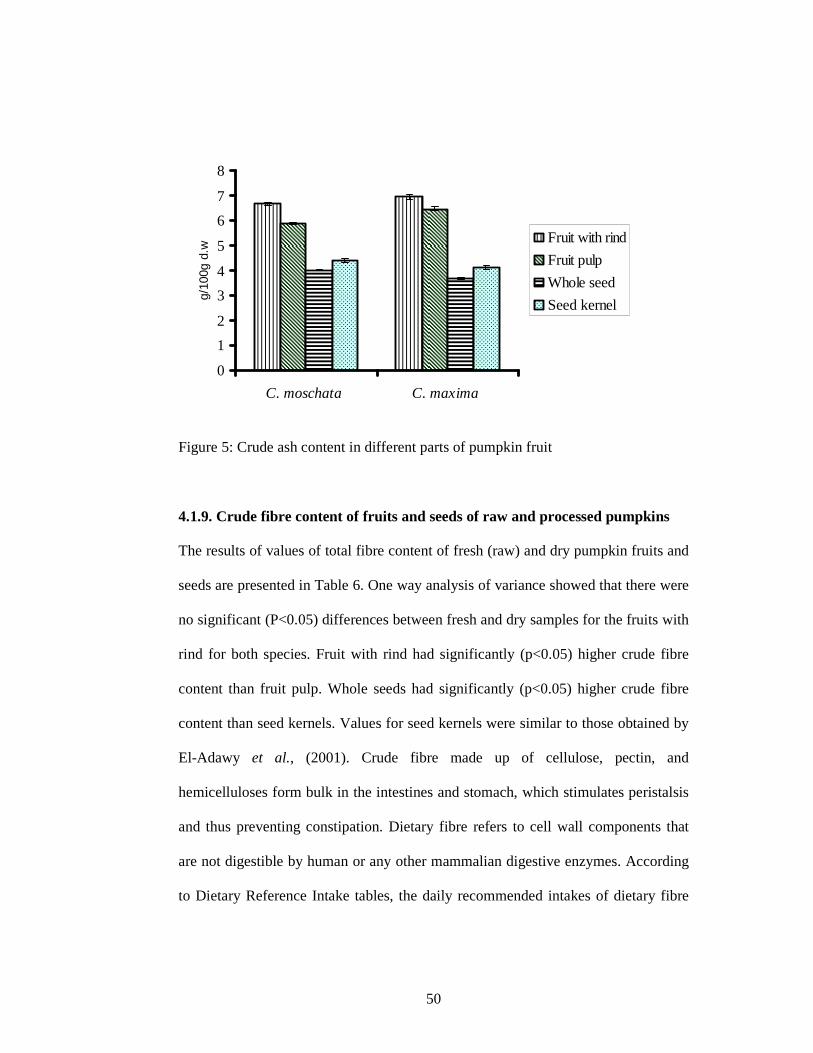
50
0
1
2
3
4
5
6
7
8
C. moschata C. maxima
g/10
0g d
.w
Fruit with rind
Fruit pulp
Whole seed
Seed kernel
Figure 5: Crude ash content in different parts of pumpkin fruit
4.1.9. Crude fibre content of fruits and seeds of raw and processed pumpkins
The results of values of total fibre content of fresh (raw) and dry pumpkin fruits and
seeds are presented in Table 6. One way analysis of variance showed that there were
no significant (P<0.05) differences between fresh and dry samples for the fruits with
rind for both species. Fruit with rind had significantly (p<0.05) higher crude fibre
content than fruit pulp. Whole seeds had significantly (p<0.05) higher crude fibre
content than seed kernels. Values for seed kernels were similar to those obtained by
El-Adawy et al., (2001). Crude fibre made up of cellulose, pectin, and
hemicelluloses form bulk in the intestines and stomach, which stimulates peristalsis
and thus preventing constipation. Dietary fibre refers to cell wall components that
are not digestible by human or any other mammalian digestive enzymes. According
to Dietary Reference Intake tables, the daily recommended intakes of dietary fibre

51
for individuals range between 25-38 g per day depending on age or sex with males
and pregnant females requiring more (Institute of Medicine, 2005).
Table 6: Crude fibre content of raw and processed pumpkin fruits and seeds (g/100g
d.w)
Raw Samples Dry samples L.S.D.
Treatment C. moschata C. maxima C. moschata C. maxima (P<0.05)
Fruit with rind 10.9±0.1a 9.6±0.2a 10.3±0.1a 9.1±0.1a 1.8
Fruit without
rind 9.4±0.3b 8.2±0.1a 9.4±0.1b 8.0±0.1a 0.2
Whole seed 12.6±0.1b 12.0±0.3a 12.6±0.1b 11.9±0.1a 0.2
Seed kernel 4.2±0.1b 3.9±0.2a 4.2±0.4b 3.9±0.1a 0.1
Values are mean ± S.D, n = 3
a-bValues in the same row with different superscripts are significantly different at 5% level.
The Dietary Reference Intakes have been continuously developed since 1996 by the
Food and Nutrition Board, Commission on Life Sciences, National Research
Council, to replace the Recommended Dietary Allowances. According to institute of
Medicine, (2005), the total fibre content in g/100g on fresh weight basis of selected
fruits and vegetables is as follows: watermelon, 0.5; mango, 1.8; fresh pineapple,
1.2; banana, 2.4; apple with skin, 2.7; French beans, 3.1; potato, 3.2; carrot, 5.7; and
bitter gourd, 16.6. Fibre content of vegetables varies owing to many factors which
include growth condition (climate, soil), time of harvest or species (Ozcan and
Haydar (2004).

52
Fibre is determined as material insoluble in dilute acid and dilute alkali. Crude fibre
is a useful parameter in food and feed analysis. It is commonly used as an index of
the feeding value of poultry and stock feeds; seeds high in crude fibre content are
low in nutritional value. A determination of crude fibre is used in evaluating the
efficiency of milling and separating bran from the starchy endosperm. It is a more
direct index of flour purity than colour or ash (Yeshajahu, 1994). Crude fibre is also
useful in the chemical determination of succulence of fresh fruits and vegetables.
Over mature products have increased levels of fibre.
4.1.10. Crude fibre content in different fruit and seed parts
Different parts of the pumpkin species were found to contain different levels of
crude fibre as shown in Figure 6. Of all the fruit parts, that is, fruit with rind, fruit
pulp, whole seed and seed kernel, the whole seed was found to contain the highest
amount of crude fiber, followed by fruit with rind, then fruit pulp, with the seed
kernel having the least amount.
Both pumpkin species exhibited a similar trend in the amounts of crude fibre in
these fruit parts. Fibre rich foods are usually recommended to diabetics since they
are supposed to reduce glycaemic response to the food and consequently reduce the
need for insulin (Guillon and Champ, 2000). Diverse sources of fibre are
recommended for the young population to avoid insulin resistance syndrome and to
decrease the incidence of other metabolic diseases such as obesity and
cardiovascular disease (Guillon and Champ, 2000). Therefore the whole pumpkin
seed could serve as a good source of dietary fibre.
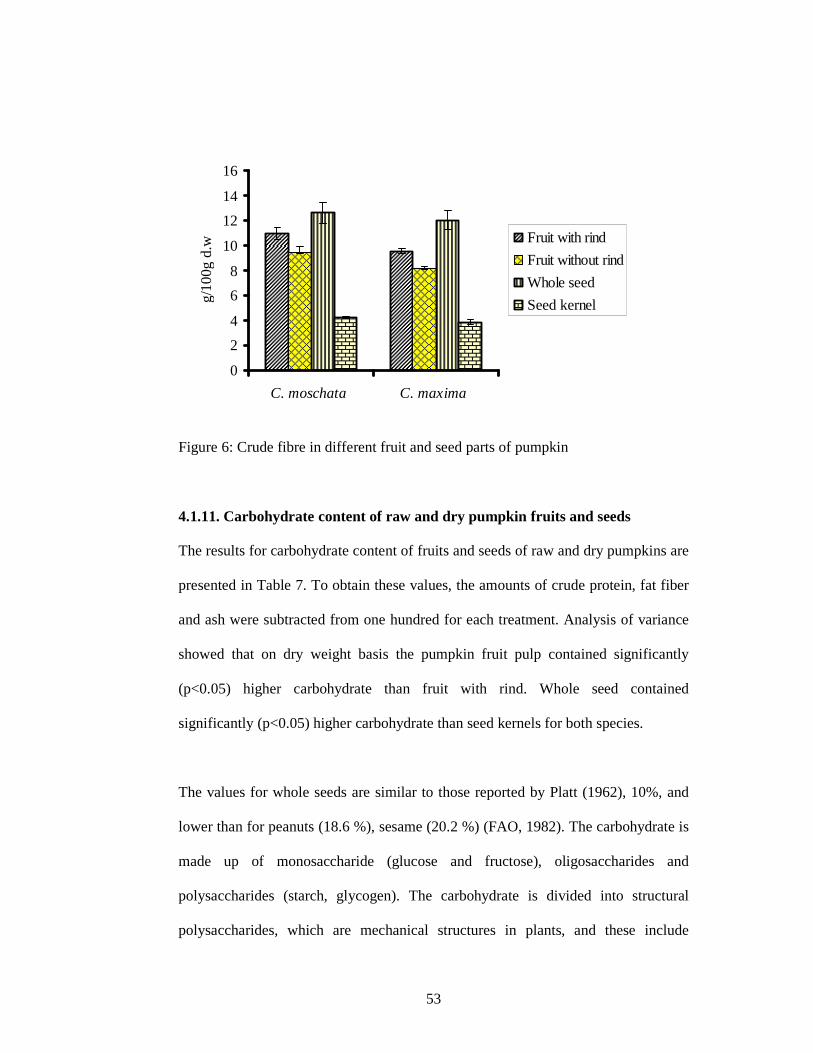
53
0
2
4
6
8
10
12
14
16
C. moschata C. maxima
g/10
0g d
.w Fruit with rind
Fruit without rind
Whole seed
Seed kernel
Figure 6: Crude fibre in different fruit and seed parts of pumpkin
4.1.11. Carbohydrate content of raw and dry pumpkin fruits and seeds
The results for carbohydrate content of fruits and seeds of raw and dry pumpkins are
presented in Table 7. To obtain these values, the amounts of crude protein, fat fiber
and ash were subtracted from one hundred for each treatment. Analysis of variance
showed that on dry weight basis the pumpkin fruit pulp contained significantly
(p<0.05) higher carbohydrate than fruit with rind. Whole seed contained
significantly (p<0.05) higher carbohydrate than seed kernels for both species.
The values for whole seeds are similar to those reported by Platt (1962), 10%, and
lower than for peanuts (18.6 %), sesame (20.2 %) (FAO, 1982). The carbohydrate is
made up of monosaccharide (glucose and fructose), oligosaccharides and
polysaccharides (starch, glycogen). The carbohydrate is divided into structural
polysaccharides, which are mechanical structures in plants, and these include

54
cellulose, hemicellulose and lignin. The nutrient polysaccharides include starch and
glycogen that are metabolic reserves in plants and animals (Southgate, 1991).
Table 7: Carbohydrate content of raw and processed pumpkin fruits and seeds
(g/100g)
Raw samples Dry Samples L.S.D.
Treatment C. moschata C. maxima C. moschata C. maxima (P<0.05)
Fruit with
rind 76.0±0.9a 77.6±0.7b 76.3±1.4a 78.3±0.8c 0.5
Fruit pulp 79.1±2.3a 79.5±0.7a 79.2±0.7a 80.4±0.9b 0.4
Whole seed 12.6±0.9b 11.8±0.5ab 12.9±0.9b 11.3±0.8a 1.0
Seed kernel 9.4±0.7a 4.2±0.7c 9.6±0.9a 3.1±0.5b 0.7
Values are mean ± S.D. n = 3
a-bValues in the same row with different superscripts are significantly different at 5% level.
The results show that pumpkins can potentially be good sources of carbohydrates in
the human nutrition continuum.

55
4.1.12. Carbohydrate content in different parts of pumpkin fruit
The carbohydrate content in the different fruit parts is represented in Figure 7. The
fruit pulp of both pumpkin species contained significantly higher amounts of
carbohydrates than either the whole seed or seed kernel. This could be attributed to
the fact that the whole seeds and seed kernels do contain higher amounts of crude fat
than the either the fruit pulp or fruit with rind.
0
10
20
30
40
50
60
70
80
90
C. moschata C. maxima
g/10
0g d
.w
Fruit with rind
Fruit pulp
Whole seed
Seed kernel
Figure 7: Carbohydrate content in different parts of pumpkin fruits. Vertical bars are
mean ± S.D.
4.2. Hunter (L*, a*, b*) colour and hue angle values for pumpkin fruit flours
The Hunter (L*, a*, b*) colour values for pumpkin fruit pulp that was dehydrated and
ground into flour are presented in Table 8. Drying pre-treatments had varying effects
on the final colour of the pumpkin flour. The treatments of blanching resulted in
significantly (p<0.05) lower chromatic L* values than the control. The flour samples
from fruit pulp that was not subjected to any drying pre-treatment had significantly
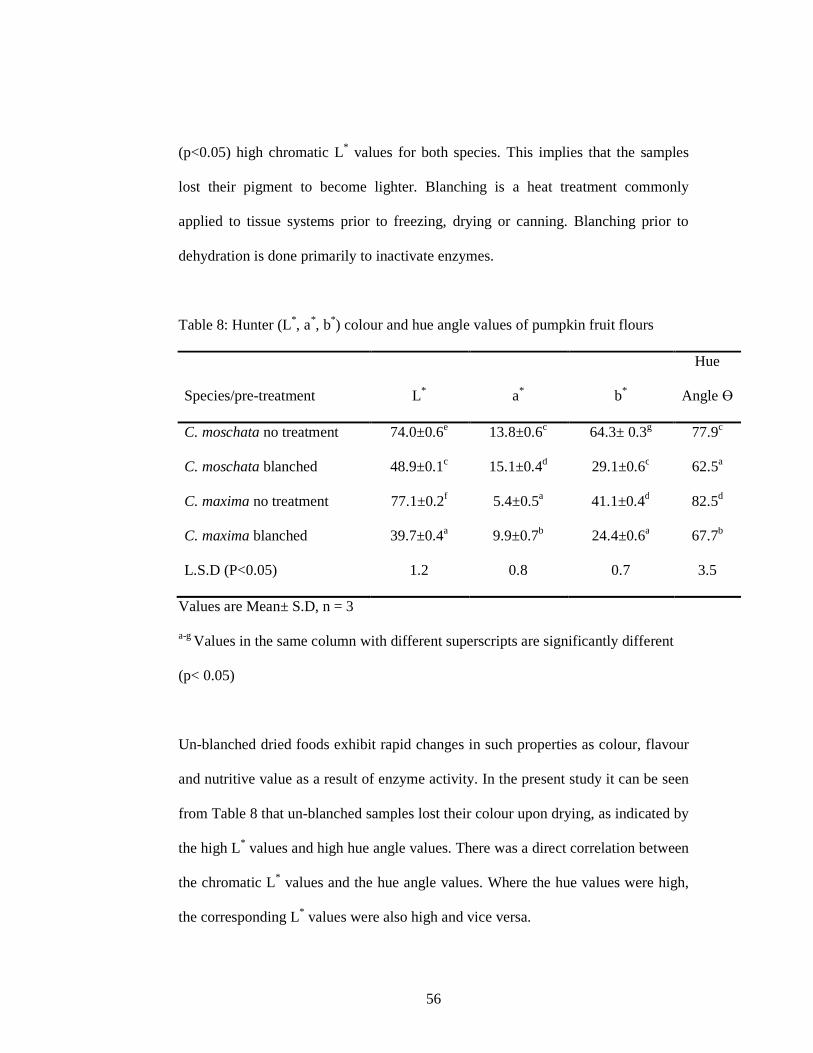
56
(p<0.05) high chromatic L* values for both species. This implies that the samples
lost their pigment to become lighter. Blanching is a heat treatment commonly
applied to tissue systems prior to freezing, drying or canning. Blanching prior to
dehydration is done primarily to inactivate enzymes.
Table 8: Hunter (L*, a*, b*) colour and hue angle values of pumpkin fruit flours
Species/pre-treatment L* a*
b*
Hue
Angle Ө
C. moschata no treatment 74.0±0.6e 13.8±0.6c 64.3± 0.3g 77.9c
C. moschata blanched 48.9±0.1c 15.1±0.4d 29.1±0.6c 62.5a
C. maxima no treatment 77.1±0.2f 5.4±0.5a 41.1±0.4d 82.5d
C. maxima blanched 39.7±0.4a 9.9±0.7b 24.4±0.6a 67.7b
L.S.D (P<0.05) 1.2 0.8 0.7 3.5
Values are Mean± S.D, n = 3
a-g Values in the same column with different superscripts are significantly different
(p< 0.05)
Un-blanched dried foods exhibit rapid changes in such properties as colour, flavour
and nutritive value as a result of enzyme activity. In the present study it can be seen
from Table 8 that un-blanched samples lost their colour upon drying, as indicated by
the high L* values and high hue angle values. There was a direct correlation between
the chromatic L* values and the hue angle values. Where the hue values were high,
the corresponding L* values were also high and vice versa.

57
The chromatic L* value is an indication of brightness, the higher the L* value, the
brighter the samples. The samples that were un-blanched depicted high hue angle
values, implying that they lost some of their orange colour to become more brightly
yellow and less orange. Hue is the characteristic associated with the conventionally
perceived colour. An angle of 900 represents yellow hue.
Objects with a higher hue angle are greener while those with a lower hue angle are
more red -orange (Francis, 1980). The chromatic a* values represent redness. The
higher the a* values the more red the samples are. The chromatic b* value represents
yellowness. The higher the b* value, the more yellow the sample is. The results
showed that the blanched samples had significantly (p<0.05) higher a* values than
the un-blanched samples. This shows that the blanched samples retained their
colour. The un-blanched samples had significantly (p<0.05) lower b* values than
the blanched ones, which means that the latter were less yellow (more orange) since
the blanching helped them retain their colour.
Blanching may provoke some loses of carotenoids, but the inactivation of oxidative
enzymes that occurs in this type of heat treatment prevents further and greater losses
of carotenoids during holding before thermal processing, slow processing and
storage ( Rodriguez-Amaya and Kimura, 2004).
Two of the more heat-resistant and widely distributed enzymes in plant tissues are
peroxidase and catalase. Activity of these enzymes, therefore, can be used to
evaluate the effectiveness of a blanching treatment. If both are inactivated then it can

58
be assumed that other significant enzymes also are inactivated. In this study the
peroxidase test was done and between the blanching times of 0, 2, 4, 5, 6, 8; and 10
minutes, the peroxidase test was negative at 5 minutes, at which time there was no
colour change in the solution. Below 5 minutes, there was a deep pink–brown colour
in the resulting solution. Therefore 5 minutes is the most efficient blanching time at
a temperature of 960C for pumpkin slices of 12 cm length and 1.5 cm thickness.
4.3. Beta-carotene content in raw and dried pumpkin fruits
4.3.1. Beta-carotene content in raw pumpkins
The β-carotene content in the two species of pumpkin studied is presented in Table
9. The results show that fresh fruits with rind of C. maxima contain significantly
(p<0.05) higher beta-carotene than C. moschata. For both species generally the fruit
with rind contains more beta-carotene than the fruit pulp.
Table 9: Beta-carotene content in raw pumpkin fruits (µg/g d.w)
Variety/treatment Β-carotene content
C. maxima with rind 582.7±3.9c
C. maxima pulp 538.0 ±1.7b
C. moschata with rind 534.5±10.2b
C. moschata pulp 518.7±6.9a
L.S.D. (P<0.05) 18.5
Values are mean ± S.D, n = 3
a-c Values in the same column with different superscripts are significantly different at
5% level
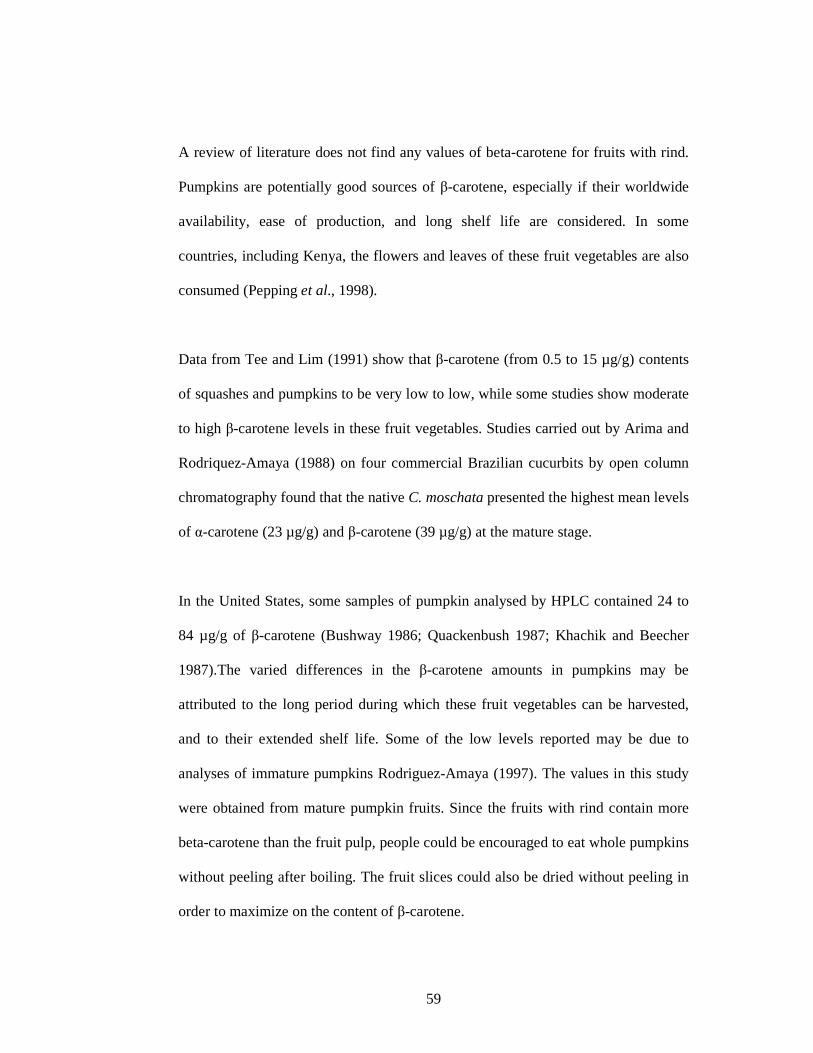
59
A review of literature does not find any values of beta-carotene for fruits with rind.
Pumpkins are potentially good sources of β-carotene, especially if their worldwide
availability, ease of production, and long shelf life are considered. In some
countries, including Kenya, the flowers and leaves of these fruit vegetables are also
consumed (Pepping et al., 1998).
Data from Tee and Lim (1991) show that β-carotene (from 0.5 to 15 µg/g) contents
of squashes and pumpkins to be very low to low, while some studies show moderate
to high β-carotene levels in these fruit vegetables. Studies carried out by Arima and
Rodriquez-Amaya (1988) on four commercial Brazilian cucurbits by open column
chromatography found that the native C. moschata presented the highest mean levels
of α-carotene (23 µg/g) and β-carotene (39 µg/g) at the mature stage.
In the United States, some samples of pumpkin analysed by HPLC contained 24 to
84 µg/g of β-carotene (Bushway 1986; Quackenbush 1987; Khachik and Beecher
1987).The varied differences in the β-carotene amounts in pumpkins may be
attributed to the long period during which these fruit vegetables can be harvested,
and to their extended shelf life. Some of the low levels reported may be due to
analyses of immature pumpkins Rodriguez-Amaya (1997). The values in this study
were obtained from mature pumpkin fruits. Since the fruits with rind contain more
beta-carotene than the fruit pulp, people could be encouraged to eat whole pumpkins
without peeling after boiling. The fruit slices could also be dried without peeling in
order to maximize on the content of β-carotene.

60
4.3.2. Beta carotene content of flours from blanched and un-blanched dried
pumpkin fruits
The values for β-carotene content in dried pumpkin fruit pulp subjected to blanching
and those not blanched are presented in Table 10. The blanched samples depicted a
significantly (p<0.05) higher content of β-carotene than the un-blanched ones.
Blanching is an important thermal treatment that inactivates oxidative enzymes that
would degrade carotenoids (Rodriguez-Amaya and Kimura, 2004). This drying pre-
treatment also preserves colour of the tissues. This was observed in the results of
colour presented earlier in Table 8. If processing of pumpkins by drying is to be
adopted both at cottage and industrial level then it would be important to incorporate
this thermal procedure.
The results in Table 10 also show that without any prior treatment, flours from
fruits with rind had significantly (p< 0.05) higher beta-carotene levels than the
respective pulp. This trend was also observed earlier for fresh fruits. Some
investigations have shown that carotenoids, including the provitamin A, are more
concentrated in the peel than in the pulp of some fruits (Gross, 1987). Thus, the
peeling of fruits and vegetables can reduce the beta-carotene content considerably.
In paired samples of immature C. pepo and C. moschata, the whole fruits had β-
carotene content five times greater than the peeled samples (1.5 compared to 0.3 and
1.0 compared to 0.2 µg/g, respectively (Arima and Rodriguez-Amaya, 1988).
The peel of the cucurbit hybrid Tetsukabuto has been found to contain 101 µg/g β-
carotene while the pulp had only 16µg/g β-carotene (Rodriguez-Amaya and Kimura,
2004). In this study, the rind (peel) was not analyzed separately from the pulp but it

61
was never the less observed that the fruits with rind contained more β-carotene than
the pulp. The flour from C. maxima contained significantly more β-carotene than the
flour from C. moschata fruits. This difference could be due to the species
differences since the period of analysis after harvest was the same.
Comparison of the β-carotene levels of raw fruits (Table 9) and that of dried fruit
(flours) in Table10, shows that thermal processing of the pumpkin fruit vegetables
caused substantial loss of the β-carotene (61.0% for C. moschata and 44.3% for C.
maxima). This notwithstanding, the retention levels of the β –carotene in the flours
would still be sufficient to make the products good sources of pro-vitamin because
the raw material used was mature enough to provide high amounts of β-carotene.
Table 10: Beta-carotene content in pumpkin fruit flours (µg/g d.w)
Treatment Variety
C. moschata C. maxima
Fruit pulp no treatment 244.1±3.8a 252.6±2.6a
Fruit with rind no treat’nt 289.2±7.2c 362.7±3.5c
Fruit pulp blanched 262.2±4.5b 299.7±0.1b
Fruit with rind blanched 315.8±7.2d 492.8±6.8d
L.S.D. (P<0.05) 8.7 5.8
Values are mean ± S.D, n = 3 a-d Values in the same column with different superscripts are significantly different at
5% level.

62
The major cause of carotenoid destruction during processing and storage of foods is
enzymatic or non-enzymatic oxidation. Isomerization of trans-carotenoids to the cis-
isomers, particularly during heat treatment, alters their biological activity and
discolors foods, but not to the same extent as oxidation. Enzymatic degradation of
carotenoids may be a more serious problem than thermal decomposition in many
foods (Rodriguez-Amaya, 2001).
In a study by Arima et al., (1988) canned sweetened C. moschata pumpkin, which
was subjected to drastic processing conditions (10-minute blanching, disintegrating,
thermal processing in an open steam jacketed kettle for 40 minutes, and immersion
of filled and sealed cans in boiling water for 10 minutes), the β-carotene content
decreased by 35%. Therefore, thermal processing could be used to add value and
diversify the utilization of pumpkins.
4.4. Starch content in pumpkin fruits
Starch was isolated from the two species of pumpkin and quantified using an
analytical weighing balance. The results obtained showed that C. maxima yielded
significantly (p<0.05) higher starch content (9.6 ± 2.2 %) than C. moschata (3.8 ±
1.4 %). The results agree with those reported by Corrigan et al., (2001) and Hurst et
al., (1995) who reported that the fruit dry matter starch content may range from <
3% to > 60 % respectively. Studies have shown that other plant food materials like
partly ripe bananas contain 8.8% starch while fresh corn and white sweet potatoes
contain about 15% starch (Yeshajahu et al., 1994). The C. maxima species can be a
potential source of starch especially in consideration of its high yields of

63
approximately 22 tons per acre. Starch is an important biopolymer that has found
various applications in the food and non-food industrial sector as a raw material. As
mentioned earlier, starch, calculated as calories, represents 80 % of the world’s food
supply (Guan et al., 1998).
4.5. Elemental mineral content of pumpkin fruit and seed flours
4.5.1. Mineral content of pumpkin fruit and seed flours of C. moschata
The results for mineral composition of fruits and seeds under various treatments for
dry samples are presented in Table 11. The fruits and seeds of C. moschata
contained significantly (p<0.05) higher levels of P, K, Mg and Na than Fe, Zn, Cu
and Mn. The fruits and seeds can be good sources of all the essential minerals
required by human beings for a healthy and active life. Generally, it can be observed
from the results that seeds flours contain significantly (p< 0.05) higher amounts of
minerals than the fruit flours.
The seed kernels contained significantly (p<0.05) higher amounts of minerals than
the seeds. This could imply that the hull contains less minerals and this is similar to
the trend observed for crude ash values. This trend is consistent with studies done on
C. maxima by Alfawaz (2004) who also found that the seeds contained less crude
ash than the seed kernels (4.59% as compared to 5.15%). Of all the nine elements
studied, copper was in the smallest amounts, except for the C. moschata fruit pulp in
which manganese was in the smallest amount.

64
Table 11: Mineral composition of fruit and seed flours of C. moschata (mg/100g
d.w)
Value
C. moschata fruit flours C. moschata seed flours L.S.D.
Element Fruit pulp Fruit with rind whole seed seed kernel P<0.05
Copper 0.9 0.2a 0.9±0.1a 1.5±0.2b 1.6±0.1b 0.3
Zinc 3.6±0.4a 5.3±0.3b 8.1±0.4c 11.1±0.3d 0.6
Manganese 0.7±0.1a 2.1±0.1b 3.1±0.1c 3.9±0.1d 0.1
Magnesium 68.4 ±1.1a 159.3±2.1b 318.4±2.9c 537.8±2.7d 4.7
Sodium 40.9±0.8c 61.2±0.8b 24.2±0.4a 22.8±1.1a 1.8
Potassium 1040.9±13.6c 1253.8±11.9d 417.3±6.9a 493.6±17.1b 17.5
Phosphorus 562.6±2.8a 714.9±4.8b 928.9±1.9c 980.8±4.4d 8.1
Iron 5.4±0.1a 9.3±0.4c 7.4±0.1b 13.6±0.9d 1.2
Calcium 6.3±0.2c 9.3±0.4d 5.0±0.2b 2.4±0.1a 0.5 Values are Mean ± S.D, n = 3
a-dValues in the same row with different superscripts are significantly different at 5%
level.
The major minerals required in the diet are sodium, calcium, magnesium, potassium,
phosphorus, chlorine, and sulphur. The latter two were not analyzed in this study.
Other minerals that are required in only micro quantities (less than 100 mg/day) are
called trace elements and they include iron, zinc, copper, selenium, iodide, fluoride,
chromium, manganese and molybdenum. Out of these those analyzed in this study
were zinc, copper, manganese and iron.

65
4.5.2. Mineral composition of pumpkin fruit and seed flours of C. maxima
The composition of minerals in the fruit and seed flours of the C. maxima species of
pumpkin is presented in Table 12. In the seed and fruit flours, levels of P, K, and Mg
were significantly (p<0.05) higher than the other elements. For most elements the
seed kernels contain higher amounts than whole seeds. These results are consistent
with those reported by El-Adawy et al., (2001). This can be explained by the fact
that the hull of the seeds does contain low levels of mineral elements if any, thus
lowering the overall content of the minerals in the whole seed. Pumpkin seeds are
rich plant source of the mineral zinc which has been reported to be good for the male
prostate gland and for body immune system. Zinc has a range of functions. It plays a
crucial role in growth and cell division where it is required for protein and DNA
synthesis, in insulin activity, in the metabolism of the ovaries and testes and in liver
function. It is a component of many enzymes that are involved in the metabolism of
proteins, carbohydrates, lipids and energy. This vital role of zinc makes infants,
children, adolescents and pregnant women especially at risk for an inadequate zinc
intake (Docrep, 2003).Consumption of pumpkin seeds by all age groups should
therefore be encouraged through nutrition programs.

66
Table 12: Mineral composition of fruit and seed flours of C. maxima (mg/100g d. w)
Value
C. maxima fruit flours C. maxima seed flours L.S.D.
Element Fruit pulp Fruit with rind whole seed seed kernel P<0.05
Copper 0.47±0.1a 0.5±0.3b 2.4±0.1d 1.9±0.1c 0.1
Zinc 2.4±0.2a 4.0±0.2b 8.7±0.3d 7.6±0.4c 0.6
Manganese 0.3±0.1a 1.3±0.2b 3.1±0.2c 3.1±0.2c 0.3
Magnesium 35.9±1.7b 15.2±0.3a 286.0±4.4c 399.4±2.7d 6.3
Sodium 41.3±0.6c 64.4±0.4d 17.8±0.2a 20.6±0.2b 0.8
Potassium 981.8±4.3c 1148.7±3.1d 351.6±7.2a 399.6±9.3b 13.9
Phosphorus 239.6±7.2a 440.5±7.2b 824.8±5.2d 776.9±2.3c 8.3
Iron 1.1 ±0.2a 5.1±0.1b 6.1±0.9c 12.8±0.4d 0.9
Calcium 12.3±0.4c 15.2±0.1d 3.3±0.2b 2.1±0.2a 0.5
Values are mean ± S.D, n = 3
a-dValues in the same row with different superscripts are significantly different at 5% level.
There is still lack of quantitative estimates on prevalence of zinc deficiencies globally,
hence policy makers are unable to address the problem (Brown et al., 2001).
4.5.3. Relative mineral content in fruit flours of C. moschata and C. maxima
4.5.3.1. Macro-minerals in fruit flours
The macro-minerals, namely magnesium, sodium, potassium, phosphorus and
calcium contained in the fruits of the two pumpkin species are illustrated in Figure
8. Comparatively, for magnesium the C. maxima fruit pulp contained the highest
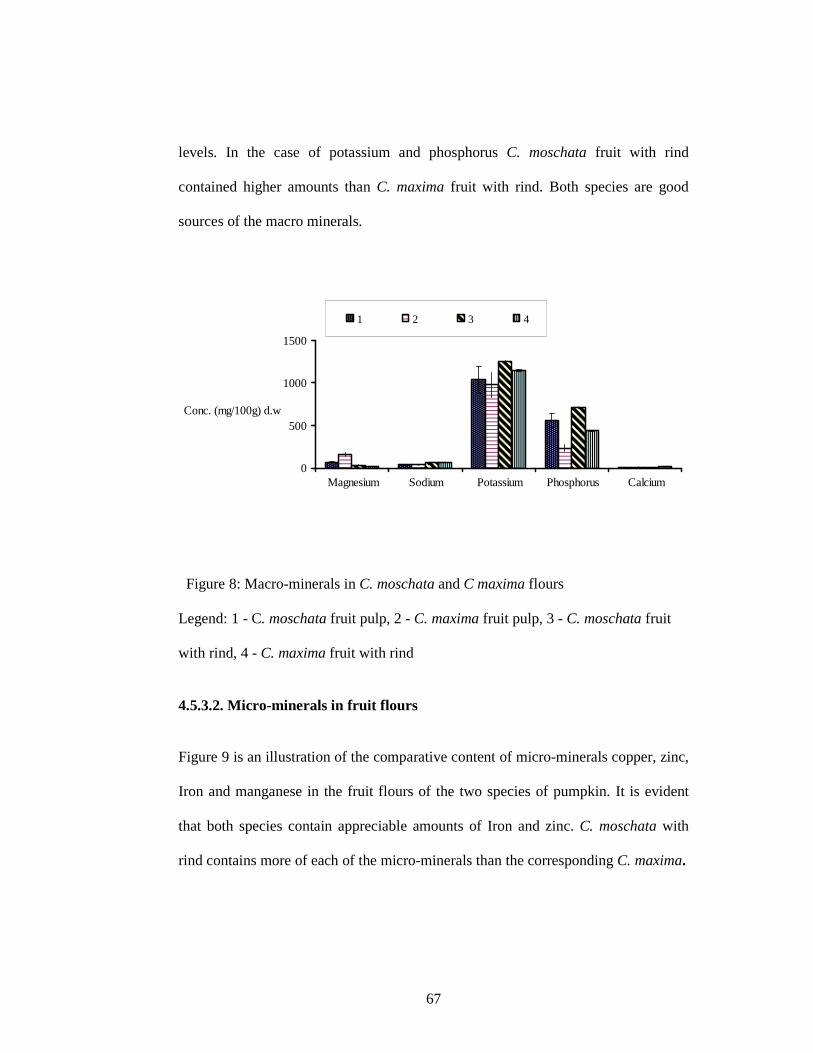
67
levels. In the case of potassium and phosphorus C. moschata fruit with rind
contained higher amounts than C. maxima fruit with rind. Both species are good
sources of the macro minerals.
0
500
1000
1500
Magnesium Sodium Potassium Phosphorus Calcium
Conc. (mg/100g) d.w
1 2 3 4
Figure 8: Macro-minerals in C. moschata and C maxima flours
Legend: 1 - C. moschata fruit pulp, 2 - C. maxima fruit pulp, 3 - C. moschata fruit
with rind, 4 - C. maxima fruit with rind
4.5.3.2. Micro-minerals in fruit flours
Figure 9 is an illustration of the comparative content of micro-minerals copper, zinc,
Iron and manganese in the fruit flours of the two species of pumpkin. It is evident
that both species contain appreciable amounts of Iron and zinc. C. moschata with
rind contains more of each of the micro-minerals than the corresponding C. maxima.

68
0.00
2.00
4.00
6.00
8.00
10.00
12.00
Copper Zinc Iron Manganese
Conc. (mg/100g) d.w
1 2 3 4
Figure 9: Micro-minerals in C. moschata and C. maxima fruit flours
Legend: 1 - C. moschata fruit pulp, 2 - C. maxima fruit pulp, 3 - C. moschata fruit
with rind, 4 - C. maxima fruit with rind.
4.5.4. Mineral content in seed flours of C. moschata and C. maxima
4.5.4.1. Macro-minerals in seed flours
The macro-mineral content in seed flours of both pumpkin species are illustrated in
Figure 10. Both species contained significantly higher amounts of magnesium,
potassium and phosphorus than calcium and sodium. C. moschata seed kernel was
found to contain higher amounts of each of the macro-minerals than its
corresponding whole seeds and the seed kernels and whole seeds of C. maxima. A
review of literature has not found any work that has compared the amounts of
minerals in whole seeds and seed kernels of pumpkin or any other nuts.

69
0
200
400
600
800
1000
1200
Magnesium Sodium Potassium Phosphorus Calcium
Conc. (mg/100g) d.w
1 2 3 4
Figure 10: Macro-minerals in C. moschata and C. maxima seed flours.
Legend: 1 - C. moschata whole seed, 2 - C. maxima whole seed, 3 - C. moschata
seed kernel, 4 - C. maxima seed kernel.
4.5.4.2. Micro-minerals in seed flours
A comparison between mineral content in whole seeds and seed kernels of the two
species of pumpkin are illustrated in Figure 11. It was found that both seeds and
seed kernels contained almost equal amounts of zinc, copper and manganese. In the
case of Iron C. maxima whole seed contained the lowest amounts while C. moschata
seed kernel contained the highest amounts of the micro-mineral. From these results
it can be seen that C. moschata is superior in terms of micro-mineral content.

70
0
5
10
15
20
Copper Zinc Iron Manganese
Conc. (mg/100g) d.w
1 2 3 4
Figure 11: Micro-minerals in C. moschata and C. maxima seed flours
Legend: 1 - C. moschata fruit pulp, 2 - C. maxima fruit pulp, 3 - C. moschata fruit
with rind, 4 - C. maxima fruit with rind
4.6. Characteristics of pumpkin seed oils
4.6.1. Physicochemical properties of pumpkin seed oil
The results of values for the physicochemical properties of pumpkin seed oils of the
two species of pumpkin under study are presented in Table 13. A one way analysis
of variance showed that there were no significant (P<0.05) differences in specific
values of the oils of the two species, except for acid value in which C. maxima oil
had a significantly (p<0.05) higher amount. Saponification value gives an indication
of molecular weight. The smaller the saponification number the larger the average
molecular weight of the triacylglycerols present. The high iodine values indicate that
the oil contains unsaturated fatty acids. Kinkela (1990) reported that Cucurbitaceae
seed oils contain 68.5% linoleic acid. The oils could be used as drying oil for
manufacture of cosmetics, oil paints and varnishes (Odoemelam, 2005).

71
Saponification is the process of breaking down a neutral fat into glycerol and fatty
acids by treatment with alkali:
Triacylglycerol + 3 KOH → Glycerol + 3 Fatty acid salts of potassium
The saponification number is defined as the mg of KOH required to saponify one
gram of fat.
Table 13: Physicochemical characteristics of pumpkin seed oil
Property C. moschata
C. maxima
L.S.D.
(P<0.05)
Refractive index (250C) 1.5±0.0a 1.5±0.0a 0.0
Specific gravity (15.50C) 0.9±0.0a 0.9±0.0a 0.0
Saponification value 201.9±4.9a 205.4±3.9a 10.2
Wij’s Iodine value 109.7±1.1a 112.2±1.6a 3.2
Acid value 1.2±0.0b 2.7±0.1a 0.1
Peroxide value 3.5±0.2a 3.8±0.3a 0.5
Values are mean ± S.D, n = 3
a-bValues in the same row with different superscripts are significantly different at 5% level.
4.6.2. Fatty acid profile of pumpkin seed oil
The fatty acid composition of lipids from the seeds of C. moschata and C. maxima
are presented in Figure 12. There were wide variations in the contents of palmitic,
Stearic, oleic and linoleic acids of the seed oils. The C. maxima seed oil contained
higher percentages linoleic acid than C. moschata oil.

72
The major unsaturated fatty acids in both oils were linoleic (9, 12-octadecadienoic
acid) acid followed by oleic acid (9-octadecenoic acid). The presence of high
amounts of the essential linoleic acid suggests that these oils are highly nutritious,
due to their ability to reduce the serum cholesterol. Both oils could be utilized as
edible cooking or salad oils or for margarine manufacture owing to their rich content
of both oleic and linoleic acids. The major saturated fatty acids in both oils were
palmitic acid (hexadecanoic acid) and stearic acid (octadecanoic acid). These results
are consistent with the findings of Al-Khalifa (1996) and Tarek et al. (2001).
0
10
20
30
40
50
60
Palmitic(16:0)
Stearic(18:0)
Oleic(18:1)
Linoleic(18:2)
Others
Fatty acid
Fatty acid content (%)
C. maxima
C. moschata
Figure 12: Fatty acid content in C. maxima and C. moschata seed oil
The comparative content of different fatty acids in the two species of pumpkin
analyzed showed that C. maxima seed oil contained more stearic and linoleic fatty

73
acids than C. moschata seed oil, while palmitic and oleic acids were in higher
amounts in C. moschata than C. maxima.
4.7. Functional properties of pumpkin seed flours and protein isolates
4.7.1. Protein solubility profile
Protein solubility characteristics are influenced by factors such as origin, processing
conditions, pH, ionic strength and the presence of other ingredients (Kinsella, 1981).
The protein solubility profiles at various pH values of protein isolates and defatted
flours of two species of pumpkin are illustrated in Figure 13.
From the results it was found that nitrogen solubility was pH –dependent. Minimum
solubilities were observed at pH 4 which is called the isoelectric point (pI). At this
point there was a sharp increase in nitrogen solubility on either side. The pI of a
protein is the pH at which the protein has an equal number of positive and negative
charges; it is the pH at which the protein carries no net charge. The pI is of
significance in protein purification because it is the pH at which solubility is often
minimal and at which mobility in an electro- focusing system is zero (and therefore
the point at which the protein will accumulate) and less water interacts with the
protein (Vojdani, 1996).
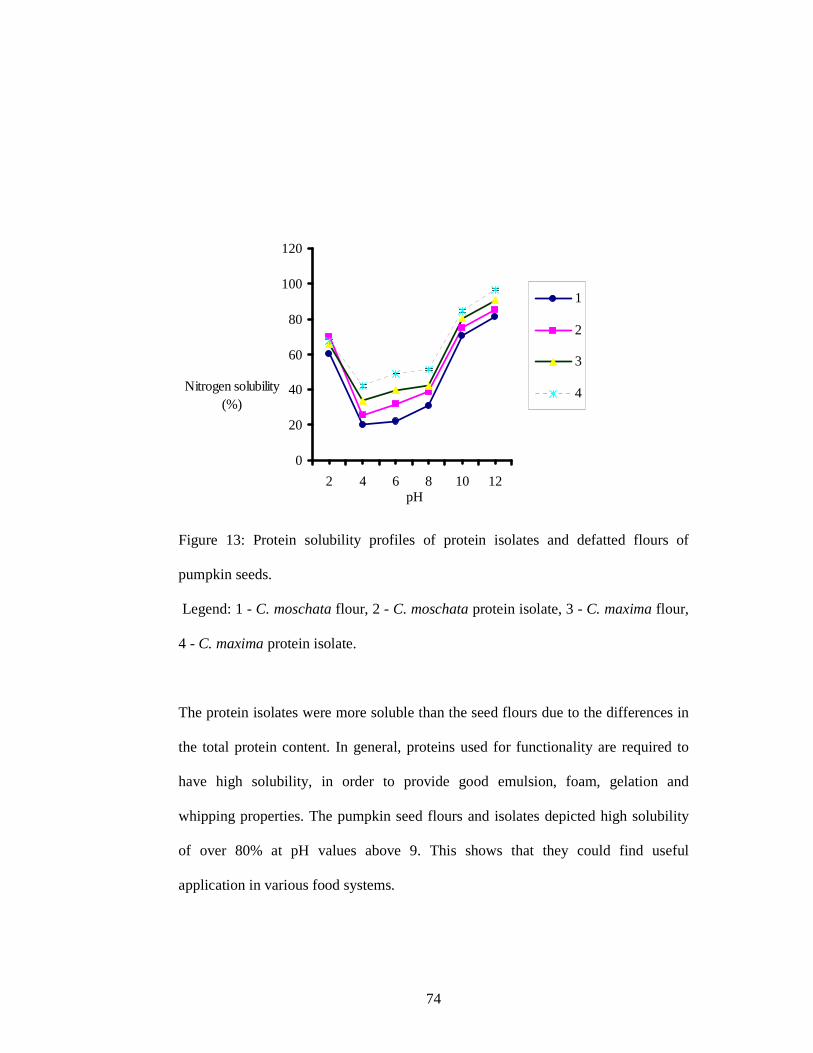
74
0
20
40
60
80
100
120
2 4 6 8 10 12pH
Nitrogen solubility (%)
1
2
3
4
Figure 13: Protein solubility profiles of protein isolates and defatted flours of
pumpkin seeds.
Legend: 1 - C. moschata flour, 2 - C. moschata protein isolate, 3 - C. maxima flour,
4 - C. maxima protein isolate.
The protein isolates were more soluble than the seed flours due to the differences in
the total protein content. In general, proteins used for functionality are required to
have high solubility, in order to provide good emulsion, foam, gelation and
whipping properties. The pumpkin seed flours and isolates depicted high solubility
of over 80% at pH values above 9. This shows that they could find useful
application in various food systems.
75
4.7.2. pH values of pumpkin seed kernel flours and protein isolates
The pH values of the flours and protein are presented in Table 14. The protein
isolates were found to be more acidic than the flour samples due to their higher
concentration of protein. The acidity of these samples was in general agreement with
pH values of many legume flours, including soybean flour (Sosulski et al., 1976).
4.7.3. Water- and oil-holding capacity
The water- and oil –holding capacities of the flours and protein isolates are shown in
Table 14. For both species the protein isolates had higher water holding capacity
than the respective flour samples. This could be attributed to the amount of protein
available in the samples.
Water holding capacity as an index of the amount of water retained within the
protein matrix shows the functional capacity of the seed protein in thickening and
food formulations.
Mwasaru et al., (1999) studied the effect of extraction pH on the water and oil
holding capacity, but in this study the proteins were all extracted at pH 8.5. The
values for oil absorption indicate that proteins isolates had significantly (p<0.05)
higher oil holding capacity than the flour samples. Oil absorption is attributed to
physical entrapment of oil and is important in flavour retention and mouth feel of
foods (Mwasaru et al., 1999).

76
Table 14: Functional properties of seed flours and protein isolates of pumpkin seeds
Functional properties
C. maxima C. maxima C. moschata C. moschata L.S.D.
flour protein Flour Protein P<0.05
Ph 6.6±0.1d 5.9± 0.1b 6.3±0.1c 5.6±0.1a 0.1
Water holding capacity
(mg/g) 2.2±0.2b 2.7 ±0.1c 1.9 ±0.1a 2.4 ± 0.2b 0.2
Oil holding capacity (ml/g) 1.7± 0.1b 2.2 ± 0.1d 1.5 ± 0.1a 2.0 ± 0.1c 0.2
Emulsifying activity (%) 44.1±0.2b 47.0±2.0c 42.1±0.2a 46.2±0.6c 1.9
Emulsifying stability (%) 55.2±0.6b 60.6±0.9d 52.0 ± 0.5a 57.2±0.6c 1.3
Foaming activity (%) 26.2±0.2a 31.3±0.3b 38.4± 0.6c 43.0 ±0.8d 0.9
Foaming stability (%) 60.0±1.0c 65.3±1.5d 39.2± 0.3a 44.6±0.6b 1.8
Values are Mean ± S.D, n=3
a-dValues in the same row with different superscripts are significantly different at 5%
level.
4.7.4. Emulsifying activity and emulsion stability
The values of emulsifying activity and stability for seed flours and protein isolates
for the two pumpkin species are presented in Table 14. The analyses were done
without modifying the pH of the solution. There were significant differences
between the emulsifying capacities and emulsion stabilities of the flours and protein
isolates, with flours having lower values of each property tested (p<0.05).

77
The ability of proteins to aid in the formation and stabilization of emulsions is
important in applications in food systems such as chopped, comminuted meats, cake
batters, coffee creamers, mayonnaise, salad dressings and frozen desserts (Kinsella,
1981). It has also been reported that emulsifying properties can be manipulated by
enhancing their solubility properties since the two properties are inter related.
4.7.5. Whipping properties
The foam expansion and foam stability profiles of flours and protein isolates of
pumpkin seeds are presented in Table 14. The results show that there were
significant differences (p<0.05) between whipping properties of the flours and
isolates, with the latter depicting higher values. The foam stability values were
higher than the respective values for foam expansion. The foaming power of
proteins can be enhanced by partial hydrolysis which, however, results in decreased
foam stability, thus a compromise has to be made between foamability and foam
stability depending on the application (Mwasaru et al., 1999).
The foaming property is important in the manufacture of foods such as whipped
toppings, fudges, chiffon desserts and angel cakes. Proteins stabilize foams by
forming a cohesive but deformable film which ideally resists excessive localized
thinning (Kinsella, 1981). It can be seen that the pumpkin proteins can be ideal for
these food applications.

78
4.7.6. Gelation Properties
The least gelation concentration (LGC) of seed flours and protein isolates of the two
pumpkin species are given in Table 15. The flour samples of both seeds had an LGC
of 8% while the protein isolates had LGC of 6%. The value for the flours is in
agreement with the value of 8% obtained for defatted pumpkin flours for C. maxima
(Lazos, 1992).
Table 15: Gelation properties of seed flours and protein isolates of pumpkin seeds
Flour and protein isolate
concentration
% (w/v)
C. maxima
Flour
C. maxima
Protein isolate
C. moschata
Flour isolate
C. moschata
Protein
isolate
2 _ _ _ _
4 _ ± _ ±
6 ± + ± +
8 + + + +
10 + + + +
12 + + + +
14 + + + +
16 + + + +
18 + + + +
20 + + + +
_,Not gelled; ±, gelled slightly; +, gelled

79
A commercial soy protein isolate required a minimum concentration of 12% to form
a stable gel (Mwasaru et al., 1999). Previous workers have reported LGC of 8% for
soy isolate (Kinsella, 1981), 10% for mung bean isoelectric protein isolate (Coffman
and Garcia, 1977).
Proteins are composed of three dimensional matrices or networks of intertwined,
partially associated polypeptides in which water is entrapped. Proteins are able to
form gels and provide a structural matrix for holding water, flavours, sugars and
other ingredients and based on this they play an important role in many food
applications in particular comminuted sausage products and tofu (Fleming et
al.,1975).
4.8. Food application potential of pumpkin fruit flour
4.8.1. Colour of pumpkin flour-wheat flour cakes
The ingredients of the cakes made with addition of pumpkin powder are presented in
Table 1 in chapter 3. The amounts of sugar, shortening, baking powder water and
whole eggs were constant for all samples.
The mean values for crumb and crust cake colours are given in Table 16. The results
show significant differences (p<0.05) between the L*, a*, and b* values at all levels
of pumpkin powder replacement. The crust and crumb of the cakes became
significantly darker (more orange) than the control with subsequent replacements of
the wheat flour with the pumpkin flour.

80
Table 16: Mean values for crust and crumb colours of cakes prepared with various
levels of pumpkin flour replacing wheat flour
% pumpkin powder replacement L.S.D.
Colour values 0 5 10 15 20 P<0.05
Crust colour
L* 58.1± 0.3e 55.3±0.3d 46.2±0.4c 43.3± 0.4b 42.9±0.3a 0.6
a* 10.5± 0.2a 11.2±0.6a 14.3±0.6b 15.4 ± 0.2c 16.8±0.4d 0.9
b* 31.8±0.2b 37.2±0.2e 36.4±0.1d 35.3±0.5c 29.4±0.5a 0.6
Ө 71.8 73.3 68.6 66.5 60.3 0.9
Crumb colour
L* 66.3±0.3d 65.1±0.3c 60.1±0.1b 60.2± 0.3b 58.4±0.6a 0.7
a* 14.1±0.1d 17.5±0.1c 22.0±0.0a 32.0±0.03b 38.0 ±0.0ab 0.1
b* 42.2± 0.3a 45.3±0.4b 52.3±0.4c 56.4± 0.7d 57.9±0.2e 0.6
Ө 74.0 68.9 67.2 60.4 56.7 1.5
Values are Mean ± S.D
a-d Values in the same row with different superscripts are significantly different at 5%
level. Ө: Hue angle = tan-1 b*/a*
This is evident from the values of the hue angle values, which became subsequently
lower with increasing amount of pumpkin powder added. Visually, this can be seen
from pictures of the cakes (plates 3 and 4). These results are similar with the
findings by Lee et al., (1993) who found that on substituting egg with bovine plasma
product the cake crust and crumb colours became significantly darker and tanner
than those for the control when 25% or more of the egg was replaced by plasma.

81
In the present study colour changes were observed to occur from the addition level
of 5%. Colour as a physical property of food is important in consumer acceptability
of food products. The yellow colour is appealing to both adults and children and
would influence the purchasing choice (Lee et al., 1999).
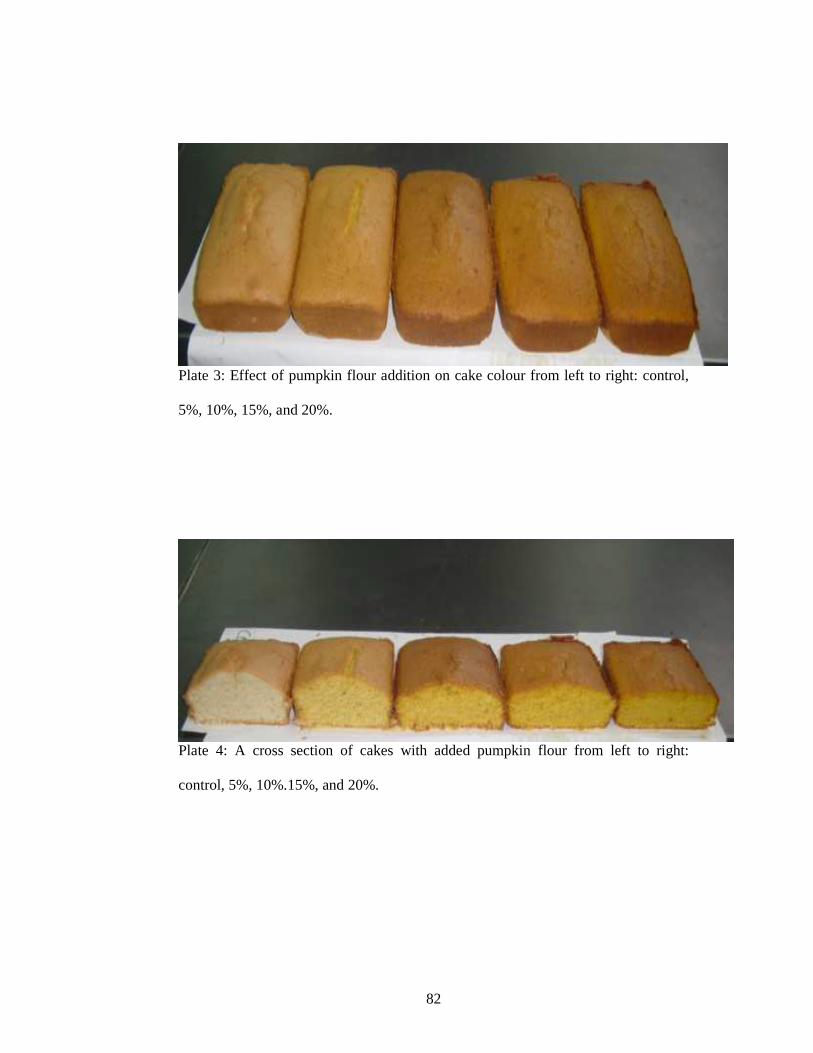
82
Plate 3: Effect of pumpkin flour addition on cake colour from left to right: control,
5%, 10%, 15%, and 20%.
Plate 4: A cross section of cakes with added pumpkin flour from left to right:
control, 5%, 10%.15%, and 20%.

83
4.8.2. Beta-carotene content in cakes with blending of pumpkin flour with
wheat flour
The effect of pumpkin flour replacements on cakes is shown in figure 14. It was
observed that the beta carotene content increased with subsequent increase in the
percentage of pumpkin flour added.
0
2
4
6
8
10
12
14
0 5 10 15 20
% pumpkin flour added
Beta-carotene conc. (mg/100g)
Figure 14: Beta-carotene concentration in cakes with various additions of pumpkin powder
Beta-carotene, alpha carotene and beta-cryptoxanthin are carotenes that are
converted to vitamin A in the body. About 300 carotenoids have been isolated from
natural sources (Ong and Tee, 1992). The most important sources for carotenoids are
plants, where often the brilliant colours of the carotenoids are covered by the green
chlorophillic pigments. Most yellow and orange coloured fruits and vegetables
contain carotenoids.

84
In human beings, carotenoids can serve several important functions. The most
widely studied and well understood nutritional role of carotenoids is their
provitamin A activity. Deficiency of vitamin A is a major cause of premature death
in developing nations, particularly among children. The vitamin A can be produced
within the body from beta-carotene (Britton et al., 1995; Patton et al., 1990). Dietary
beta-carotene is obtained from a number of fruits and vegetables, such as carrots,
pumpkins, spinach, sweet potatoes (Mangels et al., 1993).
Fortification of foods with products rich in beta-carotene would go a long way in
reducing health problems like low body immunity and night blindness that are
associated with deficiency of vitamin A. In a study conducted by Abebe et al.,
(2006) in Ethiopia it was found that the use of pumpkin improved the vitamin A
density of corn: kidney bean: pumpkin (CBP) diet and kocho: kidney bean: pumpkin
(KBP) diet. Compared with the un-supplemented corn and kocho diet, the
improvement in the vitamin A value was more than 25-fold in CBP and more than
180-fold in KBP. The amounts of vitamin A required to prevent night blindness
were evaluated by the Food and Nutrition Board (2001) and an Estimated Average
Requirement (EAR) of 112 µg/day.
4.8.3. Sensory Evaluation of cakes
Sensory rating of cakes is presented in Table 18. Colour rating was lowest (5.44) for
the control (0% pumpkin flour addition) as compared to the colour rating of 7.78 at
5% pumpkin flour addition to the wheat flour. The control cake was white in colour
while addition of pumpkin flour gave the cakes yellow colouration which appealed

85
to the panellists. The lowest score (5.78) for general acceptability was observed at
20% pumpkin flour addition compared to 7.89 score for 5% pumpkin flour
replacement level.
Table17: Sensory evaluation scores of cakes made from pumpkin-wheat flour blends
Property % Pumpkin powder added
0 5 10 15 20 LSD
Colour 5.4±1.0a 7.8±0.7b 7.1±1.5b 7.4±0.9b 7.0±1.0b 0.9
Flavour 6.8±1.3a 8.1±0.9b 7.7±0.9bc 7.1±1.6ac 6.8±1.4a 0.9
Texture 7.2± 1.5b 7.7±1.2b 7.1±1.6b 7.3 ±1.2b 5.6±1.42a 1.1
Appearance 6.2±1.8a 7.8±1.5a 6.9±1.76a 7.2 ±1.7a 6.6 ±1.8a 1.3
General
acceptability 6.6± 0.7ac 7.9±0.9b 7.3±1.3b 7.2 ±1.5bc 5.8±2.0a 1
Values are mean ±S.D, n= 9
a-cValues in the same column with different superscripts are significantly different at
5% level.
The cake flavour at 5% replacement level attracted the highest score (8.1), while 0%
(control) and 20% attracted the lowest rating (6.8). Generally, replacing the wheat
flour in cake formulations improved their sensory rating. The most acceptable flour
combination was 10g pumpkin flour (5% of mixture) and 190g wheat flour.

86
CHAPTER 5: CONCLUSION AND RECOMMENDATIONS 5.1. Conclusion
From this study, it can be concluded that both species of pumpkins contain high
moisture levels, with fruits yielding a dry matter of approximately 12% on
dehydration. Conversely, the pumpkin seeds contain low moisture levels (5.7%-
6.1%). Therefore the seeds can be stored over long periods of time, owing to their
low moisture levels.
The pumpkin seeds are better sources of protein than the pumpkin fruits, since
pumpkin fruits were found to contain relatively low amounts of proteins (4-4.9%),
as compared to the seeds (35-40%). The pumpkin fruits contained negligible
amounts of crude fat (1-2 %) as compared to seeds and seed kernels which contained
relatively high amounts of crude fat (34-48%). Therefore pumpkin seeds can
contribute substantially to the dietary fat in human nutrition.
The crude ash content of pumpkin fruits was found to be higher than that for the
seeds, with fruits ranging between 5-7% while seeds 3.6-4.4%, therefore mineral
intake in the diet can be enhanced by increased consumption of pumpkin fruits. The
crude fiber content of pumpkin fruits ranged between 8-10.4%. Fruits with rind
contained more crude fiber than fruit pulp. Whole seeds contained crude fiber
ranging between 11-12.6%, while seed kernels had lesser amounts of 3.8-4.2%. The
whole seeds contain half the amount of fiber as sesame seeds per 100g. These results
show that consumption of whole pumpkin fruits without peeling can enhance the

87
amounts of fibre consumed, also the seeds could be consumed without de-hulling in
order to ensure adequate intake of dietary fibre.
From this study it can be seen that both raw and processed pumpkin fruits contained
substantial amounts of Beta-carotene which ranged between 518.7-582.7µg/g for
raw fruits and 244-492.8 µg/g for processed fruits on dry weight basis. The pumpkin
fruits and seeds contained substantial amounts of all minerals analyzed. Zinc and
Iron were more in the seeds than in the respective fruits. Therefore processing of the
fruits by drying should be encouraged in order to reduce bulkiness since this does
not affect their nutritive value.
This study also showed that the oils are nutritious due to their ability to reduce
serum cholesterol and could be utilized as edible cooking or salad oils or for
margarine manufacture The physicochemical properties of seed lipids showed them
to be desirable since the iodine value was 109-112 g I/100g oil, acid value 1.2-
2.7mg/KOH /g oil and peroxide value 3.5-3.7 Meq.thio /kg sample. The high iodine
value gave an indication of highly unsaturated fatty acids. This was confirmed by
the analysis of fatty acid profile that found the lipids to contain 43.4-54.9 % linoleic
acid which is a poly- unsaturated fatty acid. Therefore consumption of pumpkin oil
in the diet as cooking oil, margarine or salad dressing would improve the nutritional
status of the most vulnerable in the population.
Owing to their high protein content, the seed proteins could be used in various food
systems such as sausages and comminuted foods since they have desirable
88
functional properties. The pumpkin fruit flour would be used in flour fortification in
order to enhance their beta-carotene content, flavour and colour of resulting food
products. From this study, it can be concluded that C. maxima species is a better
species than C. moschata owing to its nutritional composition and physicochemical
properties.
This study proves to be true the hypothesis that the four products of pumpkin fruits
and seeds are potentially nutritious and could be incorporated into food systems for
fortification and as functional food ingredients. Pumpkins therefore have good
potential for increased production, processing and utilization.
5.2. Recommendations
It is recommended that further studies be conducted to optimize blanching methods
to ensure minimal losses of beta-carotene. Studies should also be done with more
possible types of foods that can be made with incorporation of pumpkin seed and
fruit flours.
Future work should involve the study of influence of storage conditions on beta
carotene content and colour of the processed pumpkin fruits. It is also recommended
that the drying kinetics of the pumpkin fruits be studied in order to come up with
information on the optimal drying conditions.

89
REFERENCES Abebe, Y., Stoecker, B. J., Hinds, M. J. and Gates, G. E. (2006). Nutritive value and
acceptability of corn and kocho-based foods supplemented with legumes for infant
feeding in Southern Ethiopia. African Journal of Food Agriculture Nutrition and
Development, 6: 1-18.
AACC (1995). American Association of Cereal Chemists, St. Paul, MN, USA. 9th
Edition, Volume 1.
ACC/SCN (2000). 4th Report on the World Nutrition Situation, Geneva: ACC/SCN
Publishers. Ch. 2 pp. 23-32.
Achu, B. M., Fokou, E., Martin, F. (2005). Nutritive value of some cucurbitaceae
oil seeds from different regions in Cameroon. African Journal of Biotechnology, 4:
1329-1334.
Acquaah, G. (2004). Horticulture: Principles and Practices. 3rd Edition. Upper
Saddle River: New Jersey. Pearson Education Inc.
Alfawaz, M. (2004). Nutritional and oil characteristics of pumpkin (Cucurbita
maxima) seed kernels. http://ift.confex.com/1ft/2004/techprogram/paper (Accessed
in July, 2007).

90
Al-Khalifa, A. S. (1996). Physicochemical characteristics, fatty acid composition
and lipoxygenase activity of crude pumpkin and melon seed oils. Journal of
Agricultural and Food Chemistry, 44: 964-966.
AOAC (1995). Official methods of analysis of the Association of Official Analytical
Chemists. 16th Edition. Volume II. Washington DC, USA.
Arima, H. K. and Rodriguez-Amaya D. B. (1988). Carotenoid composition and
vitamin A value of commercial Brazilian squashes and pumpkins. Journal of
Micronutrient Analysis, 4: 177-191.
Asiegbu, J. E. (1987). Some biochemical evaluation of fluted pumpkin seed. Journal
of the Science of Food and Agriculture, 40: 151-155.
AVRDC. (1992). Vegetable production and marketing; Proceedings of a national
Review and planning workshop. Asian Vegetable Research and Development
Center. Shanhua, Taiwan. Publication no. 92-379. 286p.
Badenhuizen, N. P. (1964). General method for starch isolation. In R. L. Whistler,
R. J. Smith, J. N. Bemiller and M. L. Wolform (Eds.). Methods in Carbohydrate
Chemistry: Starch, 4: 14-15. London. Academic Press.
Belitz, D. and Grosch, W. (1986). Food Chemistry, Berlin: Springer-verlang
Heidelberg. Ch. 6 pp. 305-307, Ch 15 pp. 504-528.

91
Ben-Amotz, A. and Rachel Fishler. (1998). Analysis of carotenoids with emphasis
on 9-cis β-carotene in vegetables and fruits commonly consumed in Israel. Food
Chemistry, 62: 515-520.
Bender, D. A. (1992). Pg. 20 in: Nutritional Biochemistry of vitamins Cambridge
University Press.
Britton, G. S., Liaan, J. and Pfander, H. (1995). Carotenoids today and challenges
for the future. In: Britton, G.S. Liaan J. and H. Pfander (eds). Carotenoids Vol. 1 A:
Isolation and Analysis. Basel. Birkhauser.
Brown, K. H., Wuehler, S. E. and Peerson, J. M. (2001). The importance of zinc in
human nutrition and estimation of the global prevalence of zinc deficiency. Food
and Nutrition Bulletin, 22, The United Nations University.
Bushway, R. J. (1986). Determination of α- and β-carotene in some raw fruits and
Vegetables by high performance liquid chromatography. Journal of Agriculture and
Food Chemistry, 34: 409-412.
CAAMS. (2004). Course content. International Course on Food and Agro-
Processing Machinery. Beijing, People’s Republic of China.
Cantwell, M. and Suslow, T. (2002). Pumpkin: Winter squash. Recommendations
for maintaining postharvest quality. Postharvest Technology Research Information
92
Center, University of California. Online. http://www.postharvest.ucdavis.edu .
Accessed on 10th May 2005.
Carcea Bencini, M. (1986). Functional properties of drum-dried chickpea (Cicer
arietinum L.) flours. Journal of Food Science, 51: 1518-1526.
Chweya, J. A. and P. B. Eyzaguirre (1999). The Biodiversity of Traditional
Leafy Vegetables. International Plant Genetic Resources Institute, Rome, Italy.
Coffmann, C. W. and Garcia, W. W. (1977). Functional Properties and amino acid
Composition of a protein isolate from mung bean flour. Journal of Food
Technology, 12: 473- 484.
Combs, F. G. (1992). The Vitamins. Fundamental Aspects in Nutrition and Health,
San Diego: Academic Press Inc. Ch.3 pp.123-127.
Corrigan, V. K., Hurst, P. L., and Potter, J. F. (2001). Winter Squash (Cucurbita
Maxima): texture, sensory, chemical and physical measures. New Zealand Journal
of Crop and Horticultural science, 29: 111- 124.
Dallman, P. R. (1992)). Changing iron needs from birth through adolescence. In:
Nutritional anaemias (S. J. Fomon and S. Zlotkin, eds.). Nestle Nutrition Workshop
Series. Raven Press, New York, USA: 29-39.
93
El-Adawy, T. A. and Taha, K. M. (2001). Characteristics and Composition of
Different Seeds Oils and Flours. Food Chemistry, 74: 47-54.
Fawzi, W. W. and Hunter, D. J. (1998). Vitamins in HIV disease progression and
vertical transmission. Epidemiology, 9: 457-466.
Fagbemi, T. N. and Oshodi A. A. (1991). Chemical composition and functional
properties of full fat fluted pumpkin seed flour. Nigerian Food Journal, 9: 26-32.
FAO (1982). Food Composition Table for the Near East. Nuts and Seeds. FAO Food
and Nutrition Paper, 26. ISBN92-5-101277-6. p. 85.
FAO (1995). Fruit and Vegetable Processing: FAO Agricultural Services
Bulletin No. 119. FAO, Rome.
FAO (1997). Food and Agriculture Organization. Preventing specific micronutrient
deficiencies in human nutrition in the developing world, by Lathan. Rome. Pp 399-
411.
FAO (2005). Broadening the Food Base with Indigenous Plants. Information Sheet
12.Online. http://www.fao.org/DOCREP/003/X3996E/x3996e24.htm. (Accessed
in September, 2007).

94
FAO (2001). Improving nutrition through home gardening. A training package for
preparing field workers in Africa, Food and Agricultural Organization of the United
Nations, Nutrition Programme Service, Food and Nutrition Division.
Fleming, S. E., Sosulski, F. W. and Hamon, N. W. (1975). Gelation and thickening
phenomena of vegetable protein products. Journal of Food Science, 40: 805.
Food and Nutrition Board (2001). Panel of Micronutrients Standing Committee on
the Scientific Evaluation of Dietary Reference Intakes. Institute of Medicine.
Washington D.C., National Academy Press.
Francis, F. J., (1980). Colour Evaluation of Horticultural Crops. Hortscience, 15: 58-
59.
Frigg, M. (1999). Prevention and Eradication of Xerophthalmia, Sight and Life
Newsletter 3/1997, Switzerland. Task Force. Pp. 13-27.
Gibson, R. S. (2003). Inadequate Intakes of Zinc in developing countries –Practical
household strategies to reduce risk of deficiency, Zinc and Human Health,
http://www.iza.com/zhe.org/Articles/Art-05.htm. (Accessed on 15th May, 2007).
Gordon, H. T., Johnson, L. E., and Bauernfeind, J. C., 1985). The use of beta-
carotene in bakery products. Cereal Foods World, 30: 274-276.
95
Gross, J. (1987). Pigments in Fruits. London: Academic Press.
Guan, H. P. (1998). Starch Biosynthesis: Understanding the Functions and
Interactions of Multiple Isozymes of Starch Synthase and Branching Enzyme.
Trends in Glycoscience and Technology, 10: 307-319.
Guillon, F. and Champ, M. (2002). Structural and physical properties of dietary
fiber, and consequences of processing on human physiology. Food Research
International, 33: 233-245.
Heinonen, M., Ollilainen,V., Linkola, E., Varo, P., and Koivistoinen, P. (1989).
Carotenoids and retinoids in finished foods: cereal and bakery products. Cereal
Chemistry, 66: 270-273.
IFPRI, 2004. International Food Policy Research Institute. Africa’s Food and
Nutrition Security Situation. 2020 Discussion paper 37. Washington DC, USA.
Ihekoronye, A. and Ngoddy, P. O. (1985). Integrated Food Science and Technology
for the tropics, London: Macmillan Publishers. Ch. 11 pp. 167-190, Ch. 12 pp. 194-
200.
Kabirulla, M. and Willis, R. B. H. (1982). Functional properties of acetylated and
Succinylated sunflower protein isolate. Journal of Food Technology, 17: 235-249.

96
Kahn S, Fargue A. J. (1992). Studies on the loss of ascorbic acid and carotene
during storage and cooking of vegetables. Bangladesh Journal of Nutrition, 5: 1-6.
Kasemsuwan, T., Jane, J., Schnable, P., Stinar, P., and Robertson, D. (1995).
Characterization of the dominant mutant amylase-extender maize starch. Cereal
Chemistry, 71: 457-464.
Kershaw, S. J. and Hackett, F (1987). Comparison of three standard solvent
extraction procedures for the determination of oil content in commercial oil seed
samples. Journal of Science, Food and Agriculture, 40: 233-244.
Khachik, F. and Beecher G. R. (1987). Application of a C45 –β-carotene as an
internal standard for the quantification of carotenoids in yellow/orange vegetables
by liquid chromatography. Journal of Agriculture and Food Chemistry, 35: 732-738.
Kimura, M., Rodriguez-Amaya, D. B. and Godoy, H. T. (1990). Assessment of the
saponification step in the quantification of carotenoids and pro-vitamin A. Food
Chemistry, 35: 187-195.
Kinsella, J. E. (1981). Functional properties of proteins: Possible relationship
between structure and function in foams. Food Chemistry, 7: 273.
Latham, M. C. (1997). Human Nutrition in the Developing World, Rome: FAO.

97
Latunde-Dada, O. G. (2000). Women and sustainable approaches to the management
of iron deficiency. Food and Nutrition Bulletin, 21: 277-278.
Lazos, E. S. (1986). Nutritional, fatty acid and oil characteristics of pumpkin and
melon seeds. Journal of Food Science, 51: 1382-1283.
Lazos, E. S. (1992). Certain functional properties of defatted pumpkin seed flour.
Plant Foods for Human Nutrition, 42: 257-273.
Lee C. C., Johnson, L. A., Love, J. A. and Johnson, S. (1993). Sensory and physical
properties of cakes with bovine plasma products substituted for egg. Cereal
Chemistry, 70: 18-21.
Lee C. C., Johnson, L. A., Love, J. A. and Johnson, S. (1991). Effect of processing
and usage level on performance of bovine plasma as an egg white substitute in
cakes. Cereal Chemistry, 68: 100-104.
Lee, Cho- H, Jin-Kook, C., Seung, J. L, Woojoon P. and Chang-Hun K.
(2002). Enhancing β-carotene content in Asian noodles by adding pumpkin powder.
Cereal Chemistry, 79: 593-595.
Leninger, A. L. (1992). Biochemistry. 2nd Edition. New Delhi, India.

98
Levin, H. M. (1996). A cost-benefit analysis of nutritional programmes of anaemia
reduction. World Bank Research Observer, 1: 219-45.
Lin, M. Y. J., Humbert, E. S. and Sosulski, F. W. (1974). Certain functional
properties of sunflower meal products. Journal of Food Science, 39: 368-370.
Mangels, A. R., Holden J. M. and Lanza E. (1993). Carotenoid content of fruits and
Vegetables: An evaluation of analytical data. Journal of American Dietetics
Association, 93: 281-295.
Martin, F. (1998). Cucurbit seeds as possible oil and protein sources for small scale
household use in the hot humid tropics. Oil crops/processing. P. 2.
Meiselman, H. L., (1984). Consumer Studies of Food Habits. In: Sensory Analysis
of Foods, Piggot, H. J. (Ed).
MOA/GoK (2004). Strategy for Revitalizing Agriculture, 2004-2014. Ch. 7 pp 48.
Republic of Kenya. Government Printers.
Morris, E. R., Ptitchkina, N. M., Novokreschonova, L. V. and Piskunova, G. V.
(1998). Large enhancements in loaf volume and organoleptic acceptability of wheat
bread by small additions of pumpkin powder: possible role of acetylated pectin in
stabilising gas-cell structure. Food Hydrocolloids, 12: 333-337.

99
Murkovik, M.; Mulleder, U. and Neunteufl, H. (2001). Carotenoid content in
different varieties of pumpkins. Journal of Food Composition and Analysis, 15: 633-
638.
Mwasaru, M. A., Muhammad, K., Bakar, J. and Che Man, Y. B. (1999). Effects of
isolation technique and conditions on the extractability, physicochemical and
functional properties of pigeon pea (Cajanus cajan) and cowpea (Vigna
unguiculata) protein isolates. Food Chemistry, 67: 435-443.
Odoemelam, S. A. (2005). Proximate composition and selected physicochemical
properties of the seeds of African Oil Bean (Pentaclethra marcrophylla). Pakistan
Journal of Nutrtion, 4: 382-383.
Ong, A. S. H. and Tee, E. S. (1992). Natural sources of carotenoids from plants and
oils. Mathematical Enzymology, 213: 142-157.
Oyenuga, V. A. (1968). Nigerias foods and feedingstuffs. IbadanUniversity Press.
PP. 12-13, 66.
Ozcan, M. and Haydar, H. (2004). A Condiment [Sumac (Rhus coriara L.) Fruits]
some physicochemical properties. Bulgarian Journal of Plant Physiology, 30: 74-84.
Patton, S., Canfield, L. M., Houston, G.E., Ferris, A. M. and Jansen R.G.
(1990). Carotenoids of human colostrums. Lipids, 25: 159-165.
100
Pearson, B. (1976). The Chemical Analysis of Food. 7th Edition. Churchil
Livingstone, London and New York.
Pepping, F., Vencken, C. M. J. and West, C. E. (1988). Retinol and carotene content
of foods consumed in East Africa determined by high performance liquid
chromatography. Journal of Science of Food and Agriculture, 45: 359-371.
Platt, B. S. (1962). Tables of representative values of foods commonly used in
Tropical countries. London. Pp 10-12.
Quackenbush, F. W. (1987). Reverse phase separation of cis and trans-carotenoids
and its application to β-carotene in food materials. Journal of Liquid
Chromatography, 10: 643-653.
Rahma, E. H. and Narasinga Rao M. S. (1979). Characterization of sunflower
proteins. Journal of Food Science, 44: 579-582.
Rice, R. P. (1973). Fruits and Vegetable Production in Warm Climates. London:
Macmillan Press. Pp 252-255.
Rodriguez-Amaya D. B. (1997). Carotenoids and food preparation: The retention of
provitamin A carotenoids in prepared, processed and stored foods. Opportunities for
Micronutrient Interventions, Washington DC.

101
Rodriguez-Amaya, D. B. (2002). Effects of processing and storage on food
carotenoids. Sight and Life Newsletter, 3: 25-35.
Rodriguez-Amaya D. B. (2001). A Guide to Carotenoid Analysis in Foods.
Washington: ILSI Press. Pp. 1-10, 27-45.
Rodriguez-Amaya, D. B. and Kimura, M. (2004). Harvestplus Hand Book for
Carotenoid Analysis. Harvestplus Technical Monograph 2. Washington DC and
California. IFPRI and CIAT.
Rogers, D. E., Malouf, R. B., Langeneier, J., Gelroth, J. A. and Ranhotram, G. S.
(1993). Stability and nutrient contribution of β- carotene added to selected bakery
products. Cereal Chemistry, 70: 558-561.
Roger, S. Gillian, A., Ric, C. and Buysee, W. (2001). Using GenStat for Windows
5th Edition in Agriculture and Experimental Biology. ICRAF Nairobi, Kenya.
Sathe, S. K., Deshpande, S. S. and Salunkhe, D. K. (1983). Functional properties of
Black gram (Phaseolus mungo L.) proteins. Lebensmittel-Wiss Und –Technologica,
16: 69-72.
Southgate, D. A. I. (1991). Determination of Food Carbohydrates. 2nd Ed. Elsevier,
New York, NY.

102
Sosulski, F. Garrat, M. D. and Slinkard, A. E. (1976). Functional properties of ten
legume flours, Canadian Institute of Food Science and Technology Journal, 9: 66-
69.
Tee, E. S. and Lim, C. L. (1991). Carotenoid Composition and Content of Malaysian
Fruits and Vegetables by AOAC and HPLC methods. Food Chemistry, 41: 309-339.
Tindall, H. D. (1983). Vegetables in the Tropics. Macmillan. Hong Kong. pp 146-
167.
UNICEF (2000). The State of the Worlds Children. New York. United Nations
Children’s Fund.
UNICEF/MI (2004). Vitamin and mineraldeficiency. A global progress report
written and produced, in consultation with The Micronutrient Initiative and
UNICEF, by Peter Adamson, P& LA, Oxfordshire, UK.
Vodouhe, S. R. and Capo-Chichi L. (1998). Egusi: High Protein Crop with Multiple
Uses but neglected and under-utilized. Bulletin-CIEPCA/West Africa Cover
Crops. Cotonou, Republic of Benin. P. 6
Vogel, A. (1980). A text book of practical organic chemistry. 5th edition. Longman,
London.

103
Vose, J. R. (1980). Production and functionality of starches and protein isolates from
legume seeds (field peas and horse bean). Cereal Chemistry, 57: 406-410.
Wang, L. C., and Kinsella, J. E. (1976). Functional properties of novel proteins:
alfalfa leaf protein. Journal of Food Science, 47: 286- 292.
Wardlaw, G. M. and Kessel, M. (2002). Perspectives in Nutrition. McGraw-Hill,
FifthEdition.
Watt, B. K., Merril, A. L., Pecot, R. K., Adams, C. F., Orr, M. L. and Miller, D. F.
(1975). Hand book of the nutritional contents of foods, United States Department of
Agriculture, Dover Publications, Inc., New York.
Woolfe, J. A. (1992). Sweet Potato: An Un-tapped Food Resource, Cambridge:
Cambridge Press. Ch. 1 pp. 1-18, Ch.3 pp 118-160, Ch. 6 pp. 292-333.
Yasumatsu, K., Sawada, K., Moritaka, S., Toda, J., and Ishii, K. (1972). Whipping
and emulsifying properties of soybean products. Agricultural and Biological
Chemistry, 36: 719-727.
Yeshajahu Pomeranz and Meloan C. (1994). Food Analysis, Theory and Practice. 3rd
Edition. Chapman and Hall. New York.
Copyright © 2022 FDOKUMEN