ANTONIO ZENERE Physicochemical and Sensory Properties ...
175
ANTONIO ZENERE Physicochemical and Sensory Properties of a Chip-type Snack Food Based on Defatted Peanut and Soy Flour (Under the direction of YAO-WEN HUANG) Raw peanuts contain 45% oil, and mechanical extraction leaves 12-14% fat in the press cake. Peanut press cake is rich in protein and relatively low in fat; however, almost all of it is currently used as animal feed or fertilizer since the peanuts used in the oil extraction process are not edible grade. The goal of this research was to develop a chip-type snack food based on partially defatted flour processed from edible grade peanuts. In a preliminary experiment, chips were produced from a mixture of peanut flour and either soy or corn flour. A consumer test showed that the panelists did not consider the chips completely acceptable. However, peanut-corn chips had a higher rating than peanut-soy chips for overall liking (4.9 versus 4.4, on a 9-point hedonic scale) and acceptability (46.7% considered the peanut-corn acceptable, compared with 40.7% for peanut-soy chips). A second generation of peanut chips was produced by mixing 3 parts of peanut flour with 1 part of soy flour or wheat flour, cornstarch, peanut butter and sugar. A trained panel characterized the sensory attributes of the peanut chips in an analytical sensory test. Only a few significant differences in sensory quality were found between the peanut-soy chips and the peanut-wheat chips. However, the hardness appeared to be the biggest concern about the new product, with shear stress values close to 1000 N/g.
-
Upload
khangminh22 -
Category
Documents
-
view
0 -
download
0
Transcript of ANTONIO ZENERE Physicochemical and Sensory Properties ...
ANTONIO ZENERE
Physicochemical and Sensory Properties of a Chip-type Snack Food Based on
Defatted Peanut and Soy Flour
(Under the direction of YAO-WEN HUANG)
Raw peanuts contain 45% oil, and mechanical extraction leaves 12-14%
fat in the press cake. Peanut press cake is rich in protein and relatively low in
fat; however, almost all of it is currently used as animal feed or fertilizer since the
peanuts used in the oil extraction process are not edible grade. The goal of this
research was to develop a chip-type snack food based on partially defatted flour
processed from edible grade peanuts.
In a preliminary experiment, chips were produced from a mixture of peanut
flour and either soy or corn flour. A consumer test showed that the panelists did
not consider the chips completely acceptable. However, peanut-corn chips had a
higher rating than peanut-soy chips for overall liking (4.9 versus 4.4, on a 9-point
hedonic scale) and acceptability (46.7% considered the peanut-corn acceptable,
compared with 40.7% for peanut-soy chips).
A second generation of peanut chips was produced by mixing 3 parts of
peanut flour with 1 part of soy flour or wheat flour, cornstarch, peanut butter and
sugar. A trained panel characterized the sensory attributes of the peanut chips in
an analytical sensory test. Only a few significant differences in sensory quality
were found between the peanut-soy chips and the peanut-wheat chips.
However, the hardness appeared to be the biggest concern about the new
product, with shear stress values close to 1000 N/g.
In a third experiment a new series of peanut chips was produced,
containing peanut flour and soy in the ratio of 3:1, in addition to variable amounts
of sugar, starch and peanut butter. A factorial design was used, with sugar,
starch and peanut butter at three different levels. Twenty-seven formulations
were produced in replicate. Kramer shear force, instrumental color and
consumer acceptability were analyzed. The Kramer shear value was 441 N/g
chip in formulations with high percentages of sugar, starch and peanut butter.
Response surface methodology (RSM) was applied to investigate the optimum
levels of each ingredient in the chips. Contour plots were built for each physical
and sensory characteristic. They showed that chips made with the highest level
of sugar, starch and peanut butter were about half as hard as chips made with
the lowest level of each ingredient.
INDEX WORDS: Peanut flour, Soy flour, Dough sheeting, Impingement oven,
Kramer shear, Optimization, Acceptability, Consumer
testing, Snack chips.
PHYSICOCHEMICAL AND SENSORY PROPERTIES OF A CHIP-TYPE SNACK
FOOD BASED ON DEFATTED PEANUT AND SOY FLOUR
by
ANTONIO ZENERE
B. S., University of Florence, Italy, 1974
M. S., University of Georgia, 1992
A Dissertation Submitted to the Graduate Faculty
of The University of Georgia in Partial Fulfillment
of the
Requirements of the Degree
DOCTOR OF PHILOSOPHY
ATHENS, GEORGIA
2003

2003
ANTONIO ZENERE
ALL Rights Reserved
PHYSICOCHEMICAL AND SENSORY PROPERTIES OF A CHIP-TYPE SNACK
FOOD BASED ON DEFATTED PEANUT AND SOY FLOUR
by
ANTONIO ZENERE
Major Professor: Yao-Wen Huang
Committee: Philip E. Koehler Ronald R. Eitenmiller Manjeet S. Chinnan Robert D. Phillips Kay H. McWatters
Electronic Version Approved:
Maureen Grasso Dean of the Graduate School The University of Georgia May 2003

iv
DEDICATION
ACKNOWLEDGMENTS
I would like to express my deepest appreciation and gratitude to my major
professor, Dr. Yao-Wen Huang, for his stimulation, guidance, patience,
encouragement and financial support throughout most of my Ph. D. program.
I also would like to thank Ms. Kay H. McWatters, Dr. Philip E. Koehler, Dr.
Ronald R. Eitenmiller, Dr. Robert D. Phillips and Dr. Manjeet S. Chinnan for
serving on my advisory committee.
I want to express my sincere gratitude to the entire faculty, staff and
student body of this Department who have always treated me with respect and
an open mind. This research could not have been done without the technical
help of Mrs. Brenda Lyon for the sensory tests, and Dr. Glenn Ware and Carolyn
Clancey for the statistical planning and analysis of my data. Saalia Firibu has
lent generous help in designing the contour plots, and Dr. Reynolds has provided
advice and support on sheeting and baking technology. Rico Suhalim, Sunissa
Siripongvuticorn and Ruth Ann Morrow have been a great support with their
friendship and light-hearted camaraderie. However, I would like to point out that
the entire body of students of this Department has shown a kindness and
tolerance I have never met in any other workplace, and for this I am very grateful.
v
TABLE OF CONTENTS
Page
ACKNOWLEDGMENTS ......................................................................................iv
INTRODUCTION ……………………………………………………………………….1
SECTION I. LITERATURE REVIEW ……………………………………………6
SECTION II. PHYSICAL CHARACTERISTICS AND CONSUMER
ACCEPTABILITY OF LOW-FAT PEANUT CHIPS
FORTIFIED WITH CORN FLOUR OR SOY FLOUR …….......51
SECTION III. PHYSICAL AND SENSORY PROPERTIES OF PEANUT
CHIPS FORTIFIED WITH SOY AND WHEAT FLOURS ……..68
SECTION IV. CONSUMER ACCEPTABILITY OF A PEANUT-SOY
CHIP-TYPE SNACK FOOD AND OPTIMIZATION BY
RESPONSE SURFACE METHODOLOGY………………………93
SECTION V. SUMMARY AND CONCLUSIONS ……...……………...…….. ..164
1
INTRODUCTION
Snacks are food consumed between meals. In today’s hectic lifestyle,
meals are often taken on the run, between classes, in the car and on the work
desk. Snack foods are becoming part of everybody’s life, and often consumed in
place of regular meals. Furthermore, with more and more people attending every
level of school, the general population is becoming more educated, and thus
pays more attention to what they are eating. The USDA has succeeded in
making everybody at least vaguely aware of the food pyramid. The result is that
the choice of snack foods is becoming more sophisticated, and traditional potato
chips or corn chips are not enough anymore. Consumers look for more protein,
more vitamins, more fiber and less (saturated) fat.
Most snack foods produced today consist of starch from cereals, tubers or
roots. However, in different countries, popular snacks are already enriched with
protein from animal or vegetable origin (Suknark, 1998). In Southeast Asia it is
possible to buy snack products made with tapioca and minced fish. However,
vegetable proteins are less expensive and can be produced everywhere on earth
provided there is some availability of water. Peanut (Woodroof, 1983) and
soybean (Liu, 1997) are excellent sources of proteins that can be used to fortify
starch-based snacks.
This dissertation describes the study and the production of a new snack
food based on defatted peanut meal enriched with soybean, corn or wheat flour.
2
The first section covers the literature review, which describes the nutritional
characteristics of peanuts and other nuts and the health benefits derived from
eating unsaturated fatty acids. It also describes the challenge of producing a soft
and tasty snack using peanut meal, because of the hard texture normally
resulting from baking high-protein dough. In fact, proteins tend to form a harder
network than starch. Therefore, peanut meal needs to be mixed with other
ingredients that break the protein network and help in softening the texture of the
chips. Soybean flour has the potential to be an important component of the chip,
because of its content in protein and isoflavones. Response surface
methodology (RSM) and consumer tests are also briefly discussed in Section 1.
Section II describes a first generation of experimental peanut chips
obtained by mixing three parts of peanut meal and one part of either soy or corn
flour, plus a minimum amount of sugar, salt and baking powder. The peanut
meal was obtained by grinding the press cake produced as a co-product of
industrial peanut oil extraction, using edible grade peanuts. The peanut press
cake was provided by a Georgia company and was pellet-shaped. A consumer
sensory test determined the acceptability of the chips.
Section III describes a new experiment in which different peanut chips
were produced. The objective of this experiment was to improve not only the
texture and acceptability of the peanut chips, but also our knowledge of the effect
of increasing or decreasing the amount of different flour components, that is,
peanut, soy or wheat flour. To this purpose, we hired and trained a sensory
panel. The ensuing quantitative sensory test was expected to result in the
3
measurement of the sensory qualities of chips produced using different levels of
peanut, soy or wheat flour (Stone and Sidel, 1993). As in Section II, peanut
chips were produced using flour derived from grinding pellet-shaped peanut
press cake. The chips were fortified with soy flour or wheat flour. Corn was
abandoned because of its longer baking time and its bland flavor. Soy and
wheat were selected because of their respective advantages over corn, soy
being rich in protein and isoflavones, wheat being tasty and easy to bake. To
overcome the beany taste associated with soybean flour, peanut butter was
added. Cornstarch was also added in order to improve the texture of chips that
consumer panelists in the first experiment had rated too hard (4.4 to 4.5 on a 9-
point hedonic scale). Sensory attributes of the chips were identified and
quantitatively rated. Ratings were correlated with the results of the instrumental
analysis. Results showed that hard texture and low peanut flavor were problems
still present in the new peanut chips. The conclusion was that fortifying peanut
chips with soy or wheat did not produce all the anticipated improvements in terms
of texture and flavor.
Section IV shows the results of a new study in which components of the
chips that had not been tested in Section III were analyzed. The new experiment
was prompted by the results of literature research. Matz (1989) had stated that
sugar, cornstarch and shortening had a softening effect on baked products.
Peanut butter as shortening was chosen in the hope it could improve the flavor
while at the same time softening the texture. Section IV describes a full factorial
design in which chips, beside containing peanut meal and soy flour in the ratio of
4
3:1, contained sugar, starch and peanut butter at three different levels, for a total
of 27 formulations. Three extra formulations were added as a “dummy control”,
containing wheat flour instead of soy flour. The objective was to study how the
physical and sensory characteristics of the chips were affected by varying the
levels of the ingredients assumed to be responsible for chip texture: sugar, starch
and peanut butter. Response surface methodology (RSM) was applied and
contour plots were generated. Results showed that peanut chips were softer and
more acceptable to consumers when the percentage of sugar, starch and peanut
butter was increased. Optimal conditions for a soft texture are met when 10-15%
starch, at least 20% peanut butter and at least 12% sugar are used. The results
of the study show that the commercial production of a new, healthy chip-type
snack food is feasible. This would have a positive economic impact on the
peanut growers of Georgia, and would offer consumers a convenient and healthy
new product. Section V contains the summary and conclusions of the three
studies reported in sections II through IV.
REFERENCES
Liu, K. 1997. Soybeans: Chemistry, Technology and Utilization. Book from
International Thompson Publishing. Florence, KY (p. 25 -113).
Matz, S.A. 1989. Formulas and Processes for Bakers. Elsevier Science
Publishers. New York, NY.
Stone, H. and Sidel, J.L. 1993. Sensory Evaluation Practices. Academic Press,
Inc., San Diego, CA, 2nd Ed. (p. 1-338).
5
Suknark, K. 1998. Development of extrusion processes for novel snack food
production and the physicochemical and nutritional properties of resulting
products. Dissertation, Department of Food Science and Technology.
University of Georgia, Athens, GA (p. 99-145).
Woodroof J. G. 1983. Peanuts: Production, Processing, Products. 3rd ed. Book
from AVI Publishing Company, Inc., Westport, CT (p. 165-179).

6
SECTION I
LITERATURE REVIEW
7
Snacks are foods eaten between meals; they tend to be high in calories
and fat (Ranhotra and Vetter, 1991), but low in protein, vitamins and other
nutrients. They can be either salty or sweet, like crackers, cookies, popcorn,
potato chips, doughnuts and chocolate. Snack foods are very popular in the
United States. The rate of snack food sales has been growing steadily in the last
10 years (Anonymous, 2001) with increases between 6.2% and 8.5% in the last 4
years on record. Among the snack foods, peanuts have particularly suffered
from a negative trend, affected by popular perception about healthy foods. In
1996, peanut sales were at the lowest value in many years, due to a lack of new
products, a decrease in marketing and promotional efforts and consumer
concern over food allergy and fat content (Wilkes, 2001). Research efforts have
changed that. Epidemiological and animal studies have shown that nuts
(peanuts, walnuts, pistachios, etc.) offer several health benefits. Kris-Etherton et
al. (1999) found that high-monounsaturated fatty acids lower both plasma
cholesterol and triacylglycerol concentration. Furthermore, diets high in peanuts
can reduce LDL susceptibility to oxidation and consequently reduce the chances
of arteriosclerosis (Sabate, 1999). Other researchers (Awad et al., 2000)
discovered that peanuts contain β-sitosterol, a phytosterol that inhibits cancer
growth (Kris-Etherton et al., 1999). After the publication of the results of such
research efforts and more intense advertisement, nut sales were up 50% in 2000
compared to 1996 (Anonymous, 2001). That is good news for the United States
and in particular for the state of Georgia, a big producer of peanuts. For the year
2001, the estimated harvest of peanuts in the U.S. will be 4,239 million pounds
8
(farmer stock equivalent) (Anonymous, 2002), the largest since 1994/1995 and
almost a billion pounds up from the previous year. The yield will be a record
3000 pounds/acre, thanks to good weather and technological improvements in
determining the best time for harvesting (Anonymous, 2002). The internal
market will absorb 2,250 million pounds (53%) for food use; the rest will be
exported (750 million pounds) or crushed (725 million pounds) for oil.
Chip-type snack foods are very popular all over the world because of their
desirable sensory attributes and convenience. Hundreds of new products are
introduced into the market every year (Anonymous, 1998). Starting in the
nineties, under the pressure of a public concerned about too many calories in the
American diet, companies began to produce low- and no-fat foods (Anonymous,
1998). However, today’s consumers are more educated about nutritional values
and have realized that certain kinds of fat are healthier (and more tasteful) than
no fat. Companies are offering more healthy snack foods, with calcium, vitamins,
fiber, proteins and some fat, possibly unsaturated (Malovany, 2001). More and
more healthy snack foods will become available in the next years, because the
interest of consumers is strong. Two basic technologies are used today for the
production of snacks: extrusion and sheeting (Shukla, 2000).
Extrusion cooking is a high-temperature, short time process that combines
the operations of feed transport, mixing, working, and forming in an efficient way
to transform raw ingredients into intermediate and finished products (Harper,
1989). The raw material is fed into the hopper, and from there it is transported
down the barrel, where it is transformed into a fluid paste by pressure,
9
temperature and mechanical shear. Cooking takes place in the barrel. After
being cooked, the food material is shaped at the die, at the end of the barrel
(Baird and Reed, 1989). Two types of extruders are used, the single-screw and
the twin-screw. The first is simpler, designed to convey feed down the barrel and
create pressure at the die (Frame, 1994). The second can be of different types,
depending on the relative direction of screw rotation, counter- and co- rotating,
and degree of intermeshing (Harper, 1989). The twin-screw extruder is more
expensive than the single-screw extruder, but it provides better conveying and
mixing capability. Its co-rotating twin screws can intermesh and move feed
material with both drag flow and positive displacement flow (Frame, 1994). The
variables of the extrusion process are temperature, screw speed, screw
configuration and feed rate (Suknark, 1998). Barrel temperature is an important
factor in the quality of extrudates. At temperatures above 100 °C, water
contained in the feed evaporates rapidly when passing through the die and
results in direct-expanded products (Kinsella, 1978; Moore, 1994). In the so-
called “half products”, the dough is cooked in the barrel, but puffing is prevented
by keeping the temperature at the die below 100 °C. The temperature in the
barrel should be between 120 and 150 °C (Kinsella, 1978). In this temperature
range the food has high viscosity, does not create excessive pressure at the die
(Colonna et al., 1989), and reaches a high degree of expansion in the final
product (Frame, 1994). Screw speed affects the residence time and the shear
stress of the extruded materials (Colonna et al., 1989). High screw speed
increases shear rate and product temperature, increasing the chances of
10
damage to the food molecules (Harper, 1986). High shear rate at the die also
reduces the starch molecular size, resulting in small-pore extrudates with low
mechanical strength (Harper, 1986). Screw configuration is another way to affect
the shear stress on the dough. Screw elements are added on the transport
barrel, such as mixing paddles, reverse screws, cut flights and orifice plugs
(Gogoi et al., 1996) to add mechanical energy to the transported food, and
accelerate chemical processes such as starch gelatinization (Yam et al., 1994).
Feed rate can affect the pressure at the die and the speed of mechanical
transformation of food (Colonna et al., 1989). Twin-screw extrusion is more
versatile than single-screw, allowing a more efficient mixing of the ingredients.
Twin-screw extrusion was used by Suknark et al. (1999) to produce tapioca-fish
and tapioca-peanut snacks and to determine the optimal extrusion conditions.
Increasing temperature and screw speed resulted in increased expansion and
decreased bulk density and shear strength. Both half products were best when
the barrel temperature was between 95 °C and 100 °C and the speed ranged
between 230 and 400 rpm.
Extrusion is a very efficient technology. However, it has also a harsh
effect on some nutrients, such as vitamins. Some experiments showed how
vitamins are affected by extrusion. Retinyl palmitate was reduced to 48% of its
starting value in fish half-products and to 27% in peanut half-products (Suknark
et al. 2001). Also tocopherols are damaged. However, after being fried,
products may contain more vitamin E than the starting material because
tocopherols are absorbed from the oil during deep fat frying (Suknark et al.,
11
2001). Folic acid and vitamins B1 and B2 are severely damaged by extrusion
(Cheftel, 1986). Carotenoids are resistant, but the porosity of the expanded
snacks makes them susceptible to oxidation of carotenoids during later storage.
Twenty to forty percent losses of vitamin C are constantly observed during
extrusion, probably as a result of enhanced oxidation at high temperature
(Cheftel, 1986).
Protein digestibility is generally increased by extrusion, particularly at
higher temperature. However, enzyme activity is destroyed. Lipoxygenase is
almost completely inactivated, with different efficiency for the three enzymatic
species (L2>L1>L3) (Guzman et al., 1989; Zhu et al., 1996). Isoflavones, a
family of potent natural inhibitors of cancer cell proliferation, are not significantly
affected (Mahungu et al., 1999). However, more recent studies determined that
extrusion reduced the isoflavone content by 24%, not enough to cause reduction
in its health benefit (Singletary et al., 2000).
Sheeting
Sheeting technology is simpler than extrusion and is easily available.
Sheeting is the process of compacting and gauging the mass of dough into a
sheet of even thickness and at the full width of the band. The dough sheet must
have no significant holes, and the edges should be smooth, not ragged (Faridi,
1990). Sheeting is the direct industrial derivation of the age-old process of rolling
dough in the home kitchen with a rolling pin on a flat table. The sheeting of
dough is used in the baking industry for the production of cookies, pizza, bread
and pastry doughs, as well as Mexican specialties such as tacos and tortillas
12
(Levine and Drew, 1990). It used to be the only method available for making
pasta, but extrusion is more often used today. The snack industry makes wide
use of sheeting for the production of fabricated snacks such as potato ‘crisps’
(such as Pringles) and corn chips.
Few studies exist on the technical and quantitative aspects of sheeting.
One from Kilborn and Tipples (1974) shows that the process of sheeting has the
effect of “developing” the dough, resulting in bread loaves with higher volume.
Photomicrographs of hard wheat dough revealed that proteins tend to form a
network under the stress produced by sheeting. Excessive sheeting, however,
tends to break down such network. Kilborn and Tipples (1974) observed that
only 25% of the energy operating the rolls finds its way into the dough. The rest
is lost as attrition and resistance, both from the dough and the mechanical
components of the motor. The passage from the pilot laboratory to industrial
production is usually accomplished by increasing the diameter of the rolls and
their speed. However, higher roll diameter and higher speed result in higher
energy input into the dough, which may affect the quality of the product. As a
result, the scaling-up process from pilot plant to mass production in the industry
can present problems difficult to solve. From Levine and Drew (1990), Levine
and Levine (1997) and Levine (1998) studies on the sheeting process, some
conclusions were that 1) the reduction ratio of dough into sheet should be small,
otherwise the work required for sheeting would be too high and the quality of the
product would suffer. It is better to use several reducing steps, possibly involving
multiple rollers instead of a single one; 2) when several reducing steps need to
13
be applied, it is better to use the more energetic steps in the beginning, and the
less energetic at the end, when the dough is thinner; 3) high speed sheeting, as
well as high ratio of roller diameter vs. gap, are hard on the quality of the product.
The maximum pressure exerted by the rolls increases with the square root of the
roll diameter; 4) there is a substantial spring back of the dough sheet after
passing through the rollers, and the spring back increases as the ratio between
roller diameter and gap increases; 5) when assembling a pair of rollers on a
sheeter, care must be applied to center the shaft with respect to the roller, or the
sheeted dough will be uneven.
Peanuts
Peanut (Arachis hypogaea), also known as groundnut, is a good source of
food for the human diet (Woodroof, 1983). Peanut has a relatively high protein
content (28%) (Woodroof, 1983), a pleasant flavor and a light tan color that
facilitates its incorporation into a wide range of food products (Prinyawiwatkul et
al., 1995). Like most legumes, peanuts are relatively low in sulphur-containing
essential amino acids and tryptophan. The amount of another essential amino
acid, lysine, is also low, but greater than in cereal grains (Duranti and Gius,
1997). However, other authors (Miller et al., 1978) studied the nutritional quality
of meal made from different cultivars of peanut as measured by rat bioassay.
They determined that the nutritional quality of peanut is low because the
concentration of some essential amino acids is lower than required for growth of
young animals. The protein efficiency ratio (PER) of peanut is 50 - 75%
compared to casein, considered the reference standard (100%). The
14
requirement in lysine was appraised at 1.0% of the total amino acids, against the
determined average value of 0.5% in the studied cultivars. Threonine
requirement was determined at 0.56%, while the authors detected 0.40%. The
total requirement of methionine and cystine together was determined to be
0.67%, against the observed concentration of 0.14 for methionine and 0.16 for
cystine in the studied cultivars. Such findings were confirmed by Khalil and
Chughtai (1983). These authors studied the nutritional quality of peanut in 5
cultivars grown in Pakistan. They determined that lysine was the first limiting
amino acid in 3 cultivars, followed by threonine, methionine and cystine. These
amino acids suffer the biggest loss in the roasting process. Other essential
amino acids such as leucine, phenylalanine and tyrosine were adequate.
In the United States, most of the peanut crop is marketed for direct
consumption as roasted kernels or used to make peanut butter or cookies. In
many countries of the world, peanuts are grown mainly for crushing (Woodroof,
1983). There are different methods for crushing. In developing countries such
as Nigeria, oil is traditionally extracted from peanuts by primitive methods such
as aqueous extraction or by hand pressing, so that little oil is obtained, and of
poor quality. Bigger processors work by hydraulic or screw pressing, the latter
method being more efficient. Two authors (Adeeko and Ajibola, 1990) described
a study on the best conditions for peanut oil extraction. Increasing pressure
yields more oil until a limit of 20 MPa. At higher pressure the oil production levels
off or decreases. Moisture content also is a critical factor, with 6% moisture
being the optimal amount. Above 6% the oil yield decreases in efficiency.
15
Heating helps by decreasing the oil viscosity, and in such way increasing the oil
production. The heating time has been studied, and an upper limit of 25 min has
been found to be the most efficient. India, the country with the largest production
of peanuts, has a large industry of peanut oil extraction and relies mainly on
expeller pressing methods. As in Nigeria, efficiency in oil extraction relies on the
traditional system of leaving the skin on the kernels, and adding 1-2% of the
hulls, so to facilitate extraction. The oil extraction leaves a press cake that is
high in protein (40%) and low in fat (14%), is high in phenolic pigments and
fibers, and is used as animal feed or fertilizer (Chavan et al., 1991), if processed
from non-food grade peanuts. Part the press cake is even exported.
Chavan’s study described how the press cake, usually unfit for human
consumption, can be obtained so to be food-grade. Peanuts were first
deskinned, by means of pre-chilling the kernels at 4° C or alternatively by pre-
heating them for 20 min at 80° C. The cake obtained from oil extraction was
milled in a laboratory grinder to produce partially defatted peanut meal. Peanut
meal was added to wheat flour in the proportion of 10, 20 or 30%, and used to
produce bread, buns, cupcakes or doughnuts. A partially trained sensory panel
judged the baked products containing 10% defatted peanut meal to be
undistinguishable from the original products, but to become less and less
acceptable when the peanut component was increased to 20 and 30%. Of
particular importance was the fact that inclusion of defatted peanut meal resulted
in denser, less expanded volume breads. There were two possible reasons for
that, one being that peanut meal had higher water holding capacity, and the other
16
that gluten, which is responsible for forming air cells in the dough during bread
baking, was less effective because of being diluted by peanut meal. Other
undesirable effects of enriching the wheat flour with 20 or 30% peanut meal were
that the crumb was coarse and yellowish, and products had an unpleasant
peanut aroma and taste and an unappealing brown color. The same author
reported that defatted peanuts extracted with solvent (n-hexane) were
considered more suitable for human consumption. Also the press cake could be
made food-grade if the skin and hulls were removed from the peanuts prior to
extraction and sanitary conditions observed in the processing plant.
Peanut, also known as groundnut, is one of the world’s principal oilseed
crops (Freeman et. al., 1999). The price of groundnut oil and meal has oscillated
in the years between 1979 and 1996. The peak was reached in 1981, rising
above $1000 per ton; the lowest level was reached in 1987 at $504 per ton. The
two main reasons for such variability were the drought in Senegal and Sudan,
among the largest exporters of peanut oil, and the shift of Argentina from
groundnut production to soybean, considered a more lucrative crop. Factors of
price variability are the thin market of groundnuts (the major producers such as
India and China use most of their product for the internal market) and its
substitutability. Substitutability means that peanut oil can be easily substituted by
other oils, above all soybean, sunflower, cottonseed and rapeseed, even if
peanut oil drew constantly higher prices in the years 1979-1996, being
considered higher in quality. High substitutability, however, assures that
international prices of all vegetable oil are closely correlated. Also oilseed meals
17
are substitutable as animal feed, soybean meal being considered superior for
protein content, digestibility and palatability for livestock. The international prices
of peanut meal oscillated between $ 240 (1980) and $ 98 (1985) per ton. The
historical trend indicates a long-term decline in price of groundnut meal, reflecting
increasing competition from alternative protein sources (both oilseeds and
cereals). For example, the share in import of the European Community has
declined from 22% in 1979-81 to 5% in 1994-96, due to a reduction in livestock
production after the bovine spongiformis encephalopathy (BSE) crisis, and the
rising utilization of alternative, less expensive meals for animal feed. However,
the medium term prediction of peanut utilization is that consumption of peanut oil
and peanut meal will continue to grow, even if at a slower pace than in the
1970’s and 80’s, conditioned by population growth and, above all, by global
improvement of per-capita income.
Considering that peanut meal can be of food-grade, finding an application
for it, for example as a snack food, would be beneficial for consumers and for the
economy of many countries. This would be true in particular for the United
States, one of the largest peanut producing countries in the world, after India and
China, and the top exporter (Anonymous, 2002). The world economy today
cannot afford to waste anything. Waste represents not only lower profits but also
the even bigger problem of disposal. Space is growing scarce in this
overpopulated planet. Another example is represented by peanut hulls, which
are filling the yards of peanut processing plants. Efforts to eliminate any peanut
industry waste should be welcomed. For example, Johnson et al. (2002)
18
successfully used peanut hull pellets to absorb copper ions from wastewater, and
Omar et al. (2002) developed a way to use acid-treated hulls from peanut (and
other oilseeds) for bleaching vegetable oils.
Our work aimed at utilizing protein-rich peanut meal to produce nutritious
snack foods for humans. A chip-type snack food, to be successful on the market,
needs to be tasty, flavorful and crisp. A crisp, easily breakable texture is not
always easy to accomplish in a new chip-type snack food. It requires a balance
of ingredients and cooking procedures. Baked sweet snacks (cookies)
technology indicates that the continuous structure of the cookie generally arises
from components of the flour (Matz, 1989). The basic framework is constituted
by either protein or starch, or both, and is tenderized by such components as
sugar, egg yolk, ammonia, sodium bicarbonate (or baking powder), and
shortening (Matz, 1993). A wide variety of flours are being used for sweet
biscuits, ranging from a soft (low-protein) cookie flour to a rather strong (high-
protein) sponge flour. Increasing protein content of the flour increases water
absorption and makes the dough “bucky” and difficult to roll out. Diluting the
high-protein flour with starch improves rollability (Miller and Trimbo, 1970). A
high-protein flour leads to hardness of texture and coarseness of internal grains
and surface appearance (Matz, 1993). Tenderness was found to be inversely
related to the protein content of the flour, and the effect of the protein was
accentuated when the water content of the dough was increased (Miller and
Trimbo, 1970). Furthermore, crusts become softer with increased shortening
content and decreasing water level. Piecrusts made with soft shortening were
19
more tender than crusts made with hard shortenings. Dextrose can often be
substituted for up to 20% of the sucrose. If it is used with care, invert syrup may
make some cookies, particularly wafers, softer, lighter and spongier, with a more
open texture (Matz, 1993). Lecithin in the amount of 0.4% will improve
machinability.
Matz (1989) summarized his findings about the baking technology with a
list of tougheners (binding materials) and softeners for cookies. Tougheners are:
(1) Flour; (2) Water-because it hydrates the gluten; (3) Milk solids-not very
effective as binders in the amounts normally found in cookie doughs; (4) Egg
whites; (5) Egg yolks-which act as tougheners because of their protein content
and as tenderizers because they contain fat and emulsifiers; (6) Cocoa or
chocolate products; (7) Leavening acids; (8) Salt; (9) Oat flour; (10) Soy flour.
Tenderizing materials include: (1) Sugar, probably the most important tenderizer
in cookies; (2) Shortenings; (3) Emulsifiers; (4) Leavenings-because a more
porous, “lighter” structure seems softer; (5) Egg yolks-see comment in
tougheners’ discussion; (6) Corn starch or wheat starch; (7) Corn flour; and (8)
Ground raisins or ground dates. Generally, non-reactive (inert) substances act
as tenderizers. Stewart (1984) described a method to produce crackers without
yeast, but using sodium bicarbonate and ammonium bicarbonate. Proteases
were added (0.03%) to make the dough less stiff and easier to handle.
Studies with extruded products have also shown that high protein content
is not compatible with a soft, crunchy chip (Faubion and Hoseney, 1982; Paton
and Spratt, 1984). The degree of expansion of extruded products determines
20
their bulk density and their texture characteristics of hardness, crunchiness or
crispness. The more expanded an extruded product is, the softer its texture and
the lower its shear strength. Expansion is inversely related to density and is the
result of air cell formation in the dough, with the starch and proteins forming a
network. However, starch and protein play a different role. Expansion may
actually be reduced by the addition of proteins to a starchy system
(Prinyawiwatkul et al., 1995), because proteins form a stronger and harder
network than starch (Suknark, 1998). Gogoi et al. (1996) found that fish added to
rice flour in increasing proportion resulted in lower expansion ratio and water
solubility index, and increased bulk density and shear strength.
Fat also has an effect on texture of extruded snacks. Several studies
found that both fat and protein content affect the texture of the chips. A low
quantity of oil (3%) helps expansion (Mohamed, 1990), while high lipid content
(>5%) prevents expansion (Cheftel, 1986). Suknark (1998) found that
substituting starch with partially defatted peanut flour (PDPF) up to 15-30% was
beneficial for expansion (some oil was still present in the PDPF), but higher
substitution prevented expansion. In this case the depressing effect of the higher
level of peanut flour on expansion was probably due not only to the presence of
higher amounts of oil, but also to high content of protein. A mixture of oil or fat
with other components including water is generally called an emulsion. Doughs
are emulsions, and their behavior during the process of baking determines the
lightness and marketability of the product (Rousseau, 1999). The role of fat
crystals in emulsions has been discovered and studied in the last 20 years (Van
21
Boekel and Walstra, 1981). Their relevance in bread making has been stressed
by Brooker (1996), who discovered that the fat crystals present in the shortening
are responsible for producing quality high volume bread loaves. This effect is
due to the stabilization of gas cells in bread dough by the fat crystals, which are
adsorbed on the gas-water interface during proofing, and melt during baking.
The newly melted fat provides materials for the expanding cell walls. When oil
was used instead of fat, less expansion was observed.
In her dissertation on a snack food based on fish-starch or peanut-starch
extrusion, Suknark (1998) hypothesized a different effect on texture derived from
native and denatured proteins. Denatured proteins are insoluble. Therefore,
they absorb less water than native proteins leaving the water available to starch
for gelatinization. Thus, snack foods containing denatured proteins tend to be
softer than snacks containing native proteins. However, denaturation could
affect texture in other ways too. For example, denatured proteins could break
and interact less with other proteins so that they would form a less continuous
network (Han and Khan, 1990). Our previous study confirmed Suknark’s
hypothesis: chips made with partially defatted (12% fat, Golden Peanut Corp.,
Blakeley, GA) commercial peanut flour were softer than peanut chips prepared
from cold pressed peanut flour recovered after oil extraction (Birdsong Peanut
Corp.). Peanut flour was derived from cold temperature (50 ºC) oil processing
and its proteins were not denatured. Conversely, chips made from commercial
flour (PDPF, Golden Peanut Corp., Blakeley, GA) were derived from peanuts
roasted at 175 ºC, which is above the minimum required for protein denaturation
22
(160 ºC). To improve the handling and nutritional properties of defatted peanut
flour, it was decided to fortify it with soybean flour.
Soybean
Soybean (Glycine max) has a long history of cultivation and food application in
the Far East (China). It was imported into the United States in 1764, but its use
on a large scale started in 1922, with the opening of the first processing plant
(Liu, 1997). Today the United States is the largest producer and exporter of
soybean, with about half the world harvest. Soybean belongs to the family
Leguminosae, subfamily Papilionoidae, genus Glycine. Many cultivars exist, with
distinct characteristics of flowering, daylight and soil adaptation, so that soybeans
can be cultivated all over the United States (Burton, 1997). Like many other
legumes, soybean has the capability to take nitrogen from the air and convert it
to metabolizable ammonium N, a process known as nitrogen fixation. This
characteristic makes it a good rotational crop to alternate with high-nitrogen-
consuming crops such as corn (Liu, 1997). Soybean is the legume with the
highest protein content (40% dry weight); oil is 20% of the dry weight. Similar to
other legume plants, soybean is deficient in the sulfur-containing amino acids,
methionine and cysteine, and also in threonine. However, unlike other legumes
and most cereals, soybean contains a sufficient amount of lysine. Considering
the amount of oil percent in the individual seeds, soybean is the second oilseed
after peanut (peanut = 48% dry weight (Liu, 1997). The oil concentration of all
other legumes is between 1% and 3.6% (Salunkhe et al., 1983). Soybean oil
consists mainly of palmitic (11%), oleic (23%), linoleic (52%) and linolenic (8%).
23
Linoleic and linolenic are considered essential fatty acids because the animal
organism is not able to synthesize them. More specifically, the human body
cannot introduce double bonds between the terminal methyl group and the first
double bond situated in the carbon chain of the respective fatty acid (Liu, 1997).
Linoleic and linolenic acids are required for synthesis of prostaglandins and the
eicosahenoics and docosahenoics necessary for normal growth, health, skin
smoothness and impermeability, reproduction, anti-inflammatory processes, etc.
(Akoh and Min, 1998). Furthermore, linolenic acid belongs to the group of n-3
fatty acids, which are required for healthy liver function and brain phospholipids
content (Akoh and Min, 1998). Recent dietary estimates for fatty acids intake are
(Simopoulos, 1989):
saturated F. A. = 18 g/day;
linoleic acid (C18: 2 n-6) = 14g/day;
linolenic acid (C18: 3 n-3) = 3g/day.
Other important components found in soybean include phospholipids,
vitamins, minerals and isoflavones. In recent years soybeans have been rapidly
increasing in popularity among the western societies. The acknowledgment of
the health benefit that comes from eating soy products regularly as part of a low-
fat diet, and the abundance of this legume in the United States, have stimulated
a strong research effort on ways to utilize soybeans in the human diet. Genta et
al. (2002) reported a method to produce a candy using okara, a residue of soy
processing, mixed with peanut, glucose, natural essences and hydrogenated oil.
24
Dhingra and Jood (2002) evaluated the nutritional and organoleptic
characteristics of wheat bread fortified with soy flour. They found that addition of
20% soy flour was not detrimental to the consumer sensory rating of the product.
Isoflavones are a family of phytochemicals that were identified in 1941
(Walter, 1941). They are part of the larger family of flavonoids and can be
isolated from soybeans and a few other legumes. Isoflavones are contained in
only a few plants because of the limited distribution of the enzyme chalcone
isomerase, which converts 2(R) naringinen, a flavone precursor, into 2-
hydroxydaidzein (Coward et al., 1993). Isoflavones are found in soybeans or soy
foods in the amount of 1.33 - 3.82 mg/g dry-weight, part as β-glycosides
conjugates and part as aglicones (Coward et al., 1993; Wang and Murphy,
1994). Isoflavones have been the object of extensive research in the last ten
years, after it was recognized that they could provide health benefits (Liu, 1997;
Messina, 1999). In fact, extensive research has linked the isoflavones to
reduction of osteoporosis and menopausal syndrome in aging humans,
prevention of different cancers including breast and prostate cancer (Aronson et
al., 1999), protection from cardiovascular diseases by lowering cholesterol levels
and lipid oxidation in blood (Adlercreutz and Mazur, 1997; Kyle et al. 1997;
Nagata et al., 1998; Guthrie et al., 2000; Abraham et al., 2002; Ishimi et al.,
2002). Many epidemiological studies have been initiated by the observation that
Oriental women, whose daily diet includes relevant amounts of soy products
(Nakamura et al.. 2000; Kim and Kwon, 2001), have much lower incidence of
breast cancers, osteoporosis, flashes and other menopausal symptoms than
25
western females, whose diet hardly contains any soy products. The mechanism
of action is not known. It is possible that many concomitant actions are
responsible for the physiological effects. For example, isoflavones have a limited
estrogenic action that might compete with mammalian estrogens for receptors
(Zava and Duwe, 1995). Another mechanism involved could be the inhibition of
protein tyrosine-kinase (Akiyama and Ogawara, 1991), which is part of a growth
factor-stimulated signal transduction cascade in normal and transformed cells.
Another possibility lies in its anti-oxidant potential, which can explain the effect of
isoflavones in limiting the oxidation of LDL-cholesterol and the genesis of
arteriosclerosis (Kanazawa et al., 1995).
Among the different isoflavones, daidzein and genistein are the most
abundant in soybeans. A third isoflavone, glycitein, is exclusive of the soy
hypocotyl (germ). The isoflavones are naturally present as beta-glucosides,
usually with malonic acid esterified in position 6 of glucose, or as aglycones (no
bound sugar). The malonyl-derivate is easily hydrolyzed to glucoside or
aglycone by temperatures above 80 °C or acid reaction (Kudou et al., 1991;
Sherkat et al., 2001). The level of conjugation of the isoflavones varies between
fermented and non-fermented soy foods, as non-fermented foods contain mainly
beta-glycosides and fermented foods have predominantly aglycones. These
data are confirmed by Wang and Murphy (1994), who measured the isoflavone
composition of the American and Japanese soybean grown in Iowa, and found
that isoflavone content varies greatly with crop year, and also, in lesser measure,
by location and variety. The same authors (Wang and Murphy, 1996) later
26
studied how isoflavones withstand different processing conditions during the
preparation of traditional soy products. They found that significant losses of
isoflavones take place during soaking (12% loss) and heat processing in making
tempeh (44%), during coagulation in tofu processing (44%) or alkaline extraction
in protein isolate production (53%). Sometimes traditional soy foods can be
prepared with different methods and each of them may have a different impact
on isoflavones. Therefore, information on the whole process is required before
the isoflavone content can be estimated.
Analysis of isoflavones can be done by gas chromatography (Fenner,
1996); however, HPLC is the technique of choice today. Methods for sample
preparation vary, depending on the nature of the sample. Following the initial
grinding, extraction has been performed with aqueous ethanol or methanol (80%)
with or without the addition of HCl (AOAC, 2001). The sample has also been
extracted directly in acetonitrile with 0.1% HCl (Wang and Murphy, 1994).
Hydrochloric acid has been shown to hydrolyze the ether bond between
isoflavone and glucose (Kudou et al., 1991; Gu and Gu, 2001), resulting in the
isoflavones being detected mainly as aglycones. Extraction by refluxing at 80 °C
has proved satisfactory for Franke et al. (1994). These researchers extracted
isoflavones for 1, 2, 3 and 4 hr in the presence of different concentrations of HCl
(0.5, 1.0, 1.5, 2.0, 2.5 and 3.0 M). Their conclusion was that daidzein recovery
was maximal after 1 hr reflux, and genistein after 3 hr, both in 2M HCl. These
researchers also studied the phytoestrogen level in 40 food items, mainly
legumes, and found isoflavones to be present in detectable amount in soybeans,
27
black beans, clover sprouts and alfalfa sprouts. Most researchers have detected
isoflavones by HPLC using gradient elution, but a method for isocratic elution
was developed by Hutabarat et al. (1998). This method is simpler and faster,
and results compare well with the gradient method. An optimization study of the
extraction conditions by Chiang et al. (2001) concluded that optimal (R2 = 0.967)
extraction time, acid conditions and temperature for total isoflavones in soybean
hypocotyls (germs) are: HCL = 3.42M; time = 205.5 min; T = 44.6 °C. More
detailed information can be collected by HPLC- mass spectrometer (Gu and Gu,
2001) or by gas-chromatography (Fenner, 1996).
Peanut, being a legume like soybean, was expected to contain some level
of isoflavones. Mazur and Adlercreutz (1999) reported groundnuts to contain
daidzein and genistein in relatively high amount, but other researchers did not
confirm their finding (Nakamura et al., 2000). Because of the increasing
popularity of isoflavones as a health-promoting and disease-preventing
compound, soy flour is an ideal candidate to fortify peanut pellet flour, to produce
a tasty and healthy new snack food.
Oxidation
The shelf life of a food product is often limited by its fat content, because
fat has a tendency to undergo oxidation. The mechanisms of oxidation can be
enzymatic or spontaneous (autoxidation). Enzymatic oxidation is triggered by
lipoxygenase on unsaturated fatty acids such as linoleic and linolenic. The
enzyme triggers the reaction of molecular oxygen with the fatty acid, generating a
hydroperoxide that later degrades into smaller molecules such as aldehydes,
28
ketones, lactones, alcohols, etc. which impart off-flavors to the product.
Autoxidation is triggered by metals, oxygen, light, high temperature, proceeds
through the three steps of initiation, propagation and termination, and results in
off-flavor and spoilage of a fat-containing food. Peanuts, containing 45-50% fat,
mainly oleic and linoleic acids, but also linolenic and arachidonic (Andersen et
al., 1998), are highly susceptible to oxidation. Soybeans contain 20% fat, which
makes them also vulnerable to oxidative spoilage.
Researchers are very active in trying to understand the precise
mechanism of oxidation in food products, so to prevent their degradation and
enhance the shelf life. It is known, for example, that low moisture storage is
critical for peanut crops. Peanuts, after harvesting, are carefully dried to 5-6%
moisture before long term storage (Woodroof, 1983). Among researchers, Chiou
et al. (1995) determined that the composition of fatty acids in peanuts and their
tendency to oxidize varied in Taiwan with the crop location and season, even for
the same cultivar. They found that the spring crop was more resistant to
oxidation than the fall crop. Food oxidation can be retarded by the addition of
synthetic or natural antioxidants. However, some research studies have shown
that chemical antioxidants such as BHA and BHT are toxic to experimental
animals (Witschi, 1986; Grice, 1988). Therefore, the use of natural antioxidants
is now a trend in both research and industrial applications.
Tocopherol, phospholipids, ascorbyl palmitate, rosemary and catechin,
either alone or in combination, have been shown to increase peanut oil stability
(Chu and Hsu, 1999). One third of the peanut crop in Taiwan is processed for
29
oil, but differently than in the U.S., peanuts are roasted before oil extraction by
expel-pressing. In Chu’s study, maximal protection from oxidation was shown by
the association of 1500 ppm of catechin with 400 ppm of rosemary. Blending
high oleic acid (HO) peanut with sesame and soy resulted in a spread product
with increased resistance to oxidation (Sumainah et al., 2000). Lee et al. (2000)
extracted aroma compounds by steam distillation and solvent extraction (SDE)
from soybeans, mung beans, kidney beans and azuki beans. Their results
showed that even the volatile components of these, and other beans such as
coffee (Singhara et al., 1998), have antioxidant activity.
The antioxidant effect of natural compounds is being studied by an ever-
growing number of food scientists and chemists. A protein-rich fraction from oat
was found to protect linoleic acid from oxidation in an aqueous suspension
containing soybean lipoxygenase-1 and micellar linoleic acid (Lehtinen and
Laakso, 2000). The protection was found to reach the maximum effect after 5
minutes and required contact between an oat fraction and linoleic acid. A group
of researchers studied the inhibitory effect of natto, a product of soybean
fermentation, on LDL oxidation in vitro (Iwai et al. 2002a) and in cholesterol-fed
rats (Iwai et al., 2002b). Natto was divided into three water-soluble fractions, a
high-molecular-weight viscous substance, a low-molecular-weight viscous
substance and soybean water extract. The low-molecular-weight viscous
substance was found to have the strongest free radical scavenging activity, as
assessed by electron spin resonance. This fraction and the soybean water
extract were fed to rats kept in a cholesterol-rich diet. Results showed that the
30
two fractions had an inhibitory effect on the LDL oxidation in vivo, and could
explain why Japanese people, who are habitual consumers of natto and other
soybean-based foods, have low incidence of cardiovascular diseases.
The Maillard reaction has also been under study for its relevance in the
oxidation process. Mastrocola and Munari (2000) determined that lipid oxidation
is retarded by the accumulation of Maillard reaction products (MRPs) in a pre-
heated mixture containing glucose, pre-gelatinized starch, lysine and soybean oil.
They also showed that the MRPs continue to accumulate during storage even at
room temperature, increasing their capability of retarding lipid oxidation. The
Maillard reaction is also involved in the antioxidant activity of roasted and
defatted peanut kernels (Hwang et al., 2001). The authors investigated the
possibility of using roasted peanut pellets co-produced in the oil extraction
procedure. Because the peanut kernels were roasted at 180 °C before solvent
extraction, Maillard reaction products were left in the residue and showed to
possess a measurable antioxidant activity. This works in several ways, by
exerting reducing power, scavenging free radicals, chelating Fe(II) ions. Most
important, the MRPs showed a measurable effect in inhibiting human
LDL/cholesterol oxidation, which is considered a factor in atherosclerosis. This
material, the authors explained, could be utilized, directly or with previous
enzymatic digestion, as antioxidants, helping to solve the problem of how best to
utilize peanut meal, currently used only as animal feed or fertilizer. The
mechanism of action of the Maillard reaction products is under study. It has been
reported that MRPs obtained by reacting xylose, glucose or fructose with lysine
31
have shown some damaging effect on DNA in a culture of human lymphocytes.
The phenomenon was probably the effect of free radicals formed at the time of
MRPs formation (Yen et al., 2002).
The problem of what to do with oilseed meal produced by oil extraction is
not limited to peanuts. Matthaus (2002) described how the residues from 8
species of seeds (including rapeseed, mustard, crambe and sunflower), after
their oil has been extracted, are used as animal feed or as fuel in power plants.
However, such residues contain many antioxidants, which could be extracted
and utilized. Several compounds with antioxidant activity (polyphenols,
flavanoids and sinapines) were recognized and recovered from the defatted
material. The optimal conditions of their extraction and their efficacy as reducing
agents were studied.
Response Surface Methodology (RSM) is a collection of statistical and
mathematical procedures aimed at determining how changes in one or more
components in the formulation or in the processing conditions of a new product
affect the quality of the product. It is a useful tool for analyzing and optimizing
processes (experiments) in which several independent variables simultaneously
influence a response (Floros and Chinnan, 1987). The ultimate goal of RSM is to
optimize the critical response of a product (Walker, 2000). Most of the RSM
applications come from areas such as chemical or engineering processing,
industrial research and biological investigations (Floros and Chinnan, 1987). If
an experiment has a large number of factors to be considered, one of the
advantages of RSM is the reduced number of runs needed to provide sufficient
32
information for statistically acceptable results. It is a faster and less expensive
method of performing scientific research compared to the classical one-variable-
at-a-time or full factorial design (Floros and Chinnan, 1988; Hinds et al., 1994).
Another advantage of the RSM is that it can be applied to the generation of
surface or contour plots, which allow visualizing how the response changes when
the input variables increase or decrease. Response surfaces and contour plots
are graphic expressions of prediction equations. They allow the researcher to
predict the outcome of a process without the need to physically perform the
process (Walker, 2000).
RSM starts by selecting the experimental design contemplating a
reasonable number of variables (input variables) and their levels, and the
responses (output variables). After performing the experiments, the data are
collected and analyzed statistically. Parameter estimates are obtained and used
as function coefficients. The function (model) is also called a prediction equation
and is used to computer-generate contour plots. Once the plots are obtained,
limits of acceptability are applied, so to identify optimum conditions. In the case
of a snack food, the optimum conditions are assumed to be those producing the
highest acceptability from the consumers. But constraints are also determined
based upon cost of the ingredients and of manufacturing. The last step is the
verification, which consists of running control (diagnostic) tests to assess the
adequacy of the model (Dziezak, 1990).
Many papers have been published in recent years on optimization.
Among them, one described the optimal amount of oat bran and water that can
33
be added to a low fat chicken frankfurter without loss of quality (Chang and
Carpenter, 1997). USDA regulations allow substituting water for fat, provided
that the sum of fat and water does not exceed 40% by weight of the finished
product. Contour plots showed optimum formulation at 2% oat bran and 20%
added water. In RSM the variables are continuous. A variation in the application
of RSM is called mixture design, useful when the factors to be studied are three,
their individual values are between 0 and 1 and the sum is 1. The graphical
representation is a simplex lattice design. Malundo et al. (1994) used the mixture
design to determine the optimal amount of peanut extract mixed with cottonseed
oil and water to produce a liquid coffee whitener. Another application of the
same experimental design was described by Jaswir et al. (1999), who studied the
life extension of palm oil used for deep-fat frying by natural antioxidants.
Oleoresin rosemary and sage extracts, together with citric acid, were shown to
be more affective than the synthetic BHA and BHT, in extending the life of frying
oil. The optimal combination was found to be 0.059% rosemary extract, 0.063%
sage extract and 0.028% citric acid.
Consumer sensory tests. During the long process of developing a new
product, different sensory tests are planned, at different times, to optimize the
product and maximize its chance of success in the market. Two kinds of sensory
tests are known, analytical and affective (IFT, 1981). Analytical tests are used
for laboratory evaluation of products in terms of differences or similarities and for
identification and quantification of sensory characteristics. An analytical sensory
test involves the detection, description and quantification of all sensory properties
34
of a product (Walker, 2000). It usually requires a few (5-20) trained panelists to
detect, evaluate and quantify the attributes of a prototype. Trained panelists
often reveal important information that could not be described or identified by
consumers in products that they consider acceptable or unacceptable.
Affective tests are used for evaluation of acceptance or preference of
products by consumers (Hashim et al., 1999). They are so called because the
panelists are expected to express their feelings and personal opinion about the
product (Resurreccion, 1998). During such tests, panelists can express simply
their preference or perform a rating among different samples, depending on the
type of product (Meilgaard et al., 1991). Participants are usually untrained and
recruited among people who are consumers or potential consumers of the
product. The minimum number of individuals that is required for consumer tests
is much larger than that required in analytical tests, usually ranging between 50
and 100. Larger numbers of panelists would decrease the risk of errors, but the
higher cost of more participants would not add enough statistical benefit to be
worthwhile. The characteristics to be examined in a consumer test can be
appearance, color, odor, taste, texture or overall acceptability of the food or
beverage. The characteristics can be different from the ones listed above, or can
be more detailed, depending on the product and the attributes that are
considered most critical for its success in the market. However, the questions
asked to the panelists cannot be too complex, because consumer panelists are
not trained and could be easily confused (Resurreccion, 1998).
35
A very popular method of rating used in an affective test is the 9-point
hedonic scale. It was developed by Jones et al. (1955) and Peryam and Pilgrim
(1957). It is articulated so that each descriptor had 9 possible levels: “dislike
extremely” (rating of 1), “dislike very much” (2), “dislike moderately” (3), “dislike
slightly” (4), “neither like nor dislike” (5), “like slightly” (6), “like moderately” (7),
“like very much” (8), “like extremely” (9). Other scale categories have been tried,
including the 3-, 5- and 7- point hedonic scales (Stone and Sidel, 1993). They
are used in cases when panelists have problems in understanding or expressing
differences among, e.g., “like slightly” and “like moderately”, as in the case of
children (Resurreccion, 1998). Even some adults have problems with a 9-point
scale. For example, some tend to avoid the extreme points in rating food
samples. Therefore, shorter scales are sometimes used, but they are of limited
use, because they do not stress the amount of difference among samples.
Furthermore, panelists who have the tendency to avoid the extremes of the scale
end up cutting the extreme points of any scale, thus further reducing any 3-, 5- or
7- point hedonic scale (Stone and Sidel, 1993). Consumer affective tests have
been the subject of the monograph “Consumer Sensory Evaluation” published in
1979 by the American Society for Testing and Materials (ASTM), Committee E-
18.
The consumer (or acceptance) test is an important step in product
development. It usually follows a descriptive test and precedes larger-scale
market tests. Discriminative (or analytical) sensory tests are required to narrow
the initial choice of samples to a smaller number. Then a consumer test
36
determines the acceptability of a selected number of samples. Samples that are
potentially most successful and generate information useful to optimize the
product itself should be selected. Success with the panelists, however, does not
guarantee success in the market. This will require a specific evaluation with a
larger-scale consumer test, usually involving 100 or more people from different
strategic locations (Resurreccion, 1998).
The objectives of an acceptance test are to 1) determine the level of
acceptability of a product among potential consumers of that product, 2)
determine the acceptability of different qualities of a product, like appearance,
color, aroma, taste, hardness, overall liking and 3) quantify the consumers’
response by correlating the results of the sensory test with the results of
analytical sensory tests as well as physical tests. If consumer acceptance can
be related to the attribute intensities, then a relationship between sensory
characteristics and formulation process can be established (Walker, 2000). This
relationship can be transformed into a predictive equation and displayed in
response surfaces or contour plots.
REFERENCES
Abraham, D., Blaydes, B.S., Bryant, C.W., Latendresse, J.R., Weis C.C. and
Delclos, K.B. 2002. Estrogen receptor expression in the prostate of rats
treated with dietary genistein. Chromatography B: Analytical Technologies
in the Biomedical and Life Sciences (Electronic release. Accepted for
publication).
37
Adeeko, K.A. and Ajibola, O.O. 1990. Processing factors affecting yield and
quality of mechanically expressed groundnut oil. J. Agric. Eng. Res. 45(1):
31-43.
Adlercreutz, H. and Mazur, W. 1997. Phyto-estrogens and western diseases.
Ann. Med. 29: 95-120.
Akiyama, T. and Ogawara, H. 1991. Use and specificity of genistein as inhibitor
of protein-tyrosine kinases. Methods Enzymol. 201: 362.
Akoh, C. and Min, B.D. 1998. Food Lipids: Chemistry, Nutrition and
Biotechnology. Marcel Dekker Inc., New York, NY.
Andersen, P.C., Hill, K., Gorbet, D.W. and Brodbeck, B.V. 1998. Fatty acid and
amino acid profiles of selected peanut cultivars and breeding lines. J.
Food Composition and Analysis 11(2): 100-111.
Anonymous. 1998. An interview with McCormick on trends in the snack industry
Cereal Foods World 43 (2): 60-65.
Anonymous. 2001. State of the industry. Snack Foods and Wholesale Bakery
90(10):1-38.
Anonymous. 2002. Oil Crops Outlook, USDA, January 2002.
AOAC. 2001. Official Methods of Analysis of AOAC International, Arlington VA.
Method 2001.10.
Aronson, W.J., Tymchuk, C.N., Elashoff, R.M., McBride, W.H., McLean, C.,
Wang, H.J. and Heber, D. 1999. Decreased growth of human prostate
LNCaP tumors in SCID mice fed a low-fat, soy protein diet with
isoflavones. Nutrition and Cancer 35 (2): 130-136.
38
Awad, A.B., Chan, K.C., Downie, A.C. and Fink, C.S. 2000. Peanut as a source
of β-sitosterol. Nutrition and Cancer 36(2): 238-241.
Baird, D.G. and Reed, C.M. 1989. Transportation properties in food doughs. Ch.
17 in Extrusion Cooking, C. Mercier, P. Linko and J.M. Harper (Ed.), p.
205-234. American Association of Cereal Chemists, St. Paul, MN.
Brooker, B.E. 1996. The role of fat in the stabilization of gas cells in bread dough.
J. Cereal Sci. 24: 187-198.
Burton, J.W. 1997. Soyabean (Glycine max (L.) Merr.). Field Crops Res. 53: 171-
186.
Chang, H.C. and Carpenter, J.A. 1997. Optimization quality of frankfurters
containing oat bran and added water. J. Food Sci. 62(1): 194-202.
Chavan, J.K., Shinde, V.S. and Kadam, S.S. 1991. Utilization of expeller pressed
partially defatted peanut cake meal in the preparation of bakery products.
Pl. Foods Hum. Nutr. 41(3): 253-259.
Cheftel J.C. 1986. Nutritional effect of extrusion cooking. Food Chem. 20: 263-
283.
Chiang, W.D., Shih, C.J. and Chu, Y.H. 2001. Optimization of acid hydrolysis
conditions for total isoflavones analysis in soybean hypocotyls by using
RSM. Food Chem. 72(4): 499-503.
Chiou, R.Y.Y., Liu, C.P., Hou, C.J. and Liu, C.D. 1995. Comparison of fatty acid
composition and oxidative stability of peanut oil prepared from spring and
fall crops of peanuts. J. Agric. Food Chem. 43(3): 676-679.
39
Chu, Y.H. and Hsu, H.F. 1999. Effects of antioxidants on peanut oil stability.
Food Chem. 66(1): 29-34.
Colonna, P., Tayeb, J. and Mercier, C. 1989. Extrusion cooking of starch and
starchy products. Ch. 9 in Extrusion Cooking, C. Mercier, P. Linko and
J.M. Harper (Ed.), p. 247-391. American Association of Cereal Chemists,
St. Paul, MN.
Coward, L., Barnes, N.C., Setchell, K.D.R. and Barnes, S. 1993. Genistein,
daidzein and their beta-glycoside conjugates; antitumor isoflavones in
soybean foods from American and Asian diets. J. Agric. Food Chem. 41:
1961-1967.
Dziezak, J.D. 1990. Taking the gamble out of product development. Food
Technology 6: 110-117.
Dhingra, S. and Jood, S. 2002. Organoleptic and nutritional evaluation of wheat
breads supplemented with soybean and barley flour. Food Chem. 77(4):
479-488.
Duranti, M. and Gius, C. 1997. Legume seeds: protein content and nutritional
value. Food Crops Research 53: 31-45.
Faridi, H. 1990. Application of rheology in the cookie and cracker industry.
Chapter 8 in Dough Rheology and Baked Product Texture by H.A. Faridi
and J.M. Faubion. Ed. Van Nostrand Reinhold, New York, NY.
Faubion, J.M. and Hoseney, R.C. 1982. High-temperature short-time extrusion
cooking of wheat starch and flour II: effect of protein and lipid on extrudate
properties. Cereal Chem. 59: 533-537.
40
Fenner, G.P. 1996. Low-temperature treatment of soybean (Glycine max)
isoflavonoid aglycon extracts improves gas chromatographic resolution. J.
Agric. Food Chem. 44 (12): 3727-3729.
Floros, J.D. and Chinnan, M.S. 1987. Optimization of pimiento pepper lye-peeling
process using Response Surface Methodology. Transactions of the ASAE.
30 (2): 560-565.
Floros, J.D. and Chinnan, M.S. 1988. Seven factor response surface optimization
of a double-stage lye (NaOH) peeling process for pimiento peppers. J.
Food Sci. 53(2): 631-638.
Frame, N.D. 1994. Operational characteristics of the co-rotating twin-screw
extruder. In The Technology of Extrusion Cooking, N.D. Frame (Ed), p. 1-
51. Blackie Academic and Professional, Chapman & Hall, New York.
Franke, A.A., Custer, L.J., Cerna, C.M. and Narala, K.K. 1994. Quantitation of
phytoestrogens in legumes by HPLC. J. Agric. Food Chem. 42:1905-1913.
Freeman, H.A., Nigam, S.N., Kelley, T.G., Ntare, B.R., Subrahmanyam, P. and
Boughton, D. 1999. The world groundnut economy: facts, trends, and
outlook. International Crops Research Institute for the Semi-Arid Tropics.
Patancheru 502324, Andhra Pradesh, India.
Genta, H.D., Genta, M.L., Álvarez, N.V and Santana, M. S. 2002. Production and
acceptance of a soy candy. J. Food Eng. 53 (2): 199-202.
Gogoi, B.K., Oswalt, A.J., and Choudhury, G.S. 1996. Reverse screw elements,
and feed composition effects during twin-screw extrusion of rice flour and
fish muscle blend. J. Food Sci. 61: 590-595.
41
Grice, H.C. 1988. Safety evaluation of butylated hydroxyanisol (BHA) from the
perspective of effects on forestomach and oesophageal squamous
epitelium. Food Chem. Toxic. 26: 717-723.
Gu, L. and Gu, W. 2001. Characteristics of soy isoflavones and screening for
novel malonyl glycosides using high-performance liquid chromatography-
electrospray ionization-mass spectrometry. Phytochem. Anal. 12:377-382.
Guthrie, J. R., Ball, M., Murkies, A. and Dennerstein, L. 2000. Dietary
phytoestrogen intake in mid-life Australian-born women: relationship to
health variables. Climacteric: J. Inter. Menopause Soc. 3(4): 254-261.
Guzman, G.J., Murphy, P.A. and Johnson, L.A. 1989. Properties of soybean-corn
mixtures processed by low cost extrusion. J. Food Sci. 54(1): 1590-1593.
Han, J.Y. and Khan, K. 1990. Functional properties of pin-milled and air-
classified dry edible bean fractions. Cereal Chem. 67(4): 390-394.
Harper, J.M. 1986. Extrusion texturization of foods. Food Technol. 40(3): 70-76.
Harper, J.M.1989. Food extruders and their application. Ch. 1 in Extrusion
Cooking, C. Mercier, P. Linko and J.M. Harper (Ed.), p. 1-16. American
Association of Cereal Chemists, St. Paul, MN.
Hashim, I.B., McWatters, K.H. and Hung, Y.C. 1999. Consumer acceptance of
honey marinated chicken. J. Muscle Foods 10: 231-244.
Hinds, M.J., Chinnan, M.S. and Beuchat, L.R. 1994. Unhydrogenated palm oil as
a stabilizer for peanut butter. J. Food Sci. 59(4): 816-820.
Hutabarat, L.S., Mulholland, M. and Greenfield, H. 1998. Development and
validation of an isocratic high-performance liquid chromatographic method
42
for quantitative determination of phytoestrogens in soya bean. J.
Chromatography A 795: 377-382.
Hwang, J.W., Shue, Y.S. and Chang, H.M. 2001. Antioxidant activity of roasted
and defatted peanut kernels. Food Res. Int. 34(7): 639-647.
IFT Sensory Evaluation Division. 1981. Sensory evaluation guide for testing food
and beverage products. Food Technol. 35: 50-59.
Ishimi, Y., Yoshida, M., Wakimoto, S., Wu, J., Chiba, H., Wang, X., Takeda, K.
and Miyaura, C. 2002. Genistein, a soybean isoflavone, affects bone
marrow lymphopoiesis and prevents bone loss in castrated male mice.
Bone (Electronic release. Accepted for publication on 2-25-2002).
Iwai, K., Nakaya, N., Kawasaki, Y. and Matsue, H. 2002a. Inhibitory effect of
natto, a kind of fermented soybeans, on LDL oxidation in vitro. J. Agric.
Food Chem. 50(12): 3592-3596.
Iwai, K., Nakaya, N., Kawasaki, Y. and Matsue, H. 2002b. Antioxidative functions
of natto, a kind of fermented soybeans: effect on LDL oxidation and lipid
metabolism in cholesterol-fed rats. J. Agric. Food Chem. 50(12): 3597-
3601.
Jaswir, I., Che Man, Y.B. and Kitts, D. 1999. Use of natural antioxidants in
refined palm olein during repeated deep-fat frying. Food Res. Int. 33: 501-
508.
Jones, L.V., Peryam, D.R. and Thurstone, L.L. 1955. Development of a scale for
measuring soldiers’ food preference. Food Res. 20: 512-520.
43
Johnson, P.D., Watson, M.A., Brown, J. and Jefcoat, I.A. 2002. Peanut hull
pellets as a single use sorbent for the capture of Cu(II) from wastewater.
Waste Management 22(5): 471-480.
Khalil, J.K. and Chughtai, M.I.D. 1983. Chemical composition and nutritional
quality of 5 peanut cultivars grown in Pakistan. Quality Plantarum. Plant
Foods for Human Nutrition 33: 63-70.
Kanazawa, T., Osanai, T., Zhang, X.S., Uemura, T., Oike, Y. and Ohkubo, K.
1995. Protective effects of soy protein on the peroxidizability of
lipoproteins in cerebrovascular diseases. J. Nutr. 125 (suppl.): 639S.
Kilborn, R.H. and Tipples, K.H. 1974. Implications of the mechanical
development of bread dough by means of sheeting rolls. Cereal Chem.
51(5): 648-657.
Kim, J.S. and Kwon, C.S. 2001. Estimated dietary isoflavone intake of Korean
population based on National Nutrition Survey. Nutrition Res. 21(7): 947-
953.
Kyle, E., Neckers, L., Takimoto, C., Curt, G. and Bergan, R. 1997. Genistein-
induced apoptosis of prostate cancer cells is preceded by a specific
decrease in focal adhesion kinase activity. Molecular Pharmacology
51(2): 193-200.
Kinsella, J.E. 1978. Texturized proteins: fabrication, flavoring, and nutrition. Crit.
Rev. Food Sci. Nutr. 10(11): 147-207.
Kris-Etherton, P.M., Pearson, T.A., Wan, Y., Hargrove, R.L., Moriarty, K., Fishell,
V. and Etherton, T.D. 1999. High-monounsaturated fatty acid diets lower
44
both plasma cholesterol and triacylglycerol concentrations. Am. J. Clin.
Nutr. 70(6):1009-1015.
Kudou, S., Fleury, Y., Welti, D., Magnolato, D., Uchida, T., Kitamura, K. and
Okubo, K. 1991. Malonyl isoflavone glucosides in soybean seeds
(Glycine max Merrill). Agric. Biol. Chem. 55: 2227-2233.
Lee, K.G., Mitchell, A.E. and Shibamoto, T. 2000. Determination of antioxidant
properties of aroma extracts from various beans. J. Agric. Food Chem.
48(10): 4817-4820.
Lehtinen, P. and Laakso, S. 2000. Inhibition of linoleic acid oxidation by
interaction with a protein-rich oat fraction. J. Agric. Food Chem. 48(11):
5654-5657.
Levine, L. and Drew, B.A. 1990. Rheological and engineering aspects of the
sheeting and laminating of dough. Chapter 14 in Dough Rheology and
Baked Product Texture by H.A. Faridi and J.M. Faubion. Ed. Van
Nostrand Reinhold, New York, NY.
Levine, L. and Levine, S. 1997. A preliminary investigation of the deformation of
cereal pellets by flaking rolls. Cereal Foods World 42(6):445-451.
Levine, L. 1998. Models for dough compressibility in sheeting. Cereal Foods
World 43(8): 629-634.
Liu, K. 1997. Soybeans- Chemistry, Technology and Utilization. International
Chapman and Hall, New York, NY. p. 83-113.
45
Mahungu, S.M., Diaz-Mercado, S., Li, J., Schwenk, M., Singletary, K. and Faller,
J. 1999. Stability of isoflavones during extrusion processing of corn/soy
mixtures. J. Agric. Food Chem. 47(1): 279-284.
Malovany, D. 2001. Shopping for trends. Snack Foods and Wholesale Bakery
90(5):6.
Malundo, T.M.M., Resurreccion, A.V.A., Ware, G.O. and Beuchat, L.R. 1994.
Sensory, physical and microbiological properties of liquid whitener from
peanuts. J. Food Sci. 59(2): 338-349.
Mastrocola, D. and Munari, M. 2000. Progress of the Maillard reaction and
antioxidant action of Maillard reaction products in preheated model
systems during storage. J. Agric. Food Chem. 48(8): 3555-3559.
Matthaus, B. 2002. Antioxidant activity of extracts obtained from residues of
different oilseeds. J. Agric. Food Chem. 50(12): 3444-3452.
Matz, S.A. 1989. Formulas and Processes for Bakers. Elsevier Science
Publishers. New York, NY.
Matz, S.A. 1993. Snack food technology. 3rd ed. The AVI Publishing Company,
New York, NY.
Mazur, W. and Adlercreutz, H. 1999. Dietary intake and levels in body fluids of
lignans and isoflavonoids in various populations. From: Natural
Antioxidants and Anticarcinogens in Nutrition, Health and Disease. Ed. by
J.T. Kumpulainen and J.T. Salonen, The Royal Society of Chemistry,
Cambridge, UK.
46
Meilgaard, M., Civille, G.V. and Carr, B.T. 1991. Sensory Evaluation Techniques
2nd Ed. CRC Press, Inc., Boca Baton, FL.
Messina, M.J. 1999. Legumes and soybeans: overview of their nutritional
profiles and health effects. Am. J. Clin. Nutrition 70(3): 439-462.
Miller, B.S. and Trimbo, H.B. 1970. Factors affecting the quality of pie dough
andpie crust. Bakers Digest 44(1): 46-49, 52-55.
Miller, J., Phillips, R.D. and Young, C.T. 1978. Protein nutrition quality of meal
made from several cultivars of peanuts as measured by rat bioassay.
Peanut Sci. 5(1): 19-22.
Mohamed, S. 1990. Factors affecting extrusion characteristics of expanded
starch-based products. J. Food Proc. Preserv. 14: 437-452.
Moore, G. 1994. Snack foods extrusion. Ch. 4 in The Technology of Extrusion
Cooking, N. D. Frame (Ed), p. 110-143. Blackie Academic and
Professional, Chapman & Hall, New York.
Nagata, C., Takatsuka, N., Kurisu, Y. and Shimizu, H. 1998. Decreased serum
total cholesterol concentration is associated with soy products in
Japanese men and women. J. Nutrition 128(2): 209-213.
Nakamura, Y, Tsuji, S. and Tonogai, Y. 2000. Determination of the levels of
isoflavonoids in soybeans and soy derived foods and estimation of
isoflavonoids in the Japanese daily intake. J. AOAC Int. 83(3): 635-650.
Omar, S., Girgis, B. and Taha, F. 2002. Carbonaceous materials from seed hulls
for bleaching of vegetable oils. (Electronic release. Accepted for
publication on March 11, 2002 by Food Res. Int.)
47
Paton, D. and Spratt, W.A. 1984. Component interaction in the extrusion cooking
process: influence of process conditions on the functional viscosity of the
wheat flour system. J. Food Sci. 49: 1380-1385.
Peryam, D.R. and Pilgrim, F.J. 1957. Hedonic scale method of measuring food
preferences. Food Tech. 11(9):9-14.
Prinyawiwatkul, W., Beuchat, L.R., Phillips, R.D. and Resurreccion, A.V.A. 1995.
Modelling the effects of peanut flour, feed moisture content, and extrusion
temperature on physical properties of an extruded snack product. Int. J. of
Food Sci. Tech. 30: 37-44.
Ranhotra, G.S. and Vetter, J.L. 1991. Foods Considered for Nutrient Addition:
Snacks and Confectioneries. Ch. 11 in Nutrient Addition to Food, J.C.
Bauernfeind and P.A. Lachance (Ed.), p. 319-345. Food and Nutrition
Press, Inc., Trumbull, CT.
Resurreccion, A.V.A, 1998. Consumer sensory testing for product development.
Aspen Publishers, Inc., Gaithersburg, MD.
Rousseau, D. 1999. Fat crystals and emulsion stability-a review. Food Res. Int.
33: 3-14.
Sabate, J. 1999. Nut consumption, vegetarian diets, ischemic heart disease risk
and all-cause mortality: evidence from epidemiological studies. Am. J.
Clin. Nutrition 70(3): 500S-503S.
Salunkhe, D.K., Sathe, S.K. and Reddy, N.R. 1983. Legume lipids. In Chemistry
and Biochemistry of Legumes. S.K. Arora (Ed.) Edward Arnold Pub. Ltd.,
London.
48
Sherkat, F., Nilsson, M., Eng, J. and Hadjis, M. 2001. Effects of processing on
the isoflavones content of soy and soy-bovine milk products. Food
Australia 53(7): 264-266.
Shukla, T.P. 2000. Modern snack food. Cereal Foods World 45(10): 477.
Simopoulos, A.P. 1989. Executive summary, in Dietary w3 and w6 Fatty Acids-
Biological Effects and Nutritional Essentiality. C. Galli and A.P.
Simopoulos (Ed.), p.391–404. Plenum, New York.
Singhara, A., Macku, C. and Shibamoto, T. 1998. Antioxidative activity of brewed
coffee extracts. In Functional Foods for Disease Prevention II: Medicinal
Plants and Other Foods; Shibamoto, T., Terao, J. Osawa, T., Eds; ACS
Symp. Ser. 701; Am. Chem. Soc: Washington, DC. p. 101-109.
Singletary, K., Faller, J., Li, J.Y. and Mahungu, S. 2000. Effect of extrusion on
isoflavone content and antiproliferative bioactivity of soy/corn mixtures. J.
Agric. Food Chem. 48 (8): 3566-3571.
Stewart, J. 1984. Snack cracker production. How to choose ingredients and
methods. Bakers Digest 58 (4): 20-24.
Stone, H. and Sidel, J.L. 1993. Sensory Evaluation Practices. Academic Press,
Inc. p. 84-106.
Suknark, K. 1998. Development of extrusion processes for novel snack food
production and the physicochemical and nutritional properties of resulting
products. Ph. D. Dissertation, University of Georgia, Athens, GA.
49
Suknark, K., Lee, J., Eitenmiller, R.R. and Phillips, R.D. 2001. Stability of
tocopherols and retinyl palmitate in snack extrudates. J. Food Sci. 66(6):
897-902.
Suknark, K., Phillips, R.D. and Y.W. Huang. 1999. Tapioca-fish and tapioca-
peanut snacks by twin-screw extrusion and deep fat frying. J. Food Sci.
64(2): 303-308.
Sumainah, G.M., Sims, C.A., Bates, R.P. and O’Keefe, S.F. 2000. Flavor and
oxidative stability of peanut-sesame-soy blends. J. Food Sci. 65: 901-905.
Van Boekel, M.A.J.S. and Walstra, P. 1981. Stability of oil-in-water emulsions
with crystals in the disperse phase. Colloids Surf. 3: 109-118.
Walker, G.M. 2000. Sensory profiles, modeling, and optimization, and effect of
storage time temperature on cracker-coated peanuts. M. S. Thesis,
University of Georgia, Athens, GA.
Walter, E.D. 1941. Genistin (an isoflavon glycoside) and its aglucone, genistein
from soybeans. J. Am. Chem. Soc. 63: 3273-3276.
Wang, H.J. and Murphy, P.A. 1994. Isoflavone composition of American and
Japanese soybeans in Iowa: effect of variety, crop year and location. J.
Agric. Food Chem. 42: 1674-1677.
Wang, H.J. and Murphy, P.A. 1996. Mass balance study of isoflavones during
soybean processing. J. Agric. Food Chem. 44: 2377-2383.
Wilkes, A.P. 2001. Turning snack nut sales around. Snack Foods and Wholesale
Bakery 90(10): 44-47.
50
Witschi, H.P. 1986. Enhanced tumor development by butylated hydroxytoluene
(BHT) in the liver, lung and gastrointestinal tract. Food Chem. Toxic. 24:
1127-1130.
Woodroof, J.G. 1983. Peanuts: Production, Processing, Products. Third Edition.
AVI Publishing Company, Inc., Westport, CT.
Yam, K.L., Gogoi B.K., Karve, M.V. and Wang, S.S. 1994. Shear conversion of
corn meal by reverse screw elements during twin-screw extrusion at low
temperature. J. Food Sci. 59: 113-114.
Yen, G.C., Liao, C.M. and Wu, S.C. 2002. Influence of Maillard reaction products
on DNA damage in human lymphocytes. J. Agr. Food Chem. 50: 2970-
2976.
Zava, D.T. and Duwe, G. 1995. Estrogenic bioactivity of phytoestrogens in
human breast cancer cells in monolayer culture. J. Nutrition 803S: 807S.
Zhu, S., Riaz, M.N. and Lusas, E.W. 1996. Effect of different extrusion
temperatures and moisture content on lipoxygenase inactivation and
protein solubility in soybeans. J. Agric. Food Chem. 44(10): 3315-3318.
51
SECTION II
PHYSICAL CHARACTERISTICS AND CONSUMER ACCEPTABILITY
OF LOW-FAT PEANUT CHIPS FORTIFIED
WITH CORNMEAL OR SOY FLOUR1
1Zenere, A., Huang, Y.-W., and McWatters, K. H. To be submitted to Peanut
Science.
52
ABSTRACT
Peanut press cake, an edible grade co-product of the peanut oil industry in
the form of pellets, was ground into meal. It was fortified with one third of either
cornmeal or soy flour and mixed with salt, sugar, baking powder and water, to
make dough. The dough was sheeted, cut into triangular shapes, and baked in
an impingement oven at 205 ºC for approximately 2 min. Color was measured in
CIE L*a*b* units. The peanut-corn and peanut-soy chips were similar in
lightness (L* = 60.64 - 59.25) but the peanut-soy chips had lower values of a*
(5.67), b* (18.98), hue (73.36) and chroma (19.81) compared to the peanut-corn
chips (a*=6.80, b*=24.45, hue =74.46 and chroma = 25.38). Texture was
determined using an Instron fitted with a Kramer cell. The peanut/soy chips
showed lower shear stress compared with peanut/corn chips (53.5 vs. 69.98
N/cm2). A sensory test with 75 participants was conducted to determine the
acceptability of the product. Peanut-corn chips received higher hedonic ratings
for appearance, color, aroma and overall liking than peanut-soy chips.
Consumers found the peanut-corn chips to be more acceptable than peanut-soy
chips (46.7% vs. 40.7%).
53
INTRODUCTION
Chips are a very popular food item today. They are convenient and rather
inexpensive. People enjoy them between meals and at mealtime (Anonymous,
1998). In 1999, the sale of potato chips reached a record $4.6 billion and tortilla
(corn) chips $3.7 billion (Anonymous, 2000). However, corn and potato chips are
not the only snack foods to meet with success by consumers. New snack foods
appear on the market every day with different formulations. Food companies
strive to produce new items to take advantage of new production technologies,
cultural trends, nutrition and health discoveries, and Dietary Guidelines from FDA
(Fuller, 1994). On a global scale, another reason to develop new food items is
the expanding world population. Feeding billions of people is an enormous
challenge and will require a judicious use of resources. The focus will be on
developing new ways to deliver the required amount of proteins, essential fatty
acids, minerals and vitamins. The “mad cow disease” emergency in Europe
reminded us that some well established sources in the food supply might be
denied on short notice. Every alternative source of proteins must be explored
and developed (Phillips and Falcone, 1988; Ward, 1995; Suknark et al., 1998).
Peanuts meet all of these requirements, particularly because of their high protein
content. It is true that they also contain a significant quantity of fat (35.8-54.2%)
(Woodroof, 1983), but the ratio of unsaturated vs. saturated fatty acids is high
(Andersen et al., 1998). Furthermore, some unsaturated fatty acids are essential
components of the human diet (Shukla, 1994). There are also ways to remove
some or nearly all of the oil without damaging the other nutrients.
54
In light of today’s trend towards consumption of low-fat (but good tasting)
foods in the United States, we developed a new chip from defatted peanut
pellets, an edible-grade co-product of the peanut oil industry. Previous
experiments with peanut flour were described by McWatters and Heaton (1972),
who produced peanut flour by grinding raw, full-fat peanuts. Chips were
produced by mixing peanut flour and water, forming, cutting and deep fat frying
the dough. The final chips varied in oil content depending on the flour particle
size. Peanut flour separated with a 14- and 18-mesh sieve absorbed more oil
than 30-mesh particle size flour. Nevertheless, all the chips produced contained
too much oil to be marketable. Another experiment with defatted peanut flour
was described by McWatters and Cherry (1980). They produced peanut chips
with commercial peanut flour, partially defatted or full-fat, toasted or untoasted.
The dough, formed by mixing peanut flour and water, was sticky and difficult to
handle unless the peanuts had been toasted at 160 ºC. Chips produced with
flour from peanuts toasted at a temperature of 171 or 177 ºC did not hold
together when fried. Furthermore, those chips that maintained their shape during
deep fat frying had final oil content between 47.8 and 62.4%, too high to be
appealing to customers. Our objective was to produce a chip from defatted
peanut pellets, an edible grade co-product of the peanut oil industry, fortified with
soy flour or cornmeal, and to determine the physical characteristics and
acceptability of the peanut-soy and peanut-corn chips.
55
MATERIALS AND METHODS
Peanut Pellet source. The defatted peanut press cake, in pellet shape,
was kindly provided by Birdsong Peanut Corporation, Suffolk, VA. This material
was received in August 1999, and stored at 4 ºC until used. It was derived from
Virginia variety seeds, extra large and medium size, harvested in 1998. The oil
had been extracted by hydraulic compression, and the temperature generated in
the process did not exceed 50 ºC. Pellet color was mocha-brown, and they had
very little residual peanut flavor. Product specifications provided by the company
indicated a protein content of 40-44%, oil content 10-14%, moisture 8%, fiber
3.7% and ash 3.1%. Soy flour (Arrowhead Mills, Hereford, TX) was lightly
roasted, full fat, and was purchased at a local store. Cornmeal (Arrowhead Mills,
Hereford, TX) was also purchased at a local grocery store.
Dough Preparation. The pellets were passed through a grinder (Model
4E, The Stroub Co., Philadelphia, PA), and then sieved with a # 15 mesh U.S.
Standard screen. Defatted peanut (150 g) flour was machine mixed on low
speed (Kitchen Aid, model KSM50PVH, Hobart Corp., Troy, OH) with 50 g of
either soy flour or cornmeal, together with 4 g salt, 12 g sugar, 3 g baking powder
and 80 g of water. The ingredients were mixed until the dough formed a solid
mass around the beater (ca 2 min). The bowl and beater were then scraped and
mixing continued (ca 1 min).
Sheeting and Baking. The dough was divided into roughly two parts of
150 g each. One part was enclosed in a plastic bag (Ziploc) and left at room
temperature. The other was placed between two layers of 60 µm plastic
56
(Cryovac, Duncan, SC). The dough was then passed through a sheeter (Model
S-18-BNO 4458, Moline Machinery, Ltd., Duluth, MN) set at the lowest possible
thickness (fourth lowest position) that allowed the dough to be removed from the
plastic without breaking. The dough was then rapidly cut into 5.1-cm-side
squares with a blade cutter. Each square was then cut diagonally with a pizza
cutter to obtain two triangular chips. The chips were released onto a wire screen
and placed on the belt of an impingement oven preheated at 205 ºC, set at a 2-
min time. In the meantime, the other part of the dough was processed by the
same procedure. The chips were cooled, put into plastic bags (Ziploc) and
stored in the refrigerator until used for physical and sensory evaluation.
Corn chips were not adequately crispy and dry after 2 minutes baking. A
supplemental baking time of 30 seconds was found to be satisfactory, and 2.5
min baking time was applied for all corn chips.
Proximate Composition. Percent moisture (Table 2.1) was determined
by drying the samples in a vacuum oven at 100 ºC (AOAC, 1995, Method
4.1.06). Fat was determined by extraction with petroleum ether using a Soxhlet
apparatus (AOAC Method 4.5.01). Protein content was determined by a private
laboratory (Seaboard Farms, Athens, GA) on a nitrogen analyzer (Model FD-428,
LECO, St. Joseph, MI).
Color Determination (Table 2.2). Instrumental measurement of chip color
was obtained using a Minolta colorimeter (model CR 200, Osaka, Japan). L*, a*,
b*, hue and chroma values (CIE system) for 10 chips were recorded (L* =
57
lightness, a* = red to green, b* = yellow to blue, hue = tan-1(b*/a*) and chroma =
(a*2+b*2)1/2.
Texture. Physical determination of texture was done using an Instron
Universal Testing Machine (model 1122, Canton, MA) fitted with a Kramer cell.
The load cell had a range of 500 Kg and the crosshead speed was 50 mm/min.
The maximum force required to shear the sample was recorded as shear stress
and expressed in N/cm2. Ten chips per formulation were tested, one at a time.
The average thickness of 1.6 mm was measured with a caliper, but the data was
not used in the final calculations, as all the chips had approximately the same
thickness. Chips were sheared one at a time because two chips were large
enough to overlap and three chips were hard enough to overload and tip the
Instron.
Sensory Evaluation. Sensory evaluation was conducted in the
Department of Food Science and Technology of the University of Georgia,
Athens. Seventy-five panelists (untrained consumers) were recruited from UGA
students, staff and faculty. They signed a consent form approved by the
University of Georgia Institutional Review Board, and were informed of the nature
of the food. After completing a demographic questionnaire, the panelists were
seated in individual booths in a climate-controlled laboratory equipped with
fluorescent lighting. Two samples, in duplicate, were offered on a tray in four
muffin paper cups, each marked by a random three-digit number. Two samples
contained peanut-soy and two contained peanut-corn chips. The presentation
order of the chips was randomized for each panelist. Water, unsalted crackers
58
and an expectoration cup were provided. Together with the chips, the panelists
received four ballots, one for each sample. Panelists rated each chip sample
using a 9-point hedonic scale (1 = dislike extremely, 5=neither like nor dislike, 9 =
like extremely) for appearance, color, aroma, flavor, texture and overall liking.
Product acceptance (yes or no) was also asked for each sample.
Statistical analysis was performed using the General Linear Model
(GLM) Procedure with the Statistical Analysis System (SAS Institute, Inc. 1996).
Analysis of Variance and Duncan’s Multiple Range Test were performed on the
physical, instrumental (color and texture) and sensory data (p<0.05).
RESULTS AND DISCUSSION
The baking process required 0.5 min longer for peanut-corn chips than
peanut-soy chips to obtain a level of lightness, crispness and moisture as close
as possible to the peanut-soy chips. The chemical analysis of the baked chips
showed a high protein and a very low oil content (Table 2.1). Color
determination showed similar values for lightness (L*), but peanut-corn chips had
higher values of a*, b*, hue angle and chroma than peanut-soy chips (Table 2.2).
Texture was also different, with peanut-soy chips (53.51 N/cm2) less hard than
peanut-corn chips (69.98 N/cm2). The demographic characteristics of the
sensory panelists are shown in Table 2.3. The population was almost equally
represented by males (52.2%) and females (47.8%). Nearly 70% were under the
age of 35, and 58% were students. Forty-nine percent were white, 31.3% were
Asian, and 10.4% were Hispanic. More than half had never been married, and
59
46.3% were married. Not surprisingly, a large percentage (70.1%) had
completed graduate or professional school.
The panelists did not detect any difference between peanut-soy and
peanut-corn chips in flavor and texture. Flavor received similar rating of 4.6 to 5
(“neither like nor dislike”) and so did texture, with scores of 4.4-4.5 (dislike
slightly) (Table 2.4). Peanut-corn chips received higher ratings than peanut-soy
chips for appearance, color and aroma, with ratings above 6 (“like slightly”) for
the chip containing 25% corn. Overall liking showed also a higher rating for
peanut-corn (4.9) than peanut-soy (4.4). The flavor was bland in both kinds,
apparently because the previous defatting process had extracted much of the
peanut flavor along with the oil. No external flavor, natural or artificial, was
added. Responses by consumers were disparate. For example, in response to
the question: “Overall, how do you like this sample?” the same kind of chip
sometimes received a score of 1 (dislike extremely) and sometimes a score of 9
(like extremely). This shows the risk that may be encountered in this kind of
sensory evaluation, where a quantitative assessment is required from people
with no training. A final question was asked of the panelists: “is this product
acceptable?” Of those responding, 46.7% answered positively for the peanut-
corn chips, whereas 40.7% responded favorably for the peanut-soy chips (Table
2.5).
60
CONCLUSIONS
Chips were produced with defatted peanut flour, a food-grade co-product
of the peanut oil industry, fortified with 25% soy flour or 25% cornmeal. The
preparation was simple and easy, thanks largely to a powerful sheeter and an
impingement oven. Baking the chips instead of frying them resulted in low fat
content in the final product (7.5% in peanut-soy and 5.5% in peanut-corn chips),
which would allow to label such snack food as a “low-fat” product. The difference
in physical characteristics between the two chips was small, and also the
consumer test did not show a strong difference between them. However, the
ratings of texture by the consumers, and the optional comments the panelists
wrote on the ballots, suggest that the chips were too hard, and needed to be
softened. Nonetheless, the low fat content of the final product leaves open the
possibility of adding peanut butter to the mix. It could increase the peanut flavor,
tenderize the chips and still keep the fat level reasonably low. The addition of
cornstarch or potato starch to the formulation could also enhance the level of
softness or crispness in the peanut chip. Overall, the commercial production of a
peanut chip that is low in fat and high in protein seems possible and practical.
Fortification with soy flour could provide additional health benefit. Findings from
this study are being used to guide further development of a nutritious, novel food
from peanuts.
61
ACKNOWLEDGMENTS
The authors gratefully acknowledge the financial support provided by the
State of Georgia’s Traditional Industries Program for Food Processing. Dr.
Glenn Ware and Mrs. Carolyn Clancey provided helpful support with the
statistical analysis of the experiment.
REFERENCES
Andersen, P.C., Hill, K., Gorbet, D. W. and Brodbeck, B.V. 1998. Fatty acid and
amino acid profiles of selected peanut cultivars and breeding lines. J.
Food Comp. Anal. 11:100-111.
AOAC. 1995. American Association of Analytical Chemists, 16th ed. Edited by
Patricia Cuniff, 2200 Wilson Boulevard, Arlington, VA.
Anonymous. 1998. An interview with McCormick on trends in the snack food
industry. Cereal Foods World 43 (2): 61-65.
Anonymous. 2000. State of the Industry Report. Snack Food and Wholesale
Bakery 89 (6):1-74.
Fuller, G.W. 1994. New food product development. From concept to
marketplace. CRC Press Inc., Boca Raton, FL.
McWatters, K.H. and Heaton, E.K. 1972. Development of snack-type chips from
peanuts. Research Bulletin 106. College of Agriculture Experiment
Stations, University of Georgia, Athens, GA.
McWatters, K.H. and Cherry, J.P. 1980. Influence of defatting and toasting on
binding and processing characteristics of peanut flours utilized in snack-
type peanut chips. J. Food Sci. 45(4):831-835.
62
Phillips, R.D. and Falcone, R.G. 1988. Extrusion of sorghum and sorghum
peanut mixtures : effect of barrel temperature and feed moisture on
physical-textural characteristics. J. Texture Studies 19:185-197.
SAS Institute, Inc. 1996. Statistical Analysis System Software. Version 6.08.
SAS Institute, Inc., Cary, NC
Shukla, T. P. 1994. Future snacks and snack food technology. Cereal Foods
World 39(9):704-705.
Suknark, K., McWatters, K.H. and Phillips, R.D. 1998. Acceptance by American
and Asian consumers of extruded fish and peanut snack products. J.
Food Sci. 63(4):721-725.
Ward, C.D.W. 1995. Effect of physicochemical and sensory properties on
functionality and consumer acceptance of snack chips formulated with
cowpea, corn, and wheat flour mixtures. Ph. D. Dissertation. Department
of Food Science and Technology, University of Georgia, Athens, GA.
Woodroof, J.G. 1983. Peanuts: Production, Processing, Products. 3rd Ed. AVI
Publishing Co. Inc., Westport, CT.
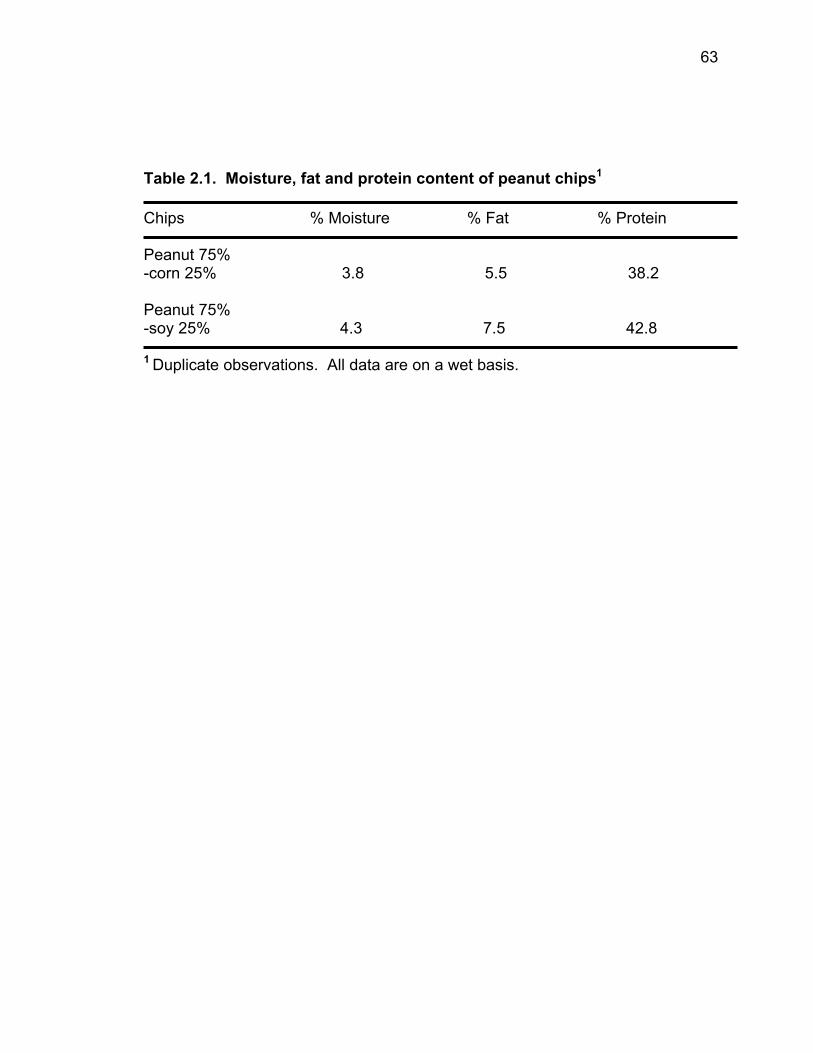
63
Table 2.1. Moisture, fat and protein content of peanut chips1 Chips % Moisture % Fat % Protein Peanut 75% -corn 25% 3.8 5.5 38.2 Peanut 75% -soy 25% 4.3 7.5 42.8 1 Duplicate observations. All data are on a wet basis.
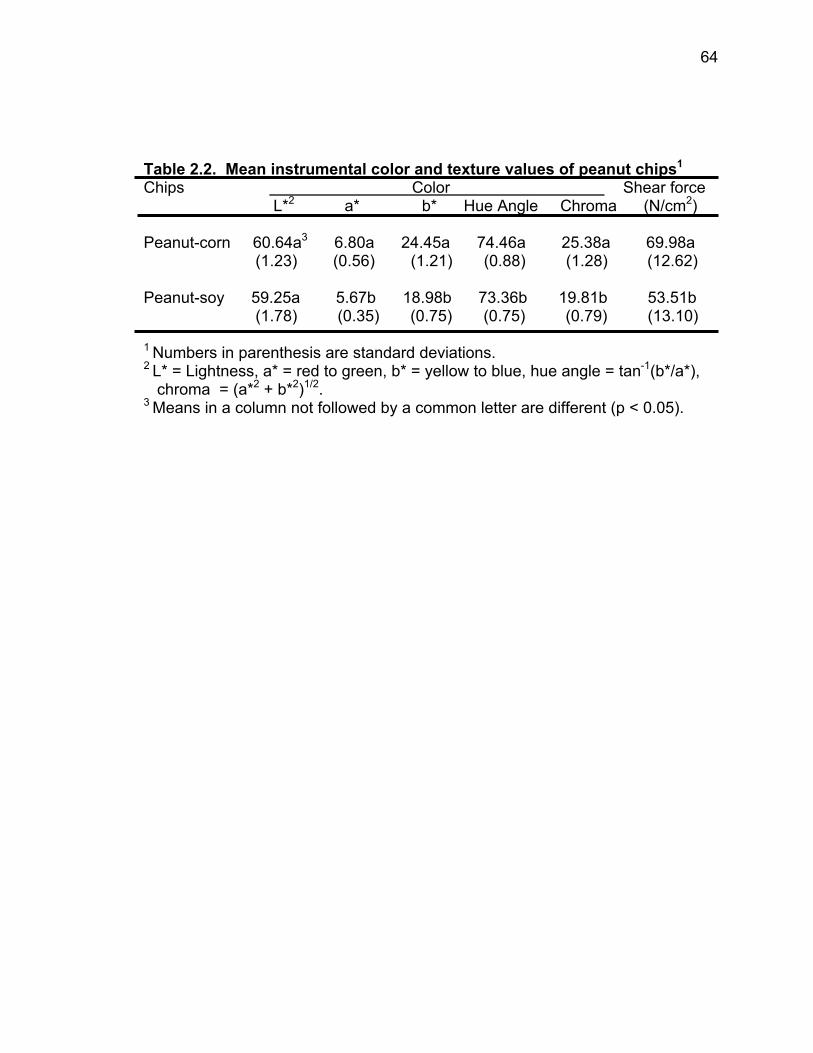
64
Table 2.2. Mean instrumental color and texture values of peanut chips1 Chips Color Shear force L*2 a* b* Hue Angle Chroma (N/cm2) Peanut-corn 60.64a3 6.80a 24.45a 74.46a 25.38a 69.98a (1.23) (0.56) (1.21) (0.88) (1.28) (12.62) Peanut-soy 59.25a 5.67b 18.98b 73.36b 19.81b 53.51b (1.78) (0.35) (0.75) (0.75) (0.79) (13.10) 1 Numbers in parenthesis are standard deviations. 2 L* = Lightness, a* = red to green, b* = yellow to blue, hue angle = tan-1(b*/a*), chroma = (a*2 + b*2)1/2. 3 Means in a column not followed by a common letter are different (p < 0.05).
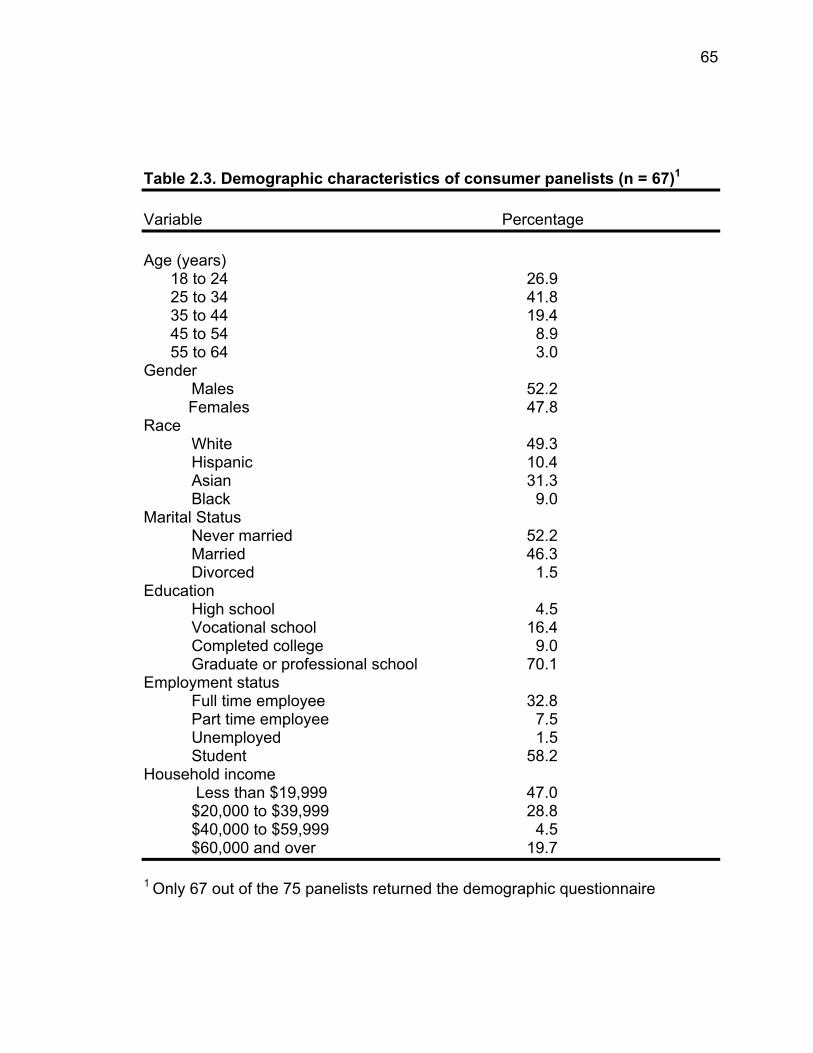
65
Table 2.3. Demographic characteristics of consumer panelists (n = 67)1 Variable Percentage Age (years) 18 to 24 26.9 25 to 34 41.8 35 to 44 19.4 45 to 54 8.9 55 to 64 3.0 Gender Males 52.2 Females 47.8 Race White 49.3 Hispanic 10.4 Asian 31.3 Black 9.0 Marital Status Never married 52.2 Married 46.3 Divorced 1.5 Education High school 4.5 Vocational school 16.4 Completed college 9.0 Graduate or professional school 70.1 Employment status Full time employee 32.8 Part time employee 7.5
Unemployed 1.5 Student 58.2
Household income Less than $19,999 47.0 $20,000 to $39,999 28.8 $40,000 to $59,999 4.5 $60,000 and over 19.7
1 Only 67 out of the 75 panelists returned the demographic questionnaire
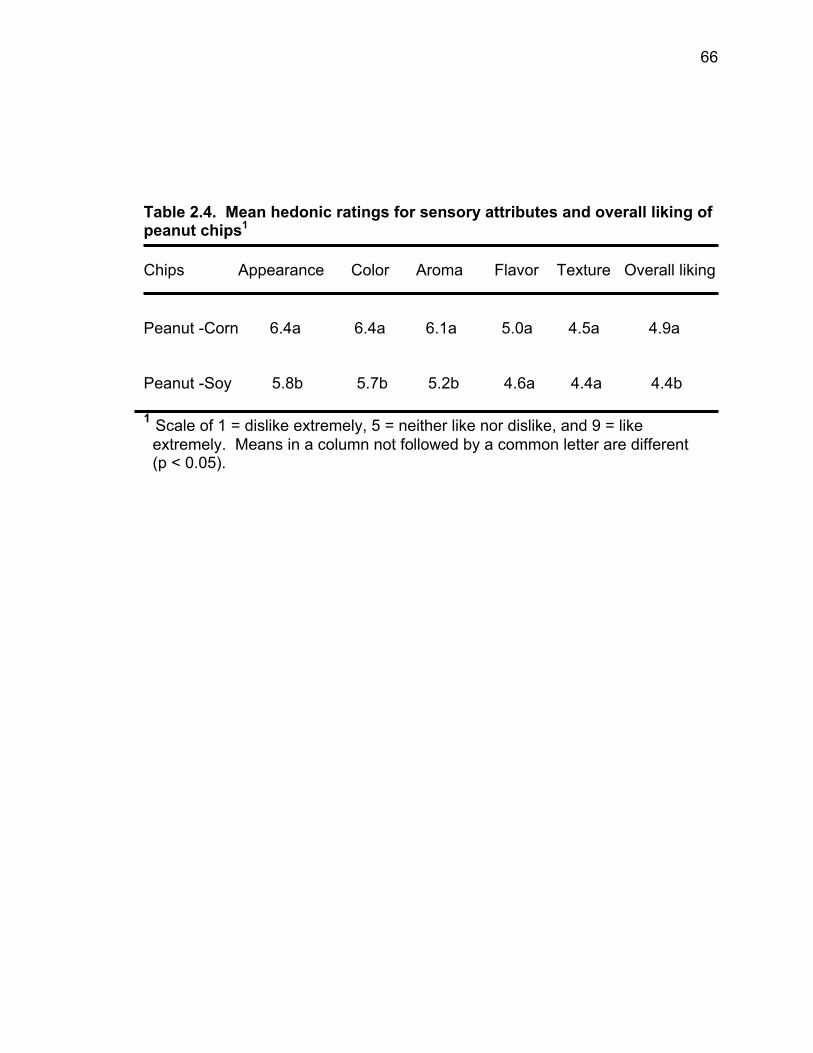
66
Table 2.4. Mean hedonic ratings for sensory attributes and overall liking of peanut chips1 Chips Appearance Color Aroma Flavor Texture Overall liking
Peanut -Corn 6.4a 6.4a 6.1a 5.0a 4.5a 4.9a Peanut -Soy 5.8b 5.7b 5.2b 4.6a 4.4a 4.4b 1 Scale of 1 = dislike extremely, 5 = neither like nor dislike, and 9 = like extremely. Means in a column not followed by a common letter are different (p < 0.05).
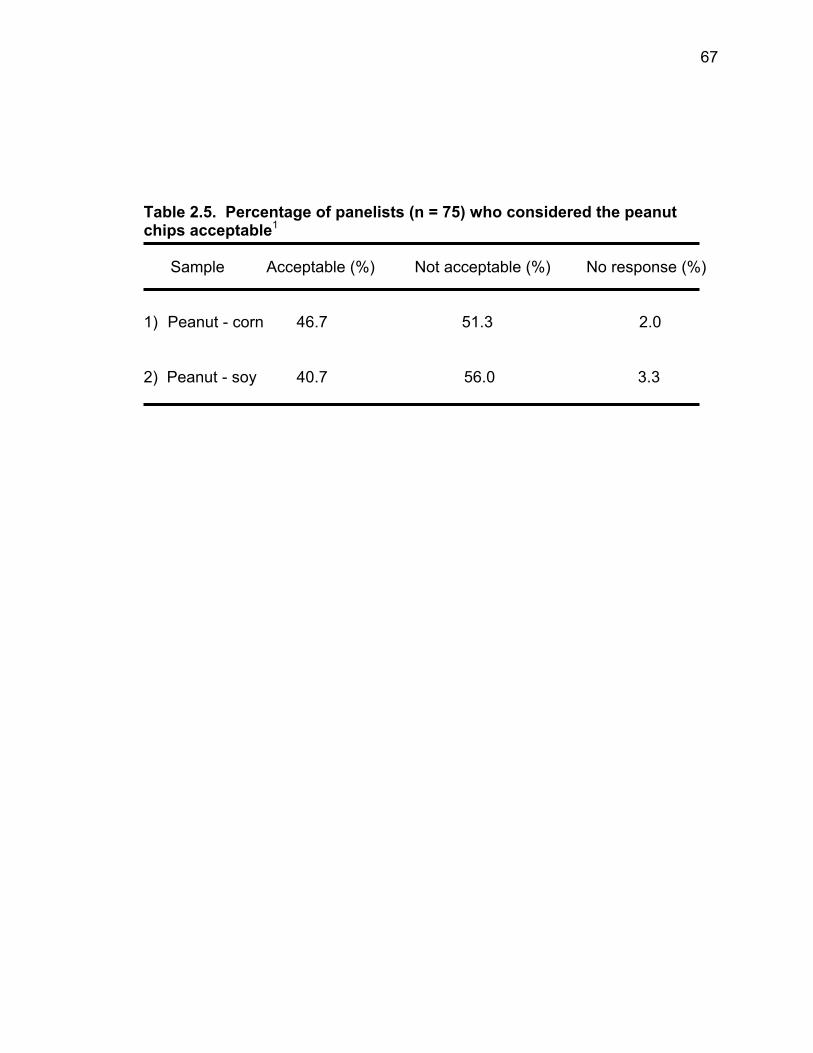
67
Table 2.5. Percentage of panelists (n = 75) who considered the peanut chips acceptable1 Sample Acceptable (%) Not acceptable (%) No response (%)
1) Peanut - corn 46.7 51.3 2.0 2) Peanut - soy 40.7 56.0 3.3
68
SECTION III
PHYSICAL AND SENSORY PROPERTIES OF PEANUT CHIPS FORTIFIED
WITH SOY AND WHEAT FLOURS
1 Zenere, A., Huang, Y.-W., McWatters K. H. and Lyon, B. G. To be
submitted to the Journal of Food Science.
69
ABSTRACT Peanut flour (10% fat), made from cold pressed peanut pellets and
fortified with 25% partially roasted soy flour or wheat flour, was made into
baked chips. Chips made from 75% peanut flour and 25% soy flour had
higher intensities of “burnt” and “cardboardy” flavors than those made with
100% peanut flour or with 75% peanut flour and 25% wheat flour.
However, chips made from skinless cold pressed peanut pellets had lower
intensities of peanut butter, grainy and burnt flavors as compared to skin-
on peanut pellets. The shear stress for chips made with 100% defatted
peanut flour was 106 Kg/g, while that for chips with commercial roasted
peanut flour was 80 Kg/g. Adding soy or wheat flours resulted in softer
chips.
70
INTRODUCTION
According to a recent report of the Snack Food Association (SFA),
the sale of snack foods reached the level of $30 billion in 1999
(Anonymous, 2000). In 1997, a total of 1,400 new snack foods had been
produced and the average consumer who bought snack foods had spent
approximately $55 for those items (Anonymous, 1998). Snack nut
consumption has decreased in the past few years because of concern
about fat content and a lack of new products. However, the last report
from the SFA (Anonymous, 2000) shows an increase in nut sales of
13.7% in 1999. This improvement was due to the positive publicity that
nuts contain mono-unsaturated fatty acids, considered a healthy kind of
fat. Peanuts have been used alone or mixed with fish or other flours such
as tapioca and sorghum (Phillips and Falcone, 1988; Suknark et al.,1999)
to produce extruded foods. Extrusion is convenient and is finding more
and more applications, but it requires expensive equipment that not every
processor can afford. Furthermore, it can have a harsh effect on the
nutrients. A more traditional process, like sheeting, may sometimes be
more convenient. At the present time, no low fat peanut-based chip is
available in the market. The objective of this research was to develop a
baked chip product based on defatted peanut flour.
71
MATERIALS AND METHODS
Peanut flour and other ingredients
Cold pressed peanut pellet, an edible grade by-product of the
peanut oil industry (Birdsong Peanut Corp., Suffolk, VA) was used for the
study. Shelled peanut kernels were pressed through an oil extractor at
50°C for 30 sec. The skin was left on the seeds during processing
because it facilitated the movement of the crushed kernels through the oil
extractor. Specifications provided by the peanut processor for the
proximate composition of the peanut pellet were: protein, 40-44%; fat, 10-
14%; moisture, 8%; fiber, 3.7% and ash, 3.1%. The peanut pellets, in the
form of sticks, were ground with a split grinder (Model 4E, The Straub Co.,
Philadelphia, PA) on the day of each experiment. Commercial peanut
flour (Golden Peanut Co., Alpharetta, GA) used as a control was lightly
roasted and partially defatted (fat = 12.7%). The moisture and protein
contents were 2.2% and 53.7%, respectively. Lightly roasted soybean
flour (Arrowhead Mills, Hereford, TX) and unbleached wheat flour
(Arrowhead Mills, Hereford, TX) were purchased at a local grocery store in
Athens, GA. Creamy peanut butter (Kroger - Tara Foods, Albany, GA)
and pre-gelatinized, modified cornstarch (BAKA-Snack, National Starch
and Chemical Corp., Bridgewater, NJ) were also used. The formulations
of tested chips are shown in Table 3.1.
72
Sample preparation
The dry ingredients were mixed first manually and then put into a
Kitchen Aid mixer (Model KSM 50PWH, St. Joseph, MI) for 1 min. After
adding water (at 40°C), the ingredients were mixed until dough formed.
The dough was placed between two thick sheets (60 µm) of plastic film
(Cryovac, Duncan, SC), and passed through a sheeter (Model S-18-BNO
4458 Moline Machinery, Ltd., Duluth, MN) set to the fourth lowest position,
so as to deliver a sheet of 1.6 mm thickness with a size of ca. 30 x 50 cm.
The sheet was sprinkled on both sides with sugar. Approximately 12 g of
sugar per batch was added. The sheet was cut into squares (5 cm x 5
cm) by using a multiple-blade pizza cutter. The chips were put on a metal
tray and set on the belt of an impingement oven (Model 1450, Lincoln
Foodservice Products, Fort Wayne, IN). They were first dried at 98°C for
20 min to reduce the moisture content to 8-10%, and then baked at 160°C
for 2 min. Final moisture content of the chips was 2-3%. The chips were
cooled, stored in Ziploc bags and refrigerated until the next day when
the sensory tests were conducted.
Sensory evaluation
A quantitative analytical sensory method was used (Meilgaard et
al., 1991). The eight-member trained descriptive panel was comprised of
males and females ranging in age between 23 and 63 who had previously
been screened and selected. All but one panelist had more than two
years’ experience in descriptive panel work. Panelists met twice a week
73
from 9:00 to 11:00 a.m. Initial training sessions were held to develop the
list of descriptive attributes appropriate for a range of commercial chips
and crackers. The list of descriptors and references was refined and
finalized as appropriate for the test samples (Table 3.2). The descriptors
chosen were: peanut butter flavor, grainy/nutty, scorched/burnt,
cardboardy, sweet, salty, bitter/astringent, roughness, hardness,
fracturability, moisture absorption, gritty/grainy particles, chewiness and
toothpack. Attributes were scored on a scale of 1 to 15 with 1 being the
low intensity of the attribute and 15 being high intensity. Tests were
conducted in individual test booths equipped with low-pressure sodium
vapor lighting to mask color differences. Water, expectorating cups,
unsalted crackers and apple slices were served with test samples for
mouth cleansing. After a warm-up sample, duplicate chips in coded
plastic bags were presented in two sets of three samples with a 15-min
break between sets. Order of samples within a set was randomized. The
test was presented via computer using the Compusense Sensory Analysis
system (Compusense five, Release 4.0, Compusense, Inc., Guelph, ON,
Canada). Panelists followed the computer screen instructions to evaluate
the samples and record their responses on the 15-point unstructured line
scales for each attribute.
Proximate composition
Moisture was determined using a HR73 Halogen Moisture Analyzer
(Mettler-Toledo, Greifensee, Switzerland). Fat content was determined by
74
extraction with petroleum ether (AOAC 4.5.01, 1995). Protein content
was determined by a private laboratory (Seaboard Farms, Athens, GA) on
a nitrogen analyzer (Model FD-428, LECO, St. Joseph, MI).
Color determination
Instrumental measurement of chip color was obtained using a
Minolta colorimeter (model CR 200, Osaka, Japan). L*, a* and b* values
for 10 replicates per sample were recorded (L* = lightness, a* = redness,
and b* = yellowness).
Texture measurement
For the Kramer shear test, an Instron Universal Testing Machine (Model
1122, Instron Corp., Canton, MA) was fitted with a Kramer cell attachment. The
cross bar with a 5000 N load cell moved at 50 mm/min speed. Data were
recorded and analyzed by a series IX Automated Material Testing System
software (Instron, Canton, MA). One chip (ca. 2.7 g) was laid on the center of
the Kramer cell. The force required to crush it was recorded as shear stress
and expressed as Kg/g. The total work required to break the chip (“energy to
break point”) was also recorded and expressed in Kg*mm. In the snapping test
(Bruns and Bourne, 1975) the chip was positioned on top of two bars 2.5 cm
apart and broken by a vertical bar connected to the Instron loading cell and
moving at 50 mm/min. The results were expressed in Newtons.
Statistical analysis
Analysis of Variance was performed using the General Linear
Model procedure (PROC GLM) with statistical software (SAS Institute Inc.
75
1996). Analysis of Variance and Duncan’s multiple range tests
determined whether the effect of treatment (formula) was significant at
P<0.05. Correlation between sensory data and the physical data shear
stress, “energy-to-break- point” and “snapping force” was determined
using the Pearson correlation procedure (PROC CORR).
RESULTS AND DISCUSSION
Experiment 1.
Five experiments for five formulations, each with at least three
replications, were conducted. Mean values obtained in Experiment 1 are
shown in Table 3.3. This experiment was performed using cold-pressed
defatted peanut pellets. Pellets were ground just before the experiment,
to prevent oxidation and rancidity. Chips made from 100% peanut
(Formula 1) were visually observed to have a dark brown color; this
formula had the least redness and yellowness. Formula 5, which
contained the lowest level of peanut pellet (50% peanut pellet, 25% soy
and 25% wheat), had the highest energy-to-break-point (190 Kg*mm),
indicating the highest amount of work required to break the chip.
Of all the sensory descriptors, only “burnt”, “cardboard”,
“roughness” and “hardness” were different in the 5 formulations. Formula
2 (75% peanut, 25% soy) was the highest in burnt (3.5) and cardboard
(4.3) flavors and hardness (8.3). Formula 1 (100% peanuts) had the
lowest intensities of burnt (2.3) and cardboard (3.0).
76
Experiment 2.
To determine if the flavor and the textural attributes were influenced
by the peanut composition or by the peanut defatting process, Experiment
2 was conducted using commercial-partially defatted-lightly roasted
peanut flour (fat content = 12.7%, protein = 53%, moisture =2.2%). The
formulations were the same as that in Experiment 1. The commercial flour
was finely ground and lighter in color than the one obtained by grinding
the pellets. Therefore, the appearance of the second set of chips was
different. Chips made from the commercial flour had higher redness (a*
ranged from 8.49 to 10.52) and yellowness (b* = 28.6 - 30.79) than those
made with flour from pellets (a* = 7.26 - 9.19 and b* = 20.01 - 29.57)
(Table 3.4). In addition, the shear stress was different (75.8 - 94.8 Kg/g)
compared to 92.1 - 102.9 Kg/g for cold pressed, suggesting that the chips
made from commercial flour were softer than chips from pellets. There
were no perceived differences among the different formulations containing
commercial peanut flour, except for “burnt” and “cardboard”, with the 25%
soy chips always having greater intensities of these attributes than chips
with 25% wheat or 100% peanut. Ratings for chips in the two experiments
were very similar, thus it seemed relevant to test the two different chips,
from pellets or from commercial flour, side by side, in a parallel
experiment.
77
Experiment 3.
Table 3.6 shows the result of Experiment 3, in which three
formulations with cold pressed peanut pellets (CP) are compared with
identical formulations using lightly roasted commercial peanut flour (LR).
Table 3.5 shows the relative percentages of the flour mixtures. As in the
two previous experiments, sugar was sprinkled on the chip surface.
Experiment 4.
This experiment was identical to Experiment 3, the only difference
being that sugar was not sprinkled on the chips (Table 3.7). The chips
made from pellets were lighter in color than those made from commercial
flour (60.5 and 56.0, respectively). Redness and yellowness were both
higher in non-sugarcoated chips made from commercial flour (10.4 and
30.4, respectively) compared with chips from pellets (7.8 and 24.5). The
same trend had been previously noted in chips with topical sugar. The
shear stress for chips made from pellets was 17.9% to 45.6% higher than
that for chips made from commercial flour, with the coat of sugar usually
adding to the hardness. In either Experiment 3 or 4, chips made with
100% peanut had higher shear stress than the other formulas (with the
exception of Formula 2 in non-sugarcoated peanut pellet chips). This
indicated that texture of chips made from 100% peanut flour is harder than
that of chips made from mixed flours. The snapping test was applied in
Experiment 3, 4 and 5. Chips prepared with 100% commercial peanut
flour (LR) tended to have lower snapping force values than the mixed-flour
78
chips containing commercial flour. Moreover, chips prepared with
commercial peanut flour had higher snapping force values than chips
obtained from pellets.
The sensory analysis in Tables 3.6 and 3.7 shows low values for
intensities of taste and flavor attributes, also noted in previous
experiments. However, peanut butter flavor was generally higher in chips
with topical sugar than in chips without topical sugar (3.6 and 3.1,
respectively), suggesting the possibility that sugar may intensify peanut
flavor.
Experiment 5.
Peanut skin can yield a final product with darker color than when
the skin is not present. Furthermore, the skin is known to contain tannins
(Woodroof, 1983), which cause bitter taste. To observe if the peanut skin
had any effect on color and flavor of chips, a sample of pellets derived
from peanuts that had been blanched (separated from their skin) before
processing was obtained from the company. The results are shown in
Table 3.8. The L* and b* values were higher when the skin had been
removed than when present. However, most of the other physical
characteristics were not affected by the skin. Chips made from pellets
with skin had slightly higher intensities of some flavor attributes (peanut
butter, grainy/nutty, burnt) and roughness than chips that had no skin.
Toothpacking was less intense in chips that contained peanut skin than
when skin was not present.
79
The physical attribute energy-to-break-point showed a trend: the
chips made from 100% peanut pellets had often lower values than chips
made with 75% or 50% peanut pellet flour (Tables 3.3 and 3.8). This
trend was not apparent in chips made from commercial peanut flour
(Table 3.4). This textural characteristic may be the result of interaction
among different proteins. Peanut proteins derived from cold pressed
pellets were not denatured during low-temperature processing (50°C), so
they were more likely to interact with proteins contained in soy flour or
wheat flour than the proteins present in defatted and roasted commercial
peanut flour.
Correlation analysis
No statistical correlation was found between sensory and physical data.
This was to be expected because the differences among formulations were
small. No correlation above 0.5 was identified, with the exception of hardness
and snapping force (0.57).
Comparison with commercial products
The texture of a snack food is critical for customer acceptance. In
order to evaluate the progress done in this area, and the work that still
needs to be done, four comparable products already in the market (Air
Crisps Wheat Thins and Wheatsworth from Nabisco, Wheatables
and Toasteds from Keebler) were analyzed with the Instron and Kramer
cell. The four products are all described as crackers. Commercial chips
(like potato chips or corn chips) were wavy and irregular in shape and
80
could not be as easily tested for shear or snapping-force as our peanut
chips. The results are shown in Table 3.9. The shear stress of three of
the four products ranged between 10.1 and 15.9 Kg/g. Only the
Wheatables were as high as 31.2 Kg/g. Defatted peanut chips show a
much harder texture than the commercial cracker-like products. However,
when the flour from pellets was replaced with commercial flour, the
average shear stress decreased from 106.1 to 86.7 Kg/g (Table 3.6).
Chips made with a mixture of soy and peanut flours decreased further in
hardness (70.5 Kg/g in sugarcoated and 66.0 Kg/g in non-sugarcoated
chips) (Table 3.6 and Table 3.7). There is space for further improvement.
For example, the peanut percentage in the flour mix could be decreased
and different starch formulations could be investigated (for example,
potato starch). Also changing the chip geometry should help. For
example, smaller chips made with 75% commercial peanut flour and 25%
wheat, sugarcoated, drew praises and interest at the public show “Peanut
and Jelly Day” at the State Capitol, Atlanta on March 1, 2000. Another
way to improve the geometry could be by puncturing or pricking the dough
as is done with most commercial crackers.
CONCLUSIONS
A snack chip prepared from defatted peanut flour, a by-product of peanut
oil extraction, could be a successful new product, with its high content of protein
and other nutrients and low fat content. Furthermore, the chip could have a very
low cost, because the principal ingredient is an edible grade by-product of peanut
81
oil extraction. Mixing commercial peanut flour with flour from pellets could add
the advantage of softer texture to that of the low cost of defatted pellet flour.
Problems with a hard texture persist, but it has been shown that it is possible to
add softness to the product, for example, by adding different flours. More
improvement could be achieved with different flour formulations and a different
geometry of the chips. Descriptive sensory analysis did not detect a strong
difference in flavor and texture between chips prepared with 100% peanut flour
or a mix of 75% peanut and 25% soy or wheat flour. If improvement can be
made in baked peanut chip quality, potential exists for providing peanuts in a
novel, ready-to-eat form.
ACKNOWLEDGMENT
The authors gratefully acknowledge the financial support provided by the
State of Georgia’s Traditional Industries Program for Food Processing.
Special appreciation is extended to Elizabeth Savage of USDA – ARS,
Athens, GA, who trained the descriptive panel and conducted the sensory
tests. Dr. Glenn Ware and Mrs. Carolyn Clancey provided helpful support
with the statistical analysis of the experiment.
82
REFERENCES
Anonymous, 1998. An interview with McCormick on trends in the food industry.
Cereal Foods World 43(2):60-65.
Anonymous, 2000. State of the Industry, Report 2000. Snack Food and
Wholesale Bakery 89(6):35-108.
AOAC. 1995. Official Methods of Analysis of AOAC International. 16th
ed. Vol 1. AOAC International, Arlington VA: Ch 4, P. 17 (Method
4.5.01).
Bruns, A. J. and Bourne, M. C. 1975. Effect of sample dimensions on the
snapping force of crisp food. J. Text. Stud. 6:445-458.
Meilgaard, M., Civille, G. V. and Carr, B. T. 1991. Sensory evaluation
techniques. 2nd ed. CRC Press Inc. Boca Raton, Fla.
Phillips, R.D. and Falcone, R.G. 1988. Extrusion of sorghum and sorghum
peanut mixtures: effect of barrel temperature and feed moisture on
physical-textural characteristics. J. Text. Stud. 19:185-197.
SAS Institute Inc., 1996. Statistical Analysis System Software. Version 6.08.
SAS Institute Inc., Cary, N.C.
Suknark, K., Phillips, R.D. and Huang, Y.-W. 1999. Tapioca-fish and tapioca-
peanut snacks by twin-screw extrusion and deep-fat frying. J. Food Sci. 64
(2):303-308.
Woodroof, J.G. 1983. Peanuts: production, processing, products. 3rd Ed. AVI
Publishing Co. Inc., Westport, CT.
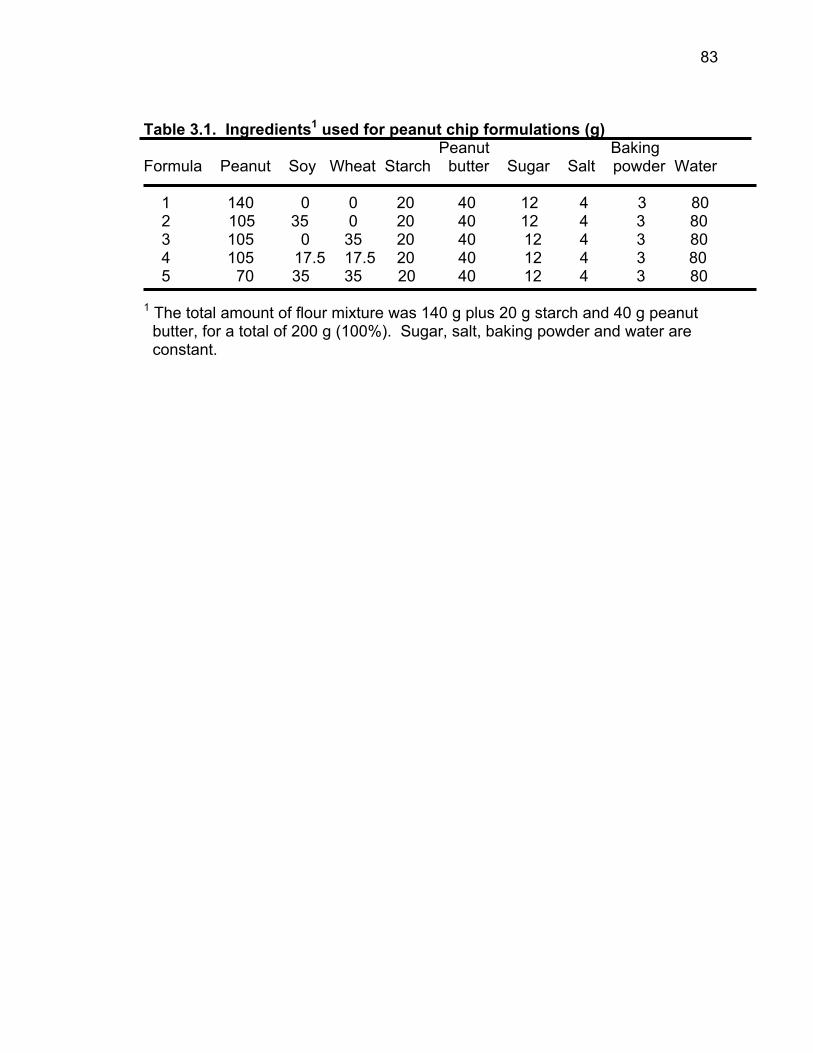
83
Table 3.1. Ingredients1 used for peanut chip formulations (g) Peanut Baking Formula Peanut Soy Wheat Starch butter Sugar Salt powder Water 1 140 0 0 20 40 12 4 3 80 2 105 35 0 20 40 12 4 3 80 3 105 0 35 20 40 12 4 3 80 4 105 17.5 17.5 20 40 12 4 3 80 5 70 35 35 20 40 12 4 3 80 1 The total amount of flour mixture was 140 g plus 20 g starch and 40 g peanut butter, for a total of 200 g (100%). Sugar, salt, baking powder and water are constant.
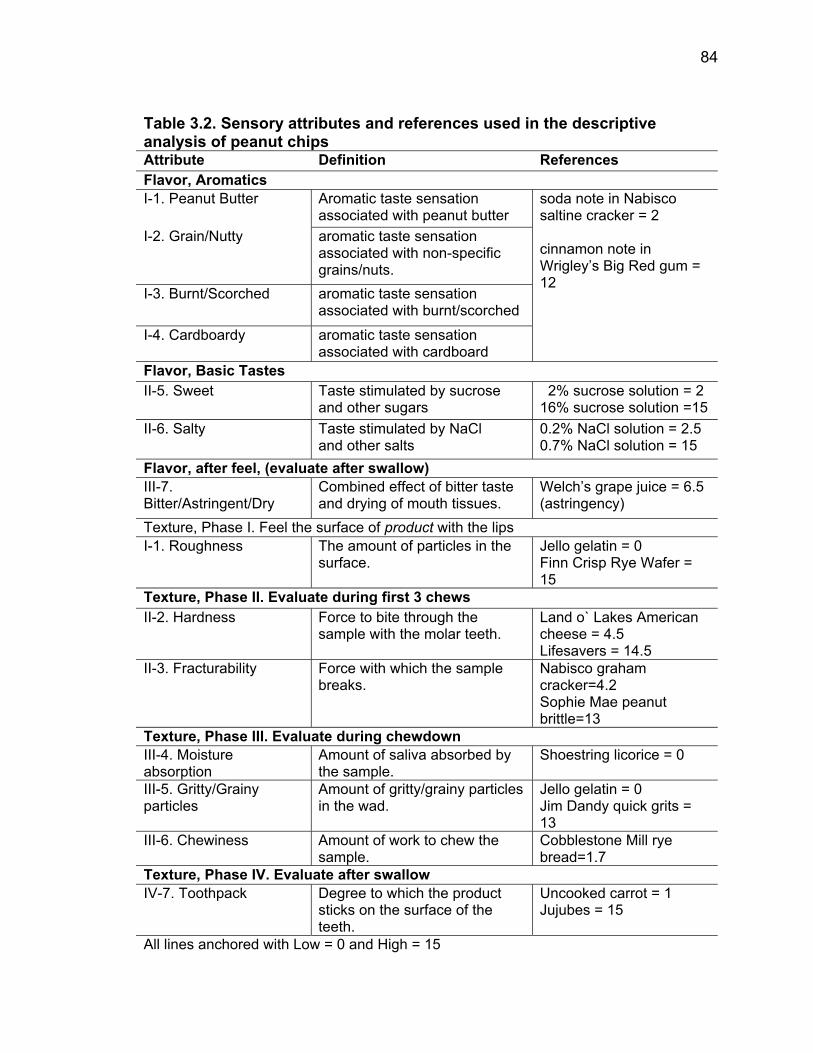
84
Table 3.2. Sensory attributes and references used in the descriptive analysis of peanut chips Attribute Definition References Flavor, Aromatics I-1. Peanut Butter Aromatic taste sensation
associated with peanut butter I-2. Grain/Nutty aromatic taste sensation
associated with non-specific grains/nuts.
I-3. Burnt/Scorched aromatic taste sensation associated with burnt/scorched
I-4. Cardboardy aromatic taste sensation associated with cardboard
soda note in Nabisco saltine cracker = 2 cinnamon note in Wrigley’s Big Red gum = 12
Flavor, Basic Tastes II-5. Sweet Taste stimulated by sucrose
and other sugars 2% sucrose solution = 2 16% sucrose solution =15
II-6. Salty Taste stimulated by NaCl and other salts
0.2% NaCl solution = 2.5 0.7% NaCl solution = 15
Flavor, after feel, (evaluate after swallow) III-7. Bitter/Astringent/Dry
Combined effect of bitter taste and drying of mouth tissues.
Welch’s grape juice = 6.5 (astringency)
Texture, Phase I. Feel the surface of product with the lips I-1. Roughness The amount of particles in the
surface. Jello gelatin = 0 Finn Crisp Rye Wafer = 15
Texture, Phase II. Evaluate during first 3 chews II-2. Hardness Force to bite through the
sample with the molar teeth. Land o` Lakes American cheese = 4.5 Lifesavers = 14.5
II-3. Fracturability Force with which the sample breaks.
Nabisco graham cracker=4.2 Sophie Mae peanut brittle=13
Texture, Phase III. Evaluate during chewdown III-4. Moisture absorption
Amount of saliva absorbed by the sample.
Shoestring licorice = 0
III-5. Gritty/Grainy particles
Amount of gritty/grainy particles in the wad.
Jello gelatin = 0 Jim Dandy quick grits = 13
III-6. Chewiness Amount of work to chew the sample.
Cobblestone Mill rye bread=1.7
Texture, Phase IV. Evaluate after swallow IV-7. Toothpack Degree to which the product
sticks on the surface of the teeth.
Uncooked carrot = 1 Jujubes = 15
All lines anchored with Low = 0 and High = 15
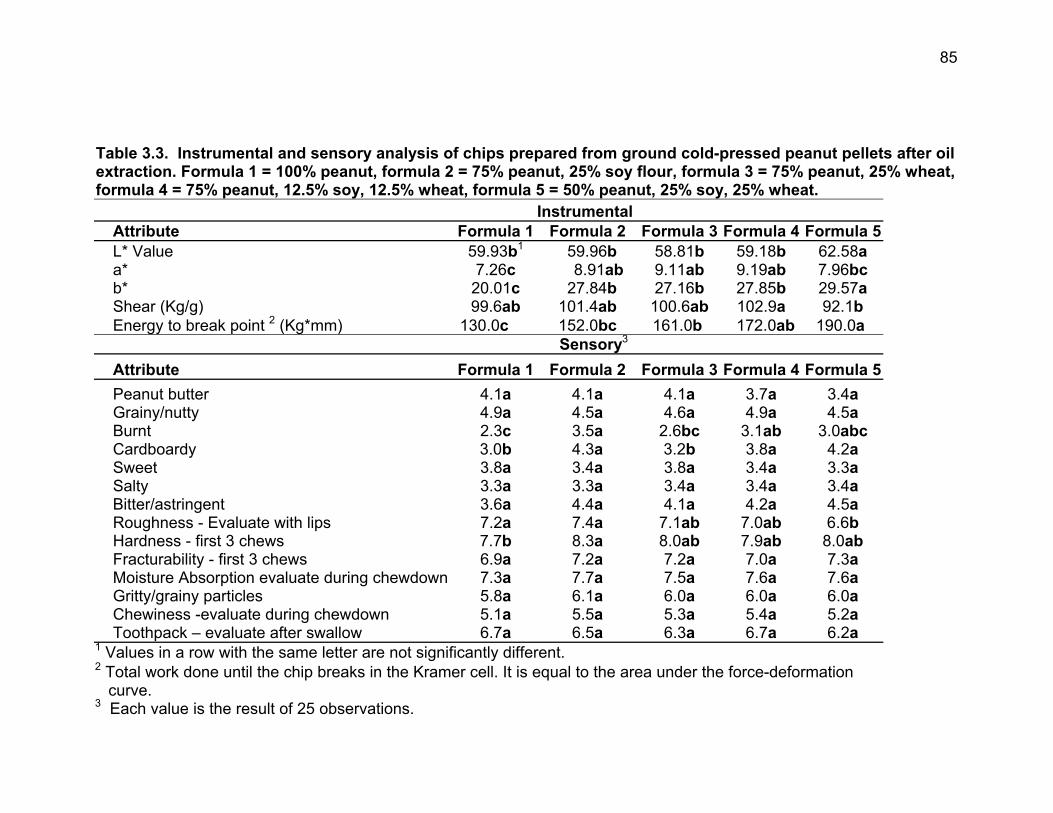
85
Table 3.3. Instrumental and sensory analysis of chips prepared from ground cold-pressed peanut pellets after oil extraction. Formula 1 = 100% peanut, formula 2 = 75% peanut, 25% soy flour, formula 3 = 75% peanut, 25% wheat, formula 4 = 75% peanut, 12.5% soy, 12.5% wheat, formula 5 = 50% peanut, 25% soy, 25% wheat. Instrumental
Attribute Formula 1 Formula 2 Formula 3 Formula 4 Formula 5L* Value 59.93b1 59.96b 58.81b 59.18b 62.58a a* 7.26c 8.91ab 9.11ab 9.19ab 7.96bc b* 20.01c 27.84b 27.16b 27.85b 29.57a Shear (Kg/g) 99.6ab 101.4ab 100.6ab 102.9a 92.1b Energy to break point 2 (Kg*mm) 130.0c 152.0bc 161.0b 172.0ab 190.0a
Sensory3 Attribute Formula 1 Formula 2 Formula 3 Formula 4 Formula 5Peanut butter 4.1a 4.1a 4.1a 3.7a 3.4a Grainy/nutty 4.9a 4.5a 4.6a 4.9a 4.5a Burnt 2.3c 3.5a 2.6bc 3.1ab 3.0abc Cardboardy 3.0b 4.3a 3.2b 3.8a 4.2a Sweet 3.8a 3.4a 3.8a 3.4a 3.3a Salty 3.3a 3.3a 3.4a 3.4a 3.4a Bitter/astringent 3.6a 4.4a 4.1a 4.2a 4.5a Roughness - Evaluate with lips 7.2a 7.4a 7.1ab 7.0ab 6.6b Hardness - first 3 chews 7.7b 8.3a 8.0ab 7.9ab 8.0ab Fracturability - first 3 chews 6.9a 7.2a 7.2a 7.0a 7.3a Moisture Absorption evaluate during chewdown 7.3a 7.7a 7.5a 7.6a 7.6a Gritty/grainy particles 5.8a 6.1a 6.0a 6.0a 6.0a Chewiness -evaluate during chewdown 5.1a 5.5a 5.3a 5.4a 5.2a Toothpack – evaluate after swallow 6.7a 6.5a 6.3a 6.7a 6.2a
1 Values in a row with the same letter are not significantly different. 2 Total work done until the chip breaks in the Kramer cell. It is equal to the area under the force-deformation curve. 3 Each value is the result of 25 observations.
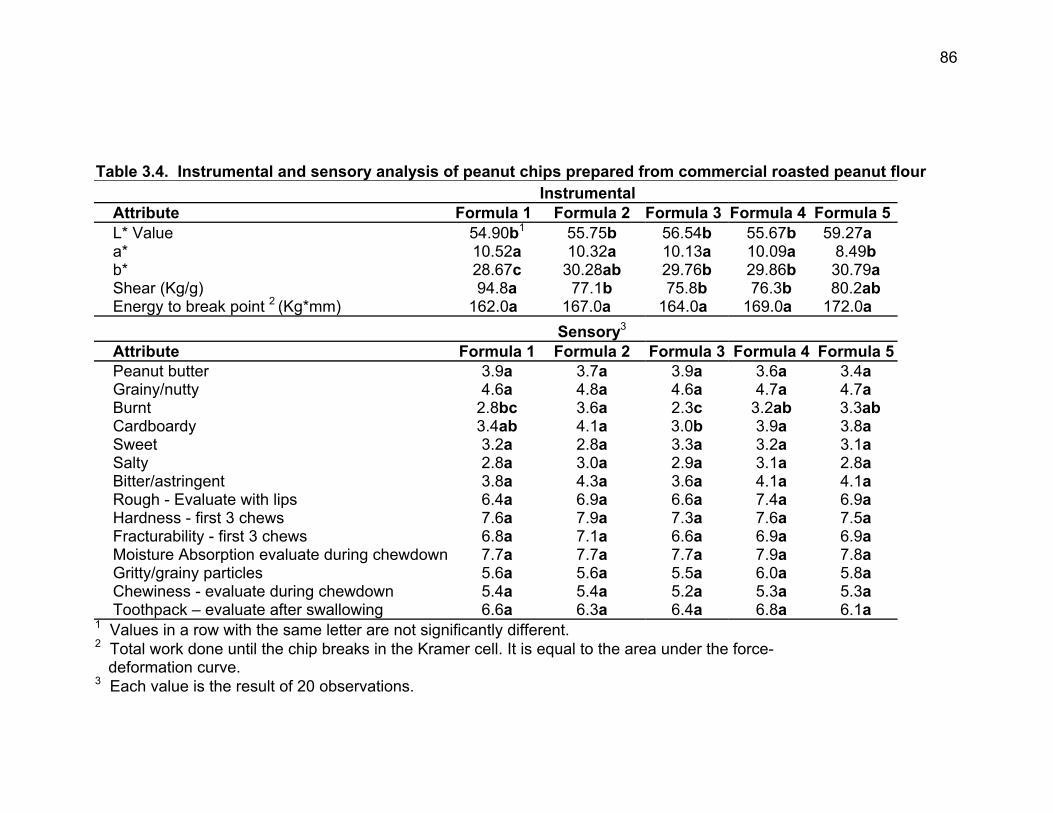
86
Table 3.4. Instrumental and sensory analysis of peanut chips prepared from commercial roasted peanut flour Instrumental
Attribute Formula 1 Formula 2 Formula 3 Formula 4 Formula 5L* Value 54.90b1 55.75b 56.54b 55.67b 59.27a a* 10.52a 10.32a 10.13a 10.09a 8.49b b* 28.67c 30.28ab 29.76b 29.86b 30.79a Shear (Kg/g) 94.8a 77.1b 75.8b 76.3b 80.2ab Energy to break point 2 (Kg*mm) 162.0a 167.0a 164.0a 169.0a 172.0a
Sensory3 Attribute Formula 1 Formula 2 Formula 3 Formula 4 Formula 5Peanut butter 3.9a 3.7a 3.9a 3.6a 3.4a Grainy/nutty 4.6a 4.8a 4.6a 4.7a 4.7a Burnt 2.8bc 3.6a 2.3c 3.2ab 3.3ab Cardboardy 3.4ab 4.1a 3.0b 3.9a 3.8a Sweet 3.2a 2.8a 3.3a 3.2a 3.1a Salty 2.8a 3.0a 2.9a 3.1a 2.8a Bitter/astringent 3.8a 4.3a 3.6a 4.1a 4.1a Rough - Evaluate with lips 6.4a 6.9a 6.6a 7.4a 6.9a Hardness - first 3 chews 7.6a 7.9a 7.3a 7.6a 7.5a Fracturability - first 3 chews 6.8a 7.1a 6.6a 6.9a 6.9a Moisture Absorption evaluate during chewdown 7.7a 7.7a 7.7a 7.9a 7.8a Gritty/grainy particles 5.6a 5.6a 5.5a 6.0a 5.8a Chewiness - evaluate during chewdown 5.4a 5.4a 5.2a 5.3a 5.3a Toothpack – evaluate after swallowing 6.6a 6.3a 6.4a 6.8a 6.1a
1 Values in a row with the same letter are not significantly different. 2 Total work done until the chip breaks in the Kramer cell. It is equal to the area under the force- deformation curve. 3 Each value is the result of 20 observations.
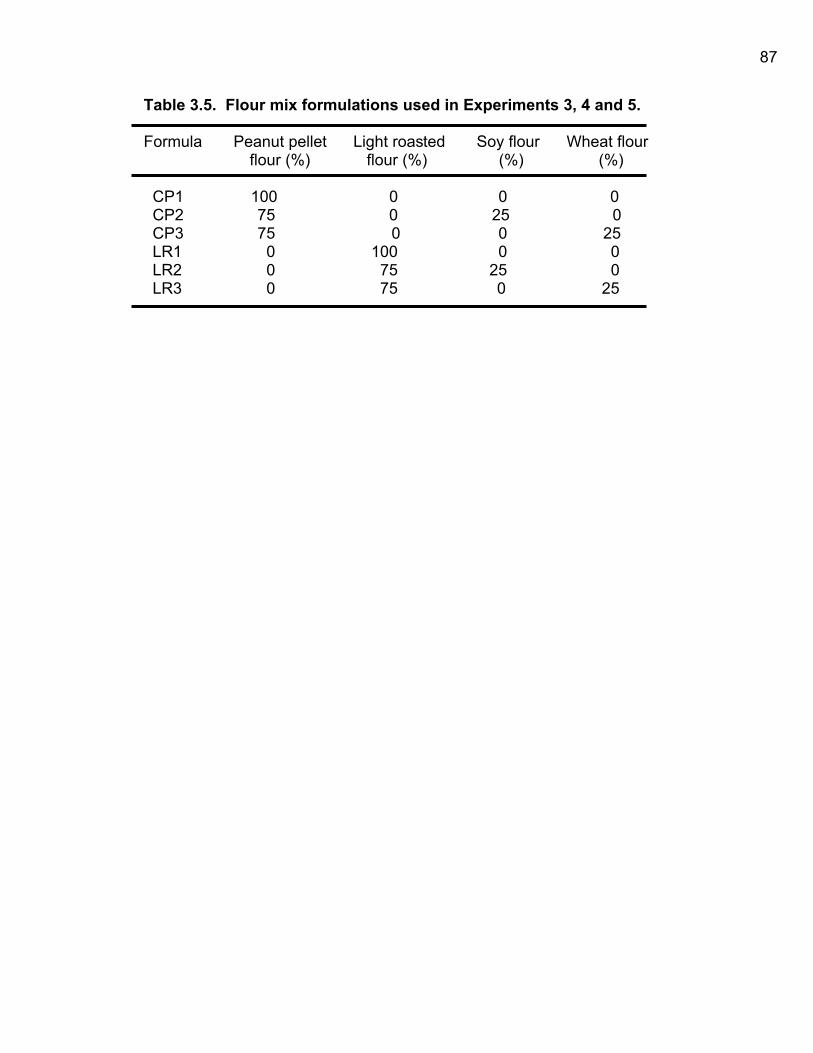
87
Table 3.5. Flour mix formulations used in Experiments 3, 4 and 5. Formula Peanut pellet Light roasted Soy flour Wheat flour flour (%) flour (%) (%) (%) CP1 100 0 0 0 CP2 75 0 25 0 CP3 75 0 0 25 LR1 0 100 0 0 LR2 0 75 25 0 LR3 0 75 0 25
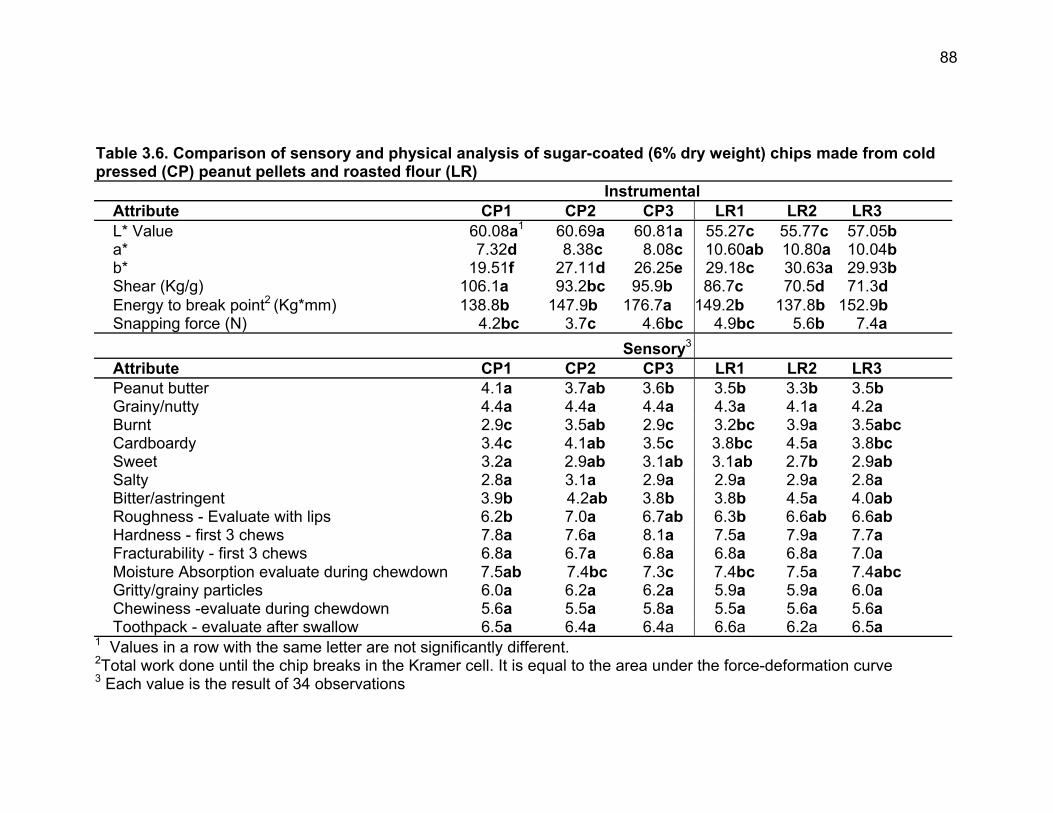
88
Table 3.6. Comparison of sensory and physical analysis of sugar-coated (6% dry weight) chips made from cold pressed (CP) peanut pellets and roasted flour (LR)
Instrumental Attribute CP1 CP2 CP3 LR1 LR2 LR3 L* Value 60.08a1 60.69a 60.81a 55.27c 55.77c 57.05b a* 7.32d 8.38c 8.08c 10.60ab 10.80a 10.04b b* 19.51f 27.11d 26.25e 29.18c 30.63a 29.93b Shear (Kg/g) 106.1a 93.2bc 95.9b 86.7c 70.5d 71.3d Energy to break point2 (Kg*mm) 138.8b 147.9b 176.7a 149.2b 137.8b 152.9b Snapping force (N) 4.2bc 3.7c 4.6bc 4.9bc 5.6b 7.4a Sensory3 Attribute CP1 CP2 CP3 LR1 LR2 LR3 Peanut butter 4.1a 3.7ab 3.6b 3.5b 3.3b 3.5b Grainy/nutty 4.4a 4.4a 4.4a 4.3a 4.1a 4.2a Burnt 2.9c 3.5ab 2.9c 3.2bc 3.9a 3.5abc Cardboardy 3.4c 4.1ab 3.5c 3.8bc 4.5a 3.8bc Sweet 3.2a 2.9ab 3.1ab 3.1ab 2.7b 2.9ab Salty 2.8a 3.1a 2.9a 2.9a 2.9a 2.8a Bitter/astringent 3.9b 4.2ab 3.8b 3.8b 4.5a 4.0ab Roughness - Evaluate with lips 6.2b 7.0a 6.7ab 6.3b 6.6ab 6.6ab Hardness - first 3 chews 7.8a 7.6a 8.1a 7.5a 7.9a 7.7a Fracturability - first 3 chews 6.8a 6.7a 6.8a 6.8a 6.8a 7.0a Moisture Absorption evaluate during chewdown 7.5ab 7.4bc 7.3c 7.4bc 7.5a 7.4abc Gritty/grainy particles 6.0a 6.2a 6.2a 5.9a 5.9a 6.0a Chewiness -evaluate during chewdown 5.6a 5.5a 5.8a 5.5a 5.6a 5.6a Toothpack - evaluate after swallow 6.5a 6.4a 6.4a 6.6a 6.2a 6.5a
1 Values in a row with the same letter are not significantly different. 2Total work done until the chip breaks in the Kramer cell. It is equal to the area under the force-deformation curve 3 Each value is the result of 34 observations
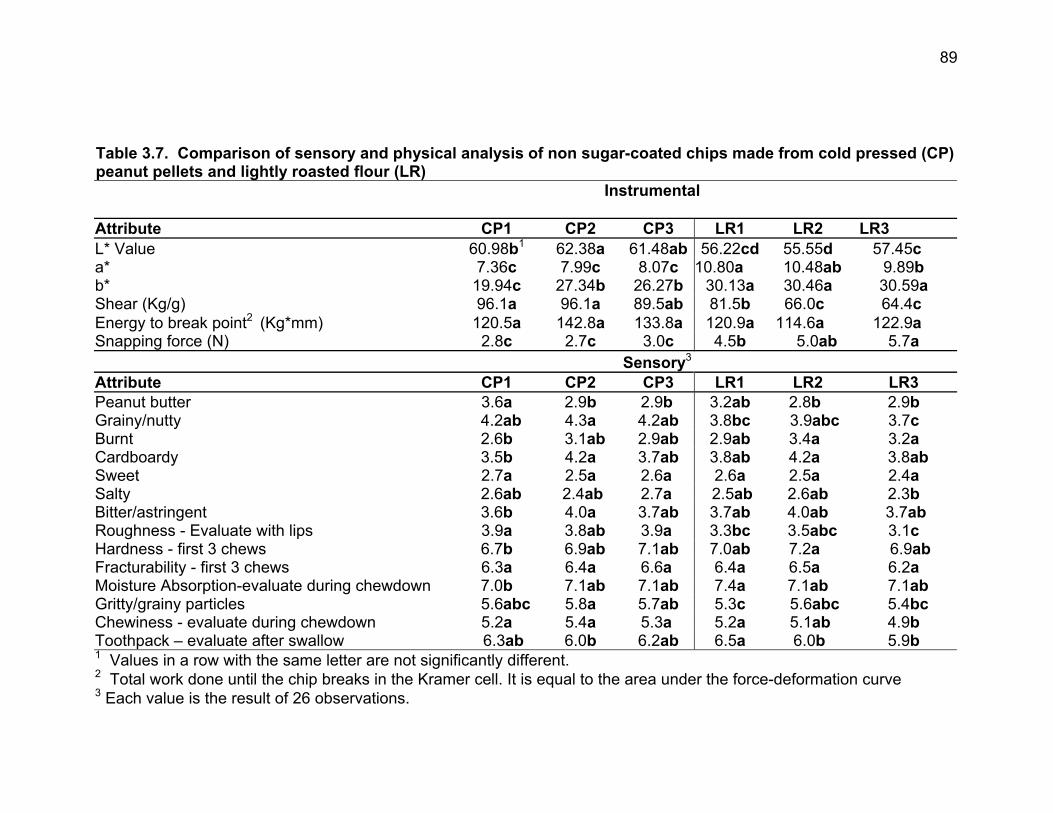
89
Table 3.7. Comparison of sensory and physical analysis of non sugar-coated chips made from cold pressed (CP) peanut pellets and lightly roasted flour (LR)
Instrumental
Attribute CP1 CP2 CP3 LR1 LR2 LR3 L* Value 60.98b1 62.38a 61.48ab 56.22cd 55.55d 57.45c a* 7.36c 7.99c 8.07c 10.80a 10.48ab 9.89b b* 19.94c 27.34b 26.27b 30.13a 30.46a 30.59a Shear (Kg/g) 96.1a 96.1a 89.5ab 81.5b 66.0c 64.4c Energy to break point2 (Kg*mm) 120.5a 142.8a 133.8a 120.9a 114.6a 122.9a Snapping force (N) 2.8c 2.7c 3.0c 4.5b 5.0ab 5.7a Sensory3 Attribute CP1 CP2 CP3 LR1 LR2 LR3 Peanut butter 3.6a 2.9b 2.9b 3.2ab 2.8b 2.9b Grainy/nutty 4.2ab 4.3a 4.2ab 3.8bc 3.9abc 3.7c Burnt 2.6b 3.1ab 2.9ab 2.9ab 3.4a 3.2a Cardboardy 3.5b 4.2a 3.7ab 3.8ab 4.2a 3.8ab Sweet 2.7a 2.5a 2.6a 2.6a 2.5a 2.4a Salty 2.6ab 2.4ab 2.7a 2.5ab 2.6ab 2.3b Bitter/astringent 3.6b 4.0a 3.7ab 3.7ab 4.0ab 3.7ab Roughness - Evaluate with lips 3.9a 3.8ab 3.9a 3.3bc 3.5abc 3.1c Hardness - first 3 chews 6.7b 6.9ab 7.1ab 7.0ab 7.2a 6.9ab Fracturability - first 3 chews 6.3a 6.4a 6.6a 6.4a 6.5a 6.2a Moisture Absorption-evaluate during chewdown 7.0b 7.1ab 7.1ab 7.4a 7.1ab 7.1ab Gritty/grainy particles 5.6abc 5.8a 5.7ab 5.3c 5.6abc 5.4bc Chewiness - evaluate during chewdown 5.2a 5.4a 5.3a 5.2a 5.1ab 4.9b Toothpack – evaluate after swallow 6.3ab 6.0b 6.2ab 6.5a 6.0b 5.9b 1 Values in a row with the same letter are not significantly different. 2 Total work done until the chip breaks in the Kramer cell. It is equal to the area under the force-deformation curve 3 Each value is the result of 26 observations.
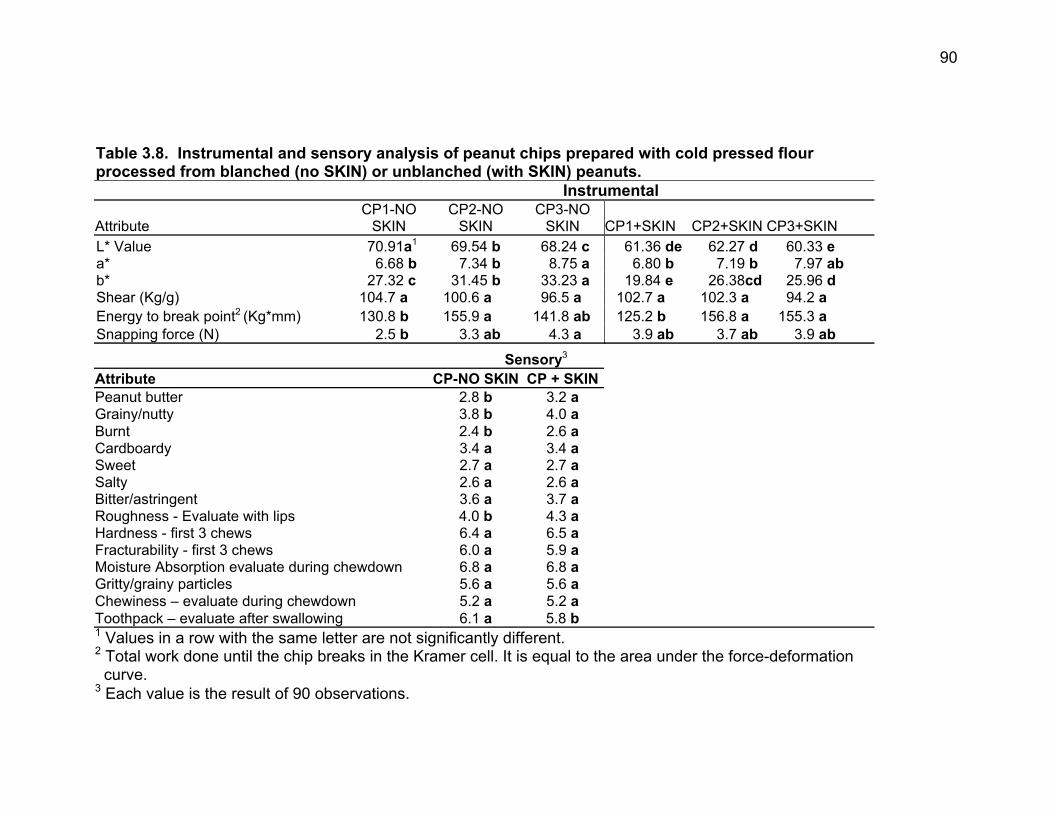
90
Table 3.8. Instrumental and sensory analysis of peanut chips prepared with cold pressed flour processed from blanched (no SKIN) or unblanched (with SKIN) peanuts. Instrumental
Attribute CP1-NO
SKIN CP2-NO
SKIN CP3-NO
SKIN CP1+SKIN CP2+SKIN CP3+SKIN L* Value 70.91a1 69.54 b 68.24 c 61.36 de 62.27 d 60.33 e a* 6.68 b 7.34 b 8.75 a 6.80 b 7.19 b 7.97 ab b* 27.32 c 31.45 b 33.23 a 19.84 e 26.38cd 25.96 d Shear (Kg/g) 104.7 a 100.6 a 96.5 a 102.7 a 102.3 a 94.2 a Energy to break point2 (Kg*mm) 130.8 b 155.9 a 141.8 ab 125.2 b 156.8 a 155.3 a Snapping force (N) 2.5 b 3.3 ab 4.3 a 3.9 ab 3.7 ab 3.9 ab
Sensory3 Attribute CP-NO SKIN CP + SKIN Peanut butter 2.8 b 3.2 a Grainy/nutty 3.8 b 4.0 a Burnt 2.4 b 2.6 a Cardboardy 3.4 a 3.4 a Sweet 2.7 a 2.7 a Salty 2.6 a 2.6 a Bitter/astringent 3.6 a 3.7 a Roughness - Evaluate with lips 4.0 b 4.3 a Hardness - first 3 chews 6.4 a 6.5 a Fracturability - first 3 chews 6.0 a 5.9 a Moisture Absorption evaluate during chewdown 6.8 a 6.8 a Gritty/grainy particles 5.6 a 5.6 a Chewiness – evaluate during chewdown 5.2 a 5.2 a Toothpack – evaluate after swallowing 6.1 a 5.8 b 1 Values in a row with the same letter are not significantly different. 2 Total work done until the chip breaks in the Kramer cell. It is equal to the area under the force-deformation curve. 3 Each value is the result of 90 observations.
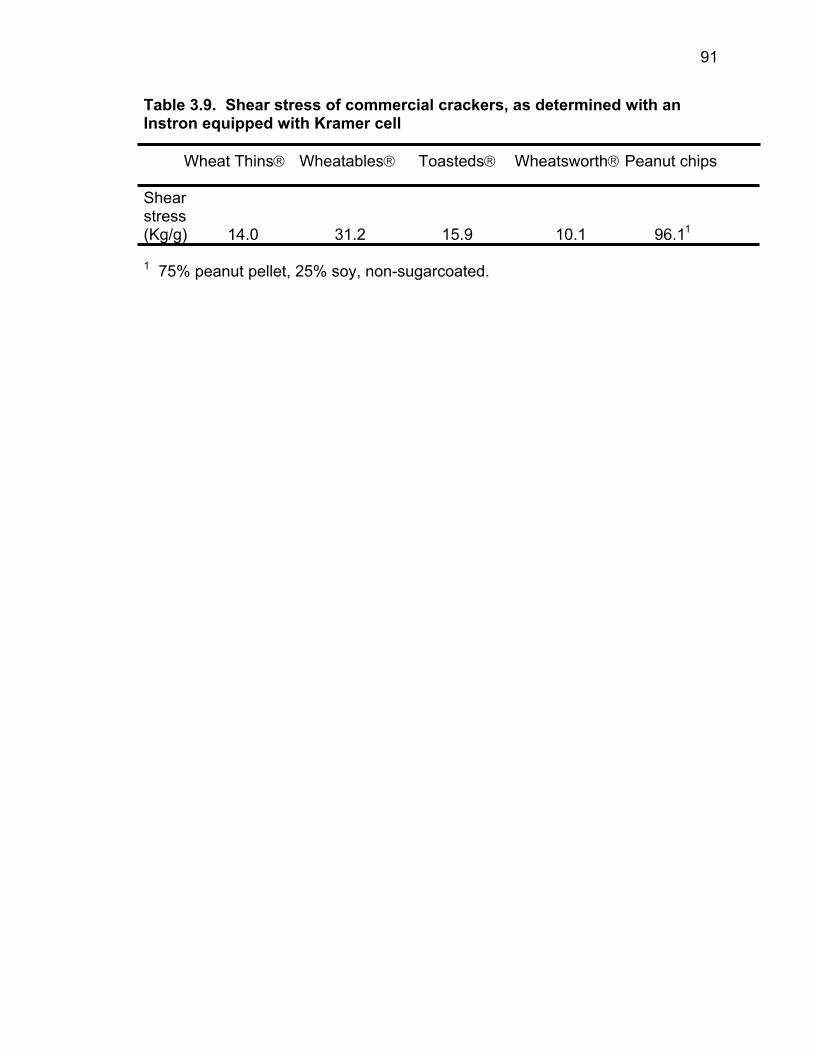
91
Table 3.9. Shear stress of commercial crackers, as determined with an Instron equipped with Kramer cell Wheat Thins Wheatables Toasteds Wheatsworth Peanut chips Shear stress (Kg/g) 14.0 31.2 15.9 10.1 96.11 1 75% peanut pellet, 25% soy, non-sugarcoated.
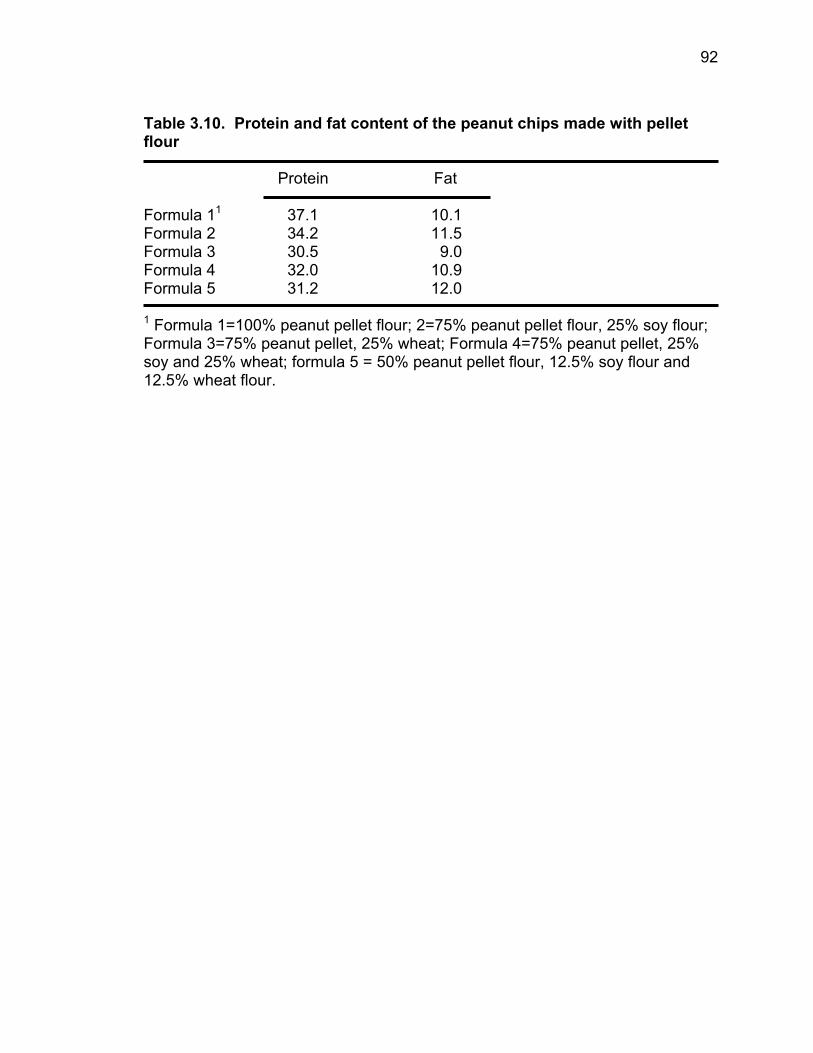
92
Table 3.10. Protein and fat content of the peanut chips made with pellet flour Protein Fat Formula 11 37.1 10.1 Formula 2 34.2 11.5 Formula 3 30.5 9.0 Formula 4 32.0 10.9 Formula 5 31.2 12.0 1 Formula 1=100% peanut pellet flour; 2=75% peanut pellet flour, 25% soy flour; Formula 3=75% peanut pellet, 25% wheat; Formula 4=75% peanut pellet, 25% soy and 25% wheat; formula 5 = 50% peanut pellet flour, 12.5% soy flour and 12.5% wheat flour.
93
SECTION IV
CONSUMER ACCEPTABILITY OF A PEANUT-SOY CHIP-TYPE SNACK
OPTIMIZED BY RESPONSE SURFACE METHODOLOGY
A. Zenere, Y. W. Huang, and G.O. Ware. To be submitted to the Journal of Food
Science or Food Research International.
94
ABSTRACT
A series of peanut chip formulations were made with cold pressed peanut
flour and soy flour. The chips also contained sugar, cornstarch and peanut butter
at one of 3 different levels, in a 3 X 3 X 3 full factorial design. The chips were
tested for shear force, snapping force and CIE L* a* b* color. Hardness was
found by Instron / Kramer cell to be as low as 442.4 N/g for chips containing 18%
sugar, 15% starch and 20% peanut butter. A consumer test was designed using
chips of the 27 formulations, in addition to three peanut-wheat formulations
included as dummy controls, in a balanced incomplete block design. The results
showed that the sensory characteristics were dependent on the levels of sugar,
starch and peanut butter. The acceptability of peanut-soy chip was >90% for
chips made with 18% sugar and 30% peanut butter. Starch was not a significant
factor for taste, sensory hardness and acceptability, but it was for the physical
and some sensory properties. Response Surface Methodology (RSM) was used
to generate contour plots, showing that the physical properties and sensory
texture, appearance, aroma, taste and overall liking of the new product were
optimal when sugar, starch and peanut butter were high. Optimal areas were
identified.
95
INTRODUCTION
In the United States, most of the peanut crop is marketed either for direct
consumption as roasted kernels, peanut butter and cookies or for oil extraction.
Extraction, when done by pressing raw peanuts, leaves a cake that is high in
protein (40%) and low in fat (14%). If processed from non food-grade peanuts,
the cake is used as animal feed or fertilizer (Woodroof, 1983; Hwang et al., 2001;
Matthaus, 2002). Chip-type snack foods have been popular in the market and
are produced by either extrusion or sheeting (Shukla, 2000). In a previous study
prototype chips were produced using defatted peanut press cake fortified with
either soy or wheat flour (the cake was in the shape of pellets). Consumers rated
the texture of the chips 4.4 (peanut-soy) and 4.5 (peanut corn) on a 9-point
hedonic scale. Less than 50% of the consumers rated the chips as acceptable,
implying that the quality of the chips was not fully satisfactory. A successive
study by the same authors resulted in a series of chips containing, in addition to
cold pressed peanut meal, soy or wheat flour, 9.1% peanut butter, 10.95%
sucrose and 4.5% cornstarch (percentages do not include water). A trained
descriptive panel rated these chips as little different from each other in terms of
texture and flavor. They rated the organoleptic properties with values that were
mostly between 2.6 and 4.3, and hardness as high as 7-8 on a 15-cm line scale.
However, instrumental (shear stress) tests done with an Instron and Kramer cell
yielded results varying among the various formulations. In particular, chips
containing no soy or wheat were as hard as or harder than chips containing 25%
soy or wheat flour. In the same study it was observed that chips produced with
commercial (roasted) defatted peanut flour were softer than chips produced with
96
cold pressed peanut meal, especially when fortified with soy or wheat.
Nonetheless, a comparison between cold pressed peanut meal chips (with soy)
and four commercial crackers showed that the shear force of the softest peanut
chips was threefold higher than the hardest of the commercial crackers, and five
times higher than their average. The wheat-based crackers were not fully
comparable with peanut chips, due to the different content in protein and starch.
However, they were chosen as controls because they were the most similar
samples commercially available.
Previous studies have shown that high-protein components yield a harder
and crunchier extruded chip than low-protein components (Faubion and
Hoseney, 1982; Paton and Spratt, 1984). Suknark (1998) observed that
increased proteins in formulation form a strong, hard network. Conversely,
expansion of an extruded product may actually be increased by the addition of
starch (Prinyawiwatkul et al., 1995). Also addition of 3% oil helps expansion
(Mohamed, 1990), although an oil level at 5% or more may prevent expansion
(Cheftel, 1986). Suknark (1998) found that substituting starch with partially
defatted peanut flour (PDPF) up to 15-30% was beneficial for expansion, but
higher substitution prevented expansion due to the higher content of oil and
protein. Soybeans contain phospholipids, vitamins, minerals and isoflavones.
The level of isoflavones in soybean and soyfood ranges from 1.33 to 3.88 mg/g
dry weight (Coward et al., 1993; Wang and Murphy, 1994). Therefore, fortifying
cold pressed peanut flour with soy flour would yield a healthy product. Our
previous study determined that addition of soy or wheat flour can result in crispier
97
and at least as tasty chips. However, it was not clear how much of the change
was due to soy or wheat flour and how much was due to other ingredients such
as sugar, starch and peanut butter. These ingredients had been added because
sugar and cornstarch were known to have a tenderizing effect (Matz, 1989).
Peanut butter was expected to have a shortening effect (it contains 55% fat) and
to carry the additional benefit of its rich peanut flavor. In the present investigation
it was decided to focus on soy flour as main secondary ingredient (besides cold
pressed peanut flour), because of the nutritional advantage provided by its high
content in protein and isoflavones. The objective was to study the influence
exerted by the ingredients sugar, starch and peanut butter on texture and
sensory characteristics of the chips and to identify the most acceptable
formulation by an optimization process.
MATERIALS AND METHODS
Formulation. Defatted peanut cake (protein 40-44%, fat 10-14%,
moisture 8%, fiber 3.7% and ash 3.1%) in the form of pellets was kindly provided
by Birdsong Peanut Corp., Suffolk, VA, stored at -30° C and ground in our
laboratory on the day it was used. Soy flour (Arrowhead Mills, Hereford, TX) was
purchased at a local grocery store. Peanut-soy chips were prepared using
different levels of sugar, starch and peanut butter, in a 3 X 3 X 3 full factorial
design, while keeping peanut flour to soy flour ratio as 3:1. A total of 27
formulations were produced. The three factors were 1) sugar, at the levels of
6%, 12% and 18%; 2) starch, at the levels of 5%, 10% and 15%; 3) peanut
98
butter, at the levels of 10%, 20% and 30%. The experiment was replicated twice,
for a total of 54 samples.
Sample preparation. In all 27 treatments the ratio of peanut flour to soy
flour was kept at 3:1, the same as in our previous studies (Table 4.1). The
variables were sucrose, modified cornstarch (Baka-Plus, National Starch and
Chemicals, Bridgewater, NJ) and creamy peanut butter (Tara Foods, Albany,
GA). The chips were prepared as described elsewhere. Pellet-shaped peanut
press cake was ground in a split grinder (Model 4E, The Straub Co.,
Philadelphia, PA). The required amounts of flour were blended with soy flour,
sugar, starch, peanut butter, salt, baking powder and approximately 30% warm
water in a Kitchen Aid mixer (Model KSM 50PWH, St. Joseph, MI) for 3 min at
speed 2. The dough was sheeted using an industrial sheeter (Model S-18-BNO
4458, Moline Machinery, Ltd., Duluth, MN), cut into ca. 3.8-cm-side squares, and
then baked in an impingement oven (Model 1450, Lincoln Foodservice Products,
Fort Wayne, IN). Baking was performed in two steps: 1) 20 min at 98° C, so to
bring moisture content down to 9-10%; 2) 2 min at 160° C, to finally bake the
product. Drying the chips for 20 min before baking them prevented most of the
bubbling that would have otherwise covered the chips surface and produced an
unpleasant visual effect. The chips, cooled to room temperature, were bagged
(Ziploc bags), flushed with nitrogen and stored at -30° C. For the consumer
test, three extra formulations were prepared using wheat flour instead of soy
flour. The three peanut-wheat samples are referred to as “dummy controls”. The
purpose of adding a few peanut-wheat samples was to use them in the consumer
99
test together with the peanut/soy chips. In fact, during a previous analytical
sensory test, a trained sensory panel had found only small, if any, differences
between peanut/soy and peanut/wheat chips. It was important to see if a panel
of untrained consumers was able to discriminate between the two chips.
Since all 30 formulations could not be produced in the same day, a
maximum of nine formulations, consisting of a one-third fractional factorial, was
prepared each day. Three separate one-third fractional factorials were
generated covering all 27 treatments. The three treatments with wheat
(Formulas 28, 29 and 30) were prepared last. Chips for the physical tests were
made in the larger size of 5.1-cm-side squares, to fit the Kramer cell used in the
shear test. The average weight was 2.7 g. Chips prepared for the sensory test
were smaller squares of 3.8-cm side and weighed ca. 1.7 g. For either large or
small chips the thickness was 1.6 mm. The reason for chips of different size was
that smaller chips were perceived as being softer, but the larger size chips fit the
Kramer cell better.
Proximate composition
Percent moisture. About 2 grams of ground product in duplicate were
dried at 100 °C overnight in a vacuum oven (AACC, 1986).
Fat. Extraction was carried out in a Soxhlet apparatus. About 2 grams of
sample were loaded into pre-dried and weighed 185 mm-diameter Whatman®
No.1 filter paper, folded and stapled at one end. Then the samples were dried at
100 °C overnight in a vacuum oven. The samples were cooled in a dessicator,
weighed and inserted in the Soxhlet units, four samples per unit. Reflux with
100
petroleum ether was carried out for 6 hrs. The extracted samples were dried in a
vacuum oven at 100 °C, cooled in a dessicator and weighed (Nielsen, 1998).
Protein. An automated Kjeldahl system (Fisher Scientific, Pittsburg, PA),
was used. One g of sample, in triplicate, was added to each 250-ml glass tube,
followed by adding 7 g of K2SO4, 0.8 g of CuSO45H2O and 15 ml H2SO4.
Digestion of the samples was carried out in a TCDB 20 digestion block at 420 °C
for 30-90 min. Distillation was accomplished in a Kjeltec® 2200 Auto Distillation
Unit. Titration of the receiving solution was done using 0.1889 N HCl.
Ash. Approximately 3 grams of each ground sample were placed in a
ceramic crucible with lid and heated overnight in an oven at 600 °C. After the
samples were cooled in the oven, they were placed into a dessicator and
weighed.
Color. The color of chips was determined using a Minolta Chroma meter
(model CR 200, Osaka, Japan) with CIE L* a* b* values, where L* denotes
lightness, a* red to green, b* yellow to blue, hue = tan-1 (b*/a*) and chroma =
(a*2+b*2)1/2. Ten chips per treatment per replication were tested, for a total of 20
chips per formulation.
Texture. An Instron Universal Testing Machine (Model 1122, Instron
Corp., Canton, MA) fitted with a Kramer cell was used to evaluate chip texture.
The cross bar with a 500 Kg load cell had a speed of 50 mm/min. One 5.1 -cm
square chip was positioned in the cell, and the force required to shear was
recorded. The texture was analyzed also by a snapping test, following the
method described by Bruns and Bourne (1975), with modifications. Two wood
101
blocks, each 50 mm long, had been glued to a wood board at a distance of 15
mm from each other. One chip at a time was set bridging over them, and was
broken (snapped) by a single blade connected to an Instron. The cross bar had
a load cell of 50 Newtons and a speed of 50 mm/min. The system was operated
by Merlin computer software (Instron Corp., Canton, MA). The blade was made
with a 3-mm-thick Plexiglas plate tapered on one side to a moderately sharp
edge. A computer monitor showed how the force increased to a maximum and
finally dropped at the chip failure. The peak force was recorded in Newtons (N).
Six chips per formulation per 2 replications were tested, for a total of 12 chips per
formulation.
Sensory evaluation. Ninety untrained panelists, recruited among
students, faculty and staff of the University of Georgia, Athens, GA, participated
in the consumer sensory test twice, for a total of 180 panelists (Resurreccion,
1998). Each consumer tasted 5 random samples, in a balanced incomplete
block design, so that each formulation was judged by a total of 30 panelists. The
samples were presented on a tray in random order (presentation in monadic
order was not practical due to the large number of participants). Before each
test, a randomized list of 90 groups of 5 samples was generated utilizing a SAS
software (SAS/QC, 1995), distributed in such a way that all treatments were
presented the same number of times (15 per rep). The panelists evaluated each
sample on a 9-point hedonic scale, where 1 was defined as “dislike extremely”, 5
as “neither like nor dislike” and 9 as “like extremely” (Figure 4.1) (IFT Sensory
Evaluation Division, 1981; Ward, 1995; Hashim et al., 1999). Panelists rated the
102
following descriptors: appearance, color, aroma, taste, hardness, overall liking,
and acceptability. The scale was reduced for one descriptor, hardness, so to
have only 5 points, 1 being “very hard”, 2 “hard”, 3 “adequate”, 4 “soft” and 5
“very soft”, to simplify and clarify the textural analysis for the participants. During
four days, most panelists participated in the sensory test twice, with an interval of
two days between sessions.
Statistical Analysis. Data were recorded on a Microsoft Excel 97
program. The physical property data of Replicate 1 were tabulated and analyzed
independently from those of Replicate 2. This allowed us to obtain prediction
equations from the first replicate, and verify them using the data from the second
replicate. Eventually both replicates were combined and analyzed together.
PROC GLM (analysis of variance), PROC CORR (correlation), PROC REG and
PROC PLOT (regression analysis and contour plots) were the procedures in the
SAS Release 6.12 (SAS Institute Inc., Cary, NC) used in the analysis.
Analysis of variance and regression analysis were conducted to determine the
significance level of each component in the model. A mathematical relationship
(model) between independent variables and dependent variables (or responses)
was expected to approximate the form of a second-degree polynomial equation
(Floros and Chinnan, 1987; Floros and Chinnan, 1988):
y = β0 + β1x1 + β2x2 + β3x3 + x12 + x2
2 + x32 + β12x1 x2 + β13x1 x3 + β23x2 x3
in which Y was the response; β0, β1, β2 and β3 were coefficients and x1, x2, x3
were the coded independent variables sugar, starch and peanut butter,
respectively. A full model for each physical and sensory characteristic was
103
developed including all linear and quadratic terms representing the independent
variables, plus all the pairwise cross products between the linear terms.
Reduced models were constructed for all response variables by regression
procedure (PROC REG) and backward elimination. If the reduced model was
not significantly different from the full model, it was used to predict the response
variable (Walker, 2000). The prediction models were used to build contour plots,
which represented all the combinations of the independent variables that were
found to have a significant effect on the attribute of the product. A computer
program (Statistica®, version 5.0, 1995) was used to transform the model for
each physical or sensory characteristic into contour plots. Plotting was done
using two variables at a time and keeping the third variable fixed at one level.
The fixed variable was usually the least significant for that response. When only
two variables were significant for an attribute, a single plot was drawn for that
attribute, with the two significant factors used on the X and Y-axes.
RESULTS AND DISCUSSION
Chemical composition
Percent moisture, fat, protein and ash content of selected chips and of the
primary ingredients are presented in Table 4.2. The fat content ranged from 10.1
to 16.0%, protein ranged from 16.3 to 21.3%, ash ranged from 3.8 to 4.3% and
moisture ranged from 2.2 to 3.0%. The fat content was lower than expected
calculating the fat content of the ingredients. One reason was that the plastic
sheets had high affinity for fat and removed part of the oil from the chips, to the
point that fat had to be wiped from the plastic sheets between batches, to avoid
104
transferring fat from batch to batch. Substituting part of the cold pressed peanut
flour with soy flour and peanut butter improved the texture and flavor of the chips,
but resulted also in increased fat content, compared with previous experiments.
Higher fat content is not ideal, but it is a trade off compared with a peanut chip
with lower fat but harder texture and less acceptable to consumers.
Physical properties
Texture. Shear force varied between 950.4 N/g (Formula 1) and 442.4
N/g (Formula 26) (Table 4.3). The highest shear force values were prevalent
among the treatments with low sugar, starch and peanut butter, while low values
of shear force were found among formulations with high sugar, starch and peanut
butter such as Formulas 18, 26, and 27. The results show that sugar, starch and
peanut butter were all highly significant (p = 0.001) in making the chips softer.
The snapping test resulted in values ranging between 13.3 (Formula 16)
and 7.0 Newtons (N) (Formula 14) and decreased with increasing amounts of
sugar and peanut butter. The trend was similar to shear force, but shear values
decreased progressively with increasing sugar and starch, while snapping force
showed a minimum value at 10% starch and then increased with 15% starch.
However, the significance of the data on snapping force is limited by the higher
standard deviation in snapping force data compared with the shearing test data.
For example, a chip exposed to the pressure from the blade during the snapping
test sometimes broke almost immediately upon application of force (probably due
to the presence of invisible fractures in the chip), and other times resisted a
pressure of 12-14 N before undergoing fracture. As a control, two commercial
105
crackers, Wheatable low fat and Toasted Wheat were tested in both a shear
test and a snapping test (Table 4.4). They also showed a higher standard
deviation for snapping forces than shear forces. Previous literature on the
snapping test (also called three-point-bending test) from Bruns and Bourne
(1975) and many others (Katz and Labuza, 1981; Ward, 1995; Piazza and Masi,
1997), show that they conducted the test by calculating the slope of the force-
deformation curve, probably avoiding high standard deviations. Those
researchers did not report tables with standard deviations, so it is difficult to
compare our data with theirs. However, even with such drawbacks, our values of
(peak) snapping force provided useful information.
Color. The average values for L*, a* and b* were 63.9, 8.1 and 28.7,
respectively (Table 4.5). L* values were slightly higher in chips with lower peanut
butter, and higher starch. Hue angle ranged between 70.94 (Formula 3) and
76.72 (Formula 25), with values decreasing with increasing peanut butter. The
diminishing hue angles were due to increasing values of a* more than to
changing values of b*. On the L*a*b* color chart, 70.94 corresponds to a brown
hue while 76.72 falls in a more yellow area. Chroma ranged between 31.95
(Formula 3) and 27.10 (Formula 25). Chroma, which measures the color
intensity (saturation), depended on both a* and b*. Its values increased with
diminishing sugar and increasing peanut butter.
The regression analysis of the data after the first replicate of the
instrumental analysis showed a good fit, with R2 for shear stress equal to 0.91,
and L* a* and b* with an R2 of 0.73, 0.78 and 0.78, respectively (Table 4.6).
106
However, the regression analysis after the second replicate showed a lower
coefficient of determination. L* value, for example, had a total R2 = 0.33
indicating that this characteristic has a high variability and may be difficult to
control (Table 4.7). Yellowness (b* values) had a coefficient of determination
even lower (R2=0.276). Redness (a* values) had a high R2 (=0.66) after the
second replicate, indicating a higher predictability than L* and b*. This could be
important for quality control, because the a* value could be used to check the
baking stage in an automated peanut chip production. Hue values were
statistically analyzed only after the second replicate but showed a high value of
R2 = 0.72. In the hue model sugar, starch and peanut butter were all significant.
Chroma depended only on sugar and peanut butter, but its R2 was low (=0.31).
Yellowness (b*) was only dependent on sugar (p<0.001) and peanut butter
(p<0.05). Redness (a* value) increased with decreasing starch and increasing
peanut butter. Yellowness (b* value) increased with increasing peanut butter and
decreasing sugar.
Consumer acceptance
On average, the panelists rated the appearance of the chips 6.68 on a 9-
point hedonic scale (Table 4.8) which is between 6 =like slightly and 7 =like
moderately. However, most scores ranged between 6.36 and 7.1 (the only
exception being Formula 25, rated 5.67) showing little discrimination among
formulations. The same lack of discrimination was found in color and aroma.
Ratings of color ranged between 6.10 and 7.20, while ratings for aroma were
between 5.57 and 6.96. Both showed an increase in consumer rating with
107
increasing amounts of sugar, starch and peanut butter. However, the R2 was low
(R2<0.5) for all three responses appearance, color and aroma (Table 4.9). Few
independent variables were significant with a p< 0.05, which is probably the
effect of how little agreement there is among consumers on evaluation of
appearance, color and aroma. For the attribute taste, panelists showed a greater
discrimination, with a minimum rating of 4.27 for Formula 4 (6% sugar, 10%
starch and 10% peanut butter), and a maximum rating of 7.24 for Formula 24
(18% sugar, 10% starch and 30% peanut butter). Taste showed a low
dependence on sugar (p = 0.509) and peanut butter (p = 0.99), but a high
dependence (p<0.05) on the interaction of sugar-peanut butter. The descriptors
overall liking and acceptability showed the same trend, with formula 24 receiving
the highest rating (7.35 and 100%, respectively) and formula 1 receiving the
lowest. Acceptability increased with increasing sugar and peanut butter
(p<0.001) but did not show any dependence on starch. An acceptability of 100%
is the ideal target of any new product manufacturer. However, because such
level of acceptability is hardly realistic, it was decided to consider an acceptability
of 80% as a more practical goal. Seven formulations were above the 80%
threshold (9 if we count the samples containing wheat). Three of the samples, all
containing 30% peanut butter, were above 90% acceptability. This compared
well with the acceptance of extruded tapioca-peanut snacks described in
Suknark’s work (1998). Her product, an extruded and fried peanut-based
cracker, was rated as acceptable by more than 80% of both American and Asian
consumers. However, her alternative product, a tapioca-fish cracker, was rated
108
as acceptable by only 60-70% of the American consumers (while more than 80%
of the Asian consumers rated the fish cracker as acceptable). This difference in
the rating of fish snacks shows how ethnic background is an important factor in
predicting the success of a new food product, independently from its nutritional
quality. It also shows that peanut snacks are rated highly in both American and
Asian cultures.
Sensory hardness showed the same trend as acceptability: Formula 4 (6%
sugar, 10% starch and 10% peanut butter) was rated “hard” (1.90 on a 5-point
hedonic scale) and Formula 24 (18% sugar, 10% starch and 30% peanut butter)
was rated “adequate” (2.96). In general, about the other formulations, the lower
was the level of sugar and peanut butter, the lower was the rating. There were
some notable exceptions, however. Formulas 2, 3 and 9 had a high rating for
hardness even though if they were low in sugar. Formula 12 (medium sugar and
low starch) was high not only in hardness, but also in acceptability (82.86%) and
taste (6.33). These formulations are interesting because they could be produced
commercially at lower cost than chips with high sugar and starch, with almost the
same likelihood of being accepted by consumers. For hardness a target of at
least 2.5 in the consumer rating was considered acceptable in such a high
protein peanut-based chip. Sensory hardness was dependent only on sugar
(p<0.01) and peanut butter (p<0.01), but not on starch. This differs from the data
of physical hardness, which was dependent on starch. Such discrepancy may
have derived from the smaller amplitude of the 5-point scale compared with the
9-point hedonic scale, which left the panelists with less ground for discrimination.
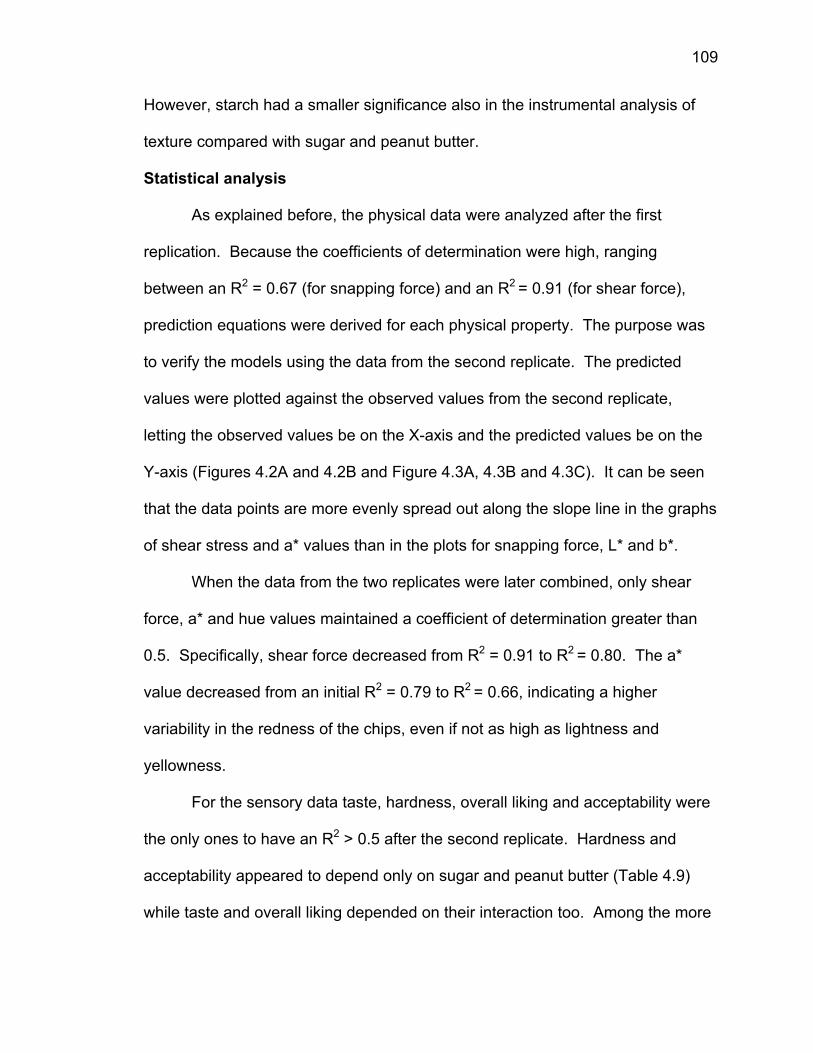
109
However, starch had a smaller significance also in the instrumental analysis of
texture compared with sugar and peanut butter.
Statistical analysis
As explained before, the physical data were analyzed after the first
replication. Because the coefficients of determination were high, ranging
between an R2 = 0.67 (for snapping force) and an R2 = 0.91 (for shear force),
prediction equations were derived for each physical property. The purpose was
to verify the models using the data from the second replicate. The predicted
values were plotted against the observed values from the second replicate,
letting the observed values be on the X-axis and the predicted values be on the
Y-axis (Figures 4.2A and 4.2B and Figure 4.3A, 4.3B and 4.3C). It can be seen
that the data points are more evenly spread out along the slope line in the graphs
of shear stress and a* values than in the plots for snapping force, L* and b*.
When the data from the two replicates were later combined, only shear
force, a* and hue values maintained a coefficient of determination greater than
0.5. Specifically, shear force decreased from R2 = 0.91 to R2 = 0.80. The a*
value decreased from an initial R2 = 0.79 to R2 = 0.66, indicating a higher
variability in the redness of the chips, even if not as high as lightness and
yellowness.
For the sensory data taste, hardness, overall liking and acceptability were
the only ones to have an R2 > 0.5 after the second replicate. Hardness and
acceptability appeared to depend only on sugar and peanut butter (Table 4.9)
while taste and overall liking depended on their interaction too. Among the more
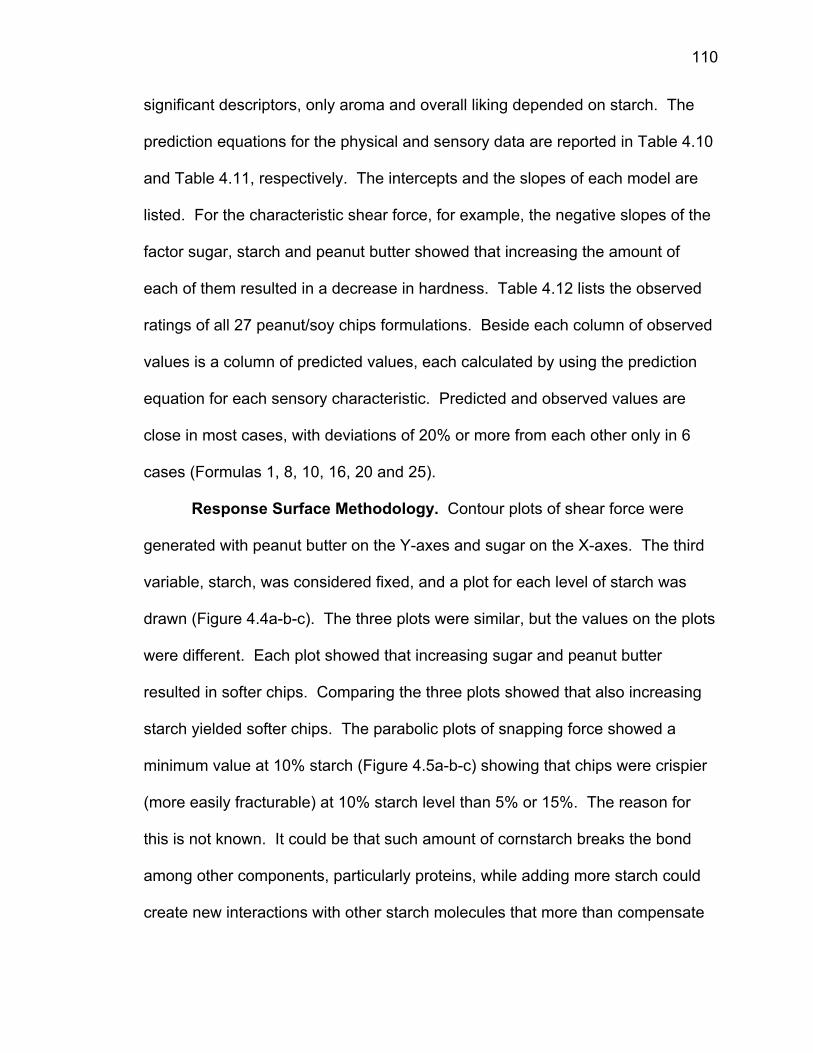
110
significant descriptors, only aroma and overall liking depended on starch. The
prediction equations for the physical and sensory data are reported in Table 4.10
and Table 4.11, respectively. The intercepts and the slopes of each model are
listed. For the characteristic shear force, for example, the negative slopes of the
factor sugar, starch and peanut butter showed that increasing the amount of
each of them resulted in a decrease in hardness. Table 4.12 lists the observed
ratings of all 27 peanut/soy chips formulations. Beside each column of observed
values is a column of predicted values, each calculated by using the prediction
equation for each sensory characteristic. Predicted and observed values are
close in most cases, with deviations of 20% or more from each other only in 6
cases (Formulas 1, 8, 10, 16, 20 and 25).
Response Surface Methodology. Contour plots of shear force were
generated with peanut butter on the Y-axes and sugar on the X-axes. The third
variable, starch, was considered fixed, and a plot for each level of starch was
drawn (Figure 4.4a-b-c). The three plots were similar, but the values on the plots
were different. Each plot showed that increasing sugar and peanut butter
resulted in softer chips. Comparing the three plots showed that also increasing
starch yielded softer chips. The parabolic plots of snapping force showed a
minimum value at 10% starch (Figure 4.5a-b-c) showing that chips were crispier
(more easily fracturable) at 10% starch level than 5% or 15%. The reason for
this is not known. It could be that such amount of cornstarch breaks the bond
among other components, particularly proteins, while adding more starch could
create new interactions with other starch molecules that more than compensate
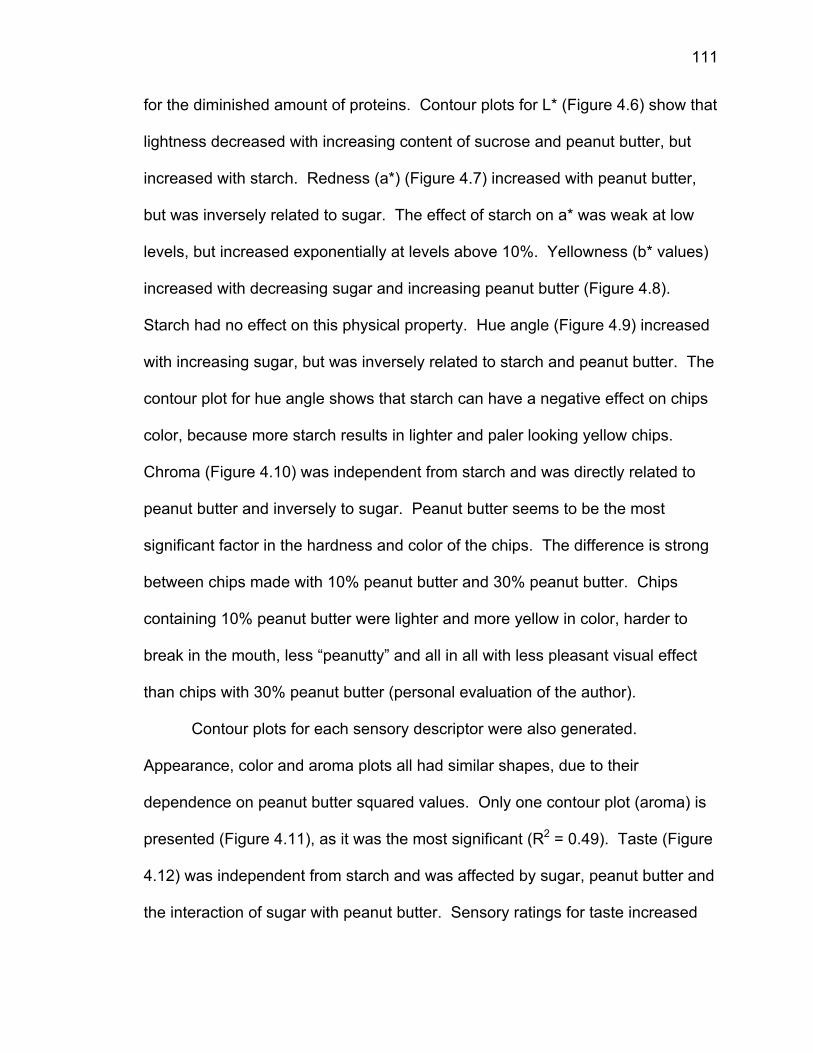
111
for the diminished amount of proteins. Contour plots for L* (Figure 4.6) show that
lightness decreased with increasing content of sucrose and peanut butter, but
increased with starch. Redness (a*) (Figure 4.7) increased with peanut butter,
but was inversely related to sugar. The effect of starch on a* was weak at low
levels, but increased exponentially at levels above 10%. Yellowness (b* values)
increased with decreasing sugar and increasing peanut butter (Figure 4.8).
Starch had no effect on this physical property. Hue angle (Figure 4.9) increased
with increasing sugar, but was inversely related to starch and peanut butter. The
contour plot for hue angle shows that starch can have a negative effect on chips
color, because more starch results in lighter and paler looking yellow chips.
Chroma (Figure 4.10) was independent from starch and was directly related to
peanut butter and inversely to sugar. Peanut butter seems to be the most
significant factor in the hardness and color of the chips. The difference is strong
between chips made with 10% peanut butter and 30% peanut butter. Chips
containing 10% peanut butter were lighter and more yellow in color, harder to
break in the mouth, less “peanutty” and all in all with less pleasant visual effect
than chips with 30% peanut butter (personal evaluation of the author).
Contour plots for each sensory descriptor were also generated.
Appearance, color and aroma plots all had similar shapes, due to their
dependence on peanut butter squared values. Only one contour plot (aroma) is
presented (Figure 4.11), as it was the most significant (R2 = 0.49). Taste (Figure
4.12) was independent from starch and was affected by sugar, peanut butter and
the interaction of sugar with peanut butter. Sensory ratings for taste increased
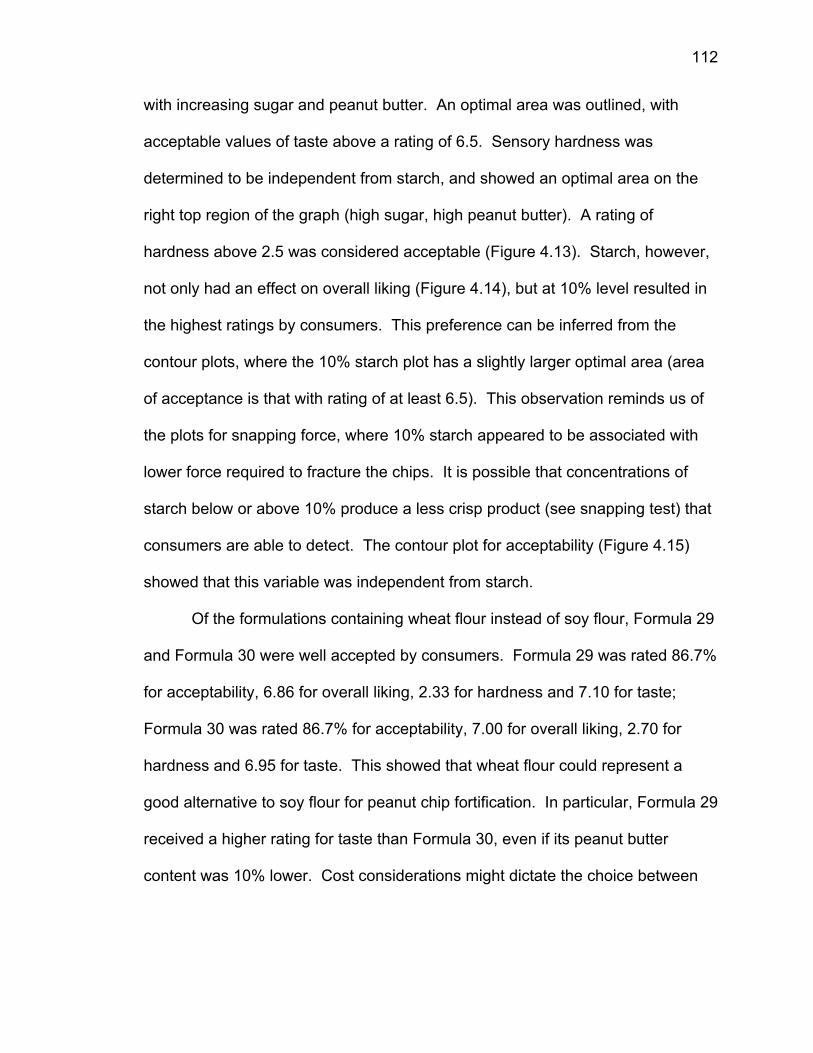
112
with increasing sugar and peanut butter. An optimal area was outlined, with
acceptable values of taste above a rating of 6.5. Sensory hardness was
determined to be independent from starch, and showed an optimal area on the
right top region of the graph (high sugar, high peanut butter). A rating of
hardness above 2.5 was considered acceptable (Figure 4.13). Starch, however,
not only had an effect on overall liking (Figure 4.14), but at 10% level resulted in
the highest ratings by consumers. This preference can be inferred from the
contour plots, where the 10% starch plot has a slightly larger optimal area (area
of acceptance is that with rating of at least 6.5). This observation reminds us of
the plots for snapping force, where 10% starch appeared to be associated with
lower force required to fracture the chips. It is possible that concentrations of
starch below or above 10% produce a less crisp product (see snapping test) that
consumers are able to detect. The contour plot for acceptability (Figure 4.15)
showed that this variable was independent from starch.
Of the formulations containing wheat flour instead of soy flour, Formula 29
and Formula 30 were well accepted by consumers. Formula 29 was rated 86.7%
for acceptability, 6.86 for overall liking, 2.33 for hardness and 7.10 for taste;
Formula 30 was rated 86.7% for acceptability, 7.00 for overall liking, 2.70 for
hardness and 6.95 for taste. This showed that wheat flour could represent a
good alternative to soy flour for peanut chip fortification. In particular, Formula 29
received a higher rating for taste than Formula 30, even if its peanut butter
content was 10% lower. Cost considerations might dictate the choice between
113
soybean flour and wheat flour as fortificants, balanced against the nutritional
benefit of soybean flour and its isoflavone content.
The optimal area was identified with the region of the contour plot with
acceptance ratings above 80%. It can be seen, for example, that chips
containing 16% sugar and 20% peanut butter occupy such area. Increasing
sugar and peanut butter above 18% and 30%, respectively, could improve
sensory qualities and consumer acceptability, but it would increase the amount of
calories; this would deviate from the healthy snack desired. Nonetheless,
consumer acceptability close or equal to 100% for some formulations indicated
that an optimal area was reached when 18% sugar and 20-30% peanut butter
were used.
Verification. A final test was conducted to verify that the contour plots
were reliable. Two sets of chips were produced using the same ingredients of
Formula 12 and Formula 25. The ingredients and the preparation conditions
were the same used for the 27 formulations, with the exception of the soybean
flour (the original one could not be found. The new soybean flour was labeled
“organic” and was produced by the same company as the old flour (Arrowhead
Mill, Hereford, TX). The verification samples were tested only for some of the
physical properties (snapping test was not done). It would not be possible to test
the sensory properties in a consumer test. Ten chips were tested for shear force,
L* value, a*, b*, hue angle and chroma (Table 4.13). Under each result the
comparative original value is reported, and the percentage variation is indicated
between parenthesis. The test showed that the shear force of the test chips was
114
lower than that of the original chips. Color, as tested with the Minolta chroma
meter, did fall most of the times in the range of the original values +/- 5% (Hinds
et al., 1994). Even if redness (a*) had a deviation of 18%, such deviations were
not apparent in hue angle and chroma values. L* values of the test sample was
found 6% lower (i.e. darker chips) than original samples from the same
formulation. However, a much larger difference was found in the shear force of
the two verification samples, which was 20% lower than the original Formula 12
and Formula 25. The difference could be explained with some quality difference
in the soybean flour used for the original samples and the verification samples (a
lapse of 16-18 months intervened between the original test and the verification
test. It is possible that soybean flour could have been produced from different
varieties or cultivars). However, the verification test of the chips for color could
be considered satisfactory, and the deviations from the expected values were
small.
Machinability. Experiments were conducted to see if it was possible to
sheet the peanut-soy dough without the plastic sheets. Two hundred grams of
flour mix were prepared, using the same conditions and amount of components
used previously for Formula 24. However, 90 ml of water was added instead of
the usual 55 ml. The formed dough, as expected, became very wet and stuck to
the bowl. It was removed from the container by hand, set on a teflon surface and
dusted with soy flour just enough not to be sticky. Soy flour was used because it
was fine and more suitable than the coarse peanut meal. By carefully adding
more soy flour when required, it was possible to flatten the dough with a rolling
115
pin enough for the dough to pass through the sheeter. A few passes were
required to reach the final thickness. The dough sheet was manually removed
from the sheeter and laid on a table to be cut into chips. These were baked in
the impingement oven as usual. The chips were cooled and placed in plastic
bags, to be refrigerated. The chips appeared to be the same as usual (personal
observation of the author), the only small difference being that a more irregular
surface was noticed, with the presence of small bubbles. The soy flour used for
dusting the dough did not add unpleasant flavors (personal observation of the
author). Another difference was that the chips were slightly thinner than those
made with plastic sheets. In fact, without the plastic sheets the sheeter was set
to a lower thickness in order to compensate for the missing plastic sheets. The
whole process without plastic sheets was simple and with some mechanical
equipment, it could be much faster than with plastic sheets. This finding was
important because it showed that producing peanut chips with low manual
operation is possible. The dusting and sheeting of the dough is a process that
could be done by machines, such as is already done in high-volume commercial
bakeries today.
CONCLUSIONS
An experimental design with peanut-soy chips made with different levels
of sugar, starch and peanut butter showed that all three components had a
significant effect on the physical properties of the chips. The sugar effect is that
by increasing its level the chips become less hard, more easily fracturable,
darker (because of a caramelization effect or Maillard reaction), with a slightly
116
higher hue and a lower chroma. Sugar at a level of 18% of the dry mix (not
including the water) was most effective in reducing the hardness of the chip.
Increasing starch provided more fracturability (until we reach a 10% level; at 15%
starch chips become harder and less fracturable), lighter in color and with a
higher hue (which means chips are more yellow and less brown), especially at
higher levels of peanut butter. Peanut butter produced less hard, more easily
fracturable and darker chips. Furthermore, peanut butter resulted in lower hue
(more brown color, having an opposite effect than cornstarch), and higher
chroma. A consumer sensory test with 90 panelists, in duplicate, showed that
increasing the content of sugar, starch and peanut butter resulted in softer,
tastier and more acceptable chips. The sensory effect of sugar and peanut
butter is particularly significant for taste, texture, overall liking and acceptability,
implying that an increase in the two components increased ratings on taste,
overall liking and acceptability and texture. Starch appeared to be less
significant that the other two ingredients, and was significant (at α<0.1) only in
overall liking. The optimal area on the contour plots was identified, and it
contains formulations receiving a rating of at least 6.5 for taste and overall liking,
2.5 for hardness and 80% acceptability.
Future investigation
For commercial production of peanut-soy chips a more automatic process
will be required, especially in the area of sheeting and cutting. During our study
the sheeting of the dough has been carried out using two sheets of plastic.
Without the plastic sheets, the dough showed a tendency to stick to the rollers, to
117
become entangled, fold and break. A preliminary experiment for making the
process more automatic and less labor intensive was successful (see the section
on Machinability). More research focus on more automatic manufacturing is
required in order to keep labor costs low and production volume high.
Further work can be applied in the area of texture, for example by studying
the use of emulsifiers or proteases, which could break the bond among proteins
and possibly help in softening the chips. In the area of flavor, improvements
could derive from adding flavoring such as cocoa, which is already successfully
used in peanut cookies. Improved taste and flavor could result from dusting the
dough with commercial defatted roasted peanut flour, instead of soy flour. More
research could be applied to the fat content. Sheeting the dough with plastic
sheets had the unplanned effect of absorbing part of the fat from the peanut
dough. Without the plastic sheets, as would be the case in a more automatic
processing, the final product would probably a have higher fat content. An effort
should be made to reduce fat content of the peanut chips below 10%, so to
qualify them as a “low fat” product (for example, using low fat peanut butter).
118
REFERENCES
AACC. 1986. American Association of Cereal Chemists, Method 44-40.
Bruns, A. J. and Bourne, M. C. 1975. Effect of sample dimensions on the
snapping force of crisp food. J. Text. Stud. 6:445-458.
Cheftel J.C. 1986. Nutritional effect of extrusion cooking. Food Chem. 20:263-
283.
Coward, L., Barnes, N.C., Setchell, K.D.R. and Barnes, S. 1993. Genistein,
daidzein and their beta-glycoside conjugates: antitumor isoflavones in
soybean foods from American and Asian diets. J. Agric. Food Chem.
41:1961-1967.
Faubion, J.M. and Hoseney, R.C. 1982. High-temperature short-time extrusion
cooking of wheat starch and flour II: effect of protein and lipid on extrudate
properties. Cereal Chem. 59:533-537.
Floros, J. D. and Chinnan, M. S. 1987. Optimization of pimiento pepper lye-
peeling process using response surface methodology. Transactions of the
ASAE. 30 (2): 560-565.
Floros, J. D. and Chinnan, M. S. 1988. Seven factor response surface
optimization of a double-stage lye (NaOH) peeling process for pimiento
peppers. J. Food Sci. 53(2):631-638.
Hashim, I.B., McWatters, K.H. and Hung, Y.-C. 1999. Consumer acceptance of
honey marinated chicken. J. Muscle Foods 10:231-244.
Hinds, M.J., Chinnan, M.S. and Beuchat, L.R. 1994. Unhydrogenated palm oil as
a stabilizer for peanut butter. J. Food Sci. 59(4):816-820 and 832.
119
Hwang, J.Y., Shue, Y.S. and Chang, H.M. 2001. Antioxidative activity of roasted
and defatted peanut kernels. Food Res. Int. 34(7):639-647.
IFT Sensory Evaluation Division. 1981. Sensory evaluation guide for testing food
and beverage products. Food Technol. 35 (November):50-59.
Katz, E. and Labuza, T.P. 1981. Effect of water activity on the sensory crispness
and mechanical deformation of snack food products. J. Food Sci. 46:403-
409.
Matthäus, B. 2002. Antioxidant activity of extracts obtained from residues of
different oilseeds. J. Agric. Food Chem. 50(12):3444-3452.
Matz, S.A. 1989. Formulas and Processes for Bakers. Elsevier Science
Publishers. New York, NY
Mohamed S. 1990. Factors affecting extrusion characteristics of expanded
starch-based products. J. Food Proc. Preserv. 14:437-452.
Nielsen, S.S., 1998. Food Analysis, 2nd Edition, An Aspen Publication®, Aspen
Publishers, Inc. Gaithersburg, Md.
Paton, D. and Spratt, W.A. 1984. Component interaction in the extrusion cooking
process: influence of process conditions on the functional viscosity of the
wheat flour system. J. Food Sci. 49:1380-1385.
Piazza, L. and Masi, P. 1997. Development of crispness in cookies during baking
in an industrial oven. Cereal Chem. 74(2):135-140.
Prinyawiwatkul, W., Beuchat, L.R., Phillips, R. D. and Resurreccion, A.V.A. 1995.
Modelling the effects of peanut flour, feed moisture content, and extrusion
120
temperature on physical properties of an extruded snack product. Int. J.
Food Sci. Technol. 30:37-44.
Resurreccion, A.V.A. 1998. Consumer sensory testing for product development.
Aspen Publishers, Inc. Gaithersburg, MD.
SAS/QC Software: usage and reference, version 6.11 First Ed. 1995. SAS
Institute, Cary, NC.
Shukla, T.P. 2000. Modern snack foods. Cereal Foods World 45(10):477.
Statistica® version 5.0. 1995. STATSOFT, Tulsa, OK.
Suknark, K. 1998. Development of extrusion processes for novel snack food
production and the physicochemical and nutritional properties of resulting
products. Ph.D. dissertation, University of Georgia, Athens, GA.
Walker, G.M. 2000. Sensory profiles, modeling, and optimization, and effect of
storage time temperature on cracker-coated peanuts. M. S. thesis,
University of Georgia, Athens, GA.
Wang, H.-J. and Murphy, P.A., 1994. Isoflavones composition of American and
Japanese soybeans in Iowa: effect of variety, crop year and location. J.
Agric. Food Chem. 42:1674-1677.
Ward, C.D. 1995. Effects of physicochemical and sensory properties on
functionality and consumer acceptance of snack chips formulated with
cowpea, corn, and wheat flour mixtures. Ph. D. Dissertation, University of
Georgia, Athens, GA.
Woodroof, J.G. 1983. Peanuts: Production, Processing, Products. 3rd Ed. AVI
Publishing Co., Inc. Westport, CT.
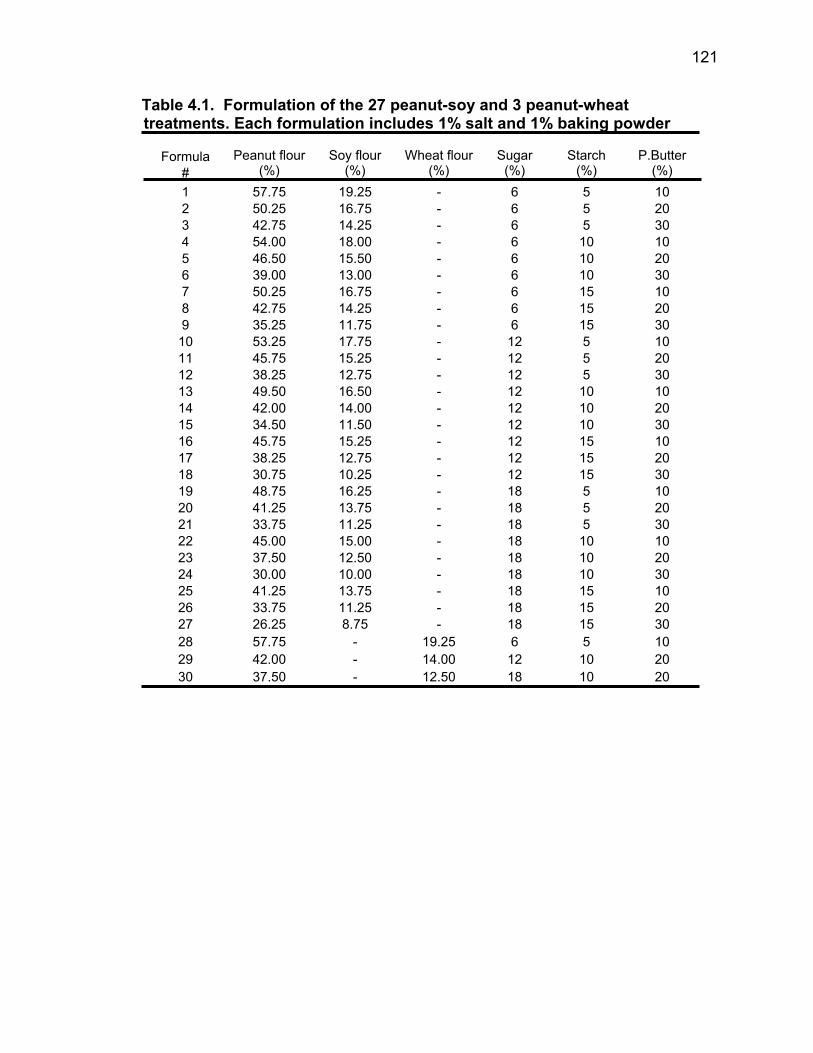
121
Table 4.1. Formulation of the 27 peanut-soy and 3 peanut-wheat treatments. Each formulation includes 1% salt and 1% baking powder
Formula
#
Peanut flour
(%)
Soy flour
(%)
Wheat flour
(%)
Sugar
(%)
Starch
(%)
P.Butter
(%) 1 57.75 19.25 - 6 5 10 2 50.25 16.75 - 6 5 20 3 42.75 14.25 - 6 5 30 4 54.00 18.00 - 6 10 10 5 46.50 15.50 - 6 10 20 6 39.00 13.00 - 6 10 30 7 50.25 16.75 - 6 15 10 8 42.75 14.25 - 6 15 20 9 35.25 11.75 - 6 15 30 10 53.25 17.75 - 12 5 10 11 45.75 15.25 - 12 5 20 12 38.25 12.75 - 12 5 30 13 49.50 16.50 - 12 10 10 14 42.00 14.00 - 12 10 20 15 34.50 11.50 - 12 10 30 16 45.75 15.25 - 12 15 10 17 38.25 12.75 - 12 15 20 18 30.75 10.25 - 12 15 30 19 48.75 16.25 - 18 5 10 20 41.25 13.75 - 18 5 20 21 33.75 11.25 - 18 5 30 22 45.00 15.00 - 18 10 10 23 37.50 12.50 - 18 10 20 24 30.00 10.00 - 18 10 30 25 41.25 13.75 - 18 15 10 26 33.75 11.25 - 18 15 20 27 26.25 8.75 - 18 15 30 28 57.75 - 19.25 6 5 10 29 42.00 - 14.00 12 10 20 30 37.50 - 12.50 18 10 20
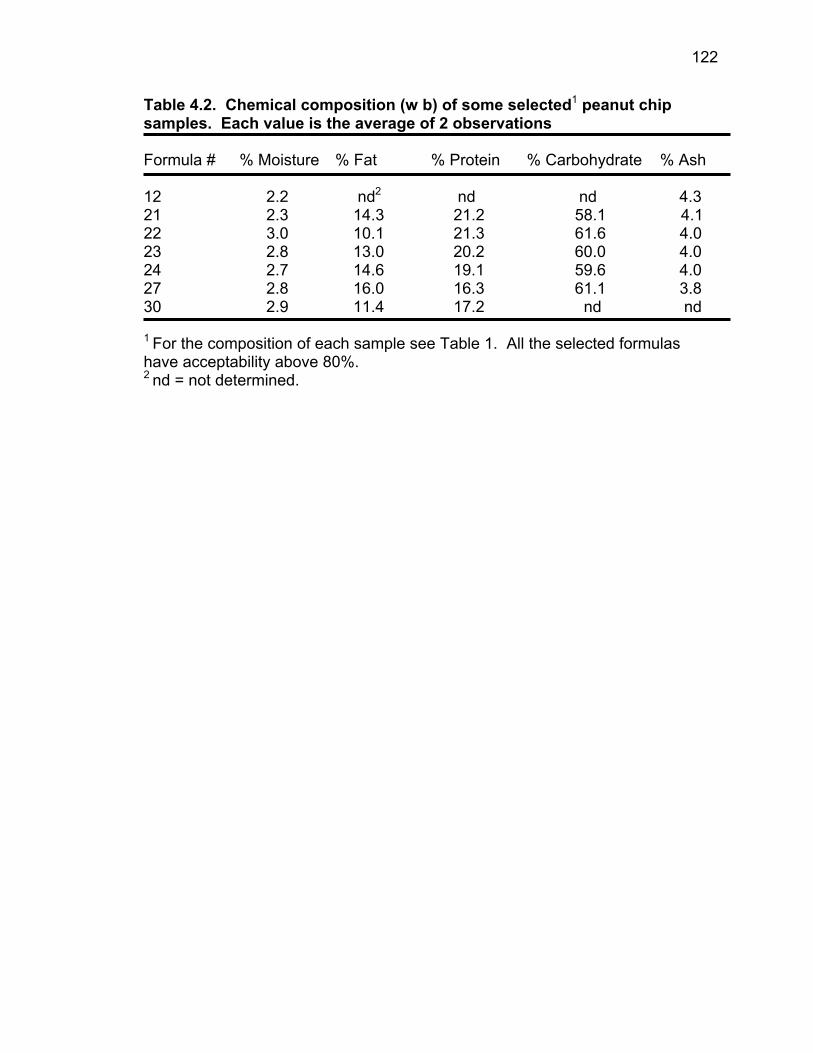
122
Table 4.2. Chemical composition (w b) of some selected1 peanut chip samples. Each value is the average of 2 observations Formula # % Moisture % Fat % Protein % Carbohydrate % Ash 12 2.2 nd2 nd nd 4.3 21 2.3 14.3 21.2 58.1 4.1 22 3.0 10.1 21.3 61.6 4.0 23 2.8 13.0 20.2 60.0 4.0 24 2.7 14.6 19.1 59.6 4.0 27 2.8 16.0 16.3 61.1 3.8 30 2.9 11.4 17.2 nd nd
1 For the composition of each sample see Table 1. All the selected formulas have acceptability above 80%. 2 nd = not determined.
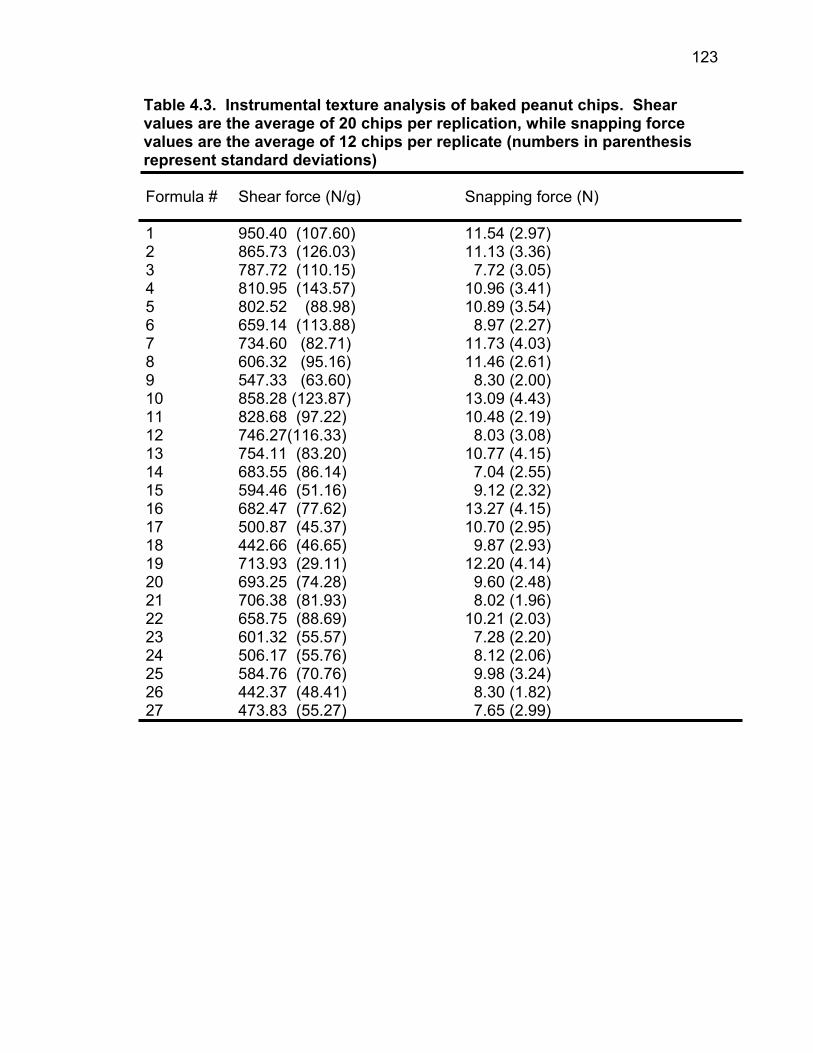
123
Table 4.3. Instrumental texture analysis of baked peanut chips. Shear values are the average of 20 chips per replication, while snapping force values are the average of 12 chips per replicate (numbers in parenthesis represent standard deviations) Formula # Shear force (N/g) Snapping force (N) 1 950.40 (107.60) 11.54 (2.97) 2 865.73 (126.03) 11.13 (3.36) 3 787.72 (110.15) 7.72 (3.05) 4 810.95 (143.57) 10.96 (3.41) 5 802.52 (88.98) 10.89 (3.54) 6 659.14 (113.88) 8.97 (2.27) 7 734.60 (82.71) 11.73 (4.03) 8 606.32 (95.16) 11.46 (2.61) 9 547.33 (63.60) 8.30 (2.00) 10 858.28 (123.87) 13.09 (4.43) 11 828.68 (97.22) 10.48 (2.19) 12 746.27(116.33) 8.03 (3.08) 13 754.11 (83.20) 10.77 (4.15) 14 683.55 (86.14) 7.04 (2.55) 15 594.46 (51.16) 9.12 (2.32) 16 682.47 (77.62) 13.27 (4.15) 17 500.87 (45.37) 10.70 (2.95) 18 442.66 (46.65) 9.87 (2.93) 19 713.93 (29.11) 12.20 (4.14) 20 693.25 (74.28) 9.60 (2.48) 21 706.38 (81.93) 8.02 (1.96) 22 658.75 (88.69) 10.21 (2.03) 23 601.32 (55.57) 7.28 (2.20) 24 506.17 (55.76) 8.12 (2.06) 25 584.76 (70.76) 9.98 (3.24) 26 442.37 (48.41) 8.30 (1.82) 27 473.83 (55.27) 7.65 (2.99)
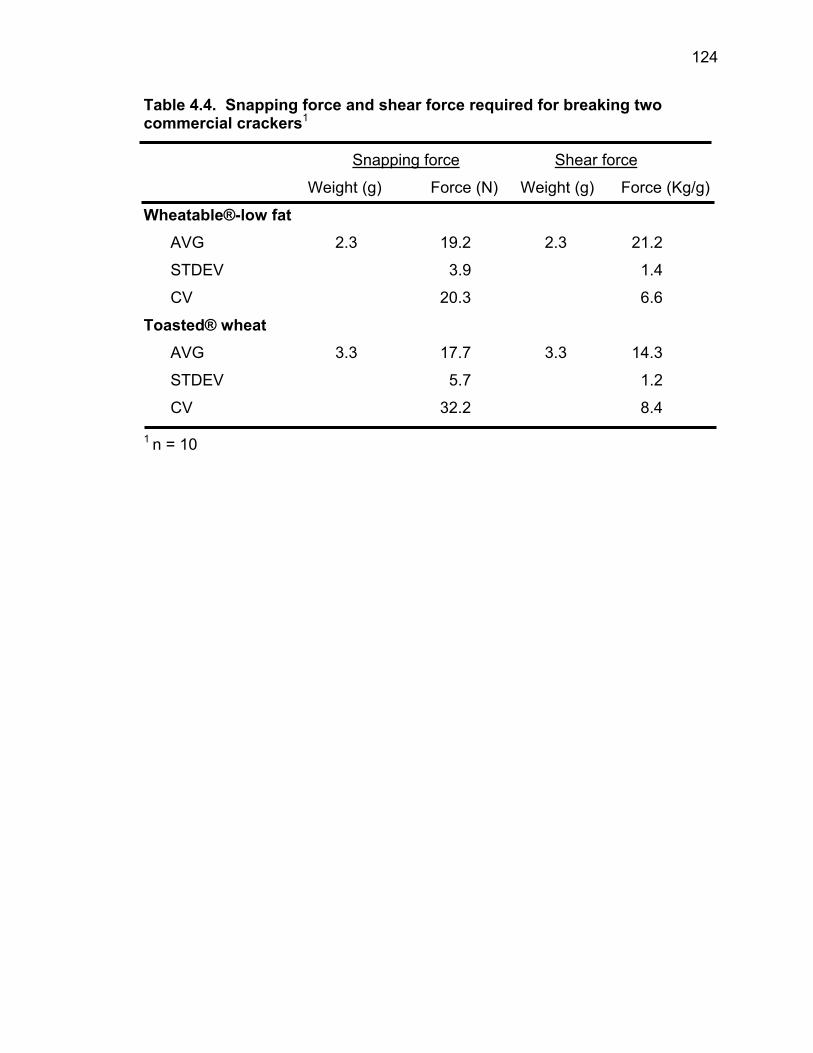
124
Table 4.4. Snapping force and shear force required for breaking two commercial crackers1 Snapping force Shear force
Weight (g) Force (N) Weight (g) Force (Kg/g)
Wheatable®-low fat AVG 2.3 19.2 2.3 21.2
STDEV 3.9 1.4
CV 20.3 6.6
Toasted® wheat AVG 3.3 17.7 3.3 14.3
STDEV 5.7 1.2
CV 32.2 8.4
1 n = 10
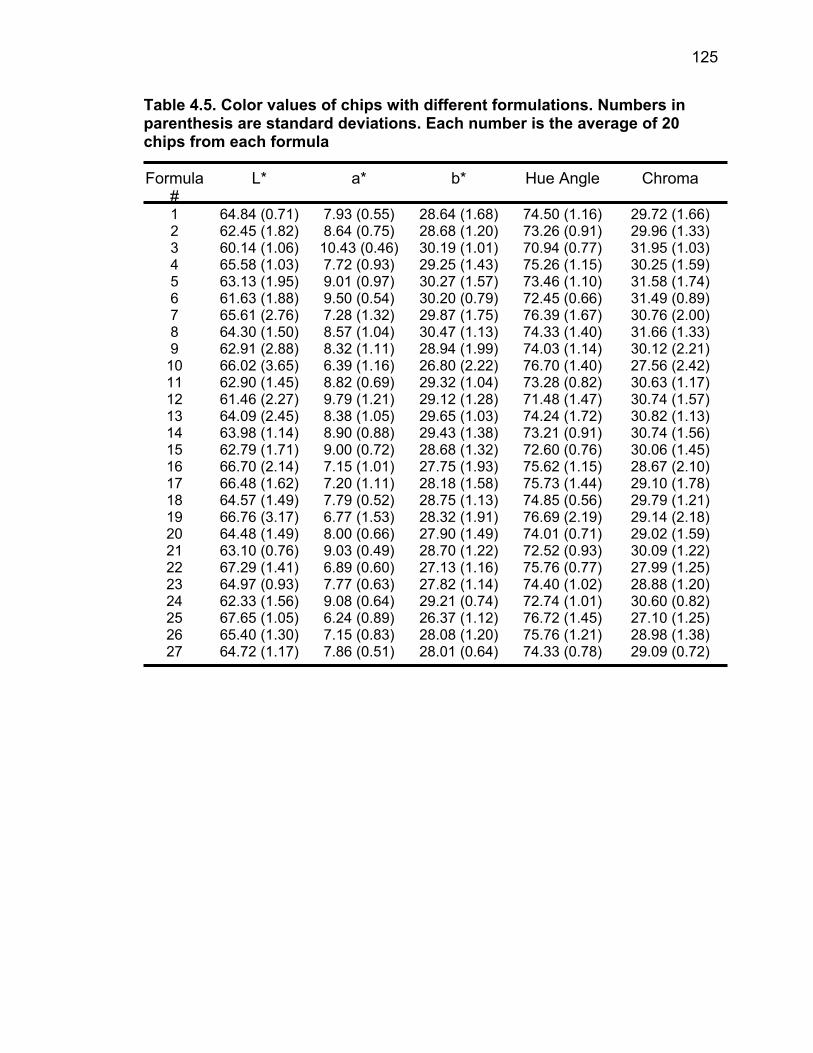
125
Table 4.5. Color values of chips with different formulations. Numbers in parenthesis are standard deviations. Each number is the average of 20 chips from each formula Formula
# L* a* b* Hue Angle Chroma
1 64.84 (0.71) 7.93 (0.55) 28.64 (1.68) 74.50 (1.16) 29.72 (1.66) 2 62.45 (1.82) 8.64 (0.75) 28.68 (1.20) 73.26 (0.91) 29.96 (1.33) 3 60.14 (1.06) 10.43 (0.46) 30.19 (1.01) 70.94 (0.77) 31.95 (1.03) 4 65.58 (1.03) 7.72 (0.93) 29.25 (1.43) 75.26 (1.15) 30.25 (1.59) 5 63.13 (1.95) 9.01 (0.97) 30.27 (1.57) 73.46 (1.10) 31.58 (1.74) 6 61.63 (1.88) 9.50 (0.54) 30.20 (0.79) 72.45 (0.66) 31.49 (0.89) 7 65.61 (2.76) 7.28 (1.32) 29.87 (1.75) 76.39 (1.67) 30.76 (2.00) 8 64.30 (1.50) 8.57 (1.04) 30.47 (1.13) 74.33 (1.40) 31.66 (1.33) 9 62.91 (2.88) 8.32 (1.11) 28.94 (1.99) 74.03 (1.14) 30.12 (2.21)
10 66.02 (3.65) 6.39 (1.16) 26.80 (2.22) 76.70 (1.40) 27.56 (2.42) 11 62.90 (1.45) 8.82 (0.69) 29.32 (1.04) 73.28 (0.82) 30.63 (1.17) 12 61.46 (2.27) 9.79 (1.21) 29.12 (1.28) 71.48 (1.47) 30.74 (1.57) 13 64.09 (2.45) 8.38 (1.05) 29.65 (1.03) 74.24 (1.72) 30.82 (1.13) 14 63.98 (1.14) 8.90 (0.88) 29.43 (1.38) 73.21 (0.91) 30.74 (1.56) 15 62.79 (1.71) 9.00 (0.72) 28.68 (1.32) 72.60 (0.76) 30.06 (1.45) 16 66.70 (2.14) 7.15 (1.01) 27.75 (1.93) 75.62 (1.15) 28.67 (2.10) 17 66.48 (1.62) 7.20 (1.11) 28.18 (1.58) 75.73 (1.44) 29.10 (1.78) 18 64.57 (1.49) 7.79 (0.52) 28.75 (1.13) 74.85 (0.56) 29.79 (1.21) 19 66.76 (3.17) 6.77 (1.53) 28.32 (1.91) 76.69 (2.19) 29.14 (2.18) 20 64.48 (1.49) 8.00 (0.66) 27.90 (1.49) 74.01 (0.71) 29.02 (1.59) 21 63.10 (0.76) 9.03 (0.49) 28.70 (1.22) 72.52 (0.93) 30.09 (1.22) 22 67.29 (1.41) 6.89 (0.60) 27.13 (1.16) 75.76 (0.77) 27.99 (1.25) 23 64.97 (0.93) 7.77 (0.63) 27.82 (1.14) 74.40 (1.02) 28.88 (1.20) 24 62.33 (1.56) 9.08 (0.64) 29.21 (0.74) 72.74 (1.01) 30.60 (0.82) 25 67.65 (1.05) 6.24 (0.89) 26.37 (1.12) 76.72 (1.45) 27.10 (1.25) 26 65.40 (1.30) 7.15 (0.83) 28.08 (1.20) 75.76 (1.21) 28.98 (1.38) 27 64.72 (1.17) 7.86 (0.51) 28.01 (0.64) 74.33 (0.78) 29.09 (0.72)
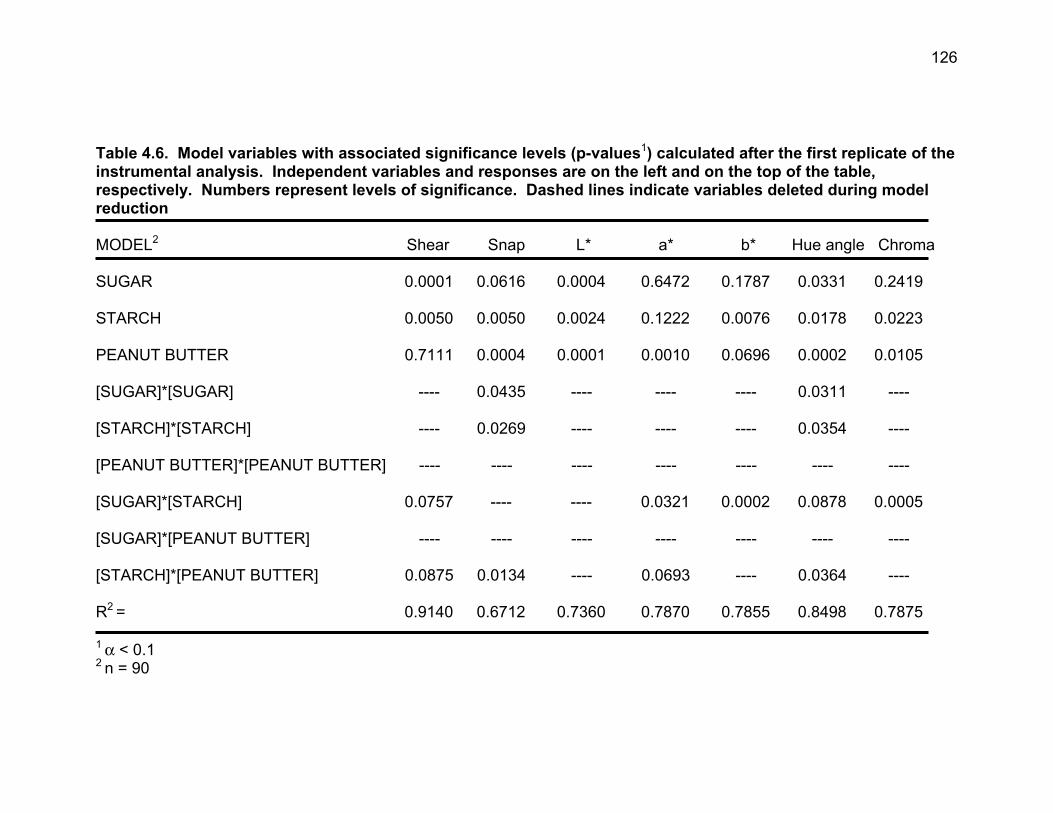
126
Table 4.6. Model variables with associated significance levels (p-values1) calculated after the first replicate of the instrumental analysis. Independent variables and responses are on the left and on the top of the table, respectively. Numbers represent levels of significance. Dashed lines indicate variables deleted during model reduction MODEL2 Shear Snap L* a* b* Hue angle Chroma SUGAR 0.0001 0.0616 0.0004 0.6472 0.1787 0.0331 0.2419 STARCH 0.0050 0.0050 0.0024 0.1222 0.0076 0.0178 0.0223 PEANUT BUTTER 0.7111 0.0004 0.0001 0.0010 0.0696 0.0002 0.0105 [SUGAR]*[SUGAR] ---- 0.0435 ---- ---- ---- 0.0311 ---- [STARCH]*[STARCH] ---- 0.0269 ---- ---- ---- 0.0354 ---- [PEANUT BUTTER]*[PEANUT BUTTER] ---- ---- ---- ---- ---- ---- ---- [SUGAR]*[STARCH] 0.0757 ---- ---- 0.0321 0.0002 0.0878 0.0005 [SUGAR]*[PEANUT BUTTER] ---- ---- ---- ---- ---- ---- ---- [STARCH]*[PEANUT BUTTER] 0.0875 0.0134 ---- 0.0693 ---- 0.0364 ---- R2 = 0.9140 0.6712 0.7360 0.7870 0.7855 0.8498 0.7875 1 α < 0.1 2 n = 90
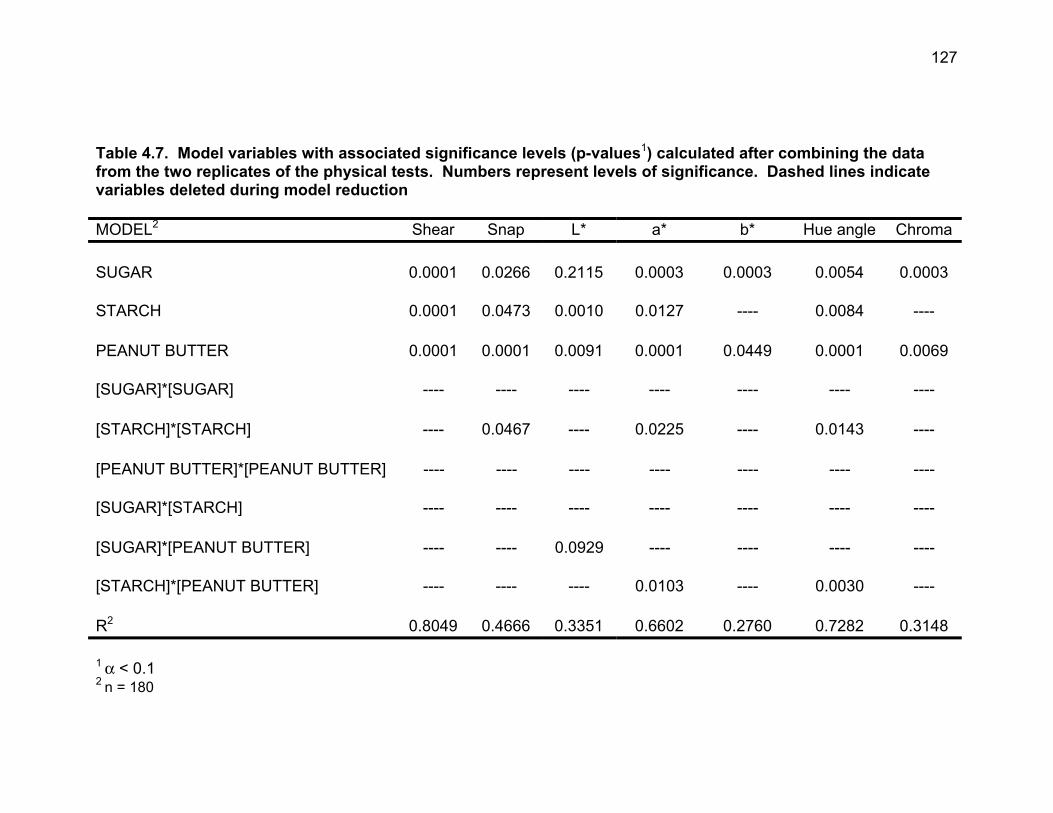
127
Table 4.7. Model variables with associated significance levels (p-values1) calculated after combining the data from the two replicates of the physical tests. Numbers represent levels of significance. Dashed lines indicate variables deleted during model reduction MODEL2 Shear Snap L* a* b* Hue angle Chroma SUGAR 0.0001 0.0266 0.2115 0.0003 0.0003 0.0054 0.0003 STARCH 0.0001 0.0473 0.0010 0.0127 ---- 0.0084 ---- PEANUT BUTTER 0.0001 0.0001 0.0091 0.0001 0.0449 0.0001 0.0069 [SUGAR]*[SUGAR] ---- ---- ---- ---- ---- ---- ---- [STARCH]*[STARCH] ---- 0.0467 ---- 0.0225 ---- 0.0143 ---- [PEANUT BUTTER]*[PEANUT BUTTER] ---- ---- ---- ---- ---- ---- ---- [SUGAR]*[STARCH] ---- ---- ---- ---- ---- ---- ---- [SUGAR]*[PEANUT BUTTER] ---- ---- 0.0929 ---- ---- ---- ---- [STARCH]*[PEANUT BUTTER] ---- ---- ---- 0.0103 ---- 0.0030 ---- R2 0.8049 0.4666 0.3351 0.6602 0.2760 0.7282 0.3148 1 α < 0.1
2 n = 180
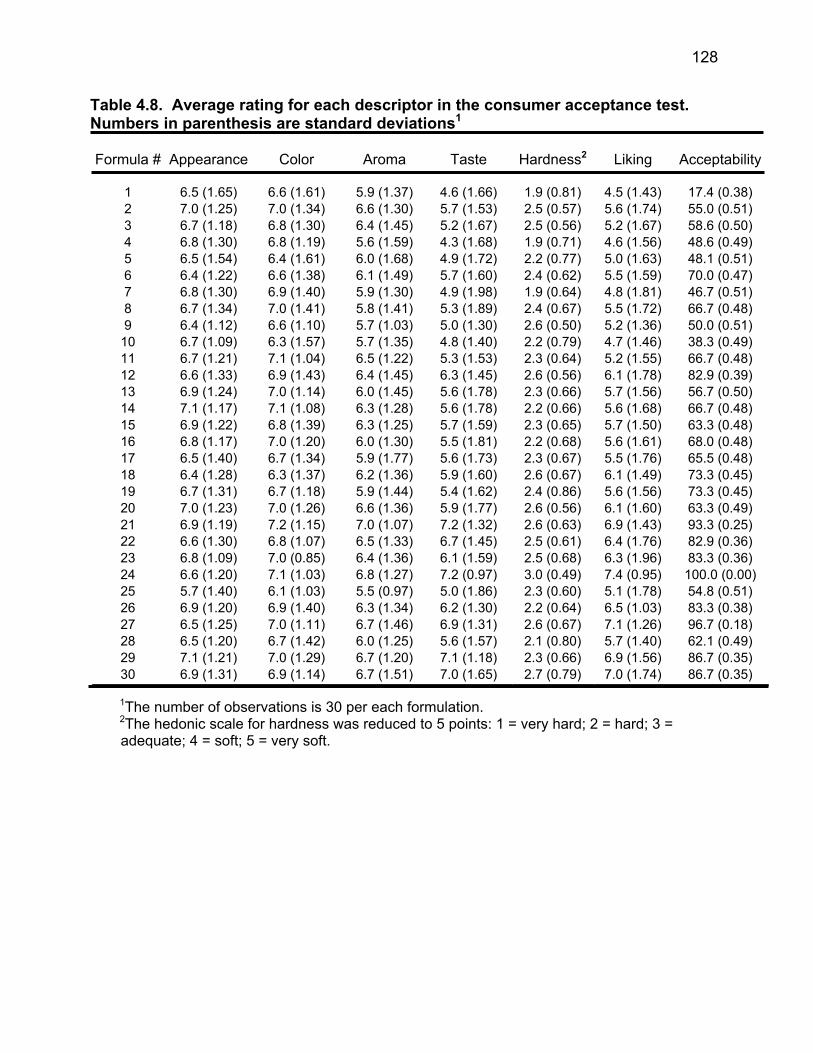
128
Table 4.8. Average rating for each descriptor in the consumer acceptance test. Numbers in parenthesis are standard deviations1
Formula # Appearance Color Aroma Taste Hardness2 Liking Acceptability
1 6.5 (1.65) 6.6 (1.61) 5.9 (1.37) 4.6 (1.66) 1.9 (0.81) 4.5 (1.43) 17.4 (0.38) 2 7.0 (1.25) 7.0 (1.34) 6.6 (1.30) 5.7 (1.53) 2.5 (0.57) 5.6 (1.74) 55.0 (0.51) 3 6.7 (1.18) 6.8 (1.30) 6.4 (1.45) 5.2 (1.67) 2.5 (0.56) 5.2 (1.67) 58.6 (0.50) 4 6.8 (1.30) 6.8 (1.19) 5.6 (1.59) 4.3 (1.68) 1.9 (0.71) 4.6 (1.56) 48.6 (0.49) 5 6.5 (1.54) 6.4 (1.61) 6.0 (1.68) 4.9 (1.72) 2.2 (0.77) 5.0 (1.63) 48.1 (0.51) 6 6.4 (1.22) 6.6 (1.38) 6.1 (1.49) 5.7 (1.60) 2.4 (0.62) 5.5 (1.59) 70.0 (0.47) 7 6.8 (1.30) 6.9 (1.40) 5.9 (1.30) 4.9 (1.98) 1.9 (0.64) 4.8 (1.81) 46.7 (0.51) 8 6.7 (1.34) 7.0 (1.41) 5.8 (1.41) 5.3 (1.89) 2.4 (0.67) 5.5 (1.72) 66.7 (0.48) 9 6.4 (1.12) 6.6 (1.10) 5.7 (1.03) 5.0 (1.30) 2.6 (0.50) 5.2 (1.36) 50.0 (0.51)
10 6.7 (1.09) 6.3 (1.57) 5.7 (1.35) 4.8 (1.40) 2.2 (0.79) 4.7 (1.46) 38.3 (0.49) 11 6.7 (1.21) 7.1 (1.04) 6.5 (1.22) 5.3 (1.53) 2.3 (0.64) 5.2 (1.55) 66.7 (0.48) 12 6.6 (1.33) 6.9 (1.43) 6.4 (1.45) 6.3 (1.45) 2.6 (0.56) 6.1 (1.78) 82.9 (0.39) 13 6.9 (1.24) 7.0 (1.14) 6.0 (1.45) 5.6 (1.78) 2.3 (0.66) 5.7 (1.56) 56.7 (0.50) 14 7.1 (1.17) 7.1 (1.08) 6.3 (1.28) 5.6 (1.78) 2.2 (0.66) 5.6 (1.68) 66.7 (0.48) 15 6.9 (1.22) 6.8 (1.39) 6.3 (1.25) 5.7 (1.59) 2.3 (0.65) 5.7 (1.50) 63.3 (0.48) 16 6.8 (1.17) 7.0 (1.20) 6.0 (1.30) 5.5 (1.81) 2.2 (0.68) 5.6 (1.61) 68.0 (0.48) 17 6.5 (1.40) 6.7 (1.34) 5.9 (1.77) 5.6 (1.73) 2.3 (0.67) 5.5 (1.76) 65.5 (0.48) 18 6.4 (1.28) 6.3 (1.37) 6.2 (1.36) 5.9 (1.60) 2.6 (0.67) 6.1 (1.49) 73.3 (0.45) 19 6.7 (1.31) 6.7 (1.18) 5.9 (1.44) 5.4 (1.62) 2.4 (0.86) 5.6 (1.56) 73.3 (0.45) 20 7.0 (1.23) 7.0 (1.26) 6.6 (1.36) 5.9 (1.77) 2.6 (0.56) 6.1 (1.60) 63.3 (0.49) 21 6.9 (1.19) 7.2 (1.15) 7.0 (1.07) 7.2 (1.32) 2.6 (0.63) 6.9 (1.43) 93.3 (0.25) 22 6.6 (1.30) 6.8 (1.07) 6.5 (1.33) 6.7 (1.45) 2.5 (0.61) 6.4 (1.76) 82.9 (0.36) 23 6.8 (1.09) 7.0 (0.85) 6.4 (1.36) 6.1 (1.59) 2.5 (0.68) 6.3 (1.96) 83.3 (0.36) 24 6.6 (1.20) 7.1 (1.03) 6.8 (1.27) 7.2 (0.97) 3.0 (0.49) 7.4 (0.95) 100.0 (0.00) 25 5.7 (1.40) 6.1 (1.03) 5.5 (0.97) 5.0 (1.86) 2.3 (0.60) 5.1 (1.78) 54.8 (0.51) 26 6.9 (1.20) 6.9 (1.40) 6.3 (1.34) 6.2 (1.30) 2.2 (0.64) 6.5 (1.03) 83.3 (0.38) 27 6.5 (1.25) 7.0 (1.11) 6.7 (1.46) 6.9 (1.31) 2.6 (0.67) 7.1 (1.26) 96.7 (0.18) 28 6.5 (1.20) 6.7 (1.42) 6.0 (1.25) 5.6 (1.57) 2.1 (0.80) 5.7 (1.40) 62.1 (0.49) 29 7.1 (1.21) 7.0 (1.29) 6.7 (1.20) 7.1 (1.18) 2.3 (0.66) 6.9 (1.56) 86.7 (0.35) 30 6.9 (1.31) 6.9 (1.14) 6.7 (1.51) 7.0 (1.65) 2.7 (0.79) 7.0 (1.74) 86.7 (0.35)
1The number of observations is 30 per each formulation. 2The hedonic scale for hardness was reduced to 5 points: 1 = very hard; 2 = hard; 3 = adequate; 4 = soft; 5 = very soft.
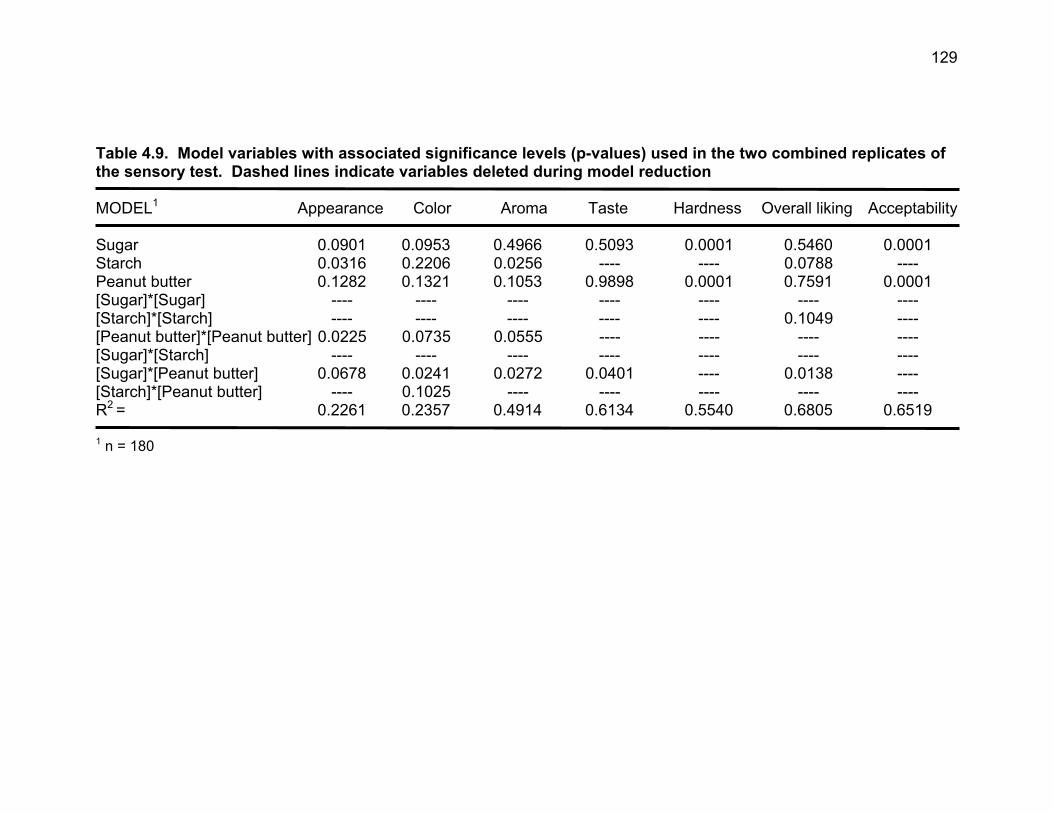
129
Table 4.9. Model variables with associated significance levels (p-values) used in the two combined replicates of the sensory test. Dashed lines indicate variables deleted during model reduction MODEL1 Appearance Color Aroma Taste Hardness Overall liking Acceptability Sugar 0.0901 0.0953 0.4966 0.5093 0.0001 0.5460 0.0001 Starch 0.0316 0.2206 0.0256 ---- ---- 0.0788 ---- Peanut butter 0.1282 0.1321 0.1053 0.9898 0.0001 0.7591 0.0001 [Sugar]*[Sugar] ---- ---- ---- ---- ---- ---- ---- [Starch]*[Starch] ---- ---- ---- ---- ---- 0.1049 ---- [Peanut butter]*[Peanut butter] 0.0225 0.0735 0.0555 ---- ---- ---- ---- [Sugar]*[Starch] ---- ---- ---- ---- ---- ---- ---- [Sugar]*[Peanut butter] 0.0678 0.0241 0.0272 0.0401 ---- 0.0138 ---- [Starch]*[Peanut butter] ---- 0.1025 ---- ---- ---- ---- ---- R2 = 0.2261 0.2357 0.4914 0.6134 0.5540 0.6805 0.6519 1 n = 180
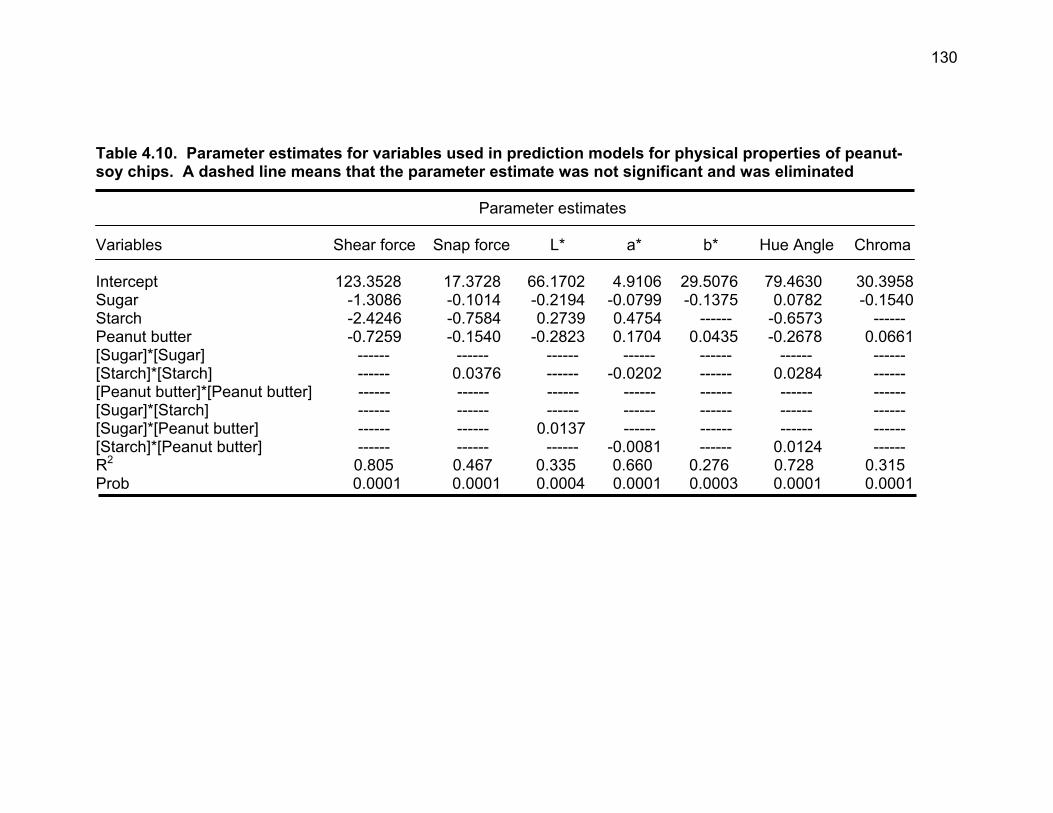
130
Table 4.10. Parameter estimates for variables used in prediction models for physical properties of peanut- soy chips. A dashed line means that the parameter estimate was not significant and was eliminated Parameter estimates Variables Shear force Snap force L* a* b* Hue Angle Chroma Intercept 123.3528 17.3728 66.1702 4.9106 29.5076 79.4630 30.3958Sugar -1.3086 -0.1014 -0.2194 -0.0799 -0.1375 0.0782 -0.1540 Starch -2.4246 -0.7584 0.2739 0.4754 ------ -0.6573 ------ Peanut butter -0.7259 -0.1540 -0.2823 0.1704 0.0435 -0.2678 0.0661[Sugar]*[Sugar] ------ ------ ------ ------ ------ ------ ------ [Starch]*[Starch] ------ 0.0376 ------ -0.0202 ------ 0.0284 ------ [Peanut butter]*[Peanut butter] ------ ------ ------ ------ ------ ------ ------ [Sugar]*[Starch] ------ ------ ------ ------ ------ ------ ------ [Sugar]*[Peanut butter] ------ ------ 0.0137 ------ ------ ------ ------ [Starch]*[Peanut butter] ------ ------ ------ -0.0081 ------ 0.0124 ------ R2 0.805 0.467 0.335 0.660 0.276 0.728 0.315 Prob 0.0001 0.0001 0.0004 0.0001 0.0003 0.0001 0.0001
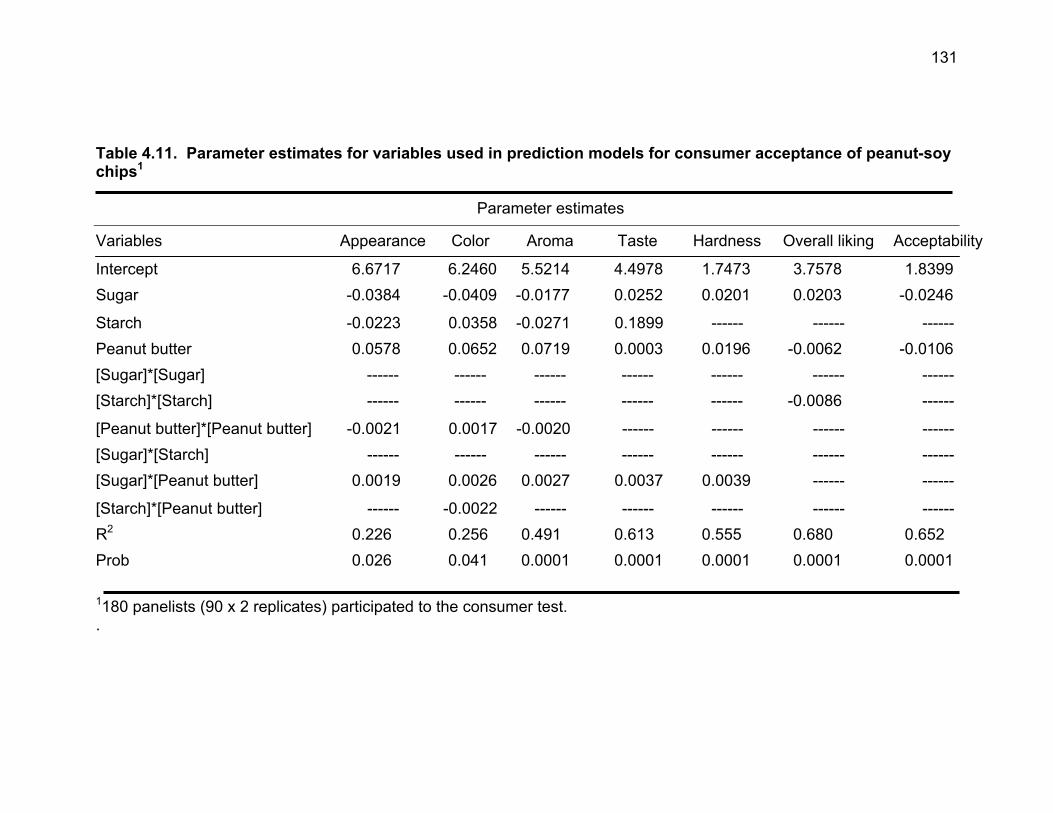
131
Table 4.11. Parameter estimates for variables used in prediction models for consumer acceptance of peanut-soy chips1
Parameter estimates
Variables Appearance Color Aroma Taste Hardness Overall liking Acceptability
Intercept 6.6717 6.2460 5.5214 4.4978 1.7473 3.7578 1.8399 Sugar -0.0384 -0.0409 -0.0177 0.0252 0.0201 0.0203 -0.0246
Starch -0.0223 0.0358 -0.0271 0.1899 ------ ------ ------ Peanut butter 0.0578 0.0652 0.0719 0.0003 0.0196 -0.0062 -0.0106 [Sugar]*[Sugar] ------ ------ ------ ------ ------ ------ ------ [Starch]*[Starch] ------ ------ ------ ------ ------ -0.0086 ------
[Peanut butter]*[Peanut butter] -0.0021 0.0017 -0.0020 ------ ------ ------ ------ [Sugar]*[Starch] ------ ------ ------ ------ ------ ------ ------ [Sugar]*[Peanut butter] 0.0019 0.0026 0.0027 0.0037 0.0039 ------ ------
[Starch]*[Peanut butter] ------ -0.0022 ------ ------ ------ ------ ------ R2 0.226 0.256 0.491 0.613 0.555 0.680 0.652
Prob 0.026 0.041 0.0001 0.0001 0.0001 0.0001 0.0001
1180 panelists (90 x 2 replicates) participated to the consumer test. .
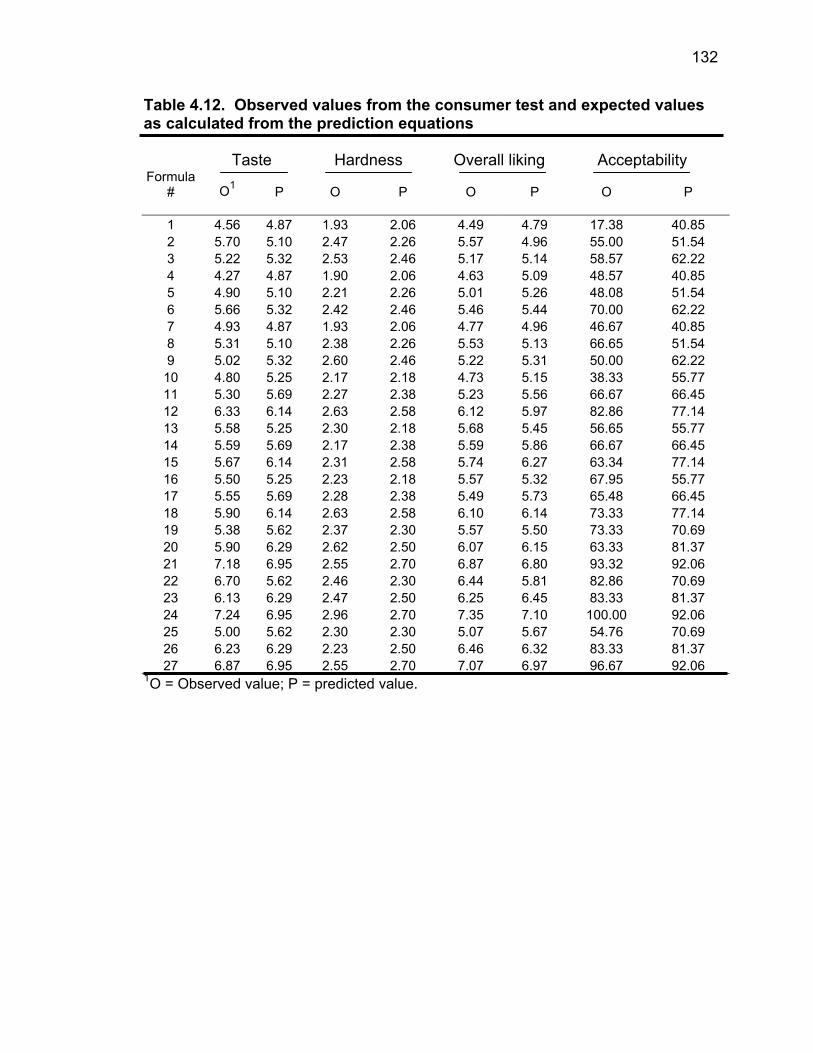
132
Table 4.12. Observed values from the consumer test and expected values as calculated from the prediction equations Taste Hardness Overall liking Acceptability Formula
#
O1
P
O
P
O
P
O
P
1 4.56 4.87 1.93 2.06 4.49 4.79 17.38 40.85 2 5.70 5.10 2.47 2.26 5.57 4.96 55.00 51.54 3 5.22 5.32 2.53 2.46 5.17 5.14 58.57 62.22 4 4.27 4.87 1.90 2.06 4.63 5.09 48.57 40.85 5 4.90 5.10 2.21 2.26 5.01 5.26 48.08 51.54 6 5.66 5.32 2.42 2.46 5.46 5.44 70.00 62.22 7 4.93 4.87 1.93 2.06 4.77 4.96 46.67 40.85 8 5.31 5.10 2.38 2.26 5.53 5.13 66.65 51.54 9 5.02 5.32 2.60 2.46 5.22 5.31 50.00 62.22
10 4.80 5.25 2.17 2.18 4.73 5.15 38.33 55.77 11 5.30 5.69 2.27 2.38 5.23 5.56 66.67 66.45 12 6.33 6.14 2.63 2.58 6.12 5.97 82.86 77.14 13 5.58 5.25 2.30 2.18 5.68 5.45 56.65 55.77 14 5.59 5.69 2.17 2.38 5.59 5.86 66.67 66.45 15 5.67 6.14 2.31 2.58 5.74 6.27 63.34 77.14 16 5.50 5.25 2.23 2.18 5.57 5.32 67.95 55.77 17 5.55 5.69 2.28 2.38 5.49 5.73 65.48 66.45 18 5.90 6.14 2.63 2.58 6.10 6.14 73.33 77.14 19 5.38 5.62 2.37 2.30 5.57 5.50 73.33 70.69 20 5.90 6.29 2.62 2.50 6.07 6.15 63.33 81.37 21 7.18 6.95 2.55 2.70 6.87 6.80 93.32 92.06 22 6.70 5.62 2.46 2.30 6.44 5.81 82.86 70.69 23 6.13 6.29 2.47 2.50 6.25 6.45 83.33 81.37 24 7.24 6.95 2.96 2.70 7.35 7.10 100.00 92.06 25 5.00 5.62 2.30 2.30 5.07 5.67 54.76 70.69 26 6.23 6.29 2.23 2.50 6.46 6.32 83.33 81.37 27 6.87 6.95 2.55 2.70 7.07 6.97 96.67 92.06
1O = Observed value; P = predicted value.
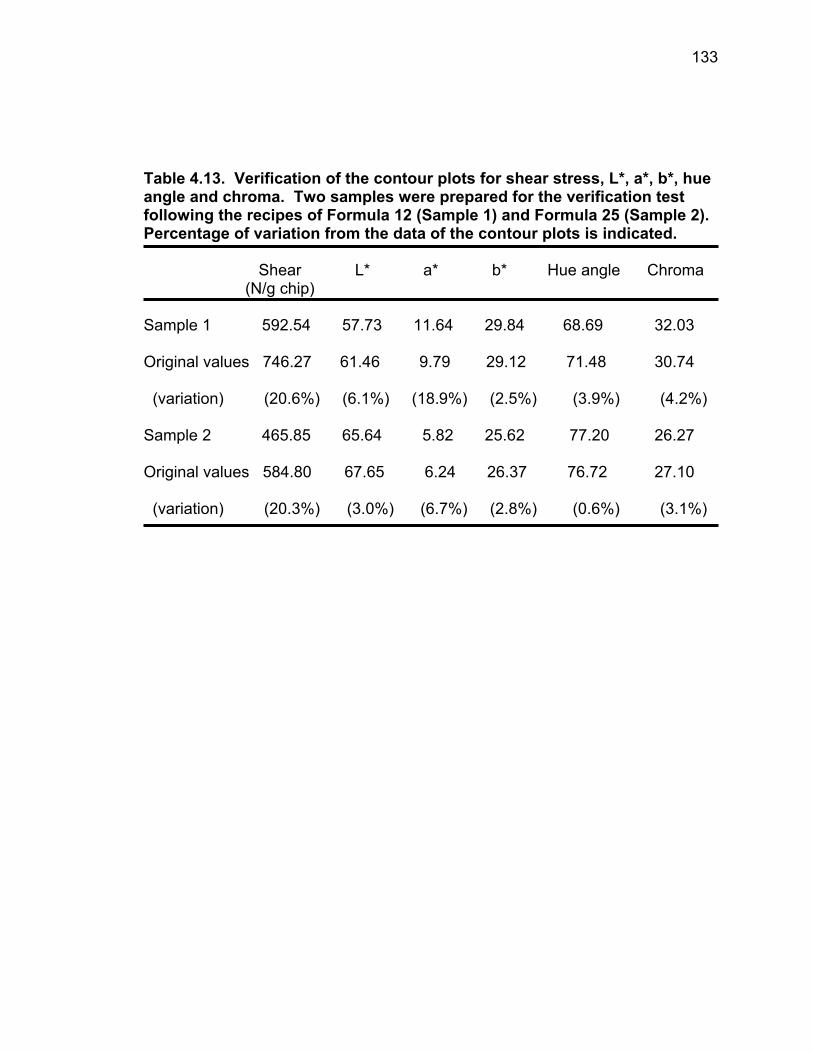
133
Table 4.13. Verification of the contour plots for shear stress, L*, a*, b*, hue angle and chroma. Two samples were prepared for the verification test following the recipes of Formula 12 (Sample 1) and Formula 25 (Sample 2). Percentage of variation from the data of the contour plots is indicated.
Shear L* a* b* Hue angle Chroma (N/g chip)
Sample 1 592.54 57.73 11.64 29.84 68.69 32.03 Original values 746.27 61.46 9.79 29.12 71.48 30.74 (variation) (20.6%) (6.1%) (18.9%) (2.5%) (3.9%) (4.2%) Sample 2 465.85 65.64 5.82 25.62 77.20 26.27 Original values 584.80 67.65 6.24 26.37 76.72 27.10 (variation) (20.3%) (3.0%) (6.7%) (2.8%) (0.6%) (3.1%)
134
Figure 4.1. The questionnaire used for the consumer evaluation of the experimental peanut chips.
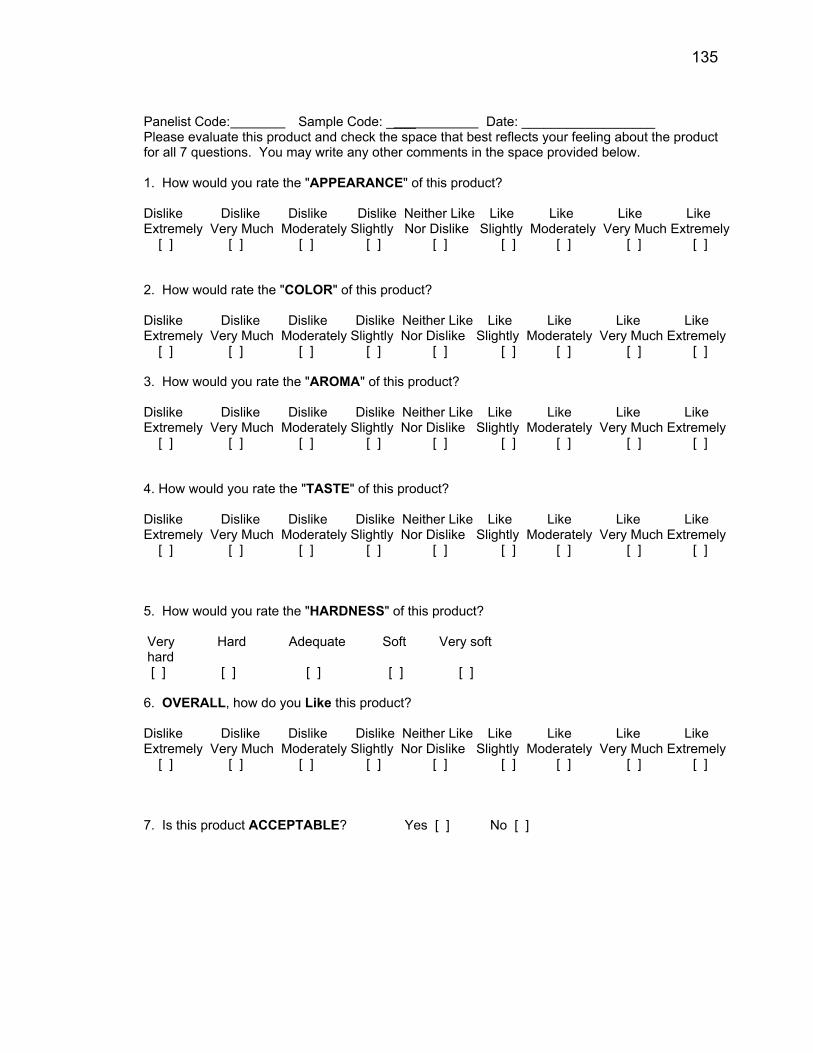
135
Panelist Code: Sample Code: ____ Date: __________________ Please evaluate this product and check the space that best reflects your feeling about the product for all 7 questions. You may write any other comments in the space provided below. 1. How would you rate the "APPEARANCE" of this product?
Dislike Dislike Dislike Dislike Neither Like Like Like Like Like Extremely Very Much Moderately Slightly Nor Dislike Slightly Moderately Very Much Extremely [ ] [ ] [ ] [ ] [ ] [ ] [ ] [ ] [ ]
2. How would rate the "COLOR" of this product? Dislike Dislike Dislike Dislike Neither Like Like Like Like Like Extremely Very Much Moderately Slightly Nor Dislike Slightly Moderately Very Much Extremely [ ] [ ] [ ] [ ] [ ] [ ] [ ] [ ] [ ] 3. How would you rate the "AROMA" of this product? Dislike Dislike Dislike Dislike Neither Like Like Like Like Like Extremely Very Much Moderately Slightly Nor Dislike Slightly Moderately Very Much Extremely [ ] [ ] [ ] [ ] [ ] [ ] [ ] [ ] [ ]
4. How would you rate the "TASTE" of this product? Dislike Dislike Dislike Dislike Neither Like Like Like Like Like Extremely Very Much Moderately Slightly Nor Dislike Slightly Moderately Very Much Extremely [ ] [ ] [ ] [ ] [ ] [ ] [ ] [ ] [ ]
5. How would you rate the "HARDNESS" of this product? Very Hard Adequate Soft Very soft hard [ ] [ ] [ ] [ ] [ ] 6. OVERALL, how do you Like this product? Dislike Dislike Dislike Dislike Neither Like Like Like Like Like Extremely Very Much Moderately Slightly Nor Dislike Slightly Moderately Very Much Extremely [ ] [ ] [ ] [ ] [ ] [ ] [ ] [ ] [ ] 7. Is this product ACCEPTABLE? Yes [ ] No [ ]
136
Figure 4.2. The predictive equations for the responses shear force (A) and snapping force (B). On the X-axis are the observed values, on the Y-axis are the predicted values. The straight lines (y = x) show where the points would fall if there was identity between observed and predicted values.
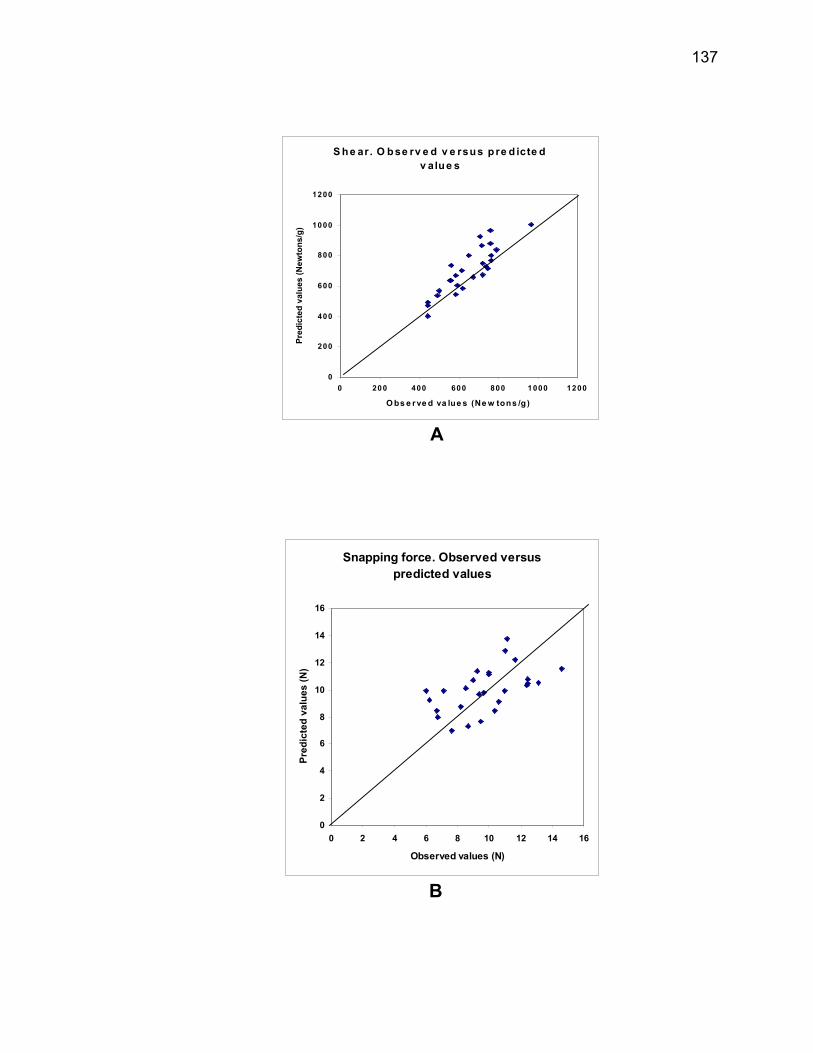
137
A
B
S he ar. O bse rv e d v e rsus p re d icte d v alue s
0
200
400
600
800
1000
1200
0 200 400 600 800 1000 1200
O bs e rve d va lue s (Ne w tons /g)
Pred
icte
d va
lues
(New
tons
/g)
Snapping force. Observed versus predicted values
0
2
4
6
8
10
12
14
16
0 2 4 6 8 10 12 14 16
Observed values (N)
Pred
icte
d va
lues
(N)
138
Figure 4.3. The predictive equation for the responses lightness = L* (A), redness = a* (B), and yellowness = b* (C). X-axis indicates the observed values, Y-axis indicates the predicted values.
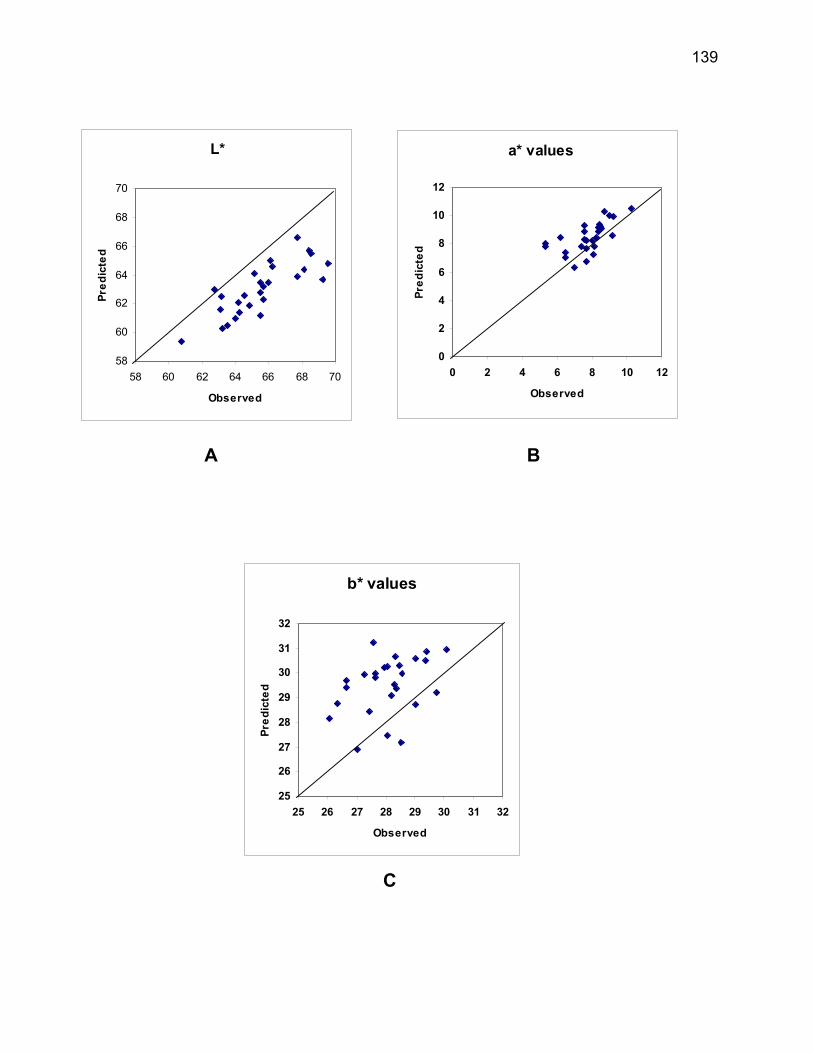
139
A B
C
L*
58
60
62
64
66
68
70
58 60 62 64 66 68 70
Observed
Pred
icte
d
a* values
0
2
4
6
8
10
12
0 2 4 6 8 10 12
Observed
Pred
icte
d
b* values
25
26
27
28
29
30
31
32
25 26 27 28 29 30 31 32
Observed
Pred
icte
d
140
Figure 4.4. Contour plots of shear strength for peanut-soy chips at (a) 5% starch, (b) 10% starch and (c) 15% starch. Numbers on the axes represent percentages of sucrose (x) and peanut butter (y) (g/100g chip). Values on the plot represent forces per units of weight of the chips (N/g).
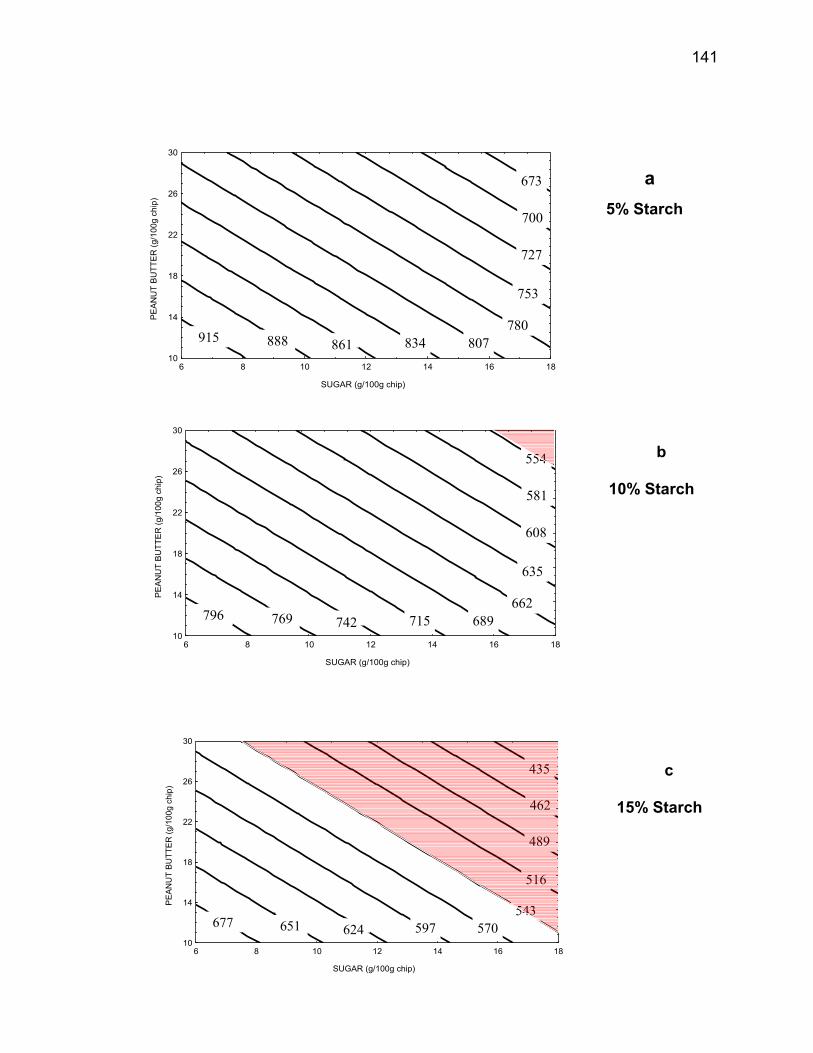
141
a 5% Starch
c 15% Starch
SUGAR (g/100g chip)
PEAN
UT
BUTT
ER (g
/100
g ch
ip)
10
14
18
22
26
30
6 8 10 12 14 16 18
677 651 624 597 570543
516
489
462
435
SUGAR (g/100g chip)
PEAN
UT
BUTT
ER (g
/100
g ch
ip)
10
14
18
22
26
30
6 8 10 12 14 16 18
796 769 742 715 689662
635
608
581
554
SUGAR (g/100g chip)
PEAN
UT
BUTT
ER (g
/100
g ch
ip)
10
14
18
22
26
30
6 8 10 12 14 16 18
915 888 861 834 807780
753
727
700
673
b 10% Starch
142
Figure 4.5. Contour plots of snapping force of peanut-soy chips at (a) 6% sugar, (b) 12% sugar and (c) 18% sugar. Numbers on the axes represent percentages of cornstarch (x) and peanut butter (y) (g/100g chip). Numbers on the plot represent forces expressed in Newtons (N).
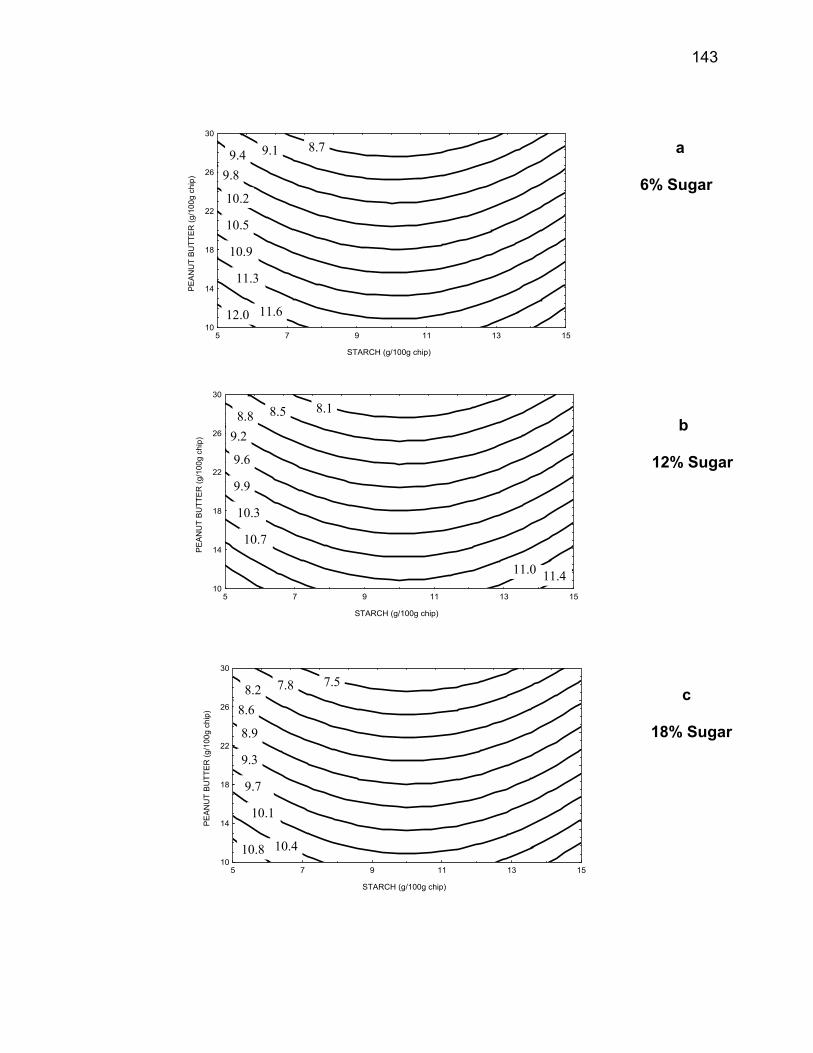
143
a 6% Sugar
STARCH (g/100g chip)
PEAN
UT
BUTT
ER (g
/100
g ch
ip)
10
14
18
22
26
30
5 7 9 11 13 15
10.8 10.4
10.1
9.7
9.3
8.9
8.68.2 7.8 7.5
STARCH (g/100g chip)
PEAN
UT
BUTT
ER (g
/100
g ch
ip)
10
14
18
22
26
30
5 7 9 11 13 15
12.0 11.6
11.3
10.9
10.5
10.2
9.89.4 9.1 8.7
STARCH (g/100g chip)
PEAN
UT
BUTT
ER (g
/100
g ch
ip)
10
14
18
22
26
30
5 7 9 11 13 15
11.411.0
10.7
10.3
9.9
9.6
9.28.8 8.5 8.1
b 12% Sugar
c 18% Sugar
144
Figure 4.6. Contour plot of L* (lightness) values at 6, 12 and 18% sugar. Values were determined by Minolta Chroma meter (black = 0, white = 100). Numbers on the axes represent percentages of cornstarch and peanut butter (g/100g chip).
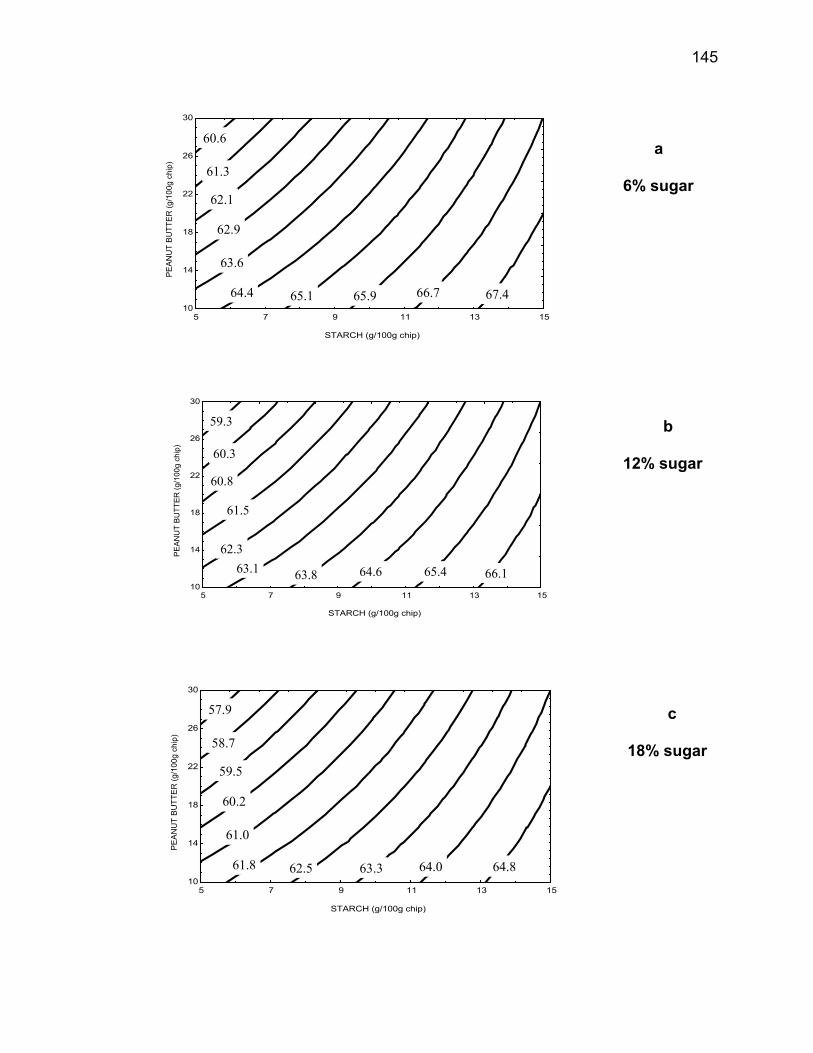
145
c 18% sugar
b 12% sugar
a 6% sugar
STARCH (g/100g chip)
PEAN
UT
BUTT
ER (g
/100
g ch
ip)
10
14
18
22
26
30
5 7 9 11 13 15
60.6
61.3
62.1
62.9
63.6
64.4 65.1 65.9 66.7 67.4
STARCH (g/100g chip)
PEAN
UT
BUTT
ER (g
/100
g ch
ip)
10
14
18
22
26
30
5 7 9 11 13 15
59.3
60.3
60.8
61.5
62.363.1 63.8 64.6 65.4 66.1
STARCH (g/100g chip)
PEAN
UT
BUTT
ER (g
/100
g ch
ip)
10
14
18
22
26
30
5 7 9 11 13 15
57.9
58.7
59.5
60.2
61.0
61.8 62.5 63.3 64.0 64.8
146
Figure 4.7. Contour plot of a* (redness) at different concentrations of sugar (in CIE L* a* b* system). Numbers on the axes represent percentages of cornstarch and peanut butter (g/100g chip).
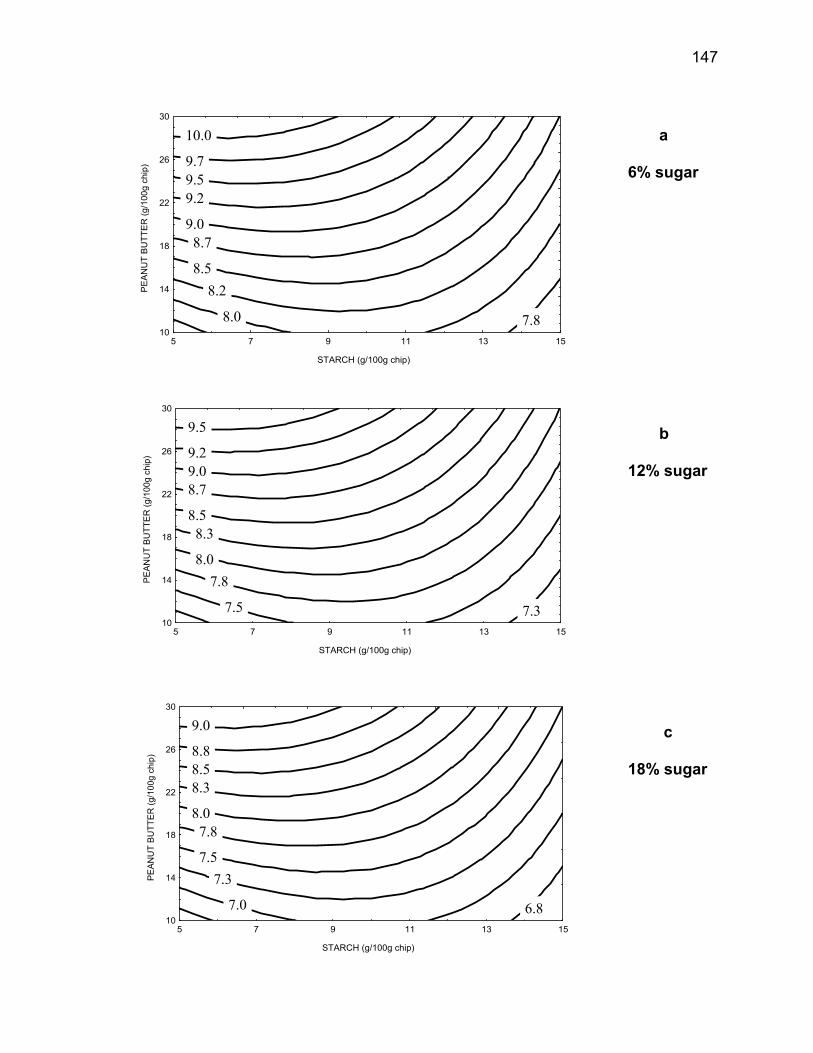
147
a 6% sugar
b 12% sugar
c 18% sugar
STARCH (g/100g chip)
PEAN
UT
BUTT
ER (g
/100
g ch
ip)
10
14
18
22
26
30
5 7 9 11 13 15
10.0
9.79.59.2
9.08.7
8.58.2
8.0 7.8
STARCH (g/100g chip)
PEAN
UT
BUTT
ER (g
/100
g ch
ip)
10
14
18
22
26
30
5 7 9 11 13 15
9.5
9.29.08.7
8.58.3
8.07.8
7.5 7.3
STARCH (g/100g chip)
PEAN
UT
BUTT
ER (g
/100
g ch
ip)
10
14
18
22
26
30
5 7 9 11 13 15
9.0
8.88.58.3
8.07.8
7.57.3
7.0 6.8
148
Figure 4.8. Contour plot of yellowness (b*) as determined with Minolta Chroma-meter. Yellowness is independent from starch. Numbers on the axes represent percentages of sucrose and peanut butter (g/100g chip).
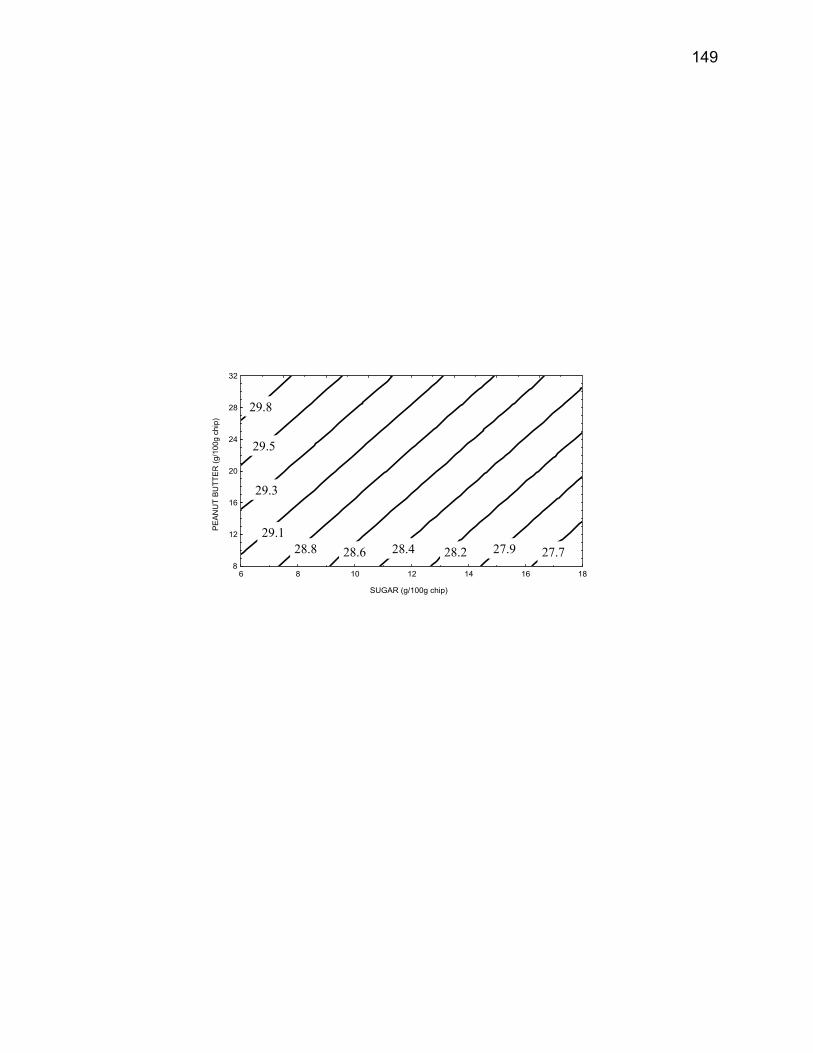
149
SUGAR (g/100g chip)
PEAN
UT
BUTT
ER (g
/100
g ch
ip)
8
12
16
20
24
28
32
6 8 10 12 14 16 18
29.8
29.5
29.3
29.128.8 28.6 28.4 28.2 27.9 27.7
150
Figure 4.9. Contour plot for hue angle values at 6, 12 and 18% sugar. Numbers on the axes represent percentages of cornstarch and peanut butter (g/100g chip).
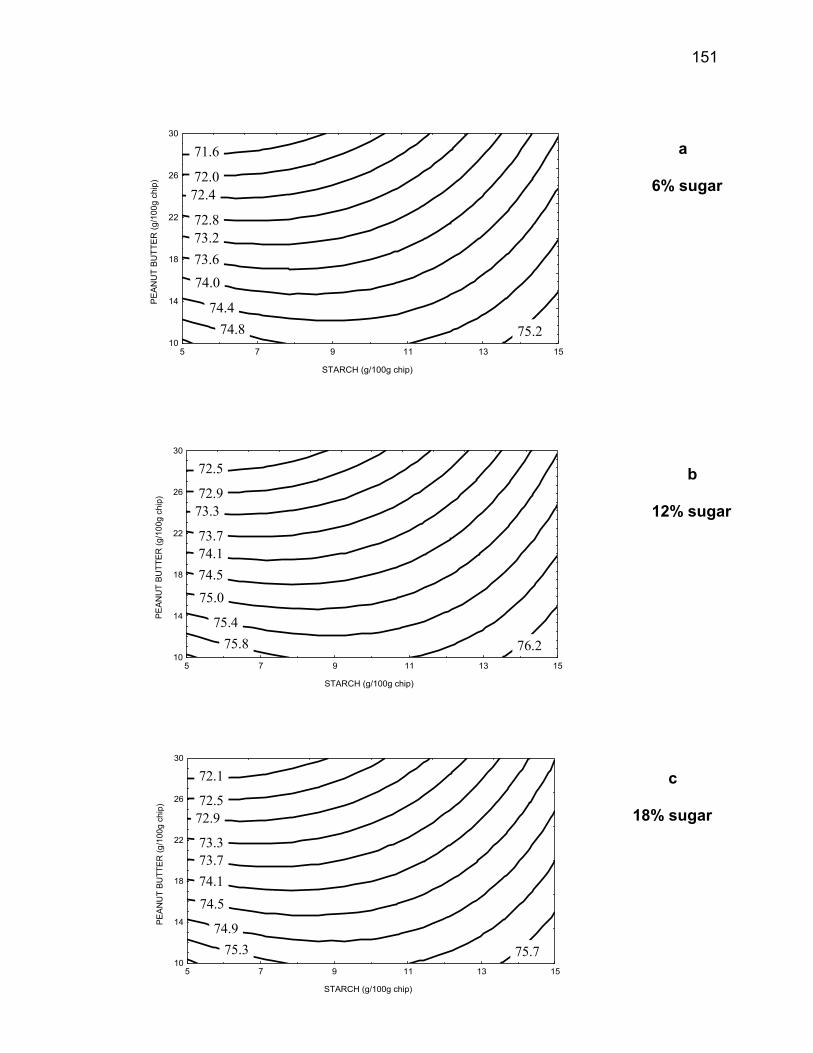
151
b 12% sugar
a 6% sugar
c 18% sugar
STARCH (g/100g chip)
PEAN
UT
BUTT
ER (g
/100
g ch
ip)
10
14
18
22
26
30
5 7 9 11 13 15
71.6
72.072.4
72.873.273.674.0
74.474.8 75.2
STARCH (g/100g chip)
PEAN
UT
BUTT
ER (g
/100
g ch
ip)
10
14
18
22
26
30
5 7 9 11 13 15
72.1
72.572.9
73.373.774.174.5
74.975.3 75.7
STARCH (g/100g chip)
PEAN
UT
BUTT
ER (g
/100
g ch
ip)
10
14
18
22
26
30
5 7 9 11 13 15
72.5
72.973.3
73.774.174.575.0
75.475.8 76.2
152
Figure 4.10. Chroma values. Only sugar and peanut butter were significant in this model. Therefore, starch was not included and only one plot was drawn. Numbers on the axes represent percentages of sucrose and peanut butter (g/100g chip).
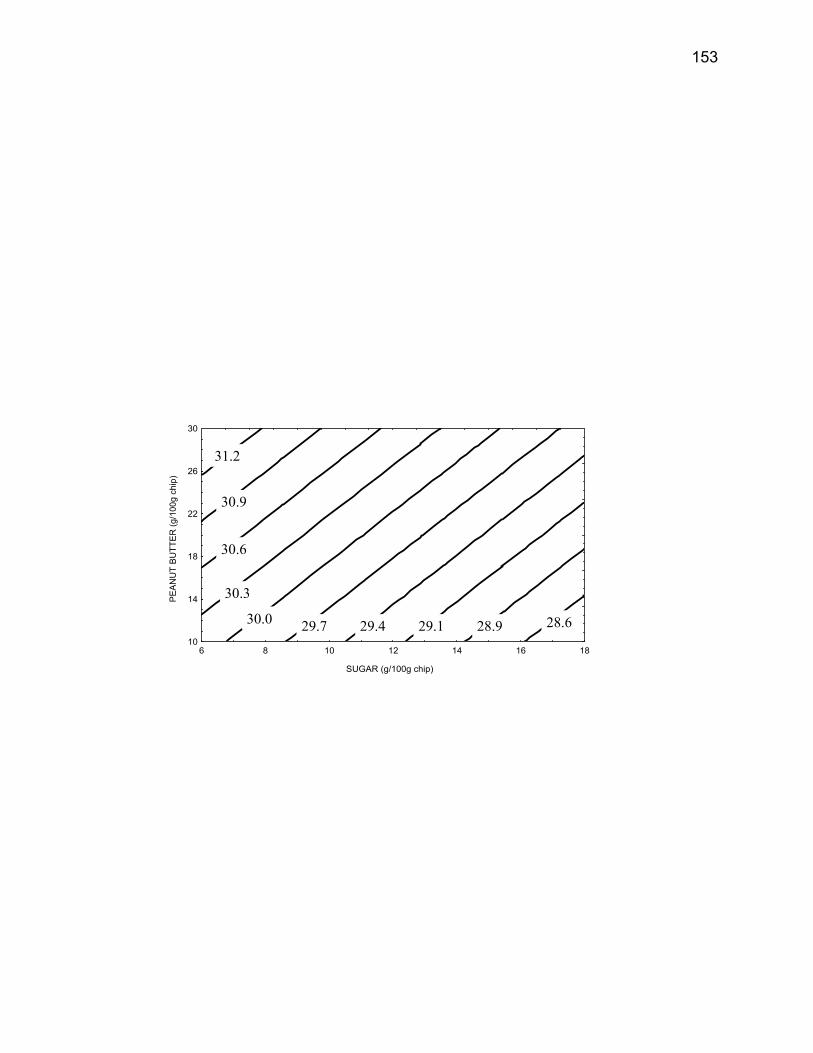
153
SUGAR (g/100g chip)
PEAN
UT
BUTT
ER (g
/100
g ch
ip)
10
14
18
22
26
30
6 8 10 12 14 16 18
31.2
30.9
30.6
30.3
30.0 29.7 29.4 29.1 28.9 28.6
154
Figure 4.11. Contour plot for aroma. Numbers represent values on a 9-point hedonic scale (1=dislike extremely; 5=neither like nor dislike; 9=like extremely). Numbers on the axes represent percentages of sucrose and peanut butter (g/100g chip). Each plot represents the effect of a different starch level.
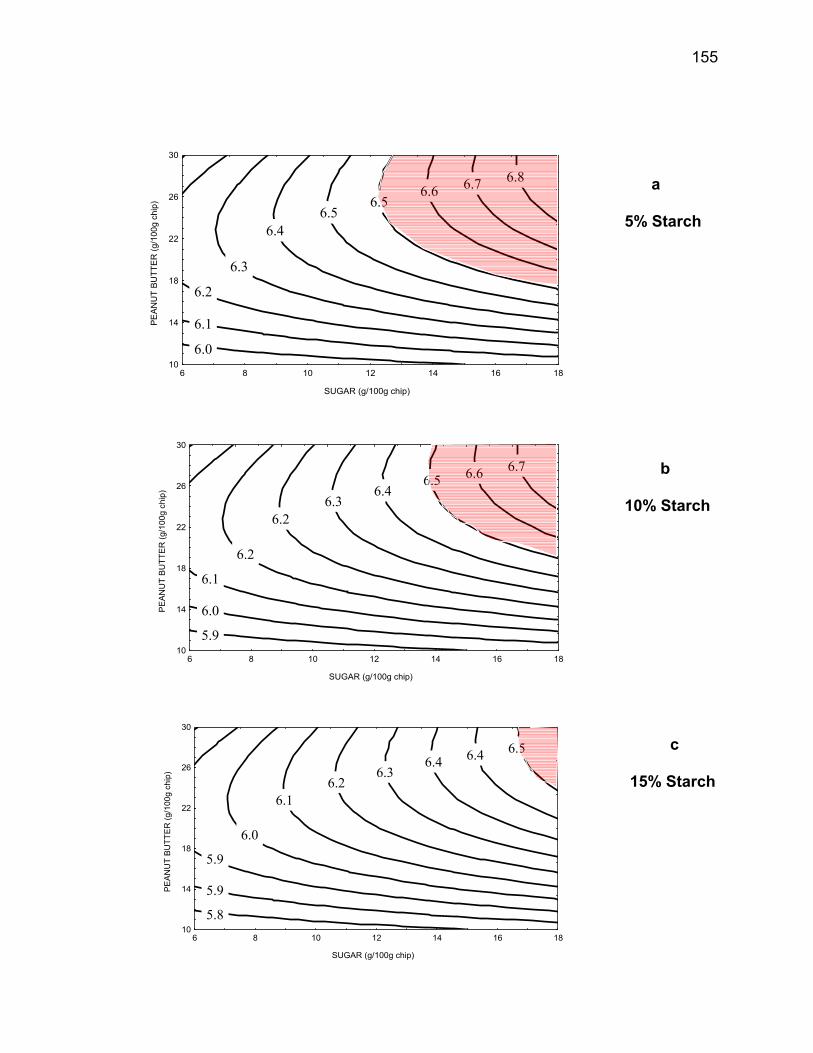
155
SUGAR (g/100g chip)
PEAN
UT
BUTT
ER (g
/100
g ch
ip)
10
14
18
22
26
30
6 8 10 12 14 16 18
6.0
6.1
6.2
6.3
6.46.5
6.56.6 6.7 6.8 a
5% Starch
c 15% Starch
b 10% Starch
SUGAR (g/100g chip)
PEAN
UT
BUTT
ER (g
/100
g ch
ip)
10
14
18
22
26
30
6 8 10 12 14 16 18
5.9
6.0
6.1
6.2
6.26.3
6.46.5 6.6 6.7
SUGAR (g/100g chip)
PEAN
UT
BUTT
ER (g
/100
g ch
ip)
10
14
18
22
26
30
6 8 10 12 14 16 18
5.8
5.9
5.9
6.0
6.16.2
6.36.4 6.4 6.5 c
15% Starch
156
Figure 4.12. Contour plot of taste. Numbers on the lines represent values on a 9-point hedonic scale, with 1 = dislike extremely, 5 = neither like nor dislike, 9 = like extremely. Taste ratings depended on sugar and peanut butter, but were independent from starch.
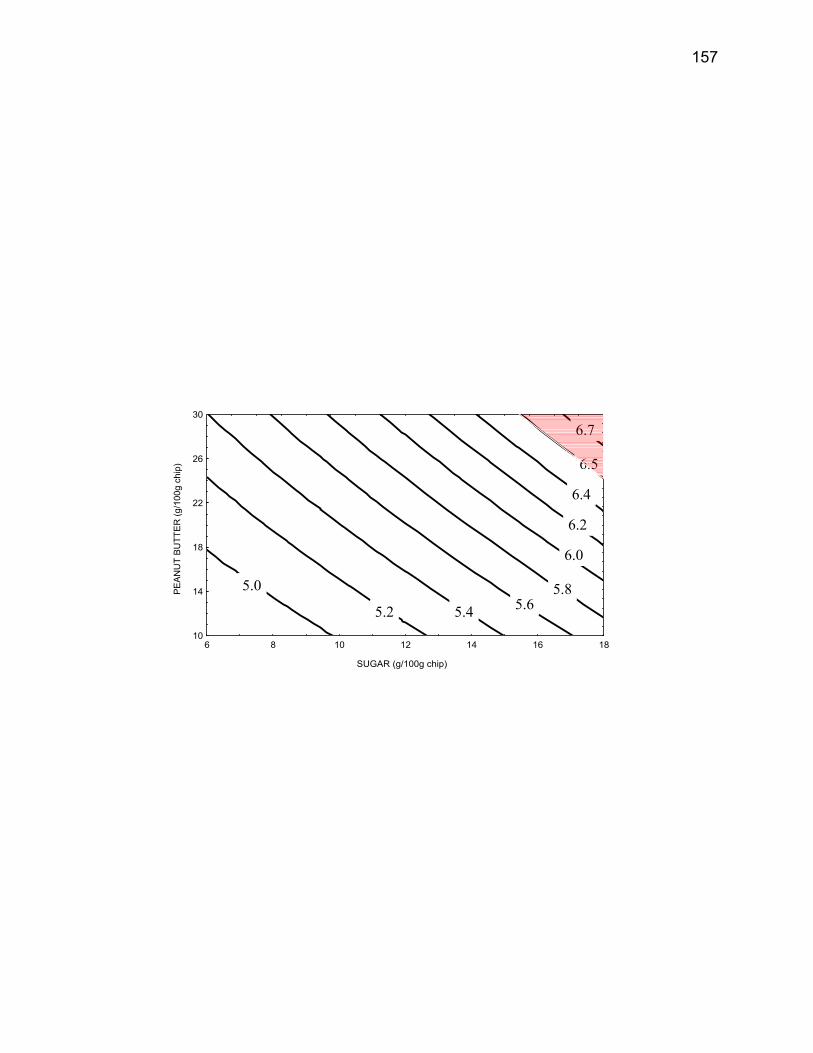
157
SUGAR (g/100g chip)
PEAN
UT
BUTT
ER (g
/100
g ch
ip)
10
14
18
22
26
30
6 8 10 12 14 16 18
5.0
5.2 5.4 5.65.8
6.0
6.2
6.4
6.5
6.7

158
Figure 4.13. Contour plot of sensory hardness, determined on a 5-point hedonic scale (1= very hard; 3= adequate; 5= very soft). Numbers on the axes represent percentages of sucrose and peanut butter (g/100g chip).
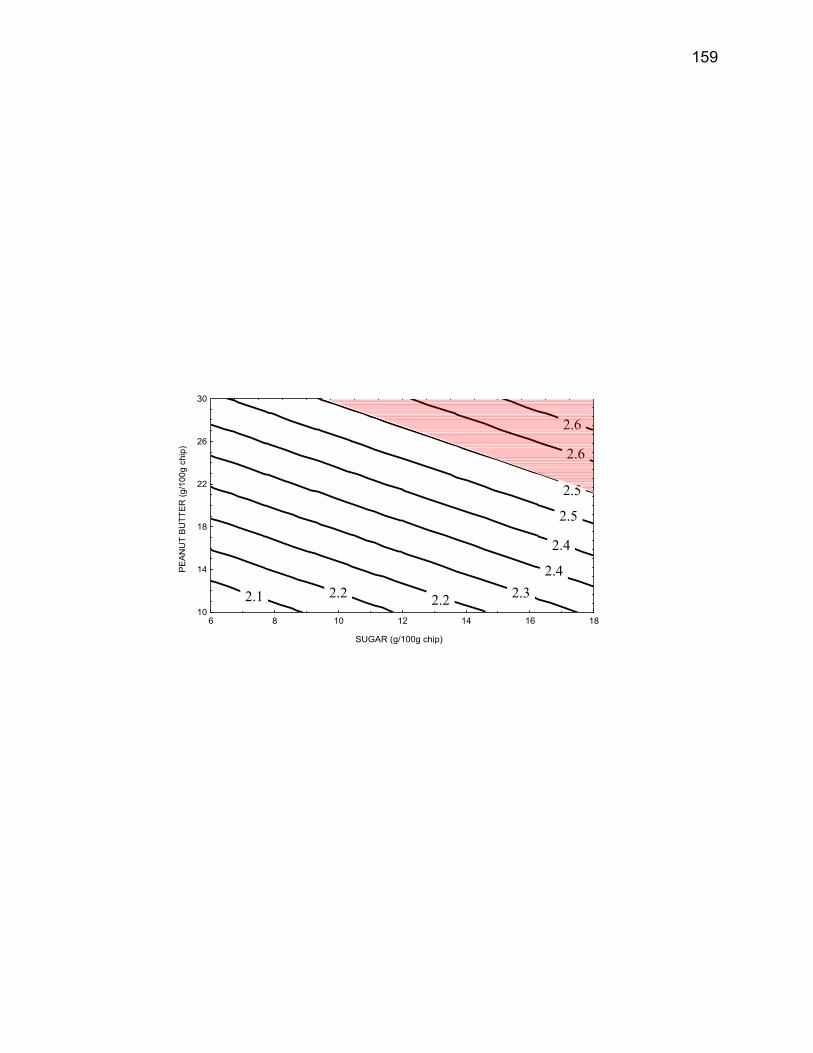
159
SUGAR (g/100g chip)
PEAN
UT
BUTT
ER (g
/100
g ch
ip)
10
14
18
22
26
30
6 8 10 12 14 16 18
2.1 2.2 2.2 2.32.4
2.4
2.5
2.5
2.6
2.6
160
Figure 4.14. Contour plot for overall liking determined on a 9-point hedonic scale. Numbers on the axes represent percentages of sucrose, cornstarch or peanut butter (g/100g chip).
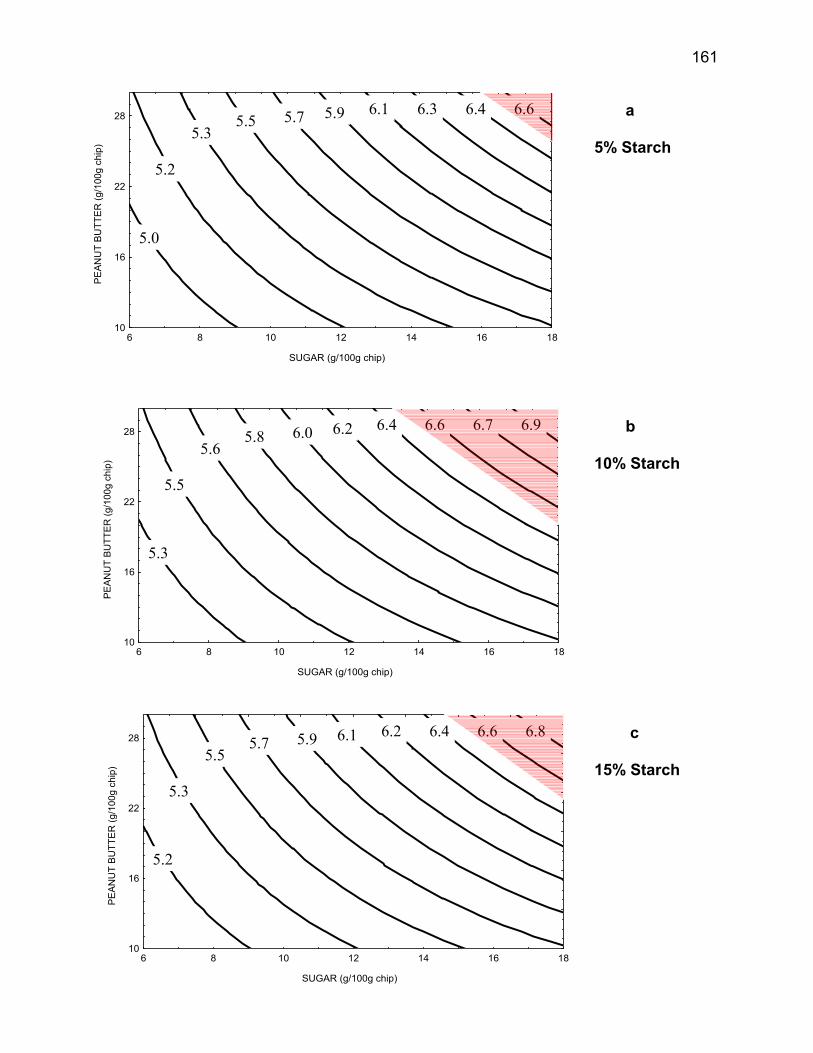
161
a 5% Starch
b 10% Starch
SUGAR (g/100g chip)
PEAN
UT
BUTT
ER (g
/100
g ch
ip)
10
16
22
28
6 8 10 12 14 16 18
5.0
5.2
5.35.5 5.7 5.9 6.1 6.3 6.4 6.6
SUGAR (g/100g chip)
PEAN
UT
BUTT
ER (g
/100
g ch
ip)
10
16
22
28
6 8 10 12 14 16 18
5.3
5.5
5.65.8 6.0 6.2 6.4 6.6 6.7 6.9
SUGAR (g/100g chip)
PEAN
UT
BUTT
ER (g
/100
g ch
ip)
10
16
22
28
6 8 10 12 14 16 18
5.2
5.3
5.55.7 5.9 6.1 6.2 6.4 6.6 6.8 c
15% Starch
162
Figure 4.15. Contour plot of acceptability. The numbers on the plot represent percentages of panelists who considered the chips acceptable.
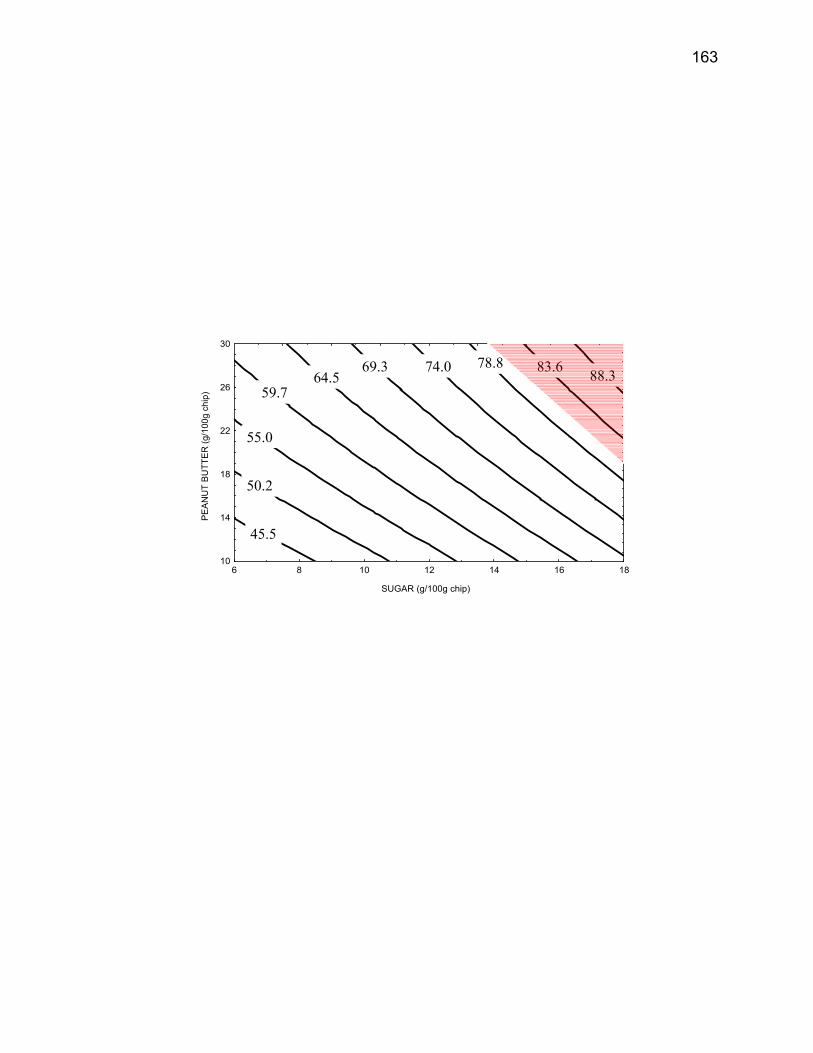
163
SUGAR (g/100g chip)
PEAN
UT
BUTT
ER (g
/100
g ch
ip)
10
14
18
22
26
30
6 8 10 12 14 16 18
45.5
50.2
55.0
59.764.5
69.3 74.0 78.8 83.6 88.3

164
SECTION V
SUMMARY AND CONCLUSIONS
165
The goal of this research was to create a new snack food based on
peanut meal, a secondary product of the peanut oil industry. Chip-type snack
foods are very popular with consumers from all over the world, but especially
from the U.S. However, snacks have been formulated so far mostly with starch
and have been cooked preferentially by deep fat frying. Such snacks have met
with high acceptance from consumers because of their taste, but nonetheless
they have been criticized by nutritionists for being high in calories and low in real
nutrients. Things are changing now. Companies are focusing on producing
foods with less fat and more protein, minerals, fiber and vitamins. Our goal was
to produce a snack based on peanut press cake, the product left after the oil is
extracted from the peanuts by compression. Previous experiments with peanut
flour had resulted in chips with good taste and appearance, but too high in oil
content to meet the interest of consumers.
In a preliminary experiment, we produced peanut chips fortified with corn
or soy flour. This product was very low in fat (5-7%) but a consumer test
determined that the chips were not completely acceptable (rating = 4.9 for
peanut-corn and 4.5 for peanut-soy, on a 9-point hedonic scale). A second study
involved the use of a trained panel. Twelve subjects were trained for a few
weeks before the beginning of the study. During the test they were required to
analyze a series of peanut chips fortified with either soy or wheat. The panel
rated the peanut-soy and the peanut-wheat as very similar. Furthermore, they
rated the texture of the chips as hard and the peanut flavor as low. However, this
experiment showed that the soy flour commercially available did not have the
166
strong raw beany flavor that we had experienced earlier, and peanut-soy chips
were not rated differently from the peanut-wheat product. Therefore, it was
concluded that soy was preferable to wheat as a fortifier in our chips, because of
its content of proteins and isoflavones.
At this point of the study on peanut-soy chip development, the new
product was still rough, far from being ready for the market, the main problem
being that it was hard and had low flavor. Several publications reported how
proteins and fat affect the hardness of starch-based snack foods, baked or fried,
sheeted or extruded. We investigated such interaction among proteins, fat and
carbohydrates (including sucrose) by producing 27 formulations of peanut chips
prepared using 3 different levels of 3 ingredients (sucrose, starch and peanut
butter). A statistical analysis with graphic representation of the data is called
Response Surface Methodology (RSM). Such method allowed us to draw
contour plots and predict the optimum conditions based on the physical and
sensory properties of the chips. The contour plots showed that higher sugar,
higher starch and higher peanut butter resulted in softer, more flavorful and more
acceptable chips than lower levels of these ingredients.
One of the problems still present was the machinability of the chips. In
fact, the peanut dough had proved to be too sticky to go through a sheeter
without the protection of two plastic sheets. The two plastic sheets separated the
dough from the metal roller and made the sheeting process easy and fast.
However, this could not be a viable component of commercial production
because removing the chip-shaped dough from the plastic was difficult and time
167
consuming. A method was devised to eliminate the use of plastic sheets. A
batch of very fluid dough was prepared using a higher quantity of water than
usual. After mixing, the dough was removed from the mixing bowl, laid on a table
and dusted abundantly with soy flour. The dough could be patted to a round ball.
With frequent dusting the dough flattened with a rolling pin, such that it was
possible to pass it through a sheeter two or three times, until it reached the
thickness required for chips. The dough sheet was then removed to a table, cut
into squares, and laid on the oven belt. The chips, baked in the same time and
temperature as usual, appeared and tasted as good as the plastic-sheeted chips.
This proved that a more automated production of peanut chips is possible, and
the peanut-soy flour dough is as workable as the wheat flour dough used to
produce commercial bread.
In summary, press cake from cold pressed peanuts was used successfully
to produce a chip-type snack. The peanut flour was mixed easily with other
flours and resulted in a dough easy to handle and to sheet. The addition of
peanut butter, sugar and starch added softness and flavor to the final product,
and a RSM was very helpful in determining the optimum amount of the three
ingredients to use in order to obtain chips acceptable to consumers. The
technique could be easily expanded to identify the optimum of any other
ingredients in the mixture.
168
Further research
1- Further experiments will be required to improve the
mechanization of the peanut chip making process, especially in
the sheeting and cutting stage.
2- In order to produce and market the peanut chips as “low fat”,
efforts should be made to lower the fat content of the chips below
10%.
3- The texture could be improved further, softening the chips by
addition of ingredients that break the bond between proteins, for
example with emulsifiers or proteases.
4- The flavor could be enriched, adding roasted peanut flavor or
different flavors such as cocoa, already used in confections
together with peanut.