aspects of microbiology, physicochemical and hazard
142
0 ASPECTS OF MICROBIOLOGY, PHYSICOCHEMICAL AND HAZARD ANALYSIS CRITICAL CONTROL POINTS OF “OGIRI” PRODUCTION FROM DIFFERENT SUBSTRATES BY DIMEJESI, SOPHINA AMARACHUKWU REG. NO: 2012487006F DEPARTMENT OF APPLIED MICROBIOLOGY AND BREWING FACULTY OF BIOSCIENCES, NNAMDI AZIKIWE UNIVERSITY AWKA SUPERVISOR: PROF. F.J.C. ODIBO AUGUST, 2016.
-
Upload
khangminh22 -
Category
Documents
-
view
2 -
download
0
Transcript of aspects of microbiology, physicochemical and hazard

0
ASPECTS OF MICROBIOLOGY, PHYSICOCHEMICAL AND HAZARD
ANALYSIS CRITICAL CONTROL POINTS OF “OGIRI” PRODUCTION
FROM DIFFERENT SUBSTRATES
BY
DIMEJESI, SOPHINA AMARACHUKWU
REG. NO: 2012487006F
DEPARTMENT OF APPLIED MICROBIOLOGY AND BREWING
FACULTY OF BIOSCIENCES, NNAMDI AZIKIWE UNIVERSITY
AWKA
SUPERVISOR: PROF. F.J.C. ODIBO
AUGUST, 2016.

1
CHAPTER ONE
1.0 INTRODUCTION
“Ogiri” is an oily paste produced mainly from melon seed and consumed within West
African countries (Odufa, 1981a). Apart from melon seed (Citrullus vulgaris), which is the
regular substrate used for the production of “ogiri”, castor oil seed (Ricinus communis),
climbing melon (Cucumeropsis manni) seeds, and fluted pumpkin (Telfaria occidentalis)
seeds are also used as alternative substrates for the production of “ogiri” (Enujiugha,
2003,and Odibo et al., 1990) The use of alternative substrates for “ogiri” production during
the last three decades is as a result of increase in consumption rate as well as the high prices
of its substrates (Odibo and Ume, 1989). The alarming increase in the demand and prices of
various substrates for “ogiri” production was also reported by David and Aderibigbe, (2010)
and Odibo et al., (2012) which resulted in the use of Cucumeropsis seeds which are relatively
cheaper and unpopular for “ogiri” production used as food condiment. “Ogiri” constitute
major soup condiment in Anambra, Ebonyi, Enugu, Abia and Imo States of Nigeria.The
production of “ogiri” from these seeds is based on fermentation by species of microorganisms
which may be indigenous to the seeds or occur in their production environment (Odufa,
1981,and Dimejesi and Iheukwumere, 2014). The traditional preparation of “ogiri” from
melon seeds is by method of uncontrolled fermentation (Achi, 2005) and this involves both
the raw seeds after which they are dehulled and boiled again to soften the seeds for
fermentation. The softened seeds are wrapped in leaves, kept in sacks and left to ferment at
room temperature for three to five days prior to drying and mashing to a smooth paste, the
“ogiri”. Traditional fermentation of food serves several functions which include enhancement
of diet through development of flavour, aroma and texture in food substances, preservation
and shelf-life extension through lactic acid, alcohol, acetic acid and alkaline fermentation,
enhancement of food quality with protein, amino acids, essential fatty acids and vitamins,
improving digestibility and nutrient viability, detoxification of anti nutrient through food
fermentation processes and a decrease in cooking time and fuel requirement Stein Kraus,
(1995). Dehulling is done manually by local producers and this may introduce a myriad of
organisms into the seed prior to fermentation, some of which may be pathogenic and can
cause spoilage. This development coupled with unhygienic fermentation and operational
environment could result in the production of “ogiri” with variable quality and unacceptable
aroma, short shelf life and one that pose health hazard to the consumers. Various bacterial
and fungal species have been isolated from “ogiri”. Odibo,et al. (2012) isolated Bacillus,

2
Serratia, Pseudomonas, Klebsiella, Staphylococcus, Pediococcus and Lactobacillus. Bacteria
genera which include Bacillus, Leuconostic, Streptococcus, Pediococcus, Micrococcus and
Lactobacillusspecies were isolated by Oluwale and Aderibigbe (2010) from fermenting
Citrullus vulgaris seed for “ogiri” production. Dimejesi and Iheukwumere isolated Erwinia,
Flavobacterium, Micrococcus, Staphylococcus, Bacillus and Shigella species from
fermenting castor oil (Ricinus communis) seeds for “ogiri” production. Microorganisms
found in “ogiri” are not artificially inoculated but found their way into the “ogiri” through
variety of sources which may include air, water used in mixing, leaves used in wrapping, the
handlers as well as utensils and equipment used in the processing (Odiboet al., 2012).
The greatest food borne disease hazard now appears to be pathogenic bacteria
(Marvin et al., 1984) and constitute major public health problems worldwide (Wester et al.,
1998). Most food borne disease incidents are caused by mishandling or mistreatment of foods
in food service in the home, in public and private institutions or in commercial eating
establishments. Food borne disease is an inclusive term for many syndromes typically
gastroenteritis, with sudden onset of vomiting or diarrhea or both with accompanying
abdominal pains. Some episodes include fever, prostration, shock or neurological symptoms.
The principal causes of food borne diseases fall into three categories viz:Metallic or
poisonous chemicals,toxins occurring naturally in plants or animals, and microbiological
agents, viruses bacteria, protozoa, helminthes, molds or their toxins.
Food borne pathogens remain one of the major public health problems worldwide (Nester et
al., 1998). Food borne diseases are endemic in many developing countries and constitute a
major cause of mortality in these areas (Adam and Moses, 2005). Various regulatory agencies
and organizations such as National Canners Association (NCA), Food and Drug Organization
(FDO), Food and Agricultural Organization (FAO), World Health Organization (WHO),
International Organization for Standardization (ISO), which is represented by the Standard
Organization of Nigeria (SON) and National Agency for Food and Drug Administration and
Control (NAFDAC) have been set up to monitor the standards of food. Many producers
especially the local producers are virtually ignorant to the compliance of these regulatory
bodies as a total quality management tool(Enyinnaya, 2013). The twentieth session of Codex
Alimentarus Commission held in Geneva from 28 June to 7 July, 1993 recognized the
importance of Hazard Analysis Critical Control Point (HACCP) and adopted guidelines for
establishment of HACCP system (ALI NORM 93/13A, Appendix II). These regulatory
bodies ensure food safety compliances in food production (Firman and Yapp, 2008, and
Henson and Headsmen, 1998).

3
Hazard Analysis Critical Control Point (HACCP) is a systematic approach to ensure
food safety by U.S. National Advisory Committee on Microbiological Criteria for Foods
(Enyinnaya, 2013.) HACCP has become synonymous with food safety. It is a worldwide
recognized systematic and preventive approach that addresses biological, chemical and
physical hazards through anticipation and prevention rather than through end product
inspection and testing (Omotongun, 2016). Critical Control Points (CCPs) are located at any
step of production process where these hazards can either be prevented, eliminated or reduced
to acceptable levels. Examples of control points include thermal processing, chilling, testing
ingredients for chemical residues, product formulation control and testing products for metal
and biological contaminants.
Public health and food authorities worldwide have promoted the concept of HACCP
for providing safe and healthy foods. HACCP is being implemented with some degree of
success in large and medium-size food industries. However, much progress has not been
made in small businesses where food safety problems are particularly important and better
control of the risk is needed (Cadmus et al, 2013). The safety and quality of foods
domestically produced can be therefore critical since the products also find their way into the
open market for sale.
HACCP is achieved through the application of HACCP principles which
include:Assembly of HACCP team, Product description, Identification of the intended use of
product, Construction of flow diagram, On-site verification of flow diagram, Listing all the
potential hazards in each step and conduction of hazards analysis, Determination of Critical
Control Points,Establishment of critical limits for each CCP, Establishment of monitoring
system for each CCP, Establishment of corrective actions.
HAACP is very advantageous as far as food safety is concerned because of the following:
1. It is science based and systematic, identifies specific hazards and measures for their
control to ensure food safety and reduces the reliance on end product inspection and
testing.
2. It enhances the responsibility and degree of control at the level of the food industry.
3. It aids inspection by food control regulatory authorities and promotes international
trade by increasing buyers‟ confidence.
Various studies have been documented on “ogiri” viz: Some biochemical and natural changes
during fermentation of fluted pumpkin seeds (Achiwehu, 1986a and 1986b; Odibo and Umeh,
1989), castor oil seeds (Anosike and Egwuatu, 1981), microbiology, enzymatic activities and
amino acid composition of “ogiri”, (Odibo and Umeh, 1989; Odibo et al, 2008; Falgan, 2012;

4
Dimejesi and Iheukwumere, 2014) to mention but a few. However, to the best of my
knowledge there has not been any work documented on the Hazard Analysis Critical Control
Point on production of “ogiri” from different substrates.
1.1 Statement of the Problems
1. Many potential pathogenic bacterial species have been recovered from “ogiri”
samples. Though used as food condiment in cooking, it is expected that the heating
will destroy the microorganisms and also the heat-labile toxins elaborated in “ogiri”.
However, “ogiri” is also used in preparing cold ready-to-eat foods and as such
portends great danger to those who relish such ready-to-eat foods.
2. Considering the production of “ogiri” and its unhygienic nature as carried out by the
traditional producers or village entrepreneurs, there is every need to employ a
management system in which food is addressed through the analysis and control of
biological, chemical and physical hazards from raw material production, procurement
and handling, to manufacturing/production process, distribution and consumption of
the finished product.
1.2 Aim of Study
To establish the Hazard Analysis Critical Control Point of “ogiri” produced from
creeping melon, fluted pumpkin, climbing melon and castor oil seeds.
1.3 Specific Objectives
The specific objectives in this study include the following:
1. To determine the prevalent organism(s) in each process step.
2. To determine the potential hazards both biological and non-biological.
3. To analyze the constituents of “ogiri” produced from creeping melon seeds (Citrullus
vulgaris), castor oil seed (Ricinus communis), fluted pumpkin seeds (Telfairia
occidentalis) and climbing melon (Cucumeropsis manii).
4. To device control measures of the hazards.
5. To ensure quality and safety of product through proper handling.

5
1.4 Justification for the Study
The unhygienic process condition of “ogiri” results in the production of “ogiri” of
variable quality in aroma, flavour, shelf life and may pose health hazard to the consumers. It
is therefore necessary to establish a Hazard Analysis Critical Control Points (HACCP) of
“ogiri” production in order to address food safety problems.

6
CHAPTER TWO
2.0 LITERATURE REVIEW
2.1 Food Condiments
Food condiments are those edible items used in smaller quantities to give flavour or
relish to the main food. Food condiments are never the main meal but are like additives added
in smaller quantity to food /meal for special purpose or function (Nzelu, 2010). Food that are
used for condiments production are numerous and varied. Three decades ago, the major soup
condiments for flavour improvement in many parts of Nigeria were “Ogiri” “Okpeghe” and
dawa-dawa, Ukpaka or Ugba.Others like pepper, spicy leaves and onions were also used to
enhance flavor but these were dominated by the “Ogiri” and dawa-dawa. Fermented food
condiments produced mainly from leguminous oil seeds are shown in Fig 2.1
Production of “Ogiri” through the fermentation of these leguminous oil seed gives it
the characteristic flavour which enhances the taste of Nigerian traditional soups and sauces
used as accomplishments to indigenous starchy root tuber diets.
2.2 Processing and production of Ogiri
The major raw materials for the production of “Ogiri” are castor oil seeds (Ricinus
communis) and melon seeds(Citrillus vulgaris).
During the last three decades, the consumption of Ogiri as well as the prices of its various
substrates has increased. In Nigeria, alternative substrate, fluted pumpkin (Telfairia
occidentalis)seed are used for the production of “Ogiri” (Odibo and Umeh, 1989). As a result
of the ever-growing increase in the demand and prices of various substrates for the
production of “Ogiri”, David and Aderibigbe (2010) and Odibo et al(2012) used
Cucumeropsis(climbing melon) seeds which are relatively cheaper and unpopular seeds for
the production of “Ogiri”. Also, (Akinyeleet al., 2013) reported the microbiological,
physiochemical and anti-nutritional properties of melon seeds. Barber and Achiwehu (1988)
used castor oil seed for “ogiri” production.
In addition, soyabeans (Glycine max) has recently emerged as new raw material for the
production of “Ogiri‟. Figure 2.1 shows the production process of “Ogiri” using different
substrates

7
DehullDehull Dehull
Wrap
(optional)
B o i l
3 - 6 h o u r s
Boil to dehull (1hr) Soak (6-8 hrs)
Melon seedsSoya beans Fluted Pumkin
Castor oil seeds Cuc um erop sis
seed
Ferment
Grind to small
particles
Wrap / package
WrapWrap Wrap Wrap
Use or Store
Figure 2.1: The processing steps for the production of “Ogiri” from different substrates
source (Nzelu, 2010)
8
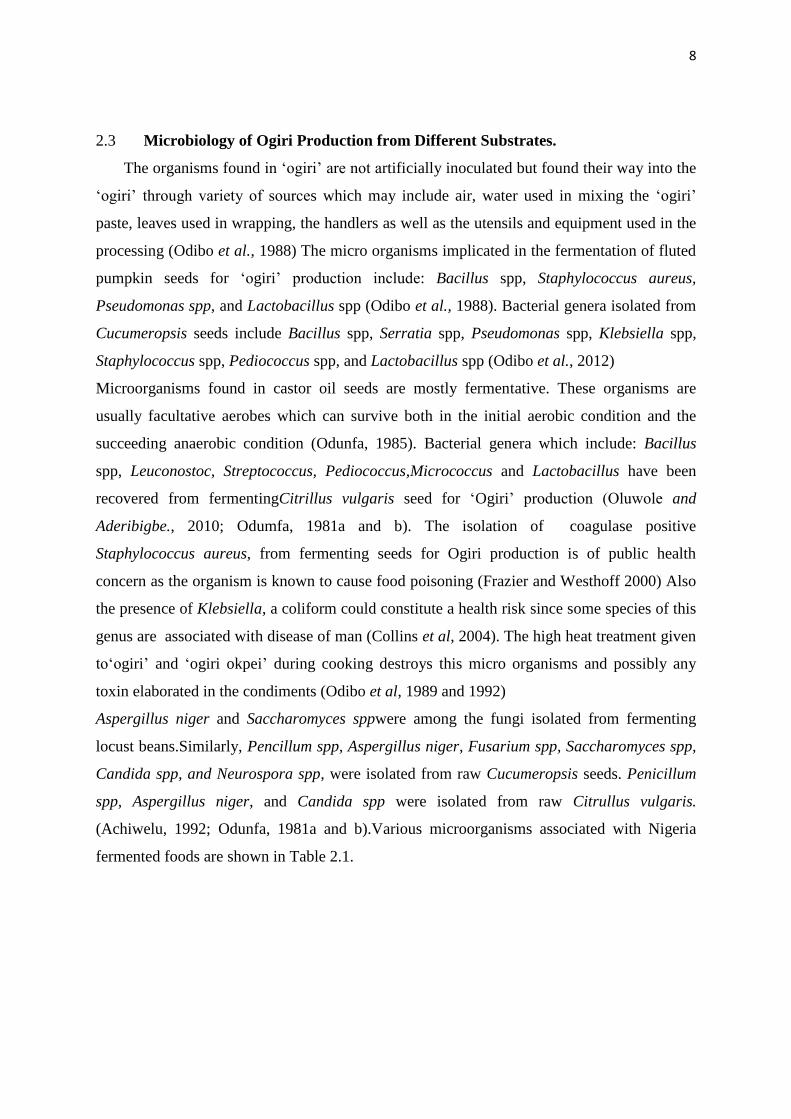
2.3 Microbiology of Ogiri Production from Different Substrates.
The organisms found in „ogiri‟ are not artificially inoculated but found their way into the
„ogiri‟ through variety of sources which may include air, water used in mixing the „ogiri‟
paste, leaves used in wrapping, the handlers as well as the utensils and equipment used in the
processing (Odibo et al., 1988) The micro organisms implicated in the fermentation of fluted
pumpkin seeds for „ogiri‟ production include: Bacillus spp, Staphylococcus aureus,
Pseudomonas spp, and Lactobacillus spp (Odibo et al., 1988). Bacterial genera isolated from
Cucumeropsis seeds include Bacillus spp, Serratia spp, Pseudomonas spp, Klebsiella spp,
Staphylococcus spp, Pediococcus spp, and Lactobacillus spp (Odibo et al., 2012)
Microorganisms found in castor oil seeds are mostly fermentative. These organisms are
usually facultative aerobes which can survive both in the initial aerobic condition and the
succeeding anaerobic condition (Odunfa, 1985). Bacterial genera which include: Bacillus
spp, Leuconostoc, Streptococcus, Pediococcus,Micrococcus and Lactobacillus have been
recovered from fermentingCitrillus vulgaris seed for „Ogiri‟ production (Oluwole and
Aderibigbe., 2010; Odumfa, 1981a and b). The isolation of coagulase positive
Staphylococcus aureus, from fermenting seeds for Ogiri production is of public health
concern as the organism is known to cause food poisoning (Frazier and Westhoff 2000) Also
the presence of Klebsiella, a coliform could constitute a health risk since some species of this
genus are associated with disease of man (Collins et al, 2004). The high heat treatment given
to„ogiri‟ and „ogiri okpei‟ during cooking destroys this micro organisms and possibly any
toxin elaborated in the condiments (Odibo et al, 1989 and 1992)
Aspergillus niger and Saccharomyces sppwere among the fungi isolated from fermenting
locust beans.Similarly, Pencillum spp, Aspergillus niger, Fusarium spp, Saccharomyces spp,
Candida spp, and Neurospora spp, were isolated from raw Cucumeropsis seeds. Penicillum
spp, Aspergillus niger, and Candida spp were isolated from raw Citrullus vulgaris.
(Achiwelu, 1992; Odunfa, 1981a and b).Various microorganisms associated with Nigeria
fermented foods are shown in Table 2.1.

9
Table 2.1 Microorganisms associated with Nigerian fermented foods condiments
SUBSTRATE MICROORGANISM PRODUCT
African locust
beans
parkiafilicoida
Bacillus spp. Pseudomonas spp. Micrococcus
spp., Streptococcus
Iru
Castor seed Ricinus
communis
Fluted pumpkin
seeds Telferia
ocidentalis
Bacillus spp., E. coil, Staphylococcus spp.,
Pseudomonas Bacillus subtilis Staphylococcus
spp., Micrococcus spp Corynebacterium spp.
B. subtilis, B. licheniformis
B. megateruim Straphylococcus epidermidis,
Micrococcus spp.
Ogiri-igbo
Ogiri-ugu
African oil beans
Pentaclethra
macrophylla
Bacillus subtilis, B. licheniformis,
B. pumilis, Staphylococcus spp.
Okphehe
African yam beans
Stenophylis
Stenocarpa
Saccharomyces cerevisiae, Lactobacillus
spp.,Fusarium spp
Ogiri-egusi
Source: David and Aderingbe (2010)

10
2.4 Traditional Food Fermentation
Fermentation is one of the oldest and most important food processing and preservation
techniques. Food fermentation involves the use of microorganisms and enzymes for the
production of food with distinct quality attributes that are quite different from the original
agricultural raw material (Awoh, 2008).
Most of the cyanide in cassava tubers is eliminated by fermentation and subsequently during
pressing and frying to produce garri. During fermentation, endogenous linamarase present in
cassava roots hydrolyze linamarin and lotaustralin releasing hydrogen cynide (HCN).
Crushing exposes the cyanogens which are located in the cell vacuole to the enzyme which is
located on the outer cell membrane, facilitating their hydrolysis. Apart from garri, thereis a
vast array of traditional fermented food produced in Nigeria and other west- African
countries as shown in Table 2.2. These include staple foods such as fufu, lafun and ogi,
condiments such as „Iru‟(dawadawa, ogiri and ugba(ukpaka), Alcoholic beverage such as
“burukutu”, pito and fermented milk and cheese are also produced.
The fermentation process of these products constitute a vital body of indigenous
knowledge used for food preservation acquired by observations and experience, and passed
on from generation to generation.
Apart from increasing the shelf life and reduction in anti-nutritional factors,
fermentation markedly improves digestibility, nutritive value and flavour of the raw materials
(Katz, 2003).
Microbial growth, either of natural or inoculated populations, causes chemical and/or
textural changes to form a product that can be stored for extended periods.Therefore
fermentation process also is used to create new, pleasing food flavours and odour (Prescott,
2008).
Detoxification of mycotoxins in foods through Lactic acid bacterial (LAB) fermentation
has been demonstrated over the years (Biernasiak et al, 2006) and has been successfully used
to detoxify cassava toxins (cyanogens) following the fermentation of cassava food.
Fermented maize (Ogi), a staple cereal and a popular weaning food in most rural
communities in Nigeria, have been reported to have 50% reduction in aflatoxin B1 after 72
hours of fermentation (Oluwafemi and Ikeokwu, 2015)
2.5 Food Borne Illness
The greatest food-borne disease hazard now appears to be pathogenic bacteria.
Although the available statistics are deficient in showing the real incidence of food-borne

11
illness, they are useful in determining trends and do reflect certain points of interest regarding
etiologic agents and their epidemiology (Marvin,, 1984) According to Marvin et al(1984), the
statistics and other accumulating evidence indicate that most food-borne disease incidents are
caused by mishandling or mistreatment of foods in food service in the home, in public, and in
private institution or in commercial eating establishments. These data indicates that many
people are either careless or uninformed about microbiological hazards of food preparation
and handling.
Food-borne disease is an inclusive term for many syndromes. Acute gastroenteritic
with sudden onset of vomiting or diarrhea or both, with accompanying abdominal pain is
typical. Some episodes includes fever, prostration, shock or neurological symptoms. The
incubation period (the time between eating and the onset of first symptom), the type and
duration of symptoms vary depending on the etiological agent, the infected individuals
genetic predisposition and physical condition, and mediation taken (Marvin, 1984).
The principal cause of food-borne diseases falls into three categories:
1. Metallic or poisonous chemicals
2. Toxins occurring naturally in plants or animals.
3. Microbiological agents, viruses, bacteria, protozoa, helminthes, molds or their toxins.
Food-borne outbreaks caused by chemicals are relatively uncommon metallic poisonings
which can occur when high acid foods, as fruit juices and carbonated beverages are stored in,
or allowed to flow through metal- containing (copper or cadmium) or metal-coated (zinc,
antimony or lead) vessels or pipelines. Other chemical poisoning occur because workers in
advertently mistake poisons such as sodium, fluoride or other pesticides for food stuff or
condiments, add excessive amounts of flavour intensifier, monosodium glutamate, curing or
colour intensifying agents nitrites or preservatives, benzoic acid, to food or in advertently
contaminate food when applying pesticides (Marvin, 1984).
Bacterial contamination of food is the most frequent cause of food-borne disease,
Many bacterial pathogens, Salmonella spp, Shigella spp and some enteropathogenic strains of
Escherichia coli that are conveyed by food invade the intestinal mucosa and cause true
infections, others release enterotoxins during growth or lysis (Vibriocholerae some
enteropathogenic E. coli) or during sporulation (Clostridium pertringens) in the gut. Other
bacteria such as Clostridium botulinum and Staphylococcus aureus produce toxin as they
proliferate within a food and when the food is eaten, causes an intoxication. Gram positive
bacteria may also adhere to the intestinal mucosa and cause diarrhea, Stayphylococcus

12
aureus, Clostridium pertrimgens and Bacillus cereus have been shown to produce chronic
diarrhea by attachment to and colonization of human intestinal mocusa (Marvin, 1984).
Outbreak of hepatitis-A have been traced to several kinds of foods particularly shell-
fish (Marvin, 1984). Many food-borne diseases are of unknown etiology. Microbiological
studies and epidemiological investigations have established common sources, reservoirs and
vehicles of food-borne pathogens.
The diversity of food products and food processing operations affect the number and
types of microorganism that may be introduced into food, where they can survive or grow.
The following six categories of food-borne disease are listed in Table 2.4:
1. Upper gastro intestinal tract symptoms (nausea, vomiting) occur first or predominate.
2. Lower gastro intestinal tract symptoms (abdominal cramps, diarrhea) occur first or
predominate.
3. Sore throat and respiratory tract symptoms
4. Neutrological symptoms (visual, disturbances, vertigo, tingling, paralysis)
5. Allergic symptoms (facial flushing, itching)
6. General infection symptoms (fever, chills, malaise, prostration, aches swollen lymph
nodes).

13
Table 2.2: Guide for Laboratory Test Indicated by Certain Symptoms and Incubation
Periods
Incubation
periods
Redominant symptoms Specimen to
analyze
Organism, toxin or toxic
substances
Less than
1hour
Nausea, vomiting, unusual taste,
burning of mouth
Vomitus, urine,
blood, stool
Metallic chemicals
1-2 hour Nausea, vomiting, cyanosis,
headache, dizziness, dyspriea,
trembling, weakness, loss of
consciousness.
Blood Nitrites
1-6hr, mean 2-
4 hr
Nausea, vomiting, retching,
diarrhea, abdominal pain,
prostration
Vomitus, stool Staphylococcus aureus and
its enterotoxins
8-16hr, (2-4 hr
rarely)
Vomiting, diarrhea, abdominal
cramps, nausea
Vomitus, stool Bacillus cereus
6-24 hr Nausea, Vomiting, diarrhea, thirst,
dilation of pupils, collapse, coma
sore throat and respiratory
symptoms
Urine, blood Amanita mushroomsc
12-72 hr Sore throat, fever, nausea,
vomiting, rhinorrhea, sometimes a
rash
Throat swab Streptococcus
2-5 days Inflamed throat and nose, spreading
grayish exudates, fever, chills, sore
throat, malaise, difficulty in
swallowing, edema of cervical
lymph node
Throat swab,
blood
Corynebacterium,
diphtheria
Lower gastrointestinal tract symptoms (abdominal cramps diarrhea) occur first or predominate
8-22 hr, mean
10-12 hr
Abdominal cramps, diarrhea,
putrefactive, diarrhea associated
with C. perfringens
Stool Clostridium perfringens, Bacillus
cereus, Streptococcus faecalis, S.
faecium
12-72 hr,
mean 18-36 hr
Abdominal cramps, diarrhea,
Fever, chills, malaise
Stool Salmonella (including S. arizonae),
Shigella, Enteropathogenic
Escherichia coli, other
enterobacteriaceae, Yersinia
enterocolitica, Pseudomonas
aeruginosa, Aeromonas hydrophila,
Plesiomonas
shigelloides,Campylobacter jejuni,
Vibrio cholerae (01 and non-01), V.
parahaemolyticus.
3 – 5 days diarrhea, Fever, vomiting,
abdominal pain, respiratory
symptoms
Stool Enteric viruses
1 – 6 weeks Mucoid diarrhea (fatty stools),
abdominal pain, weight loss
Stool Giardia lambila
1 to several
weeks, means
3 – 4 weeks
Abdominal pain, diarrhea,
constipation, headache,
drowsiness, ulcers, variable –
Stool Entamoeba histolytica

14
Neurological symptoms (visual disturbances, vertigo, tingling, paralysis)
Less than 1
hr.
Tingling, and numbness,
giddiness, staggering,
drowsiness, tightness of throat,
incoherent speech, respiratory
paralysis.
Shellfish toxin3.5
Gastroenteritis, nervousness,
blurred vision, chest pain,
cyanosis, twitching,
convulsion.
Blood, urine,
fat biopsy
Organic phosphate insecticides 5.6
Excessive salivation,
perspiration, gastroenteritis
irregular pulse, pupils
constricted, asthmatic
breathing.
Urine Muscaria-type mushrooms7
1 – 6 hr. Tingling, and numbness,
gastroenteritis, dizziness, dry
mouth, muscular aches, dilated
eyes, blurred vision, paralysis,
weakness, nausea, vomiting,
tingling, loss of weight,
confusion.
Blood, urine,
stool, gastric
washing
Ciguatera toxin chlorinate
hydrocarbons (insecticides)
12 – 72 hr Vertigo, double or blurred
vision, loss of reflex to light,
difficult in swallowing,
speaking and breathing, dry
mouth, weakness, respiratory
paralysis.
Blood, stool. Clostridium botulinum and its
neurotoxins
More than 72
hr.
Numbness. weakness of legs,
plastic paralysis, impairment
of vision, blindness, coma,
Urine, blood,
stool, hair
Organic mercury5
Gastroenteritis leg pain,
ungainly high stepping gait,
foot and wrist drop.
Triorthocresyl phosphate5
Allergic symptoms (facial flushing, itching)
Less than 1 hr Headache, dizziness, nausea,
vomiting, peppery taste,
burning of throat, facial
swelling and flushing, stomach
Vomitus Histamine
often asymptomatic.
3 – 6 months Nervousness, insomnia, hunger
pains, anorexia, weight loss,
abdominal pain, sometimes
gastroenteritis
Stool Taenia saginata, T. solium

15
pain, itching of skin.
Numbness around mouth,
tingling sensation, flushing,
dizziness, headache, nausea,
Monosodium glutamate (Chinese
restaurant syndrome)
Flushing, sensation of warmth,
itching, abdominal pain, blood,
puffing of face and knees.
Nicotinic acid5
Generalized infection symptoms (fever, chills, malaise, prostration, aches, swollen lymph nodes
4 to 28 days,
mean 9 days
Gastroenteritis, fever, edema
about eyes, perspiration,
muscular pain, chills,
prostration, labored breathing.
Muscle biopsy Trichinella spiralis
7 – 28 days,
mean 14 days
Malaise, headache, fever,
cough, nausea, vomiting,
constipation, abdominal pain,
chills, rose, bloody stools
Stool, Blood Salmonella typhi
10 – 13 days Fever, headache, myalga, rash Lymph node
biopsy blood
Toxoplasma gondii
10 – 50 days,
means 25 - 30
days
Fever, Malaise, lassitude,
anorexia, nausea, abdominal
pain jaundice
Urine, blood Etiological agent not yet isolated,
probably viral
Varying periods
(depends on
specific illness)
Prostration, Malaise, swollen
lymph nodes, and other
specific symptoms of disease
in question (for more
information on rarer disease
see reference 2).
Blood, Stool,
Urine, sputum,
Lymph node,
gastric
washings (one
of more,
depending on
organism)
Bacillus anthracis, Brucella
melitensis, B. abortus, B. suis,
Coxiella burnetii, Francisella
tularensis, Listeria
monocytogenes, Mycobacterium
tuberculosis, Mycobacterium spp,
Pasteurella multocida,
Streptobacillus moniliformis,
Campylobacter jejuni.
Source: Marvin, 1984

16
2.6 Importance of Food fermentation
The primary benefit of fermentation is the conversion of sugars and other carbohydrates to
usable end products. According to Steinkraus (1995), the traditional fermentation of foods
serves several functions, which includes: enhancement of diet through development of
flavour, aroma, and texture in food substrates, preservation and shelf-life extension through
lactic acid, alcohol, acetic acid and alkaline fermentation, enhancement of food quality with
protein, essential amino acids, essential fatty acids and vitamins, improving digestibility and
nutrient viability, detoxification of anti-nutrient through food fermentation processes, and a
decrease in cooking time and fuel requirement.
2.6.1 Nutritional Benefits
Fermentation can produce important nutrients or eliminate anti-nutrients. Food can be
preserved by fermentation, since fermentation uses up food energy and creates conditions
unsuitable for spoilage microorganisms. For instance, in pickling, the acid produced by the
dominant organism inhibits the growth of all other microorganisms (Katz, 2003)
Fermenting makes foods more edible by changing chemical compounds, or
predigesting, the foods for use. There are extreme examples of poisonous plants like cassava
that are converted to edible products by fermenting. Some coffee beans are hulled by a wet
fermenting process, as opposed to a dry process (Battcock and Aza-Ali, 1998).
Reduction in anti-nutritional and toxic components in plant foods by fermentation was
observed in a research which showed “Cereals, legumes, and tubers that are used for the
production of fermented foods may contain significant amounts of antinutritional or toxic
components such as phytates, tannins, cyanogenic glycosides, oxalates, saponins, lectins, and
inhibitors of enzymes such as alpha-amylase, trypsin, and chymotrypsin. These substances
reduce the nutritional value of foods by interfering with the mineral bioavailability and
digestibility of proteins and carbohydrates. In natural or pure mixded-culture fermentations of
plant foods by yeasts, molds, and bacteria, antinutritional components (e.g phytate in whole
wheat breads) can be reduced by up to 50%‟ toxic components, such as lectins in tempe and
other fermented foods made from beans, can be reduced up to 95%. (Larsson and Sandberg,
1991).
Fermentation increases nutritional values of foods, and allows us to live healthier
lives. Here are a few examples:
1. The sprouting of grains, seeds, and nuts, multiplies the amino acid, vitamin, and
mineral content and antioxidant qualities of the starting product.

17
2. Fermented beans are easier for the bodies to digest, like the proteins found in soy
beans that are nearly indigestible until fermented (Katz, 2003).
3. Fermented dairy products, like, cheese, yogurt, and kefir, can be consumed by those
not able to digest the raw milk, and aid the digestion and well-being for those with
lactose intolerance and autism.
4. Porridge made from grains allowed to ferment increases the nutritional values so
much that it reduces the risk of disease in children.
5. Probotic supplements (beneficial bacterial cultures for microbial balance in the body)
are capable of fighting cancer and other diseases.
6. Vinegar is used to leach out certain flavours and compounds from plant materials to
make healthy and tasty additions to the meals.
2.6.2. Health Benefits
Fermented food, enjoyed across the globe, conveys health benefits through lactic acid
fermentation. The fermentation process can transform the flavour of food from the plain and
mundane to a mouth-puckering sourness enlivened by colonies of beneficial bacteria and
enhanced micronutrients.
Studies have revealed that Lactobacillus rhamnosus and L. reuteri which are common
organisms in Nigerian fermented foods like ogi and kununzaki could colonize the vagina, kill
viruses, and reduce the risk of infections including bacterial vaginosis (Reid et al., 2010). The
therapeutic effects of Lactic Acid Bacteria (LAB) and ogi, including their immunostimulatory
effect, are due primarily to changes in the gastrointestinal microflora to suppress the growth
of pathogens. Increase in population of LAB in the intestine or vagina reduces the cause of
bacterial vaginosis, which is a major risks factor for the contraction of HIV (Reid, 2002a). It
also reduces the occurrence of gonorrhoea, Chlamydia, and other sexually transmitted
diseases (Reid et al, 2001b) and diarrhea (Adebolu et al, 2007).
All lactic acid producing bacteria (E. glactobacillus acidophilus, L. bulgaricus, L.
plantarum, L. caret, L. Pentoaceticus, L. brevis and L. themophilus) produce high acidity
during fermentation. The lactic acid they produce is effective in inhibiting the growth of other
bacteria that may decompose or spoil the food. Despite their complexity, the whole basis of
lactic acid fermentation centres on the ability of lactic acid bacteria to produce acid, which
then inhibits the growth of other undesirable organisms. Other compounds are important as
they improve particular tastes and aromas to the final products. The L. mesenteroides initiates
growth in vegetables more rapidly over a range of temperatures and salt concentrations than

18
any other lactic acid bacteria. It produces carbon dioxide and acids which rapidly lower the
pH and inhibit the development of undesirable micro organisms.
Over 200 species of bacteria live in gut of humans. These microbes help break down
food in the intestines, aid in the digestion process, help fight off disease, and boost the
immune system. If we eat nothing but overly processed and hard to digest foods, then the
fermentation process occur within the GIT resulting into gas, bloating, diarrhea, and
constipation might possibly lead to other diseases like cancer. However, providing the body
with predigested foods such as fermented foods will help the existing microbes within to do
the job they need to do.
Fermentation is not only a way to preserve certain foods, in some cases it actually
adds to the nutrient value of it. Fermented vegetables contain more vitamin C and fermented
milk products have ample amounts of B vitamins. The bioavailability of these vitamins also
increases with fermentation. Probiotics, or “good bacteria” are also formed through the
process of fermentation. Fermented soy products contain more vitamin B12 (Chung et al,
2010).
The desirable bacteria cause less deterioration of the food by inhibiting the growth of
the spoiling types of bacteria. Some fermenting processes lower the pH of foods preventing
harmful microorganisms to live with too acidic an environment. Controlled fermentation
processes encourage the growth of good bacteria which starves, or fights off, the bad
microbes.
The fermentation process can be stopped by other means of preserving, such as,
canning (heating), drying, or freezing. Heat (Pasteurization, 630C), and low temperatures
(freezing, 00C or below) stops the fermenting process by slowing, or killing, the preferred
microorganisms, and other bacteria. A few undesirable bacteria are not killed by either
means, and continue to grow. When the beneficial bacteria are gone, the unfavorable bacteria
take over, growing exponentially! This causes rotting, disease, illness, and inedible foods.
When the goods gups are present and happy, the food remains edible.
Phytates (phytic acid) are the storage form of phosphorus [a mineral] bound to
inositol (a B vitamin) in foods high in fiber (all plant foods), and particularly the fiber of raw
whole grains, legumes, seeds, and nuts. Although these foods have high phosphorus content,
the phosphates in phytates are not released by human digestion. Phytates, particularly in such
raw foods as bran, are a concern because they can bind a portion of the iron, zinc, and
calcium in foods, making the minerals unavailable for absorption. When bread is leavened
(fermented) by yeast, enzymes degrade phytic acid, and phytates pose no problem. Enzymes,

19
called phytases, destroy phytates during fermentation processes such as: the yeast-raising of
dough, Even a small amount of phytates in food can reduce iron absorption by half (by 50%),
but the effect is less marked if a meal is supplemented with ascorbic acid (Vitamin C) which
also helps the absorption of zinc and calcium.
Fermented food, enjoyed across the globe, conveys health benefits through lactic acid
fermentation. The fermentation process can transform the flavour of food from the plain and
mundane to a mouth-puckering sourness enlivened by colonies of beneficial bacteria and
enhanced micronutrients. While fermented food like yogurt, sauerkraut and kefir are well-
known many other lesser-known foods also benefit from the lactic acid fermentation process.
Indeed, virtually every food with a complex or simple sugar content can be successfully
fermented (Katz, 2003).
Born of both necessity and practicality, lactic acid fermentation proved to be not only
an efficient method of preserving food for our ancestors, but also a critical one. Indeed,
fermented food like sauerkraut, cheese, wine, kvass, soured grain porridge and breads often
sustained tribes and villages during harsh winters when fresh foods were not available let
alone plentiful.
2.6.3 Detoxification
The removal of anti-nutrient from the Nigerian fermented foods is an important step in
ensuring that the fermented food is safe to eat. Many fermentation foods contain naturally
occurring toxins and anti-nutritional compounds. These can be removed or detoxified by the
action of micro-organisms during fermentation for instance, the fermentation process that
produces the Sudanese product, kawal, removes the toxins from the leaves of Cassia
obtusitfolia and fermentation is an important step in ensuring that the fermentated foods are
safe to eat.
2.6.4 Mycotoxin Detoxification
Foods and feeds are often contaminated with a number of toxins either naturally or through
infestation by microorganisms such as moulds, bacteria and virus. Certain moulds often
produce secondary toxic metabolites called mycotoxins. These include fumonisins,
ochratoxins A, zearalenone and aflatoxins (Katz, 2003). Several methods are available for
degrading toxins from contaminated food,for example, alkaline ammonia treatment to remove
mycotoxins from food. However, these methods are harsh to food as they involve the use of
chemicals which are potentially harmful to health or may impair or reduce the nutritional

20
value of foods. Cooking foods does not remove mycotoxins either as most of them are heat
stable. Detoxification of mycotoxins in foods through lactic acid bacteria fermentation has
been demonstrated over the years (Bienasiak et al, 2006). Using LAB fermentation for
detoxification is more advantageous in that it is a milder method, which preserves the
nutritive value and flavour of de-contaminated food. In addition to this, LAB fermentation
irreversibly degrades mycotoxins without leaving any toxic residues. The detoxifying effect
is believed to be through toxin binding effect.
In a review, Bankole and Adebanjo (2003), reported that the level of Aflatoxin Bl, B2
and G1 were significantly higher in corn from the high incidence area for human
hepatocellular carcinoma and the average daily intake of aflatoxin B1 from the high risk areas
was 184.1 g/k aflatoxin. Udoh et al. (2000) reported 33% of maize sample from ecological
zones of Nigeria contaminated with aflatoxins.
Fermented maize (Ogi) is a staple cereal in Nigeria and it is a popular weaning food in
most rural communities in Nigreia. Oluwafemi and Ikeowa (2005) have reported that in
fermenting maize to ogi, aflatoxin B1 was reduced by about 50% after 72hours of
fermentation. Maize as well as other Nigerian cereals are also important raw materials for
both local and commercial beer brewing. Oluwafemi and Taiwo (2003) have shown that the
role of S. cerevisiae in reducing the pH from 5.2 to 3.7 during fermentation is important in
detoxifying aflatoxin B during beer fermentation.
2.7 History of HACCP
The concept of HACCP was developed in the 1960‟s by the Pillsbury company, while
working with NASA and the US Army laboratories to provide safe food for space
expeditions. The limitations of end product testing became evident to those who were trying
to provide the safest possible food products. In order to ensure that food used for space
missions would be safe, almost all the product manufactured would need to be tested. The
practice of proactive system of HACCP evolves from these efforts to understand and control
food safety failures.
HACCP has been widely used by industry since the late 1970s, and is now
internationally recognized as the best system for ensuring food safety. It is endorsed by the
Food and Agricultural Organization (FAO) and World Health Organization (WHO) of the
United Nations, and, in the United States by the National Advisory Committee on
Microbiological criteria for Food (NACMCF). In 1972, HACCP was published and

21
documented in the USA. In 1985 the National Academy of Science (NAS) recommended the
use of HACCP.
HACCP is now internationally recognized for ensuring food safety. The HACCP
system is endorsed and became used by Food and Agricultural Organization (FAO), World
Health Organization (WHO) of the United Nations and in the United systems by National
Advisory Committee for Microbiological Criteria for Food (NACMCF). The HACCP system
has also been implemented under regulation in other countries like Europe, Canada, Australia
and New Zealand and is a high priority program under Codex Alimantaries, the world food
standard authority.
2.7.1 The Need for HACCP
New challenges to the U.S food supply have prompted FDA to consider adopting a HACCP
based food safety system on a wider basis. One of the most important challenges is the
increasing number of new food pathogens. For example between 1973 and 1988, bacteria not
previously recognized as important causes of food-borne illness-such as Escherichia coli
0157:H7 and Salimonella enteritidis became more widespread (NACMCF, 1997).
There also is increasing public health concern about chemical contamination of food:
for example, the effects of lead in food on the nervous system.
Another important factor is that the size of the food industry and the diversity of
products and processes have grown tremendously in the amount of domestic food
manufactured and the number and kinds of foods imported at the same time, FDA and state
and local agencies have the same limited level of resources to ensure food safety.
The need for HACCP in the United States particularly in the seafood and juice
industries, is further fueled by the growing trend in international trade for worldwide
equivalence of food products and the Codex Alimentarious Commission‟s adoption of
HACCP as the international standard for food safety \(Codex, 2007).
2.7.2 Advantages
HACCP offers a number of advantages.
1. Focuses on identifying and preventing hazards from contaminating food is based on
sound science.
2. Permits more efficient and effective government oversight, primarily because the
recordkeeping allows investigators to see how well a firm is complying with food
safety laws over a period rather than how well it is doing on any given day.

22
3. Places responsibility for ensuring food safety appropriately on the food manufacturer
or distributor.
4. Helps food companies compete more effectively in the world market
5. Reduces barriers to international trade (Enyinnaya, 2013).
HACCP Principles
HACCP is a systematic approach to the identification, evaluation, and control of food safety
hazards based on the following seven principles:
Principle 1: Conduct a hazard analysis
Principle 2: Determine the critical control points (CCPs)
Principle 3: Establish critical limits.
Principle 4: Establish monitoring procedures
Principle 5: Establish corrective actions
Principle 6: Establish verification procedures.
Principle 7: Establish record-keeping and documentation procedures
(Enyinnaya, 2013)
2.7.3 Guidelines for Application of HACCP Principles
HACCP is a management system in which food safety is addressed through the analysis and
control of biological, chemical, and physical hazards from raw materials production,
procurement and handling, to manufacturing, distribution and consumption of the finished
product. For successful implementation of a HACCP plan, management must be strongly
committed to the HACCP concept. A firm commitment to HACCP by top management
provides company employees with a sense of the importance of producing safe food.
HACCP is designed for use in all segments of the food industry from growing,
harvesting, processing, manufacturing, distributing, and merchandising to preparing food for
consumption. Prerequisite programs such as current Good Manufacturing Practices (cGMPs)
are an essential foundation for the development and implementation of successful HACCP
plans. Food safety systems based on the HACCP principles have been successfully applied in
food processing plants, retail food stores, and food service operations. The seven principles of
HACCP have been universally accepted by government agencies, trade associations and the
food industry around the world.

23
Prerequisite Programmes
The production of safe food products requires that the HACCP system be built upon a solid
foundation of prerequisites programs such as GMP and SOP. Each segment of the food
industry must provide the conditions necessary to protect food while it is under their control.
This has traditionally been accomplished through the application of cGMPs. These conditions
and practices are now considered to be prerequisites to the development and implementation
of effective HACCP plans. Prerequisites programs provide the basic environmental and
operating conditions that are necessary for the production of safe, wholesome food. The
Condex Alimentarius General Principles of Food Hygiene described the basic conditions and
practices expected for foods intended for international trade. While prerequisite programs
may impact upon the safety of a food, they also are concerned with ensuring that foods are
wholesome and suitable for consumption. HACCP plans are narrower in scope, being limited
to ensuring food is safe to consume.
The existence and effectiveness of prerequisite programs should be assessed during
the design and implementation of each HACCP plan. All prerequisite programs should be
documented and regularly audited. Prerequisite programs are established and managed
separately from the HACCP plan. Certain aspects, however, of a prerequisite program may be
incorporated into a HACCP plan. For example, many establishments have preventive
maintenance procedures for processing equipment to avoid unexpected equipment failure and
loss of production. During the development of a HACCP plan, the HACCP team may decide
that the routine maintenance and calibration of an oven should be included in the plan as an
activity of verification. This would further ensure that all the food in the oven is cooked to the
minimum internal temperature that is necessary for food safety (Enyinnaya, 2013).
Education and Training
The success of a HACCP system depends on educating and training management and
employees on the importance of their role in producing safe foods. This should also include
information on the control of food-borne hazards related to all stages of the food chain. It is
important to recognize that employees must first understand what HACCP is and then learn
the skills necessary to make it function properly. Specific training activities should include
working instructions and procedures that outline the tasks of employees monitoring each
CCP.

24
Management must provide adequate time for thorough education and training personnel must
be given the materials and equipment necessary to perform these tasks. Effective training is
an important prerequisite to successful implementation of a HACCP plan (USFDA, USDA,
NACMCF, 1992).
Developing a HACCP Plan
The format of HACCP plans will vary. In many cases the plans will be product and process
specific. However, some plans may use a unit operations approach. Generic HACCP plans
can serve as useful guides in the development of process and product HACCP plans;
however, it is essential that the unique conditions within each facility be considered during
the development of all components of the HACCP plan.
In the development of a HACCP plan, five preliminary tasks need ot be accomplished
before the application of the HACCP principles to a specific product and process. The five
preliminary tasks are given in Figure 2.2

25
Fig 2.2 Preliminary Task in the development of HACCP
Source: Enyinnaya (2013)
Assemble the HACCP Team
Describe the food and its distribution
Describe the intended use and consumers of the food
Develop a Flow Diagram which describes the process
Verify the Flow Diagram

26
Assemble of the HACCP Team
The first task in developing a HACCP plan is to assemble a HACCP team consisting of
individuals who have specific knowledge and expertise appropriate to the product and
process. It is the team‟s responsibility to develop the HACCP plan. The team should be multi
disciplinary and include individuals from areas such as engineering, production, sanitation,
quality assurance, and food microbiology. The team should also include local personnel who
are involved in the operation as they are more familiar with the variability and limitations of
the operation. In addition, this fosters a sense of ownership among those who must implement
the plan. The HACCP team may need assistance from outside experts who are knowledgeable
in the potential biological, chemical and/or physical hazards associated with the product and
the process. However, a plan which is developed totally by outside sources may be erroneous,
incomplete, and lacking in support at the local level.
Due to the technical nature of the information required for hazard analysis, it is
recommended that experts who are knowledgeable in the food process should either
participate in or verify the completeness of the hazard analysis and the HACCP plan. Such
individuals should have the knowledge and experience to correctly: (a) conduct a hazard
analysis; (b) identify potential hazards; (c) identify hazards which must be controlled; (d)
recommend controls, critical limits, and procedures for monitoring and verification; (e)
recommend appropriate corrective actions when a deviation occurs; (f) recommend research
related to the HACCP plan if important information is not known; and (g) validate the
HACCP plan (NACMCF, 1992 and Sperber, 1992).
Describe the Food and its Distribution
The HACCP team first describes the food. This consists of a general description of the food,
ingredients, and processing methods. The method of distribution should be described along
with information on whether the food is to be distributed frozen, refrigerated, or at ambient
temperature.
Describe the Intended Use and Consumers of the Food
Describe the normal expected use of the food. The intended consumers may be the general
public or a particular segment of the population (e.g infants, immunocompromised
individuals, the elderly, etc).

27
Develop a Flow diagram which Describes the Process
The purpose of a flow diagram is to provide a clear, simple outline of the steps involved in
the process. The scope of the flow diagram must cover all the steps in the process which are
directly under he control of the establishment. In addition, the flow diagram can include steps
in the food chain which are before and after the process that occur in the establishment. The
flow diagram need not be as complex as engineering drawings. A block type flow diagram is
sufficiently descriptive (see Figure 2.3). Also, a simple schematic of the facility is often
useful in understanding and evaluating product and process flow.
Verification of Flow Diagram
The HACCP team should perform an on-site review of the operation to verify the accuracy
and completeness of a the flow diagram. Modifications should be made to the flow diagram
as necessary and documented.

28
Fig. 2.3 Example of Flow Diagram for the production of frozen cooked beef patties
Source: Okaka and Ene (2005)
1. Receiving (Seed)
2. Grinding
3. Mixing
4. Forming
5. Cooking
6. Freezing
7. Boxing
8. Distribution
9. Reheating
10. Serving
29
Application of HACCP Principle
After these five preliminary tasks have been completed, the seven principles of HACCP are
applied.
Conduct a Hazard Analysis (Principle 1)
After addressing the preliminary tasks discussed above, the HACCP team conducts a hazard
analysis and identifies appropriate control measures. The purpose of the hazard analysis is to
develop a list of hazards which are of such significance that they are reasonably likely to
cause injury or illness if not effectively controlled. Hazards that are not reasonably likely to
occur would not require further consideration within a HACCP plan. It is important to
consider in the hazard analysis the ingredients and raw materials, each step in the process,
product storage and distribution, and final preparation and use by the consumer. When
conducting a hazard analysis, safety concerns must be differentiated from quality concerns. A
hazard is defined as a biological, chemical or physical agent that is reasonably likely to cause
illness or injury in the absence of its control. Thus, the word hazard as used in this documents
is limited to safety.
A thorough hazard analysis is the key to preparing an effective HACCP plan. If the
hazard analysis is not done correctly and the hazards warranting control within the HACCP
system are not identified, the plan will not be effective regardless of how well it is followed.
The hazard analysis and identification of associated control measures accomplish
three objectives. Those hazards and associated control measures are identified. The analysis
may identify needed modifications to a process or product so that product safety is further
assured or improved. The analysis provides a basis for determining CCPs in Principle 2.
The process of conducting a hazard analysis involves two stages. The first hazard
identification, can be regarded as a brain storming session. During this stage, the HACCP
team reviews the ingredients used in the product, the activities conducted at each step in the
process and the equipment used, the final product and its method of storage and distribution,
and the intended use and consumers of the product. Based on this review, the team develops a
list of potential biological, chemical or physical hazards which may be introduced, increased,
or controlled at each step in the production process.
After the list of potential hazards is assembled, stage two, the hazard evaluation, is
conducted. In stage two of the hazard analysis, the HACCP team decides which potential
hazards must be addressed in the HACCP plan. During this stage, each potential hazard is

30
evaluated based on the severity of the potential hazard and its likely occurrence. Severity is
the seriousness of the consequences of exposure to the hazard. Considerations of severity
(e.g., impact of sequence, and magnitude and duration of illness or injury) can be helpful in
understanding the public health impact of the hazard. Consideration of the likely occurrence
is usually based upon a combination of experience, epidemiological data, and information in
the technical literature. When conducting the hazard evaluation, it is helpful to consider the
likelihood of exposure and severity of the potential consequences if the hazard is not properly
controlled. During the evaluation of each potential hazard, the food, its method of
preparation, transpiration, storage and persons likely to consume the product should be
considered to determine how each of these factors may influence the likely occurrence and
severity of the hazard being controlled.
Hazard identified in one operation or facility may not be significant in another
operation producing the same or a similar product. For example, due to differences in
equipment and/or an effective maintenance program, the probability of metal contamination
may be significant in one facility but not in another. A summary of the HACCP team
deliberations and the rationale developed during the hazard analysis should be kept for future
reference. This information will be useful during reviews and updates of the hazard analysis
and the HACCP plan.
Some Questions to be Answered when Conducting a Hazard analysis
Ingredients
1. Does the food contain any sensitive ingredient that may present microbiological
hazards such as Salmonella, Staphylococcus aureus, chemical hazards such as
aflatoxin, antibiotic or pesticide residue, physical hazards such as stones, glass,
metals?
2. Are potable water, ice and steam used in formulating or in handling the food?
3. What are the sources of e.g geographical region, specific supplier?
Internal factor (Physical characteristics and composition e.g. pH, type of acidulant,
fermentation carbohydrates, water activity (Aw), preservatives) of the food during and after
processing.
1. What hazard may result if the food composition is not controlled?
2. Does the food permit survival or multiplication of pathogens and/or toxin formulation
in the food during processing?

31
3. Will the food permit survival a multiplication of pathogens and/or toxin formulation
during subsequent steps in the food chain?
4. Are there other similar products in the market place? What has been the safety record
for these products? What hazards have been associated with the products.
Procedure for processing
1. Does the process include a controllable processing step that destroys pathogens? If so,
which pathogens?
2. If the product is subject to recontamination between processing and packaging, which
biological, chemical or physical hazards a re likely to occur?
A critical control point is defined as a step at which control can be applied and is essential to
prevent or eliminate a food safety hazard or reduce it to an acceptable level. The potential
hazards that are reasonably likely to cause illness or injury in the absence of their control
must be addressed in determined CCPs.
Complete and accurate identification of CCPs is fundamental to controlling food safety
hazards. The information developed during the hazard analysis is essential for the HACCP
team in identifying which steps in the process are CCPs. One strategy to facilitate the
identification of each CCP is the use of a CCP decision tree. (Enyinnaya, 2013).
Although application of the CCP decisions tree can be useful in determining if a
particular step is a CCP for a previously identified hazard, it is merely a tool and not a
mandatory element of HACCP. A CCP decision tree is not a substitute or expert knowledge.
Critical control points are located at any step where hazards can be either prevented,
eliminated, or reduced to acceptable levels. Examples of CCPs may include: thermal
processing, chilling, testing ingredients for chemical residues, product formulation control,
and testing, product for metal contaminants CCPs must be carefully developed and
documented. In addition, they must be used only for purposes of product safety. For example,
a specific microbiological pathogen, could be a CCP. Likewise, refrigeration of a precooked
food to prevent hazardous microorganisms from multiplying, or the adjustment of a food to a
pH necessary to prevent toxin formation could also be CCPs. Different facilities preparing
similar food items can differ in the hazards identified and the steps which are CCPs. This can
be due to differences in each facility‟s layout, equipment, selection of ingredients, processes
employed, etc.

32
Establish Critical Limits (Principle 3)
A critical limit is a maximum and/or minimum value to which a biological chemical or
physical parameter must be controlled at a CCP to prevent, eliminate or reduce to an
acceptable level the occurrence of a food safety hazard. A critical limit is used to distinguish
between safe and unsafe operating conditions at a CCP.Critical limits should not be confused
with operational limits which are established for reasons other than food safety.
Each CCP will have one or more control measures to assure that the identified hazards
are prevented, eliminated or reduced to acceptable levels. Each control measure has one or
more associated critical limits. Critical limits may be based upon factors such as:
temperature, time physical dimensions, humidity, moisture level, water activity (aw) pH,
titrable acidity, salt concentration, available chlorine, viscosity, preservatives, or sensory
information such as aroma and visual appearance. Critical limits must be scientifically based.
For each CCP, there is at least one criterion for food safety that is to be met. An example of a
criterion is a specific lethality of a cooking process such as a 5D reduction in Salmonella. The
critical limits and criteria for food safety may be derived from sources such s regulatory
standards and guidelines, literature surveys, experimental results, and experts. The principle
can be achieved by the use of decision tree as shown in figure 2.4. Figures 2.5 and 2.6
represent “Fura” and “Ukpaka” production processes showing critical control points (Okaka,
2005).

33
Q1. Does this step involve a hazard of sufficient risk and severity to warrant its control?
YES NO NOT A CCP
Q2. Does a control measure for the hazard exist at this stage?
YES NO Modify the step, process
or Product
Is control at this step
Necessary for safety? Yes
NO NOT A CCP STOP
Q3. Is control at this stage necessary to prevent, eliminate, or reduce the risk of the hazard
to consumers?
YES NO NOT A CCP STOP
CCP
Fig. 2.4 HACCP Decision Tree
Source: Okaka and Ene (2005) and Enyinnaya (2013).

34
Pearl millet kernels
Decorticating/Dehulling
CCP Washing Bran and germ
Draining
Spices Pounding
Decorticated grain
(0.5g w/w)
CCP Shifting Grits
Removal of Flour
Some flour
for dusting
the fura
Compressing
Cooking
(20 – 30mins)
CCP Pounding
CCP Moulding
CCP Dusting
Fura
CCP Holding/Displaying
Consumer
Fig. 2.5 Fura Production Process showing the Critical Control Points (CCP)
Source: Okaka and Ene (2005)

35
Raw African oil bean seed CCP. Contamination with pathogens
Cleaning
Boil in water
(8 hours)
Dehulling
Slicing of CCP. Contamination with
endosperm Pathogens.
Boiling in water
(60 mins)
Soak in cold CCP. Contamination and
Water (8hrs) growth of pathogens
Draining
Fermentation CCP. Contamination and growth
of pathogens
Fermentation Ukpaka
Wrapping and CCP. contamination and
Marketing growth of pathogens.
Figure 2.6 Ukpaka production process shown Critical Control Point (CCP)
Source: Okaka and Ene (2005)

36
Establish Monitoring Procedures (Principle 4)
Monitoring is a planned sequence of observations or measurements to assess whether a CCP
is under control and to produce an accurate record for future use of verification. Monitoring
serves three main purposes. First, monitoring is essential to food safety management in that it
facilitates tracking of the operation. If monitoring indicates that there is a trend towards loss
of control, then action can be taken to bring the process back into control before a deviation
from a critical limit occurs. Second, monitoring is used to determine whether there is loss of
control and a deviation occurs at a CCP, i.e exceeding or not meeting a critical limit. When a
deviation occurs, an appropriate corrective action must be taken. Third, it provides written
documentation for use in verification.
An unsafe food may result if a process is not properly controlled and a deviation
occurs. Because of the potentially serious consequences of a critical limit deviation,
monitoring procedures must be effective. Ideally, monitoring should be continuous, which is
possible with many types of physical and chemical methods. Assignment of the responsibility
for monitoring is an important consideration for each CCP. Specific assignments will depend
on the number of CCPs and control measures and the complexity of monitoring. All records
and documents associated with CCP monitoring should be dated and signed or initiated by
the person doing the monitoring (Enyinnaya, 2013).
Establish Corrective Actions (Principle 5)
The HACCP system for food safety management is designed to identify health hazards and to
establish strategies to prevent, eliminate, or reduce their occurrence. However, ideal
circumstances do not always prevail and deviations from established processes may occur.
An important purposes of corrective actions is to prevent foods which may be hazardous from
reaching consumers. Where there is a deviation from established critical limits, corrective
actions are necessary. Therefore, corrective actions should include the following elements:
(a) determine and correct the cause of non-compliance; (b) determine the disposition of non-
compliant product and (c) record the corrective actions that have been taken. Specific
corrective actions should be developed in advance for each CCP and included in the HACCP
plan. As a minimum, the HACCP plan should specify what is done when a deviation occurs,
who is responsible for implementing the corrective actions, and that a record will be
developed and maintained of the actions taken. Individuals who have a thorough
understanding of the process, product and HACCP plan should be assigned the responsibility
for oversight of corrective actions. As appropriate, experts may be consulted to review the

37
information available and to assist in determining disposition of non-compliant product
(Enyinnaya, 2013).
Establish Verification Procedures (Principle 6)
Verification is defined as those activities, other than monitoring, that determine the validity
of the HACCP plan and that the system is operating according to the plan. The NAN (1985)
pointed out that the major infusion of science in a HACCP system centers on proper
identification of the hazards, critical control point, critical limits, and instituting proper
verification procedures. These processes should take place during the development and
implementation of the HACCP plans and maintenance of the HACCP system.
One aspect of verification is evaluating whether the facility‟s HACCP system is functioning
according to the HACCP plan. An effective HACCP system requires little end-product
testing, since sufficient validated safeguards are built in early in the process. Another
important aspect of verification is the initial validation of the HACCP plan to determine that
the plan is scientifically and technically sound, that all hazards have been identified and that
if the HACCP plans is properly implemented these hazards will be effectively controlled.
Information needed to validate the HACCP plan often include (1) expert advice and scientific
studies and (2) in-plant observations, measurements, and evaluations. In addition, a periodic
comprehensive verification of the HACCP system should be conducted by an unbiased,
independent authority. Such authorities can be internal or external to the food operation.
Establish Record-Keeping and Documentation Procedures (principle 7)
Generally, the records maintained for the HACCP System should include
1. A summary of the hazard analysis, including the rationale for determining hazards
and control measure.
2. The HACCP Plan
Listing of the HACCP team and assigned responsibilities.
Description of the food, its distribution, intended use, and consumer.
Verified flow diagram.
HACCP Plan Summary Table that includes information for:
Steps in the process that are CCPs
The hazard(s) of concern.
Critical limits

38
Monitoring
Corrective action
Verification procedures and schedule
Record-keeping procedures
A brief summary of position responsible for performing the activity and the procedures and
frequency should be provided
The following is an example of a HACCP plan summary table:
CCP Hazards Critical
limit(s)
Monitoring Corrective
Actions
Verification Records
2.7.4 Implementation and Maintenance of the HACCP Plan
The successful implementation of a HACCP plan is facilitated by commitment from top
management. The next step is to establish a plan that describes the individuals responsible for
developing, implementing and maintaining the HACCP system. Initially, the HACCP
Coordinator and team are selected and trained as necessary. The team is then responsible for
developing the initial plan and coordinating its implementation,. Products teams can be
appointed to develop HACCP plans for specific products. An important aspect in developing
these teams is to assure that they have appropriate training. The workers who will be
repsonsibile for monitoring need to be adequately trained. Upon completion of the HACCP
plan, operator procedures, forms and procedures for monitoring and corrective actions are
developed. Often it is a good idea to develop a timeline for the activities involved in the
initial implementation of the HACCP plan. Implementation of the HACCP system involves
the continual application of the monitoring, record-keeping, corrective actions procedures and
others activities described in the HACCP plan.
Maintaining an effective HACCP system depends largely on regularly scheduled
verification activities. The HACCP plan should be updated and revised as needed. An
important aspect of maintaining the HACCP system is to assure that all individuals involved
are properly trained so they understand their role and can effectively fulfill their
responsibilities.

39
2.8 Food Safety Hazards
Hazard is a described as any biological or physical property agent that may cause a consumer
health risk (Rhodehamel, 1992).
Biological hazard
Biological hazards can be divided into three categories: microorganisms, parasites and prions.
It has been reported that microorganisms are the principal sources of food borne disease
(Eilers, 1990).
Parasites
Cysticerei, Tenia spp, trematodes, nematodes, cestodes, Trichnilla spp., Echinoccocus spp.
and Aniskis spp, are commonly isolated parasites from foods. Raw meat and fish are the most
risky foods for parasite infections. Conventional cooking destroys them. They may also loss
their viability during freezing depending on the time and temperature (Unterimann, 1998).
Prions
Prions are considered as causative agent of “Bovine Spongiform Encephalitis” (BSE). They
are resistant to heat treatments and mainly isolated from offal (Untermann, 1998).
Microorganisms
No food product unless it is sterilized is free from microorganisms. Microorganisms of
concern in food safety include viruses, some species of bacteria, moulds and protozoa. Of the
microorganisms certain species of bacteria and moulds are able to produce toxic metabolites.
Their toxigenic effects can range from mild to severe gastrointestinal disorders or chronic
syndromes such as carcinogenity, teratogenity, mutagenity and immunosuppression (Adam
and Moses, 1999).
Viruses
Hepatitis A, poliovirus, rotavirus, astrovirus and Norwalk viruses are transmitted to man by
foods and drinking water. Contamination occurs through faecal oral route (Fries, 1994).
Moulds
Moulds represent health hazards because of their toxic metabolites called mycotoxins.
Mycotoxins may be produced in some plants in the field or during drying and storage under
improper conditions.

40
Algae
Some types of algae such as Cyanobacteria (blue green algae) and Pyrophyta (dinoflagellates)
produce toxic compounds for human being. Poisoning occur after consumption of some
seafood fed with these toxic algae (Falconer, 1993).
Bacteria
Food borne disease caused by performed toxins are referred to food poisoning (intoxications),
whereas the disorders caused by bacterial growth or endotoxin production in the body after
ingestion were called food infections (Table 2.5)

41
Table 2.3 Food Borne Diseases
Intoxication/Infection Bacteria
Infections
Intoxications
Salmonella spp., Shigella spp., Campylobacter spp.,
Yersinia enterocolitica, Listeria monocytogenes, pathogenic
E. coli, Aeromonas spp., Vibrio cholerae, Bacillus cereus
(diarhoagenic type), Clostridium perfringens
Clostridium botulimun, B. cereus (emetic type),
Staphylococcus aureus
Source: Eley, 1992; Frazier and Westhoff, 1988; Granum et al, 1995

42
Symptoms of the food borne diseases vary with the type of organisms and are more
severe in immuno-compromised person, children and elderly, infective doses of bacteria
range between 10 to 108 cells/g depending on bacterial strain, type of food consumed together
with implicated one and health status of consumer (Granum et al, 1995).
Bacillus cereus: Some strains of B. cereus produce diarrhoagenic and emetic toxins.
Emetic toxin is secreted into food and stable to heat treatments above 1200C (Moss, 1987).
Spices, cereals, dried foods, meat and meat products, fried or boiled rice, ice cream, cooked
rice dishes, soups, green vegetables, sauces (Kramer and Gilbert, 1989) are the implicated
food commodities in B. cereus contamination. However, commonly associated foods with
emetic and diarrhoagenic syndromes are cooked rice and pertinacious foods respectively
(Notermans and Batt, 1998).
Campylobacter spp: Campylobacter jejuni and C. coli are the major species of
Campylobacters causing food poisonings and considered as the common causes of
gastrointestinal diseases. Most commonly associated foods with C. jejuni contaminations are
poultry and poultry products (Bryan and Doyle, 1995).
Clostridium spp: Clostridium botulimum and C. perfringens are the well-known toxin
producing species of the genus. The C. botulinum represents health hazard rather than its
frequency incidence than its deadly antigenic types of botulin toxins (A, B, C1, C2, D, E, F
and G) and may be classified based on the type of toxin produced. (Dodd and Austin, 1997).
The botulism caused by C. botulinum strains is divided into four categories: food borne,
infant, wound and those classified as underdetermined. Symptoms of food borne botulism
involving nausea, vomiting, weakness, headache, dryness in the throat, double vision and
difficulty in swallowing and speaking exists usually 12-72 hours (Hatheway, 1990)..
Ingestion of C. botulinum spores mainly by honey is the cause of infant botulism. The causes
of botulism outbreaks are improperly canned or preserved food (Delmas et al, 1994).
Clostridium perfringens is one of the causes of gastroenteritis outbreaks. At least 12
different toxins were produced by Clostridium perfringens strains. C. perfringens Type A is
one of the most common causes of food borne diseases associated with diarrhoeal and
cramping symptoms in the USA (McClane, 1992). Beta-toxin produced by Clostridium
perfringens type C is responsible for a deadly food poisoning known as necrotic enteritis
(Granum, 1990). Uncured meat and meat products, sauces, salads, particularly inadequately
cooled ones were implicated in C. perfringens gastroenteritis (Labbe and Huang, 1995).
Pathogenic Escherichia coli: Pathogenic E. coli strains are classified into specific
groups: enteropathogenic E. coli (EPEC), enterotoxigenic E. coli (ETEC), enteroinvasive E.

43
coli (EIEC), diffuse-adhering E. coli (DAEC), enteroaggregative E. coli (EaggEC),
enerohemorrhagic E. coli. Serotype 0157:H7 (Doyle et al., 1997). Pathogenic E. coli strains
were associated with diarrhoeal diseases, wound infections, meningitis, septicaemia,
arterioscleroses, haemolytic ureamic syndrome and immunological diseases (Olysvik et al,
1991). The main reservoir for E. coli 0157:H7 serotypes were reported to be bovine or other
foods cross contaminated by beef product or bovine manure (Pierard et al, 1997).
Foods involved in pathogenic E. coil outbreaks mainly cheese, water, turkey, mayonnaise,
crabmeat, scallops, meat, hamburgers, and beef sandwiches (Olsvik et al, 1991).
Salmonella spp: Salmonellae are considered as one of the most important and
common food borne diseases in several counties worldwide. Gastroenteritis, dysentery,
enteritis and typhoid are the symptoms of Salmonella infections. Meats, poultry and their
products are commonly associated foods with Salmonella infections (Bryan and Doyle,
1995).
Shigella spp: Shigella dysenteriae, S. flexneri, S. boydii and S. sonnei are the
pathogenic strains of genus Shigella and regarded as the principal causes bacillary dysentery
(Vargas et al, 1999). Contaminated raw vegetables and fruits, soiled hands, seafood, milk and
puddings are the main sources of Shigella spp. (Farber, 1989).
Staphylococcus aureus: Medical expenses and loss of productivity due to food
poisoning caused by S. Aureaus were estimated to cost $1.5billion each year in the United
States (Su and Lee Wong, 1997). Enterotoxins are secreted into the foods and resistant to
almost all food processing procedures (Moss, 1996). Vomiting, Nausea, abdominal cramps,
prostration and some diarrhea usually occur after 2-4 hours following ingestion of
contaminated food. Food frequently involvedin S. aureus poisoning include meat, poultry,
eggs, dairy products, and seafood (Reed, 1993). Man is the main reservoir of post-process
contaminations of foods (Reed, 1993).
Listeria monocytogenes: Listeria monocytoenes is the causative bacterium of
listeriosis and has been linked mainly with flu-like illness, abortion and stillbirth in pregnant
women. L. monocytogenes also causes septicemia and meningitis in immune-compromised
persons. Healthy individuals are not affected in the presence of low numbers of L.
monocytogenes. Foods commonly implicated with L. monocytogenes contaminations are raw
milk, fresh vegetables (Schothorst, 1999).
Other Bacteria
Symptoms of Vibrio cholerae infections involve loss of water at high levels that may
lead to collapse and death. Human can also transmit the bacteria the others as well as foods.

44
The reservoir of V. parahaemolyticus is water, seafood and fish and foods contaminated with
water (Schothorst, 1999). There exists some reports indicating intoxications developing with
watery diarrhea due to the consumption of foods contaminated with Yersinia enterocolitica.
Pigs are the main reservoir of Y. enterocolitica (Frazier and Westhoff, 1988). Motile groups
of Aeromonas genus were shown to be responsible for food borne illnesses from mild
diarrhea to „cholera-like‟ and a „dysentery-like‟ nature gastroenteritis (Stelma, 1988). Water
was considered as one of the sources of Aeromonas spp. (Stern et al, 1987).
Control of Microbial Hazards in Foods
The main control measures in order to control microbial hazards in foods are given below:
1. Prevention of contaminations
2. Limitation of microbial growth
3. Elimination/destruction of microorganisms
Control Methods for Microbial Hazards are Tabulated in Table 2.6

45
Table 2.4 Control of microbial hazards
Heat treatment
Pasteurization
Sterilization
Chemical preservatives
pH
Water activity
Prevention of contaminations
Personnel hygiene
Packaging
Raw material control
Process sanitation
Modified atmosphere
Radiation
Source: Enyinnaya (2013)

46
Chemical Hazards
Chemical contaminants in food may be naturally occurring or may be added during
processing of food. Food may contain several types of chemicals that are hazardous for men.
Limits have been established for some types of chemicals whereas others are not allowed to
be found in foods (Rhodehamel, 1992). Chemical hazards for foods have been presented in
Table 2.7

47
Table 2.5 Chemical Hazards in various Food.
1. Chemicals naturally occurred in foods
Mycotoxins
Mushrooms
Shellfish toxins
PSP (“paralytic shellfish poisoning”) toksinleri
DSP (“Diarrhaeic shellfish poisoning”) toksinleri
NSP (“Neurotoxic shellfish poisoning”) toskinleri
ASP (“Amnesic shellfish poisoning”) toksinleri
Scrambotoxin
Tetratoksin
Ciguatoxin
Allergens
2. Chemicals used in the field
Pesticides
Antibiotics and growth hormones
Fertilizers
3. Environmental contaminants
Toxic minerals
Polychlorinated biphenyls (PCBs)
4. Food additives
5. Chemicals occurred during processing
Poycylic Aromatic Hydrocarbons (PAH)
N-Nitrosamines
6. Contaminants from food packaging materials
7. Detergent, disinfection residues, chemicals intentionally added
8. From packaging materials – plasticizers, vinyl chloride, printing coatings inks,
adhesives, lead, tin
Source: Rhodehamel (1992)

48
Mycooxins
Mycotoxins are secondary metabolites of moulds. Aflatoxins (B1, B2, G2, G2), fumonisins,
moniliformin, ochratoxin A, Patulin, sterigmatocystine, trichothecenes, zearalenone,
alternariols, altertoxins, deoxinivalenol and T-2 toxin are the most commonly isolated
mycotoxins. Limit values for some mycotoxins are given in Table 2.8

49
Table 2.6 Established Limits for some common types of mycotoxins
Mycotoxins Established limits (ppb)
Aflatoxins in food
Aflatoxin in milk (M1)
Ochratoxin A
Patulin in apple juice
T-2 toxin
0-50
0-0,5
1-300
20-50
100
Source: Moss (1996)

50
Studies on mycotoxins have been concentrated on aflatoxins, which are considered as
potential carcinogens. Fumonisins have received great attention in recent years;
epidemiological studies indicated a correlation between eusophagu cancer and consumption
of foods contaminated with fumonisins. Ochratoxin A is commonly isolated from coffee
grains and barley. Patulin is a common problem in apple juice all over the world.
Shellfish Toxins
Shellfish toxins cause “Paralytic Shellfish Poisoning” (PSP), “Diarrhetic Shellfish Poisoning”
(DSP), “Emnesic Shellfish Poisoning” (ASP) and “Neutrotoxic Shellfish Poisoning” (NSP)
through shellfish fed by toxic algae (Falconer, 1993).
Allergens
Some chemicals in foods and additives can cause allergic reactions in susceptible individuals,
and are considered as component of HACCP system.
Other Chemicals
Pesticides do not represent health risk in case they are used under proper conditions.
Maximum residue limits have been established for permitted pesticides and regulated by
Environmental Protection Agency (EPA) (Rhodehamel, 1992).
1. Increase in the use of nitrate containing fertilizers has caused the accumulation of
nitrates in some plants (Anon. 1997).
2. Antibiotics are mainly used for the treatment of infections in animals. However, they
are sometimes used as growth stimulating agents also. They increase the chance for
evolution of antibiotic resistant pathogens in human (Anon. 1997).
3. Maximum tolerable limits have been established for toxic elements including
mercury, lead, arsenic and cadmium. Toxic elements as well as polychlorinated
biphenyls (PCBs) contaminate foods as the result of environmental pollution (Jones,
1989).
4. Some chemicals such as polycyclic aromatic hydrocarbons (PAH) occur in foods
during processing at high temperatures (>3000C). Their concentrations increase with
direct exposure to flame. They can also contaminate plants through accumulation of
these compounds found in air (Shibamoto and Bjeldanes, 1993).

51
5. Detergent, disinfection residues and migration from food packaging materials are
also considered among chemical hazards in foods. Control methods for chemical
hazards are given in Table 2.9.

52
Table 2.7 Control methods for chemical hazards
Control before receipt
Raw materials specifications
Supplier guarantees
Random checks
Control before use
Check the purpose for the use of chemical
Control purity, formulation and labeling
Check the quantities to be used
Control storage and handling conditions
Control all the chemicals in facility
Review uses
Record of uses
Source: Rhodehamel (1992)

53
Physical Hazards
Foreign objects such as glass, wood, stones, metal, bone, plastic are the main physical
hazards. They can cause injuries to man. Their presence in foods also indicates that foodstuffs
were not processed under hygienic conditions.
Critical Control Points
Critical control points (CCPs) are any point or procedure in a specific food where loss of
control may result in an acceptable health risk.
Hazards can be controlled during:
A. Growing:
i. The use of antibiotics
ii. Application of pesticides
iii. Location of growing field
B. Ingredient receiving:
i. Temperature control
C. Processing:
i. Mixing of Ingredients
ii. Thermal processing
D. Distribution:
i. Time-temperature control
Critical Limits
Critical limits are minimum or maximum established values to control hazards at each CCPs.
Exceeding critical limits indicates that the product may represent is a health hazard. Most
frequently used critical limits are given below (Moberg, 1992).
Time
Temperature
Humidity
Moisture content
pH
Preservative
Salt concentration
Available chlorine

54
Viscosity
Monitoring Critical Control Point Limits and Corrective Actions
Monitoring and record keeping are essential to HACCP system‟s success. Monitoring
parameters can be qualitative and quantitative. Temperature checks, testing (Microbiological,
chemical etc.), sensory and visual examinations are examples of monitoring procedures. To
establish an effective monitoring procedure the questions of what, why, how, where, who and
when must be answered (Hudak-Roos and Garret, 1992.
Corrective actions cover procedures that should be applied when a deviation occurred.
Examples of corrective actions include continued cooking until 700C; addition of acid to
reach target pH; addition of preservative to achieve proper concentration etc.
Record Keeping and Verification
Record keeping provides evidence of food safety, documentation for audit. In addition it is a
tool for personnel training and solving problems (Stevenson and Hum, 1992).
Verification is the sum of activities other than monitoring that determines the validity and
compliance with HACCP program (Prince, 1992).
HACCP is very beneficial to individual food processing industries and the world at
large. It controls potential food safety risk in the manufacturing of food products. It helps to
eliminate the risks involved in food production by identifying the main control points where
risks lie to ensure a safe product at the end of the production process. In food processing
operations, HACCP is important because it avoids hazards in an establishment by analyzing
each component of the operation from delivery to service. Other benefits of HACCP include
- Saves business money in long run
- Avoids food poisoning
- Increases food safety standard
- Increases food quality standard
- Organizes process to produce safe food
2.8 HACCP of Fermented Food Condiments
The consumers‟ preference for safe and quality food products is increasing and the need to
develop strategy to improve safety of condiments is essential for product competitiveness
with standard bouillon cubes as well as guarantee product acceptability and consistency

55
(Oguntoyinbo, 2015). Hazard Analysis Critical Control Points is a systematic approach
identification of hazard and prevention strategy for the improvement of food safety without
necessary reliance on end product testing (Oguntoyinbo, 2015). Hazard analysis consists of
evaluation of raw materials, water and its sources, environment, fermentation vessel, personal
hygiene and other sources of contamination during processing as well as handling during
packaging of final products (Oguntoyinbo, 2015; Rabi et al., 2013). The raw seeds, sands
used in dehulling, diluent, paw-paw leaves used as additives as well as final moulding,
tabletting and display for sale to the consumers are Critical Control Points in the production
of “dawadawa”, a food condiment (Rabi et al., 2013) and these Critical Control Points are
capable of contaminating the final products which could predispose the consumers of the
products to food borne illnesses.

56
CHAPTER THREE
3.0 MATERIALS AND METHODS
3.1 Procurement of Samples for Study
The samples, creeping melon seeds (Citrullus vulgaris) climbing melon seeds (Cucumeropsis
manni), castor oil seeds (Ricinus communis) and fluted pumpkin seeds (Telfairia
occidentalis) were bought at open market from different states of Nigeria. The choice of
samples source was made because samples are not indigenous and not produced in sufficient
quantities in the areas where they are mostly utilized. Also the climatic conditions and soil
type could affect the composition of the samples. Different samples of ogiri produced from
those substrates were collected from local (traditional) producers who were engaged to do so.
Some of the ogiri samples were also bought at open markets.
3.1.1 Experimental Sites
The Microbiological analyses were carried out in the microbiology laboratory, Nnamdi
Azikiwe University, Awka North Local Government Area while the physicochemical
analyses were carried out in National Agency for Food and Drug Administration and Control
(NAFDAC) zonal laboratory, Agulu in Anaocha Local Government Area both in Anambra
State, Nigeria.

57
Plate 3.1 Various substrates for “ogiri” production
Key: 1 = Climbing melon seeds
2 & 3 = Creeping melon seeds
4 & 5 = Castor oil seeds
6 = Fluted pumpkin fruits
7 = Fluted pumpkin seeds
4 5
1 2 3
6 7

58
3.1.2 Production of “Ogiri”
The traditional method of processing „ogiri‟ by Nzelu (2010) was modified to become
appropriate for the study as shown in Figure 3.1 The mature seeds of castor oil, creeping
melon, climbing melon and fluted pumpkin were sorted and aseptically dehulled. Ten wraps
of 250g each were boiled for six hours. The boiled seeds were drained and left to ferment at
room temperature. One wrap each was mashed in a disinfested mortar and the resultant paste,
the „ogiri‟ was finally wrapped in blanched plantain leaves (Musa sapientum).
Microbiological and chemical analysis of „ogiri‟ from different substrates were
carried out each day as fermentation proceeded. One gram of each sample was dissolved in
9ml of peptone water and diluted using a ten fold serial dilution prior to microbial analysis.

59
Castor oil Melon Fluted pumpkin Climbing melon
seeds seeds seeds seeds
Sorting Sorting Sorting Sorting
Dehulling Dehulling Dehulling Dehulling
Wrapping Wrapping Wrapping Wrapping
Draining and fermentation
Mashing
Wrapping/packaging
Storing/using
Fig 3.1: Process flow chart for the laboratory production of ogiri.
3.2 Microbial Analysis of „Ogiri‟ Samples
BOILING
(1-6 HOURS)

60
3.2.1 Total Viable Counts
This was carried outby pour plate method as described by Tasie and Okafor (1999). One
gram of each sample was weighed using electronic weighing balance (0106-1) and dissolved
in 9ml of peptone water and diluted using a ten fold serial dilution. Zero point one millilistre
of each sample suspension was taken from the dilutions 10-4
, 10-5
and 10-6
and inoculated on
Nutrient agar, MacConkey agar, plate count agar, Salmonella shigella agar and sabouraud
dextrose agar in duplicate and incubated at room temperature (maximum of 35oC) for 24-72
hours. The mean of the replicate plating was calculated and the total viable count was
calculated by the formular V= N/V x D expressed as cfu/g. Pure cultures of isolates were
stored in agar slants in a refrigerator at 4oC. The pure cultures were characterized by cultural,
morphological and biochemical tests which included Gram staining, motility test, catalase
test, coagulase test, citrate test, oxidase test, indole test, methyl red test, Voges-Proskaur
test, nitrogen reduction test and sugar fermenation as described by Marvin (1984) and
Duguid (1986) respectively. The isolations were made at material collection before sorting,
during fermentation, after mashing and storing/using.
3.2 Detection of Faecal Coliforms
The methods of Tasie and Okafor (1999) was used. The test was carried in three stages.
Presumptive Test
One gram of each sample was suspended in 9ml of peptone water. Five tubes containing 5ml
of single strength lactose broth and 1ml of samples were incubated at 35oC for 24 hours with
inverted durham tubes. Also the remaining 5 tubes with 5ml launy lactose broth and 0.1ml
sample suspension was also incubated at 35oC for 24 hours. The 10ml of sample suspension
was also added to 5 tubes containing 10ml of double strength lactose broth.
Gas production indicated positive presumptive test while absence of gas production indicated
negative presumptive test.

61
Confirmatory Test
A loopful of culture from the positive presumptive test was aseptically transferred to fresh
tubes containing brilliant green lactose bile broth and incubated at 35oC for 48 hours.
Turbidity and production of gas indicated positive confirmatory test.
Completed Test
Cultures from positive confirmatory test was streaked on Eosin Methylene Blue (EMB) and
inoculated at 35oC for 24 – 48 hours. Presence of colonies with green metallic sheen
differentiated E. coli from other coliforms.
3.2.2 Enumeration of Coliforms
The membrane filter technique was adopted. A sterile membraneabsorbent pad was placed in
a Petri dish with sterile forceps and 2ml of the medium (teepol broth) added. Ten mililitress
of the sample suspension was filtered using pre-sterilized membrane filter of 0.45m pore
size. The filter disc was transferred to nutrient pad previously prepared and incubated at 35oC
for 24 hours. The colonies were then counted.
3.3 Identification of Bacterial Isolates
The identification of bacterial isolates was confirmed using morphological, biochemical and
physiological tests as described by (Dimejesi and Iheukwumere, 2014).
3.3.1 Motility Test
This was carried out using soft agar stabbing (tube method). Each isolate was transferred with
sterile inoculating needle into a test tube containing nutrient broth. The tube was plugged
with cotton wool and incubated for 24-48 hours. After 24-48 hours of incubation, a well
dispersed growth from the line of inoculation indicated positive result.
3.3.2 Hydrogen Sulphide Test
Agar stabbing method (tube method) was also used. Each isolate was transferred with a
sterile inoculating needle into a test tube containing nutrient broth and incubated for 24-48
hours.
Presence of black precipitate at the bottom of the test tube indicated production of hydrogen
sulphide.

62
3.3.3 Coagulase Test
This was carried out using slide method. A loopful of distilled water was dropped on a clean
slide. A small amount of a 24-hour old culture was mixed with the distilled water on the
slide. The test suspension was treated with a drop of citrated plasma and mixed properly with
the sterile inoculation loop. A control was also prepared without plasma.
Clumping of the organism (agglutination) within 5-10 seconds indicated positive test, while
absence of agglutination showed negative result.
3.3.4 Indole Test
One and half grams of peptone water and 1.5g of glucose were dissolved in 150ml of water.
The solution was dispensed into test tubes and autoclaved at 121oC for 15 minutes. The
medium was inoculated with the test-organism and incubated at 37oC for 48 hours for
optimum accumulation of indole. Zero point five million of Kovac‟s reagent (prepared by
dissolving 10g of p-Dimethyl – aminobenzaldehyde in 150ml of amyl alcohol or 50ml of
conc. HCL was added to each test tube and shaken gently. The development of red colour
indicated positive reaction.
3.3.5 Methyl red test
One and half grams of peptone water and 1g of glucose were dissolved in 100ml of water,
dispensed into test tubes and autoclaved at 121oC for 15 minutes. The medium was
inoculated with the test-organism and incubated at 37oC for 48 hours. About 5 drops of
methyl red indicator reagent was added in each test tube and mixed. Positive result was bright
red while negative result (tests) was yellow.
3.3.6 Voges-Proskauer Test
One and half grams of peptone water and 1g of glucose were dissolved in 100ml of water,
and dispensed into test tubes and autoclaved at121oC for 15 minutes. The medium (glucose
peptone water) was inoculated with the test-organism and incubated at 30oC for 48 hours.
Half a mililitre of O‟ Meara reagent (40g potassium hydroxide and 0.3g creatine in 100ml of
diluted water) was added and mixed. A pink colour indicated positive reaction.
3.3.7 Citrate Utilization Test
Simmon‟s citrate medium, a modification of Koser‟s medium with agar was used. Agar was
added to solidify the medium. This was dispensed in test tubes, autoclaved at 121oC for 15

63
minutes and allowed to set as slopes (slants). The Simmon‟s medium consisted of Koser‟s
medium (11g), agar 30g and bromothymol blue (40ml) as an indicator was added. The
solidified medium was incubated at 37oC for 96 hours. Blue colour and streak of growth
indicated positive results.
3.3.8 Urease Test
About 2.4g of urea-based medium was dissolved in 95ml of distilled water and autoclaved at
121oC for 15 minutes in a conical flask. Five mililitres of sterile urea was pipetted into each
bijou bottle and also autoclaved. The urea agar based medium and the sterile urea were mixed
at almost gelling temperature, solidified in slant and inoculated. These were incubated at
37oC for 24-48 hours. Development of pink colour indicated positive urea test while no
colour change indicated negative urea activity.
3.3.9 Nitrate Reduction Test
The test medium was prepared by dissolving 0.4g of potassium nitrate (KNO3), and 10g of
peptone water in 22ml of distilled water. About 5ml of the mixture was pipetted in different
bijou bottles and autoclaved at 121oC for 15 minutes. These were inoculated with a test
organism and inoculated at 30oC for 24-96 hours. The test reagents A and B were also
prepared. The solution A (8g of H2SO4 in 11ml of 5N acetic acid). Test solution B (5g
of x – naphthylamine in 11ml of 5N acetic acid).
After incubation, equal volumes of test reagent A and B were mixed and 0.1ml of the
mixture was added in each bijou bottle. A red colour developing within a few minutes
indicated positive reaction (i.e. presence of nitrite) while no colour change indicated negative
reaction.
3.3.10 Catalase Test
Two drops of hydrogen peroxide was added to a smear of a 24-hour old culture of isolate on a
glass slide. Evolution of gas as white froth indicated a positive reaction while absence of gas
indicated negative reaction.
3.3.11 Oxidase Test
A strip of Whatman‟s No. 1 filter paper was soaked in a freshly prepared 1% solution of
tetramethyl-p-phenylene diamine dihydrochloride, drained for 30 seconds, air-dried and

64
stored in a dark bottle which was gently sealed with screw cap. The dried paper which had a
light purple tint was laid on a Petri dish and moistened with distilled water. The colony to be
tested was smeared on the moist area. Development of an intense deep purple hue within 10-
60 seconds was considered positive oxidase test while absence of colouration or colouration
later than 60 seconds was considered oxidase reaction.
3.3.12 Sugar Fermentation
This was done to investigate the ability of the isolates to utilize different sugars. The
following sugars were used: glucose, maltose, sucrose, lactose, manitol and sorbitol. One
gram of each sugar was dissolved in 100ml of distilled water and dispensed in different test
tubes. One and half grams of bacteriological peptone and 1ml of bromocresol purple were
added to different test tubes (i.e. the mixture of each sugar, bacteriological peptone and
bromocresol purple) were dispensed into test tubes and sterilized with inverted Durham
tubes at 115oC for 10 minutes. These were incubated for 24 hours at 37
oC. Change of colour
from purple to yellow indicates positive test which is the production of acid. Presence of air
bubbles at the top Durham tubes (empty space towards the bottom of the inverted Durham
tubes) indicated gas production and absence of air bubbles indicated no gas production.
3.4 Identification of Fungal Isolates
This was carried out by wet mount and slide culture method as described by Tasie and Okafor
(1999).
3.4.1 Lactophenol Cotton Blue Stain
The apparatus and the working surfaces were disinfected. The isolates were placed on the
slides and mixed with 2 drops of lactophenol cotton blue stain and covered with cover slip
sealed with nail hardner and viewed under microscope (x40 objective lens)
3.4.2 Slide Culture
This was done to observe the morphological characteristics of the isolates without disturbing
the arrangement of spores and hyphae. A 100mm square agar block (SDA) each were placed
on sterile slides. The slides were incubated with speck of fungal colony and aseptically
covered with cover slip. The whole arrangement was placed on a sterile Petri-dishes
containing small amount of sterile water and supported on a V-shaped sterile glass rod. The
small amount of water helped to prevent the agar from drying out. The petridishes were

65
covered and incubated at 25-30oC. Viable growth was examined at intervals when the viable
growth was observed, the cover slips were removed and the lactophenol cotton blue mount
was performed and examined microscopically for sporulation.
3.4.3 Molecular identification of Bacterial and Fungal Isolates
This was carried out by the method described by Centre for Agriculture and
Bioscience International (CABI) and certified by Caine, T.S, Identification Operation
Manager. All original samples were subjected to a purity check.
Bacterial samples were processed using partial 16S rDNA sequencing analysis.
Fungal samples were processed using ITS rDNA sequencing analysis.
All procedures were validated and processing undertaken in accordance with CABI‟s
in-house methods as documented in TPs 61-68 and TP70 for bacteria and TPs 72-80 for
filamentous fungi.
Molecular assays were carried out on each sample using nucleic acid as a template. A
proprietary formulation [microLYSISR-PLUS (MPL), Microzone, UK] was subjected to the
rapid heating and cooling of a thermal cycler, to lyse cells and release deoxyribonucleic acid
(DNA).
Following DNA extraction, Polymerase Chain Reaction (PCR) was employed to
amplify copies of the partial 16S fragment of rDNA in vitro for bacteria and the ITS fragment
of rDNA in vitro for filamentous fungi.
The quality of the PCR product was assessed by undertaking gel electrophoresis.
PCR purification step was carried out to remove unutilized dNTOs, primer,
polymerase and other PCR mixture compounds and obtain a highly purified DNA template
for sequencing. This procedure also allowed concentration of low yield amplicons.
Sequencing reactions were undertaken using BigDye Terminator v3.1 kit from
Applied Biosystems (Life Technologies, UK) which utilizes fluorescent labeling of the chain
terminator ddNTPs, to permit sequencing.
Removal of excess unincorporated dye terminator was carried out to ensure a
problem-free electrophoresis of fluorescently labeled sequencing reaction products on the
capillary array AB 3130 Genetic Analyzer (DS1) DyeExTM
2.0 (Qiagen, UK)
Modules containing prehydrated gel-filtration resin were optimized for clean-up of
sequencing reactions containing BigDye terminators. Dye removal was followed by
suspension of the purified products in highly deionised formamide Hi-DiTM
(Life
Technologies, UK) to prevent rapid sample evaporation and secondary structure formation.

66
Samples were loaded onto the AB 3130 Genetic Analyzer and sequencing undertaken
to determine the order of the nucleotide bases, adenine, guanine, cytosine, and thymine in the
DNA oligonucleotide.
Following sequencing, identification were undertaken by comparing the sequence
obtained with those available in European Molecular Biology Laboratory (EMBL) via the
European Bioinformatics Institute (EBI)
3.5 Physicochemical Analysis
3.5.1 Determination of Protein
Determination of protein was carried out by Kjeldahl‟s method as described by Egan et al
(1981) and in NAFDAC Standard Operation (SOP) for protein determination. The analysis
was carried out in three stages: Digestion, Distillation and Titration.
Digestion
Two grams of each sample was weighed out using electronic weighing balance (METLAR
200)and put in a 250ml Kjeldahl digestion flask. Then 10g of copper sulphate and 3g of
sodium sulphate were added together and 3g of the mixture was added to the sample. Two
pieces of Kjeldahl tablet was also used as alternative to mixture of copper sulphate and
sodium sulphate. One gram of anti-bumping granules (chips) was added as well as 20ml of
concentrated H2SO4. The flask and its content was placed in Kjeldahl‟s temperature regulated
digester and digested for 3-4 hours as shown in Appendix 1, allowed to cool prior to
distillation.
Distillation
Fifty mililitres of 10% sodium citrate solution was added to the digest in the flask. Then 10ml
of 30% w/v of NaOH, two pieces of zinc pellets (granules) and 10ml of 2% boric acid were
added in a 250ml conical flask. Also 1-2 drops of methyl red indicator solution was added to
the mixture in the conical flask and placed under the mouth of the condenser. The distillate
was then collected in the receiver flask and was used for titration.
Titration
Thirty mililitres of the distillate was put in a 250ml conical flask and titrated against 0.1M
HCL to a purplish end point. The percentage nitrogen was calculated and then multiplied by a
factor (6.25) to get the percentage protein.

67
% Nitrogen = Titre x Ma x 0.0140 x 100
w
where Ma = Molarity of acid used
W = weight of sample
Then % protein = % nitrogen x 6.25
3.5.2 Determination of Free Fatty Acid
This was carried out using Association of Official Analytical Chemist (AOAC, 2006) official
method. Five gram of each sample was put in a conical flask and heated at 60-70oC. Then
100ml of ethanol and 2ml phenolphthalein indicator were added to the heated sample and
titrated against 0.25m NaOH solution to a faint purple colour that persisted for 20 minutes.
Then the free fatty acid content was calculated as oleic acid and also as palmitic acid and
expressed in mg/ml.
3.5.3 Determination of Total Ash
This was carried out by the method described in NAFDAC Standard Operation Procedure
(SOP, 2014) for determination of total ash. For each sample, a clean dish (crucible) was
weighted and the weight recorded as W1. Then 5g of the sample was weighed directly into
the dish and the weight (weight of the dish and sample) and recorded as W2. The dish and the
sample were charred over a flame in a fume cupboard until no smoke was given off. The
crucible and the content were transferred into a muffle furnace (AAF 1100) at 550oC-600
oC
and left to ash. The fully ashed sample (black ash in colour) was cooled in a decicator and the
weight recorded as W3. The percentage ash was then calculated using the formulator.
% ash = W3 – W1 x 100
W2 - W1
3.5.4 Determination of Moisture Content
This was done using electronic moisture analyzer - Sartorius moisture analyzer (MA45). One
gram of each sample was weighted using the in-built balance of the moisture analyzer. The
start/on button was pressed. The reading was taken when signal for completed test (steady
temperature of 105oC was noted).

68
3.5.5 Determination of Crude Fibre
This was carried out by the method described in NAFDAC Standard Operation Procedure
(SOP) for crude fibre determination. Two grams of the sample was put in a 250ml conical
flask. Then 20ml petroleum ether and 200ml of 1.25% NaOH were added into the conical
flask and boiled in a hot plate stirrer for 30 minutes. The residue was filtered out using
Whatman‟s No. 1 filter paper. The weight of empty crucible was recorded as W1. The filter
paper and the residue was placed on the crucible dried in the furnace and the weight of the
crucible together with that of residue was recorded as W2. Then the loss of weight of samples
after ashing was taken as crude fibre content
% crude fibre = W3 - W6 x 100
Wt of samples
Where W3 = weight of residue
W6 = Wt of ash = W5 – W4
W5 = Wt of crucible + ash
W4 = Wt of empty crucible
3.5.6 Determination of total Carbohydrate
Total carbohydrate was obtained by different using
Total carbohydrate = 100 - (% moisture + ash + protein + fat)
3.5.7 Determination of Volatile Acidity
This was carried out by the method (Dimejesi and Iheukwumere, 2014). The distillation
apparatus set up as shown in appendix 3.Five grams of each sample was dissolved in 100ml
of distilled water and poured into round bottom flask and also 1g of anti-bumping chips
added.
Then lL (1000ml) of water was poured into the steam developer (vapour developer) vessels.
Ten millilitres of distilled water was poured in the receptor flask meant for collecting the
distillate. Sixty mililitre of the distillate was poured into a 250ml conical flask, heated to boil,
1ml of 1% alcoholic phenolphthalein indicator solution was added and titrated with 0.81M
NaOH to a faint pink colour and the volume recorded as „a‟ ml. Five mililitres of 25% H2SO4
and 0.1mle of 1% starch solution was also added and immediately titrated with 0.2M iodine
solution in the burette to a blue colour lasting for 10 minutes and the volume recorded as „b‟
ml. Then the volatile acid content was calculated as acetic acid in mg/l using the formula 0-
12 (a-2b)

69
Where „a‟ = volume of NaOH used
„b‟ = volume of iodine used
3.5.8 Determination of Titrable Acidity
The method of Amerine et al (1980) was used. Two hundred mililitres of distilled water was
poured into a 250ml conical flask and brought to boil. Then 2 drops of 1% aqueous
phenolphthalein indicator was added to the boiling water in the conical flask and titrated
against 0.1M NaOH to a faint pink colour and the volume recorded as V1. Five mililitres of
the sample suspension was added and titrated against 0.1M NaOH to a faint pink colour and
the volume recorded as V2. The titrable acidity was calculated and expressed as tartaric acid
in g/100ml using the formula.
Titrable Acidity g/100ml = V1 x MV x 75 x 100
V2 x 1000
Where V1 = Volume of NaOH for neutralizing the water
V2 = Volume of NaOH for neutralizing the sample
M = Molarity of NaOH
V = Volume of sample used
75 = Equivalent weight of tartaric acid
3.5.9 Determination of pH
The pH values of the samples were determined with pH meter (JENWAY 3510). The pH
meter was standardized with buffers of pH 4 and pH 8 respectively and then with distilled
water. The electrode was then inserted in each sample suspension and the readings were
taken.
3.6 Determination of Total Afflatoxin
Samples were extracted and the extracts analyzed using Enzyme Linked Immuno Sorbent
Assay (ELISA) machine (Statfax 303). The extraction was carried out by the method
described in the NAFDAC Standard Operation Procedure (SOP) for Mycotoxin analysis. Five
grams of each sample was put in a conical flask and 25ml of tween ether and ethanol was
added in the ratio of 30:70 (3:7). The mixture in the conical flask was put in orbital shaker
(DS 25002) set at 125 rpm for 20-30 minutes to aid homogenization. The sample was then
filtered with Whatman No. 1 filter paper and the filterate was used for Mycotoxin analysis.

70
Mycotoxin Analysis was carried out using Agra Quant Aflatoxin (1-20 Ppb) Test kit.
Afflatoxin conjugate was pipetted into the desired number of wells using multi-channel
pipette set at 200 l. The standard was pipetted in the ascending order from 0.00 – 20ppb to
the first well using the multi-channel pipette set at 100l. Using the same multi-channel
pipette set at 100 l, the filtered samples were pipetted into the well. The standard was
equally prepared. The whole arrangement was incubated for 15 minutes on a bench and blue
colour change was observed. Finally, stop solution was added in all the wells using multi-
channel pipette set at 100 l and colour change from blue to yellow was observed. The wells
were set well and inserted into the ELISA (Stat fax 3030) machine where the result was
produced and interpreted.
3.7 Determination of Heavy Metals
3.7.1 Determination of Cadmium
This was determined by the use of smart electrophotometer (Lamotte). Cadmium was
selected from the menu button. The samples were extracted using soxhlet extraction
apparatus (GT 301). Ten mililitres of the extracted sample were poured into a cuvette (tube).
The tube was inserted into the spectrophotometer chamber and scanned as blank. The tube
was removed from the spectophotometer. The 1ml of buffered ammonium reagent (402t), 2
drops of 10% sodium citrate, 0.5ml of PAN indicator (4021) cap and 0.5ml stabilizing
reagent (4022) cap were added into the test tube, mixed together and inserted into the
spectophotometer chamber. Scan sample was selected from the menu and the result recorded
in ppm.
3.7.2 Determination of Lead
This was determined using smart spectrophotometer. The tube to be used was rinsed with test
sample and filled with 10ml sample (extract) and scanned as blank. The tube was removed
from the spectrophotometer. Then 5ml of ammonium chloride buffer (4032), 3 drops of 10%
sodium cyanide, 0.5m Pyridylazo resorcinol (PAR) indicator and 0.5ml of stabilizing reagent
were also added to the tube, mixed and inserted into the chamber. The menu scan sample
was selected and the result recorded in ppm.
Thirty three copper Unit Dose Vials (UDV) was selected from the menu. The tube
was rinsed with test sample water and filled with 3ml of the test sample and scanned as blank.
The tube was removed from the chamber. Then 3ml of sample was also added to a copper
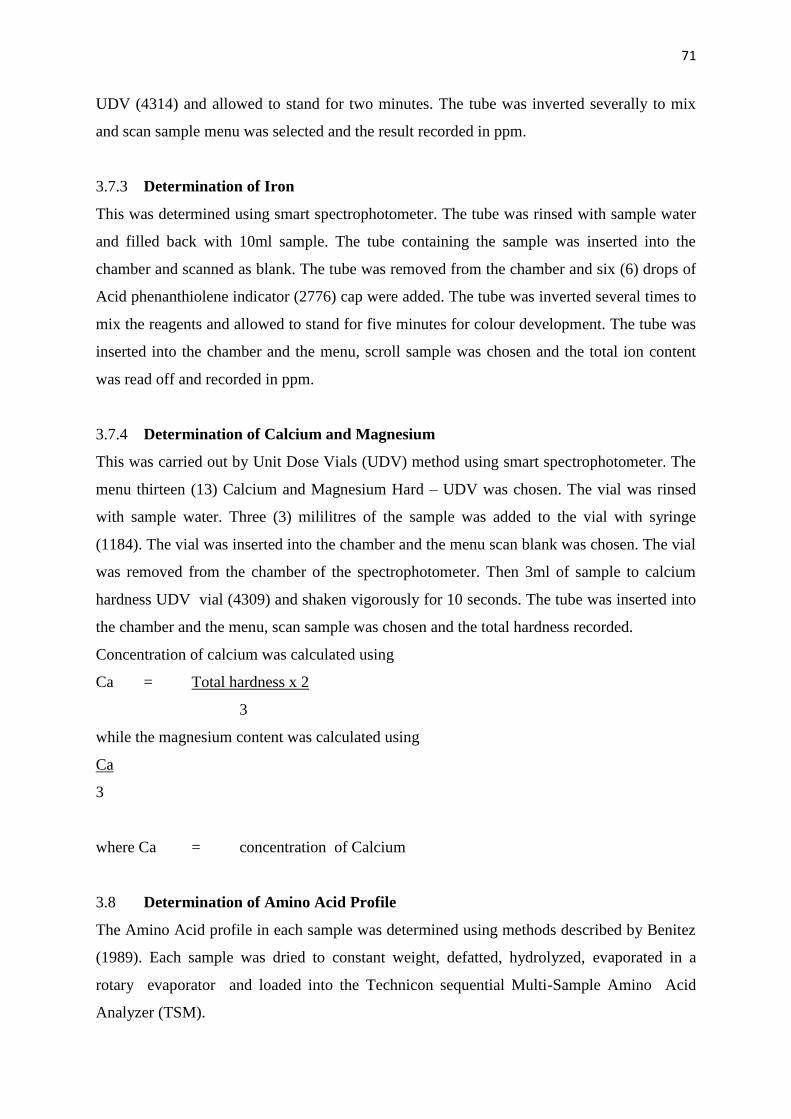
71
UDV (4314) and allowed to stand for two minutes. The tube was inverted severally to mix
and scan sample menu was selected and the result recorded in ppm.
3.7.3 Determination of Iron
This was determined using smart spectrophotometer. The tube was rinsed with sample water
and filled back with 10ml sample. The tube containing the sample was inserted into the
chamber and scanned as blank. The tube was removed from the chamber and six (6) drops of
Acid phenanthiolene indicator (2776) cap were added. The tube was inverted several times to
mix the reagents and allowed to stand for five minutes for colour development. The tube was
inserted into the chamber and the menu, scroll sample was chosen and the total ion content
was read off and recorded in ppm.
3.7.4 Determination of Calcium and Magnesium
This was carried out by Unit Dose Vials (UDV) method using smart spectrophotometer. The
menu thirteen (13) Calcium and Magnesium Hard – UDV was chosen. The vial was rinsed
with sample water. Three (3) mililitres of the sample was added to the vial with syringe
(1184). The vial was inserted into the chamber and the menu scan blank was chosen. The vial
was removed from the chamber of the spectrophotometer. Then 3ml of sample to calcium
hardness UDV vial (4309) and shaken vigorously for 10 seconds. The tube was inserted into
the chamber and the menu, scan sample was chosen and the total hardness recorded.
Concentration of calcium was calculated using
Ca = Total hardness x 2
3
while the magnesium content was calculated using
Ca
3
where Ca = concentration of Calcium
3.8 Determination of Amino Acid Profile
The Amino Acid profile in each sample was determined using methods described by Benitez
(1989). Each sample was dried to constant weight, defatted, hydrolyzed, evaporated in a
rotary evaporator and loaded into the Technicon sequential Multi-Sample Amino Acid
Analyzer (TSM).

72
3.8.1 Defatting of Sample
The sample was defatted using chloroform/methanol mixture of ratio 2:1. About 4g of the
sample was put in extraction thimble and extracted for 15 hours in Soxhlet extraction
apparatus (AOAC, 2006).
3.8.2 Nitrogen Determination
A small amount (200g) of ground sample was weighed, wrapped in Whatman filter (No. 1)
and put in the Kjeldhal digestion flask. Concentrated sulphuric acid (10ml) was added.
Catalyst mixture (0.5g) containing sodium sulphate (Na2SO4), copper sulphate (CuSO4) and
selenium oxide (SeO2) in the ratio of 10:5:1 was added into the flask to facilitate digestion.
Four pieces of anti-bumping granules were added.
The flask and its content was heated for 3 hours in a Kjeldahl digestion apparatus
until the colour turned green. The digested sample was cooled and diluted with distilled water
to 100ml in standard volumetric flask. Aliquot (10ml) of the diluted solution with 10ml of
45% sodium hydroxide was put into the Markham distillation apparatus and distilled into
10ml of 2% boric acid containing 4 drops of bromocresol green/methyl red indicator until
70ml of distillate was collected.
The distillate was then titrated with standardized 0.01 N hydrochloric acid to grey
coloured. Percentage Nitrogen = (a-b) x 0.01 x 14 x V x 100
W x C
3.9 Determination of Critical Control Points
This was determined using the decision tree as described by Rabi et al, 2013.

73
Does the step involve a hazard of sufficient likelihood of occurrence and severity to warrant
its control?
Yes No
Does a control measure for the hazards exist at this step?
Yes No Yes Modify the step or product
Is control at this step necessary? No
Is control at this step necessary to prevent, eliminate or reduce the risk of hazard to
consumers?
Yes No
CCP
Fig. 3.2 Critical Control Point Decision Tree
Source: (Rabi et al., 2013)
CCP
P
CCP
P
CCP
P

74
3.10 Statistical Analyses
The data obtained from the study was subjected to Analysis of Variance (ANOVA)
using computer SPSS (2015) version 20. Differences in means were evaluated at 5% (0.05)
level of significance and direction of interaction between treatment using Turkey HSD POST
HOC Test.

75
CHAPTER FOUR
4.0 RESULTS
The mean heterotrophic bacterial counts were high in virtually all the samples. However, the
highest mean heterotrophic bacterial count was observed in “ogiri” produced from castor oil
seed (5.6 x 10⁸cfu/g) followed by creeping melon (4.8 x 10
8cfu/g), fluted pumpkin (3.7 x
108cfu/g) and climbing melon seeds (2.7 x 10
8cfu/g) (Table 4.1).
The “ogiri” produced from fluted pumpkin showed the highest mean coliform count
(2.5 x 10⁷cfu/g) followed by climbing melon (2.4 x 10
7cfu/g), castor oil seed (2.3 x 10
7cfu/g)
and creeping melon (1.6 x 10⁷cfu/g) as shown in Table 4.2.
The “ogiri” produced from castor oil seed showed the highest mean heterotrophic
fungal counts (4.1 x 10⁷cfu/g) followed by fluted pumpkin (3.2 x 10
7cfu/g), climbing melon
(2.9 x 10⁷cfu/g) and creeping melon (2.2 x 10
7cfu/g) as shown in Table 4.3
The “ogiri” produced from castor oil seeds recorded higher Salmonella – Shigella
counts (3.6 x 10⁷cfu/g) than its counterpart samples, climbing melon (3.4 x 10
7cfu/g), fluted
pumpkin (3.2 x 10⁷cfu/g) and creeping melon seeds (2.7 x10
7cfu/g). Table 4.4 shows mean
Salmonella – Shigella Count of “ogiri” produced from creeping melon, castor oil, fluted
pumpkin and climbing melon seeds.

76
Table 4.1 Mean Heterotrophic Bacterial Counts of “ogiri” Samples Produced from Creeping
Melon, Climbing Melon, Fluted Pumpkin and Castor Oil seeds
Sample Mean Heterotrophic Count (cfu/g)
Locally processed
(x108)
Laboratory Processed
(x106)
Creeping melon 4.80.1 1.10.2
Castor oil 5.60.3 0.50.2
Fluted pumpkin 3.70.2 1.80.1
Climbing melon 2.70.7 1.00.3

77
Table 4.2 Mean Coliform Counts of “ogiri” Samples Produced from Creeping Melon, Castor
Oil, Fluted Pumpkin and Climbing Melon Seeds.
Sample Mean Coliform Count (cfu/g)
Locally Processed
(x107)
Laboratory Processed
(x102)
Creeping melon 1.60.1 0.10.02
Castor oil 2.30.1 1.00.2
Fluted pumpkin 2.50.1 0.20.01
Climbing melon 2.40.1 1.00.01
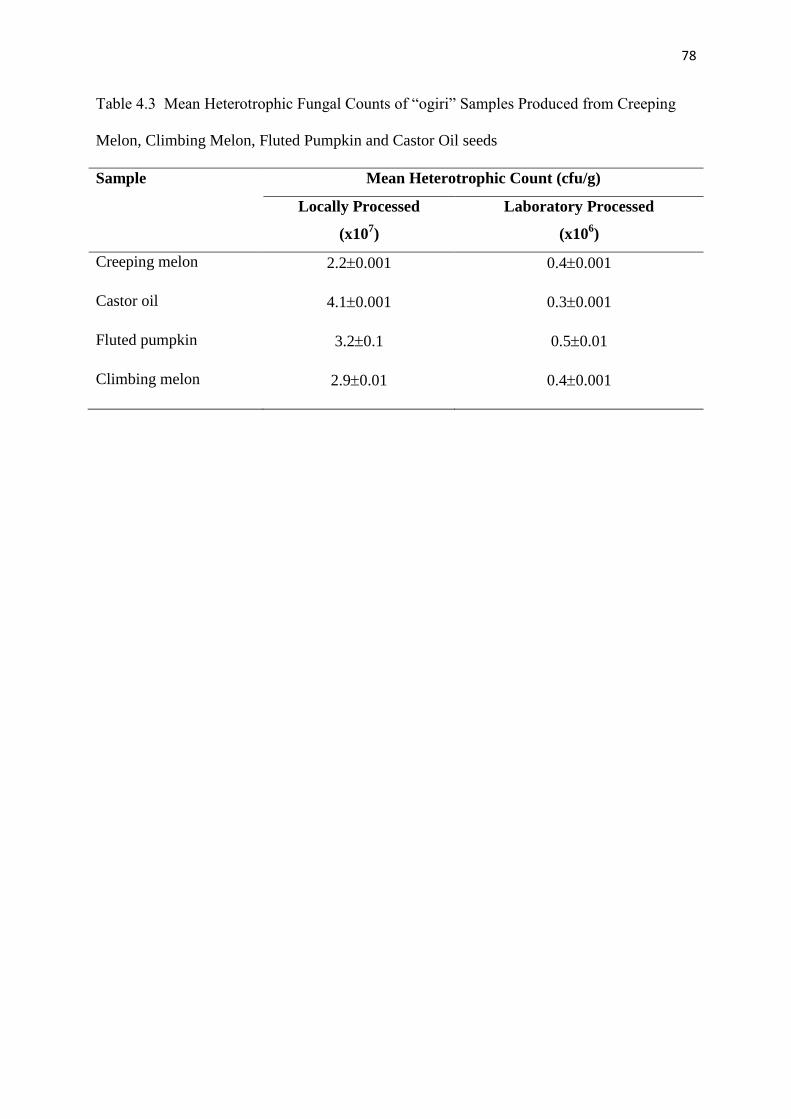
78
Table 4.3 Mean Heterotrophic Fungal Counts of “ogiri” Samples Produced from Creeping
Melon, Climbing Melon, Fluted Pumpkin and Castor Oil seeds
Sample Mean Heterotrophic Count (cfu/g)
Locally Processed
(x107)
Laboratory Processed
(x106)
Creeping melon 2.20.001 0.40.001
Castor oil 4.10.001 0.30.001
Fluted pumpkin 3.20.1 0.50.01
Climbing melon 2.90.01 0.40.001

79
Table 4.4 Mean Salmonella – Shigella Counts of “ogiri” Produced from Creeping Melon,
Castor Oil, Fluted Pumpkin and Climbing Melon Seeds.
Sample Mean Salmonella-Shigella Count (cfu/g)
Locally Processed
(x107)
Laboratory Processed
Creeping melon 2.70.01 NG
Castor oil 3.60.1 NG
Fluted pumpkin 3.20.1 NG
Climbing melon 3.40.1 NG
Key NG = No Growth

80
Table 4.5 shows the mean viable counts of unprocessed and processed “ogiri”
samples from climbing melon, castor oil, creeping melon and fluted pumpkin seeds. The
mean viable counts were higher in the processed samples than the unprocessed samples with
castor oil seed recording the highest mean viable count in processed product (5.2 x 10⁸cfu/g)
followed by creeping melon (4.7 x 10⁸cfu/g), fluted pumpkin (4.5 x 10
8cfu/g) and climbing
melon (3.7 x 10⁸cfu/g). In the unprocessed samples, creeping melon recorded the highest
mean viable count (9.8 x 10⁴cfu/g) followed by castor oil seeds (9.5 x 10
4cfu/g), climbing
melon (8.3 x 10⁴cfu/g) and fluted pumpkin (7.6 x 10⁴cfu/g).
Table 4.6 shows the mean viable count of utensils, packaging materials, water and
handlers involved in “ogiri” production. The mean viable bacterial count was higher in
mortar and pestle (4.5 x 10⁶cfu/ml) than its counterpart samples, leaves (2.5 x 10
6cfu/ml),
water (1.2 x 10⁶cfu/ml), nasal swab (5.0 x 10
3cfu/ml), string (3.8 x 10
3cfu/ml) and skin swab
(3.4 x 10³cfu/ml). There was higher coliform count in the leaves (2.5 x 10
6cfu/ml) than other
samples – mortar and pestle (2.4 x 10⁶cfu/ml), water (2.1 x 10
6cfu/ml), skin swab (3.3 x
103cfu/ml), skin swab (2.8 x 10
3cfu/ml), and string (1.2 x 10
4cfu/ml). The leaves, mortar and
pestle recorded the highest mean viable fungal count (2.0 x 10⁴cfu/ml each) followed by
water (1.0 x 10⁴cfu/ml), nasal swab (4.0 x 10
2cfu/ml), skin swab and string (2.0 x 10
2cfu/ml
each).

81
Table 4.5 Mean Viable Counts of Unprocessed and Processed Samples.
Sample Mean Heterotrophic Count (cfu/g)
Unprocessed (Seeds)
(x104)
Processed (Ogiri)
(x108)
Creeping melon 8.30.05 3.70.10
Castor oil 9.50.03 5.20.04
Fluted pumpkin 9.80.1 4.70.02
Climbing melon 7.60.1 4.50.2

82
Table 4.6 Mean Viable Counts of the Utensils, Packaging Materials, Water and Handlers
involved in “ogiri” Production.
Sample Mean Viable Count (cfu/ml)
NA MA SDA SSA
Leaves for wrapping 2.5 x 10⁶ 2.5 x 10
6 2.0 x 10
4 4.4 x 10
5
Water for mixing 1.2 x 10⁶ 2.1 x 10
6 1.0 x 10
4 2.0 x 10
4
Mortar and Pestle 4.5 x 10⁶ 2.4 x 10
6 2.0 x 10
4 6.5 x 10
6
Handlers (Nasal Swab) 5.0 x 10³ 2.8 x 10
3 4.0 x 10
2 NG
Handlers (Skin Swab) 3.4 x 10³ 3.3 x 10
3 2.0 x 10
2 Ng
String 3.8 x 10³ 1.2 x 10
4 2.0 x 10
2 1.0 x 10
4
Key: SSA = Salmonella-ShigellaAgar
NG = No Growth
NA = Nutrient Agar
MA = MacConkey Agar
SDA = Sabouraud Dextrose Agar

83
A total of seventeen bacterial and four fungal genera were isolated. The isolates were
characterized based on their cultural, morphological and biochemical properties using the
Bergey‟s Manual of Determinative Bacteriology (Holt et al., 1994), the isolates were
tentatively identified as Pseudomonas, Staphylococcus aureus, Lactobacillus, Streptococcus,
Proteus, Escherichia, Klebsiella, Salmonella, Shigella, Bacillus, Flavobacterium,
Micrococcus, Actinomyces, Vibrio and Pediococcus species. Also four types of fungal
species were also isolated. The fungal isolates were characterized based on cultural and
morphological propertiesaccording to (Laron, 2014 and Barneth and Hunter, 2000). The
isolates were identified as Aspergillus, Mucor, Penicillium and Trichoderma species.
Eight out of the isolates were characterized and identified using 165 rDNA
sequencing analysis for bacteria and ITS rDNA sequencing for fungi and the isolates
identified as Pseudomonasplecoglossicida, Bacillus fusiformis (Lysinibacillus fusiformis),
Klebsiella pneumoniae, Enterobacter clocae, Leclercia adecarboxylata, Aspergillus
fumigatus, Aspergillus terreus and Trichoderma reesei, respectively as shown in Tables 4.7
and 4.8.

84
Table 4.7 Characteristics of Bacterial Isolates
Iso
late
s
Cultural
Morphology
Microscopic
Morphology
Gra
m R
ea
ctio
n
Ca
tala
se
Cit
rate
Co
ag
ula
se
Ox
ida
se
Met
hy
l R
ed
Nit
rate
Ind
ole
Vo
ges
Pro
ska
uer
Ure
ase
H2S
Mo
tili
tty
La
cto
se
Ma
lto
se
Glu
cose
Su
cro
se
Xy
lose
Ma
nit
ol
So
rbit
ol
Probable
organism
1 2 3 4 5 6 7 8 9 10 11 12 13 14 15 16 17 18 19
1 On nutrient and
MacConkey agar,
colonies are large,
low convex, rough
and oval in shape.
Some are irregularly
round about 2-3mm
in diameter and emit
fruity odour and also
pigmented (green-
yellow, blue-green
Straight and
slightly curved
rods
-
+
-
-
+
-
+
-
-
+
+
+
-
-
A
-
-
-
-
Pseudomonas
plecoglossicida
2 Colonies are
yellowish, moist and
have smooth
glistering surface on
nutrient agar, appears
pinkish on
MacConkey agar and
about 1-2mm in size.
Cocci in
grape-like
cluster with
some singe
and paired
+
+
-
+
-
+
+
-
+
+
-
-
A
+
A
A
+
A
A
A
Staphylococcus
spp
3 Colonies are round,
entire, low convex,
smooth, transluscent,
colourless and about
2-3mm in diameter
on MacConkey agar
Slender
irregular rods
+
-
-
-
-
-
-
-
-
-
-
-
+
A
+
A
+
A
-
A
A
A
Lactobacillus
spp

85
4 Low convex discrete
colonies about 0.5-
1.0mm in diameter
Spherical
cocci in short
chains
+
-
-
-
+
-
-
-
-
+
-
-
+
+
A
+
A
+
A
A
-
-
Streptococcus
spp
5 Very large swarming
(spreading) growth
(surface), emit
putrefactive fishy
odour and creamy in
colour about 3-5mm
in diameter
Coccobacilli
in short chain
and some are
in pairs
-
+
-
-
-
+
+
+
-
+
+
+
-
-
A
A
A
-
-
Proteus spp
6 Colourless to greyish
smooth colonies on
nutrient agar, rose
pink, large colonies
of MacConkey agar
about 2-3mm in
diameter
Rod shaped
-
+
-
-
-
+
+
+
-
-
+
+
+
A
A
+
A
+
-
A
+
A
-
Escherichia
coli
7 On MacConkey agar,
colonies appear large,
mucoid and red,
colourless to grey on
nutrient agar.
Rod shaped
-
+
+
-
-
-
+
-
+
+
-
-
+
A
A
+
A
+
A
A
+
A
A
K. pneumoniae
8 Colonies are greyish
to white circular,
moist, convex and
transluscent in
nutrient agar
Pale yellow on
MacConkey agar,
colourless with black
centre on SSA, about
2-3mm in diameter
Rod shaped
-
+
+
-
-
+
+
-
-
-
+
+
+
A
+
A
+
A
A
+
A
+
A
A
Salmonella spp

86
9 Smooth greyish
colour, transluscent
colonies on nutrient
agar, colourles on
MacConkey agar,
colourless without
blackening on SSA
Short rods in
pairs
-
+
-
-
-
+
+
-
-
-
-
-
+
A
+
A
+
A
+
A
+
A
+
A
+
A
Shigella spp
10 Large, greenish,
raised, wide-
spreading with
irregular fingerlike
edges and opaque
about 2-3mm in
diameter
Long straight
rods in single,
some in pairs
+
+
+
-
+
-
+
-
-
+
-
-
+
-
+
A
+
A
+
A
A
A
A
Bacilus
Fusiforms
11 Small, smooth,
yellow and
transluscent colonies
about 1-2mm in
diameter
Short slender
rods
-
+
+
-
+
-
-
-
-
-
-
-
+
A
+
A
+
A
+
A
+
A
+
A
+
A
Flavobacterium
spp
12 Smooth yellow
colonies, shinny,
raised and some with
elevated centres,
about 1-2mm
diameter
Small
irregular rods
in pairs and
tetrads
+
+
-
-
-
-
-
-
+
+
-
+
-
A
-
+
-
A
-
-
Micrococcus
spp
13 White to yellow
colonies that are star-
shaped with irregular
edges
Fetted mass of
branding
filament
which are
interlaced.
+
-
-
-
+
+
+
-
-
+
-
-
A
A
A
A
A
A
A
A
Actinomyces
spp
14 Round , greenish to
bluish colonies about
2-3mm in diameter
Curved and
straight
-
+
+
-
+
+
+
+
+
+
-
+
-
A
A
-
A
A
A
Vibrio

87
15 Very small flat
colonies, white to
colourless colonies
on nutrient agar,
about 1mm in
diameter.
Cocci in tetrad
or in short
chain
+
-
-
-
-
+
+
-
-
-
+
-
A
+
A
A
A
A
A
A
Pediococcus
spp
16
Greyish smooth
colonies
Gram negative
Rods
-
+
-
-
-
+
+
+
-
+
+
+
-
-
A
G
A
G
-
-
A
G
Leclercia
Adecarboxylata
17
Large mucoid
colonies on red
Mackonkey agar
Rod shaped
-
+
+
-
-
-
+
+
-
+
+
-
-
+
A
G
A
G
A
G
A
G
A
Enterobacter
Cloacae

88
Table 4.8 Characteristics and Identity of Fungi Isolates
Isolate Colony
Morphology
Microscopic
Morphology
Probable
Identity
1 Greenish white, Flat,
irregular shaped, dry
and dull
Septate, hyphae,
conidia arranged like
mob-heead
Penicillium spp
2 White filamentous
colonies
Non-septate hyphae,
spores enclosed in a
sporangium
Mucor spp
3 Granular to wooly
colonies that have
some shade of yellow
or yellow-brown
Long conidiophores Aspergillus spp
4 1-2 concentric rings
with green conidal
production which is
denser in the centre
with irregular yellow
zones
Conidia shape
glubose to
subglobose
Trichoderma reesei

89
Table 4.9 shows the total bacterial counts during the 6-day fermentation of castor oil,
creeping melon, climbing melon and fluted pumpkin seeds for “ogiri” production. There was
a general increase in the bacterial counts in the first 4 days of fermentation. The bacterial
count in castor oil decreases on the fifth day and increased thereafter, while in the other
samples (creeping melon, fluted pumpkin and climbing melon) there was a continuous
decrease in the bacterial counts.
Table 4.10 shows total fungal count during the 6-day fermentation of castor oil,
creeping melon, fluted pumpkin and climbing melon seeds for “ogiri” production. There was
a general decrease in the fungal counts in all the samples with days of fermentation.
However, the fungi disappear after 2-3 days.

90
Table 4.9 Total Bacterial Count during the Six-Day Fermentation of Castor Oil, Creeping
Melon, Climbing Melon and Fluted Pumpkin Seeds for “ogiri” Production
Day Total Bacterial Count (cfu/g)
Castor Oil
Seed
(x109)
Creeping
Melon Seed
(x106)
Fluted
Pumpkin
Seed
(x106)
Climbing
Melon
Seed
(x106)
0 0.9 0.8 0.6 0.7
1 1.0 1.2 2.0 1.1
2 1.2 1.3 3.1 0.5
3 1.4 1.6 3.3 0.4
4 1.6 1.9 3.5 0.3
5 1.4 1.6 2.2 0.2
6 1.9 1.3 1.5 0.1

91
Table 4.10 Total Fungi Count during the Six-Day Fermentation of Castor Oil, Creeping
Melon, Fluted Pumpkin and Climbing Melon Seeds for “ogiri” Production.
Day Total Fungal Count (cfu/g)
Castor Oil
Seed
(x104)
Creeping
Melon Seed
(x106)
Fluted
Pumpkin
Seed
(x106)
Climbing
Melon
Seed
(x106)
0 0.4 0.5 0.6 0.5
1 0.2 0.3 0.5 0.4
2 0.1 0.2 0.5 0.3
3 0.1 0.1 0.4 NG
4 NG NG NG NG
5 NG NG NG NG
6 NG NG NG NG
Key: NG = No Growth

92
The result of proximate analysis of the unprocessed creeping melon, climbing melon,
fluted pumpkin and castor oil seed samples and their resultant fermented products (“ogiri”)
are shown in Table 4.11. The moisture content of the fermented products was higher (40.34-
73.79%) than in the unprocessed substrates (seeds) (9.73-41.34%). The crude fibre contents
of the fermented products were lower (2.0-3.0%) than the unprocessed seeds (2.5-3.5%).
The fat content decreased in all the samples from the unprocessed seeds (31.22-
34.82%) to (22.00-25.20%) in the fermented products. The protein content was higher in the
unprocessed seeds (8.40-13.48%) than in the fermented products (4.80-7.96%). The free fatty
acid (FFA) content was higher in the fermented products (7.68-17-68%) than in the
unprocessed seeds (5.25-16.64%). The carbohydrate content was higher in the fermented
products (55.020-56.88%) than in the unprocessed seeds (46.51-48.33%).
The titrable acidity was higher in the fermented products (0.62-0.75g/100ml) than in
the unprocessed seed (0.25-0.3g/100ml). The ash content is lower in the fermented samples
(2.6-3.2%) than in unprocessed seeds (3.4-3.6%).
The volatile acidity was higher in the fermented products (0.07-0.08g/100ml) than in
the unprocessed (0.03-0.05g/100ml) in virtually all the samples as fermentation progressed.
The pH in the unfermented seeds ranged from 6.2-6.4 and 7.2-7.5 in the fermented
products

93
Table 4.11 Proximate Composition of Unprocessed and Processed Castor Oil, Fluted Pumpkin, Cucumeropsis and Melon Seeds
Castor Oil Seed Cucumeropsis manii Fluted Pumpkin Seed Melon Seed
Unprocessed Fermented Unprocessed Fermented Unprocessed Fermented Unprocessed Fermented
Protein (%) 4.300.10 3.900.10 5.700.27 4.800.27 8.400.10 4.200.10 13.480.01 7.960.01
Fat (%) 34.820.01 25.200.10 31.220.01 22.001.00 15.600.10 5.001.00 23.490.01 17.400.10
FFA (mg/ml) 16.640.01 17.680.02 3.580.01 4.500.10 3.460.01 7.680.03 5.250.01 6.910.01
Ash (%) 3.01.00 3.20.17 0.20.10 0.150.01 3.400.10 1.600.10 3.600.10 2.600.10
Moisture content (%) 4.860.03 40.340.01 6.001.00 20.650.01 41.340.01 73.790.01 9.730.01 25.530.01
Crude fibre (%) 2.500.10 2.001.00 0.500.10 0.400.10 1.600.20 1.500.10 3.500.10 3.300.10
Carbohydrates (%) 46.510.03 55.020.01 48.330.03 56.880.01 31.260.01 38.700.01 36.510.02 44.990.01
Titrable acidity (g/100ml) 0.250.01 0.620.01 0.300.01 0.600.01 0.150.01 0.400.10 0.300.01 0.750.01
Volatile acidity (g/100ml) 0.050.01 0.080.01 0.040.01 0.070.01 0.030.01 0.060.01 0.020.01 0.040.01
pH 6.40.10 7.20.17 6.20.10 7.50.17 6.10.10 7.10.10 6.20.10 6.900.10

94
The results of the mineral analysis is shown in Table 4.12.
The calcium content was higher in the unprocessed seeds (20.001.00), 21.301.00 in
climbing melon, than the fermented seeds of castor oil and Cucumeropsis manii (20.001 and
18.750.17) while is higher in the fermented fluted pumpkin and creeping melon seed (38.70-
72.70ppm) as against that in unprocessed seeds (21.30-34.70ppm). The copper content is
higher in all the unprocessed seeds except that of fluted pumpkin. There is higher
concentration of cadmium in the unprocessed seeds (0.63-0.67ppm) than in the fermented
products (0.40-0.60ppm). There was a decrease in the concentration of lead in virtually all the
samples from unprocessed to fermented. The iron content is higher in the fermented products
than in the unprocessed seeds except in that of Cucumeropsis manii. The magnesium content
of unprocessed seeds are higher (11.6-15.3ppm) than in the fermented products (9.6-
14.3ppm)

95
Table 4.12 Mineral Content of Unprocessed and Fermented Castor Oil, Fluted Pumpkin, Cucumeropsis manii and Melon Seeds
Castor Oil Seed Cucumeropsis manii Fluted Pumpkin Seeds Melon Seed
Unprocessed Fermented Unprocessed Fermented Unprocessed Fermented Unprocessed Fermented
Calcium
(ppm)
26.001.00 20.001.00 21.300.17 18.750.01 46.001.00 72.700.17 34.200.10 38.700.17
Copper (ppm) 0.330.02 0.180.01 0.380.02 0.270.03 0.230.02 0.260.01 0.980.01 0.600.10
Cadmiun
(ppm)
0.630.02 0.600.10 0.590.01 0.400.22 0.200.10 0.100.02 0.670.01 0.100.01
Lead (ppm) 0.200.01 0.010.01 2.800.10 1.200.10 0.200.01 0.100.01 0.100.053 0.100.56
Iron (ppm) 0.500.10 0.800.10 0.890.01 0.700.01 1.420.05 0.530.01 1.350.01 0.520.01
Magnesium
(ppm)
9.300.10 0.100.10 7.100.17 6.250.10 15.300.10 14.300.17 11.660.01 9.600.10

96
The amino acid analysis for various samples is shown in Table 4.13. There was a
decrease in the concentration of amino acids from nearly all the unprocessed to the fermented
samples, except in Argmine, Isoleucine and Leucine where the reverse is the case. The
concentration of amino acid, proline remained the same (2.90g/100ml), Glutamic acid
recorded the highest concentration of amino acid in both fermented and unprocessed samples
(12.49-15.21g/100ml protein) followed by Aspartic acid, Argmine and Valine. The
tryptophan contents were low (0.8-1.32g/100g protein) in virtually all the samples. Similarly,
the concentrations of cystine and methionme were also low - (1.29-1.5g/100 protein) and
(1.31-1.5g/100g protein) respectively in all the samples.

97
Table 4.13 Amino Acid Profile of the Samples
Concentration of amino acid (g/100g) Protein
Amino Acid Unprocessed
Castor oil
Seed
Fermented
Castor oil
Seed
Unprocessed
Melon Seed
Fermented
Melon Seed
Unprocessed
Cucumeropsis
Fermented
Cucumeropsis
Unprocessed
Pumpkin
Seed
Fermented
Pumpkin
Seed
Lysine 3.790.01 3.490.01 3.600.20 3.710.01 4.200.01 4.100.01 3.300.20 3.100.01
Histidine 3.020.01 2.830.01 2.95 0.10 3.010.01 2.890.01 2.560.01 2.500.10 2.200.01
Arginnie 7.830.01 8.010.01 8.590.01 7.490.01 9.280.01 8.300.01 8.760.01 7.920.01
Aspartic acid 8.330.02 7.640.01 7.830.01 3.010.01 8.650.02 6.500.01 7.890.01 6.850.01
Threonine 3.150.02 2.490.01 3.070.01 2.720.02 2.300.02 2.120.01 2.500.01 2.300.02
Serine 3.490.02 3.110.01 3.700.01 3.520.01 4.230.02 4.050.01 3.550.01 3.160.01
Glutamic acid 13.430.01 12.930.01 14.080.01 13.220.10 15.210.01 14.210.01 13.580.01 13.110.10
Proline 2.900.10 2.900.10 3.130.01 3.360.02 3.590.10 3.320.10 2.550.01 2.250.02
Glyenie 4.500.10 4.010.01 3.680.01 3.400.10 4.020.10 3.850.01 2.630.01 2.300.10
Alanine 4.020.01 3.720.01 4.100.10 3.870.01 4.480.01 3.870.01 4.350.10 4.020.01
Cystine 1.520.01 1.290.01 1.310.01 1.380.02 1.380.01 1.420.01 1.450.01 1.340.02
Valine 5.200.10 3.680.01 3.920.01 4.070.01 4.100.10 4.200.01 4.500.01 4.060.01
Methronine 1.630.02 1.310.01 1.310.01 1.340.01 1.450.02 1.480.01 1.500.01 1.230.01
Isoleucine 3.020.01 3.130.01 3.290.01 3.230.01 3.230.01 3.150.01 3.390.01 3.010.01
Leucine 5.600.10 5.810.01 6.490.01 6.280.01 6.690.10 6.520.01 6.190.01 5.480.01
Tryosine 2.480.02 2.340.01 2.650.01 2.480.01 2.980.02 2.630.01 3.150.01 2.550.01
Phenylalanine 4.490.02 4.230.01 4.310.01 4.050.01 5.100.02 4.870.01 4.050.02 3.780.01
Tryptophan 1.110.01 1.090.01 1.220.01 1.090.01 1.320.01 1.100.01 0.800.01 0.500.01

98
There was a decrease in the pH in all the samples (0-72 hours) and increase after 96
hours as shown in Tables 4.14, 4.15, 4.16 and 4.17.
The titrable acidity and volatile acidity decrease throughout the fermentation period in
virtually all the samples as shown in Tables 4.18 – 4.25.

99
Table 4.14 Changes in pH during the 4-Day Fermentation of “ogiri” Samples Produced from
Melon Seeds.
Fermentation
Period (Hour)
pH
Sample 1 2 3 4 5
0 6.380.29 6.500.29 6.900.29 6.800.29 6.200.29
24 6.300.36 6.000.36 6.800.36 6.600.36 6.000.36
48 5.300.64 5.000.64 6.500.64 6.300.64 5.900.64
72 5.200.57 4.800.50 6.200.59 6.000.59 5.500.59
96 6.000.46 5.600.46 6.800.46 6.500.46 6.200.46
Key: 1, 2, 3, 4 and 5 = different samples of “ogiri” melon seeds.

100
Table 4.15 pH Changes during 4-Day Fermentation of “ogiri” produced from Castor Oil
Seeds.
Fermentation
Period (Hour)
pH
Sample 8 9 10 11 12
0 7.00.27 6.80.27 6.60.27 6.60.27 6.80.27
24 6.60.13 6.50.13 6.40.13 6.30.13 6.60.43
48 5.30.54 5.30.54 6.10.54 5.10.54 6.30.54
72 5.20.45 5.20.45 5.00.45 5.00.45 6.00.45
96 6.00.39 6.80.39 5.90.39 6.00.39 6.50.39
Key: 8, 9, 10, 11 and 12 = different samples of “ogiri” from castor oil seeds.

101
Table 4.16 pH Changes during 4-Day Fermentation of “ogiri” Samples produced from Fluted
Pumpkin Seeds.
Fermentation
Period (Hour)
pH
Sample 15 16 17 18 19
0 6.00.13 6.10.13 6.20.13 6.00.13 6.30.13
24 5.90.06 6.00.06 6.00.06 5.90.06 6.00.06
48 4.90.58 4.40.58 5.50.58 5.80.58 5.60.58
72 4.80.50 4.20.50 5.00.50 5.60.50 4.90.50
96 5.70.30 5.10.30 5.60.30 5.90.30 5.70.30
Key: 15, 16, 17, 18 and 19 = different samples of “ogiri from fluted pumpkin seeds

102
Table 4.17 pH Changes during the 4-Day Fermentation of “ogiri” Samples produced from
Cucumeropsis Seeds.
Fermentation
Period (Hour)
pH
Sample 22 23 24 25 26
0 6.50.11 6.60.11 6.70.11 6.50.11 6.40.11
24 6.40.14 6.40.14 6.60.14 6.40.14 6.20.14
48 5.00.56 5.30.56 6.30.56 6.00.56 6.10.56
72 4.90.23 5.20.23 5.50.23 5.50.23 5.60.23
96 5.60.18 5.50.18 5.90.18 5.80.18 5.90.18
Key: 22, 23, 24, 25 and 26 = different samples of “ogiri” from Cucumeropsis seeds

103
Table 4.18 Titrable Acidity during the 4-Day Fermentation of “ogiri” Samples produced
from Melon Seeds.
Fermentation
Period (Hour)
Titrable Acidity (g/100ml)
Sample 1 2 3 4 5
0 0.700.20 0.400.20 0.700.20 0.400.02 0.420.02
24 0.400.09 0.300.09 0.500.09 0.300.09 0.300.09
48 0.300.07 0.210.07 0.400.07 0.250.07 0.250.07
72 0.200.02 0.200.02 0.200.02 0.220.02 0.250.02
96 0.100.39 0.100.39 0.100.39 0.200.39 0.140.39
Key: 1, 2, 3, 4 and 5 = different samples of “ogiri” from melon seeds.

104
Table 4.19 Titrable Acidity during the 4-Day Fermentation of “ogiri” Samples produced
from Castor Oil Seeds.
Fermentation
Period (Hour)
Titrable Acidity (g/100ml)
Sample 8 9 10 11 12
0 0.410.11 0.600.11 0.500.11 0.700.11 0.600.11
24 0.300.11 0.500.11 0.400.11 0.600.11 0.500.11
48 0.280.09 0.400.09 0.300.09 0.500.09 0.400.09
72 0.200.06 0.300.06 0.200.06 0.300.06 0.200.06
96 0.100.06 0.200.06 0.100.06 0.200.06 0.100.06
Key: 8, 9, 10, 11 and 12 = different samples of “ogiri” from castor oil seeds

105
Table 4.20 Titrable Acidity during 4-Day Fermentation of “ogiri” Samples produced from
Fluted Pumpkin Seeds.
Fermentation
Period (Hour)
Titrable Acidity (g/100ml)
Sample 15 16 17 18 19
0 0.320.02 0.360.02 0.350.02 0.330.02 0.360.02
24 0.630.12 0.370.12 0.380.12 0.360.12 0.370.12
48 0.670.13 0.380.13 0.390.13 0.380.13 0.380.13
72 0.700.13 0.400.13 0.410.13 0.400.13 0.390.13
96 0.720.09 0.530.09 0.500.09 0.520.09 0.500.09
Key: 15, 16, 17, 18 and 19 = different samples of “ogiri” from fluted pumpkin seeds.

106
Table 4.21 Titrable Acidity during the 4-Day Fermentation of “ogiri” Samples produced
from Cucumeropsis Seeds.
Fermentation
Period (Hour)
Titrable Acidity (g/100ml)
Sample 22 23 24 25 26
0 0.570.09 0.600.09 0.380.09 0.450.09 0.500.09
24 0.550.09 0.520.09 0.350.09 0.400.09 0.430.09
48 0.400.08 0.450.08 0.250.08 0.300.08 0.350.08
72 0.320.05 0.300.05 0.200.05 0.280.05 0.260.05
96 0.200.02 0.180.02 0.150.02 0.190.02 0.160.02
Key: 22, 23, 24, 25 and 26 = different samples of “ogiri” from Cucumeropsis seeds.

107
Table 4.22 Volatile Acidity during the 4-Day Fermentation of “ogiri” Samples produced
from Melon Seeds.
Fermentation
Period (Hour)
Volatile Acidity (g/100ml)
Sample 1 2 3 4 5
0 0.050.01 0.030.01 0.040.01 0.050.01 0.030.01
24 0.070.01 0.050.01 0.060.01 0.060.01 0.060.01
48 0.090.01 0.060.01 0.070.01 0.070.01 0.80.01
72 0.120.02 0.080.02 0.090.02 0.090.02 0.090.02
96 0.130.01 0.120.01 0.140.01 0.120.01 0.120.01
Key: 1, 2, 3, 4 and 5 = different samples of “ogiri” from melon seeds.

108
Table 4.23 Volatile Acidity during 4-Day Fermentation of “ogiri” Samples produced from
Castor Oil Seeds.
Fermentation
Period (Hour)
Volatile Acidity (g/100ml)
Sample 8 9 10 11 12
0 0.060.02 0.050.02 0.070.02 0.040.02 0.080.02
24 0.070.01 0.070.01 0.080.01 0.060.01 0.090.01
48 0.080.02 0.090.02 0.120.02 0.080.02 0.100.02
72 0.090.02 0.100.02 0.130.02 0.090.02 0.110.02
96 0.100.02 0.120.02 0.140.02 0.110.02 0.130.02
Key: 8, 9, 10, 11 and 12 = different samples of “ogiri” from castor oil seeds.

109
Table 4.24 Volatile Acidity during 4-Day Fermentation of “ogiri” Samples produced from
Fluted Pumpkin Seeds.
Fermentation
Period (Hour)
Volatile Acidity (g/100ml)
Sample 15 16 17 18 19
0 0.060.02 0.020.02 0.040.02 0.050.02 0.030.02
24 0.070.01 0.050.01 0.060.01 0.070.01 0.050.01
48 0.080.02 0.060.02 0.070.02 0.100.02 0.070.02
72 0.160.03 0.130.03 0.090.03 0.120.03 0.090.03
96 0.180.03 0.140.03 0.120.03 0.130.03 0.110.03
Key: 15, 16, 17, 18 and 19 = different samples of “ogiri” from fluted pumpkin seeds

110
Table 4.25 Volatile Acidity during the 4-Day Fermentation of “ogiri” Samples produced
from Cucumeropsis Seeds.
Fermentation
Period (Hour)
Volatile Acidity (g/100ml)
Sample 22 23 24 25 26
0 0.040.01 0.050.01 0.040.01 0.030.01 0.050.01
24 0.060.01 0.060.01 0.060.01 0.070.01 0.070.01
48 0.080.01 0.070.01 0.080.01 0.090.01 0.080.01
72 0.100.01 0.080.01 0.100.01 0.110.01 0.100.01
96 0.110.39 1.000.39 0.120.39 0.130.39 0.120.39
Key: 22, 23, 24, 25 and 26 = different samples of “ogiri” from Cucumeropsis seeds.

111
Afflatoxin content was higher in castor oil seed and this is above the limit 20ppb
while that of climbing melon has lower afflatoxin content. However, afflatoxin was not
detected in the laboratory dehulled seedsand fermented seed as shown in Table 4.26.

112
Table 4.26 Total Afflatoxin Contents of Laboratory Dehulled, Hawked and Fermented
Creeping Melon, Climbing Melon,, Fluted Pumpkin and Castor Oil Seeds.
Sample Afflatoxin Concentration (ppb)
Laboratory
Dehulled Seeds
Hawked
Seeds
Fermented
Seeds (“ogiri”)
Creeping Melon Seed ND 3.0 ND
Climbing Melon Seed ND 2.0 ND
Castor Oil Seed ND > 20 ND
Fluted Pumpkin Seed ND 1.0 ND
Key: ND = Not Detected

113
Table 4.27 shows the mineral contents of castor oil seed obtained from various
sources. The cadmium content of castor oil seed obtained from Kogi (0.85 ppm), Kebbi (0.90
ppm), Katsina (0.80 ppm), Kano (0.56 ppm), Kaduna (0.58 ppm) and Enugu (0.60 ppm) are
higher than their counterpart sources, Abia (0.40 ppm), Anambra (0.35 ppm), Ebonyi 0.50
ppm) and Imo (0.41 ppm). The lead content ranged from 0.01 ppm to 0.40 ppm with that
obtained from Katsina and Kaduna registering the highest concentration (0.40 ppm each).
The calcium content ranged from 25.00 ppm to 27.00 ppm with that from Kebbi State
recording the highest concentration (27.00 ppm). The copper content ranged from 0.26 ppm
to 0.44 ppm. The iron content ranged from 0.50 ppm to 0.60 ppm. The magnesium content
ranged from 8.0 ppm to 10.20 ppm.
Table 4.28 shows the mineral content of creeping melon seeds obtained from various
sources. The cadmium content ranged from 0.28 ppm to 0.98 ppm with that obtained from
Kogi State registering the highest concentration (0.98 ppm) while that from Abia State
registering the lowest concentration (0.28 ppm). The lead content ranges from (0.01 ppm to
0.18 ppm) with the one obtained from Benue State registering higher concentration (0.18
ppm) while that from Anambra State registering the lowest concentration. The cadmium
content ranges from 33.35 ppm to 34.50 ppm with the one from Benue State recoding the
highest concentration and that from Kogi recording the lowest concentration. The iron
content ranges from 1.29 to 1.52 ppm with the one from Kogi State registering the highest
concentration and that from Benue State recording the lowest. The magnesium content ranges
from 10.88 ppm to 12.68 ppm with the one from Benue State recording the highest
concentration (12.68 ppm) and that from Katsina registering the lowest concentration (10.88
ppm)
Table 4.29 shows the mineral content of fluted pumpkin seeds obtained from various
sources. The cadmium content ranges from 0.10 ppm to 0.35 ppm with the one from Kebbi
State recording the highest (0.35 ppm) concentration while that from Abia State recording the
lowest concentration (0.10 ppm). The lead content ranges from 0.01 ppm to 0.22 ppm with
the one obtained from Kebbi State registering the highest concentration (0.22 ppm) while that
obtained from Imo State registering the lowest concentration (0.01 ppm). The copper content
ranges from 4.01 ppm to 47.89 ppm with the one from Kano registering the highest
concentration (47.89 ppm) and that from Kaduna registering the lowest concentration (42.01
ppm). The iron content ranges from 1.12 ppm to 1.80 ppm with the one from Kogi State
registering the highest concentration (1.80 ppm) and that from Anambra registering the
lowest concentration (1.12 ppm). The magnesium content ranges from 14.05 ppm to 16.05

114
ppm with the one from Ebonyi State recording the highest concentration (16.05 ppm) and that
from Anambra State registering the lowest concentration (14.05 ppm)
Table 4.30 shows the mineral content of climbing melon seeds from various sources.
The cadmium content ranges from 0.35 ppm to 1.00 ppm with the one obtained from Kogi
State recording the highest concentration (1.00 ppm) and that from Anambra recording the
lowest concentration (0.35 ppm). The lead content ranges from 1.85 ppm to 3.60 ppm with
the one from Kogi registering the highest concentration (3.60 ppm) and that from Anambra
recording the lowest concentration (1.85 ppm). The calcium content ranges from 2.80 ppm to
21.78 ppm with the one from Katsina State registering the highest concentration (21.78 ppm)
and that from Kano registering the lowest concentration (20.80 ppm). The copper content
ranges from 0.30 ppm to 0.50 ppm with the one obtained from Kano State registering the
highest concentration (0.50 ppm) and that from Anambra State registering the lowest
concentration (0.30 ppm). The iron content ranges from 0.70 ppm to 1.20 ppm with the one
from Kogi State recording the highest concentration (1.2 ppm) and that from Abia and
Anambra States recording the lowest concentrations (0.73 ppm each). The concentration of
magnesium ranges from 6.81 ppm to 7.50 ppm with the one from Kogi State registering the
highest concentration (7.50 ppm) and that from Anambra recording the lowest concentration
(6.81 ppm).
.

115
Table 4.27 Mineral Content of Castor Oil Seed Samples from various Sources
Sample Source
(State)
Mineral Content (ppm)
Calcium Copper Cadmium Lead Iron Magnesium
Abia 26.00 0.30 0.40 0.01 0.48 9.25
Anambra 25.50 0.29 0.35 0.02 0.49 9.30
Benue 25.00 0.31 0.65 0.25 0.47 9.26
Ebonyi 26.50 0.28 0.50 0.20 0.54 8.95
Enugu 26.50 0.35 0.60 0.05 0.46 8.98
Imo 25.20 0.26 0.41 0.02 0.48 8.86
Kaduna 26.60 0.42 0.58 0.40 0.50 8.80
Kano 26.80 0.33 0.56 0.22 0.52 9.60
Katsina 25.80 0.44 0.80 0.40 0.45 9.10
Kebbi 27.00 0.32 0.90 0.30 0.60 10.00
Kogi 25.00 0.33 0.85 0.33 0.51 10.20

116
Table 4.28 Mineral Contents of Creeping Melon Seed Samples from various Sources.
Sample Source
(State)
Mineral Content (ppm)
Calcium Copper Cadmium Lead Iron Magnesium
Abia 34.20 0.95 0.28 0.01 1.36 11.65
Anambra 34.00 0.93 0.30 0.02 1.34 11.66
Benue 34.50 0.90 0.70 0.18 1.29 12.68
Ebonyi 33.90 0.89 0.60 0.12 1.31 11.59
Enugu 35.00 0.97 0.70 0.10 1.37 11.62
Imo 33.80 0.95 0.50 0.05 1.33 11.64
Kaduna 34.10 0.98 0.67 0.10 1.36 11.70
Kano 33.95 1.20 0.80 0.12 1.32 12.00
Katsina 35.05 0.99 0.95 0.13 1.30 10.88
Kebbi 33.50 1.02 0.85 0.14 1.35 10.90
Kogi 33.35 1.00 0.98 0.13 1.52 11.94

117
Table 4.29 Mineral Contents of Fluted Pumpkin Seed Samples from various Sources
Sample Source
(State)
Mineral Content (ppm)
Calcium Copper Cadmium Lead Iron Magnesium
Abia 46.70 0.15 0.10 0.03 1.16 14.15
Anambra 42.20 0.10 0.11 0.02 1.12 14.05
Benue 47.80 0.23 0.29 0.09 1.35 14.95
Ebonyi 43.00 0.20 0.24 0.07 1.62 16.05
Enugu 42.90 0.25 0.23 0.09 1.35 15.30
Imo 46.99 0.18 0.10 0.01 1.60 15.60
Kaduna 42.01 0.24 0.31 0.15 1.40 16.00
Kano 47.89 0.30 0.20 0.10 1.50 15.20
Katsina 43.03 0.28 0.25 0.12 1.30 15.00
Kebbi 44.49 0.35 0.35 0.22 1.42 16.02
Kogi 44.30 0.25 0.30 0.20 1.80 15.98

118
Table 4.30 Mineral Content of Climbing Melon Seed Samples from various Sources.
Sample Source
(State)
Mineral Content (ppm)
Calcium Copper Cadmium Lead Iron Magnesium
Abia 21.30 0.35 0.38 1.98 0.73 6.81
Anambra 21.20 0.30 0.35 1.85 0.73 6.85
Benue 21.26 0.38 0.74 3.43 0.79 7.15
Ebonyi 21.50 0.40 0.38 2.00 0.82 6.88
Enugu 22.00 0.37 0.50 2.75 0.98 7.50
Imo 20.95 0.41 0.40 2.85 0.75 7.12
Kaduna 21.10 0.36 0.65 2.99 0.85 7.08
Kano 20.80 0.50 0.70 2.80 0.89 6.95
Katsina 21.78 0.31 0.59 3.05 1.05 7.00
Kebbi 21.21 0.40 0.80 3.50 1.00 7.20
Kogi 22.23 0.40 1.00 3.60 1.2 7.50

119
Table 4.31 Shows the mean bacterial and fungal counts (cfu/g/ml) of samples from the
production stages of “ogiri” from creeping melon, climbing melon, fluted pumpkin and castor
oil seeds.
Production Stage Heterotrophic
Bacterial
Count
(x106)
Coliform
count
(x106)
Salmonella-
Shigella
Count
(x106)
Fungal
Counts
(x104)
Raw seed 5.0 4.2 3.5 4.2
Boiled seed 4.8 3.4 3.0 3.7
Fermented seed 4.9 4.3 3.4 4.3
Nasal swab 5.5 3.4 NG 5.2
Skin swab 3.5 3.2 NG 3.0
Mortar 4.5 2.4 6.5 1.4
Pestle 4.4 2.2 5.8 1.5
Water 1.2 2.3 2.1 2.0
Leaves 2.5 2.5 4.4 1.2
Strings 3.8 1.2 1.0 2.0
FAO (1979) Maximum acceptable limit is 1.00 x 10⁵ cfu/g/ml

120
Table 4.32 Shows the various bacterial and fungal isolates detected from the samples at
various stages of production of “ogiri” from creeping melon, climbing melon, fluted
pumpkin and castor oil seeds.
Production Stage Bacteria Isolated Fungi Isolated
Raw seeds E. coli, Staph. aureus,
Bacillus fusiformis,
Pseudomonas spp and
Proteus spp
Aspergillus fumigatus,
Penicillium spp, Mucor spp,
Trichoderma reesei, and
Aspergillus terreus
Boiled seeds Staphylococcus aureus and
Streptococcus spp
Mucor spp
Fermented seeds E. coli, Staph. aureus,
Flavobacterium spp,
Micrococcus spp,
Bacillusfusiformis, Shigella
spp, and Lactobacillus
Mucor spp
Nasal swab Staph. aureus, Streptococcus
spp, Bacillus spp and
Pseudomonas spp
Penicillium spp,
Aspergillus terreus
Skin swab Staph. aureus and E. coli Mucor spp
Mortar Salmonella spp, Staphaureus, Mucor spp, Penicillium spp,
Aspergillus fumigatus
Pestle Salmonella spp, Shigella spp,
Staph. aureus
Mucor spp,
Penicillium spp
Water Pseudomonas, E. coli,
Proteus spp,
Enterobactercloacae,
Leclercia adecarboxylata,
Vibrio
Aspergillus spp,
Penicillium spp
Leaves Actinomyces spp, Klebsiella
pneumoniae, E. coli
Trichoderma ressei,
Mucor spp, Aspergillus
fumigatus

121
Table 4.33 Mean heavy metal contents (ppm) of the samples at various stages of “ogiri”
production from creeping melon, climbing melon, fluted pumpkin and castor oil.
Production Stage Copper Lead Cadmium
Raw material 0.48 0.82 0.53
Sorted seeds 0.40 0.75 0.45
Boiled seeds 0.33 0.35 0.30
Water NP NP
Fermented seeds 0.33 0.35 0.30
Key: NP = Not Present
NAFDAC acceptable limits for Heavy Metals in food condiments (copper = 5.0 ppm, Lead =
0.20 ppm and Cadmium = 5.0 ppm)

122
HC.HB.CB.SS.F.HM
HC.HB.SS.F
HM. HB
HC.HB.CB.SS.
HC.CB.HB.
HC.HB.F.SS
HC.HB.SS.F
HC.SS.CB.F
HC.HB.CB
HC.HB.CB
Figure 4.1 Critical control points from the production stages of “ogiri” from creeping melon,
fluted pumpkin, castor oil and climbing melon seeds.
Key: CCP = Critical Control Point; HC = High Count; HB = Heterotrophic Bacteria;
CB = Coliform Bacteria; SS = Salmonella Shigella; F = Fungi; HM = Heavy Metal
Raw Seed
Sorting
Boiling
Dehulling
(with hand)
Washing
Wrapping
Fermentation
Mashing
Mixing/Mounding
Packaging and Distribution CCP
P
CCP
P
CCP
P
CCP
P
CCP
P
CCP
P
CCP
P
CCP
P
CCP
P
CCP
P

123
CHAPTER FIVE
5.0 DISCUSSION, CONCLUSIONS AND RECOMMENDATIONS
5.1 Discussion
There is higher microbial counts in the “ogiri” obtained from the local producers than
in the laboratory prepared “ogiri” though similar microbial flora was observed in both
(Tables 4.1 to 4.4). The high microbial counts in the “ogiri” obtained from local producers
could be as a result of poor hygienic practices and poor sanitary quality of processing
utensils, water and packaging materials. A similar observation was made by (Odibo and
Umeh, 1988; Odibo et al., 2012 and Dimejesi and Iheukwumere, 2014).
A great number of bacterial genera identified as Pseudomonas plecoglossida, Bacillus
fusiformis, Klebsiella pneumoniae, Enterobacter cloacae, Lactobacillus spp, Leclercia
adecarboxylataStreptococcus spp, Proteus spp, Escherichia coli, Salmonella spp,Shigella
spp, Vibrio, Flavobacterium, Micrococcus spp, Pediococcus spp and Actinomyces spp were
discovered. Fungi isolated were Aspergillus fumigatus, Trichoderma reesei, Aspergillus
terreus, Penicillium spp and Mucor spp.
The leaves used in wrapping the fermenting seeds and the mortar and pestle used in
mashing the seeds constitute the major sources of bacteria particularly Actinomyces spp and
Salmonella spp from the leaves of mortar, respectively. The isolation of Bacillus spp,
Pseudomonas spp, Klebsiella spp, Staphylococcus aureus, Pediococcus spp and
Lactobacillus spp (Table 4.32) is in line with the findings of Odibo et al.(2012) and earlier
reports of Odunfa(1981a and b)
The population of pathogenic organisms may be attributable to intrinsic factors of
“Ogiri” samples such as availability of nutrients, pH, water activity (aw), lack of competing
organisms and extrinsic factors which include the storage temperature. This observation is
still in line with that of David and Adenibigbe (2010).
The disappearance of fungi after three days fermentation of “ogiri” samples (Table
4.10) shows that fungi are not favoured by the near alkaline pH of the process (alkaline
fermentation) and anoxic fermentation. This agrees with the observation made by Dimejesi
and Iheukwumere(2014). The progressive increase in the microbial load was also observed
by David and Aderibigbe(2010).
In traditional fermented foods preparation, microbes are used to prepare and preserve
food products (Achi, 2005) and hence fermentation of food has many advantages such as

124
improvement of nutritional value and protection against bacterial pathogens (Gadaga et al.,
2014).
The isolation of coagulase positive staphylococcus aureus from fermenting seeds is of
public health concern as the organism is known to cause food poison (Frazier and Weshoff,
2000). This organism was isolated from nasal and skin swabs of the producers and hence was
observed to contaminate the products, “ogiri”. The presence of Klebsiella, a coliform could
constitute a health risk since some species of this genus are associated with the disease of
man. This observation was also made by (Odibo et al., 2012) who also expressed the
expectation that high heat treatment subjected to “ogiri” and “ogiri okpei” respectively
during cooking will destroy these microorganisms and possibly any toxin in the condiment.
Therefore there is the risk of using “ogiri” in the preparation of cold ready-to-eat foods such
as abacha.
The presence of E. coli, an indicator organism was observed to come from the water
used in the reconstitution of “ogiri”. Enterobacter aerogenes and Enterobacter cloacae are
widely distributed in water sewage, soil and on vegetables and are occasionally found in
faeces and respiratory tract of man (Arora, 2009). These organisms have been reported to
occasionally cause meningitis and septicaemia. Therefore, the isolation of Enterobacter
cloacae from “ogiri” samples may be attributed to the water used in reconstitution, the
unwashed leaves usually used in wrapping “ogiri” and poor hygienic practices by the
handlers. Pseudomonas spp are also widely distributed in soil, water and sewage, so its
presence in “ogiri” is understandable.
Actinomyces, a filamentous anaerob to micro aerophilic, Gram positive, non-spore
forming rods is typically found in the soil, decaying organic matter and can also be found in
oral cavities, dental plagues and intestinal tract of mammals (Goodfellow and William,
1983). The isolation of Actinomyces is observed to come from the leaves used in wrapping
“ogiri” since the leaves are usually collected from the bush and used for wrapping unwashed.
Salmonella spp, isolated were typically from the mortar and pestle used in mashing. It
was also observed that the local producers of “ogiri” use these utensils several times without
washing and the cracks in these utensils serve as a hiding/breeding area for the organisms and
probably other contaminants. Most of isolates could not be identified to species levels using
morphological and biochemical characteristics. So, DNA sequence based identification was
used to identify species within the complex.
The isolation of some pathogens from “ogiri” portends a great danger to the
consumption of this product. However, Odibo et al. (2012) also reported that high heat

125
treatment subjected to “ogiri” and “ogiri okpei” during cooking will destroy these
microorganisms and possibly the toxins elaborated in the condiment.
The increase in pH during fermentation has also been reported by (Aderibigbe and
Adebayo, 2012). The increase in moisture content of the processed (fermented) products
agree closely with the report of (Omafuvbe et al., 2004) and this may be as a result of the
decomposition of the fermenting bacteria on the products.
The increase in pH during the fermentation of melon seeds, climbing melon seeds,
castor oil seeds and fluted pumpkin seeds which had been reported to aciduric could have
contributed to the poor growth of Lactobacillus spp (Aderibigbe and Adebayo, 2002). The
increase in pH could also be attributed to the ability of the fermenting organisms to degrade
protein (Onawola et al., 2011); Berber and Achiwehu, (1992) also reported that the amino
acids produced due to protein metabolism are responsible for gradual pH increase leveling off
towards 7.5-8.0 and the pH increase may also be due to formation of ammonia from amino
acids.
The decrease in the amount of protein with increase in the population of organisms
suggest utilization by the organisms and this agrees with the findings of (Enujiugha, 2003 and
Olaofe et al., 1993) and hence attributed to the high proteolytic activities of the fermenting
organisms generating free amino acids (Onawola, 2011). However, boiling as a processing
technique reduce seeds‟ crude protein while the combination of boiling and fermentation
increases protein content (Igwe et al., 2012).
The decrease in crude fibre and ash content are in agreement with that of (David et
al., 2010) for “ogiri” produced from different melon seeds.
The increase in the volatile acidity in virtually all the samples (Table 4.11) indicates
similar increase in the production of free fatty acid by the lipolytic fermenting organisms and
this agrees with the findings of Dimejesi and Iheukwumere (2014).
The detection of total aflatoxin in the hawked seeds is undesirable as this may be
caused by poor house-keeping and storage conditions. None was detected in the fermented
products as the causative organisms are destroyed during fermentation. The concentration of
volatile acid serve as an indicator of food spoilage and shows that the food has been infected
with microorganisms (Bielig et al., 1976).
Food crops when grown in the soil contaminated with lead absorb the element (lead)
which adversely affect the consumers of the products.
The high level of lead may be attributed to the raw materials source because most of
the substrates used in producing “ogiri” are produced in the affected areas and are distributed

126
all over the country. Lead and Copper are used for making pesticides which is used for crop
preservation and pest control. These elements penetrate into food stuff which when consumed
cause cancer. One of the sources of cadmium is build up of cadmium levels in water, air and
soil from industrial areas. Crops grown in cadmium contaminated irrigation water is likely to
be contaminated with cadmium.
Acute exposure to cadmium may cause flu-like symptoms like chills, fever, and
muscle ache sometimes referred to as “Cadmium blues”. High levels may cause trachea-
bronchitis and pulmonary edema and can also lead to kidney problems which can be fatal.
Cadmium exposure has also been reported to cause kidney stone and kidney damage
inflicted by cadmium poisoning is irreversible. However, a decrease in the cadmium, copper,
lead, calcium and magnesium contents was observed in processed product, “ogiri”. A similar
observation was also made by Aduanya et al. (2013) in processing African breadfruit
(Treculia africana) seeds.
Heat has little or no effect on mineral content of food hence, they are said to be heat
stable. The slight decrease in the mineral content (Table 4.12) could be as a result of leaching
out minerals when food is cooked in boiling water.
The presence of lead and cadmium poses a public health hazard to the consumers. The
possible source of lead and cadmium could be from the water around mining areas due to
industrial effluent used in reconstitution, soil contaminated with these elements, poor mining
and hygienic practices (Dada and Akpan, 2015). The concentration of lead in unprocessed
samples are higher than that in processed (fermented) samples with that of Cucumeropsis
(2.80ppm) above the NAFDAC limit (0.2 ppm) for spices. The concentration of Cadmium in
both unprocessed and processed samples (18.78 – 72.70 ppm) is above the NAFDAC limit
(5.00 ppm) for spices. However, the general decrease in the mineral contents was also
observed by (Aduanya et al., 2013) in boiling of African breadfruit (Treculia africana seeds).
The increase in iron content in the processed samples is in line with that of (Aduanya et al.,
2013) who pointed that roasting of breadfruit increased the mineral contents of the samples
especially iron and copper. Boiling has been reported to decrease iron and copper contents
compared with the raw samples (Ayoola and Adeyeye, 2010).
The significant decrease in the copper content from processed and unprocessed (<
0.05) samples is in line with the findings of (Ayoola and Adeyeye, 2010). Mineral analysis
are essential to guarantee the quality of any food product. Some minerals are vital for the
proper functioning of the body while others are toxic (Abdabasit et al., 2012). The higher
cadmium content in all the unprocessed samples than in the processed (boiled) samples

127
suggests that the cadmium content can further be reduced by large period of boiling. In the
same vein, the concentration of lead were higher in the raw (unprocessed) samples than in the
processed (boiled) samples. The higher heavy metal contents especially cadmium and lead in
castor oil, creeping melon, fluted pumpkin and climbing melon obtained from Kogi, Kebbi,
Katsina, Benue, Kano and Kaduna States of Nigeria may be attributed to environmental
pollution due to industrial effluent.
Glutamic acid and aspartic acid are the most concentrated amino acids (Table 4.13)
and this observation is in agreement with the earlier report trend of glutamic acid aspartic
acid being the most concentrated amino acids in oil seeds (Igwe et al., 2012, and Ugwu et al.,
2012). Methionine was the least concentrated in all the samples and the low concentration of
methionine is in consonance with earlier reported least concentration of methionine in some
raw and processed legumes (Khattab et al., 2009 and Ojiakor et al., 2012).
The result of moisture analysis shows that the moisture content is higher in the
processed samples of “ogiri” than in the raw seeds (substrates). It is believed that materials
containing high moisture content has less storage stability than those with lower moisture
content. Adegunwa et al. (2011) while carrying out research on effect of processing on the
nutritional contents of yam and cocoyam tubers observed that the processed samples with
moisture content higher than 12% has less storage stability than those with lower moisture
content.
The higher moisture content in the processed product could be caused by the quantity
of water used in the reconstitution and the variation could also be as a result of variation in
the dehulling method. The increase in moisture contents of the processed fermented products
agrees closely with the report of David et al. (2010) and Adegunnwa et al. (2011) on
microbiology and proximate composition of “ogiri” produced from different melon seeds.
Though the moisture content observed in this work is higher with that observed by David et
al. (2010) and this may be due to differences in the process method and also the methodology
used in carrying out the analysis as well as the efficiency of the equipment used in the
analysis.
There was a general decrease in the crude fibre content in all the samples of castor oil
seed, Cucumeropsis manii, fluted pumpkin seed and melon seed. David et al. (2010) also
observed similar decrease in the crude fibre content but the crude fibre contents are higher in
virtually all the samples (Cucumeropsis manii, Citrillus lenctus and Citrillus vulgaris).
However, in this work, Cucumeropsis manii recorded the lowest fibre content in both

128
processed and unprocessed samples and this could be attributed to the state of seeds before
analysis and also the method and equipment used in the analysis.
There is significant increase in the free fatty acid content in all the samples. Fat is
found in most food groups and foods containing fat generally provide a range of different
fatty acids both saturated and unsaturated.
The balance of Omega 3 and Omega 6 polyunsaturated fatty acids in western diets has
changed substantially over last 100 years as the two families of polyunsaturated fatty acids
share a common metabolic pathways. Concern has been raised that this might be detrimental
to health. It is advisable to increase our consumption of long chain Omega 3 polyunsaturated
fatty acids and decrease the intake of saturated fatty acids which increases the level of
cholesterol. High free fatty acid bring about oxidative hydrolytic rancidity in food which
results in off flavour and colour and these are not desirable in food. Also this chemical
process (decomposition of fat by hydrolysis or oxidation) destroys nutrients in food
especially vitamins. However, Odibo et al. (2008) made similar observation that a
disadvantage of high concentration of unsaturated fatty acids in the product would be
susceptible to rancidity, since the fats are less stable than saturated fats and this should be
taken into consideration in designing procedures for preservation of food.
Vegetable oils undergo changes in terms of chemical and physical properties when
they interact with food or atmosphere. Some food processing techniques can affect fatty acid
composition of oils when hardly subjected to successive heating (Lee et al., 2004). Types of
reaction that are known to lead to degradation of vegetable oils include polymerization,
oxidation and hydrolysis. The fatty acid composition of oils can be indicator of its stability,
physical properties and nutritional values.
The ash contents were low in virtually all the samples and this is in agreement with
the findings of David et al. (2010) on the “microbiology and proximate composition of
„ogiri‟”. The high carbohydrate content observed in his work contrasted his findings on the
carbohydrate content. However, the ash observed in this work is higher than the NAFDAC
limit for ash content 0.3 – 1.2% for spices.
The appreciable concentration of Lysine (3.79g/100g), Histidine (3.0g.100g), Valine
(5.20g/100g), Isoleucine (3.02g/100g), Leucine (5.60g/100g) and Phenylalanine (4.49g/100g)
in both processed and unprocessed samples is very important from the nutrition point of view
as these are among the essential amino acids. Similar observation was also made by Odibo
et al. (2008).

129
The concentrations of methionine, cystine and tryptophan were low 1.63g/100g,
1.52g/100g and 1.11g/100g, respectively and this disagrees with observation made by Odibo
et al. (2008).
Glutamic acid was recorded as the highest concentrated amino acids in both
unprocessed and fermented samples. The sodium salt of L-glutamic forms the active
flavouring agent in most commercial seasoning agents (e.g. Maggi cubes or sauce). This
observation is in line with that made by Odibo et al. (2008).
Abdalbasit et al. (2012) reported increase in the percentage of sulphur containing
amino acids after boiling safflower seed but the reduction in the concentration of the sulphur
containing amino acids (cystine and methionine) contrasted this observation. This is probably
due to active metabolism of the compounds by the fermenting organisms and this was earlier
reported by (Odibo et al., 2008).
There is a general decrease in the amino acid content of the processed samples
(“Ogiri”) except in the processed (fermented) castor oil seeds where increase in the amino
acids (Arginine, Isoleucine and Leucine) was observed. Similarly, there was increase in
lysine, proline, valine, and methionine contents of processed melon seed “ogiri”.
The general reduction in the concentration of most amino acids was also observed by
Odibo et al. (2008) in the fermentation of Prosopis africana seeds for ogiri okpei production.
This reduction in amino acid contents after processing (fermentation) suggests active
metabolism of these components by the fermenting bacteria and this is also in consonance
with the findings of Allagheny et al. (1996).
The most abundant amino acid and highly concentrated amino acids in the
unprocessed (unfermented) seeds were glutamine (glutamic acid), aspartic acid and arginine.
Ojinnaka and Ojimelukwe (2012) reported that free amino acids such as glutamic acid and
aspartic acid may have contributed to the formation of flavour during the fermentation of
Ricinus communis. It is well known that glutamic acid and aspartic acid contribute to the
pleasant umami taste or savoury enhancement in food.
Lioe et al. (2004, 2007) carried out chemical and sensory studies on savoury fractions
obtained from soy sauces and phenylalanine as well as NaCl and glutamic acid in the
fractions. A potential synergistic effect of umami among free glutamic acid, salt and
phenylalanine (bitter amino acid) were observed.
Proteolysis has been reported as the main metabolic activity during the fermentation
of African locust bean which also contributes to the development of texture flavour of the
fermented products (Folasade et al., 2008).

130
Kpikpi et al. (2009) also reported that amino acids play a major role in the taste and flavour
development in food.
5.2 Conclusion
The organisms associated with the fermentation of “ogiri” from various substrates have been
established. The amino acid profile of fermented “ogiri” from different substrates has also
been elucidated from the study.
Heavy metals such Cd2+
, Pb12+
, Cu2, Fe
2+ and Mg
2+ were detected on unprocessed and
processed substances for “ogiri” production. In addition aflatoxin was found majorly in the
locally processed “ogiri” samples. The hazard analysis revealed sorting, washing,
fermentation, mixing, boiling, packaging and raw material as critical control points.
Apart from these controls specified as critical control points for “ogiri”, the quality of the
water used in reconstitution, the cleanliness and sterilization procedures and personal traffic
hygiene were also analyzed within the HACCP system to improve the effectiveness of
system.
5.3 Recommendations
Since women who are largely involved in the production of “ogiri” are ignorant of
good house-keeping, good hygiene practices and good manufacturing practices, which are
prerequisite operation needed for the successful implementation of HACCP, it becomes a
challenge. It is therefore recommended that all the regulatory agencies relating to food safety
such as NAFDAC, SON, National Codex Committee, Ministry of Agriculture, states and
local governments should join hands in order to:
1. Protect the public against injury to health through the consumption of unwholesome
food.
2. Educate the populace on sound hygienic and safety practices.
3. Conduct public health surveillance of food premises, food handlers and equipment
used for food processing.
4. Restrain the sale of foods which are not hygienically prepared, adulterated and
contaminated.
Finally, people should boil “ogiri” before using to prepare ready-to-eat foods such as
abacha.

131
5.4 Contribution to Knowledge
This study has shown that:
1. “Ogiri” samples especially the locally processed samples contain some pathogenic
bacteria.
2. Aflatoxin can be detected in “ogiri”.
3. Heavy metals can be found in unprocessed and processed substrate for “ogiri”
production.
4. The critical points for “ogiri” production are dehulling, raw materials, mixing,
packaging, fermentation and washing.
5. The amino acid profile of the unfermented and fermented “ogiri” samples were
elucidated.

132
REFERENCES
Abdalbasit, A.M., Sara, Y.A., Siddig, I.A. Sit, F.C., Ahmed, M.E., Samia, O.Y.
and Shiou, W.G. (2012). Effect of roasting and boiling on the chemical
composition of amino acid and oil stability of safflower seeds.
International Journal of Food Science and Technology10:1365-2621
Achi, O.K. (2005). The Potential for upgrading traditional fermented foods
through biotechnology. African Journal of Biotechnology 4(5): 375-380.
Achiwehu, S.C. (1986a). Effect of Fermentation on oil bean seed (Pentaclethra
macophylla) Journal of Food Chemistry17: 105-106.
Achiwehu, S.C. (1986b). Some biochemical and Nutritional changes during the
fermentation of fluted pumpkin (Telfairia occidentalis). Plantand
Human Nutrition3:181-185
Achiwehu, S.C. (1992): Microbiology of “Ogiri” Production from melon seeds
(Citrullus vulgaris. Nigerian Food Journal10:123-135.
Adams, M.R. and Moss, M.O. (1999). Food Microbiology. Royal Society of
Chemistry, Cambridge 40-44.
Adebolu, T.T., Olodun, A.O. ad Ihunweze, B.C. (2007): Evaluation of ogi
liquor from different grains for antibacterial activities against some
common diarrhoeal bacteria in south west Nigeria. African Journal of
Biotechnology6(9): 1140-1143.
Adegunwa, M.O., Alamu, E.O. and Omitoguin, L.A. (2011). Effect of processing
on the nutritional contents of yam and cocoyam tubers. Journal of
Applied Biosciences46:3086-3092
Aderibigbe, E.J. (1988). Physiological studies on Bacillus species Isolated
from Africna oil bean. Ph.D. Thesus, University of Ibadan, Nigeria.
Aderibigbe, E.Y. and Adebayo, C.O. (2002). Fermentative utilization of
Soybean in Nigeria. NISEB Journal 2:31-35.
Aderiye, B. I and Ojo, O. (1987): Monitoring microbiological and biochemical
changes in fermented yam.FoliaMicrobial42(2): 141-144.
Aduanya, O.C, Akunna, T.O., Onwusonye, J.C. and Obi-Aduanya, G.A. (2013).
Effect of traditional processing methods on mineral contents of African
Breadfruits (Treculis Africana seeds). International Science Research
Journal4(2):23-26

133
Amerine, C.S. (1980). Science of wine making. University of London Press Ltd,
London P. 23.
Anon, (1997): Food processing Food, Nutrition and prevention of cancer,
A Global perspective. World Cancer Research Fund in
association with American Institute for Cancer Research pp 472-
501.
Anosike, E.O. and Egwuatu, C.K. (1981). Biochemical changes during
fermentation of Castor oil (Ricinus communis) seed for use as seasoning
agent. Qualitas Plantarum plant food for Human Nutrition30: 181-
184
AOAC (Association of Official Analytical Chemists) (2006): Office Method of
Analysis of the Association of Official Analytical ChemistsW.
Horwitz editor eighteen edition, Washington D.C. AOAC. Pp176-183
Ayoola, P.B. and Adeye, A. (2010). Effect of heating on the chemical
composition and physiochemical properties of Arachis hypogea
(groundnut) seed flour and oil. Pakistan Journal of Nutrition
9(8):751-754
Barber, L., Achiwehu, S.C. and Ibiama, E.A. (1988). Microbiology of “Ogiri”
Production from casor oil seed (Ricinus Communis). Journal of
Food Microbiology5:177-183.
Bankole, S.A and Adebanjo A (2003): Mycotoxins in food in West Africa:
Current situation of controlling it. African Journal of
Biotechnology2(9) 254-263.
Benitez, L.V. (1989): Amino Acid and fatty Acid Profiles in aquaculture
nutrition studies in 55. De Silva (ed) Food nutrition Research in Asia
pp. 23-25. Proceedings of the Third Asian Food Nutrition
Network meeting Asians Fish Society Special Publication 4:116.
Asians Fisheries society Manila Philippines.
Bryan, F.L. and Doyle, M.P. (1995): Health risk and consequences of
Salmonella and Compaylobacter jejuni in raw poultry. Journal of
Foods Protection58:326-344.
Bucham, R.E. (2000). Bergy’s Manual of Determinative Bacteriology 18th
ed
Lippincott Williams and Wilkins Publisher. Philadelphia United States
PP 529-895

134
Bukar, A. and Magashi, A.M. (2008): Preliminary investigation of the use of
Plant Aqueous Extracts as Antimicrobial Washing Solutions on
Tomatoes, Peppers and Oranges. International Journal of Pure and
Applied Sciences2(1):22-26 www.lipas.com
Cadmus, S.I.B., Ajunwa, M.O., Adeleke, A.J., Agada, C.A. and Awoleye, A.A.
(2013) Mini Review Theoretical and Onsite Evaluation of Hazard
Potentials in the local Production of Wara; an Indigenous West African
Soft Cheese. British Microbiology Research Journal3(3):218-234.
Chung, S.K. Mee, S.L. Se, 10. and Sang, CP (2010):Discovery of novel
sources of vitamin B in Traditional Korean Food from
Nutritional surveys of centenarians Cur Gerontol Geriatr Res:
2010: 2010: 374897.
CODEX (2007): Codex Alimentarius commission procedural Manual. Revised
edition pp. 156-160.
Collins, C.H., Lyne, P.M., Grange, J.M and Falkinam, J.O (2004):
Microbiological methods 8th
ed. Hodder Amold Publication New
York pp. 464-465.
Dada, O.E. and Akpan , N.J. (2015). Assessing the Mobility Index of Cadmium in
two selected ornamental plants species thriving in the core Central of
Urban Area in South-West Nigeria. Proceedings of Society for
Environmental Toxicology and Pollution Mitigation (SETPOM)
International Conference on Environmental Management and Safety:
University of Lagos Conference Centre, Akoka Lagos Nigeria P. 46
David O.M. and Aderibigbe, E.W (2010): Microbiology and proximate
composition of Ogiri a pastry produced form different melon seeds.
New YorkScience Journal3(4): 18-27.
Dimejesi S.A. and Iheukwumere I.H. (2014): Microbiological quality of ashed
and unashed “Ogiri” produced from castor oil seeds (Ricinus
Communis). Journal of Science Engineering and Technology22:
10507-11514.
Dodds, K.I. and Austin, J.W. (1997): ColostridiumBotulinum. In “Food
Microbiologyandfundamentalsandfrontiers” (Ed. M.P. Doyle,
L.R. Benchat and T.J. Montville) ASM press Washington DC pp
288-304.
Duiguid, J.P. (1986). Medical Microbiology 12th
ed. Church Hill Living Stone.
Edinburgh London and New York 170-189.

135
Eilers (1990): New food provides new food safety challenges. Food
Processing 6: 104-108
Eley, A.R. (1992): Microbial food Poisoning. Chapman and Hall, London. Pp
211-213.
Enyinnaya, U. (2013). Principles of HACCP (Implementation, Validation and
Verification) in Nigeria Food Industry). A paper presented at Nigerian
Institute of Food Science and Technology (NIFST) workshop on
compliance to Food Legislation and standards in Nigeria held at Federal
Secretariat Auditorium Enugu, 5th
June.
Enujiugha, V.N. (2003). Nutrient changes during the fermentation of African oil
bean (Pentaclethra Macophylla) seed. Pakistan Journal of Nutrition
2(5): 320-232.
Falegan, C.R. (2012): Enzymatic activities of Bacillus species isolated from
commercial samples of “ogiri” (Fermented Citrullus vulgaris)
in West Africa Journal of Microbiology 2(2): 96-102,
Fairman, R. and Yapp, C. (2004). Compliance with food safety legislation in
small and micro-business: Enforcement as external motivator
3(2):http//www.cieh/JEHR/ Compliance Food Legislation.html Acessed
June 4. 2013
Farber, (1989) Food bornepathogenic organisms. Characteristics of the
organisms and their associated diseases Journal of Food Science
and Technology22: 311-321.
Federal Institute of Industrial Research Oshodi (FIIRO) (2012): FIIRO New
Letter, www.fiiro.org.index.php.,12 2-12 FIIRO- newsletter-sp-30998
Food and Agricultural Organization (1979): Manuals of Food Quality
Control. 4. FAO Food and Nutrition Paper, United Nations, Rome,
14(4):A1- F10.
Frazier, W.C. and Westhoff, D.C. (2000); Food Microbiology, 4th
ed. Tata
McGraw Hill Publication Limited New Delhi pp 17-34.
Folasade, M., Olajuyigbe and Ajele, J.O. (2008). Properties of extracellular
protease from Bacillus lichenifornis lbbl-11 isolated from “iru” - a
traditionally fermented African locust bean condiment. Global
Journal of Biotechnology and Biochemistry3:42-46

136
Fries, R. (1994): Viruses in Foods, A review Fleishchwirtschaft 74: 740-742.
Gadaga, T.H. (2004). The occurrence, growth and control of
pathogens in African fermented Foods. African Journal of Nutrition
and Development4(1):20-23.
Giese, J. (1998): New development in Microbial testing Journal of Food
Technology52L79-80.
Granum P.E. (1990): Clostridium pertringens toxins involved in food
poisoning. International journal of food microbiology10: 101-
112.
Granum, P.E., Tomas, J.M., and Aloug, J.E (1995): A survey of bacterial
toxins involved in Food Poisoning: a suggestion for bacterial
food poisoning toxin nomenclature. International journal of
Food Microbiology 28:129-144.
Hatheway, C.I., (1900): Toxigenic Clostridia. Clinical Microbiology reviews 3:
65-98.
Henson, S. and Headsman, N. (1998). Food Safety Regulation and the Firm:
Understanding the compliance Process. Food Policy33: 9-23.
Hudak – Roos, M. and Garrett, E.S. (1992): Monitoring critical control point,
critical, limits. In “HACCP Principles and Applications” (ed
Pierson, M.D, Corlett, D.A) Chapman and Hall, New York pp
62-70.
Ihekoronye, A. I. and Ngoddy, P.O (1985). Integrated Food Science and
Technology for the Tropics 3rd
ed. Macmillan Publishing Ltd
London 45-368.
International Commission on Microbiology Specification for Foods, ICMSF
(1988): HACCP in microbiology safety and quality. Oxford Mead,
Blackwell Scientific Publications.
Jones, .R.N., (1989): Polychlorinatd biphenyls: where do we stand now?
Lancet: II (8666) 791-794.
Katz, S. (2003): Wild fermentation. The flavour, Nutrition and craft of live
culture foods. Chelsea Green company.
Kpikpi, E.N., Dzogbefia, V.P. and Glover, R.K. (2009). Enzymatic and some
biochemical changes associated with the production of Kantong, a
traditional fermented condiment in Northern Ghana. Journal of Food
Biochemistry 33:61-73

137
Kramer. J. M. and Gilbert, R.J. (1989): Bacillus cereus and other Bacillus
species. In “Food Borne Bacterial Pathogens”. Marcel Dekker,
(ed. M. P. Doyle). Marcel Dekker, New York pp 21-70.
Labbe, R.G. and Huang, T.H. (1995): Generation time and Modeling of
enterotoxin Positive and enterotoxin negative strains of
clostridium perfringens in laboratory media and ground beef.
Journal of Food Protection 58: 1303-1306.
Ladipo, J.K, Ossai, G.E.A and Olunloye, O.A. (1986). Food Science and
Technology in National Development: Entrepreneurship in
Food Industry. Nigerian Food Journal 4:3-11.
Lee, Y., Oh, S., Chang, J. and Kim, J. (2004). Chemical composition and
oxidation stability of safflower oil prepared from safflower seed
roasted with different temperature. Food Chemistry84:1-6
Marvin, L.S (1984). Compendium of Method for microbiological Examination
of Foods 2nd
ed. America Public health Association. Washington,
D.C. 124-879.
Moberg, L.I. (1992): Establishing critical control points. In HACCP principle
and Applications. Chapman and Hall, new York pp 50-61.
Moss, M.O. (1996): Mycotoxins. Mycological Research 100:513-523.
NACMCF (1992): Hazard analysis and critical control system. The national
advisory committee on microbiological criteria for food.
International journal of food microbiology18:1-23.
National Advisory Committee on Microbiological Criteria for Foods
(NACMF, 1997). Hazard Analysis and Critical Control Point,
Principle and Guidelines
Nester, E. W., Roberts, C.E, Pearsell, N.N., Andrewson D.G. and Nester, M.T.
(1998): Microbiology: A Human Perspective. 2nd
Edition,
WCB/McGraw-Hill Boston pp 237-312.
Nester, E.W., Anderson, D.G., Roberts, C.E.P. and Nester, N.T. (2004):
Microbiology: A Human perspective 4th
edition McGraw Hill, Pp.
610-628
Notermans, S. and Batt, C.A (1998): A risk of assessment approach for food
borne Bacillus cereus and its toxins, Journal of Applied
Microbiology symposium supplement84:515-615.

138
Nzelu, I.C. (2010): Identification, composition and processing of tropical food
commodities 2nd edition. Eaglet Publisher Ltd Fergu Nwankwo Printing
Services, Enugu pp 73 – 86
Nzelu, I.C., Nwosu, U.L., and Onwurah, C.O. (2012). Food Analysis Principles
and Practice 1st ed. Fergu Nwanklwo Printing Service, Enugu,
Nigeria. 30-45
Obeta, J.N. (1983). A note on the Microorganisms associated with the
fermentation of oil bean seed. Journal of Applied Bacteriology 54: 433-
435.
Obizoba, I.C. and Ati, J.V. (1991). Effect of soaking, sprouting and
fermentation on the nutritional quality of Bambara nut (Vaandiera
subterranean) and its product (milk). Plant Food Human
Nutrition 42: 15-23.
Odibo, F.J.C. and Umeh, A.I (1989): Microbiology of the fermentation
Telfairia seeds for “Ogiri” production. MIRCEN Journal of Applied
Microbial Biotechnology5:217-222
Odibo, F.J.C. and Umeh, A.I (1988): Microbiology of fermentation of Telfairia
seeds for “Ogiri” Production. MIRCEN Journal 5: 217-222.
Odibo, F.J.C., Nwabunnia, F. and Osuigwe, D.I. (1990). Biochemical changes
during fermentation of (Telfaria occidentalis) seeds for “Ogir”
production. World Journal Microbial Biotechnology 6: 425-427.
Odibo, F.J.C. Ugwu, D.A and Ekeocha, D.C (1992): Microorganisms
associated with the fermentation of prosobis seed for “Ogiri-Okpei”
Production Food Science Technology29: 305-307.
Odibo, F.J.C. and Ezeaku, E.C and Ogbo, F.C. (2008): Biochemical changes
during fermentation of prosobis African seeds for “ogiri-okpei”
production Journal of Industrial Microbiology and Biotechnology35:
947 – 952.
Odibo, F.JC, Nwabunnia, E; Ezekweghi, C,C. and Uzoeghe, E. (2012):
Fermentation of Cucumeropsis seeds, an uncommon substrate for
Ogiri production African Journal of Microbiology 6(24)5095-5099.
Odunfa, S.A. (1981a). Microbiology and amino acid composition of “ogiri”, a
food condiment from fermented melon seeds. Die Nahrung 25:
811-813.

139
Odunfa, S.A. (1981b). Microorganisms associated with the fermentation of
African Locust bean (Parkia fillicoidea) during “iru” propagation
Journal of Plant Foods3: 245-250.
Odunfa, S.A (1985): Microbiology and Toxicology aspects of fermentation of
castor oil for “Ogiri” Production Journals of Food science 50:
1758- 1759.
Ojinnaka, M.C. and Ojimelukwe, P.C. (2012). Effect of fermentation period on
the organic acid and amino acid content of Ogiri from Ricinus
communis. International Journal of Food Technology10(5-5):140-
150
Okafor, N. (1997). IndustrialMicrobiology 2nd
ed. University of Ife Press Ltd.
P.40-65.
Okaka, J.C.N. and Ene, G.I. (2005). Food Microbiology – Methods in Food
Safety control 1st ed. DCJANCO Academic Publishers,
Independence Layout, Enugu 185-212.
Olaofe, O., Adeyemi, F.O. and Adediran, G. (1994). Amino Acid and Mineral
Compositions and Functional Properties of some oil seeds. Journal of
Agriculture andFood Chemistry 42(4): 878-881.
Oluwafemi, F,. and Ikeowa, M.C. (2005): Fate of Afflatoxin BI during
fermentation of maize into „Ogi‟. Nigerian Food Journal
3(www.ajol.info/journals/nifoj).
Oluwafemi, F., and Taiso, V.O (2003): Reversal of toxigenic effects of
afflatoxin BI on cockerels by alcoholic extract of African nutineg
Monodora Myristica. Journal of Science of Food. Africa 84: 333-340.
Oluwole, M. and Aderibigbe (2010): ocrpnop;pgy and proximate composition
of Origi‟ A pastruy produced from different melon seeds. New York
Science Journal 3(4): 1-9.
Omafuvbe, B.O and Oyedapo, O.O (2002). Observed biochemical changes
during oil bean (Pentaclethra macrophylla) seeds. Nigerian Journalof
Nutritional Science 21:19-23.
Omafuvbe, B.O., Shonukan, O.O. and Abiose, S.H. (2000). Microbiological
and biochemical changes in fermentation of soya bean for soy
“dawadawa”, a Nigerian food condiment. NigerianJournal of Food
Microbiology 17:469-474.
Omafuvbe, B.O., Folade, O.S., Oshuntogun, B.A. and Adewusi, S.R.A. (2004).
Chemical and biochemical composition changes in African locust
bean (Parkia biglobosa) and melon seed (Colothisvulgaris) during
fermentation. ParkistanJournal of Nutrition 3(3):140-145.

140
Omotogun, J. (2016). Food Safety and Trade Facilitation Solutions. Proceedings of
Nigerian Institute of Food Science and Technology Workshop on Food
Safety Management Systems FIIRO Lagos PP.1-6
Penningtoon, T.H. (2000): Introduction. In HACCP in meat industry 2nd edition
CRC press Cambridge pp3-10.
Pierard, D. and Lauwers, S. (1998): Enteric infections due to Escherichia coli
clinical microbiology and infection4: 414-415.
Prescott, L.M., Harley, J.P., Klein, D.A (2005): Microbiology 6th
edition.
McGraw-Hill Inc. New York USA pp 799-818.
Rabi, M., Mulchtar, A., Kawo, A.H., Schamsuddeen, U. and Bukar, A. (2013).
Evaluation of Critical Control Points (CCPs) in the production of
Dawadawa (African locust bean cake) in Dawakin Tofa Local
Government Area, Kano State, Nigeria. Bayero Journal of Pure
and Applied Sciences6(1): 46-51
Reed, G. H. (1993): Food borne illness .I.Staphylococcal food poisoning.
Dairy Food and Environmental Sanitation 13: 642.
Reid, G. Brucem, A.W., Frasier, N. Heinemann, C., Owen, J. and Henning, B.
(2001b): oral probiotics can resolve urogenital infections.
FEMSImmunology Medical Microbiology 30: 49-52.
Rhodehamel, E.J. (1992): over view of biological, chemical and physical
hazards. In “HACCP Principles and Applications” (ed. M.D. Pierson
D.A. Corlett_. Champam ad Hall New York. Pp 8-28.
Schiegel, H.G. (2002). General/Microbiology, 7th
ed. Cambridge Low Price
Edition. Cambridge Universal Press, UK. Pp 377-8.
Schothorst, M. (1999): Microbiological and hygienic aspects of food safety,
“Interactional food safety handbook” (ed K, Vander Hijden, M.
Jounes, L. Fjshbein, and S. Miller) Markel Dekker, Inc. New York
pp 27 – 46.
Shibamoto, T. and Bjeldanes, L.F. (1993) Natural toxins in plant food stuffs.
Introduction to Food Toxicology Academic Press, Harcourt Brace
and Com.San Diego Pp 67-96.
Sperber, W.H. (1992): Determining critical control points, in “HACCP
principles and applications (ed. M.D Pierson, D.A Corlett).
Chapman and Hall, new York. Pp 39-49.
Stelma, G.N. Jr. (1988): Vinilence factors associated with Pathogenicity of
Aeromonas isolates Journal of Food Safety 9:1-9.
141
Stein Kraus, K.H. (1995): Indigenous fermented food involving alkali
fermentation in Steinkraus, K.H. (ed). Hand book of indigenous
fermented foods 2nd
edn Marcel Dekker, New York pp 349-362.
Sterm, N.J. Draxek, E.S. and Joseph, S.W (1987). Low incidence of
Aeromonas spp in livestock feaces Journal of Food Protection 50:
66-69.
Stevanson, K.E and Humm, B. J. (1992): Effective records keeping system for
documenting the HACCP plan. In “HACCP principles and Applications” (Ed M.D Pierson, D.A Corlett) Chapman and Hall,
New York pp 83-89.
Su, Y.C. and Lee Wong, A.C (1997): Current perspectives on detection of
staphylococcal enterotoxins. Journal of Food Protection 60:195-
202.
Tasie, F.O. and Okafor, U.O (1999). Laboratory methods in Microbiology 1st
ed. Colours communications. Ogui New Layout, Enugu 49-110.
Udoh, J.M, Cardwell, K.F and Ikotun, T. (2000): Storage structure and
afflatoxin content of maize in five agreo ecological zones of Nigeria.
Journal of Stored Product Reserve: 36: 187-201.
Ugwu, C.U., Ojiakor, O.A., Anugheje, K.C., Nwaogu, L.A. & Ujowundu, C.O.
(2012). Amino acid profile of raw and locally processed seeds of
Prosopis africana and Ricinus communis: Potential antidotes to
protein malnutrition. Functional Foods in Health and Disease
2(4):107-119
Unteriman, F. (1998): Microbial hazard in Food. Food Control 9(2/3): 119-
126.
Vargas, M. Gascon, J., Jimenez de Anta, M.T. and Vila, J. (1999): Prevalence
of shigalla enterotoxin and 2 among Shigella strains isolated from
patients with traveler‟s diarrhea. Journals of clinical microbiology
37:3608-3611.
Woodhall, M. (1989). Application of hazard analysis and critical control point
system in milk manufacture. Journal of Society of dairy Technology42
(4): 102-105.
Yeshajahu, P. and Clifton,, E. (1996). Food Analysis theory and Practical 3rd
ed. S.K. Jain Publishers, New Delhi India 280-766.