Microbiology Lab Manual - Gavilan iLearn
105
GAVILAN COMMUNITY COLLEGE Microbiology Lab Manual Biology 8 Patrick Yuh & Mary McKenna 2020
-
Upload
khangminh22 -
Category
Documents
-
view
0 -
download
0
Transcript of Microbiology Lab Manual - Gavilan iLearn

GAVILAN COMMUNITY COLLEGE
Microbiology Lab Manual Biology 8
Patrick Yuh & Mary McKenna
2020

This page is intentionally blank

Table of Contents
Introduction .......................................................................................................................... 5
Exercise 1 – Contamination .................................................................................................... 7
Exercise 2 – Hand Washing .................................................................................................. 11
Exercise 3 – Microscope Basics............................................................................................. 17
Exercise 4 – Sterile Transfer Techniques ............................................................................... 23
Exercise 5 – Simple Stain...................................................................................................... 31
Exercise 6 – Gram Stain ....................................................................................................... 35
Exercise 7 – Acid-Fast Stain .................................................................................................. 41
Exercise 8 – Anaerobic Bacteria ........................................................................................... 45
Exercise 9 – Antibiotics ........................................................................................................ 49
Exercise 10 – Selective and Differential Media ..................................................................... 55
Exercise 11 – Gram-Positive Organisms & Media .................................................................. 63
Exercise 12 – Gram-Negative Organisms & Media ................................................................ 69
Exercise 13 – Bacterial Gene Transfer: Transformation ......................................................... 77
Exercise 14 – DNA Fingerprinting: Detecting the p53 Tumor Suppressor Gene ...................... 83
Exercise 15 – Unknown I: Gram-Positive Species .................................................................. 89
Exercise 16 – Unknown II: Gram-Negative Species................................................................ 91
Exercise 17 – Unknown III: Urine Culture ............................................................................. 93
Unknown Worksheets ......................................................................................................... 95
Unknown Worksheet Addendum for UK III ........................................................................ 101
Appendix: Graphing Tutorial .............................................................................................. 103

This page is intentionally blank

5
Introduction Welcome to the Lab Manual for Microbiology (Bio 8) at Gavilan College! It is my hope that the Lab Manual will serve as a useful guide to help you learn and become familiar with many widely used tools and techniques in microbiology. We will begin with the basics and cover the concepts of contamination, the scientific process, proper microscope usage, and sterile transfer technique. This is followed by a set of labs dealing with three of the most commonly performed bacterial stains: the simple stain; the Gram stain; and the acid fast stain. These first labs contain key techniques which are essential to learn well as they are used throughout the course. Next is a tour of selective and differential media used to culture bacteria. There are two labs that focus more on biotechnology, a field which relies on the use of microorganisms. The last three labs involve identification of an unknown bacterial species, which will require you to apply the techniques and tools you learned from the first three sets of labs in this course. The labs in this manual follow the format of a scientific paper. They begin with an Introduction that states the purpose of the lab and provides relevant background information. The Materials & Methods section describes the materials and protocols needed to complete the experiments. The Results section is for presenting results of your experiment, and the Discussion section is where results are interpreted, and their significance is discussed. Your instructor may require that you keep a Lab Notebook for the course in which you use this format to discuss your lab work. In order to do well in and learn from the lab portion of this course, you must put in time before, during, and after lab sessions. Preparing for lab, i.e. pre-lab, will help you get more out of doing the labs and also enable you to finish your lab work and leave earlier. Pre-lab activities (e.g. quizzes, notebook checks) may be a formal part of your lab grade. Reading the lab beforehand is essential. Doing the lab work on the day it is assigned goes without saying; scheduling lab make-ups is logistically challenging, and your instructor may not award you points for turning in lab results you did not obtain yourself. Do not forget about post-lab processing! It is a crucial part of cementing the lab concepts into your mind. Lab time can get hectic, and it can be an endeavor just to complete the lab work. You need to spend time after lab to think about the concepts the lab deals with. You are expected to already be familiar with the basics of making graphs, and the units of the metric system. Fortunately, I have included some material to help you with the former, and we will cover the latter during lecture. If your instructor does not assign you any work on graphing, be proactive during the first week of class and go through the Graphing Tutorial at the end of the Lab Manual! Finally, a few items of lab safety. These are for your safety and non-negotiable. When in lab, you are:
1) NEVER eating or drinking 2) ALWAYS wearing closed-toe shoes 3) ALWAYS wearing a lab coat
Thank you for your attention. Let’s have a great semester! Patrick Yuh

6
This page is intentionally blank

7
Contamination
Introduction Microorganisms are everywhere! They can live in the most inhospitable environments on Earth (e.g. hydrothermal vents on the ocean floor) and are transferred easily from one place to another. When working in the lab, it is unfortunately easy to introduce unwanted organisms into your experiment, a process known as contamination. The purpose of Lab 1 is to look for the presence of microbes in our environment. We will attempt to find them in three locations: 1) the air; 2) the skin; and 3) an inanimate object. An inanimate object that harbors microbes due to air or human contact is also called a fomite. Culture media All living organisms require certain things to live (food, water, etc.). In order to grow (i.e. culture) microbes in the lab, we prepare various types of culture media that can support their growth. Certain types of media support the growth of some microbes better than others. Three types of media will be used in this lab: 1) Sabouraud agar (Sab); 2) tryptic soy agar (TSA); 3) nutrient agar (NA). These solid media have been prepared in Petri dishes; any medium prepared in this way is called a plate. Sabouraud agar is slightly acidic and has an abundance of glucose, which encourage the growth of fungi. It will be used to check for fungal spores in the air. Tryptic soy agar contains additional nutrients that are often necessary for growing normal flora. It will be used to grow bacteria living on the skin. Nutrient agar is a general purpose medium that supports the growth of a variety of bacteria and fungi. It will be used to grow microbes found on a fomite before and after disinfection. Materials & Methods Each person will need the following materials: 1 Sabouraud agar plate 1 tryptic soy agar plate 1 nutrient agar plate
3 sterile disposable swabs 1 squirt bottle of water 1 disinfecting wipe
How to Label Your Media (Fig. 1.1) • How: Sharpies work best for labeling, but wax pencils will also work • What: include your name or initials, date, type of medium, and specimen (species, source, etc.) • Where: for plates, label the bottom of the plate (i.e. not the lid), along the edge, in small lettering • When: as soon as possible • Why: to be able to identify your plate • Who: you!
EXERCISE
1

Lab 1 – Contamination 8
Working with Agar Plates • Plates should have their lids on AT ALL TIMES, unless they are being inoculated (i.e. microbes are
being transferred onto the agar) • Observe growth on plates with the lids closed whenever possible, opening the lid only when further
examination is required • Agar plates are always incubated upside down (i.e. with the lid on the bottom) to avoid condensation
dripping from the lid onto the culture 1. Obtain the three plates and immediately label them as Sab, TSA, or NA (it is difficult to tell them
apart).
2. Sabouraud agar plate: place the plate on any level surface in the room. Open the lid. Close the lid when you finish step 4, or after 10 minutes, whichever comes first.
3. Tryptic soy agar plate: choose a small area of your skin for testing. Use a squirt bottle to place 3-4 drops of water on one sterile swab. Rub the moistened swab on the skin. Rub the swab gently over the surface of the agar, being careful not to break through the surface.
4. Nutrient agar plate: choose a fomite (i.e. an inanimate object) for testing. Draw a line down the middle of the bottom side, not the lid. Label one side ‘Before’ and the other side ‘After’. a. Before: Use a squirt bottle to place 3-4 drops of water on one sterile swab. Rub the moistened
swab on the fomite. Rub the swab gently over the surface of the agar on the ‘Before’ side, being careful not to break through the surface.
b. After: Wipe the fomite with a disinfecting wipe. Wait for the surface to dry. Repeat step 4a with a new swab to set up the ‘After’ side.
5. Place your three plates in an ‘incubation’ plate rack. Cultures will be incubated overnight (18-24
hours) at 37°C and then kept at 4°C. 6. The following lab session, observe the plates and complete the Results section.
Figure 1.1. Labeling an agar plate. Label the bottom side along the edge in small letters.

Lab 1 – Contamination 9
Results Name & Lab Section:
1. Make sketches of any visible growth on your three plates below. Keep in mind that a thorough and
complete presentation of your results includes: 1) an accurate visual representation of said results; 2) labels identifying important features of the colonies. The goal is to present, with pictures and words, as much important information as possible, as concisely as possible.
Sabouraud agar (air)
Tryptic soy agar (body)
Nutrient agar (fomite)
2. Make a bar graph of your results below to compare the number of different kinds of colonies seen on
each of your plates.

Lab 1 – Contamination 10
Discussion 1. Why are agar plates incubated upside down? 2. When presenting results of microbial culture growth, sometimes there is no visible growth. In these
cases, why is it better to indicate that there was no growth than to leave part of your results blank? 3. Your results probably show how easy it is to contaminate your work. What are some precautions you
could take in lab to minimize contamination?

11
Hand Washing
Introduction Microorganisms are still everywhere! Many different species live naturally and permanently on human skin. These are called normal flora or resident flora, and are harmless or even beneficial under normal conditions (some can cause disease when found in other parts of the body). People can easily pick up additional microbes by touching contaminated surfaces (i.e. fomites). These are referred to as transient flora because they can be removed by hand washing; some are also pathogenic. Proper hand washing removes transient flora and temporarily reduces the normal flora population. It is perhaps the single most effective way to prevent the spread of transient flora in a clinical setting and also in our daily lives. Studies have shown that it is one of the most effective ways to avoid catching and spreading the cold virus during the cold and flu season.1 This is especially important in hospitals, as hospital-acquired infections, known as nosocomial infections, are the 8th leading cause of U.S. deaths.2 The purpose of this lab is to investigate the effectiveness of hand washing on reducing the number of kinds of microbes found on the hands. This lab is different in the sense that each group will be able to choose one aspect of hand washing they wish to investigate. All groups have access to the same materials, but the exact protocol and experiment will be determined by each group; the PROMPTS and questions in the Methods section provide a framework for designing a good experiment. Materials & Methods Each group will have access to the following materials: 2 tryptic soy agar plates regular hand soap antibacterial hand soap hand sanitizer
paper towels sterile disposable swabs squirt bottle of water
The inoculation method for the plates in this lab is the same as in Lab 1: swab a small area of skin with a wet sterile swab, and gently rub across the surface of the agar. The scientific process In order to learn more about the world in which we live, scientists (and many others) employ a step-by-step procedure called the scientific process or method. The major steps include:
1. Making observations 2. Asking questions 3. Formulating hypotheses
4. Designing and doing experiments 5. Interpreting experimental results 6. Communicating your findings
EXERCISE
2

Lab 2 – Hand Washing 12
Making observations The relevant observations for this lab were mostly made in Lab 1. One additional observation about hand washing we need to consider is actually an experimental result discussed in the Introduction for this lab:
• microbes live on the skin • different kinds can be distinguished based on their colony characteristics • people can have different kinds of microbes on their skin • hand washing reduces the microbe count on the skin
Asking questions With the above observations, we can begin to ask questions about the efficacy of hand washing in getting rid of microbes. Answer PROMPT 1 and try coming up with some questions based on the observations. PROMPT 1: What are some aspects of hand washing that could affect how well it gets rid of microbes? 1. Based on your answers to PROMPT 1, come up with three questions you are interested in exploring
for this lab. Each question should only explore ONE aspect. Number them 1, 2, and 3. Formulating hypotheses A hypothesis is so often described as an educated guess that it has become cliché. Think of a hypothesis as an answer to a question. A good hypothesis must be three things:
• specific: it must be sufficiently specific to inform the design of an experiment • testable: the accuracy of the hypothesis must be able to be tested with an experiment • reasonable: it must be consistent with what is already known (e.g. other facts and observations)
A good hypothesis does NOT need to be correct! If it was known to be correct before any experiments were done, there would be no need to do the experiments. Rather, a good hypothesis is one that allows for many experiments to be done to test it, and the point of doing them is to gather evidence to support or refute the hypothesis. Answer PROMPT 2 and question 2. PROMPT 2: Here is an observation, question, and three hypotheses. Indicate whether each hypothesis is specific, testable, and reasonable. Place a checkmark next to the best hypothesis.
Observation: My cell phone does not turn on. Question: What is wrong with my cell phone? Specific? Testable? Reasonable? Hypothesis 1: One of the parts is broken. Hypothesis 2: My phone’s battery is dead. Hypothesis 3: My phone is possessed by demons.

Lab 2 – Hand Washing 13
2. Write one good hypothesis for each of the three questions you came up with before. Designing the experiment After a good hypothesis has been made, it is time to start thinking about how to test it by designing an experiment. Recall from before that each question/hypothesis deals with only one aspect of hand washing. This single aspect being tested is called the experimental variable. All other aspects that could be tested are called control variables. Answer PROMPT 3 and question 3. PROMPT 3: Here is a hypothesis: “During hand washing, hot water is more effective than cold water at removing microbes.” What is the experimental variable here? What are the control variables here? 3. Pick one of your hypotheses from question 2, and name the experimental and control variables. The experimental variable is the one being changed (in order to test the effects of changing it), and control variables stay the same in all experimental trials. Trials where the experimental variable is changed are part of the experimental group, and trials where it is unchanged are part of the control group. PROMPT 4: A group of four students tests the hypothesis in PROMPT 3. Students 1 and 2 wash their hands in hot water, and students 3 and 4 wash their hands in cold water. Which students are in the experimental group, and which are in the control group? The results from Lab 1 showed that people have different kinds of microbes on their skin. Furthermore, an individual can only wash her hands in one way, i.e. she cannot be part of both the control and experimental groups. Taken together, this means that results from students in the experimental group are not directly comparable to results from the control group.

Lab 2 – Hand Washing 14
4. Can you think of a way to get results that CAN be compared to each other? Hint: this involves adding a step to your experiment.
Your experimental protocol (i.e. Methods) At this point, you should be ready to write out the steps of your experimental protocol. Since every group has the same materials and is inoculating their media in the same way, the vast majority of your protocol will be identical to that of a classmate. The only major difference will be which variable you choose to test. Use the rest of this page to write out your protocol. Add more numbers if necessary. You will decide in your group which variable to test. 1. 2. 3. 4. 5. Works Cited 1. Office of the Associate Director for Communication, Digital Media Branch, Division of Public Affairs. Wash Your
Hands. http://www.cdc.gov/features/handwashing/. Updated December 11, 2013. Accessed July 25, 2015. 2. Tortora, GJ, Funke, BR, Case, CL. Microbiology: An Introduction. 11th ed. San Francisco, CA: Benjamin
Cummings; 2013.

Lab 2 – Hand Washing 15
Results Name & Lab Section:
1. Each person who washed his hands has one set of results. Make a bar graph of all the results from
your group to compare the number of different kinds of colonies seen in each trial.
Discussion 1. Would you say your group’s results support or refute your hypothesis? Why? 2. A good scientist thinks critically and is always thinking of ways that experimental results may not
suggest the hypothesis is correct. Look critically at your group’s results and describe one way in which they do not support your hypothesis.
3. Experiments are often repeated to ensure the accuracy and reproducibility of the results. What are
two ways in which you could improve upon your experiment, if you were to repeat it?

Lab 2 – Hand Washing 16
This page is intentionally blank
17
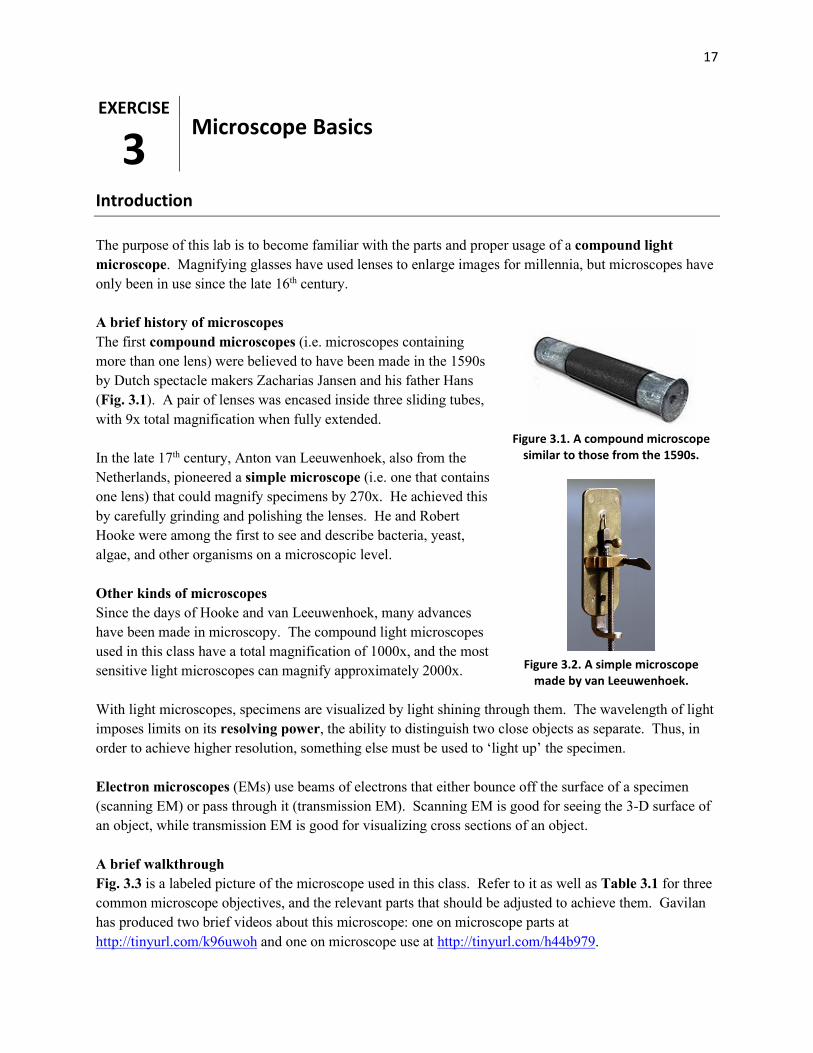
Microscope Basics
Introduction The purpose of this lab is to become familiar with the parts and proper usage of a compound light microscope. Magnifying glasses have used lenses to enlarge images for millennia, but microscopes have only been in use since the late 16th century. A brief history of microscopes The first compound microscopes (i.e. microscopes containing more than one lens) were believed to have been made in the 1590s by Dutch spectacle makers Zacharias Jansen and his father Hans (Fig. 3.1). A pair of lenses was encased inside three sliding tubes, with 9x total magnification when fully extended. In the late 17th century, Anton van Leeuwenhoek, also from the Netherlands, pioneered a simple microscope (i.e. one that contains one lens) that could magnify specimens by 270x. He achieved this by carefully grinding and polishing the lenses. He and Robert Hooke were among the first to see and describe bacteria, yeast, algae, and other organisms on a microscopic level. Other kinds of microscopes Since the days of Hooke and van Leeuwenhoek, many advances have been made in microscopy. The compound light microscopes used in this class have a total magnification of 1000x, and the most sensitive light microscopes can magnify approximately 2000x. With light microscopes, specimens are visualized by light shining through them. The wavelength of light imposes limits on its resolving power, the ability to distinguish two close objects as separate. Thus, in order to achieve higher resolution, something else must be used to ‘light up’ the specimen. Electron microscopes (EMs) use beams of electrons that either bounce off the surface of a specimen (scanning EM) or pass through it (transmission EM). Scanning EM is good for seeing the 3-D surface of an object, while transmission EM is good for visualizing cross sections of an object. A brief walkthrough Fig. 3.3 is a labeled picture of the microscope used in this class. Refer to it as well as Table 3.1 for three common microscope objectives, and the relevant parts that should be adjusted to achieve them. Gavilan has produced two brief videos about this microscope: one on microscope parts at http://tinyurl.com/k96uwoh and one on microscope use at http://tinyurl.com/h44b979.
Figure 3.1. A compound microscope
similar to those from the 1590s.
Figure 3.2. A simple microscope
made by van Leeuwenhoek.
EXERCISE
3

Lab 3 – Microscope 18
Figure 3.3. A labeled diagram of the Olympus CX31 microscope.
I want to do one of these three things… So I should adjust these parts…
See through the microscope Focus on my specimen Adjust the light
Ocular lenses Coarse focus knob (4x obj. ONLY!) Dimmer switch
Objective lenses Fine focus knob Aperture iris diaphragm
X- and Y-axis knobs Condenser
Field iris diaphragm
Table 3.1. A helpful guide to using the microscope.

Lab 3 – Microscope 19
Materials & Methods Each person will need the following materials: letter e slide crossed threads slide blood smear slide bacteria slide
compound light microscope immersion oil lens paper Windex
Microscopes are very expensive instruments! The ones used in this class cost several thousand dollars and must be treated respectfully. Setting Up the Microscope • use both hands to carry your assigned microscope to your lab bench • remove the dust cover, plug in your microscope, and turn the power switch on • alert your instructor if your scope was not put away properly from the previous class Letter e slide (your instructor may walk through this as a class) 1. Mount the slide on the microscope stage.
2. Adjust the X- and Y-axis knobs so that light shines through the specimen.
3. Focus on the specimen with the 4x objective lens:
a. Bring the stage all the way up with the coarse focus knob. b. While looking through both ocular lenses, slowly bring the stage back down until the letter e
comes into focus. Answer Results question 1. c. For optimal viewing, adjust the focus and distance of the ocular lenses with the diopter
adjustment ring and interpupillary distance scale, respectively. (Write down the interpupillary distance that is best for viewing comfortably through both lenses, and adjust the ocular lenses to this distance at the beginning of every lab session involving the microscope.)
d. Move the X- and Y-axis knobs, and answer Results question 2.
4. Handling only the black rubber ring of the revolving nosepiece, rotate to the 10x objective. Refocus on the letter e using ONLY the fine focus knob.
5. Once you have seen the letter e in focus at 10x, switch back to 4x, remove the slide from the stage, and return it to the slide tray.
Crossed threads slide 1. Repeat steps 1-3 from before (mount the slide, shine light through specimen, focus at 4x).
2. Repeat step 4 from before (switch to 10x and refocus on the threads).
3. Switch to 40x and refocus. Answer Results question 3.

Lab 3 – Microscope 20
Blood smear slide 1. Repeat steps 1-3 from before (mount the slide, shine light through specimen, focus at 4x).
2. Repeat step 4 from before (switch to 10x and refocus on the blood smear).
3. Switch to 40x and refocus. Bacteria slide 1. Repeat steps 1-3 from before (mount the slide, shine light through specimen, focus at 4x).
2. Repeat step 4 from before (switch to 10x and refocus on the bacteria).
3. Switch to 40x and refocus.
4. This time you will switch to the 100x oil immersion lens:
a. Rotate the objective lenses so the specimen is halfway between the 40x and 100x lenses. b. Carefully add one drop of immersion oil onto the coverslip. c. Slowly finish rotating the 100x lens in place. The lens will make contact with the oil, which
should now be sandwiched between the lens and the coverslip. d. Focus and view the specimen at 100x. Answer Results question 4.
5. When done viewing the specimen at 100x: a. Rotate the 100x lens halfway. b. Tear off one piece of lens paper and add a few drops of Windex. c. Gently wipe the 100x lens AND the slide to remove all oil from them. You MUST remove all
oil. Any oil left on will DESTROY the lens. Returning the Microscope • remove slide • switch to 4x objective • bring stage all the way down and forward • turn dimmer all the way down • power off • unplug and wrap cord neatly around back • put on dust cover • return to cabinet (with both hands) according to microscope number • if you have not returned your microscope properly, you will suffer the consequences

Lab 3 – Microscope 21
Results Name & Lab Section:
1. What is the orientation of the e when viewing through the microscope versus on the stage? Describe
with words AND make two small sketches of the e. 2. When you move the slide in one direction on the stage (left, right, up, down), in which direction does
the specimen appear to move when viewing through the microscope? 3. As you adjust the fine focus, how many threads are in focus at one time? 4. Make a sketch of what you see when viewing the bacteria at 100x.
Remember what is required for a good sketch! Discussion 1. Which objective lens should you start with when viewing a specimen, and why? 2. If you had a slide with the word dog on it (it is right-side up on the slide), sketch how it would look
when seen through the scope. 3. When viewing the crossed threads at 40x, why are they not all in focus at the same time? Hint: think
about what happens when you adjust the focus knob.

Lab 3 – Microscope 22
This page is intentionally blank

23
Sterile Transfer Techniques
Introduction The purposes of this lab are twofold: to learn how to 1) use sterile or aseptic technique when working with bacteria in the lab; and 2) use transfer techniques to set up new cultures. Sterile means to be completely free of life, and sterile technique has two main goals. The first goal of sterile technique it to protect the work being done. As shown in Labs 1 and 2, contamination can happen quite easily. The presence of contaminants will often make the results uninterpretable, as they can affect the growth, appearance, etc. of the microbes being studied. Thus, it is essential to minimize the risk of contamination when working with microbial cultures. The second goal of sterile technique is to protect the user from the microbes she is working with. Sterile technique generally consists of the following principles: 1. Maintaining the sterility of the tools being used 2. Maintaining the sterility of surfaces most often exposed to the air 3. Minimizing exposure of culture media to the air In order to study microbes, they must be cultured with media. This means transferring microbes from one place to another while following sterile technique. Starting now, students will use sterile technique during all lab sessions. The activities in this lab provide the first opportunities to practice sterile and transfer technique, and the results for some of these activities will depend on the user’s ability to maintain proper sterile technique. See Fig. 4.4 for a guide to sterile transfer technique. This lab also introduces two new types of culture media: the slant and the broth. A slant is a glass tube containing agar medium that was solidified at an angle to allow for more surface area (Fig. 4.1). A broth is a glass tube containing a liquid medium (Fig. 4.1). Any type of culture medium can be prepared as a plate, slant, or broth; the only differences are the use of a Petri dish or glass tube, and the addition of agarose to solidify the medium.
Students will use sterile technique to transfer bacteria to a total of four media: one slant; one broth; and two plates. One of these plates involves a transfer technique known as the quadrant streak. The goal of the quadrant streak is to grow isolated colonies (Fig. 4.2) that can be used for other things, such as macroscopic and microscopic examination, or preparing a pure culture. Since a colony consists of cells that originated from one starting cell, all cells from the same colony should be identical to each other. A pure culture consists of one, and only one, species growing in the medium. A mixed culture contains two or more species in the same medium, grown together. Fig. 4.5 shows the steps of the quadrant streak.
EXERCISE
4
Figure 4.1. A nutrient agar slant (A) and nutrient broth (B).
A B
Figure 4.2. A quadrant streak.

Lab 4 – Sterile Transfer 24
Materials & Methods There are three parts to this lab. First, we will go through general protocols for sterile transfer techniques. This is followed by specific information for each of the three parts. Bunsen Burner Watch this video on the proper use of a Bunsen burner: http://bit.ly/1gr6GE0 Transfer Technique (also see Fig. 4.4) This video shows how to do a broth to broth transfer: http://bit.ly/1HjeccM. Read the steps below as you watch the video to follow along. 1. Flame the inoculating loop. Start at the base and work
out to the loop. Use the hottest part of the flame (Fig. 4.3). When the metal wire glows red, it is done. Wait 10-20 seconds to cool.
2. Prepare the stock culture.
a. If the stock is a broth, first gently mix the culture to resuspend the microbes.
b. If the stock is a slant or broth, hold the tube with your other hand and unscrew the cap with the same hand that is holding the sterilized loop. Briefly flame the lip of the tube.
c. If the stock is a plate, lift one side of the lid off the plate and keep it above the agar. The lid should be lifted at an angle to the plate like a sideways V.
3. Pick up microbes. Carefully insert the sterilized loop into the stock and obtain some microbes.
a. If the stock is a slant or plate, do NOT break the surface of the agar. b. If the stock is a broth, dip the loop into the broth and microbes will be picked up in the film of
broth that forms within the loop (like when using a bubble wand for blowing bubbles). 4. Set aside the stock culture.
a. If the stock is a slant or broth, flame the lip again, and screw the cap back on. b. If the stock is a plate, put the lid back on.
5. Inoculate the new medium.
a. Repeat step 2b or 2c, this time with the new medium. b. If the new medium is a slant, gently zigzag across the surface of the agar. c. If the new medium is a broth, gently swirl the loop in the broth several times.
6. Finish the transfer.
a. Repeat step 4, this time with the new medium. b. Flame the loop to kill any remaining microbes.
violet outer cone pale blue middle cone dark blue inner cone
barrel
gas inlet
main gas valve base gas control valve
air vents
hottest part of flame (> 800°C)
Figure 4.3. The parts of a Bunsen burner, and characteristics of the flame.

Lab 4 – Sterile Transfer 25
Figure 4.4. A protocol for slant to slant transfer.

Lab 4 – Sterile Transfer 26
Quadrant Streak Technique 1. Use sterile technique to obtain microbes on a sterilized loop (steps 1-4 of the Transfer Technique
protocol). 2. Inoculate the new medium (this is the quadrant streak). Refer to Fig. 4.5.
a. Quadrant 1: Gently make at least 10-20 zigzags across the surface of the plate. The zigzags should be close together and it is fine to go back across a previous zigzag.
b. Flame the loop. c. Quadrant 2: Make a second set of zigzags. With the first few zigzags, cross back over the streaks
you made in Quadrant 1 to pick up microbes. Continue to make a total of 20-30 zigzags. d. Flame the loop. e. Quadrant 3: Make a third set of zigzags. With the first few zigzags, cross back over the streaks
you made in Quadrant 2 to pick up microbes. Continue to make a total of 20-30 zigzags. f. Flame the loop. g. Quadrant 4: Make a fourth set of zigzags. With the first few zigzags, cross back over the streaks
you made in Quadrant 3 to pick up microbes. Continue to make a total of 20-30 zigzags. h. Flame the loop. Put the lid back on the plate.
Figure 4.5. The four quadrants of the quadrant streak technique.

Lab 4 – Sterile Transfer 27
A. TRANSFER TO SLANT & BROTH Each person will need the following materials: 1 nutrient agar slant 1 nutrient broth
2 stock cultures (plate, slant, or broth) inoculating loop
Reminder: standard abbreviations are used on culture labels – Serratia marcescens is abbreviated S. marcescens, Micrococcus luteus is abbreviated M. luteus, etc. 1. Every student inoculates one slant and one broth, using stock cultures on plates, slants, and broths.
a. Pick one stock culture (plate, slant, or broth) for inoculating a new slant. b. Pick one stock culture (plate, slant, or broth) for inoculating a new broth.
2. Place newly inoculated cultures in ‘incubation’ racks. Leave tube caps slightly loose to ensure adequate oxygen supply. Cultures will be incubated overnight at 37°C and then kept at 4°C.
B. PAINTING WITH MICROBES Each person will need the following materials: 1 nutrient agar plate inoculating loop
3-4 stock plate cultures (per group) 3-4 tubes of sterile water (per group)
1. As a group, prepare one set of ‘paints’ using tubes of sterile water and bacteria as the color. Use
sterile technique to transfer one type of bacteria to each tube. These will serve as your paint.
2. Individually, draw a simple picture on the bottom side of a nutrient agar plate. Plan to use at least three different ‘colors’.
3. Reproduce your drawing using the paint. Essentially you are using sterile transfer technique with the paint serving as the stock cultures.
4. Place newly inoculated cultures in ‘incubation’ racks. Cultures will be incubated overnight at 37°C. C. QUADRANT STREAK Each person will need the following materials: 1 nutrient agar plate inoculating loop
1 mixed stock broth culture (three species)
1. Use the mixed broth culture as the stock to inoculate a new plate by quadrant streak. See the
Quadrant Streak protocol and/or Fig. 4.5 for more details.
2. Place newly inoculated cultures in ‘incubation’ racks. Cultures will be incubated overnight at 37°C.

Lab 4 – Sterile Transfer 28
This page is intentionally blank

Lab 4 – Sterile Transfer 29
Results Name & Lab Section:
A. Transfer to Slant & Broth
Did your slant and broth have growth? Growth in broth cultures is characterized by turbidity (cloudiness). The more turbid the broth, the more growth occurred.
B. Painting with Microbes
Make a well-labeled sketch of your ‘painting’ plate. Indicate whether there were contaminants.
C. Quadrant Streak Make a well-labeled sketch of your quadrant streak plate. Indicate how many bacterial species you were able to isolate.
Discussion 1. Describe how inoculated cells develop into colonies on a solid medium such as a plate or slant. 2. What are some possible uses for an isolated colony?

Lab 4 – Sterile Transfer 30
This page is intentionally blank

31
Simple Stain
Introduction In order to more easily view microbes through a microscope, stains are often used to colorize one or more microbial components. The purposes of this lab are to 1) learn how to prepare a bacterial smear, 2) learn how to perform a simple stain, and 3) observe various bacterial morphologies and arrangements. As mentioned in Lab 4, one common use for isolated colonies is microscopic examination. This involves transferring microbes from the colony to a clean microscope slide and using heat to kill and adhere them onto the slide. Usually this is immediately followed by a staining protocol, such as the simple stain. A simple stain is one in which all cells are stained the same color, as only one stain is used. Contrast this with a differential stain, which uses two stains to stain different types of cells different colors (Fig. 5.1). Staining bacteria is an effective way to see their morphologies. There are three basic bacterial cell shapes: coccus; bacillus; and helix. Cocci are spherical, and can be arranged in several ways: diplococci live in pairs, streptococci are in chains, and staphylococci live in clusters (like a bunch of grapes). Bacilli are rod-shaped, and have some similar arrangements as cocci (diplobacilli, streptobacilli). Helical bacteria are spiral or twisted, and can be categorized as flexible or rigid. Flexible helical bacteria are known as spirochetes, while rigid helical bacteria are known as vibrio or spirilla.
Figure 5.1. A simple stain (left) and differential stain (right). Note the scale bar.
Materials & Methods Each group will need the following materials and cultures: 1 microscope slide per person crystal violet clothespin water squirt bottle 1-2 staining trays
Staphylococcus aureus (slant) Bacillus subtilis (broth) Enterococcus faecalis (broth) Saccharomyces cerevisiae (broth)
EXERCISE
5
___ 5 µm

Lab 5 – Simple Stain 32
Reminder: standard abbreviations are used on culture labels – Staphylococcus aureus is abbreviated S. aureus, Enterococcus faecalis is abbreviated E. faecalis, etc. There are four different stock cultures. Each person will perform one simple stain using a different stock, so that each group will have at least one simple stain of all four stocks. In other words: do one simple stain, and observe all four. Preparing a Smear 1. Clean the slide (if necessary). If the slide is not clean and free of residue, rinse it with alcohol and
dry with a Kimwipe. 2. Place one small drop of water on the slide. Skip this step if the stock is a liquid culture! 3. Use sterile technique to transfer the specimen. See the Transfer Technique protocol in Lab 4 if
you need a reminder of the steps. a. If the stock is a solid culture, take a very small amount of cells (it is fine if you cannot see them
on the loop). This is different from previous transfers in that you want a small number of cells. b. If the stock is a liquid culture, transfer several loopfuls of broth onto the slide. c. Use the loop to spread out the cells in the drop of water on the slide over a larger area. Initially,
the drop of water should only become slightly cloudy. If it is too cloudy you have transferred too many cells and they will end up in piles, which makes it difficult to see their morphologies.
4. Dry and heat fix the slide. Attach a clothespin to one end of the slide. Holding the slide by the clothespin, pass it briefly several times over a flame. Do not linger over the flame! Excessive heat will distort the shape of the cells. When the smear is completely dry, heat fix the cells by passing the slide over a flame once smear side up, and once smear side down.
Simple Stain (Fig. 5.2) 1. Place the slide on the rack of the staining tray. The smear should be facing up. 2. Cover the smear with a few drops of crystal violet for 30 seconds. 3. Using a water squirt bottle, gently rinse off the stain until the runoff is clear. 4. Blot the slide dry in a pad of blotting (bibulous) paper. Repeat until the slide is completely dry. 5. Place a coverslip on top of the smear and observe under the microscope. See the Microscope
protocols in Lab 3 if you need a reminder of the steps. Dispose of slides in Bleach Water container. Empty staining tray in Hazardous Waste container. Rinse tray and rack, and place in drying rack.
Figure 5.2. A summary of the simple stain protocol.

Lab 5 – Simple Stain 33
Results Name & Lab Section:
1. Make well-labeled sketches of the S. aureus and B. subtilis simple stains from your group, seen
through the oil immersion lens.
2. Which cells were larger, the E. faecalis or S. cerevisiae? Discussion 1. Explain your answer for Results question 2. In other words, why were the cells of one species larger? 2. Why is it important not to overheat a bacterial smear? 3. Explain the difference between 1) a simple stain vs. differential stain, and 2) bacillus vs. Bacillus.

Lab 5 – Simple Stain 34
This page is intentionally blank

35
Gram Stain
Introduction While a simple stain procedure is fast, it provides little information beyond bacterial morphology and arrangement. A differential stain procedure known as the Gram stain can yield additional information about the arrangement of the cell wall and plasma membrane, which groups bacteria into two convenient categories: Gram-positive and Gram-negative (Fig. 6.1). The purpose of this lab is to learn how to perform the Gram stain, the most important and widely used staining protocol in microbiology. The Gram stain was invented by Hans Christian Gram in 1884. He was trying to develop a technique to distinguish bacteria from human cells in biopsies. This technique did not work for this, but it ended up being extremely useful in distinguishing bacteria from each other. At the end of the Gram stain, bacteria that are purple are known as Gram-positive and bacteria that are pink/red are known as Gram-negative. The right panel of Fig. 5.1 is a Gram stain showing purple cocci and pink bacilli.
Figure 6.1. The structural differences between Gram-positive and Gram-negative bacteria. The Gram stain (Fig. 6.2) There are four main steps to the Gram stain: 1) primary stain; 2) mordant; 3) decolorizer; 4) counterstain. Each step is followed by a brief water rinse. The primary stain is crystal violet, which stains all bacteria purple. The mordant is iodine, which forms an ionic bond with the crystal violet, preventing the larger complex from leaving the cells. Next is a decolorizer (in this case, ethanol), which dissolves the outer membrane of Gram-negative cells and dehydrates the cell walls of both Gram-positive and Gram-negative cells. The crystal violet–iodine (CV–I) complexes are still trapped within Gram-positive cells, but they are now able to leave Gram-negative cells, which are now colorless. This is the differentiating step of the Gram stain. The last step is to add a counterstain called safranin, which enters all bacteria. Gram-positive cells remain purple (as it is darker than the pink/red color of safranin), and Gram-negative cells are pink/red.
EXERCISE
6

Lab 6 – Gram Stain 36
Figure 6.2. An overview of the Gram stain. Results can be deceiving! Keep in mind that the terms Gram-positive and Gram-negative are used to describe the results of a Gram stain, and that they are also used to describe the structure of a bacterium’s cell wall and plasma membrane. However, the former does not prove the latter; it merely suggests it. For example, it is possible for Gram-positive cells to end up pink/red by the Gram stain. How? Aside from experimental error, one common way for this to occur is through the use of old cultures. As the bacteria age, some may die and their cell walls partially break down. This makes it possible for the CV–I complexes to escape during the decolorizing step, resulting in a Gram-negative result from Gram-positive cells. Materials & Methods Each group will need the following materials and cultures: 1 microscope slide per person Gram stain reagents (one set in wooden rack) clothespin water squirt bottle 1-2 staining trays
Escherichia coli Staphylococcus aureus Bacillus subtilis one ‘unknown’ culture hand washing plate from Lab 2
Reminder: standard abbreviations are used on culture labels – Escherichia coli is abbreviated E. coli, etc.

Lab 6 – Gram Stain 37
Each person will perform one Gram stain, choosing among the following: 1) mixed slide containing S. aureus and E. coli 2) B. subtilis 3) unknown 4) hand washing colony from Lab 2
As in Lab 5, each group will end up with at least one Gram stain for each of these four options. In other words: do one Gram stain, and observe all four. Gram Stain (Fig. 6.3) 0. Prepare a bacterial smear. See the Preparing a Smear protocol in Lab 5 if you need a reminder of
the steps.
1. Place the slide on the rack of the staining tray. The smear should be facing up. 2. Cover the smear with a few drops of crystal violet for 30 seconds. 3. Wash Step: Using a water squirt bottle, gently rinse the smear until the runoff is clear. 4. Cover the smear with a few drops of Gram’s iodine for 30 seconds. 5. Decolorize by adding ethanol dropwise until the runoff is clear, or approximately 10 seconds,
whichever comes first. Hold the slide at an angle and let the ethanol drip through the smear. 6. Repeat the Wash Step. 7. Cover the smear with a few drops of safranin for 30 seconds. 8. Repeat the Wash Step. 9. Blot the slide dry in a pad of blotting (bibulous) paper. Repeat until the slide is completely dry. 10. Place a coverslip on top of the smear and observe under the microscope. See the Microscope
protocols in Lab 3 if you need a reminder of the steps. Dispose of slides in Bleach Water container. Empty staining tray in Hazardous Waste container. Rinse tray and rack, and place in drying rack.

Lab 6 – Gram Stain 38
Figure 6.3. A summary of the Gram stain protocol.

Lab 6 – Gram Stain 39
Results Name & Lab Section:
1. Make a well-labeled sketch of the mixed slide Gram stain from your group, seen through the oil
immersion lens. 2. Did the B. subtilis Gram stain have purple cells, pink cells,
or both? 3. Which unknown culture did your group stain, and what
was the color and shape of the cells? Would you say these cells are Gram-positive or Gram-negative?
Discussion 1. Experimental error is one way of getting an inaccurate Gram stain result. What is one specific error
that could be made, and how would it affect the result? 2. Why is decolorizing considered the most important step of the Gram stain?

Lab 6 – Gram Stain 40
This page is intentionally blank

41
Acid-Fast Stain
Introduction Many bacterial species can be categorized as Gram-positive or Gram-negative based on the composition of their cell walls, but some species cannot. One example is Mycobacterium spp., which have a very hydrophobic and waxy lipid called mycolic acid in their cell walls. This gives species of Mycobacterium certain properties: cells stick together more easily; colonies have a raised, wrinkled morphology; and hydrophilic substances are impermeable. This last property makes Mycobacterium spp. more pathogenic, more resistant to chemical disinfectants, and prevents the entry of dyes such as crystal violet. The purpose of this lab is to learn how to perform the acid fast stain, a staining protocol that is able to distinguish between bacterial species containing mycolic acid (dubbed acid-fast) and species that do not (dubbed non–acid-fast). The acid fast stain was developed in the late 19th century by two German doctors, Franz Ziehl and Friedrich Neelsen. It is a differential stain that uses the dyes carbol fuchsin and methylene blue. The carbol fuchsin is heated in order to penetrate the waxy cell walls, then cooled to trap it inside the cells. A decolorization step with acid alcohol washes the carbol fuchsin out of non–acid-fast cells only; acid-fast cells do not get decolorized, hence the term acid-fast. Cells are then counterstained with methylene blue to more easily visualize non–acid-fast cells (which are colorless after decolorization). A successful acid fast stain will turn acid-fast cells pink and non–acid-fast cells blue (Fig. 7.1).
Figure 7.1. An acid fast stain of Mycobacterium smegmatis (pink) and Micrococcus luteus (blue). Materials & Methods Each group will need the following materials and cultures: 1 microscope slide per person acid fast stain reagents (wooden rack & on cart) clothespin water squirt bottle
Mycobacterium smegmatis Staphylococcus epidermidis one ‘unknown’ culture 1-2 staining trays
EXERCISE
7
___ 5 µm

Lab 7 – Acid Fast Stain 42
Reminder: standard abbreviations are used on culture labels – Mycobacterium smegmatis is abbreviated M. smegmatis, etc. Each person will perform one acid fast OR one Gram stain, choosing among the following:
1) acid fast: mixed slide containing M. smegmatis and S. epidermidis 2) acid fast: M. smegmatis 3) acid fast: unknown 4) Gram: M. smegmatis
As in Lab 6, each group will end up with at least one stain for each of these four options. In other words: do one stain, and observe all four. Acid Fast Stain 0. Prepare a bacterial smear. See the Preparing a Smear protocol in Lab 5 if you need a reminder of
the steps.
1. Place the slide on the rack of the steamer. The smear should be facing up. 2. Cover the smear with a small piece of paper towel. 3. Add a few drops of carbol fuchsin to the paper towel. Steam the smear for 5 minutes. Add more
carbol fuchsin as needed to keep the smear covered. Do not let the smear dry out! 4. Place the slide on a staining tray and let cool for 1-2 minutes. Remove the paper towel. 5. Decolorize by adding acid alcohol dropwise until the runoff is clear, or approximately 30 seconds,
whichever comes first. Hold the slide at an angle and let the acid alcohol drip through the smear. 6. Wash Step: Gently rinse the smear with water. 7. Cover the smear with a few drops of methylene blue for 30 seconds. 8. Repeat the Wash Step. 9. Blot the slide dry in a pad of blotting (bibulous) paper. Repeat until the slide is completely dry. 10. Place a coverslip on top of the smear and observe under the microscope. See the Microscope
protocols in Lab 3 if you need a reminder of the steps. Dispose of slides in Bleach Water container. Empty staining tray in special waste container. Rinse tray and rack, and place in drying rack.

Lab 7 – Acid Fast Stain 43
Results Name & Lab Section:
1. Make a well-labeled sketch of the mixed slide acid fast stain from your group, seen through the oil
immersion lens. 2. Which unknown culture did your group stain, and what
was the color and shape of the cells? Would you say these cells are acid-fast or non–acid-fast?
Discussion 1. As mentioned in the Introduction, acid-fast bacteria are generally more pathogenic than other
bacterial species. Name two acid-fast species and the diseases they cause. 2. If a Gram stain was done on Mycobacterium tuberculosis, what would the result look like? Explain.

Lab 7 – Acid Fast Stain 44
This page is intentionally blank

45
Anaerobic Bacteria
Introduction There are many species of bacteria that require oxygen to live, but there are also many species with different oxygen requirements. The purpose of this lab is to become familiarized with some of these species, as well as the methods used to culture them. Species that require oxygen to live are known as obligate aerobes. Like humans, these species use O2 as their final electron acceptor in glucose metabolism; without it, they will die. On the other end of the spectrum are species for which oxygen is toxic. These obligate anaerobes either use a different final electron acceptor in metabolism or perform fermentation to produce ATP. In between is a group called facultative anaerobes, species that can live with or without oxygen. They perform aerobic metabolism when O2 is available (and thus grow faster), and anaerobic metabolism when O2 is not available. Most human pathogens, and most of the bacterial species used in this course, are facultatively anaerobic. Two other groups are considered in this lab. Some species, known as microaerophiles, require lower oxygen levels than the ~20% found in Earth’s atmosphere. Lastly, capnophiles require higher levels of carbon dioxide than the ~0.4% found in the atmosphere. Some bacteria are both microaerophilic and capnophilic, such as Campylobacter. See Table 8.1 for a summary of these five classifications.
Oxygen requirement Description Examples
Obligate aerobe Must have O2 to survive (dies in its absence) Pseudomonas, Neisseria
Facultative anaerobe Can grow with or without O2, but grows faster with Escherichia
Obligate anaerobe Must NOT have O2 to survive (dies in its presence) Clostridium, most pathogens
Microaerophile Requires low amount of O2 (< 20% in atmosphere) Campylobacter, Micrococcus
Capnophile Requires extra CO2 (> 0.4% found in atmosphere) Campylobacter, Haemophilus
Table 8.1. A summary of the different oxygen requirements of bacteria. Culturing strains with different oxygen requirements Most of these groups can be cultured in the same environment as in previous labs, but some require different media and incubation conditions. Obligate anaerobes are grown in thioglycolate broth; thioglycolate is a reducing agent that removes O2 from the broth (i.e. acts an oxygen scavenger). All inoculations will be done on Brewer’s anaerobic agar plates, which also contain thioglycolate to remove O2 from the medium (aerobic species can still obtain O2 from the environment, if present). The Brewer’s plates will be placed in one of three environments: a plate rack; a GasPak jar in which atmospheric oxygen is removed with an AnaeroGen GasPak; a candle jar in which a candle will be lit after it is sealed. As the candle burns, it will consume O2 and release CO2, lowering O2 levels and raising CO2 levels.
EXERCISE
8

Lab 8 – Anaerobic Bacteria 46
Materials & Methods Each group will need the following media and cultures: 3 Brewer’s agar plates
Escherichia coli Pseudomonas aeruginosa Micrococcus luteus Clostridium sporogenes
1. Inoculate each Brewer’s plate with all four stock cultures, according to Fig. 8.1 (use a Sharpie to
section the plate in four quarters). Prepare all three plates the same way. Label carefully! 2. Place one newly inoculated plate in the plate rack, one in the GasPak jar, and one in the candle jar.
Cultures will be incubated overnight (18-24 hours) at 37°C and then kept at 4°C.
3. After the class is finished, your instructor will add an AnaeroGen GasPak into the GasPak jar and a lighted candle into the candle jar. This will remove all atmospheric oxygen in the GasPak jar, and remove most atmospheric oxygen and add some CO2 in the candle jar.
4. The following lab session, observe the plates and complete the Results section.
Figure 8.1. A diagram of how to inoculate four strains on one plate.

Lab 8 – Anaerobic Bacteria 47
Results Name & Lab Section:
In the table below, indicate with 0, +1, +2, or +3 how much growth occurred in each environment.
Plate rack GasPak jar Candle jar E. coli
P. aeruginosa
M. luteus
C. sporogenes
Discussion 1. Which of the five terms in Table 8.1 best describes the three incubation environments? In other
words, what kinds of bacteria would grow best in the three environments? Plate rack:
GasPak jar: Candle jar: 2. Now use the same five terms in Table 8.1 to categorize the four species you cultured. In other words,
use your results to describe the oxygen requirements of the four species. E. coli:
P. aeruginosa: M. luteus: C. sporogenes: 3. Why do obligate aerobes (and facultative anaerobes) need oxygen? Be specific.

Lab 8 – Anaerobic Bacteria 48
This page is intentionally blank

49
Antibiotics
Introduction Antibiotics are a class of chemotherapeutic agents used to treat bacterial infections. They can also be used in the lab to help characterize and identify an unknown strain. The purpose of this lab is to become familiarized with the Kirby-Bauer sensitivity test, a type of disc diffusion test used to determine the effect of various antibiotics on bacteria. A brief history Penicillin was the first antibiotic to be mass produced and used on a wide scale. It was accidentally discovered by Alexander Fleming in 1928 after he observed that contamination on his culture plate was inhibiting the growth of the bacteria he was trying to culture. The contaminant was a mold of the genus Penicillium; further studies identified the specific molecule made by the mold that had the antibacterial effect, which was named penicillin. Since then, other molecules have been discovered and synthesized which resemble penicillin, and are categorized in the penicillin family of antibiotics. Many other antibiotic families have also come into widespread use. Proper use of antibiotics The discovery and widespread use of antibiotics revolutionized medicine. Many in the medical community thought humanity had finally found the ‘silver bullet’ that could target bacterial cells but leave human cells unharmed. For several decades, the mortality rate for many kinds of bacterial infections dropped dramatically. Unfortunately, antibiotics have also been severely over-used and misused (e.g. using antibiotics to treat viral infections, not taking the full course of prescribed antibiotics, feeding antibiotics to livestock). This widespread abuse, combined with the short generation time of bacteria, has led to the increased prevalence of strains that are resistant to one (or more) antibiotics. MRSA (methicillin-resistant Staphylococcus aureus) is perhaps the most well-known example, and has complicated treatment of staph infections. Dr. Paul Marino summarizes proper antibiotic use concisely in The ICU Book: “The first rule of antibiotics is try not to use them, and the second rule is try not to use too many of them for too long.”1 The Kirby-Bauer test One way to measure the sensitivity of bacteria to antibiotics is to perform the Kirby-Bauer test. This involves inoculating Mueller-Hinton agar plates to achieve a lawn of growth, applying a set of paper discs coated with different antibiotics, and incubating the plate. If an antibiotic stops growth or kills the bacteria, there will be a zone of inhibition around the disc where no growth has occurred (Fig. 9.1). Zones of inhibition are measured and compared to established standards to determine whether the bacteria are susceptible, intermediate, or resistant to that antibiotic (Table 9.1).
EXERCISE
9

Lab 9 – Antibiotics 50
Figure 9.1. A Kirby-Bauer sensitivity test. Bacteria are described as susceptible/sensitive, intermediate, or resistant to a given antibiotic.
Antibiotic Code Amount Zone of inhibition diameter (mm)
Staphylococcus spp. Enterobacteriaceae
R I S R I S Amoxicillin, Clavulanic acid AMC 20, 10 µg ≤ 19 ≥ 20 ≤ 13 14-17 ≥ 18
Ampicillin AMP 10 µg ≤ 28 ≥ 29 ≤ 13 14-16 ≥ 17
Bacitracin B 10 µg ≤ 8 9-12 ≥ 13 ≤ 8 9-12 ≥ 13
Neomycin N 30 µg ≤ 12 13-16 ≥ 17 ≤ 12 13-16 ≥ 17
Penicillin P 10 U ≤ 28 ≥ 29 ≤ 11 12-21 ≥ 22
Streptomycin S 10 µg ≤ 11 12-14 ≥ 15 ≤ 11 12-14 ≥ 15 Triple sulfa (sulfonamides) S3 300 µg ≤ 12 13-16 ≥ 17 ≤ 12 13-16 ≥ 17
Vancomycin VA 30 µg ≤ 14 ≥ 15 ≤ 14 ≥ 15
Table 9.1. Standards for disc diffusion testing from the Clinical and Laboratory Standards Institute (CLSI).2 R = resistant, I = intermediate, S = susceptible.

Lab 9 – Antibiotics 51
Materials & Methods Each group will need the following media and cultures: 2 Mueller-Hinton agar plates 2 sterile disposable swabs
Escherichia coli Staphylococcus epidermidis
1. Use sterile swabs to inoculate one plate with E. coli and the other with S. epidermidis. Swab the
entire surface, rotate the plate 60°, swab again, rotate, and swab a third time (Fig. 9.2).
2. Keep the other end of the swabs as sterile as possible for step 4. 3. Bring the inoculated plates to your instructor, who will apply the antibiotic discs onto the surface. 4. Use the other end of the swab to gently tap on the discs so they adhere to the surface of the agar.
Failure to do so may result in discs falling off when inverting the plate.
5. Place plates in the ‘incubation’ racks. Handle with care to keep the discs from falling off. Cultures will be incubated overnight (18-24 hours) at 37°C and then kept at 4°C.
6. The following lab session, observe the plates and complete the Results section.
Figure 9.2. Inoculation method for the Kirby-Bauer test. Swab the entire surface (black lines), rotate the plate 60° (note the red orientation mark), swab again (blue lines), rotate 60°, and swab again (green lines).
Works Cited 1. Marino, PL. “Antimicrobial therapy”. The ICU Book. Hagerstown, MD: Lippincott Williams & Wilkins; 2013: 939. 2. CLSI, editor. Clinical and Laboratory Standards Institute. Performance Standards for Antimicrobial
Susceptibility Testing: Twenty-third Informational Supplement M100-S23. Wayne, PA: CLSI; 2013.

Lab 9 – Antibiotics 52
This page is intentionally blank

Lab 9 – Antibiotics 53
Results Name & Lab Section:
Complete the table below: • Measure the diameter (in mm) of the zone of inhibition (ZoI) for each antibiotic disc. Measure the
radius and double it if it is difficult to measure diameter. • Indicate whether each species is resistant, intermediate, or susceptible to each antibiotic, and whether
each antibiotic would be an effective treatment for the respective bacterial infection.
Antibiotic Code S. epidermidis E. coli
ZoI diameter (mm) R/I/S? Effective? ZoI diameter
(mm) R/I/S? Effective?
Amoxicillin, Clavulanic acid AMC
Ampicillin AMP
Bacitracin B
Neomycin N
Penicillin P
Streptomycin S
Triple sulfa (sulfonamides) S3
Vancomycin VA
Discussion 1. How would you explain the differences you saw in how sensitive the two species were to the various
antibiotics? 2. How do you propose to stop or at least slow down the spread of MRSA and other antibiotic-resistant
bacteria?

Lab 9 – Antibiotics 54
This page is intentionally blank

55
Selective and Differential Media
Introduction The purpose of this lab is to be introduced to the principles of selective and differential media. Media are “selective” because they allow the growth of only certain types of bacteria, and “differential” because different types of bacteria produce different reactions on the media. These types of media are very important to the clinical microbiologist for the isolation and identification of pathogenic organisms. They are also used by water, food, and research microbiologists. When a clinical microbiologist receives a specimen from a patient, her jobs are threefold: 1) to determine whether or not significant microorganisms are present, and if so, in what quantities; 2) to identify the disease-causing organism and thus allow the physician to approximate the course the infection will follow; and 3) to recommend antimicrobic therapy based on the type of organism present and on antimicrobic sensitivity tests. Selective and enrichment media Let us first discuss the selective aspect. To identify the infection-causing organism, the microbiologist needs to have enough pure culture of the suspected pathogen to use as an inoculum in different identifying tests, and also needs to eliminate unimportant organisms that might be incidentally present (e.g. normal skin flora). To accomplish these goals, two general types of media have been developed:
1. Selective – contains substances which would select against organisms incidental to an infection 2. Enrichment – contains substances to encourage the growth of the suspected pathogen, while still
allowing the growth of incidental organisms
Selective medium Selection factor Organisms selected against
MacConkey agar bile salts, crystal violet Gram-positive
mannitol salt agar (MSA) 7.5% NaCl salt-intolerant species, especially Streptococcus spp.
EMB agar eosin, methylene blue Gram-positive
Enrichment medium Enrichment factor Organisms enriched for
selenite broth selenite Salmonella spp.
thioglycolate sodium thioglycolate anaerobic and microaerophilic organisms
Table 10.1. Examples of selective and enrichment media. Once received, a specimen is inoculated to a selective or enrichment medium (Table 10.1). The type of medium used is determined by the type of organism that is suspected. The spectrum of choices is narrowed by the location and type of infection. For example, urinary tract infections are usually caused by Gram-negative organisms, so MacConkey or EMB would be used. The specimen is also inoculated to a non-selective medium (which does not contain ingredients that specifically enrich or inhibit organisms). This is done in case the pathogen is not the one suspected.
EXERCISE
10

Lab 10 – Selective and Differential Media 56
The most commonly used non-selective medium is blood agar. The blood provides nutrients not available in less rich media (such as nutrient agar), which allows the growth of more fastidious organisms (those that require more specific nutrients). For microorganisms that require even more complex nutrients, a medium called chocolate agar is used. “Chocolate” refers to the color of the red blood cells in the medium, which has been heated to 75-80°C. This lyses the cells and denatures their proteins, making more nutrients available to the microorganisms being cultured. Examples of bacteria that require chocolate agar are Neisseria gonorrhoeae and N. meningitidis, which are the causative organisms of gonorrhea and meningitis, respectively. Differential media Differential media allow identification based on the fact that different bacteria (and other microbes) have different metabolic properties (Table 10.2). It is possible to identify an unknown bacterium by comparing its metabolic reactions against those of a known bacterium. For example, if an organism is Gram-negative, ferments lactose, and does not hydrolyze urea, the microbiologist would suspect E. coli since that species has those metabolic properties. These three properties can be tested by culturing the unknown on a variety of differential media. Other bacteria would produce different reactions on these media. Additional tests would be performed to confirm the identity. A differential medium contains the minimum nutrients required for the organism to grow, and one or more nutrients present in high concentration. This allows the organism to grow, but eventually forces it to use the more abundant nutrient for further growth. An indicator substance in the medium will demonstrate whether this nutrient is being metabolized. For example, when a sugar is fermented, acid is usually produced as a byproduct. A medium testing for sugar fermentation would contain a high concentration of the sugar, and also a pH indicator that changes color depending on pH. Thus, an acidic reaction in this medium indicates that fermentation occurred. Mannitol salt agar (MSA) contains the sugar mannitol, and the pH indicator phenol red turns yellow in acidic pH and red in basic pH (Fig. 10.1). Nitrogen-containing compounds (such as urea or proteins) produce basic end products when metabolized, so a basic reaction indicates that the urea or protein was metabolized. Although not strictly true, blood agar may also be considered differential, since different bacteria have distinct colony morphology and different effects on the blood (Table 10.4).
Differential medium High conc. nutrient Indicator Positive / Negative result
urea broth urea (hydrolysis) phenol red Pink or red / Orange
lactose broth lactose (fermentation) phenol red Yellow or orange / Red
Table 10.2. Examples of differential media.
Figure 10.1. MSA is selective and differential. Only certain species such as Staphylococcus
can grow in high salt; mannitol fermentation differentiates among these species.

Lab 10 – Selective and Differential Media 57
Selective and differential (S&D) media Many selective media are also differential. Examples of S&D media are MacConkey and EMB agar (Table 10.3). Due to their differential qualities, these media give the microbiologist a presumptive identification after 24 hours. For example, on MacConkey agar, yellow colonies (non-lactose fermenting) indicate the presence of Salmonella (Fig. 10.2). On a non-S&D medium such as nutrient agar, further tests would have to be done before any presumptive identification could be made. Further testing is required to confirm the identity, but making a preliminary identification saves valuable time and therapy may be started. Although there are now other rapid tests available, such as DNA-based tests, the use of S&D media remains valuable.
S&D medium Selection factor; Selects against
Nutrient; Indicator(s)
Colony appearance of positive / negative result
MacConkey agar bile salts, crystal violet; Gram+ species
lactose; neutral red pink / yellow or tan
mannitol salt agar (MSA) 7.5% NaCl; salt-intolerant species
mannitol; phenol red yellow / pink-red
brilliant green agar brilliant green; Gram+ and some Gram–
sucrose, lactose; phenol red pink-red / yellow-green
EMB agar eosin, methylene blue; Gram+ species
lactose; eosin, methylene blue
metallic green / pink or no change
Table 10.3. Examples of selective and differential (S&D) media. Materials & Methods Throughout this lab: • all agar plates should be inoculated using the quadrant streak technique • all broths should be inoculated using the sterile transfer technique learned in Lab 4 DAY 1 Each group will need the following media and cultures: 3 blood agar plates 3 MacConkey agar plates 2 brilliant green agar plates 1 selenite broth
Escherichia coli Proteus mirabilis Salmonella typhimurium Pseudomonas aeruginosa mixed culture (E. coli and S. typhimurium)
Figure 10.2. Possible results on MacConkey agar, from left to right: non-lactose fermenter; lactose
fermenter; ‘super’ lactose fermenter (E. coli).

Lab 10 – Selective and Differential Media 58
1. Inoculate the following media using the following cultures:
Medium All groups Left side of room Right side of room
Blood agar (3) P. aeruginosa, P. mirabilis E. coli S. typhimurium
MacConkey agar (3) mixed culture P. aeruginosa, S. typhimurium P. mirabilis, E. coli
Brilliant green agar (2) P. aeruginosa, S. typhimurium P. mirabilis, E. coli
Selenite broth (1) mixed culture
2. Place newly inoculated cultures in ‘incubation’ racks. Leave tube caps slightly loose to ensure
adequate oxygen supply. Cultures will be incubated overnight at 37°C and then kept at 4°C.
DAY 2 Each group will need the following media and cultures: 3 mannitol salt agar plates 1 MacConkey agar plate
selenite broth culture from Day 1 Staphylococcus aureus Staphylococcus epidermidis Enterococcus faecalis
1. Observe and record results from Day 1. Refer to another group to obtain results for cultures your
group did not set up. See Fig. 10.3 and Table 10.4 for terms used to describe blood agar colonies.
2. Inoculate the following media using the following cultures:
Medium All groups
Mannitol salt agar (3) S. aureus, S. epidermidis, E. faecalis
MacConkey agar (1) selenite broth culture from Day 1
3. Place newly inoculated cultures in ‘incubation’ racks. Cultures will be incubated overnight at 37°C
and then kept at 4°C.

Lab 10 – Selective and Differential Media 59
Figure 10.3. Terms used to describe blood agar colony appearance.
Colony characteristic Descriptive terms typically used
color cream, gray, white, yellow, etc. (most colonies are cream colored)
size diameter of colony in millimeters (mm): measure the smallest and largest colonies, and record as a range (e.g. 2-5 mm); colonies < 0.5 mm are recorded as pinpoint
hemolysis complete = total clearing of red color around colonies; partial = some discoloration; none = no change
texture smooth, rough (not shiny), slimy, drop-like, granular, hairy
Table 10.4. Additional terms used to describe blood agar colony appearance.

Lab 10 – Selective and Differential Media 60
This page is intentionally blank

Lab 10 – Selective and Differential Media 61
Results Name & Lab Section:
DAY 1 Blood agar (refer to Fig. 10.3 and Table 10.4 for more info)
Form Elevation Margin Color Size (mm) Hemolysis Texture P. aeruginosa
P. mirabilis
E. coli
S. typhimurium
MacConkey agar (record mixed culture plate results on next page)
Color of colonies Color of media P. aeruginosa
P. mirabilis
E. coli
S. typhimurium
Brilliant green agar
Color of colonies Color of media P. aeruginosa
P. mirabilis
E. coli
S. typhimurium

Lab 10 – Selective and Differential Media 62
DAY 2 MacConkey agar: mixed culture plates Record the approximate percentages of pink and yellow colonies on each plate.
Day 1 plate (from stock culture) Day 2 plate (from selenite broth) yellow colonies
pink colonies
Mannitol salt agar
Color of colonies Color of media Relative growth (+1 to +4 based on number of quadrants with growth)
S. aureus
S. epidermidis
E. faecalis
Discussion 1. On the mixed culture MacConkey plates, which species produced the yellow colonies, and which
produced the pink colonies? 2. Based on your mixed culture MacConkey results, what can you conclude about the function of
selenite broth? What type of medium is selenite broth? 3. Why did some species grow on MSA while others did not?

63
Gram-Positive Organisms & Media
Introduction In most cases, the primary step in the identification of an unknown pathogen is the Gram stain. This differential stain allows the microbiologist to assign the organism to one of two groups, Gram+ or Gram–, and therefore significantly narrow the field of possible choices for identification. Some media are especially useful in identification of Gram-positive bacteria, and others are especially useful for identifying Gram-negative bacteria; some media are used with equal frequency for both groups. The purpose of this lab is to become familiarized with some of the more common media and tests used to identify Gram-positive organisms. In this lab we will use NaCl broth, conduct the catalase and Staph-Tex tests, and examine in more detail how hemolysis is used as a diagnostic criterion. A more detailed look at hemolysis Hemolysis is caused by hemolysin, an enzyme produced by some bacteria which ruptures the plasma membranes of red blood cells (RBCs). This cell lysis causes the release and destruction of hemoglobin, resulting in a decrease of red color in the medium near the colony (Fig. 11.1). Different bacteria produce different hemolysins, which cause different types of hemolysis. Blood agar is often used to distinguish between Streptococcus and Staphylococcus strains. On blood agar the hemolysins cause varying degrees of clearing. A completely clear zone around the colony is known as complete hemolysis. A diminishing of the red is called partial hemolysis. Interestingly, the effects on blood agar are different for RBCs from different species. For example, gamma hemolysins may produce partial hemolysis on rabbit blood agar, but have no visible effect on sheep blood agar. (The in vivo [in living organisms] effects of hemolysins are not completely understood; they may be responsible for tissue damage.) Streptococcus can produce one of three types of hemolysins: alpha (α), beta (β), and gamma (γ). Table 11.1 describes their effect on blood agar, and Fig. 11.1 shows the appearance of each type of hemolysis. Staphylococcus can produce one of four types of hemolysins: α, β, γ, and δ (delta). The first three share the same name as the Streptococcus hemolysins but are not actually the same enzymes; however, they also produce partial to complete hemolysis.
EXERCISE
11
Figure 11.1. Hemolysis patterns on blood agar. Refer to Table 11.1 for a more detailed description.

Lab 11 – Gram-Positive Organisms & Media 64
Name of type Appearance of media
α (partial) partial hemolysis immediately surrounding the colony possibly an outer zone of complete hemolysis media may show green discoloration
β (complete) wide zone of complete hemolysis in Staphylococcus, β-hemolysin can cause “double zone” hemolysis
γ (none) no visible hemolysis (on sheep blood agar)
Table 11.1. Different types of hemolysis caused by Streptococcus and Staphylococcus. The staphylococcal β-hemolysin causes an interesting effect on blood agar called “hot-cold” or “double zone” hemolysis. In hot-cold lysis, overnight incubation at 37°C produces partial clearing around the colony. Subsequent incubation at room temperature or refrigeration produces a zone of complete clearing within the discolored zone (sometimes the double zone effect will be visible after the first 37°C incubation). Incidentally, Clostridium perfringens (the causative organism for gas gangrene) also produces double zone hemolysis. NaCl broth This is a selective medium that tests organisms’ tolerance to sodium chloride. It contains 5% NaCl, glucose, and phenol red. Organisms capable of growing at 5% NaCl will metabolize glucose and produce acidic byproducts that cause the phenol red to turn yellow. Organisms intolerant to 5% NaCl do not grow or eat glucose, and the medium remains red in color. An orange color indicates growth. Generally, salt-tolerant organisms are found in areas of the body where the salt concentration in higher, such as the skin and intestines. The catalase and Staph-Tex tests In addition to testing with media, there are other tests that do not require media and also give immediate results. Typically, they are designed to detect the presence of specific enzymes or toxins produced by, or structural characteristics of, the bacterium. In this lab we will cover the catalase test and a type of agglutination test called the Staph-Tex test. The catalase test detects the presence of the enzyme catalase, which catalyzes the reaction:
H2O2 (hydrogen peroxide) → H2O + O2
A loopful of cells is mixed in a 3% H2O2 solution. If catalase is present, the reaction proceeds and oxygen gas bubbles are seen. See Fig. 11.3. This test is helpful in differentiating Staphylococcus from Streptococcus and Enterococcus.
Figure 11.2. NaCl broth. Growth, i.e. acid
production, turns the broth yellow.
Figure 11.3. Catalase test results. A positive reaction (+) and a negative reaction (-).

Lab 11 – Gram-Positive Organisms & Media 65
The Staph-Tex test is a type of agglutination test which causes the target cells to agglutinate (i.e. clump up) when the test is performed. This test is used to differentiate between pathogenic and non-pathogenic Staphylococcus. It is based on antigen-antibody binding; the test reagent contains antibodies that bind specifically to S. aureus cells and causes them to agglutinate. Materials & Methods Each group will need the following media/supplies and cultures: 2 blood agar plates 3 6.5% NaCl broths 2 microscope slides 1 bottle of 3% H2O2
Enterococcus faecalis Staphylococcus aureus Staphylococcus epidermidis Streptococcus pyogenes
1. Inoculate the following media using the following cultures:
Medium All groups Left side of room Right side of room
blood agar (2) E. faecalis, S. aureus S. epidermidis, S. pyogenes
6.5% NaCl broth (3) E. faecalis, S. aureus, S. pyogenes
2. Place newly inoculated cultures in ‘incubation’ racks. Leave tube caps slightly loose to ensure
adequate oxygen supply. Cultures will be incubated overnight at 37°C and then kept at 4°C. 3. Perform the catalase test on S. aureus and E. faecalis.
a. Place one drop of 3% H2O2 on a microscope slide. b. Gently mix a loopful of cells with the H2O2 and look for bubbles. c. Dispose of slides in Bleach Water container.
4. After steps 1-3 are completed, your instructor will demonstrate the Staph-Tex test for S. aureus and
S. epidermidis. Record results on the next page.
5. In the next lab session, observe and record results from Day 1. Refer to another group to obtain results for cultures your group did not set up. See Tables 10.4 and 11.1 for terms used to describe colonies on blood agar.
Figure 11.4. The Staph-Tex test. Sample 1 shows agglutination; sample 2 does not.

Lab 11 – Gram-Positive Organisms & Media 66
This page is intentionally blank

Lab 11 – Gram-Positive Organisms & Media 67
Results Name & Lab Section:
Blood agar
Form Elevation Margin Color Size (mm) Hemolysis Texture E. faecalis
S. aureus
S. pyogenes
S. epidermidis
6.5% NaCl broth
Color of broth Positive or negative result? E. faecalis
S. aureus
S. pyogenes
Catalase test
Bubbles? Positive or negative result? E. faecalis
S. aureus
Staph-Tex test
Appearance Positive or negative result? S. aureus
S. epidermidis

Lab 11 – Gram-Positive Organisms & Media 68
Discussion 1. If a catalase test turns out positive, what can you say about the cells that were tested?
2. What are some advantages and disadvantages of using blood agar vs. the Staph-Tex test to differentiate between S. aureus and S. epidermidis?
3. For some of your 6.5% NaCl broth cultures, why did the broth turn yellow?

69
Gram-Negative Organisms & Media
Introduction The purpose of this lab is to become familiarized with some of the more common media and tests used to identify Gram-negative organisms. In this lab you will: 1) use MacConkey agar, TSI agar slants, SIM agar deeps, Simmon’s citrate agar slants, and urea broth; and 2) conduct the KOH and oxidase tests. Generally speaking, Gram-negative organisms are less fastidious (i.e. need fewer nutrients) than Gram-positive organisms; thus, some of the media used for Gram-negative organisms will not support many Gram-positive bacteria. Gram-negative organisms are usually the cause of urine and fecal infections. This lab will cover the initial handling of a fecal specimen that has been determined to be Gram-negative. Lab 19 (Unknown III) will include an introduction to the procedure used with urine specimens. Routine fecal culture is directed at the detection of pathogenic members of the family Enterobacteriaceae, mainly Salmonella and Shigella. MacConkey agar and EMB agar are often used for preliminary plating to eliminate incidental Gram-positive bacteria. In urine specimens, Gram-positive organisms must also be considered (especially Staphylococcus and Enterococcus faecalis). Therefore, urine specimens are also routinely plated to blood agar. Fig. 12.1 illustrates how a fecal specimen might be handled. Note the use of media that were introduced in Lab 10, which serve to isolate a suspected Gram-negative bacterium.
fecal specimen MacConkey or EMB selenite broth
MacConkey or EMB Gram stain:
aerobic Gram-negative organism
confirm Gram stain with KOH test (not done in many labs) TSI slant, SIM deep, urea broth; oxidase test
Fig. 12.1. Typical lab protocol for identifying bacteria responsible for fecal infections. All media are incubated
overnight (18-24 hours) at 37°C. Urea broth This medium tests for the presence of urease, an enzyme that hydrolyzes urea into ammonia, which is a base (i.e. it increases the pH of the broth). Phenol red in the medium turns magenta in basic conditions. See Fig. 12.1.
EXERCISE
12
Figure 12.1. Urea broth. Uninoculated (A), urease positive (B), urease negative (C). A B C

Lab 12 – Gram-Negative Organisms & Media 70
Simmon’s citrate slant This medium tests the organism’s ability to metabolize citrate as its only carbon source. Bromthymol blue is used as a pH indicator. If citrate is used, the medium becomes more alkaline, and turns blue. TSI slant Triple sugar iron (TSI) agar is a very helpful medium that tests for the following reactions: 1. Fermentation of glucose, sucrose, and lactose
There is a higher concentration of lactose and sucrose relative to glucose. This causes different fermentation patterns in the slant and butt portions of the agar, which are visualized by a pH indicator.
2. Gas production from fermentation Fermentation can give rise to CO2 gas, seen as bubbles or cracks in the agar.
3. H2S (hydrogen sulfide) production The medium also contains sulfur-containing metabolites and iron. When cells use the metabolites, H2S is produced, which reacts with the iron to form a black product.
Several combinations of these reactions can be observed. Table 12.1 describes six possible reaction sets, which we will use to describe TSI cultures. Fig. 12.3 shows the six reaction sets.
Figure 12.3. TSI slant. A is uninoculated; B-G show possible results.
A B C
Figure 12.2. Simmon’s citrate slant. Uninoculated (A), citrate negative (B),
citrate positive (C).
A B C D E F G

Lab 12 – Gram-Negative Organisms & Media 71
TSI reaction # Reaction details
1
acid butt acid slant gas present no blackening
glucose fermentation lactose and/or sucrose fermentation gas production from glucose fermentation no H2S production
2
acid butt alkaline slant gas variable blackening
glucose fermentation no lactose or sucrose fermentation possible gas production from glucose fermentation H2S production
3
acid butt alkaline slant gas variable no blackening
glucose fermentation no lactose or sucrose fermentation possible gas production from glucose fermentation no H2S production
4
acid butt acid slant gas variable blackening
glucose fermentation lactose and/or sucrose fermentation possible gas production from glucose fermentation H2S production
5
alkaline butt alkaline slant no gas blackening
no sugars fermented (therefore no acid or gas production) H2S production
6
acid butt acid slant no gas blackening variable
glucose fermentation lactose and/or sucrose fermentation no gas production from glucose fermentation possible H2S production
Table 12.1. Different types of TSI reactions. SIM deep SIM stands for sulfur-indole-motility, and like TSI, can test for multiple reactions: 1. H2S (hydrogen sulfide) production
The medium tests for H2S production in the same manner as TSI. 2. Indole production
If cells can break down tryptophan (an amino acid), indole is one of the products. Indole is detected by the addition of Kovac’s reagent (p-dimethyl aminobenzaldehyde) to the tube after incubation. The reagent turns red in the presence of indole, and does not change color in the absence of indole.
3. Motility SIM has relatively low concentration of agar, which allows motility within the medium. Motile organisms grow throughout the medium; non-motile organisms grow only in the immediate area of inoculation.
See Fig. 12.4 for examples of inoculated SIM media.

Lab 12 – Gram-Negative Organisms & Media 72
Figure 12.4. SIM deep. A-E show various combinations of sulfide production, indole production, and motility. The KOH and oxidase tests The KOH test allows the identification of an organism as Gram-negative or Gram-positive. It is based on differences in cell wall composition: Gram-positive cell walls seem to be resistant to degradation by 3% KOH, whereas Gram-negative cell walls are susceptible. A loopful of cells is mixed in a 3% KOH solution. In Gram-negative organisms, the cell wall breaks down and nucleic acids leak out, which results in a viscous, stringy culture. Gram-positive cell walls remain intact and there is no visible change. The KOH test is a helpful backup for the Gram stain, but should not be used as a substitute, since it does not allow bacterial morphology to be observed (e.g., cocci vs. bacilli), which can be a crucial factor in identification. This test also does not show if a culture is contaminated, which potentially could be demonstrated by the Gram stain.
The oxidase test is helpful in eliminating some Gram-negative bacteria as possible causative organisms (all members of the family Enterobacteriaceae are oxidase negative). Cells are exposed to filter paper soaked in a reagent (tetramethyl-p-phenylenediamine dihydrochloride) that is colorless when reduced, but turns purple to black when oxidized. Organisms possessing cytochrome c oxidase (an electron acceptor) are able to oxidize the reagent and turn the paper purple/black. The color change must occur within 20 seconds to be a positive result.
A B C D E
Figure 12.5. A positive result for a KOH test.
Figure 12.6. Negative (A) and positive (B) results for
the oxidase test.

Lab 12 – Gram-Negative Organisms & Media 73
Materials & Methods Each group will need the following media/supplies and cultures: 1 MacConkey plate 4 TSI slants 4 SIM deeps 2 Simmon’s citrate slants 2 urea broths 3 microscope slides 1 bottle of 3% KOH 1 oxidase test slide
Proteus mirabilis Klebsiella pneumoniae Escherichia coli Salmonella typhimurium Pseudomonas aeruginosa Staphylococcus aureus
1. Inoculate the following media using the following cultures:
Medium All groups
MacConkey plate (1) K. pneumoniae
TSI slant (4) P. mirabilis, K. pneumoniae, E. coli, S. typhimurium
SIM deep (4) P. mirabilis, K. pneumoniae, E. coli, S. typhimurium
Simmon’s citrate slant (2) P. mirabilis, E. coli
urea broth (2) K. pneumoniae, E. coli
Inoculation protocols for new media: a. TSI: use a needle (not a loop) to stab to the bottom of the tube, withdraw, then zigzag the surface b. SIM: use a needle to stab to the bottom of the tube and withdraw c. Simmon’s citrate: use a loop to zigzag across the surface
2. Place newly inoculated cultures in ‘incubation’ racks. Leave tube caps slightly loose to ensure adequate oxygen supply. Cultures will be incubated overnight at 37°C and then kept at 4°C.
3. Perform the KOH test on all six strains.
a. Leave enough room on the slide to test two strains per slide. b. Place one drop of 3% KOH on a slide. c. Gently mix a loopful of cells with the KOH and look for a change in consistency. Recall that no
change = negative result, and increased viscosity = positive result. d. Dispose of slides in Bleach Water container.
4. Perform the oxidase test on all strains except S. aureus.
a. Check for open packages of test slides before opening a new one! b. Each plastic slide has four test areas. Since you are testing five strains, leave room in one test
area to test two strains. c. Spread a loopful of cells onto the test area and look for a color change. Recall that no change =
negative result, and purple/black within 20 seconds = positive result. d. Dispose of slides in biohazard waste.

Lab 12 – Gram-Negative Organisms & Media 74
5. In the next lab session, observe and record results from Day 1. a. Your instructor will bring out uninoculated media for you to compare the ‘before’ and ‘after.’ b. Indole test for SIM: add a few drops of Kovac’s reagent to the top of the SIM culture. Recall
that no color change = negative result, and change to red = positive result. Dispose of empty reagent tubes in waste container labeled Used Indole Tubes.

Lab 12 – Gram-Negative Organisms & Media 75
Results Name & Lab Section:
MacConkey plate
Color of colonies Color of media K. pneumoniae
TSI slant
Reaction # Appearance of media (refer to Table 12.1) P. mirabilis
K. pneumoniae
E. coli
S. typhimurium
SIM deep
Appearance of media S, I, M reactions (indicate + or – for each) S I M
P. mirabilis
K. pneumoniae
E. coli
S. typhimurium
Simmon’s citrate slant Urea broth
Appearance + or – result? Appearance + or – result?
P. mirabilis K. pneumoniae
E. coli E. coli KOH test Oxidase test
+ or – result? Gram + or –? + or – result?
P. mirabilis P. mirabilis
K. pneumoniae K. pneumoniae
E. coli E. coli
S. typhimurium S. typhimurium
P. aeruginosa P. aeruginosa
S. aureus S. aureus X

Lab 12 – Gram-Negative Organisms & Media 76
Discussion 1. If you had inoculated S. aureus onto a MacConkey plate, predict what your results would be.
2. In the Introduction it was mentioned that all members of the family Enterobacteriaceae are oxidase negative. This means they lack the cytochrome c oxidase enzyme. Why do you think they lack the enzyme? (Hint: think about what this enzyme does, and where these bacteria live.)

77
Bacterial Gene Transfer: Transformation
Introduction There are three methods of horizontal gene transfer between bacteria: transformation; conjugation; and transduction. The purpose of this experiment is to become familiarized with bacterial transformation. Transformation is the transfer of “naked” DNA into another organism. By “naked,” it is meant that there is no structure (e.g. the F pilus in conjugation) or vector (e.g. a bacteriophage in transduction) involved in the DNA transfer. In transformation, the genes of the transferred DNA are expressed by the recipient organism. Transformation occurs very rarely in nature, and is also done artificially in the lab. The transformation of bacterial cells with human DNA, such as is done with the genes for human insulin or human growth hormone (hGH), is a complex process. However, in vitro methods of gene transfer into E. coli using plasmids are routinely done and relatively simple. The major steps of an E. coli transformation in vitro are as follows:
1. chemically treat cells to increase their competency, i.e. make them more permeable to DNA 2. incubate cells with plasmid 3. heat shock cells to take up plasmid 4. let cells recover from heat shock 5. plate (i.e. inoculate) cells onto agar media and incubate overnight
The pGREEN plasmid The plasmid we will use in this experiment is called pGREEN. It contains two genes: an ampicillin resistance gene (AmpR) and a gene called green fluorescent protein (GFP). AmpR serves as a selectable marker used in selection of colonies that took up the plasmid. GFP is the “gene of interest” that we want the E. coli to possess after transformation. The GFP gene was originally isolated from Aequorea victoria, a bioluminescent jellyfish. Cells that express the GFP gene (i.e. make the GFP protein) will glow green (this is enhanced under blacklight). If a colony of cells has been successfully transformed, it will contain both AmpR and GFP. (Another reason for including antibiotic resistance genes is that any transformed bacteria are at a competitive disadvantage, because they expend energy expressing the gene of interest in the plasmid.) Positive and negative controls Each group will set up a “real” transformation and a “mock” transformation, the only difference being that the mock transformation does not contain plasmid DNA. Both reactions will be subjected to the same protocol and ultimately plated to different agar media. Luria-Bertani (LB) agar will be used in this experiment; plates will either contain ampicillin (LB/Amp) or not (LB). In any experiment it is important to have positive and negative controls. For the sake of simplicity, most lab exercises do not include controls. However, this transformation experiment incorporates positive and negative controls because there are several reagents (“ingredients”) required, and it is essential to verify that they are all working as intended.
EXERCISE
13

Lab 13 – Transformation 78
A positive control ensures that other reagents in the experiment are working as they should be in order to give a positive result; in this case, it means growth on either LB plate. A negative control ensures that the user does not get positive results when they are not expected (i.e. no false positives); in this case, it means no growth on the LB/Amp plate using the mock transformed cells. More details about the control plates are provided in the Materials and Methods section. Materials & Methods Each group will need the following supplies and cultures: 1 Escherichia coli culture plate 2 LB agar plates* 2 LB/Amp agar plates* 2 15 ml round bottom tubes*† 1 beaker filled with ice 1 tube rack 1 vial cold 50 mM CaCl2 (calcium chloride) *† 1 vial LB broth*
4 “hockey stick” cell spreaders* 1 P100 micropipette 1 box of pipette tips* 1 empty beaker for used pipette tips For the class: 42°C water bath vial of pGREEN DNA (0.005 mg/ml)
*these are sterile; apply proper sterile technique when using them! †keep on ice as much as possible
DAY 1 (see Fig. 15.1 on next page for a summary of these steps) 1. The fresh agar plates look identical – immediately label them as LB or LB/Amp!
2. Label one 15 ml tube “real” or “+DNA”, and the other one “mock” or “–DNA”.
3. Add 250 μl cold CaCl2 to each tube (pipet ~85 μl three times).
4. Use sterile loop to add one colony of E. coli cells to each tube. Avoid transferring any agar.
5. Pipet gently but thoroughly to suspend cells (the solution should be cloudy, not clumpy).
6. Your instructor will add 10 μl of plasmid DNA to your +DNA tube.
7. Incubate tubes on ice for 15 minutes. Label your four plates while you are waiting:
Plate Cells to inoculate Purpose of plate Suggested name for plate
LB/Amp “real” transformed cells (+DNA) experimental plate LB/Amp+
LB/Amp “mock” transformed cells (–DNA) negative control LB/Amp–
LB “real” transformed cells (+DNA) positive control LB+
LB “mock” transformed cells (–DNA) positive control LB–

Lab 13 – Transformation 79
8. Heat shock cells in both tubes in 42°C water bath for 90 seconds.
9. Incubate tubes on ice for 1-2 minutes.
10. Add 250 μl LB broth to each tube. Mix gently by pipetting.
11. Incubate at room temperature for 10 minutes.
12. Pipet 100 μl of cell suspension onto the appropriate media.
13. Use spreader to cover surface of plate with cell suspension. Let covered plates sit for 5 minutes to allow absorption of liquid into the agar.
14. Place plates in “incubation” racks. Cultures will be incubated overnight at 37°C. DAY 2 In the next lab session, observe and record results from Day 1.
“mock” or –DNA “real” or +DNA
both tubes are treated
equally except for addition of
plasmid
add 250 μl cold CaCl2 add one clump of cells
pipet thoroughly + or – DNA
incubate on ice 15’ label plates
heat shock 42° 90” incubate on ice 1-2’
add 250 μl LB, pipet gently incubate room temp 10’
pipet 100 μl to appropriate media use spreader, wait 5’
place in incubation rack
Figure 13.1. Summary of transformation protocol.

Lab 13 – Transformation 80
This page is intentionally blank

Lab 13 – Transformation 81
Results Name & Lab Section:
1. Observe the colonies through the bottom of the plate (do not remove the lid) and complete the table.
Plate Is growth expected?
Is growth observed?
Number of colonies
Expected phenotypes Observed phenotypes
LB/Amp+
LB/Amp–
LB+
LB–
Expected vs. observed: what you expect is essentially your prediction of the result, based on your understanding of the experiment. What you observe is what actually happened. Number of colonies: count the number of colonies that grew on half of the plate, then double it to get an estimate of the total colonies on each plate. It may help to circle each colony with a pen as it is counted. If growth is too dense to count individual colonies, record this as a “lawn” of growth. Phenotypes: a phenotype is an observable property of an organism. In this experiment the possible phenotypes are 1) being resistant or sensitive to ampicillin (AmpR or AmpS, respectively) and 2) the colony color (white or green). You can observe colony color by shining UV light (blacklight) onto the plate.
2. What happened during the experiment that caused the different phenotypes (green vs. white, AmpR
vs. AmpS)?

Lab 13 – Transformation 82
Discussion 1. Did any of your actual results differ from what you expected? If so, explain what you think may have
caused the results. 2. Think carefully, and explain what the expected results for the plates below tells you about how the
experiment is supposed to work. a. LB+ (with DNA) and LB– (without DNA) plates
b. LB/Amp+ and LB+ plates
3. Do not think about the GFP gene for this question: what tells you that any transformation experiment is successful? In other words, what is it you are selecting for?

83
DNA Fingerprinting: Detecting the p53 Tumor Suppressor Gene
Introduction The purpose of this lab is to determine whether a patient has a specific genetic marker which increases the chance of developing cancer. The presence of this genetic marker is determined by a series of techniques, collectively known as DNA fingerprinting:
1. tissue biopsy 2. DNA extraction 3. restriction enzyme digest 4. PCR 5. gel electrophoresis
Restriction enzymes After DNA has been extracted from cells in the biopsy, restriction enzymes are used to cut up (i.e. digest) the double stranded DNA at various places. As your instructor may have mentioned, restriction endonucleases (aka restriction enzymes, or REs) are produced by certain species of bacteria and act as an immune system to digest the DNA of bacteriophages trying to infect them. REs were first purified from bacteria in the late 1960s, and today there are hundreds of commercially available types routinely used in laboratory procedures. Restriction enzymes can be thought of as molecular scissors for DNA. Any given RE will recognize and cut DNA at a specific sequence called a restriction site. For example, the restriction enzyme EcoRI recognizes and cuts at GAATTC (both strands will be cut because the other strand also has GAATTC going the other direction). EcoRI cuts (i.e. breaks a bond) between the G and A on both strands, resulting in two smaller DNA molecules. There is nothing special about a given restriction site; they are randomly scattered throughout the genome. If EcoRI and human DNA are mixed in a tube, the enzyme will cut anywhere there is a GAATTC in the genome. We can use this to determine the genotype of an individual; that is, whether he/she has certain genetic markers. Agarose gel electrophoresis After the DNA has been digested, we need a way to see how large the fragments are. The samples are loaded into a set of wells on one side of a gel made of agar and buffer, which has a porous consistency similar to that of gelatin, and is itself submerged in buffer. DNA molecules move through the pores when an electrical current is applied. Keep in mind that each sample contains thousands, if not millions, of DNA molecules. The point is to separate all of them based on their length/size (in base pairs). Longer/larger molecules travel more slowly through the gel, and shorter/smaller molecules travel more quickly. Molecules of the same length/size will end up in the same vertical position in the gel and appear as a rectangular band (because the well is rectangular).
EXERCISE
14

Lab 14 – DNA Fingerprinting 84
To measure how long/large each band is, a sample known as a DNA ladder is also loaded. The ladder contains DNA molecules of known lengths. Fig. 14.1 shows one example of a DNA ladder that has been run out on a gel. The ladder is run alongside other samples and serves as a ruler with which to measure them. The DNA ladder used in this lab is not technically required, since all we need to look for is the relative lengths of each band in the other four DNA samples. Knowledge of the relative lengths is sufficient to determine the genotype of the patient in her three cell types (RBC, breast tumor, and healthy breast). What is DNA fingerprinting? DNA fingerprinting is the restriction digest of genomic DNA and subsequent gel electrophoresis of the resulting DNA fragments. Since only ~2% of our DNA actually codes for protein, the vast majority of our genome can undergo mutations with no deleterious effects. A given mutation can create, or destroy, a restriction site (Fig. 14.2). Recall that mutations occur randomly. Taken together, this means that a genomic digest of one person’s DNA will result in a unique set of DNA fragments, different from anyone else. This is why they are referred to as DNA fingerprints. Uses/applications of DNA fingerprinting Obtaining DNA fingerprints can provide a wealth of genetic information about a person. DNA fingerprinting is used in paternity testing, crime scene investigations, and genetic screening of diseases. It can also be used for non-human DNA, such as identifying the pathogen responsible for an outbreak. Today’s lab: a DNA fingerprint focusing on one gene In this lab we will be looking at only one gene in the human genome: the tumor suppressor gene p53. The healthy version of p53 codes for a protein that ensures our cells divide only when appropriate. There is a common mutation to p53 that renders the protein non-functional, and by coincidence, this mutation creates a new EcoRI restriction site. We will be looking at the p53 gene of a patient to see whether her cells have the healthy, unhealthy, or both versions of p53. An important note: humans contain two copies of every gene (one inherited from each parent), so there are three possible combinations. See Fig. 14.3. In order to look at only one gene out of the entire set of digested DNA fragments, we need some way of making more copies of it. In the list of five techniques on the previous page, steps 3 and 4 are reversed. In other words, PCR is done first to amplify the p53 gene using gene-specific primers and a small amount of undigested DNA as the template. The PCR product is then digested with EcoRI. This has already been done for you; all that remains is to 1) load the samples in an agarose gel, 2) run the gel to separate the DNA fragments by size, and 3) visualize them with a DNA stain.
EcoRI WILL cut Mutation EcoRI will NOT cut
GAATTC CTTAAG
GAGTTC CTCAAG
Figure 14.2. Mutations (affected bases in yellow) can create (left arrow) or destroy (right arrow) restriction sites.
Figure 14.1. A typical DNA ladder showing the sizes and
relative abundance of each set of DNA fragments.

Lab 14 – DNA Fingerprinting 85
*<-------------------------------- 8 kbp --------------------------------->* p53 gene
*<--------------------- 6 kbp --------------------->*<---- 2 kbp ---->* p53 gene
Figure 14.3. Restriction sites (stars) found in a healthy (above) and unhealthy (below) p53 gene. Materials & Methods Each group will need the following supplies and equipment: 1 gel box containing an agarose gel 1 gel box lid with electrodes 1 power supply 1 small plastic container 1 Petri dish with a “practice” gel 1 tube of DNA loading dye to use on practice gel
1 P100 micropipette 1 box of pipette tips* 1 empty beaker for used pipette tips 1 set of DNA samples Gel running buffer DNA stain
*these are sterile; apply proper sterile technique when using them!
1. Practice loading samples “submarine” style with the loading dye and practice gel. Your instructor will demonstrate the technique.
2. When ready, load the five DNA samples. There is roughly 30-35 µl of each sample; load as much as
possible into each well. Your gel has six wells, so plan accordingly. The five samples are described below.
DNA sample Sample description
A DNA ladder
B Control DNA (from cells of a cancer-free patient)
C Patient red blood cell DNA
D Patient breast tumor cell DNA
E Patient healthy breast cell DNA
3. After the samples are loaded into the wells, secure the lid onto the gel box. Make sure the electrodes
are firmly plugged in – one end with the gel box, and the other with the power supply.
4. Plug in and turn on the power supply. Set it to 120-150 volts. Have your instructor come by and check that everything has been set up correctly.
5. Run the gel for ~45-60 minutes.

Lab 14 – DNA Fingerprinting 86
6. When finished, begin staining the gel: a. Turn off the power supply. b. Unplug and remove the gel box lid. c. Remove the tray containing the gel out of the gel box, and partly unscrew the small plastic screws
holding the gel in the tray. The plastic ‘door’ will drop down once the screws are loosened. d. Gently slide the gel into the small plastic container. e. Your instructor will add the DNA stain. f. Let sit for 2-3 minutes. Carefully pour the stain back into the bottle.
7. Cleanup: while the gel is destaining in step 8, return equipment to carts. Gel running buffer can be
poured down the drain. Practice gels can be disposed of in the trash. 8. Destain the gel to remove the background staining:
a. Add warm tap water to the container. Let sit for 2-3 minutes. Pour water down the drain. b. Repeat until the DNA bands become easily visible, or until the background becomes very light
blue.
9. When the DNA bands are clearly visible, sketch your results in the Results section.
10. Dispose of the gel in the trash. Return any remaining items to the carts in the appropriate places.

Lab 14 – DNA Fingerprinting 87
Results Name & Lab Section:
1. Make a well-labeled diagram of your actual gel results below. The wells are indicated by the boxes.
Discussion 1. The Introduction mentioned that there are three possible results when testing a given DNA sample.
Each possible result is run in its own lane of an agarose gel. Describe and draw what these three lanes would look like.
2. Based on the expected results for the gel (NOT the actual results you sketched above), what can you conclude about the genotype of the patient in her different cell types? Explain your answer.

Lab 14 – DNA Fingerprinting 88
This page is intentionally blank

89
Unknown I: Gram-Positive Species
Introduction By this point students should have become familiarized with the media and tests most commonly used to identify Gram-positive organisms. The purpose of this experiment is to use these media and tests to identify an unknown Gram-positive organism. Each student will be given a starter culture to identify. Each culture is one of four possible species: Staphylococcus aureus; Staphylococcus epidermidis; Enterococcus faecalis; or Streptococcus pyogenes. Bacterial identification is achieved by Gram staining and conducting other necessary tests (see Fig. 15.1). An attempt has been made to streamline the identification procedure. This is a realistic approach for two reasons: 1) in an actual laboratory identification, the spectrum of choices is narrowed to a few species, based on the disease symptoms presented; 2) identification is made in as few steps as possible to save both time and money. Table 15.1 summarizes test results for each unknown. Identification will be based on the following criteria:
1. Gram stain reaction and morphology 2. Reactions on various S&D media and tests (including blood agar)
The first inoculation will be onto blood agar. This has several purposes: to check the culture for purity; to grow enough of the culture to perform subsequent tests; and to observe any potential hemolysis. Materials & Methods Since each student is working on one of four unknowns, a general protocol is described here. Refer to the dichotomous key in Fig. 15.1 to determine which media and tests to use. Refer to previous lab exercises for inoculation protocols and descriptions of positive and negative results. Keep detailed notes on what tests you do, their results, your conclusions, etc. DAY 1 Inoculate unknown onto blood agar. Incubate overnight at 37°C. DAY 2 Use colonies on blood agar plate for all subsequent tests and inoculations. Perform a Gram stain to verify your unknown is a Gram-positive coccus. Refer to Fig. 15.1 and perform the appropriate tests and/or inoculations for your unknown. Observe and record results on an Unknown Worksheet. DAY 3 Observe and record results on an Unknown Worksheet. Finish identification.
EXERCISE
15

Lab 15 – Unknown I 90
NaCl
hemolysis hemolysis
uh oh… S. pyogenes uh oh… E. faecalis
+
γ
β
–
others others
Figure 15.1. Dichotomous key for Unknown I. Media and tests to perform are highlighted in yellow.
S. aureus S. epidermidis E. faecalis S. pyogenes
catalase + + – –
MSA + –
Staph-Tex + –
Hemolysis double zone little or none gamma beta
NaCl broth + –
Table 15.1. Summary of test results for Unknown I species. Results & Discussion
For Unknown I, turn in a completed Unknown Worksheet.
Gram+ coccus
catalase
+ –
MSA
Staph-Tex Staph-Tex
hemolysis uh oh… hemolysis
uh oh… S. aureus uh oh… S. epidermidis
+
+ +
little to none
double zone
–
– –
others others

91
Unknown II: Gram-Negative Species
Introduction By this point students should have become familiarized with the media and tests most commonly used to identify Gram-negative organisms. The purpose of this experiment is to use these media and tests to identify an unknown Gram-negative organism. Each student will be given a starter culture to identify. Each culture is one of four possible species: Escherichia coli; Klebsiella pneumoniae; Proteus mirabilis; or Salmonella spp. Bacterial identification is achieved by Gram staining and conducting other necessary tests (see Fig. 16.1). An attempt has been made to streamline the identification procedure. This is a realistic approach for two reasons: 1) in an actual laboratory identification, the spectrum of choices is narrowed to a few species, based on the disease symptoms presented; 2) identification is made in as few steps as possible to save both time and money. Table 16.1 summarizes test results for each unknown. Identification will be based on the following criteria:
1. Gram stain reaction and morphology 2. Reactions on various S&D media and tests (including blood agar)
Materials & Methods Since each student is working on one of four unknowns, a general protocol is described here. Refer to Fig. 16.1 and Table 16.1 to determine the identity of your unknown. All students use the same media and tests for this lab. Refer to previous lab exercises for inoculation protocols and descriptions of positive and negative results. Keep detailed notes on what tests you do, their results, your conclusions, etc. DAY 1 Inoculate unknown onto blood agar. Incubate overnight at 37°C. DAY 2 Use colonies on blood agar plate for all subsequent tests and inoculations. Observe and record hemolysis patterns on an Unknown Worksheet. Perform a Gram stain to verify your unknown is a Gram-negative bacillus. Confirm with KOH test. Perform ALL tests and/or inoculations shown in Fig. 16.1 and Table 16.1:
TSI, SIM, urea broth, MacConkey, Simmon’s citrate, oxidase test DAY 3 First determine TSI reaction, then proceed to Table 16.1 for the others. Observe and record results. Finish identification if possible. Repeat any desired tests and/or inoculations for final observations on Day 4.
EXERCISE
16

Lab 16 – Unknown II 92
Figure 16.1. Modified dichotomous key for Unknown II.
E. coli K. pneumoniae P. mirabilis Salmonella spp.
hemolysis gamma gamma* gamma^ gamma
oxidase – – – –
indole + +/– – –
motility +/– – ++ +/–
urea – weak + + –
MacConkey + weak + – –
Simmon’s citrate – + – +/–
*K. pneumoniae has “drop-like” colony morphology on blood agar ^P. mirabilis has a swarming pattern of growth on blood agar
Table 16.1. Summary of test results for Unknown II species. Results & Discussion
For Unknown II, turn in a completed Unknown Worksheet.
Gram– bacillus
TSI reaction 5 or 6
uh oh… 4
1 E. coli or
K. pneumoniae 2 3
E. coli, K. pneumoniae, or
Salmonella spp.
P. mirabilis or Salmonella spp.
E. coli or P. mirabilis

93
Unknown III: Urine Culture
Introduction The purpose of this experiment is to identify an unknown bacterial species from a simulated urine culture. Urinary bladder infections can be caused by Gram-positive and Gram-negative bacteria. (A count of over 105 bacteria/ml urine is considered significant in terms of an infection, so the first lab test would be to quantify the bacteria in the urine specimen. This involves inoculating a small volume of urine, for example 1 μl, onto MacConkey and blood agar, counting colonies, and back-calculating. In the example, 100 colonies on either plate would be considered significant. In the interest of time, we will not be quantifying the simulated urine culture.) The causative organism may be sensitive to certain antibiotics, depending on its identity. This can be easily tested by performing an antibiotic sensitivity screen (this should have been done this in a previous lab). Paper discs soaked with various antibiotics are placed on a Mueller-Hinton agar plate that has been inoculated with the urine culture, and the zones of inhibition (i.e. clear zones) are measured after overnight incubation. These results are useful not only for prescribing antibiotics for the patient, but also aid in identification of the bacteria through comparing the unknown’s drug sensitivity profile with profiles of other species. Materials & Methods Each student is working on one of the unknowns from Unknown I or II (eight possibilities); a general protocol is described here. After you determine the Gram-ness of your unknown, refer back to Unknown I or II and proceed the same way as before. Refer to previous lab exercises for inoculation protocols and descriptions of positive and negative results. Keep detailed notes on what tests you do, their results, your conclusions, etc. DAY 1 Initial inoculations: 1. blood agar by quadrant streak 2. MacConkey by quadrant streak 3. Mueller-Hinton by swabbing over entire surface (3x coverage). Refer to Lab 9 for more details. Incubate all media overnight at 37°C. DAY 2 Use colonies on blood agar plate for all subsequent tests and inoculations. Record hemolysis patterns. Measure clear zones on Mueller-Hinton plate and record on UK III Worksheet Addendum. Perform a Gram stain on your unknown. Confirm with KOH test. Proceed along ‘Gram+’ path (Fig. 15.1 and Table 15.1) or ‘Gram–’ path (Fig. 16.1 and Table 16.1).
EXERCISE
17

Lab 17 – Unknown III 94
DAY 3 Observe and record results. Finish identification if possible. Repeat any desired tests and/or inoculations for final observations on Day 4. Results & Discussion
Check with your instructor to find out what to turn in for Unknown III.

95
Unknown Worksheet (check one: □ UK I □ UK II □ UK III) Name & Lab Section:
Microscopic appearance by Gram stain: ___________________________________ Unknown #: __________
Blood agar colony description: ___________________________________ Final identification: ____________________________________
Date Incubation time (hrs)
Name of medium or test
Rationale Result Conclusion

96
Unknown Worksheet (check one: □ UK I □ UK II □ UK III) Name & Lab Section:
Microscopic appearance by Gram stain: ___________________________________ Unknown #: __________
Blood agar colony description: ___________________________________ Final identification: ____________________________________
Date Incubation time (hrs)
Name of medium or test
Rationale Result Conclusion

97
Unknown Worksheet (check one: □ UK I □ UK II □ UK III) Name & Lab Section:
Microscopic appearance by Gram stain: ___________________________________ Unknown #: __________
Blood agar colony description: ___________________________________ Final identification: ____________________________________
Date Incubation time (hrs)
Name of medium or test
Rationale Result Conclusion

98
Unknown Worksheet (check one: □ UK I □ UK II □ UK III) Name & Lab Section:
Microscopic appearance by Gram stain: ___________________________________ Unknown #: __________
Blood agar colony description: ___________________________________ Final identification: ____________________________________
Date Incubation time (hrs)
Name of medium or test
Rationale Result Conclusion

99
Unknown Worksheet (check one: □ UK I □ UK II □ UK III) Name & Lab Section:
Microscopic appearance by Gram stain: ___________________________________ Unknown #: __________
Blood agar colony description: ___________________________________ Final identification: ____________________________________
Date Incubation time (hrs)
Name of medium or test
Rationale Result Conclusion

100
Unknown Worksheet (check one: □ UK I □ UK II □ UK III) Name & Lab Section:
Microscopic appearance by Gram stain: ___________________________________ Unknown #: __________
Blood agar colony description: ___________________________________ Final identification: ____________________________________
Date Incubation time (hrs)
Name of medium or test
Rationale Result Conclusion

101
UK III Worksheet Addendum Name & Lab Section:
Kirby-Bauer sensitivity screen
Antibiotic Zone of inhibition
diameter (mm) Effect
(resistant, intermediate, susceptible)
Amoxicillin, Clavulanic acid (AMC)
Ampicillin (AMP)
Bacitracin (B)
Neomycin (N)
Penicillin (P)
Streptomycin (S)
Triple sulfa (sulfonamides) (S3)
Vancomycin (VA)

102
This page is intentionally blank

103
Graphing Tutorial
Making and reading graphs is an important skill in the biomedical sciences. When made well, they convey a great deal of information in a concise manner. When read well, the reader gleans a great deal of information. Experimental results are often presented visually with graphs to complement the corresponding text, and are found in all forms of scientific literature, including textbooks. The goal of this Appendix is to help you develop your graphing skills. Graphing Tutorial, U.S. Dept. of Education Log on to the course website and read through the Graphing Tutorial, prepared by the National Center of Education Statistics (NCES) in the U.S. Dept. of Education. Here are some additional comments:
“How do I choose which type of graph to use?” Read this section of the tutorial to learn about the different types of graphs. Each type presents information in its own way, and it is important to choose the type that will most effectively convey what you want. In this course you will see mostly bar graphs and line graphs, so we will focus on these two in the next sections. “Building bar graphs” Bar graphs are used to show the same variable (plotted on the Y-axis) in different situations (plotted on the X-axis). Read this section. A good bar graph contains the elements described in this section. “Learning line graphs” Line graphs are used to show how one variable (plotted on the Y-axis) changes over time (plotted on the X-axis). Read this section. A good line graph contains the same elements described in the bar graph section. “What are independent and dependent variables?” Read this section of the tutorial to learn about the differences between independent and dependent variables.
Final comments Here are a few last words on making effective graphs:
• Use plenty of space to plot your graph. It is easier to read a large graph than a squished one. • As long as the data are presented accurately, the axes do not have to start at zero.
When you are done going through the Graphing Tutorial document, complete the Graphing Activity on the next page. Your instructor may assign this as graded work.
APPENDIX

104
This page is intentionally blank

105
Graphing Activity Name & Lab Section:
1. Use the experimental data below to produce a graph that effectively conveys the information. 2. Answer the questions below.
Test subject Number of kinds of colonies before hand washing
Number of kinds of colonies after hand washing
A 4 2
B 3 3
C 5 3
D 2 1
• What type of graph did you decide to make? Why did you choose that type? • What is the independent variable in this experiment? Why?
• What is the dependent variable in this experiment? Why?