Enhanced supercapacitance of multiwalled carbon nanotubes functionalized with ruthenium oxide
Upload
manchesterCategory
view
0download
0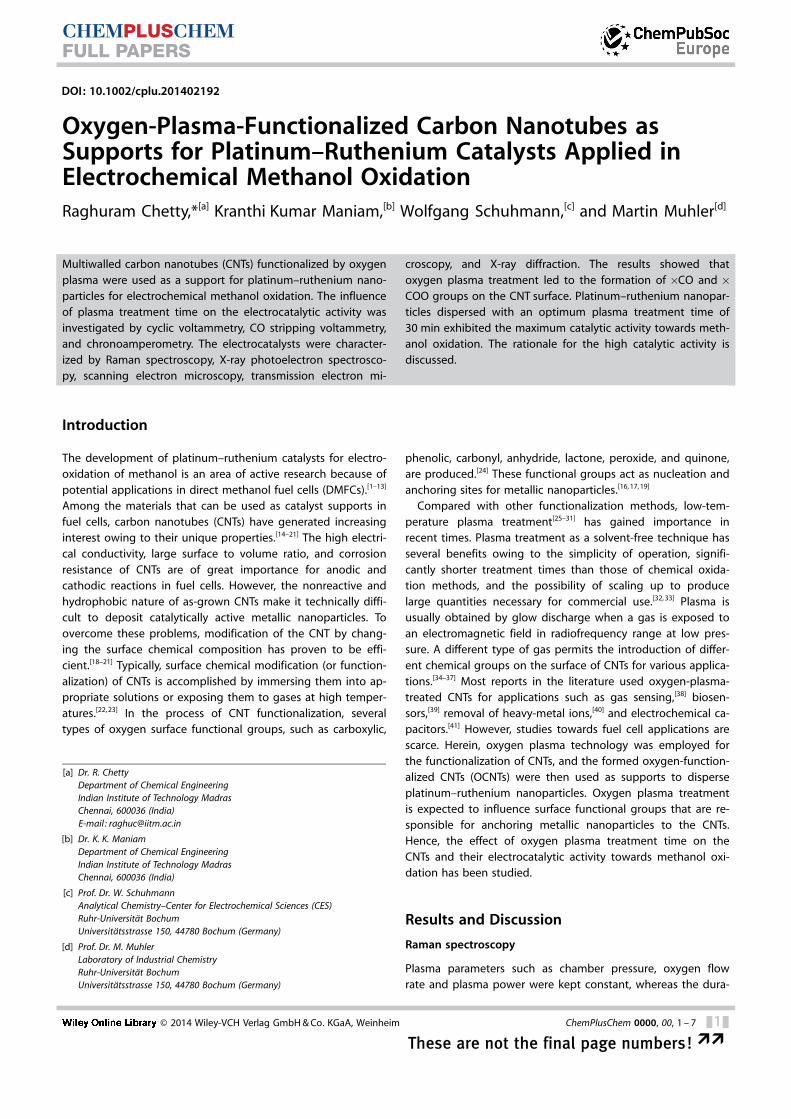
DOI: 10.1002/cplu.201402192
Oxygen-Plasma-Functionalized Carbon Nanotubes asSupports for Platinum–Ruthenium Catalysts Applied inElectrochemical Methanol OxidationRaghuram Chetty,*[a] Kranthi Kumar Maniam,[b] Wolfgang Schuhmann,[c] and Martin Muhler[d]
Introduction
The development of platinum–ruthenium catalysts for electro-oxidation of methanol is an area of active research because ofpotential applications in direct methanol fuel cells (DMFCs).[1–13]
Among the materials that can be used as catalyst supports infuel cells, carbon nanotubes (CNTs) have generated increasinginterest owing to their unique properties.[14–21] The high electri-cal conductivity, large surface to volume ratio, and corrosionresistance of CNTs are of great importance for anodic andcathodic reactions in fuel cells. However, the nonreactive andhydrophobic nature of as-grown CNTs make it technically diffi-cult to deposit catalytically active metallic nanoparticles. Toovercome these problems, modification of the CNT by chang-ing the surface chemical composition has proven to be effi-cient.[18–21] Typically, surface chemical modification (or function-alization) of CNTs is accomplished by immersing them into ap-propriate solutions or exposing them to gases at high temper-atures.[22, 23] In the process of CNT functionalization, severaltypes of oxygen surface functional groups, such as carboxylic,
phenolic, carbonyl, anhydride, lactone, peroxide, and quinone,are produced.[24] These functional groups act as nucleation andanchoring sites for metallic nanoparticles.[16, 17, 19]
Compared with other functionalization methods, low-tem-perature plasma treatment[25–31] has gained importance inrecent times. Plasma treatment as a solvent-free technique hasseveral benefits owing to the simplicity of operation, signifi-cantly shorter treatment times than those of chemical oxida-tion methods, and the possibility of scaling up to producelarge quantities necessary for commercial use.[32, 33] Plasma isusually obtained by glow discharge when a gas is exposed toan electromagnetic field in radiofrequency range at low pres-sure. A different type of gas permits the introduction of differ-ent chemical groups on the surface of CNTs for various applica-tions.[34–37] Most reports in the literature used oxygen-plasma-treated CNTs for applications such as gas sensing,[38] biosen-sors,[39] removal of heavy-metal ions,[40] and electrochemical ca-pacitors.[41] However, studies towards fuel cell applications arescarce. Herein, oxygen plasma technology was employed forthe functionalization of CNTs, and the formed oxygen-function-alized CNTs (OCNTs) were then used as supports to disperseplatinum–ruthenium nanoparticles. Oxygen plasma treatmentis expected to influence surface functional groups that are re-sponsible for anchoring metallic nanoparticles to the CNTs.Hence, the effect of oxygen plasma treatment time on theCNTs and their electrocatalytic activity towards methanol oxi-dation has been studied.
Results and Discussion
Raman spectroscopy
Plasma parameters such as chamber pressure, oxygen flowrate and plasma power were kept constant, whereas the dura-
Multiwalled carbon nanotubes (CNTs) functionalized by oxygenplasma were used as a support for platinum–ruthenium nano-particles for electrochemical methanol oxidation. The influenceof plasma treatment time on the electrocatalytic activity wasinvestigated by cyclic voltammetry, CO stripping voltammetry,and chronoamperometry. The electrocatalysts were character-ized by Raman spectroscopy, X-ray photoelectron spectrosco-py, scanning electron microscopy, transmission electron mi-
croscopy, and X-ray diffraction. The results showed thatoxygen plasma treatment led to the formation of �CO and �COO groups on the CNT surface. Platinum–ruthenium nanopar-ticles dispersed with an optimum plasma treatment time of30 min exhibited the maximum catalytic activity towards meth-anol oxidation. The rationale for the high catalytic activity isdiscussed.
[a] Dr. R. ChettyDepartment of Chemical EngineeringIndian Institute of Technology MadrasChennai, 600036 (India)E-mail : [email protected]
[b] Dr. K. K. ManiamDepartment of Chemical EngineeringIndian Institute of Technology MadrasChennai, 600036 (India)
[c] Prof. Dr. W. SchuhmannAnalytical Chemistry–Center for Electrochemical Sciences (CES)Ruhr-Universit�t BochumUniversit�tsstrasse 150, 44780 Bochum (Germany)
[d] Prof. Dr. M. MuhlerLaboratory of Industrial ChemistryRuhr-Universit�t BochumUniversit�tsstrasse 150, 44780 Bochum (Germany)
� 2014 Wiley-VCH Verlag GmbH & Co. KGaA, Weinheim ChemPlusChem 0000, 00, 1 – 7 &1&
These are not the final page numbers! ��
CHEMPLUSCHEMFULL PAPERS

tion of plasma exposure was varied from 10 to 40 min to givedifferent surface oxygen concentrations. The samples were la-beled accordingly as OCNT1, OCNT2, OCNT3, and OCNT4 for10, 20, 30, and 40 min of oxygen plasma treatment, respective-ly. The platinum–ruthenium catalysts were then impregnatedby using a stock solution of chloride precursor to attain a nomi-nal metal loading of 20 wt % and 1:1 (Pt/Ru) ratio on the func-tionalized CNTs.
Raman spectroscopy was used to study the surface structureof the OCNTs (Figure 1). CNTs with and without functionaliza-
tion have similar Raman scattering patterns. The peaks nearn= 1328 and 1577 cm�1, corresponding to sp3- and sp2-hybrid-ized carbon, respectively, signify a disordered graphite struc-ture (D band) and the ordered state (G band) on the CNT sur-face, respectively. The extent of modification or defects in CNTscan be evaluated by the intensity ratio of the D andG bands.[42] The calculated ID/IG intensity ratios are 1.05, 1.06,1.14, and 1.01 for OCNT1, OCNT2, OCNT3, and OCNT4, respec-tively; it is 1.03 for untreated CNTs. The ID/IG ratio increased ini-tially with increasing plasma treatment time, leading to an in-creased amount of sp3 carbon, whereas a decrease in the ID/IG
ratio was observed for the longest plasma treatment time(OCNT4).
Prolonged plasma treatment has been reported to partiallyremove the graphitic sheets from the CNT structure.[44] More-over, slight broadening of the D and G peaks is observed uponincreasing the plasma treatment time to 40 min, which indi-cates extreme exposure of CNTs to oxygen plasma.[43] OCNTsexhibit a significantly increased hydrophilicity and can beeasily dispersed in water, whereas the untreated as-receivedCNTs cannot be dispersed in water.
X-ray photoelectron spectroscopy (XPS)
The C 1 s spectra of unfunctionalized and OCNTs are shown inFigure 2. The C 1 s core-level spectra of all CNT samples exhibita dominant peak at 284.5 eV, owing to the sp2-carbon atomsof the graphene sheets.[45] However, there are clear differencesin the spectra after plasma functionalization. The intensities of
the signals increase to 286 and 288.5 eV for OCNTs, owing tothe presence of �C�OH[46, 47] and �COO groups.[48] These sig-nals are less pronounced in the unfunctionalized CNTs. As seenfrom the results shown in Figure 2, the intensity of oxygen-containing groups increases with increasing plasma treatmenttime. A close examination of the graphitic carbon peakshowed an increase in the full-width at half-maximum (FWHM)up to 30 min before decreasing at longer plasma treatmenttimes. The increase in FWHM indicates higher porosity with de-creasing graphitic character.[49] In addition, broadening of the C1 s spectrum also suggests the introduction of chemical andphysical defects owing to decreased delocalization.[50] Thisresult is in agreement with those obtained by Raman spectros-copy, which showed an increase in the ID/IG ratio from 1.05 to1.14 up to 30 min of plasma treatment time.
Representative Pt 4 f and Ru 3 p3/2 spectra of Pt�Ru deposit-ed on an OCNT (e.g. , OCNT3) are shown in Figure 3. The Pt 4 f
spectrum exhibited a doublet containing a low-energy(Pt 4 f7/2) peak and a high-energy (Pt 4 f5/2) peak at approxi-mately 71.5 and 74.9 eV; these can be assigned to metallic Ptand Pt2+ ions, respectively.[51] X-ray photoelectron spectra forthe Pt 4 f region suggest the presence of a significant amountof Pt0 at the surface of OCNT3. In the case of Ru, the Ru 3 p3/2
spectrum was considered for the deconvolution process be-
Figure 1. Raman shifts showing the D and G bands of OCNTs before deposi-tion of platinum–ruthenium nanoparticles : a) as-received unfunctionalizedCNTs; b) 10 (OCNT1), c) 20 (OCNT2), d) 30 (OCNT3), and e) 40 min (OCNT4) ofplasma treatment.
Figure 2. Deconvoluted X-ray photoelectron spectra showing the C 1 s peakof a) unfunctionalized as-received CNTs, and OCNTs subjected to variousoxygen plasma treatment times: b) 10, c) 20, d) 30, and e) 40 min.
Figure 3. X-ray photoelectron spectra showing the a) Pt 4 f and b) Ru 3 p3/2regions of platinum–ruthenium catalyst deposited on OCNT3.
� 2014 Wiley-VCH Verlag GmbH & Co. KGaA, Weinheim ChemPlusChem 0000, 00, 1 – 7 &2&
These are not the final page numbers! ��
CHEMPLUSCHEMFULL PAPERS www.chempluschem.org

cause of the overlap of Ru 3 d peaks with the C 1 s spectrum,and the two deconvoluted peaks at 461.9 and 464.9 eV wereattributed to Ru and RuO2 species, respectively.[52] These resultssupport the substantial existence of metallic Pt and Ru in thePt�Ru/OCNT3 catalyst.
The elemental surface compositions of all platinum–rutheni-um catalysts supported on OCNTs determined from the XPSsurvey scan are summarized in Table 1. The surface atomic con-
centrations calculated from the corresponding peak areasshowed an increase in surface oxygen with increasing plasmatreatment time. The concentration of oxygen increased from4.2 % at 10 min plasma treatment to 5.1 % after 40 min ofplasma treatment. The surface concentration of platinum andruthenium remained almost constant.
SEM and TEM analysis
The SEM micrographs of platinum–ruthenium deposition onfunctionalized CNTs are presented in Figure 4. The metallicnanoparticles were well dispersed on the outer surface of theCNTs, which were subjected to various oxygen plasma treat-ment times, and the energy-dispersive X-ray spectrum (notshown herein) of these nanoparticles confirmed the presenceof elemental platinum and ruthenium with an atomic ratioclose to 1:1.
The TEM micrographs of platinum–ruthenium nanoparticlesdispersed on OCNTs are shown in Figure 5. The particle sizedistribution yielded average particle sizes between 5 and 7 nm.An increase in the dispersion of platinum–ruthenium particlessupported on OCNTs up to a plasma treatment time of 30 minwas observed. Upon further increasing the plasma treatmenttime to 40 min, the platinum–ruthenium nanoparticles tendedto aggregate, as shown in Figure 5 d.
X-ray diffraction (XRD) analysis
The XRD patterns of all PtRu/OCNT catalysts are shown inFigure 6. The catalyst displayed characteristic patterns similar
to face-centered cubic (fcc) Pt0, as indicated by the presence ofpeaks at 39.8, 46.3, 67.5 81.3, and 85.78 owing to (111), (200),(220), (311), and (222) reflections, respectively. No patterns ofplatinum or ruthenium oxides were detectable by XRD; thisdemonstrated that the precursors were converted mainly intometallic platinum–ruthenium. Moreover, a small peak at 2q=
43.88 confirms the existence of metallic ruthenium[53] in theplatinum–ruthenium catalysts. Additional ruthenium diffraction
Table 1. XPS surface atomic concentrations of platinum–ruthenium de-posited on OCNTs subjected to various plasma treatment times.
Sample C [%] O [%] Pt [%] Ru [%]
PtRu/OCNT1 92.6 4.2 2.3 0.9PtRu/OCNT2 92.0 4.6 2.4 1.0PtRu/OCNT3 92.2 4.7 2.3 0.8PtRu/OCNT4 91.6 5.1 2.5 0.8
Figure 4. SEM micrographs of platinum–ruthenium deposited on OCNTs sub-jected to various oxygen plasma treatment times: a) 10, b) 20, c) 30, andd) 40 min.
Figure 5. TEM micrographs of platinum–ruthenium deposited on OCNTs sub-jected to various oxygen plasma treatment times: a) 10, b) 20, c) 30, andd) 40 min.
Figure 6. XRD patterns of platinum–ruthenium deposited on CNTs subjectedto various oxygen plasma treatment times: a) 10, b) 20, c) 30, and d) 40 min.
� 2014 Wiley-VCH Verlag GmbH & Co. KGaA, Weinheim ChemPlusChem 0000, 00, 1 – 7 &3&
These are not the final page numbers! ��
CHEMPLUSCHEMFULL PAPERS www.chempluschem.org

peaks at 2q= 38.4, 69.4, and 82.28 for ruthenium reflections(100), (110), and (200), respectively, were also observed asshoulders on the platinum (111), (220), and (311) diffractionpeaks; this suggests the presence of a separate rutheniumphase. Unalloyed ruthenium in the platinum–ruthenium cata-lyst has also been observed previously.[54] The XRD patterns ofplatinum–ruthenium nanoparticles deposited on OCNTsshowed a slight increase in peak intensity with an increase inplasma treatment time; this was indicative of increased crystal-linity and relatively larger particle sizes, with PtRu/OCNT4showing the highest peak intensity. As shown in the TEM mi-crographs (Figure 5 d), platinum–ruthenium nanoparticles tendto aggregate on CNTs plasma treated for 40 min; this confirmsthe relatively larger particle size.
Electrochemical characterization
Figure 7 provides a comparison of the CO stripping voltammo-grams for all PtRu/OCNT catalysts in 0.5 m H2SO4 at a scan rate
of 50 mV s�1 after complete adsorption of CO and subsequentpurging of the solution with argon. For all catalysts, the hydro-gen desorption peaks are completely suppressed in the lowerpotential region in the first scan owing to the saturating cover-age of adsorbed CO species at the Pt sites. A broad CO oxida-tion peak is detected in the first anodic scan, whereas no COoxidation is monitored in the second scan; this suggests thecomplete removal of adsorbed CO species. The onset poten-tials for CO oxidation for all catalysts were between 0.37 and0.40 V. The electrochemical surface area (ESA), which are mea-sured by using the CO oxidation charge after subtracting thebackground current of the subsequent voltammogram, assum-ing 420 mC cm�2 as the oxidation charge for one monolayer ofCO on a smooth Pt surface, are 48, 85, 125, and 52 m2 g�1 forPt�Ru deposited on OCNT1, OCNT2, OCNT3, and OCNT4, re-spectively. The ESA increased with increasing plasma treatmenttime up to 30 min and then decreased.
The Raman spectra showed an increase in the ID/IG ratio upto 30 min of plasma treatment and the C 1 s XPS spectrum (inFigure 2) showed an increase in FWHM up to 30 min followedby a decrease at longer plasma treatment times. Moreover,TEM micrographs showed improved dispersion of platinum–ruthenium nanoparticles on the OCNTs up to 30 min of plasmatreatment. Longer exposure to oxygen plasma might havecaused damage to the CNTs and resulted in poor dispersion ofPt�Ru nanoparticles, leading to lower ESA. The highest ESA isobserved for Pt�Ru/OCNT3 at a plasma treatment time of30 min.
The electrocatalytic activities of PtRu/OCNT for the oxidationof methanol were studied by cyclic voltammetry in 1 m metha-nol at a scan rate of 50 mV s�1. The corresponding voltammo-grams are shown in Figure 8. The peak in the forward scan can
be attributed to the oxidation of methanol and in the reversescan to the removal of CO-like residues accumulated duringthe forward scan. The methanol oxidation current increased forthe catalysts obtained with OCNTs with plasma treatmenttimes of up to 30 min. Pt�Ru/OCNT3 showed the maximumcurrent density with the onset potential shifted to 60 mVlower than the onset potential of the other catalysts.
The surface specific activity of catalysts evaluated by usingthe ESA of Pt estimated from CO adsorption at the anodicpeak current density in the forward scan is found to decreasein the order of Pt�Ru/OCNT3 (1.66 mA cm�2
Pt)>Pt�Ru/OCNT1(1.37 mA cm�2
Pt)>Pt�Ru/OCNT2 (1.33 mA cm�2Pt)>Pt�Ru/
OCNT4 (0.99 mA cm�2Pt). These results signify the superior cata-
lytic activity of Pt�Ru/OCNT3 towards the oxidation of metha-nol.
Chronoamperometry was performed at a potential of600 mV for all catalysts in 1 m methanol and 0.5 m H2SO4 atroom temperature. The oxidation current decreased continu-ously for all catalysts (Figure 9); this was supposedly becauseof catalyst poisoning by chemisorbed carbonaceous speciesformed during the oxidation of methanol.[42] The platinum–ruthenium catalyst deposited on CNTs treated with plasma for30 min was able to maintain the highest current densityamong all catalysts tested. The metal–support interactions be-tween the platinum–ruthenium nanoparticles and the oxygen
Figure 7. CO stripping voltammograms for platinum–ruthenium depositedon OCNTs subjected to various plasma treatment times: a) 10 min, b) 20 min,c) 30 min and d) 40 min. Voltammograms were recorded in 0.5 m H2SO4 atroom temperature at a scan rate of 50 mV s�1. The dotted lines refer to thesecond cycle of the voltammograms after stripping of adsorbed CO.
Figure 8. Cyclic voltammograms for methanol (1 m) oxidation in 0.5 m H2SO4
at room temperature at a scan rate of 50 mV s�1 for platinum–ruthenium de-posited on OCNTs subjected to various plasma treatment times: a) 10, b) 20,c) 30, and d) 40 min.
� 2014 Wiley-VCH Verlag GmbH & Co. KGaA, Weinheim ChemPlusChem 0000, 00, 1 – 7 &4&
These are not the final page numbers! ��
CHEMPLUSCHEMFULL PAPERS www.chempluschem.org

groups of CNTs treated with plasma for 30 min seem to bestronger, resulting in higher stability in comparison to the cata-lysts obtained from CNTs treated at shorter or longer plasmatreatment times. Additionally, this indicates the improved toler-ance of Pt�Ru/OCNT3 to carbonaceous species.
Plasma treatment generally modifies the uppermost atomiclayers of a material surface without significantly affecting itsbulk properties. With increasing plasma treatment time, theoxygen content increased, which suggested that oxygen-con-taining groups were successfully grafted to the surface ofCNTs. One of the reasons for the decrease in catalytic activityobserved for Pt�Ru deposited on OCNT4 might be the resultof structural damage to OCNT4 during the 40 min plasmatreatment time, as evident from the Raman spectra and XPSdata. As mentioned earlier, prolonged plasma treatment par-tially removed the graphitic sheets from the CNT structure.Thus, an optimized plasma functionalization time was provento decrease structural damage, preserve the integrity and elec-tronic structure of the CNTs, and provide sufficient amount offunctional groups on the CNT surface for the subsequent depo-sition of catalytically active nanoparticles. Functional oxygengroups obtained at 30 min of plasma treatment time wereclearly favorable for optimal dispersion of platinum–rutheniumnanoparticles with increased ESA, leading to higher activity to-wards methanol oxidation.
Conclusion
In the quest of functionalizing CNTs, oxygen plasma treatmentis an effective method to endow CNTs with groups that canact as nucleation sites to favor dispersion and deposition ofplatinum–ruthenium nanoparticles on their surface. Platinum–ruthenium nanoparticles prepared by impregnation–reductionwere characterized by Raman spectroscopy, XPS, SEM, TEM,XRD, and electrochemical techniques. Voltammetry and chro-noamperometry results showed that platinum–rutheniumnanoparticles deposited on 30 min OCNTs exhibited superiormethanol oxidation activity to that of catalysts prepared atshorter or longer plasma treatment times.
Experimental Section
Plasma treatment
CNTs with an inner diameter of 20–50 nm and an outer diameterof 50–200 nm were obtained from Applied Sciences. As-receivedCNTs were purified by calcination under high-purity He (99.9999 %)at 800 8C for 60 min. For oxygen plasma treatment, CNTs (1 g) wereintroduced into the plasma chamber, in which a rotary barrel wasmounted to assure homogeneous treatment of the material. CNTswere treated in a plasma reactor from Plasma Finish (model V 15-G), equipped with a high-frequency generator from H�ttinger (PFG300 RF), working at a frequency of 13.56 MHz�0.05 % anda power up to 300 W.[12] The chamber pressure (20 Pa) and oxygenflow rate (30 mL min�1) were kept constant during plasma treat-ment. The plasma power was 120 W and the treatment time wasvaried from 10 to 40 min to obtain different surface oxygen con-centrations.
Catalyst synthesis
Pt�Ru catalysts were prepared by the impregnation–reductionmethod, as reported elsewhere.[42] The required amount ofH2PtCl6·6 H2O (Alfa) and RuCl3·x H2O (Aldrich) were dissolved in eth-anol followed by the addition of OCNTs to the precursor solutionto attain a nominal metal loading of 20 wt % and 1:1 Pt/Ru ratio.The mixture was sonicated for 3 h, ethanol was evaporated at80 8C, and the dry impregnated CNTs were ground in an agatemortar. The impregnated CNTs were placed in a quartz boat andexposed to an additional drying step under a He atmosphere at100 8C for 1 h. Subsequently, reduction of the metal precursors wasperformed at 350 8C under a mixture of 1:1 He/H2 for 2 h at a flowrate of 100 cm3 min�1.
Characterization
XPS measurements were performed in an ultrahigh vacuum setupequipped with a Gammadata-Scienta SES 2002 analyzer. A mono-chromatic AlKa (1486.6 eV; anode operating at 14 kV and 55 mA) X-ray source was used as the incident radiation. The binding energieswere calibrated based on the C 1 s peak of graphite at 284.5 eV asa reference. The CASA XPS program with a Gaussian–Lorentzianmix function and Shirely background subtraction was employed todeconvolute the X-ray photoelectron spectra. Raman spectra wereobtained by using a FRA 106 Bruker Raman spectrophotometer. AJEOL JEM 3010 microscope operated at 200 kV was used for TEM.SEM images were obtained by using a Hitachi S4800 field-emissionhigh-resolution scanning electron microscope coupled with anenergy-dispersive X-ray analyzer. XRD patterns were measured byusing a PANalytical theta–theta powder diffractometer.
Electrocatalytic study
Electrochemical measurements were performed at room tempera-ture in a three-electrode cell connected to a CHI 1100 workstation(CH Instruments). The working electrode was a thin layer ofNafion-impregnated catalyst cast on a 3 mm diameter glassycarbon electrode. The electrode was polished to mirror finish with0.1 and 0.03 mm alumina suspensions prior to catalyst coating. Thecatalyst ink was obtained by sonicating a mixture of catalyst(7.5 mg) in deionized water (1 mL), ethanol (1 mL), and Nafion solu-tion (0.5 mL; Aldrich: 5 wt % Nafion) for 1 h. Ink (10 mL) was pipet-ted and spread on the glassy carbon surface and the electrode
Figure 9. Chronoamperometric response recorded at a constant potential of600 mV in 1 m methanol and 0.5 m H2SO4 at room temperature for Pt�Ru de-posited on OCNTs subjected to various plasma treatment times: a) 10, b) 20,c) 30, and d) 40 min.
� 2014 Wiley-VCH Verlag GmbH & Co. KGaA, Weinheim ChemPlusChem 0000, 00, 1 – 7 &5&
These are not the final page numbers! ��
CHEMPLUSCHEMFULL PAPERS www.chempluschem.org

was dried in air. Platinum gauze and a commercial saturated calo-mel electrode (0.24 V versus a standard hydrogen electrode (SHE))were used as counter and reference electrodes, respectively. All po-tentials quoted herein were referenced against the SHE. For metha-nol oxidation, the electrolyte solution was 1 mol dm�3 CH3OH in0.5 mol dm�3 H2SO4, and the solutions were purged with argon for20 min prior to each measurement. CO stripping voltammogramswere conducted in 0.5 m H2SO4. Initially, argon was purged into the0.5 m solution of H2SO4 for 20 min. Afterwards, CO gas was purgedfor 15 min by holding the electrode at a potential of 0.08 V (vs.SHE). Then, dissolved CO in the solution was removed by bubblingAr for 20 min, and stripping voltammograms were collected ata scan rate of 50 mV s�1.
Acknowledgements
We thank Dr. V. Chirila and Prof. W. Brandl, University of AppliedSciences, Gelsenkirchen, Germany, for their help with the oxygenplasma treatment; Dr. T. Reinecke for the XRD measurements ;and Dr. W. Xia for his supportive discussions. We thank the Indus-trial Consultancy and Sponsored Research (IC & SR) and the De-partment of Chemical Engineering, Indian Institute of Technology,Madras, for financial support.
Keywords: carbon nanotubes · electrochemistry · fuel cells ·plasma chemistry · platinum
[1] Y. V. Neburchilov, J. Martin, H. Wang, J. Zhang, J. Power Sources 2007,169, 221 – 238.
[2] O. A. Petrii, J. Solid State Electrochem. 2008, 12, 609 – 642.[3] S. K. Kamarudin, F. Achmada, W. R. W. Daud, Int. J. Hydrogen Energy
2009, 34, 6902 – 6916.[4] S. J. Yoo, T. Y. Jeon, K. S. Kim, T. H. Lim, Y. E. Sung, Phys. Chem. Chem.
Phys. 2010, 12, 15240 – 15246.[5] R. Chetty, K. Scott, S. Kundu, M. Muhler, J. Fuel Cell Sci. Tech. 2010, 7,
031011.[6] K. C. Park, I. Y. Jang, W. Wongwiriyapan, S. Morimoto, Y. J. Kim, Y. C.
Jung, T. Toya, M. Endo, J. Mater. Chem. 2010, 20, 5345 – 5354.[7] S. Sen, F. Sen, G. GokagaÅ, Phys. Chem. Chem. Phys. 2011, 13, 6784 –
6792.[8] A. Rabis, P. Rodriguez, T. J. Schmidt, ACS Catal. 2012, 2, 864 – 890.[9] Y. S. Wang, S. Y. Yang, S. M. Li, H. W. Tien, S. T. Hsiao, W. H. Liao, C. H. Liu,
K. H. Chang, C. C. M. Ma, C. C. Hu, Electrochim. Acta 2013, 87, 261 – 269.[10] L. Guo, S. Chen, L. Li, Z. Wei, J. Power Sources 2014, 247, 360 – 364.[11] D. Sebasti�n, M. J. L�zaro, R. Moliner, I. Suelves, A. S. Arico, V. Baglio, Int.
J. Hydrogen Energy 2014, 39, 5414 – 5423.[12] Y. Cheng, C. Xu, P. K. Shen, S. P. Jiang, Appl. Catal. B 2014, 158 – 159,
140 – 149.[13] B. Wu, C. Wang, D. Xue, J. Xiao, Diamond Relat. Mater. 2014, 46, 1 – 7.[14] P. Serp, M. Corrias, P. Kalck, Appl. Catal. A 2003, 253, 337 – 358.[15] K. Lee, J. Zhang, H. Wang, D. P. Wilkinson, J. Appl. Electrochem. 2006, 36,
507 – 522.[16] D. Vairavapandian, P. Vichchulada, M. D. Lay, Anal. Chim. Acta 2008, 626,
119 – 129.[17] N. Karousis, N. Tagmatarchis, D. Tasis, Chem. Rev. 2010, 110, 5366 – 5397.[18] B. Wu, Y. Kuang, X. Zhang, J. Chen, Nano Today 2011, 6, 75 – 90.[19] S. Sharma, B. G. Pollet, J. Power Sources 2012, 208, 96 – 119.
[20] J. Liu, L. Lai, N. G. Sahoo, W. Zhou, Z. Shen, S. H. Chan, Aust. J. Chem.2012, 65, 1213 – 1222.
[21] J. Zhu, A. Holmen, D. Chen, ChemCatChem 2013, 5, 378 – 401.[22] A. Felten, J. Ghijsen, J. J. Pireaux, R. L. Johnson, C. M. Whelan, D. Liang,
G. V. Tendeloo, C. Bittencourt, J. Phys. D 2007, 40, 7379 – 7382.[23] E. Antolini, Appl. Catal. B 2009, 88, 1 – 24.[24] S. Kundu, Y. Wang, W. Xia, M. Muhler, J. Phys. Chem. C 2008, 112,
16869 – 16878.[25] J. P. Boudou, J. I. Paredes, A. Cuesta, A. Mart�nez-Alonso, J. M. D. Tasc�n,
Carbon 2003, 41, 41 – 56.[26] V. Chirila, G. Marginean, W. Brandl, Surf. Coat. Technol. 2005, 200, 548 –
551.[27] H. Miyagawa, L. T. Drzal, Composites Part A 2005, 36, 1440 – 1448.[28] J. S. Lee, A. Chandrashekar, B. M. Park, L. J. Overzet, G. S. Lee, J. Vac. Sci.
Technol. B 2005, 23, 1013 – 1017.[29] N. Massoni, A. B. Martinent, J. Y. Laurent, J. Power Sources 2007, 166,
68 – 73.[30] M. R. Loos, J. Nahorny, L. C. Fontana, Curr. Org. Chem. 2013, 17, 1880 –
1893.[31] Q. Wang, X. Wang, Z. Chai, W. Hu, Chem. Soc. Rev. 2013, 42, 8821 – 8834.[32] R. Chetty, S. Kundu, W. Xia, M. Bron, W. Schuhmann, V. Chirila, W.
Brandl, T. Reinecke, M. Muhler, Electrochim. Acta 2009, 54, 4208 – 4215.[33] W. Xia, D. Su, A. Birkner, L. Ruppel, Y. Wang, C. Woll, J. Qian, C. Liang, G.
Marginean, W. Brandl, M. Muhler, Chem. Mater. 2005, 17, 5737 – 5742.[34] H. Bubert, S. Haibera, W. Brandl, G. Marginean, M. Heintze, V. Bruser, Di-
amond Relat. Mater. 2003, 12, 811 – 815.[35] T. Xu, J. Yang, J. Liu, Q. Fu, Appl. Surf. Sci. 2007, 253, 8945 – 8951.[36] Z. Hou, B. Cai, H. Liu, D. Xu, Carbon 2008, 46, 405 – 413.[37] L. Yang, Z. Shi, W. Yang, Surf. Coat. Tech. 2014, 251, 122 – 127.[38] R. Ionescu, E. H. Espinosa, E. Sotter, E. Llobet, X. Vilanova, X. Correig, A.
Felten, C. Bittencourt, G. Van Lier, J.-C. Charlier, J. J. Pireaux, Sens. Actua-tors B 2006, 113, 36 – 46.
[39] R. Yang, Y. Wei, Y. Yu, C. Gao, L. Wang, J. H. Liu, X.-J. Huang, Electrochim.Acta 2012, 76, 354 – 362.
[40] J.-Y. Lee, E. J. Park, C. J. Lee, S. W. Kim, J. J. Pak, N. K. Min, Thin SolidFilms 2009, 517, 3883 – 3887.
[41] C.-C. Lin, H. C. Huang, J. Power Sources 2009, 188, 332 – 337.[42] R. V. Hull, L. Li, Y. Xing, C. C. Chusuei, Chem. Mater. 2006, 18, 1780 –
1788.[43] S. Banerjee, S. S. Wong, J. Phys. Chem. B 2002, 106, 12144 – 12151.[44] S. Huang, L. Dai, J. Phys. Chem. B 2002, 106, 3543 – 3545.[45] W. Xia, Y. Wang, R. Bergstr�ßer, S. Kundu, M. Muhler, Appl. Surf. Sci.
2007, 254, 247 – 250.[46] X. Zhang, L. Lei, B. Xia, Y. Zhang, J. Fu, Electrochim. Acta 2009, 54,
2810 – 2817.[47] F. Morales-Lara, M. J. P�rez-Mendoza, D. Altmajer-Vaz, M. Garc�a-Rom�n,
M. Melguizo, F. J. L�pez-Garz�n, M. Domingo-Garc�a, J. Phys. Chem. C2013, 117, 11647 – 11655.
[48] T. I. T. Okpalugo, P. Papakonstantinou, H. Murphy, J. McLaughlin, N. M. D.Brown, Carbon 2005, 43, 153 – 161.
[49] P. V. Lakshminarayanan, H. Toghiani, C. U. Pittman, Carbon 2004, 42,2433 – 2442.
[50] D.-Q. Yang, E. Sacher, J. Phys. Chem. C 2008, 112, 4075 – 4082.[51] R. Chetty, W. Xia, S. Kundu, M. Bron, T. Reinecke, W. Schuhmann, M.
Muhler, Langmuir 2009, 25, 3853 – 3860.[52] J. F. Moulder, W. F. Stickle, P. E. Sobol, K. D. Bomben, Handbook of X-ray.
Photoelectron Spectroscopy, Physical Electronics Inc. , Eden Prairie, 1995.[53] J. Lu, Carbon 2007, 45, 1599 – 1605.[54] A. L. Ocampo, M. M. Hernandez, J. Morgado, J. A. Montoya, P. J. Sebas-
tian, J. Power Sources 2006, 160, 915 – 924.
Received: June 27, 2014Published online on && &&, 0000
� 2014 Wiley-VCH Verlag GmbH & Co. KGaA, Weinheim ChemPlusChem 0000, 00, 1 – 7 &6&
These are not the final page numbers! ��
CHEMPLUSCHEMFULL PAPERS www.chempluschem.org

FULL PAPERS
R. Chetty,* K. K. Maniam, W. Schuhmann,M. Muhler
&& –&&
Oxygen-Plasma-Functionalized CarbonNanotubes as Supports for Platinum–Ruthenium Catalysts Applied inElectrochemical Methanol Oxidation
Oxidation after treatment : Carbonnanotubes functionalized by oxygenplasma have been used as supports forplatinum–ruthenium nanoparticles forelectrochemical methanol oxidation.The plasma treatment time has beenoptimized, and platinum–rutheniumnanoparticles dispersed on optimumoxygen-plasma-treated carbon nano-tubes exhibit maximum catalytic activitytowards methanol oxidation (seefigure).
� 2014 Wiley-VCH Verlag GmbH & Co. KGaA, Weinheim ChemPlusChem 0000, 00, 1 – 7 &7&
These are not the final page numbers! ��
Copyright © 2022 FDOKUMEN