Investigation of efficient two-step methanol synthesis ...
249
INVESTIGATION OF EFFICIENT, TWO-STEP METHANOL SYNTHESIS PROCESSES AT MODERATE PRESSURES AND TEMPERATURES FAN WU, M. ENG-CHEM ORCID: 0000-0001-5078-8711 Submitted in total fulfillment of the requirement of the degree of Doctor of Philosophy February 2018 Department of Chemical Engineering The University of Melbourne Australia
-
Upload
khangminh22 -
Category
Documents
-
view
0 -
download
0
Transcript of Investigation of efficient two-step methanol synthesis ...
INVESTIGATION OF EFFICIENT, TWO-STEP
METHANOL SYNTHESIS PROCESSES
AT MODERATE PRESSURES AND TEMPERATURES
FAN WU, M. ENG-CHEM
ORCID: 0000-0001-5078-8711
Submitted in total fulfillment of the requirement of the degree of Doctor of Philosophy
February 2018
Department of Chemical Engineering
The University of Melbourne
Australia

ii
ABSTRACT
Methanol is one of the most common chemical commodities traded around the world
every year. It can be used as a raw material with wide applications such as construction
materials, plastics and fuel cells. Currently methanol is commercially manufactured from
syngas containing carbon monoxide (CO) and hydrogen (H2) via a one-step method at
high temperatures and pressures (250 to 300 °C and 50 to 100 bar). However, the harsh
operating conditions have negative impacts on the economy and the environment.
Compared with the conventional methanol synthesis process, a two-step method of
producing methanol in the liquid phase has attracted increasing interest as the operating
conditions are moderate (100 °C to 140 °C and 30 bar), thus reducing the operating cost.
This method consists of two steps of reactions: (1) carbonylation of alcohol to produce
ester; (2) hydrogenation reaction of the produced ester to produce methanol. The
hydrogenation reaction is the rate limiting step in the two-step methanol synthesis
process and is the focus of this work.
In this work, an extensive literature review of two-step methanol synthesis process,
including the vapour-liquid equilibrium (VLE), reactions of each step at moderate
temperatures and pressures, and commercial catalysts used for the synthesis process,
was conducted.
The solubilities of carbon monoxide (CO) and hydrogen (H2) in liquid methanol and
methyl formate were comprehensively studied in a designed apparatus from 296 K to
375 K in preparation for study the reaction properties. The solubilities of H2 in methanol
and methyl formate are lower than those of CO in methanol and methyl formate. The
solubilities of CO and H2 in methanol and methyl formate increase with increasing
iii
temperature probably due to the endothermic processes. The experimental data was
further validated using a modified Peng-Robinson Equation of State through an equation
of state approach (phi-phi method). The binary interaction parameters of the model used
for predicting the VLE were determined. The binary interaction parameters for CO in
methanol and methyl formate were constant, which were independent of the
temperature, whereas the binary interaction parameters for H2 in methanol and methyl
formate was a function of temperature.
The reaction mechanism of the hydrogenation reaction of methyl formate using a
commercial catalyst, copper chromite, was thoroughly investigated. A possible reaction
mechanism containing five elementary steps of (1) the adsorption of methyl formate on
the catalyst surface; (2) the adsorption and dissociation of hydrogen on the catalyst
surface; (3) surface reaction; (4) methanol generation via the intermediate CH2OH(s); (5)
methanol generation via the intermediate CH3O(s) was proposed. The rate constants
were estimated using MATLAB build-in functions ‘ode15’ and ‘fmincon’ through the least
squares minimisation method. The step of H2 adsorption and dissociation on the catalyst
surface was speculated as the rate controlling step due to the lowest rate constant
obtained among all forward reactions, and the corresponding activation energy was
determined as 50.15 kJ/mol, which was consistent with other published works. Through
using the evaluated rate constants, the reaction kinetics and mechanism were validated
from a group of hydrogenation reaction experiments conducted at 1.8 MPa, 2.0 MPa and
2.2 MPa with a same temperature of 110 °C.
A novel catalytic system of Cu/ZnO/ZrO2-hydrotalcite (Cu/ZnO/ZrO2-HTC) was
developed for the hydrogenation reaction of methyl formate at moderate temperatures
and pressures via a simple co-precipitation method. The ratio and role of each component
iv
were comprehensively investigated and compared using a number of characteristic
techniques including TPR, XRD, SEM, TPD-CO2, TGA, BET and XPS. An optimised catalytic
system of Cu/ZrO2(8:2)-HTC was screened, used and compared with the commercial
catalyst, copper chromite. The developed catalyst has better performance at relatively
lower temperatures, where the reaction rate of the hydrogenation reaction using the
novel catalyst in the first 100 minutes is four times faster than that of using the
commercial copper chromite, and the time to achieve equilibrium of using the novel
catalyst reduces to one third of the commercial catalyst.
Compared to the traditional methanol synthesis process, this work shows great potential
to employ a two-step methanol synthesis process via methyl formate at moderate
temperatures and pressures, thus saving energy cost and operating cost.

v
DECLARATION
This is to certify that:
i. This dissertation comprises only my original work towards to the Ph.D.
ii. Due acknowledgement has been made in the text to all other materials used
iii. The dissertation is less than 100,000 words in length, exclusive of tables, maps,
bibliographies and appendices.
Fan Wu
vi
ACKNOWLEDGEMENTS
This Ph.D. is one of the most difficult tasks I have accomplished in my life to date. It is a
special and extraordinary journey and I genuinely enjoyed my adventure over the last
four years. This thesis would have never been written and completed without the
supports and dedications from many people. I would like to take this chance to thank
those great people who helped and guided me throughout my Ph.D. life.
First and foremost, I would like to express my deepest gratitude to Prof. Paul A. Webley,
who acted as my main supervisor and project leader. He offered me an opportunity to
work with him and his team, and also opened a door for expanding my outlook on the
research in chemical engineering fields. His continuous support not only in academic
work but also in finance motivated me to keep going throughout my Ph.D. life. His
suggestions and feedback were always invaluable and made my Ph.D. journey go
smoother and with less frustration.
I also appreciate the selfless contribution from Dr. Fatin Abbas Hasan and Dr. Penny Xiao,
who acted as my co-supervisors. From their meticulous care not only in my research but
also in my daily life, I always felt the warmth and comfort like at home. Also, their rigorous
academic attitudes towards work encouraged me to be optimistic to every challenge
throughout my Ph.D. I also would like to acknowledge Dr. Luke Connel and later Prof.
David Dunstan for serving as my research committee chair, who provided me with
valuable comments on each year’s progress review.
I am also thankful to my kind and helpful colleagues in our clean energy lab, especially
David Danaci, Dr. Ranjeet Singh, Lefu Tao, Xin Fang and Thomas Moore, who helped me
set up the experiments and troubleshoot uncountable bottlenecks in my research.

vii
Without them, I may not be sitting here to write up my thesis. I am also thankful to Dr
Chaoen Li in CSIRO, who provided constructive advices in deriving the chemical reaction
mechanism. Also, I felt to be obliged to mention Prof. Sandra Kentish, Prof. Geoff Stevens,
Prof. David Shallcross, Dr. Daniel Heath, and Dr. Gabriel De Silva, who provided me with
casual tutorial positions in the department to enrich my teaching experience. I would like
to thank my research project (RP) student, Peng Shang, to come and conduct some
experiments for 12 weeks. For all my friends, especially Chen Yuan, Chloe Jack, Feng Li,
Qinghu Zhao, Yuhan Men, and Guoping Hu, their long-lasting friendship makes my work
and life more pleasant.
To Yue (Frank) Wu, my wonderful husband. He has been considerable and understanding
during my Ph.D. journey. He gave me everything he has and looked after me very well.
Despite being very busy with his Ph.D. work in the same department, he has always been
here for me, helping me through this adventure. I definitely would not have survived
during the hard time of my Ph.D. without him. I truly thank to his patience and endless
love for me.
Finally, to my beloved parents. None of this would have been possible without them. Both
have financially supported my overseas undergraduate study and living in Melbourne. I
am always number one to them and enjoy their endless love and care. I am so fortunate
to be your daughter and I am so proud of you.
viii
Contents Abstract .............................................................................................................................................................. ii
Declaration ........................................................................................................................................................ v
Acknowledgements ...................................................................................................................................... vi
List of Equations .......................................................................................................................................... xiv
List of Figures ............................................................................................................................................ xviii
List of Reactions ....................................................................................................................................... xxiii
List of Tables ................................................................................................................................................ xxv
Chapter 1 Introduction ........................................................................................................................... 1
1.1 Background ..................................................................................................................................... 1
1.2 Motivation, objective and outline of the thesis ................................................................. 5
Chapter 2 Literature review ................................................................................................................. 7
2.1 Commercial production of methanol .................................................................................... 7
2.1.1 Syngas production ............................................................................................................... 7
2.1.2 Methanol synthesis from syngas.................................................................................... 9
2.1.3 Separation and purification ........................................................................................... 14
2.1.4 Limitations of commercial methanol synthesis processes ................................ 16
2.2 Methanol synthesis at moderate conditions .................................................................... 18
2.2.1 Three approaches of methanol synthesis ................................................................. 18
2.2.2 Methanol synthesis via methyl formate (MS via MF) .......................................... 24
2.3 Solubility in gas-liquid phase ................................................................................................. 37
ix
2.3.1 Definition of solubility ..................................................................................................... 37
2.3.2 Fugacity of the system ..................................................................................................... 38
2.3.3 Solubility literature data review .................................................................................. 39
2.3.4 Solubility modelling .......................................................................................................... 50
2.4 Conclusions ................................................................................................................................... 57
Chapter 3 Materials and methodology ........................................................................................... 58
3.1 Materials ........................................................................................................................................ 58
3.2 Methodologies ............................................................................................................................. 59
3.2.1 Powder X-ray diffraction (XRD) ................................................................................... 59
3.2.2 Scanning electron microscopy (SEM) ........................................................................ 59
3.2.3 Energy Dispersive X-ray spectroscopy (EDX) ........................................................ 59
3.2.4 N2 adsorption-desorption isotherms ......................................................................... 59
3.2.5 Temperature-programmed reduction (TPR) .......................................................... 60
3.2.6 Specific copper surface area via N2O titration ........................................................ 62
3.2.7 Thermal gravimetric analysis (TGA) .......................................................................... 63
3.2.8 X-ray photoelectron spectroscopy (XPS).................................................................. 64
3.2.9 Auger Electron Spectroscopy (AES) ........................................................................... 64
3.2.10 Products analysis method - Gas chromatography (GC) .................................. 64
Chapter 4 Solubility study ................................................................................................................... 67
4.1 Objective ........................................................................................................................................ 67
4.2 Experimental apparatus and procedures.......................................................................... 67
x
4.2.1 Apparatus .............................................................................................................................. 67
4.2.2 Procedure .............................................................................................................................. 69
4.3 Theory ............................................................................................................................................. 72
4.3.1 Evaluation of experimental results ............................................................................. 72
4.3.2 Modelling .............................................................................................................................. 74
4.3.3 Uncertainty calculation ................................................................................................... 79
4.3.4 Henry’s law constant and its confidence intervals ............................................... 80
4.3.5 Thermodynamic property determination ................................................................ 81
4.4 Data analysis ................................................................................................................................. 82
4.4.1 Validation of the experimental apparatus................................................................ 82
4.4.2 Experimental results ........................................................................................................ 85
4.4.3 Modelling results ............................................................................................................... 93
4.5 Conclusions ................................................................................................................................... 98
Chapter 5 Hydrogenation reaction kinetics mechanism ......................................................... 99
5.1 Introduction .................................................................................................................................. 99
5.2 Experimental apparatus and procedures....................................................................... 102
5.2.1 Apparatus ........................................................................................................................... 102
5.2.2 Procedure ........................................................................................................................... 103
5.3 Carbonylation reaction study ............................................................................................. 106
5.4 Hydrogenation reaction catalysts preparation and characterisation ................. 107
5.4.1 Catalysts preparation .................................................................................................... 107
xi
5.4.2 The structure and phase compositions .................................................................. 108
5.4.3 Thermal behaviour and stability .............................................................................. 110
5.4.4 The morphology and size............................................................................................. 111
5.4.5 The surface area and specific copper surface area ............................................ 112
5.4.6 Summary ............................................................................................................................ 113
5.5 Study of hydrogenation reaction kinetics and explore the reaction mechanism ...
........................................................................................................................................................ 113
5.5.1 Effects of agitation speed on reaction rate ........................................................... 113
5.5.2 Effects of catalysts loadings on reaction rate ....................................................... 115
5.5.3 Effects of temperature on reaction conversion and selectivity .................... 117
5.5.4 Reaction kinetics model and parameter estimation ......................................... 122
5.5.5 Mechanism validation ................................................................................................... 132
5.6 Conclusions ................................................................................................................................ 138
Chapter 6 Development of novel hydrogenation catalysts ................................................. 140
6.1 Introduction ............................................................................................................................... 140
6.2 Design of a novel catalyst ..................................................................................................... 141
6.3 Cu/Zn/Zr-HTC catalyst .......................................................................................................... 143
6.3.1 Catalyst preparation ...................................................................................................... 143
6.3.2 Catalyst reducibility ....................................................................................................... 145
6.3.3 Catalyst crystalline structure ..................................................................................... 147
6.3.4 Thermal stability of the catalyst ............................................................................... 150
xii
6.3.5 Morphology and dispersion of the catalyst .......................................................... 153
6.3.6 Surface areas and specific copper surface area .................................................. 157
6.3.7 The surface basicity of CuZnZr-HTC catalyst ....................................................... 158
6.3.8 Chemical states of elements in the catalyst .......................................................... 160
6.4 Conclusions ................................................................................................................................ 171
Chapter 7 Determination of the catalytic performance of the novel hydrogenation
catalysts ................................................................................................................................................ 172
7.1 Introduction ............................................................................................................................... 172
7.2 Experimental apparatus and procedures....................................................................... 173
7.3 Results and Discussion .......................................................................................................... 173
7.3.1 Roles of the components in the Cu/ZnO/ZrO2-HTC catalytic system......... 173
7.3.2 By products formation .................................................................................................. 176
7.3.3 The catalytic effect of the ratio of Cu/ZnO on the reaction ............................ 177
7.4 Comparison of Cu/ZrO2-HTC catalysts with copper chromite............................... 182
7.4.1 The characteristics of catalysts ................................................................................. 182
7.4.2 Catalytic performance ................................................................................................... 183
7.5 Conclusions ................................................................................................................................ 186
Chapter 8 Conclusions and recommendations ......................................................................... 188
Chapter 9 References ......................................................................................................................... 190
Chapter 10 Appendices .................................................................................................................... 214
Appendix A Mass Spectrometry (MS) calibration of hydrogen using 5.4% H2/Ar ..... 214
xiii
Appendix B. Mass Spectrometry (MS) calibration of CO2 using 4.99% CO2/He .......... 215
Appendix C. Multi-level calibration of liquid samples in GC ................................................ 216
Appendix D. The grade of the certified standard-spec gas from ScottTM for retention
time determination .............................................................................................................................. 217
xiv
LIST OF EQUATIONS
Equation 2-1. Formula for S value determination ................................................................................................. 10
Equation 2-2. The overall reaction rate expression [86] ....................................................................................... 26
Equation 2-3. The overall reaction rate expression [87] ....................................................................................... 27
Equation 2-4. Carbonylation reaction forward reaction rate [88] ........................................................................ 27
Equation 2-5. Carbonylation reaction forward reaction rate with pyridine as a promoter [88]........................... 27
Equation 2-6. Reaction kinetics expression for the hydrogenation reaction [65] ................................................. 30
Equation 2-7. Reaction kinetics expression for the hydrogenation reaction in the presence of CO [65] .............. 30
Equation 2-8. Reaction kinetics expression for the hydrogenation reaction [86] ................................................. 30
Equation 2-9. Predicted concurrent methanol production [89] ............................................................................ 33
Equation 2-10.Thermodynamic equilibrium of the fugacity in gas phase and liquid phase ................................. 37
Equation 2-11. The equation of the fugacity coefficient ....................................................................................... 38
Equation 2-12. The equation of activity coefficient .............................................................................................. 39
Equation 2-13. Krichevsky-Kasarnovsky equation ................................................................................................ 43
Equation 2-14. Generalised equation of Peng Robinson EoS ................................................................................ 51
Equation 2-15. The parameter b determination of binary system........................................................................ 51
Equation 2-16. The parameter a determination of binary system........................................................................ 51
Equation 2-17. b of the pure component .............................................................................................................. 51
Equation 2-18. a of the pure component .............................................................................................................. 51
Equation 2-19. Alpha function by Soave ............................................................................................................... 52
Equation 2-20. Generalised function m of acentric functor .................................................................................. 52
Equation 2-21. Alpha function by Twu .................................................................................................................. 52
Equation 2-22. Generalised alpha function by Twu .............................................................................................. 53
Equation 2-23. Alpha function by Boston-Mathias at subcritical condition ......................................................... 53
Equation 2-24. Alpha function by Boston-Mathias at supercritical condition ...................................................... 53
Equation 2-25. Binary interaction parameter (BIP) .............................................................................................. 54
Equation 2-26. Absolute average deviation relatives (AADR) ............................................................................... 55
xv
Equation 2-27. Fugacity equilibrium ..................................................................................................................... 55
Equation 2-28. Vapour phase fugacity of component .......................................................................................... 56
Equation 2-29. Liquid phase fugacity .................................................................................................................... 56
Equation 2-30. Liquid phase fugacity in terms of Henry’s law constant ............................................................... 56
Equation 2-31. The relationship between gas phase fugacity and liquid phase activity coefficient..................... 56
Equation 2-32. Pseudo Henry’s law constant ....................................................................................................... 56
Equation 2-33. The formula of pseudo Henry’s law constant ............................................................................... 56
Equation 3-1. Determination of amount of desorbed CO2 .................................................................................... 62
Equation 3-2. Determination of copper dispersion ............................................................................................... 63
Equation 4-1. The total amount of solute in the tank 4 ........................................................................................ 72
Equation 4-2. Generalised equation of Peng-Robinson EoS.................................................................................. 72
Equation 4-3. Parameter b in PR EoS .................................................................................................................... 72
Equation 4-4. Parameter a in PR EoS .................................................................................................................... 72
Equation 4-5. alpha function ................................................................................................................................ 73
Equation 4-6. Determination of mi when acentric factor less than 0.49 .............................................................. 73
Equation 4-7. Determination of mi when acentric factor above 0.49 .................................................................. 73
Equation 4-8. Total moles of solvents in the equilibrium cell ............................................................................... 73
Equation 4-9. The density of the solvent .............................................................................................................. 73
Equation 4-10. The total pressure in the absorption tank 4 ................................................................................. 74
Equation 4-11. The Antoine Equation ................................................................................................................... 74
Equation 4-12. The total amount of the solvent in the tank 4 .............................................................................. 74
Equation 4-13. The total amount of the solute in the tank 4 ................................................................................ 74
Equation 4-14. The amount of solvent in the vapour phase ................................................................................. 74
Equation 4-15. The mole fraction of solute in solvent .......................................................................................... 74
Equation 4-16. Determination of b parameter in PR-EoS ..................................................................................... 75
Equation 4-17. Determination of a parameter in PR-EoS ..................................................................................... 75
Equation 4-18. Determination of bi parameter in PR-EoS .................................................................................... 75
Equation 4-19. Determination of ai parameter in PR-EoS .................................................................................... 75

xvi
Equation 4-20. Fugacity equilibrium ..................................................................................................................... 75
Equation 4-21. Wilson’s equation ......................................................................................................................... 77
Equation 4-22. The expression of the mole fraction of components in the liquid phase ...................................... 77
Equation 4-23. The expression of the mole fraction of components in the gas phase ......................................... 77
Equation 4-24. Determination of the mole fraction of components in terms of equilibrium ratio K .................... 77
Equation 4-25. Fugacity coefficient of components in the liquid phase ............................................................... 78
Equation 4-26. Determination of the mixture parameter Ѱ in the liquid phase .................................................. 78
Equation 4-27. Determination of the mixture parameter 𝑎𝛼 in the liquid phase ................................................. 78
Equation 4-28. Determination of the mixture parameter b in the liquid phase ................................................... 78
Equation 4-29. Fugacity coefficient of components in the gas phase .................................................................. 78
Equation 4-30. Determination of the mixture parameter Ѱ in the gas phase ...................................................... 78
Equation 4-31. Determination of the mixture parameter 𝑎𝛼 in the gas phase .................................................... 78
Equation 4-32. Determination of the mixture parameter b in the gas phase ....................................................... 79
Equation 4-33. Evaluation of a new equilibrium ratio K ....................................................................................... 79
Equation 4-34. Convergence constrains ............................................................................................................... 79
Equation 4-35. Uncertainty of u(x)/x .................................................................................................................... 80
Equation 4-36. Uncertainty of u(n)/n in the gas phase......................................................................................... 80
Equation 4-37. Uncertainty of u(n)/n in the liquid phase ..................................................................................... 80
Equation 4-38. The Henry’s constant expression .................................................................................................. 80
Equation 4-39. The fugacity of the solute in the liquid phase ............................................................................... 80
Equation 4-40. The expression of the Henry’s constant ........................................................................................ 81
Equation 4-41. Dissolution enthalpy of gas-liquid solubility ................................................................................. 81
Equation 4-42. Dissolution entropy of gas-liquid solubility .................................................................................. 81
Equation 4-43. Dissolution Gibbs free energy of gas-liquid solubility ................................................................... 81
Equation 4-44. The binary interaction parameter ................................................................................................ 95
Equation 4-45. Definition of AARD ........................................................................................................................ 95
Equation 5-1. Reaction rate expression of methyl formate ................................................................................ 126
Equation 5-2. Reaction rate expression of H2 ..................................................................................................... 126
xvii
Equation 5-3.Reaction rate expression of methanol .......................................................................................... 126
Equation 5-4. Reaction rate expression of HCOOCH3(s2) .................................................................................... 126
Equation 5-5. Reaction rate expression of H(s) ................................................................................................... 126
Equation 5-6. Reaction rate expression of CH2OH(s) .......................................................................................... 127
Equation 5-7. Reaction rate expression of CH3O(s) ............................................................................................. 127
Equation 5-8. Reaction rate expression of catalytic site s .................................................................................. 127
Equation 5-9 BDF evaluation using higher orders of Taylor polynomial ............................................................. 127
Equation 5-10. Least-squares regression function .............................................................................................. 127
Equation 5-11. The absolute average relative residual ...................................................................................... 128
Equation 5-12. Central differences ..................................................................................................................... 129
Equation 5-13 Precision matrix P ........................................................................................................................ 129
Equation 5-14 Degrees of freedom ..................................................................................................................... 129
Equation 5-15 Residual variance ........................................................................................................................ 130
Equation 5-16. Arrhenius equation ..................................................................................................................... 130
Equation 6-1. Auger parameter (αCu) .................................................................................................................. 163
Equation 7-1. Pseudo-space time yield (STYPS) ................................................................................................... 178
xviii
LIST OF FIGURES
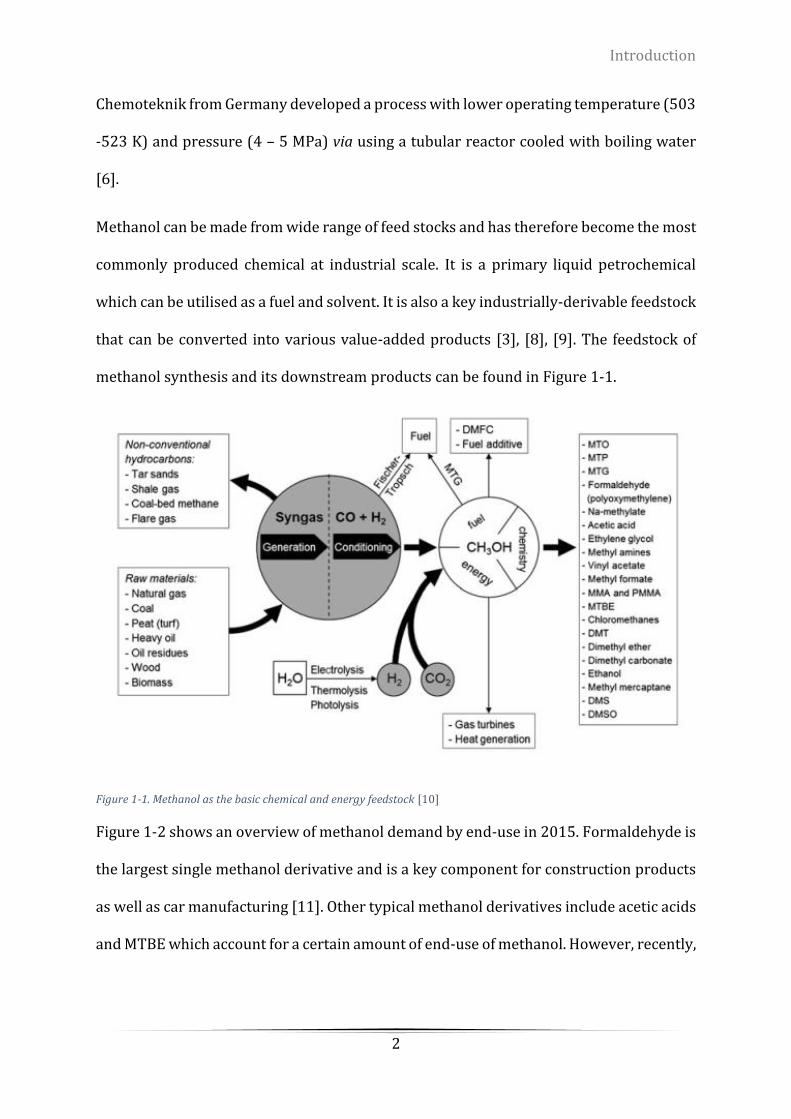
Figure 1-1. Methanol as the basic chemical and energy feedstock [10] ................................................................. 2
Figure 1-2. Global methanol demand by end-use 2015 [14] .................................................................................. 3
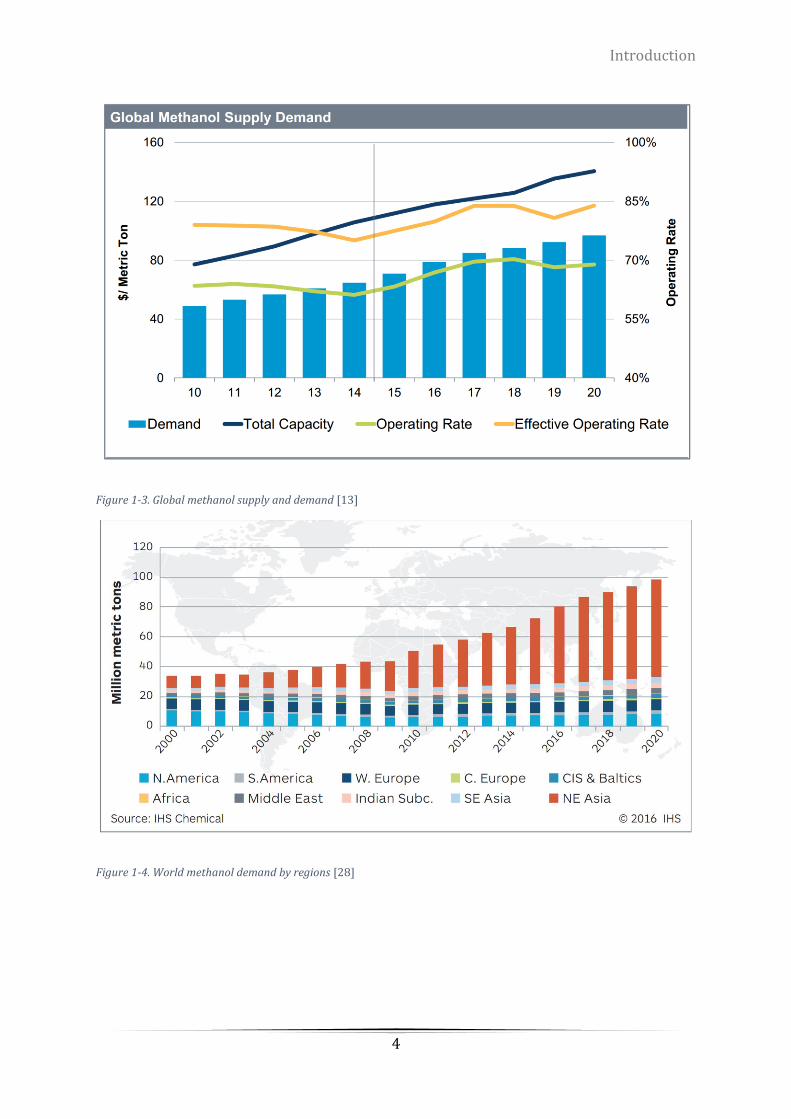
Figure 1-3. Global methanol supply and demand [13] ........................................................................................... 4
Figure 1-4. World methanol demand by regions [28] ............................................................................................. 4
Figure 2-1. Global methanol production technologies distribution ...................................................................... 11
Figure 2-2. Thermodynamic equilibrium curves for the conversion of syngas to methanol. Syngas with
(H2/CO=2) is used .................................................................................................................................................. 17
Figure 2-3. Equilibrium conversion of CO in methanol synthesis at various temperatures and pressures. Syngas
with (H2/CO=2) is used .......................................................................................................................................... 17
Figure 2-4. A proposed mechanism of methanol synthesis using low grade syngas based on the DRIFT study ... 21
Figure 2-5. Thermodynamic analysis of methanol reaction condition when H2/CO = 2 [89] ................................ 33
Figure 2-6. Literature data of H2-methanol binary system at room temperature at low pressures. The x-axis
stands for mole fraction of H2. The y-axis stands for total pressure. (+) Choudhary et al. at 293 K [100]; (*)
Wainwright et al. at 291 K [101]; (∆) Descamps et al. at 291.2 K [108]; (○) Liu et al. at 296.25 K [103] ............ 43
Figure 2-7. Literature data of H2-methanol binary system at room temperature at high pressures. The x-axis
stands for mole fraction of H2. The y-axis stands for total pressure. (squares) Brunner et al. at 298.15 K [106];
(solid circles) Bezanehtak et al. at 298.15 K [104] ................................................................................................ 44
Figure 2-8. Literature data of H2-methanol binary system at various temperature at low pressure. (X) Liu et al.
at 373.95 K [103]; (solid square) Liu et al. at 363.55 K [103];(Φ) Descamps et al. at 308.2 K [108] .................... 45
Figure 2-9. Literature data of H2-methanol binary system at various temperature at high pressure [106] ......... 45
Figure 2-10. Solubility data of H2-methyl formate binary system. The x-axis stands for the mole fraction of H2.
The y-axis stands for the total pressure. (a) by Liu et al. [103]; (b) by Wainwright et al. [101]........................... 47
Figure 2-11. Solubility data of CO-methanol binary system at 323 K. The x-axis stands for the mole fraction of
H2. The y-axis stands for the total pressure. (x) Liu et al. [111]; (○)Tonner et al.[110]; (∆) Brunner et al. [106] 49
Figure 2-12. Solubility data of CO-methanol binary system at various temperatures [106]. The x-axis stands for
the mole fraction of H2. The y-axis stands for the total pressure. ........................................................................ 50
xix
Figure 3-1. Schematic diagram of the valves and detectors in the Agilent GC 7890B .......................................... 66
Figure 4-1. Schematic diagram of solubility apparatus: 1. Gas cylinders (He, CO2, H2 and CO); 2. Mass flow
controller, 3. Storage tank; 4. Absorption tank; 5. Heating tape/Cooling bath; 6. Magnetic stirrer; 7. Vacuum
pump; 8. Vent system; BV-1 to BV-4: Ball valves; NV-1 and NV-2: Needle valves ................................................ 68
Figure 4-2. The flow chart of solubility experiments ............................................................................................. 71
Figure 4-3. The flow chart of phi-phi approach to determine the VLE data ......................................................... 77
Figure 4-4. The comparison of the experimental results with the literature data ................................................ 83
Figure 4-5. The comparison of the experimental results and literature data for CO-CH3OH system at 298.1 K... 84
Figure 4-6. The composition of the experimental results and literature data for CO-CH3OH system at 322.7 K .. 85
Figure 4-7. Isothermal phase equilibrium of CO in methyl formate...................................................................... 87
Figure 4-8. Isothermal phase equilibrium of CO in methyl formate...................................................................... 89
Figure 4-9. Isothermal phase equilibrium of H2 in methanol ................................................................................ 90
Figure 4-10. Isothermal phase equilibrium of H2 in methyl formate .................................................................... 91
Figure 4-11. Modelling validation results of CO solubility in methanol ................................................................ 96
Figure 4-12. Modelling validation results of CO solubility in methyl foramte ...................................................... 96
Figure 4-13. Modelling validation results of H2 solubility in methanol ................................................................. 97
Figure 4-14. Modelling validation results of H2 solubility in methyl formate ....................................................... 97
Figure 5-1. Schematic diagram of reaction apparatus: 1. Gas cylinders (He, CO2, H2 and CO); 2. Mass flow
controller, 3. Storage tank; 4. Reactor; 5. Heating tape/Cooling bath; 6. Magnetic stirrer; 7. Vacuum pump; 8.
Vent system; 9. Gas sampling tank; 10. GC; BV-1 to BV-6: Ball valves; NV-1 to NV-3: Needle valves ................ 102
Figure 5-2. The pressure profiles of carbonylation reaction. Operating conditions: Ptotal=2.3 MPa, agitation
speed = 800 rpm, catalyst loadings = 0.4 mol/L ................................................................................................. 107
Figure 5-3. The TPR profile of the copper chromite catalysts ............................................................................. 108
Figure 5-4. XRD patterns of copper chromite catalyst ........................................................................................ 110
Figure 5-5. The profile of thermal gravity analysis and the corresponding DTG ................................................ 111
Figure 5-6. SEM images of the copper chromite sample. (a) and (b) are copper chromite; (c) and (d) are reduced
copper chromite .................................................................................................................................................. 112
xx
Figure 5-7. Effect of rotation speeds on the conversion of methanol. Operating conditions: Ptotal = 3.2 MPa, T =
384 K, Catalyst loading = 16 g/L ......................................................................................................................... 114
Figure 5-8. Effect of the catalyst loadings on the conversion rate of methanol. Operating conditions: Ptotal= 3.2
MPa, T = 384K. Rotation speed = 800 rpm. ........................................................................................................ 116
Figure 5-9. Effect of temperature on the reaction rate. Operating conditions: Ptotal = 3.2 MPa, T = 346 K, Catalyst
loading = 16 g/L. Rotation speed = 800 rpm. ...................................................................................................... 118
Figure 5-10. Effect of temperature on the reaction rate. Operating conditions: Ptotal = 3.2 MPa, T = 370 K,
Catalyst loading = 16 g/L. Rotation speed = 800 rpm. ........................................................................................ 119
Figure 5-11. Effect of temperature on the reaction rate. Operating conditions: Ptotal = 3.2 MPa, T = 384 K,
Catalyst loading = 16 g/L. Rotation speed = 800 rpm. ........................................................................................ 120
Figure 5-12. Comparison of experimental and simulation results at T = 346 K. Operating conditions: Ptotal = 3.2
MPa, Catalyst loading = 16 g/L. Rotation speed = 800 rpm. .............................................................................. 131
Figure 5-13. Comparison of experimental and simulation results at T = 370 K. Operating conditions: Ptotal = 3.2
MPa, Catalyst loading = 16 g/L. Rotation speed = 800 rpm. .............................................................................. 131
Figure 5-14. Comparison of experimental and simulation results at T = 384 K. Operating conditions: Ptotal = 3.2
MPa, Catalyst loading = 16 g/L. Rotation speed = 800 rpm. .............................................................................. 132
Figure 5-15. Validation of the modelling parameters on various pressure. Catalyst loading = 16 g/L, T = 384K.
Operating conditions: PH2 = 1.8 MPa, T = 384 K, Catalyst loading = 16 g/L. Rotation speed = 800 rpm ............. 133
Figure 5-16. Validation of the modelling parameters on various pressure. Operating conditions: PH2 = 2.0 MPa, T
= 384 K, Catalyst loading = 16 g/L. Rotation speed = 800 rpm ........................................................................... 133
Figure 5-17. Validation of the modelling parameter on various pressure. Operating conditions: PH2 = 2.2 MPa, T
= 384 K, Catalyst loading = 16 g/L. Rotation speed = 800 rpm ........................................................................... 134
Figure 5-18. Schematic description of the proposed mechanism. Step 1 to Step 3 ............................................ 136
Figure 5-19. Schematic description of the proposed mechanism. Step 4 and Step 5 ......................................... 137
Figure 6-1. TPR profile of calcinated CuZnZr-HTC catalysts with different Cu/Zn ratio. (a) Cu8 (b) Cu6 (c) Cu4 (d)
Cu2 ...................................................................................................................................................................... 146
Figure 6-2. XRD patterns of dried CuZnZr-HTC catalyst ...................................................................................... 148
Figure 6-3. XRD patterns of calcinated CuZnZr-HTC catalyst .............................................................................. 149
xxi
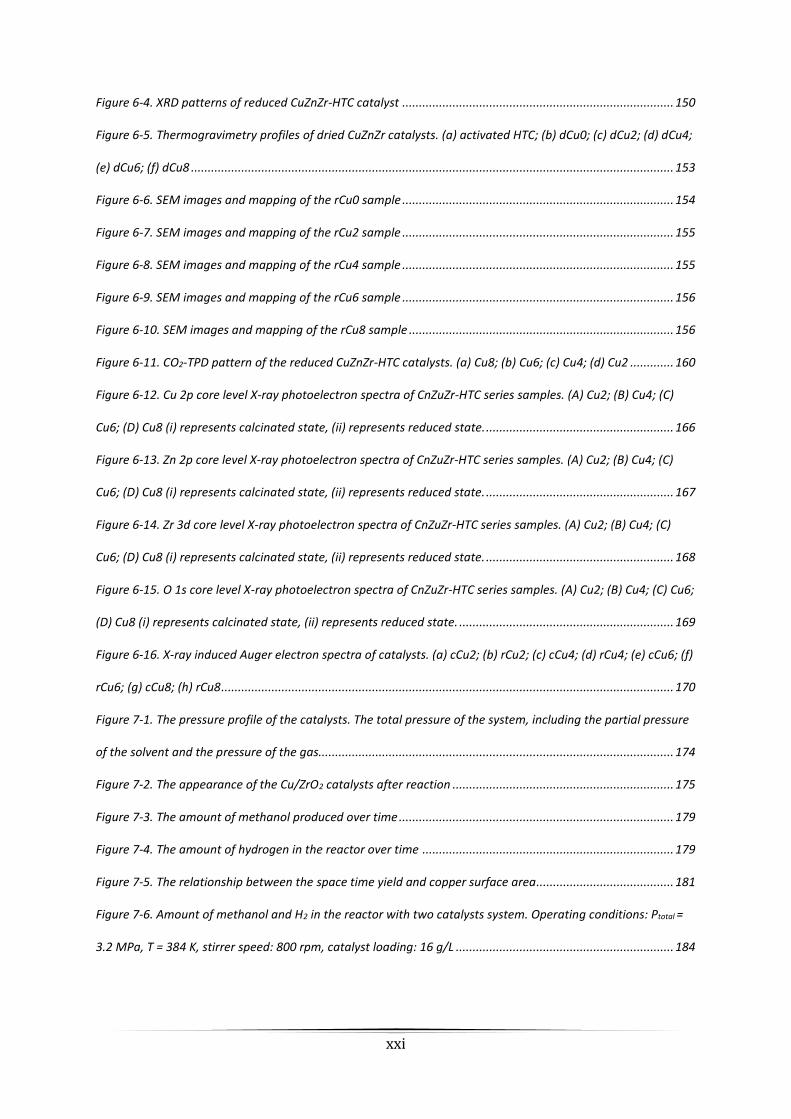
Figure 6-4. XRD patterns of reduced CuZnZr-HTC catalyst ................................................................................. 150
Figure 6-5. Thermogravimetry profiles of dried CuZnZr catalysts. (a) activated HTC; (b) dCu0; (c) dCu2; (d) dCu4;
(e) dCu6; (f) dCu8 ................................................................................................................................................ 153
Figure 6-6. SEM images and mapping of the rCu0 sample ................................................................................. 154
Figure 6-7. SEM images and mapping of the rCu2 sample ................................................................................. 155
Figure 6-8. SEM images and mapping of the rCu4 sample ................................................................................. 155
Figure 6-9. SEM images and mapping of the rCu6 sample ................................................................................. 156
Figure 6-10. SEM images and mapping of the rCu8 sample ............................................................................... 156
Figure 6-11. CO2-TPD pattern of the reduced CuZnZr-HTC catalysts. (a) Cu8; (b) Cu6; (c) Cu4; (d) Cu2 ............. 160
Figure 6-12. Cu 2p core level X-ray photoelectron spectra of CnZuZr-HTC series samples. (A) Cu2; (B) Cu4; (C)
Cu6; (D) Cu8 (i) represents calcinated state, (ii) represents reduced state. ........................................................ 166
Figure 6-13. Zn 2p core level X-ray photoelectron spectra of CnZuZr-HTC series samples. (A) Cu2; (B) Cu4; (C)
Cu6; (D) Cu8 (i) represents calcinated state, (ii) represents reduced state. ........................................................ 167
Figure 6-14. Zr 3d core level X-ray photoelectron spectra of CnZuZr-HTC series samples. (A) Cu2; (B) Cu4; (C)
Cu6; (D) Cu8 (i) represents calcinated state, (ii) represents reduced state. ........................................................ 168
Figure 6-15. O 1s core level X-ray photoelectron spectra of CnZuZr-HTC series samples. (A) Cu2; (B) Cu4; (C) Cu6;
(D) Cu8 (i) represents calcinated state, (ii) represents reduced state. ................................................................ 169
Figure 6-16. X-ray induced Auger electron spectra of catalysts. (a) cCu2; (b) rCu2; (c) cCu4; (d) rCu4; (e) cCu6; (f)
rCu6; (g) cCu8; (h) rCu8 ....................................................................................................................................... 170
Figure 7-1. The pressure profile of the catalysts. The total pressure of the system, including the partial pressure
of the solvent and the pressure of the gas.......................................................................................................... 174
Figure 7-2. The appearance of the Cu/ZrO2 catalysts after reaction .................................................................. 175
Figure 7-3. The amount of methanol produced over time .................................................................................. 179
Figure 7-4. The amount of hydrogen in the reactor over time ........................................................................... 179
Figure 7-5. The relationship between the space time yield and copper surface area ......................................... 181
Figure 7-6. Amount of methanol and H2 in the reactor with two catalysts system. Operating conditions: Ptotal =
3.2 MPa, T = 384 K, stirrer speed: 800 rpm, catalyst loading: 16 g/L ................................................................. 184
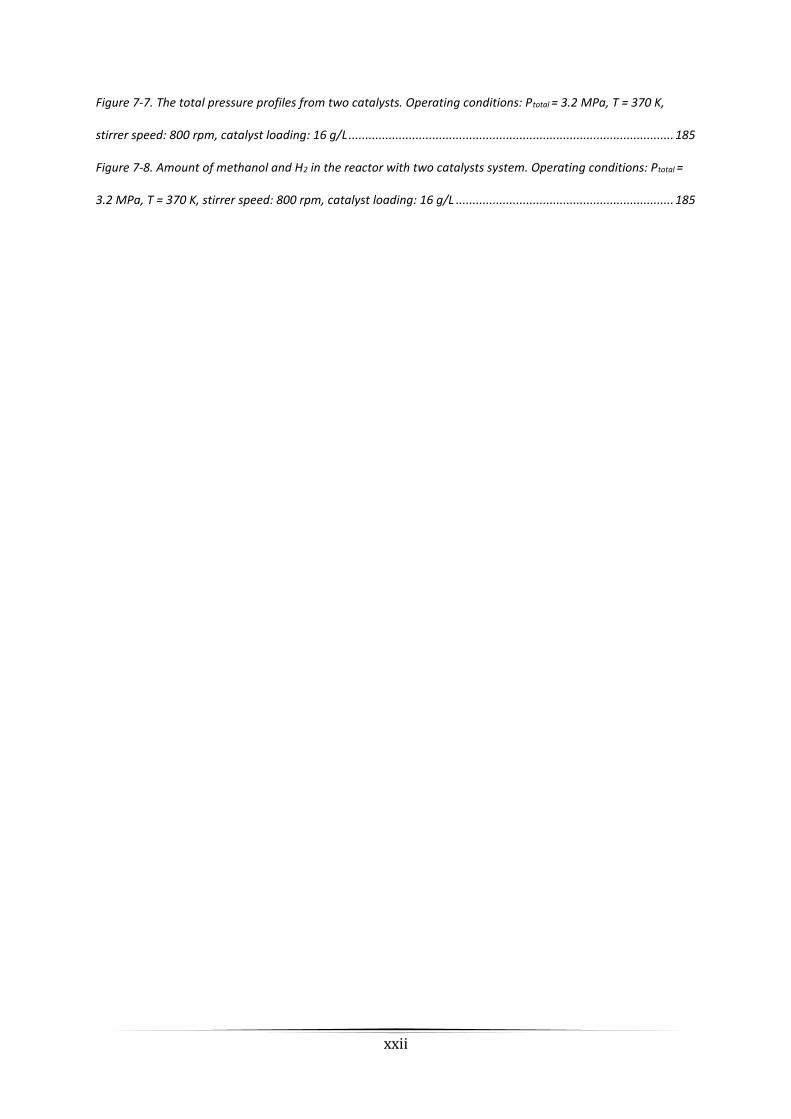
xxii
Figure 7-7. The total pressure profiles from two catalysts. Operating conditions: Ptotal = 3.2 MPa, T = 370 K,
stirrer speed: 800 rpm, catalyst loading: 16 g/L ................................................................................................. 185
Figure 7-8. Amount of methanol and H2 in the reactor with two catalysts system. Operating conditions: Ptotal =
3.2 MPa, T = 370 K, stirrer speed: 800 rpm, catalyst loading: 16 g/L ................................................................. 185
xxiii
LIST OF REACTIONS
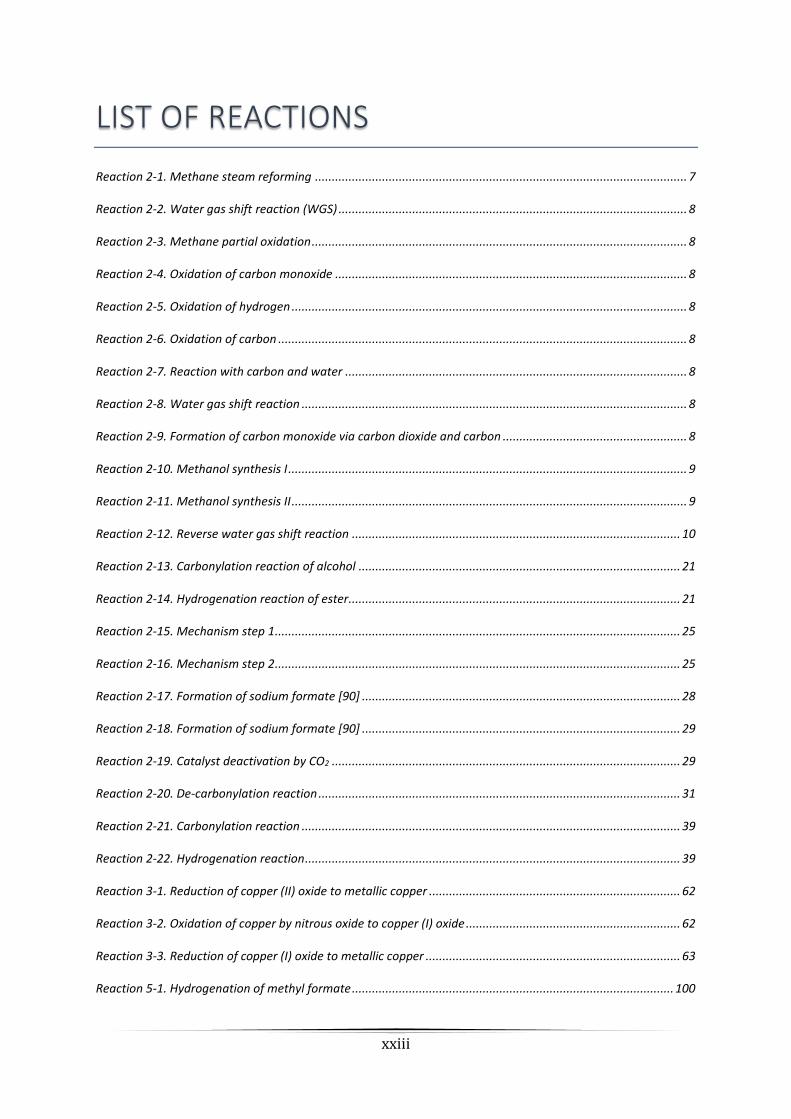
Reaction 2-1. Methane steam reforming ............................................................................................................... 7
Reaction 2-2. Water gas shift reaction (WGS) ........................................................................................................ 8
Reaction 2-3. Methane partial oxidation ................................................................................................................ 8
Reaction 2-4. Oxidation of carbon monoxide ......................................................................................................... 8
Reaction 2-5. Oxidation of hydrogen ...................................................................................................................... 8
Reaction 2-6. Oxidation of carbon .......................................................................................................................... 8
Reaction 2-7. Reaction with carbon and water ...................................................................................................... 8
Reaction 2-8. Water gas shift reaction ................................................................................................................... 8
Reaction 2-9. Formation of carbon monoxide via carbon dioxide and carbon ....................................................... 8
Reaction 2-10. Methanol synthesis I ....................................................................................................................... 9
Reaction 2-11. Methanol synthesis II ...................................................................................................................... 9
Reaction 2-12. Reverse water gas shift reaction .................................................................................................. 10
Reaction 2-13. Carbonylation reaction of alcohol ................................................................................................ 21
Reaction 2-14. Hydrogenation reaction of ester ................................................................................................... 21
Reaction 2-15. Mechanism step 1 ......................................................................................................................... 25
Reaction 2-16. Mechanism step 2 ......................................................................................................................... 25
Reaction 2-17. Formation of sodium formate [90] ............................................................................................... 28
Reaction 2-18. Formation of sodium formate [90] ............................................................................................... 29
Reaction 2-19. Catalyst deactivation by CO2 ........................................................................................................ 29
Reaction 2-20. De-carbonylation reaction ............................................................................................................ 31
Reaction 2-21. Carbonylation reaction ................................................................................................................. 39
Reaction 2-22. Hydrogenation reaction ................................................................................................................ 39
Reaction 3-1. Reduction of copper (II) oxide to metallic copper ........................................................................... 62
Reaction 3-2. Oxidation of copper by nitrous oxide to copper (I) oxide ................................................................ 62
Reaction 3-3. Reduction of copper (I) oxide to metallic copper ............................................................................ 63
Reaction 5-1. Hydrogenation of methyl formate ................................................................................................ 100

xxiv
Reaction 5-2. Decomposition of copper barium ammonium chromite ............................................................... 101
Reaction 5-3. Decomposition of copper ammonium chromite ........................................................................... 101
Reaction 5-4. Decarbonylation reaction ............................................................................................................. 122
Reaction 5-5. Dehydration of methanol ............................................................................................................. 122
Reaction 5-6. Adsorption of methyl formate on the catalyst active sites ........................................................... 123
Reaction 5-7. Adsorption of H2 on the catalyst active sites ................................................................................ 123
Reaction 5-8. Formation of intermediates .......................................................................................................... 123
Reaction 5-9. Production of methanol I .............................................................................................................. 123
Reaction 5-10. Production of methanol II ........................................................................................................... 123
Reaction 7-1. Decarbonylation reaction of methyl formate ............................................................................... 176
Reaction 7-2. Dehydration of methanol ............................................................................................................. 176
xxv
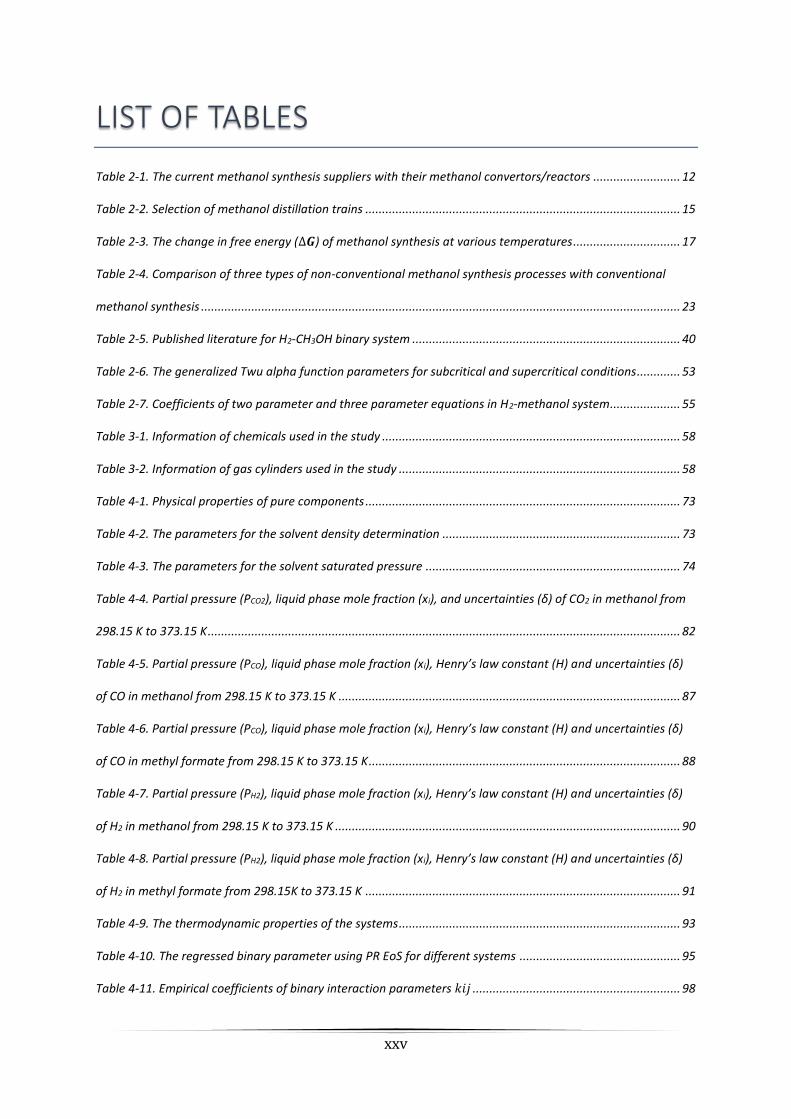
LIST OF TABLES
Table 2-1. The current methanol synthesis suppliers with their methanol convertors/reactors .......................... 12
Table 2-2. Selection of methanol distillation trains .............................................................................................. 15
Table 2-3. The change in free energy (∆𝑮) of methanol synthesis at various temperatures ................................ 17
Table 2-4. Comparison of three types of non-conventional methanol synthesis processes with conventional
methanol synthesis ............................................................................................................................................... 23
Table 2-5. Published literature for H2-CH3OH binary system ................................................................................ 40
Table 2-6. The generalized Twu alpha function parameters for subcritical and supercritical conditions ............. 53
Table 2-7. Coefficients of two parameter and three parameter equations in H2-methanol system ..................... 55
Table 3-1. Information of chemicals used in the study ......................................................................................... 58
Table 3-2. Information of gas cylinders used in the study .................................................................................... 58
Table 4-1. Physical properties of pure components .............................................................................................. 73
Table 4-2. The parameters for the solvent density determination ....................................................................... 73
Table 4-3. The parameters for the solvent saturated pressure ............................................................................ 74
Table 4-4. Partial pressure (PCO2), liquid phase mole fraction (xi), and uncertainties (δ) of CO2 in methanol from
298.15 K to 373.15 K ............................................................................................................................................. 82
Table 4-5. Partial pressure (PCO), liquid phase mole fraction (xi), Henry’s law constant (H) and uncertainties (δ)
of CO in methanol from 298.15 K to 373.15 K ...................................................................................................... 87
Table 4-6. Partial pressure (PCO), liquid phase mole fraction (xi), Henry’s law constant (H) and uncertainties (δ)
of CO in methyl formate from 298.15 K to 373.15 K ............................................................................................. 88
Table 4-7. Partial pressure (PH2), liquid phase mole fraction (xi), Henry’s law constant (H) and uncertainties (δ)
of H2 in methanol from 298.15 K to 373.15 K ....................................................................................................... 90
Table 4-8. Partial pressure (PH2), liquid phase mole fraction (xi), Henry’s law constant (H) and uncertainties (δ)
of H2 in methyl formate from 298.15K to 373.15 K .............................................................................................. 91
Table 4-9. The thermodynamic properties of the systems .................................................................................... 93
Table 4-10. The regressed binary parameter using PR EoS for different systems ................................................ 95
Table 4-11. Empirical coefficients of binary interaction parameters 𝑘𝑖𝑗 .............................................................. 98
xxvi
Table 5-1. Experimental conditions for hydrogenation reactions ....................................................................... 105
Table 5-2. The carbonylation reaction performance .......................................................................................... 107
Table 5-3. The reducibility of the copper chromite ............................................................................................. 108
Table 5-4. Surface properties of the copper chromite ........................................................................................ 113
Table 5-5. Amount of methanol produced under different agitation speeds .................................................... 115
Table 5-6. Amount of hydrogen at various catalyst loadings ............................................................................ 117
Table 5-7. Experimental values of reactants and products at different temperature. ....................................... 121
Table 5-8. The absolute average relative residual (AARD,%) for each system ................................................... 128
Table 5-9. Regressed kinetics parameters .......................................................................................................... 130
Table 5-10. The absolute average relative residual (AARD%) for each system .................................................. 134
Table 5-11. Experimental values of reactants and products at different Hydrogen pressure. ........................... 135
Table 6-1. Metal composition of prepared catalysts .......................................................................................... 144
Table 6-2. Centre of reduction peaks and corresponding concentrations to the TPR pattern over CuZnZr-HTC
catalysts with different Cu/Zn ratio .................................................................................................................... 146
Table 6-3. Total mass loss of the dried catalysts ................................................................................................ 152
Table 6-4. The relative surface concentration of metal (atomic %) on the CuZnZr-HTC catalysts. The values in the
parentheses are the nominal concentration normalized to the total metal content of the prepared samples .. 157
Table 6-5. Physicochemical properties of the calcinated samples with different Cu/Zn ratio. ........................... 157
Table 6-6. The amount and distribution of basic sites of the reduced CuZnZr-HTC catalysts ............................. 159
Table 6-7. XPS parameters of Cu core level in CuZnZr-HTC catalysts .................................................................. 162
Table 6-8. XPS parameters of Zn core level in CuZnZr-HTC catalysts .................................................................. 162
Table 6-9. XPS parameters of Zr core level in CuZnZr-HTC catalysts................................................................... 162
Table 6-10. XPS parameters of calcined CuZnZr-HTC samples ............................................................................ 164
Table 6-11. XPS parameters of reduced CuZnZr-HTC samples ............................................................................ 164
Table 7-1. Experiment Operating conditions ...................................................................................................... 173
Table 7-2. Metal compositions of prepared catalysts ......................................................................................... 173
Table 7-3. Catalytic performance for hydrogenation of methyl formate ........................................................... 178
Table 7-4. Physicochemical properties of copper chromite and Cu8 catalysts ................................................... 182

xxvii
Table 7-5. Surface composition of the catalyst ................................................................................................... 183
Table 7-6. Space time yield of the catalysts at 384 K .......................................................................................... 184
Table 7-7. Space time yield of the catalysts at 370 K .......................................................................................... 185

Introduction
1
CHAPTER 1 INTRODUCTION
1.1 BACKGROUND
Methanol is an important feedstock used as a fuel and solvent in various industries. It was
first obtained by Robert Boyle in 1661 as a by-product in the production of charcoal via
wood distillation, thus it is so called wood alcohol [1]. The elemental composition of
methanol remained unidentified until 1834 when Dumas and Peligot introduced the
terminology methyl alcohol [2]. Until 1923, methanol production rate was very limited,
approximately 10 - 20 L per ton of wood treated for charcoal manufacturing. Initially,
methanol was produced for the purpose of lighting, cooking and heating; however, it was
rapidly substituted by more economical fuels, such as kerosene [3].
In 1905, Sabatier suggested the first synthetic pathway for methanol production from CO
and H2 [4]. Based on those findings, in early 1920s, Mittasch et al. at BASF (Badische
Anilin and Soda Fabrik) synthesised organic oxygenates, including methanol, from syngas
that was supplied from coal gasification in the course of development of ammonia
synthesis [5]. In 1923, BASF (in Leuna, Germany) started to commercialise syngas-to-
methanol process with utilising sulphur resistant zinc chromite (ZnO-Cr2O3) catalysts
and operating conditions of 593 – 723 K and 25 - 35 MPa [6].
Due to the harsh operating conditions of methanol production operated by BASF, new
technology and catalysts were required to make the process feasible and economical.
With the invention of steam reforming of methane, sulphur free syngas was produced. In
1966, ICI (Imperial Chemical Industries, Great Britain) successfully produced methanol
at lower pressure and temperature (10 MPa and 573 K) by using a quench reactor loaded
with high activity Cu/ZnO catalyst [7]. Meanwhile, Lurgi Gesellschaft fur warme and
Introduction
2
Chemoteknik from Germany developed a process with lower operating temperature (503
-523 K) and pressure (4 – 5 MPa) via using a tubular reactor cooled with boiling water
[6].
Methanol can be made from wide range of feed stocks and has therefore become the most
commonly produced chemical at industrial scale. It is a primary liquid petrochemical
which can be utilised as a fuel and solvent. It is also a key industrially-derivable feedstock
that can be converted into various value-added products [3], [8], [9]. The feedstock of
methanol synthesis and its downstream products can be found in Figure 1-1.
Figure 1-1. Methanol as the basic chemical and energy feedstock [10]
Figure 1-2 shows an overview of methanol demand by end-use in 2015. Formaldehyde is
the largest single methanol derivative and is a key component for construction products
as well as car manufacturing [11]. Other typical methanol derivatives include acetic acids
and MTBE which account for a certain amount of end-use of methanol. However, recently,

Introduction
3
newer products such as light-olefins using MTO (methanol to olefins) and dimethyl ether
(DME), are changing the methanol applications palette [11]–[13].
Figure 1-2. Global methanol demand by end-use 2015 [14]
Over 90 methanol plants are distributed globally with an annual capacity of 120 million
metric tons [15]–[27]. About 0.2 million tons of methanol are consumed daily as chemical
feedstock and/or as fuels [28]. In 2010, the global demand for methanol reached 49
million metric tons (MMT), and is expected to exceed 95 MMT by 2020 based on the
global methanol supply-demand chart shown on Figure 1-3 and Figure 1-4. In addition,
the current dominant player in the methanol global market is China, which is driven by
the significant economic growth in the last two decades. China dominates about 54 % of
world demand, due to substantial demand for olefins which are derived from methanol
via MTO technology [11], [12], [14]. In 2020, northeast Asia led by China will dominate
70 % of global market demand, followed by North America at just 9 % and Western
Europe at 8 % [13].
7%
4%
18%2%3%
8%
3%
9%
2%
8%
9%
27%
Formaldehyde
Acetic Acid
MTBE/TAME
Methyl Methacrylate
Gasoline/Fuel
Biodiesel
Dimethyl ether
Methylamines
Chloromethanes
MTO
Solvents
Others
Introduction
4
Figure 1-3. Global methanol supply and demand [13]
Figure 1-4. World methanol demand by regions [28]
Introduction
5
1.2 MOTIVATION, OBJECTIVE AND OUTLINE OF THE THESIS
Methanol is commercially produced from fossil fuel-based syngas that contains CO and
H2 at 250 to 300 °C and 50 to 100 bar. The high pressure and temperature requirement
for syngas to methanol process has a negative impact on both economy and environment.
Over the past decades, researchers have been looking thoroughly for new catalysts which
can convert syngas to methanol at low temperature and low pressure and designing new
processes with moderate operating conditions. A methanol synthesis via methyl formate
process (MS via MF) was selected (as one of many options) for study in this thesis as it
has certain advantages, such as that it can be potentially industrialised at moderate
pressures and temperatures (100 - 140 °C and 20 - 40 bar). The process consists of two
reactions, a carbonylation reaction and a hydrogenation reaction. Based on the literature
study, the hydrogenation reaction is the rate limiting step, and hence, it becomes the
research focus of this study.
This thesis is presented in eight chapters. In Chapter 1, a brief introduction of methanol
and methanol synthesis background is introduced. Chapter 2 reviews and summarises
the published literature of the commercial methanol synthesis as well as the MS via MF
process. A short review of the vapour liquid equilibrium of the H2/CO system in methanol
and methyl formate system is also included in Chapter 2. Chapter 3 introduces the
materials and methodologies used in the current research. Chapter 4 reports on the
vapour liquid equilibrium of the reactants at the operating conditions of the reaction by
using a bench-scale custom-built apparatus. The Peng Robinson Equation of State (PR-
EoS) with a binary interaction parameter kij was fit to the data to ensure that the
equation of state (EoS) describes the experimental results correctly. In Chapter 5, the
hydrogenation reaction is performed at different temperatures and pressures and a

Introduction
6
reaction mechanism is proposed and validated. Chapter 6 and 7 present a study of a novel
catalyst synthesis using copper oxide, zinc oxide and zirconium oxide deposited on
hydrotalcite-like compounds, detailing the characterisation of the catalysts as well as the
hydrogenation reaction performance using the novel catalyst. Chapter 8 summarises the
PhD work and the key findings, together with some recommendations for future
development.

Literature review
7
CHAPTER 2 LITERATURE REVIEW
2.1 COMMERCIAL PRODUCTION OF METHANOL
The typical methanol synthesis process consists of three steps: production of syngas,
conversion of syngas to methanol and methanol purification [29].
2.1.1 SYNGAS PRODUCTION
The characteristics of the syngas production depend on the type of feedstock used and
the operation conditions of the process [30], [31].
Natural gas is the primary and preferred feedstock for methanol production in industry
because the corresponding processes for syngas production are low in energy
consumption, capital investment and operating cost [32]. There are three main
technologies applied in industry to produce syngas from natural gas. The most common
approach is an extremely endothermic process called methane steam reforming (MSR),
which is operated at a temperature of 800 -1000 °C and a pressure in the range of 2 – 3
MPa [33]. The reactions are shown in Reaction 2-1 and Reaction 2-2. [9], [34], [35]. The
second common technology for syngas manufacturing is called partial oxidation of
methane (POX) where air is introduced as a source of oxygen. The overall reaction is
exothermic (the sum of Reaction 2-6 to 2-8) [3], [30], [32], [34]. The third well-known
methane to syngas technology is called auto-thermal reforming (ATR) which combines
both steam reforming and partial oxidation into one step. ATR is a thermodynamically
neutral system because heat required for the endothermic steam reforming reaction is
supplied by the exothermic partial oxidation reaction occurring in the same vessel [36].
Reaction 2-1. Methane steam reforming
CH4 + H2O ⇌ CO + 3H2 ∆Ho = 205.43 kJ/mol
Literature review
8
Reaction 2-2. Water gas shift reaction (WGS)
CO + H2O ⇌ CO2 + H2 ∆Ho = −41.00 kJ/mol
Reaction 2-3. Methane partial oxidation
CH4 +1
2O2 ⇌ CO + 2H2 ∆Ho = −35.98 kJ/mol
Reaction 2-4. Oxidation of carbon monoxide
CO +1
2O2 ⇌ CO2 ∆Ho = −282.84 kJ/mol
Reaction 2-5. Oxidation of hydrogen
H2 +1
2O2 ⇌ H2O ∆Ho = −241.42 kJ/mol
Coal is the other main feedstock used for syngas production in countries with low or
costly local availability of natural gas [37]. In this case, syngas is produced via three
processes: gasification, partial oxidation and steam treatment. The reactions are
summarised in Reaction 2-6 to Reaction 2-9 [32], [38].
Reaction 2-6. Oxidation of carbon
C + O2 ⇌ CO2
Reaction 2-7. Reaction with carbon and water
C + H2O ⇌ CO + H2
Reaction 2-8. Water gas shift reaction
CO + H2O ⇌ CO2 + H2
Reaction 2-9. Formation of carbon monoxide via carbon dioxide and carbon
CO2 + C ⇌ 2CO
In recent years, syngas production using shale gas has become popular since large shale
deposits have been discovered in the United States and Canada [39]–[41].
Literature review
9
After possible purification processes, syngas is pressurised with a compressor and added
to recycled syngas and then heated. The produced syngas consisting of H2 and CO with a
ratio of 3 to 5 is introduced to the methanol reactor [42].
2.1.2 METHANOL SYNTHESIS FROM SYNGAS
Methanol was first manufactured by BASF where methanol was synthesised over a
catalyst of ZnO/Cr2O3 at 25 - 35 MPa and 600 - 723 K. The very high pressure required
for the process was undesirable, so that large companies have invested considerable
money and research to improve the operating conditions of the methanol synthesis
process. By 1966, ICI was able to reduce the pressure to 10 MPa by using a new catalyst
based on copper and zinc oxide. Since then this process which is called low-pressure
methanol synthesis and is the only process employed globally for methanol production
[3]. In this process, syngas discharged from the reformer is washed, compressed and
heated before entering the methanol synthesis converter [9]. However, the per-pass
conversion of syngas to methanol is very low (< 20 %), resulting in a large recycle stream
of non-converted syngas. Methanol synthesis is an energy intensive process due to the
high operating pressure and temperature, and a high-volume stream of non-converted
syngas which requires compression to be recycled and mixed with the feed stream
entering the methanol reactor. The reactions that are carried out in the methanol reactor
include [43]:
Reaction 2-10. Methanol synthesis I
CO + 2H2 ⇌ CH3OH ∆Ho = −90.77 kJ/mol
Reaction 2-11. Methanol synthesis II
CO2 + 3H2 ⇌ CH3OH + H2O ∆Ho = −49.58 kJ/mol
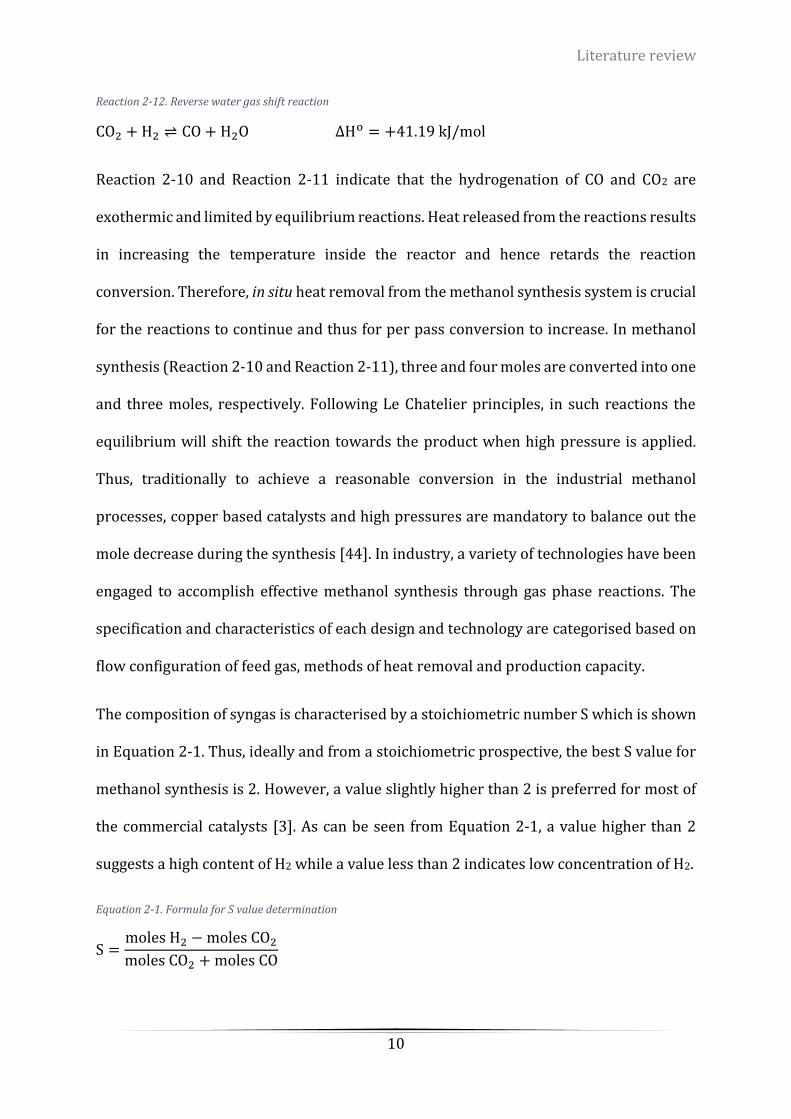
Literature review
10
Reaction 2-12. Reverse water gas shift reaction
CO2 + H2 ⇌ CO + H2O ∆Ho = +41.19 kJ/mol
Reaction 2-10 and Reaction 2-11 indicate that the hydrogenation of CO and CO2 are
exothermic and limited by equilibrium reactions. Heat released from the reactions results
in increasing the temperature inside the reactor and hence retards the reaction
conversion. Therefore, in situ heat removal from the methanol synthesis system is crucial
for the reactions to continue and thus for per pass conversion to increase. In methanol
synthesis (Reaction 2-10 and Reaction 2-11), three and four moles are converted into one
and three moles, respectively. Following Le Chatelier principles, in such reactions the
equilibrium will shift the reaction towards the product when high pressure is applied.
Thus, traditionally to achieve a reasonable conversion in the industrial methanol
processes, copper based catalysts and high pressures are mandatory to balance out the
mole decrease during the synthesis [44]. In industry, a variety of technologies have been
engaged to accomplish effective methanol synthesis through gas phase reactions. The
specification and characteristics of each design and technology are categorised based on
flow configuration of feed gas, methods of heat removal and production capacity.
The composition of syngas is characterised by a stoichiometric number S which is shown
in Equation 2-1. Thus, ideally and from a stoichiometric prospective, the best S value for
methanol synthesis is 2. However, a value slightly higher than 2 is preferred for most of
the commercial catalysts [3]. As can be seen from Equation 2-1, a value higher than 2
suggests a high content of H2 while a value less than 2 indicates low concentration of H2.
Equation 2-1. Formula for S value determination
S =moles H2 − moles CO2
moles CO2 + moles CO
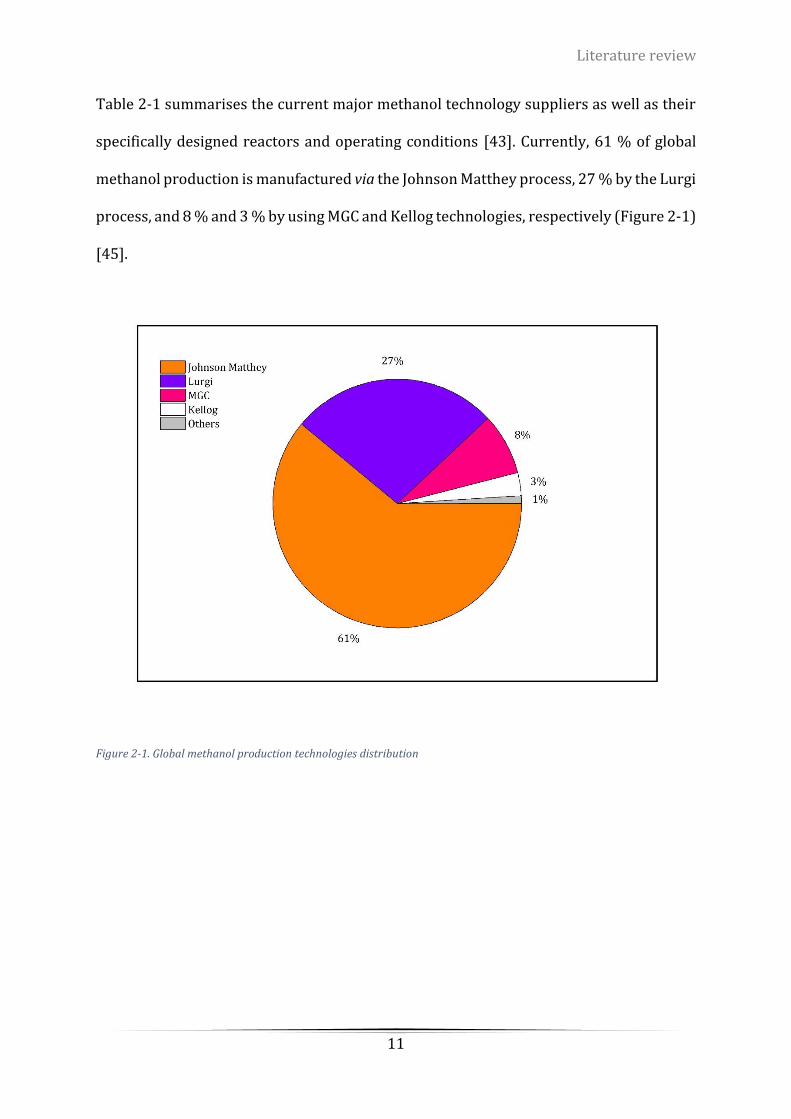
Literature review
11
Table 2-1 summarises the current major methanol technology suppliers as well as their
specifically designed reactors and operating conditions [43]. Currently, 61 % of global
methanol production is manufactured via the Johnson Matthey process, 27 % by the Lurgi
process, and 8 % and 3 % by using MGC and Kellog technologies, respectively (Figure 2-1)
[45].
Figure 2-1. Global methanol production technologies distribution
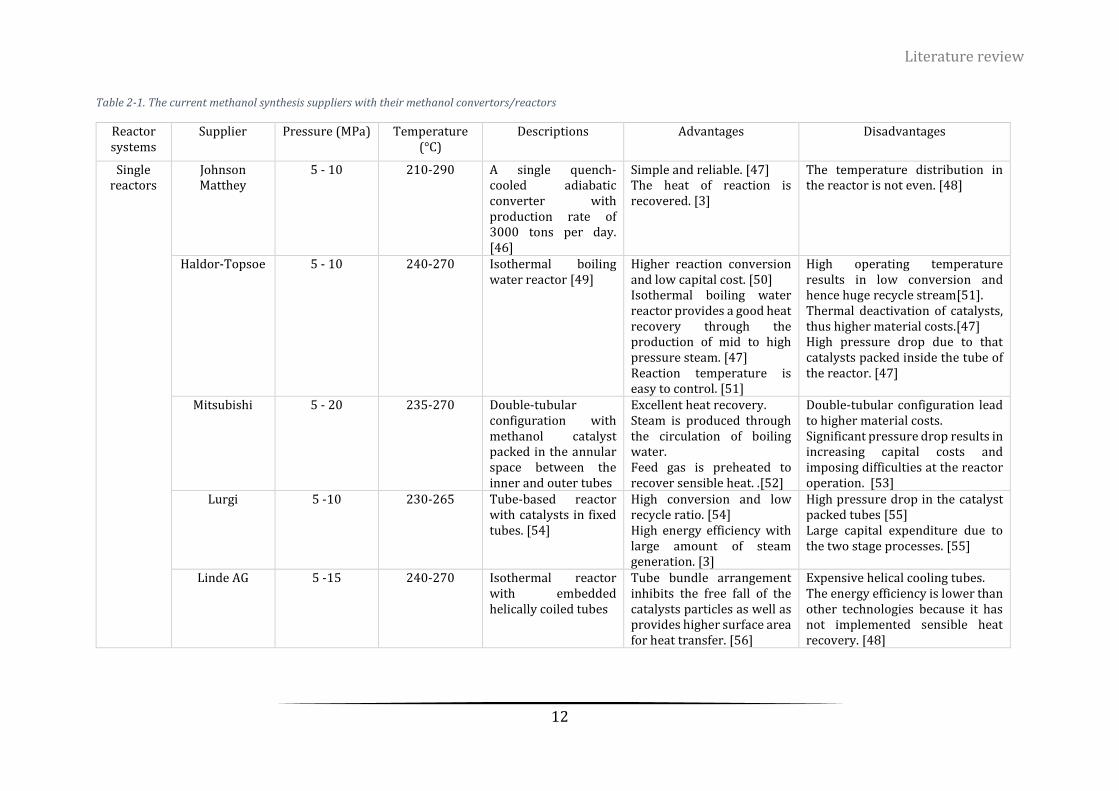
Literature review
12
Table 2-1. The current methanol synthesis suppliers with their methanol convertors/reactors
Reactor systems
Supplier Pressure (MPa) Temperature (°C)
Descriptions Advantages Disadvantages
Single reactors
Johnson Matthey
5 - 10 210-290 A single quench-cooled adiabatic converter with production rate of 3000 tons per day. [46]
Simple and reliable. [47] The heat of reaction is recovered. [3]
The temperature distribution in the reactor is not even. [48]
Haldor-Topsoe 5 - 10 240-270 Isothermal boiling water reactor [49]
Higher reaction conversion and low capital cost. [50] Isothermal boiling water reactor provides a good heat recovery through the production of mid to high pressure steam. [47] Reaction temperature is easy to control. [51]
High operating temperature results in low conversion and hence huge recycle stream[51]. Thermal deactivation of catalysts, thus higher material costs.[47] High pressure drop due to that catalysts packed inside the tube of the reactor. [47]
Mitsubishi 5 - 20 235-270 Double-tubular configuration with methanol catalyst packed in the annular space between the inner and outer tubes
Excellent heat recovery. Steam is produced through the circulation of boiling water. Feed gas is preheated to recover sensible heat. .[52]
Double-tubular configuration lead to higher material costs. Significant pressure drop results in increasing capital costs and imposing difficulties at the reactor operation. [53]
Lurgi 5 -10 230-265 Tube-based reactor with catalysts in fixed tubes. [54]
High conversion and low recycle ratio. [54] High energy efficiency with large amount of steam generation. [3]
High pressure drop in the catalyst packed tubes [55] Large capital expenditure due to the two stage processes. [55]
Linde AG 5 -15 240-270 Isothermal reactor with embedded helically coiled tubes
Tube bundle arrangement inhibits the free fall of the catalysts particles as well as provides higher surface area for heat transfer. [56]
Expensive helical cooling tubes. The energy efficiency is lower than other technologies because it has not implemented sensible heat recovery. [48]
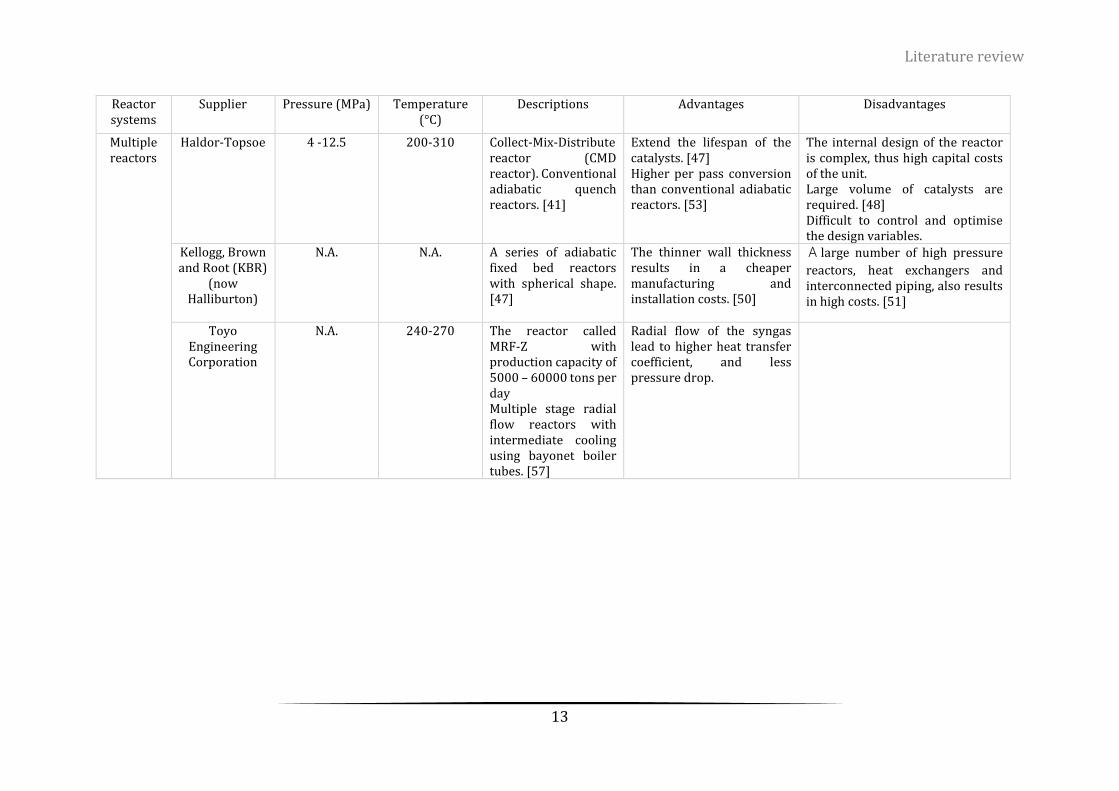
Literature review
13
Reactor systems
Supplier Pressure (MPa) Temperature (°C)
Descriptions Advantages Disadvantages
Multiple reactors
Haldor-Topsoe 4 -12.5 200-310 Collect-Mix-Distribute reactor (CMD reactor). Conventional adiabatic quench reactors. [41]
Extend the lifespan of the catalysts. [47] Higher per pass conversion than conventional adiabatic reactors. [53]
The internal design of the reactor is complex, thus high capital costs of the unit. Large volume of catalysts are required. [48] Difficult to control and optimise the design variables.
Kellogg, Brown and Root (KBR)
(now Halliburton)
N.A. N.A. A series of adiabatic fixed bed reactors with spherical shape. [47]
The thinner wall thickness results in a cheaper manufacturing and installation costs. [50]
A large number of high pressure
reactors, heat exchangers and interconnected piping, also results in high costs. [51]
Toyo Engineering Corporation
N.A. 240-270 The reactor called MRF-Z with production capacity of 5000 – 60000 tons per day Multiple stage radial flow reactors with intermediate cooling using bayonet boiler tubes. [57]
Radial flow of the syngas lead to higher heat transfer coefficient, and less pressure drop.
Literature review
14
2.1.3 SEPARATION AND PURIFICATION
The product stream exiting the methanol reactor is crude methanol since it contains by-
products like water, dissolved gases and traces of H2. The ratio of products is highly
dependent on the type of methanol reactors, feed streams and operating conditions [32].
The purification of methanol and separation of the by-products and impurities are
conducted using one or more distillation columns [32], [58]–[60]. In the current
methanol production plants, two types of distillation trains are applied; cost-saving two-
column distillation and energy-saving three-column distillation [61]. Each type of
methanol distillation column system is suitable for a certain kind of plants. Table 2-2
summarises the advantages and disadvantages of each system as well as the
corresponding schematic diagrams.

Literature review
15
Table 2-2. Selection of methanol distillation trains
Factors Two-column system [59] Three-column system [61]
Selection criterion
The plants with steam reforming When steam import for column reboiler is possible Low capital costs
Insufficient reformed gas waste heat is generated. Large plant capacities Low Energy consumption
Disadvantages High energy consumption High capital costs
Flow diagram [32]

Literature review
16
2.1.4 LIMITATIONS OF COMMERCIAL METHANOL SYNTHESIS PROCESSES
Even though methanol production is well established in industry, the exothermic nature
and thermodynamic characteristics of methanol synthesis reactions present several
difficulties and problems for the optimum process and reactor designs.
HIGH OPERATING TEMPERATURE
The change in free energy (∆G) of methanol synthesis at different temperatures, when P
is set at 3 MPa, is summarised in the Table 2-3 with the values obtained from the
AspenPlus using thermodynamics database in the library. It shows that ∆𝐺 reduces when
temperature decreases, indicating that methanol synthesis reaction is favoured at low
temperature. However, the commercial catalysts (kinetics) shows higher activity at
elevated temperature, therefore the reaction temperature chosen is a compromise of
thermodynamics and kinetics and is within the range of 250 – 300 ℃. Moreover, Figure
2-2 shows that the theoretical CO conversion is limited to approximately 20 % at
commercial operating conditions (300 °C and 50 bar). Higher pressures could improve
the methanol reaction equilibrium and yield higher methanol conversion. However, those
extreme operating conditions result in not only higher investment cost, but also higher
energy demand.
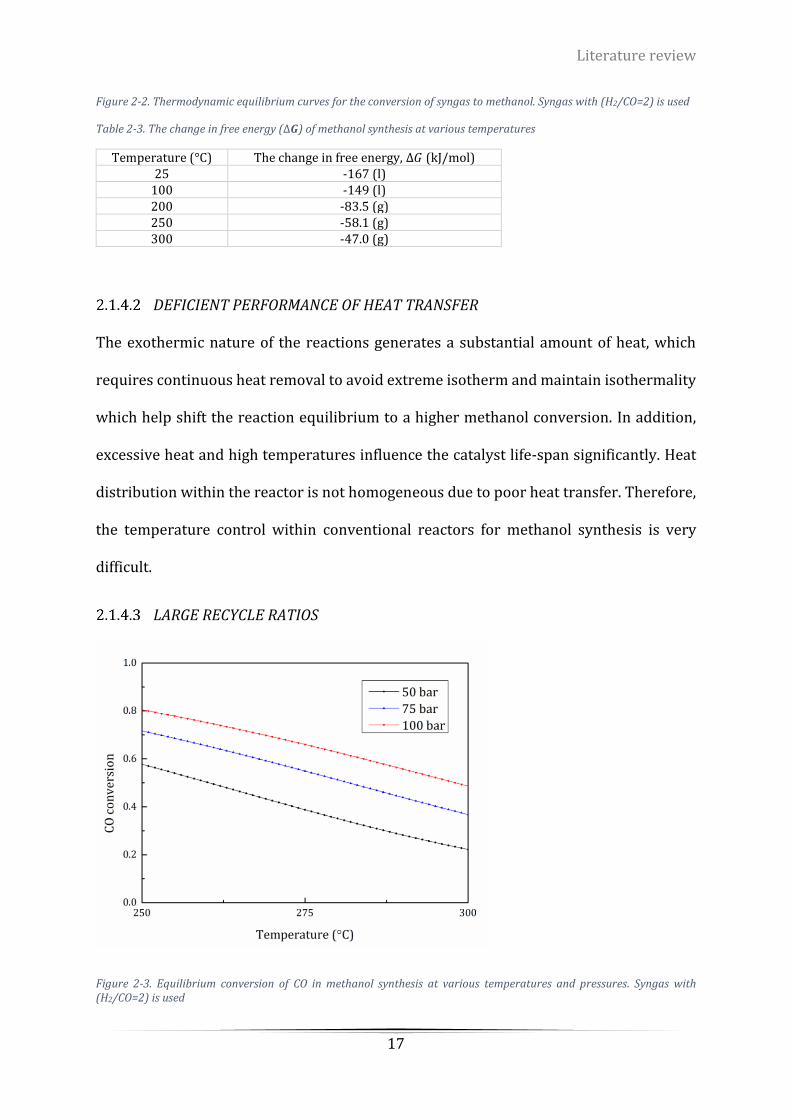
Literature review
17
Figure 2-2. Thermodynamic equilibrium curves for the conversion of syngas to methanol. Syngas with (H2/CO=2) is used
Table 2-3. The change in free energy (∆𝑮) of methanol synthesis at various temperatures
Temperature (°C) The change in free energy, ∆𝐺 (kJ/mol) 25 -167 (l)
100 -149 (l) 200 -83.5 (g) 250 -58.1 (g) 300 -47.0 (g)
DEFICIENT PERFORMANCE OF HEAT TRANSFER
The exothermic nature of the reactions generates a substantial amount of heat, which
requires continuous heat removal to avoid extreme isotherm and maintain isothermality
which help shift the reaction equilibrium to a higher methanol conversion. In addition,
excessive heat and high temperatures influence the catalyst life-span significantly. Heat
distribution within the reactor is not homogeneous due to poor heat transfer. Therefore,
the temperature control within conventional reactors for methanol synthesis is very
difficult.
LARGE RECYCLE RATIOS
Figure 2-3. Equilibrium conversion of CO in methanol synthesis at various temperatures and pressures. Syngas with (H2/CO=2) is used
Literature review
18
From Figure 2-3, up to 30 % equilibrium conversion of CO can be achieved at industrial
operating conditions of 250 ℃ and 5 MPa. The equilibrium conversion of CO to methanol
at different operating conditions was calculated by Aspen HYSYS using thermochemical
data within its database. However, the optimum conditions which favour both kinetics
and thermodynamics equilibrium are difficult to balance. As a consequence, CO per-pass
conversion is very low ranging from 6 to 12 %. Thus, a large stream of unreacted high-
pressure gas need to be recycled, i.e., large recycle ratios are required.
Over the past decades, many research groups and institutions around the world have
been working on the development of catalysts, reactor configurations and process
designs that generate methanol at moderate conditions, to increase methanol production
rates thermodynamically. The outcomes can be classified into three approaches: namely
Brookhaven National Laboratory (BNL) homogeneous liquid phase methanol synthesis
at low temperature and pressure (BNL-LTLP) [62], [63], methanol synthesis via methyl
formate as an intermediate (MS via MF), and methanol synthesis using low-grade syngas
at low temperature (MS-LT) [64]–[67]. A summary of these three approaches will be
explained and summarised in the next section. A comparison among these approaches as
well as the commercial methanol synthesis process will be performed, which provides a
potential guideline that helps to determine the research scope and objective.
2.2 METHANOL SYNTHESIS AT MODERATE CONDITIONS
2.2.1 THREE APPROACHES OF METHANOL SYNTHESIS
Approach 1: Brookhaven National Laboratory (BNL) Low Temperature Liquid Phase
methanol synthesis (BNL-LTLP)
Literature review
19
Brookhaven National Laboratory(BNL) proposed a concurrent tandem catalytic system
to produce methanol from syngas with H2/CO ratio of 2 at preferred operating
temperature ranges between 80 - 120 °C and pressure range between 1 - 5 MPa [62], [63],
[68]. The catalytic system consists of NaH, RONa (where R is alkyl group containing 1 - 6
carbon atoms) and M(OAc)2 (where M is Ni, Pd and Co). About 74 % methanol conversion
is obtained at 5.17 MPa and 100 °C. The active catalysts in the system were alkali alkoxide
and Ni(CO)4, which were confirmed by X-ray absorption fine structure (XAFS) analysis
[69], [70]. The reaction rate obtained is five times faster with K alkoxide than Na alkoxide,
and methoxide is a preferred alkoxide ion in the system. Therefore, KOCH3 was selected
as the alkali alkoxide catalyst due to its affordability/availability as well as pronounced
catalysis performance [71]–[73]. The addition of polar solvent, such as
tetrahydrofuran(THF), 1,4-dioxide, triglyme, polyethylene glycol, DMSO, 2-
hydroxybenzothiazole and pyridine, can enhance the methanol conversion and
selectivity [71], [73]–[76]. CO2, dimethyl ether, water and alkali formate were detected
as by-products and the introduction of trace amount of CO2 could deactivate the catalyst
system [71]–[73]. The reaction kinetics using Ni(CO)4/KOCH3 was determined by Wegrzy
et al. and Mahajan et al. over a temperature range between 343.15 K and 393.15 K [73].
By increasing the reaction temperature from 110 to 160 °C, the space time yield (STY)
can also be increased by 5.6 times, resulting in 0.95 kg methanol/L·hr. This STY is higher
than that of ICI commercial methanol production with only 0.5 - 0.77 kg methanol/L·hr
and lower temperature input.
Due to the toxic nature of Ni(CO)4, it has become necessary to find alternatives to avoid
cumbersome handling of the reaction solutions during methanol synthesis. Ni salts,
including NiCl2, NiSO4, Ni(acac)2 and Ni(PPh3)(CO)3 were found to be the good

Literature review
20
replacement for Ni(CO)4 for low temperature methanol synthesis, and they were
converted into new active forms that functionalise as catalysts in the process [77], [78].
Mahajan et al. found that 8.9 mol methanol/L catalyst·hr can be achieved when Ni-
salts/base in triglyme/methanol solution was applied at 130 °C and 4 MPa under
continuous 5 % N2 in syngas flow conditions [78]. This result agreed with the commercial
catalysts that yields an equivalent rate of 6 mol methanol/L catalyst·hr at 5 MPa and 250
°C with syngas [79]. In addition to nickel salts, Raney nickel also showed a good catalytic
performance compared with Ni(CO)4. However, the high costs of the catalysts make this
kind of catalysts hard to be applicable in the industry. In addition, since the catalysts are
soluble in the reactants, it is difficult to purify the final products and recycle the catalysts
for further usage.
Approach 2: Low temperature methanol synthesis using low grade syngas (MS-LT)
Low grade syngas is the syngas which contains significant amount of CO2. Tsubaki et al.
postulated a new approach for liquid phase methanol synthesis using the conventional
catalyst of gas phase methanol synthesis - Cu/ZnO/Al2O3 that can tolerate the presence
of traces of CO2 and H2O [66], [67]. The new system effectively showed higher conversion,
and more methanol yield at lower temperature than conventional gas phase methanol
synthesis. The active sites of Cu/ZnO/Al2O3 catalyst for methanol synthesis is not only
metallic Cu but also Cu-Zn site as they both work synergistically to catalyse the methanol
synthesis reactions [80]. Alcohol is required to be present in the low grade syngas system,
and studies showed that the conversion to methanol decreased with increasing carbon
number of alcohol molecules and the secondary alcohols performed the highest activity
with highest conversions [81], [82]. A STY of 0.17 kg methanol/L·hr was obtained when
n-butanol was applied as the promoter at 170 °C and 3 MPa, exhibiting the highest activity.
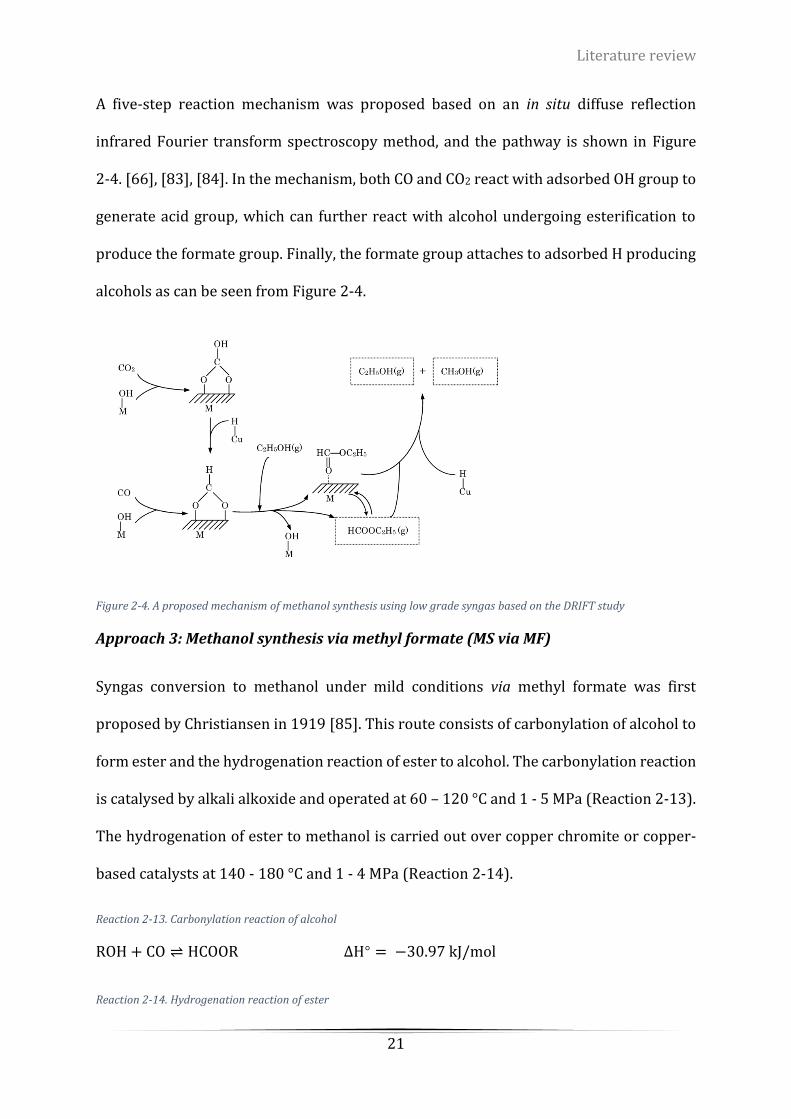
Literature review
21
A five-step reaction mechanism was proposed based on an in situ diffuse reflection
infrared Fourier transform spectroscopy method, and the pathway is shown in Figure
2-4. [66], [83], [84]. In the mechanism, both CO and CO2 react with adsorbed OH group to
generate acid group, which can further react with alcohol undergoing esterification to
produce the formate group. Finally, the formate group attaches to adsorbed H producing
alcohols as can be seen from Figure 2-4.
Figure 2-4. A proposed mechanism of methanol synthesis using low grade syngas based on the DRIFT study
Approach 3: Methanol synthesis via methyl formate (MS via MF)
Syngas conversion to methanol under mild conditions via methyl formate was first
proposed by Christiansen in 1919 [85]. This route consists of carbonylation of alcohol to
form ester and the hydrogenation reaction of ester to alcohol. The carbonylation reaction
is catalysed by alkali alkoxide and operated at 60 – 120 °C and 1 - 5 MPa (Reaction 2-13).
The hydrogenation of ester to methanol is carried out over copper chromite or copper-
based catalysts at 140 - 180 °C and 1 - 4 MPa (Reaction 2-14).
Reaction 2-13. Carbonylation reaction of alcohol
ROH + CO ⇌ HCOOR ∆H° = −30.97 kJ/mol
Reaction 2-14. Hydrogenation reaction of ester
Literature review
22
HCOOR + H2 ⇌ ROH + CH3OH ∆H° = −52.6 kJ/mol
This approach is characterised by low temperature and liquid phase operating conditions.
The temperature of both reactions is lower than that in traditional gas phase methanol
synthesis. The low operating temperature reduces the thermodynamic limitation and
thus yields higher process conversion. Also, the liquid phase condition allows efficient
heat transfer and hence better temperature control.
Both the two-step process and the concurrent process have been studied in literature
intensively. The reaction kinetics of both reactions and the combined reactions were
proposed using simple power law expressions [65], [72], [86]–[89]. The hydrogenation
reaction has a slower reaction rate than the carbonylation reaction, and it is reported that
the hydrogenation is the rate limiting reaction when two reactions were carried out
simultaneously [72], [86]. The operating temperature ranges are 60 - 100 °C and 120 -
180 °C for the carbonylation reaction and hydrogenation reaction, respectively. Hence a
higher temperature range of 150 to 180 °C was selected for concurrent methanol
synthesis [89]. Alkali formate, CO2 and dimethyl ether were detected in the product of the
carbonylation reaction and CO was identified in the hydrogenation reaction products
[86], [90], [91]. The reaction mechanisms were also proposed for the methanol synthesis
via the methyl formate approach [90].
Comparison of methanol synthesis at moderate operating conditions and the
commercial reactions
Table 2-4 summarises the comparison among the three low-temperature (non-
conventional) methanol synthesis approaches and with the conventional methanol

Literature review
23
synthesis. In summary, all three methods are operated efficiently at moderate conditions
compared to the conventional methanol synthesis and to generate more methanol.
Both the BNL process and MS via MF process require pre-treatment steps to remove
water and carbon dioxide to minimize their negative effects on the catalysts. This
purification step is not practically difficult since advanced adsorption process could
effectively remove CO2 and H2O using zeolites or other adsorption materials. In addition,
regeneration of basic catalysts in the BNL process is compulsory. This can be achieved by
either in situ auto-repair or ex situ regeneration. The toxic nature of nickel catalyst is the
drawback of this process that has inhibited its commercialisation. Therefore,
investigating new catalysts, such as metal-salt catalysts, is essential for the BNL process.
In addition, although the process of low grade methanol synthesis is a good option when
a large amount of CO2 contained syngas is used as feed, additional separation processes
are required for the purification of the final product as large amount of the by-product,
esters, is generated at low partial pressure of hydrogen.
Table 2-4. Comparison of three types of non-conventional methanol synthesis processes with conventional methanol synthesis
Processes Advantages Disadvantages Conventional process
• Mature process with desired economic benefits and industrial outputs.
• At least 50 % of syngas must be recycled.
• High pressure and high temperature process
• High operating costs
BNL process
• Low temperature and pressure, so low operating costs
• High conversion • Low operating costs
• Low tolerance to H2O and CO2, pre-treatment of syngas is required.
• Nickel catalyst is environmentally unfriendly.
• The intermediate, Ni(CO)4 is highly toxic.
• Separation base catalysts with final products.
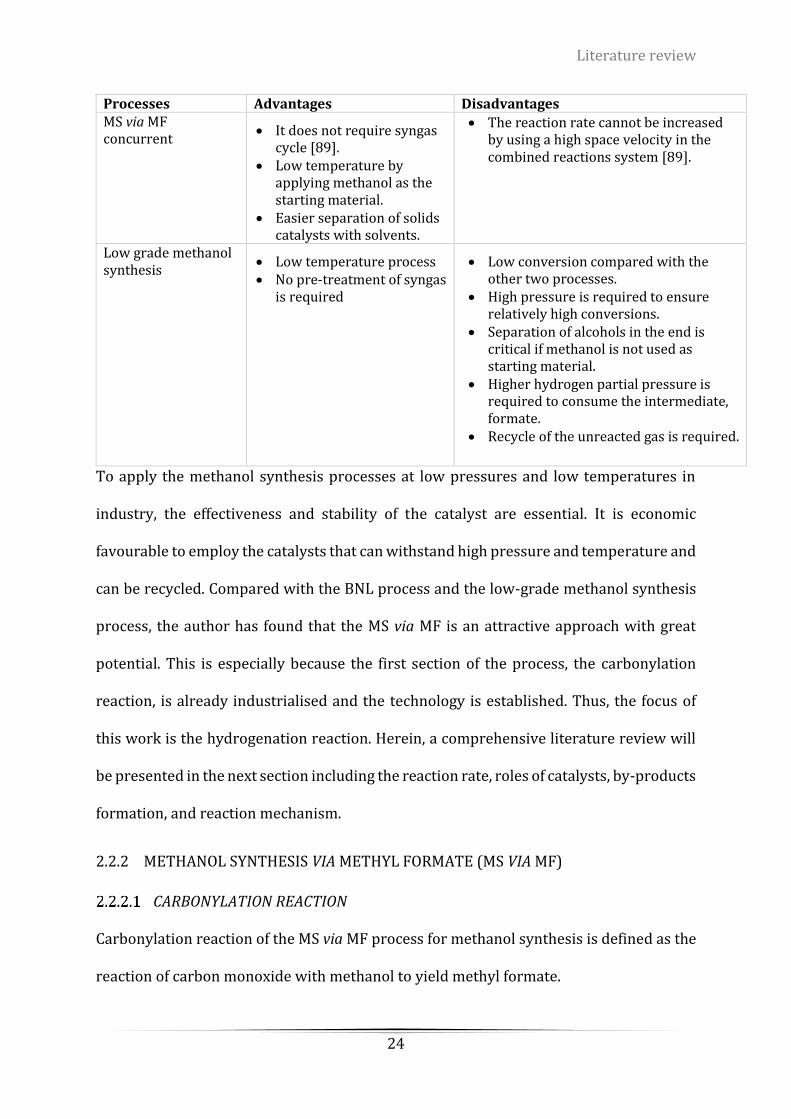
Literature review
24
Processes Advantages Disadvantages MS via MF concurrent
• It does not require syngas cycle [89].
• Low temperature by applying methanol as the starting material.
• Easier separation of solids catalysts with solvents.
• The reaction rate cannot be increased by using a high space velocity in the combined reactions system [89].
Low grade methanol synthesis
• Low temperature process • No pre-treatment of syngas
is required
• Low conversion compared with the other two processes.
• High pressure is required to ensure relatively high conversions.
• Separation of alcohols in the end is critical if methanol is not used as starting material.
• Higher hydrogen partial pressure is required to consume the intermediate, formate.
• Recycle of the unreacted gas is required.
To apply the methanol synthesis processes at low pressures and low temperatures in
industry, the effectiveness and stability of the catalyst are essential. It is economic
favourable to employ the catalysts that can withstand high pressure and temperature and
can be recycled. Compared with the BNL process and the low-grade methanol synthesis
process, the author has found that the MS via MF is an attractive approach with great
potential. This is especially because the first section of the process, the carbonylation
reaction, is already industrialised and the technology is established. Thus, the focus of
this work is the hydrogenation reaction. Herein, a comprehensive literature review will
be presented in the next section including the reaction rate, roles of catalysts, by-products
formation, and reaction mechanism.
2.2.2 METHANOL SYNTHESIS VIA METHYL FORMATE (MS VIA MF)
CARBONYLATION REACTION
Carbonylation reaction of the MS via MF process for methanol synthesis is defined as the
reaction of carbon monoxide with methanol to yield methyl formate.
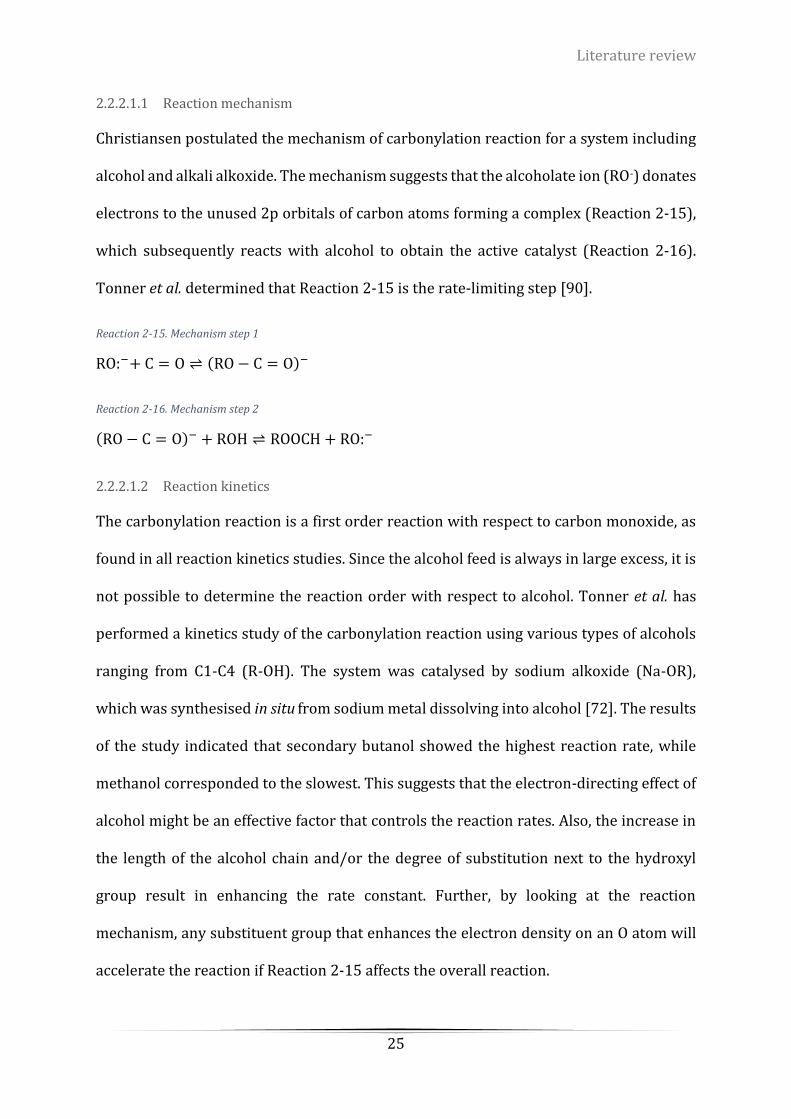
Literature review
25
2.2.2.1.1 Reaction mechanism
Christiansen postulated the mechanism of carbonylation reaction for a system including
alcohol and alkali alkoxide. The mechanism suggests that the alcoholate ion (RO-) donates
electrons to the unused 2p orbitals of carbon atoms forming a complex (Reaction 2-15),
which subsequently reacts with alcohol to obtain the active catalyst (Reaction 2-16).
Tonner et al. determined that Reaction 2-15 is the rate-limiting step [90].
Reaction 2-15. Mechanism step 1
RO:−+ C = O ⇌ (RO − C = O)−
Reaction 2-16. Mechanism step 2
(RO − C = O)− + ROH ⇌ ROOCH + RO:−
2.2.2.1.2 Reaction kinetics
The carbonylation reaction is a first order reaction with respect to carbon monoxide, as
found in all reaction kinetics studies. Since the alcohol feed is always in large excess, it is
not possible to determine the reaction order with respect to alcohol. Tonner et al. has
performed a kinetics study of the carbonylation reaction using various types of alcohols
ranging from C1-C4 (R-OH). The system was catalysed by sodium alkoxide (Na-OR),
which was synthesised in situ from sodium metal dissolving into alcohol [72]. The results
of the study indicated that secondary butanol showed the highest reaction rate, while
methanol corresponded to the slowest. This suggests that the electron-directing effect of
alcohol might be an effective factor that controls the reaction rates. Also, the increase in
the length of the alcohol chain and/or the degree of substitution next to the hydroxyl
group result in enhancing the rate constant. Further, by looking at the reaction
mechanism, any substituent group that enhances the electron density on an O atom will
accelerate the reaction if Reaction 2-15 affects the overall reaction.
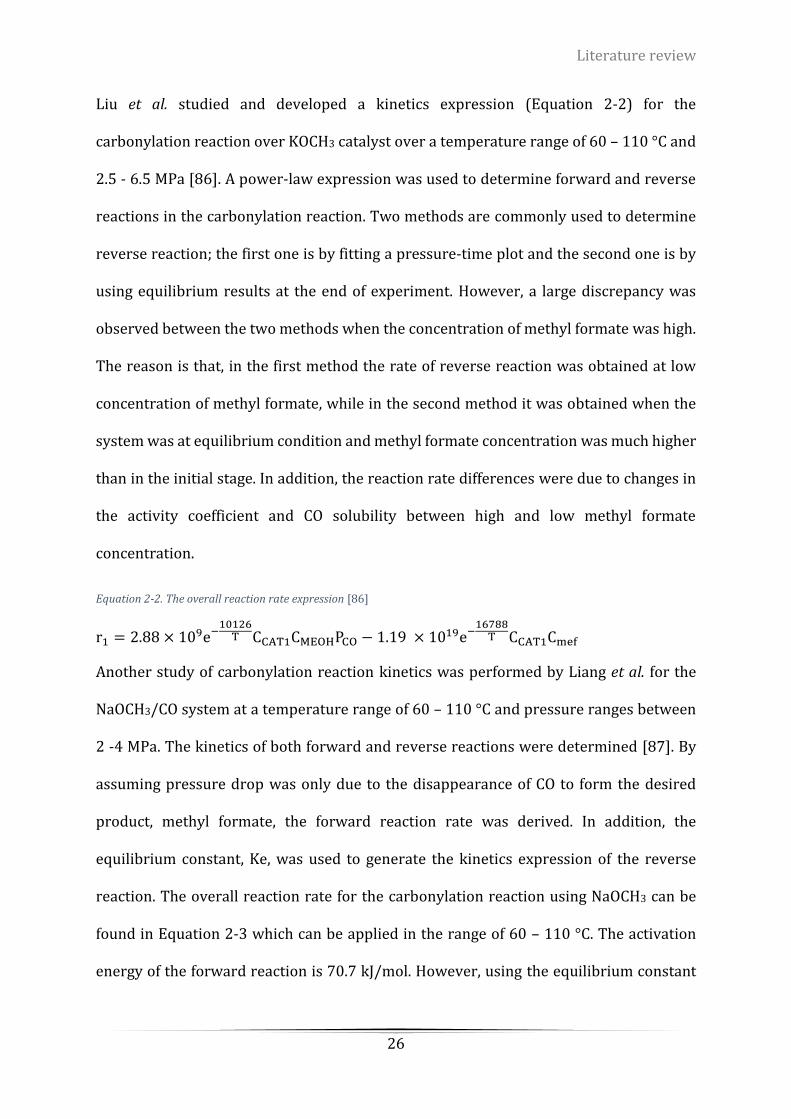
Literature review
26
Liu et al. studied and developed a kinetics expression (Equation 2-2) for the
carbonylation reaction over KOCH3 catalyst over a temperature range of 60 – 110 °C and
2.5 - 6.5 MPa [86]. A power-law expression was used to determine forward and reverse
reactions in the carbonylation reaction. Two methods are commonly used to determine
reverse reaction; the first one is by fitting a pressure-time plot and the second one is by
using equilibrium results at the end of experiment. However, a large discrepancy was
observed between the two methods when the concentration of methyl formate was high.
The reason is that, in the first method the rate of reverse reaction was obtained at low
concentration of methyl formate, while in the second method it was obtained when the
system was at equilibrium condition and methyl formate concentration was much higher
than in the initial stage. In addition, the reaction rate differences were due to changes in
the activity coefficient and CO solubility between high and low methyl formate
concentration.
Equation 2-2. The overall reaction rate expression [86]
r1 = 2.88 × 10⁹e−10126
T CCAT1CMEOHPCO − 1.19 × 10¹⁹e−16788
T CCAT1Cmef
Another study of carbonylation reaction kinetics was performed by Liang et al. for the
NaOCH3/CO system at a temperature range of 60 – 110 °C and pressure ranges between
2 -4 MPa. The kinetics of both forward and reverse reactions were determined [87]. By
assuming pressure drop was only due to the disappearance of CO to form the desired
product, methyl formate, the forward reaction rate was derived. In addition, the
equilibrium constant, Ke, was used to generate the kinetics expression of the reverse
reaction. The overall reaction rate for the carbonylation reaction using NaOCH3 can be
found in Equation 2-3 which can be applied in the range of 60 – 110 °C. The activation
energy of the forward reaction is 70.7 kJ/mol. However, using the equilibrium constant
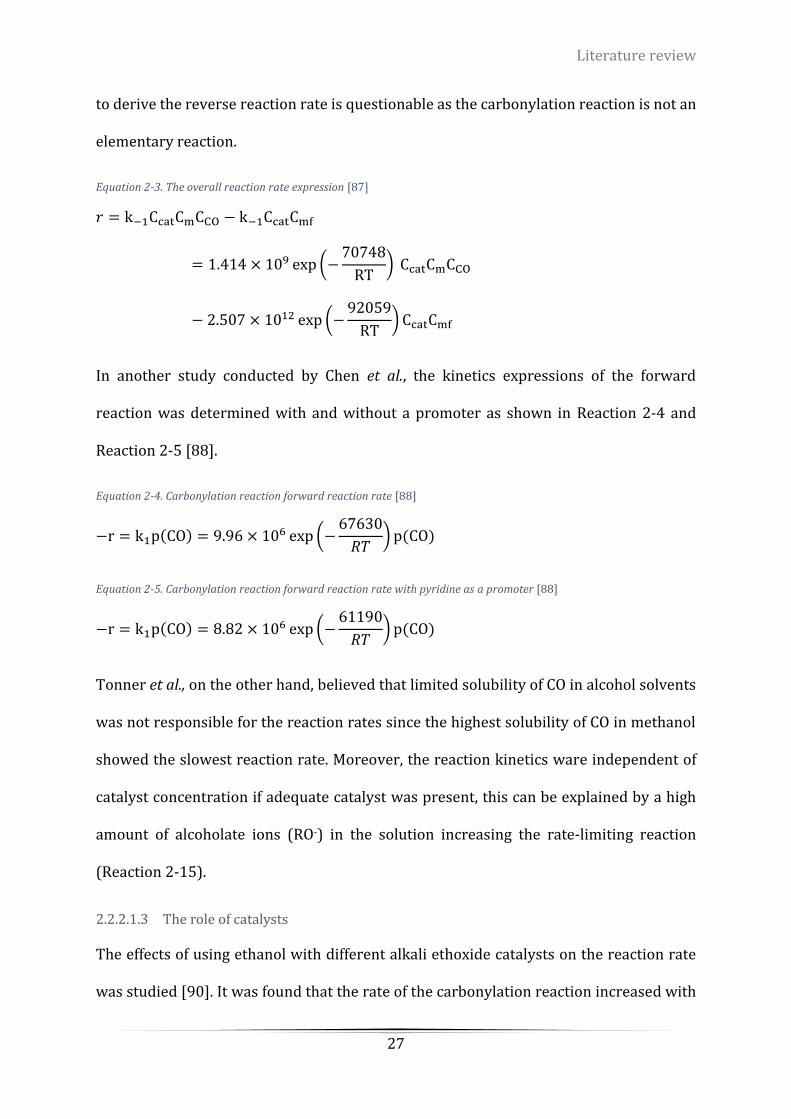
Literature review
27
to derive the reverse reaction rate is questionable as the carbonylation reaction is not an
elementary reaction.
Equation 2-3. The overall reaction rate expression [87]
𝑟 = k−1CcatCmCCO − k−1CcatCmf
= 1.414 × 10⁹ exp (−70748
RT) CcatCmCCO
− 2.507 × 10¹² exp (−92059
RT) CcatCmf
In another study conducted by Chen et al., the kinetics expressions of the forward
reaction was determined with and without a promoter as shown in Reaction 2-4 and
Reaction 2-5 [88].
Equation 2-4. Carbonylation reaction forward reaction rate [88]
−r = k1p(CO) = 9.96 × 10⁶ exp (−67630
𝑅𝑇) p(CO)
Equation 2-5. Carbonylation reaction forward reaction rate with pyridine as a promoter [88]
−r = k1p(CO) = 8.82 × 10⁶ exp (−61190
𝑅𝑇) p(CO)
Tonner et al., on the other hand, believed that limited solubility of CO in alcohol solvents
was not responsible for the reaction rates since the highest solubility of CO in methanol
showed the slowest reaction rate. Moreover, the reaction kinetics ware independent of
catalyst concentration if adequate catalyst was present, this can be explained by a high
amount of alcoholate ions (RO-) in the solution increasing the rate-limiting reaction
(Reaction 2-15).
2.2.2.1.3 The role of catalysts
The effects of using ethanol with different alkali ethoxide catalysts on the reaction rate
was studied [90]. It was found that the rate of the carbonylation reaction increased with

Literature review
28
the order of K>Na>Li. As Reaction 2-15 determines the overall carbonylation reaction,
the formation of alcoholate ion (RO-) is dependent on the ionization potential of the alkali
metal. The ionization potential of metal alkali K, Na and Li, are 4.31 V, 5.12 V and 5.36 V
respectively. Hence, a fast carbonylation reaction rate was observed when potassium
ethoxide was used. In addition, higher reaction rates were obtained using
KOCH3/methanol compared to NaOCH3/methanol system, which indirectly indicates the
higher catalytic activity of KOCH3 and the important role of alcoholate ions in the reaction
as discussed earlier [86].
2.2.2.1.4 Role of promoters
In order to improve the carbonylation reaction rate, several solvents were added to the
reaction system and their effects were investigated. It was found that in the presence of
a solvent, or as named a promoter, like pyridine, the carbonylation reaction rate was
enhanced more than 1.5 times that in the absence of the promoter [88], [92]. No
explanation was given, and no fundamental studies have been conducted to identify the
reasons behind the positive effects of the promotors. However, adding promoters could
increase the subsequent difficulty in product separation.
2.2.2.1.5 By-products formation
Traces of alkali formate was detected in the product of the carbonylation reaction as
proposed by Tonner et al. and Liu et al. [72], [86]. Possible reactions, such as Reaction
2-17 or Reaction 2-18 might result in the formation of alkali formate [90]. Also, traces
amount of CO2, and dimethyl ether were detected as by-products. The by-product
formation increased with reaction temperature and reaction time [86].
Reaction 2-17. Formation of sodium formate [90]
HCOOR + RONa ⇌ R2O + HCOONa
Literature review
29
Reaction 2-18. Formation of sodium formate [90]
NaOH + HCOOR ⇌ HCOONa + ROH
The effect of CO2 on the carbonylation reaction was investigated at 70 °C. No reaction was
observed after purging CO2 into the system. It is evident that CO2 has a significant
consequence on the carbonylation reaction, and the probable reason could be
deactivation of the catalysts by CO2 to generate CH3OCOOK as shown in Reaction 2-19.
Reaction 2-19. Catalyst deactivation by CO2
CO2 + CH3OK ⇌ CH3OCOOK
HYDROGENATION REACTION
Hydrogenation or sometimes called the hydrogenolysis reaction, is the second stage of
methanol synthesis via the methyl formate approach. In this reaction methyl formate
reacts with H2 to form methanol. Various heterogeneous copper-based catalysts have
been tested in both gas phase and liquid phase systems in a slurry reactor. The following
discussion covers this reaction.
2.2.2.2.1 Reaction kinetics
The kinetics expression of the hydrogenation reaction was performed by Monti et al.
(Equation 2-6) with regards to the concentration of methyl formate, hydrogen pressure
and catalysts concentration in the temperature range of 408 and 473 K. The activation
energy was determined to be 62.4 ± 0.2 kJ/mol at a hydrogen pressure of 4.5 MPa [65]. A
modified kinetic expression for the hydrogenation reaction was determined in the
presence of CO (P > 80 kPa) and at a temperature of 446 K (Equation 2-7).
In addition, the effects of mass transfer (controlled by agitation speed) on reaction rate
was determined. It was found that the reaction rate was not subject to mass transfer
limitations when the catalyst concentration was above 20 g/L [65].
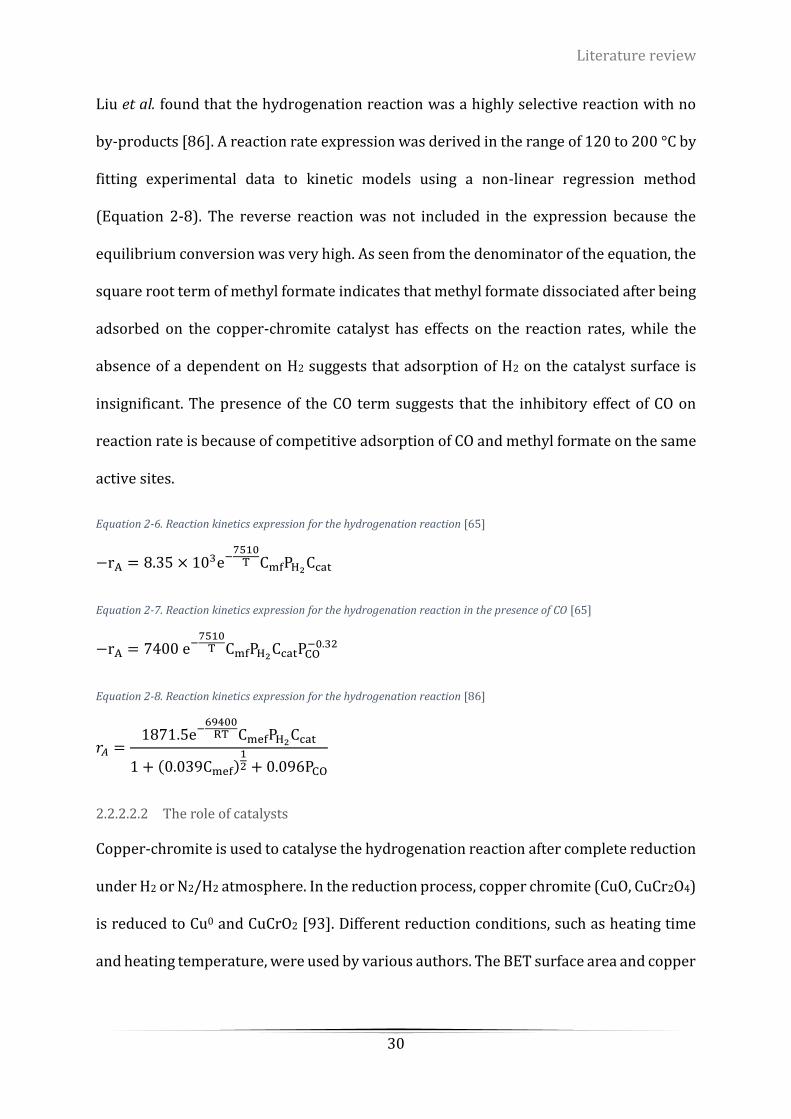
Literature review
30
Liu et al. found that the hydrogenation reaction was a highly selective reaction with no
by-products [86]. A reaction rate expression was derived in the range of 120 to 200 °C by
fitting experimental data to kinetic models using a non-linear regression method
(Equation 2-8). The reverse reaction was not included in the expression because the
equilibrium conversion was very high. As seen from the denominator of the equation, the
square root term of methyl formate indicates that methyl formate dissociated after being
adsorbed on the copper-chromite catalyst has effects on the reaction rates, while the
absence of a dependent on H2 suggests that adsorption of H2 on the catalyst surface is
insignificant. The presence of the CO term suggests that the inhibitory effect of CO on
reaction rate is because of competitive adsorption of CO and methyl formate on the same
active sites.
Equation 2-6. Reaction kinetics expression for the hydrogenation reaction [65]
−rA = 8.35 × 10³e−7510
T CmfPH2Ccat
Equation 2-7. Reaction kinetics expression for the hydrogenation reaction in the presence of CO [65]
−rA = 7400 e−7510
T CmfPH2CcatPCO
−0.32
Equation 2-8. Reaction kinetics expression for the hydrogenation reaction [86]
𝑟𝐴 =1871.5e−
69400RT CmefPH2
Ccat
1 + (0.039Cmef)12 + 0.096PCO
2.2.2.2.2 The role of catalysts
Copper-chromite is used to catalyse the hydrogenation reaction after complete reduction
under H2 or N2/H2 atmosphere. In the reduction process, copper chromite (CuO, CuCr2O4)
is reduced to Cu0 and CuCrO2 [93]. Different reduction conditions, such as heating time
and heating temperature, were used by various authors. The BET surface area and copper

Literature review
31
surface area of G-89 (Nissan Girdler Catalysts Company, Ltd) copper chromite after
reduction was reported to be 24.8 m2/g and 4.9 m2/g, respectively [65].
2.2.2.2.3 By-products formation
It has been reported that in gas phase hydrogenation reactions, the undesired
decarbonylation reaction can take place, producing CO as a by-product (Reaction 2-20).
The production of CO exhibits a negative effect on the system as it inhibits the
hydrogenation reaction by replacing the adsorbed hydrogen on the catalyst surface and
causes catalytic deactivation especially when the hydrogenation reaction is carried out in
the gas phase at atmospheric pressure [91].
Reaction 2-20. De-carbonylation reaction
HCOOCH3 ⇌ CH3OH + CO
In order to investigate the influence of CO on the liquid-phase hydrogenation reaction, a
number of experiments were carried out with different concentrations of CO in the
system [65]. It was found that the effects of the added CO is inhibition of kinetics rather
than progressive catalyst poisoning or thermodynamic equilibrium restriction.
Therefore, poisoning of copper chromite catalysts was not the case in liquid phase
hydrogenation reaction. However, Liu et al. observed that the existence of CO reduced the
hydrogenation reaction rate, while such deleterious effects can be partially restored
when CO was removed [86]. In addition to CO, CO2 was also found to be a factor that
caused catalyst deactivation and such an effect cannot be reversed [86] and CO2 is
thought to poison the catalyst.
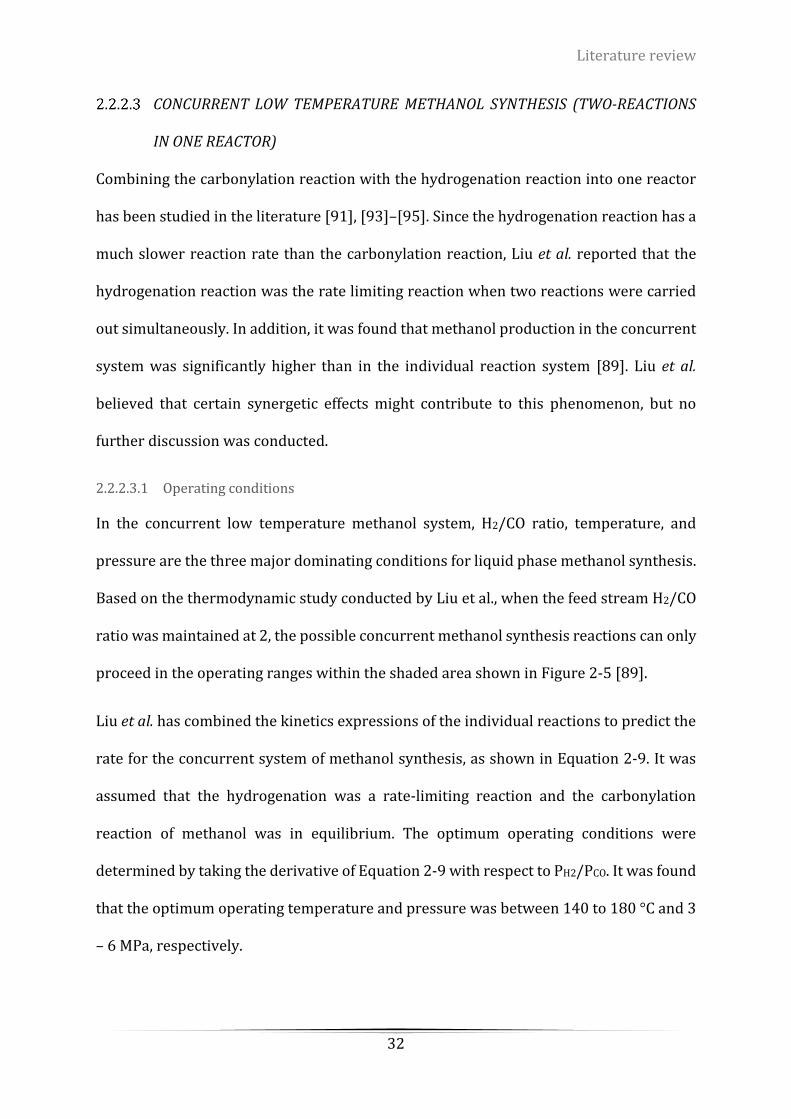
Literature review
32
CONCURRENT LOW TEMPERATURE METHANOL SYNTHESIS (TWO-REACTIONS
IN ONE REACTOR)
Combining the carbonylation reaction with the hydrogenation reaction into one reactor
has been studied in the literature [91], [93]–[95]. Since the hydrogenation reaction has a
much slower reaction rate than the carbonylation reaction, Liu et al. reported that the
hydrogenation reaction was the rate limiting reaction when two reactions were carried
out simultaneously. In addition, it was found that methanol production in the concurrent
system was significantly higher than in the individual reaction system [89]. Liu et al.
believed that certain synergetic effects might contribute to this phenomenon, but no
further discussion was conducted.
2.2.2.3.1 Operating conditions
In the concurrent low temperature methanol system, H2/CO ratio, temperature, and
pressure are the three major dominating conditions for liquid phase methanol synthesis.
Based on the thermodynamic study conducted by Liu et al., when the feed stream H2/CO
ratio was maintained at 2, the possible concurrent methanol synthesis reactions can only
proceed in the operating ranges within the shaded area shown in Figure 2-5 [89].
Liu et al. has combined the kinetics expressions of the individual reactions to predict the
rate for the concurrent system of methanol synthesis, as shown in Equation 2-9. It was
assumed that the hydrogenation was a rate-limiting reaction and the carbonylation
reaction of methanol was in equilibrium. The optimum operating conditions were
determined by taking the derivative of Equation 2-9 with respect to PH2/PCO. It was found
that the optimum operating temperature and pressure was between 140 to 180 °C and 3
– 6 MPa, respectively.
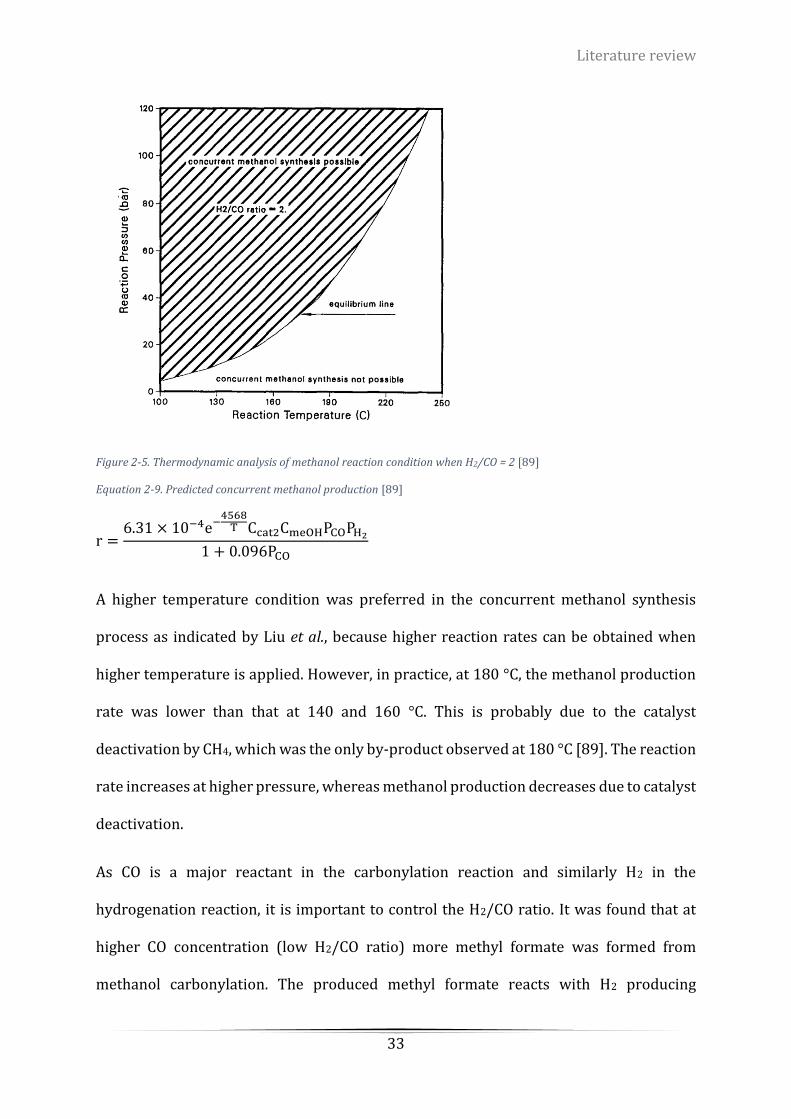
Literature review
33
Figure 2-5. Thermodynamic analysis of methanol reaction condition when H2/CO = 2 [89]
Equation 2-9. Predicted concurrent methanol production [89]
r =6.31 × 10⁻⁴e−
4568T Ccat2CmeOHPCOPH2
1 + 0.096PCO
A higher temperature condition was preferred in the concurrent methanol synthesis
process as indicated by Liu et al., because higher reaction rates can be obtained when
higher temperature is applied. However, in practice, at 180 °C, the methanol production
rate was lower than that at 140 and 160 °C. This is probably due to the catalyst
deactivation by CH4, which was the only by-product observed at 180 °C [89]. The reaction
rate increases at higher pressure, whereas methanol production decreases due to catalyst
deactivation.
As CO is a major reactant in the carbonylation reaction and similarly H2 in the
hydrogenation reaction, it is important to control the H2/CO ratio. It was found that at
higher CO concentration (low H2/CO ratio) more methyl formate was formed from
methanol carbonylation. The produced methyl formate reacts with H2 producing
Literature review
34
methanol, therefore, the production rate increases. However, with excess CO, catalyst
deactivation is inevitable. The optimal ratio, on the other hand, cannot be determined
because of the effect of the other reaction factors including temperature, pressure and
catalysts loading.
2.2.2.3.2 Combination of catalysts
Palekar et al. investigated the concurrent methanol system experimentally at 150 °C and
5 MPa [93]. The alkali methoxide and copper chromite, which were used to catalyze the
carbonylation reaction and hydrogenation reaction were combined and fed into the
reactor [93]. Between the two reactions, the hydrogenation reaction is the rate-limiting
reaction because its rate is two orders of magnitude lower than the carbonylation
reaction [86]. The results showed that methanol production rate was higher than the
hydrogenation reaction alone, which suggested that a synergistic behaviour of the two
reactions was taking place [93]. In addition, better tolerance to the presence of CO2 and
H2O was observed in the concurrent systems when the operating temperature was above
100 °C [89], [93].
Since the catalyst, KOCH3, used solely for the carbonylation reaction deactivates
gradually, it is suggested that the addition of the copper chromite contributes to
regeneration of the deactivated catalyst. A proposed mechanism of the catalyst
regeneration was put forward and further proved by several experiments using alkali
carbonate, formate, hydroxide and bicarbonates with copper chromite [88]. Therefore, a
synergistic effect between KOCH3 and copper-chromite leads to a higher rate of methanol
production in the concurrent synthesis [93], [95].
In a study conducted by Liu et al., it was found that methanol production decreased with
increasing the concentration of potassium methoxide. This is probably due to the
Literature review
35
blockage of the active sites on copper chromite surface by the alkali ions and methoxide
ions block, and this phenomenon is so called alkali site blocking [95]. Thus, different alkali
methoxides were used with copper chromite to determine the effects of alkali site
blocking. It was found that potassium methoxide provided the highest methanol
synthesis rates, however, the reasons were not clearly identified. The conversion rate of
methyl formate increases from sodium to cesium, or in another words, with decreasing
the ionization potential of alkali metals [72]. With regard to rubidium methoxides and
cesium methoxides, the methanol production rate is very small. This is probably due to
the large size of rubidium and cesium ions that occupy more hydrogenation sites on the
catalyst surface decreasing the methanol production rate. Alkaline earth methoxides can
also be used as catalysts for methanol synthesis, however they showed lower methanol
production rate than that of alkali methoxides [95].
There is a conflict in regard to identification of copper chromite active sites. Palekar et al.
believed that it was likely that Cu+ is the active species in the concurrent synthesis [93].
However, there are other research groups who propose that Cu2+, Cu0 on CuCr2O4, Cu0 on
or mixed with Cr2O3 , Cu2O or CuO on CuCr2O4 or Cu0 on Cu2Cr2O4 can be the active species
[93].
Ohyama compared the performance of several copper-based catalysts along with KOCH3.
His results indicated that the commercial catalysts N203SD and G-89, and copper
chromite showed activity for methanol synthesis, particularly, N203SD which exhibited
the highest space time yield (STY) [96]. CuO/ZnO based catalysts including KMB and
G668 showed no catalytic activity for the hydrogenation reaction, which agrees with the
results shown by Palekar et al. [95]. In addition, methanol is only produced when both
Literature review
36
CuO and Cr2O3 are employed, suggesting that the active site for hydrogenation reaction
might be obtained by mixing CuO and Cr2O3.
2.2.2.3.3 High selectivity for methanol over DME, water and CO2
Small numbers of by-products were observed and identified such as CO2, DME and H2O,
which were the same by-products observed with the carbonylation reaction [93]–[95],
[97]. The concentration of by-products increased at higher temperature. Methane, for
example, was detected as by-product when temperature was increased to 180 °C. In the
concurrent reaction system, the overall reaction rate was observed to be considerably
lower than predicted. This was attributed to the presence of methane which might
deactivate the catalyst [89]. Although the negative effect of CO2 on concurrent methanol
production has been observed, the addition of CO2 can significantly reduce the formation
of by-products, i.e. DME formation [98].
ADVANTAGES OF THE CON-CURRENT METHANOL SYNTHESIS COMPARED TO
THE INDIVIDUAL REACTIONS
Liu et al. summarised two major advantages with bringing the two reactions together in
one reactor [98]. These advantages include higher methanol production and enhanced
tolerance to CO2. At 140 and 160 °C, the concurrent synthesis (two reactions at once) gave
80 and 50 % higher yield respectively than the separate carbonylation and hydrogenation
[98]. It was found that the non-reversible poisoning effect of CO2 on CH3OK had
significantly reduced and become reversible in the con-current methanol synthesis. Liu
et al. attributed this synergistic effect to the interaction between the two catalysts in the
system. The homogeneous catalysts (CH3OK) and its ionic form (CH3O-) are adsorbed on
the copper chromite surface and compete for the same active sites as CO, CO2 and H2O,
which results in a higher methanol reaction rate.

Literature review
37
2.3 SOLUBILITY IN GAS-LIQUID PHASE
The reactants involved in the current research are gas and liquid phases. Since the
reaction takes place in the liquid phase (where the catalyst is), the gas reactant must first
be contacted with the liquid and dissolve the liquid reactant. During the solid catalytic
process, gas and liquid reactants must diffuse or move to the catalyst surface to trigger
the reactions.
Therefore, the solubility of the reactants will affect the movement from phase to phase,
which means the reaction rate can be influenced by mass transfer. To understand gas-
liquid solubility at the typical reaction operating conditions, a short review will be
provided based on the fundamental experimental and modelling works for the proposed
fluid systems.
2.3.1 DEFINITION OF SOLUBILITY
According to the official IUPAC nomenclature, the definition of solubility is: the analytical
composition of a saturated solution expressed as a proportion of a designated solute in a
designated solvent.
The term ‘saturated’ refers to equilibrium of vaporization and dissolution of solute in the
solvent like CO and/or H2 gas in methanol and/or methyl formate liquid. In general, we
are concerned with the liquid mixture which at temperature and pressure is in
equilibrium with a vapour mixture at the same conditions. Thus, if a gaseous phase and a
liquid phase are in equilibrium, then for component i in the mixture, the condition of
thermodynamic equilibrium is given by Equation 2-10.
Equation 2-10.Thermodynamic equilibrium of the fugacity in gas phase and liquid phase
fiV = fi
L
Literature review
38
In the following discussion, we will only focus on the pure gas in pure liquids and neglect
effects due to the surface tension, gravitation, electric or magnetic fields, semipermeable
membranes, or any other special conditions.
2.3.2 FUGACITY OF THE SYSTEM
The fugacity of a component in a mixture depends on the temperature, pressure and
composition of the mixture.
With respect to the vapour phase, the composition is expressed by the mole fraction y.
The fugacity of i in the vapour 𝑓𝑖𝑉 can be related to temperature, pressure and mole
fraction by the fugacity coefficient, ϕi is expressed by Equation 2-11.
Equation 2-11. The equation of the fugacity coefficient
ϕi =fi
V
yiP
The fugacity coefficient, ϕi, is normalised by the partial pressure of component i, which
in turn, as P approaches to 0, ϕi tends to 1. Therefore, at low pressure, it is usually a good
assumption to set ϕi = 1. The term ‘low’ depends on the mixture system. For typical
mixtures of nonpolar (or slightly polar) fluids at a temperature near or above the normal
boiling temperature of the least volatile component, ‘low’ pressure means a pressure less
than a few bars. For mixtures containing one component of very low volatility and
another of high volatility, the fugacity coefficient of the light component may be close to
unity for pressures up to 1 – 2 MPa.
Regarding the liquid phase, the fugacity of component i in liquid phase is related to the
composition of that phase through the activity coefficient, γi . Like the vapour phase
situation, the mole fraction of component i in the liquid phase, x, is usually used to
Literature review
39
describe the fugacity of components in that phase. The relationship between fugacity in
the liquid phase and mole fraction can be determined by Equation 2-12.
Equation 2-12. The equation of activity coefficient
γi =ai
xi=
fiL
xifi0
Where 𝑓𝑖0 is the standard-state fugacity of component i (sometimes, it refers to the
reference state) and ai is the activity of component i. For most cases, activity coefficients
for solutions contained nonelectrolytes are based on a standard state, for every
component i, 𝑓𝑖0 is the fugacity of pure liquid i at system temperature and pressure, that
is to say, the pressure is the total pressure and the composition is 1.
2.3.3 SOLUBILITY LITERATURE DATA REVIEW
The system of liquid phase methanol synthesis involves two types of reactions;
carbonylation of methanol to methyl formate and hydrogenation of methyl formate to
methanol (Reaction 2-21 and Reaction 2-22).
Reaction 2-21. Carbonylation reaction
CH3OH + CO ⇌ CH3OCOH
Reaction 2-22. Hydrogenation reaction
CH3OCOH + 2H2 ⇌ 2CH3OH
Initially CO gas is fed to a reactor containing liquid methanol at a desired temperature
and pressure. Every one mole of CO reacts with one mole of methanol generating one
mole of methyl formate. Thereafter H2 is fed to the system where one mole of methyl
formate reacts with two moles of H2 producing two moles of methanol. Therefore, to
investigate those reactions and comprehend the role of feed gas solubility in liquid phase
components in the system, four major liquid-gas systems need to be studied including
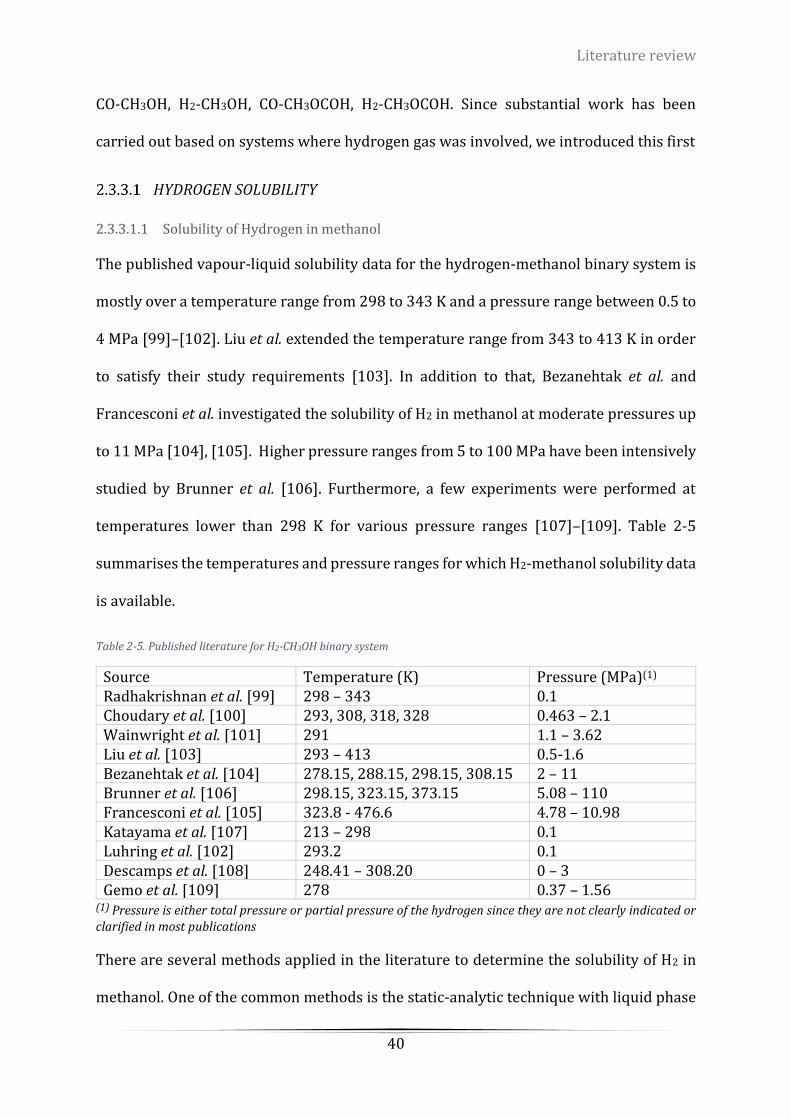
Literature review
40
CO-CH3OH, H2-CH3OH, CO-CH3OCOH, H2-CH3OCOH. Since substantial work has been
carried out based on systems where hydrogen gas was involved, we introduced this first
HYDROGEN SOLUBILITY
2.3.3.1.1 Solubility of Hydrogen in methanol
The published vapour-liquid solubility data for the hydrogen-methanol binary system is
mostly over a temperature range from 298 to 343 K and a pressure range between 0.5 to
4 MPa [99]–[102]. Liu et al. extended the temperature range from 343 to 413 K in order
to satisfy their study requirements [103]. In addition to that, Bezanehtak et al. and
Francesconi et al. investigated the solubility of H2 in methanol at moderate pressures up
to 11 MPa [104], [105]. Higher pressure ranges from 5 to 100 MPa have been intensively
studied by Brunner et al. [106]. Furthermore, a few experiments were performed at
temperatures lower than 298 K for various pressure ranges [107]–[109]. Table 2-5
summarises the temperatures and pressure ranges for which H2-methanol solubility data
is available.
Table 2-5. Published literature for H2-CH3OH binary system
Source Temperature (K) Pressure (MPa)(1)
Radhakrishnan et al. [99] 298 – 343 0.1 Choudary et al. [100] 293, 308, 318, 328 0.463 – 2.1 Wainwright et al. [101] 291 1.1 – 3.62 Liu et al. [103] 293 – 413 0.5-1.6 Bezanehtak et al. [104] 278.15, 288.15, 298.15, 308.15 2 – 11 Brunner et al. [106] 298.15, 323.15, 373.15 5.08 – 110 Francesconi et al. [105] 323.8 - 476.6 4.78 – 10.98 Katayama et al. [107] 213 – 298 0.1 Luhring et al. [102] 293.2 0.1 Descamps et al. [108] 248.41 – 308.20 0 – 3 Gemo et al. [109] 278 0.37 – 1.56
(1) Pressure is either total pressure or partial pressure of the hydrogen since they are not clearly indicated or clarified in most publications
There are several methods applied in the literature to determine the solubility of H2 in
methanol. One of the common methods is the static-analytic technique with liquid phase

Literature review
41
recirculation and online gas chromatography where the sampling was achieved through
rotating sampling valves [101], [104], [108]. However, the sampling valve for liquid
recirculation line poses a problem of introducing some of the carrier gas when switching
the valve between vapour and liquid samples. Also, the sampling valve for the vapour
products requires a great deal of attention to eliminate the pressure drop and obtain
reliable samples.
Liu et al. and Gemo et al. utilized a synthetic method with total pressure measurement at
the desired temperature (figures can be found in Table 2-5). In this method, H2 is injected
into an autoclave loaded with methanol until the pressure inside the autoclave reaches
the desired level at which point stirring starts. The amount of absorbed H2 was
determined by the pressure change between pressure before and after stirring [103],
[109]. The ideal gas law was applied to evaluate the number of moles of both solutes and
solvents. The drawback of this method is the uncertainty of the amount of H2 absorbed in
the methanol before stirring. The quantity determined in such a methodology would be
usually underestimated.
Francesconi et al. applied a similar method to measure hydrogen solubility in alcohols
[105]. However, in this work a more sophisticated procedure is used to calculate the
number of H2 moles in the liquid phase. More details are provided in the modelling
section (section 2.3.4). Descamps et al. applied both synthetic methods and static-analytic
method to the H2-methanol binary system at 298 K to compare the outcomes of the two
methods and to identify the consistency of those two techniques. They have found that
the results from both methods are similar, which means both methods can be used
reliably for in the solubility measurements [108].

Literature review
42
The method employed by Radhakrishnan et al. and Choudary et al. is to saturate methanol
with hydrogen at a desired temperature and pressure in an autoclave [99], [100]. After
saturation, a known amount of saturated liquid sample was transferred to a burette,
where the dissolved hydrogen gas was desorbed/released to the atmosphere. The
volume of desorbed hydrogen can be determined at atmospheric pressure. The drawback
of this method is only single point at specific temperature and pressure can be
determined in every experiment to ensure the accuracy of the results. Katayama et al. also
determined the volume of solvent and vapour phase to measure the solubility of H2 in
methanol by using a static method with mercury displacement [107]. Nevertheless, such
a method can be used for the determination of gas solubility at low temperature due to
the limitations of the equipment.
Figure 2-6 and Figure 2-7 display P-x diagrams of available literature solubility data at
approximately 295 K and a pressure range from 0.5 to 100 MPa. To ensure the unit
consistency, some data points in Figure 2-6 have been converted from the raw literature
data. As can be seen in Figure 2-6, the solubility data of H2 in methanol is in a good
agreement for many researchers except Choudhary’s work, even though different
experimental procedures and methodology were applied. Since the method applied by
Choudhary et al. suffers of limitations in determining the solubility, no other solubility
work performed after 1986 used their procedure. At high pressure, the results from both
Bezanehtak et al. and Brunner et al. are almost overlapping, which provides a good
guideline for the current research. The results indicate that with pressure increase, the
solubility of hydrogen in methanol increases linearly as expected, in accordance with
Henry’s law.
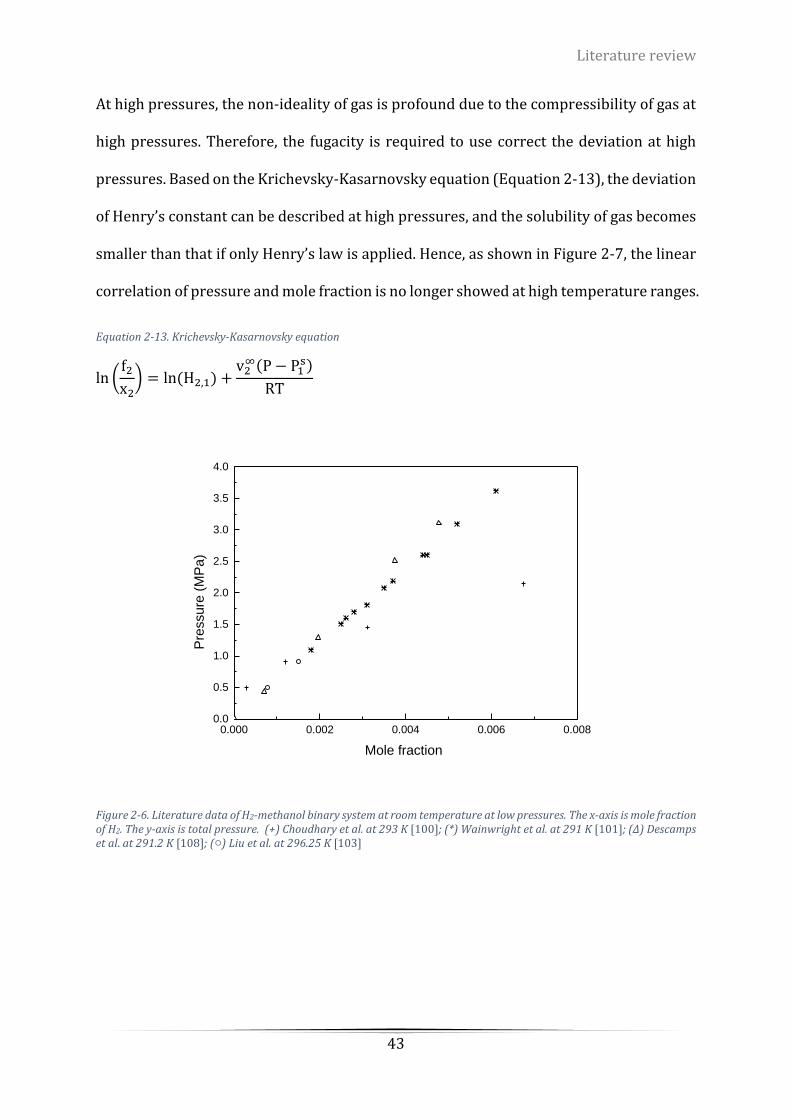
Literature review
43
At high pressures, the non-ideality of gas is profound due to the compressibility of gas at
high pressures. Therefore, the fugacity is required to use correct the deviation at high
pressures. Based on the Krichevsky-Kasarnovsky equation (Equation 2-13), the deviation
of Henry’s constant can be described at high pressures, and the solubility of gas becomes
smaller than that if only Henry’s law is applied. Hence, as shown in Figure 2-7, the linear
correlation of pressure and mole fraction is no longer showed at high temperature ranges.
Equation 2-13. Krichevsky-Kasarnovsky equation
ln (f2
x2) = ln(H2,1) +
v2∞(P − P1
s)
RT
0.000 0.002 0.004 0.006 0.0080.0
0.5
1.0
1.5
2.0
2.5
3.0
3.5
4.0
Pre
ssure
(M
Pa
)
Mole fraction
Figure 2-6. Literature data of H2-methanol binary system at room temperature at low pressures. The x-axis is mole fraction of H2. The y-axis is total pressure. (+) Choudhary et al. at 293 K [100]; (*) Wainwright et al. at 291 K [101]; (∆) Descamps et al. at 291.2 K [108]; (○) Liu et al. at 296.25 K [103]
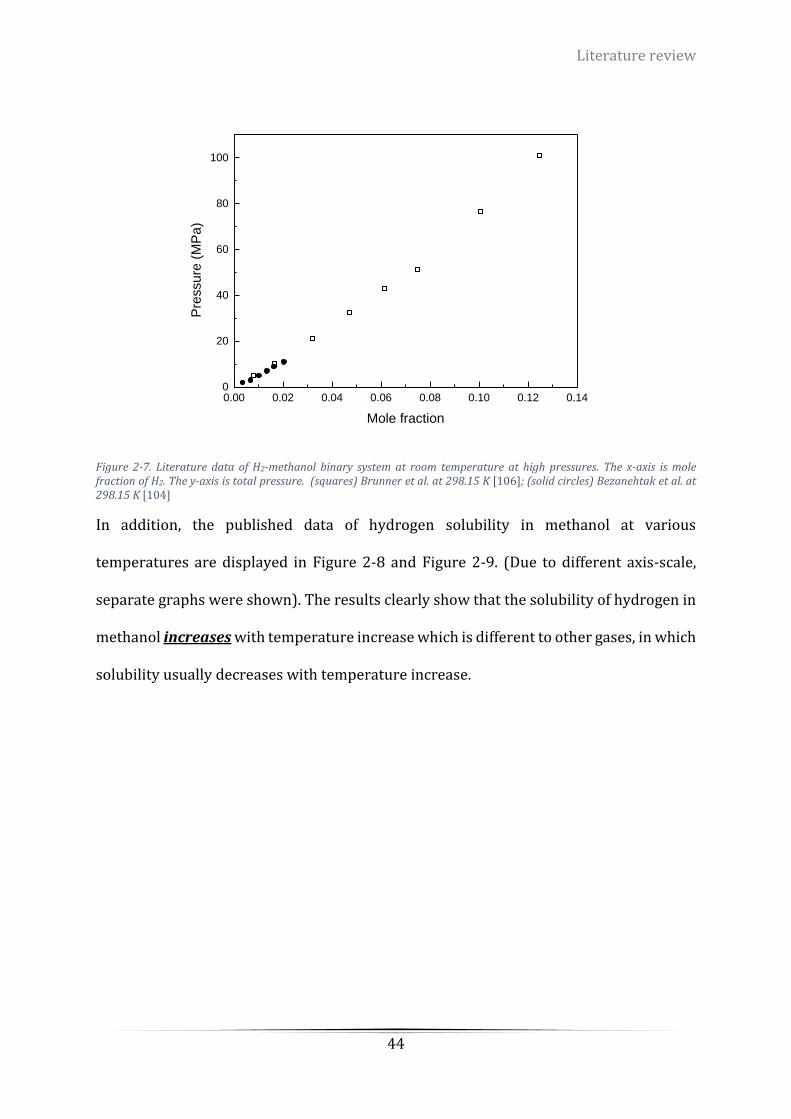
Literature review
44
0.00 0.02 0.04 0.06 0.08 0.10 0.12 0.140
20
40
60
80
100
Pre
ssure
(M
Pa
)
Mole fraction
Figure 2-7. Literature data of H2-methanol binary system at room temperature at high pressures. The x-axis is mole fraction of H2. The y-axis is total pressure. (squares) Brunner et al. at 298.15 K [106]; (solid circles) Bezanehtak et al. at 298.15 K [104]
In addition, the published data of hydrogen solubility in methanol at various
temperatures are displayed in Figure 2-8 and Figure 2-9. (Due to different axis-scale,
separate graphs were shown). The results clearly show that the solubility of hydrogen in
methanol increases with temperature increase which is different to other gases, in which
solubility usually decreases with temperature increase.

Literature review
45
0.000 0.001 0.002 0.003 0.004 0.005 0.006 0.0070.0
0.5
1.0
1.5
2.0
2.5
3.0
3.5
4.0
373.95 K
363.55 K
308.2 K
Pre
ssure
(M
pa)
Mole fraction
Figure 2-8. Literature data of H2-methanol binary system at various temperature at low pressure. (X) Liu et al. at 373.95 K [103]; (solid square) Liu et al. at 363.55 K [103];(Φ) Descamps et al. at 308.2 K [108]
0.00 0.02 0.04 0.06 0.08 0.10 0.12 0.14 0.16 0.180
20
40
60
80
100
120
298.15 K
323.15 K
373.15 K
Pre
ssure
(M
Pa
)
Mole fraction
Figure 2-9. Literature data of H2-methanol binary system at various temperature at high pressure [106]
In this work of low pressure and low temperature methanol synthesis, it is crucial to
understand hydrogen solubility in methanol at temperatures in the range of 50 – 100 °C
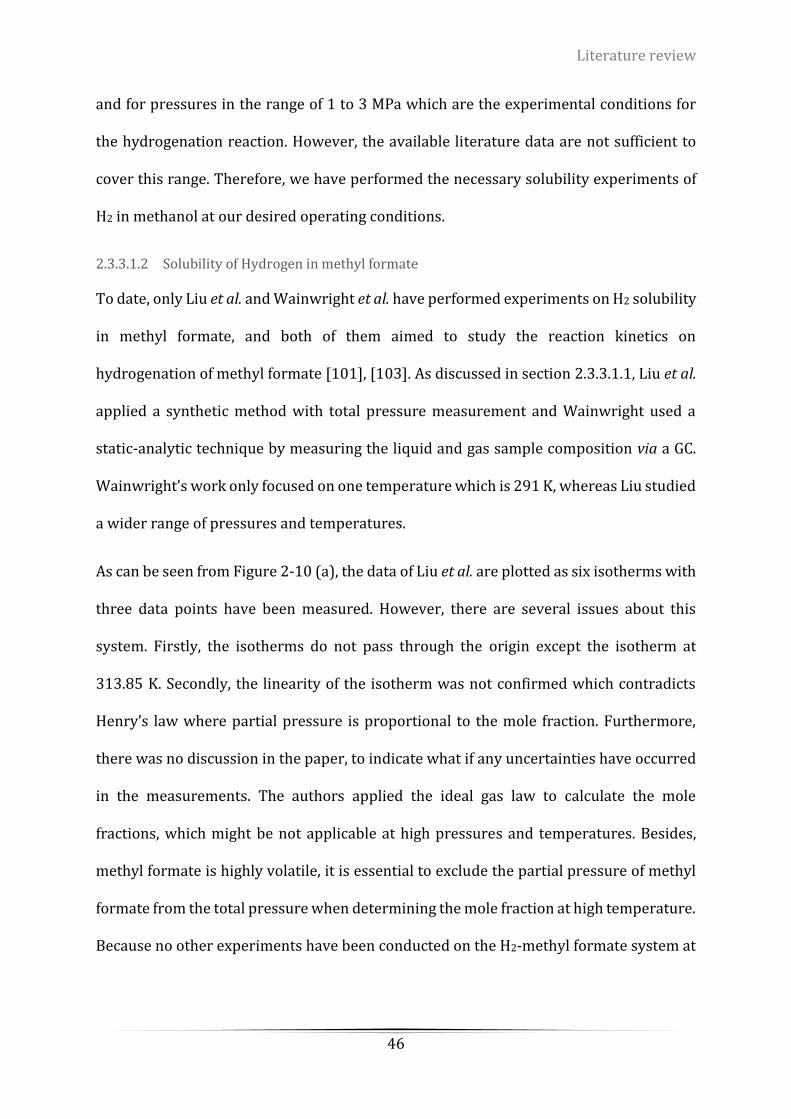
Literature review
46
and for pressures in the range of 1 to 3 MPa which are the experimental conditions for
the hydrogenation reaction. However, the available literature data are not sufficient to
cover this range. Therefore, we have performed the necessary solubility experiments of
H2 in methanol at our desired operating conditions.
2.3.3.1.2 Solubility of Hydrogen in methyl formate
To date, only Liu et al. and Wainwright et al. have performed experiments on H2 solubility
in methyl formate, and both of them aimed to study the reaction kinetics on
hydrogenation of methyl formate [101], [103]. As discussed in section 2.3.3.1.1, Liu et al.
applied a synthetic method with total pressure measurement and Wainwright used a
static-analytic technique by measuring the liquid and gas sample composition via a GC.
Wainwright’s work only focused on one temperature which is 291 K, whereas Liu studied
a wider range of pressures and temperatures.
As can be seen from Figure 2-10 (a), the data of Liu et al. are plotted as six isotherms with
three data points have been measured. However, there are several issues about this
system. Firstly, the isotherms do not pass through the origin except the isotherm at
313.85 K. Secondly, the linearity of the isotherm was not confirmed which contradicts
Henry’s law where partial pressure is proportional to the mole fraction. Furthermore,
there was no discussion in the paper, to indicate what if any uncertainties have occurred
in the measurements. The authors applied the ideal gas law to calculate the mole
fractions, which might be not applicable at high pressures and temperatures. Besides,
methyl formate is highly volatile, it is essential to exclude the partial pressure of methyl
formate from the total pressure when determining the mole fraction at high temperature.
Because no other experiments have been conducted on the H2-methyl formate system at
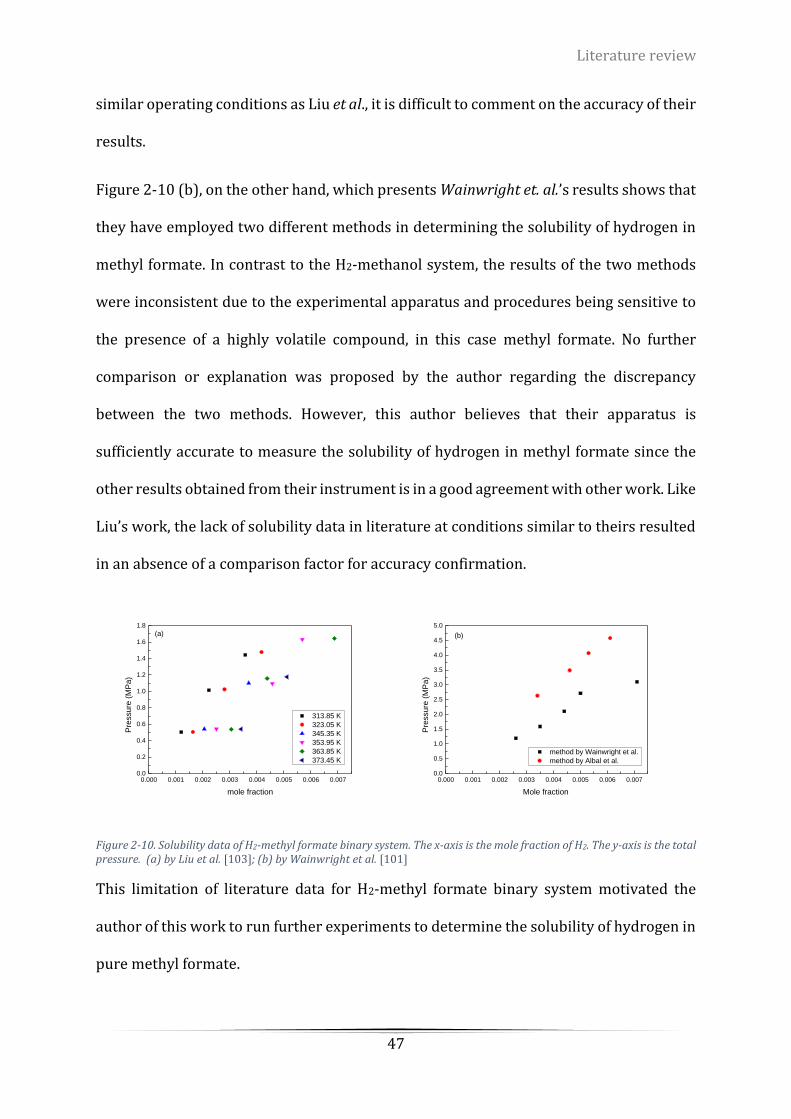
Literature review
47
similar operating conditions as Liu et al., it is difficult to comment on the accuracy of their
results.
Figure 2-10 (b), on the other hand, which presents Wainwright et. al.’s results shows that
they have employed two different methods in determining the solubility of hydrogen in
methyl formate. In contrast to the H2-methanol system, the results of the two methods
were inconsistent due to the experimental apparatus and procedures being sensitive to
the presence of a highly volatile compound, in this case methyl formate. No further
comparison or explanation was proposed by the author regarding the discrepancy
between the two methods. However, this author believes that their apparatus is
sufficiently accurate to measure the solubility of hydrogen in methyl formate since the
other results obtained from their instrument is in a good agreement with other work. Like
Liu’s work, the lack of solubility data in literature at conditions similar to theirs resulted
in an absence of a comparison factor for accuracy confirmation.
0.000 0.001 0.002 0.003 0.004 0.005 0.006 0.0070.0
0.2
0.4
0.6
0.8
1.0
1.2
1.4
1.6
1.8
(a)
313.85 K
323.05 K
345.35 K
353.95 K
363.85 K
373.45 K
Pre
ssure
(M
Pa)
mole fraction
0.000 0.001 0.002 0.003 0.004 0.005 0.006 0.0070.0
0.5
1.0
1.5
2.0
2.5
3.0
3.5
4.0
4.5
5.0
(b)
method by Wainwright et al.
method by Albal et al.
Pre
ssure
(M
Pa)
Mole fraction
Figure 2-10. Solubility data of H2-methyl formate binary system. The x-axis is the mole fraction of H2. The y-axis is the total pressure. (a) by Liu et al. [103]; (b) by Wainwright et al. [101]
This limitation of literature data for H2-methyl formate binary system motivated the
author of this work to run further experiments to determine the solubility of hydrogen in
pure methyl formate.
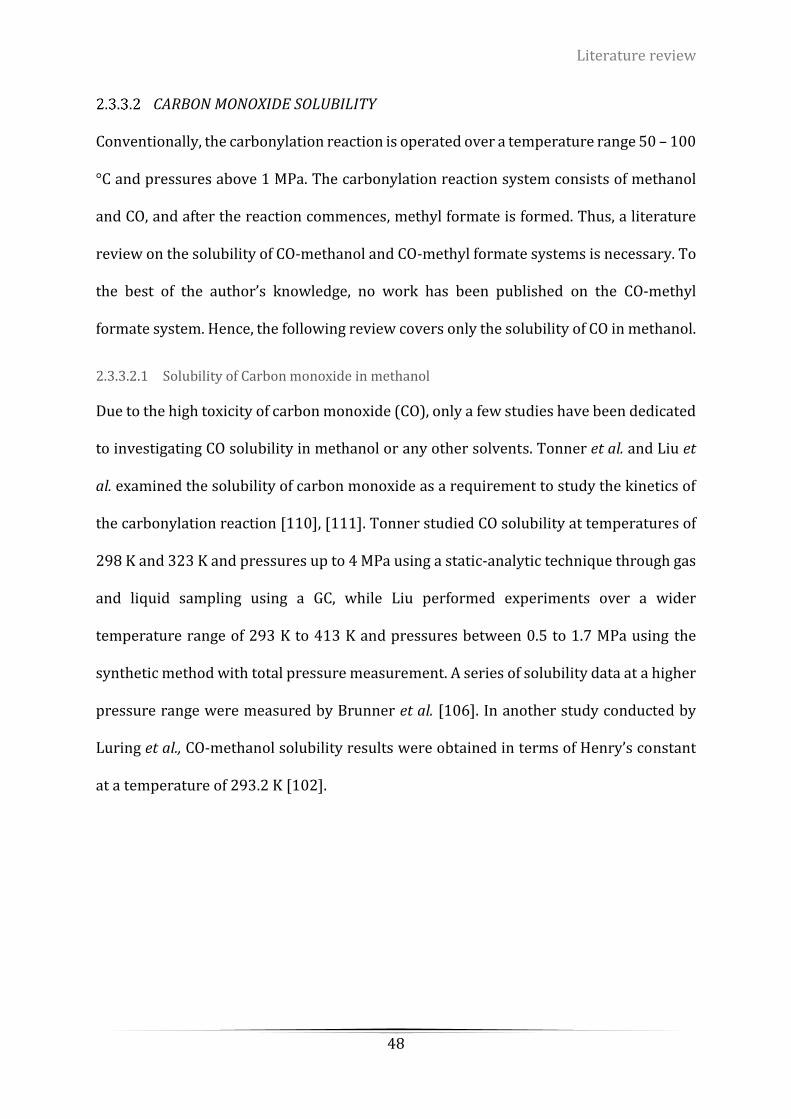
Literature review
48
CARBON MONOXIDE SOLUBILITY
Conventionally, the carbonylation reaction is operated over a temperature range 50 – 100
°C and pressures above 1 MPa. The carbonylation reaction system consists of methanol
and CO, and after the reaction commences, methyl formate is formed. Thus, a literature
review on the solubility of CO-methanol and CO-methyl formate systems is necessary. To
the best of the author’s knowledge, no work has been published on the CO-methyl
formate system. Hence, the following review covers only the solubility of CO in methanol.
2.3.3.2.1 Solubility of Carbon monoxide in methanol
Due to the high toxicity of carbon monoxide (CO), only a few studies have been dedicated
to investigating CO solubility in methanol or any other solvents. Tonner et al. and Liu et
al. examined the solubility of carbon monoxide as a requirement to study the kinetics of
the carbonylation reaction [110], [111]. Tonner studied CO solubility at temperatures of
298 K and 323 K and pressures up to 4 MPa using a static-analytic technique through gas
and liquid sampling using a GC, while Liu performed experiments over a wider
temperature range of 293 K to 413 K and pressures between 0.5 to 1.7 MPa using the
synthetic method with total pressure measurement. A series of solubility data at a higher
pressure range were measured by Brunner et al. [106]. In another study conducted by
Luring et al., CO-methanol solubility results were obtained in terms of Henry’s constant
at a temperature of 293.2 K [102].

Literature review
49
0.000 0.005 0.010 0.015 0.020 0.025 0.0300
1
2
3
4
5
6
7
8
9
Pre
ssure
(M
Pa
)
Mole fraction
Figure 2-11. Solubility data of CO-methanol binary system at 323 K. The x-axis is the mole fraction of H2. The y-axis is the total pressure. (x) Liu et al. [111]; (○)Tonner et al.[110]; (∆) Brunner et al. [106]
Figure 2-11 shows that the isotherms from Liu et al. and Brunner et al. studies are in a
reasonably good agreement even though different methodologies were applied. Tonner’s
work shows a discrepancy to Brunner’s results. However, both work show comparable
results of H2-methanol system which indicate that the different results are not strongly
affected strongly by the measurement apparatus. This is possibly because methanol is not
volatile compare to methyl formate, and it does not require a highly sophisticated
instrument to compute the moles of carbon monoxide.
In addition to that, various isotherms were obtained by Brunner et al. and the data points
of temperatures below 373.15 K and pressures up to 10 MPa were plotted in Figure 2-12.
It shows that with increasing temperature, the solubility of CO in methanol increases
correspondingly although the increments are not significant. This phenomenon is the
same as hydrogen in methanol while different to most gases.
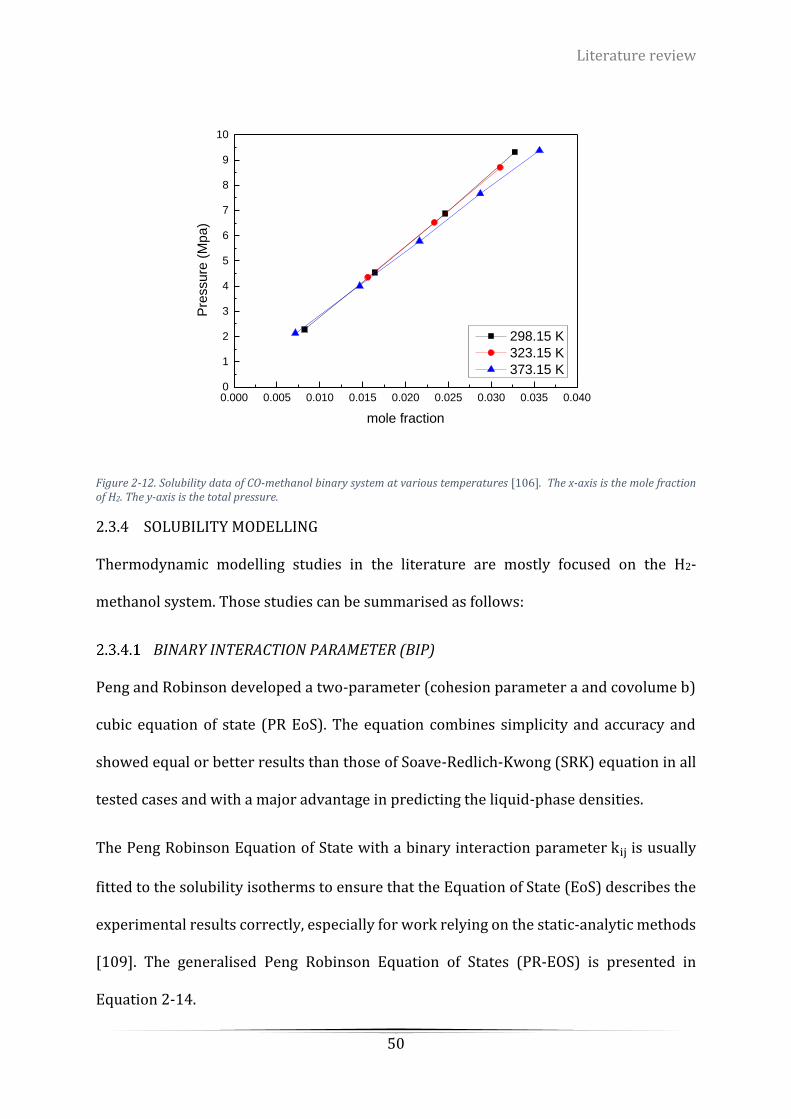
Literature review
50
0.000 0.005 0.010 0.015 0.020 0.025 0.030 0.035 0.0400
1
2
3
4
5
6
7
8
9
10
Pre
ssure
(M
pa)
mole fraction
298.15 K
323.15 K
373.15 K
Figure 2-12. Solubility data of CO-methanol binary system at various temperatures [106]. The x-axis is the mole fraction of H2. The y-axis is the total pressure.
2.3.4 SOLUBILITY MODELLING
Thermodynamic modelling studies in the literature are mostly focused on the H2-
methanol system. Those studies can be summarised as follows:
BINARY INTERACTION PARAMETER (BIP)
Peng and Robinson developed a two-parameter (cohesion parameter a and covolume b)
cubic equation of state (PR EoS). The equation combines simplicity and accuracy and
showed equal or better results than those of Soave-Redlich-Kwong (SRK) equation in all
tested cases and with a major advantage in predicting the liquid-phase densities.
The Peng Robinson Equation of State with a binary interaction parameter kij is usually
fitted to the solubility isotherms to ensure that the Equation of State (EoS) describes the
experimental results correctly, especially for work relying on the static-analytic methods
[109]. The generalised Peng Robinson Equation of States (PR-EOS) is presented in
Equation 2-14.
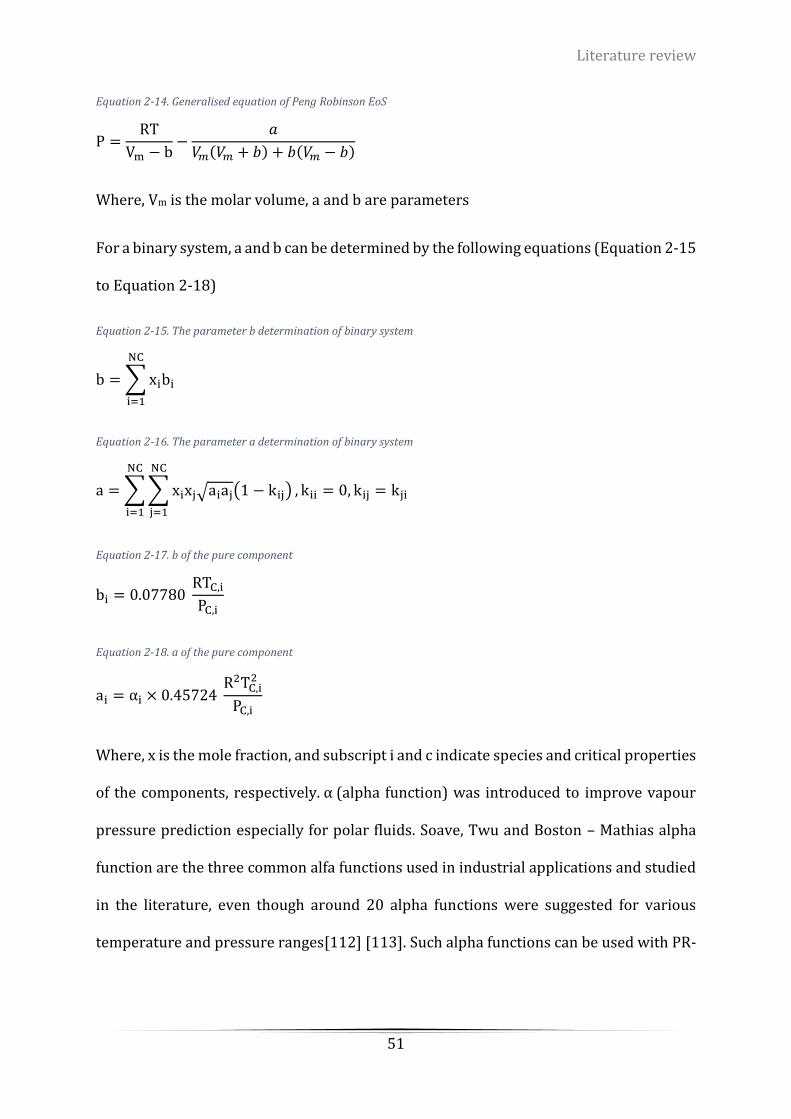
Literature review
51
Equation 2-14. Generalised equation of Peng Robinson EoS
P =RT
Vm − b−
𝑎
𝑉𝑚(𝑉𝑚 + 𝑏) + 𝑏(𝑉𝑚 − 𝑏)
Where, Vm is the molar volume, a and b are parameters
For a binary system, a and b can be determined by the following equations (Equation 2-15
to Equation 2-18)
Equation 2-15. The parameter b determination of binary system
b = ∑ xibi
NC
i=1
Equation 2-16. The parameter a determination of binary system
a = ∑ ∑ xixj√aiaj(1 − kij)
NC
j=1
NC
i=1
, kii = 0, kij = kji
Equation 2-17. b of the pure component
bi = 0.07780 RTC,i
PC,i
Equation 2-18. a of the pure component
ai = αi × 0.45724 R2TC,i
2
PC,i
Where, x is the mole fraction, and subscript i and c indicate species and critical properties
of the components, respectively. α (alpha function) was introduced to improve vapour
pressure prediction especially for polar fluids. Soave, Twu and Boston – Mathias alpha
function are the three common alfa functions used in industrial applications and studied
in the literature, even though around 20 alpha functions were suggested for various
temperature and pressure ranges[112] [113]. Such alpha functions can be used with PR-
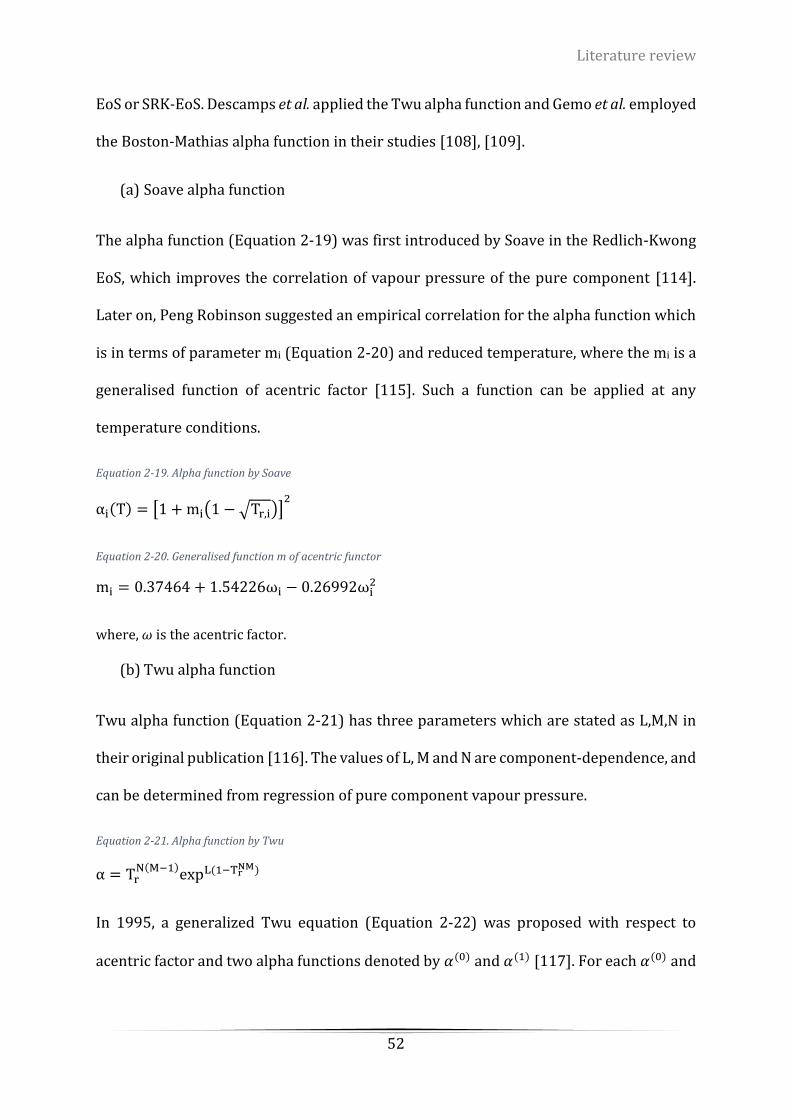
Literature review
52
EoS or SRK-EoS. Descamps et al. applied the Twu alpha function and Gemo et al. employed
the Boston-Mathias alpha function in their studies [108], [109].
(a) Soave alpha function
The alpha function (Equation 2-19) was first introduced by Soave in the Redlich-Kwong
EoS, which improves the correlation of vapour pressure of the pure component [114].
Later on, Peng Robinson suggested an empirical correlation for the alpha function which
is in terms of parameter mi (Equation 2-20) and reduced temperature, where the mi is a
generalised function of acentric factor [115]. Such a function can be applied at any
temperature conditions.
Equation 2-19. Alpha function by Soave
αi(T) = [1 + mi(1 − √Tr,i)]2
Equation 2-20. Generalised function m of acentric functor
mi = 0.37464 + 1.54226ωi − 0.26992ωi2
where, 𝜔 is the acentric factor.
(b) Twu alpha function
Twu alpha function (Equation 2-21) has three parameters which are stated as L,M,N in
their original publication [116]. The values of L, M and N are component-dependence, and
can be determined from regression of pure component vapour pressure.
Equation 2-21. Alpha function by Twu
α = TrN(M−1)
expL(1−TrNM)
In 1995, a generalized Twu equation (Equation 2-22) was proposed with respect to
acentric factor and two alpha functions denoted by 𝛼(0) and 𝛼(1) [117]. For each 𝛼(0) and
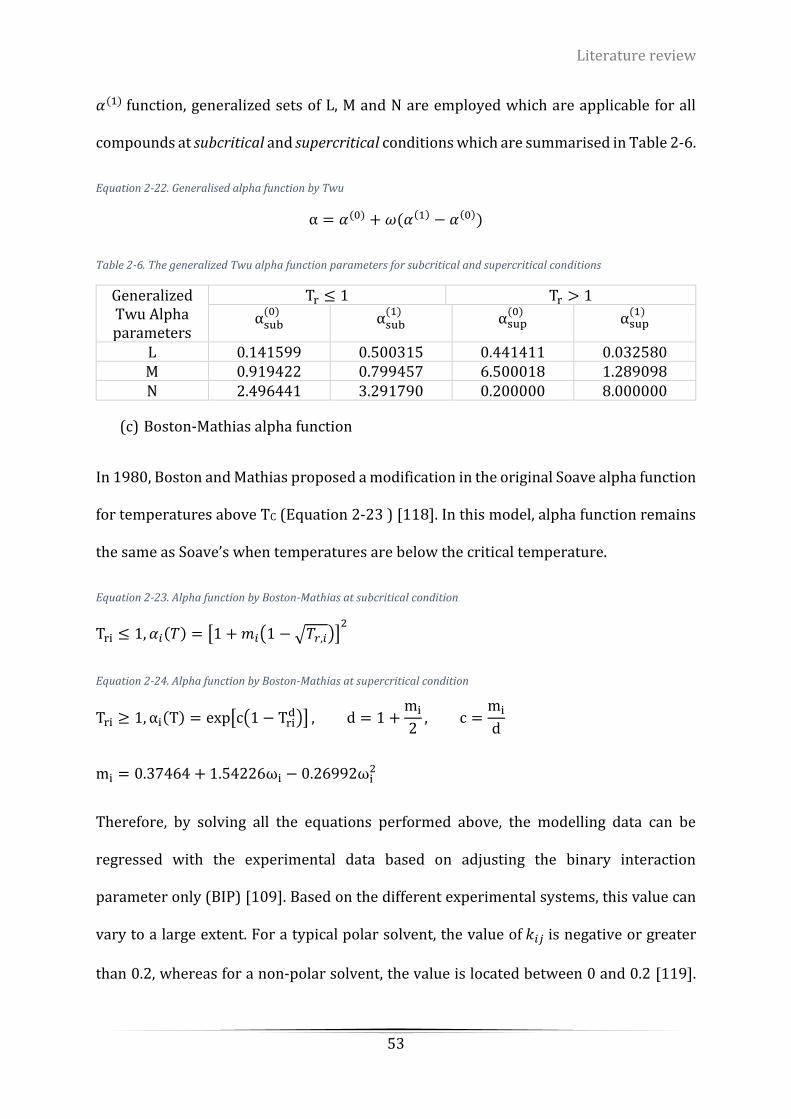
Literature review
53
𝛼(1) function, generalized sets of L, M and N are employed which are applicable for all
compounds at subcritical and supercritical conditions which are summarised in Table 2-6.
Equation 2-22. Generalised alpha function by Twu
α = 𝛼(0) + 𝜔(𝛼(1) − 𝛼(0))
Table 2-6. The generalized Twu alpha function parameters for subcritical and supercritical conditions
Generalized Twu Alpha parameters
Tr ≤ 1 Tr > 1
αsub(0)
αsub(1)
αsup(0)
αsup(1)
L 0.141599 0.500315 0.441411 0.032580 M 0.919422 0.799457 6.500018 1.289098 N 2.496441 3.291790 0.200000 8.000000
(c) Boston-Mathias alpha function
In 1980, Boston and Mathias proposed a modification in the original Soave alpha function
for temperatures above TC (Equation 2-23 ) [118]. In this model, alpha function remains
the same as Soave’s when temperatures are below the critical temperature.
Equation 2-23. Alpha function by Boston-Mathias at subcritical condition
Tri ≤ 1, 𝛼𝑖(𝑇) = [1 + 𝑚𝑖(1 − √𝑇𝑟,𝑖)]2
Equation 2-24. Alpha function by Boston-Mathias at supercritical condition
Tri ≥ 1, αi(T) = exp[c(1 − Trid)] , d = 1 +
mi
2, c =
mi
d
mi = 0.37464 + 1.54226ωi − 0.26992ωi2
Therefore, by solving all the equations performed above, the modelling data can be
regressed with the experimental data based on adjusting the binary interaction
parameter only (BIP) [109]. Based on the different experimental systems, this value can
vary to a large extent. For a typical polar solvent, the value of 𝑘𝑖𝑗 is negative or greater
than 0.2, whereas for a non-polar solvent, the value is located between 0 and 0.2 [119].
Literature review
54
In addition, the binary interaction parameter (BIP) kij is dependent on temperature only
and can be expressed by the following equation.
Equation 2-25. Binary interaction parameter (BIP)
kij = kij1 + kij
2 ∙ T
There are two modelling approaches describing the equilibrium behaviour of vapour-
liquid systems: Equation of State (EoS) and activity model. The EoS method takes
advantage of the equation of state for both gas and liquid phases, whereas the activity
model utilises the activity coefficients to describe the liquid phase and uses the equation
of state for the vapour phase. The EoS method has been successfully applied to non-polar
and slightly polar solvents under a broad range of temperatures and pressures [120]. The
activity model is commonly used for incompressible solvents at low temperatures and
pressures [121]. As the reaction conditions of methanol synthesis processes are at
relatively high temperatures and high pressures, the activity model may not be applicable
to the system. In addition, the activity model incorporates a number of interaction
parameters (usually more than 4 parameters), which requires great amount of
experimental data to regress, and thus it may not be accurate due to the lack of available
data for vapour-liquid equilibrium of methanol synthesis processes. Therefore, EoS
model is usually used to predict the phase behaviour of the methanol synthesis processes.
HENRY’S CONSTANT
Thi et al. tried to fit the Henry’s constants to all reliable H2-methanol literature sources in
order to evaluate the Henry’s constant of hydrogen in solvents at high temperature [122].
Two empirical models suggested by Harvey were applied to determine the parameters
for the regressions, and both equations and the corresponding parameters are shown in
Table 2-7, along with the absolute average deviation (AADR). H𝑖 is the Henry’s constant
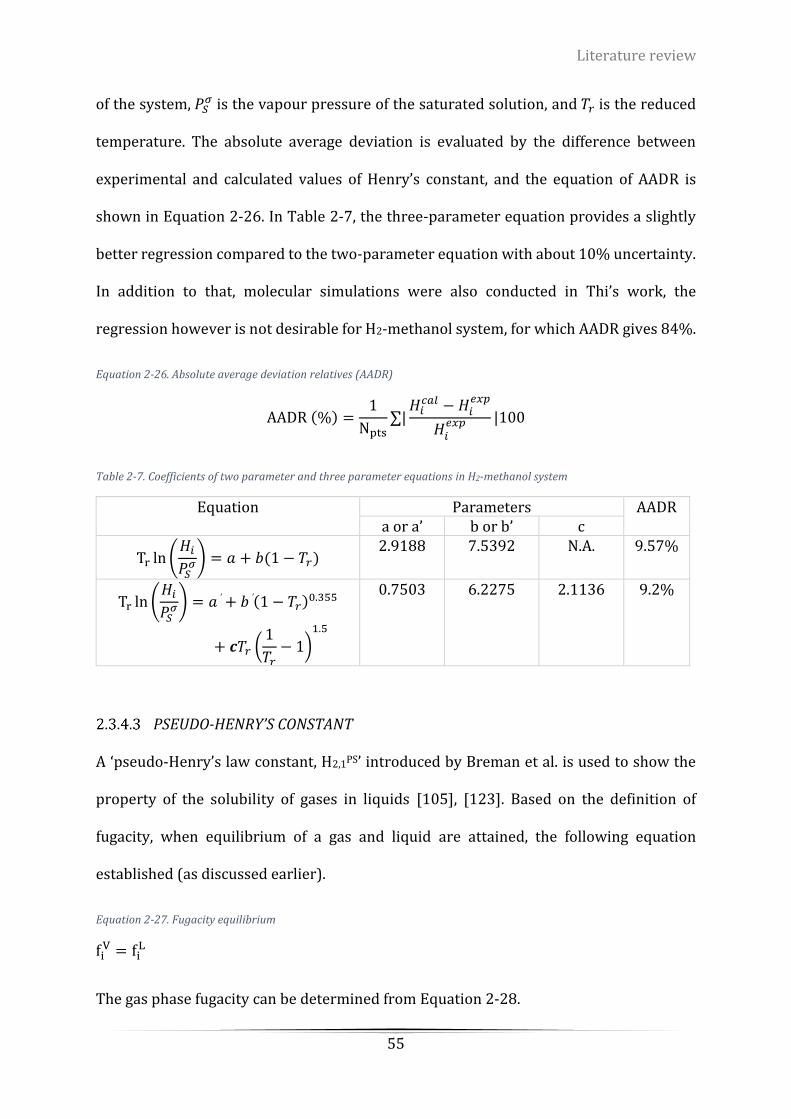
Literature review
55
of the system, 𝑃𝑆𝜎 is the vapour pressure of the saturated solution, and 𝑇𝑟 is the reduced
temperature. The absolute average deviation is evaluated by the difference between
experimental and calculated values of Henry’s constant, and the equation of AADR is
shown in Equation 2-26. In Table 2-7, the three-parameter equation provides a slightly
better regression compared to the two-parameter equation with about 10% uncertainty.
In addition to that, molecular simulations were also conducted in Thi’s work, the
regression however is not desirable for H2-methanol system, for which AADR gives 84%.
Equation 2-26. Absolute average deviation relatives (AADR)
AADR (%) =1
Npts∑|
𝐻𝑖𝑐𝑎𝑙 − 𝐻𝑖
𝑒𝑥𝑝
𝐻𝑖𝑒𝑥𝑝 |100
Table 2-7. Coefficients of two parameter and three parameter equations in H2-methanol system
Equation Parameters AADR a or a’ b or b’ c
Tr ln (𝐻𝑖
𝑃𝑆𝜎) = 𝑎 + 𝑏(1 − 𝑇𝑟)
2.9188 7.5392 N.A. 9.57%
Tr ln (𝐻𝑖
𝑃𝑆𝜎) = 𝑎′ + 𝑏′(1 − 𝑇𝑟)0.355
+ 𝒄𝑇𝑟 (1
𝑇𝑟− 1)
1.5
0.7503 6.2275 2.1136 9.2%
PSEUDO-HENRY’S CONSTANT
A ‘pseudo-Henry’s law constant, H2,1PS’ introduced by Breman et al. is used to show the
property of the solubility of gases in liquids [105], [123]. Based on the definition of
fugacity, when equilibrium of a gas and liquid are attained, the following equation
established (as discussed earlier).
Equation 2-27. Fugacity equilibrium
fiV = fi
L
The gas phase fugacity can be determined from Equation 2-28.
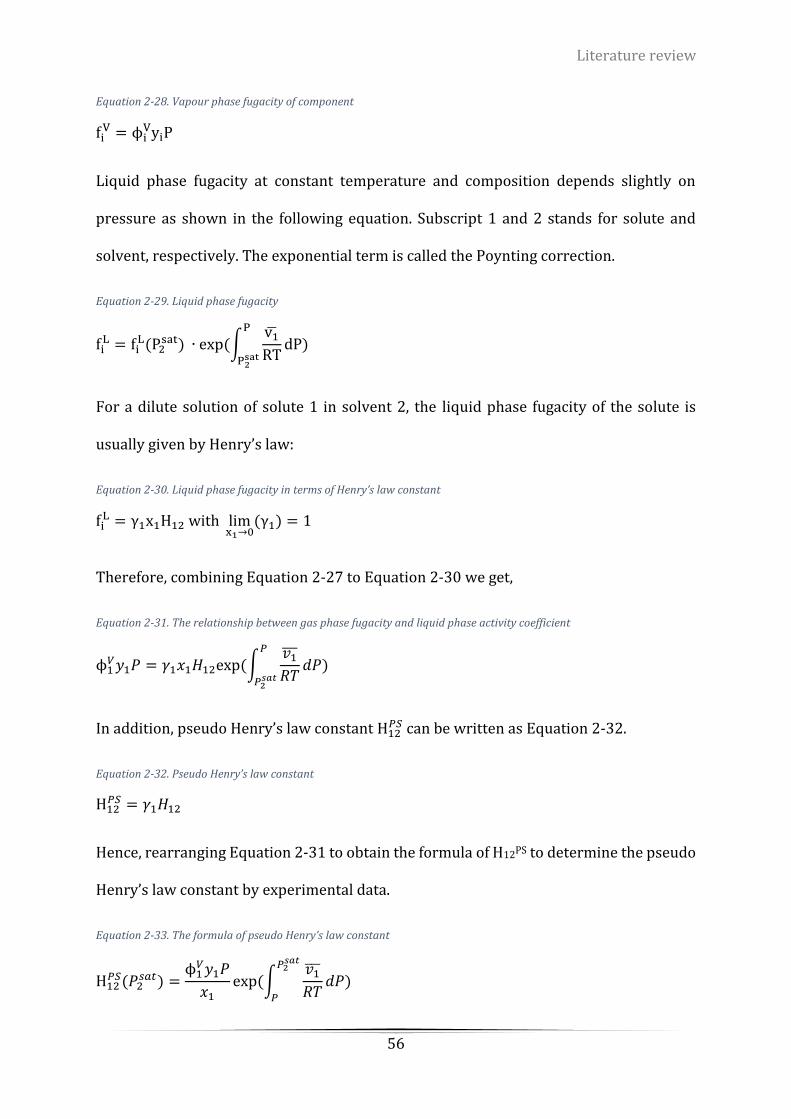
Literature review
56
Equation 2-28. Vapour phase fugacity of component
fiV = ϕi
VyiP
Liquid phase fugacity at constant temperature and composition depends slightly on
pressure as shown in the following equation. Subscript 1 and 2 stands for solute and
solvent, respectively. The exponential term is called the Poynting correction.
Equation 2-29. Liquid phase fugacity
fiL = fi
L(P2sat) ∙ exp (∫
v1̅
RT
P
P2sat
dP)
For a dilute solution of solute 1 in solvent 2, the liquid phase fugacity of the solute is
usually given by Henry’s law:
Equation 2-30. Liquid phase fugacity in terms of Henry’s law constant
fiL = γ1x1H12 with lim
x1→0(γ1) = 1
Therefore, combining Equation 2-27 to Equation 2-30 we get,
Equation 2-31. The relationship between gas phase fugacity and liquid phase activity coefficient
ϕ1𝑉𝑦1𝑃 = 𝛾1𝑥1𝐻12exp (∫
𝑣1̅̅ ̅
𝑅𝑇
𝑃
𝑃2𝑠𝑎𝑡
𝑑𝑃)
In addition, pseudo Henry’s law constant H12𝑃𝑆 can be written as Equation 2-32.
Equation 2-32. Pseudo Henry’s law constant
H12𝑃𝑆 = 𝛾1𝐻12
Hence, rearranging Equation 2-31 to obtain the formula of H12PS to determine the pseudo
Henry’s law constant by experimental data.
Equation 2-33. The formula of pseudo Henry’s law constant
H12𝑃𝑆(𝑃2
𝑠𝑎𝑡) =ϕ1
𝑉𝑦1𝑃
𝑥1exp (∫
𝑣1̅̅ ̅
𝑅𝑇
𝑃2𝑠𝑎𝑡
𝑃
𝑑𝑃)
Literature review
57
Applying the Peng-Robinson EoS to determine ϕ1𝑉 and v1̅ , and using either Antoine
Equation or Wagner Equation to obtain vapour pressure of the solvent at specific
temperature [124]. In addition, the composition of solute and solvent in each phase can
be calculated from the experimental data at equilibrium using Breman’s iterative method.
Hence, the pseudo-Henry’s law constant can be determined [123].
2.4 CONCLUSIONS
In this chapter, three types of recent methanol synthesis methods have been discussed in
detail including kinetics mechanism, kinetics and roles of catalysts. Solubility
experimental data and thermodynamic regressed models were extensively studied and
investigated for the current research topic in the literature.
As can be seen, due to the insufficient reliable VLE data from previous work, performing
VLE experiments became important and necessary in our study – both to confirm if mass
transfer control was occurring and to obtain values of liquid phase concentrations of CO
and H2 for kinetics modelling. Hence, solubility experiments were conducted for four
systems: H2-methanol, H2-methyl formate, CO-methanol and CO-methyl formate at
temperature ranges from 25 to 100 °C and pressures from 0.3 to 3 MPa. Such operating
conditions were selected based on the reaction conditions. The solubility experimental
apparatus, procedures and the experimental data will be presented in chapter 4.
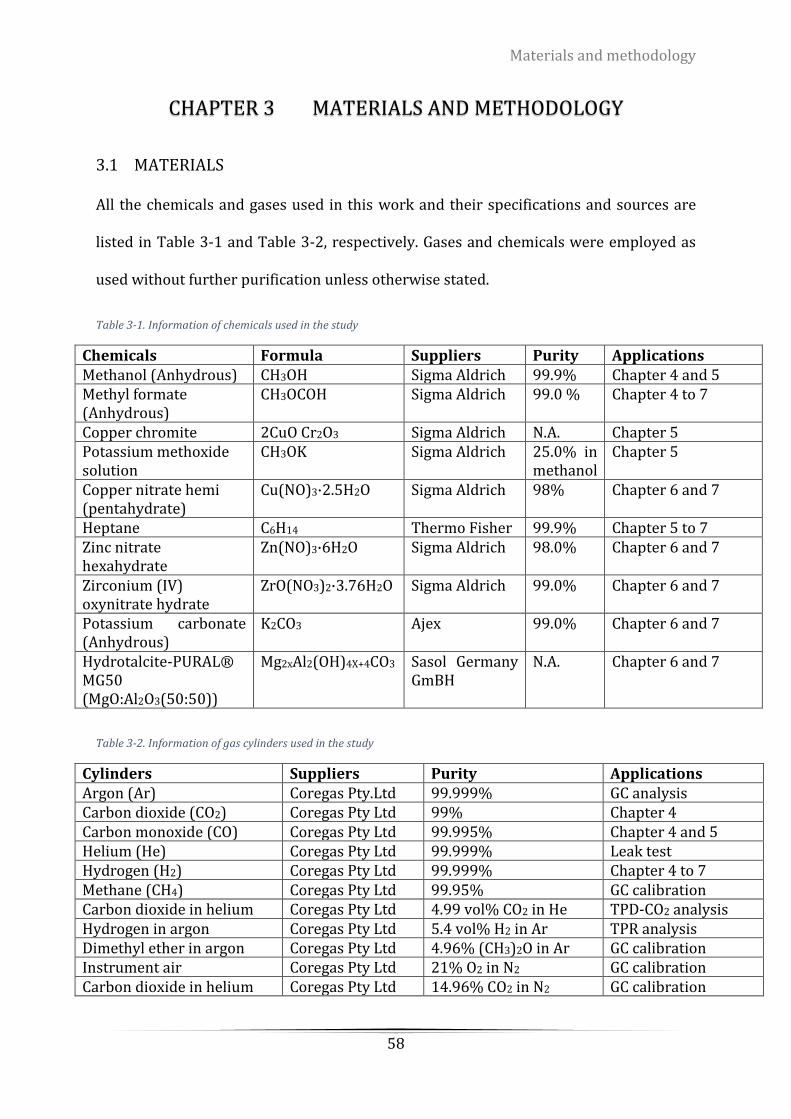
Materials and methodology
58
CHAPTER 3 MATERIALS AND METHODOLOGY
3.1 MATERIALS
All the chemicals and gases used in this work and their specifications and sources are
listed in Table 3-1 and Table 3-2, respectively. Gases and chemicals were employed as
used without further purification unless otherwise stated.
Table 3-1. Information of chemicals used in the study
Chemicals Formula Suppliers Purity Applications Methanol (Anhydrous) CH3OH Sigma Aldrich 99.9% Chapter 4 and 5 Methyl formate (Anhydrous)
CH3OCOH Sigma Aldrich 99.0 % Chapter 4 to 7
Copper chromite 2CuO Cr2O3 Sigma Aldrich N.A. Chapter 5 Potassium methoxide solution
CH3OK Sigma Aldrich 25.0% in methanol
Chapter 5
Copper nitrate hemi (pentahydrate)
Cu(NO)3·2.5H2O Sigma Aldrich 98% Chapter 6 and 7
Heptane C6H14 Thermo Fisher 99.9% Chapter 5 to 7 Zinc nitrate hexahydrate
Zn(NO)3·6H2O Sigma Aldrich 98.0% Chapter 6 and 7
Zirconium (IV) oxynitrate hydrate
ZrO(NO3)2·3.76H2O Sigma Aldrich 99.0% Chapter 6 and 7
Potassium carbonate (Anhydrous)
K2CO3 Ajex 99.0% Chapter 6 and 7
Hydrotalcite-PURAL® MG50 (MgO:Al2O3(50:50))
Mg2xAl2(OH)4X+4CO3
Sasol Germany GmBH
N.A. Chapter 6 and 7
Table 3-2. Information of gas cylinders used in the study
Cylinders Suppliers Purity Applications Argon (Ar) Coregas Pty.Ltd 99.999% GC analysis Carbon dioxide (CO2) Coregas Pty Ltd 99% Chapter 4 Carbon monoxide (CO) Coregas Pty Ltd 99.995% Chapter 4 and 5 Helium (He) Coregas Pty Ltd 99.999% Leak test Hydrogen (H2) Coregas Pty Ltd 99.999% Chapter 4 to 7 Methane (CH4) Coregas Pty Ltd 99.95% GC calibration Carbon dioxide in helium Coregas Pty Ltd 4.99 vol% CO2 in He TPD-CO2 analysis Hydrogen in argon Coregas Pty Ltd 5.4 vol% H2 in Ar TPR analysis Dimethyl ether in argon Coregas Pty Ltd 4.96% (CH3)2O in Ar GC calibration Instrument air Coregas Pty Ltd 21% O2 in N2 GC calibration Carbon dioxide in helium Coregas Pty Ltd 14.96% CO2 in N2 GC calibration
Materials and methodology
59
3.2 METHODOLOGIES
3.2.1 POWDER X-RAY DIFFRACTION (XRD)
XRD is an analytical technique used to identify the structure and phase composition of
crystalline catalysts [125], [126]. The diffraction patterns of the synthesised catalysts
were recorded by a Bruker D2 PHASER X-ray powder diffractometer using a nickel
filtered Cu K𝛼 radiation (𝜆=1.5406 Å). The X-ray diffraction scanning was performed at
ambient conditions at 2θ from 10° to 90° at 30 kV and 10 mA using a scan rate of 2°/min.
3.2.2 SCANNING ELECTRON MICROSCOPY (SEM)
The morphology and the size of the produced solid catalysts were determined using a
field emission scanning electron microscopy taken by JSM-7001F Schottky at 5kV [127].
The samples were crushed and sprinkled on carbon tape and mounted on a metal stub
and coated with gold.
3.2.3 ENERGY DISPERSIVE X-RAY SPECTROSCOPY (EDX)
The elemental (both metals and non-metals) analysis as well as their relative proportions
(atomic % generally) were determined using the energy dispersive x-ray spectrometer
attached to the JSM-7001F Schottky [128].
3.2.4 N2 ADSORPTION-DESORPTION ISOTHERMS
The solid catalysts, especially metal oxides, supported metal oxides, are porous materials
with complex pore size distributions that range between micro (average pore diameter d
< 2 nm), meso (2 < d < 50 nm) and macro (d > 50 nm) [129]. The surface area, pore volume,
and pore size distribution play a vital role in the number of accessible active sites in the
catalyst. The structural properties of the solid catalysts were characterised by N2

Materials and methodology
60
adsorption-desorption measurement at 77K using ASAP 2010 (Accelerated Surface Area
and Porosimetry 2010) [125]. All samples were degassed at 573 K for 3 hours under
vacuum before the analysis. The Brunauer, Emmer, and Teller (BET) method was used to
calculate the specific surface area (SA) using the adsorption data collected over a relative
pressure (P/P0) range of 0.05 – 0.3. The pore volume (PV) was calculated by Barrett-
Joyner-Halenda (BJH) method using the adsorption data.
3.2.5 TEMPERATURE-PROGRAMMED REDUCTION (TPR)
Temperature-programmed reduction (TPR) was used to characterise the metal oxides,
mixed metal oxides, and metal oxides dispersed on a support [130]. In this work, the
oxide of interest is copper oxide. The TPR provides quantitative information of
reducibility of the oxide’s surfaces, as well as the heterogeneity of the reducible surface.
BELCAT Basic, the chemisorption analyser, was used for TPR measurements of the
catalysts samples. Around 40 mg sample was placed on top of glass wool in a U-tube
quartz reactor. The sample was pre-treated by flowing pure Ar (50 mL/min) at 573 K for
2 hours to remove H2O content. Then the sample was cooled down to 323 K by flowing
pure Ar at 50 mL/min. The TPR experiments carried out under 5 vol% H2/Ar flowing at
50 mL/min with temperature increase at a ramp rate of 5 K/min until reach 1023 K.
A mass spectrometry MS (BELMass) was used to measure the change of H2 concentration
in the outlet gas stream over the temperature variation. The BELMass is a quadruple MS
with a faraday cup detector. It operates at 1 mA electron current and 1000 V secondary
electron multiplier. The hydrogen gas (H2) was calibrated prior the TPR experiment in
order to accurately calculate the amount of H2 consumed. The calibration of the hydrogen
peaks with correction factor can be found in Appendix A. CO2 - Temperature programmed
desorption (CO2-TPD)
Materials and methodology
61
Temperature programmed desorption of carbon dioxide (CO2-TPD) is a method to
determine the catalyst basicity as well as the distribution of the basic sites on the surface
of the catalyst [131]. Pure CO2 gas was supplied for CO2-TPD measurement in the BELCAT
Basic chemisorption analyser. Mass Spectrometry (BELMass) was used to determine the
amount of the actual desorbed CO2. Four procedures are involved in the CO2-TPD
experiment.
Step 1: Catalyst reduction
100 mg of the sample was placed on the top of glass wool in a U-tube quartz reactor where
pure H2 (30 mL/min) flowed at 573 K for six hours and then cooled down to room
temperature using He (30 mL/min).
Step 2: Pre-treatment
After the reduction step, the sample weight was measured to obtain the actual mass. The
sample was pre-treated by flowing pure He (50 mL/min) at 573 K for 2 hours to remove
water content. Subsequently, the sample was cooled down to 393 K by flowing He at 50
mL/min.
Step 3: CO2 adsorption
To determine the amount of the basic sites of the catalysts, only chemisorption is
considered. 393 K was selected as the exposure temperature in the CO2-TCD experiment.
The pre-treated sample was exposed to CO2/He stream (30 mL/min) for 60 mins at 393
K.
Step 4: Chemisorption measurement
Chemisorption is a type of adsorption where the adsorbate molecules interact with the
catalyst surface by strong chemical bonds [125]. The samples were heated from 393 K to
1073 K at a ramp rate of 10 K/min by He stream. Then the samples were held at 1073 K
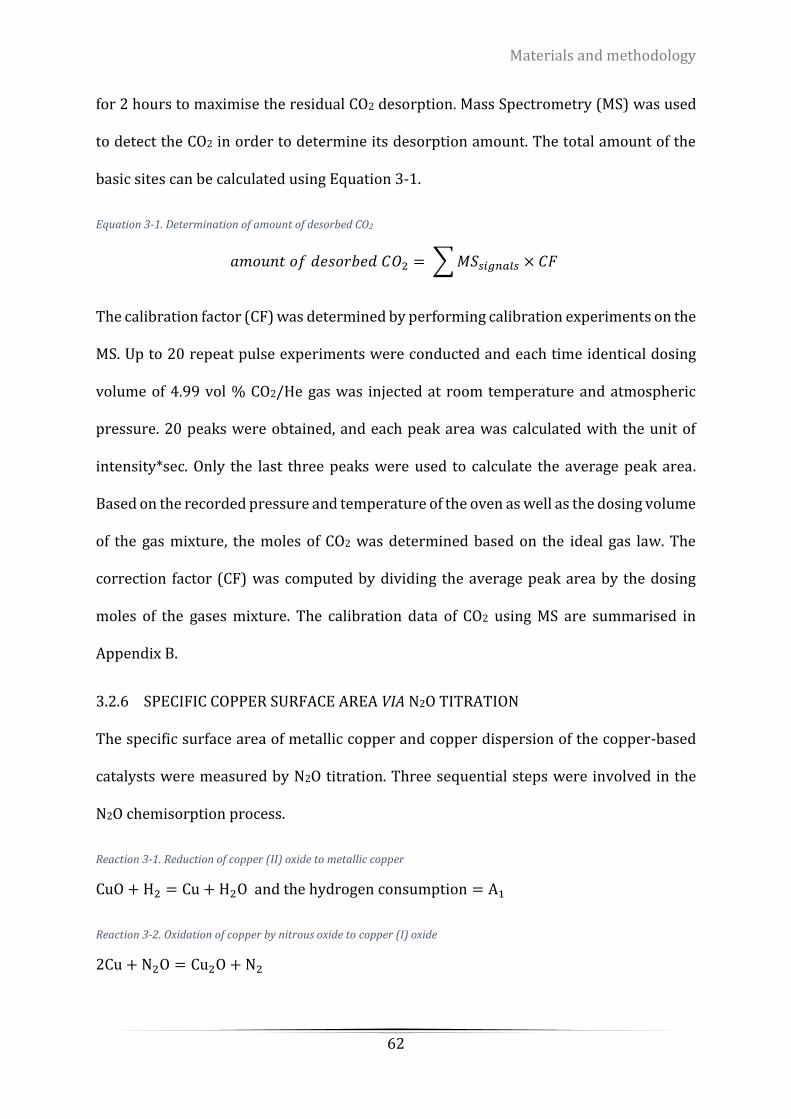
Materials and methodology
62
for 2 hours to maximise the residual CO2 desorption. Mass Spectrometry (MS) was used
to detect the CO2 in order to determine its desorption amount. The total amount of the
basic sites can be calculated using Equation 3-1.
Equation 3-1. Determination of amount of desorbed CO2
𝑎𝑚𝑜𝑢𝑛𝑡 𝑜𝑓 𝑑𝑒𝑠𝑜𝑟𝑏𝑒𝑑 𝐶𝑂2 = ∑ 𝑀𝑆𝑠𝑖𝑔𝑛𝑎𝑙𝑠 × 𝐶𝐹
The calibration factor (CF) was determined by performing calibration experiments on the
MS. Up to 20 repeat pulse experiments were conducted and each time identical dosing
volume of 4.99 vol % CO2/He gas was injected at room temperature and atmospheric
pressure. 20 peaks were obtained, and each peak area was calculated with the unit of
intensity*sec. Only the last three peaks were used to calculate the average peak area.
Based on the recorded pressure and temperature of the oven as well as the dosing volume
of the gas mixture, the moles of CO2 was determined based on the ideal gas law. The
correction factor (CF) was computed by dividing the average peak area by the dosing
moles of the gases mixture. The calibration data of CO2 using MS are summarised in
Appendix B.
3.2.6 SPECIFIC COPPER SURFACE AREA VIA N2O TITRATION
The specific surface area of metallic copper and copper dispersion of the copper-based
catalysts were measured by N2O titration. Three sequential steps were involved in the
N2O chemisorption process.
Reaction 3-1. Reduction of copper (II) oxide to metallic copper
CuO + H2 = Cu + H2O and the hydrogen consumption = A1
Reaction 3-2. Oxidation of copper by nitrous oxide to copper (I) oxide
2Cu + N2O = Cu2O + N2
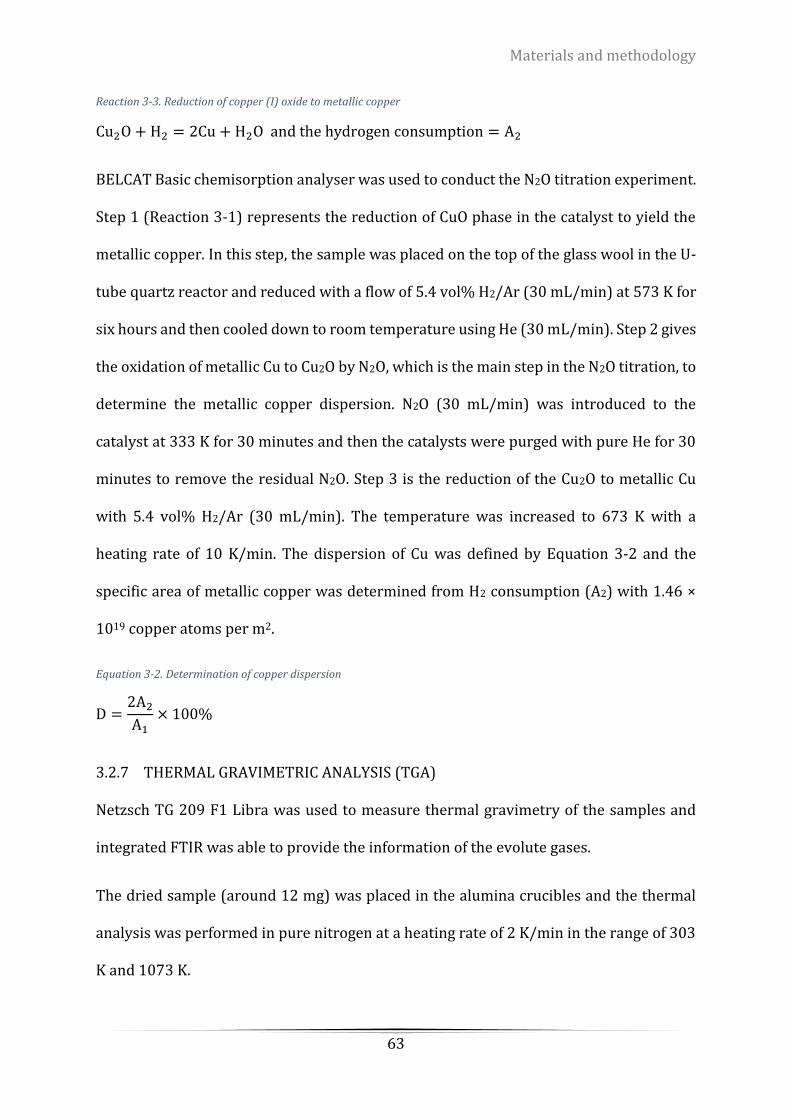
Materials and methodology
63
Reaction 3-3. Reduction of copper (I) oxide to metallic copper
Cu2O + H2 = 2Cu + H2O and the hydrogen consumption = A2
BELCAT Basic chemisorption analyser was used to conduct the N2O titration experiment.
Step 1 (Reaction 3-1) represents the reduction of CuO phase in the catalyst to yield the
metallic copper. In this step, the sample was placed on the top of the glass wool in the U-
tube quartz reactor and reduced with a flow of 5.4 vol% H2/Ar (30 mL/min) at 573 K for
six hours and then cooled down to room temperature using He (30 mL/min). Step 2 gives
the oxidation of metallic Cu to Cu2O by N2O, which is the main step in the N2O titration, to
determine the metallic copper dispersion. N2O (30 mL/min) was introduced to the
catalyst at 333 K for 30 minutes and then the catalysts were purged with pure He for 30
minutes to remove the residual N2O. Step 3 is the reduction of the Cu2O to metallic Cu
with 5.4 vol% H2/Ar (30 mL/min). The temperature was increased to 673 K with a
heating rate of 10 K/min. The dispersion of Cu was defined by Equation 3-2 and the
specific area of metallic copper was determined from H2 consumption (A2) with 1.46 ×
1019 copper atoms per m2.
Equation 3-2. Determination of copper dispersion
D =2A2
A1× 100%
3.2.7 THERMAL GRAVIMETRIC ANALYSIS (TGA)
Netzsch TG 209 F1 Libra was used to measure thermal gravimetry of the samples and
integrated FTIR was able to provide the information of the evolute gases.
The dried sample (around 12 mg) was placed in the alumina crucibles and the thermal
analysis was performed in pure nitrogen at a heating rate of 2 K/min in the range of 303
K and 1073 K.
Materials and methodology
64
3.2.8 X-RAY PHOTOELECTRON SPECTROSCOPY (XPS)
X-ray photoelectron spectroscopy (XPS) is a technique for elemental composition
analysis of the surface of the solid catalysts and for the oxidation state and electronic of
the predetermined elements [132].
A Kratos Axis ULTRA X-ray Photoelectron Spectrometer equipped with a 165mm
hemispherical electron energy analyser was used to acquire XPS data. The incident
radiation was Monochromatic Al KαX-rays (1486.6 eV) at 150 W (15 kV, 15 mA). The base
pressure in the analysis chamber was set at 1.0 ×10⁻⁹ torr and the pressure of the sample
analysis was maintained at 1.0 ×10⁻⁸ torr. The scanned area was approximately 0.8 mm ×
0.3 mm and the depth was less than 10 nm (the volume is c.a. 2400 µm3). The survey
(wide) scans were taken at an analyser pass energy of 160 eV and were carried out over
the range of 1200 to 0 eV binding energy range with 1.0 eV increment and a dwell time of
100 ms. The multiplex (narrow) high resolution scans at a pass energy of 20 eV and were
run with 0.05 eV step and 250 ms dwell time.
3.2.9 AUGER ELECTRON SPECTROSCOPY (AES)
Auger electron spectroscopy (AES) is obtained from the ejection of the Auger electron
after relaxation of the photoionized atoms [132]. This technique is complementary to the
XPS results and provides additional surface-sensitive information on the surface
compositions and the specific chemical bonding. The operating conditions are same as
that of XPS.
3.2.10 PRODUCTS ANALYSIS METHOD - GAS CHROMATOGRAPHY (GC)
Gas chromatography (GC) is an instrumental technique that is used to analyze the
compositions of mixtures by separating the mixtures into individual components.
Materials and methodology
65
In our present research, both thermal conductivity detector (TCD) and flame ionization
detector (FID) were employed. A configuration of GC, Agilent 7890B, was designed based
on the feed composition and the expected reaction mixture components, including H2, CO,
CO2, CH4, O2, N2, Ar, (CH3)2O, alcohols (C1-C4), CH3OCOH, and HCOOH. Two columns in
series were installed in the TCD line, where the column CP-Molesieve 5 Å was used to
separate CO2, and the other column HP-PLOT-U column was used for the separation of H2,
CO, air, CH4, (CH3)2O and organic compounds. In addition, a column of HP-INNOWax was
installed in the FID line to separate organic products. An automatic liquid sampler was
designed to inject the liquid samples (1 µL) into the vaporiser. The gases in the sampler
tank was injected to the GC manually via a needle valve attached to the GC inlet. The
sampled gases ware initially purged to the GC for 1 minute to remove the gases residues
in the GC lines. A volume of 250 µL of each gases sample was then injected into the column.
Each analysis took 22.5 minutes. The schematic diagram of the valve and detectors in the
GC is shown in Figure 3-1. Since the liquid samples were mainly methanol and methyl
formate, the calibration was carried out based on multi-point calibration by injecting a
series of liquid methanol and methyl formate mixtures with known different
compositions. The calibration calculation of these two compounds can be found in
Appendix C. A ScottTM analytical bottle with number of premixed gases components was
used to identify the retention time of the gases components (The details of the
composition of gases mixtures are shown in Appendix D). The retention time of gases
including CO and (CH3)2O were determined using pure CO and 4.96% (CH3)2O in Ar
mixture, respectively. Calibration of the gases sample was accomplished by a single-point
calibration method and the details of the calibration lines can be found in Appendix D.
• Pure gases: N2, CO, H2, CH4, and CO2
• Mixture gases: Compressed air and 4.96% (CH3)2O in Ar
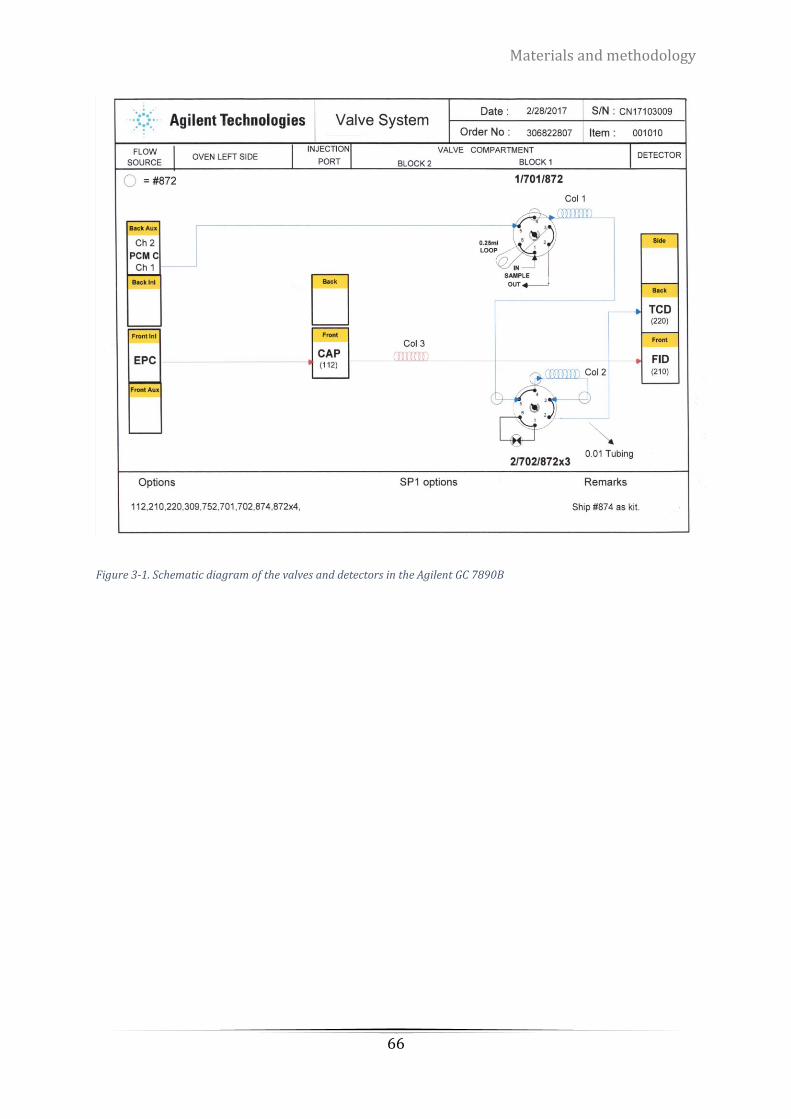
Materials and methodology
66
Figure 3-1. Schematic diagram of the valves and detectors in the Agilent GC 7890B
Solubility study
67
CHAPTER 4 SOLUBILITY STUDY
4.1 OBJECTIVE
In the literature review (Chapter 2), a two-step methanol synthesis via methyl formate
was proposed for investigation in the current research study. Prior to investigating the
kinetics of the two step reactions, it is of great importance to understand the solubilities
of the reactant gases (carbon monoxide and hydrogen) into liquid solvents (methanol and
methyl formate) to evaluate the effect of the mass transfer in the reaction process if the
reaction is controlled by the mass transport process and to understand the equilibrium
limits, if any, of the gases in the liquids.
In this chapter, a validation experiment of CO2 solubility in methanol was carried out to
verify the apparatus and procedure by comparing the results with the literature data. In
addition, the solubilities of CO and H2 in liquid methyl formate and methanol were
measured at different pressures (0.3 MPa to 3.3 MPa) and temperatures (25 °C to 100 °C),
respectively. The Peng-Robinson Equation of State (PR-EoS) was used to fit and validate
the experimental data.
4.2 EXPERIMENTAL APPARATUS AND PROCEDURES
4.2.1 APPARATUS
The apparatus used for solubility measurement in this work was designed based on the
constant-volume methodology, where a measured amount of gas (solute) was brought
into the vessel and contacted with a known volume of pure liquid (solvent) via stirring
until the equilibrium was achieved. The solute solubility in the solvent can be calculated
from fundamental thermodynamic equations.
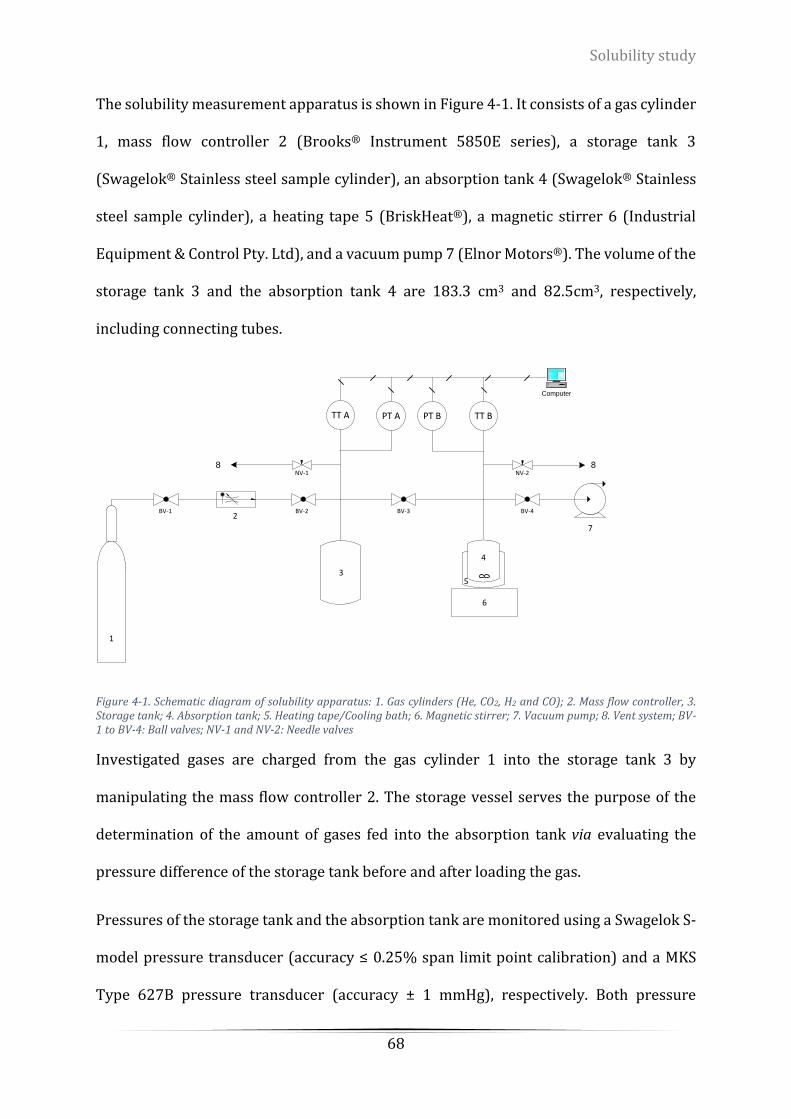
Solubility study
68
The solubility measurement apparatus is shown in Figure 4-1. It consists of a gas cylinder
1, mass flow controller 2 (Brooks® Instrument 5850E series), a storage tank 3
(Swagelok® Stainless steel sample cylinder), an absorption tank 4 (Swagelok® Stainless
steel sample cylinder), a heating tape 5 (BriskHeat®), a magnetic stirrer 6 (Industrial
Equipment & Control Pty. Ltd), and a vacuum pump 7 (Elnor Motors®). The volume of the
storage tank 3 and the absorption tank 4 are 183.3 cm3 and 82.5cm3, respectively,
including connecting tubes.
Figure 4-1. Schematic diagram of solubility apparatus: 1. Gas cylinders (He, CO2, H2 and CO); 2. Mass flow controller, 3. Storage tank; 4. Absorption tank; 5. Heating tape/Cooling bath; 6. Magnetic stirrer; 7. Vacuum pump; 8. Vent system; BV-1 to BV-4: Ball valves; NV-1 and NV-2: Needle valves
Investigated gases are charged from the gas cylinder 1 into the storage tank 3 by
manipulating the mass flow controller 2. The storage vessel serves the purpose of the
determination of the amount of gases fed into the absorption tank via evaluating the
pressure difference of the storage tank before and after loading the gas.
Pressures of the storage tank and the absorption tank are monitored using a Swagelok S-
model pressure transducer (accuracy ≤ 0.25% span limit point calibration) and a MKS
Type 627B pressure transducer (accuracy ± 1 mmHg), respectively. Both pressure
TT A
7
1
6
BV-1 BV-2 BV-3 BV-4
NV-1 NV-2
2
3
PT A PT B TT B
4
5
8 8
Computer
Solubility study
69
transducers are connected to a NI™ USB-6002 data acquisition (DAQ) device and
monitored by the LabVIEW System Design Software. Meanwhile, the pressure of the
absorption tank B is displayed by a power supply digital readout unit (MKS Instruments
Inc, 660B model). Two pressure transducers are calibrated using accurate manometers
to provide precise and reproducible results at a constant operating temperature of 294.6
K.
Temperature inside the absorption tank is controlled using the external heating tape 5
coupled with a temperature controller. Temperatures of both storage tank and
absorption tank are measured using the K-type thermocouples (accuracy ± 0.1 K)
connected to the National Instruments™ (NI™) thermocouple measurement devices and
recorded with the LabVIEW System Design Software.
4.2.2 PROCEDURE
The procedure of vapour-liquid equilibrium measurement at moderate temperatures and
moderate pressures includes the following steps:
1) Leak Test: Prior to every experiment, a leak test is undertaken by injecting Helium to
a certain pressure value and monitoring the stability of the pressure value over two hours.
2) Liquid solvent load and system degas: 12 mL liquid solvent (methanol or methyl
formate) is loaded to the absorption tank 4 under a pure nitrogen environment in a glove
box. The tank is subsequently connected to the process apparatus line via a VCR-gasket
(Swagelok®), and then immersed in dry ice to cool down. The purpose of using dry ice is
to reduce the vapour pressure to an acceptable value (less than 500 Pa) due to the
volatility of solvents. Once the temperature inside of the absorption tank is reduced
below 213 K and the vapor pressure of the volatile solvents is below 200 Pa, a vacuum
Solubility study
70
pump is turned on to degas the apparatus. The solvent loss during the degas step is less
than 0.5 % based on the mass balance calculation, and it is assumed that there is no other
gas contained in the absorption tank after degassing.
3) Gas injection: While waiting for the solvent in the absorption tank 4 to cool down to
213 K, valves BV-1 and BV-2 are opened to load the gas phase solute from gas cylinder to
the storage tank 3 via the mass flow controller (MFC).
4) Solubility experiment: when the pressure inside the storage tank 3 is stabilized, the
valve BV-3 is opened for 3 seconds and then closed, which allows the gas to flow from the
tank 3 to the tank 4. Subsequently, the dry ice is removed, and we wait for the tank 4 to
reach room temperature. Then the heating tape (No. 5 in Figure 4-1) is attached to the
tank 4 and heated up to the preset temperatures, simultaneously the stirrer is turned on
to accelerate the gas-liquid mass transfer. When the pressure measured by the pressure
gauge transducer (PT B in Figure 4-1) is stable, the system is considered to reach the
equilibrium state. In general, the system takes one hour to reach equilibrium.
After the stabilized pressure has been recorded, valves BV-1 and BV-2 are reopened to
load more gas phase solute into the storage tank 3, and then closed again. Thereafter,
valve BV-3 is opened for only 3 seconds to pressurize the tank 4. A new equilibrium
pressure is then achieved after one hour. The steps mentioned in this paragraph are
repeated to get a number of equilibrium pressure values in the tank 4. The final recorded
value is about 3.2 MPa. All pressure and temperature values of the tank 3 and the tank 4
are continuously recorded every 1 second via LabVIEW software.
5) Shut down procedure: When the experiment is completed, the tank 4 is cooled down
to 213 K using dry ice to reduce the vapor pressure inside the tank. A venting step is then
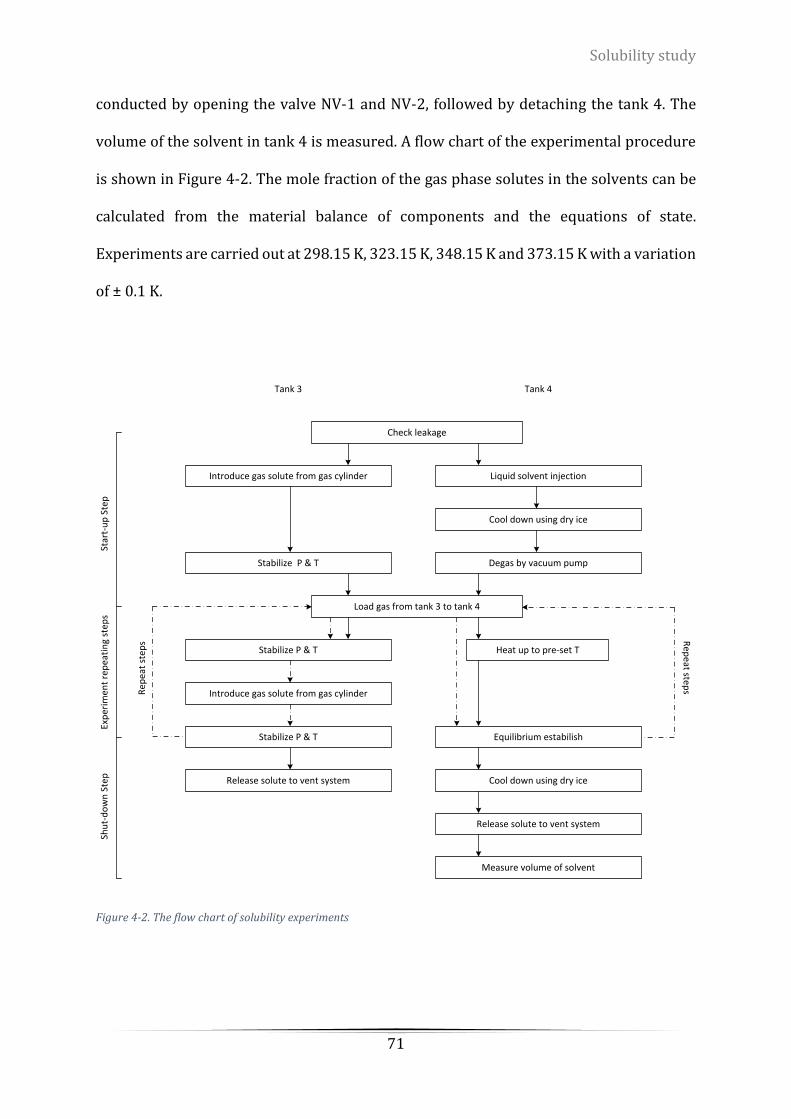
Solubility study
71
conducted by opening the valve NV-1 and NV-2, followed by detaching the tank 4. The
volume of the solvent in tank 4 is measured. A flow chart of the experimental procedure
is shown in Figure 4-2. The mole fraction of the gas phase solutes in the solvents can be
calculated from the material balance of components and the equations of state.
Experiments are carried out at 298.15 K, 323.15 K, 348.15 K and 373.15 K with a variation
of ± 0.1 K.
Figure 4-2. The flow chart of solubility experiments
Tank 3
Check leakage
Introduce gas solute from gas cylinder Liquid solvent injection
Stabilize P & T
Cool down using dry ice
Load gas from tank 3 to tank 4
Tank 4
Degas by vacuum pump
Stabilize P & T
Introduce gas solute from gas cylinder
Stabilize P & T Equilibrium estabilish
Heat up to pre-set T
Release solute to vent system Cool down using dry ice
Release solute to vent system
Measure volume of solvent
Shu
t-d
ow
n S
tep
Exp
erim
ent
rep
eati
ng
step
sSt
art-
up
Ste
p
Rep
eat
step
s Rep
eat steps
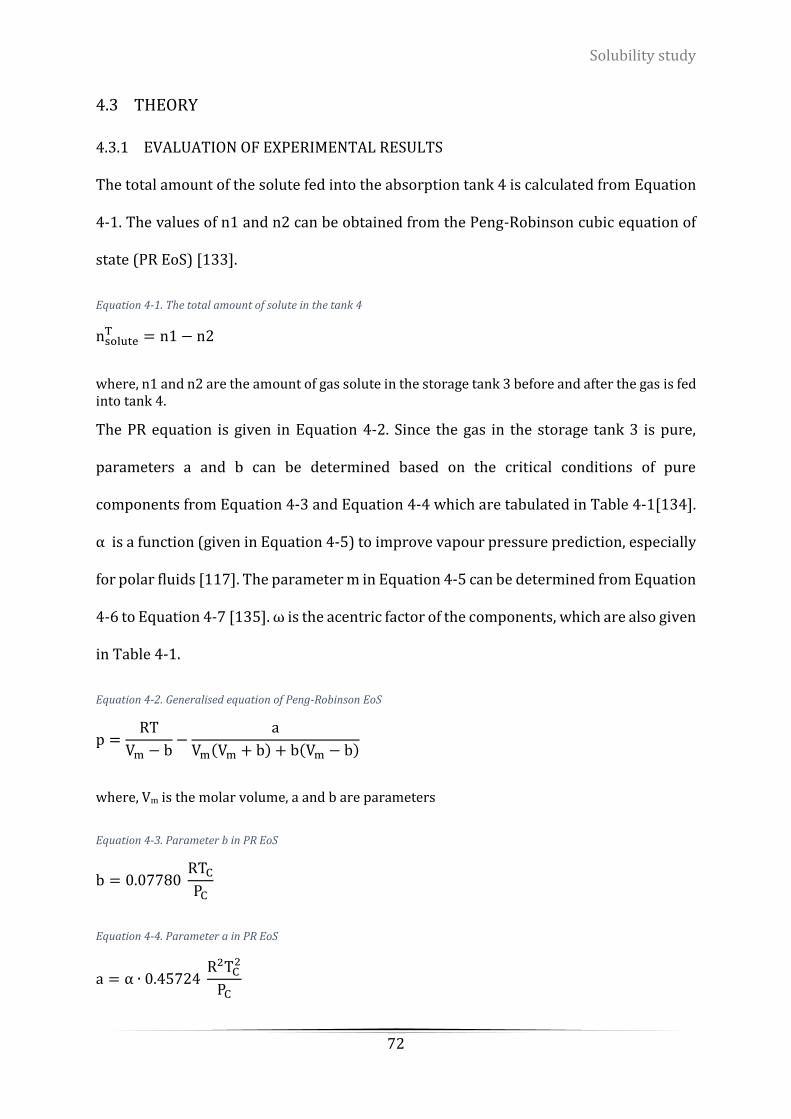
Solubility study
72
4.3 THEORY
4.3.1 EVALUATION OF EXPERIMENTAL RESULTS
The total amount of the solute fed into the absorption tank 4 is calculated from Equation
4-1. The values of n1 and n2 can be obtained from the Peng-Robinson cubic equation of
state (PR EoS) [133].
Equation 4-1. The total amount of solute in the tank 4
nsoluteT = n1 − n2
where, n1 and n2 are the amount of gas solute in the storage tank 3 before and after the gas is fed into tank 4.
The PR equation is given in Equation 4-2. Since the gas in the storage tank 3 is pure,
parameters a and b can be determined based on the critical conditions of pure
components from Equation 4-3 and Equation 4-4 which are tabulated in Table 4-1[134].
α is a function (given in Equation 4-5) to improve vapour pressure prediction, especially
for polar fluids [117]. The parameter m in Equation 4-5 can be determined from Equation
4-6 to Equation 4-7 [135]. ω is the acentric factor of the components, which are also given
in Table 4-1.
Equation 4-2. Generalised equation of Peng-Robinson EoS
p =RT
Vm − b−
a
Vm(Vm + b) + b(Vm − b)
where, Vm is the molar volume, a and b are parameters
Equation 4-3. Parameter b in PR EoS
b = 0.07780 RTC
PC
Equation 4-4. Parameter a in PR EoS
a = α ∙ 0.45724 R2TC
2
PC

Solubility study
73
Equation 4-5. alpha function
α(T) = [1 + m(1 − √Tr)]2
Equation 4-6. Determination of mi when acentric factor less than 0.49
m = 0.37464 + 1.54226ω − 0.26992ω2 for ω < 0.49
Equation 4-7. Determination of mi when acentric factor above 0.49
m = 0.376942 + 1.48503ω − 0.1644ω2 + 0.016667ω3 for ω > 0.49
Table 4-1. Physical properties of pure components
Components MW (g/mol) Tc (K) Pc (MPa) Vc (m3/mol) Zc Acentric factor CH3OH 32.04 512.58 8.0959 0.1178 0.224 0.5656 CH3OCOH 60.05 487.20 5.9984 0.172 0.255 0.2537 H2 2.016 33.25 1.297 0.06503 0.305 -0.2153 CO 28.01 132.92 3.4988 0.0931 0.295 0.0663 CO2 44.01 304.21 7.383 0.094 0.274 0.223621
The total amount of solvents fed into the absorption tank 4 can be determined using
Equation 4-8. The density can be calculated using the DIPPR equation (shown in Equation
4-9), where the parameter A, B, C and D are listed in Table 4-2.
Equation 4-8. Total moles of solvents in the equilibrium cell
nsolventT =
ρVL
MW
where, ρ is the density of the solvent at ambient temperature, MW is the molecular weight of the solvent, VL is the liquid volume.
Equation 4-9. The density of the solvent
ρ =A
B1+(1−TC
)D × MW
Table 4-2. The parameters for the solvent density determination
Solvents A B C D Methanol 1.2057 0.19779 512.63 0.17272 Methyl formate 1.1639 0.23213 497.22 0.23826
The total pressure in the absorption tank 4 is the sum of the partial pressure of the gas
phase solute and the partial pressure of the liquid solvent, which can be written in
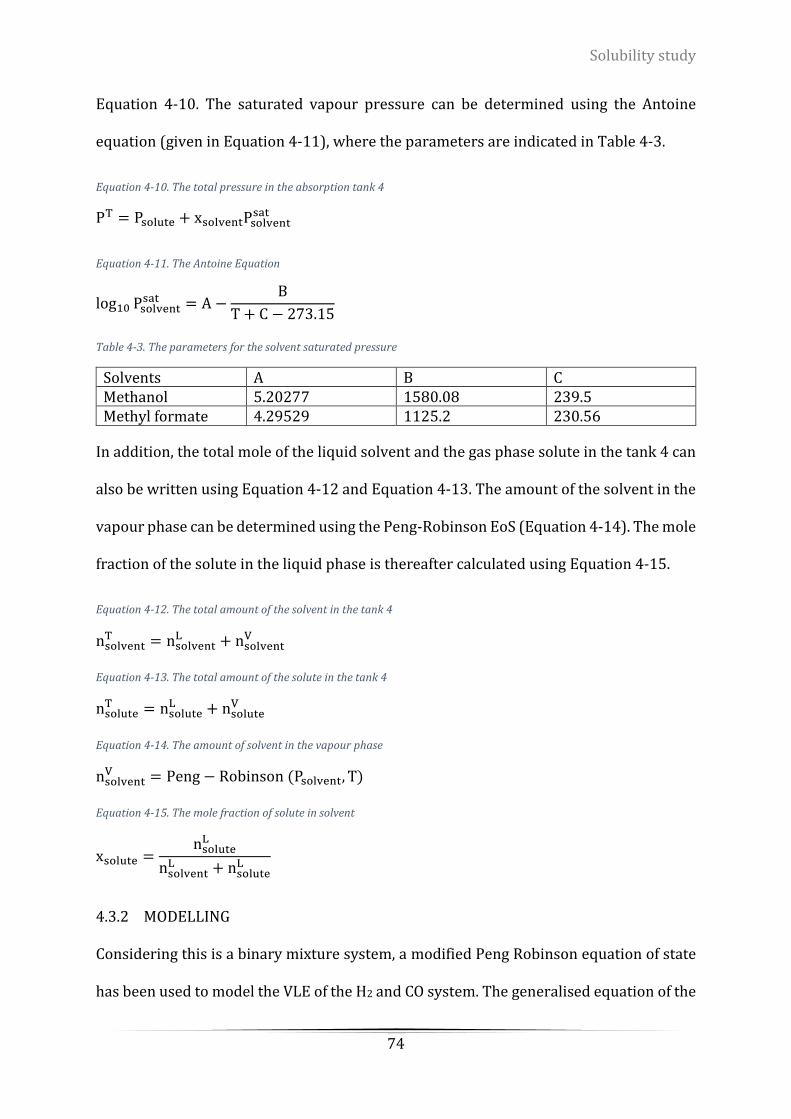
Solubility study
74
Equation 4-10. The saturated vapour pressure can be determined using the Antoine
equation (given in Equation 4-11), where the parameters are indicated in Table 4-3.
Equation 4-10. The total pressure in the absorption tank 4
PT = Psolute + xsolventPsolventsat
Equation 4-11. The Antoine Equation
log10 Psolventsat = A −
B
T + C − 273.15
Table 4-3. The parameters for the solvent saturated pressure
Solvents A B C Methanol 5.20277 1580.08 239.5 Methyl formate 4.29529 1125.2 230.56
In addition, the total mole of the liquid solvent and the gas phase solute in the tank 4 can
also be written using Equation 4-12 and Equation 4-13. The amount of the solvent in the
vapour phase can be determined using the Peng-Robinson EoS (Equation 4-14). The mole
fraction of the solute in the liquid phase is thereafter calculated using Equation 4-15.
Equation 4-12. The total amount of the solvent in the tank 4
nsolventT = nsolvent
L + nsolventV
Equation 4-13. The total amount of the solute in the tank 4
nsoluteT = nsolute
L + nsoluteV
Equation 4-14. The amount of solvent in the vapour phase
nsolventV = Peng − Robinson (Psolvent, T)
Equation 4-15. The mole fraction of solute in solvent
xsolute =nsolute
L
nsolventL + nsolute
L
4.3.2 MODELLING
Considering this is a binary mixture system, a modified Peng Robinson equation of state
has been used to model the VLE of the H2 and CO system. The generalised equation of the
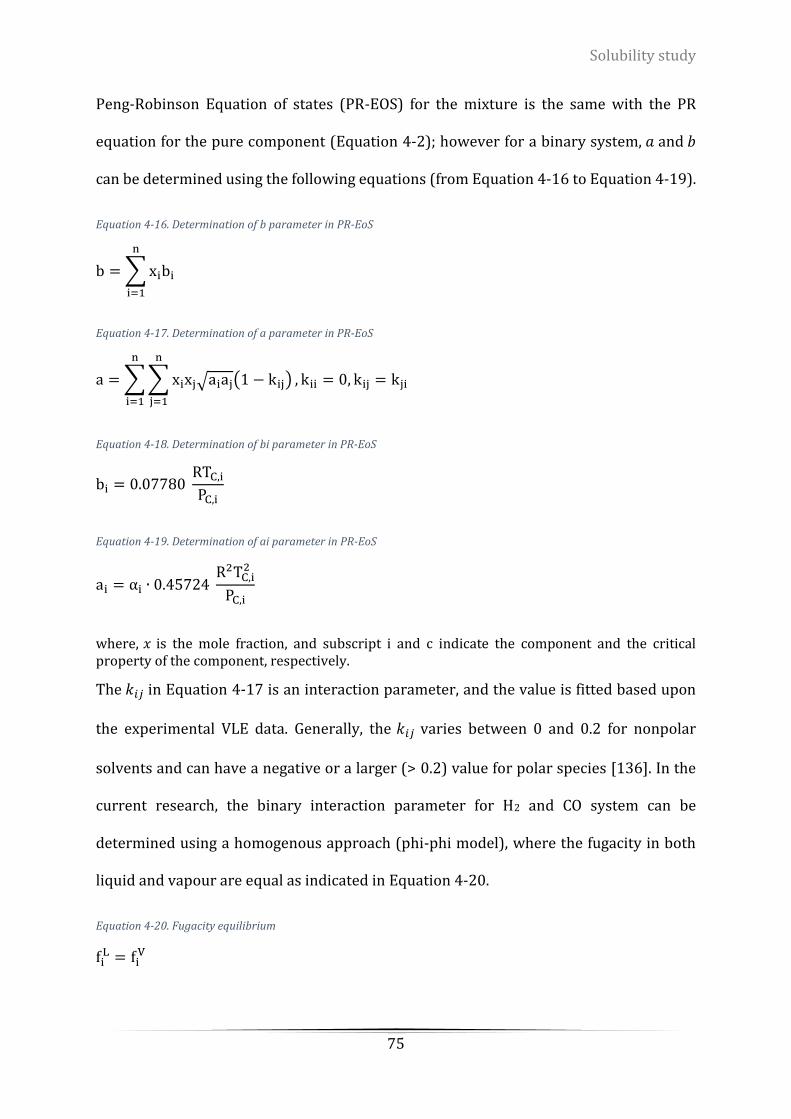
Solubility study
75
Peng-Robinson Equation of states (PR-EOS) for the mixture is the same with the PR
equation for the pure component (Equation 4-2); however for a binary system, 𝑎 and 𝑏
can be determined using the following equations (from Equation 4-16 to Equation 4-19).
Equation 4-16. Determination of b parameter in PR-EoS
b = ∑ xibi
n
i=1
Equation 4-17. Determination of a parameter in PR-EoS
a = ∑ ∑ xixj√aiaj(1 − kij)
n
j=1
n
i=1
, kii = 0, kij = kji
Equation 4-18. Determination of bi parameter in PR-EoS
bi = 0.07780 RTC,i
PC,i
Equation 4-19. Determination of ai parameter in PR-EoS
ai = αi ∙ 0.45724 R2TC,i
2
PC,i
where, 𝑥 is the mole fraction, and subscript i and c indicate the component and the critical property of the component, respectively.
The 𝑘𝑖𝑗 in Equation 4-17 is an interaction parameter, and the value is fitted based upon
the experimental VLE data. Generally, the 𝑘𝑖𝑗 varies between 0 and 0.2 for nonpolar
solvents and can have a negative or a larger (> 0.2) value for polar species [136]. In the
current research, the binary interaction parameter for H2 and CO system can be
determined using a homogenous approach (phi-phi model), where the fugacity in both
liquid and vapour are equal as indicated in Equation 4-20.
Equation 4-20. Fugacity equilibrium
fiL = fi
V
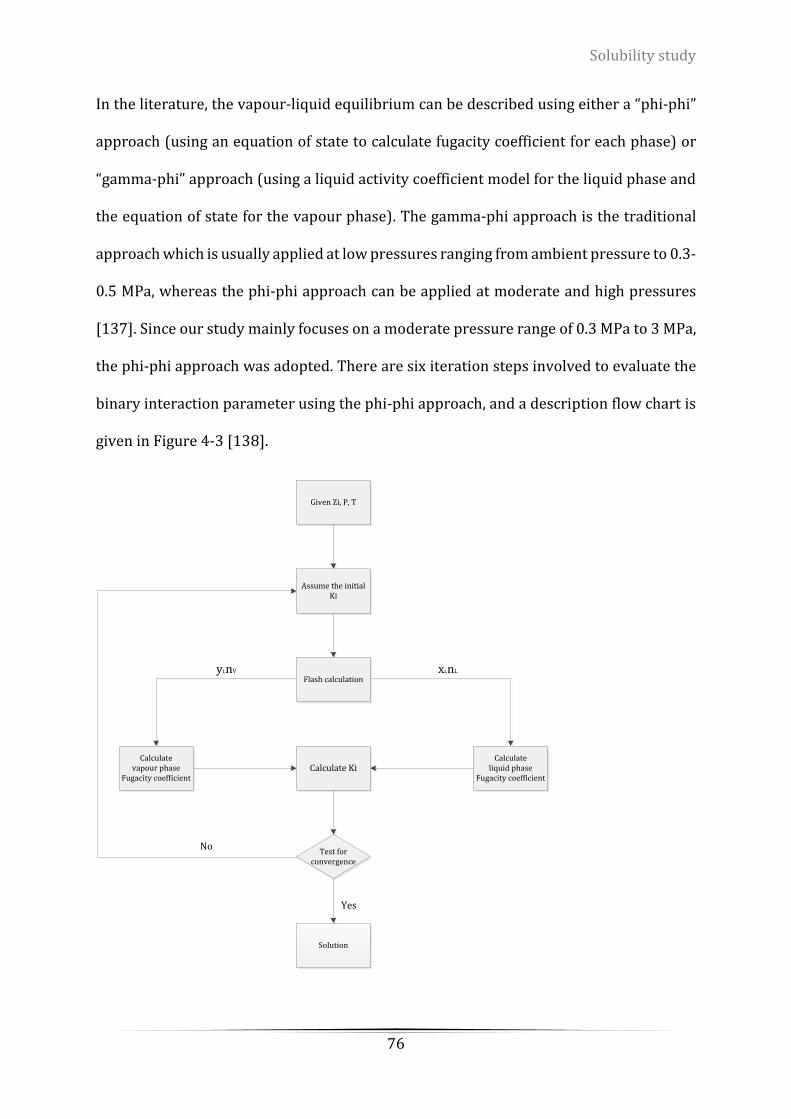
Solubility study
76
In the literature, the vapour-liquid equilibrium can be described using either a “phi-phi”
approach (using an equation of state to calculate fugacity coefficient for each phase) or
“gamma-phi” approach (using a liquid activity coefficient model for the liquid phase and
the equation of state for the vapour phase). The gamma-phi approach is the traditional
approach which is usually applied at low pressures ranging from ambient pressure to 0.3-
0.5 MPa, whereas the phi-phi approach can be applied at moderate and high pressures
[137]. Since our study mainly focuses on a moderate pressure range of 0.3 MPa to 3 MPa,
the phi-phi approach was adopted. There are six iteration steps involved to evaluate the
binary interaction parameter using the phi-phi approach, and a description flow chart is
given in Figure 4-3 [138].
Given Zi, P, T
Assume the initial Ki
Flash calculation
Calculate KiCalculate
vapour phase Fugacity coefficient
Calculate liquid phase
Fugacity coefficient
Test for convergence
Solution
xi,nLyi,nV
No
Yes
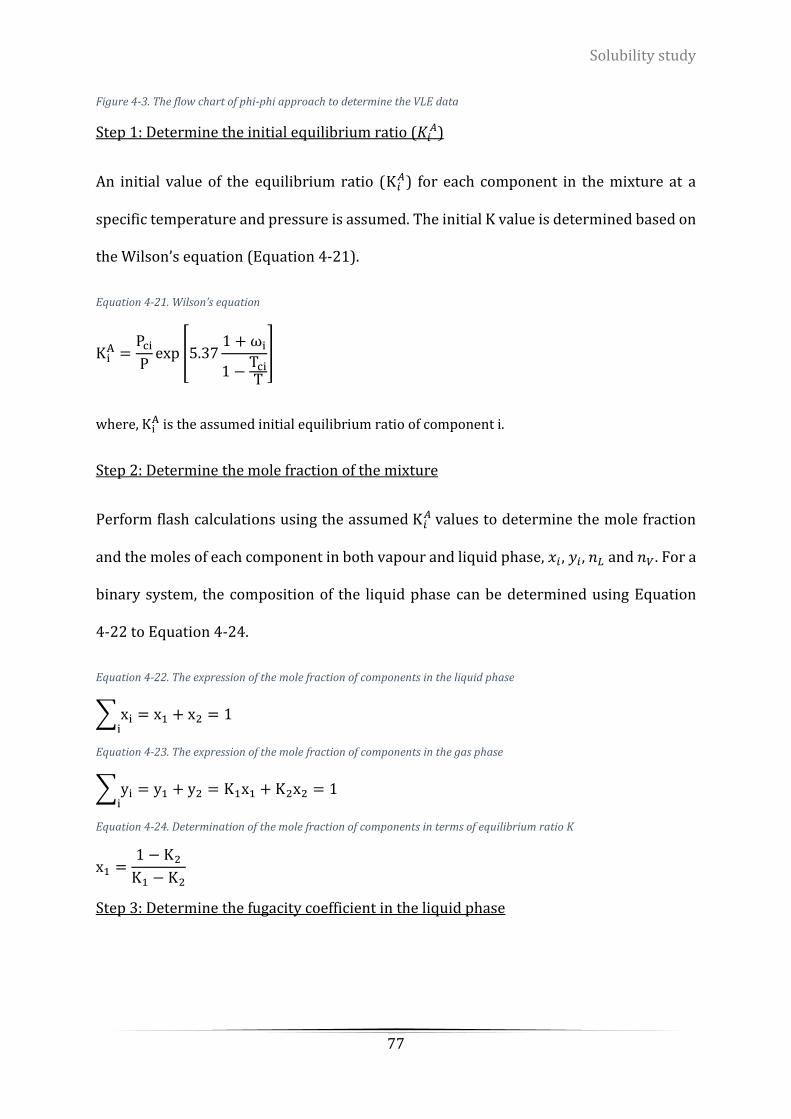
Solubility study
77
Figure 4-3. The flow chart of phi-phi approach to determine the VLE data
Step 1: Determine the initial equilibrium ratio (𝐾𝑖𝐴)
An initial value of the equilibrium ratio (Κ𝑖𝐴) for each component in the mixture at a
specific temperature and pressure is assumed. The initial K value is determined based on
the Wilson’s equation (Equation 4-21).
Equation 4-21. Wilson’s equation
ΚiA =
Pci
Pexp [5.37
1 + ωi
1 −Tci
T
]
where, ΚiA is the assumed initial equilibrium ratio of component i.
Step 2: Determine the mole fraction of the mixture
Perform flash calculations using the assumed Κ𝑖𝐴 values to determine the mole fraction
and the moles of each component in both vapour and liquid phase, 𝑥𝑖 , 𝑦𝑖, 𝑛𝐿 and 𝑛𝑉 . For a
binary system, the composition of the liquid phase can be determined using Equation
4-22 to Equation 4-24.
Equation 4-22. The expression of the mole fraction of components in the liquid phase
∑ xii
= x1 + x2 = 1
Equation 4-23. The expression of the mole fraction of components in the gas phase
∑ yii
= y1 + y2 = K1x1 + K2x2 = 1
Equation 4-24. Determination of the mole fraction of components in terms of equilibrium ratio K
x1 =1 − K2
K1 − K2
Step 3: Determine the fugacity coefficient in the liquid phase

Solubility study
78
The calculated composition of the liquid phase 𝑥𝑖 is used to determine the fugacity
coefficient Φ𝑖𝐿 of each component in the liquid phase. The evaluation expressions are
shown from Equation 4-25 to Equation 4-28.
Equation 4-25. Fugacity coefficient of components in the liquid phase
ln(ΦiL) =
bi(ZL − 1)
bm− ln(ZL − B) − [
A
2√2B] [
2ΨiL
(aα)mL
−bi
bmL
] ln [ZL + (1 + √2)B
ZL − (1 − √2)B]
Equation 4-26. Determination of the mixture parameter Ѱ in the liquid phase
ΨiL = ∑[xj√aiajαiαj(1 − kij)]
j
Equation 4-27. Determination of the mixture parameter 𝑎𝛼 in the liquid phase
(aα)mL = ∑ ∑[xixj
ji
√aiajαiαj(1 − kij)]
Equation 4-28. Determination of the mixture parameter b in the liquid phase
bmL = ∑(xibi)
i
Step 4: Determine fugacity coefficient in the gas phase
Use the calculated composition of the gas phase 𝑥𝑖 to determine the fugacity coefficient
Φ𝑖𝐺 of each component in the gas phase.
Equation 4-29. Fugacity coefficient of components in the gas phase
ln(ΦiV) =
bi(ZV − 1)
bm− ln(ZV − B) − [
A
2√2B] [
2ΨiV
(aα)mV −
bi
bmV ] ln [
ZV + (1 + √2)B
ZV − (1 − √2)B]
Equation 4-30. Determination of the mixture parameter Ѱ in the gas phase
ΨiV = ∑[yj√aiajαiαj(1 − kij)]
j
Equation 4-31. Determination of the mixture parameter 𝑎𝛼 in the gas phase

Solubility study
79
(aα)mV = ∑ ∑[yiyj
ji
√aiajαiαj(1 − kij)]
Equation 4-32. Determination of the mixture parameter b in the gas phase
bmV = ∑(yibi)
i
Step 5: Determine the new equilibrium ratio 𝐾
Determine a new set of equilibrium ratios from Equation 4-33 using the values obtained
from step 3 and step 4.
Equation 4-33. Evaluation of a new equilibrium ratio K
K =Φi
L
ΦiV
Step 6: Test for convergence
Check the solution by applying the constrains that is given in Equation 4-34.
Equation 4-34. Convergence constrains
∑ [Ki
KiA
− 1]
2n
i=1
≤ ε
where, ε is the error tolerance, in this case, we choose 0.00001
n is the number of components in the system
4.3.3 UNCERTAINTY CALCULATION
The uncertainties of the measurement should be constrained within the system errors at
different temperatures, pressures, and volumes. The experimental errors for the
temperature, the pressure and the volume are u(T) =0.2 K, u(Pstorage tank) = 0.001 MPa,
u(Pequilibrium tank) = 200 Pa, and u(V) = 0.02 mL, respectively. Based on the method for the
estimation of uncertainties, the overall uncertainty for the measured solubility can be
determined using Equation 4-35, Equation 4-36 and Equation 4-37.
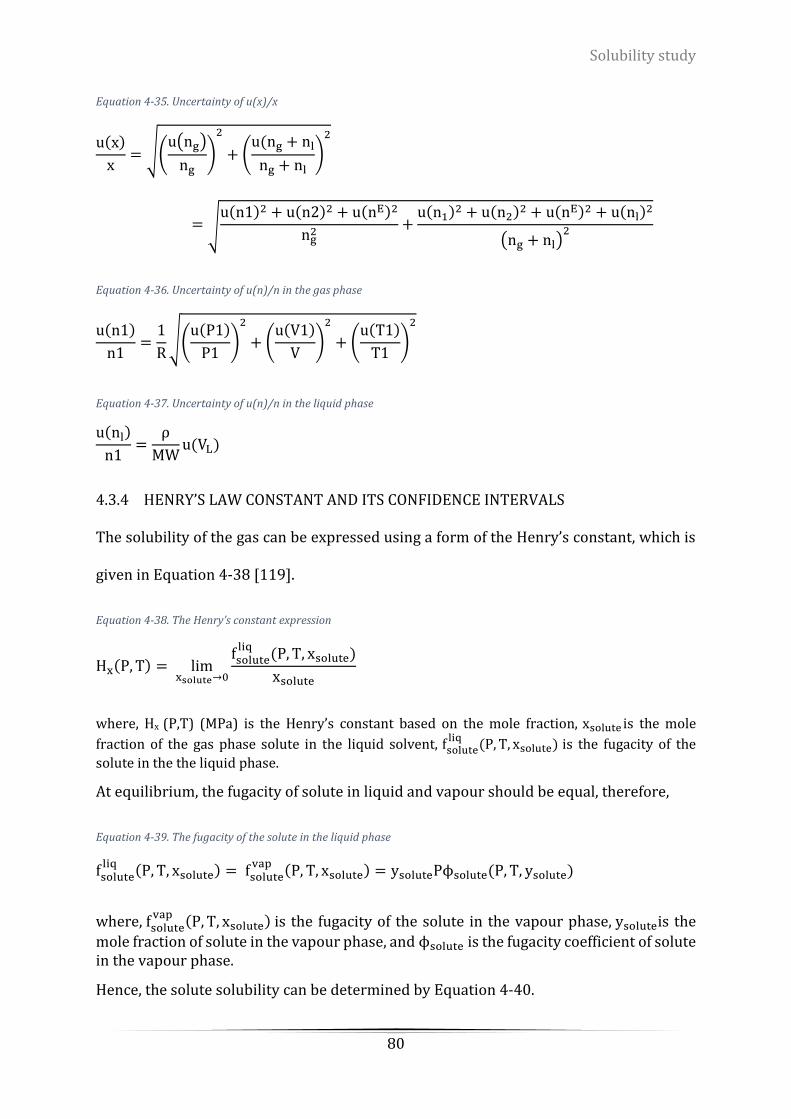
Solubility study
80
Equation 4-35. Uncertainty of u(x)/x
u(x)
x= √(
u(ng)
ng)
2
+ (u(ng + nl
ng + nl)
2
= √u(n1)2 + u(n2)2 + u(nE)2
ng2
+u(n1)2 + u(n2)2 + u(nE)2 + u(nl)2
(ng + nl)2
Equation 4-36. Uncertainty of u(n)/n in the gas phase
u(n1)
n1=
1
R√(
u(P1)
P1)
2
+ (u(V1)
V)
2
+ (u(T1)
T1)
2
Equation 4-37. Uncertainty of u(n)/n in the liquid phase
u(nl)
n1=
ρ
MWu(VL)
4.3.4 HENRY’S LAW CONSTANT AND ITS CONFIDENCE INTERVALS
The solubility of the gas can be expressed using a form of the Henry’s constant, which is
given in Equation 4-38 [119].
Equation 4-38. The Henry’s constant expression
Hx(P, T) = limxsolute→0
fsoluteliq
(P, T, xsolute)
xsolute
where, Hx (P,T) (MPa) is the Henry’s constant based on the mole fraction, xsolute is the mole
fraction of the gas phase solute in the liquid solvent, fsoluteliq
(P, T, xsolute) is the fugacity of the
solute in the the liquid phase.
At equilibrium, the fugacity of solute in liquid and vapour should be equal, therefore,
Equation 4-39. The fugacity of the solute in the liquid phase
fsoluteliq (P, T, xsolute) = fsolute
vap (P, T, xsolute) = ysolutePϕsolute(P, T, ysolute)
where, fsolutevap (P, T, xsolute) is the fugacity of the solute in the vapour phase, ysoluteis the
mole fraction of solute in the vapour phase, and ϕsolute is the fugacity coefficient of solute in the vapour phase.
Hence, the solute solubility can be determined by Equation 4-40.
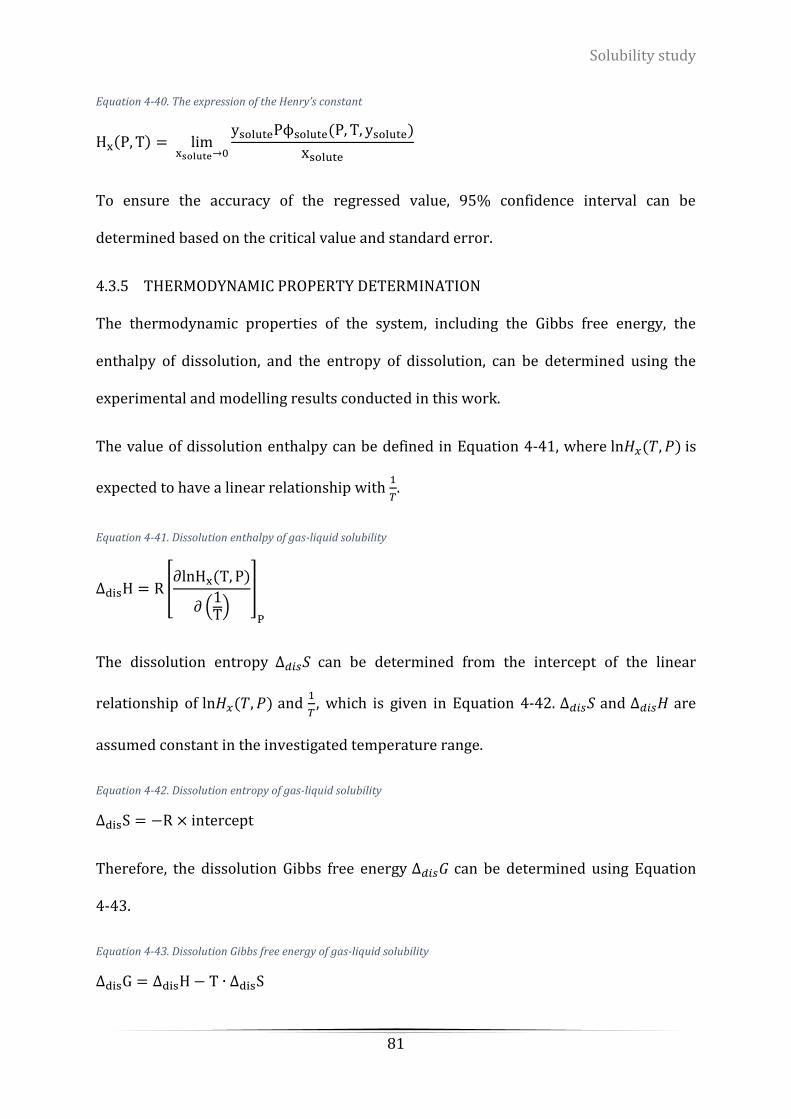
Solubility study
81
Equation 4-40. The expression of the Henry’s constant
Hx(P, T) = limxsolute→0
ysolutePϕsolute(P, T, ysolute)
xsolute
To ensure the accuracy of the regressed value, 95% confidence interval can be
determined based on the critical value and standard error.
4.3.5 THERMODYNAMIC PROPERTY DETERMINATION
The thermodynamic properties of the system, including the Gibbs free energy, the
enthalpy of dissolution, and the entropy of dissolution, can be determined using the
experimental and modelling results conducted in this work.
The value of dissolution enthalpy can be defined in Equation 4-41, where ln𝐻𝑥(𝑇, 𝑃) is
expected to have a linear relationship with 1
𝑇.
Equation 4-41. Dissolution enthalpy of gas-liquid solubility
∆disH = R [∂lnHx(T, P)
∂ (1T)
]
P
The dissolution entropy ∆𝑑𝑖𝑠𝑆 can be determined from the intercept of the linear
relationship of ln𝐻𝑥(𝑇, 𝑃) and 1
𝑇, which is given in Equation 4-42. ∆𝑑𝑖𝑠𝑆 and ∆𝑑𝑖𝑠𝐻 are
assumed constant in the investigated temperature range.
Equation 4-42. Dissolution entropy of gas-liquid solubility
∆disS = −R × intercept
Therefore, the dissolution Gibbs free energy ∆𝑑𝑖𝑠𝐺 can be determined using Equation
4-43.
Equation 4-43. Dissolution Gibbs free energy of gas-liquid solubility
∆disG = ∆disH − T ∙ ∆disS

Solubility study
82
4.4 DATA ANALYSIS
4.4.1 VALIDATION OF THE EXPERIMENTAL APPARATUS
Before conducting the solubility experiments, it is necessary to test the reliability of the
experimental apparatus for the current system. Since the vapour-liquid equilibrium of
CO2-methanol system has been extensively studied and a great amount of data is available
in the literature, a validation experiment was carried out using CO2 dissolved into the
liquid methanol in our experimental apparatus to validate the experimental setup and
the data processing method discussed in Section 4.3.
The VLE data for CO2-methanol system was measured at four different temperatures
(300.78 K, 322.91 K, 351.33 K and 376.61 K) with a pressure range of 0.2 MPa to 2.8 MPa.
The results are listed in Table 4-4 and the data are plotted in Figure 4-4.
Table 4-4. Partial pressure (PCO2), liquid phase mole fraction (xi), and uncertainties (δ) of CO2 in methanol from 298.15 K to 373.15 K
𝐏𝐂𝐎𝟐 (MPa) 𝐱𝐢 𝛅 𝐏𝐂𝐎𝟐
(MPa) 𝐱𝐢 𝛅
T=300.78 K T=322.91 K 0.2477 0.0160 0.0004 0.3192 0.0147 0.0004 0.4856 0.0315 0.0007 0.5276 0.0244 0.0007 0.8526 0.0551 0.0006 0.9124 0.0414 0.0006 1.2915 0.0843 0.0008 1.3560 0.0614 0.0008 1.7528 0.1164 0.0010 1.8353 0.0839 0.0010 2.2281 0.1506 0.0012 2.3308 0.1081 0.0010 2.7119 0.1847 0.0014 2.8268 0.1338 0.0014
T=351.33 K T=376.36 K 0.3175 0.0128 0.0004 0.6228 0.0210 0.0019 0.4897 0.0177 0.0007 0.8078 0.0251 0.0001 0.8820 0.0286 0.0006 1.2057 0.0338 0.0008 1.3475 0.0414 0.0009 1.6836 0.0448 0.0011 1.8406 0.0556 0.0012 2.1908 0.0553 0.0014 2.3573 0.0723 0.0015 2.7128 0.0695 0.0017 2.8797 0.0908 0.0017

Solubility study
83
Figure 4-4. The comparison of the experimental results with the literature data
Since the published gas-liquid equilibrium experiments for CO2-methanol system were
performed at various operating conditions, it is difficult to obtain the experimental data
from the literature at the exactly same operating conditions as our work. Hence, to ensure
high accuracy and consistency, the published VLE data that were measured at the
temperatures close to our experimental conditions were selected [104], [106], [139]–
[142]. As can be seen from Figure 4-4, both the measured data in the apparatus and the
literature data of CO2-methanol system have good agreement at these four different
temperatures.
Moreover, as the solubility of CO2 in methanol is larger compared with the solubility of
other gases such as H2 and CO in methanol, it was necessary to test the sensitivity of the
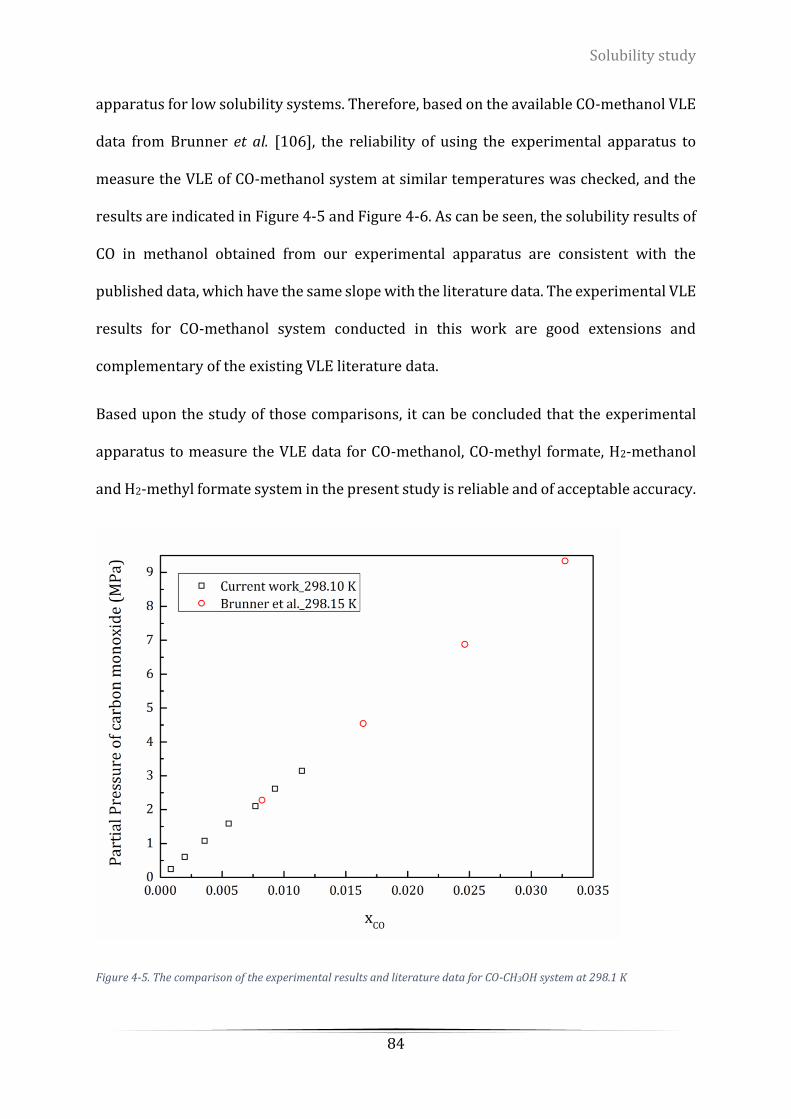
Solubility study
84
apparatus for low solubility systems. Therefore, based on the available CO-methanol VLE
data from Brunner et al. [106], the reliability of using the experimental apparatus to
measure the VLE of CO-methanol system at similar temperatures was checked, and the
results are indicated in Figure 4-5 and Figure 4-6. As can be seen, the solubility results of
CO in methanol obtained from our experimental apparatus are consistent with the
published data, which have the same slope with the literature data. The experimental VLE
results for CO-methanol system conducted in this work are good extensions and
complementary of the existing VLE literature data.
Based upon the study of those comparisons, it can be concluded that the experimental
apparatus to measure the VLE data for CO-methanol, CO-methyl formate, H2-methanol
and H2-methyl formate system in the present study is reliable and of acceptable accuracy.
Figure 4-5. The comparison of the experimental results and literature data for CO-CH3OH system at 298.1 K
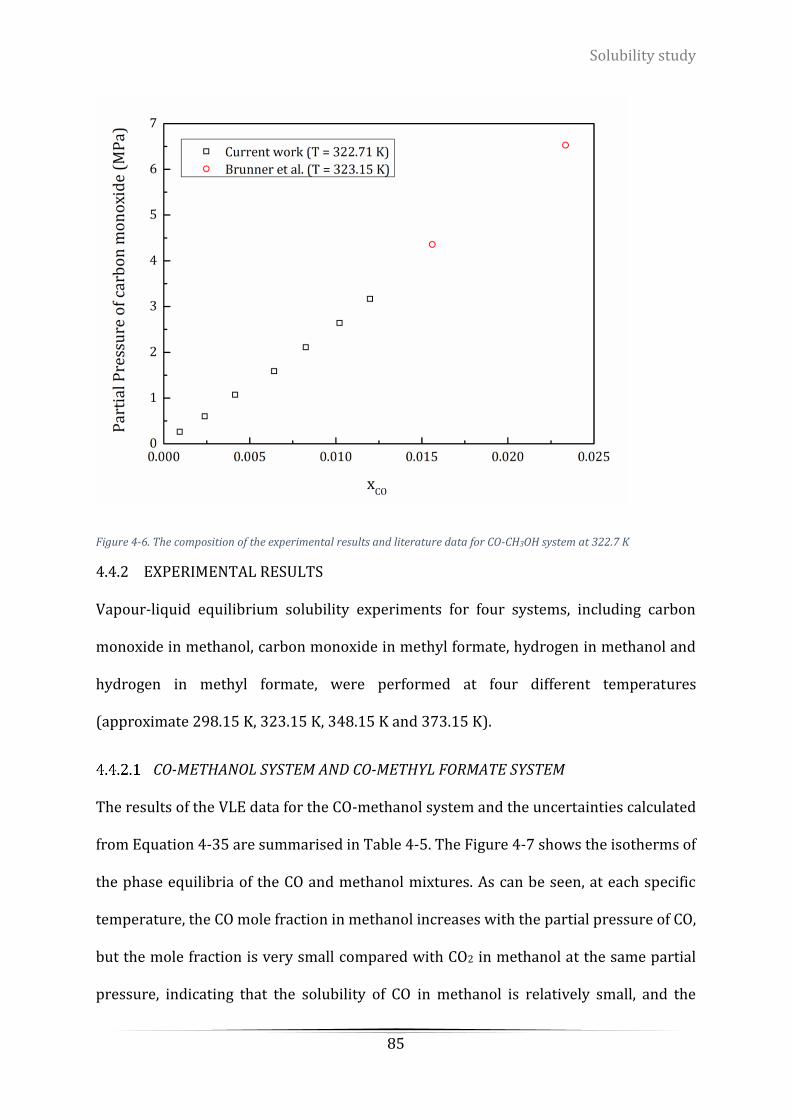
Solubility study
85
Figure 4-6. The composition of the experimental results and literature data for CO-CH3OH system at 322.7 K
4.4.2 EXPERIMENTAL RESULTS
Vapour-liquid equilibrium solubility experiments for four systems, including carbon
monoxide in methanol, carbon monoxide in methyl formate, hydrogen in methanol and
hydrogen in methyl formate, were performed at four different temperatures
(approximate 298.15 K, 323.15 K, 348.15 K and 373.15 K).
CO-METHANOL SYSTEM AND CO-METHYL FORMATE SYSTEM
The results of the VLE data for the CO-methanol system and the uncertainties calculated
from Equation 4-35 are summarised in Table 4-5. The Figure 4-7 shows the isotherms of
the phase equilibria of the CO and methanol mixtures. As can be seen, at each specific
temperature, the CO mole fraction in methanol increases with the partial pressure of CO,
but the mole fraction is very small compared with CO2 in methanol at the same partial
pressure, indicating that the solubility of CO in methanol is relatively small, and the

Solubility study
86
Henry’s constant for the CO-methanol system is significantly larger (shown in Table 4-5)
than that of CO2 in methanol. It is noted that the VLE of the CO-methanol system presents
some interesting trends when changing the temperature. The solubility of CO increases
with the increase of the temperature, which is opposite of the typical trend where gas
solubility decreases with increasing the temperature. In most cases, high temperatures
increase the kinetic energy and the Brownian motion of the solute molecules in the liquid
phase, and this increase in thermal energy (kT) exceeds the attractive solute-solvent
interaction, leading to a drop in solubility as temperature increases. However, this
explanation is not applicable for the CO-methanol system. From Figure 4-7, it can be seen
that at the same partial pressure of CO, when increasing the temperature, the liquid mole
fraction of CO in methanol increases, which means that kinetic energy (kT) of the
dissolved CO molecules may not be the dominant factor of the VLE in the CO-methanol
system, and this is also reflected by the Henry’s constants shown in Table 4-5, where the
Henry’s constant decreases with increasing temperature. The phenomenon has also been
found in other published works [102], [106], [123]. One explanation is that CO has
stronger solute-solute interactions than solute-solvent interactions, and they prefer to
associate with themselves rather than the solvents. As the temperature increases, the
thermal expansion of the liquid reduces the opportunities for solute-solvent interactions
and increases the opportunities for solute-solute interactions, leading to an increase in
solubility of CO gas solutes. Although the solvent still expands with increase in
temperature for these systems, this effect can be negligible due to the strong interaction
between the gas molecules and the solvent. As a consequence of these relative energetic
interactions, CO dissolves into methanol and methyl formate are endothermic processes,
where the sum enthalpy of the separation of gas molecules and the separation of liquid
molecules is greater than the enthalpy of mixing gas molecules and liquid molecules. High
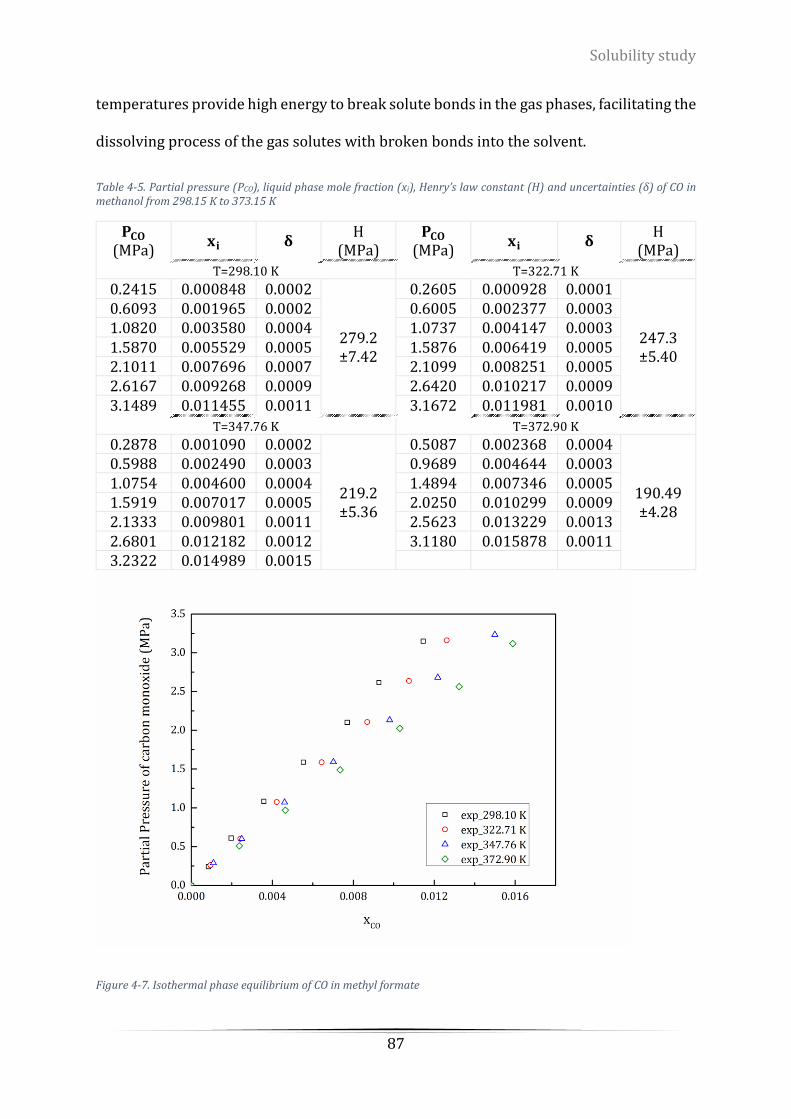
Solubility study
87
temperatures provide high energy to break solute bonds in the gas phases, facilitating the
dissolving process of the gas solutes with broken bonds into the solvent.
Table 4-5. Partial pressure (PCO), liquid phase mole fraction (xi), Henry’s law constant (H) and uncertainties (δ) of CO in methanol from 298.15 K to 373.15 K
𝐏𝐂𝐎
(MPa) 𝐱𝐢 𝛅
H (MPa)
𝐏𝐂𝐎
(MPa) 𝐱𝐢 𝛅
H (MPa)
T=298.10 K T=322.71 K
0.2415 0.000848 0.0002
279.2 ±7.42
0.2605 0.000928 0.0001
247.3 ±5.40
0.6093 0.001965 0.0002 0.6005 0.002377 0.0003 1.0820 0.003580 0.0004 1.0737 0.004147 0.0003 1.5870 0.005529 0.0005 1.5876 0.006419 0.0005 2.1011 0.007696 0.0007 2.1099 0.008251 0.0005 2.6167 0.009268 0.0009 2.6420 0.010217 0.0009 3.1489 0.011455 0.0011 3.1672 0.011981 0.0010
T=347.76 K T=372.90 K
0.2878 0.001090 0.0002
219.2 ±5.36
0.5087 0.002368 0.0004
190.49 ±4.28
0.5988 0.002490 0.0003 0.9689 0.004644 0.0003 1.0754 0.004600 0.0004 1.4894 0.007346 0.0005 1.5919 0.007017 0.0005 2.0250 0.010299 0.0009 2.1333 0.009801 0.0011 2.5623 0.013229 0.0013 2.6801 0.012182 0.0012 3.1180 0.015878 0.0011 3.2322 0.014989 0.0015
Figure 4-7. Isothermal phase equilibrium of CO in methyl formate
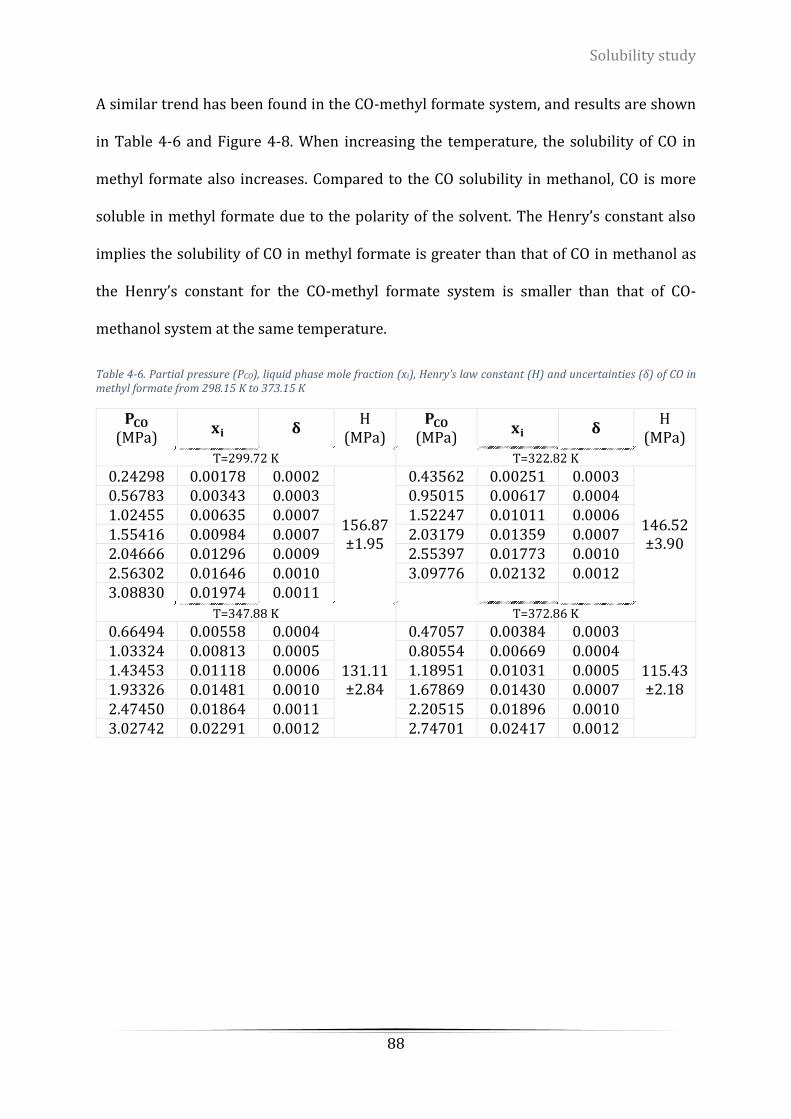
Solubility study
88
A similar trend has been found in the CO-methyl formate system, and results are shown
in Table 4-6 and Figure 4-8. When increasing the temperature, the solubility of CO in
methyl formate also increases. Compared to the CO solubility in methanol, CO is more
soluble in methyl formate due to the polarity of the solvent. The Henry’s constant also
implies the solubility of CO in methyl formate is greater than that of CO in methanol as
the Henry’s constant for the CO-methyl formate system is smaller than that of CO-
methanol system at the same temperature.
Table 4-6. Partial pressure (PCO), liquid phase mole fraction (xi), Henry’s law constant (H) and uncertainties (δ) of CO in methyl formate from 298.15 K to 373.15 K
𝐏𝐂𝐎
(MPa) 𝐱𝐢 𝛅
H (MPa)
𝐏𝐂𝐎
(MPa) 𝐱𝐢 𝛅
H (MPa)
T=299.72 K T=322.82 K
0.24298 0.00178 0.0002
156.87 ±1.95
0.43562 0.00251 0.0003
146.52 ±3.90
0.56783 0.00343 0.0003 0.95015 0.00617 0.0004 1.02455 0.00635 0.0007 1.52247 0.01011 0.0006 1.55416 0.00984 0.0007 2.03179 0.01359 0.0007 2.04666 0.01296 0.0009 2.55397 0.01773 0.0010 2.56302 0.01646 0.0010 3.09776 0.02132 0.0012 3.08830 0.01974 0.0011
T=347.88 K T=372.86 K
0.66494 0.00558 0.0004
131.11 ±2.84
0.47057 0.00384 0.0003
115.43 ±2.18
1.03324 0.00813 0.0005 0.80554 0.00669 0.0004 1.43453 0.01118 0.0006 1.18951 0.01031 0.0005 1.93326 0.01481 0.0010 1.67869 0.01430 0.0007 2.47450 0.01864 0.0011 2.20515 0.01896 0.0010 3.02742 0.02291 0.0012 2.74701 0.02417 0.0012
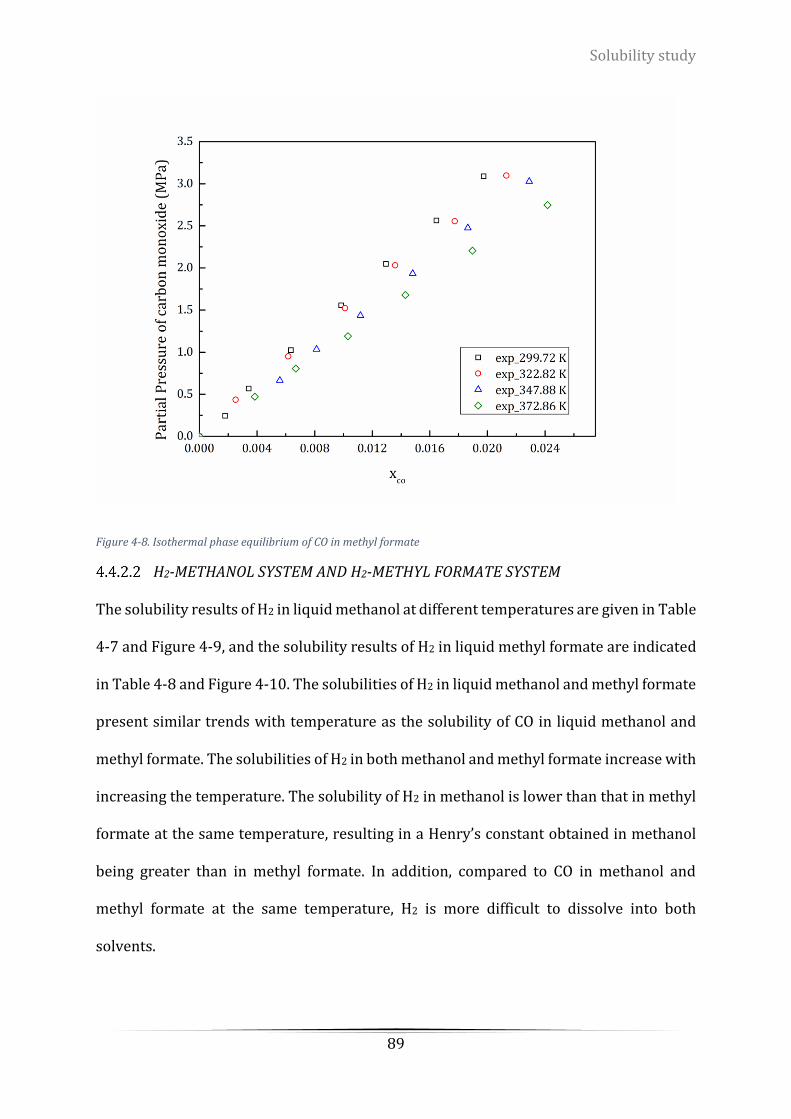
Solubility study
89
Figure 4-8. Isothermal phase equilibrium of CO in methyl formate
H2-METHANOL SYSTEM AND H2-METHYL FORMATE SYSTEM
The solubility results of H2 in liquid methanol at different temperatures are given in Table
4-7 and Figure 4-9, and the solubility results of H2 in liquid methyl formate are indicated
in Table 4-8 and Figure 4-10. The solubilities of H2 in liquid methanol and methyl formate
present similar trends with temperature as the solubility of CO in liquid methanol and
methyl formate. The solubilities of H2 in both methanol and methyl formate increase with
increasing the temperature. The solubility of H2 in methanol is lower than that in methyl
formate at the same temperature, resulting in a Henry’s constant obtained in methanol
being greater than in methyl formate. In addition, compared to CO in methanol and
methyl formate at the same temperature, H2 is more difficult to dissolve into both
solvents.
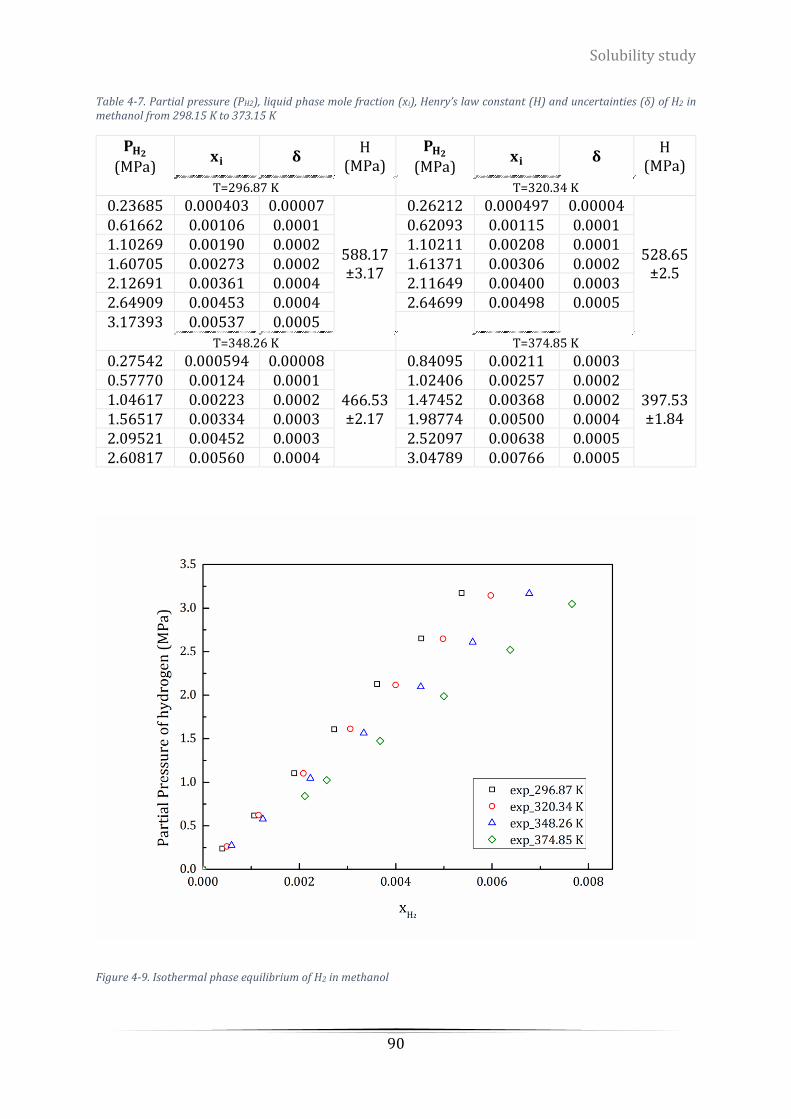
Solubility study
90
Table 4-7. Partial pressure (PH2), liquid phase mole fraction (xi), Henry’s law constant (H) and uncertainties (δ) of H2 in methanol from 298.15 K to 373.15 K
𝐏𝐇𝟐
(MPa) 𝐱𝐢 𝛅
H (MPa)
𝐏𝐇𝟐
(MPa) 𝐱𝐢 𝛅
H (MPa)
T=296.87 K T=320.34 K
0.23685 0.000403 0.00007
588.17 ±3.17
0.26212 0.000497 0.00004
528.65 ±2.5
0.61662 0.00106 0.0001 0.62093 0.00115 0.0001 1.10269 0.00190 0.0002 1.10211 0.00208 0.0001 1.60705 0.00273 0.0002 1.61371 0.00306 0.0002 2.12691 0.00361 0.0004 2.11649 0.00400 0.0003 2.64909 0.00453 0.0004 2.64699 0.00498 0.0005 3.17393 0.00537 0.0005
T=348.26 K T=374.85 K
0.27542 0.000594 0.00008
466.53 ±2.17
0.84095 0.00211 0.0003
397.53 ±1.84
0.57770 0.00124 0.0001 1.02406 0.00257 0.0002 1.04617 0.00223 0.0002 1.47452 0.00368 0.0002 1.56517 0.00334 0.0003 1.98774 0.00500 0.0004 2.09521 0.00452 0.0003 2.52097 0.00638 0.0005 2.60817 0.00560 0.0004 3.04789 0.00766 0.0005
Figure 4-9. Isothermal phase equilibrium of H2 in methanol

Solubility study
91
Table 4-8. Partial pressure (PH2), liquid phase mole fraction (xi), Henry’s law constant (H) and uncertainties (δ) of H2 in methyl formate from 298.15K to 373.15 K
𝐏𝐇𝟐
(MPa) 𝐱𝐢 𝛅
H (MPa)
𝐏𝐇𝟐
(MPa) 𝐱𝐢 𝛅
H (MPa)
T=296.63 K T=325.45 K
0.23819 0.00052 0.00002
480.76 ±10.21
0.44456 0.00117 0.00008
376.54 ±4.40
0.65607 0.00141 0.0001 1.20781 0.00318 0.0001 1.08370 0.00234 0.0002 1.43591 0.00377 0.0002 1.57290 0.00342 0.0002 1.87448 0.00487 0.0002 2.08338 0.00438 0.0003 2.37579 0.00628 0.0003 2.59759 0.00530 0.0004 2.88468 0.00771 0.0004 3.11675 0.00642 0.0004
T=348.38 K T=371.61 K
0.46206 0.00169 0.00006
283.39 ±2.31
0.46720 0.00237 0.0001
187.46 ±6.72
1.12690 0.00395 0.0001 0.65865 0.00321 0.0002 1.43690 0.00509 0.0003 1.09824 0.00593 0.0004 1.84089 0.00656 0.0004 1.53884 0.00842 0.0005 2.30308 0.00814 0.0006 2.08377 0.01104 0.0008 2.82852 0.00992 0.0005
Figure 4-10. Isothermal phase equilibrium of H2 in methyl formate
Solubility study
92
DISCUSSION ON THE SOLUBILITY TREND WITH TEMPERATURE
As discussed in the previous sections, the solubility of both H2 and CO in either methanol
or methyl formate is increased with the increase of temperature. One possible reason is
that the CO-CO and H2-H2 interactions are stronger than CO-solvent and H2-solvent
interactions, and they prefer to associate with themselves rather than the solvents. As the
temperature increases, the solvent undergoes thermal expansion, implying that the
solvent molecules are further apart, and their intermolecular forces are weaker. The gas
molecules may accommodate the solvent molecules more easily. This may increase the
apparent solubilities of CO and H2 gas solutes. However, in conventional vapour-liquid
systems, the gas solute interacts favourably with the liquid and the process is exothermic,
leading to a decrease in gas solubility when the temperature increases.
As discussed earlier, the overall solution process for systems in which solute-solute
interactions are stronger than solute-solvent interactions are endothermic. The binding
energy between methanol and methanol was determined to be 28 kJ/mol [143], however,
the binding energy between CO and methanol and H2 and methanol are not available in
the literature, therefore, water was selected as an example since it did not expect to be
large different from the methanol situation. The binding energy between the two water
molecules is evaluated to be 20 – 25 kJ/mol [144]. Nevertheless, the binding energy of
H2-H2O, and CO-H2O are only 0.71 kJ/mol and 4.05 kJ/mol, respectively [145], [146].
Higher energy input is required to break the water-water bonds than is released when
H2-H2O or CO-H2O bonds are formed, making the process endothermic overall. High
temperatures provide high energy to break solute bonds in the gas phases, facilitating the
dissolving process of the gas solutes with broken bonds into the solvent.
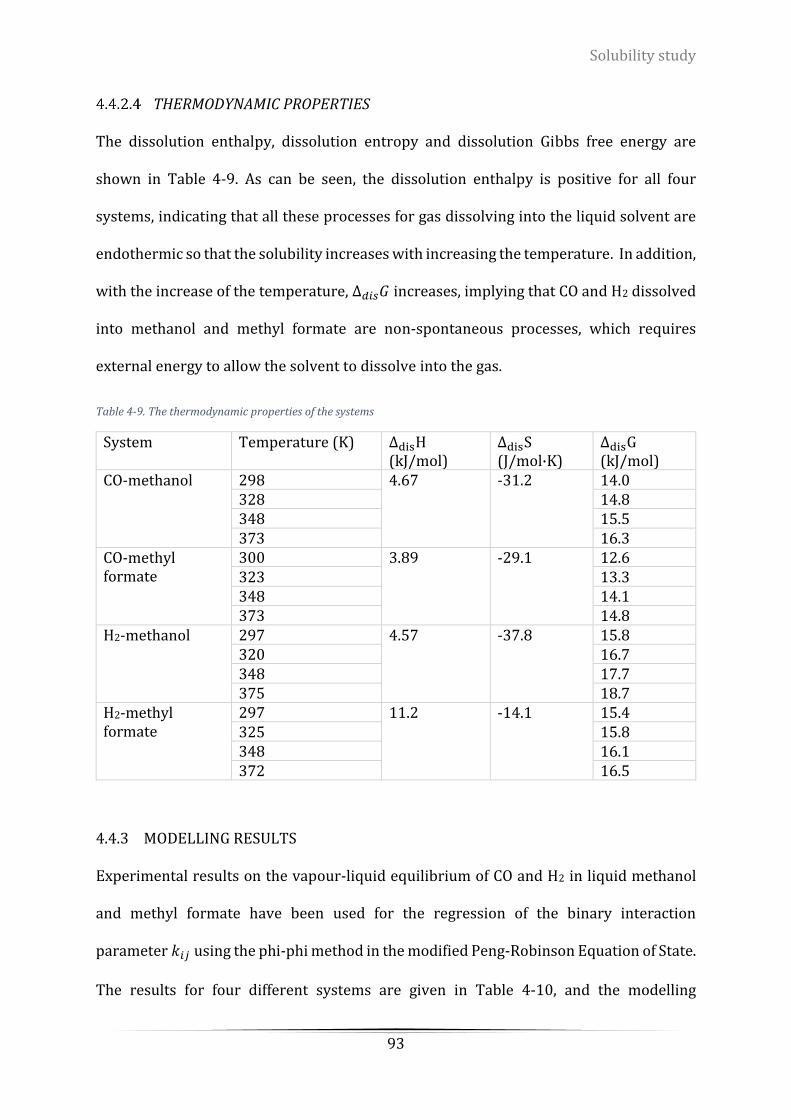
Solubility study
93
THERMODYNAMIC PROPERTIES
The dissolution enthalpy, dissolution entropy and dissolution Gibbs free energy are
shown in Table 4-9. As can be seen, the dissolution enthalpy is positive for all four
systems, indicating that all these processes for gas dissolving into the liquid solvent are
endothermic so that the solubility increases with increasing the temperature. In addition,
with the increase of the temperature, ∆𝑑𝑖𝑠𝐺 increases, implying that CO and H2 dissolved
into methanol and methyl formate are non-spontaneous processes, which requires
external energy to allow the solvent to dissolve into the gas.
Table 4-9. The thermodynamic properties of the systems
System Temperature (K) ∆disH (kJ/mol)
∆disS (J/mol·K)
∆disG (kJ/mol)
CO-methanol 298 4.67 -31.2 14.0 328 14.8 348 15.5 373 16.3
CO-methyl formate
300 3.89 -29.1 12.6 323 13.3 348 14.1 373 14.8
H2-methanol 297 4.57 -37.8 15.8 320 16.7 348 17.7 375 18.7
H2-methyl formate
297 11.2 -14.1 15.4 325 15.8 348 16.1 372 16.5
4.4.3 MODELLING RESULTS
Experimental results on the vapour-liquid equilibrium of CO and H2 in liquid methanol
and methyl formate have been used for the regression of the binary interaction
parameter 𝑘𝑖𝑗 using the phi-phi method in the modified Peng-Robinson Equation of State.
The results for four different systems are given in Table 4-10, and the modelling
Solubility study
94
validation results for CO-methanol, CO-methyl formate, H2-methanol and H2-methyl
formate systems are shown in Figure 4-11, Figure 4-12, Figure 4-13 and Figure 4-14;
respectively. The binary parameter 𝑘𝑖𝑗 is temperature dependent, which can be
described using Equation 4-44, where 𝐴 , 𝐵 and 𝐶 are empirical coefficients [124]. In
some particular vapour-liquid systems, 𝑘𝑖𝑗 may be constant when changing the
temperature [104], and this phenomenon has also been found in CO-methanol and CO-
methyl formate in our study, where the values for these two systems are constant at -0.21
and -0.051. However, for H2-methanol and H2-methyl formate systems, the binary
interaction coefficient is temperature dependent, and the empirical coefficients are
regressed and given in Table 4-11. According to Kordas et al., the binary interaction
parameter 𝑘𝑖𝑗 has different boundary conditions depending on the characteristics of the
solvent [136]. For Non-polar solvent, 𝑘𝑖𝑗 should be located between 0 and 0.2, whereas
for polar solvents, 𝑘𝑖𝑗 should be negative or greater than 0.2. In our study, as methanol
and methyl formate are polar solvents, the regressed binary parameters are either
negative or greater than 0.2 (shown in Table 4-10), which satisfy the boundary conditions
of 𝑘𝑖𝑗 .
The maximum absolute average relative deviation (AARD) are used to check the
reliability of the model for each system. The equation is defined in Equation 4-45, where,
𝑥𝑒𝑒𝑥𝑝 is the experimental data, 𝑥𝑒
𝑐𝑎𝑙𝑐 is the simulation result, 𝑁 is the total number of
experimental points. The results are also listed in Table 4-10, showing that the model can
well represent the experimental data (within 5%), and validation results are shown from
Figure 4-11 to Figure 4-14. Therefore, modified Peng-Robinson Equation of State is an
appropriate model to predict the solubilities of CO and H2 in methanol and methyl
formate.

Solubility study
95
Equation 4-44. The binary interaction parameter
𝑘𝑖𝑗(𝑇) = 𝐴 +𝐵
𝑇+ 𝐶𝑇
Equation 4-45. Definition of AARD
AARD(%) =1
N∑
|xeexp
− xecalc|
xeexp
N
1
× 100
Table 4-10. The regressed binary parameter using PR EoS for different systems
System Temperature (K) 𝑘𝑖𝑗 AARD%
CO-methanol 298.10 -0.21 3.20 322.71 -0.20 0.70 347.76 -0.21 4.30 372.90 -0.21 0.38
CO-methyl formate 299.72 -0.052 0.71 322.82 -0.052 4.70 347.88 -0.051 2.43 372.86 -0.051 2.73
H2-methanol 296.87 -0.33 0.11 320.34 -0.24 0.30 348.26 -0.12 0.95 374.85 -0.015 0.19
H2-methyl formate 296.63 0.36 3.70 325.45 0.40 1.70 348.38 0.39 0.40 371.61 0.28 3.50
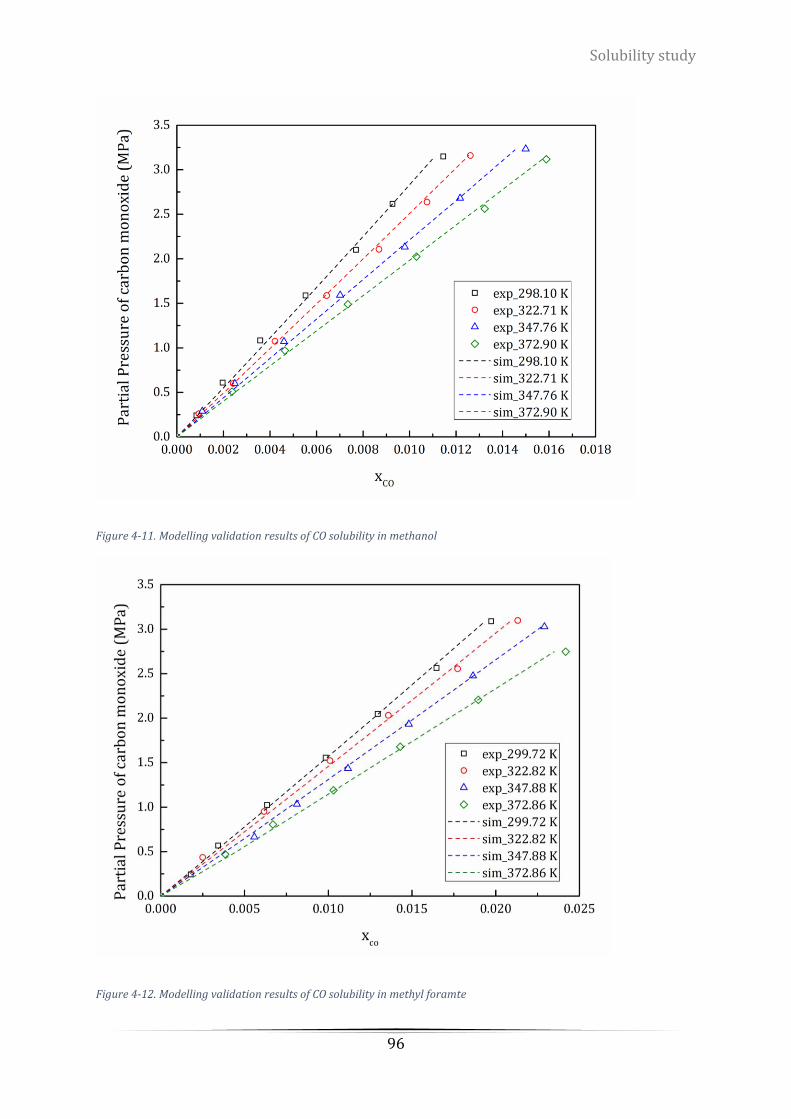
Solubility study
96
Figure 4-11. Modelling validation results of CO solubility in methanol
Figure 4-12. Modelling validation results of CO solubility in methyl foramte
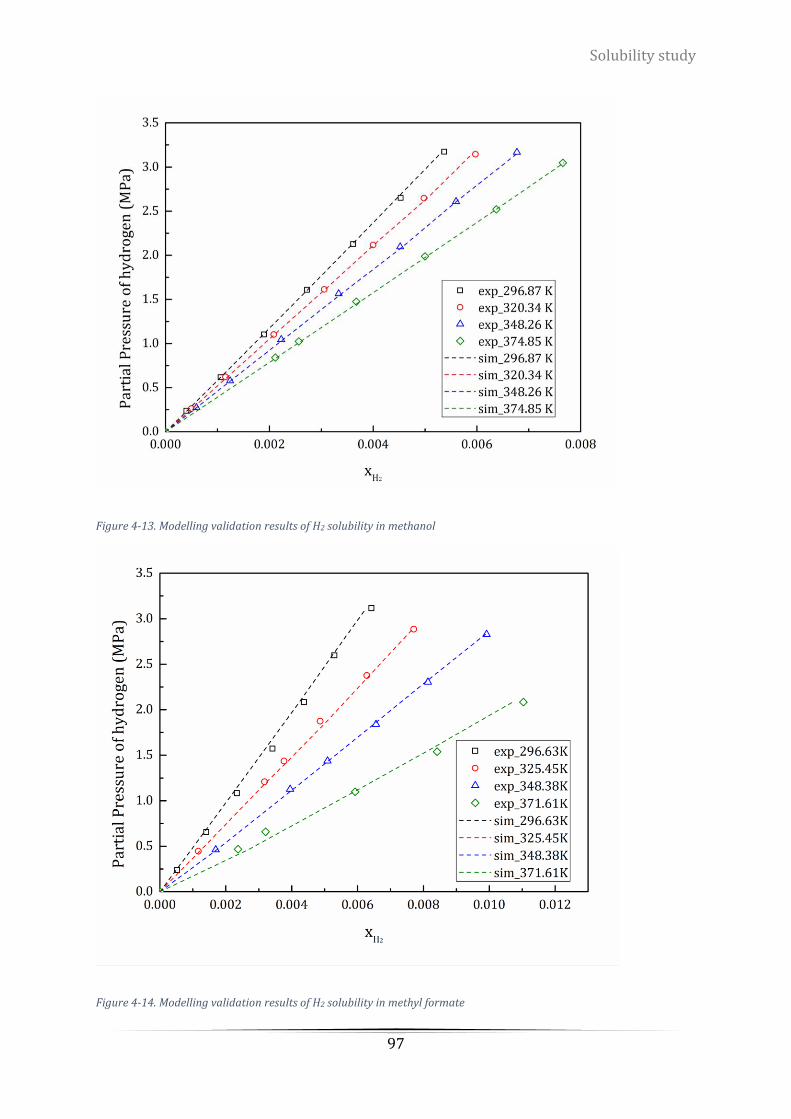
Solubility study
97
Figure 4-13. Modelling validation results of H2 solubility in methanol
Figure 4-14. Modelling validation results of H2 solubility in methyl formate
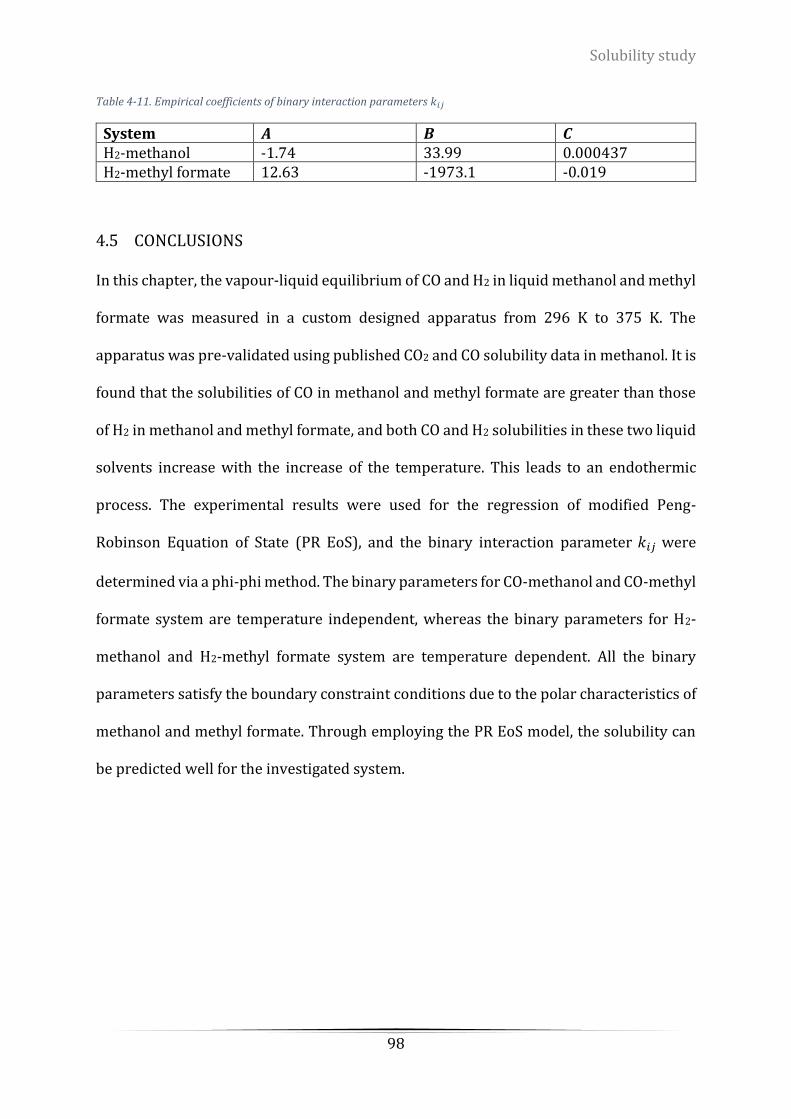
Solubility study
98
Table 4-11. Empirical coefficients of binary interaction parameters 𝑘𝑖𝑗
System 𝑨 𝑩 𝑪 H2-methanol -1.74 33.99 0.000437 H2-methyl formate 12.63 -1973.1 -0.019
4.5 CONCLUSIONS
In this chapter, the vapour-liquid equilibrium of CO and H2 in liquid methanol and methyl
formate was measured in a custom designed apparatus from 296 K to 375 K. The
apparatus was pre-validated using published CO2 and CO solubility data in methanol. It is
found that the solubilities of CO in methanol and methyl formate are greater than those
of H2 in methanol and methyl formate, and both CO and H2 solubilities in these two liquid
solvents increase with the increase of the temperature. This leads to an endothermic
process. The experimental results were used for the regression of modified Peng-
Robinson Equation of State (PR EoS), and the binary interaction parameter 𝑘𝑖𝑗 were
determined via a phi-phi method. The binary parameters for CO-methanol and CO-methyl
formate system are temperature independent, whereas the binary parameters for H2-
methanol and H2-methyl formate system are temperature dependent. All the binary
parameters satisfy the boundary constraint conditions due to the polar characteristics of
methanol and methyl formate. Through employing the PR EoS model, the solubility can
be predicted well for the investigated system.
Hydrogenation reaction kinetics mechanism
99
CHAPTER 5 HYDROGENATION REACTION KINETICS
MECHANISM
5.1 INTRODUCTION
In the methanol synthesis via the methyl formate (MS via MF) two-step approach, the
hydrogenation reaction (the second step) is the rate limiting step. However, to our best
knowledge, few studies have been reported on the hydrogenation mechanisms and the
characteristics of the catalysts. Hence, it is important to investigate the hydrogenation
reaction to understand comprehensively the reaction mechanism and kinetics. In
addition, since the first step is commercialised in ester production, its kinetics are well
known. Study of the second step becomes crucial and a clear understanding may aid in
the scale up of the production of methanol via the ‘MS via MF’ approach at moderate-
temperature and moderate-pressure conditions.
Producing alcohols from esters is one of the fundamental reactions in organic chemistry,
and has been employed in a great number of chemical manufacturing industries [147]. In
industry, Adkin-type catalysts (CuO/CuCr2O4) are used to produce alcohols due to their
stable structure although they are operated at harsh conditions such as temperatures
ranging from 200 to 300 °C and H2 pressures ranging from 14 to 30 MPa [147], [148].
However, side reactions and degradation of the reactants and products are the main
problems in the current manufacturing processes [149].
In our present work, methanol is produced from hydrogenation of methyl formate, which
is given by Reaction 5-1. In this reaction, catalytic hydrogenation of carboxylic esters is
challenging due to its low electrophilicity of carbonyl carbon and the difficulties
associated with polarizing the carbonyl group of the substrate [150]. A number of
Hydrogenation reaction kinetics mechanism
100
researchers have studied a range of hydrogenation catalysts intensively, including
heterogenous catalysts and homogeneous catalysts, in order to screen cost effective and
environmentally friendly catalysts [148], [149], [151].
Reaction 5-1. Hydrogenation of methyl formate
CH3COOH + 2H2 ⇌ 2CH3OH
Regarding the homogenous catalysts which have recently been published in the literature,
Ru- and Os-based homogenous catalysts were developed for the hydrogenation of esters
but were only limited to highly activated esters [152]. Significant breakthroughs were
made in the catalytic hydrogenation of esters by Milstein et al. who developed Ru-based
catalysts for the hydrogenation of non-active esters in 2006 [11]. Later on, Pidko group
proposed a new pathway for the hydrogenation of methyl formate to produce methanol
using bipyridine-based Ru-pincer complex at 110 °C and 5 MPa [151]. However, such
catalysts contained expensive metals and toxic chemicals, which makes it commercially
unattractive.
In comparison with the homogeneous catalysts, heterogeneous catalysts, such as copper
chromite and copper-based catalysts, were widely investigated in both gas and liquid
phases [64], [155], [156]. The active sites of such copper-based catalysts for ester
hydrogenation reactions are considered as Cu0, Cu+, or a combination of Cu0 and Cu+. The
heterogeneous catalysts are more favourable as they have improved compatibility with
easy recovery. The solid-state heterogeneous catalysts are also easy to separate and
recover after finishing experiments. Copper chromite is one of the most commonly used
catalysts to evaluate the hydrogenation of esters to produce alcohols. The copper
chromite is manufactured via the discompose of either copper barium ammonium
chromite (Ba2Cu2(NH4)2(CrO4)5) or copper ammonium chromite (Cu(NH4)2(CrO4)2) at a
Hydrogenation reaction kinetics mechanism
101
temperature range from 350 °C to 450 °C (shown in Reaction 5-2 and Reaction 5-3,
respectively). In addition, a separation process of the reaction products is required to
purify the final products.
Reaction 5-2. Decomposition of copper barium ammonium chromite
Ba2Cu2(NH4)2(CrO4)5 ⇌ CrCuO3 + CuO + 2Ba + 4H2O + 4 Cr + N2 + 6O2
Reaction 5-3. Decomposition of copper ammonium chromite
Cu(NH4)2(CrO4)2 ⇌ CrCuO3 + CrO + 4H2O + N2
Since the copper chromite has good compatibility, stability and is easy to recover, copper
chromite is employed in the current research to study the reaction kinetics and the
possible mechanism. In this chapter, three objectives were discussed and explained.
Firstly, to study the carbonylation reaction to verify the reaction and compare with
literature data; secondly, to study the structure, surface properties and thermal stability
of the catalyst by using XRD, SEM, TGA, N2 physisorption, TPR and N2O chemisorption
techniques; Finally, to investigate the kinetics and the possible reaction mechanism of
copper chromite catalysed hydrogenation of methyl formate. A number of experiments
were performed in a batch reactor at different temperatures and pressures ranging from
346 to 384 K and 1.8 to 2.2 MPa, respectively, with a range of copper chromite
concentrations (8 g/L to 20 g/L).
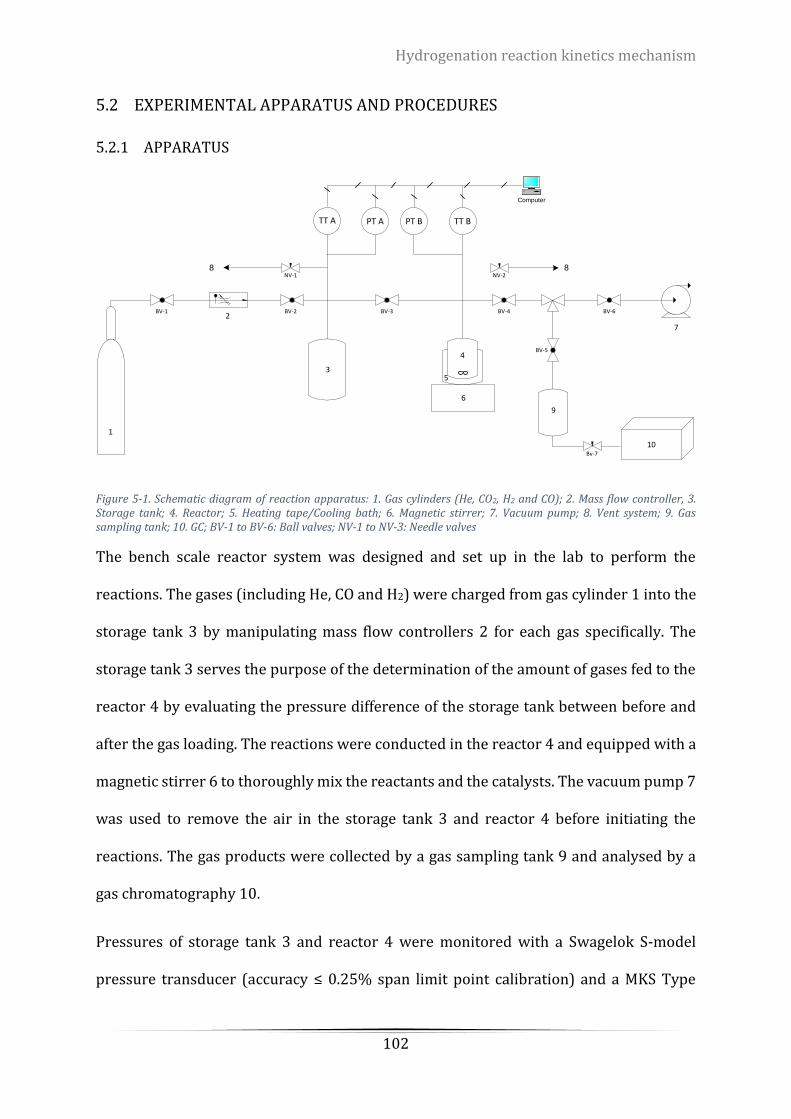
Hydrogenation reaction kinetics mechanism
102
5.2 EXPERIMENTAL APPARATUS AND PROCEDURES
5.2.1 APPARATUS
Figure 5-1. Schematic diagram of reaction apparatus: 1. Gas cylinders (He, CO2, H2 and CO); 2. Mass flow controller, 3. Storage tank; 4. Reactor; 5. Heating tape/Cooling bath; 6. Magnetic stirrer; 7. Vacuum pump; 8. Vent system; 9. Gas sampling tank; 10. GC; BV-1 to BV-6: Ball valves; NV-1 to NV-3: Needle valves
The bench scale reactor system was designed and set up in the lab to perform the
reactions. The gases (including He, CO and H2) were charged from gas cylinder 1 into the
storage tank 3 by manipulating mass flow controllers 2 for each gas specifically. The
storage tank 3 serves the purpose of the determination of the amount of gases fed to the
reactor 4 by evaluating the pressure difference of the storage tank between before and
after the gas loading. The reactions were conducted in the reactor 4 and equipped with a
magnetic stirrer 6 to thoroughly mix the reactants and the catalysts. The vacuum pump 7
was used to remove the air in the storage tank 3 and reactor 4 before initiating the
reactions. The gas products were collected by a gas sampling tank 9 and analysed by a
gas chromatography 10.
Pressures of storage tank 3 and reactor 4 were monitored with a Swagelok S-model
pressure transducer (accuracy ≤ 0.25% span limit point calibration) and a MKS Type
TT A
1
6
BV-1 BV-2 BV-3 BV-4
NV-1 NV-2
2
3
PT A PT B TT B
4
5
8 8
Computer
7
BV-6
Bv-7
BV-5
9
10
Hydrogenation reaction kinetics mechanism
103
627B pressure transducer (accuracy ± 1 mmHg), respectively. Both pressure transducers
were connected to a NI™ USB-6002 data acquisition (DAQ) device and pressure values
were recorded by LabVIEW System Design Software to record the pressures. Meanwhile,
the pressure of the reactor was real-time displayed by a power supply digital readout unit
(MKS Instruments Inc, 660B model). Two pressure transducers were calibrated with
accurate manometers to provide accurate and reproducible results.
The temperature inside the reactor 4 was controlled with an external heating tape
coupled with a temperature controller 5. Temperatures of both storage tank 3 and
reactor 4 were measured with K-type thermocouples (accuracy ± 0.1 K) connected to
National Instruments™ (NI™) thermocouple measurement devices and recorded with
LabVIEW System Design Software.
5.2.2 PROCEDURE
The procedure of methanol synthesis at low temperature and low pressure comprises the
following steps:
1) Leak Test: Prior to every experiment, the leak test was undertaken by injecting helium
into the reactor (4) to 30 bar and monitoring the pressure stability. The leak test takes
two hours.
2) Loading catalysts and liquid reactant and system degassing: About 12 mL of liquid
reactant (methanol or methyl formate) and catalysts were loaded to the reactor (4). The
reactor was subsequently connected to the process apparatus line via a VCR-gasket
(Swagelok®), and then immersed in dry ice bath to cool down. The cooling step by dry
ice is to reduce the vapour pressure of the volatile solvents used in the experiments of
this work to an acceptable value (less than 500 Pa). Once the temperature inside of the
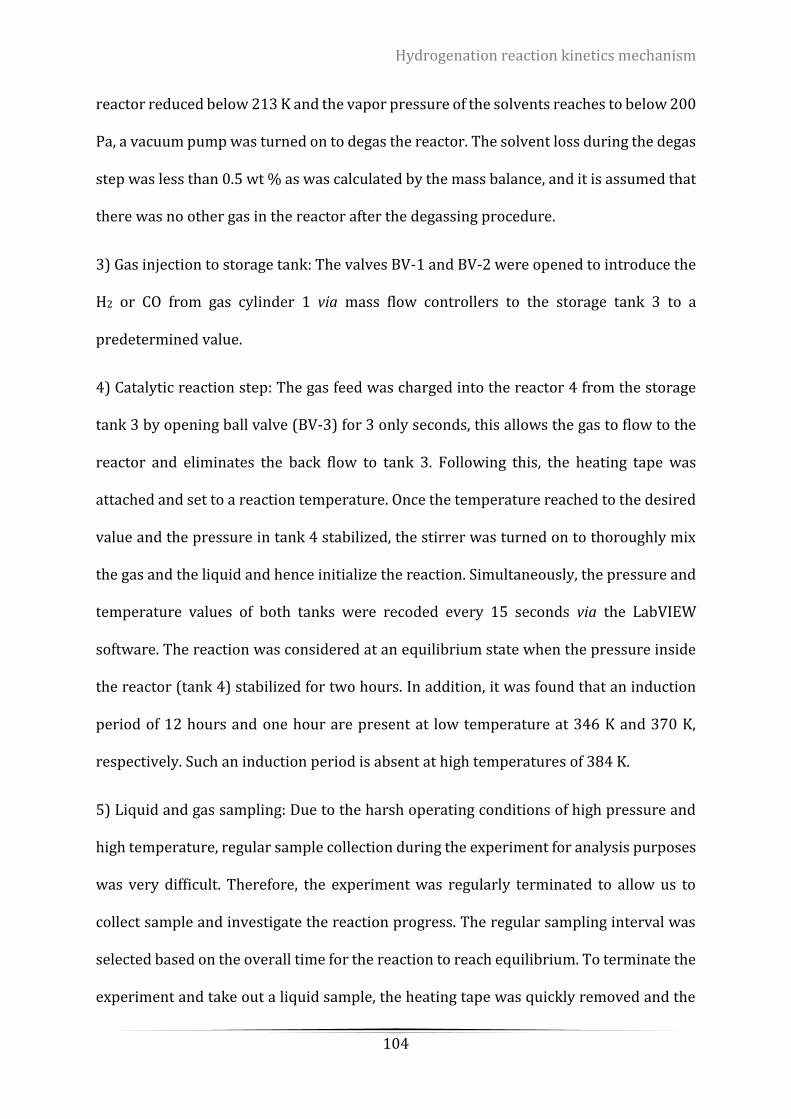
Hydrogenation reaction kinetics mechanism
104
reactor reduced below 213 K and the vapor pressure of the solvents reaches to below 200
Pa, a vacuum pump was turned on to degas the reactor. The solvent loss during the degas
step was less than 0.5 wt % as was calculated by the mass balance, and it is assumed that
there was no other gas in the reactor after the degassing procedure.
3) Gas injection to storage tank: The valves BV-1 and BV-2 were opened to introduce the
H2 or CO from gas cylinder 1 via mass flow controllers to the storage tank 3 to a
predetermined value.
4) Catalytic reaction step: The gas feed was charged into the reactor 4 from the storage
tank 3 by opening ball valve (BV-3) for 3 only seconds, this allows the gas to flow to the
reactor and eliminates the back flow to tank 3. Following this, the heating tape was
attached and set to a reaction temperature. Once the temperature reached to the desired
value and the pressure in tank 4 stabilized, the stirrer was turned on to thoroughly mix
the gas and the liquid and hence initialize the reaction. Simultaneously, the pressure and
temperature values of both tanks were recoded every 15 seconds via the LabVIEW
software. The reaction was considered at an equilibrium state when the pressure inside
the reactor (tank 4) stabilized for two hours. In addition, it was found that an induction
period of 12 hours and one hour are present at low temperature at 346 K and 370 K,
respectively. Such an induction period is absent at high temperatures of 384 K.
5) Liquid and gas sampling: Due to the harsh operating conditions of high pressure and
high temperature, regular sample collection during the experiment for analysis purposes
was very difficult. Therefore, the experiment was regularly terminated to allow us to
collect sample and investigate the reaction progress. The regular sampling interval was
selected based on the overall time for the reaction to reach equilibrium. To terminate the
experiment and take out a liquid sample, the heating tape was quickly removed and the

Hydrogenation reaction kinetics mechanism
105
reactor (tank 4) was quickly quenched by dry ice to cool down to 213 K. This would
terminate the reaction and prohibit the liquid sample vaporization during the pressure
relief process. The gas products were collected by using a gas sampling tank 9 which is
connected to the valve BV-5. By turning on the valves (BV-4 and BV-5), gas moves from
the system to the gas sampling tank. The liquid products were taken out from the reactor
4.
6) The sample analysis: Both liquid and gas samples were analysed via a gas
chromatography (GC).
7) Catalyst recovery: The solid catalysts can be recovered by filtering the liquid products,
and then washed with the liquid reactant. After that, the solid catalysts were vacuum
dried at room temperature for 12 hours.
In this chapter, experiments were initially carried out at different rotation speeds to
determine the optimized agitation speed with minimum mass transfer resistance. The
effect of catalyst loadings was also investigated. Subsequently, experiments were
conducted at three different temperatures using the optimized agitation speed and
catalyst loading to determine the activation energy (𝐸𝑎) of the copper chromite catalysed
hydrogenation reaction. A possible reaction mechanism was proposed and validated by
running a series of experiments at different hydrogen pressures. The experimental
conditions of the hydrogenation reaction are listed in Table 5-1.
Table 5-1. Experimental conditions for hydrogenation reactions
Parameters Experimental conditions Catalysts Copper chromite Rotation speeds (rpm) 400, 600, 800 and 1000 Catalyst loadings (g/L) 8, 12, 16 and 20 Temperatures (K) 346, 370 and 384 Pressure (MPa) 1.8, 2.0 and 2.2
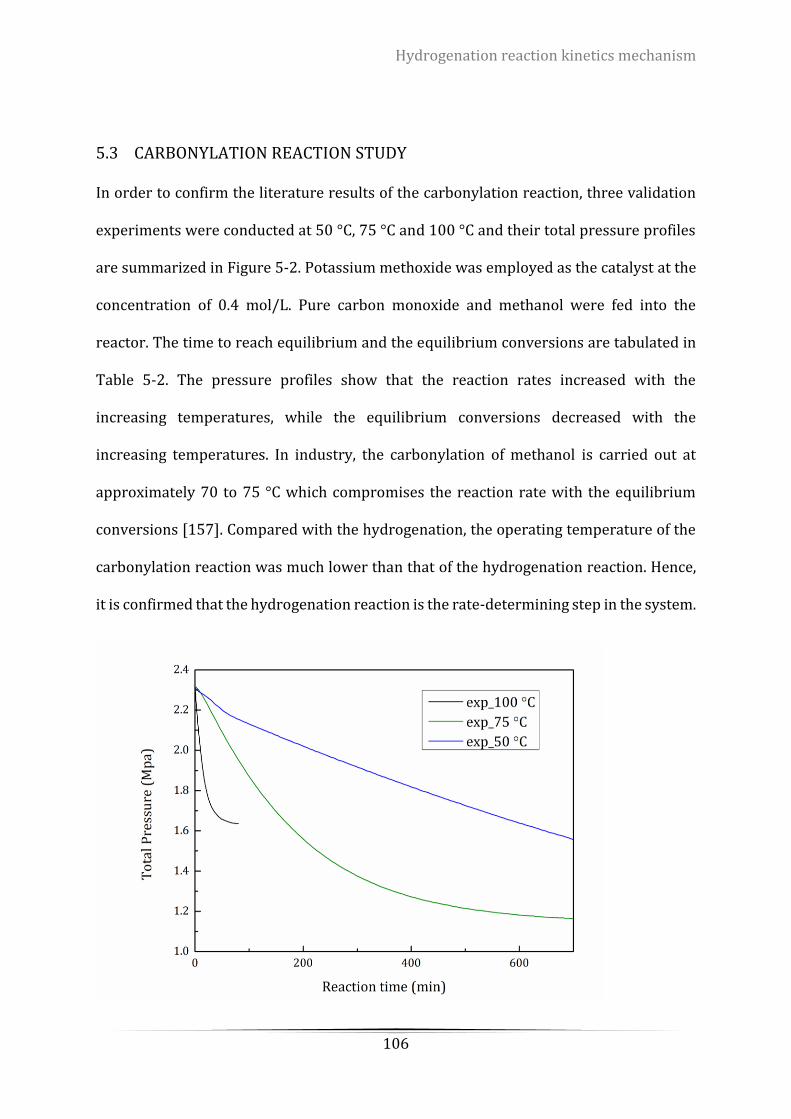
Hydrogenation reaction kinetics mechanism
106
5.3 CARBONYLATION REACTION STUDY
In order to confirm the literature results of the carbonylation reaction, three validation
experiments were conducted at 50 °C, 75 °C and 100 °C and their total pressure profiles
are summarized in Figure 5-2. Potassium methoxide was employed as the catalyst at the
concentration of 0.4 mol/L. Pure carbon monoxide and methanol were fed into the
reactor. The time to reach equilibrium and the equilibrium conversions are tabulated in
Table 5-2. The pressure profiles show that the reaction rates increased with the
increasing temperatures, while the equilibrium conversions decreased with the
increasing temperatures. In industry, the carbonylation of methanol is carried out at
approximately 70 to 75 °C which compromises the reaction rate with the equilibrium
conversions [157]. Compared with the hydrogenation, the operating temperature of the
carbonylation reaction was much lower than that of the hydrogenation reaction. Hence,
it is confirmed that the hydrogenation reaction is the rate-determining step in the system.
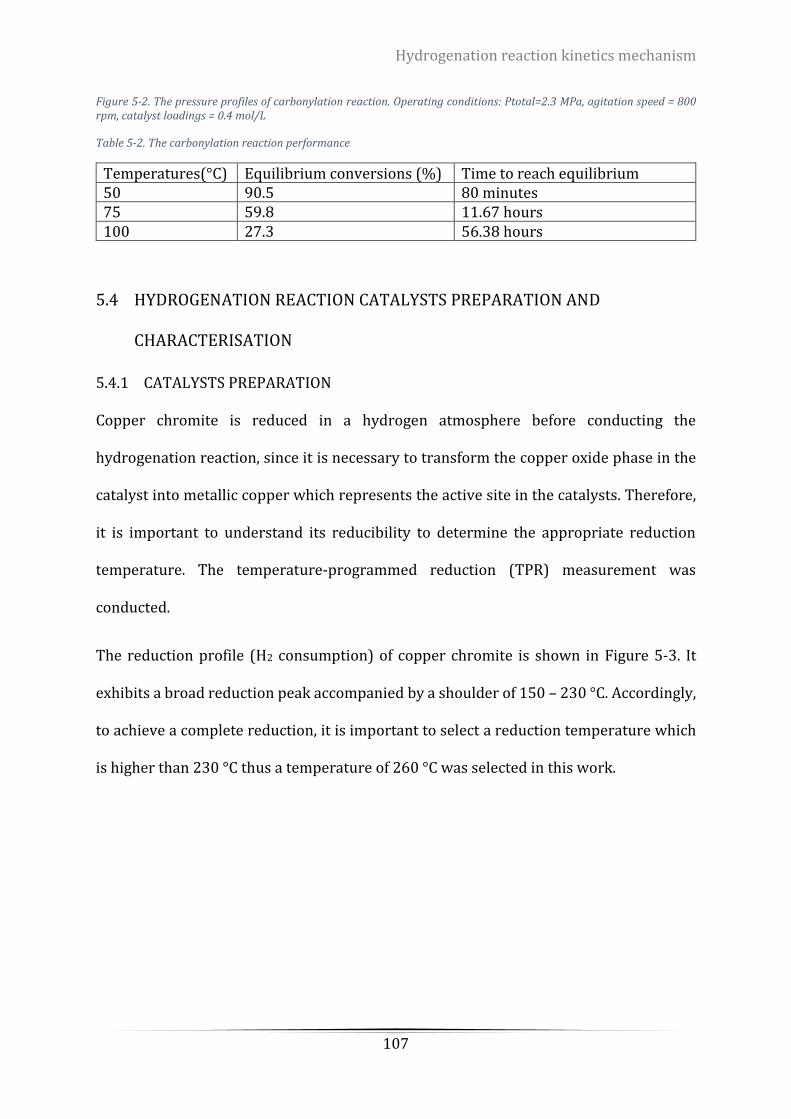
Hydrogenation reaction kinetics mechanism
107
Figure 5-2. The pressure profiles of carbonylation reaction. Operating conditions: Ptotal=2.3 MPa, agitation speed = 800 rpm, catalyst loadings = 0.4 mol/L
Table 5-2. The carbonylation reaction performance
Temperatures(°C) Equilibrium conversions (%) Time to reach equilibrium 50 90.5 80 minutes 75 59.8 11.67 hours 100 27.3 56.38 hours
5.4 HYDROGENATION REACTION CATALYSTS PREPARATION AND
CHARACTERISATION
5.4.1 CATALYSTS PREPARATION
Copper chromite is reduced in a hydrogen atmosphere before conducting the
hydrogenation reaction, since it is necessary to transform the copper oxide phase in the
catalyst into metallic copper which represents the active site in the catalysts. Therefore,
it is important to understand its reducibility to determine the appropriate reduction
temperature. The temperature-programmed reduction (TPR) measurement was
conducted.
The reduction profile (H2 consumption) of copper chromite is shown in Figure 5-3. It
exhibits a broad reduction peak accompanied by a shoulder of 150 – 230 °C. Accordingly,
to achieve a complete reduction, it is important to select a reduction temperature which
is higher than 230 °C thus a temperature of 260 °C was selected in this work.
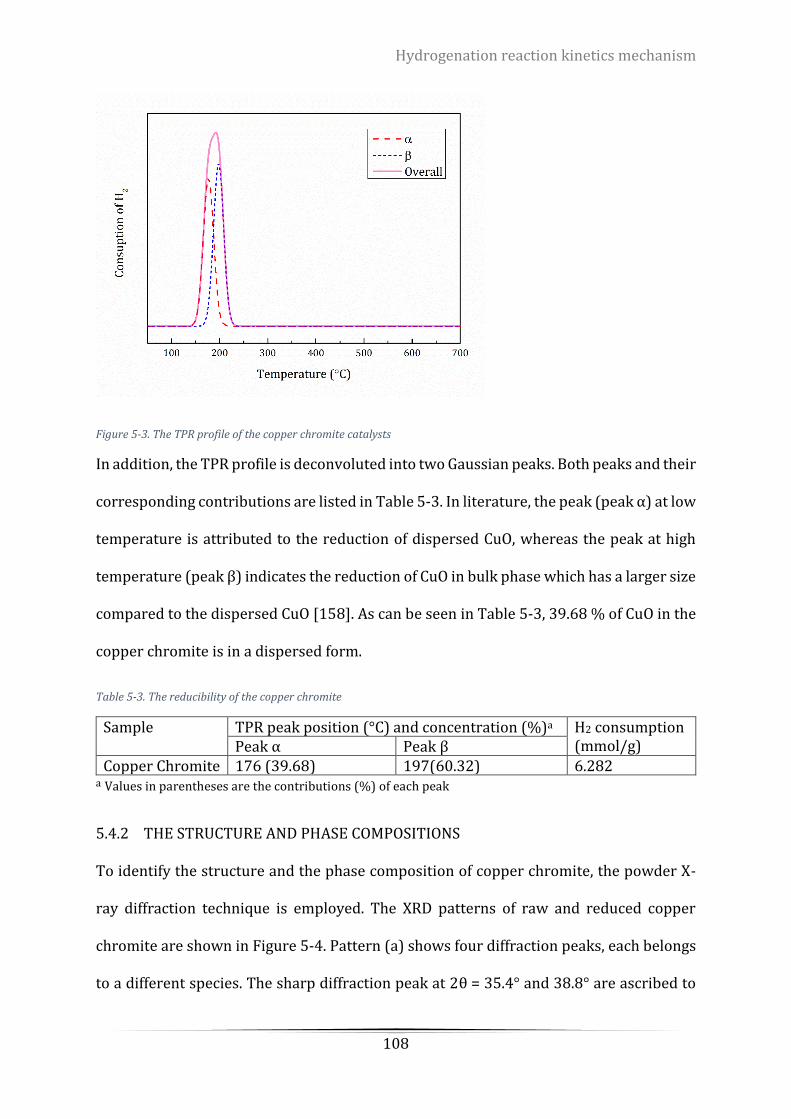
Hydrogenation reaction kinetics mechanism
108
Figure 5-3. The TPR profile of the copper chromite catalysts
In addition, the TPR profile is deconvoluted into two Gaussian peaks. Both peaks and their
corresponding contributions are listed in Table 5-3. In literature, the peak (peak α) at low
temperature is attributed to the reduction of dispersed CuO, whereas the peak at high
temperature (peak β) indicates the reduction of CuO in bulk phase which has a larger size
compared to the dispersed CuO [158]. As can be seen in Table 5-3, 39.68 % of CuO in the
copper chromite is in a dispersed form.
Table 5-3. The reducibility of the copper chromite
Sample TPR peak position (°C) and concentration (%)a H2 consumption (mmol/g) Peak α Peak β
Copper Chromite 176 (39.68) 197(60.32) 6.282 a Values in parentheses are the contributions (%) of each peak
5.4.2 THE STRUCTURE AND PHASE COMPOSITIONS
To identify the structure and the phase composition of copper chromite, the powder X-
ray diffraction technique is employed. The XRD patterns of raw and reduced copper
chromite are shown in Figure 5-4. Pattern (a) shows four diffraction peaks, each belongs
to a different species. The sharp diffraction peak at 2θ = 35.4° and 38.8° are ascribed to
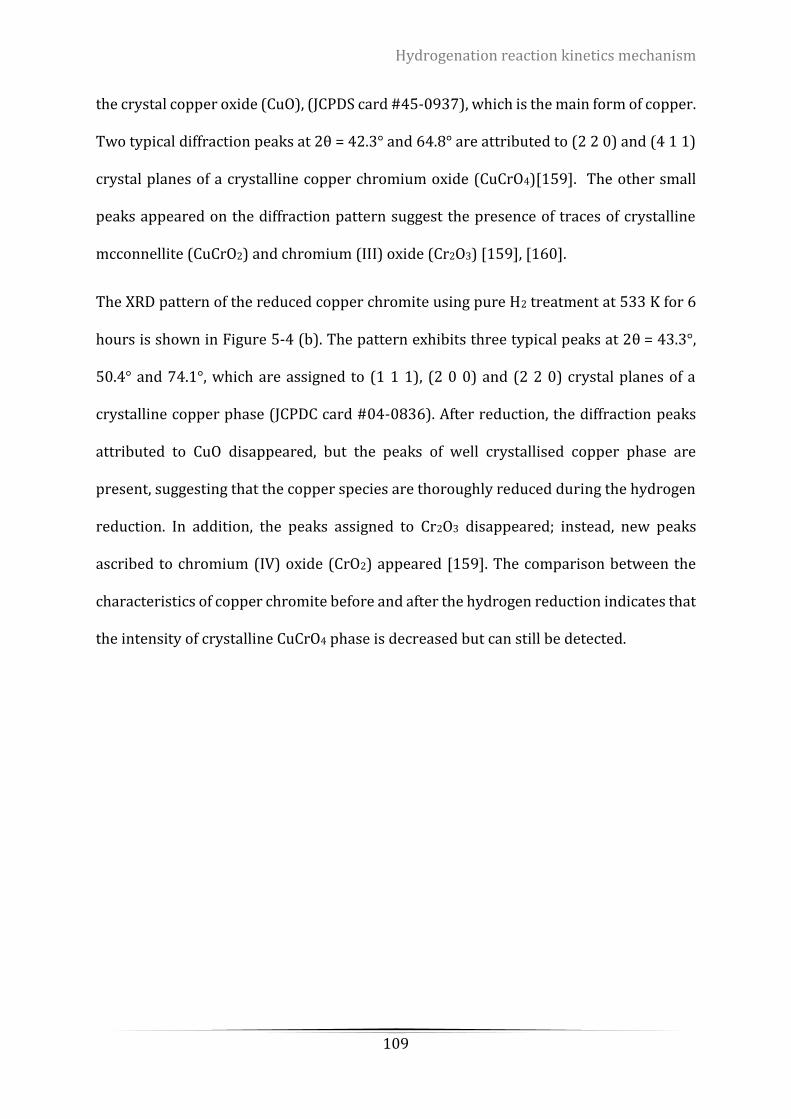
Hydrogenation reaction kinetics mechanism
109
the crystal copper oxide (CuO), (JCPDS card #45-0937), which is the main form of copper.
Two typical diffraction peaks at 2θ = 42.3° and 64.8° are attributed to (2 2 0) and (4 1 1)
crystal planes of a crystalline copper chromium oxide (CuCrO4)[159]. The other small
peaks appeared on the diffraction pattern suggest the presence of traces of crystalline
mcconnellite (CuCrO2) and chromium (III) oxide (Cr2O3) [159], [160].
The XRD pattern of the reduced copper chromite using pure H2 treatment at 533 K for 6
hours is shown in Figure 5-4 (b). The pattern exhibits three typical peaks at 2θ = 43.3°,
50.4° and 74.1°, which are assigned to (1 1 1), (2 0 0) and (2 2 0) crystal planes of a
crystalline copper phase (JCPDC card #04-0836). After reduction, the diffraction peaks
attributed to CuO disappeared, but the peaks of well crystallised copper phase are
present, suggesting that the copper species are thoroughly reduced during the hydrogen
reduction. In addition, the peaks assigned to Cr2O3 disappeared; instead, new peaks
ascribed to chromium (IV) oxide (CrO2) appeared [159]. The comparison between the
characteristics of copper chromite before and after the hydrogen reduction indicates that
the intensity of crystalline CuCrO4 phase is decreased but can still be detected.
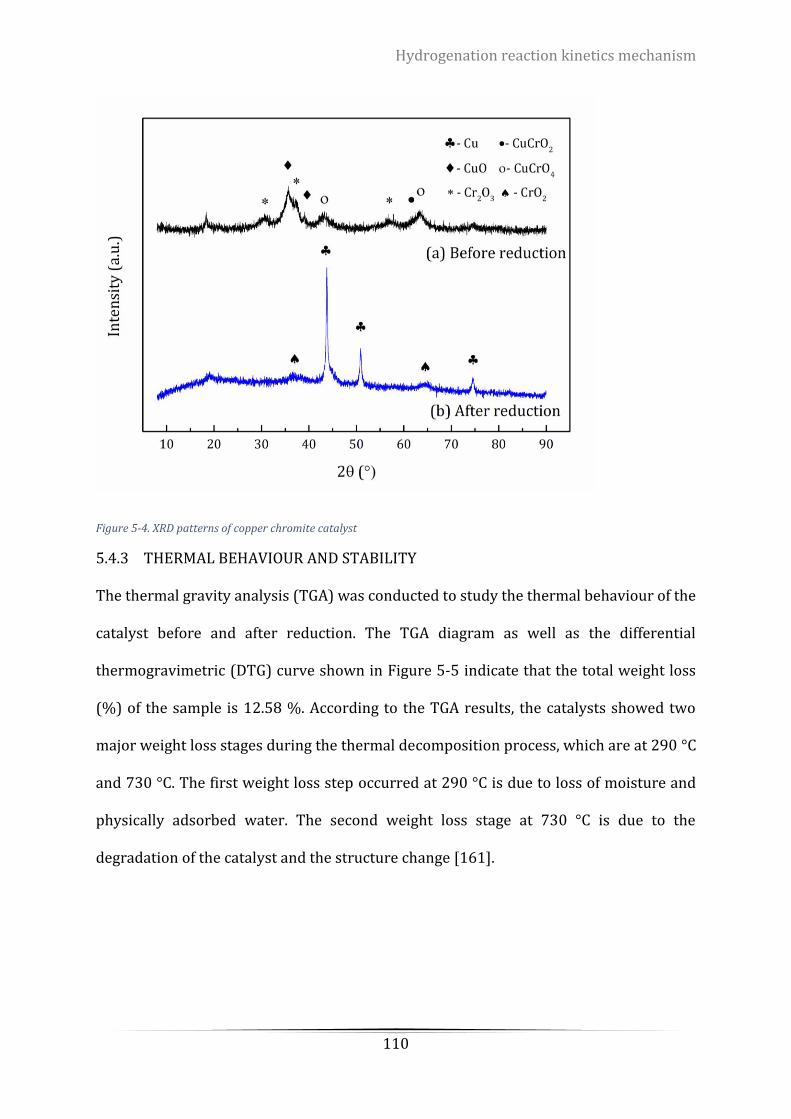
Hydrogenation reaction kinetics mechanism
110
Figure 5-4. XRD patterns of copper chromite catalyst
5.4.3 THERMAL BEHAVIOUR AND STABILITY
The thermal gravity analysis (TGA) was conducted to study the thermal behaviour of the
catalyst before and after reduction. The TGA diagram as well as the differential
thermogravimetric (DTG) curve shown in Figure 5-5 indicate that the total weight loss
(%) of the sample is 12.58 %. According to the TGA results, the catalysts showed two
major weight loss stages during the thermal decomposition process, which are at 290 °C
and 730 °C. The first weight loss step occurred at 290 °C is due to loss of moisture and
physically adsorbed water. The second weight loss stage at 730 °C is due to the
degradation of the catalyst and the structure change [161].
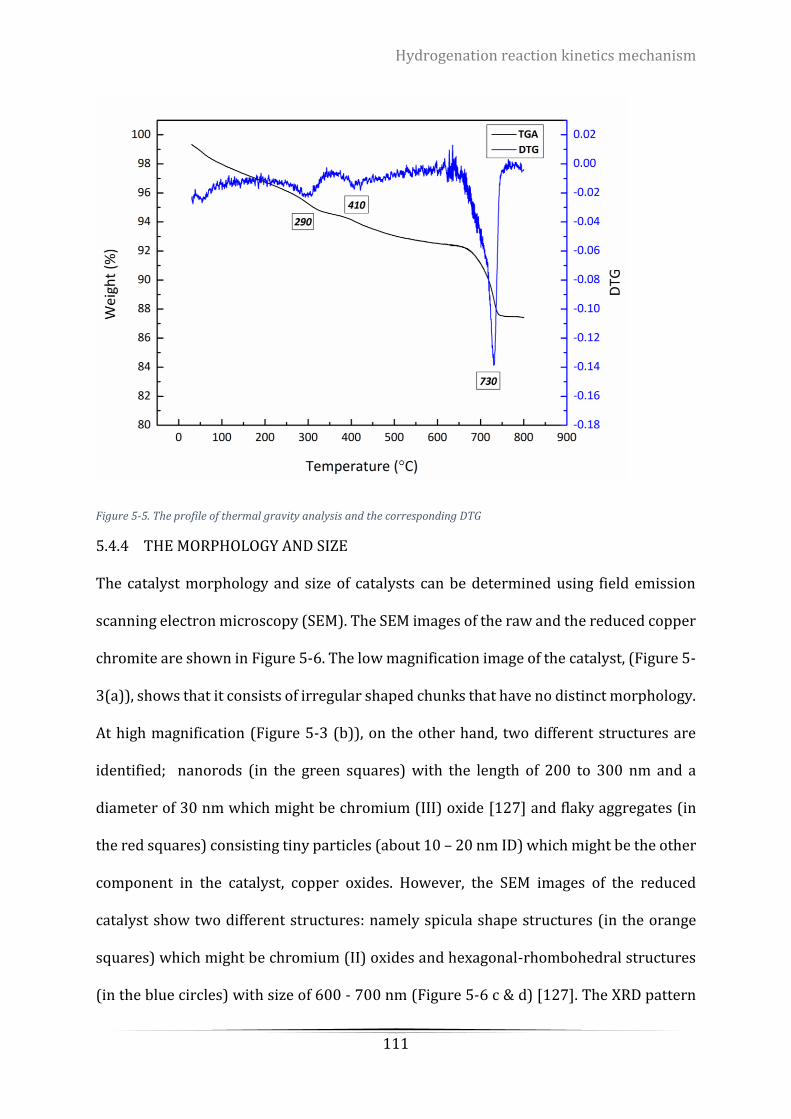
Hydrogenation reaction kinetics mechanism
111
Figure 5-5. The profile of thermal gravity analysis and the corresponding DTG
5.4.4 THE MORPHOLOGY AND SIZE
The catalyst morphology and size of catalysts can be determined using field emission
scanning electron microscopy (SEM). The SEM images of the raw and the reduced copper
chromite are shown in Figure 5-6. The low magnification image of the catalyst, (Figure 5-
3(a)), shows that it consists of irregular shaped chunks that have no distinct morphology.
At high magnification (Figure 5-3 (b)), on the other hand, two different structures are
identified; nanorods (in the green squares) with the length of 200 to 300 nm and a
diameter of 30 nm which might be chromium (III) oxide [127] and flaky aggregates (in
the red squares) consisting tiny particles (about 10 – 20 nm ID) which might be the other
component in the catalyst, copper oxides. However, the SEM images of the reduced
catalyst show two different structures: namely spicula shape structures (in the orange
squares) which might be chromium (II) oxides and hexagonal-rhombohedral structures
(in the blue circles) with size of 600 - 700 nm (Figure 5-6 c & d) [127]. The XRD pattern
Hydrogenation reaction kinetics mechanism
112
of the reduced catalyst shows three defined peaks which are attributed to copper crystals
(Figure 5-4). From this, it can be inferred that the hexagonal-rhombohedral structures
are the metallic copper crystals. Moreover, after reduction the nanorod crystals were
disappeared and replaced with spicula shape structures with 300 nm length and 20 nm
diameter indicating that Cr2O3 is transformed into CrO2. In conclusions, the XRD and SEM
result indicate that the active species of metallic copper is successfully reduced and ready
to use for the hydrogenation reaction.
Figure 5-6. SEM images of the copper chromite sample. (a) and (b) are copper chromite; (c) and (d) are reduced copper chromite
5.4.5 THE SURFACE AREA AND SPECIFIC COPPER SURFACE AREA
The ASAP2010 was used to determine the specific surface area and pore volume of
copper chromite, and the results of before and after hydrogen reduction are listed in
1 µm
(a)
0.1 µm
(b)
1 µm
(c)
0.1 µm
(d)
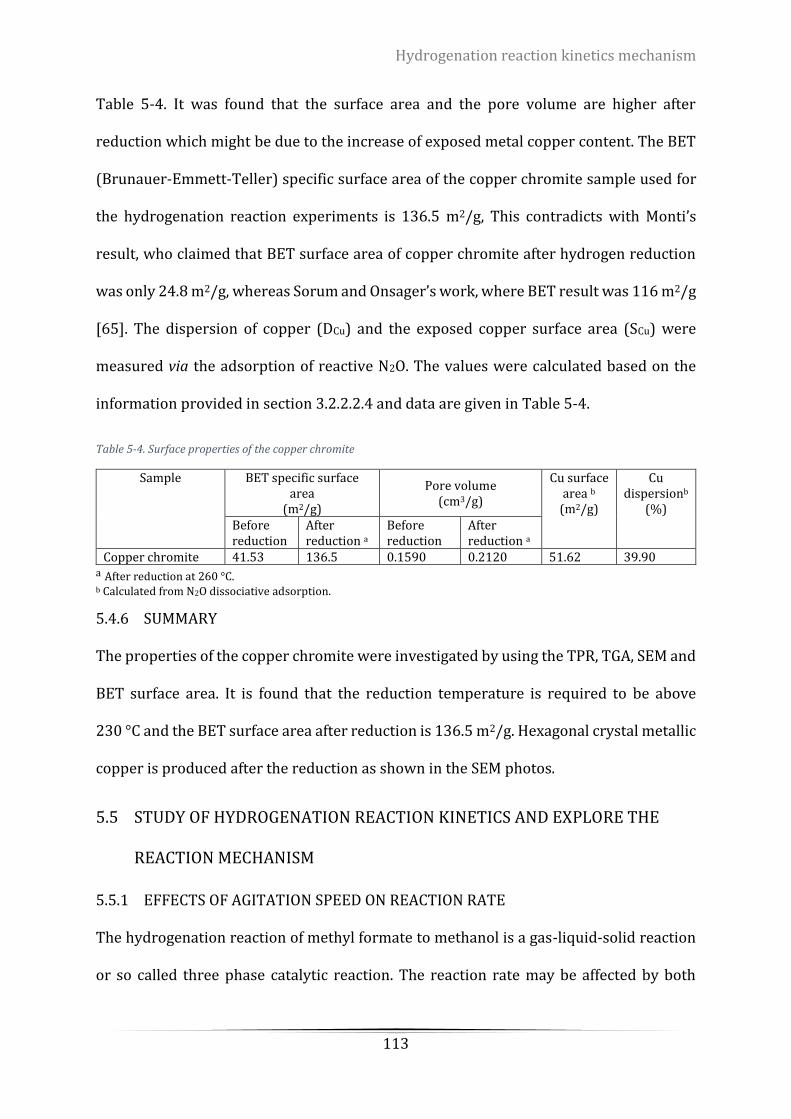
Hydrogenation reaction kinetics mechanism
113
Table 5-4. It was found that the surface area and the pore volume are higher after
reduction which might be due to the increase of exposed metal copper content. The BET
(Brunauer-Emmett-Teller) specific surface area of the copper chromite sample used for
the hydrogenation reaction experiments is 136.5 m2/g, This contradicts with Monti’s
result, who claimed that BET surface area of copper chromite after hydrogen reduction
was only 24.8 m2/g, whereas Sorum and Onsager’s work, where BET result was 116 m2/g
[65]. The dispersion of copper (DCu) and the exposed copper surface area (SCu) were
measured via the adsorption of reactive N2O. The values were calculated based on the
information provided in section 3.2.2.2.4 and data are given in Table 5-4.
Table 5-4. Surface properties of the copper chromite
Sample BET specific surface area
(m2/g)
Pore volume (cm3/g)
Cu surface area b
(m2/g)
Cu dispersionb
(%) Before reduction
After reduction a
Before reduction
After reduction a
Copper chromite 41.53 136.5 0.1590 0.2120 51.62 39.90 a After reduction at 260 °C. b Calculated from N2O dissociative adsorption.
5.4.6 SUMMARY
The properties of the copper chromite were investigated by using the TPR, TGA, SEM and
BET surface area. It is found that the reduction temperature is required to be above
230 °C and the BET surface area after reduction is 136.5 m2/g. Hexagonal crystal metallic
copper is produced after the reduction as shown in the SEM photos.
5.5 STUDY OF HYDROGENATION REACTION KINETICS AND EXPLORE THE
REACTION MECHANISM
5.5.1 EFFECTS OF AGITATION SPEED ON REACTION RATE
The hydrogenation reaction of methyl formate to methanol is a gas-liquid-solid reaction
or so called three phase catalytic reaction. The reaction rate may be affected by both
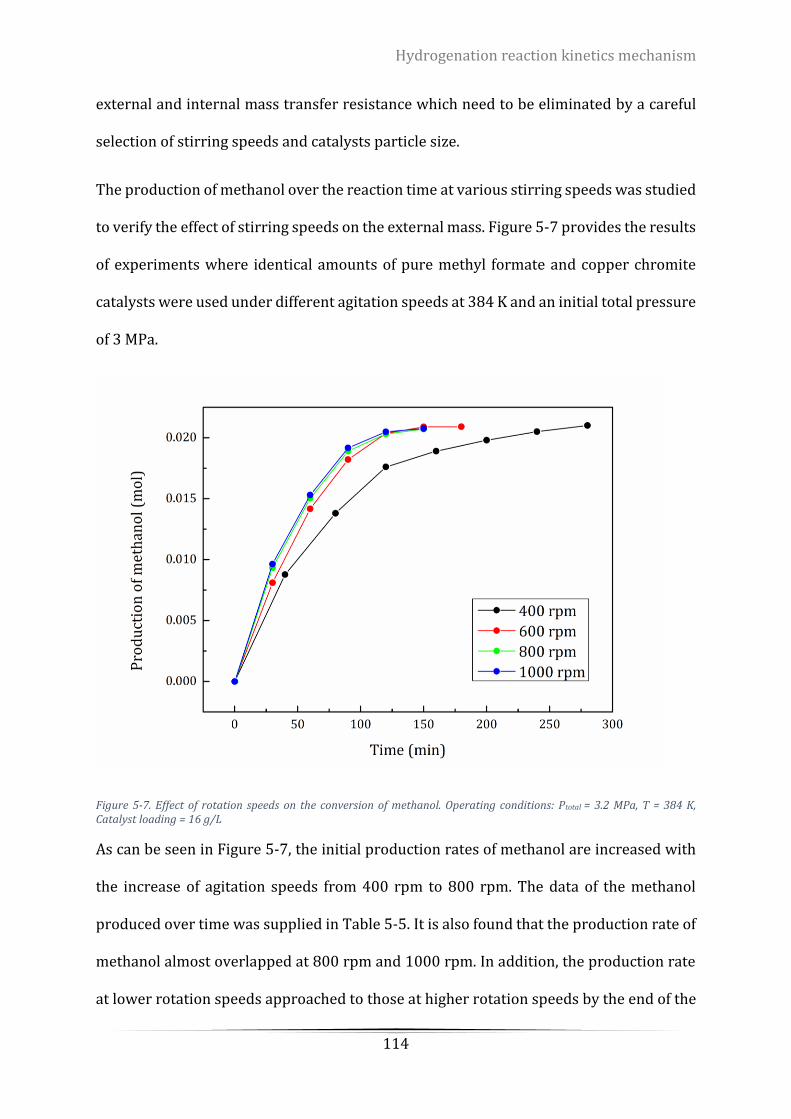
Hydrogenation reaction kinetics mechanism
114
external and internal mass transfer resistance which need to be eliminated by a careful
selection of stirring speeds and catalysts particle size.
The production of methanol over the reaction time at various stirring speeds was studied
to verify the effect of stirring speeds on the external mass. Figure 5-7 provides the results
of experiments where identical amounts of pure methyl formate and copper chromite
catalysts were used under different agitation speeds at 384 K and an initial total pressure
of 3 MPa.
Figure 5-7. Effect of rotation speeds on the conversion of methanol. Operating conditions: Ptotal = 3.2 MPa, T = 384 K, Catalyst loading = 16 g/L
As can be seen in Figure 5-7, the initial production rates of methanol are increased with
the increase of agitation speeds from 400 rpm to 800 rpm. The data of the methanol
produced over time was supplied in Table 5-5. It is also found that the production rate of
methanol almost overlapped at 800 rpm and 1000 rpm. In addition, the production rate
at lower rotation speeds approached to those at higher rotation speeds by the end of the
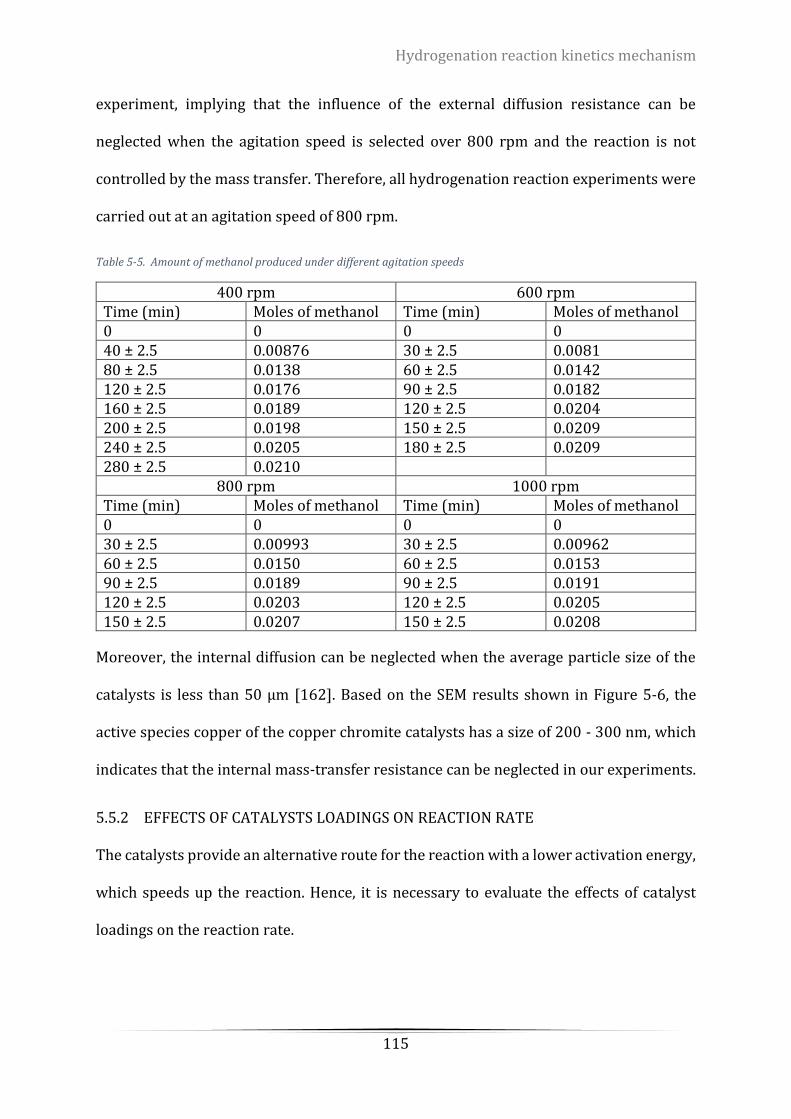
Hydrogenation reaction kinetics mechanism
115
experiment, implying that the influence of the external diffusion resistance can be
neglected when the agitation speed is selected over 800 rpm and the reaction is not
controlled by the mass transfer. Therefore, all hydrogenation reaction experiments were
carried out at an agitation speed of 800 rpm.
Table 5-5. Amount of methanol produced under different agitation speeds
400 rpm 600 rpm Time (min) Moles of methanol Time (min) Moles of methanol 0 0 0 0 40 ± 2.5 0.00876 30 ± 2.5 0.0081 80 ± 2.5 0.0138 60 ± 2.5 0.0142 120 ± 2.5 0.0176 90 ± 2.5 0.0182 160 ± 2.5 0.0189 120 ± 2.5 0.0204 200 ± 2.5 0.0198 150 ± 2.5 0.0209 240 ± 2.5 0.0205 180 ± 2.5 0.0209 280 ± 2.5 0.0210
800 rpm 1000 rpm Time (min) Moles of methanol Time (min) Moles of methanol 0 0 0 0 30 ± 2.5 0.00993 30 ± 2.5 0.00962 60 ± 2.5 0.0150 60 ± 2.5 0.0153 90 ± 2.5 0.0189 90 ± 2.5 0.0191 120 ± 2.5 0.0203 120 ± 2.5 0.0205 150 ± 2.5 0.0207 150 ± 2.5 0.0208
Moreover, the internal diffusion can be neglected when the average particle size of the
catalysts is less than 50 µm [162]. Based on the SEM results shown in Figure 5-6, the
active species copper of the copper chromite catalysts has a size of 200 - 300 nm, which
indicates that the internal mass-transfer resistance can be neglected in our experiments.
5.5.2 EFFECTS OF CATALYSTS LOADINGS ON REACTION RATE
The catalysts provide an alternative route for the reaction with a lower activation energy,
which speeds up the reaction. Hence, it is necessary to evaluate the effects of catalyst
loadings on the reaction rate.
Hydrogenation reaction kinetics mechanism
116
Figure 5-8. Effect of the catalyst loadings on the conversion rate of methanol. Operating conditions: Ptotal= 3.2 MPa, T = 384K. Rotation speed = 800 rpm.
Figure 5-8 represents the effect of catalyst loadings range between 8 g/L and 20 g/L on
hydrogen conversion. The data are summarised in Table 5-6. The unit of the catalyst
loadings represents the gram of catalysts per volume of methyl formate used in the
experiment. The result indicates that 8 g/L of the reduced copper chromite gives the
lowest methanol production rate. In addition, the hydrogen conversion rate can be
significantly improved by increasing the catalysts loading from 8 g/L to 12 g/L, which
implies that the reaction rate is proportional to the catalysts loadings at the investigated
range. Interestingly, it was found that the reaction rate can only be improved slightly
when adding the catalysts from 12 g/L to 20 g/L, which may suggest that the active sites
of the catalysts should be sufficient to initiate the hydrogen reaction. Therefore, 16 g/L
of catalysts concentration was used for our all hydrogenation reactions.
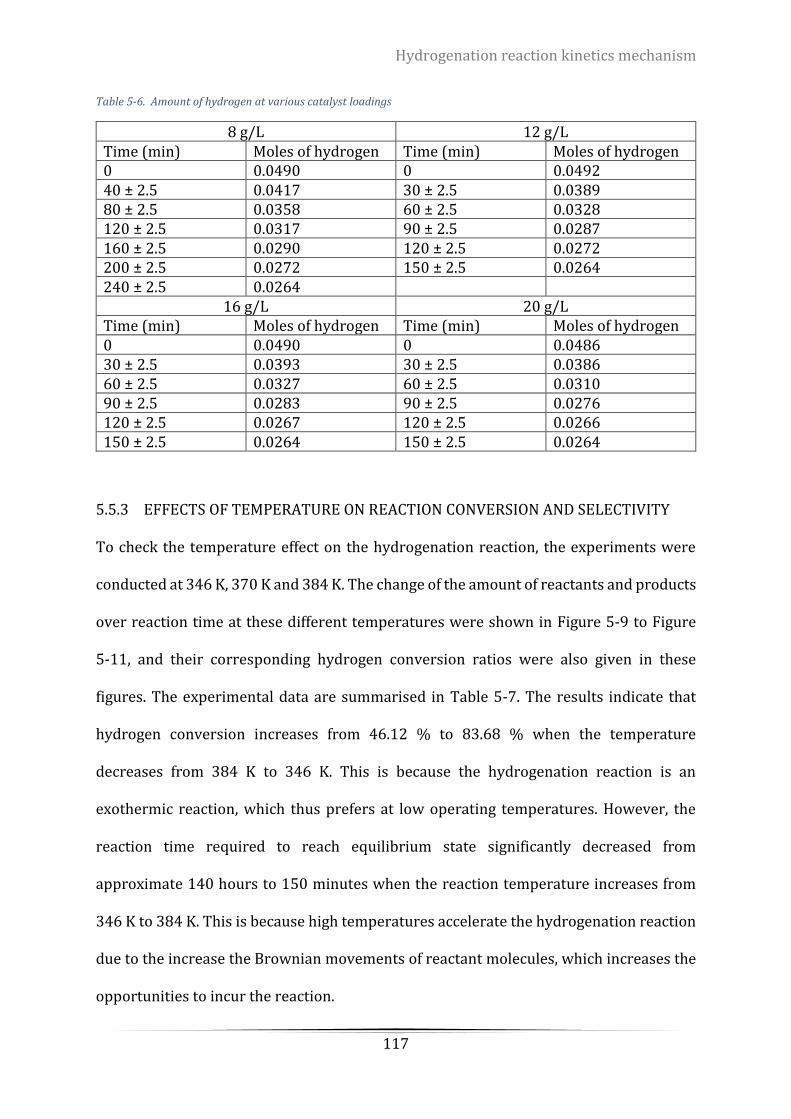
Hydrogenation reaction kinetics mechanism
117
Table 5-6. Amount of hydrogen at various catalyst loadings
8 g/L 12 g/L Time (min) Moles of hydrogen Time (min) Moles of hydrogen 0 0.0490 0 0.0492 40 ± 2.5 0.0417 30 ± 2.5 0.0389 80 ± 2.5 0.0358 60 ± 2.5 0.0328 120 ± 2.5 0.0317 90 ± 2.5 0.0287 160 ± 2.5 0.0290 120 ± 2.5 0.0272 200 ± 2.5 0.0272 150 ± 2.5 0.0264 240 ± 2.5 0.0264
16 g/L 20 g/L Time (min) Moles of hydrogen Time (min) Moles of hydrogen 0 0.0490 0 0.0486 30 ± 2.5 0.0393 30 ± 2.5 0.0386 60 ± 2.5 0.0327 60 ± 2.5 0.0310 90 ± 2.5 0.0283 90 ± 2.5 0.0276 120 ± 2.5 0.0267 120 ± 2.5 0.0266 150 ± 2.5 0.0264 150 ± 2.5 0.0264
5.5.3 EFFECTS OF TEMPERATURE ON REACTION CONVERSION AND SELECTIVITY
To check the temperature effect on the hydrogenation reaction, the experiments were
conducted at 346 K, 370 K and 384 K. The change of the amount of reactants and products
over reaction time at these different temperatures were shown in Figure 5-9 to Figure
5-11, and their corresponding hydrogen conversion ratios were also given in these
figures. The experimental data are summarised in Table 5-7. The results indicate that
hydrogen conversion increases from 46.12 % to 83.68 % when the temperature
decreases from 384 K to 346 K. This is because the hydrogenation reaction is an
exothermic reaction, which thus prefers at low operating temperatures. However, the
reaction time required to reach equilibrium state significantly decreased from
approximate 140 hours to 150 minutes when the reaction temperature increases from
346 K to 384 K. This is because high temperatures accelerate the hydrogenation reaction
due to the increase the Brownian movements of reactant molecules, which increases the
opportunities to incur the reaction.
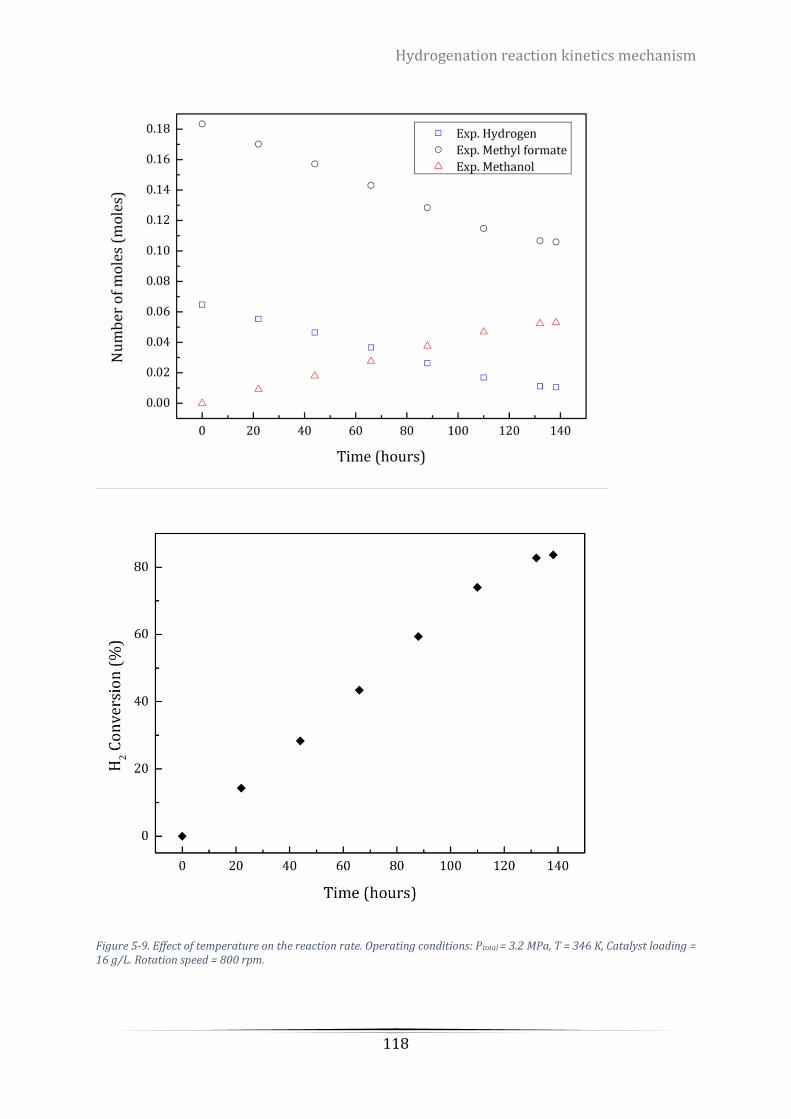
Hydrogenation reaction kinetics mechanism
118
Figure 5-9. Effect of temperature on the reaction rate. Operating conditions: Ptotal = 3.2 MPa, T = 346 K, Catalyst loading = 16 g/L. Rotation speed = 800 rpm.
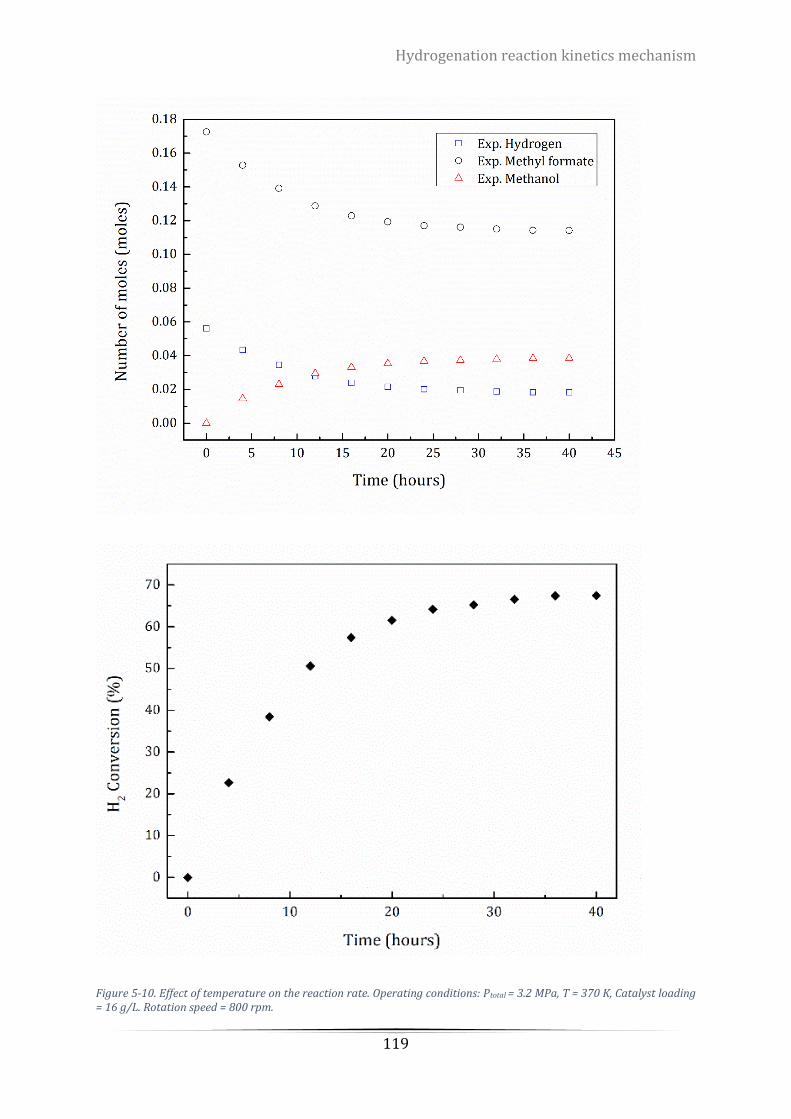
Hydrogenation reaction kinetics mechanism
119
Figure 5-10. Effect of temperature on the reaction rate. Operating conditions: Ptotal = 3.2 MPa, T = 370 K, Catalyst loading = 16 g/L. Rotation speed = 800 rpm.
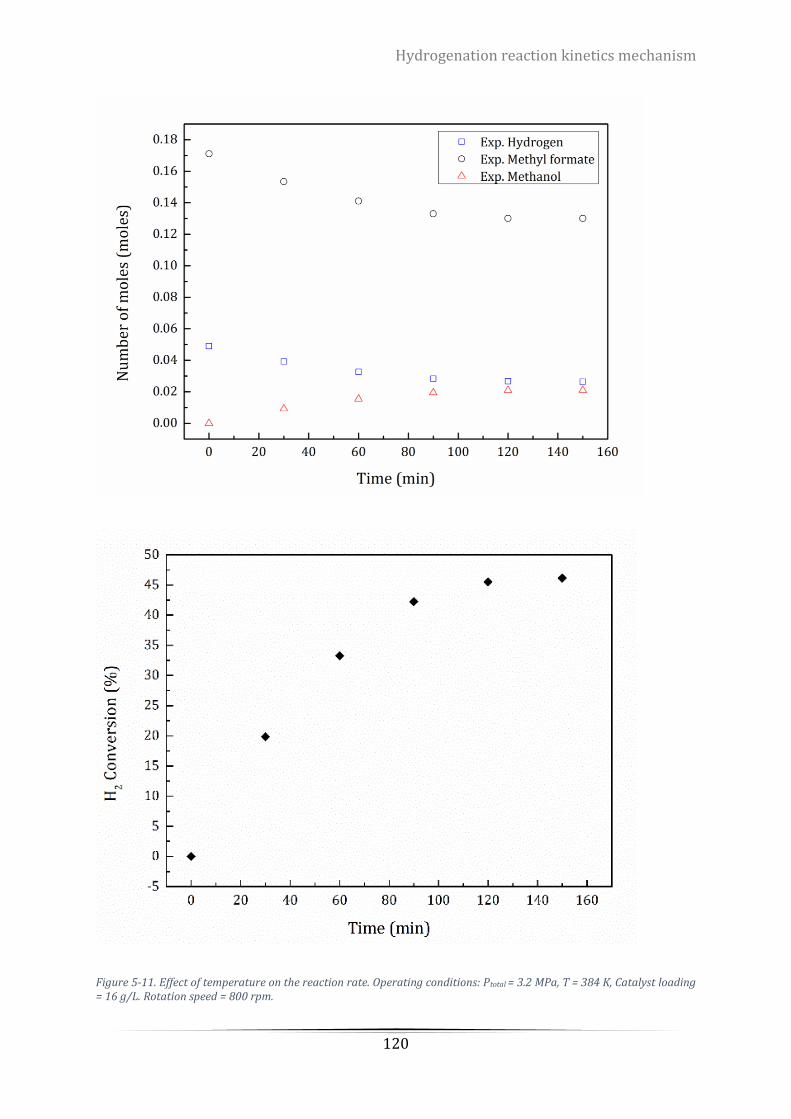
Hydrogenation reaction kinetics mechanism
120
Figure 5-11. Effect of temperature on the reaction rate. Operating conditions: Ptotal = 3.2 MPa, T = 384 K, Catalyst loading = 16 g/L. Rotation speed = 800 rpm.
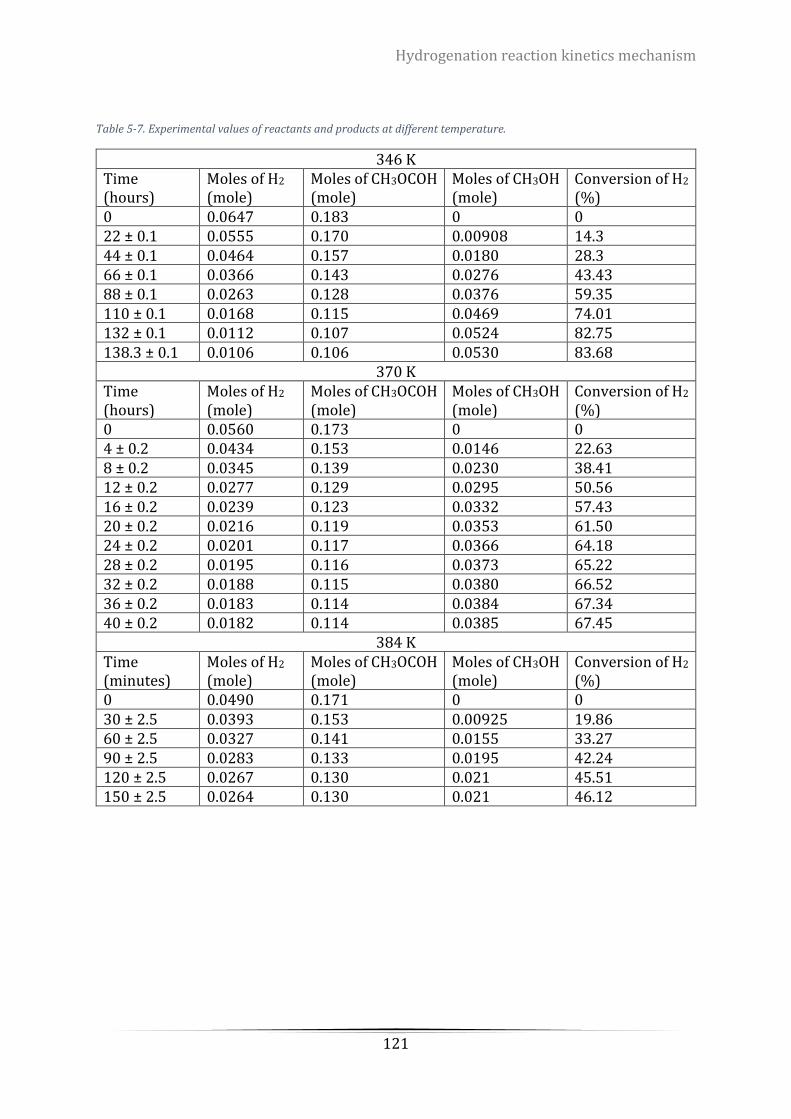
Hydrogenation reaction kinetics mechanism
121
Table 5-7. Experimental values of reactants and products at different temperature.
346 K Time (hours)
Moles of H2 (mole)
Moles of CH3OCOH (mole)
Moles of CH3OH (mole)
Conversion of H2
(%) 0 0.0647 0.183 0 0 22 ± 0.1 0.0555 0.170 0.00908 14.3 44 ± 0.1 0.0464 0.157 0.0180 28.3 66 ± 0.1 0.0366 0.143 0.0276 43.43 88 ± 0.1 0.0263 0.128 0.0376 59.35 110 ± 0.1 0.0168 0.115 0.0469 74.01 132 ± 0.1 0.0112 0.107 0.0524 82.75 138.3 ± 0.1 0.0106 0.106 0.0530 83.68
370 K Time (hours)
Moles of H2 (mole)
Moles of CH3OCOH (mole)
Moles of CH3OH (mole)
Conversion of H2
(%) 0 0.0560 0.173 0 0 4 ± 0.2 0.0434 0.153 0.0146 22.63 8 ± 0.2 0.0345 0.139 0.0230 38.41 12 ± 0.2 0.0277 0.129 0.0295 50.56 16 ± 0.2 0.0239 0.123 0.0332 57.43 20 ± 0.2 0.0216 0.119 0.0353 61.50 24 ± 0.2 0.0201 0.117 0.0366 64.18 28 ± 0.2 0.0195 0.116 0.0373 65.22 32 ± 0.2 0.0188 0.115 0.0380 66.52 36 ± 0.2 0.0183 0.114 0.0384 67.34 40 ± 0.2 0.0182 0.114 0.0385 67.45
384 K Time (minutes)
Moles of H2 (mole)
Moles of CH3OCOH (mole)
Moles of CH3OH (mole)
Conversion of H2
(%) 0 0.0490 0.171 0 0 30 ± 2.5 0.0393 0.153 0.00925 19.86 60 ± 2.5 0.0327 0.141 0.0155 33.27 90 ± 2.5 0.0283 0.133 0.0195 42.24 120 ± 2.5 0.0267 0.130 0.021 45.51 150 ± 2.5 0.0264 0.130 0.021 46.12
Hydrogenation reaction kinetics mechanism
122
The analysis of reaction products show trace amounts of undesired products, CO and
dimethyl ether in the gas phase of some experiments, which can be attributed to a
decarbonylation reaction (shown in Reaction 5-4) and a methanol dehydration reaction
(shown in Reaction 5-5), respectively. As their produced amount are small, it is difficult
to evaluate their peak areas from the GC analysis, and thus a 99 % selectivity of the
hydrogenation reaction may be assumed in the operating temperatures ranges between
346 K and 384 K. On the other hand, it is noted that a large portion of methyl formate was
detected in the gas phase due to its high vapour pressure (c.a. 1 MPa) at 384 K.
Reaction 5-4. Decarbonylation reaction
HCOOCH3 ⇌ CH3OH + CO
Reaction 5-5. Dehydration of methanol
2CH3OH ⇌ CH3OCH3 + H2O
It can be found that the concentration of reactants decreases dramatically at the initial
stage of the reaction and then slows down gradually with increasing the reaction time.
Therefore, most of the hydrogen reaction occurs at the beginning of the experiments due
to high concentration of reactants.
5.5.4 REACTION KINETICS MODEL AND PARAMETER ESTIMATION
In order to obtain the reaction rate, it is necessary to consider a reaction mechanism.
However, no published literature on the possible hydrogenation reaction mechanism is
available, it is important to postulate a reaction mechanism for the current hydrogenation.
Hence, a kinetics model with the dissociative adsorption of hydrogen is derived. In the
theory, the molecular size of hydrogen is much smaller than the organic species, and thus
it can be adsorbed on the surface of the solid catalysts freely. Therefore, the adsorption
of hydrogen and methyl formate on the catalysts can be considered as non-competitive.
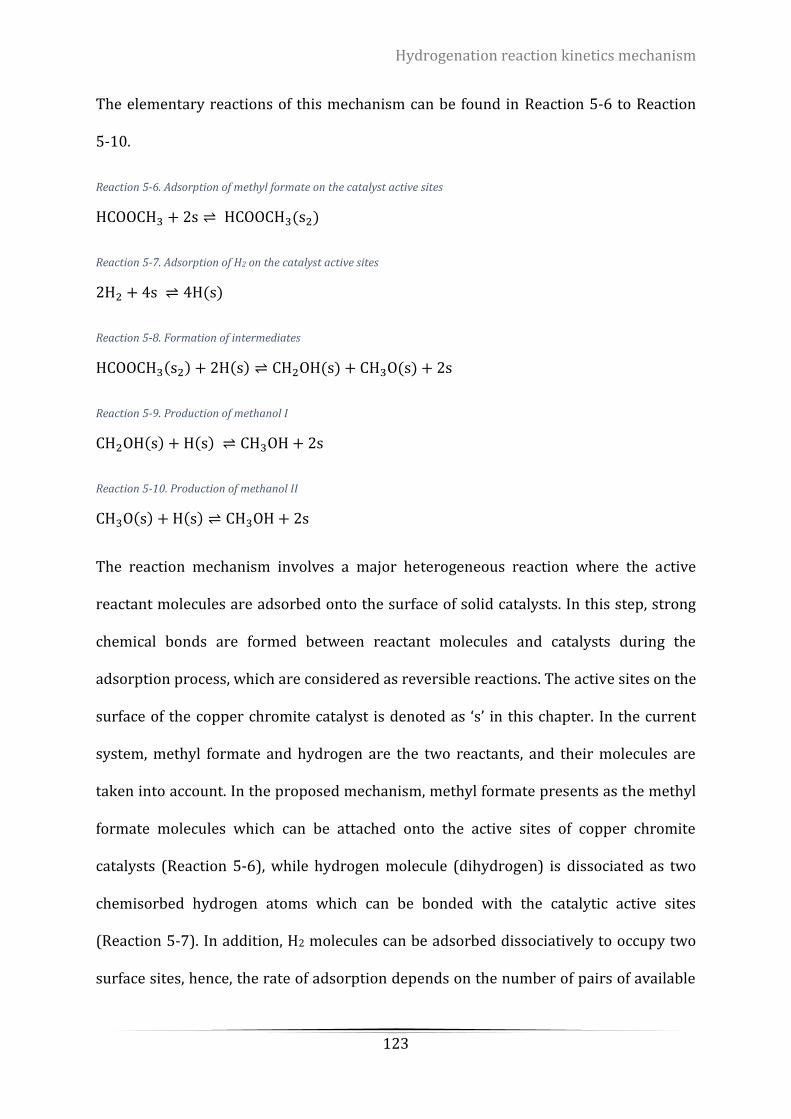
Hydrogenation reaction kinetics mechanism
123
The elementary reactions of this mechanism can be found in Reaction 5-6 to Reaction
5-10.
Reaction 5-6. Adsorption of methyl formate on the catalyst active sites
HCOOCH3 + 2s ⇌ HCOOCH3(s2)
Reaction 5-7. Adsorption of H2 on the catalyst active sites
2H2 + 4s ⇌ 4H(s)
Reaction 5-8. Formation of intermediates
HCOOCH3(s2) + 2H(s) ⇌ CH2OH(s) + CH3O(s) + 2s
Reaction 5-9. Production of methanol I
CH2OH(s) + H(s) ⇌ CH3OH + 2s
Reaction 5-10. Production of methanol II
CH3O(s) + H(s) ⇌ CH3OH + 2s
The reaction mechanism involves a major heterogeneous reaction where the active
reactant molecules are adsorbed onto the surface of solid catalysts. In this step, strong
chemical bonds are formed between reactant molecules and catalysts during the
adsorption process, which are considered as reversible reactions. The active sites on the
surface of the copper chromite catalyst is denoted as ‘s’ in this chapter. In the current
system, methyl formate and hydrogen are the two reactants, and their molecules are
taken into account. In the proposed mechanism, methyl formate presents as the methyl
formate molecules which can be attached onto the active sites of copper chromite
catalysts (Reaction 5-6), while hydrogen molecule (dihydrogen) is dissociated as two
chemisorbed hydrogen atoms which can be bonded with the catalytic active sites
(Reaction 5-7). In addition, H2 molecules can be adsorbed dissociatively to occupy two
surface sites, hence, the rate of adsorption depends on the number of pairs of available

Hydrogenation reaction kinetics mechanism
124
surface sites. The reserve reaction is known as associative desorption. Two intermediates
(Reaction 5-8), CH2OH(s) and CH3OH(s) are subsequently generated followed by
Reaction 5-6 and Reaction 5-7, which becomes the precursor reaction to produce the
methanol molecules (Reaction 5-9 and Reaction 5-10).
In literature, the quasi equilibrium method is widely applied to determine reaction
kinetics models and their corresponding rate expressions. In this model, several reaction
mechanisms are proposed, where there are many elementary steps. For example,
hydrogenation reactions contain different carbon chain repartition and monomer
formation elementary steps. In each proposed reaction mechanism, only one elementary
step is assumed to be a rate limiting step (RDS), and all other steps are considered as
equilibrium, or named quasi equilibrium. The expression is constrained with the site
balance where the sum of surface fraction adsorbed by different species equals to one.
Based on the assumption, a rate equation can be expressed.
In each mechanism, every elementary step has possibilities to be the RDS, thus having a
number of rate expressions for different RDS in different mechanisms. All the expressions
are further required to be regressed using experimental data to evaluate the parameters
in each expression. The one with the best fitting is considered the most likely reaction
mechanism and reaction kinetics model. According to Mirzaei et al., there are many ways,
including graph, residual plot, confidence interval, 𝑅2 , 𝑅𝑎𝑑𝑗2 and variance and 𝑅𝑚𝑠𝑑 , to
evaluate if the rate expression reflects the experiment correctly [163]. The graph is used
to track the reaction rate of reactants or products to check if the prediction of the model
is consistent with the experiment. The residual plot is used to check the deviation
between the model and the experiment. Confidence intervals are used to check the
robustness of evaluated parameters in the model. 𝑅2 and 𝑅𝑎𝑑𝑗2 are employed if the model
Hydrogenation reaction kinetics mechanism
125
responds to the experimental data. Variance and 𝑅𝑚𝑠𝑑 are adopted to evaluate the
accuracy of the model.
It was found that using the quasi equilibrium method is a time-consuming process, which
involved great amounts of work in deriving rate expressions and evaluating the best
model. In addition, some reactions may have multiple rate limiting steps, and other
elementary reactions may not be at equilibrium. Therefore, using this method may not be
reliable and accurate to illustrate a reaction mechanism.
Hence, in our study, a new approach will be used and presented. Since the elementary
reaction steps are proposed, the reaction rate of each component including the
intermediates can be expressed based on the concentration and the kinetics constants,
and all those equations are ordinary differential equations (ODEs). The ODEs can be
found from Reaction 5-6 to Reaction 5-10. In MATLAB, such ODEs can be solved using the
built-in MATLAB solver ‘ode15s’. ‘ode15s’ adopts variable-step, variable-order based
numerical differentiation formula (NDF) and backward differentiation formula (BDF) to
solve ODEs in the form of Taylor polynomial. The variable order for Taylor polynomial
can be selected up to 5 in ‘ode15s’ to evaluate the objective function 𝜕𝐹
𝜕𝑡. A typical BDF
using higher orders of Taylor polynomial is given by Reaction 5-9. Considering the
concentration of each element in the proposed reaction mechanism is in a broad range,
which make the objective function stiff, the numerical method should take small variable
steps to obtain satisfactory results. Hence, the ‘ode15s’ provides an efficient and time-
saving method without sacrificing the calculation accuracy.
The kinetic parameters 𝜃 = [𝑘1, 𝑘−1, 𝑘2, 𝑘−2, 𝑘3, 𝑘−3, 𝑘4, 𝑘−4, 𝑘5, 𝑘−5] were evaluated
using the least-squares regression method, and the objective function is given in Equation
5-10, which is the sum of difference between the concentration of hydrogen, methyl
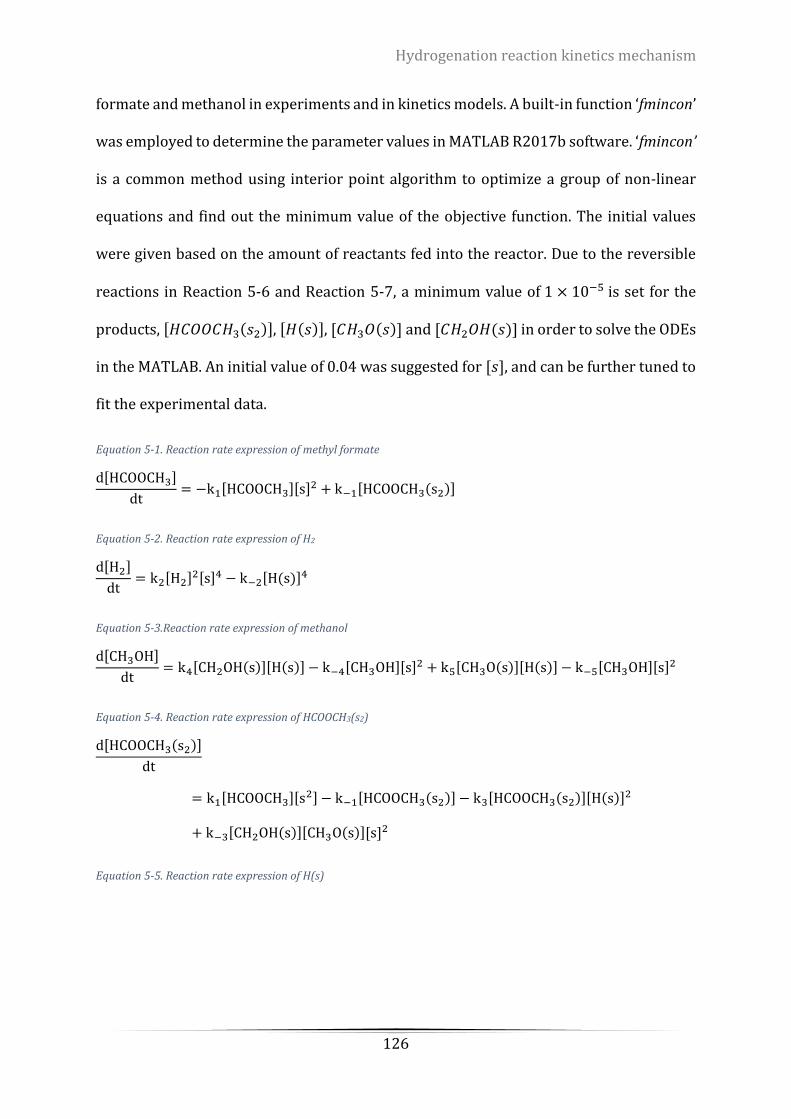
Hydrogenation reaction kinetics mechanism
126
formate and methanol in experiments and in kinetics models. A built-in function ‘fmincon’
was employed to determine the parameter values in MATLAB R2017b software. ‘fmincon’
is a common method using interior point algorithm to optimize a group of non-linear
equations and find out the minimum value of the objective function. The initial values
were given based on the amount of reactants fed into the reactor. Due to the reversible
reactions in Reaction 5-6 and Reaction 5-7, a minimum value of 1 × 10⁻⁵ is set for the
products, [𝐻𝐶𝑂𝑂𝐶𝐻3(𝑠2)], [𝐻(𝑠)], [𝐶𝐻3𝑂(𝑠)] and [𝐶𝐻2𝑂𝐻(𝑠)] in order to solve the ODEs
in the MATLAB. An initial value of 0.04 was suggested for [𝑠], and can be further tuned to
fit the experimental data.
Equation 5-1. Reaction rate expression of methyl formate
d[HCOOCH3]
dt= −k1[HCOOCH3][s]2 + k−1[HCOOCH3(s2)]
Equation 5-2. Reaction rate expression of H2
d[H2]
dt= k2[H2]2[s]4 − k−2[H(s)]4
Equation 5-3.Reaction rate expression of methanol
d[CH3OH]
dt= k4[CH2OH(s)][H(s)] − k−4[CH3OH][s]2 + k5[CH3O(s)][H(s)] − k−5[CH3OH][s]2
Equation 5-4. Reaction rate expression of HCOOCH3(s2)
d[HCOOCH3(s2)]
dt
= k1[HCOOCH3][s2] − k−1[HCOOCH3(s2)] − k3[HCOOCH3(s2)][H(s)]2
+ k−3[CH2OH(s)][CH3O(s)][s]2
Equation 5-5. Reaction rate expression of H(s)
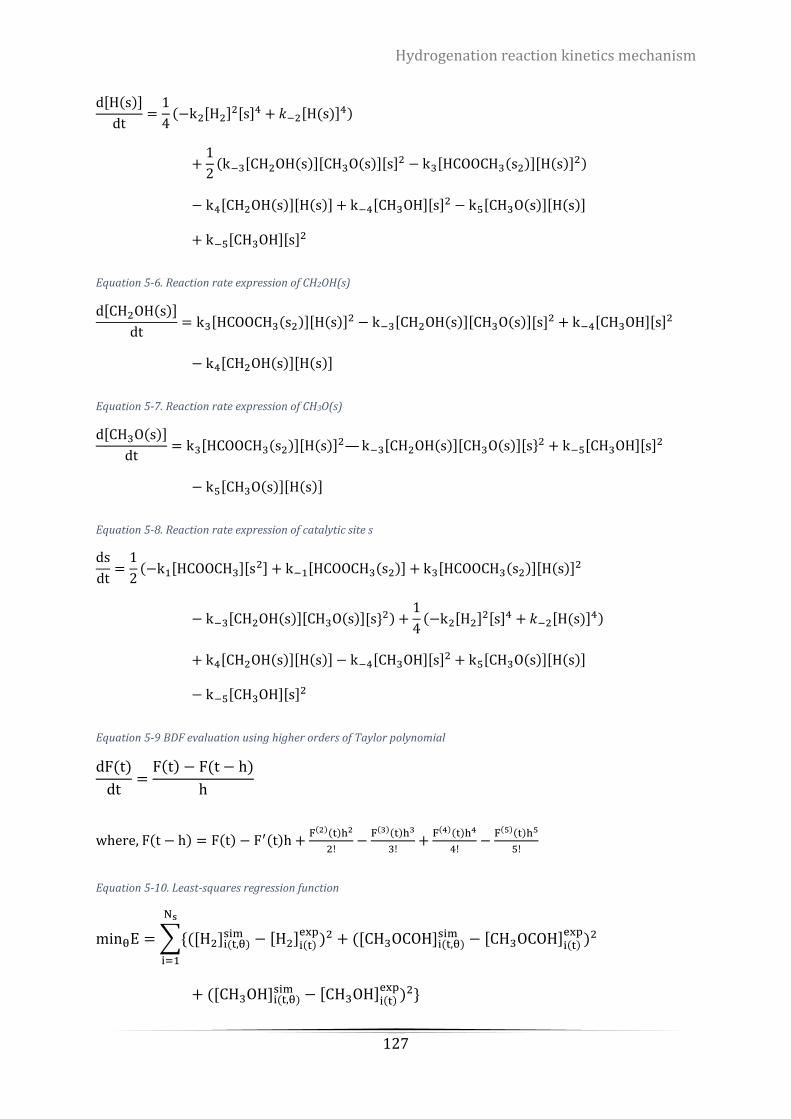
Hydrogenation reaction kinetics mechanism
127
d[H(s)]
dt=
1
4(−k2[H2]2[s]4 + 𝑘−2[H(s)]4)
+1
2(k−3[CH2OH(s)][CH3O(s)][s]2 − k3[HCOOCH3(s2)][H(s)]2)
− k4[CH2OH(s)][H(s)] + k−4[CH3OH][s]2 − k5[CH3O(s)][H(s)]
+ k−5[CH3OH][s]2
Equation 5-6. Reaction rate expression of CH2OH(s)
d[CH2OH(s)]
dt= k3[HCOOCH3(s2)][H(s)]2 − k−3[CH2OH(s)][CH3O(s)][s]2 + k−4[CH3OH][s]2
− k4[CH2OH(s)][H(s)]
Equation 5-7. Reaction rate expression of CH3O(s)
d[CH3O(s)]
dt= k3[HCOOCH3(s2)][H(s)]2— k−3[CH2OH(s)][CH3O(s)][s}2 + k−5[CH3OH][s]2
− k5[CH3O(s)][H(s)]
Equation 5-8. Reaction rate expression of catalytic site s
ds
dt=
1
2(−k1[HCOOCH3][s2] + k−1[HCOOCH3(s2)] + k3[HCOOCH3(s2)][H(s)]2
− k−3[CH2OH(s)][CH3O(s)][s}2) +1
4(−k2[H2]2[s]4 + 𝑘−2[H(s)]4)
+ k4[CH2OH(s)][H(s)] − k−4[CH3OH][s]2 + k5[CH3O(s)][H(s)]
− k−5[CH3OH][s]2
Equation 5-9 BDF evaluation using higher orders of Taylor polynomial
dF(t)
dt=
F(t) − F(t − h)
h
where, F(t − h) = F(t) − F′(t)h +F(2)(t)h2
2!−
F(3)(t)h3
3!+
F(4)(t)h4
4!−
F(5)(t)h5
5!
Equation 5-10. Least-squares regression function
minθE = ∑{([H2]i(t,θ)sim − [H2]
i(t)exp
)2 + ([CH3OCOH]i(t,θ)sim − [CH3OCOH]
i(t)exp
)2
Ns
i=1
+ ([CH3OH]i(t,θ)sim − [CH3OH]
i(t)exp
)2}
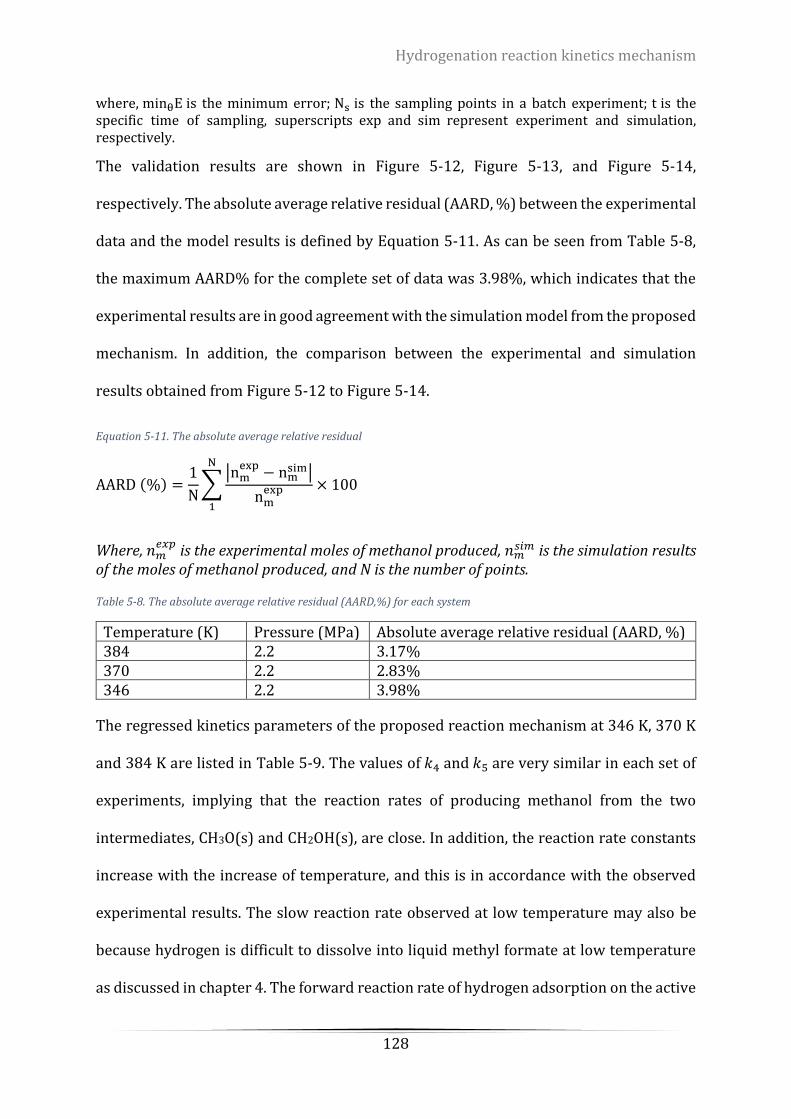
Hydrogenation reaction kinetics mechanism
128
where, minθE is the minimum error; Ns is the sampling points in a batch experiment; t is the specific time of sampling, superscripts exp and sim represent experiment and simulation, respectively.
The validation results are shown in Figure 5-12, Figure 5-13, and Figure 5-14,
respectively. The absolute average relative residual (AARD, %) between the experimental
data and the model results is defined by Equation 5-11. As can be seen from Table 5-8,
the maximum AARD% for the complete set of data was 3.98%, which indicates that the
experimental results are in good agreement with the simulation model from the proposed
mechanism. In addition, the comparison between the experimental and simulation
results obtained from Figure 5-12 to Figure 5-14.
Equation 5-11. The absolute average relative residual
AARD (%) =1
N∑
|nmexp
− nmsim|
nmexp
N
1
× 100
Where, 𝑛𝑚𝑒𝑥𝑝 is the experimental moles of methanol produced, 𝑛𝑚
𝑠𝑖𝑚 is the simulation results of the moles of methanol produced, and N is the number of points.
Table 5-8. The absolute average relative residual (AARD,%) for each system
Temperature (K) Pressure (MPa) Absolute average relative residual (AARD, %) 384 2.2 3.17% 370 2.2 2.83% 346 2.2 3.98%
The regressed kinetics parameters of the proposed reaction mechanism at 346 K, 370 K
and 384 K are listed in Table 5-9. The values of 𝑘4 and 𝑘5 are very similar in each set of
experiments, implying that the reaction rates of producing methanol from the two
intermediates, CH3O(s) and CH2OH(s), are close. In addition, the reaction rate constants
increase with the increase of temperature, and this is in accordance with the observed
experimental results. The slow reaction rate observed at low temperature may also be
because hydrogen is difficult to dissolve into liquid methyl formate at low temperature
as discussed in chapter 4. The forward reaction rate of hydrogen adsorption on the active
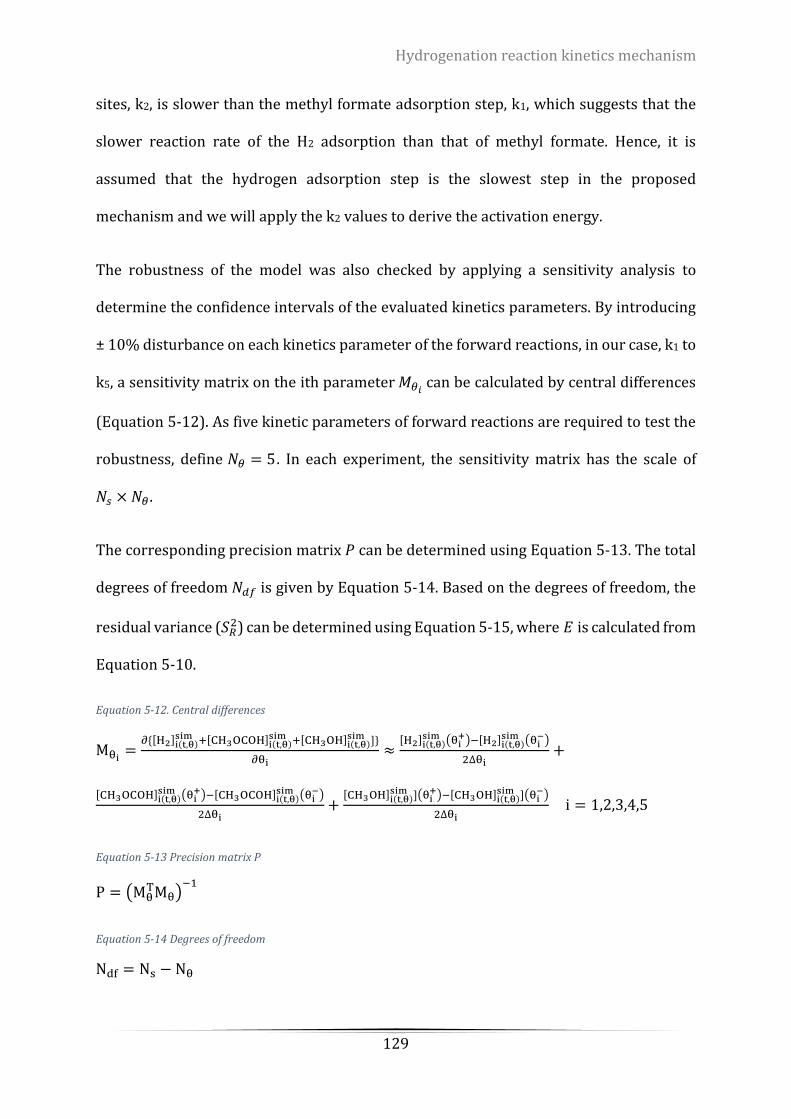
Hydrogenation reaction kinetics mechanism
129
sites, k2, is slower than the methyl formate adsorption step, k1, which suggests that the
slower reaction rate of the H2 adsorption than that of methyl formate. Hence, it is
assumed that the hydrogen adsorption step is the slowest step in the proposed
mechanism and we will apply the k2 values to derive the activation energy.
The robustness of the model was also checked by applying a sensitivity analysis to
determine the confidence intervals of the evaluated kinetics parameters. By introducing
± 10% disturbance on each kinetics parameter of the forward reactions, in our case, k1 to
k5, a sensitivity matrix on the ith parameter 𝑀𝜃𝑖 can be calculated by central differences
(Equation 5-12). As five kinetic parameters of forward reactions are required to test the
robustness, define 𝑁𝜃 = 5 . In each experiment, the sensitivity matrix has the scale of
𝑁𝑠 × 𝑁𝜃.
The corresponding precision matrix 𝑃 can be determined using Equation 5-13. The total
degrees of freedom 𝑁𝑑𝑓 is given by Equation 5-14. Based on the degrees of freedom, the
residual variance (𝑆𝑅2) can be determined using Equation 5-15, where 𝐸 is calculated from
Equation 5-10.
Equation 5-12. Central differences
Mθi=
∂{[H2]i(t,θ)sim +[CH3OCOH]i(t,θ)
sim +[CH3OH]i(t,θ)sim ]}
∂θi≈
[H2]i(t,θ)sim (θi
+)−[H2]i(t,θ)sim (θi
−)
2∆θi+
[CH3OCOH]i(t,θ)sim (θi
+)−[CH3OCOH]i(t,θ)sim (θi
−)
2∆θi+
[CH3OH]i(t,θ)sim ](θi
+)−[CH3OH]i(t,θ)sim ](θi
−)
2∆θi i = 1,2,3,4,5
Equation 5-13 Precision matrix P
P = (MθTMθ)
−1
Equation 5-14 Degrees of freedom
Ndf = Ns − Nθ
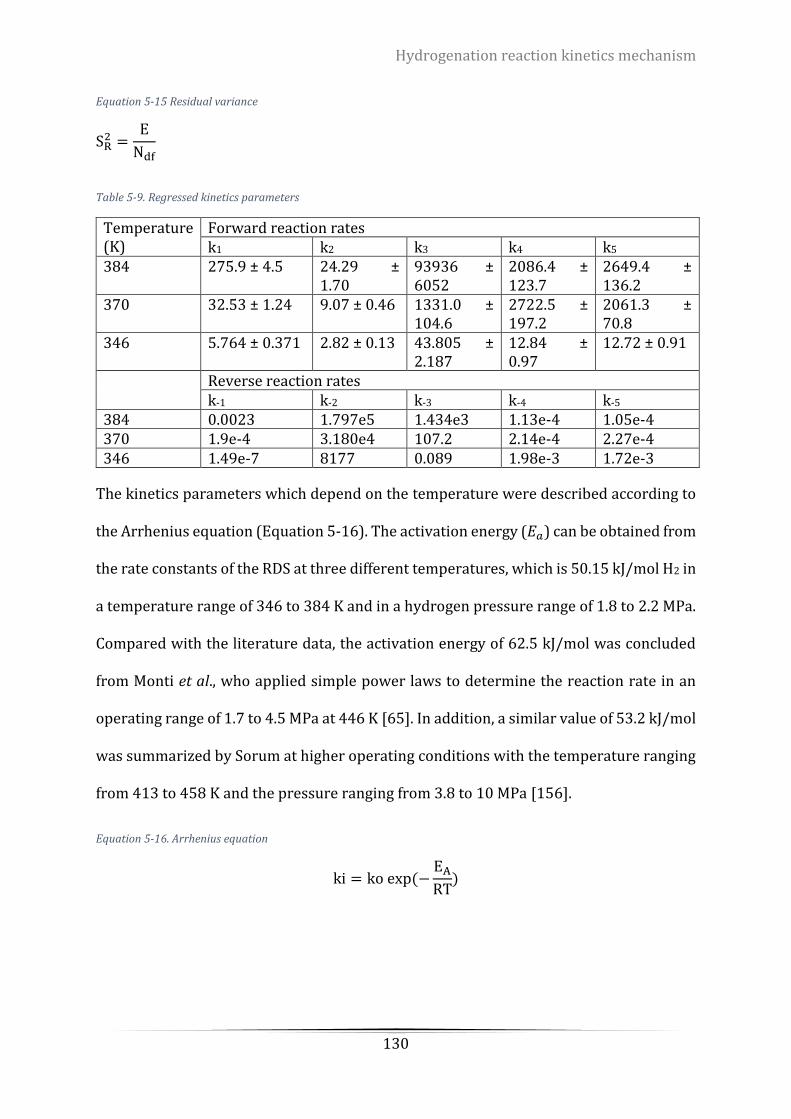
Hydrogenation reaction kinetics mechanism
130
Equation 5-15 Residual variance
SR2 =
E
Ndf
Table 5-9. Regressed kinetics parameters
Temperature (K)
Forward reaction rates k1 k2 k3 k4 k5
384 275.9 ± 4.5 24.29 ± 1.70
93936 ± 6052
2086.4 ± 123.7
2649.4 ± 136.2
370 32.53 ± 1.24 9.07 ± 0.46 1331.0 ± 104.6
2722.5 ± 197.2
2061.3 ± 70.8
346 5.764 ± 0.371 2.82 ± 0.13 43.805 ± 2.187
12.84 ± 0.97
12.72 ± 0.91
Reverse reaction rates k-1 k-2 k-3 k-4 k-5
384 0.0023 1.797e5 1.434e3 1.13e-4 1.05e-4 370 1.9e-4 3.180e4 107.2 2.14e-4 2.27e-4 346 1.49e-7 8177 0.089 1.98e-3 1.72e-3
The kinetics parameters which depend on the temperature were described according to
the Arrhenius equation (Equation 5-16). The activation energy (𝐸𝑎) can be obtained from
the rate constants of the RDS at three different temperatures, which is 50.15 kJ/mol H2 in
a temperature range of 346 to 384 K and in a hydrogen pressure range of 1.8 to 2.2 MPa.
Compared with the literature data, the activation energy of 62.5 kJ/mol was concluded
from Monti et al., who applied simple power laws to determine the reaction rate in an
operating range of 1.7 to 4.5 MPa at 446 K [65]. In addition, a similar value of 53.2 kJ/mol
was summarized by Sorum at higher operating conditions with the temperature ranging
from 413 to 458 K and the pressure ranging from 3.8 to 10 MPa [156].
Equation 5-16. Arrhenius equation
ki = ko exp (−EA
RT)

Hydrogenation reaction kinetics mechanism
131
Figure 5-12. Comparison of experimental and simulation results at T = 346 K. Operating conditions: Ptotal = 3.2 MPa, Catalyst loading = 16 g/L. Rotation speed = 800 rpm.
Figure 5-13. Comparison of experimental and simulation results at T = 370 K. Operating conditions: Ptotal = 3.2 MPa, Catalyst loading = 16 g/L. Rotation speed = 800 rpm.
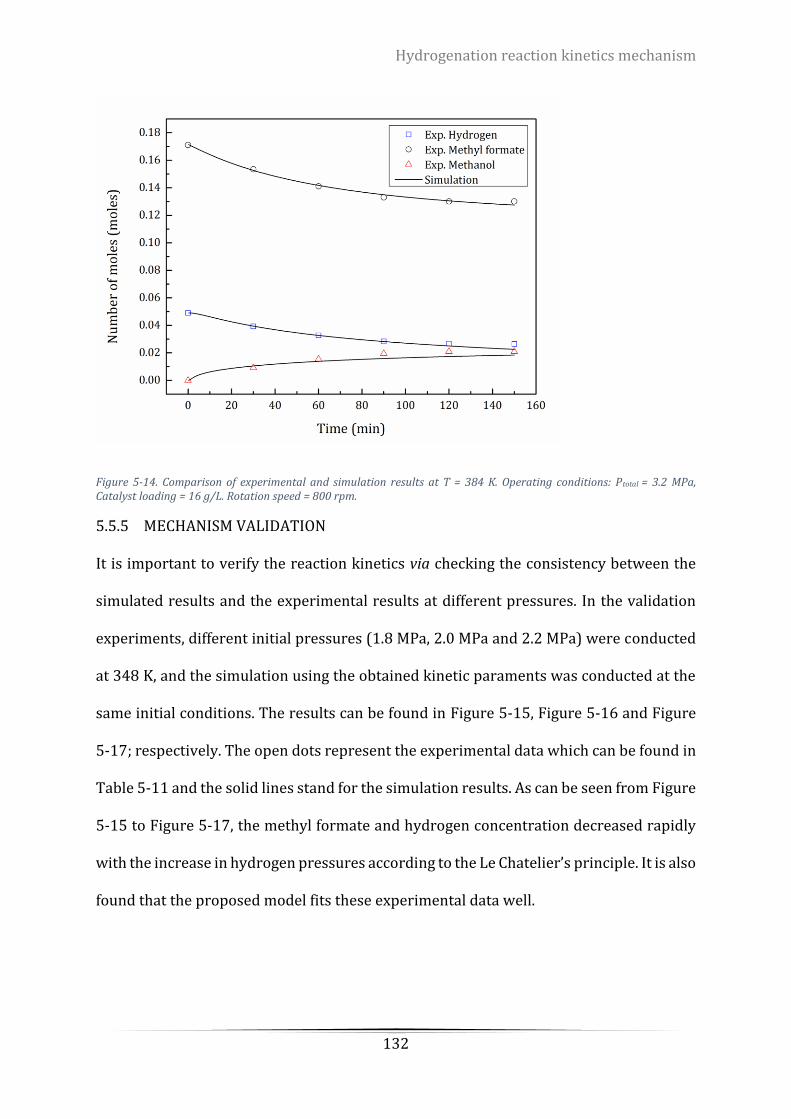
Hydrogenation reaction kinetics mechanism
132
Figure 5-14. Comparison of experimental and simulation results at T = 384 K. Operating conditions: Ptotal = 3.2 MPa, Catalyst loading = 16 g/L. Rotation speed = 800 rpm.
5.5.5 MECHANISM VALIDATION
It is important to verify the reaction kinetics via checking the consistency between the
simulated results and the experimental results at different pressures. In the validation
experiments, different initial pressures (1.8 MPa, 2.0 MPa and 2.2 MPa) were conducted
at 348 K, and the simulation using the obtained kinetic paraments was conducted at the
same initial conditions. The results can be found in Figure 5-15, Figure 5-16 and Figure
5-17; respectively. The open dots represent the experimental data which can be found in
Table 5-11 and the solid lines stand for the simulation results. As can be seen from Figure
5-15 to Figure 5-17, the methyl formate and hydrogen concentration decreased rapidly
with the increase in hydrogen pressures according to the Le Chatelier’s principle. It is also
found that the proposed model fits these experimental data well.
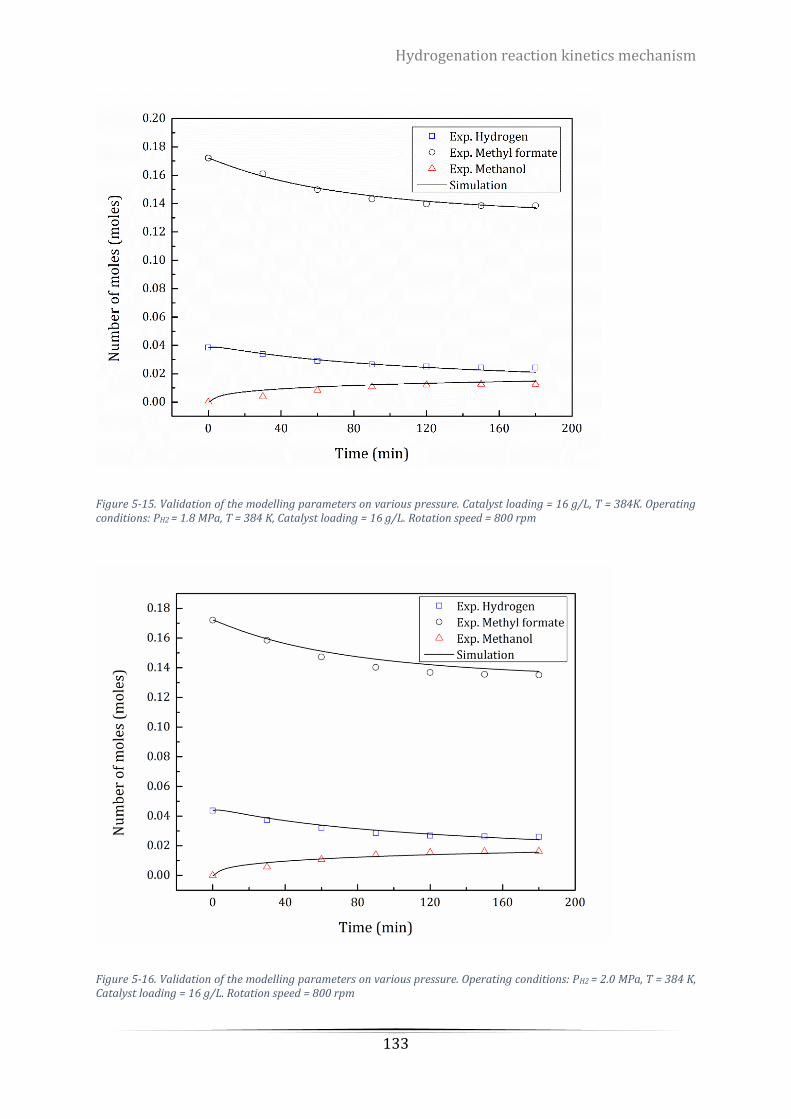
Hydrogenation reaction kinetics mechanism
133
Figure 5-15. Validation of the modelling parameters on various pressure. Catalyst loading = 16 g/L, T = 384K. Operating conditions: PH2 = 1.8 MPa, T = 384 K, Catalyst loading = 16 g/L. Rotation speed = 800 rpm
Figure 5-16. Validation of the modelling parameters on various pressure. Operating conditions: PH2 = 2.0 MPa, T = 384 K, Catalyst loading = 16 g/L. Rotation speed = 800 rpm
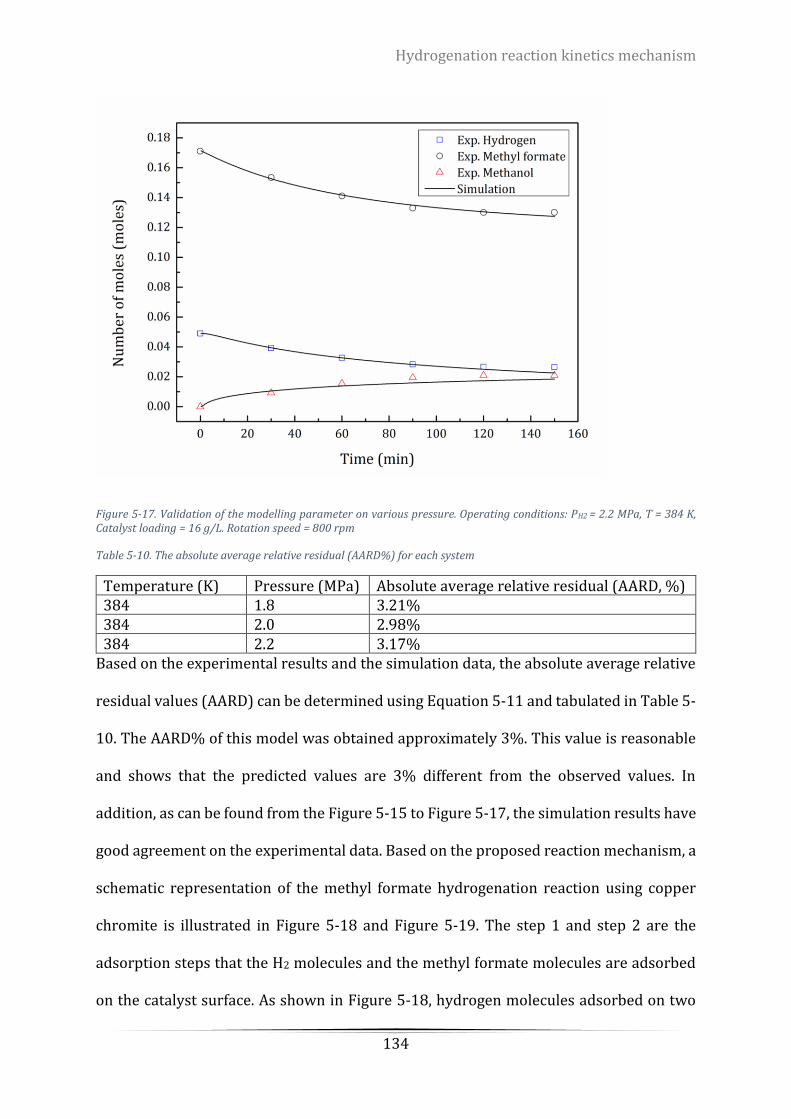
Hydrogenation reaction kinetics mechanism
134
Figure 5-17. Validation of the modelling parameter on various pressure. Operating conditions: PH2 = 2.2 MPa, T = 384 K, Catalyst loading = 16 g/L. Rotation speed = 800 rpm
Table 5-10. The absolute average relative residual (AARD%) for each system
Temperature (K) Pressure (MPa) Absolute average relative residual (AARD, %) 384 1.8 3.21% 384 2.0 2.98% 384 2.2 3.17%
Based on the experimental results and the simulation data, the absolute average relative
residual values (AARD) can be determined using Equation 5-11 and tabulated in Table 5-
10. The AARD% of this model was obtained approximately 3%. This value is reasonable
and shows that the predicted values are 3% different from the observed values. In
addition, as can be found from the Figure 5-15 to Figure 5-17, the simulation results have
good agreement on the experimental data. Based on the proposed reaction mechanism, a
schematic representation of the methyl formate hydrogenation reaction using copper
chromite is illustrated in Figure 5-18 and Figure 5-19. The step 1 and step 2 are the
adsorption steps that the H2 molecules and the methyl formate molecules are adsorbed
on the catalyst surface. As shown in Figure 5-18, hydrogen molecules adsorbed on two
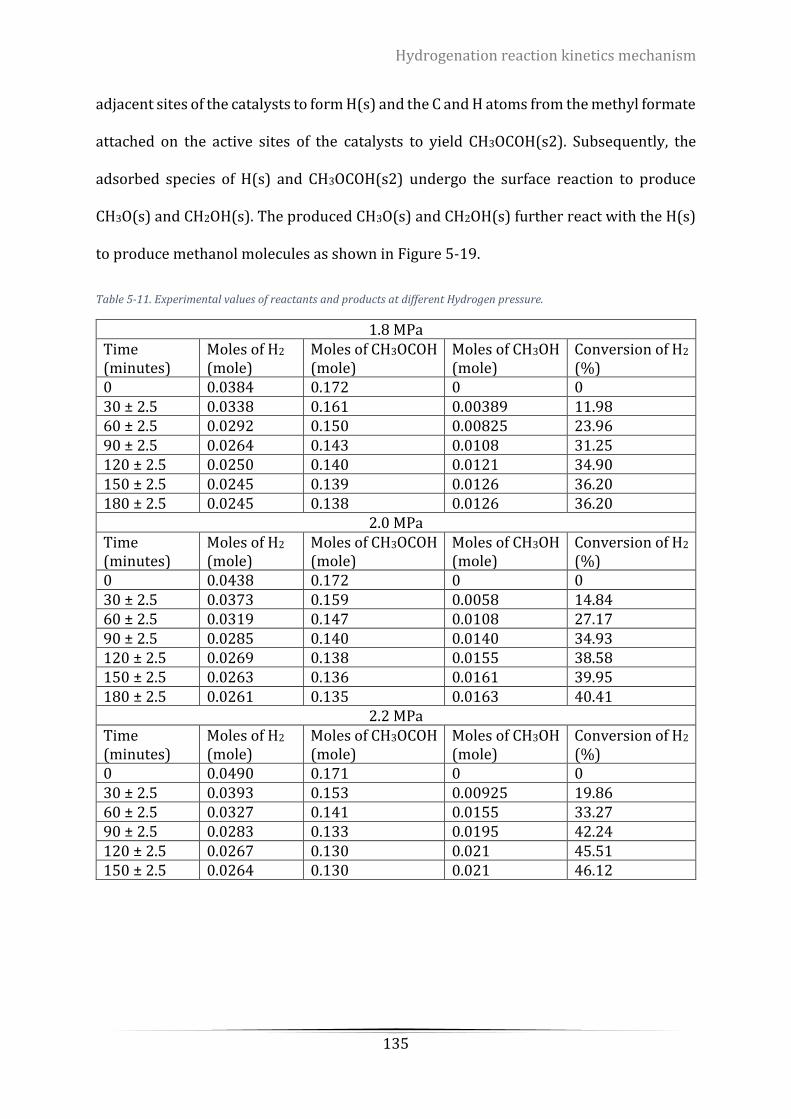
Hydrogenation reaction kinetics mechanism
135
adjacent sites of the catalysts to form H(s) and the C and H atoms from the methyl formate
attached on the active sites of the catalysts to yield CH3OCOH(s2). Subsequently, the
adsorbed species of H(s) and CH3OCOH(s2) undergo the surface reaction to produce
CH3O(s) and CH2OH(s). The produced CH3O(s) and CH2OH(s) further react with the H(s)
to produce methanol molecules as shown in Figure 5-19.
Table 5-11. Experimental values of reactants and products at different Hydrogen pressure.
1.8 MPa Time (minutes)
Moles of H2 (mole)
Moles of CH3OCOH (mole)
Moles of CH3OH (mole)
Conversion of H2
(%) 0 0.0384 0.172 0 0 30 ± 2.5 0.0338 0.161 0.00389 11.98 60 ± 2.5 0.0292 0.150 0.00825 23.96 90 ± 2.5 0.0264 0.143 0.0108 31.25 120 ± 2.5 0.0250 0.140 0.0121 34.90 150 ± 2.5 0.0245 0.139 0.0126 36.20 180 ± 2.5 0.0245 0.138 0.0126 36.20
2.0 MPa Time (minutes)
Moles of H2 (mole)
Moles of CH3OCOH (mole)
Moles of CH3OH (mole)
Conversion of H2
(%) 0 0.0438 0.172 0 0 30 ± 2.5 0.0373 0.159 0.0058 14.84 60 ± 2.5 0.0319 0.147 0.0108 27.17 90 ± 2.5 0.0285 0.140 0.0140 34.93 120 ± 2.5 0.0269 0.138 0.0155 38.58 150 ± 2.5 0.0263 0.136 0.0161 39.95 180 ± 2.5 0.0261 0.135 0.0163 40.41
2.2 MPa Time (minutes)
Moles of H2 (mole)
Moles of CH3OCOH (mole)
Moles of CH3OH (mole)
Conversion of H2
(%) 0 0.0490 0.171 0 0 30 ± 2.5 0.0393 0.153 0.00925 19.86 60 ± 2.5 0.0327 0.141 0.0155 33.27 90 ± 2.5 0.0283 0.133 0.0195 42.24 120 ± 2.5 0.0267 0.130 0.021 45.51 150 ± 2.5 0.0264 0.130 0.021 46.12
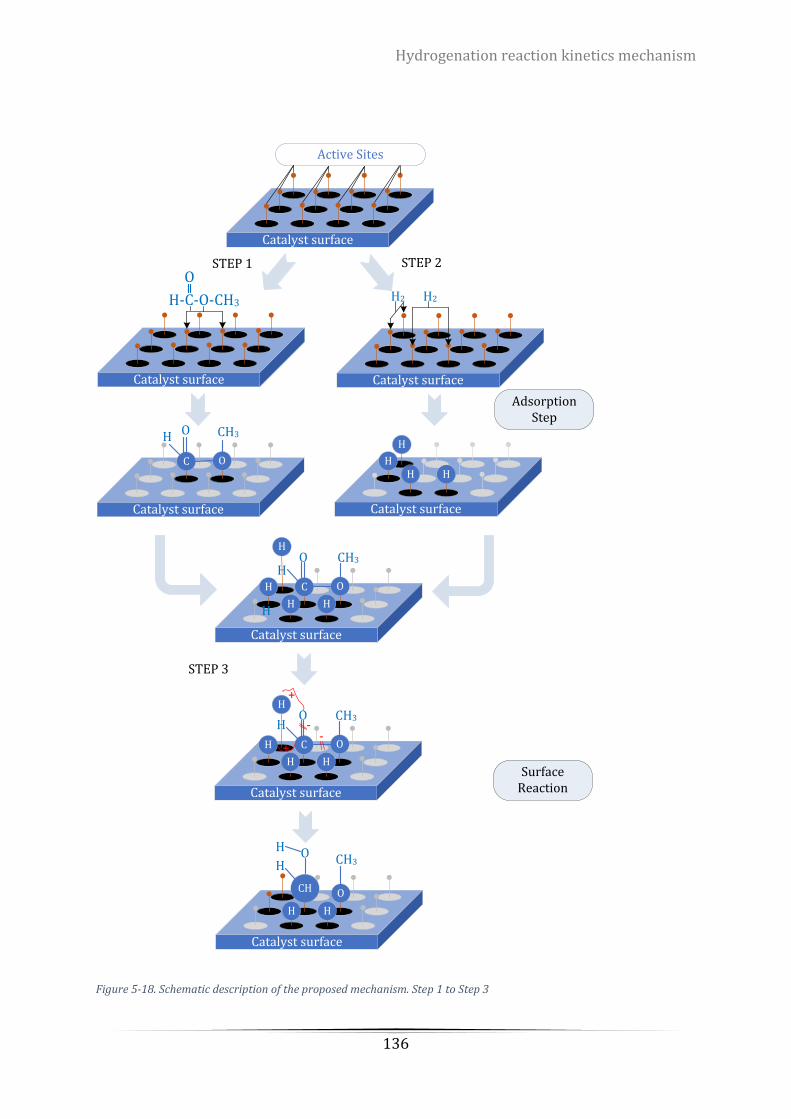
Hydrogenation reaction kinetics mechanism
136
Figure 5-18. Schematic description of the proposed mechanism. Step 1 to Step 3
Catalyst surface
Active Sites
Catalyst surface
H-C-O-CH3
O
Catalyst surface
C O
OH
H2
Catalyst surface
H
H
STEP 1 STEP 2
H H
CH3
Catalyst surface
H2
Catalyst surface
C O
O
H
H
H
H H
CH3
STEP 3
H
Catalyst surface
C O
OH
H
H H
H
+
+-
-CH3
Adsorption Step
Surface Reaction
Catalyst surface
CH O
O
H H
H
H CH3
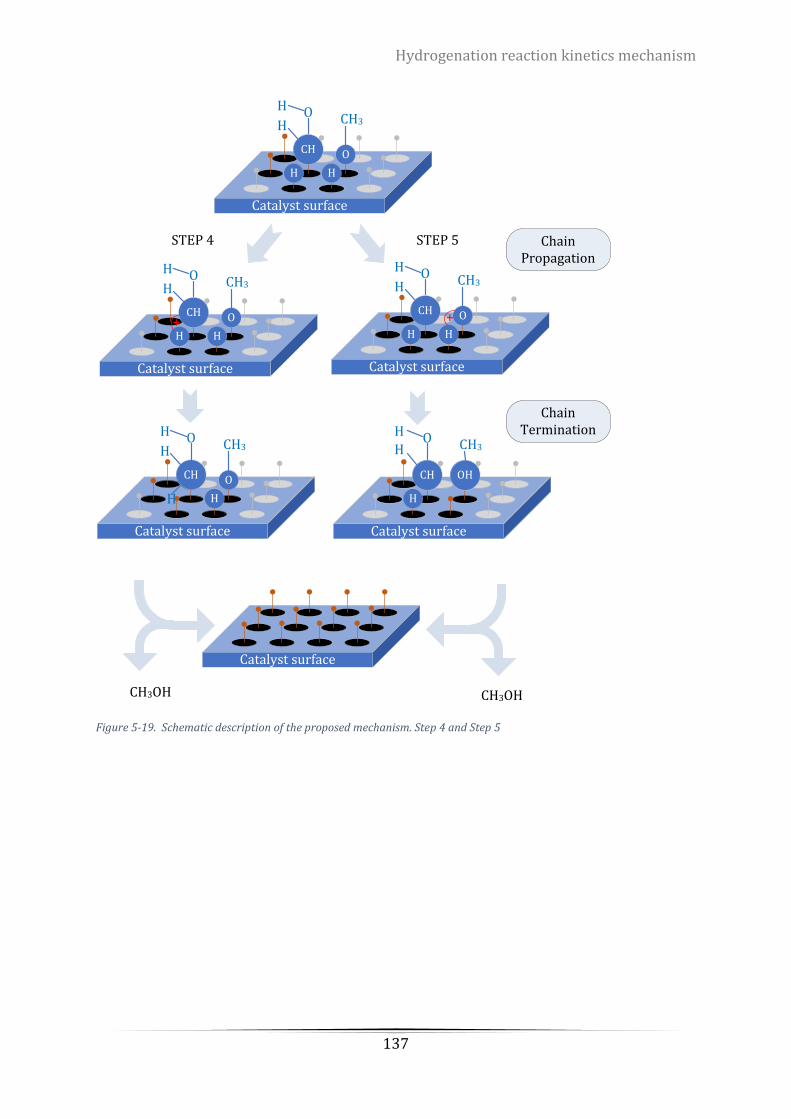
Hydrogenation reaction kinetics mechanism
137
Figure 5-19. Schematic description of the proposed mechanism. Step 4 and Step 5
STEP 4 STEP 5
Catalyst surface
CH O
O
H H
H
H CH3
+
Catalyst surface
CH O
O
H H
H
H CH3
+
CH3OH
H
H
CH3OH
Catalyst surface
Catalyst surface
CH O
OH
H CH3
H H
Catalyst surface
CH OH
O
H
CH3
Chain Propagation
Chain Termination
Catalyst surface
CH O
O
H H
H
H CH3
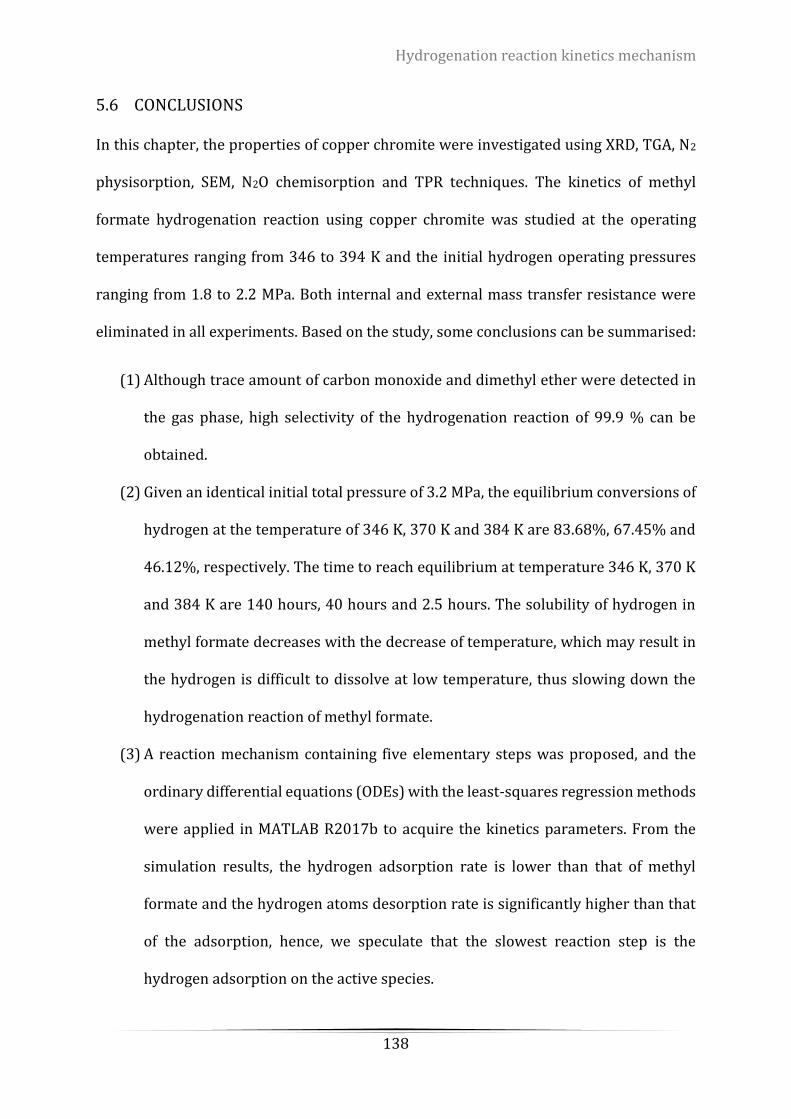
Hydrogenation reaction kinetics mechanism
138
5.6 CONCLUSIONS
In this chapter, the properties of copper chromite were investigated using XRD, TGA, N2
physisorption, SEM, N2O chemisorption and TPR techniques. The kinetics of methyl
formate hydrogenation reaction using copper chromite was studied at the operating
temperatures ranging from 346 to 394 K and the initial hydrogen operating pressures
ranging from 1.8 to 2.2 MPa. Both internal and external mass transfer resistance were
eliminated in all experiments. Based on the study, some conclusions can be summarised:
(1) Although trace amount of carbon monoxide and dimethyl ether were detected in
the gas phase, high selectivity of the hydrogenation reaction of 99.9 % can be
obtained.
(2) Given an identical initial total pressure of 3.2 MPa, the equilibrium conversions of
hydrogen at the temperature of 346 K, 370 K and 384 K are 83.68%, 67.45% and
46.12%, respectively. The time to reach equilibrium at temperature 346 K, 370 K
and 384 K are 140 hours, 40 hours and 2.5 hours. The solubility of hydrogen in
methyl formate decreases with the decrease of temperature, which may result in
the hydrogen is difficult to dissolve at low temperature, thus slowing down the
hydrogenation reaction of methyl formate.
(3) A reaction mechanism containing five elementary steps was proposed, and the
ordinary differential equations (ODEs) with the least-squares regression methods
were applied in MATLAB R2017b to acquire the kinetics parameters. From the
simulation results, the hydrogen adsorption rate is lower than that of methyl
formate and the hydrogen atoms desorption rate is significantly higher than that
of the adsorption, hence, we speculate that the slowest reaction step is the
hydrogen adsorption on the active species.
Hydrogenation reaction kinetics mechanism
139
(4) Based on the kinetics parameters that were estimated from the mechanism at
different temperatures, the activation energy of the reaction was determined of
50.15 kJ/mol in the temperature range of 346 to 384 K.
(5) Furthermore, the proposed mechanism model was validated by using the
obtained parameters to compare with the experimental data at different
pressures. The simulation results and the experimental results were compared
using the average absolute relative residual (AARD %). An average of 3 % AARD
was obtained show that the simulation results have good agreement on the
experimental data, which proves that the proposed mechanism is appropriate for
the current hydrogenation reaction system using copper chromite as the catalyst.
Based on the proposed mechanism, a schematic description was provided.
Development of novel hydrogenation catalysts
140
CHAPTER 6 DEVELOPMENT OF NOVEL HYDROGENATION
CATALYSTS
6.1 INTRODUCTION
As discussed in chapter 2 and chapter 5, the hydrogenation reaction dominates the two-
step methanol synthesis process at moderate temperatures and pressures because the
reaction rate of the hydrogenation reaction is much slower than that of carbonylation
reaction at the same temperature. Therefore, investigating and developing potentially
cost-effective and efficient catalysts is crucial.
In this chapter, a design strategy of a novel catalytic system for the hydrogenation
reaction was proposed and investigated. A number of published works concluded
metallic copper provides the main active catalytic sites for methanol production via the
hydrogenation of esters [164], and thus metallic copper was incorporated in the catalytic
system. Zinc oxide (ZnO) and zirconium oxide (ZrO2) have a role of dispersing agents, and
act as addictive promoters in the catalyst system [32], [165]–[167]. Hydrotalcite-like
compound (HTC) was also selected because it acts as a carrier and a precursor to increase
the surface area of the catalytic system, which can further improve the dispersion of
active sites [9], [52], [165], [168]. Therefore, a novel catalytic system consisting of Cu,
ZnO, ZrO2 and HTC was proposed.
A simple co-precipitation method was selected to prepare this novel catalytic system, and
the characterisations and evaluation of these catalysts are discussed in this chapter. A
number of catalyst characterisation methods, including X-ray diffraction (XRD), scanning
electron microscopy (SEM), energy dispersive X-ray spectroscopy (EDX), N2
physisorption, temperature-programmed reduction (TPR), CO2-TPD, thermal
Development of novel hydrogenation catalysts
141
gravimetric analysis (TGA), X-ray photoelectron spectroscopy (XPS) and Auger electron
spectroscopy (AES), were used to investigate and compare the properties of the catalysts.
A short conclusion based on the characterisation results was made in the end.
In addition to the compound of Cu/ZnO/ZrO2/HTC catalysts, Cu/HTC, Cu/ZnO/HTC and
Cu/ZrO catalysts were designed to identify the actual function of each component in the
catalyst system for the methyl formate hydrogenation reaction. The optimised
composition of the catalytic system was studied via the hydrogenation reaction of methyl
formate. Results and some dramatic improvements were observed compared with
commercial catalysts and will be discussed in detail in Chapter 7.
6.2 DESIGN OF A NOVEL CATALYST
In Chapter 5, the kinetics mechanism of methyl formate hydrogenation reaction using a
commercial catalyst, copper chromite, was investigated. The results showed that the
hydrogen adsorption and dissociation on the catalytic sites is difficult and rate limiting.
In addition, the hydrogenation reaction rate at 370 K was very slow compared with the
carbonylation reaction at the same temperature. Thus, the slow reaction rate poses
difficulties in conducting both carbonylation and hydrogenation at the same operating
conditions. Therefore, developing new catalysts that can enhance the reaction rate at
moderate temperatures becomes important.
Based on the published works and our studies, the active catalytic species for ester
hydrogenation is copper, including Cu present in forms of Cu0, Cu+, or their combination
[95]. Hence, copper is the critical species in the novel catalytic system.
In addition to copper species, a well-dispersed copper phase may also be significant in
the catalysts to promote the reaction effectively. Therefore, some compounds which can

Development of novel hydrogenation catalysts
142
improve the copper dispersion may be necessary. ZnO is one of the most common metal
oxides that is added with the copper-based catalysts to yield the Cu/ZnO system and
increase Cu dispersion [169], [170]. It has been reported that the active Cu+ sites
dissolved in ZnO may improve the catalytic performance and thermal stability [165],
[166]. Moreover, some researchers suggested that the presence of ZnO can help increase
the copper dispersion on the surface of the catalysts as ZnO acts as a ‘physical spacer’
between copper nanoparticles [171], [172]. Therefore, in our present work, ZnO was
chosen as the copper dispersion agent in the catalyst system.
In addition, improving hydrogen adsorption on the catalysts surface is crucial in
preparing the catalytic system. As discussed in Chapter 5, the hydrogen adsorption step
on the catalytic surface is difficult, it is important to find some compounds that can
improve this adsorption step. It has been reported that ZrO2 is able to adsorb hydrogen,
thus promoting the mass transfer between gas and solid [32], [167]. This phenomenon
can be explained by hydrogen being transported from Cu or/and ZnO to ZrO2 via
hydrogen spillover effect [173], [174]. In addition, the hydrogen adsorption on the
Cu/ZnO/ZrO2 (later on, the name of Cu/Zn/Zr-HTC will be used) catalysts cannot
increase linearly with the increased amount of ZrO2, and thus the amount of ZrO2 should
be optimized when preparing catalysts [166]. Therefore, a proper ratio of ZrO2 was
selected for the novel catalysts system to improve the hydrogen adsorption on the
catalysts.
Moreover, some researchers reported that the activity of catalysts is found to be directly
proportional to the surface area, and the surface area of the catalysts can be increased by
adding some substrates with high surface area [175]. Hydrotalcite with layered brucite
structures is a potential candidate. Hydrotalcite-like compounds (HTC), also known as
Development of novel hydrogenation catalysts
143
double layered hydroxides, consist of two positive-charged brucite-like layers with
anionic compounds in the interlayer. Their general formula is [M(II)1-xM(III)x(OH)2]x+(An-
x/n)MH2O, where M(II) is bivalent metals including Mg, Zn, Co, Cu, Fe, Ni and Mn, M(III) is
trivalent metals, such as Al, Cr, Fe, and V, and A is usually CO32- ion. Due to the fact that it
has large surface area, high metal dispersion and high stability, hydrotalcite-like
compounds and their derivatives have been attracting increasing attention to be
potentially applied in chemical industries [9], [52], [165], [168]. Zhang et al. reported a
gas phase hydrogenation of ethyl acetate to produce ethanol, which was catalysed over
Ni/Al hydrotalcite-like compounds. The results showed that at 250 °C and 10 Mpa, the
selectivity and yield of the reaction were 68.2 % and 61.7 %, respectively [176].
Therefore, hydrotalcite-like compounds (HTC) can be potentially used as one major
component of preparing new catalysts to increase their surface area.
In the present work, copper, zinc, zirconium oxide and HTC were selected in the novel
catalyst system. Since HTC acts as a carrier and ZrO2 acts as a promoter, the amount of
them in the catalysts was constant in all experiments. The ratio of copper and zinc was
manipulated to optimize the catalytic performance.
6.3 CU/ZN/ZR-HTC CATALYST
6.3.1 CATALYST PREPARATION
The Cu/Zn/Zr-HTC catalysts were synthesized by a simple co-precipitation (CP) method.
The carrier material, Mg-Al layer doubled hydroxide (LDH), was pre-activated at 673 K
for 4 hours before use to enhance its surface area. A series of copper nitrates
(Cu(NO3)2·2.5H2O), zinc nitrates (Zn(NO3)2·6H2O) and zirconium nitrates
(ZrO(NO3)2·3.76H2O) with different mass ratios were dissolved in deionized water to
become a nitrate solution (0.075 g/mL). The ratio of copper nitrate/zinc
Development of novel hydrogenation catalysts
144
nitrate/zirconium nitrates in solution was controlled between 4:0:1 and 0:4:1 on a mass
basis. Precipitant, K2CO3 aqueous solution (0.38 g/mL), was prepared by dissolving K2CO3
powder in deionized water.
Typically, 1.5 g activated LDH and 10 mL nitrate solution (0.075 g/mL) were mixed under
stirring for two hours, after which 10 mL K2CO3 solution (0.38 g/mL) was added dropwise.
The obtained slurry was aged for two hours under sequential stirring. Then the pale blue
slurry was filtered and washed with deionized water by four washing steps. The obtained
precipitate was dried at 393 K in an oven overnight to yield a dried sample, followed by
grinding into a fine powder. Next, the dried fine power was calcined in air at 673 K for 4
h prior to reduction, where the colour of the catalysts became dark green. The reduction
was carried out in H2 atmosphere at 623 K for 6 hours, which allowed the copper oxides
to be reduced to metallic Cu0, and the reduced catalysts were in black colour as the size
of reduced copper was in nano-scale. The reduction temperature was determined by the
temperature-programmed reduction measurement.
The detailed information of metal compositions is given in Table 6-1. To facilitate
discussion, the groups of experiments were simply named as Cu0, Cu2, Cu4, Cu6 and Cu8.
To distinguish the catalysts at different stages, letters ‘d’ was used to represent the
catalysts after drying, ‘c’ to represent the catalysts after calcination and ‘r’ to represent
the catalysts after reduction.
Table 6-1. Metal composition of prepared catalysts
Entry Name Precursor Cu2+/Zn2+/Zr2+ ratio Cu0 HTC 0:8:2 Cu2 HTC 2:6:2 Cu4 HTC 4:4:2 Cu6 HTC 6:2:2 Cu8 HTC 8:0:2
Development of novel hydrogenation catalysts
145
6.3.2 CATALYST REDUCIBILITY
To study the reducibility or the reduction behaviour of the CuZnZr-HTC catalysts, TPR
experiments were carried out. Figure 6-1 shows the reduction profiles of all the samples
exhibiting one broad reduction peaks accompanied by shoulders from 150 to 350 °C. The
TPR profiles are deconvoluted into two Gaussian peaks. The peaks and their
corresponding contributions that derived from the deconvolution are summarised in
Table 6-2. The consumptions of H2 calculated on a mass basis for each catalyst were also
summarised in Table 6-2. It can be observed that the hydrogen consumption increases
with the increase of copper contents. This is primarily because that the CuO in the catalyst
system is reduced to active catalytic species of Cu+ and Cu0, and the amount of the active
species is proportional to hydrogen consumption.
The peak α and β may be assigned to the reduction in different aggregation states
(dispersed or bulk phase) of Cu2O, CuO and/or their combinations, representing Cu
species with different reduction capacity [177]. In the literature, the low temperature
peak (peak α) is attributed to the reduction in dispersed CuO, whereas the high
temperature peak (peak β) denotes the reduction in CuO in larger sizes [166]. Hence, it
suggests that more than one type of copper is deposited on the surface of hydrotalcite-
like compounds. As seen from Table 6-2, except cCu6, all the catalysts are dominated by
peak β at high temperatures, suggesting that great amounts of copper oxides with a large
size are present.
The TPR peaks (peak α and peak β) on the neat CuO sample appear at 231 °C and 295 °C,
which are higher than the reduction temperatures of the CuZnZr-HTC catalysts. This
indicates that there is interaction between the copper and the support (ZnO, ZrO2 and
HTC) to some extent, and such interaction leads to an easier reduction of the catalysts
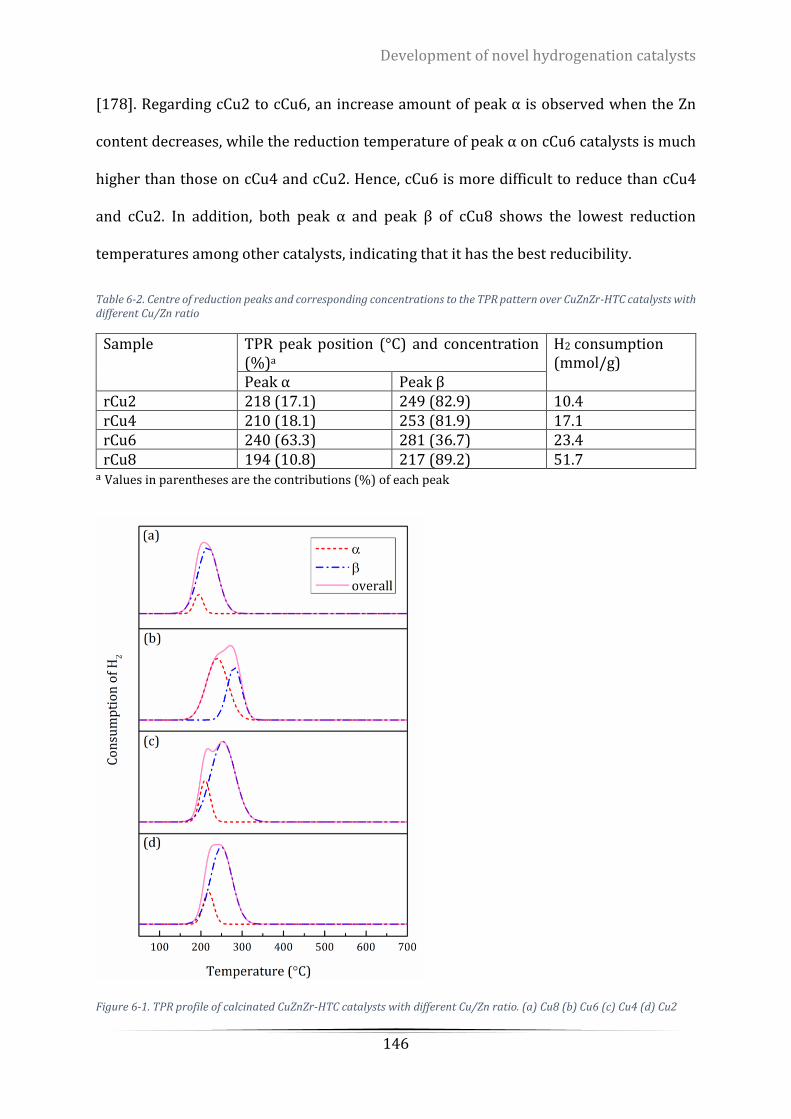
Development of novel hydrogenation catalysts
146
[178]. Regarding cCu2 to cCu6, an increase amount of peak α is observed when the Zn
content decreases, while the reduction temperature of peak α on cCu6 catalysts is much
higher than those on cCu4 and cCu2. Hence, cCu6 is more difficult to reduce than cCu4
and cCu2. In addition, both peak α and peak β of cCu8 shows the lowest reduction
temperatures among other catalysts, indicating that it has the best reducibility.
Table 6-2. Centre of reduction peaks and corresponding concentrations to the TPR pattern over CuZnZr-HTC catalysts with different Cu/Zn ratio
Sample TPR peak position (°C) and concentration (%)a
H2 consumption (mmol/g)
Peak α Peak β rCu2 218 (17.1) 249 (82.9) 10.4 rCu4 210 (18.1) 253 (81.9) 17.1 rCu6 240 (63.3) 281 (36.7) 23.4 rCu8 194 (10.8) 217 (89.2) 51.7
a Values in parentheses are the contributions (%) of each peak
Figure 6-1. TPR profile of calcinated CuZnZr-HTC catalysts with different Cu/Zn ratio. (a) Cu8 (b) Cu6 (c) Cu4 (d) Cu2
Development of novel hydrogenation catalysts
147
Therefore, from the TPR profiles of the CuZnZr-HTC catalysts, both dispersed and bulk
phase CuO are present in the catalysts. The Cu8 shows the best reducibility because it has
the lowest reduction temperature among these CuZnZr-HTC catalysts. The reduction
temperature above 350 °C is required to ensure all the copper contents in the catalysts
are completed reduced.
6.3.3 CATALYST CRYSTALLINE STRUCTURE
The X-ray diffraction (XRD) measurement is used to determine the composition and
structure of the catalysts at different stages. The XRD patterns of dried CuZnZr-HTC
catalysts and the dried HTC are indicated in Figure 6-2. As can be seen, the XRD patterns
of dried HTC, or named as activated HTC, are characterised by four typically prominent
diffraction peaks (2θ), which are at 11°, 22°, 33°, 62.4° (JCPDS card #: 50-1684). Such
typical 2θ peaks of the activated HTC also remain at the CuZnZr-HTC catalysts with low
copper contents but disappear with high copper contents. This is probably due to a
replacement of Al3+ (ionic radius 0.053 nm) or Mg2+ (ionic radius 0.065 nm) by Cu2+ (ionic
radius 0.073 nm) and Zn2+ (ionic radius 0.139 nm) and the co-formation of amorphous
precipitates (such as hydroxides and hydroxyl carbonates), thus introducing distortions
on the HTC layers [179], [180].
Regarding the dried samples with high zinc contents (including catalysts Cu0 and Cu1), a
diffraction peak at 2θ = 28° can be found, which is ascribed to the crystalline Zn(OH)2
phase (JCPDS card # 38-0385). However, such a peak no longer exists when copper
contents are higher than zinc contents, revealing that either Zn(OH)2 is not generated, or
Zn(OH)2 is generated but in an amorphous form which cannot be detected from XRD.
Therefore, a large content of copper may hinder the formation of crystalline Zn(OH)2. In
addition, the crystallized Cu2(OH)3NO3 (JCPDS card # 75-1779) and Cu2CO3(OH)2 phase
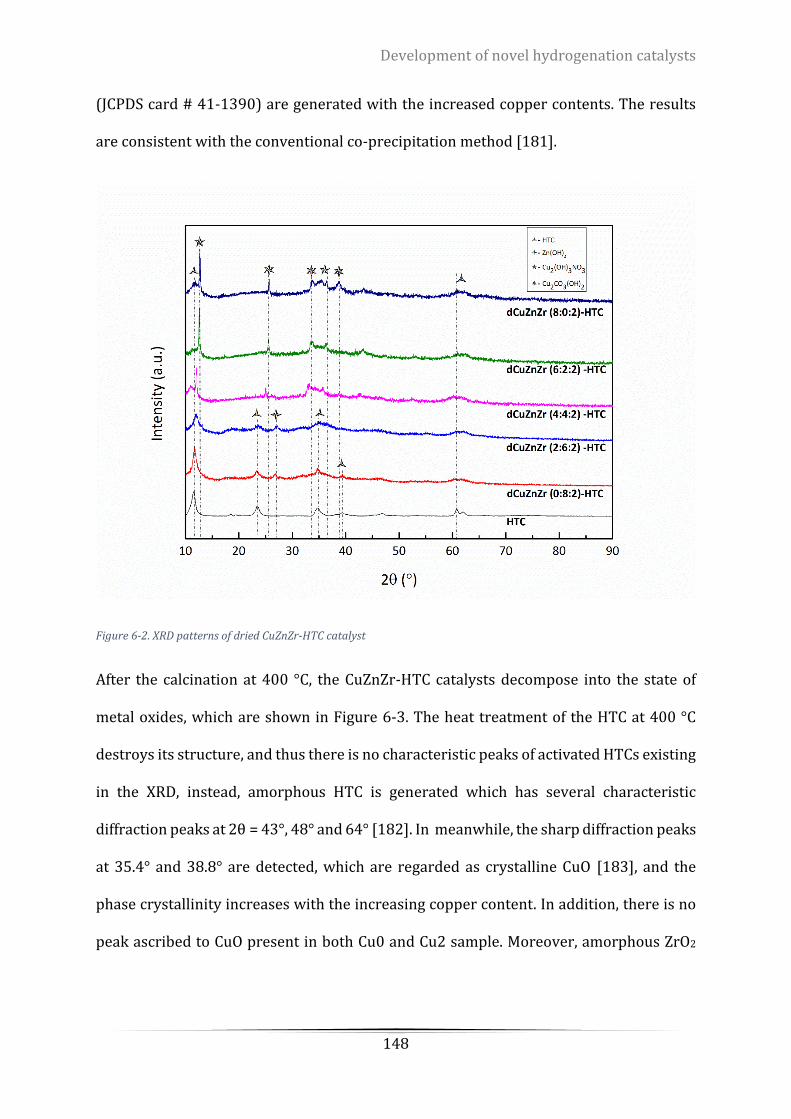
Development of novel hydrogenation catalysts
148
(JCPDS card # 41-1390) are generated with the increased copper contents. The results
are consistent with the conventional co-precipitation method [181].
Figure 6-2. XRD patterns of dried CuZnZr-HTC catalyst
After the calcination at 400 °C, the CuZnZr-HTC catalysts decompose into the state of
metal oxides, which are shown in Figure 6-3. The heat treatment of the HTC at 400 °C
destroys its structure, and thus there is no characteristic peaks of activated HTCs existing
in the XRD, instead, amorphous HTC is generated which has several characteristic
diffraction peaks at 2θ = 43°, 48° and 64° [182]. In meanwhile, the sharp diffraction peaks
at 35.4° and 38.8° are detected, which are regarded as crystalline CuO [183], and the
phase crystallinity increases with the increasing copper content. In addition, there is no
peak ascribed to CuO present in both Cu0 and Cu2 sample. Moreover, amorphous ZrO2
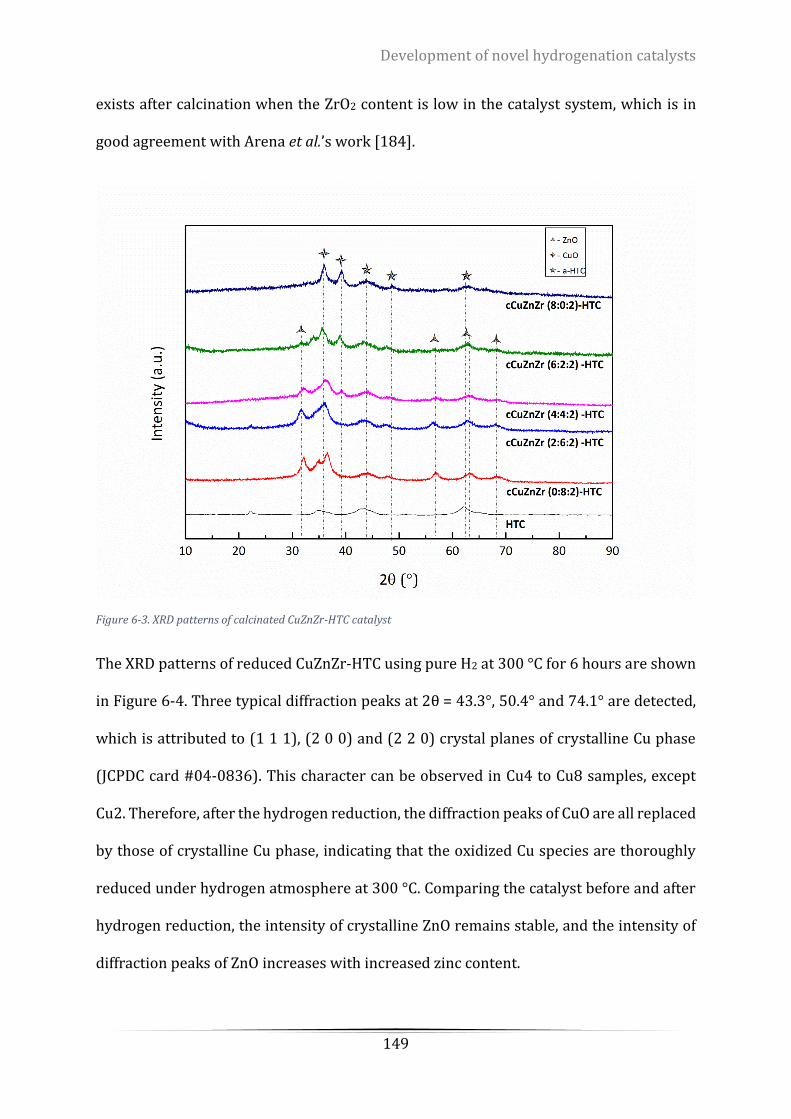
Development of novel hydrogenation catalysts
149
exists after calcination when the ZrO2 content is low in the catalyst system, which is in
good agreement with Arena et al.’s work [184].
Figure 6-3. XRD patterns of calcinated CuZnZr-HTC catalyst
The XRD patterns of reduced CuZnZr-HTC using pure H2 at 300 °C for 6 hours are shown
in Figure 6-4. Three typical diffraction peaks at 2θ = 43.3°, 50.4° and 74.1° are detected,
which is attributed to (1 1 1), (2 0 0) and (2 2 0) crystal planes of crystalline Cu phase
(JCPDC card #04-0836). This character can be observed in Cu4 to Cu8 samples, except
Cu2. Therefore, after the hydrogen reduction, the diffraction peaks of CuO are all replaced
by those of crystalline Cu phase, indicating that the oxidized Cu species are thoroughly
reduced under hydrogen atmosphere at 300 °C. Comparing the catalyst before and after
hydrogen reduction, the intensity of crystalline ZnO remains stable, and the intensity of
diffraction peaks of ZnO increases with increased zinc content.

Development of novel hydrogenation catalysts
150
Figure 6-4. XRD patterns of reduced CuZnZr-HTC catalyst
Hence, the XRD results show that metallic copper is obtained from all the reduced
CuZnZr-HTC catalysts except rCu2. The carrier, HTC is present as its amorphous phase
after reduction. Crystalline ZnO is produced and can be detected from the XRD
measurement and ZrO2 is believed to be in its amorphous phase.
6.3.4 THERMAL STABILITY OF THE CATALYST
The thermal stability of the catalysts is determined by the thermal gravimetric analysis
(TGA). The TGA-FTIR analysis was conducted to demonstrate the thermal behaviour and
characterize the dried CuZnZr-HTC catalysts. The TGA diagrams and the DTG patterns are
shown in Figure 6-5 and the results are listed in Table 6-3. Figure 6-5 shows the tendency
of weight loss patterns of each dried CuZnZr-HTC catalyst. As the major components in
each sample are same, the characteristic weight loss at different specific temperatures is
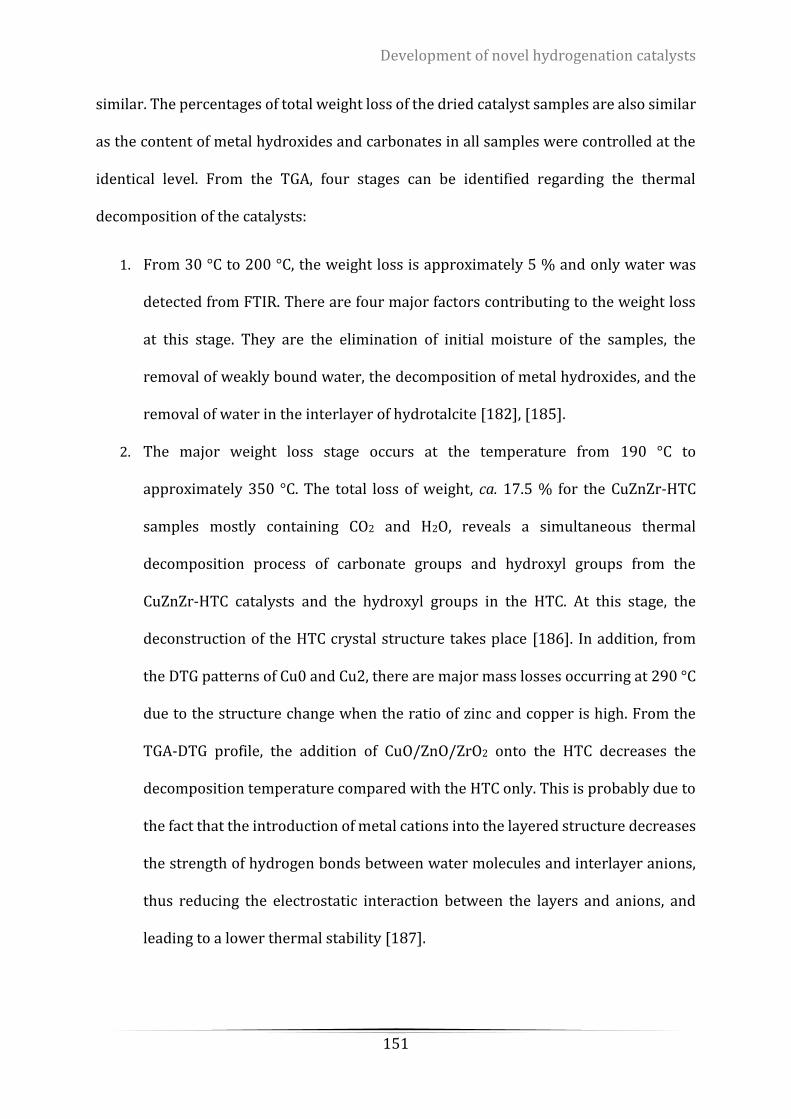
Development of novel hydrogenation catalysts
151
similar. The percentages of total weight loss of the dried catalyst samples are also similar
as the content of metal hydroxides and carbonates in all samples were controlled at the
identical level. From the TGA, four stages can be identified regarding the thermal
decomposition of the catalysts:
1. From 30 °C to 200 °C, the weight loss is approximately 5 % and only water was
detected from FTIR. There are four major factors contributing to the weight loss
at this stage. They are the elimination of initial moisture of the samples, the
removal of weakly bound water, the decomposition of metal hydroxides, and the
removal of water in the interlayer of hydrotalcite [182], [185].
2. The major weight loss stage occurs at the temperature from 190 °C to
approximately 350 °C. The total loss of weight, ca. 17.5 % for the CuZnZr-HTC
samples mostly containing CO2 and H2O, reveals a simultaneous thermal
decomposition process of carbonate groups and hydroxyl groups from the
CuZnZr-HTC catalysts and the hydroxyl groups in the HTC. At this stage, the
deconstruction of the HTC crystal structure takes place [186]. In addition, from
the DTG patterns of Cu0 and Cu2, there are major mass losses occurring at 290 °C
due to the structure change when the ratio of zinc and copper is high. From the
TGA-DTG profile, the addition of CuO/ZnO/ZrO2 onto the HTC decreases the
decomposition temperature compared with the HTC only. This is probably due to
the fact that the introduction of metal cations into the layered structure decreases
the strength of hydrogen bonds between water molecules and interlayer anions,
thus reducing the electrostatic interaction between the layers and anions, and
leading to a lower thermal stability [187].
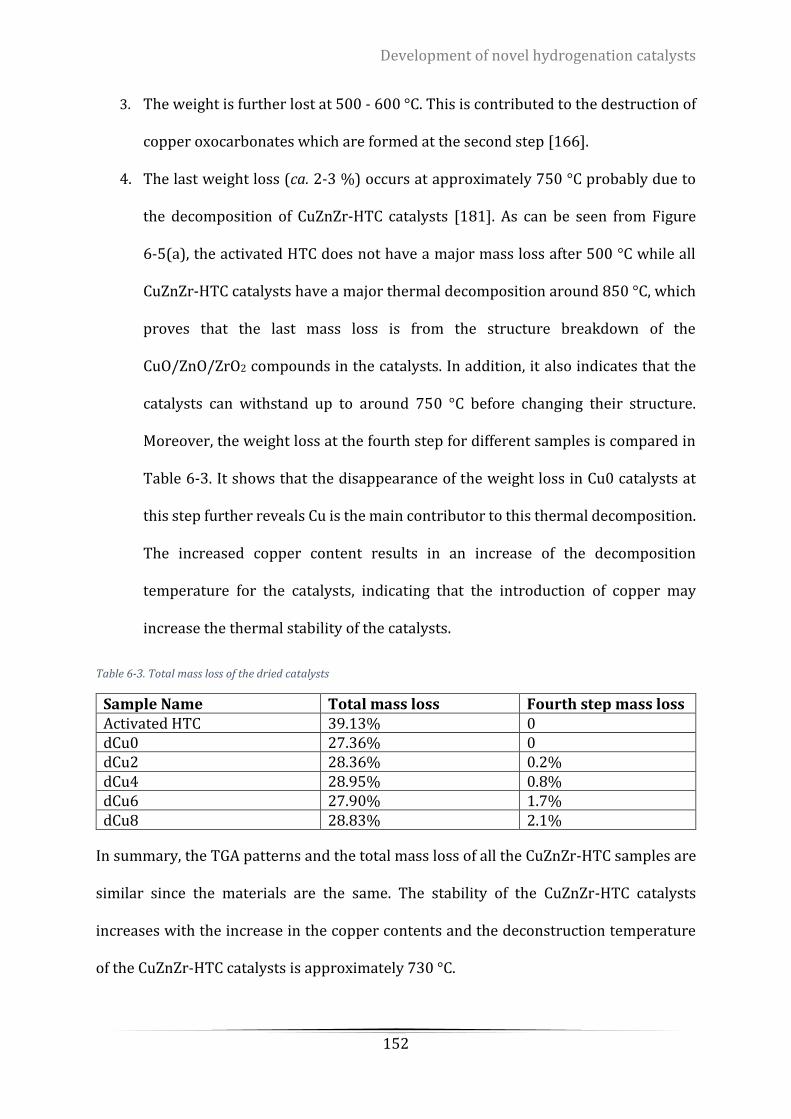
Development of novel hydrogenation catalysts
152
3. The weight is further lost at 500 - 600 °C. This is contributed to the destruction of
copper oxocarbonates which are formed at the second step [166].
4. The last weight loss (ca. 2-3 %) occurs at approximately 750 °C probably due to
the decomposition of CuZnZr-HTC catalysts [181]. As can be seen from Figure
6-5(a), the activated HTC does not have a major mass loss after 500 °C while all
CuZnZr-HTC catalysts have a major thermal decomposition around 850 °C, which
proves that the last mass loss is from the structure breakdown of the
CuO/ZnO/ZrO2 compounds in the catalysts. In addition, it also indicates that the
catalysts can withstand up to around 750 °C before changing their structure.
Moreover, the weight loss at the fourth step for different samples is compared in
Table 6-3. It shows that the disappearance of the weight loss in Cu0 catalysts at
this step further reveals Cu is the main contributor to this thermal decomposition.
The increased copper content results in an increase of the decomposition
temperature for the catalysts, indicating that the introduction of copper may
increase the thermal stability of the catalysts.
Table 6-3. Total mass loss of the dried catalysts
Sample Name Total mass loss Fourth step mass loss Activated HTC 39.13% 0 dCu0 27.36% 0 dCu2 28.36% 0.2% dCu4 28.95% 0.8% dCu6 27.90% 1.7% dCu8 28.83% 2.1%
In summary, the TGA patterns and the total mass loss of all the CuZnZr-HTC samples are
similar since the materials are the same. The stability of the CuZnZr-HTC catalysts
increases with the increase in the copper contents and the deconstruction temperature
of the CuZnZr-HTC catalysts is approximately 730 °C.
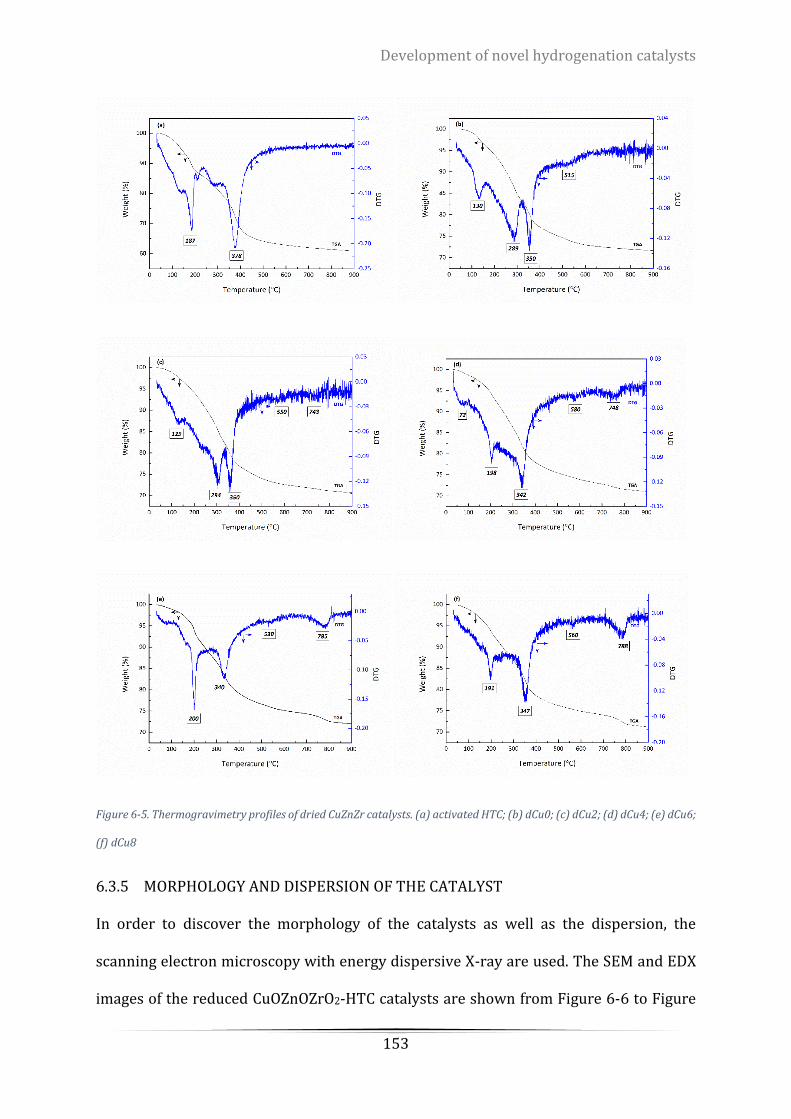
Development of novel hydrogenation catalysts
153
Figure 6-5. Thermogravimetry profiles of dried CuZnZr catalysts. (a) activated HTC; (b) dCu0; (c) dCu2; (d) dCu4; (e) dCu6;
(f) dCu8
6.3.5 MORPHOLOGY AND DISPERSION OF THE CATALYST
In order to discover the morphology of the catalysts as well as the dispersion, the
scanning electron microscopy with energy dispersive X-ray are used. The SEM and EDX
images of the reduced CuOZnOZrO2-HTC catalysts are shown from Figure 6-6 to Figure
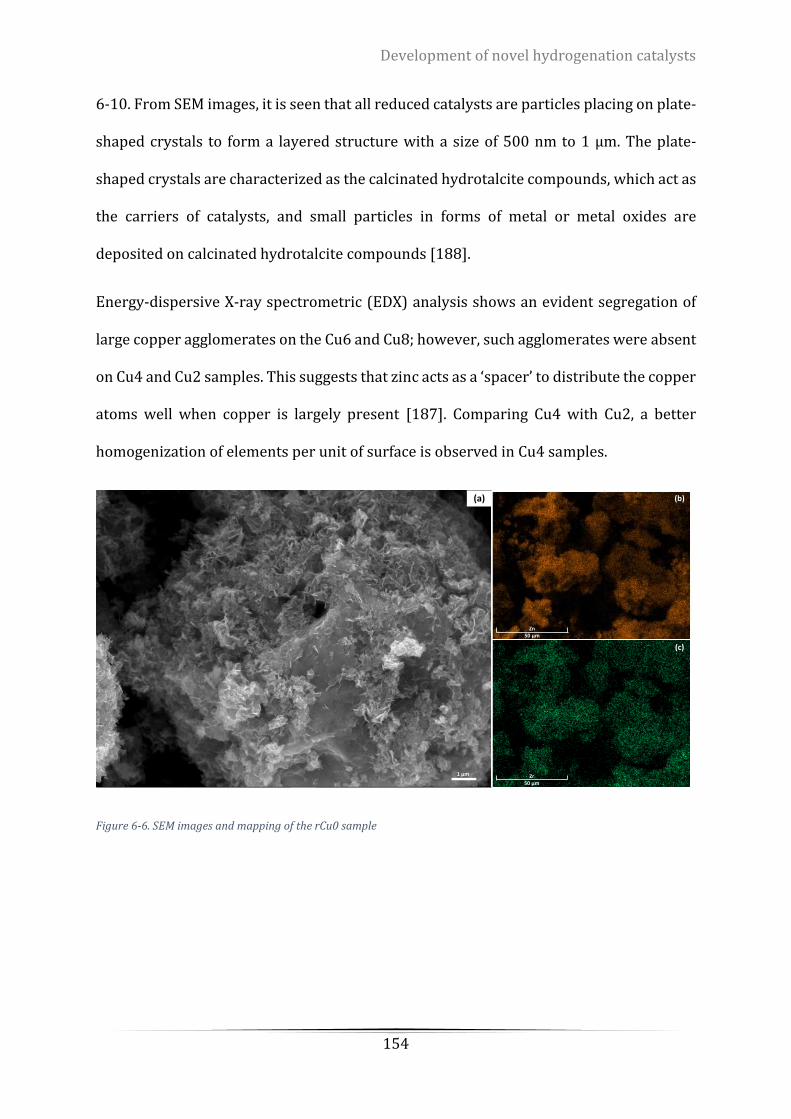
Development of novel hydrogenation catalysts
154
6-10. From SEM images, it is seen that all reduced catalysts are particles placing on plate-
shaped crystals to form a layered structure with a size of 500 nm to 1 µm. The plate-
shaped crystals are characterized as the calcinated hydrotalcite compounds, which act as
the carriers of catalysts, and small particles in forms of metal or metal oxides are
deposited on calcinated hydrotalcite compounds [188].
Energy-dispersive X-ray spectrometric (EDX) analysis shows an evident segregation of
large copper agglomerates on the Cu6 and Cu8; however, such agglomerates were absent
on Cu4 and Cu2 samples. This suggests that zinc acts as a ‘spacer’ to distribute the copper
atoms well when copper is largely present [187]. Comparing Cu4 with Cu2, a better
homogenization of elements per unit of surface is observed in Cu4 samples.
Figure 6-6. SEM images and mapping of the rCu0 sample
Zn50 µm
Zr50 µm
1 µm
(a) (b)
(c)
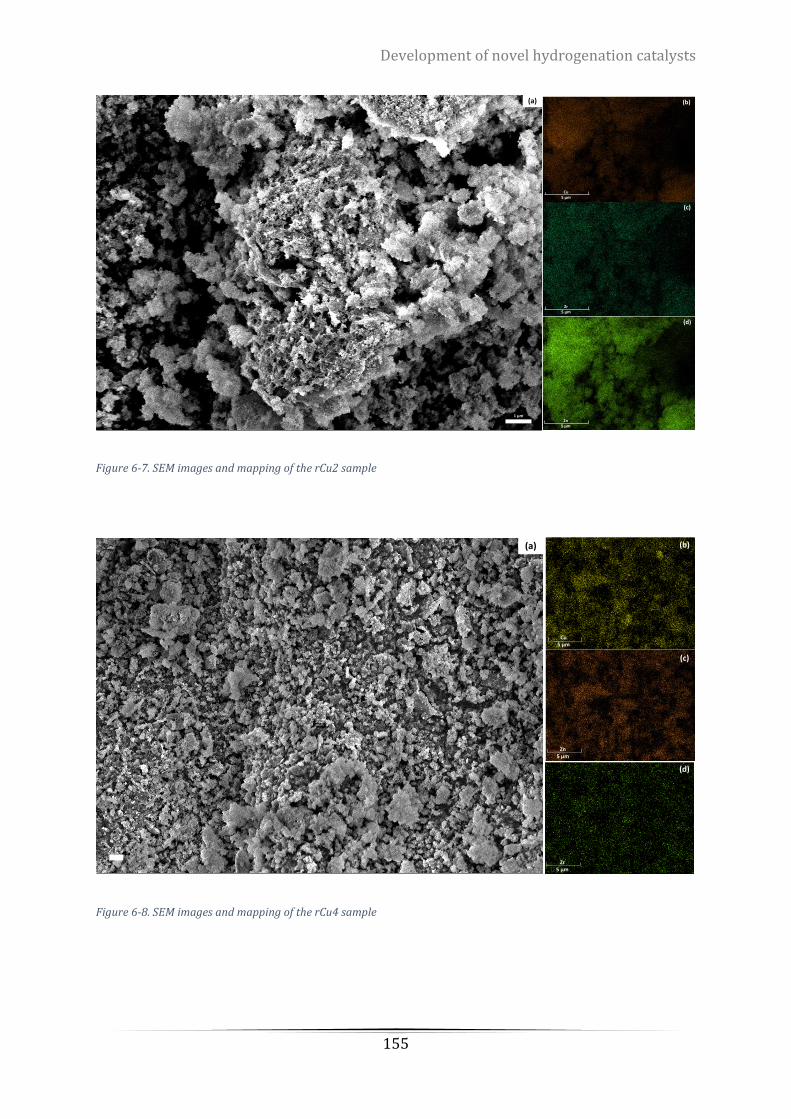
Development of novel hydrogenation catalysts
155
Figure 6-7. SEM images and mapping of the rCu2 sample
Figure 6-8. SEM images and mapping of the rCu4 sample
Zr5 µm
Zn5 µm
Cu5 µm
1 µm
(b)
(c)
(d)
(a)
Cu5 µm
Zn5 µm
Zr5 µm
1 µm
Cu5 µm
(b)
(d)
(c)
(a)
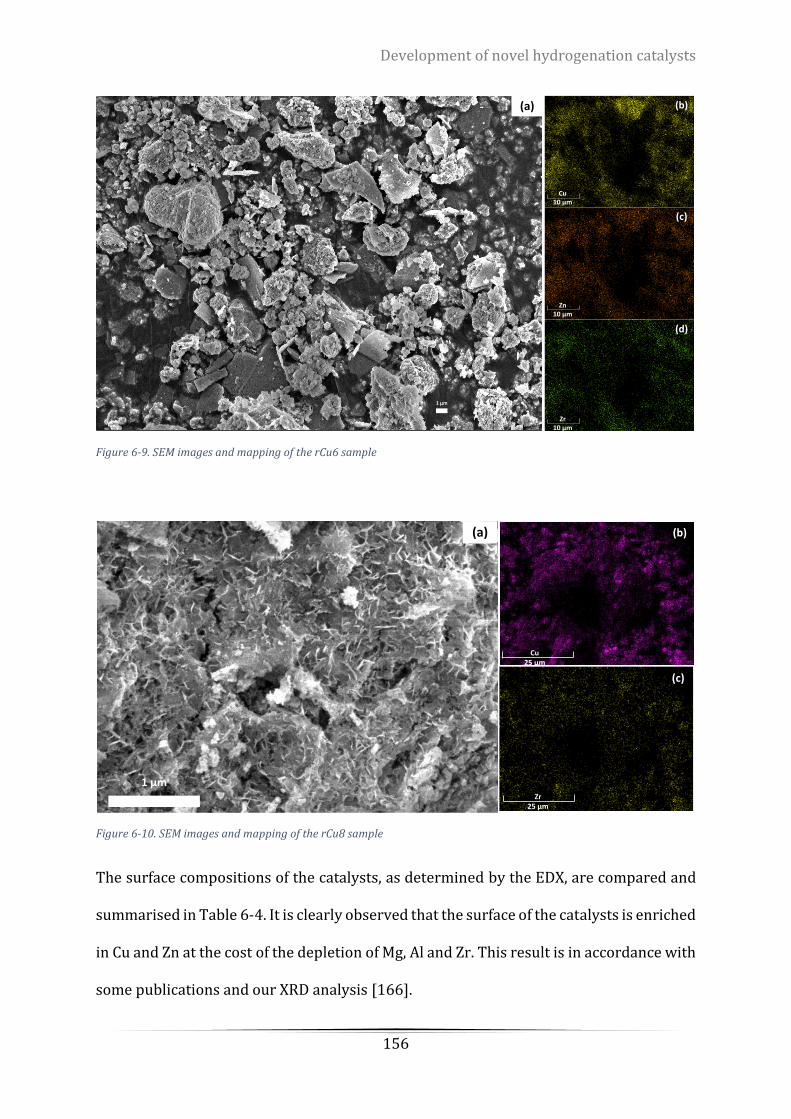
Development of novel hydrogenation catalysts
156
Figure 6-9. SEM images and mapping of the rCu6 sample
Figure 6-10. SEM images and mapping of the rCu8 sample
The surface compositions of the catalysts, as determined by the EDX, are compared and
summarised in Table 6-4. It is clearly observed that the surface of the catalysts is enriched
in Cu and Zn at the cost of the depletion of Mg, Al and Zr. This result is in accordance with
some publications and our XRD analysis [166].
Zr10 µm
Zn10 µm
Cu10 µm
1 µm
(a) (b)
(c)
(d)
Zr25 µm
Cu25 µm
1 µm
100 nm
1 µm
(b)
(c)
(a)
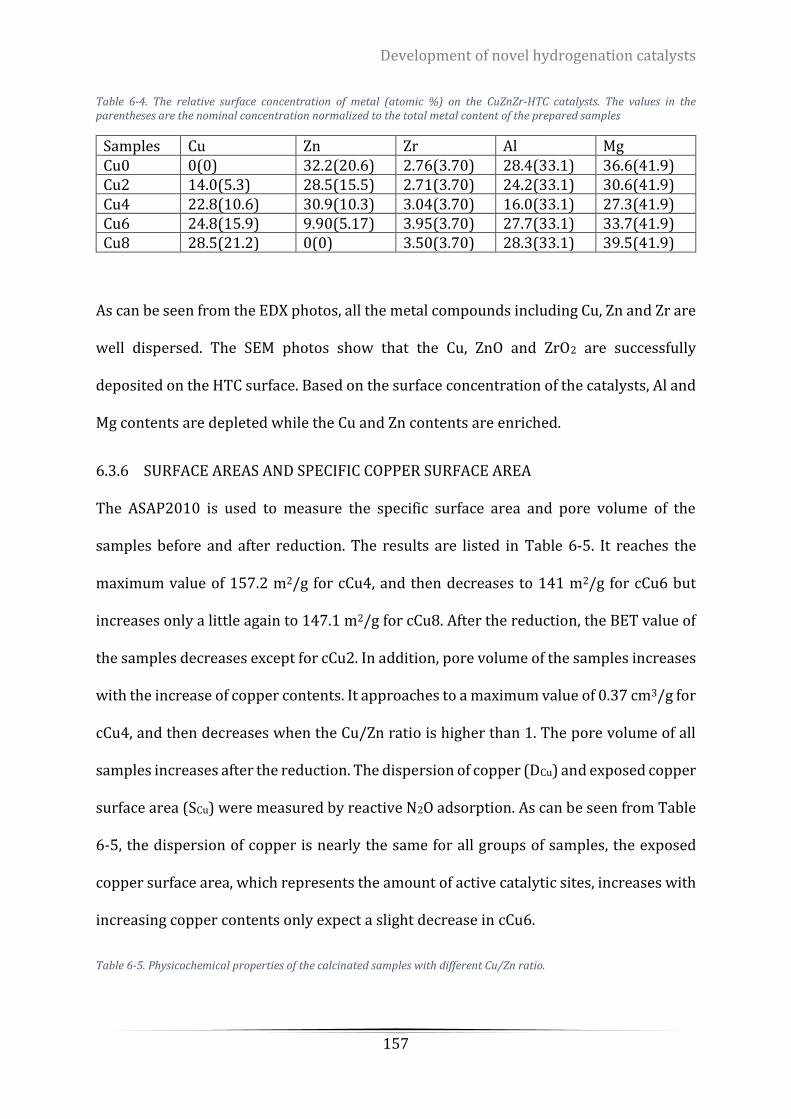
Development of novel hydrogenation catalysts
157
Table 6-4. The relative surface concentration of metal (atomic %) on the CuZnZr-HTC catalysts. The values in the parentheses are the nominal concentration normalized to the total metal content of the prepared samples
Samples Cu Zn Zr Al Mg Cu0 0(0) 32.2(20.6) 2.76(3.70) 28.4(33.1) 36.6(41.9) Cu2 14.0(5.3) 28.5(15.5) 2.71(3.70) 24.2(33.1) 30.6(41.9) Cu4 22.8(10.6) 30.9(10.3) 3.04(3.70) 16.0(33.1) 27.3(41.9) Cu6 24.8(15.9) 9.90(5.17) 3.95(3.70) 27.7(33.1) 33.7(41.9) Cu8 28.5(21.2) 0(0) 3.50(3.70) 28.3(33.1) 39.5(41.9)
As can be seen from the EDX photos, all the metal compounds including Cu, Zn and Zr are
well dispersed. The SEM photos show that the Cu, ZnO and ZrO2 are successfully
deposited on the HTC surface. Based on the surface concentration of the catalysts, Al and
Mg contents are depleted while the Cu and Zn contents are enriched.
6.3.6 SURFACE AREAS AND SPECIFIC COPPER SURFACE AREA
The ASAP2010 is used to measure the specific surface area and pore volume of the
samples before and after reduction. The results are listed in Table 6-5. It reaches the
maximum value of 157.2 m2/g for cCu4, and then decreases to 141 m2/g for cCu6 but
increases only a little again to 147.1 m2/g for cCu8. After the reduction, the BET value of
the samples decreases except for cCu2. In addition, pore volume of the samples increases
with the increase of copper contents. It approaches to a maximum value of 0.37 cm3/g for
cCu4, and then decreases when the Cu/Zn ratio is higher than 1. The pore volume of all
samples increases after the reduction. The dispersion of copper (DCu) and exposed copper
surface area (SCu) were measured by reactive N2O adsorption. As can be seen from Table
6-5, the dispersion of copper is nearly the same for all groups of samples, the exposed
copper surface area, which represents the amount of active catalytic sites, increases with
increasing copper contents only expect a slight decrease in cCu6.
Table 6-5. Physicochemical properties of the calcinated samples with different Cu/Zn ratio.
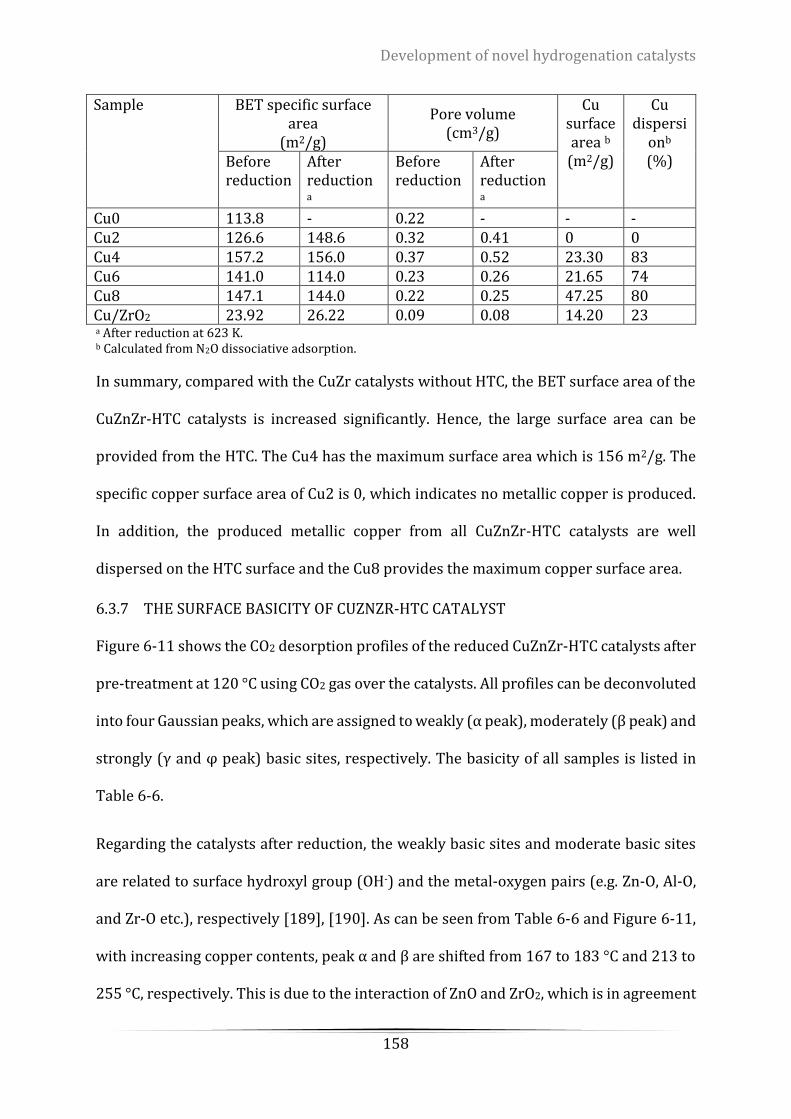
Development of novel hydrogenation catalysts
158
Sample BET specific surface area
(m2/g)
Pore volume (cm3/g)
Cu surface area b
(m2/g)
Cu dispersi
onb (%) Before
reduction After reduction a
Before reduction
After reduction a
Cu0 113.8 - 0.22 - - - Cu2 126.6 148.6 0.32 0.41 0 0 Cu4 157.2 156.0 0.37 0.52 23.30 83 Cu6 141.0 114.0 0.23 0.26 21.65 74 Cu8 147.1 144.0 0.22 0.25 47.25 80 Cu/ZrO2 23.92 26.22 0.09 0.08 14.20 23 a After reduction at 623 K. b Calculated from N2O dissociative adsorption.
In summary, compared with the CuZr catalysts without HTC, the BET surface area of the
CuZnZr-HTC catalysts is increased significantly. Hence, the large surface area can be
provided from the HTC. The Cu4 has the maximum surface area which is 156 m2/g. The
specific copper surface area of Cu2 is 0, which indicates no metallic copper is produced.
In addition, the produced metallic copper from all CuZnZr-HTC catalysts are well
dispersed on the HTC surface and the Cu8 provides the maximum copper surface area.
6.3.7 THE SURFACE BASICITY OF CUZNZR-HTC CATALYST
Figure 6-11 shows the CO2 desorption profiles of the reduced CuZnZr-HTC catalysts after
pre-treatment at 120 °C using CO2 gas over the catalysts. All profiles can be deconvoluted
into four Gaussian peaks, which are assigned to weakly (α peak), moderately (β peak) and
strongly (γ and φ peak) basic sites, respectively. The basicity of all samples is listed in
Table 6-6.
Regarding the catalysts after reduction, the weakly basic sites and moderate basic sites
are related to surface hydroxyl group (OH-) and the metal-oxygen pairs (e.g. Zn-O, Al-O,
and Zr-O etc.), respectively [189], [190]. As can be seen from Table 6-6 and Figure 6-11,
with increasing copper contents, peak α and β are shifted from 167 to 183 °C and 213 to
255 °C, respectively. This is due to the interaction of ZnO and ZrO2, which is in agreement
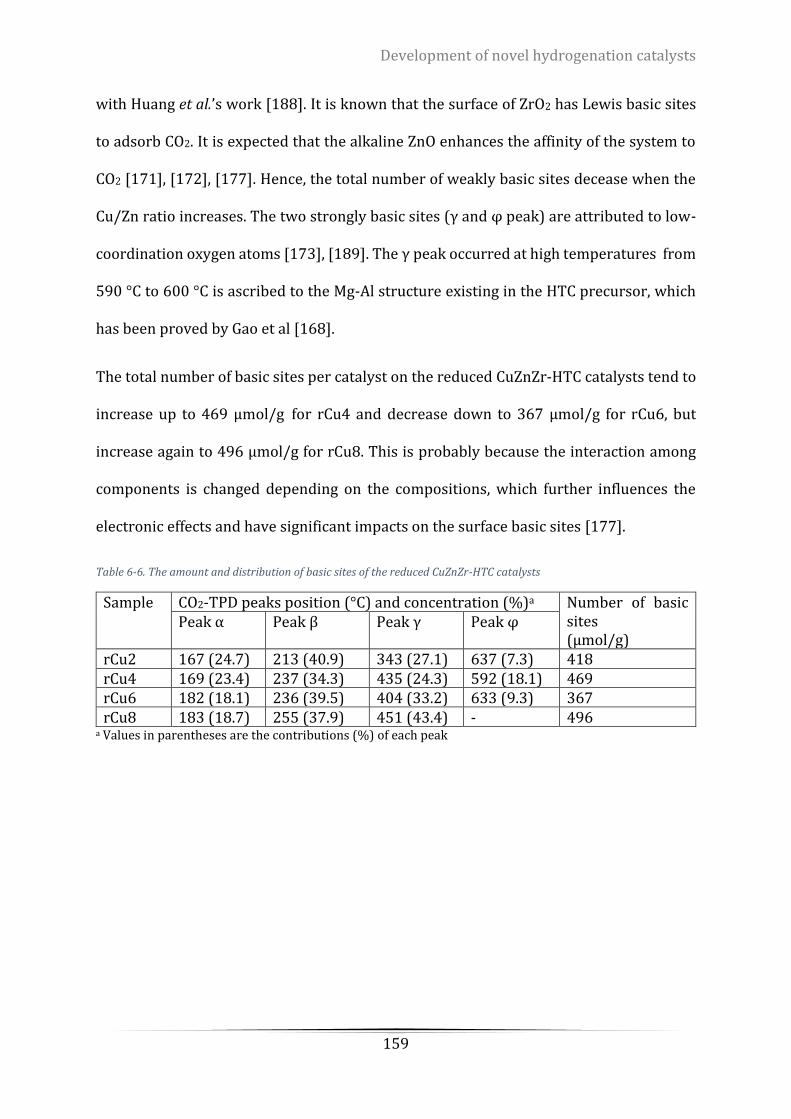
Development of novel hydrogenation catalysts
159
with Huang et al.’s work [188]. It is known that the surface of ZrO2 has Lewis basic sites
to adsorb CO2. It is expected that the alkaline ZnO enhances the affinity of the system to
CO2 [171], [172], [177]. Hence, the total number of weakly basic sites decease when the
Cu/Zn ratio increases. The two strongly basic sites (γ and φ peak) are attributed to low-
coordination oxygen atoms [173], [189]. The γ peak occurred at high temperatures from
590 °C to 600 °C is ascribed to the Mg-Al structure existing in the HTC precursor, which
has been proved by Gao et al [168].
The total number of basic sites per catalyst on the reduced CuZnZr-HTC catalysts tend to
increase up to 469 µmol/g for rCu4 and decrease down to 367 µmol/g for rCu6, but
increase again to 496 µmol/g for rCu8. This is probably because the interaction among
components is changed depending on the compositions, which further influences the
electronic effects and have significant impacts on the surface basic sites [177].
Table 6-6. The amount and distribution of basic sites of the reduced CuZnZr-HTC catalysts
Sample CO2-TPD peaks position (°C) and concentration (%)a Number of basic sites (µmol/g)
Peak α Peak β Peak γ Peak φ
rCu2 167 (24.7) 213 (40.9) 343 (27.1) 637 (7.3) 418 rCu4 169 (23.4) 237 (34.3) 435 (24.3) 592 (18.1) 469 rCu6 182 (18.1) 236 (39.5) 404 (33.2) 633 (9.3) 367 rCu8 183 (18.7) 255 (37.9) 451 (43.4) - 496
a Values in parentheses are the contributions (%) of each peak

Development of novel hydrogenation catalysts
160
Figure 6-11. CO2-TPD pattern of the reduced CuZnZr-HTC catalysts. (a) Cu8; (b) Cu6; (c) Cu4; (d) Cu2
To conclude, the basic sites of the CuZnZr-HTC catalysts are very close and the Cu8
present the maximum number of basic sites of 469 µmol/g. Some researches believed
there is a correlation between the catalysts basic sites and the products selectivity, which
will be discussed in chapter 7.
6.3.8 CHEMICAL STATES OF ELEMENTS IN THE CATALYST
The XPS measurement of the catalysts was conducted to determine the chemical states of
the elements and the XPS spectra of Cu, Zn, Zr and O for series of CuZnZr-HTC catalysts
Development of novel hydrogenation catalysts
161
are presented in Figure 6-12 to Figure 6-15. The binding energies (BE) and the full width
at half maximum (FWMH) are summaries in Table 6-7 to Table 6-9.
It can be seen from Table 6-7, these calcinated samples exhibit Cu 2p3/2 and Cu 2p1/2 main
peaks in the BE ranges from 933.3 to 933.9 eV and from 963 to 953.7 eV with a spin-orbit
coupling energy gap of 20 eV, respectively. From Figure 6-12, it is also noticed that both
Cu 2p3/2 and Cu 2p1/2 peaks are accompanied by intense satellite (Cu2+) featuring at 942
eV and 962 eV for all calcinated samples, and the Cu2+ satellite disappears after reduction,
which proves that the copper oxide is reduced to either Cu+ or a metallic state of Cu. Since
the BE value of Cu0 (932.6 eV) and Cu+ (932.4 eV) are close, it is difficult to distinguish by
typical XPS. Hence, the Auger electron spectrum of L3M45M45 (hereafter referred as Cu
LMM) is used to determine the states of copper. Detailed discussion of the distribution of
Cu+ and Cu0 will be given later.
As can be seen from Table 6-8 and Figure 6-13, the Zn 2p3/2 peak exhibits at the BE values
of between 1021.8 and1022.1 eV for both calcinated and reduced CuZnZr-HTC samples
with a FWHM value of 1.84 ± 0.08 eV. These characteristic values are close to a reference
of ZnO cat the BE values of 1021.3 to 1022.0 eV and a FWHM value of 2.0 eV [191].
Therefore, it is speculated that the chemical environment of Zn is not affected by other
components of the catalysts. In addition, since the chemical state of the Zn is unchanged
before and after reduction, indicating that ZnO is stable in the catalysts, which is
consistent with the XRD results where there are ZnO crystals present before and after
reduction.
From Zr 3d core level XP spectra of CuZnZr-HTC samples (shown in Figure 6-14) and the
XPS parameters summarized in Table 6-9, Zr exhibits the spin-orbit doublet of the 3d core
level into 3d5/2(182.04 – 182.3 eV) and 3d3/2 (184.37 – 184.67 eV) levels with an energy
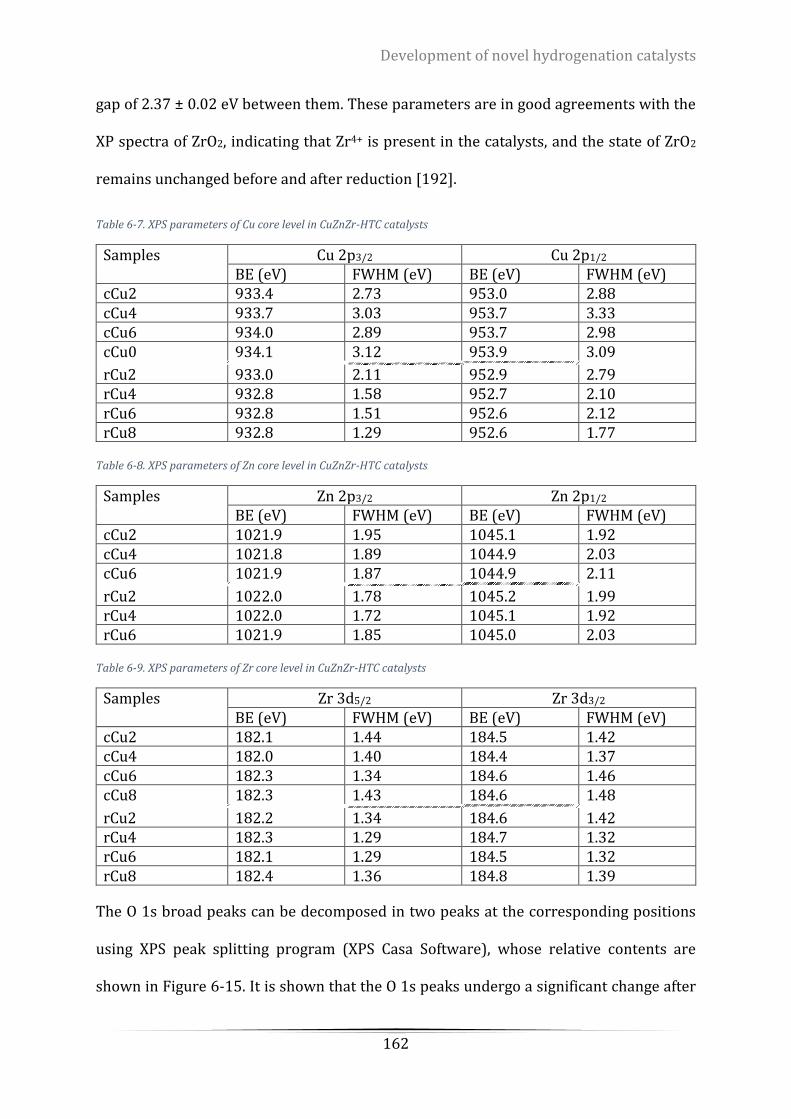
Development of novel hydrogenation catalysts
162
gap of 2.37 ± 0.02 eV between them. These parameters are in good agreements with the
XP spectra of ZrO2, indicating that Zr4+ is present in the catalysts, and the state of ZrO2
remains unchanged before and after reduction [192].
Table 6-7. XPS parameters of Cu core level in CuZnZr-HTC catalysts
Samples Cu 2p3/2 Cu 2p1/2 BE (eV) FWHM (eV) BE (eV) FWHM (eV)
cCu2 933.4 2.73 953.0 2.88 cCu4 933.7 3.03 953.7 3.33 cCu6 934.0 2.89 953.7 2.98 cCu0 934.1 3.12 953.9 3.09
rCu2 933.0 2.11 952.9 2.79 rCu4 932.8 1.58 952.7 2.10 rCu6 932.8 1.51 952.6 2.12 rCu8 932.8 1.29 952.6 1.77
Table 6-8. XPS parameters of Zn core level in CuZnZr-HTC catalysts
Samples Zn 2p3/2 Zn 2p1/2 BE (eV) FWHM (eV) BE (eV) FWHM (eV)
cCu2 1021.9 1.95 1045.1 1.92 cCu4 1021.8 1.89 1044.9 2.03 cCu6 1021.9 1.87 1044.9 2.11
rCu2 1022.0 1.78 1045.2 1.99 rCu4 1022.0 1.72 1045.1 1.92 rCu6 1021.9 1.85 1045.0 2.03
Table 6-9. XPS parameters of Zr core level in CuZnZr-HTC catalysts
Samples Zr 3d5/2 Zr 3d3/2 BE (eV) FWHM (eV) BE (eV) FWHM (eV)
cCu2 182.1 1.44 184.5 1.42 cCu4 182.0 1.40 184.4 1.37 cCu6 182.3 1.34 184.6 1.46 cCu8 182.3 1.43 184.6 1.48
rCu2 182.2 1.34 184.6 1.42 rCu4 182.3 1.29 184.7 1.32 rCu6 182.1 1.29 184.5 1.32 rCu8 182.4 1.36 184.8 1.39
The O 1s broad peaks can be decomposed in two peaks at the corresponding positions
using XPS peak splitting program (XPS Casa Software), whose relative contents are
shown in Figure 6-15. It is shown that the O 1s peaks undergo a significant change after
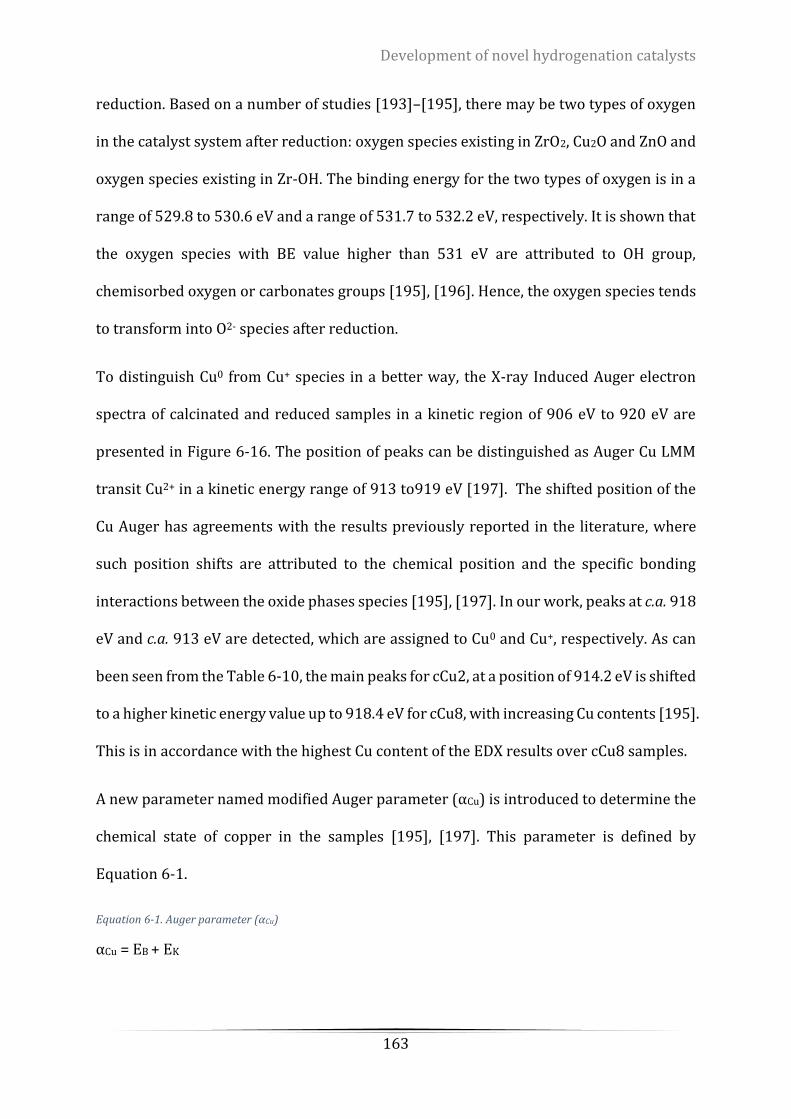
Development of novel hydrogenation catalysts
163
reduction. Based on a number of studies [193]–[195], there may be two types of oxygen
in the catalyst system after reduction: oxygen species existing in ZrO2, Cu2O and ZnO and
oxygen species existing in Zr-OH. The binding energy for the two types of oxygen is in a
range of 529.8 to 530.6 eV and a range of 531.7 to 532.2 eV, respectively. It is shown that
the oxygen species with BE value higher than 531 eV are attributed to OH group,
chemisorbed oxygen or carbonates groups [195], [196]. Hence, the oxygen species tends
to transform into O2- species after reduction.
To distinguish Cu0 from Cu+ species in a better way, the X-ray Induced Auger electron
spectra of calcinated and reduced samples in a kinetic region of 906 eV to 920 eV are
presented in Figure 6-16. The position of peaks can be distinguished as Auger Cu LMM
transit Cu2+ in a kinetic energy range of 913 to919 eV [197]. The shifted position of the
Cu Auger has agreements with the results previously reported in the literature, where
such position shifts are attributed to the chemical position and the specific bonding
interactions between the oxide phases species [195], [197]. In our work, peaks at c.a. 918
eV and c.a. 913 eV are detected, which are assigned to Cu0 and Cu+, respectively. As can
been seen from the Table 6-10, the main peaks for cCu2, at a position of 914.2 eV is shifted
to a higher kinetic energy value up to 918.4 eV for cCu8, with increasing Cu contents [195].
This is in accordance with the highest Cu content of the EDX results over cCu8 samples.
A new parameter named modified Auger parameter (αCu) is introduced to determine the
chemical state of copper in the samples [195], [197]. This parameter is defined by
Equation 6-1.
Equation 6-1. Auger parameter (αCu)
αCu = EB + EK
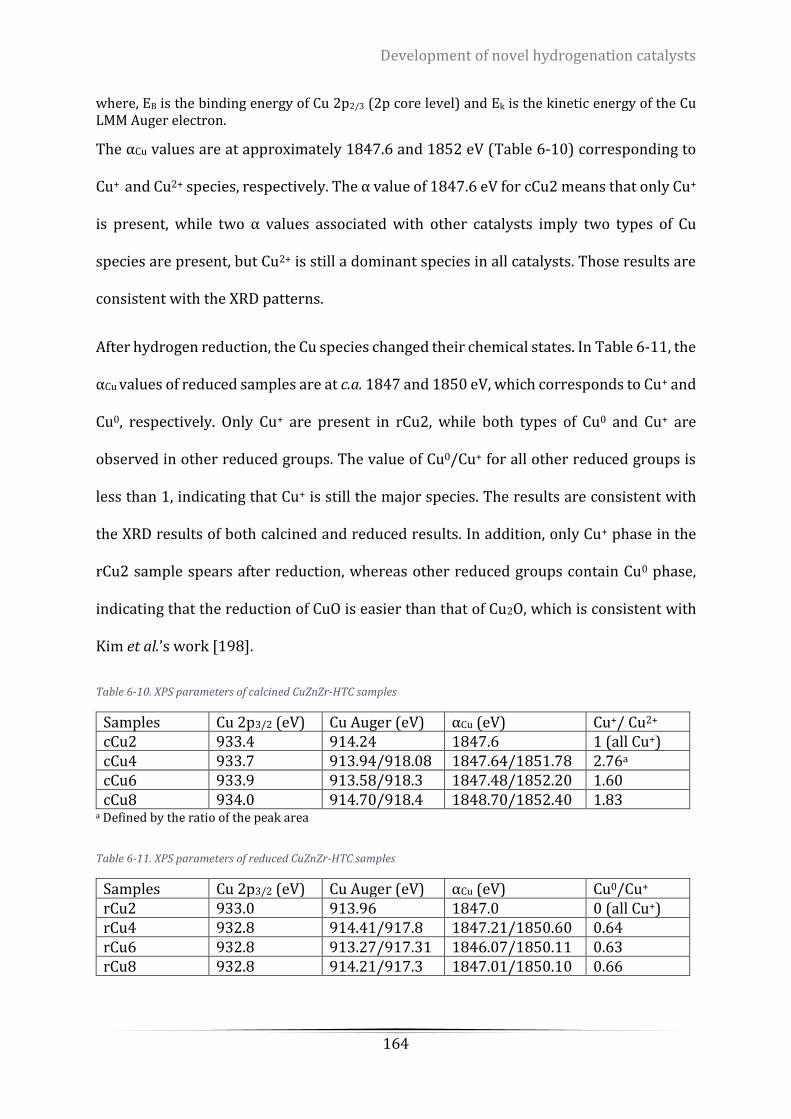
Development of novel hydrogenation catalysts
164
where, EB is the binding energy of Cu 2p2/3 (2p core level) and Ek is the kinetic energy of the Cu LMM Auger electron.
The αCu values are at approximately 1847.6 and 1852 eV (Table 6-10) corresponding to
Cu+ and Cu2+ species, respectively. The α value of 1847.6 eV for cCu2 means that only Cu+
is present, while two α values associated with other catalysts imply two types of Cu
species are present, but Cu2+ is still a dominant species in all catalysts. Those results are
consistent with the XRD patterns.
After hydrogen reduction, the Cu species changed their chemical states. In Table 6-11, the
αCu values of reduced samples are at c.a. 1847 and 1850 eV, which corresponds to Cu+ and
Cu0, respectively. Only Cu+ are present in rCu2, while both types of Cu0 and Cu+ are
observed in other reduced groups. The value of Cu0/Cu+ for all other reduced groups is
less than 1, indicating that Cu+ is still the major species. The results are consistent with
the XRD results of both calcined and reduced results. In addition, only Cu+ phase in the
rCu2 sample spears after reduction, whereas other reduced groups contain Cu0 phase,
indicating that the reduction of CuO is easier than that of Cu2O, which is consistent with
Kim et al.’s work [198].
Table 6-10. XPS parameters of calcined CuZnZr-HTC samples
Samples Cu 2p3/2 (eV) Cu Auger (eV) αCu (eV) Cu+/ Cu2+
cCu2 933.4 914.24 1847.6 1 (all Cu+) cCu4 933.7 913.94/918.08 1847.64/1851.78 2.76a
cCu6 933.9 913.58/918.3 1847.48/1852.20 1.60 cCu8 934.0 914.70/918.4 1848.70/1852.40 1.83
a Defined by the ratio of the peak area
Table 6-11. XPS parameters of reduced CuZnZr-HTC samples
Samples Cu 2p3/2 (eV) Cu Auger (eV) αCu (eV) Cu0/Cu+ rCu2 933.0 913.96 1847.0 0 (all Cu+) rCu4 932.8 914.41/917.8 1847.21/1850.60 0.64 rCu6 932.8 913.27/917.31 1846.07/1850.11 0.63 rCu8 932.8 914.21/917.3 1847.01/1850.10 0.66

Development of novel hydrogenation catalysts
165
In addition, it is noted that a new peak appears at a low kinetic energy position (c.a. 910
to 910.3 eV) for all the samples except rCu6 and rCu8. Such peak was also detected in
Zhan et al.’s work [183], which is attributed to Cuα+ in a perovskite structure (A2+B4+O3, A
and B are metals). Hence, it is likely to form a perovskite structure in the prepared
catalysts, which is mostly in the presence of CuZrO3 compound. However, based on our
XRD results, there is no indication that such crystalline structure is present in the samples,
probably because the perovskite structure is not crystalline as the amount of zirconium
is limited. Moreover, it is found such peak disappears when copper contents increase,
similar phenomenon was found in Saha et al.’s work, where it was observed that large
stoichiometric ratio of copper in CuZrO3 resulted in structure defects [199].
In short, the XPS spectrum show that ZnO and ZrO2 in the CuZnZr-HTC catalysts stay
unchanged before and after reduction. From Auger spectrum, no Cu0 phase is detected
from the Cu2 catalysts, which is consistent with the XRD, N2O chemisorption results. In
addition, the ratio of Cu0/Cu+ in the Cu4 to Cu8 catalysts is very similar.

Development of novel hydrogenation catalysts
166
Figure 6-12. Cu 2p core level X-ray photoelectron spectra of CnZuZr-HTC series samples. (A) Cu2; (B) Cu4; (C) Cu6; (D) Cu8 (i) represents calcinated state, (ii) represents reduced state.
NameCu 2p3/2Cu 2p1/2
Pos.932.753952.591
%Area49.1050.90
Cu
2p
x 103
15
20
25
30
35
40
CP
S
970 965 960 955 950 945 940 935 930 925Binding Energy (eV)
NameCu 2p3/2Cu 2p1/2
Pos.932.813952.649
%Area49.8950.11
Cu
2p
x 103
20
25
30
35
40
45
CP
S
970 965 960 955 950 945 940 935 930 925Binding Energy (eV)
rCuZnZr(2:6:2)-HTC
NameCu 2p3/2Cu 2p1/2
Pos.933
952.861
%Area47.9752.03
Cu
2p
x 102
140
150
160
170
180
190
200
210
CP
S
970 965 960 955 950 945 940 935 930 925Binding Energy (eV)
NameCu 2p3/2Cu 2p1/2
Pos.933.703953.662
%Area55.3044.70
Cu
2p
Cu
2p
x 103
18
20
22
24
26
28
30
CP
S
970 965 960 955 950 945 940 935 930 925Binding Energy (eV)
NameCu 2p3/2Cu 2p1/2
Pos.933.974953.728
%Area54.4945.51
Cu
2p
Cu
2p
x 103
12
14
16
18
20
22
24
26
CP
S
970 965 960 955 950 945 940 935 930 925Binding Energy (eV)
cCuZnZr(2:6:2)-HTC
Name
Cu 2p3/2
Cu 2p1/2
Pos.
933.374
953.061
%Area
50.02
49.98
Cu
2p
x 102
150
160
170
180
190
200
CP
S
970 965 960 955 950 945 940 935 930 925Binding Energy (eV)
NameCu 2p3/2Cu 2p1/2
Pos.934.073953.882
%Area53.3946.61
Cu
2p
Cu
2p
x 103
14
16
18
20
22
24
26
28
30
32
CP
S
970 965 960 955 950 945 940 935 930 925Binding Energy (eV)
NameCu 2p3/2Cu 2p1/2
Pos.932.792952.591
%Area50.2249.78
Cu
2p
x 103
15
20
25
30
35
40
45
50
55
60
CP
S
970 965 960 955 950 945 940 935 930 925Binding Energy (eV)
(C-i)
(B-i)
(A-i)
(D-i)
(C-ii)
(A-ii)
(B-ii)
(D-ii)
Development of novel hydrogenation catalysts
167
Figure 6-13. Zn 2p core level X-ray photoelectron spectra of CnZuZr-HTC series samples. (A) Cu2; (B) Cu4; (C) Cu6; (D) Cu8 (i) represents calcinated state, (ii) represents reduced state.
NameZn 2p3/2Zn 2p1/2
Pos.1021.851044.94
%Area49.3150.69
Zn
2p
x 103
20
22
24
26
28
30
32
34
36
38
CP
S
1050 1045 1040 1035 1030 1025 1020 1015Binding Energy (eV)
NameZn 2p3/2Zn 2p1/2
Pos.1021.891044.97
%Area49.0950.91
Zn
2p
x 103
20
22
24
26
28
30
32
34
36
38
40
CP
S
1050 1045 1040 1035 1030 1025 1020 1015Binding Energy (eV)
rCuZnZr(2:6:2)-HTC
NameZn 2p3/2Zn 2p1/2
Pos.1022.071045.19
%Area49.8850.12
Zn
2p
x 103
20
30
40
50
60
70
80
90
CP
S
1050 1045 1040 1035 1030 1025 1020 1015Binding Energy (eV)
cCuZnZr(2:6:2)-HTC
NameZn 2p3/2Zn 2p1/2
Pos.1021.881045.12
%Area59.1840.82
Zn
2p
Zn
2p
x 103
20
30
40
50
60
70
80
90
CP
S
1050 1045 1040 1035 1030 1025 1020 1015Binding Energy (eV)
NameZn 2p3/2Zn 2p1/2
Pos.1021.811044.89
%Area50.0349.97
Zn
2p
x 103
30
40
50
60
70
80
90
CP
S
1050 1045 1040 1035 1030 1025 1020 1015Binding Energy (eV)
NameZn 2p3/2Zn 2p1/2
Pos.1022.011045.09
%Area49.6750.33
Zn
2p
x 103
30
40
50
60
70
80
90
100
CP
S
1050 1045 1040 1035 1030 1025 1020 1015Binding Energy (eV)
(C-i)
(B-i)
(A-i)
(C-ii)
(A-ii)
(B-ii)
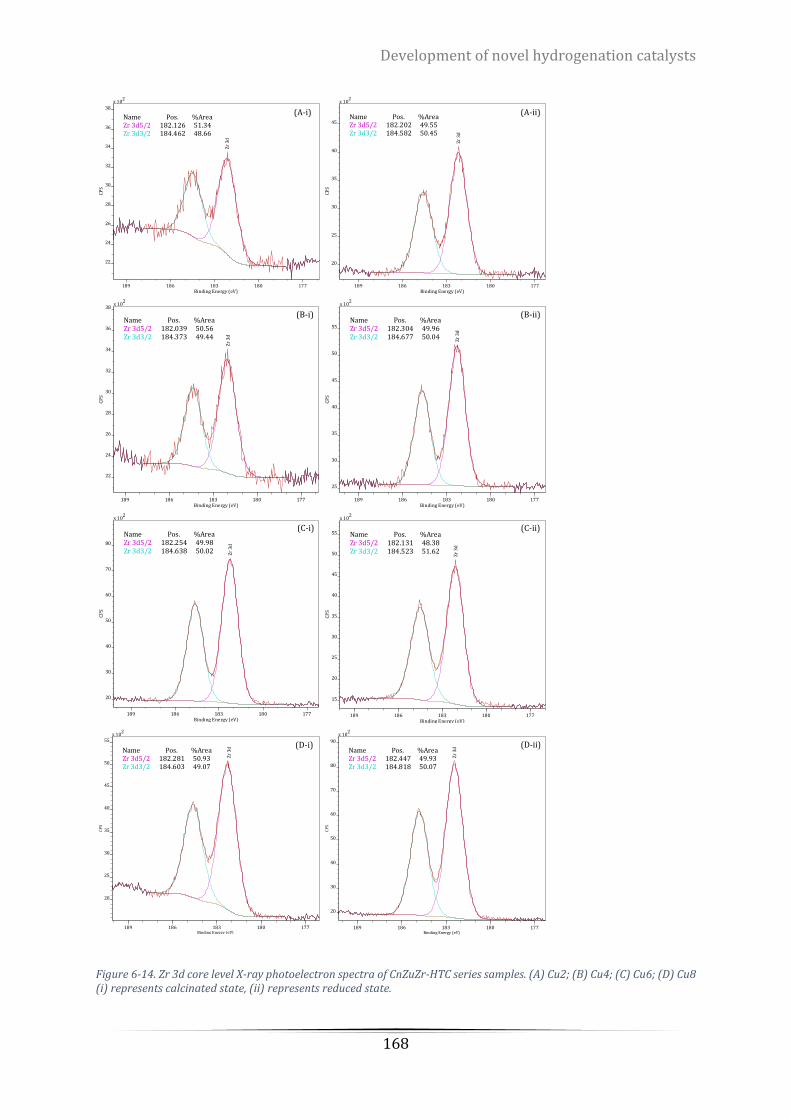
Development of novel hydrogenation catalysts
168
Figure 6-14. Zr 3d core level X-ray photoelectron spectra of CnZuZr-HTC series samples. (A) Cu2; (B) Cu4; (C) Cu6; (D) Cu8 (i) represents calcinated state, (ii) represents reduced state.
NameZr 3d5/2Zr 3d3/2
Pos.182.039184.373
%Area50.5649.44
Zr
3d
x 102
22
24
26
28
30
32
34
36
38
CP
S
189 186 183 180 177Binding Energy (eV)
NameZr 3d5/2Zr 3d3/2
Pos.182.304184.677
%Area49.9650.04
Zr
3d
x 102
25
30
35
40
45
50
55C
PS
189 186 183 180 177Binding Energy (eV)
rCuZnZr(2:6:2)-HTC
NameZr 3d5/2Zr 3d3/2
Pos.182.202184.582
%Area49.5550.45
Zr
3d
x 102
20
25
30
35
40
45
CP
S
189 186 183 180 177Binding Energy (eV)
cCuZnZr(2:6:2)-HTC
NameZr 3d5/2Zr 3d3/2
Pos.182.126184.462
%Area51.3448.66
Zr
3d
x 102
22
24
26
28
30
32
34
36
38
CP
S
189 186 183 180 177Binding Energy (eV)
NameZr 3d5/2Zr 3d3/2
Pos.182.131184.523
%Area48.3851.62
Zr
3d
x 102
15
20
25
30
35
40
45
50
55
CP
S
189 186 183 180 177Binding Energy (eV)
NameZr 3d5/2Zr 3d3/2
Pos.182.254184.638
%Area49.9850.02 Z
r 3
d
x 102
20
30
40
50
60
70
80
CP
S
189 186 183 180 177Binding Energy (eV)
NameZr 3d5/2Zr 3d3/2
Pos.182.281184.603
%Area50.9349.07
Zr
3d
x 102
20
25
30
35
40
45
50
55
CP
S
189 186 183 180 177Binding Energy (eV)
NameZr 3d5/2Zr 3d3/2
Pos.182.447184.818
%Area49.9350.07
Zr
3d
x 102
20
30
40
50
60
70
80
90
CP
S
189 186 183 180 177Binding Energy (eV)
(C-i)
(B-i)
(A-i)
(D-i)
(C-ii)
(A-ii)
(B-ii)
(D-ii)
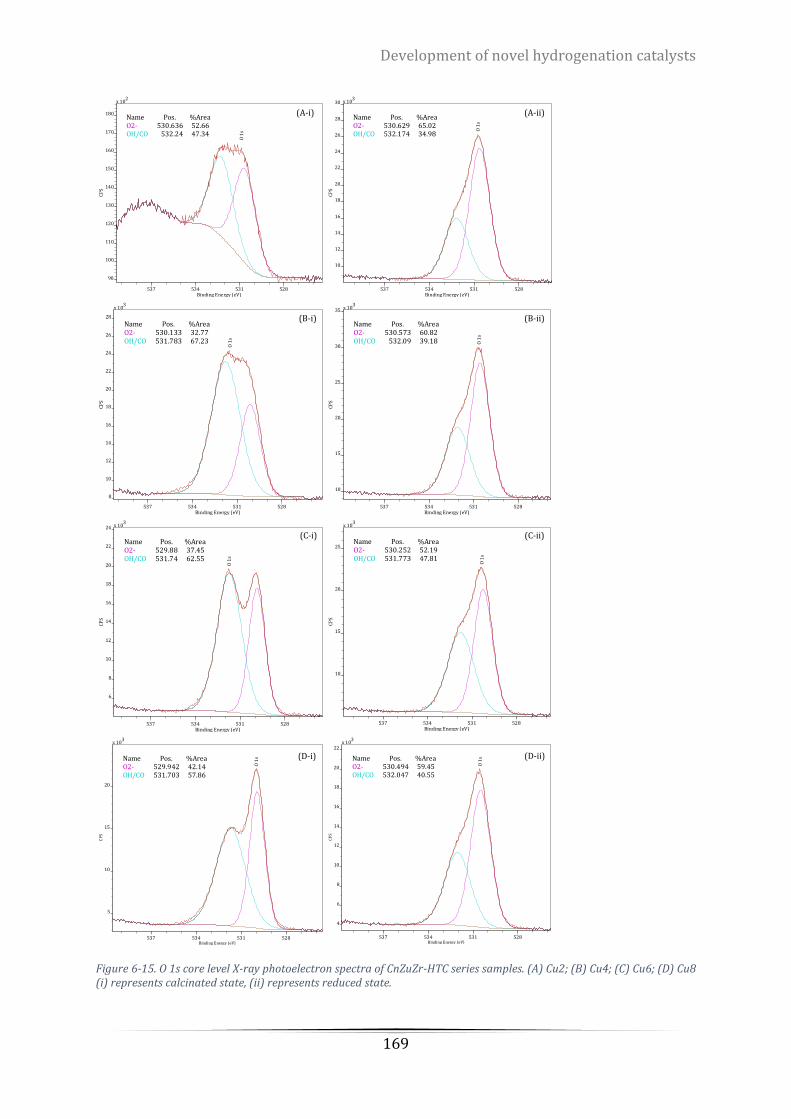
Development of novel hydrogenation catalysts
169
Figure 6-15. O 1s core level X-ray photoelectron spectra of CnZuZr-HTC series samples. (A) Cu2; (B) Cu4; (C) Cu6; (D) Cu8 (i) represents calcinated state, (ii) represents reduced state.
cCuZnZr(2:6:2)-HTC
NameO2-OH/CO
Pos.530.636
532.24
%Area52.6647.34
O 1
s
x 102
90
100
110
120
130
140
150
160
170
180
CP
S
537 534 531 528Binding Energy (eV)
rCuZnZr(2:6:2)-HTC
NameO2-OH/CO
Pos.530.629532.174
%Area65.0234.98
O 1
s
x 103
10
12
14
16
18
20
22
24
26
28
30
CP
S
537 534 531 528Binding Energy (eV)
NameO2-OH/CO
Pos.530.133531.783
%Area32.7767.23
O 1
s
x 103
8
10
12
14
16
18
20
22
24
26
28
CP
S
537 534 531 528Binding Energy (eV)
NameO2-OH/CO
Pos.530.573
532.09
%Area60.8239.18 O
1s
x 103
10
15
20
25
30
35
CP
S
537 534 531 528Binding Energy (eV)
NameO2-OH/CO
Pos.529.88531.74
%Area37.4562.55
O 1
s
x 103
6
8
10
12
14
16
18
20
22
24
CP
S
537 534 531 528Binding Energy (eV)
NameO2-OH/CO
Pos.530.252531.773
%Area52.1947.81
O 1
s
x 103
10
15
20
25
CP
S
537 534 531 528Binding Energy (eV)
NameO2-OH/CO
Pos.529.942531.703
%Area42.1457.86
O 1
s
x 103
5
10
15
20
CP
S
537 534 531 528Binding Energy (eV)
NameO2-OH/CO
Pos.530.494532.047
%Area59.4540.55
O 1
s
x 103
4
6
8
10
12
14
16
18
20
22
CP
S
537 534 531 528Binding Energy (eV)
(C-ii)
(A-ii)
(B-ii)
(D-ii)
(C-i)
(B-i)
(A-i)
(D-i)

Development of novel hydrogenation catalysts
170
Figure 6-16. X-ray induced Auger electron spectra of catalysts. (a) cCu2; (b) rCu2; (c) cCu4; (d) rCu4; (e) cCu6; (f) rCu6; (g) cCu8; (h) rCu8
x 102
95
100
105
110
115
120
125
130
135
140
Inte
nsi
ty
908 912 916 920Kinetic Energy (eV)
x 102
90
95
100
105
110
115
120
125
Inte
nsi
ty908 912 916 920
Kinetic Energy (eV)
x 102
100
105
110
115
120
125
130
135
Inte
nsi
ty
908 912 916 920 924Kinetic Energy (eV)
x 102
105
110
115
120
125
130
135
140
145
150
Inte
nsi
ty
908 912 916 920 924Kinetic Energy (eV)
x 102
65
70
75
80
85
90
Inte
nsi
ty
908 912 916 920 924Kinetic Energy (eV)
x 102
70
75
80
85
90
95
Inte
nsi
ty
908 912 916 920 924Kinetic Energy (eV)
(a) (b)
(e) (f)
(c) (d)
x 102
60
70
80
90
100
110
Inte
nsi
ty
904 908 912 916 920 924Kinetic Energy (eV)
x 102
60
70
80
90
100
Inte
nsi
ty
904 908 912 916 920 924Kinetic Energy (eV)
(g) (h)

Development of novel hydrogenation catalysts
171
6.4 CONCLUSIONS
The CuZnZr-HTC catalysts with a series of mass ratio of Cu2+:Zn2+:Zr4+ with x:y:2 (x+y =
8, x=0,2,4,6,8) were successfully prepared by a simple co-precipitation method. The
physical and chemical properties of the catalysts with different ratio of copper/zinc were
investigated by XRD, N2 physisorption, SEM, N2O chemisorption, TPR, CO2-TPD and XPS
techniques. Some conclusions can be summarised:
(1) The Cu/Zn/Zr-HTC catalysts were synthesised and can be thoroughly reduced at
pure hydrogen atmosphere above 623 K using the temperature-programmed
reduction (TPR) measurement, therefore, the reduction temperature of the
catalysts was determined at 623 K.
(2) Both metallic copper (Cu0) and Cu+ can be detected from sample rCu4, rCu6 and
rCu8 and only Cu+ species was detected in rCu2 sample from XRD analysis and
Auger electron spectrum(AES). The AES results also indicate that the ratio of
Cu0/Cu+ of rCu4, rCu6 and rCu8 samples are very close. The actual catalytic sites
for hydrogenation reaction will be discussed in chapter 7.
(3) Crystalline ZnO was detected from sample rCu2, rCu4 and rCu6 by XRD analysis.
The chemical state of zinc element analysis from the XPS measurement shows that
the ZnO phase remains unchanged before and after reduction.
(4) ZrO2 is present in the amorphous phase as its crystalline phase cannot be detected
from the XRD analysis, while the XPS analysis shows the existence of ZrO2.
(5) The rCu4 provides the largest BET surface area (156 m2/g) among the catalysts
from the N2 adsorption/desorption process. However, the rCu8 presents the
largest specific copper surface area, which is 47.25 m2/g from the N2O dissociative
measurement.
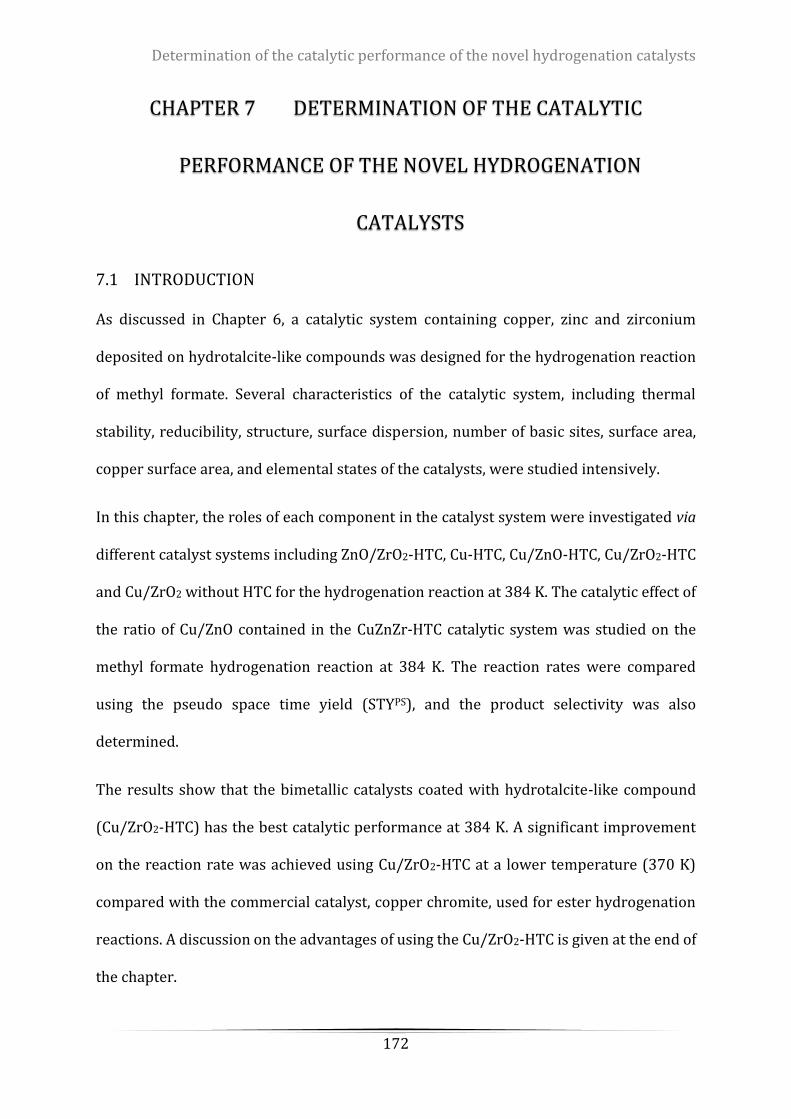
Determination of the catalytic performance of the novel hydrogenation catalysts
172
CHAPTER 7 DETERMINATION OF THE CATALYTIC
PERFORMANCE OF THE NOVEL HYDROGENATION
CATALYSTS
7.1 INTRODUCTION
As discussed in Chapter 6, a catalytic system containing copper, zinc and zirconium
deposited on hydrotalcite-like compounds was designed for the hydrogenation reaction
of methyl formate. Several characteristics of the catalytic system, including thermal
stability, reducibility, structure, surface dispersion, number of basic sites, surface area,
copper surface area, and elemental states of the catalysts, were studied intensively.
In this chapter, the roles of each component in the catalyst system were investigated via
different catalyst systems including ZnO/ZrO2-HTC, Cu-HTC, Cu/ZnO-HTC, Cu/ZrO2-HTC
and Cu/ZrO2 without HTC for the hydrogenation reaction at 384 K. The catalytic effect of
the ratio of Cu/ZnO contained in the CuZnZr-HTC catalytic system was studied on the
methyl formate hydrogenation reaction at 384 K. The reaction rates were compared
using the pseudo space time yield (STYPS), and the product selectivity was also
determined.
The results show that the bimetallic catalysts coated with hydrotalcite-like compound
(Cu/ZrO2-HTC) has the best catalytic performance at 384 K. A significant improvement
on the reaction rate was achieved using Cu/ZrO2-HTC at a lower temperature (370 K)
compared with the commercial catalyst, copper chromite, used for ester hydrogenation
reactions. A discussion on the advantages of using the Cu/ZrO2-HTC is given at the end of
the chapter.
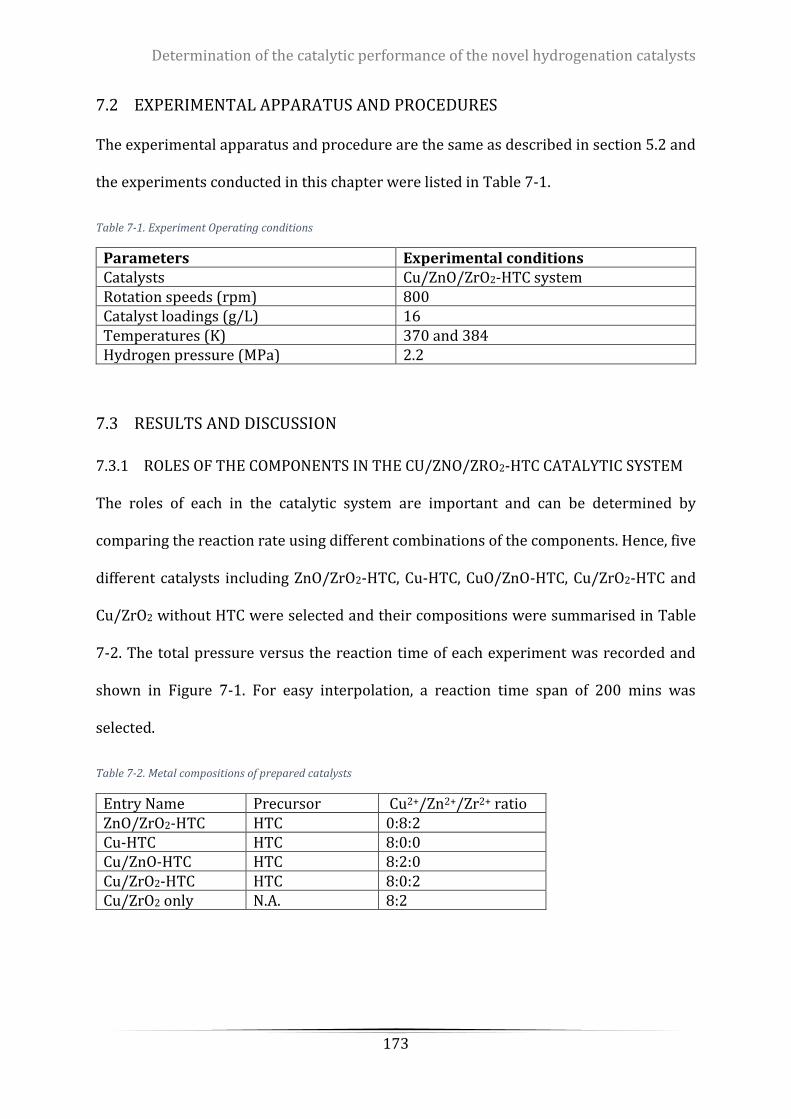
Determination of the catalytic performance of the novel hydrogenation catalysts
173
7.2 EXPERIMENTAL APPARATUS AND PROCEDURES
The experimental apparatus and procedure are the same as described in section 5.2 and
the experiments conducted in this chapter were listed in Table 7-1.
Table 7-1. Experiment Operating conditions
Parameters Experimental conditions Catalysts Cu/ZnO/ZrO2-HTC system Rotation speeds (rpm) 800 Catalyst loadings (g/L) 16 Temperatures (K) 370 and 384 Hydrogen pressure (MPa) 2.2
7.3 RESULTS AND DISCUSSION
7.3.1 ROLES OF THE COMPONENTS IN THE CU/ZNO/ZRO2-HTC CATALYTIC SYSTEM
The roles of each in the catalytic system are important and can be determined by
comparing the reaction rate using different combinations of the components. Hence, five
different catalysts including ZnO/ZrO2-HTC, Cu-HTC, CuO/ZnO-HTC, Cu/ZrO2-HTC and
Cu/ZrO2 without HTC were selected and their compositions were summarised in Table
7-2. The total pressure versus the reaction time of each experiment was recorded and
shown in Figure 7-1. For easy interpolation, a reaction time span of 200 mins was
selected.
Table 7-2. Metal compositions of prepared catalysts
Entry Name Precursor Cu2+/Zn2+/Zr2+ ratio ZnO/ZrO2-HTC HTC 0:8:2 Cu-HTC HTC 8:0:0 Cu/ZnO-HTC HTC 8:2:0 Cu/ZrO2-HTC HTC 8:0:2 Cu/ZrO2 only N.A. 8:2
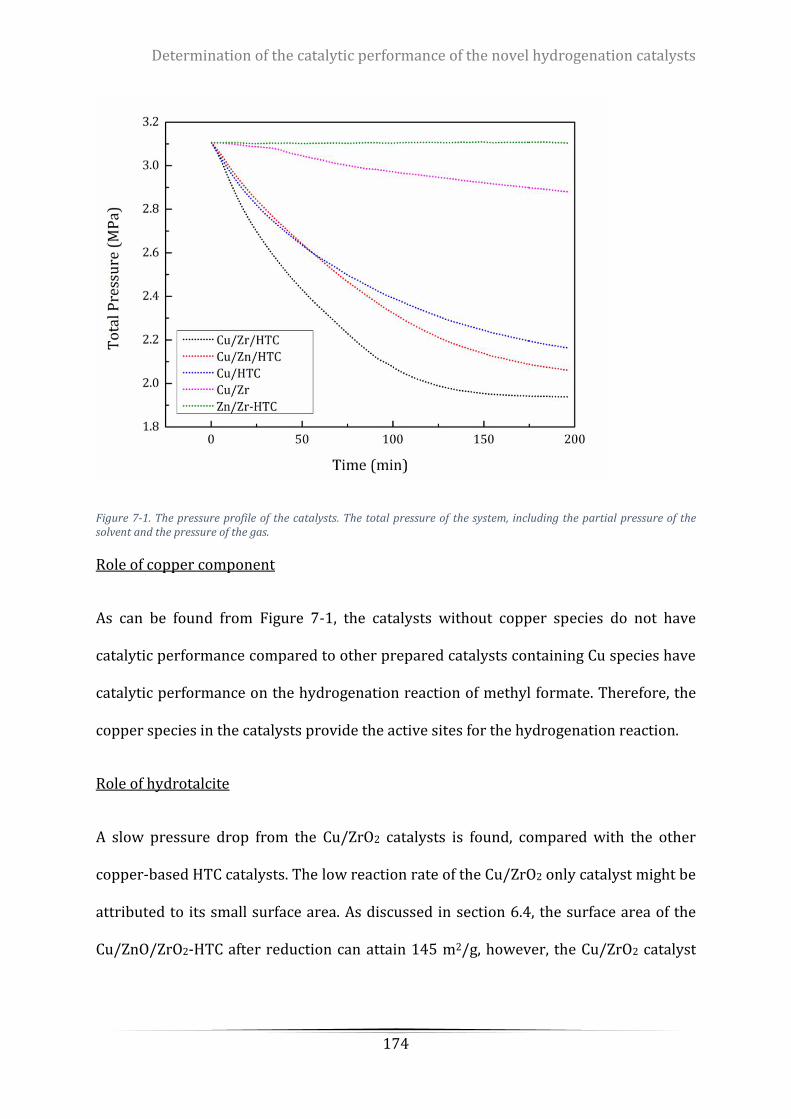
Determination of the catalytic performance of the novel hydrogenation catalysts
174
Figure 7-1. The pressure profile of the catalysts. The total pressure of the system, including the partial pressure of the solvent and the pressure of the gas.
Role of copper component
As can be found from Figure 7-1, the catalysts without copper species do not have
catalytic performance compared to other prepared catalysts containing Cu species have
catalytic performance on the hydrogenation reaction of methyl formate. Therefore, the
copper species in the catalysts provide the active sites for the hydrogenation reaction.
Role of hydrotalcite
A slow pressure drop from the Cu/ZrO2 catalysts is found, compared with the other
copper-based HTC catalysts. The low reaction rate of the Cu/ZrO2 only catalyst might be
attributed to its small surface area. As discussed in section 6.4, the surface area of the
Cu/ZnO/ZrO2-HTC after reduction can attain 145 m2/g, however, the Cu/ZrO2 catalyst
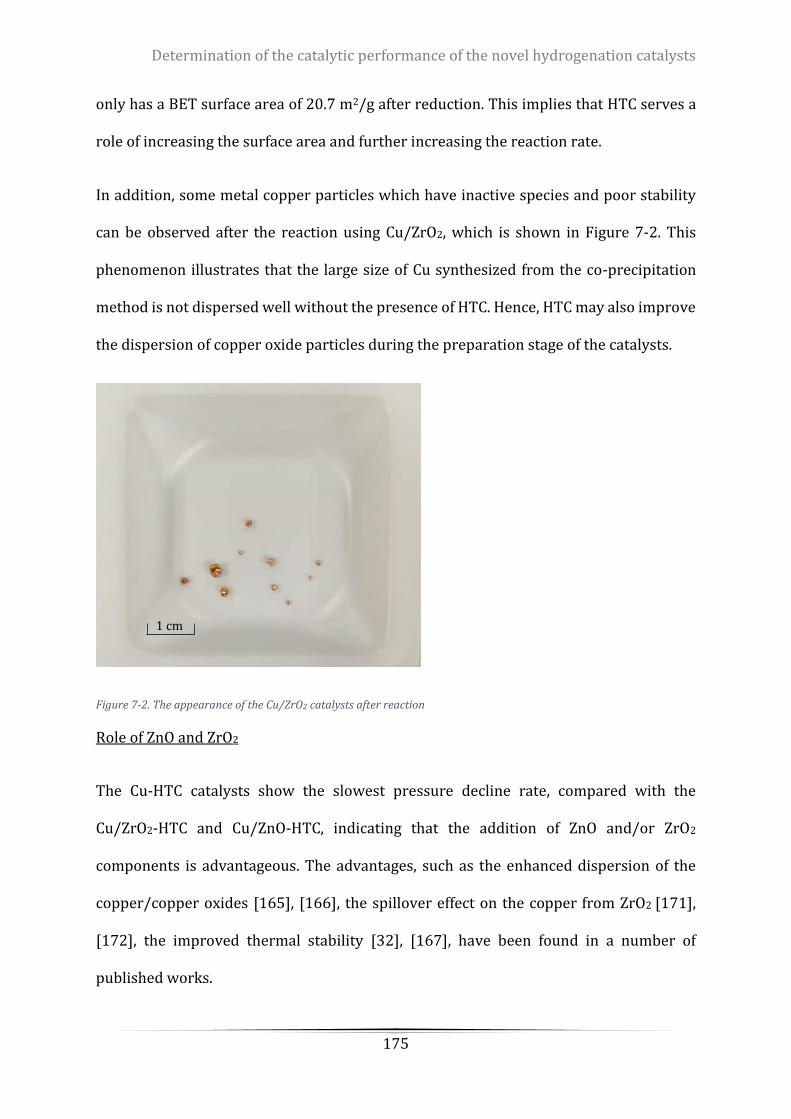
Determination of the catalytic performance of the novel hydrogenation catalysts
175
only has a BET surface area of 20.7 m2/g after reduction. This implies that HTC serves a
role of increasing the surface area and further increasing the reaction rate.
In addition, some metal copper particles which have inactive species and poor stability
can be observed after the reaction using Cu/ZrO2, which is shown in Figure 7-2. This
phenomenon illustrates that the large size of Cu synthesized from the co-precipitation
method is not dispersed well without the presence of HTC. Hence, HTC may also improve
the dispersion of copper oxide particles during the preparation stage of the catalysts.
Figure 7-2. The appearance of the Cu/ZrO2 catalysts after reaction
Role of ZnO and ZrO2
The Cu-HTC catalysts show the slowest pressure decline rate, compared with the
Cu/ZrO2-HTC and Cu/ZnO-HTC, indicating that the addition of ZnO and/or ZrO2
components is advantageous. The advantages, such as the enhanced dispersion of the
copper/copper oxides [165], [166], the spillover effect on the copper from ZrO2 [171],
[172], the improved thermal stability [32], [167], have been found in a number of
published works.
1 cm
Determination of the catalytic performance of the novel hydrogenation catalysts
176
In a comparison between the Cu/ZrO2-HTC and the Cu/ZnO-HTC catalysts, a better
performance was obtained using the Cu/ZrO2-HTC catalysts. This suggests that the
function of ZrO2 may outweigh ZnO when HTC is present. This can be explained by the
‘spillover’ effect from the modified ZrO2 in which ZrO2 may improve the mass transfer
between the hydrogen molecules and the surface of the catalysts, thus further increasing
the reaction rate. In addition, the dispersion role provided by the ZnO may be
compromised by the HTC to some extent as the HTC may be able to provide large surface
area and also improves the copper dispersion.
7.3.2 BY PRODUCTS FORMATION
As indicated from section 7.3.1, no pressure decline can be found using the Zn/Zr-HTC
catalysts, implying that there is no reaction occurring. The results are further confirmed
through the GC analysis as no methanol was detected in both liquid samples and gas
samples.
For the gas products produced from the hydrogenation reaction using the Cu/ZnO/ZrO2-
HTC catalysts, only a trace amount of dimethyl ether and carbon monoxide were detected
by GC, which is similar to the commercialized catalyst, copper chromite. As explained in
Chapter 5, two possible side reactions may occur, including a reversed decarbonylation
reaction (shown in Reaction 7-1) where CO is produced and a dehydration reaction of
methanol (Reaction 7-2) where dimethyl ether and water are generated. Since the
amounts of by-products are small and can be neglected, the selectivity of the
hydrogenation reaction using the Cu/ZnO/ZrO2-HTC catalysts is 99.9%.
Reaction 7-1. Decarbonylation reaction of methyl formate
CH3OCOH ⇌ CH3OH + CO ∆H = 16.8 kJ/mol
Reaction 7-2. Dehydration of methanol
Determination of the catalytic performance of the novel hydrogenation catalysts
177
2CH3OH ⇌ H2O + CH3OCH3 ∆H = 51.3 kJ/mol
In addition, some published work correlates the basic sites of catalysts with the
selectivity of products while they stated that the more basic sites of the catalysts, the
higher selectivity of the desired products. However, there is no evidence in our study
showing a correlation between these two factors.
7.3.3 THE CATALYTIC EFFECT OF THE RATIO OF CU/ZNO ON THE REACTION
EFFECTS ON THE REACTION RATE AND THE TIME TO REACH EQUILIBRIUM
The liquid and gas products using the catalysts of rCu2, rCu4, rCu6 and rCu8 were
analysed via the GC, and the compositions of rCu2, rCu4, rCu6 and rCu8 were given in
Table 6-1. The concentration profile of the product methanol and the reactant hydrogen
over the reaction time are shown in Figure 7-3 and Figure 7-4, respectively. Since the
experimental system is a batch reactor, equilibrium is finally attained at ‘long’ times.
Therefore, the overall time to achieve the equilibrium is used to determine the reaction
rate, which are listed in Table 7-3. In addition, in order to compare the catalytic
performance, a new term called the pseudo-space time yield (STYPS), which is defined as
the amount of methanol produced per gram of catalysts in the first 100 minutes, is given
in Equation 7-1. The STYPS of each catalyst is also provided in Table 7-3.
From Figure 7-3 and Figure 7-4, it can be found that using the rCu2 catalyst takes the
longest time to reach the equilibrium. Even after 600 minutes the reaction only reaches
half of its equilibrium conversion. With increasing the copper contents in the catalysts,
the time to achieve the equilibrium is reduced significantly, and the reaction is
accelerated correspondingly. It is observed that the reaction using the rCu4 and the rCu6
has a similar rate, but the reaction is accelerated dramatically when using the rCu8
catalyst. From STYPS analysis, consistent results can also be found. The real-time reaction
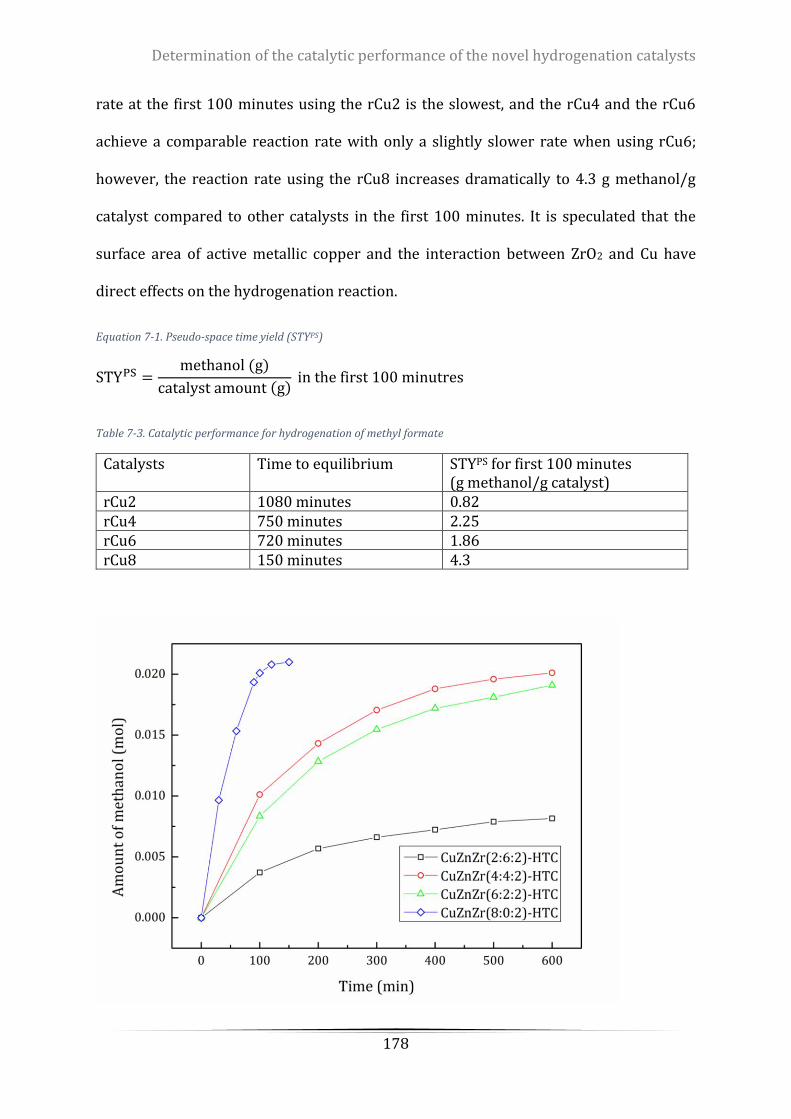
Determination of the catalytic performance of the novel hydrogenation catalysts
178
rate at the first 100 minutes using the rCu2 is the slowest, and the rCu4 and the rCu6
achieve a comparable reaction rate with only a slightly slower rate when using rCu6;
however, the reaction rate using the rCu8 increases dramatically to 4.3 g methanol/g
catalyst compared to other catalysts in the first 100 minutes. It is speculated that the
surface area of active metallic copper and the interaction between ZrO2 and Cu have
direct effects on the hydrogenation reaction.
Equation 7-1. Pseudo-space time yield (STYPS)
STYPS =methanol (g)
catalyst amount (g) in the first 100 minutres
Table 7-3. Catalytic performance for hydrogenation of methyl formate
Catalysts Time to equilibrium STYPS for first 100 minutes (g methanol/g catalyst)
rCu2 1080 minutes 0.82 rCu4 750 minutes 2.25 rCu6 720 minutes 1.86 rCu8 150 minutes 4.3
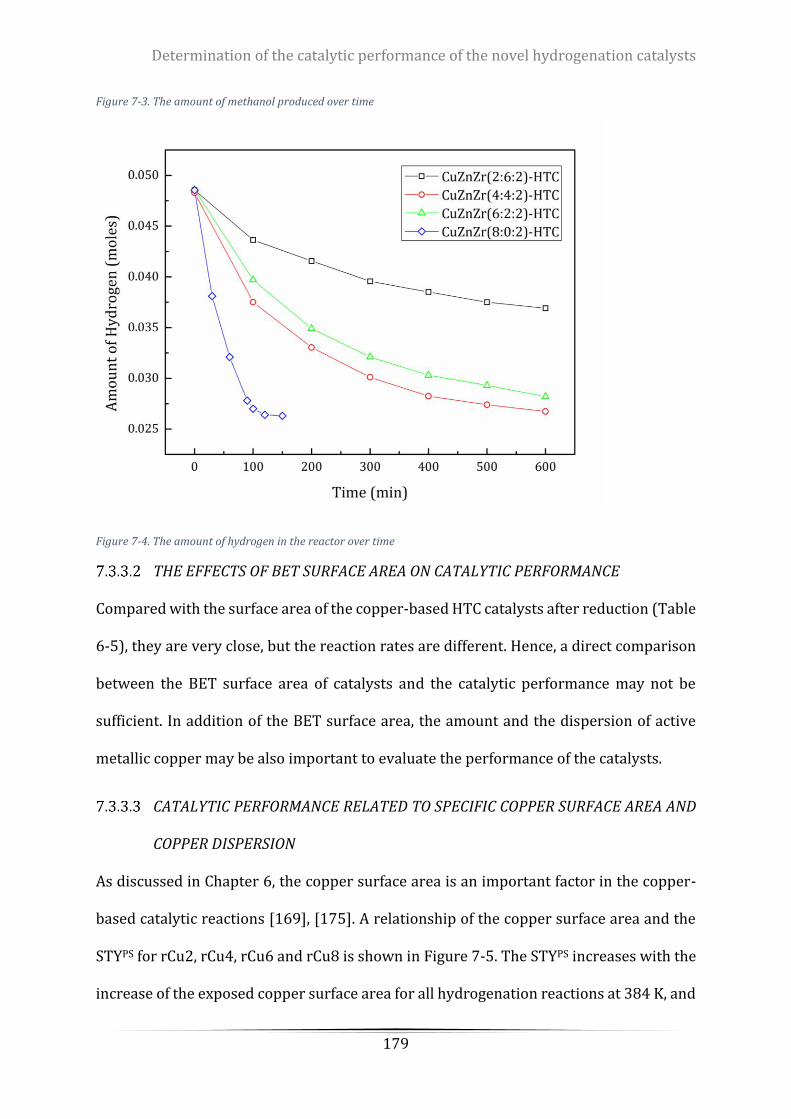
Determination of the catalytic performance of the novel hydrogenation catalysts
179
Figure 7-3. The amount of methanol produced over time
Figure 7-4. The amount of hydrogen in the reactor over time
THE EFFECTS OF BET SURFACE AREA ON CATALYTIC PERFORMANCE
Compared with the surface area of the copper-based HTC catalysts after reduction (Table
6-5), they are very close, but the reaction rates are different. Hence, a direct comparison
between the BET surface area of catalysts and the catalytic performance may not be
sufficient. In addition of the BET surface area, the amount and the dispersion of active
metallic copper may be also important to evaluate the performance of the catalysts.
CATALYTIC PERFORMANCE RELATED TO SPECIFIC COPPER SURFACE AREA AND
COPPER DISPERSION
As discussed in Chapter 6, the copper surface area is an important factor in the copper-
based catalytic reactions [169], [175]. A relationship of the copper surface area and the
STYPS for rCu2, rCu4, rCu6 and rCu8 is shown in Figure 7-5. The STYPS increases with the
increase of the exposed copper surface area for all hydrogenation reactions at 384 K, and
Determination of the catalytic performance of the novel hydrogenation catalysts
180
a nearly linear relationship can be found. This is probably because a large value of SCu
provides more active sites, which in turn have more opportunities to adsorb and store H2.
The adsorbed H2 is further dissociated in the form of atomic hydrogen, and transported
from Cu and/or ZnO to ZrO2 via ‘spillover’ effect [32], [83]. It is noted that rCu8 provides
the maximum copper surface area and STYPS, however there is no ZnO contained in the
catalytic system, which indirectly indicates that the Cu has more profound ‘spillover’
effects than that of ZnO. Therefore, to improve the catalytic activity for the hydrogenation
reaction of methyl formate, the copper-zirconium catalysts obtained using the current
simple co-precipitation method may be optimized by changing the ratio of copper and
zirconium in the future work.
In addition, it is also found that the prepared catalysts using the simple co-precipitation
method are stable and the random error is minimal, since the N2O dissociative analysis
shows that the dispersion of metallic copper among the rCu4, rCu6 and rCu8 is very close
when the designed mass ratio of Cu/Zn is above 1 (rCu2 does not contain metallic copper).
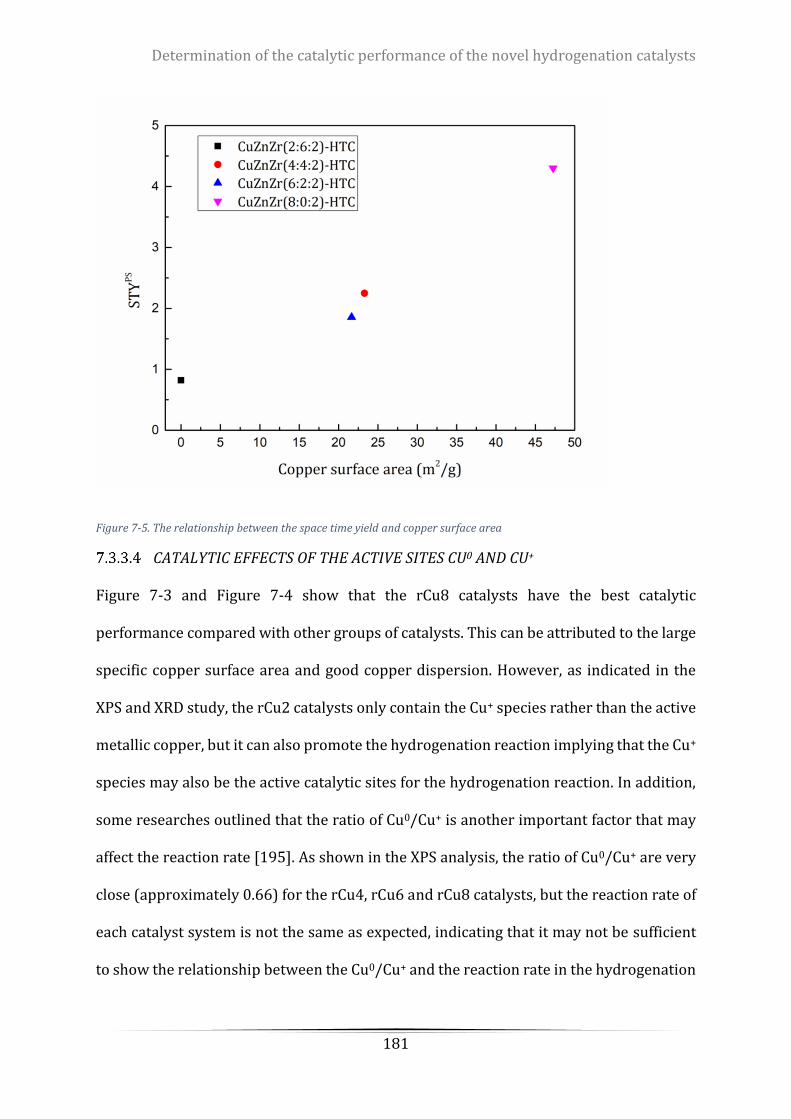
Determination of the catalytic performance of the novel hydrogenation catalysts
181
Figure 7-5. The relationship between the space time yield and copper surface area
CATALYTIC EFFECTS OF THE ACTIVE SITES CU0 AND CU+
Figure 7-3 and Figure 7-4 show that the rCu8 catalysts have the best catalytic
performance compared with other groups of catalysts. This can be attributed to the large
specific copper surface area and good copper dispersion. However, as indicated in the
XPS and XRD study, the rCu2 catalysts only contain the Cu+ species rather than the active
metallic copper, but it can also promote the hydrogenation reaction implying that the Cu+
species may also be the active catalytic sites for the hydrogenation reaction. In addition,
some researches outlined that the ratio of Cu0/Cu+ is another important factor that may
affect the reaction rate [195]. As shown in the XPS analysis, the ratio of Cu0/Cu+ are very
close (approximately 0.66) for the rCu4, rCu6 and rCu8 catalysts, but the reaction rate of
each catalyst system is not the same as expected, indicating that it may not be sufficient
to show the relationship between the Cu0/Cu+ and the reaction rate in the hydrogenation

Determination of the catalytic performance of the novel hydrogenation catalysts
182
reaction. Hence, both Cu+ and Cu0 are the active sites in the current catalyst system to
accelerate the hydrogenation reaction.
7.4 Comparison of Cu/ZrO2-HTC catalysts with copper chromite
To evaluate the commercial potential of the developed catalyst system, it is important to
compare the best catalysts from the Cu/ZnO/ZrO2-HTC catalytic system with copper
chromite, which is one of the most common catalysts used for the ester hydrogenation
reactions. A comparison including the characteristics of catalysts and the catalytic
performance between rCu8 and copper chromite was conducted for the hydrogenation
reactions of methyl formate at 370 K and 384 K.
7.4.1 THE CHARACTERISTICS OF CATALYSTS
7.4.1.1 The surface area and dispersion of active metallic copper
Table 7-4 summarises the physicochemical properties of copper chromite and rCu8 (or
named CuZr(8:2)-HTC) catalysts. It is found that the BET surface area and the Cu surface
area are both very similar; however, the copper dispersion of copper chromite is less than
the rCu8 catalyst although SEM-EDX shows that copper chromite has larger surface
compositions of copper elements (given in Table 7-5). Considering that both copper
surface area and copper dispersion may promote the hydrogenation reactions, it is
expected that rCu8 can perform better for the methyl formate hydrogenation reaction
under our investigated temperatures and pressures.
Table 7-4. Physicochemical properties of copper chromite and Cu8 catalysts
Sample BET specific surface area
(m2/g)
Pore volume (cm3/g)
Cu surface area b
(m2/g)
Cu dispersionb
(%) Before reduction
After reduction a
Before reduction
After reduction a
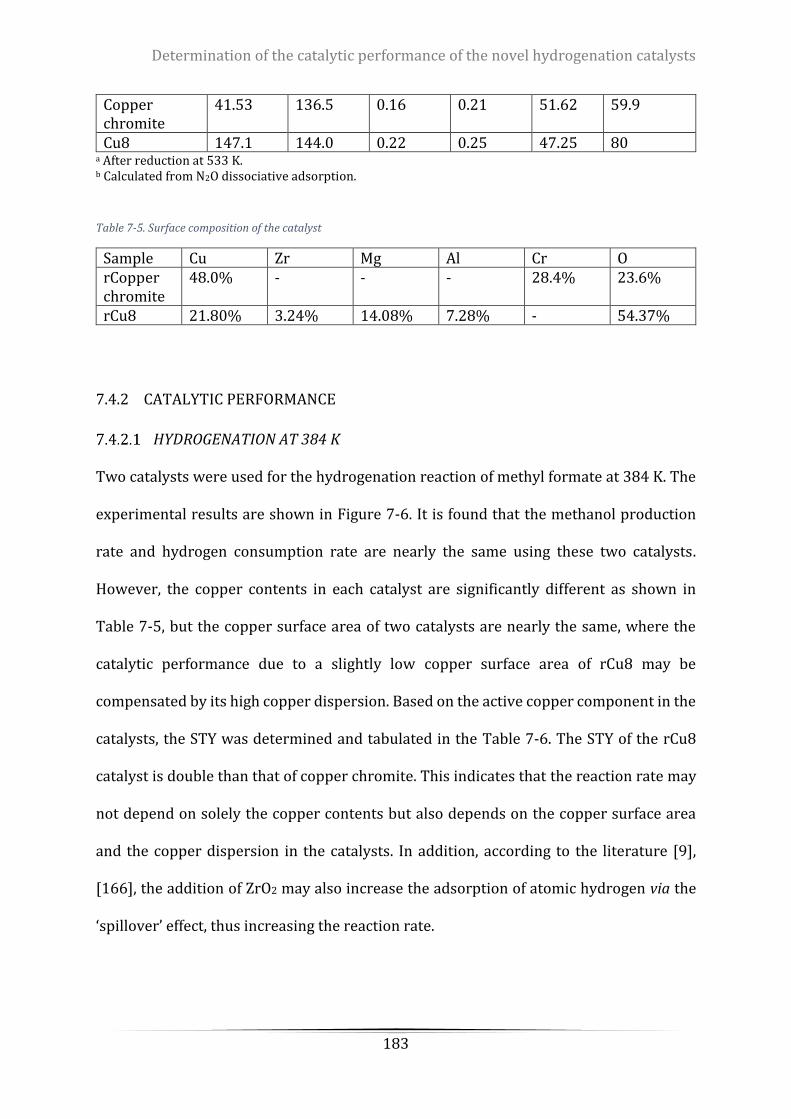
Determination of the catalytic performance of the novel hydrogenation catalysts
183
Copper chromite
41.53 136.5 0.16 0.21 51.62 59.9
Cu8 147.1 144.0 0.22 0.25 47.25 80 a After reduction at 533 K. b Calculated from N2O dissociative adsorption.
Table 7-5. Surface composition of the catalyst
Sample Cu Zr Mg Al Cr O rCopper chromite
48.0% - - - 28.4% 23.6%
rCu8 21.80% 3.24% 14.08% 7.28% - 54.37%
7.4.2 CATALYTIC PERFORMANCE
HYDROGENATION AT 384 K
Two catalysts were used for the hydrogenation reaction of methyl formate at 384 K. The
experimental results are shown in Figure 7-6. It is found that the methanol production
rate and hydrogen consumption rate are nearly the same using these two catalysts.
However, the copper contents in each catalyst are significantly different as shown in
Table 7-5, but the copper surface area of two catalysts are nearly the same, where the
catalytic performance due to a slightly low copper surface area of rCu8 may be
compensated by its high copper dispersion. Based on the active copper component in the
catalysts, the STY was determined and tabulated in the Table 7-6. The STY of the rCu8
catalyst is double than that of copper chromite. This indicates that the reaction rate may
not depend on solely the copper contents but also depends on the copper surface area
and the copper dispersion in the catalysts. In addition, according to the literature [9],
[166], the addition of ZrO2 may also increase the adsorption of atomic hydrogen via the
‘spillover’ effect, thus increasing the reaction rate.
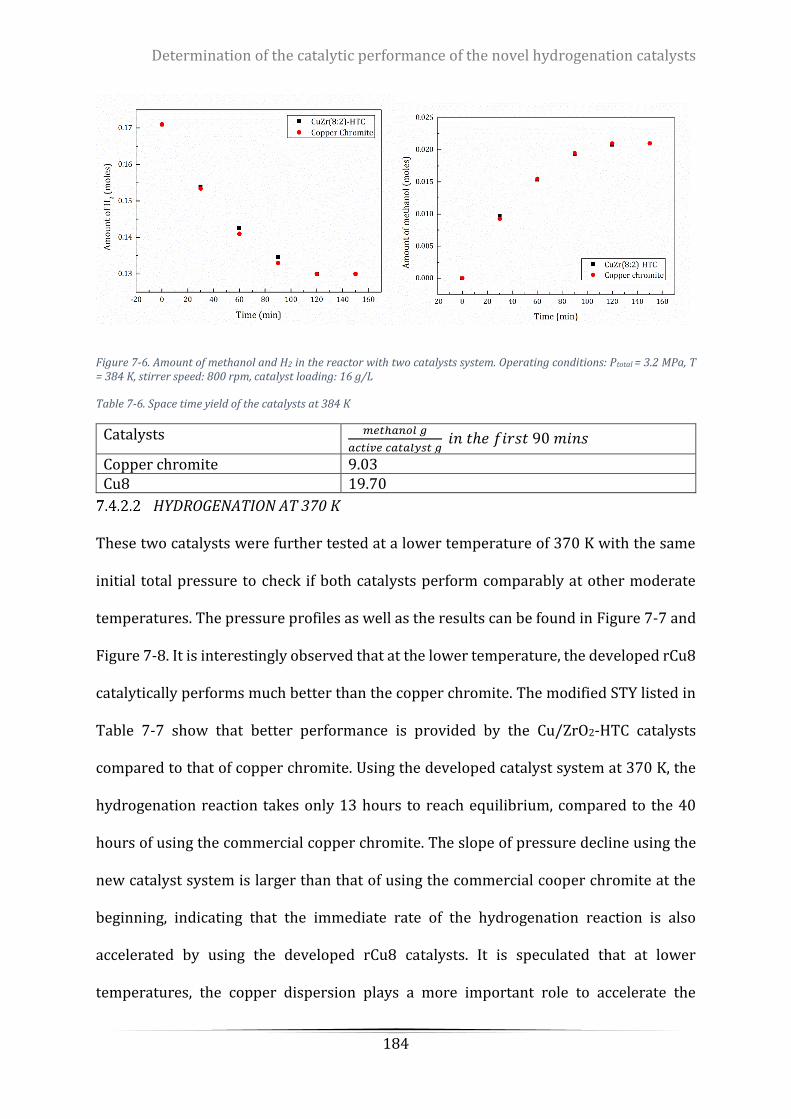
Determination of the catalytic performance of the novel hydrogenation catalysts
184
Figure 7-6. Amount of methanol and H2 in the reactor with two catalysts system. Operating conditions: Ptotal = 3.2 MPa, T = 384 K, stirrer speed: 800 rpm, catalyst loading: 16 g/L
Table 7-6. Space time yield of the catalysts at 384 K
Catalysts 𝑚𝑒𝑡ℎ𝑎𝑛𝑜𝑙 𝑔
𝑎𝑐𝑡𝑖𝑣𝑒 𝑐𝑎𝑡𝑎𝑙𝑦𝑠𝑡 𝑔 𝑖𝑛 𝑡ℎ𝑒 𝑓𝑖𝑟𝑠𝑡 90 𝑚𝑖𝑛𝑠
Copper chromite 9.03 Cu8 19.70
HYDROGENATION AT 370 K
These two catalysts were further tested at a lower temperature of 370 K with the same
initial total pressure to check if both catalysts perform comparably at other moderate
temperatures. The pressure profiles as well as the results can be found in Figure 7-7 and
Figure 7-8. It is interestingly observed that at the lower temperature, the developed rCu8
catalytically performs much better than the copper chromite. The modified STY listed in
Table 7-7 show that better performance is provided by the Cu/ZrO2-HTC catalysts
compared to that of copper chromite. Using the developed catalyst system at 370 K, the
hydrogenation reaction takes only 13 hours to reach equilibrium, compared to the 40
hours of using the commercial copper chromite. The slope of pressure decline using the
new catalyst system is larger than that of using the commercial cooper chromite at the
beginning, indicating that the immediate rate of the hydrogenation reaction is also
accelerated by using the developed rCu8 catalysts. It is speculated that at lower
temperatures, the copper dispersion plays a more important role to accelerate the
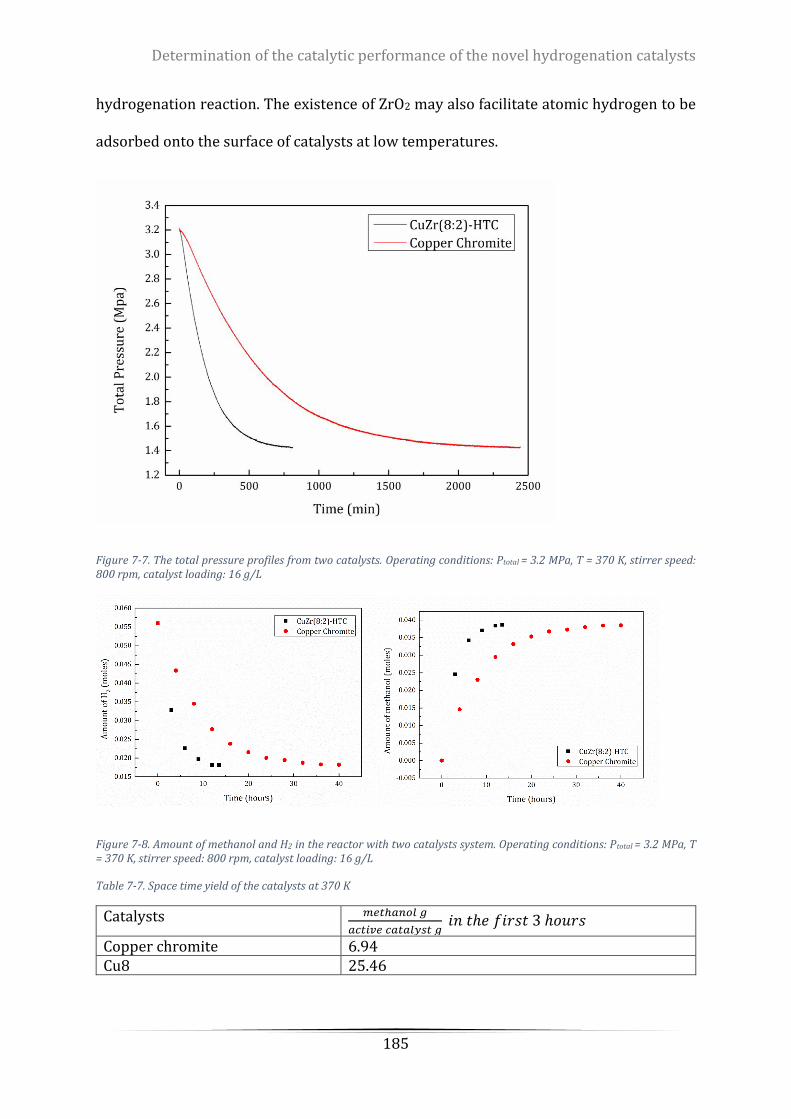
Determination of the catalytic performance of the novel hydrogenation catalysts
185
hydrogenation reaction. The existence of ZrO2 may also facilitate atomic hydrogen to be
adsorbed onto the surface of catalysts at low temperatures.
Figure 7-7. The total pressure profiles from two catalysts. Operating conditions: Ptotal = 3.2 MPa, T = 370 K, stirrer speed: 800 rpm, catalyst loading: 16 g/L
Figure 7-8. Amount of methanol and H2 in the reactor with two catalysts system. Operating conditions: Ptotal = 3.2 MPa, T = 370 K, stirrer speed: 800 rpm, catalyst loading: 16 g/L
Table 7-7. Space time yield of the catalysts at 370 K
Catalysts 𝑚𝑒𝑡ℎ𝑎𝑛𝑜𝑙 𝑔
𝑎𝑐𝑡𝑖𝑣𝑒 𝑐𝑎𝑡𝑎𝑙𝑦𝑠𝑡 𝑔 𝑖𝑛 𝑡ℎ𝑒 𝑓𝑖𝑟𝑠𝑡 3 ℎ𝑜𝑢𝑟𝑠
Copper chromite 6.94 Cu8 25.46

Determination of the catalytic performance of the novel hydrogenation catalysts
186
7.5 CONCLUSIONS
The novel Cu/ZnO/ZrO2-HTC catalysts were prepared using a simple co-precipitation
method and tested for the hydrogenation reaction of methyl formate to produce
methanol. The roles of each element in the catalytical system were identified by
comparing different compositions of the catalytic system. The catalytic performance of
different ratios of Cu/ZnO in the Cu/ZnO/ZrO2-HTC catalytic system was evaluated at 384
K and a pseudo-STY (STYPS) term was used to compare the reaction rate. rCu8 was
selected as the best catalytic system, and was further compared with the copper chromite,
which is a commercialised catalyst used for the hydrogenation reaction. Based on the
study, the following conclusions can be drawn:
(1) Copper species Cu0 and Cu+ are the active catalytic sites in the catalyst to promote
the hydrogenation reaction.
(2) The reaction rates can be significantly improved by incorporating the
Cu/ZnO/ZrO2 onto the HTC. HTC cannot only increase the total surface area of
catalysts, but it also helps increase copper dispersion on the surface of catalysts.
(3) The addition of ZnO and ZrO2 can increase the reaction rate to some extent,
depending on the catalyst compositions.
(4) 99.9 % selectivity can be obtained for all the prepared catalysts and a maximum
STYPS of 4.3 g methanol/g catalysts can be achieved when rCu8 is used.
(5) The STYPS is linearly correlated with the specific copper surface area in the
hydrogenation reaction, which has direct effect on the hydrogenation reaction
rate.
(6) The copper contents in the catalyst may not be a determining factor to evaluate
the catalytic performance of the hydrogenation reactions. The copper surface area
Determination of the catalytic performance of the novel hydrogenation catalysts
187
and copper dispersion resulting from ZrO2 play significant roles in promoting the
hydrogenation reactions. The possible reasons might be it has profound hydrogen
spillover effects which facilitate the transport of atomic hydrogen on the catalyst
surface, thus increasing the reaction rate.
(7) Through characteristic analysis and experimental hydrogenation reactions for all
prepared catalytic systems, rCu8 is the best catalyst. The catalysts were further
compared with a conventional hydrogenation catalyst, copper chromite. The rCu8
shows a better catalytic performance at moderate temperatures. The reaction rate
catalyzed by rCu8 is three times faster than that using copper chromite at 370 K.
A possible reason is that it enhances the hydrogen adsorption step on the catalyst
surface due to the existence of ZrO2.
Conclusions and recommendations
188
CHAPTER 8 CONCLUSIONS AND RECOMMENDATIONS
In the present study, a thorough literature review on possible effective methanol
synthesis pathways was conducted and presented in chapter 2, and a methanol synthesis
via methyl formate at moderate temperatures and pressures was selected for further
study. Literature review on solubility of reactant gases in reactant liquids were also
included in chapter 2. In chapter 3, materials and methodologies used and applied in the
study were explained. In chapter 4, an experimental apparatus was designed and set up
to study the vapour-liquid equilibrium of four systems containing CO-methanol, CO-
methyl formate, H2-methanol and H2-methyl formate. The results show that the
solubilities of CO and H2 in methanol and methyl formate increase with increasing
temperature and pressures possibly due to the endothermic processes and strong bond
interaction between gas molecules. A phi-phi approach using Peng-Robinson equations
of states was used to regress the experiments, and the binary interaction parameter 𝑘𝑖𝑗
for the four systems were regressed from the experimental data. The results indicate that
the binary interaction parameters of CO in methanol and methyl formate are temperature
independent, whereas the binary interaction parameters of H2 in methanol and methyl
formate are the function of temperature. In chapter 5, both carbonylation reaction and
hydrogenation reaction were preliminary studied and it was found that the
hydrogenation reaction is the rate determining step; therefore, the effects of agitation
speed, catalyst loadings and temperatures on the hydrogenation reaction rates using
copper chromite, a commercial catalyst, were investigated. A possible reaction
mechanism was proposed to evaluate the reaction kinetics parameters using the least
squares minimisation in MATLAB. Results show that the hydrogen adsorption and
dissociation is the slowest elementary step with the smallest reaction rate constant. This

Conclusions and recommendations
189
mechanism was further validated using the evaluated parameters to predict the
experiments conducted at three different pressures. In chapter 6, a novel catalyst system
consisting of copper, zinc oxide, zirconium oxide and hydrotalcite-like compounds was
designed and characterised using a number of techniques, including TPR, XRD, SEM, TGA,
BET, TPD-CO2, XPS and AES. The catalytic performance of the catalysts on the
hydrogeneration reaction was evaluated and presented in chapter 7. Results show that
the Cu/ZrO2-HTC provides the best performance. A comparison between the Cu/ZrO2-
HTC and copper chromite was thereafter conducted. It is found that the Cu/ZrO2-HTC can
improve the hydrogenation reaction rate three times at moderate temperatures, which
may because the addition of ZrO2 facilitates the transport and adsorption of atomic
hydrogen on the catalyst via the ‘spillover’ effect.
Based on the current discoveries, further experiments on the modifications of the novel
catalysts should be conducted, such as varying the ratio of copper and zirconium,
changing the hydrotalcite-like compounds percentage in the catalyst. In addition, other
catalysts preparation methods, such as sol-gel method, can be employed to compare the
catalysts performance on the hydrogenation reaction. Moreover, the investigation of
integrating the carbonylation reaction with the hydrogenation reaction using this novel
catalyst is worthwhile to check if this novel catalyst can be compatible with the different
catalyst used for the carbonylation reaction, and the total improvement can be made for
the two-step methanol synthesis process using the novel catalyst.
In future, such novel catalysts composed of copper, zinc and zirconium with optimised
ratio can be potentially used in the methanol synthesis industry at moderate operating
conditions to reduce the energy consumption significantly and further save operating
costs.
References
190
CHAPTER 9 REFERENCES
[1] “Methanol fuel: History, production & uses,” 2015. [Online]. Available:
https://allaboutuae.wordpress.com/2015/07/30/methanol-fuel-history-
production-uses/. [Accessed: 15-Jun-2016].
[2] A. Dasgupta, The science of drinking : how alcohol affects your body and mind.
Rowman & Littlefield Publishers, 2011.
[3] G. Bozzano and F. Manenti, “Efficient methanol synthesis: Perspectives,
technologies and optimization strategies,” Prog. Energy Combust. Sci., vol. 56, pp.
71–105, 2016.
[4] G. A. Somorjai, “The Catalytic Hydrogenation of Carbon Monoxide. The Formation
of C 1 Hydrocarbons,” Catal. Rev., vol. 23, no. 1–2, pp. 189–202, Jan. 1981.
[5] S. Lee, Methanol synthesis technology. CRC Press, 1990.
[6] “History of methanol synthesis,” Supermethanol. [Online]. Available:
http://www.supermethanol.eu/index.php?r=methanol_synthesis. [Accessed: 28-
Jul-2017].
[7] D. Sheldon, “Methanol Production - A Technical History,” Johnson Matthey Technol.
Rev., vol. 61, no. 3, pp. 172–182, Jul. 2017.
[8] “The methanol industry,” Methanol Institute. [Online]. Available:
http://www.methanol.org/the-methanol-industry/. [Accessed: 15-Jul-2017].
[9] A. Galadima and O. Muraza, “From synthesis gas production to methanol synthesis
and potential upgrade to gasoline range hydrocarbons: A review,” J. Nat. Gas Sci.
Eng., vol. 25, pp. 303–316, 2015.
References
191
[10] M. Bertau, H. Offermanns, L. Plass, F. Schmidt, and W. Hans-Jürgen, Methanol: The
Basic Chemical and Energy Feedstock of the Future. 2014.
[11] “China Dominates Global Methanol Capacity and Demand, Surpassing North
America and Western Europe,” IHS Markit, 2016. [Online]. Available:
http://news.ihsmarkit.com/press-release/country-industry-forecasting-
media/china-dominates-global-methanol-capacity-and-demand. [Accessed: 20-
May-2017].
[12] “Global Methanol Demand Growth Driven by Methanol to Olefins as Chinese Thirst
for Chemical Supply Grows,” IHS Markit, 2017. [Online]. Available:
http://news.ihsmarkit.com/press-release/country-industry-forecasting-
media/global-methanol-demand-growth-driven-methanol-olefi. [Accessed: 20-
May-2017].
[13] D. Johnson, “Global Methanol Market Review,” IHS Inc., no. June, 2012.
[14] N. M. Juliet, “February, 2016,” no. February, pp. 1–16, 2016.
[15] Q. Zhu, “Analysis of Domestic and International Methanol Industry and Market,”
2015.
[16] “Methanol production sites,” Methanex, 2017. [Online]. Available:
https://www.methanex.com. [Accessed: 01-Nov-2017].
[17] “Products,” TogliattiAzot. [Online]. Available:
http://www.toaz.ru/eng/goods/index.phtml. [Accessed: 06-Oct-2017].
[18] “Products,” Spichem. [Online]. Available:
http://www.sipchem.com/en/products/basic-products. [Accessed: 16-Aug-2017].
References
192
[19] “Qatar Fuel Additives Company (QAFAC),” Additives Qatar Fuel. [Online]. Available:
https://www.qp.com.qa/en/QPActivities/Pages/SubsidiariesAndJointVenturesD
etails.aspx?aid=41. [Accessed: 01-Jun-2017].
[20] “SABIC worldwide,” SABIC. [Online]. Available: https://www.sabic.com/en.
[Accessed: 07-Nov-2017].
[21] “Record output at GPIC,” Gulf Industry. [Online]. Available:
http://www.gulfindustryonline.com/news/12332_Record-output-at-GPIC.html.
[Accessed: 14-Oct-2017].
[22] “Zagros Petrochemical Company ( Public Joint Stock ),” 2015.
[23] “PETRONAS Methanol (Labuan) Sdn Bhd.” [Online]. Available:
http://www.petronas.com/. [Accessed: 17-Nov-2017].
[24] “Oil exploration,” Omen Oil Company. [Online]. Available: http://www.oman-
oil.com/index.php. [Accessed: 17-Nov-2017].
[25] “Products,” Omen methanol. [Online]. Available: http://www.omanmethanol.com/.
[Accessed: 01-Nov-2017].
[26] “About methanol,” Atlantic methanol. [Online]. Available:
http://www.atlanticmethanol.com/about-us.html. [Accessed: 04-Jun-2017].
[27] “Methanol,” Metafrax. [Online]. Available: http://www.metafrax.ru/en/. [Accessed:
04-Nov-2017].
[28] M. Alvarado, “The changing face of the global methanol market,” IHS Chem. Week,
no. March, pp. 10–11, 2016.
[29] S. A. Ghoneim, R. A. El-Salamony, and S. A. El-Temtamy, “Review on Innovative
References
193
Catalytic Reforming of Natural Gas to Syngas,” World J. Eng. Technol., vol. 4, no.
February, pp. 116–139, 2016.
[30] N. Abatzoglou and C. Fauteux-Lefebvre, “Review of catalytic syngas production
through steam or dry reforming and partial oxidation of studied liquid compounds,”
Wiley Interdiscip. Rev. Energy Environ., vol. 5, no. 2, pp. 169–187, Mar. 2016.
[31] C. E. Efika, C. Wu, and P. T. Williams, “Syngas production from pyrolysis–catalytic
steam reforming of waste biomass in a continuous screw kiln reactor,” J. Anal. Appl.
Pyrolysis, vol. 95, pp. 87–94, May 2012.
[32] M. Bertau, H. Offermans, L. Plass, F. Schmidt, and H. J. Wernicke, Methanol: The Basic
Chemical and Energy Feedstock of the Future. 2014.
[33] D. Pakhare et al., “A review of dry (CO 2 ) reforming of methane over noble metal
catalysts,” Chem. Soc. Rev., vol. 43, no. 22, pp. 7813–7837, Feb. 2014.
[34] J. . Nielsen, J. Christiansen, and J. Lars, “Concepts in Syngas Manufacture,” Catal. Sci.
Ser., vol. 10, p. 379, 2011.
[35] Y. M. A. Welaya, M. M. El Gohary, and N. R. Ammar, “Steam and partial oxidation
reforming options for hydrogen production from fossil fuels for PEM fuel cells,”
Alexandria Eng. J., vol. 51, no. 2, pp. 69–75, Jun. 2012.
[36] P. Dahl, T. Christensen, S. Winter-Madsen, and S. King, “Proven autothermal
reforming technology for modern large- scale methanol plants,” Proven
autothermal reforming Technol. Mod. large-scale methanol plants, pp. 1–12, 2014.
[37] S. Sadaka, “Gasification, producer gas and syngas,” Agric. Nat. Resour., p. 8, 2010.
[38] S. T. Chaudhari, A. A. K. Dalai, and N. N. Bakhshi, “Production of Hydrogen and/or
References
194
Syngas (H2 + CO) via Steam Gasification of Biomass-Derived Chars,” 2003.
[39] P. C. A. Bruijnincx and B. M. Weckhuysen, “Shale Gas Revolution: An Opportunity
for the Production of Biobased Chemicals,” Angew. Chemie Int. Ed., vol. 52, no. 46,
pp. 11980–11987, Nov. 2013.
[40] G. E. King, “Thirty Years of Gas Shale Fracturing: What Have We Learned?,” SPE
Annu. Tech. Conf. Exhib., no. November, 2010.
[41] F. Trifiro, “From syngas to methanol and dimethyletherFrom syngas to methanol
and dimethylether,” 2009.
[42] J. a Liu, “Kinetics , catalysis and mechanism of methane steam reforming,” Chem.
Eng., vol. Master of, no. 82, pp. 311–328, 2006.
[43] P. Galindo Cifre and O. Badr, “Renewable hydrogen utilisation for the production of
methanol,” Energy Convers. Manag., vol. 48, no. 2, pp. 519–527, Feb. 2007.
[44] F. Manenti, S. Cieri, and M. Restelli, “Considerations on the steady-state modeling
of methanol synthesis fixed-bed reactor,” Chem. Eng. Sci., vol. 66, no. 2, pp. 152–162,
Jan. 2011.
[45] “Johnson Matthey Annual report,” Johnson Matthey. [Online]. Available:
http://www.matthey.com. [Accessed: 07-Jun-2017].
[46] A. L. Rippen, “Influence of Future Energy Supplies on Processing Procedures and
Costs,” J. Dairy Sci., vol. 62, no. 1, pp. 91–95, Jan. 1979.
[47] P. J. . Tijm, F. . Waller, and D. . Brown, “Methanol technology developments for the
new millennium,” Appl. Catal. A Gen., vol. 221, no. 1–2, pp. 275–282, Nov. 2001.
[48] A. Riaz, G. Zahedi, and J. J. Klemeš, “A review of cleaner production methods for the
References
195
manufacture of methanol,” J. Clean. Prod., vol. 57, pp. 19–37, Oct. 2013.
[49] “Methanol,” Haldor Topsoe. [Online]. Available:
https://www.topsoe.com/processes/methanol. [Accessed: 28-May-2017].
[50] P. L. Spath and D. C. Dayton, “Preliminary Screening -- Technical and Economic
Assessment of Synthesis Gas to Fuels and Chemicals with Emphasis on the
Potential for Biomass-Derived Syngas,” Natl. Renew. Energy Lab., no. December, pp.
1–160, 2003.
[51] K. Hirotani, H. Nakamura, and K. Shoji, “Optimum catalytic reactor design for
methanol synthesis with TEC MRF-Z® reactor,” Catal. Surv. from Japan, vol. 2, no.
1, pp. 99–106, 1998.
[52] A. M. Smith and R. Whyman, “Review of methods for the catalytic hydrogenation of
carboxamides,” Chem. Rev., vol. 114, no. 10, pp. 5477–5510, 2014.
[53] E. Balaraman, C. Gunanathan, J. Zhang, L. J. W. Shimon, and D. Milstein, “Efficient
hydrogenation of organic carbonates, carbamates and formates indicates
alternative routes to methanol based on CO2 and CO,” Nat. Chem., vol. 3, no. 8, pp.
609–614, 2011.
[54] “Lurgi MegaMethanolTM -Generating methanol on a large scale,” Air Liquide
Engineering and Construction, 2017. [Online]. Available:
https://www.engineering-airliquide.com/lurgi-megamethanol. [Accessed: 26-
Apr-2017].
[55] Lurgi, “MegaMethanol Brochure by engineering division of Lurgi Oel, Gas and
Chemie GmbH,” Lurgi, 2010.
References
196
[56] “Isothermal reactor,” The Linde Group, 2017. [Online]. Available:
http://www.linde-
engineering.com/en/process_plants/hydrogen_and_synthesis_gas_plants/gas_ge
neration/isothermal_reactor/index.html. [Accessed: 06-Sep-2017].
[57] “MRF-Z® Methanol Reactor,” Toyo Engineering Corporation, 2017. [Online].
Available: http://www.toyo-eng.com/jp/en/products/petrochmical/methanol/.
[Accessed: 15-Jul-2017].
[58] W.-H. Cheng and H. H. Kung, Methanol production and use. M. Dekker, 1994.
[59] “Methanol Plants,” Thyssenkrupp, 2016. [Online]. Available:
https://www.thyssenkrupp-industrial-solutions.com/en/products-and-
services/chemical-plants-and-processes/organic-chemicals-and-
petrochemicals/methanol-plants/. [Accessed: 16-May-2017].
[60] “Methanol Manufacturing Process,” Salalah methanol company, 2016. [Online].
Available: http://www.smc.co.om/SitePages/Methanol.aspx. [Accessed: 16-May-
2017].
[61] C. Higman, “Methanol Production by Gasification of Heavy Residues,” in Gasification:
An Alternative to Natural Gas, 1995.
[62] R. S. Sapienza, W. A. Slegeir, T. E. O’Hare, and D. Mahajan, “Low Temperature
catalysts for methanol production,” US4614749, 1986.
[63] R. S. Sapienza, W. A. Slegeir, T. E. O’Hare, and D. Mahajan, “Low temperature
catalysts for methanol production,” US4619946, 1986.
[64] D. M. Monti, N. W. Cant, D. L. Trimm, and M. S. Wainwright, “Hydrogenolysis of
References
197
methyl formate over copper on silica: II. Study of the mechanism using labeled
compounds,” J. Catal., vol. 100, no. 1, pp. 28–38, 1986.
[65] D. M. Monti, M. a. Kohler, W. M.S., D. L. Trimm, and N. W. Cant, “Liquid Phase
Hydrogenolysis of Methyl Formate in a Semi-batch Reactor,” Appl. Catal., vol. 22,
pp. 123–136, 1986.
[66] N. Tsubaki, J. Zeng, Y. Yoneyama, and K. Fujimoto, “Continuous synthesis process of
methanol at low temperature from syngas using alcohol promoters,” 2001.
[67] N. Tsubaki, M. Ito, and K. Fujimoto, “A New Method of Low-Temperature Methanol
Synthesis,” J. Catal., vol. 197, no. 1, pp. 224–227, 2001.
[68] B. Li and K. J. Jens, “Low-temperature and low-pressure methanol synthesis in the
liquid phase catalyzed by copper alkoxide systems,” Ind. Eng. Chem. Res., vol. 53, no.
5, pp. 1735–1740, 2014.
[69] S. Ohyama, “Transformation of the nickel precursor in catalytic systems for low-
temperature methanol synthesis in liquid phase,” Appl. Catal. A Gen., vol. 181, no. 1,
pp. 87–93, 1999.
[70] J. J. Brunet and P. Caubere, “Activation of reducing agents. Sodium hydride
containing complex reducing agents. 20. Pdc, a new, very selective heterogeneous
hydrogenation catalyst,” J. Org. Chem., vol. 49, no. 21, pp. 4058–4060, Oct. 1984.
[71] D. Mahajan, V. Krisdhasima, and R. D. Sproull, “Kinetic modeling of homogeneous
methanol synthesis catalyzed by base-promoted nickel complexes,” Can. J. Chem.,
vol. 79, no. 4, pp. 848–853, 2001.
[72] S. P. Tonner, D. L. Trimm, M. S. Wainwright, and N. W. Cant, “The base-catalysed
References
198
carbonylation of higher alcohols,” J. Mol. Catal., vol. 18, no. 2, pp. 215–222, Feb.
1983.
[73] M. Marchionna, L. Basini, A. Aragno, M. Lami, and F. Ancillotti, “Mechanistic studies
on the homogeneous nickel-catalyzed low temperature methanol synthesis,”
Journal of Molecular Catalysis, vol. 75, no. 2. pp. 147–151, 1992.
[74] D. Mahajan, R. S. Sapienza, W. A. Slegeir, and T. E. O’Hare, “Homogeneous catalyst
formulations for methanol production,” US4935395, 1990.
[75] J. E. Wegrzyn, D. Mahajan, and M. Gurevich, “Catalytic Routes to Transportation
Fuels Utilizing Natural Gas Hydrates,” Catal. Today, vol. 50, no. 1, pp. 97–108, 1999.
[76] K. Li and D. Jiang, “Methanol synthesis from syngas in the homogeneous system,”
in Journal of Molecular Catalysis A: Chemical, 1999, vol. 147, no. 1–2, pp. 125–130.
[77] S. Ohyama, “Low-temperature methanol synthesis in catalytic systems composed
of nickel compounds and alkali alkoxides in liquid phases,” Appl. Catal. A Gen., vol.
180, no. 1, pp. 217–225, 1999.
[78] D. Mahajan and A. N. Goland, “Integrating low-temperature methanol synthesis and
CO2 sequestration technologies: Application to IGCC plants,” Catal. Today, vol. 84,
no. 1–2, pp. 71–81, 2003.
[79] L. Sunggyu, methanol synthesis technology. SciTech Connect, EBSCOhost, 1989.
[80] R. Yang, X. Yu, Y. Zhang, W. Li, and N. Tsubaki, “A new method of low-temperature
methanol synthesis on Cu/ZnO/Al2O3 catalysts from CO/CO2/H2,” Fuel, vol. 87, no.
4–5, pp. 443–450, 2008.
[81] J.-Q. Zeng, N. Tsubaki, and K. Fujimoto, “The promoting effect of alcohols in a new
References
199
process of low-temperature synthesis of methanol from CO/CO2/H2,” Fuel, vol. 81,
no. 1, pp. 125–127, 2002.
[82] J. Zeng, K. Fujimoto, and N. Tsubaki, “Articles A New Low-Temperature Synthesis
Route of Methanol :,” no. 9, pp. 83–86, 2002.
[83] R. Yang, Y. Fu, Y. Zhang, and N. Tsubaki, “In situ DRIFT study of low-temperature
methanol synthesis mechanism on Cu/ZnO catalysts from CO2-containing syngas
using ethanol promoter,” J. Catal., vol. 228, no. 1, pp. 23–35, 2004.
[84] R. Yang, Y. Zhang, and N. Tsubaki, “Dual catalysis mechanism of alcohol solvent and
Cu catalyst for a new methanol synthesis method,” Catal. Commun., vol. 6, no. 4, pp.
275–279, 2005.
[85] J. A. Christiansen, “Method of producing methyl alcohol from alkyl formates.,”
US1303011, 1919.
[86] Z. Liu, J. W. Tierney, Y. T. Shah, and I. Wender, “Kinetics of two-step methanol
synthesis in the slurry phase,” Fuel Process. Technol., vol. 18, no. 2, pp. 185–199,
Apr. 1988.
[87] S. P. Liang. Bai, Yulong. Zhao, Yunqing. Hu, Bing. Zhong, “Kinetics of the
carbonylation of methanol in a mechanically agitated reactor.pdf.” pp. 229–236,
1996.
[88] L. Chen, J. Zhang, P. Ning, Y. Chen, and W. Wu, “Kinetics of Methanol Carbonylation
to Methyl Formate Catalyzed by Sodium Methoxide,” vol. 13, pp. 225–230, 2004.
[89] Z. Liu, J. W. Tierney, Y. T. Shah, and I. Wender, “Methanol synthesis via
methylformate in a slurry reactor,” Fuel Process. Technol., vol. 23, no. 2, pp. 149–
References
200
167, 1989.
[90] M. Marchionna, M. Lami, and F. Ancillotti, “Process for producing methanol form
synthesis gas, in the liquid phase,” US5032618, 1991.
[91] D. M. Monti, M. S. Walnwrlght, D. L. Trlmm, and N. W. Cant, “Kinetics of the Vapor-
Phase Hydrogenolysis of Methyl Formate Over Copper on Silica Catalysts,” Ind. Eng.
Chem. Prod. Res. Dev., vol. 24, no. 3, pp. 397–401, 1985.
[92] C. Ahoba-Sam, U. Olsbye, and K.-J. Jens, “The Role of Solvent Polarity on Low-
Temperature Methanol Synthesis Catalyzed by Cu Nanoparticles,” Front. Energy
Res., vol. 5, no. July, pp. 1–11, 2017.
[93] V. M. Palekar, H. Jung, J. W. Tiemey, and I. Wender, “Slurry phase synthesis of
methanol with a potassium methoxide/copper chromite catalytic system,” Appl.
Catal. A, Gen., vol. 102, no. 1, pp. 13–34, 1993.
[94] W. W. Chen. Liang, Zhang. Jianghong, Ning. Ping, Chen. Yunhua, “Kinetics of
methanol carbonylation to methyl formate catalyzed by sodium methoxide,” J. Nat.
gas Chem., vol. 13, pp. 225–230, 2004.
[95] V. M. Palekar, J. W. Tierney, and I. Wender, “Alkali compounds and copper chromite
as low-temperature slurry phase methanol catalysts,” Appl. Catal. A, Gen., vol. 103,
no. 1, pp. 105–122, 1993.
[96] S. Ohyama, “Evaluation of Low-Temperature Methanol Synthesis in Liquid Phase.,”
vol. 103, pp. 1182–1186, 2010.
[97] D. M. Monti, N. W. Cant, D. L. Trimm, and M. S. Wainwright, “Hydrogenolysis of
methyl formate over copper on silica: I. Study of surface species by in situ infrared
References
201
spectroscopy,” J. Catal., vol. 100, no. 1, pp. 17–27, 1986.
[98] X. Huang, N. W. Cant, J. W. Evans, and M. S. Wainwright, “Kinetic studies of gas-
phase hydrogenolysis of methyl formate to methanol over copper-based catalyst,”
Catal. Today, vol. 93, pp. 113–119, 2004.
[99] K. Radhakrishnan, P. A. Ramachandran, and R. V Chaudhari, “Solubility of Hydrogen
in Methanol, Nitrobenzene, and Their Mixtures. Experimental Data and
Correlation,” J. Chem. Eng. Data, vol. 28, no. 1, pp. 1–4, 1983.
[100] V. R. Choudhary, M. G. Sane, and H. G. Vadgaonkar, “Solubility of Hydrogen in
Methanol Containing Reaction Species for Hydrogenation of o-Nitrophenol,” J.
Chem. Eng. Data, vol. 31, no. 3, pp. 294–296, 1986.
[101] M. Wainwright and T. Ahn, “Solubility of hydrogen in alcohols and esters,” J.
Chem. …, vol. 24, no. 19, pp. 22–24, 1987.
[102] P. Lühring and A. Schumpe, “Gas Solubilities (H2 , He , N2, CO, O2, Ar, CO2) in
Organic Liquids at 293.2 K,” J. Chem. Eng. Data, vol. 34, no. 2, pp. 250–252, 1989.
[103] Q. Liu, F. Takemura, and A. Yabe, “Solubility of hydrogen in liquid methanol and
methyl formate at 20 ??C to 140 ??C,” J. Chem. Eng. Data, vol. 41, no. 5, pp. 1141–
1143, 1996.
[104] K. Bezanehtak, G. B. Combes, F. Dehghani, N. R. Foster, and D. L. omasko, “Vapor-
liquid equilibrium for binary systems of carbon dioxide + methanol, hydrogen +
methanol, and hydrogen + carbon dioxide at high pressures,” J. Chem. Eng. Data, vol.
47, no. 2, pp. 161–168, 2002.
[105] A. Z. Francesconi, “Gas−Liquid Solubility of Hydrogen in n-Alcohols (1 ⩽ n ⩽ 4) at
References
202
Pressures from 3.6 MPa to 10 MPa and Temperatures from 298.15 K to 525.15 K,”
pp. 671–674, 2001.
[106] E. Brunner, W. Hültenschmidt, and G. Schlichthärle, “Fluid mixtures at high
pressures IV. Isothermal phase equilibria in binary mixtures consisting of
(methanol + hydrogen or nitrogen or methane or carbon monoxide or carbon
dioxide),” J. Chem. Thermodyn., vol. 19, no. 3, pp. 273–291, 1987.
[107] T. Katayama and T. Nitta, “Solubilities of hydrogen and nitrogen in alcohols and n-
hexane,” J. Chem. Eng. Data, vol. 21, no. 2, pp. 194–196, 1976.
[108] C. Descamps, C. Coquelet, C. Bouallou, and D. Richon, “Solubility of hydrogen in
methanol at temperatures from 248.41 to 308.20 K,” Thermochim. Acta, vol. 430,
no. 1–2, pp. 1–7, 2005.
[109] N. Gemo, P. Biasi, T. O. Salmi, and P. Canu, “H 2 solubility in methanol in the
presence of CO 2 and O 2,” J. Chem. Thermodyn., vol. 54, pp. 1–9, 2012.
[110] S. P. Tonner, M. S. Wainwright, D. L. Trlmm, and N. W. Cant, “Solubility of Carbon
Monoxide in Alcohols,” no. 1, pp. 59–61, 1983.
[111] Q. Liu, F. Takemura, and A. Yabe, “Solubility and Diffusivity of Carbon Monoxide in
Liquid Methanol,” pp. 589–592, 1996.
[112] E. Neau, O. Hernández-Garduza, J. Escandell, C. Nicolas, and I. Raspo, “The Soave,
Twu and Boston-Mathias alpha functions in cubic equations of state. Part I.
Theoretical analysis of their variations according to temperature,” Fluid Phase
Equilib., vol. 276, no. 2, pp. 87–93, 2009.
[113] A. F. Young, F. L. P. Pessoa, and V. R. R. Ahón, “Comparison of 20 Alpha Functions
References
203
Applied in the Peng-Robinson Equation of State for Vapor Pressure Estimation,”
Ind. Eng. Chem. Res., vol. 55, no. 22, pp. 6506–6516, 2016.
[114] G. Soave, “Equilibrium constants frm a modified Redlich-Kwong equation of state,”
Chem. Eng. Sci., vol. 27, no. 6, pp. 1197–1203, 1972.
[115] J. F. Boston and P. M. Mathias, “Phase equilibria in a third-generation process
simulator,” Proc. 2nd Int. Conf. Phase Equilibria Fluid Prop. Chem. Process Ind., no.
August, pp. 823–849, 1980.
[116] C. H. Twu, D. Bluck, J. R. Cunningham, and J. E. Coon, “A cubic equation of state with
a new alpha function and a new mixing rule,” Fluid Phase Equilib., vol. 69, no. C, pp.
33–50, 1991.
[117] C. H. Twu, J. E. Coon, and J. R. Cunningham, “A new generalized alpha function for a
cubic equation of state Part 1. Peng-Robinson equation,” Fluid Phase Equilib., vol.
105, no. 1, pp. 49–59, 1995.
[118] P. M. Mathias, “A versatile phase equilibrium equation of state,” Ind. Eng. Chem.
Process Des. Dev., vol. 22, no. 3, pp. 385–391, 1983.
[119] N. R. Mirza, N. J. Nicholas, Y. Wu, K. A. Mumford, S. E. Kentish, and G. W. Stevens,
“Experiments and Thermodynamic Modeling of the Solubility of Carbon Dioxide in
Three Different Deep Eutectic Solvents (DESs),” J. Chem. Eng. Data, vol. 60, no. 11,
pp. 3246–3252, 2015.
[120] A. M. Abudour, S. A. Mohammad, R. L. Robinson, and K. A. M. Gasem, “Generalized
binary interaction parameters for the Peng-Robinson equation of state,” Fluid
Phase Equilib., vol. 383, pp. 156–173, 2014.
References
204
[121] P. M. Mathias and T. W. Copeman, “Extension of the Peng-Robinson Equation of
State To Complex Mixtures: Evaluation of the Various Forms of the Local
Composition Concept,” Fluid Phase Equilibria Ekvier Sci. Publ. B.V, vol. 13, pp. 91–
108, 1983.
[122] T. K. H. Trinh, J. C. De Hemptinne, R. Lugo, N. Ferrando, and J. P. Passarello,
“Hydrogen Solubility in Hydrocarbon and Oxygenated Organic Compounds,” J.
Chem. Eng. Data, vol. 61, no. 1, pp. 19–34, 2016.
[123] B. B. Breman, a a C. M. Beenackers, E. W. J. Rietjens, and R. J. H. Stege, “Gas-Liquid
Solubilities of Carbon Monoxide, Carbon Dioxide,Hydrogen, Water, 1-Alcohols
(1 .ltoreq. n .ltoreq. 6), and n-Paraffins (2 .ltoreq. n .ltoreq. 6) in Hexadecane,
Octacosane, 1-Hexadecanol, Phenanthrene, and Tetraethylene Glycol at Pressures
up to,” J. Chem. Eng. Data, vol. 39, no. 4, pp. 647–666, 1994.
[124] R. C. Reid, J. M. Prausnitz, and B. E. Poling, The properties of gases and liquids, vol.
23, no. 3. 2006.
[125] F. Zaera and Z. Ma, Characterization of Heterogeneous Catalysts, no. December.
2006.
[126] H. Günzler and A. Williams, Handbook of Analytical Techniques, vol. 1–2. 2008.
[127] A. C. Gandhi and S. Y. Wu, “Unidirectional anisotropy mediated giant memory effect
in antiferromagnetic Cr<inf>2</inf>O<inf>3</inf>nanorods,” RSC Adv., vol. 7, no.
41, pp. 25512–25518, 2017.
[128] J. I. Goldstein et al., “X-Ray Spectral Measurement: EDS and WDS,” in Scanning
Electron Microscopy and X-ray Microanalysis, Boston, MA: Springer US, 2003, pp.
297–353.
References
205
[129] Y. FUJITA, “The Determination Method of Surface Area by the BET Method,” Shinku,
vol. 6, no. 5, pp. 169–176, 1963.
[130] G. Della, “The Chemisorption,” vol. 98, no. 8.
[131] R. J. Cvetanović and Y. Amenomiya, “A Temperature Programmed Desorption
Technique for Investigation of Practical Catalysts,” Catal. Rev., vol. 6, no. 1, pp. 21–
48, Jan. 1972.
[132] J. F. Watts and J. Wolstenholme, “Electron Spectroscopy: Some Basic Concepts,” in
An Introduction to Surface Analysis by XPS and AES, Chichester, UK: John Wiley &
Sons, Ltd, 2005, pp. 1–15.
[133] D.-Y. Peng and D. B. Robinson, “A New Two-Constant Equation of State,” Ind. Eng.
Chem. Fundam., vol. 15, no. 1, pp. 59–64, 1976.
[134] “DIPPR 801 Database | AIChE.” [Online]. Available:
https://www.aiche.org/dippr/events-products/801-database. [Accessed: 16-Feb-
2017].
[135] P. M. Mathias, H. C. Klotz, and J. M. Prausnitz, “Equation-of-State mixing rules for
multicomponent mixtures: the problem of invariance,” Fluid Phase Equilib., vol. 67,
no. C, pp. 31–44, 1991.
[136] S. Stamataki, “A generalized correlation for the interaction of CO , - hydrocarbon
binary mixtures,” vol. 93, no. 93, pp. 141–166, 1994.
[137] J. P. O’Connell and J. M. Haile, Thermodynamics: Fundamentals for applications, vol.
9780521582. 2005.
[138] T. H. Ahmed, Reservoir engineering handbook. Elsevier/Gulf Professional, 2006.
References
206
[139] X. Gui, Z. Tang, and W. Fei, “Solubility of CO 2 in Alcohols , Glycols , Ethers , and
Ketones at High Pressures from ( 288 . 15 to 318 . 15 ) K,” pp. 2420–2429, 2011.
[140] S. N. Joung et al., “Measurements and correlation of high-pressure VLE of binary
CO2-alcohol systems (methanol, ethanol, 2-methoxyethanol and 2-ethoxyethanol),”
Fluid Phase Equilib., vol. 185, no. 1–2, pp. 219–230, 2001.
[141] T. S. Reighard, S. T. Lee, and S. V Olesik, “Determination of methanol/CO2 and
acetonitrile/CO2 vapor-liquid phase equilibria using a variable-volume view cell,”
vol. vi, pp. 215–230, 1996.
[142] A. Leu and S. Y. Chung, “The equilibrium phase properties of ( carbon dioxide +
methanol ),” pp. 979–985, 1991.
[143] P. L. Huyskens, “Differences in the structures of highly polar and hydrogen-bonded
liquids,” J. Mol. Struct., vol. 198, no. C, pp. 123–133, 1989.
[144] A. D. Buckingham, “The hydrogen bond, and the structure and properties of H20
and (H20)2,” J. Mol. Struct., vol. 250, no. 2–4, pp. 111–118, 1991.
[145] V. Buch, “Treatment of rigid bodies by diffusion Monte Carlo: Application to the
para-H2⋯H2O and ortho-H2⋯H2O clusters,” J. Chem. Phys., vol. 97, no. 1, pp. 726–
729, 1992.
[146] P. Sandler, V. Buch, and J. Sadlej, “Ground and excited states of the complex of CO
with water: A diffusion Monte Carlo study,” J. Chem. Phys., vol. 105, no. 23, p. 10387,
1996.
[147] H. Adkins and K. Folkers, “the Catalytic Hydrogenation of Esters To Alcohols,” J. Am.
Chem. Soc., vol. 53, no. 3, pp. 1095–1097, 1931.
References
207
[148] U. R. Kreutzer, “Manufacture of fatty alcohols based on natural fats and oils,” J. Am.
Oil Chem. Soc., vol. 61, no. 2, pp. 343–348, 1984.
[149] K. Kon, W. Onodera, S. Takakusagi, and K. Shimizu, “Catalysis Science & Technology
Hydrodeoxygenation of fatty acids and,” Catal. Sci. Technol., vol. 4, pp. 3705–3712,
2014.
[150] C. Jonathan, N. Greeves, and S. Warren, Orangic Chemistry. Oxford University Press,
2000.
[151] J. Pritchard, G. A. Filonenko, R. Van Putten, E. J. M. Hensen Ab, and E. A. Pidko,
“Heterogeneous and homogeneous catalysis for the hydrogenation of carboxylic
acid derivatives: history, advances and future directions,” Chem. Soc. Rev. Chem. Soc.
Rev, vol. 3808, no. 44, pp. 3808–3833, 2015.
[152] S. Werkmeister, K. Junge, and M. Beller, “Catalytic Hydrogenation of Carboxylic Acid
Esters, Amides, and Nitriles with Homogeneous Catalysts,” Org. Process Res. Dev.,
vol. 18, no. 2, pp. 289–302, 2014.
[153] J. Zhang, G. Leitus, Y. Ben-David, and D. Milstein, “Efficient homogeneous catalytic
hydrogenation of esters to alcohols,” Angew. Chemie - Int. Ed., vol. 45, no. 7, pp.
1113–1115, 2006.
[154] C. J. . Teunissen, Herman T.; Elsevier, “Homogeneous Ruthenium Catalyzed
Hydrogenation of Esters to Alcohols,” Chem. Commun., vol. 3, no. 12 ml, p. 1367,
1998.
[155] J. W. Evans, P. S. Casey, M. S. Wainwright, D. L. Trimm, and N. W. Cant,
“Hydrogenolysis of alkyl formates over a copper chromite catalyst,” Appl. Catal., vol.
7, no. 1, pp. 31–41, 1983.
References
208
[156] R. J. Gormley, V. U. S. Rao, Y. Soong, and E. Micheli, “Methyl formate hydrogenolysis
for low-temperature methanol synthesis,” Appl. Catal. A Gen., vol. 87, no. 1, pp. 81–
101, 1992.
[157] O. Jogunola, T. Salmi, M. Kangas, and J. P. Mikkola, “Determination of the kinetics
and mechanism of methyl formate synthesis in the presence of a homogeneous
catalyst,” Chem. Eng. J., vol. 203, pp. 469–479, 2012.
[158] †,‡ Xin-Mei Liu, † G. Q. Lu, †,‡ and Zi-Feng Yan, and † Jorge Beltramini*, “Recent
Advances in Catalysts for Methanol Synthesis via Hydrogenation of CO and CO2,”
2003.
[159] L. Farrell et al., “Spray pyrolysis growth of a high figure of merit , nano-crystalline ,
p-type transparent conducting material at low temperature Spray pyrolysis
growth of a high figure of merit , nano-crystalline , p -type transparent conducting
material at low temperatur,” vol. 031901, pp. 2–7, 2015.
[160] A. a Khassin et al., “The state of absorbed hydrogen in the structure of reduced
copper chromite from the vibration spectra.,” Phys. Chem. Chem. Phys., vol. 11, no.
29, pp. 6090–6097, 2009.
[161] S. Mallakpour, M. Dinari, and E. Azadi, “International Journal of Polymer Analysis
and Characterization Poly ( vinyl alcohol ) Chains Grafted onto the Surface of
Copper Oxide Nanoparticles : Application in Synthesis and Characterization of
Novel Optically Active and Thermally Stable Nanocomposit,” Int. J. Polym. Anal.
Charact., vol. 20, no. January, pp. 82–97, 2015.
[162] M. Hao et al., “Kinetics of liquid phase catalytic hydrogenation of dicyclopentadiene
over Pd/C catalyst,” J. Phys. Chem. A, vol. 114, no. 11, pp. 3811–3817, 2010.
References
209
[163] A. A. Mirzaei, E. Rezazadeh, M. Arsalanfar, M. Abdouss, M. Fatemi, and M. Sahebi,
“Study on the reaction mechanism and kinetics of CO hydrogenation on a fused Fe–
Mn catalyst,” RSC Adv., vol. 5, no. 115, pp. 95287–95299, 2015.
[164] I. Kim, G. Lee, H. Jeong, J. H. Park, and J. C. Jung, “Bifunctionality of Cu/ZnO catalysts
for alcohol-assisted low-temperature methanol synthesis from syngas: Effect of
copper content,” J. Energy Chem., 2017.
[165] P. Kowalik, M. Konkol, M. Kondracka, W. Próchniak, R. Bicki, and P. Wiercioch, “The
CuZnZrAl hydroxycarbonates as copper catalyst precursors - Structure, thermal
decomposition and reduction studies,” Appl. Catal. A Gen., vol. 452, pp. 139–146,
2013.
[166] P. Gao et al., “Influence of Zr on the performance of Cu/Zn/Al/Zr catalysts via
hydrotalcite-like precursors for CO2hydrogenation to methanol,” J. Catal., vol. 298,
pp. 51–60, 2013.
[167] S. G. Jadhav, P. D. Vaidya, B. M. Bhanage, and J. B. Joshi, “Catalytic carbon dioxide
hydrogenation to methanol: A review of recent studies,” Chem. Eng. Res. Des., vol.
92, no. 11, pp. 2557–2567, 2014.
[168] M. Gao, M. Zhang, and Y. Li, “Transformation of bioethanol to 1,3-butadiene and
other bulk chemicals over the surface of Mg–Al catalysts,” RSC Adv., vol. 7, no. 43,
pp. 26935–26942, 2017.
[169] S. Ohyama, “Low-Temperature Methanol Synthesis in Catalytic Systems Composed
of Copper-Based Oxides and Alkali Alkoxides in Liquid Media: Effects of Reaction
Variables on Catalytic Performance,” Top. Catal., vol. 22, no. 3/4, pp. 337–343, 2003.
[170] Y. Z. Chen, B. J. Liaw, and B. J. Chen, “One-step synthesis of methanol from CO/H2 at
References
210
low temperature over ultrafine CuB catalysts,” Appl. Catal. A Gen., vol. 236, no. 1–2,
pp. 121–128, 2002.
[171] F. Arena, G. Italiano, K. Barbera, G. Bonura, L. Spadaro, and F. Frusteri, “Basic
evidences for methanol-synthesis catalyst design,” Catal. Today, vol. 143, no. 1–2,
pp. 80–85, 2009.
[172] F. Arena et al., “Solid-state interactions, adsorption sites and functionality of Cu-
ZnO/ZrO2 catalysts in the CO2 hydrogenation to CH3OH,” Appl. Catal. A Gen., vol.
350, no. 1, pp. 16–23, 2008.
[173] P. Gao et al., “Influence of modifier (Mn, La, Ce, Zr and Y) on the performance of
Cu/Zn/Al catalysts via hydrotalcite-like precursors for CO2 hydrogenation to
methanol,” Appl. Catal. A Gen., vol. 468, pp. 442–452, 2013.
[174] J. C. J. Bart and R. P. A. Sneeden, “Copper-zinc oxide-alumina methanol catalysts
revisited,” Catal. Today, vol. 2, no. 1, pp. 1–124, 1987.
[175] J. Yoshihara and C. T. Campbell, “Methanol Synthesis and Reverse Water–Gas Shift
Kinetics over Cu(110) Model Catalysts: Structural Sensitivity,” J. Catal., vol. 161, no.
2, pp. 776–782, 1996.
[176] B. Zhang, L. Lin, J. Zhuang, Y. Liu, L. Peng, and L. Jiang, “Hydrogenation of ethyl
acetate to ethanol over Ni-based catalysts obtained from Ni/Al hydrotalcite-like
compounds,” Molecules, vol. 15, no. 8, pp. 5139–5152, 2010.
[177] X. Dong, F. Li, N. Zhao, F. Xiao, J. Wang, and Y. Tan, “CO 2 hydrogenation to methanol
over Cu/ZnO/ZrO 2 catalysts prepared by precipitation-reduction method,” Appl.
Catal. B Environ., vol. 191, pp. 8–17, 2016.
References
211
[178] H. Tian, X. L. Zhang, J. Scott, C. Ng, and R. Amal, “TiO 2 -supported copper
nanoparticles prepared via ion exchange for photocatalytic hydrogen production,”
J. Mater. Chem. A, vol. 2, no. 18, pp. 6432–6438, 2014.
[179] R. D. Shannon and IUCr, “Revised effective ionic radii and systematic studies of
interatomic distances in halides and chalcogenides,” Acta Crystallogr. Sect. A, vol.
32, no. 5, pp. 751–767, Sep. 1976.
[180] † S. Velu, D. P. Sabde, and Neepa Shah, and S. Sivasanker*, “New Hydrotalcite-like
Anionic Clays Containing Zr4+ in the Layers: Synthesis and Physicochemical
Properties,” 1998.
[181] P. Gao et al., “Preparation and activity of Cu/Zn/Al/Zr catalysts via hydrotalcite-
containing precursors for methanol synthesis from CO2 hydrogenation,” Catal. Sci.
Technol., vol. 2, no. 7, p. 1447, 2012.
[182] S. Natesakhawat et al., “Active Sites and Structure-activity Relationships of Copper-
based Catalysts for Carbon Dioxide Hydrogenation to Methanol,” ACS Catal., vol. 2,
no. 8, p. 1667, 2012.
[183] Z. H. A. N. Haijuan, W. U. Zhiqiang, Z. H. A. O. Ning, L. I. U. Wanyi, and W. E. I. Wei,
“Structural properties and catalytic performance of the La-Cu-Zn mixed oxides for
CO 2 hydrogenation to methanol,” J. Rare Earths, 2017.
[184] F. Arena, K. Barbera, G. Italiano, G. Bonura, L. Spadaro, and F. Frusteri, “Synthesis,
characterization and activity pattern of Cu–ZnO/ZrO2 catalysts in the
hydrogenation of carbon dioxide to methanol,” J. Catal., vol. 249, no. 2, pp. 185–194,
2007.
[185] M. Bellotto, B. Rebours, O. Clause, J. Lynch, D. Bazin, and E. Elkaïm, “Hydrotalcite
References
212
Decomposition Mechanism: A Clue to the Structure and Reactivity of Spinel-like
Mixed Oxides,” J. Phys. Chem., vol. 100, no. 20, pp. 8535–8542, 1996.
[186] H. Henmi, T. Hirayama, N. Mizutani, and M. Kato, “Thermochimica Acta, 96 (1985)
145-153,” vol. 96, pp. 145–153, 1985.
[187] G. Bonura, M. Cordaro, C. Cannilla, F. Arena, and F. Frusteri, “The changing nature
of the active site of Cu-Zn-Zr catalysts for the CO2 hydrogenation reaction to
methanol,” Appl. Catal. B Environ., vol. 152–153, pp. 152–161, 2014.
[188] C. Huang, S. Chen, X. Fei, D. Liu, and Y. Zhang, “Catalytic Hydrogenation of CO2 to
Methanol: Study of Synergistic Effect on Adsorption Properties of CO2 and H2 in
CuO/ZnO/ZrO2 System,” Catalysts, vol. 5, no. 4, pp. 1846–1861, 2015.
[189] D. Tichit, N. Das, B. Coq, and R. Durand, “Preparation of Zr-containing layered
double hydroxides and characterization of the acido-basic properties of their
mixed oxides,” Chem. Mater., vol. 14, no. 4, pp. 1530–1538, 2002.
[190] G. Wu, X. Wang, W. Wei, and Y. Sun, “Fluorine-modified Mg-Al mixed oxides: A solid
base with variable basic sites and tunable basicity,” Appl. Catal. A Gen., vol. 377, no.
1–2, pp. 107–113, 2010.
[191] I. Grohmann, B. Peplinski, and W. Unger, “New entries in the XPS fingerprint
database for the characterization of precipitated Cu Zn Al oxide catalysts,” Surf.
Interface Anal., vol. 19, no. 1–12, pp. 591–594, 1992.
[192] S. Ardizzone and C. L. Bianchi, “XPS characterization of sulphated zirconia catalysts:
The role of iron,” Surf. Interface Anal., vol. 30, no. 1, pp. 77–80, 2000.
[193] M. K. Dongare, A. M. Dongare, V. B. Tare, and E. Kemnitz, “Synthesis and

References
213
characterization of copper-stabilized zirconia as an anode material for SOFC,” Solid
State Ionics, vol. 152–153, pp. 455–462, 2002.
[194] J. A. Navío, M. C. Hidalgo, G. Colón, S. G. Botta, and M. I. Litter, “Preparation and
physicochemical properties of ZrO2 and Fe/ZrO2 prepared by a sol-gel technique,”
Langmuir, vol. 17, no. 1, pp. 202–210, 2001.
[195] A. G. Sato, D. P. Volanti, D. M. Meira, S. Damyanova, E. Longo, and J. M. C. Bueno,
“Effect of the ZrO2 phase on the structure and behavior of supported Cu catalysts
for ethanol conversion,” J. Catal., vol. 307, pp. 1–17, 2013.
[196] C. Morant, J. M. Sanz, L. Galán, L. Soriano, and F. Rueda, “An XPS study of the
interaction of oxygen with zirconium,” Surf. Sci., vol. 218, no. 2–3, pp. 331–345,
1989.
[197] S. Velu, K. Suzuki, C. S. Gopinath, H. Yoshida, and T. Hattori, “XPS, XANES and EXAFS
investigations of CuO/ZnO/Al2O3/ZrO2 mixed oxide catalysts,” Phys. Chem. Chem.
Phys., vol. 4, no. 10, pp. 1990–1999, 2002.
[198] J. Y. Kim, J. A. Rodriguez, J. C. Hanson, A. I. Frenkel, and P. L. Lee, “Reduction of CuO
and Cu2O with H2: H embedding and kinetic effects in the formation of suboxides,”
J. Am. Chem. Soc., vol. 125, no. 35, pp. 10684–10692, 2003.
[199] S. Saha and S. B. Abd Hamid, “CuZrO 3 nanoparticles catalyst in aerobic oxidation of
vanillyl alcohol,” RSC Adv., vol. 7, no. 16, pp. 9914–9925, 2017.
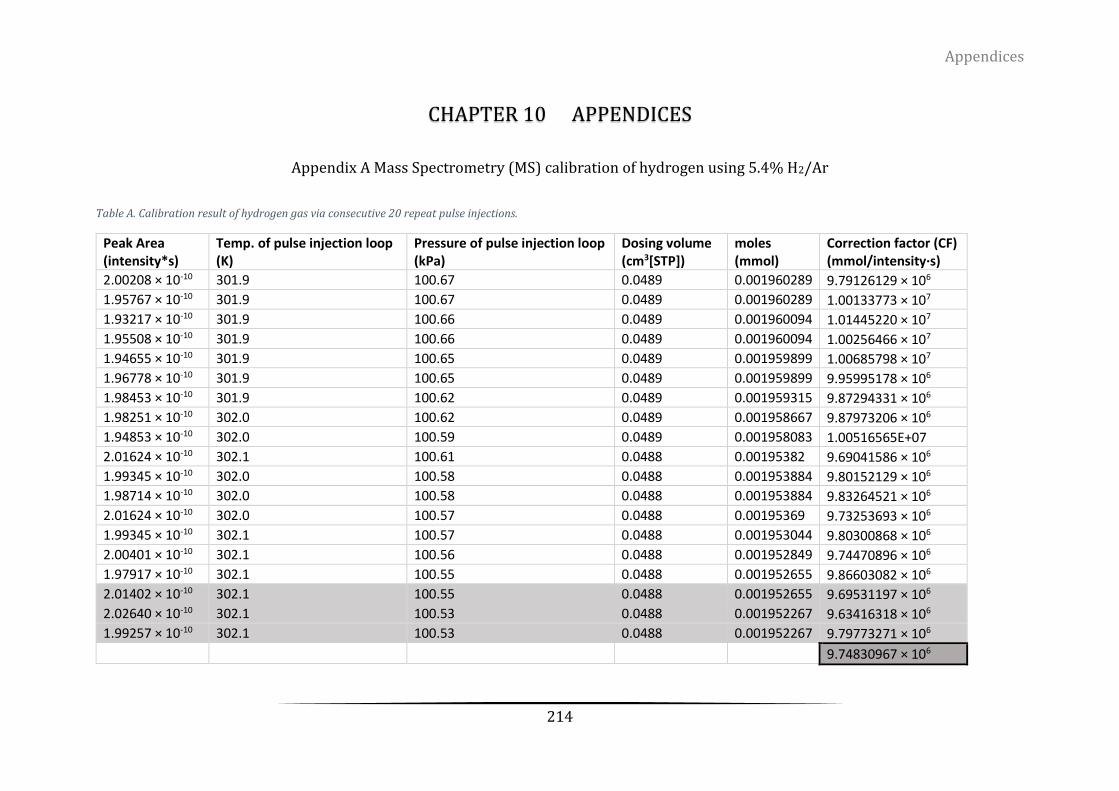
Appendices
214
CHAPTER 10 APPENDICES
Appendix A Mass Spectrometry (MS) calibration of hydrogen using 5.4% H2/Ar
Table A. Calibration result of hydrogen gas via consecutive 20 repeat pulse injections.
Peak Area (intensity*s)
Temp. of pulse injection loop (K)
Pressure of pulse injection loop (kPa)
Dosing volume (cm3[STP])
moles (mmol)
Correction factor (CF) (mmol/intensity·s)
2.00208 × 10⁻¹⁰ 301.9 100.67 0.0489 0.001960289 9.79126129 × 10⁶
1.95767 × 10⁻¹⁰ 301.9 100.67 0.0489 0.001960289 1.00133773 × 10⁷
1.93217 × 10⁻¹⁰ 301.9 100.66 0.0489 0.001960094 1.01445220 × 10⁷
1.95508 × 10⁻¹⁰ 301.9 100.66 0.0489 0.001960094 1.00256466 × 10⁷
1.94655 × 10⁻¹⁰ 301.9 100.65 0.0489 0.001959899 1.00685798 × 10⁷
1.96778 × 10⁻¹⁰ 301.9 100.65 0.0489 0.001959899 9.95995178 × 10⁶
1.98453 × 10⁻¹⁰ 301.9 100.62 0.0489 0.001959315 9.87294331 × 10⁶
1.98251 × 10⁻¹⁰ 302.0 100.62 0.0489 0.001958667 9.87973206 × 10⁶
1.94853 × 10⁻¹⁰ 302.0 100.59 0.0489 0.001958083 1.00516565E+07
2.01624 × 10⁻¹⁰ 302.1 100.61 0.0488 0.00195382 9.69041586 × 10⁶
1.99345 × 10⁻¹⁰ 302.0 100.58 0.0488 0.001953884 9.80152129 × 10⁶
1.98714 × 10⁻¹⁰ 302.0 100.58 0.0488 0.001953884 9.83264521 × 10⁶
2.01624 × 10⁻¹⁰ 302.0 100.57 0.0488 0.00195369 9.73253693 × 10⁶
1.99345 × 10⁻¹⁰ 302.1 100.57 0.0488 0.001953044 9.80300868 × 10⁶
2.00401 × 10⁻¹⁰ 302.1 100.56 0.0488 0.001952849 9.74470896 × 10⁶
1.97917 × 10⁻¹⁰ 302.1 100.55 0.0488 0.001952655 9.86603082 × 10⁶
2.01402 × 10⁻¹⁰ 302.1 100.55 0.0488 0.001952655 9.69531197 × 10⁶
2.02640 × 10⁻¹⁰ 302.1 100.53 0.0488 0.001952267 9.63416318 × 10⁶
1.99257 × 10⁻¹⁰ 302.1 100.53 0.0488 0.001952267 9.79773271 × 10⁶ 9.74830967 × 10⁶
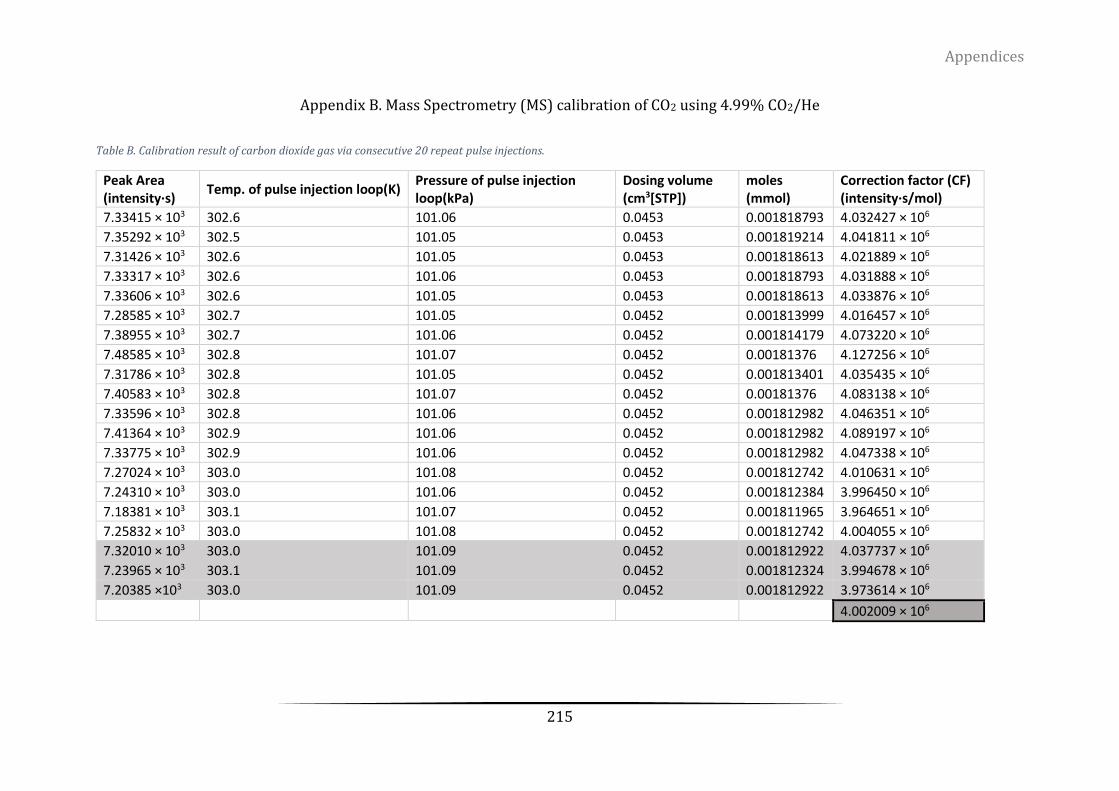
Appendices
215
Appendix B. Mass Spectrometry (MS) calibration of CO2 using 4.99% CO2/He
Table B. Calibration result of carbon dioxide gas via consecutive 20 repeat pulse injections.
Peak Area (intensity·s)
Temp. of pulse injection loop(K) Pressure of pulse injection loop(kPa)
Dosing volume (cm3[STP])
moles (mmol)
Correction factor (CF) (intensity·s/mol)
7.33415 × 10³ 302.6 101.06 0.0453 0.001818793 4.032427 × 10⁶
7.35292 × 10³ 302.5 101.05 0.0453 0.001819214 4.041811 × 10⁶
7.31426 × 10³ 302.6 101.05 0.0453 0.001818613 4.021889 × 10⁶
7.33317 × 10³ 302.6 101.06 0.0453 0.001818793 4.031888 × 10⁶
7.33606 × 10³ 302.6 101.05 0.0453 0.001818613 4.033876 × 10⁶
7.28585 × 10³ 302.7 101.05 0.0452 0.001813999 4.016457 × 10⁶
7.38955 × 10³ 302.7 101.06 0.0452 0.001814179 4.073220 × 10⁶
7.48585 × 10³ 302.8 101.07 0.0452 0.00181376 4.127256 × 10⁶
7.31786 × 10³ 302.8 101.05 0.0452 0.001813401 4.035435 × 10⁶
7.40583 × 10³ 302.8 101.07 0.0452 0.00181376 4.083138 × 10⁶
7.33596 × 10³ 302.8 101.06 0.0452 0.001812982 4.046351 × 10⁶
7.41364 × 10³ 302.9 101.06 0.0452 0.001812982 4.089197 × 10⁶
7.33775 × 10³ 302.9 101.06 0.0452 0.001812982 4.047338 × 10⁶
7.27024 × 10³ 303.0 101.08 0.0452 0.001812742 4.010631 × 10⁶
7.24310 × 10³ 303.0 101.06 0.0452 0.001812384 3.996450 × 10⁶
7.18381 × 10³ 303.1 101.07 0.0452 0.001811965 3.964651 × 10⁶
7.25832 × 10³ 303.0 101.08 0.0452 0.001812742 4.004055 × 10⁶
7.32010 × 10³ 303.0 101.09 0.0452 0.001812922 4.037737 × 10⁶
7.23965 × 10³ 303.1 101.09 0.0452 0.001812324 3.994678 × 10⁶
7.20385 ×10³ 303.0 101.09 0.0452 0.001812922 3.973614 × 10⁶ 4.002009 × 10⁶
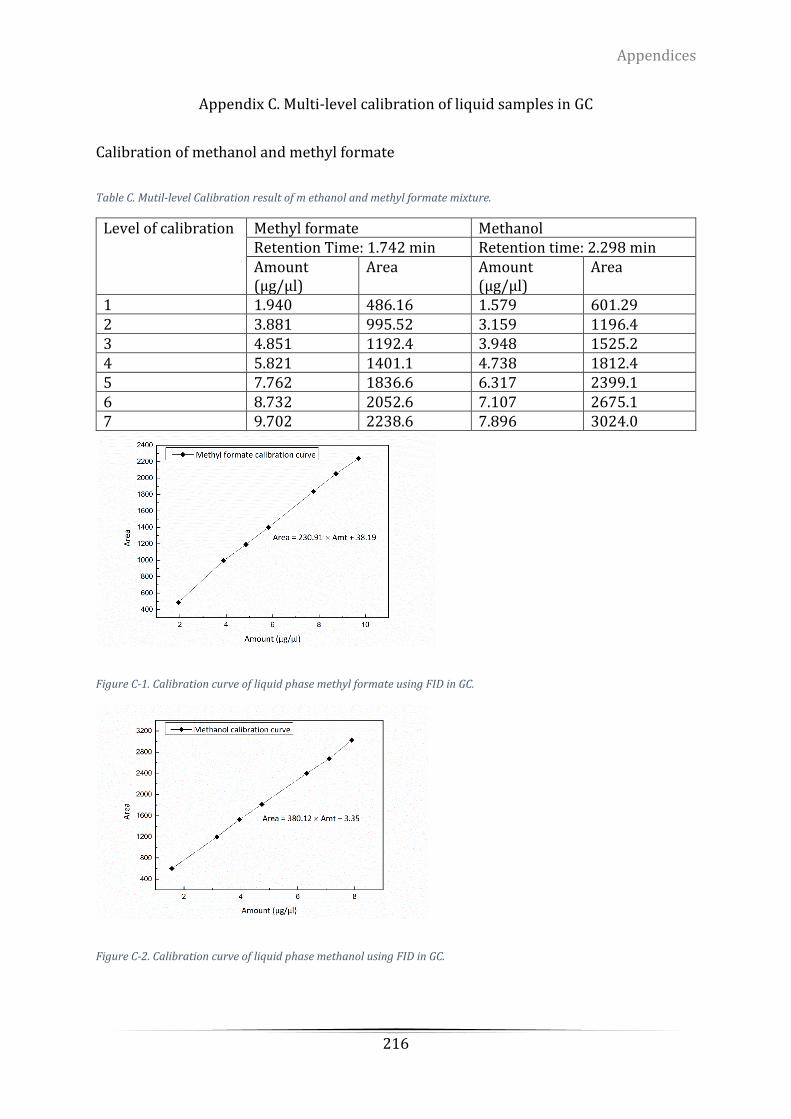
Appendices
216
Appendix C. Multi-level calibration of liquid samples in GC
Calibration of methanol and methyl formate
Table C. Mutil-level Calibration result of m ethanol and methyl formate mixture.
Level of calibration Methyl formate Methanol Retention Time: 1.742 min Retention time: 2.298 min Amount (µg/µl)
Area Amount (µg/µl)
Area
1 1.940 486.16 1.579 601.29 2 3.881 995.52 3.159 1196.4 3 4.851 1192.4 3.948 1525.2 4 5.821 1401.1 4.738 1812.4 5 7.762 1836.6 6.317 2399.1 6 8.732 2052.6 7.107 2675.1 7 9.702 2238.6 7.896 3024.0
Figure C-1. Calibration curve of liquid phase methyl formate using FID in GC.
Figure C-2. Calibration curve of liquid phase methanol using FID in GC.
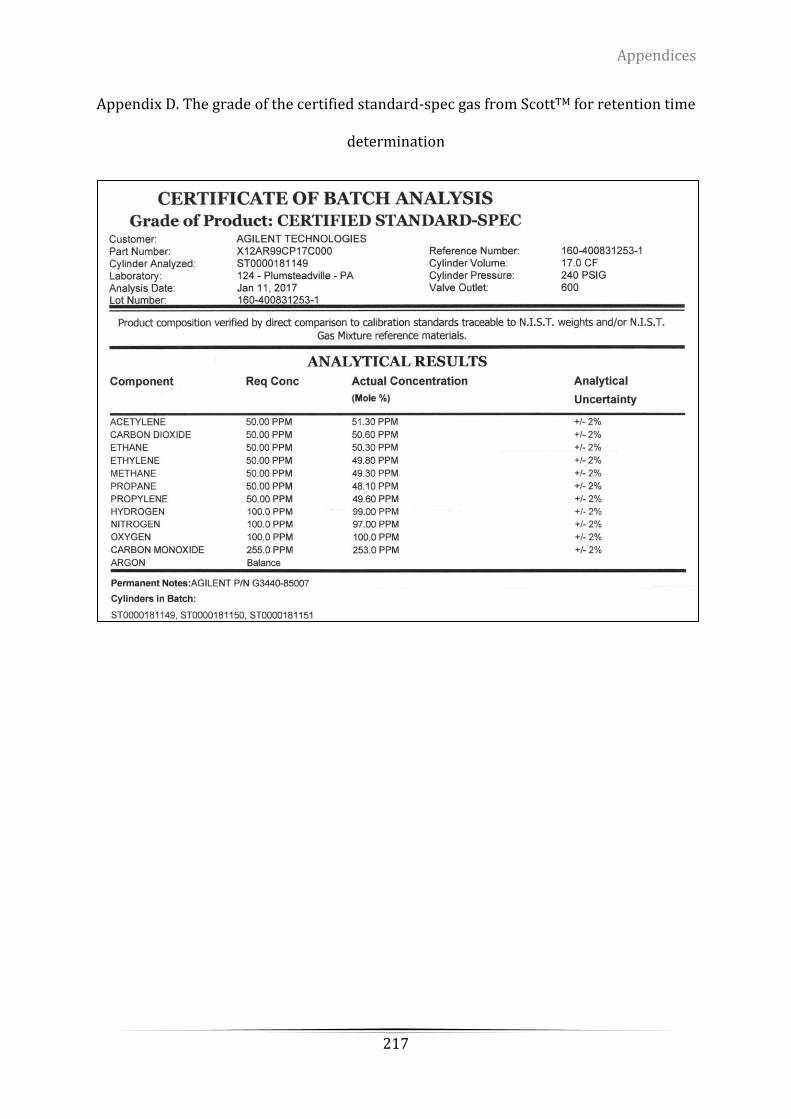
Appendices
217
Appendix D. The grade of the certified standard-spec gas from ScottTM for retention time
determination
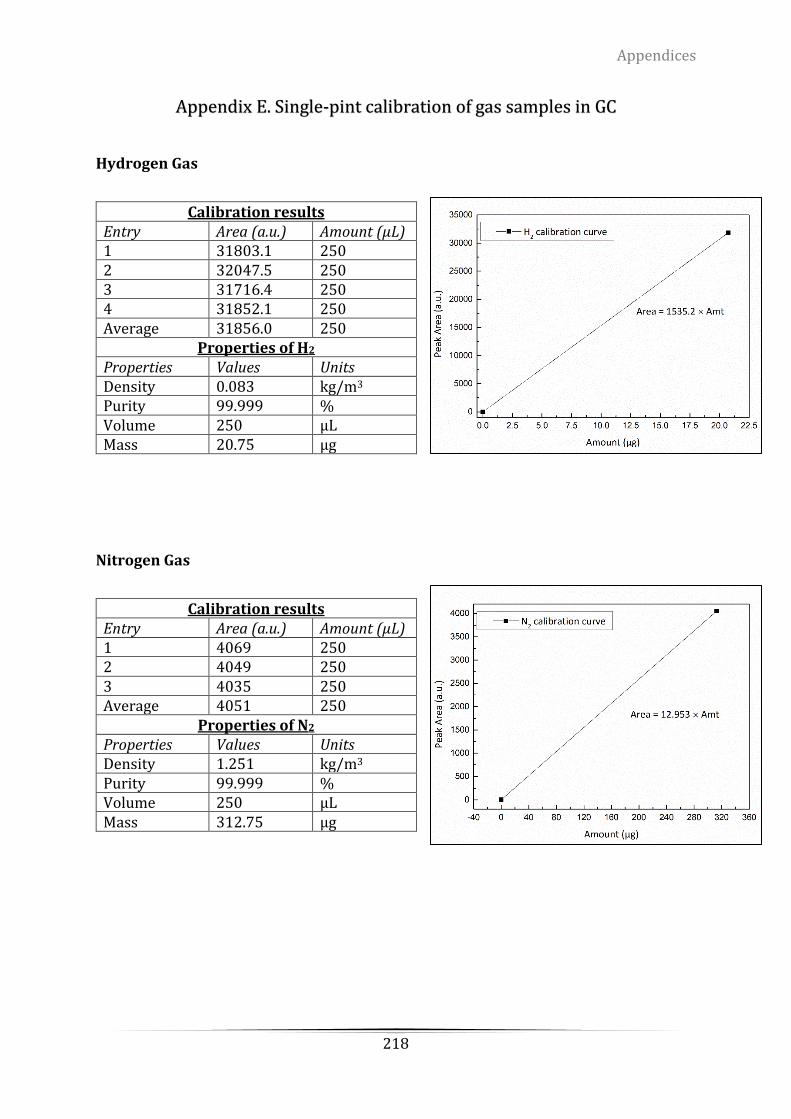
Appendices
218
Appendix E. Single-pint calibration of gas samples in GC
Hydrogen Gas
Calibration results Entry Area (a.u.) Amount (µL) 1 31803.1 250 2 32047.5 250 3 31716.4 250 4 31852.1 250 Average 31856.0 250
Properties of H2 Properties Values Units Density 0.083 kg/m3 Purity 99.999 % Volume 250 µL Mass 20.75 µg
Nitrogen Gas
Calibration results Entry Area (a.u.) Amount (µL) 1 4069 250 2 4049 250 3 4035 250 Average 4051 250
Properties of N2 Properties Values Units Density 1.251 kg/m3 Purity 99.999 % Volume 250 µL Mass 312.75 µg
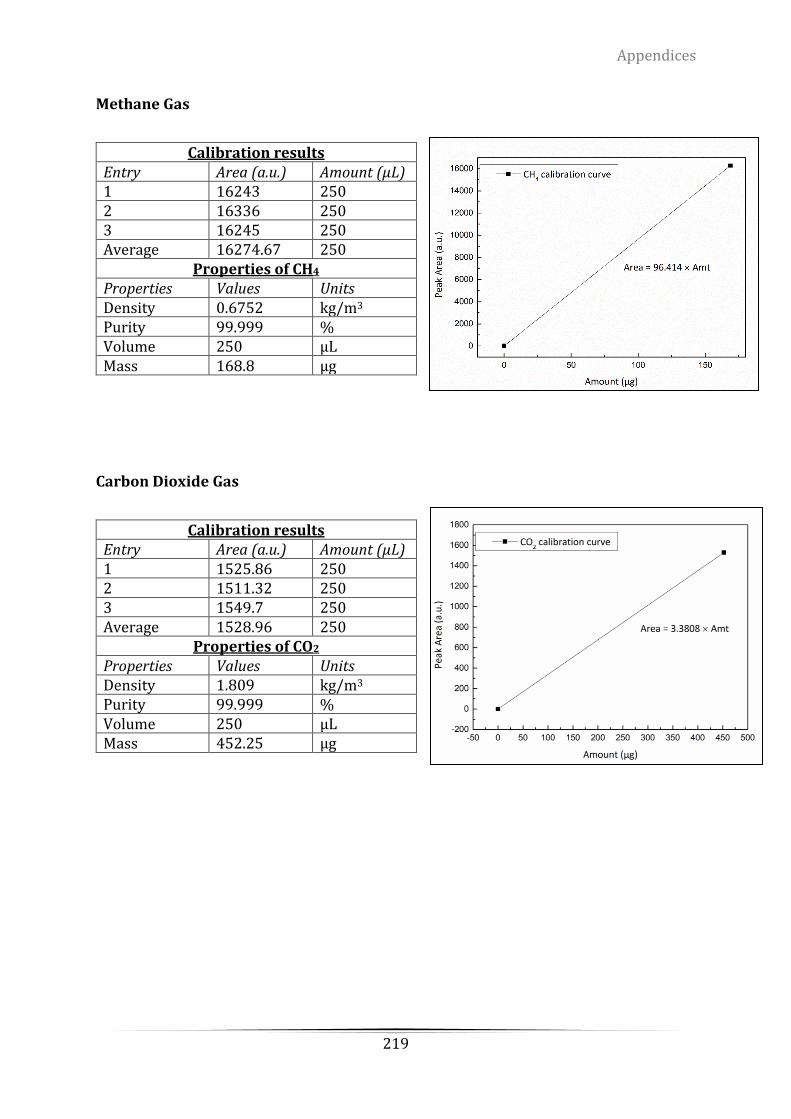
Appendices
219
Methane Gas
Calibration results Entry Area (a.u.) Amount (µL) 1 16243 250 2 16336 250 3 16245 250 Average 16274.67 250
Properties of CH4 Properties Values Units Density 0.6752 kg/m3 Purity 99.999 % Volume 250 µL Mass 168.8 µg
Carbon Dioxide Gas
Calibration results Entry Area (a.u.) Amount (µL) 1 1525.86 250 2 1511.32 250 3 1549.7 250 Average 1528.96 250
Properties of CO2 Properties Values Units Density 1.809 kg/m3 Purity 99.999 % Volume 250 µL Mass 452.25 µg
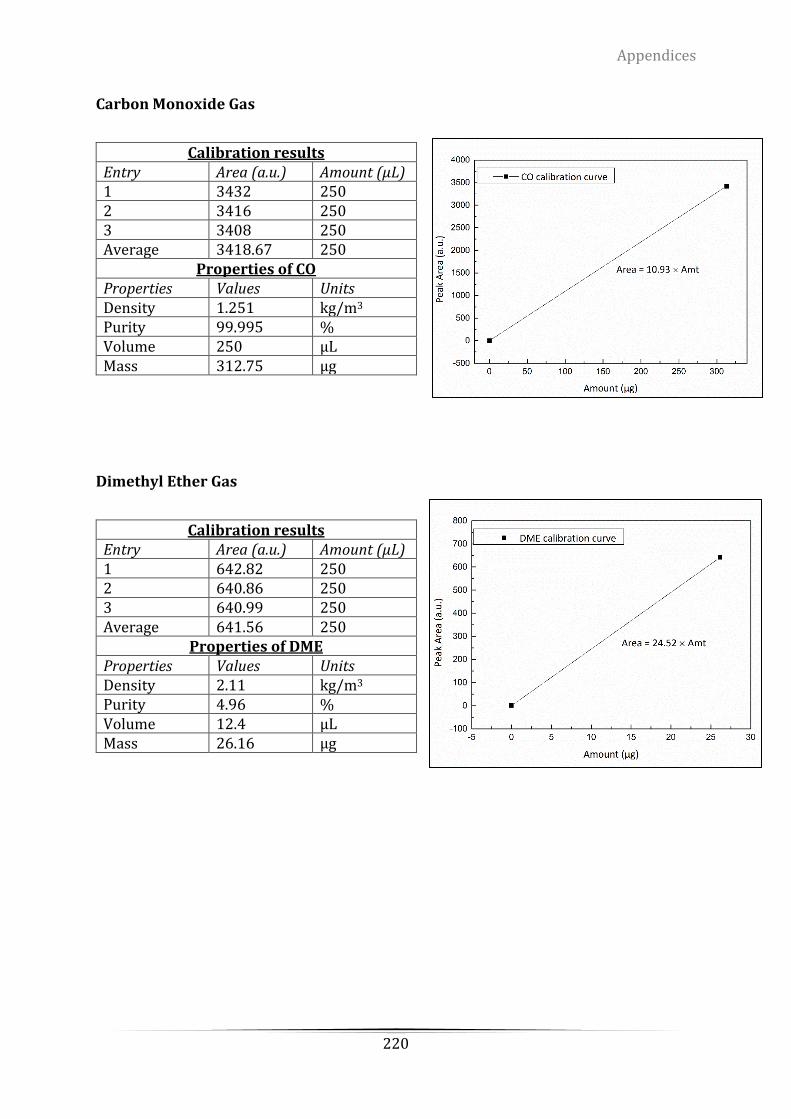
Appendices
220
Carbon Monoxide Gas
Calibration results Entry Area (a.u.) Amount (µL) 1 3432 250 2 3416 250 3 3408 250 Average 3418.67 250
Properties of CO Properties Values Units Density 1.251 kg/m3 Purity 99.995 % Volume 250 µL Mass 312.75 µg
Dimethyl Ether Gas
Calibration results Entry Area (a.u.) Amount (µL) 1 642.82 250 2 640.86 250 3 640.99 250 Average 641.56 250
Properties of DME Properties Values Units Density 2.11 kg/m3 Purity 4.96 % Volume 12.4 µL Mass 26.16 µg
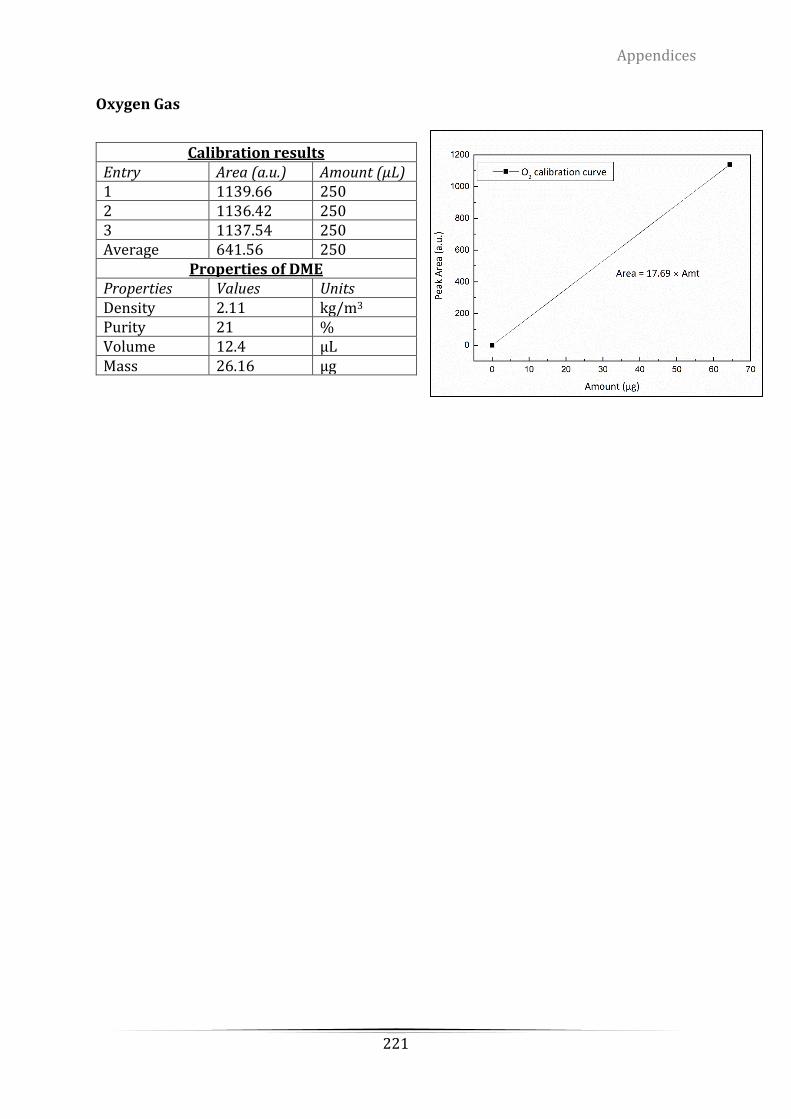
Appendices
221
Oxygen Gas
Calibration results Entry Area (a.u.) Amount (µL) 1 1139.66 250 2 1136.42 250 3 1137.54 250 Average 641.56 250
Properties of DME Properties Values Units Density 2.11 kg/m3 Purity 21 % Volume 12.4 µL Mass 26.16 µg
Minerva Access is the Institutional Repository of The University of Melbourne
Author/s:
WU, Fan
Title:
Investigation of efficient two-step methanol synthesis processes at moderate pressures and
temperatures
Date:
2018
Persistent Link:
http://hdl.handle.net/11343/212538
File Description:
Investigation of efficient two-step methanol synthesis processes at moderate pressures and
temperatures
Terms and Conditions:
Terms and Conditions: Copyright in works deposited in Minerva Access is retained by the
copyright owner. The work may not be altered without permission from the copyright owner.
Readers may only download, print and save electronic copies of whole works for their own
personal non-commercial use. Any use that exceeds these limits requires permission from
the copyright owner. Attribution is essential when quoting or paraphrasing from these works.