Synthesis and Characterization of GO/ZIF-67 Nanocomposite
16
Citation: Shahsavari, M.; Mortazavi, M.; Tajik, S.; Sheikhshoaie, I.; Beitollahi, H. Synthesis and Characterization of GO/ZIF-67 Nanocomposite: Investigation of Catalytic Activity for the Determination of Epinine in the Presence of Dobutamine. Micromachines 2022, 13, 88. https:// doi.org/10.3390/mi13010088 Academic Editor: Mehmet Remzi Dokmeci Received: 1 November 2021 Accepted: 3 January 2022 Published: 6 January 2022 Publisher’s Note: MDPI stays neutral with regard to jurisdictional claims in published maps and institutional affil- iations. Copyright: © 2022 by the authors. Licensee MDPI, Basel, Switzerland. This article is an open access article distributed under the terms and conditions of the Creative Commons Attribution (CC BY) license (https:// creativecommons.org/licenses/by/ 4.0/). micromachines Article Synthesis and Characterization of GO/ZIF-67 Nanocomposite: Investigation of Catalytic Activity for the Determination of Epinine in the Presence of Dobutamine Mahboobeh Shahsavari 1 , Mojtaba Mortazavi 2 , Somayeh Tajik 3, *, Iran Sheikhshoaie 1 and Hadi Beitollahi 4, * 1 Department of Chemistry, Faculty of Science, Shahid Bahonar University of Kerman, Kerman 7616914111, Iran; [email protected] (M.S.); [email protected] (I.S.) 2 Biotechnology Department, Institute of Science and High Technology and Environmental Sciences, Graduate University of Advanced Technology, Kerman 7631885356, Iran; [email protected] 3 Research Center of Tropical and Infectious Diseases, Kerman University of Medical Sciences, Kerman 7616913555, Iran 4 Environment Department, Institute of Science and High Technology and Environmental Sciences, Graduate University of Advanced Technology, Kerman 7631885356, Iran * Correspondence: [email protected] (S.T.); [email protected] (H.B.); Tel.: +98-34-26226613 (H.B.) Abstract: In this study, we prepared graphene oxide (GO)/ZIF-67 nanocomposites. Therefore, GO/ZIF-67 nanocomposites were used as a modifier on a screen-printed electrode (GO/ZIF-67/SPE) for studying the electrochemical behavior of epinine in phosphate buffer saline (PBS) at pH 7.0 with voltammetry techniques. The GO/ZIF-67/SPE showed greater electrocatalytic activities than the bare SPE. As a result, the GO/ZIF-67/SPE was utilized for additional electrochemical examinations. The epinine concentration determination was in the range 9.0 × 10 -8 M to 5.0 × 10 -4 M, and the limit of detection (LOD) as well as the limit of quantification (LOQ) equaled 2.0 and 6.6 nM, respectively. From the scan rate study, the oxidation of epinine was found to be diffusion-controlled, and the simultaneous detection of epinine and dobutamine were well achieved with the differential pulse voltammetric (DPV) technique. Moreover, the stability and reproducibility of epinine at the GO/ZIF- 67/SPE was studied, and the use of the GO/ZIF-67/SPE to detect epinine and dobutamine in real samples was furthermore successfully demonstrated. Keywords: epinine; dobutamine; voltammetric sensors; screen printed electrode; GO/ZIF-67 nanocomposite 1. Introduction Catecholamines play a significant role in the nervous system as central and peripheral neurotransmitters. These materials are generated by the sympathetic nervous system acti- vation and function as neurotransmitters and hormones for monitoring the heart rate, brain muscles activities, blood pressure, glycogenolysis, body temperature, and fatty acid mobi- lization [1,2]. Therefore, researchers have concentered on the design of a simplified rapid technique for detecting catecholamines in bioscience, biotechnology, and also medicinal chemistry, in particular in neurochemistry [1–3]. Epinine, also known by the common names N-methyldopamine and deoxyepinephrine, is an organic compound and a natural catecholamine drug that is structurally related to the important neurotransmitters dopamine and epinephrine. Epinine has been found in plants, insects, and animals. Epinine is an active form of ibopamine, when after oral administra- tion it is hydrolyzed by plasma esterase, which is currently being widely studied for the treatment of congestive heart failure [3–5]. One of the most prominent pharmacological characteristics of epinine is its ability to raise blood pressure, which was reported by Barger and Dale as early as 1910 [6]. In addition, epinine is suggested as a suitable substitute for epinephrine [7]. Although the use of epinine has many benefits, an overdose of epinine Micromachines 2022, 13, 88. https://doi.org/10.3390/mi13010088 https://www.mdpi.com/journal/micromachines
-
Upload
khangminh22 -
Category
Documents
-
view
1 -
download
0
Transcript of Synthesis and Characterization of GO/ZIF-67 Nanocomposite
�����������������
Citation: Shahsavari, M.; Mortazavi,
M.; Tajik, S.; Sheikhshoaie, I.;
Beitollahi, H. Synthesis and
Characterization of GO/ZIF-67
Nanocomposite: Investigation of
Catalytic Activity for the
Determination of Epinine in the
Presence of Dobutamine.
Micromachines 2022, 13, 88. https://
doi.org/10.3390/mi13010088
Academic Editor: Mehmet
Remzi Dokmeci
Received: 1 November 2021
Accepted: 3 January 2022
Published: 6 January 2022
Publisher’s Note: MDPI stays neutral
with regard to jurisdictional claims in
published maps and institutional affil-
iations.
Copyright: © 2022 by the authors.
Licensee MDPI, Basel, Switzerland.
This article is an open access article
distributed under the terms and
conditions of the Creative Commons
Attribution (CC BY) license (https://
creativecommons.org/licenses/by/
4.0/).
micromachines
Article
Synthesis and Characterization of GO/ZIF-67 Nanocomposite:Investigation of Catalytic Activity for the Determination ofEpinine in the Presence of DobutamineMahboobeh Shahsavari 1, Mojtaba Mortazavi 2, Somayeh Tajik 3,*, Iran Sheikhshoaie 1 and Hadi Beitollahi 4,*
1 Department of Chemistry, Faculty of Science, Shahid Bahonar University of Kerman, Kerman 7616914111,Iran; [email protected] (M.S.); [email protected] (I.S.)
2 Biotechnology Department, Institute of Science and High Technology and Environmental Sciences,Graduate University of Advanced Technology, Kerman 7631885356, Iran; [email protected]
3 Research Center of Tropical and Infectious Diseases, Kerman University of Medical Sciences,Kerman 7616913555, Iran
4 Environment Department, Institute of Science and High Technology and Environmental Sciences,Graduate University of Advanced Technology, Kerman 7631885356, Iran
* Correspondence: [email protected] (S.T.); [email protected] (H.B.); Tel.: +98-34-26226613 (H.B.)
Abstract: In this study, we prepared graphene oxide (GO)/ZIF-67 nanocomposites. Therefore,GO/ZIF-67 nanocomposites were used as a modifier on a screen-printed electrode (GO/ZIF-67/SPE)for studying the electrochemical behavior of epinine in phosphate buffer saline (PBS) at pH 7.0 withvoltammetry techniques. The GO/ZIF-67/SPE showed greater electrocatalytic activities than the bareSPE. As a result, the GO/ZIF-67/SPE was utilized for additional electrochemical examinations. Theepinine concentration determination was in the range 9.0 × 10⁻⁸ M to 5.0 × 10⁻⁴ M, and the limitof detection (LOD) as well as the limit of quantification (LOQ) equaled 2.0 and 6.6 nM, respectively.From the scan rate study, the oxidation of epinine was found to be diffusion-controlled, and thesimultaneous detection of epinine and dobutamine were well achieved with the differential pulsevoltammetric (DPV) technique. Moreover, the stability and reproducibility of epinine at the GO/ZIF-67/SPE was studied, and the use of the GO/ZIF-67/SPE to detect epinine and dobutamine in realsamples was furthermore successfully demonstrated.
Keywords: epinine; dobutamine; voltammetric sensors; screen printed electrode; GO/ZIF-67nanocomposite
1. Introduction
Catecholamines play a significant role in the nervous system as central and peripheralneurotransmitters. These materials are generated by the sympathetic nervous system acti-vation and function as neurotransmitters and hormones for monitoring the heart rate, brainmuscles activities, blood pressure, glycogenolysis, body temperature, and fatty acid mobi-lization [1,2]. Therefore, researchers have concentered on the design of a simplified rapidtechnique for detecting catecholamines in bioscience, biotechnology, and also medicinalchemistry, in particular in neurochemistry [1–3].
Epinine, also known by the common names N-methyldopamine and deoxyepinephrine,is an organic compound and a natural catecholamine drug that is structurally related to theimportant neurotransmitters dopamine and epinephrine. Epinine has been found in plants,insects, and animals. Epinine is an active form of ibopamine, when after oral administra-tion it is hydrolyzed by plasma esterase, which is currently being widely studied for thetreatment of congestive heart failure [3–5]. One of the most prominent pharmacologicalcharacteristics of epinine is its ability to raise blood pressure, which was reported by Bargerand Dale as early as 1910 [6]. In addition, epinine is suggested as a suitable substitute forepinephrine [7]. Although the use of epinine has many benefits, an overdose of epinine
Micromachines 2022, 13, 88. https://doi.org/10.3390/mi13010088 https://www.mdpi.com/journal/micromachines
Micromachines 2022, 13, 88 2 of 16
can be harmful to the human body and the use of this drug must be controlled in patients.Hence, epinine quantification in the samples of human serum and urine would be necessaryto develop the life and drug sciences.
Another drug called dobutamine, 4-[2-[[3-(4-hydroxyphenyl)-1-methylpropyl]amino]ethyl]-1,2-benzenediol, has been introduced as one of the most important inotropic syntheticcatecholamine medicines with heavy β-adrenergic activities. Dobutamine is commonly uti-lized for treating cardiogenic shock and heart failure [8–11]. In fact, dobutamine contributeimportantly to functions of the central nervous, hormonal, renal, and cardio-vascularsystems. Moreover, it increases the cardiac output or the heart rate that causes the improve-ment of left ventricular performance, lessens the central venous and pulmonary arterywedge pressure and diminishes the symptom of the congestive heart failure; nonetheless,the most dangerous side effect of dobutamine is increased risk of arrhythmia, includingfatal arrhythmias [12].
Changes in the metabolism of catecholamines in the human body could result insome severe illnesses (hypertension, neuroblastoma, and pheochromocytoma). The properdetection of the lower or greater content of the body would allow recording the incidenceof specific diseases at the early phase and prevent additional progression of the diseases.Moreover, the quantities of catecholamines in biological fluids possibly show their physi-ological contributions in the body [13–15]. Therefore, it is important to develop a highlyselective, sensitive, precise, and cost-effective analytical procedure to measure epinine anddobutamine concentrations in biological fluids.
Many reports are mentioned in the literature for the determination of epinine ordobutamine using various analytical methods, including liquid chromatography, normalRaman spectroscopy, spectrophotometry, spectrofluorimetry, capillary electrophoresis, andchemiluminescence [16–26].
Although these methods have been successfully used, they are laborious and needcomplicated operation and costly instrumentation, which would restrict their utilizations.Moreover, experts in the field utilized electrochemical techniques because of benefits suchas simplified operation, faster responses, very good reproducibility, acceptable stability,lower costs, and lower limits of detection (LODs) [27–33].
In addition, electrochemical determination with screen-printed electrodes (SPEs) hasbeen a widespread utilization in clinical and biomedical areas for the detection of bi-ological molecules (proteins/peptides, DNA, amino acids, and various metabolites) todiagnose or prognose diseases. These electrodes have easy modification techniques, includ-ing quickness, disposability, affordability, robustness, trace volume consumption, higherreproducibility, and decreased pretreatment requirements for samples, which would beencouraging to detect biological molecules in complex matrices [34].
Chemically modified electrodes improve mass transfer kinetics at low overpotential,resulting in the decrease of interferences’ effect and avoiding surface fouling [35–41].
Nowadays, various nanostructured materials have been developed and employedfor electrochemical studies [42–49]. Nanotechnology reduces the sizes of nanoparticles(NPs) of raw materials and improves the functionality of physical properties of NPs [50].Zeolitic imidazolate frameworks (ZIFs), an attractive subclass of metal–organic frameworks(MOFs), have gained increasing attention and have been used in many fields of science dueto ultrahigh porosity, great surface areas, facility of synthesis, and accessible coordinativeunsaturated sites compared with most of other MOFs [51,52]. However, these porousmaterials suffer from low electrical conductivity, electroactivity, and stability, which limitstheir use in electrochemical applications. Introducing high-conductive materials withremarkable mechanical strength such as graphene could be a solution to conquering thisproblem [53].
The present study attempted the synthesis and characterization of graphene ox-ide (GO)/ZIF-67 nanocomposites by using a simple synthesis approach. The preparednanocomposites has been described by various techniques. The objective of the presentresearch was designing and fabricating a SPE modified with GO/ZIF-67 nanocomposites

Micromachines 2022, 13, 88 3 of 16
as a novel electrode to detect epinine and dobutamine in aqueous buffer solutions andevaluating the analytical performance of this modified electrode by epinine quantificationin the presence of dobutamine. At the end, we examined real samples to determine epinineand dobutamine using the proposed electrochemical sensor.
2. Experimental2.1. Instruments and Reagents
According to the research design, we used the Autolab PGSTAT302Npotentiostat/galvanostat monitored with the GPES software for electrochemical assessmentand analysis. The SPE (DropSens, DRP-110, Asturias, Spain) contained 3 traditional electrodes,including a silver pseudo-reference, an unmodified or modified graphite working electrode,and a graphite counter. Moreover, we used a Metrohm 710 pH meter to measure pH.
Epinine, dobutamine, and each of the remained reagents were of analytical grade.Sigma-Aldrich has been chosen to supply these materials. In addition, orthophosphoricacid as well as the respective salts with pH values ranging between 2.0 and 9.0 were utilizedto procure the buffer solution.
2.2. Preparation of GO/ZIF-67
GO/ZIF-67 was synthesized according to the literature. Fifty milligrams of GO wasdispersed with a stirrer for 15 min, and then 20 mg of Co(NO3)2·4H2O were added to it.The mixture was stirred with a stirrer for one hour. Simultaneously, 50 mg of 2-methylimidazole were dissolved in 20 mL of water. An imidazole solution was added to the initialmixture, and after stirring for one hour, the mixture was transferred to an autoclave and leftat 100 ◦C for 3 h. Finally, the precipitate was collected after being centrifuged and washedthree times with ethanol.
2.3. Preparing the Modified Electrode
The unmodified SPE was covered with GO/ZIF-67 nanocomposites in an aqueoussolution (1 mL) and developed with the dispersion of 1 mg of the GO/ZIF-67 nanocom-posites and 1 h ultrasonication. Then, 3 µL aliquots of a GO/ZIF-67 nanocomposites/H2Osuspension solution were placed on the working electrode. After the solvent evaporated,the electrode surface was thoroughly rinsed with deionized water to wash away the unim-mobilized modifier and dried at room temperature. The ZIF-67/SPE and the GO/SPE wereprepared with the same method using ZIF-67 and GO, instead of GO/ZIF-67.
The surface areas of the GO/ZIF-67/SPE and the bare SPE were obtained by cyclicvoltammetry (CV) using 1 mM K3Fe(CN)6 at different scan rates. Using the Randles–Sevcikequation for GO/ZIF-67/SPE, the electrode surface was found to be 0.095 cm2, which wasabout 3.0 times greater than that of the bare SPE.
2.4. Preparing the Real Samples
Dobutamine ampule (250 mg/ampoule; Exir Pharmaceutical Co., Tehran, Iran) waspurchased, and the diluted solution was obtained by dilution with a 0.1 M PBS solution(pH equal to 7.0) and immediately utilized to determine dobutamine. Then, an appropriatecontent of the final solution was transferred to the electrochemical cell and consequentlyutilized to analyze dobutamine using the standard addition method.
Upon the samples collection, we used a refrigerator to store the urine samples andcentrifuged 30 mL of the samples at 3000 rpm for 10 min. Then, we filtered the supernatantwith a 0.45 µm filter. After that, 20 mL of the solution were transported into a 50 mLvolumetric flask and then diluted to the mark with PBS at pH of 7.0. In the next stage,diverse contents of epinine and dobutamine were used to spike the diluted urine samples,and the epinine and dobutamine contents were analyzed by this new technique with thestandard addition method for the prevention of further matrix effects.

Micromachines 2022, 13, 88 4 of 16
3. Results and Discussion3.1. Characterizing the GO/ZIF-67 Nanocomposites3.1.1. Energy-Dispersive X-ray Spectroscopy (EDX)
The results of Energy-Dispersive X-ray Spectroscopy (EDX) mapping analyses per-formed on GO/ZIF-67 nanocomposites are reported in Figure 1a–d. During the EDXmeasurement, different areas were focused, and the corresponding peaks are shown inFigure 1e. Both ZIF-67 and GO can be seen in the synthesized composite nanostructure inthe EDX spectrum. These results confirmed the presence of Co along with C, O, and N. Inaddition, the results of EDX (Figure 1e) showed the weight percentages of the elements C,N, O, and Co were 50.28%, 20.36%, 21.92%, and 7.44%, respectively. In the EDX spectrum,the measured atomic % values were 1.7, 20.37, 58.66, and 19.20 for Co, N, C, O, respectively.
Micromachines 2022, 13, x FOR PEER REVIEW 4 of 18
volumetric flask and then diluted to the mark with PBS at pH of 7.0. In the next stage, diverse contents of epinine and dobutamine were used to spike the diluted urine sam-ples, and the epinine and dobutamine contents were analyzed by this new technique with the standard addition method for the prevention of further matrix effects.
3. Results and Discussion 3.1. Characterizing the GO/ZIF-67 Nanocomposites 3.1.1. Energy-Dispersive X-ray Spectroscopy (EDX)
The results of Energy-Dispersive X-ray Spectroscopy (EDX) mapping analyses per-formed on GO/ZIF-67 nanocomposites are reported in Figure 1a–d. During the EDX measurement, different areas were focused, and the corresponding peaks are shown in Figure 1e. Both ZIF-67 and GO can be seen in the synthesized composite nanostructure in the EDX spectrum. These results confirmed the presence of Co along with C, O, and N. In addition, the results of EDX (Figure 1e) showed the weight percentages of the ele-ments C, N, O, and Co were 50.28%, 20.36%, 21.92%, and 7.44%, respectively. In the EDX spectrum, the measured atomic % values were 1.7, 20.37, 58.66, and 19.20 for Co, N, C, O, respectively.
Micromachines 2022, 13, x FOR PEER REVIEW 5 of 18
Figure 1. (a–d). Energy-Dispersive X-ray (EDX) mapping; (e) EDX spectra of nanoparticles in gra-phene oxide (GO)/ZIF-67 nanocomposites.
3.1.2. FTIR Analysis FTIR analysis was conducted with a Shimadzu 8400 spectrometer. In order to fur-
ther demonstration the structure of NPs, the FTIR spectrum of the GO/ZIF-67 nano-composites is presented in Figure 2. The FTIR peaks shown in this figure were exactly the same as those previously reported. Figure 2 shows all the peaks of 2-methyl imidaz-ole. Only one extra peak was seen at 418 cm−1, which is the reason for the presence of the Co–N bond. The adsorption bands at 1722 and 984 cm−1 can be attributed to the C=O bending vibration and the C–N tensile in the GO/ZIF-67 nanocomposites, respectively. The peaks of ZIF-67 were shown at 1608, 1566, and 3399 cm−1. The related bands to C=C and C=N appeared at 1608 and 1566 cm−1, respectively. The widest band at 3399 cm−1 can be ascribed to the O–H stretching vibration in the solvent [54,55]. There were some sharp peaks in regions of 900–1400 cm−1 and below 800 cm−1 that may be assigned to the in-plane bending of the ring and out-of-plane bending, respectively [56].
Figure 1. (a–d). Energy-Dispersive X-ray (EDX) mapping; (e) EDX spectra of nanoparticles ingraphene oxide (GO)/ZIF-67 nanocomposites.
Micromachines 2022, 13, 88 5 of 16
3.1.2. FTIR Analysis
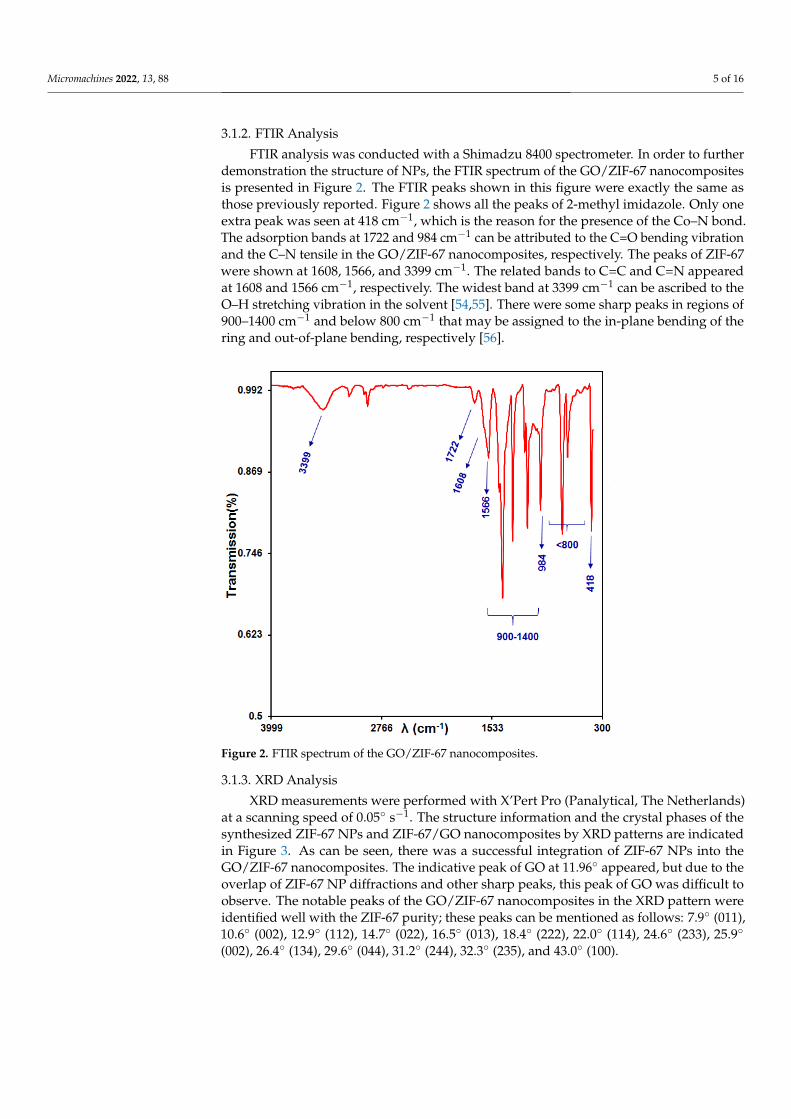
FTIR analysis was conducted with a Shimadzu 8400 spectrometer. In order to furtherdemonstration the structure of NPs, the FTIR spectrum of the GO/ZIF-67 nanocompositesis presented in Figure 2. The FTIR peaks shown in this figure were exactly the same asthose previously reported. Figure 2 shows all the peaks of 2-methyl imidazole. Only oneextra peak was seen at 418 cm−1, which is the reason for the presence of the Co–N bond.The adsorption bands at 1722 and 984 cm−1 can be attributed to the C=O bending vibrationand the C–N tensile in the GO/ZIF-67 nanocomposites, respectively. The peaks of ZIF-67were shown at 1608, 1566, and 3399 cm−1. The related bands to C=C and C=N appearedat 1608 and 1566 cm−1, respectively. The widest band at 3399 cm−1 can be ascribed to theO–H stretching vibration in the solvent [54,55]. There were some sharp peaks in regions of900–1400 cm−1 and below 800 cm−1 that may be assigned to the in-plane bending of thering and out-of-plane bending, respectively [56].
Micromachines 2022, 13, x FOR PEER REVIEW 6 of 18
Figure 2. FTIR spectrum of the GO/ZIF-67 nanocomposites.
3.1.3. XRD Analysis XRD measurements were performed with X’Pert Pro (Panalytical, Netherlands) at a
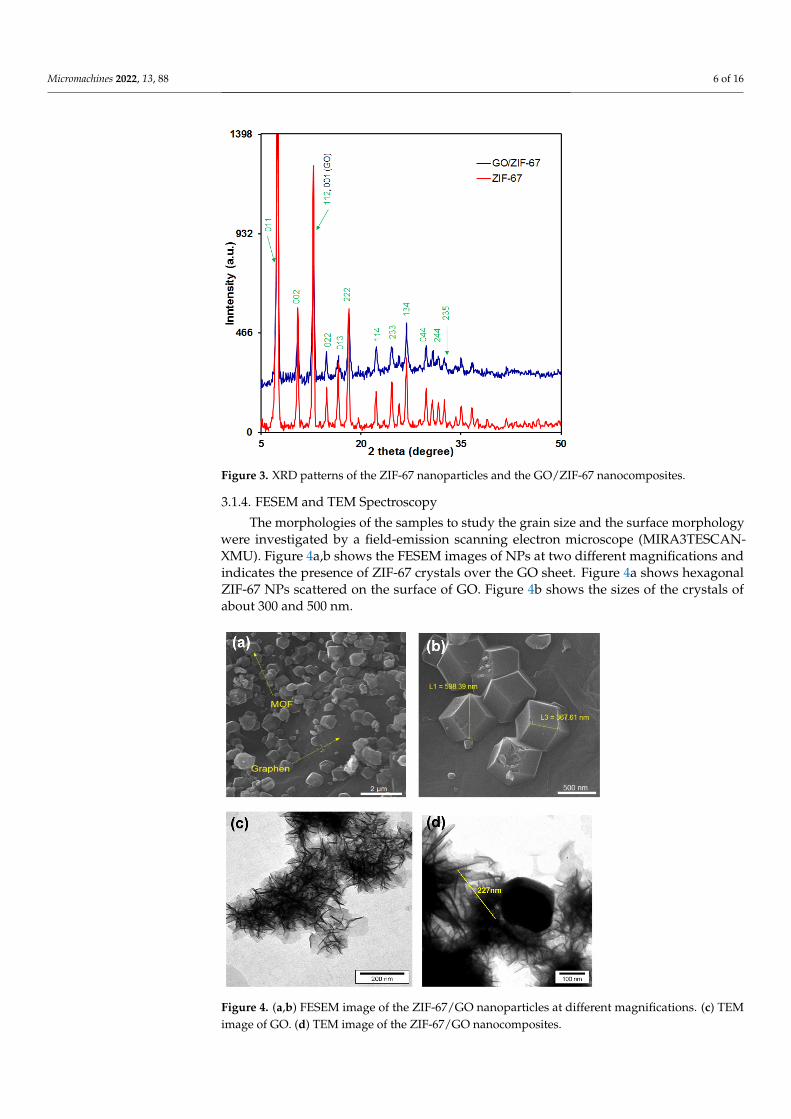
scanning speed of 0.05° s−1. The structure information and the crystal phases of the syn-thesized ZIF-67 NPs and ZIF-67/GO nanocomposites by XRD patterns are indicated in Figure 3. As can be seen, there was a successful integration of ZIF-67 NPs into the GO/ZIF-67 nanocomposites. The indicative peak of GO at 11.96° appeared, but due to the overlap of ZIF-67 NP diffractions and other sharp peaks, this peak of GO was diffi-cult to observe. The notable peaks of the GO/ZIF-67 nanocomposites in the XRD pattern were identified well with the ZIF-67 purity; these peaks can be mentioned as follows: 7.9° (011), 10.6° (002), 12.9° (112), 14.7° (022), 16.5° (013), 18.4° (222), 22.0° (114), 24.6° (233), 25.9° (002), 26.4° (134), 29.6° (044), 31.2° (244), 32.3° (235), and 43.0° (100).
Figure 3. XRD patterns of the ZIF-67 nanoparticles and the GO/ZIF-67 nanocomposites.
Figure 2. FTIR spectrum of the GO/ZIF-67 nanocomposites.
3.1.3. XRD Analysis
XRD measurements were performed with X’Pert Pro (Panalytical, The Netherlands)at a scanning speed of 0.05◦ s−1. The structure information and the crystal phases of thesynthesized ZIF-67 NPs and ZIF-67/GO nanocomposites by XRD patterns are indicatedin Figure 3. As can be seen, there was a successful integration of ZIF-67 NPs into theGO/ZIF-67 nanocomposites. The indicative peak of GO at 11.96◦ appeared, but due to theoverlap of ZIF-67 NP diffractions and other sharp peaks, this peak of GO was difficult toobserve. The notable peaks of the GO/ZIF-67 nanocomposites in the XRD pattern wereidentified well with the ZIF-67 purity; these peaks can be mentioned as follows: 7.9◦ (011),10.6◦ (002), 12.9◦ (112), 14.7◦ (022), 16.5◦ (013), 18.4◦ (222), 22.0◦ (114), 24.6◦ (233), 25.9◦
(002), 26.4◦ (134), 29.6◦ (044), 31.2◦ (244), 32.3◦ (235), and 43.0◦ (100).
Micromachines 2022, 13, 88 6 of 16
Micromachines 2022, 13, x FOR PEER REVIEW 6 of 18
Figure 2. FTIR spectrum of the GO/ZIF-67 nanocomposites.
3.1.3. XRD Analysis XRD measurements were performed with X’Pert Pro (Panalytical, Netherlands) at a
scanning speed of 0.05° s−1. The structure information and the crystal phases of the syn-thesized ZIF-67 NPs and ZIF-67/GO nanocomposites by XRD patterns are indicated in Figure 3. As can be seen, there was a successful integration of ZIF-67 NPs into the GO/ZIF-67 nanocomposites. The indicative peak of GO at 11.96° appeared, but due to the overlap of ZIF-67 NP diffractions and other sharp peaks, this peak of GO was diffi-cult to observe. The notable peaks of the GO/ZIF-67 nanocomposites in the XRD pattern were identified well with the ZIF-67 purity; these peaks can be mentioned as follows: 7.9° (011), 10.6° (002), 12.9° (112), 14.7° (022), 16.5° (013), 18.4° (222), 22.0° (114), 24.6° (233), 25.9° (002), 26.4° (134), 29.6° (044), 31.2° (244), 32.3° (235), and 43.0° (100).
Figure 3. XRD patterns of the ZIF-67 nanoparticles and the GO/ZIF-67 nanocomposites. Figure 3. XRD patterns of the ZIF-67 nanoparticles and the GO/ZIF-67 nanocomposites.
3.1.4. FESEM and TEM Spectroscopy
The morphologies of the samples to study the grain size and the surface morphologywere investigated by a field-emission scanning electron microscope (MIRA3TESCAN-XMU). Figure 4a,b shows the FESEM images of NPs at two different magnifications andindicates the presence of ZIF-67 crystals over the GO sheet. Figure 4a shows hexagonalZIF-67 NPs scattered on the surface of GO. Figure 4b shows the sizes of the crystals ofabout 300 and 500 nm.
Micromachines 2022, 13, x FOR PEER REVIEW 7 of 18
3.1.4. FESEM and TEM Spectroscopy The morphologies of the samples to study the grain size and the surface morphol-
ogy were investigated by a field-emission scanning electron microscope (MI-RA3TESCAN-XMU). Figure 4a,b shows the FESEM images of NPs at two different mag-nifications and indicates the presence of ZIF-67 crystals over the GO sheet. Figure 4a shows hexagonal ZIF-67 NPs scattered on the surface of GO. Figure 4b shows the sizes of the crystals of about 300 and 500 nm.
Figure 4c,d show TEM images of GO and GO/ZIF-67 nanocomposites by LEO912-AB instrument. The TEM analysis provided another evidence about the assem-bly of ZIF-67 over graphene sheets. Figure 4c displays that GO had many wrinkles and restacking in some areas on its sheet, and these phenomena were attributed to the exist-ence of van der Waals forces.
Figure 4. (a,b) FESEM image of the ZIF-67/GO nanoparticles at different magnifications. (c) TEM image of GO. (d) TEM image of the ZIF-67/GO nanocomposites.
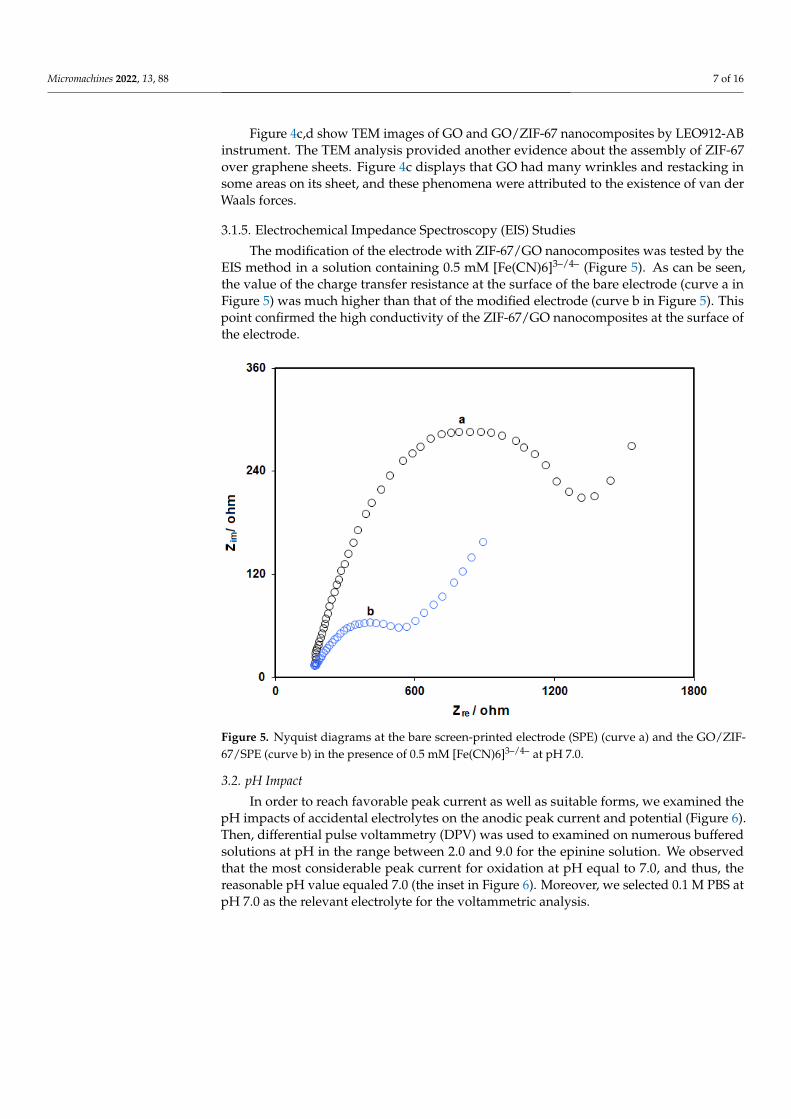
3.1.5. Electrochemical Impedance Spectroscopy (EIS) Studies The modification of the electrode with ZIF-67/GO nanocomposites was tested by
the EIS method in a solution containing 0.5 mM [Fe(CN)6]3–/4– (Figure 5). As can be seen, the value of the charge transfer resistance at the surface of the bare electrode (curve a in Figure 5) was much higher than that of the modified electrode (curve b in Figure 5). This point confirmed the high conductivity of the ZIF-67/GO nanocomposites at the surface of the electrode.
Figure 4. (a,b) FESEM image of the ZIF-67/GO nanoparticles at different magnifications. (c) TEMimage of GO. (d) TEM image of the ZIF-67/GO nanocomposites.
Micromachines 2022, 13, 88 7 of 16
Figure 4c,d show TEM images of GO and GO/ZIF-67 nanocomposites by LEO912-ABinstrument. The TEM analysis provided another evidence about the assembly of ZIF-67over graphene sheets. Figure 4c displays that GO had many wrinkles and restacking insome areas on its sheet, and these phenomena were attributed to the existence of van derWaals forces.
3.1.5. Electrochemical Impedance Spectroscopy (EIS) Studies
The modification of the electrode with ZIF-67/GO nanocomposites was tested by theEIS method in a solution containing 0.5 mM [Fe(CN)6]3–/4– (Figure 5). As can be seen,the value of the charge transfer resistance at the surface of the bare electrode (curve a inFigure 5) was much higher than that of the modified electrode (curve b in Figure 5). Thispoint confirmed the high conductivity of the ZIF-67/GO nanocomposites at the surface ofthe electrode.
Micromachines 2022, 13, x FOR PEER REVIEW 8 of 18
Figure 5. Nyquist diagrams at the bare screen-printed electrode (SPE) (curve a) and the GO/ZIF-67/SPE (curve b) in the presence of 0.5 mM [Fe(CN)6]3–/4– at pH 7.0.
3.2. pH Impact In order to reach favorable peak current as well as suitable forms, we examined the
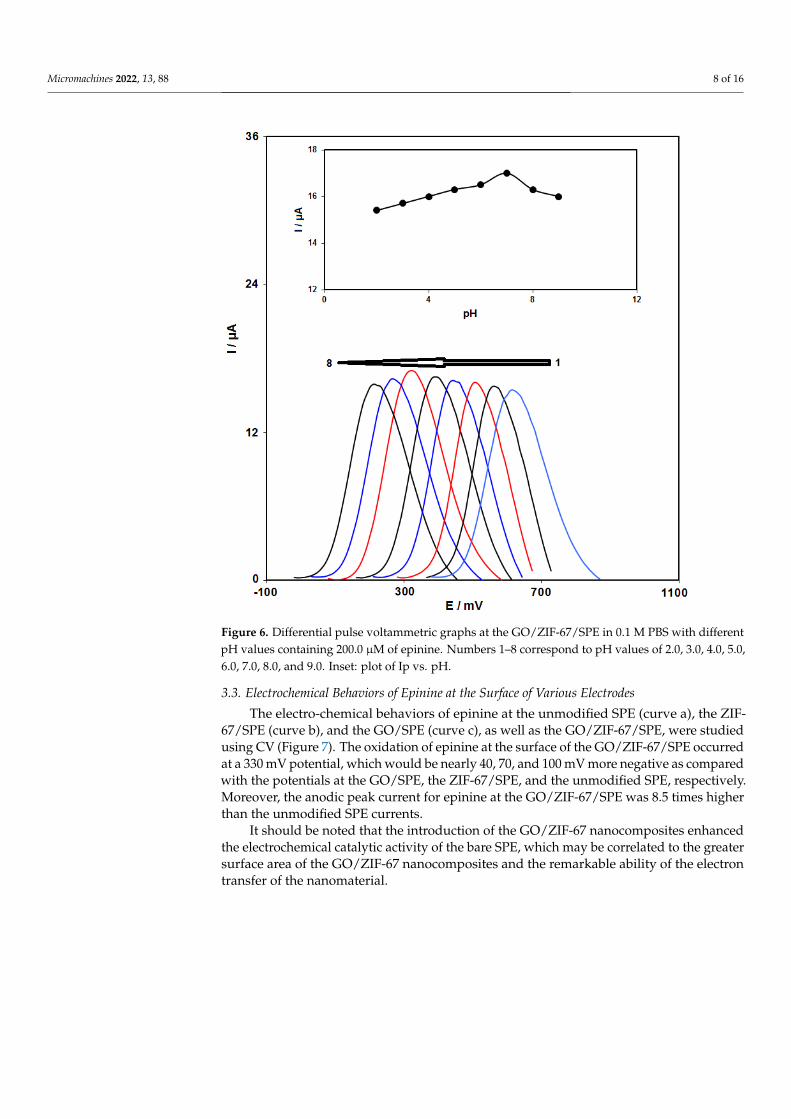
pH impacts of accidental electrolytes on the anodic peak current and potential (Figure 6). Then, differential pulse voltammetry (DPV) was used to examined on numerous buffered solutions at pH in the range between 2.0 and 9.0 for the epinine solution. We observed that the most considerable peak current for oxidation at pH equal to 7.0, and thus, the reasonable pH value equaled 7.0 (the inset in Figure 6). Moreover, we selected 0.1 M PBS at pH 7.0 as the relevant electrolyte for the voltammetric analysis.
Figure 5. Nyquist diagrams at the bare screen-printed electrode (SPE) (curve a) and the GO/ZIF-67/SPE (curve b) in the presence of 0.5 mM [Fe(CN)6]3–/4– at pH 7.0.
3.2. pH Impact
In order to reach favorable peak current as well as suitable forms, we examined thepH impacts of accidental electrolytes on the anodic peak current and potential (Figure 6).Then, differential pulse voltammetry (DPV) was used to examined on numerous bufferedsolutions at pH in the range between 2.0 and 9.0 for the epinine solution. We observedthat the most considerable peak current for oxidation at pH equal to 7.0, and thus, thereasonable pH value equaled 7.0 (the inset in Figure 6). Moreover, we selected 0.1 M PBS atpH 7.0 as the relevant electrolyte for the voltammetric analysis.
Micromachines 2022, 13, 88 8 of 16Micromachines 2022, 13, x FOR PEER REVIEW 9 of 18
Figure 6. Differential pulse voltammetric graphs at the GO/ZIF-67/SPE in 0.1 M PBS with different pH values containing 200.0 μM of epinine. Numbers 1–8 correspond to pH values of 2.0, 3.0, 4.0, 5.0, 6.0, 7.0, 8.0, and 9.0. Inset: plot of Ip vs. pH.
3.3. Electrochemical Behaviors of Epinine at the Surface of Various Electrodes The electro-chemical behaviors of epinine at the unmodified SPE (curve a), the
ZIF-67/SPE (curve b), and the GO/SPE (curve c), as well as the GO/ZIF-67/SPE, were studied using CV (Figure 7). The oxidation of epinine at the surface of the GO/ZIF-67/SPE oc-curred at a 330 mV potential, which would be nearly 40, 70, and 100 mV more negative as compared with the potentials at the GO/SPE, the ZIF-67/SPE, and the unmodified SPE, respectively. Moreover, the anodic peak current for epinine at the GO/ZIF-67/SPE was 8.5 times higher than the unmodified SPE currents.
It should be noted that the introduction of the GO/ZIF-67 nanocomposites en-hanced the electrochemical catalytic activity of the bare SPE, which may be correlated to the greater surface area of the GO/ZIF-67 nanocomposites and the remarkable ability of the electron transfer of the nanomaterial.
Figure 6. Differential pulse voltammetric graphs at the GO/ZIF-67/SPE in 0.1 M PBS with differentpH values containing 200.0 µM of epinine. Numbers 1–8 correspond to pH values of 2.0, 3.0, 4.0, 5.0,6.0, 7.0, 8.0, and 9.0. Inset: plot of Ip vs. pH.
3.3. Electrochemical Behaviors of Epinine at the Surface of Various Electrodes
The electro-chemical behaviors of epinine at the unmodified SPE (curve a), the ZIF-67/SPE (curve b), and the GO/SPE (curve c), as well as the GO/ZIF-67/SPE, were studiedusing CV (Figure 7). The oxidation of epinine at the surface of the GO/ZIF-67/SPE occurredat a 330 mV potential, which would be nearly 40, 70, and 100 mV more negative as comparedwith the potentials at the GO/SPE, the ZIF-67/SPE, and the unmodified SPE, respectively.Moreover, the anodic peak current for epinine at the GO/ZIF-67/SPE was 8.5 times higherthan the unmodified SPE currents.
It should be noted that the introduction of the GO/ZIF-67 nanocomposites enhancedthe electrochemical catalytic activity of the bare SPE, which may be correlated to the greatersurface area of the GO/ZIF-67 nanocomposites and the remarkable ability of the electrontransfer of the nanomaterial.
Micromachines 2022, 13, 88 9 of 16Micromachines 2022, 13, x FOR PEER REVIEW 10 of 18
Figure 7. CVs at the unmodified SPE (curve a), the ZIF-67/SPE (curve b), the GO/SPE (curve c), and the GO/ZIF-67/SPE (curve d) in 0.1 M PBS at pH of 7.0 in the presence of 200 μM epinine at a 50 mVs−1 scan rate.
3.4. The Impact of the Potential Scan Rate The effectiveness of the oxidation peak current of epinine on the GO/ZIF-67/SPE
was demonstrated by linear sweep voltammetry (LSV) at different scan rates. As seen in Figure 8, the peak current of epinine increased with the increasing scan rate. Moreover, a direct association existed between the current and the square root of the scan rate in a range of 10 to 400 mV s−1 (the inset in Figure 8), so that it could be a considerable associ-ation in conditions that epinine redox reaction was diffusion-controlled. As the charging current (ic) was dependent on v; hence, less scan rates were utilized for testing. Howev-er, testing would be lengthier at very lower scan rates. Thus, the 50 mV s−1 scan rate was selected as the optimum scan rate.
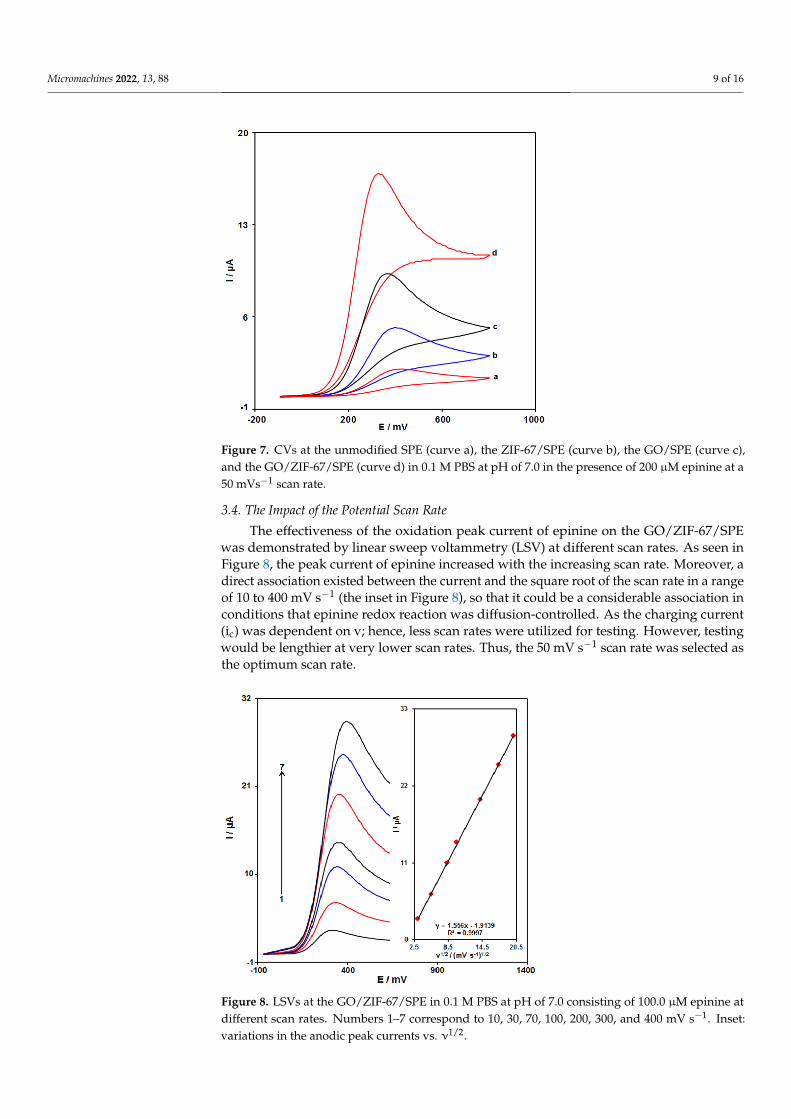
Figure 7. CVs at the unmodified SPE (curve a), the ZIF-67/SPE (curve b), the GO/SPE (curve c),and the GO/ZIF-67/SPE (curve d) in 0.1 M PBS at pH of 7.0 in the presence of 200 µM epinine at a50 mVs−1 scan rate.
3.4. The Impact of the Potential Scan Rate
The effectiveness of the oxidation peak current of epinine on the GO/ZIF-67/SPEwas demonstrated by linear sweep voltammetry (LSV) at different scan rates. As seen inFigure 8, the peak current of epinine increased with the increasing scan rate. Moreover, adirect association existed between the current and the square root of the scan rate in a rangeof 10 to 400 mV s−1 (the inset in Figure 8), so that it could be a considerable association inconditions that epinine redox reaction was diffusion-controlled. As the charging current(ic) was dependent on v; hence, less scan rates were utilized for testing. However, testingwould be lengthier at very lower scan rates. Thus, the 50 mV s−1 scan rate was selected asthe optimum scan rate.
Micromachines 2022, 13, x FOR PEER REVIEW 11 of 18
Figure 8. LSVs at the GO/ZIF-67/SPE in 0.1 M PBS at pH of 7.0 consisting of 100.0 μM epinine at different scan rates. Numbers 1–7 correspond to 10, 30, 70, 100, 200, 300, and 400 mV s−1. Inset: variations in the anodic peak currents vs. ν1/2.
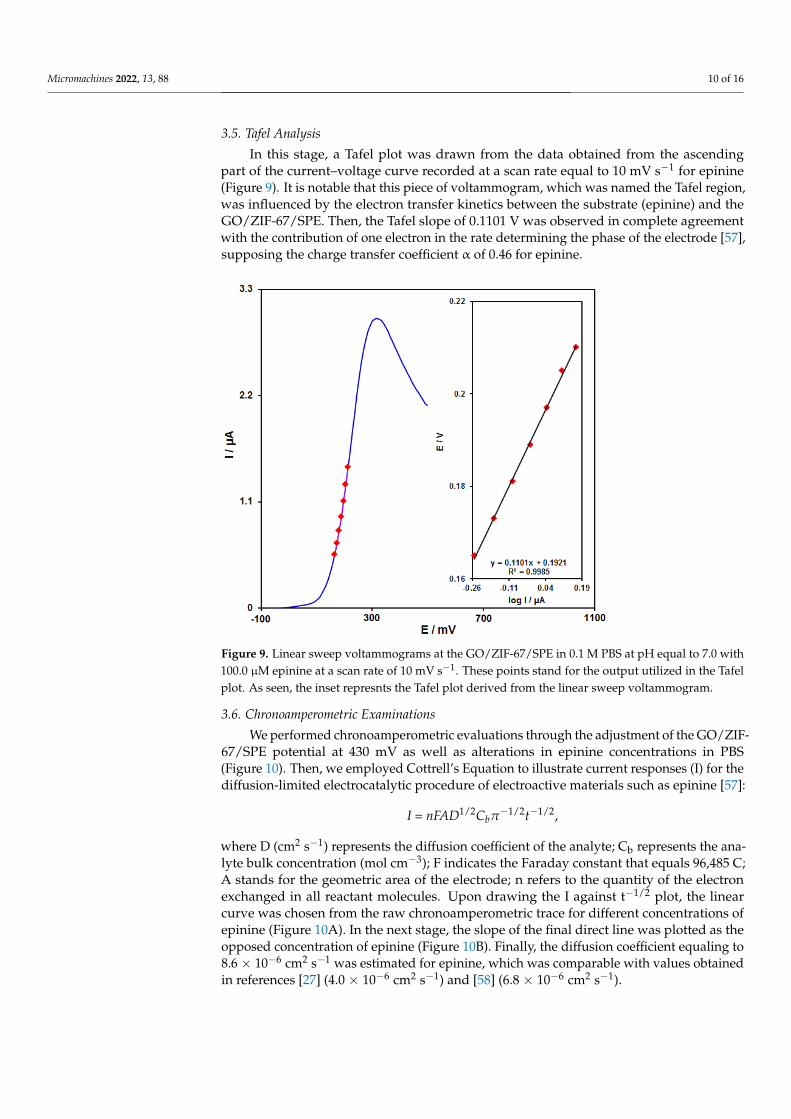
3.5. Tafel Analysis In this stage, a Tafel plot was drawn from the data obtained from the ascending
part of the current–voltage curve recorded at a scan rate equal to 10 mV s−1 for epinine (Figure 9). It is notable that this piece of voltammogram, which was named the Tafel re-gion, was influenced by the electron transfer kinetics between the substrate (epinine) and the GO/ZIF-67/SPE. Then, the Tafel slope of 0.1101 V was observed in complete agreement with the contribution of one electron in the rate determining the phase of the electrode [57], supposing the charge transfer coefficient α of 0.46 for epinine.
Figure 8. LSVs at the GO/ZIF-67/SPE in 0.1 M PBS at pH of 7.0 consisting of 100.0 µM epinine atdifferent scan rates. Numbers 1–7 correspond to 10, 30, 70, 100, 200, 300, and 400 mV s−1. Inset:variations in the anodic peak currents vs. ν1/2.
Micromachines 2022, 13, 88 10 of 16
3.5. Tafel Analysis
In this stage, a Tafel plot was drawn from the data obtained from the ascendingpart of the current–voltage curve recorded at a scan rate equal to 10 mV s−1 for epinine(Figure 9). It is notable that this piece of voltammogram, which was named the Tafel region,was influenced by the electron transfer kinetics between the substrate (epinine) and theGO/ZIF-67/SPE. Then, the Tafel slope of 0.1101 V was observed in complete agreementwith the contribution of one electron in the rate determining the phase of the electrode [57],supposing the charge transfer coefficient α of 0.46 for epinine.
Micromachines 2022, 13, x FOR PEER REVIEW 12 of 18
Figure 9. Linear sweep voltammograms at the GO/ZIF-67/SPE in 0.1 M PBS at pH equal to 7.0 with 100.0 μM epinine at a scan rate of 10 mV s−1. These points stand for the output utilized in the Tafel plot. As seen, the inset represnts the Tafel plot derived from the linear sweep voltammogram.
3.6. Chronoamperometric Examinations We performed chronoamperometric evaluations through the adjustment of the
GO/ZIF-67/SPE potential at 430 mV as well as alterations in epinine concentrations in PBS (Figure 10). Then, we employed Cottrell’s Equation to illustrate current responses (I) for the diffusion-limited electrocatalytic procedure of electroactive materials such as epinine [57]:
I = nFAD1/2Cbπ−1/2t−1/2,
where D (cm2 s−1) represents the diffusion coefficient of the analyte; Cb represents the an-alyte bulk concentration (mol cm−3); F indicates the Faraday constant that equals 96,485 C; A stands for the geometric area of the electrode; n refers to the quantity of the electron exchanged in all reactant molecules. Upon drawing the I against t–1/2 plot, the linear curve was chosen from the raw chronoamperometric trace for different concentrations of epinine (Figure 10A). In the next stage, the slope of the final direct line was plotted as the opposed concentration of epinine (Figure 10B). Finally, the diffusion coefficient equaling to 8.6 × 10⁻⁶ cm2 s−1 was estimated for epinine, which was comparable with val-ues obtained in references [27] (4.0 × 10⁻⁶ cm2 s−1) and [58] (6.8 × 10⁻⁶ cm2 s−1).
Figure 9. Linear sweep voltammograms at the GO/ZIF-67/SPE in 0.1 M PBS at pH equal to 7.0 with100.0 µM epinine at a scan rate of 10 mV s−1. These points stand for the output utilized in the Tafelplot. As seen, the inset represnts the Tafel plot derived from the linear sweep voltammogram.
3.6. Chronoamperometric Examinations
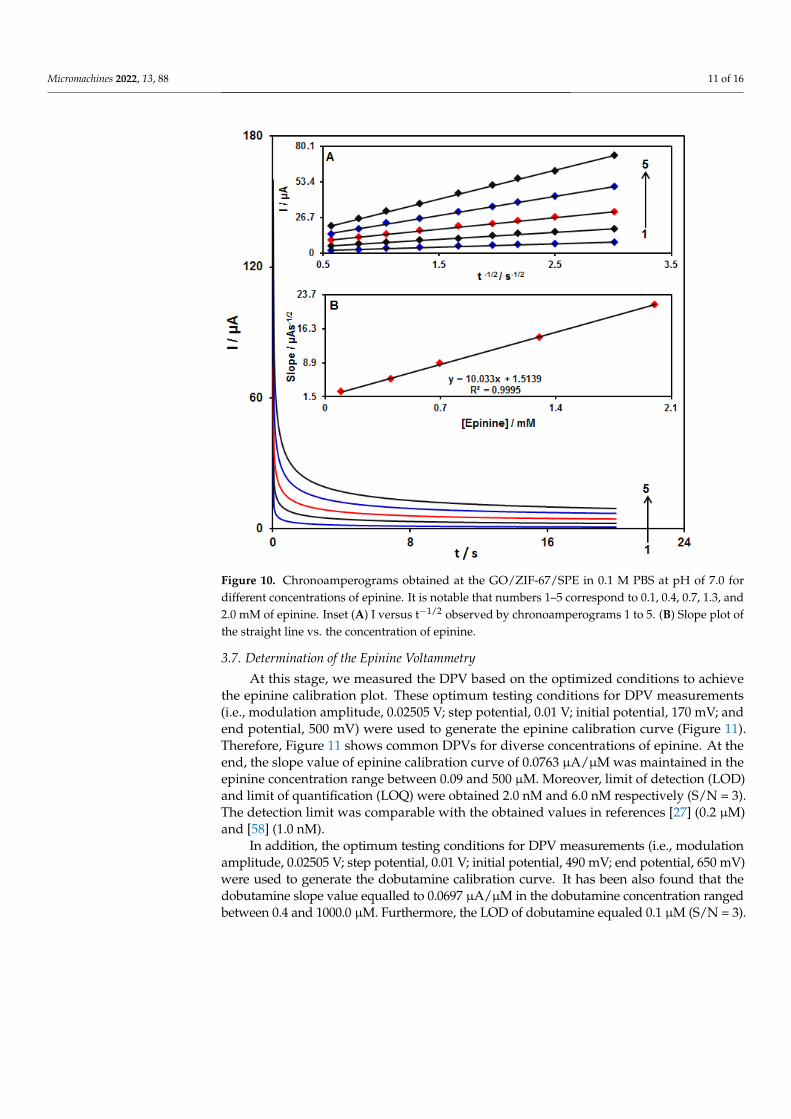
We performed chronoamperometric evaluations through the adjustment of the GO/ZIF-67/SPE potential at 430 mV as well as alterations in epinine concentrations in PBS(Figure 10). Then, we employed Cottrell’s Equation to illustrate current responses (I) for thediffusion-limited electrocatalytic procedure of electroactive materials such as epinine [57]:
I = nFAD1/2Cbπ−1/2t−1/2,
where D (cm2 s−1) represents the diffusion coefficient of the analyte; Cb represents the ana-lyte bulk concentration (mol cm−3); F indicates the Faraday constant that equals 96,485 C;A stands for the geometric area of the electrode; n refers to the quantity of the electronexchanged in all reactant molecules. Upon drawing the I against t−1/2 plot, the linearcurve was chosen from the raw chronoamperometric trace for different concentrations ofepinine (Figure 10A). In the next stage, the slope of the final direct line was plotted as theopposed concentration of epinine (Figure 10B). Finally, the diffusion coefficient equaling to8.6 × 10−6 cm2 s−1 was estimated for epinine, which was comparable with values obtainedin references [27] (4.0 × 10⁻⁶ cm2 s−1) and [58] (6.8 × 10⁻⁶ cm2 s−1).
Micromachines 2022, 13, 88 11 of 16Micromachines 2022, 13, x FOR PEER REVIEW 13 of 18
Figure 10. Chronoamperograms obtained at the GO/ZIF-67/SPE in 0.1 M PBS at pH of 7.0 for dif-ferent concentrations of epinine. It is notable that numbers 1–5 correspond to 0.1, 0.4, 0.7, 1.3, and 2.0 mM of epinine. Inset (A) I versus t−1/2 observed by chronoamperograms 1 to 5. (B) Slope plot of the straight line vs. the concentration of epinine.
3.7. Determination of the Epinine Voltammetry At this stage, we measured the DPV based on the optimized conditions to achieve
the epinine calibration plot. These optimum testing conditions for DPV measurements (i.e., modulation amplitude, 0.02505 V; step potential, 0.01 V; initial potential, 170 mV; and end potential, 500 mV) were used to generate the epinine calibration curve (Figure 11). Therefore, Figure 11 shows common DPVs for diverse concentrations of epinine. At the end, the slope value of epinine calibration curve of 0.0763 μA/μM was maintained in the epinine concentration range between 0.09 and 500 μM. Moreover, limit of detection (LOD) and limit of quantification (LOQ) were obtained 2.0 nM and 6.0 nM respectively (S/N = 3). The detection limit was comparable with the obtained values in references [27] (0.2 μM) and [58] (1.0 nM).
In addition, the optimum testing conditions for DPV measurements (i.e., modula-tion amplitude, 0.02505 V; step potential, 0.01 V; initial potential, 490 mV; end potential, 650 mV) were used to generate the dobutamine calibration curve. It has been also found that the dobutamine slope value equalled to 0.0697 μA/μM in the dobutamine concen-tration ranged between 0.4 and 1000.0 μM. Furthermore, the LOD of dobutamine equaled 0.1 μM (S/N = 3).
Figure 10. Chronoamperograms obtained at the GO/ZIF-67/SPE in 0.1 M PBS at pH of 7.0 fordifferent concentrations of epinine. It is notable that numbers 1–5 correspond to 0.1, 0.4, 0.7, 1.3, and2.0 mM of epinine. Inset (A) I versus t−1/2 observed by chronoamperograms 1 to 5. (B) Slope plot ofthe straight line vs. the concentration of epinine.
3.7. Determination of the Epinine Voltammetry
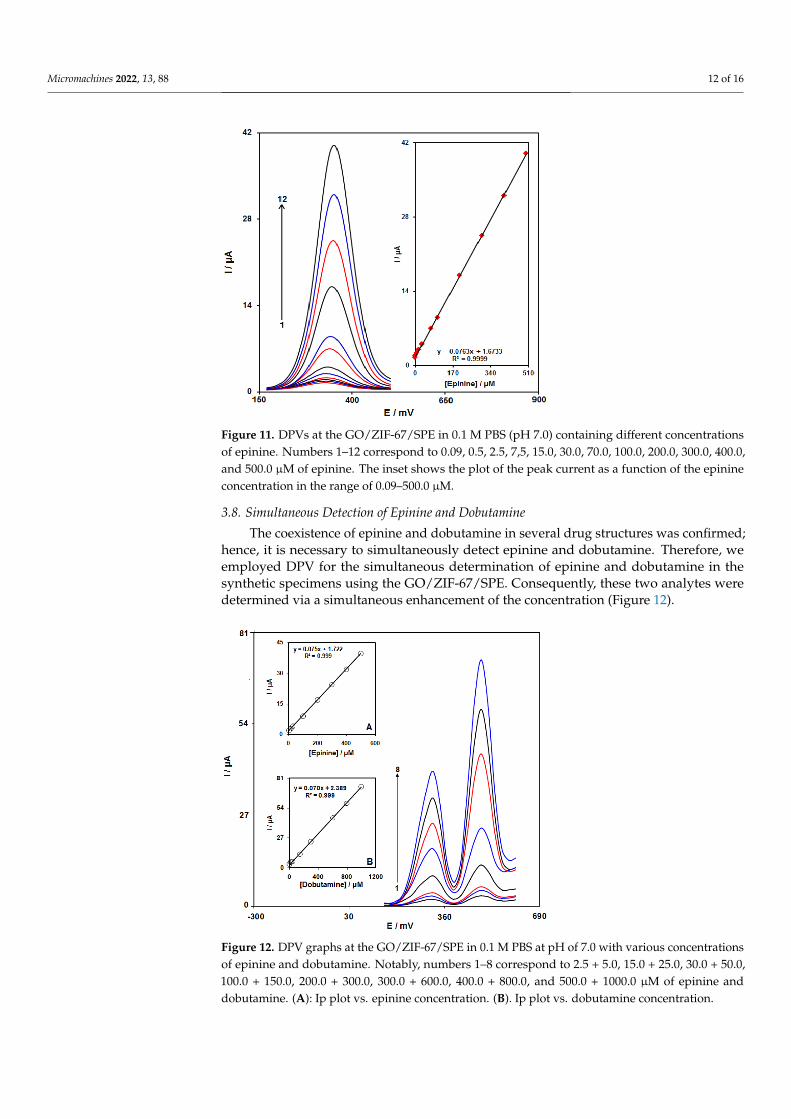
At this stage, we measured the DPV based on the optimized conditions to achievethe epinine calibration plot. These optimum testing conditions for DPV measurements(i.e., modulation amplitude, 0.02505 V; step potential, 0.01 V; initial potential, 170 mV; andend potential, 500 mV) were used to generate the epinine calibration curve (Figure 11).Therefore, Figure 11 shows common DPVs for diverse concentrations of epinine. At theend, the slope value of epinine calibration curve of 0.0763 µA/µM was maintained in theepinine concentration range between 0.09 and 500 µM. Moreover, limit of detection (LOD)and limit of quantification (LOQ) were obtained 2.0 nM and 6.0 nM respectively (S/N = 3).The detection limit was comparable with the obtained values in references [27] (0.2 µM)and [58] (1.0 nM).
In addition, the optimum testing conditions for DPV measurements (i.e., modulationamplitude, 0.02505 V; step potential, 0.01 V; initial potential, 490 mV; end potential, 650 mV)were used to generate the dobutamine calibration curve. It has been also found that thedobutamine slope value equalled to 0.0697 µA/µM in the dobutamine concentration rangedbetween 0.4 and 1000.0 µM. Furthermore, the LOD of dobutamine equaled 0.1 µM (S/N = 3).
Micromachines 2022, 13, 88 12 of 16Micromachines 2022, 13, x FOR PEER REVIEW 14 of 18
Figure 11. DPVs at the GO/ZIF-67/SPE in 0.1 M PBS (pH 7.0) containing different concentrations of epinine. Numbers 1–12 correspond to 0.09, 0.5, 2.5, 7,5, 15.0, 30.0, 70.0, 100.0, 200.0, 300.0, 400.0, and 500.0 μM of epinine. The inset shows the plot of the peak current as a function of the epinine concentration in the range of 0.09–500.0 μM.
3.8. Simultaneous Detection of Epinine and Dobutamine The coexistence of epinine and dobutamine in several drug structures was con-
firmed; hence, it is necessary to simultaneously detect epinine and dobutamine. There-fore, we employed DPV for the simultaneous determination of epinine and dobutamine in the synthetic specimens using the GO/ZIF-67/SPE. Consequently, these two analytes were determined via a simultaneous enhancement of the concentration (Figure 12).
Figure 12. DPV graphs at the GO/ZIF-67/SPE in 0.1 M PBS at pH of 7.0 with various concentra-tions of epinine and dobutamine. Notably, numbers 1–8 correspond to 2.5 + 5.0, 15.0 + 25.0, 30.0 + 50.0, 100.0 + 150.0, 200.0 + 300.0, 300.0 + 600.0, 400.0 + 800.0, and 500.0 + 1000.0 μM of epinine and
Figure 11. DPVs at the GO/ZIF-67/SPE in 0.1 M PBS (pH 7.0) containing different concentrationsof epinine. Numbers 1–12 correspond to 0.09, 0.5, 2.5, 7,5, 15.0, 30.0, 70.0, 100.0, 200.0, 300.0, 400.0,and 500.0 µM of epinine. The inset shows the plot of the peak current as a function of the epinineconcentration in the range of 0.09–500.0 µM.
3.8. Simultaneous Detection of Epinine and Dobutamine
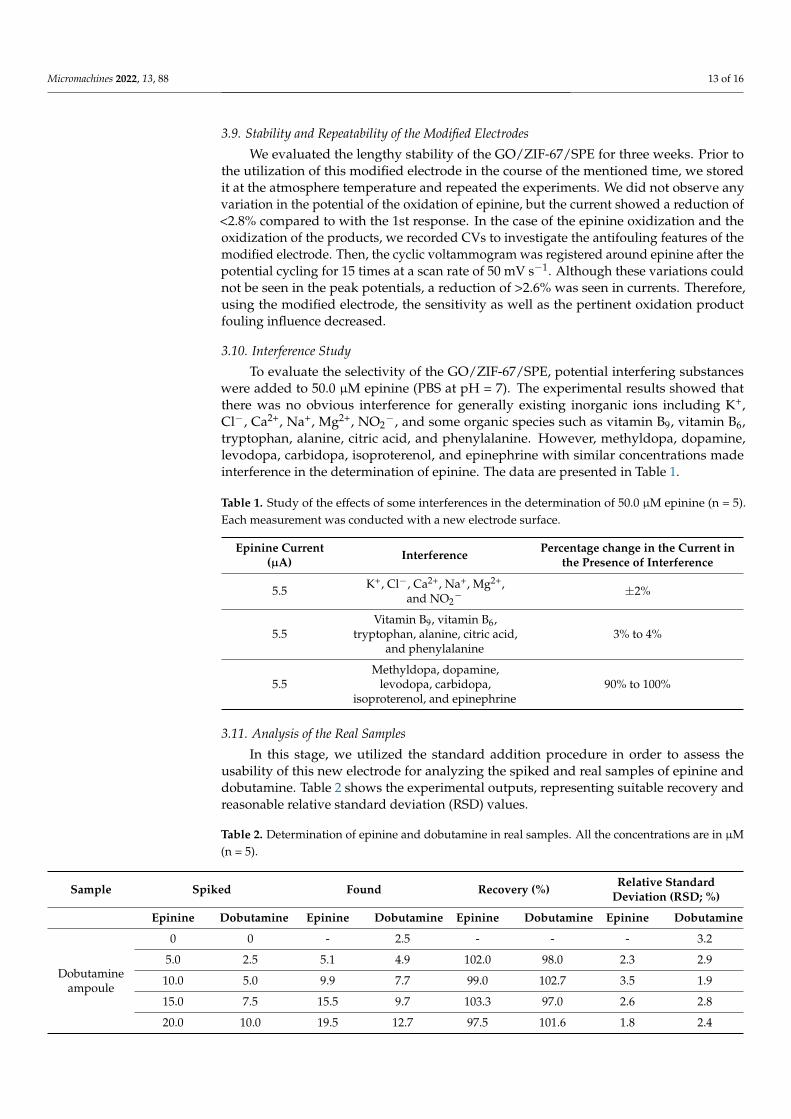
The coexistence of epinine and dobutamine in several drug structures was confirmed;hence, it is necessary to simultaneously detect epinine and dobutamine. Therefore, weemployed DPV for the simultaneous determination of epinine and dobutamine in thesynthetic specimens using the GO/ZIF-67/SPE. Consequently, these two analytes weredetermined via a simultaneous enhancement of the concentration (Figure 12).
Micromachines 2022, 13, x FOR PEER REVIEW 14 of 18
Figure 11. DPVs at the GO/ZIF-67/SPE in 0.1 M PBS (pH 7.0) containing different concentrations of epinine. Numbers 1–12 correspond to 0.09, 0.5, 2.5, 7,5, 15.0, 30.0, 70.0, 100.0, 200.0, 300.0, 400.0, and 500.0 μM of epinine. The inset shows the plot of the peak current as a function of the epinine concentration in the range of 0.09–500.0 μM.
3.8. Simultaneous Detection of Epinine and Dobutamine The coexistence of epinine and dobutamine in several drug structures was con-
firmed; hence, it is necessary to simultaneously detect epinine and dobutamine. There-fore, we employed DPV for the simultaneous determination of epinine and dobutamine in the synthetic specimens using the GO/ZIF-67/SPE. Consequently, these two analytes were determined via a simultaneous enhancement of the concentration (Figure 12).
Figure 12. DPV graphs at the GO/ZIF-67/SPE in 0.1 M PBS at pH of 7.0 with various concentra-tions of epinine and dobutamine. Notably, numbers 1–8 correspond to 2.5 + 5.0, 15.0 + 25.0, 30.0 + 50.0, 100.0 + 150.0, 200.0 + 300.0, 300.0 + 600.0, 400.0 + 800.0, and 500.0 + 1000.0 μM of epinine and
Figure 12. DPV graphs at the GO/ZIF-67/SPE in 0.1 M PBS at pH of 7.0 with various concentrationsof epinine and dobutamine. Notably, numbers 1–8 correspond to 2.5 + 5.0, 15.0 + 25.0, 30.0 + 50.0,100.0 + 150.0, 200.0 + 300.0, 300.0 + 600.0, 400.0 + 800.0, and 500.0 + 1000.0 µM of epinine anddobutamine. (A): Ip plot vs. epinine concentration. (B). Ip plot vs. dobutamine concentration.
Micromachines 2022, 13, 88 13 of 16
3.9. Stability and Repeatability of the Modified Electrodes
We evaluated the lengthy stability of the GO/ZIF-67/SPE for three weeks. Prior tothe utilization of this modified electrode in the course of the mentioned time, we storedit at the atmosphere temperature and repeated the experiments. We did not observe anyvariation in the potential of the oxidation of epinine, but the current showed a reduction of<2.8% compared to with the 1st response. In the case of the epinine oxidization and theoxidization of the products, we recorded CVs to investigate the antifouling features of themodified electrode. Then, the cyclic voltammogram was registered around epinine after thepotential cycling for 15 times at a scan rate of 50 mV s−1. Although these variations couldnot be seen in the peak potentials, a reduction of >2.6% was seen in currents. Therefore,using the modified electrode, the sensitivity as well as the pertinent oxidation productfouling influence decreased.
3.10. Interference Study
To evaluate the selectivity of the GO/ZIF-67/SPE, potential interfering substanceswere added to 50.0 µM epinine (PBS at pH = 7). The experimental results showed thatthere was no obvious interference for generally existing inorganic ions including K+,Cl−, Ca2+, Na+, Mg2+, NO2
−, and some organic species such as vitamin B9, vitamin B6,tryptophan, alanine, citric acid, and phenylalanine. However, methyldopa, dopamine,levodopa, carbidopa, isoproterenol, and epinephrine with similar concentrations madeinterference in the determination of epinine. The data are presented in Table 1.
Table 1. Study of the effects of some interferences in the determination of 50.0 µM epinine (n = 5).Each measurement was conducted with a new electrode surface.
Epinine Current(µA) Interference Percentage change in the Current in
the Presence of Interference
5.5 K+, Cl−, Ca2+, Na+, Mg2+,and NO2
− ±2%
5.5Vitamin B9, vitamin B6,
tryptophan, alanine, citric acid,and phenylalanine
3% to 4%
5.5Methyldopa, dopamine,
levodopa, carbidopa,isoproterenol, and epinephrine
90% to 100%
3.11. Analysis of the Real Samples
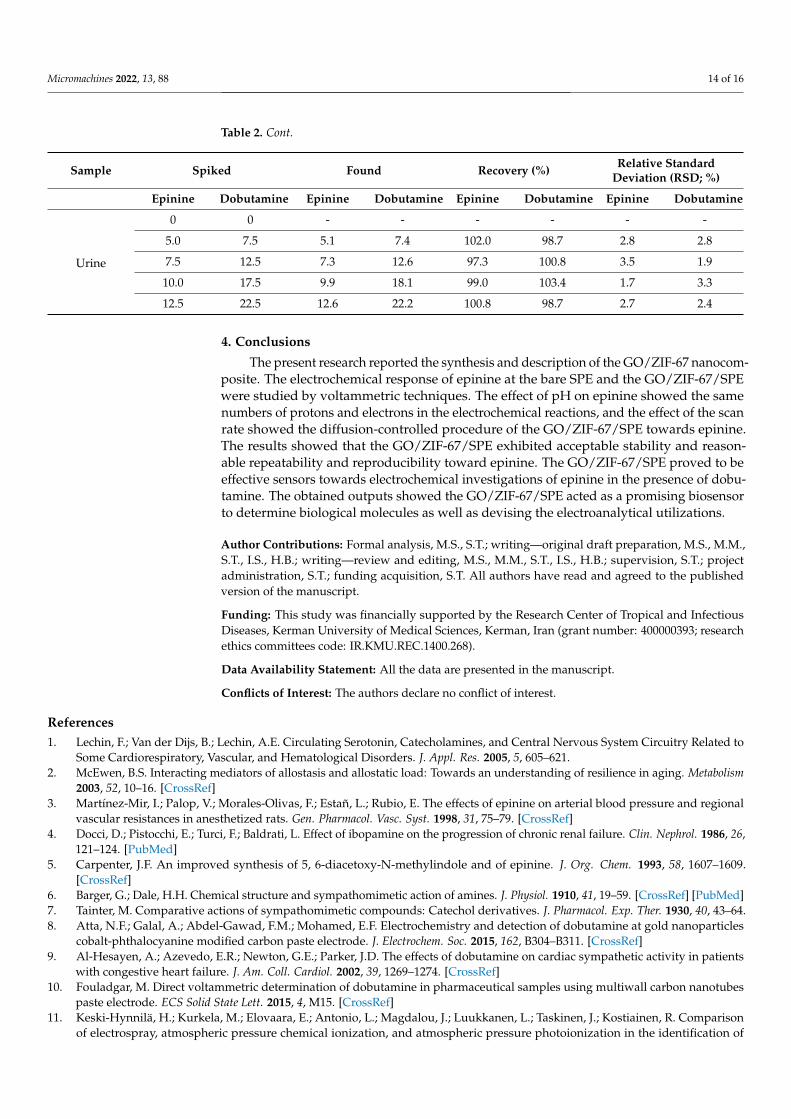
In this stage, we utilized the standard addition procedure in order to assess theusability of this new electrode for analyzing the spiked and real samples of epinine anddobutamine. Table 2 shows the experimental outputs, representing suitable recovery andreasonable relative standard deviation (RSD) values.
Table 2. Determination of epinine and dobutamine in real samples. All the concentrations are in µM(n = 5).
Sample Spiked Found Recovery (%) Relative StandardDeviation (RSD; %)
Epinine Dobutamine Epinine Dobutamine Epinine Dobutamine Epinine Dobutamine
Dobutamineampoule
0 0 - 2.5 - - - 3.2
5.0 2.5 5.1 4.9 102.0 98.0 2.3 2.9
10.0 5.0 9.9 7.7 99.0 102.7 3.5 1.9
15.0 7.5 15.5 9.7 103.3 97.0 2.6 2.8
20.0 10.0 19.5 12.7 97.5 101.6 1.8 2.4
Micromachines 2022, 13, 88 14 of 16
Table 2. Cont.
Sample Spiked Found Recovery (%) Relative StandardDeviation (RSD; %)
Epinine Dobutamine Epinine Dobutamine Epinine Dobutamine Epinine Dobutamine
Urine
0 0 - - - - - -
5.0 7.5 5.1 7.4 102.0 98.7 2.8 2.8
7.5 12.5 7.3 12.6 97.3 100.8 3.5 1.9
10.0 17.5 9.9 18.1 99.0 103.4 1.7 3.3
12.5 22.5 12.6 22.2 100.8 98.7 2.7 2.4
4. Conclusions
The present research reported the synthesis and description of the GO/ZIF-67 nanocom-posite. The electrochemical response of epinine at the bare SPE and the GO/ZIF-67/SPEwere studied by voltammetric techniques. The effect of pH on epinine showed the samenumbers of protons and electrons in the electrochemical reactions, and the effect of the scanrate showed the diffusion-controlled procedure of the GO/ZIF-67/SPE towards epinine.The results showed that the GO/ZIF-67/SPE exhibited acceptable stability and reason-able repeatability and reproducibility toward epinine. The GO/ZIF-67/SPE proved to beeffective sensors towards electrochemical investigations of epinine in the presence of dobu-tamine. The obtained outputs showed the GO/ZIF-67/SPE acted as a promising biosensorto determine biological molecules as well as devising the electroanalytical utilizations.
Author Contributions: Formal analysis, M.S., S.T.; writing—original draft preparation, M.S., M.M.,S.T., I.S., H.B.; writing—review and editing, M.S., M.M., S.T., I.S., H.B.; supervision, S.T.; projectadministration, S.T.; funding acquisition, S.T. All authors have read and agreed to the publishedversion of the manuscript.
Funding: This study was financially supported by the Research Center of Tropical and InfectiousDiseases, Kerman University of Medical Sciences, Kerman, Iran (grant number: 400000393; researchethics committees code: IR.KMU.REC.1400.268).
Data Availability Statement: All the data are presented in the manuscript.
Conflicts of Interest: The authors declare no conflict of interest.
References1. Lechin, F.; Van der Dijs, B.; Lechin, A.E. Circulating Serotonin, Catecholamines, and Central Nervous System Circuitry Related to
Some Cardiorespiratory, Vascular, and Hematological Disorders. J. Appl. Res. 2005, 5, 605–621.2. McEwen, B.S. Interacting mediators of allostasis and allostatic load: Towards an understanding of resilience in aging. Metabolism
2003, 52, 10–16. [CrossRef]3. Martínez-Mir, I.; Palop, V.; Morales-Olivas, F.; Estañ, L.; Rubio, E. The effects of epinine on arterial blood pressure and regional
vascular resistances in anesthetized rats. Gen. Pharmacol. Vasc. Syst. 1998, 31, 75–79. [CrossRef]4. Docci, D.; Pistocchi, E.; Turci, F.; Baldrati, L. Effect of ibopamine on the progression of chronic renal failure. Clin. Nephrol. 1986, 26,
121–124. [PubMed]5. Carpenter, J.F. An improved synthesis of 5, 6-diacetoxy-N-methylindole and of epinine. J. Org. Chem. 1993, 58, 1607–1609.
[CrossRef]6. Barger, G.; Dale, H.H. Chemical structure and sympathomimetic action of amines. J. Physiol. 1910, 41, 19–59. [CrossRef] [PubMed]7. Tainter, M. Comparative actions of sympathomimetic compounds: Catechol derivatives. J. Pharmacol. Exp. Ther. 1930, 40, 43–64.8. Atta, N.F.; Galal, A.; Abdel-Gawad, F.M.; Mohamed, E.F. Electrochemistry and detection of dobutamine at gold nanoparticles
cobalt-phthalocyanine modified carbon paste electrode. J. Electrochem. Soc. 2015, 162, B304–B311. [CrossRef]9. Al-Hesayen, A.; Azevedo, E.R.; Newton, G.E.; Parker, J.D. The effects of dobutamine on cardiac sympathetic activity in patients
with congestive heart failure. J. Am. Coll. Cardiol. 2002, 39, 1269–1274. [CrossRef]10. Fouladgar, M. Direct voltammetric determination of dobutamine in pharmaceutical samples using multiwall carbon nanotubes
paste electrode. ECS Solid State Lett. 2015, 4, M15. [CrossRef]11. Keski-Hynnilä, H.; Kurkela, M.; Elovaara, E.; Antonio, L.; Magdalou, J.; Luukkanen, L.; Taskinen, J.; Kostiainen, R. Comparison
of electrospray, atmospheric pressure chemical ionization, and atmospheric pressure photoionization in the identification of
Micromachines 2022, 13, 88 15 of 16
apomorphine, dobutamine, and entacapone phase II metabolites in biological samples. J. Anal. Chem. 2002, 74, 3449–3457.[CrossRef]
12. Majerus, T.C.; Dasta, J.F.; Bauman, J.L.; Danziger, L.H.; Ruffolo, R.R., Jr. Dobutamine: Ten years later. Pharmacother. J. Hum.Pharmacol. Drug Ther. 1989, 9, 245–259. [CrossRef]
13. Whiting, M.J.; Doogue, M.P. Advances in biochemical screening for phaeochromocytoma using biogenic amines. Clin. Biochem.Rev. 2009, 30, 3.
14. Pussard, E.; Neveux, M.; Guigueno, N. Reference intervals for urinary catecholamines and metabolites from birth to adulthood.Clin. Biochem. 2009, 42, 536–539. [CrossRef] [PubMed]
15. Kulinskiı̆, V.; Kolesnichenko, L. Catecholamines: Biochemistry, pharmacology, physiology, clinical aspects. Vopr. Med. Khim. 2002,48, 45–67.
16. He, H.; Stein, C.M.; Christman, B.; Wood, A.J. Determination of catecholamines in sheep plasma by high-performance liquidchromatography with electrochemical detection: Comparison of deoxyepinephrine and 3, 4-dihydroxybenzylamine as internalstandard. J. Chromatogr. B Biomed. Appl. 1997, 701, 115–119. [CrossRef]
17. Musso, N.; Vergassola, C.; Pende, A.; Lotti, G. Simultaneous Measurement of Plasma Catecholamine (Norepinephrine,Epinephrine, and Dopamine) and Free N—Methyl Dopamine (Epinine) Levels, by HPLC with Electrochemical Detection. J. Liq.Chromatogr. 1990, 13, 2217–2228. [CrossRef]
18. Hua, C.; Lee, H.K.; Hsieh, A.K. Determination of epinine in human urine by high-performance liquid chromatography coupledwith electrochemical detection using carbon fiber microelectrodes. Electroanalysis 1994, 6, 1147–1149. [CrossRef]
19. Hardee, G.E.; Lai, J.W. Determination of dobutamine in plasma by liquid chromatography with electrochemical detection. Anal.Lett. 1983, 16, 69–75. [CrossRef]
20. Husseini, H.; Mitrovic, V.; Schlepper, M. Rapid and sensitive assay of dobutamine in plasma by high-performance liquidchromatography and electrochemical detection. J. Chromatogr. B Biomed. Appl. 1993, 620, 164–168. [CrossRef]
21. Alberts, G.; Boomsma, F.; in’t Veld, A.M.; Schalekamp, M. Simultaneous determination of catecholamines and dobutamine inhuman plasma and urine by high-performance liquid chromatography with fluorimetric detection. J. Chromatogr. B Biomed. Appl.1992, 583, 236–240. [CrossRef]
22. Szlag, V.M.; Rodriguez, R.S.; Jung, S.; Bourgeois, M.R.; Bryson, S.; Purchel, A.; Schatz, G.C.; Haynes, C.L.; Reineke, T.M.Optimizing linear polymer affinity agent properties for surface-enhanced Raman scattering detection of aflatoxin B1. Mol. Syst.Des. Eng. 2019, 4, 1019–1031. [CrossRef]
23. El-Kommos, M.E. Spectrophotometric determination of dobutamine hydrochloride using 3-methylbenzothiazolin-2-one hydra-zone. Analyst 1987, 112, 101–103. [CrossRef] [PubMed]
24. Tian, F.S.; Chen, Y.H.; Liang, H.Y. Determination of dobutamine hydrochloride by enzymatic catalytic spectrofluorimetry. J.Lumin. 2014, 29, 92–95. [CrossRef]
25. Li, H.-F.; Cai, Z.; Lin, J.-M. Separation of catecholamines by microchip electrophoresis with a simple integrated laser-inducedfluorescence detector. Anal. Chim. Acta 2006, 565, 183–189. [CrossRef]
26. Zhang, C.; Huang, J.; Zhang, Z.; Aizawa, M. Flow injection chemiluminescence determination of catecholamines with electrogen-erated hypochlorite. Anal. Chim. Acta 1998, 374, 105–110. [CrossRef]
27. Karimi-Maleh, H.; Sheikhshoaie, M.; Sheikhshoaie, I.; Ranjbar, M.; Alizadeh, J.; Maxakato, N.W.; Abbaspourrad, A. A novelelectrochemical epinine sensor using amplified CuO nanoparticles and an-hexyl-3-methylimidazolium hexafluorophosphateelectrode. New J. Chem. 2019, 43, 2362–2367. [CrossRef]
28. Karimi-Maleh, H.; Orooji, Y.; Karimi, F.; Alizadeh, M.; Baghayeri, M.; Rouhi, J.; Tajik, S.; Beitollahi, H.; Agarwal, S.; Gupta, V.K.;et al. A critical review on the use of potentiometric based biosensors for biomarkers detection. Biosens. Bioelectron. 2021, 184,113252. [CrossRef] [PubMed]
29. Eren, T.; Atar, N.; Yola, M.L.; Karimi-Maleh, H. A sensitive molecularly imprinted polymer based quartz crystal microbalancenanosensor for selective determination of lovastatin in red yeast rice. Food Chem. 2015, 185, 430–443. [CrossRef]
30. Jamali, T.; Karimi-Maleh, H.; Khalilzadeh, M.A. A novel nanosensor based on Pt: Co nanoalloy ionic liquid carbon paste electrodefor voltammetric determination of vitamin B9 in food samples. LWT Food Sci. Technol. 2014, 57, 679–685. [CrossRef]
31. Negahban, S.; Fouladgar, M.; Amiri, G. Improve the performance of carbon paste electrodes for determination of dobutamineusing MnZnFe2O4 nanoparticles and ionic liquid. J. Taiwan Inst. Chem. Eng. 2017, 78, 51–55. [CrossRef]
32. Atta, N.F.; Galal, A.; Ahmed, Y.M.; Ekram, H. Design strategy and preparation of a conductive layered electrochemical sensor forsimultaneous determination of ascorbic acid, dobutamine, acetaminophen and amlodipine. Sens. Actuators B Chem. 2019, 297,126648. [CrossRef]
33. Karimi-Maleh, H.; Alizadeh, M.; Karimi, F.; Baghayeri, M.; Fu, L.; Rouhi, J.; Karaman, C.; Karaman, O.; Boukherroub, R. Agreen and sensitive guanine-based DNA biosensor for idarubicin anticancer monitoring in biological samples: A simple and faststrategy for control of health quality in chemotherapy procedure confirmed by docking investigation. Chemosphere 2022, 132928.[CrossRef]
34. Fatima, B.; Saeed, U.; Hussain, D.; Rafiq, H.S.; Majeed, S.; Manzoor, S.; Qadir, S.Y.; Ashiq, M.N.; Najam-ul-Haq, M. FacileHydrothermal Synthesis of NiTe Nanorods for Non-Enzymatic Electrochemical Sensing of Whole Blood Hemoglobin in PregnantAnemic Women. Anal. Chim. Acta 2021, 1189, 339204. [CrossRef]
Micromachines 2022, 13, 88 16 of 16
35. Tajik, S.; Dourandish, Z.; Jahani, P.M.; Sheikhshoaie, I.; Beitollahi, H.; Asl, M.S.; Jang, H.W.; Shokouhimehr, M. Recent develop-ments in voltammetric and amperometric sensors for cysteine detection. RSC Adv. 2021, 11, 5411–5425. [CrossRef]
36. Baghizadeh, A.; Karimi-Maleh, H.; Khoshnama, Z.; Hassankhani, A.; Abbasghorbani, M. A voltammetric sensor for simultaneousdetermination of vitamin C and vitamin B6 in food samples using ZrO2 nanoparticle/ionic liquids carbon paste electrode. FoodAnal. Methods 2015, 8, 549–557. [CrossRef]
37. Ibrahim, H.; Temerk, Y. Synergistic electrocatalytic activity of In2O3@FMWCNTs nanocomposite for electrochemical quantificationof dobutamine in clinical patient blood and in injection dosage form. Talanta 2020, 208, 120362. [CrossRef]
38. Karimi-Maleh, H.; Karimi, F.; Fu, L.; Sanati, A.L.; Alizadeh, M.; Karaman, C.; Orooji, Y. Cyanazine herbicide monitoring as ahazardous substance by a DNA nanostructure biosensor. J. Hazard. Mater. 2022, 423, 127058. [CrossRef] [PubMed]
39. Ganjali, M.R.; Garkani-Nejad, F.; Tajik, S.; Beitollahi, H.; Pourbasheer, E.; Larijanii, B. Determination of salicylic acid by differentialpulse voltammetry using ZnO/Al2O3 nanocomposite modified graphite screen printed electrode. Int. J. Electrochem. Sci. 2017, 12,9972–9982. [CrossRef]
40. Ling, Y.Y.; Huang, Q.A.; Feng, D.X.; Li, X.Z.; Wei, Y. Electrochemical oxidation of dobutamine on a magnesium oxide microflowers–nafion composite film modified glassy carbon electrode. Anal. Methods 2013, 5, 4580–4584. [CrossRef]
41. Karimi-Maleh, H.; Tahernejad-Javazmi, F.; Ensafi, A.A.; Moradi, R.; Mallakpour, S.; Beitollahi, H. A high sensitive biosensor basedon FePt/CNTs nanocomposite/N-(4-hydroxyphenyl)-3,5-dinitrobenzamide modified carbon paste electrode for simultaneousdetermination of glutathione and piroxicam. Biosens. Bioelectron. 2014, 60, 1–7. [CrossRef]
42. Muniraj, V.K.A.; Kamaja, C.K.; Shelke, M.V. RuO2· nH2O nanoparticles anchored on carbon nano-onions: An efficient electrodefor solid state flexible electrochemical supercapacitor. ACS Sustain. Chem. Eng. 2016, 4, 2528–2534. [CrossRef]
43. Tajik, S.; Beitollahi, H.; Nejad, F.G.; Sheikhshoaie, I.; Nugraha, A.S.; Jang, H.W.; Yamauchi, Y.; Shokouhimehr, M. Performance ofmetal–organic frameworks in the electrochemical sensing of environmental pollutants. J. Mater. Chem. A. 2021, 9, 8195–8220.[CrossRef]
44. Bijad, M.; Karimi-Maleh, H.; Khalilzadeh, M.A. Application of ZnO/CNTs nanocomposite ionic liquid paste electrode as asensitive voltammetric sensor for determination of ascorbic acid in food samples. Food Anal. Methods 2013, 6, 1639–1647.[CrossRef]
45. Xiao, X.; Zhang, Z.; Nan, F.; Zhao, Y.; Wang, P.; He, F.; Wang, Y. Mesoporous CuCo2O4 rods modified glassy carbon electrode as anovel non-enzymatic amperometric electrochemical sensors with high-sensitive ascorbic acid recognition. J. Alloys Compd. 2021,852, 157045. [CrossRef]
46. Tahernejad-Javazmi, F.; Shabani-Nooshabadi, M.; Karimi-Maleh, H. Analysis of glutathione in the presence of acetaminophenand tyrosine via an amplified electrode with MgO/SWCNTs as a sensor in the hemolyzed erythrocyte. Talanta 2018, 176, 208–213.[CrossRef]
47. Karimi-Maleh, H.; Alizadeh, M.; Orooji, Y.; Karimi, F.; Baghayeri, M.; Rouhi, J.; Tajik, S.; Beitollahi, H.; Agarwal, S.; Gupta, V.K.Guanine-based DNA biosensor amplified with Pt/SWCNTs nanocomposite as analytical tool for nanomolar determination ofdaunorubicin as an anticancer drug: A docking/experimental investigation. J. Ind. Eng. Chem. 2021, 60, 816–823. [CrossRef]
48. Gupta, V.K.; Karimi-Maleh, H.; Sadegh, R. Simultaneous determination of hydroxylamine, phenol and sulfite in water and wastewater samples using a voltammetric nanosensor. Int. J. Electrochem. Sci. 2015, 10, 303–316.
49. Garkani Nejad, F.; Beitollahi, H.; Tajik, S.; Jahani, S. La3+-doped Co3O4 nanoflowers modified graphite screen printed electrodefor electrochemical sensing of vitamin B6. Anal. Bioanal. Chem. Res. 2019, 6, 69–79.
50. Sahoo, S.; Sahoo, P.; Sharma, A.; Satpati, A. Interfacial polymerized RGO/MnFe2O4/polyaniline fibrous nanocomposite supportedglassy carbon electrode for selective and ultrasensitive detection of nitrite. Sens. Actuators B Chem. 2020, 309, 127763. [CrossRef]
51. Zhang, Z.-H.; Zhang, J.-L.; Liu, J.-M.; Xiong, Z.-H.; Chen, X. Selective and competitive adsorption of azo dyes on the metal–organicframework ZIF-67. Air Soil Pollut. 2016, 227, 1–12. [CrossRef]
52. Lin, K.-Y.A.; Chang, H.-A. Ultra-high adsorption capacity of zeolitic imidazole framework-67 (ZIF-67) for removal of malachitegreen from water. Chemosphere 2015, 139, 624–631. [CrossRef] [PubMed]
53. Zhang, W.; Tan, Y.; Gao, Y.; Wu, J.; Hu, J.; Stein, A.; Tang, B. Nanocomposites of zeolitic imidazolate frameworks on grapheneoxide for pseudocapacitor applications. J. Appl. Electrochem. 2016, 46, 441–450. [CrossRef]
54. Hu, G.; Zhang, W.; Chen, Y.; Xu, C.; Liu, R.; Han, Z. Removal of boron from water by GO/ZIF-67 hybrid material adsorption.Environ. Sci. Pollut. Res. 2020, 27, 28396–28407. [CrossRef]
55. Shahmirzaee, M.; Hemmati-Sarapardeh, A.; Husein, M.M.; Schaffie, M.; Ranjbar, M. Development of a powerful zeoliticimidazolate framework (ZIF-8)/carbon fiber nanocomposite for separation of hydrocarbons and crude oil from wastewater.Microporous Mesoporous Mater. 2020, 307, 110463. [CrossRef]
56. Ethiraj, J.; Bonino, F.; Lamberti, C.; Bordiga, S. H2S interaction with HKUST-1 and ZIF-8 MOFs: A multitechnique study.Microporous Mesoporous Mater. 2015, 207, 90–94. [CrossRef]
57. Bard, A.J.; Faulkner, L.R. Fundamentals and Applications, 2nd ed.; Wiley: New York, NY, USA, 2001; Volume 2, pp. 580–632.58. Tavana, T.; Rezvani, A.R.; Karimi-Maleh, H. Pt-doped NiO nanoparticle-ionic liquid modified electrochemical sensor: A powerful
approach for determination of epinine in the presence of phenylephrine as two blood pressure raising drugs. Electroanalysis 2020,32, 1828–1833. [CrossRef]