Nafion–clay nanocomposite membranes: Morphology and properties
27
1 Nafion-Clay Nanocomposite Membranes: Morphology and Properties Rafael Herrera Alonso, Luis Estevez, Huiqin Lian, Antonios Kelarakis, and Emmanuel P. Giannelis * 1 Department of Materials Science and Engineering, Cornell University, Ithaca, NY 14853 * To whom correspondence should be addressed. Email: [email protected] Abstract A series of Nafion-clay nanocomposite membranes were synthesized and characterized. To minimize any adverse effects on ionic conductivity the clay nanoparticles were H + exchanged prior to mixing with Nafion. Well-dispersed, mechanically robust, free- standing nanocomposite membranes were prepared by casting from a water suspension at 180°C under pressure. SAXS profiles reveal a preferential orientation of Nafion aggregates parallel to the membrane surface, or normal plane. This preferred orientation is induced by the platy nature of the clay nanoparticles, which tend to align parallel to the surface of the membrane. The nanocomposite membranes show dramatically reduced methanol permeability, while maintaining high levels of proton conductivity.The hybrid films are much stiffer and can withstand much higher temperatures compared to pure Nafion. The superior thermomechanical, electrochemical and barrier properties of the nanocomposite membranes are of significant interest for direct methanol fuel cell applications.
-
Upload
independent -
Category
Documents
-
view
0 -
download
0
Transcript of Nafion–clay nanocomposite membranes: Morphology and properties
1
Nafion-Clay Nanocomposite Membranes: Morphology and Properties
Rafael Herrera Alonso, Luis Estevez, Huiqin Lian, Antonios Kelarakis, and Emmanuel P. Giannelis*
1 Department of Materials Science and Engineering, Cornell University, Ithaca, NY
14853
* To whom correspondence should be addressed. Email: [email protected]
Abstract A series of Nafion-clay nanocomposite membranes were synthesized and characterized. To minimize any adverse effects on ionic conductivity the clay nanoparticles were H+ exchanged prior to mixing with Nafion. Well-dispersed, mechanically robust, free-standing nanocomposite membranes were prepared by casting from a water suspension at 180°C under pressure. SAXS profiles reveal a preferential orientation of Nafion aggregates parallel to the membrane surface, or normal plane. This preferred orientation is induced by the platy nature of the clay nanoparticles, which tend to align parallel to the surface of the membrane. The nanocomposite membranes show dramatically reduced methanol permeability, while maintaining high levels of proton conductivity.The hybrid films are much stiffer and can withstand much higher temperatures compared to pure Nafion. The superior thermomechanical, electrochemical and barrier properties of the nanocomposite membranes are of significant interest for direct methanol fuel cell applications.
2
Introduction Polymer electrolyte membrane (PEM) fuel cells and direct methanol fuel cells (DMFCs) are the preferred sources for various applications where both high power density and light weight are required [1-4]. An integral part of a fuel cell is the electrolyte, whose function is to maximize ionic mobility, while often providing the structural support for the electrodes as well as impeding cross-over of the fuel or any contaminants. The electrolyte must be also stable towards oxidation, reduction, hydrolysis and other degradation mechanisms over a broad temperature and humidity range. A big challenge still facing the scientific community is to engineer an electrolyte material that fulfills the above requirements, that is inexpensive and endures the aggressive fuel cell environment for a long period of time. Because of operating temperature limits and challenges with the cathode and anode materials current fuel cells operate at less than 100% theoretical efficiency [5,6]. Furthermore, fuel (hydrogen, methanol, etc.) can permeate the membrane to react at the cathode (so called “cross-over”) without producing electricity and thus lowering the overall efficiency [7,8]. Crossover contributes to loss of fuel and establishes a mixed potential at the cathode leading to lower overall performance. The majority of conventional fuel cell technology is based on perfluorosulfonic acid (PFSA) polymer membranes as the electrolyte [7-10]. PFSA polymers (e.g. Nafion, Aciplex-S and Dow) have a Teflon-like molecular backbone with perfluorosulfonic acid side chains an architecture that gives the material morphological stability and excellent long-term stability in both oxidative and reductive environments [3]. The combination of an extremely hydrophobic perfluorinated backbone with the extremely hydrophilic sulfonic acid functional groups gives rise to nanometer scale hydrophobic/hydrophilic domains. The size of the hydrophilic domains (or ionic clusters) is given by the balance between hydrophilic surface interactions with the ion exchange sites and the energy of elastic deformation of the polymer backbone [11]. When the ionic clusters are hydrated, protons formed by dissociation of sulfonic groups and assisted by water dynamics contribute to ionic conductivity. Water content, concentration of ionic species and connectivity between ionic clusters are the main features that impact the overall protonic conductivity of a PFSA membrane. Methanol permeation is thought to occur primarily, but not exclusively, through these ionic clusters too [12,13]. Introducing nanosize particles with specific functionalities into PFSA membranes could affect the size and structure of ionic domains and thus the performance of the membrane. To date different approaches have been used to improve the performance of polymer membranes used in DMFCs. These approaches can be classified into three categories: 1) modified PFSA membranes including hybrids and nanocomposites, 2) alternative sulfonate polymers (e.g. sulfonated polyaromatics and polyheterocyclic) and 3) acid-base polymers (e.g. phosphoric acid-doped polybenzimidazole (PBI)) [14,15]. This paper will concentrate on modified PFSA with inorganic nanoparticles.
3
Among the various Nafion based composite membranes, those with swelling clays seem to be promising. Swelling clays are layered silicates that are either naturally occurring (e.g. montmorillonite, hectorite) or synthesized in the lab (e.g. fluorohectorite, fluoromica and laponite). Their general characteristics include a layered structure and a platy morphology with lateral dimensions 100 – 1000 nm and individual layer thicknesses of ~ 1nm. Cation substitution in the framework renders the layers negatively charged. This charge is counterbalanced by exchangeable cations residing in the galleries between the layers [16,17]. Typical cation-exchange capacities of clays are between 0.65 and 1.50 meq/g [18]. Clay particles are easily hydrated and posses high proton conductivity (0.6×10⁻² S/cm) when fully hydrated [19]. The water is strongly adsorbed and can be removed at temperatures in excess of 130 °C. Recent work has shown that polymer nanocomposites based on clay nanoparticles exhibit reduced gas permeability due to the presence of impermeable clay particles [20] as well as structural changes in the polymer induced by the clay nanoparticles [21,22]. Thus clays are attractive candidates as Nafion additives because of their nanometer size, proton-conductivity and potential to reduce fuel (e.g. methanol) permeability. In this paper we report our work on nanocomposite membranes prepared by dispersion of clay nanoparticles into Nafion. Several papers describe the synthesis and characterization of Nafion membranes based on sulfonated [23-28], fluoro-modified [29,30] conventional organo-modified [31-33] or native clays [33]. Other approaches for synthesizing Nafion-clay hybrids have also been reported [34,35]. In general the conductivity of the nanocomposite membranes tends to be significantly lower even at fully hydrated conditions compared to Nafion. In addition, the relative permeability of methanol is reduced modestly in the nanocomposites. In the present work we report nanocomposite membranes that exhibit much better conductivity and much lower permeability compared to those already published in the literature. The reason for the higher conductivity is the use of H+-exchanged nanoparticles that significantly contribute to the membrane conductivity. In addition, the hybrid membranes are much stiffer and can withstand higher temperatures compared to pure Nafion. Both of these characteristics are highly desirable for use in fuel cell applications, since a) they can allow the use of a thinner membrane circumventing problems associated with the membrane resistance and b) enable high temperature applications. Experimental Materials Nafion (DE 1021) with a total H+ exchange capacity of 1.1 meq/g was obtained as a 10 wt.% dispersion in water (Ion-Power) or as a 5 wt.% dispersion in a mixture of low aliphatic alcohols (3-propanol, ethanol and others) and water (Aldrich). Sodium montmorillonite (Na+MMT, Cloisite Na+) with an average cation exchange capacity of 1 meq/g was supplied by Southern Clay Products. The interlayer cation of montmorillonite was exchanged from its native sodium (Na+-MMT) to the protonic (H+MMT) form using an ion-exchange resin (DOWEX HCR-W2). A 2 wt.% dispersion of Na+-MMT in deionized water (18 MΩ*cm) was prepared by mixing in an ultrasonic bath for 1 hour,
4
followed by two hours of stirring at room temperature. The dispersion was passed through the ion exchange resin three times to ensure full exchange. The dispersion was then centrifuged for 10 minutes at 10,000 rpm and the solid was dried under vacuum overnight at room temperature. The product was grinded, sieved in an 80-micron sieve, and redispersed in deionized water. Surface modified silica nanoparticles were prepared by reacting 3-(trihydroxysilyl)-1-propanesulfonic acid with surface silanol groups. Colloidal silica (HS30 from Ludox, particle diameter ca 12 nm) was diluted with deionized water to a concentration of 3.75 wt.% silica. To the suspension, a dilute solution of the silane (8 wt.%) was added dropwise while stirring. The pH of the suspension was adjusted to 5 by adding an appropriate amount of 1M NaOH solution. This clear suspension was left to react overnight at 70 °C while stirring. To eliminate unreacted silane, the suspension was purified by dialysis using a membrane tube (Spectra/Por RC Biotech Membrane, 15K MWCO) in deionized water overnight. After dialysis, sodium counter ions were exchanged to protons using an acid-exchanged resin column (DOWEX HCR-W2). The suspension was passed 3 times through the packed column to ensure full exchange. The ion exchange capacity of the functionalized nanoparticles thus prepared, measured by titration with NaOH, was estimated at 1.46 meq/g of dry modified SiO2. In addition to the colloidal silica particles described above, sulfonate bearing silica was also synthesized in-situ by a sol-gel reaction as described previously by Adjemian et al. [36]. A 1:2 mixture of tetraethoxysilane (TEOS) and 3-(trihydroxysilyl)-1-propanesulfonic acid (PSA) was reacted with water over a period of 4 hours under stirring. This mixture was used subsequently to make Nafion-silica hybrids (vide infra). During the solvent cast procedure, water is evaporated, thus promoting further polymerization and cross-linking between hydrolyzed TEOS and PSA. Our goal was to produce a protonic conducting silicon dioxide network with active sulfonic acid sites that would not only act as a hydroscopic material for water retention, but also as a source of active protonic groups. The ion exchange capacity of these networks was estimated to be higher than 2 meq/g of dry sample. Nafion-clay hybrids (NfMMT) were prepared by solvent casting. Nafion either in water or low aliphatic alcohols and the dispersion of nanoparticles (H+MMT) in water were mixed in an ultrasonic bath for 2 hours followed by overnight stirring at room temperature. Different concentrations of clay in the polymer membranes were obtained by varying the amount of nanoparticle dispersion added to the Nafion. Two different solvent casting procedures were used. The first involves heating the solution over a glass substrate in an oven at 75 °C overnight. In the second, the dispersion is placed in a high-pressure chamber at 180 °C and 180 psi for 8 hours. Dry nitrogen (N2) is continuously fed to the chamber to maintain a constant pressure of 180 psi and ensure low water content in the vapor phase. The latter procedure was used for the water-based dispersion of Nafion. As will be discussed later, solvent casting a water-based dispersion of Nafion at high temperature yields freestanding membranes with improved dispersion of nanoparticles and mechanical properties. After the nanohybrid membranes were formed,
5
they were post-treated by first boiling in 3 vol.% H2O2 for 1 h to remove organic impurities, boiling in 0.5M H2SO4 for 1 h, and finally rinsing twice in boiling deionized water for 1 h [36]. Physical/chemical characterization Ion exchange was determined by first forming the sodium form of the membranes by placing the sample in 1M salt solution at 80°C for 24h followed by titration using a 0.1M NaOH solution with phenolphthalein as an indicator. The ion exchange capacity (IEC) was calculated based on the dry weight of the polymer. WAXD measurements were performed on a Scintag PAD X diffractometer equipped with a Cu Kα source (1.54 Å) operating at 45 kV and 40 mA. Scans were made from 1.0° to 30° 2θ at a rate of 1° per minute. The slits used were 1° and 2° for the source and 0.3° and 0.5° for the detector (N2 cooled solid-state Ge), respectively, with the wider angles closer to the sample. Low background quartz sample holders were used in all cases. SAXS measurements were made on a Bruker Nanostar instrument under vacuum. The setup consists of a Cu Kα source (1.54 Å) operated at 40 kV and 40 mA. A 2D Hi-Star area detector at a sample-to-detector distance of 62.5 cm was used to record the scattering images. These 2-D images were integrated over the azimuthal angle (μ) to obtain one-dimensional intensity versus the magnitude of the scattering vector, q=(4π/λ)sinθ, where λ is the x-ray wavelength and 2θ is the scattering angle. Bright-field TEM images were obtained with a Jeol-1200 EX electron microscope operated at an accelerating voltage of 100 kV. TEM specimens (ca. 70 nm thick) were prepared by sectioning at -80°C using a Leica Ultracut UCT ultra-microtome equipped with a diamond knife. Dynamic mechanical analysis (DMA) was carried out on a TA Instruments DMA Q800 using the film/fiber tension clamp. The response as a function of temperature was measured by subjecting a rectangular film to a temperature swing from 32°C to 250°C at a rate of 5°C/min. Before measurement, the samples were dried for 24 h in air at 80°C. Ionic conductivity was measured at room temperature under a controlled relative humidity (RH) environment in a closed vessel. The relative humidity inside the chamber was controlled with different saturated salt solutions and measured with a Fisherbrand Traceable Digital Humidity/Temperature Meter [37]. A cell, equipped with a window to allow rapid equilibration, was used to measure ionic conductivity [38]. The resistance of the membrane was measured by AC impedance spectroscopy (HP 4192A, LF Impedance Analyzer) scanning a frequency range of 5Hz to 13MHz and an amplitude of 10 mV. The resistance of the membrane was calculated from the intercept of the real axis in the intermediate frequency domain of the impedance spectrum. Conductivity, σ was calculated using
lwRd
=σ (1)
6
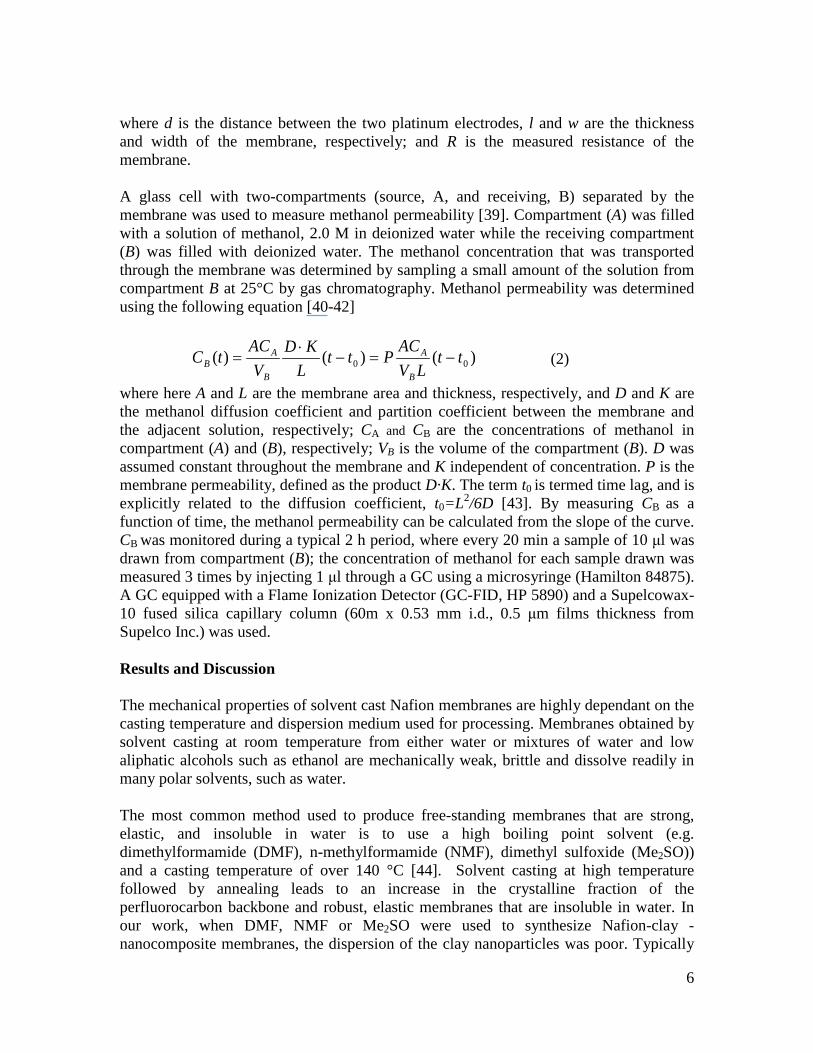
where d is the distance between the two platinum electrodes, l and w are the thickness and width of the membrane, respectively; and R is the measured resistance of the membrane. A glass cell with two-compartments (source, A, and receiving, B) separated by the membrane was used to measure methanol permeability [39]. Compartment (A) was filled with a solution of methanol, 2.0 M in deionized water while the receiving compartment (B) was filled with deionized water. The methanol concentration that was transported through the membrane was determined by sampling a small amount of the solution from compartment B at 25°C by gas chromatography. Methanol permeability was determined using the following equation [40-42]
)()()( 00 ttLV
ACPttL
KDV
ACtCB
A
B
AB −=−
⋅= (2)
where here A and L are the membrane area and thickness, respectively, and D and K are the methanol diffusion coefficient and partition coefficient between the membrane and the adjacent solution, respectively; CA and CB are the concentrations of methanol in compartment (A) and (B), respectively; VB is the volume of the compartment (B). D was assumed constant throughout the membrane and K independent of concentration. P is the membrane permeability, defined as the product D·K. The term t0 is termed time lag, and is explicitly related to the diffusion coefficient, t0=L2/6D [43]. By measuring CB as a function of time, the methanol permeability can be calculated from the slope of the curve. CB was monitored during a typical 2 h period, where every 20 min a sample of 10 μl was drawn from compartment (B); the concentration of methanol for each sample drawn was measured 3 times by injecting 1 μl through a GC using a microsyringe (Hamilton 84875). A GC equipped with a Flame Ionization Detector (GC-FID, HP 5890) and a Supelcowax-10 fused silica capillary column (60m x 0.53 mm i.d., 0.5 μm films thickness from Supelco Inc.) was used. Results and Discussion The mechanical properties of solvent cast Nafion membranes are highly dependant on the casting temperature and dispersion medium used for processing. Membranes obtained by solvent casting at room temperature from either water or mixtures of water and low aliphatic alcohols such as ethanol are mechanically weak, brittle and dissolve readily in many polar solvents, such as water. The most common method used to produce free-standing membranes that are strong, elastic, and insoluble in water is to use a high boiling point solvent (e.g. dimethylformamide (DMF), n-methylformamide (NMF), dimethyl sulfoxide (Me2SO)) and a casting temperature of over 140 °C [44]. Solvent casting at high temperature followed by annealing leads to an increase in the crystalline fraction of the perfluorocarbon backbone and robust, elastic membranes that are insoluble in water. In our work, when DMF, NMF or Me2SO were used to synthesize Nafion-clay -nanocomposite membranes, the dispersion of the clay nanoparticles was poor. Typically
7
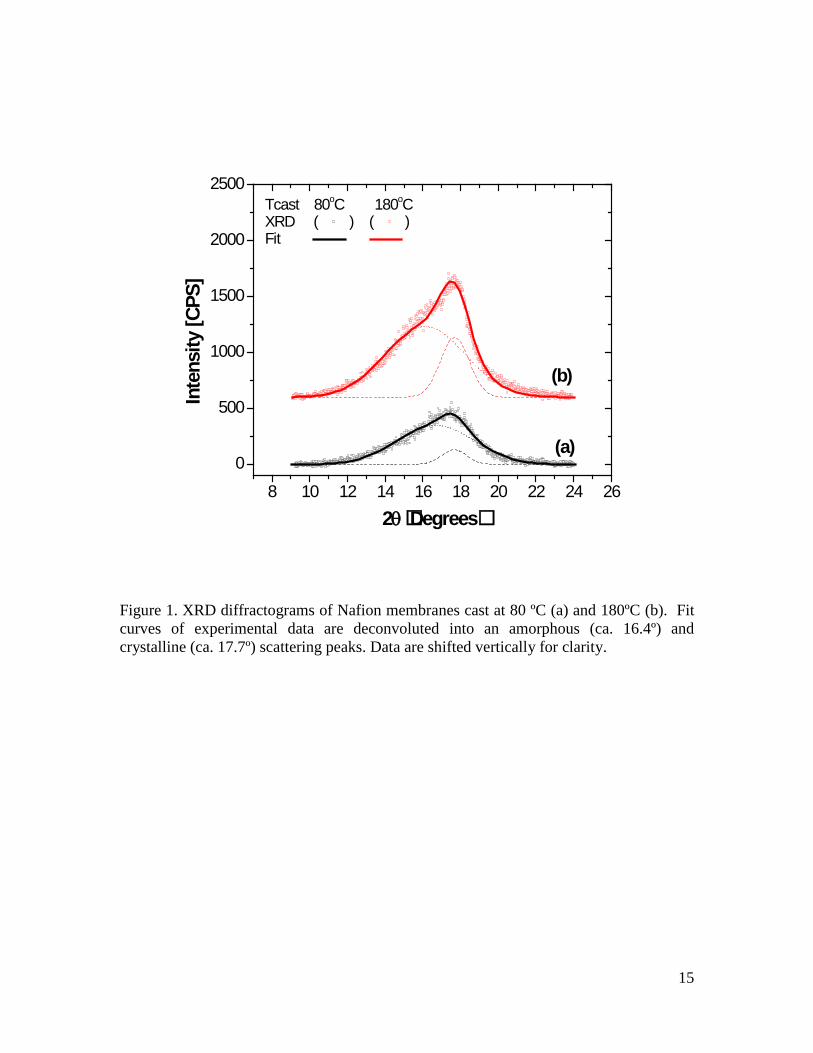
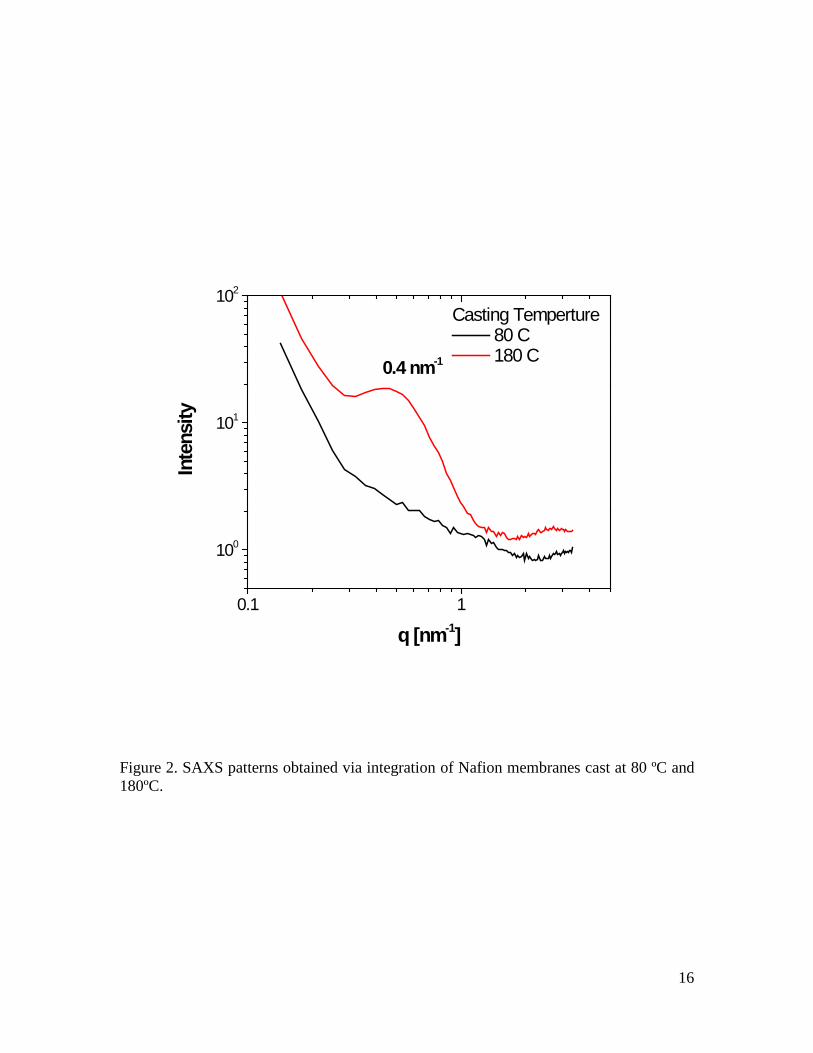
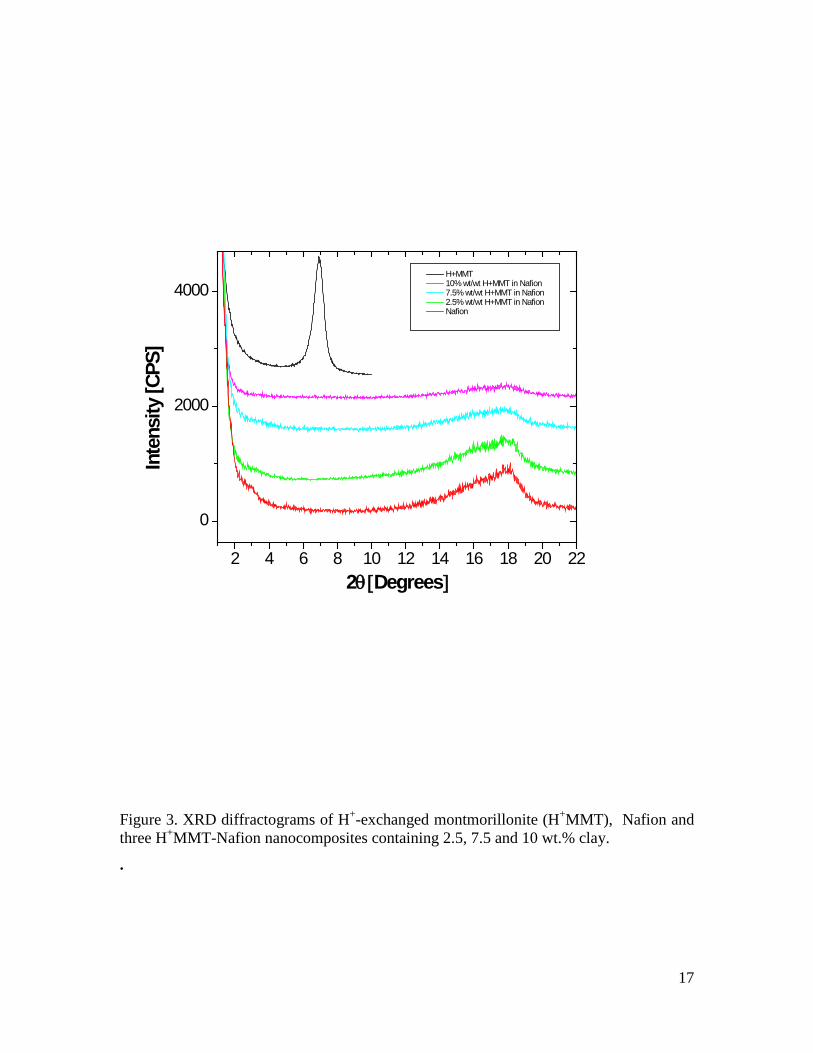
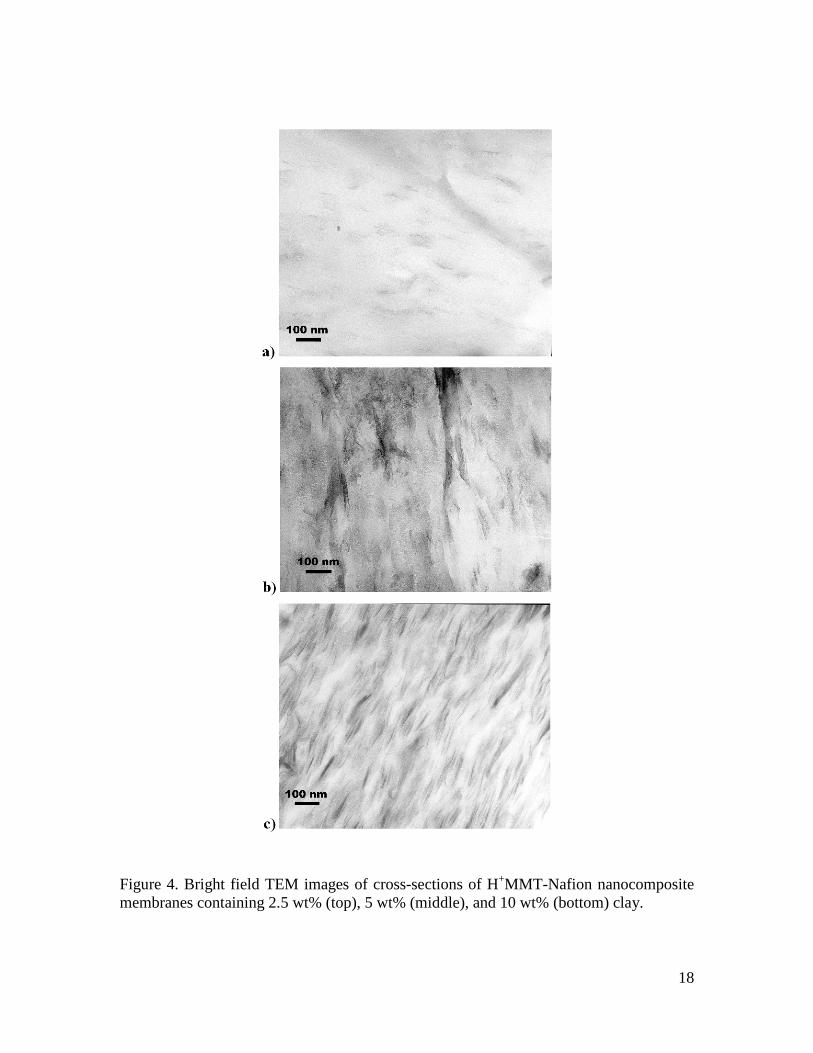
an immiscible system was obtained, as seen by XRD. In addition, when NMF or Me2SO were used, the nanoparticles flocculated and phase separated before all the solvent was evaporated leading to inhomogeneous membranes. Thus an alternative method was devised. New homogeneous nanocomposite membranes that were insoluble in water with good dispersion of the clay nanoparticles were prepared by casting at 180°C under pressure with water as the dispersion medium. The environment was pressurized with nitrogen. The pressure inside the in-house-made device was 15 psi above the vapor pressure of water at any given temperature to ensure slow solvent evaporation. In addition, dry nitrogen was flown constantly to avoid a build-up of water vapor and assure fast casting cycles. As is well known, the differences in morphological features in the Nafion membranes are due to differences in crystallinity of the perfluorocarbon backbone. XRD patterns of two Nafion membranes cast at different temperatures (80 °C and 180 °C) are shown in Figure 1. Two diffraction peaks are seen: a large amorphous halo centered at ca. 16.4°, and a superimposed Bragg peak centered at 17.7° corresponding to the crystalline fraction of the perfluorocarbon backbone. The ratio between these two peaks provides a measure of the amount of crystallinity in the membrane. The crystallinity of the membrane cast at 180 °C is higher than that that at 80 °C, a result consistent with the small angle x-ray scattering (SAXS) measurements (Figure 2). In the SAXS region there is a diffraction peak (ca. 0.04 Å-1) that is related to the regularity of the interlamellar spacing or interference between crystalline structures [45,46]. This characteristic diffraction peak is also affected by the temperature at which the membrane is cast. For membranes cast at 80 °C the diffraction pattern is flat compared to those cast at 180 °C, where the characteristic peak is clearly observed. When the cast temperature is higher than the glass transition temperature (Tg) of the perfluorocarbon backbone (ca. 150 °C), there is sufficient mobility for reorganization of the polymer backbone to crystallize [47]. In addition, the residual dispersion medium can also act as a plasticizer of the polymer matrix to assist such reorganizations. As mentioned by Gebel et al., perfluorinated membranes that are cast at low temperatures exhibit large fractions of poorly crystallized material with no long-range order between lamellar crystallites [48]. As the annealing temperature is increased, reorganization is favored and long-range order develops, leading to larger lamellar crystallites that are insoluble in water. Thus, casting Nafion from water dispersions at temperatures similar to those used with high boiling point solvents leads to membranes with similar morphological features. The added advantage of using high-temperature casting in water is that homogeneous hybrid membranes with good nanoparticle dispersion are obtained. All Nafion-clay hybrid membranes cast at 180 °C are mechanically robust and insoluble in water showing an intercalated/exfoliated structure of clay nanoparticles. Recall that hybrid membranes cast at low temperatures were mechanically weak while those cast at high temperatures but using high-boiling point organic solvents resulted in flocculation and phase-separation of the nanoparticles. The intercalated/exfoliated structure is seen in the mostly silent XRD diffractograms (Figure 3) and the TEM images (Figure 4) for
8
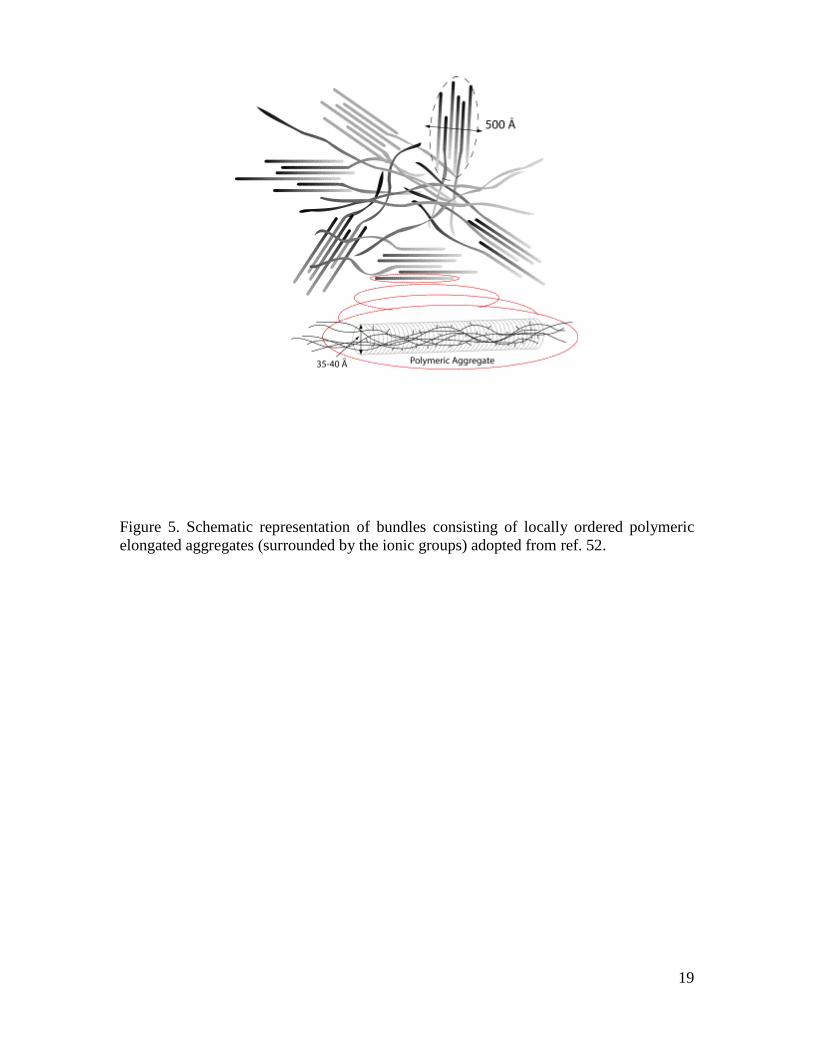
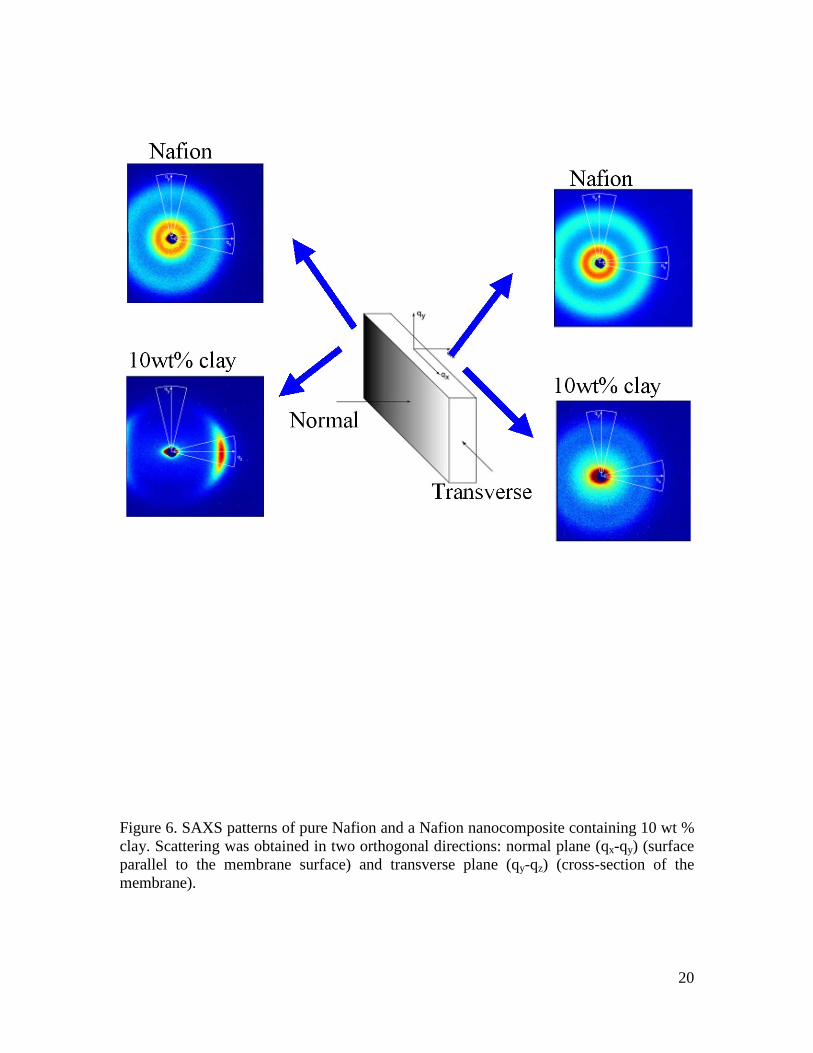
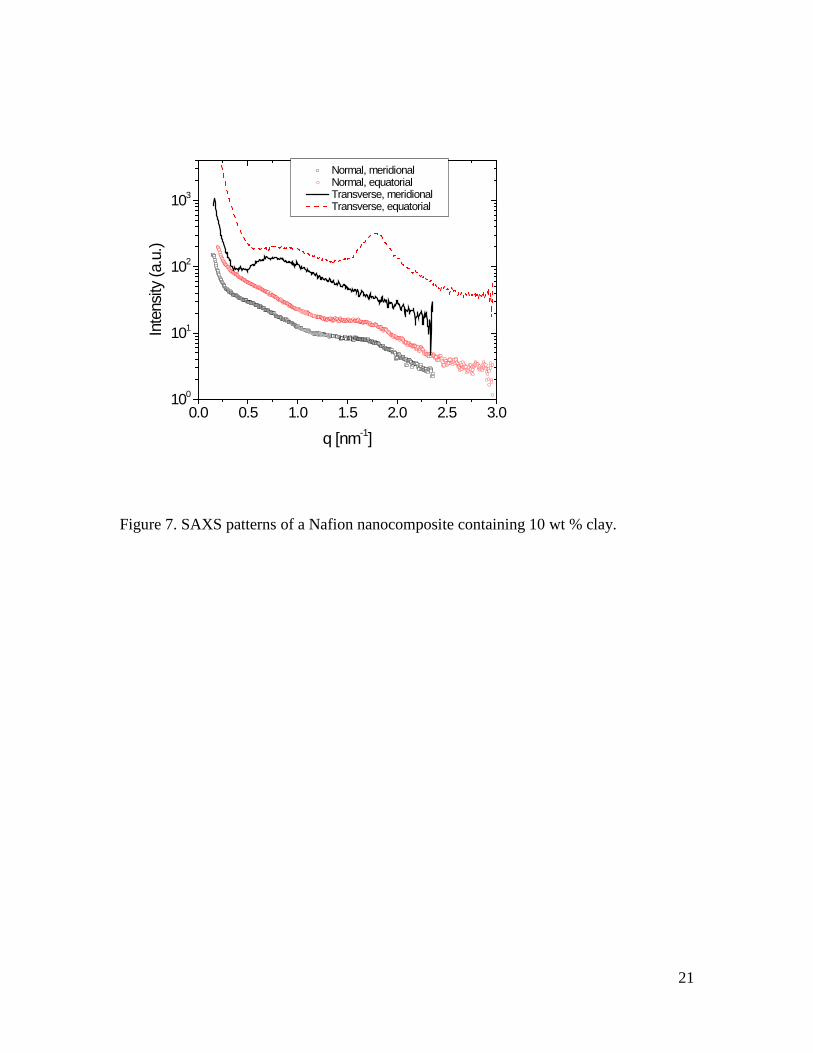
hybrids containing up to 10 wt.% of H+-MMT. In addition the ratio of the two characteristics peaks related to the amorphous (16.4°) and crystalline phase (17.7°) of the perfluorocarbon backbone are comparable with those seen for pure Nafion cast at high temperature. Thus, by optimizing the dispersion medium and the casting conditions, strong, well-dispersed Nafion membranes were synthesized. The weak diffraction signal observed at high clay loadings is probably due to excessive scattering from the clay particles. The morphology of the nanocomposite membranes as a function of nanoparticle content was further investigated using SAXS. Due to their molecular structure the polar side chains that contain the sulfonate groups aggregate into hydrophilic ionic domains. In the pure Nafion the ionic domains are distributed uniformly throughout the nonpolar perfluorinated matrix that is also organizing into crystalline domains (Figure 5). The SAXS profile of Nafion while complex it contains information about the size and spatial correlations of the ionic clusters, the crystalline domains and other higher order structure. As previously reported a typical Nafion diffraction pattern will contain: a) a scattering maximum at ca. q=1-2 nm-1, due to the electron density difference of the ionic clusters and the perfluorinated matrix; b) a low angle peak, termed matrix knee, at ca. q= 0.4-0.5 nm-1, related to the regularity of the interlamellar spacing or interference between crystalline domains; and c) an upturn at low q values (q<1 nm-1) related primarily to polymeric aggregates and other higher-order density fluctuations [49-52]. For the ionic clusters, the position of the scattering peak (size of ionic clusters) is a function of the amount of water in the polymer matrix, the counter ion (e.g. H+, Li+, Cs+…) and the ion exchange capacity of the polymer matrix. SAXS data on fully hydrated membranes were collected in two orthogonal directions to characterize any anisotropy due to the dispersion of nanoparticles in the polymer matrix. The normal plane is parallel to the membrane surface while the transverse plane is orthogonal to the membrane surface (Figure 6). Linear intensity profiles along the meridional (±π/12) and the equatorial (±π/12) axis were extracted from the 2-D SAXS scattering patterns derived across each of the planes (normal/transverse). The SAXS profiles of neat Nafion on either normal or transverse planes are very similar. Each diffractogram shows two distinct rings at similar q values (Figure 7). The positions of these two diffraction peaks are centered at ca. q=1.31 nm-1 (d= 4.8 nm) for the ionic cluster peak, and ca. q=0.4 nm-1 for the matrix knee. The latter is related to the regularity of interlamellar spacing of the crystalline domains of the polymer matrix. In contrast, the SAXS profiles of the nanocomposite membranes are more anisotropic and the degree of anisotropy increases as the concentration of the nanoparticles increases. Nanohybrid membranes with 7.5% and 10% wt. % nanoparticles show a clear anisotropic pattern evident in the transverse plane SAXS profile (Figures 6,7). The disappearance of the ionic domain peak from the meridional SAXS component, (Figure 6,7) indicates a high degree of orientation of the ionic clusters within the membrane.
9
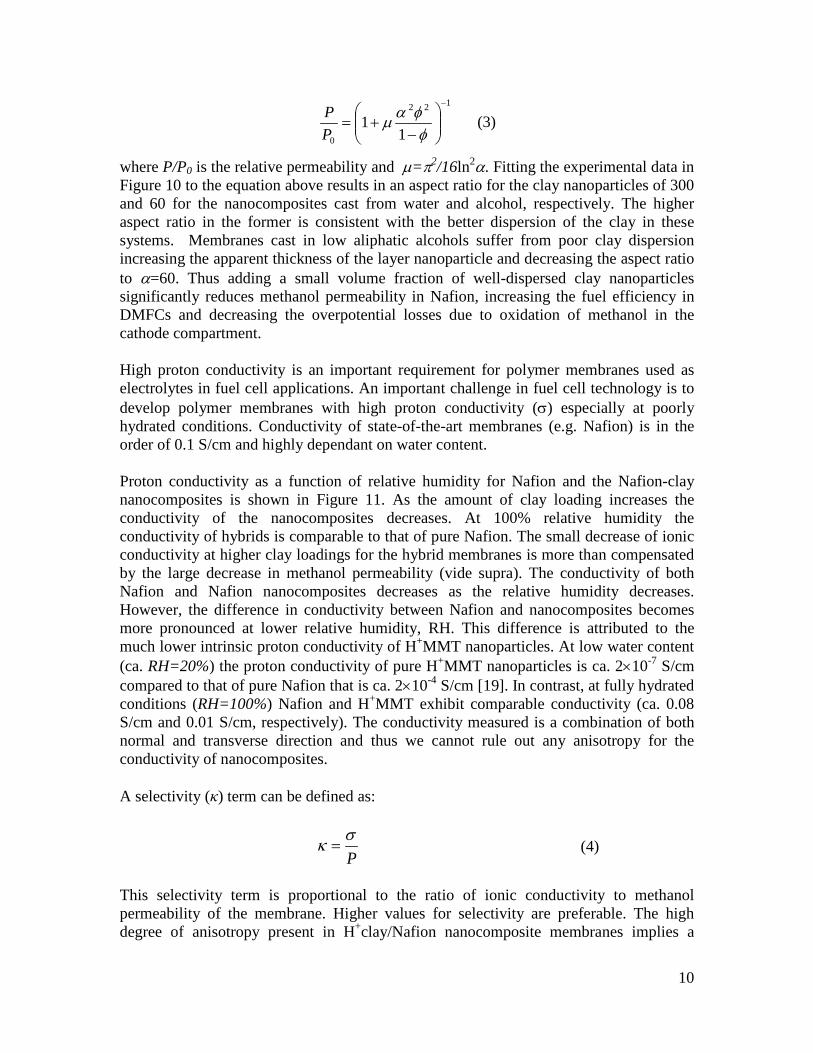
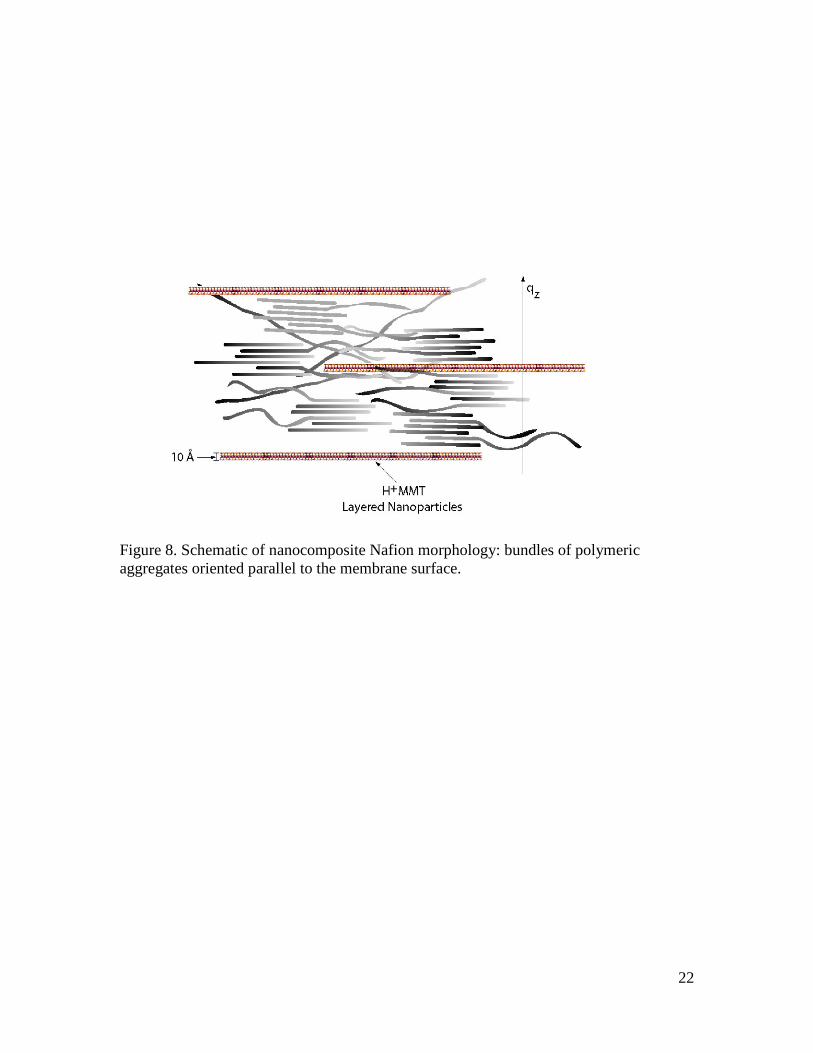
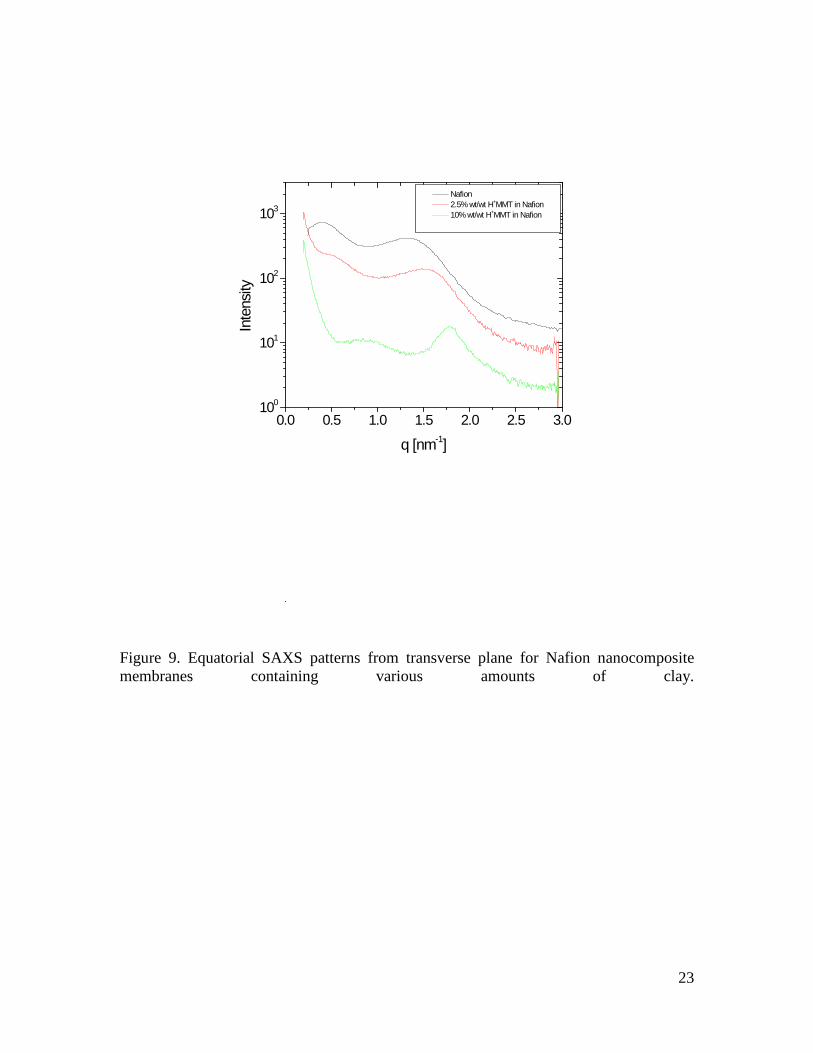
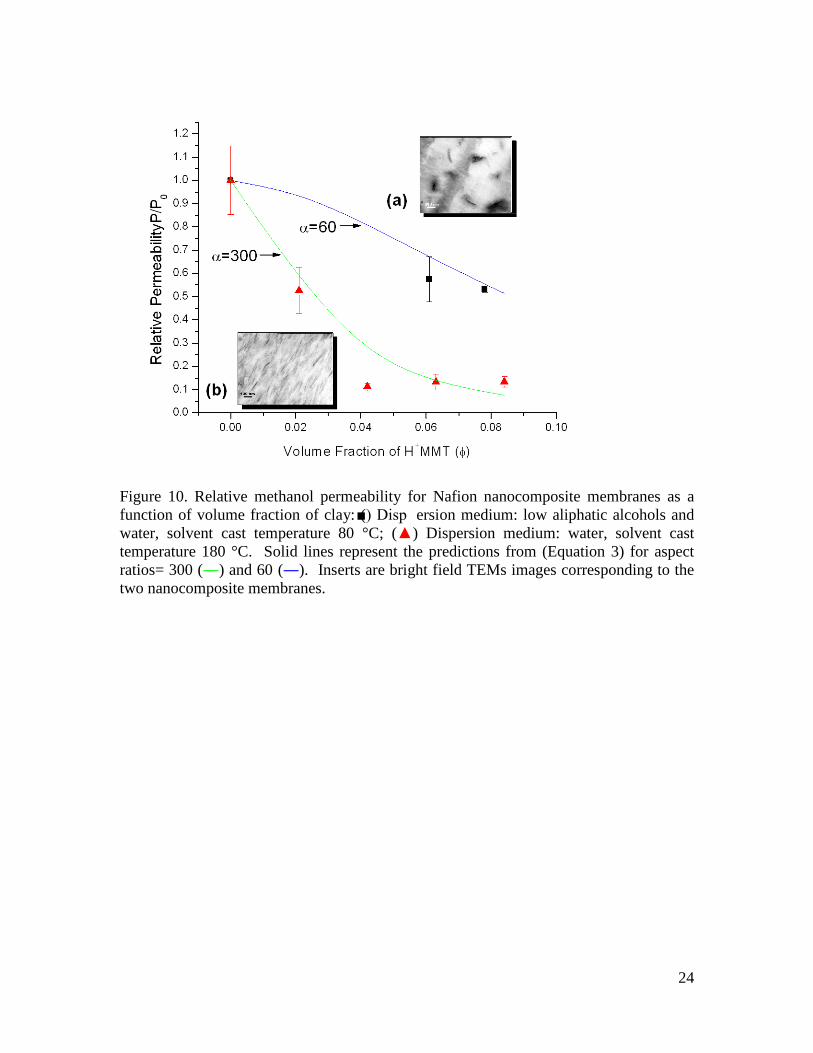
According to the SAXS data the nanocomposite membranes are composed of polymeric aggregates oriented parallel to the membrane surface, or normal plane (Figure 8). The orientation of polymer is deduced by the different profiles in the transverse and normal plane. This preferred orientation is induced by the 2-D nature of the clay nanoparticles, which tend to align parallel to the surface of the membrane. As the concentration of nanoparticles increases the ionic clusters peak tends to shift monotonically to higher values of q. The shift is attributed to the compression of the domains due to the presence of the nanoparticles (Figure 9). Although the overall intensity of the matrix knee peak is relatively weak, an increased value of the meridional component relative to the equatorial can be seen (Figure 7). The orientation of the polymeric lamella peak is orthogonal to that from the ionic domains in agreement with previous reports for moderately stretched pure Nafion [53]. Anisotropic Nafion membranes have been prepared before by uniaxial deformation [54,55]. The intensity distribution of the ionic domains peak becomes anisotropic under stretching and is orthogonal to the stretching direction, indicating that the polymer aggregates align parallel to the stretching direction. Furthermore alignment of the polar domains in Nafion has been induced by electric field [56]. We note that the alignment in the nanocomposite membranes reported here has been produced in the absence of any external fields and it is induced by the platy nanoparticles instead. Dispersion, concentration and alignment of the clay nanoparticles as well as alignment of the ionic domains are expected to be key factors in determining the transport properties of the membranes. Figure 10 contrasts the relative permeability of methanol for membranes cast using water at high temperature with those cast using low aliphatic alcohols. All values are normalized by the value for pure Nafion (P0= 6.08×10⁻⁶ cm2/s). Clearly the membranes cast using water, which leads to better nanoparticle dispersion, exhibit much lower MeOH permeability. The relative permeability of the hybrid membranes for both systems decreases as the concentration of the nanoparticles increases albeit the decrease is much more dramatic for the membranes cast from water. The difference is attributed to the dispersion of the clay nanoparticles. Membranes cast with low aliphatic alcohols show an immiscible structure with clusters of nanoparticles embedded in the polymer matrix. In contrast, the clay particles in membranes cast from water are well-dispersed with a preferred orientation parallel to the normal surface. The nanoparticle alignment induces further alignment of the polymer parallel to the normal surface resulting in a highly tortuous path for methanol permeation. The difference between these two types of membranes can be further modeled using theoretical models established for gas permeability in composite materials [57,58]. Cussler et al. proposed a permeability model for a composite material, where the impermeable plates or layers are parallel to the normal surface. The permeability is modeled as a function of the volume fraction of the layers (φ) and their aspect ratio (α), defined as half the layer width divided by the layer thickness and a geometric factor (µ). A “semidilute” system is defined when φ « 1 and αφ » 1 and the data can be modeled by
10
122
0 11
−
−
+=φ
φαµPP (3)
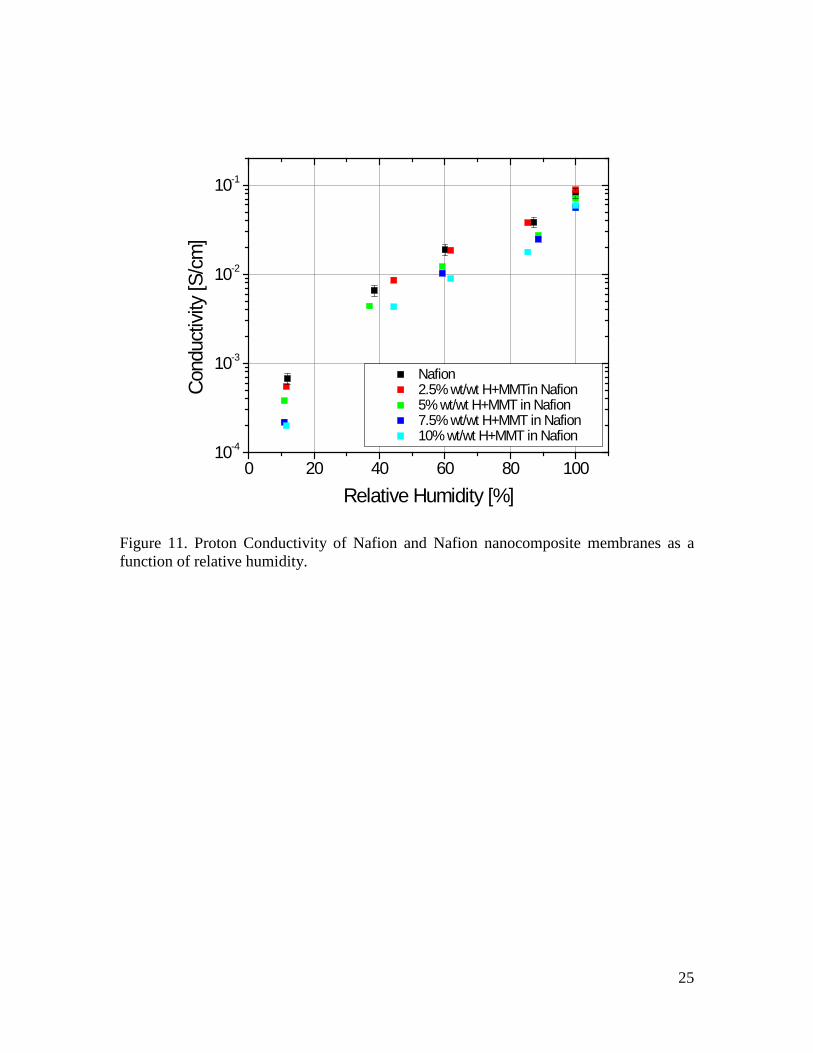
where P/P0 is the relative permeability and µ=π2/16ln2α. Fitting the experimental data in Figure 10 to the equation above results in an aspect ratio for the clay nanoparticles of 300 and 60 for the nanocomposites cast from water and alcohol, respectively. The higher aspect ratio in the former is consistent with the better dispersion of the clay in these systems. Membranes cast in low aliphatic alcohols suffer from poor clay dispersion increasing the apparent thickness of the layer nanoparticle and decreasing the aspect ratio to α=60. Thus adding a small volume fraction of well-dispersed clay nanoparticles significantly reduces methanol permeability in Nafion, increasing the fuel efficiency in DMFCs and decreasing the overpotential losses due to oxidation of methanol in the cathode compartment. High proton conductivity is an important requirement for polymer membranes used as electrolytes in fuel cell applications. An important challenge in fuel cell technology is to develop polymer membranes with high proton conductivity (σ) especially at poorly hydrated conditions. Conductivity of state-of-the-art membranes (e.g. Nafion) is in the order of 0.1 S/cm and highly dependant on water content. Proton conductivity as a function of relative humidity for Nafion and the Nafion-clay nanocomposites is shown in Figure 11. As the amount of clay loading increases the conductivity of the nanocomposites decreases. At 100% relative humidity the conductivity of hybrids is comparable to that of pure Nafion. The small decrease of ionic conductivity at higher clay loadings for the hybrid membranes is more than compensated by the large decrease in methanol permeability (vide supra). The conductivity of both Nafion and Nafion nanocomposites decreases as the relative humidity decreases. However, the difference in conductivity between Nafion and nanocomposites becomes more pronounced at lower relative humidity, RH. This difference is attributed to the much lower intrinsic proton conductivity of H+MMT nanoparticles. At low water content (ca. RH=20%) the proton conductivity of pure H+MMT nanoparticles is ca. 2×10⁻⁷ S/cm compared to that of pure Nafion that is ca. 2×10⁻⁴ S/cm [19]. In contrast, at fully hydrated conditions (RH=100%) Nafion and H+MMT exhibit comparable conductivity (ca. 0.08 S/cm and 0.01 S/cm, respectively). The conductivity measured is a combination of both normal and transverse direction and thus we cannot rule out any anisotropy for the conductivity of nanocomposites. A selectivity (κ) term can be defined as:
Pσκ = (4)
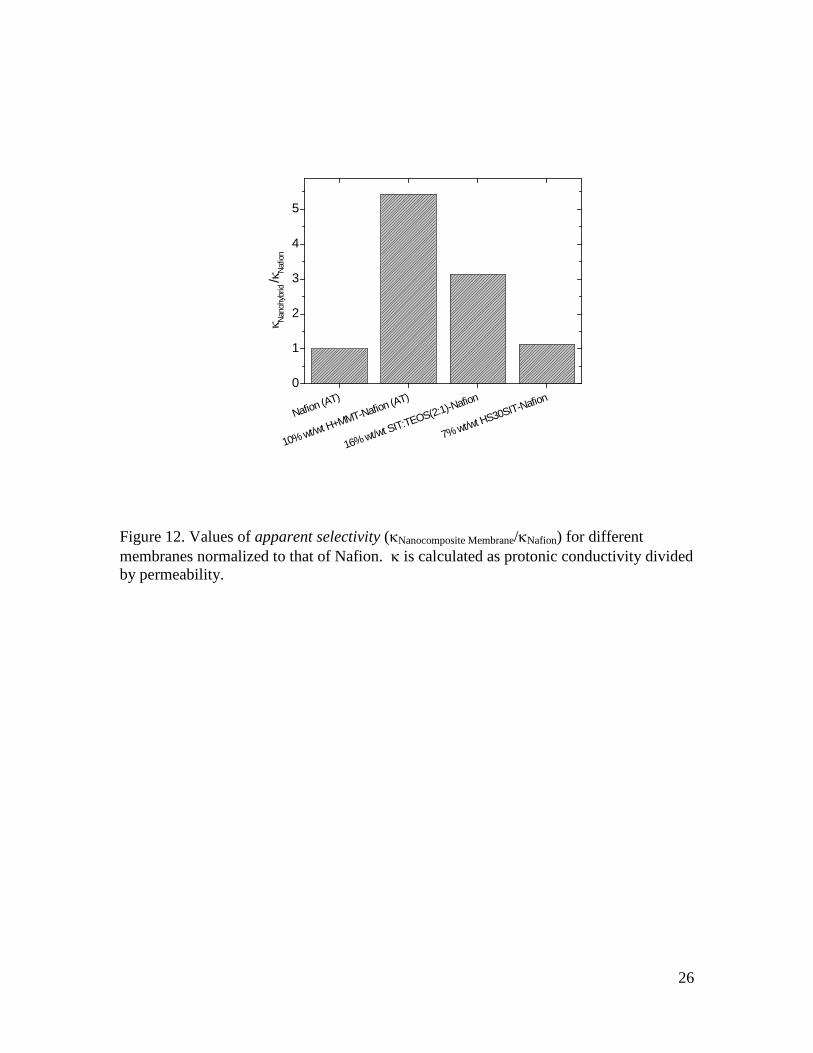
This selectivity term is proportional to the ratio of ionic conductivity to methanol permeability of the membrane. Higher values for selectivity are preferable. The high degree of anisotropy present in H+clay/Nafion nanocomposite membranes implies a
11
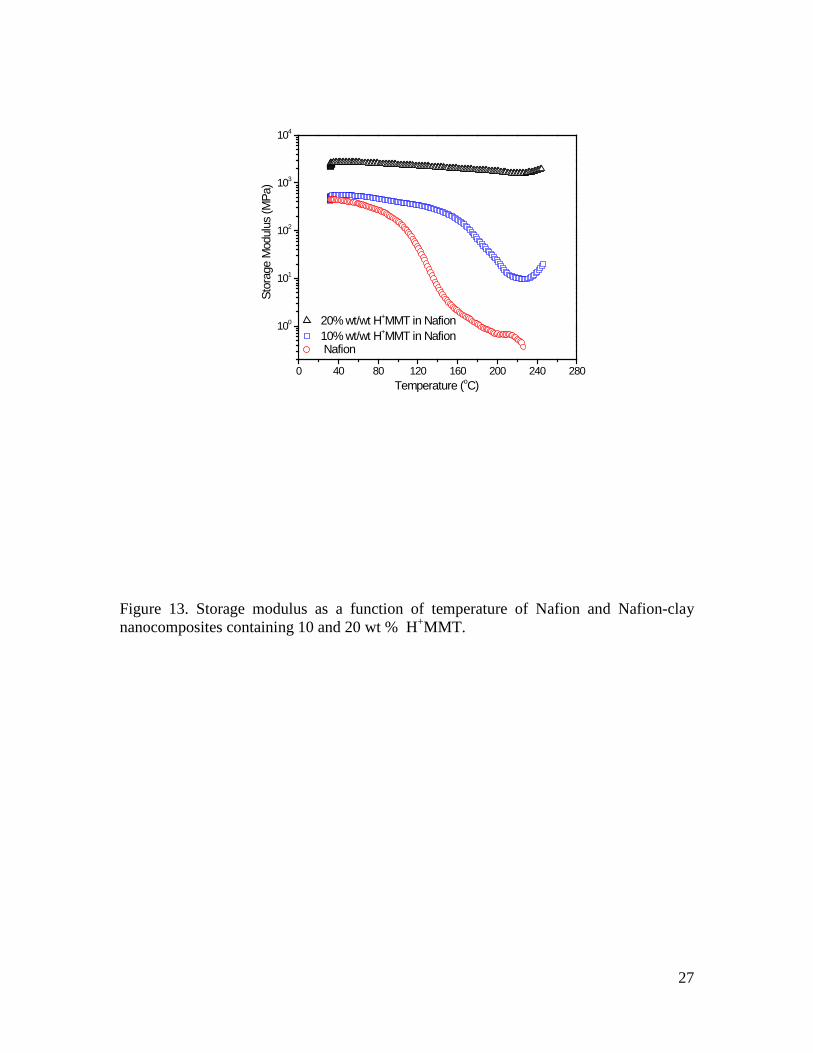
corresponding unequal contribution to proton conductivity through the normal and the transverse planes. In particular, it seems reasonable to assume that the in-plane proton conductivity could be higher due to preferential alignment of ionomer domains, while the reported methanol permeability corresponds mainly to diffusive motion in the transverse direction (through-plane). Therefore, we use apparent selectivity, to emphasize the anisotropic nature of the nanocomposite membranes and avoid any confusion. Figure 12 shows the apparent selectivity parameters (κNfMMT) for different hybrid membranes relative to Nafion. The selectivity of Nafion (κNafion) is set to one. In addition to the clay nanocomposites two other hybrids are included for comparison. The latter two hybrids are based on silicon dioxide particles surface modified with sulfonic acid groups (-SO3H). The first (HS30SIT), involve spherical SiO2 nanoparticles with a diameter of ca. 12 nm surface treated with propyl sulfonic silane. The second are made in-situ by hydrolysis and co-condensation of propyl sulfonic acid silane and tetraethylorthosilicate (see Experimental Section). Both silica based nanocomposites exhibit excellent nanoparticle dispersion. All hybrids exhibit a better apparent selectivity compared to Nafion. However, the clay based hybrid exhibits the best apparent selectivity. The small decrease of ionic conductivity for the clay based nanocomposites is more than compensated by the large decrease in methanol permeability. High selectivity values can be derived for nanoporous aluminophosphate-isopropanolamine/Nafion membranes, as reported recently [59]. However, those membranes can only withstand a very mild activation treatment, that typically results in membranes with inferior characteristics compared to those fully activated. The DMA of Nafion and two nanocomposite membranes is shown in Figure 13. In general, Nafion shows two typical glass transition temperatures, which are assigned to the nonpolar backbone and polar clusters, respectively. Kyu and Eisenberg have assigned the high temperature transition (α) at about 120°C to the Tg of the ionic clusters while the low temperature transition (β) at about 20°C was associated with the Tg of the nonpolar backbone [60,61]. Consistent with previous reports, pure Nafion shows a high temperature α transition characteristic of the polar group clusters at around 125°C. The low temperature β transition is outside the temperature range used in our measurements. In contrast to the pure Nafion, the α transition of the nanocomposites shifts to much higher temperatures. For the nanocomposite containing 20 wt.% clay the transition shifts to 215 °C and it becomes much weaker. In addition to the temperature shift, the hybrids show dramatic increases in storage modulus. The nanocomposite containing 20 wt.% clay shows a 6 times increase at low temperatures and orders of magnitude above ~ 100 °C. From the DMA analysis we conclude that the nanocomposite membranes are much stiffer and can withstand higher temperatures compared to pure Nafion. Both of these characteristics are highly desirable for use in fuel cell applications. A higher modulus membrane can allow the use of a thinner membrane circumventing problems associated with the membrane resistance. Additionally, the mechanical strength at high temperature facilitates application requiring temperatures in excess of 100 °C.
12
Conclusions In summary a series of Nafion-clay nanocomposite membranes were synthesized and characterized. Well-dispersed, mechanically robust, free-standing nanocomposite membranes were prepared by casting from a water suspension at 180°C under pressure. SAXS profiles reveal a preferential orientation of Nafion aggregates parallel to the membrane surface, or normal plane. This preferred orientation is induced by the platy nature of the clay nanoparticles, which tend to align parallel to the surface of the membrane. The nanocomposite membranes are much stiffer and can withstand much higher temperatures compared to pure Nafion. Both of these characteristics are highly desirable for use in fuel cell applications, since they might allow the use of a thinner membrane circumventing problems associated with the membrane resistance as well as enable high temperature applications. In addition, the apparent selectivity (ratio of conductivity over permeability) of nanocomposite membranes is higher compared to pure Nafion or hybrids made by incorporation of surface-modified silica nanoparticles. The small decrease of ionic conductivity for the clay based nanocomposite membranes is more than compensated by the large decrease in methanol permeability. Acknowledgments We acknowledge the financial support of the Cornell Fuel Cell Institute funded by DOE. EPG acknowledges the support of Award No. KUS-C1-018-02, made by King Abdullah University of Science and Technology (KAUST).
13
References [1] Dohle H, Divisek J, Mergel J, Oetjen HF, Zingler C, Stolten D. J. Power Sources 2002;105:274-282 [2] Guraua B, Smotkin ES. J. Power Sources 2002;112:339-352 [3] Wakizoe M, Velev OA, Srinivasan S. Electrochimica Acta 1995; 40: 335-344 [4] Carrette L, Friedrich KA, Stimming U Fuel Cells 2001;1:5-39 [5] Ren XM, Wilson MS, Gottesfeld S. J Electrochem Soc 1996; 143: L12-L15. [6] Chu D, Gilman S. J Electrochem Soc 1994;141:1770-1773 [7] Hickner MA, Pivovar BS Fuel Cells 2005; 5:213-229 [8] Costamagna P, Srinivasan S. J. Power Sources 2001;102: 242-252 [9]Wirguin CH, J Membr Sci 1996;120: 1-33 [10] Smitha B, Sridhar S, Khan AA J. Membr. Sci. 2005;259:10-26 [11] Hsu WY, Gierke TD Macromolecules 1982;15:101-105 [12] Heinzel A, Barragan VM J. Power Sources 1999; 84:70-74 [13] Ren X, Springer TE, Gottesfeld S. J. Electrochem. Soc. 2000; 147: 92-98 [14] Kreuer KD J. Membr. Sci. 2001; 185: 29-39 [15] Li QF, He RH, Jensen OJ, Bjerrum N J. Chem Mater 2003;15:4896-4915 [16] Ray SS, Okamoto M Prog Polym Sci 2003;28:1539-1641 [17] Zanetti M, Lomakin S, Camino G Macromol Mater Enineering 2000; 279: 1-9 [18] Schmidt D F PhD. Dissertation, Cornell University, 2003 [19] Aliouane N, Hammouche A, De Doncker RW, Telli L, Boutahala M, Brahimi B Solid State Ionics 2002; 148: 103-110 [20] Yano K, Usuki A, Okada A, Kurauchi T, Kamigaito O. J Polym Sci Part A-Polym Chem 1993; 31: 2493-2498 [21]Giannelis EP Adv Mater 1996;8: 29-35 [22] Paul DR, Robenson LM Polymer 2008;49:3187-3204 [23] Kim TK, Kang M, Choi YS, Kim HK, Lee W, Chang H, Seung D J. Power Sources 2007;165: 1 [24] Bebin P, Caravanier M, Galiano H J. Membr. Sci.2006; 278: 35 [25] Thomassin JM, Pagnoulle C, Caldarella G, Germain A, Jérôme R Polymer 2005; 46:11389 [26]. Lin YF, Yen CY, Hung CH, Hsiao YH, CC M. Ma J Power Sources 2007;168: 162 [27] Kim Y, Lee JS, Rhee CH, Kim HK, Chang H J. Power Sources 2006;168:180 [28] Rhee CH, Kim HK, Chang H, Lee JS Chem. Mater. 2005; 17:1691 [29] Thomassin JM, Pagnoulle, C, Bizzari D, Caldarella G, Germain A, Jérôme R Solid State Ionics 177 (2006) 1137 [30] Gosalawit R, Chirachanchai S, Shishatskiy S, Nunes SP Solid State Ionics 2007; 178: 1627 [31] Song MK, Park SB, Kim YT, Rhee HW, Kim J Mol. Cryst. Liq. Cryst. 2003: 407, pp. 15/[411]–23/[419] [32] Song MK, Park SB, Young-Taek Kim, Kim KH, Min SK, Rhee HW Electrochimica Acta 2004;50: 639–643 [33] Jung DH, Cho SY, Peck DH, Shin DR, Kim JS J Power Sources 2003;118: 205-211
14
[34] Kim DW, Choi HS, Lee C, Blumstein A, Kang Y Electrochimica Acta 2004;50: 659–662 [35] Zhang W, Li MKS, Yue PL, Gao P Langmuir 2008; 24: 2663-2670 [36] Adjemian KT, Lee SJ, Srinivasan S, Benziger J, Bocarsly AB. J Electrochem Soc 2002;149:A256-A261. [37] Dean JA, Lange NA, Knovel (Firm) Lange's handbook of chemistry. McGraw-Hill: New York, 1999 [38] Zawodzinski TA, Neeman M, Sillerud LO, Gottesfeld S. J Phys Chem 1991; 95: 6040-6044 [39] PermeGear Bethlehem, PA, 2006 [40] Crank J. The mathematics of diffusion; 2nd ed. Clarendon Press: Oxford, 1975 [41] Tricoli V J Electrochem Soc 1998; 145:3798-3801 [42] Tricoli V, Carretta N, Bartolozzi M. J Electrochem Soc 2000;147:1286-1290 [43] Moore RB, Martin CR Analytical Chemistry 1986; 58: 2569-2570 [44] Fujimura M, Hashimoto T, Kawai H. Macromolecules 1981; 14: 1309-1315 [45] Roche E J, Pineri M, Duplessix R, Levelut A. M. J Polym Sci Part B Polym Phys 1981; 19: 1-11 [46] Moore RB, Martin CR Macromolecules 1988;21:1334-1339 [47] Gebel G, Aldebert P, Pineri M Macromolecules 1987; 20: 1425-1428 [48] Moore RB, Martin CR Macromolecules 1989; 22: 3594-3599 [49] Gebel G, Lambard J Macromolecules 1997;30:7914-7920 [50]Gebel G, Moore RB Macromolecules 2000; 33: 4850-4855 [51] Schmidt-Rohr K, Chen Q Nature Materials 2008(7) 75-83 [52] Rubatat L, Gebel G, Diat O Macromolecules 2004;37:7772-7783 [53] Rubatat L, Rollet AL, Gebel G, Diat O Macromolecules 2002; 35:4050 [54] Rubatat L, Diat O, Macromolecules 2007; 40: 9455-9462 [55] van der Heidjen PC, Rubatat L, Diat O Macromolecules 2004;37: 5327-5336 [56] Lin HL, Yu TL, Han FH J Polym Research 2006; 13: 379-385 [57] DeRocher JP, Gettelfinger BT, Wang JS, Nuxoll EE, Cussler EL J Membr Sci 2005; 254:21-30 [58] Cussler EL, Hughes SE, Ward WJ, Aris R J. Membr. Sci. 1988; 38: 161-174 [59] Hudiono Y, Choi S, Shu S, Koros WJ, Tsapatsis M, Nair S. Micropor. Mesopor. Mater. 2009;118:427-434 [60]Kyu T, Eisenberg A Perfluorinated Ionomer Membranes, in: Eisenberg A., Yeager HL (Eds.), ACS Symposium Series 180, American Chemical Society, Washington, DC, 1982 [61] Stefanithis ID, Mauritz KA Macromolecules 1990;23:2397–2402
15
Figure 1. XRD diffractograms of Nafion membranes cast at 80 ºC (a) and 180ºC (b). Fit curves of experimental data are deconvoluted into an amorphous (ca. 16.4º) and crystalline (ca. 17.7º) scattering peaks. Data are shifted vertically for clarity.
8 10 12 14 16 18 20 22 24 26
0
500
1000
1500
2000
2500
(b)
Inte
nsity
[CPS
]
2θ Degrees
Tcast 80oC 180oCXRD ( ) ( )Fit
(a)
16
Figure 2. SAXS patterns obtained via integration of Nafion membranes cast at 80 ºC and 180ºC.
0.1 1
100
101
102
0.4 nm-1
Inte
nsity
q [nm-1]
Casting Temperture 80 C 180 C
17
Figure 3. XRD diffractograms of H+-exchanged montmorillonite (H+MMT), Nafion and three H+MMT-Nafion nanocomposites containing 2.5, 7.5 and 10 wt.% clay.
.
2 4 6 8 10 12 14 16 18 20 22
0
2000
4000
Inte
nsity
[CPS
]
2θ [Degrees]
H+MMT 10% wt/wt H+MMT in Nafion 7.5% wt/wt H+MMT in Nafion 2.5% wt/wt H+MMT in Nafion Nafion
18
Figure 4. Bright field TEM images of cross-sections of H+MMT-Nafion nanocomposite membranes containing 2.5 wt% (top), 5 wt% (middle), and 10 wt% (bottom) clay.
19
Figure 5. Schematic representation of bundles consisting of locally ordered polymeric elongated aggregates (surrounded by the ionic groups) adopted from ref. 52.
20
Figure 6. SAXS patterns of pure Nafion and a Nafion nanocomposite containing 10 wt % clay. Scattering was obtained in two orthogonal directions: normal plane (qx-qy) (surface parallel to the membrane surface) and transverse plane (qy-qz) (cross-section of the membrane).
21
0.0 0.5 1.0 1.5 2.0 2.5 3.0100
101
102
103
In
tens
ity (a
.u.)
q [nm-1]
Normal, meridional Normal, equatorial Transverse, meridional Transverse, equatorial
Figure 7. SAXS patterns of a Nafion nanocomposite containing 10 wt % clay.
22
Figure 8. Schematic of nanocomposite Nafion morphology: bundles of polymeric aggregates oriented parallel to the membrane surface.
23
Figure 9. Equatorial SAXS patterns from transverse plane for Nafion nanocomposite membranes containing various amounts of clay.
0.0 0.5 1.0 1.5 2.0 2.5 3.0100
101
102
103
Inte
nsity
q [nm-1]
Nafion 2.5% wt/wt H+MMT in Nafion 10% wt/wt H+MMT in Nafion
24
Figure 10. Relative methanol permeability for Nafion nanocomposite membranes as a function of volume fraction of clay: () Disp ersion medium: low aliphatic alcohols and water, solvent cast temperature 80 °C; () Dispersion medium: water, solvent cast temperature 180 °C. Solid lines represent the predictions from (Equation 3) for aspect ratios= 300 (―) and 60 (―). Inserts are bright field TEMs images corresponding to the two nanocomposite membranes.
25
Figure 11. Proton Conductivity of Nafion and Nafion nanocomposite membranes as a function of relative humidity.
0 20 40 60 80 10010-4
10-3
10-2
10-1
Cond
uctiv
ity [S
/cm
]
Relative Humidity [%]
Nafion 2.5% wt/wt H+MMTin Nafion 5% wt/wt H+MMT in Nafion 7.5% wt/wt H+MMT in Nafion 10% wt/wt H+MMT in Nafion
26
Figure 12. Values of apparent selectivity (κNanocomposite Membrane/κNafion) for different membranes normalized to that of Nafion. κ is calculated as protonic conductivity divided by permeability.
Nafion (AT)
10% wt/wt H+MMT-Nafion (AT)
16% wt/wt SIT:TEOS(2:1)-Nafion
7% wt/wt HS30SIT-Nafion0
1
2
3
4
5
κ Nano
hybr
id /κ
Nafio
n
27
Figure 13. Storage modulus as a function of temperature of Nafion and Nafion-clay nanocomposites containing 10 and 20 wt % H+MMT.
0 40 80 120 160 200 240 280
100
101
102
103
104
20% wt/wt H+MMT in Nafion10% wt/wt H+MMT in Nafion Nafion
Stor
age
Mod
ulus
(MPa
)
Temperature (oC)