Scale Up and Technology Transfer of Pharmaceutical Suspensions
Upload
independentCategory
view
4download
0
ORIGINAL CONTRIBUTION
Dielectric relaxation processes and ionic conductionbehaviour in poly(ethylene oxide)–montmorillonite claynanocomposite aqueous colloidal suspensions
R. J. Sengwa & Sonu Sankhla & Shobhna Choudhary
Received: 16 March 2009 /Revised: 23 May 2009 /Accepted: 25 May 2009 /Published online: 26 June 2009# Springer-Verlag 2009
Abstract The relative complex dielectric function, electricmodulus, alternating current (ac) electrical conductivity andcomplex impedance spectra of poly(ethylene oxide) (PEO)–montmorillonite (MMT) clay aqueous colloidal suspension(hydrocolloids) were investigated over the frequency range20 Hz to 1 MHz at 27 °C. The relaxation time correspondingto electrode polarisation and Maxwell–Wagner polarisationprocesses (ionic conduction) were determined from theseplots. The direct current (dc) electrical conductivity isevaluated from the fitting of real part ac conductivity data tothe Jonscher power law. A correlation of increase in dcconductivity and decrease of ionic conduction relaxation timewith increase of clay concentration is discussed consideringintercalation of PEO chains and its dynamics and exfoliationof MMT clay nanoplatelets in these complex fluids. Theformation of PEO–MMT clay supramolecular lamellar nano-structures with increase in continuity of lamellae arrange-ments were explored for the structural conformation of thesenanocomposite novel materials.
Keywords PEO–MMTclay nanocomposites . Dielectricrelaxation . Ionic conduction . Impedance spectroscopy .
PEO–MMT interactions . Hydrocolloids
Introduction
In last two decades, polymer–clay nanocomposites (PCNs)have evoked an intense industrial and academic research, due
to their remarkable improved mechanical, thermal, optical,chemical and electrical properties over pure polymers [1–8].Such improvements in their potentially novel properties aremainly owing to the interactions between polymer (organic)and nanoclay (inorganic) at a molecular level and the state ofclay dispersion or exfoliation. This opens the way tosynthesise a new novel material with pre-determined proper-ties at varying composition of the clay and polymer. Thehydrophilic montmorillonite (MMT) clay, which is calledinorganic polymer, is widely used for the preparation of PCNmaterials. The MMTclay is 2:1 phyllosilicate, and chemicallyit is a metal silicate [9]. Its nanometer-thickness layeredsheets are stacked by weak dipolar or van der Waals forcesand has both surface and edge charges. In water and variousorganic polar solvents, the MMT clay has excellent swellingproperties owing to the intercalation (absorption) of solventmolecules in the clay galleries and also the adsorption ofsolvent molecules on its external surfaces of the sheets.
The survey of literature exhibits that the poly(ethyleneoxide) (PEO)–MMT clay nanocomposite films are extensive-ly synthesised by solution intercalation and melt intercalationtechniques [10–21]. These PCNs are characterised bymechanical, thermal and spectroscopic techniques. Resultssuggest that PEO molecules have excellent intercalation inthe Na+-MMT clay galleries due to their hydrophilicbehaviour, good adhesion and favourable interaction com-patibility between the PEO and MMT clay. The structures ofintercalated PEO mainly govern the physico-chemicalproperties of the PEO–MMT clay nanocomposites. Experi-mental results confirmed that free MMT layers coexist withopen aggregates and tactoids in the PEO–MMT clay nano-composites and have different features depending on thefiller proportion and preparation route.
The large ionic conduction of alkali salt mixed PEO–MMT clay nanocomposite films prepared by solution and
Colloid Polym Sci (2009) 287:1013–1024DOI 10.1007/s00396-009-2056-6
R. J. Sengwa (*) : S. Sankhla : S. ChoudharyDielectric Research Laboratory, Department of Physics,J N V University,Jodhpur 342 005, Indiae-mail: [email protected]

melt intercalation routes confirmed their potential use as anovel solid electrolyte material for rechargeable batteries atambient temperature and also in design of advancedelectrochemical devices [22–29]. The flexible and linearchain molecular structure of PEO ensures a high ionicmobility of these PCN electrolytes. Further, the ionicconductivity of the PCNs also depends on the route of filmpreparation, concentration of clay and type of alkali saltused. The interesting properties of complex fluid containingthe dispersed morphology of MMT clay nanoplateletsmodify the structure and properties of solution intercalatedPCN films. Survey of literature exhibits that, so far, thedielectric behaviour and ionic conduction properties ofPEO–MMT clay nanocomposite aqueous colloidal suspen-sions have not been attempted, although it is the parentmaterial for the preparation of solution intercalated PEO–MMT clay nanocomposite films at ambient temperature.
The objective of present paper is to investigate thedielectric behaviour and alternating current (ac) electricalconductivity of the PEO–MMT clay nanocomposite aqueouscolloidal suspension with varying clay concentration over thefrequency range from 20Hz to 1MHz at ambient temperature.In order to understand the behaviour of ionic conduction in thecolloidal state of nanocomposites, the complex impedancespectroscopy is also employed to explore the interfacialpolarisation behaviour and relaxation phenomena in relationto the structural properties of the complex fluid. Further, theseinvestigations will help in design of PEO–MMT clay nano-composite colloidal materials of desired electrical propertiesfor their use in electrochemical sensors [30] and othertechnological applications [1–8]. The study of dielectricdispersion on simple and well-defined colloidal systems isalso important for understanding many complex phenomenalike those occurring in biological systems or systems withselective membranes. The PEO–MMT clay colloidal aque-ous suspension materials also have applications in on-machine and off-machine moisture barrier coating in pulpand paper industries and in petroleum industries. Therefore,it is interesting to fully understand the nature of variousinteractions that give rise to complex structures in thesecomplex hetero-materials and their relationship with changein concentration of the constituents by using dielectric andimpedance spectroscopy. These results may also be helpfulin the development of a handy dielectric tool for theirstructural characterisation. Recently, several investigators[22–44] have successfully employed the dielectric spectros-copy to yield quantitative information about the extent ofclay exfoliation and possible control on on-line meltpolymer–clay nanocomposite process and also the behaviourof clay intercalation and exfoliation in different polymermatrix in relation to their structural properties and ionconduction behaviour for their potential use as noveldielectric materials.
Materials and methods
Materials
The PEO powder of viscosity average molecular weightMv=6 × 10⁵ and polymer-grade hydrophilic sodium-montmorillonite (Na+-MMT) clay (Nanoclay, PGV) a prod-uct of Nanocor®, were purchased from Sigma-Aldrich. TheMMT clay is white in colour and has 145 meq/100 g cationexchange capacity, 150–200 aspect ratio (length to width),2.6 g/cc specific gravity, and 9–10 pH value (5% dispersion),which is best recommended clay for the preparation of PCNswith hydrophilic polymers.
Preparation of PEO–MMT clay nanocomposite aqueouscolloidal suspension (hydrocolloids)
For the preparation of MMT clay nanoplatelet colloidalsuspensions, 5 wt.% (weight fraction) of total solute (PEO +MMTclay; 2 g) was added in double-distilled deionised water(38 g) in glass bottles having air-tight caps in two-stepprocedure. Firstly, the required amount for 0, 1, 2, 3, 5, 10and 20 wt.% MMT clay concentrations i.e. 0.00, 0.02, 0.04,0.06, 0.1, 0.2 and 0.4 g of the total 2 g weight of solute wereadded in 38 g water for each concentration, separately. TheMMT clay nanoplatelet aqueous colloidal suspensions (inter-calated and exfoliated structures) were achieved by vigorousmagnetic stirring of the samples for 8 h at room temperature.After 24 h, the required amount of PEO solute (2.00, 1.98,1.96, 1.94, 1.9, 1.8 and 1.6 g) were added in the respectiveaqueous colloidal suspension clay concentration samples for5 wt.% concentration of the total weight of solute. After 48 h,each sample of the dissolved PEO in the aqueous suspendedclay were vigorous magnetic-stirred for 2 h to promote thePEO intercalation in clay sheets and its adsorption on the clayplatelet surfaces. The strong affinity of MMT clay nano-particles to PEO in aqueous media results in the highlyviscous and colloidally stable nanoparticles in suspension inthe PEO–MMT clay nanocomposite complex fluids, whichwere used for their dielectric/electrical characterisation.
Measurements
Agilent 4284A precision LCR meter and Agilent 16452Aliquid dielectric test fixture having a four-terminal nickel-plated cobal (an alloy of 17% cobalt +29% nickel +54%iron) smooth surface electrode of 38 mm diameter withceramic (alumina) as insulator and 1 mm spacing(sample thickness) were used for the capacitance andresistance measurement of the dielectric material in thefrequency range 20 Hz to 1 MHz. The specially designedelectrodes by Agilent technologies using nickel-platedcobal material have smooth surfaces which are close to
1014 Colloid Polym Sci (2009) 287:1013–1024
molecular level for better electrode/dielectric interfacecontact and for the precision dielectric measurement overthe broadband frequency range. The capacitances C0 andCP without and with sample, respectively, and parallelresistance Rp with sample were measured for the determi-nation of dielectric/electrical function of the materialunder test. The short-circuit compensation of the cell andits correction coefficient were considered to eliminate theeffect of stray capacitance during the evaluation of thefrequency-dependent values of complex dielectric func-tion. All measurements were made at 27 °C, and thetemperature was controlled by Thermo-Haake DC10controller.
The complex dielectric function ε*(ω) of the materials isdetermined from Eq. 1 [45]:
" wð Þ ¼ "0 j "
0 0 ¼ aCP
C0 j
1
wC0 RP
ð1Þ
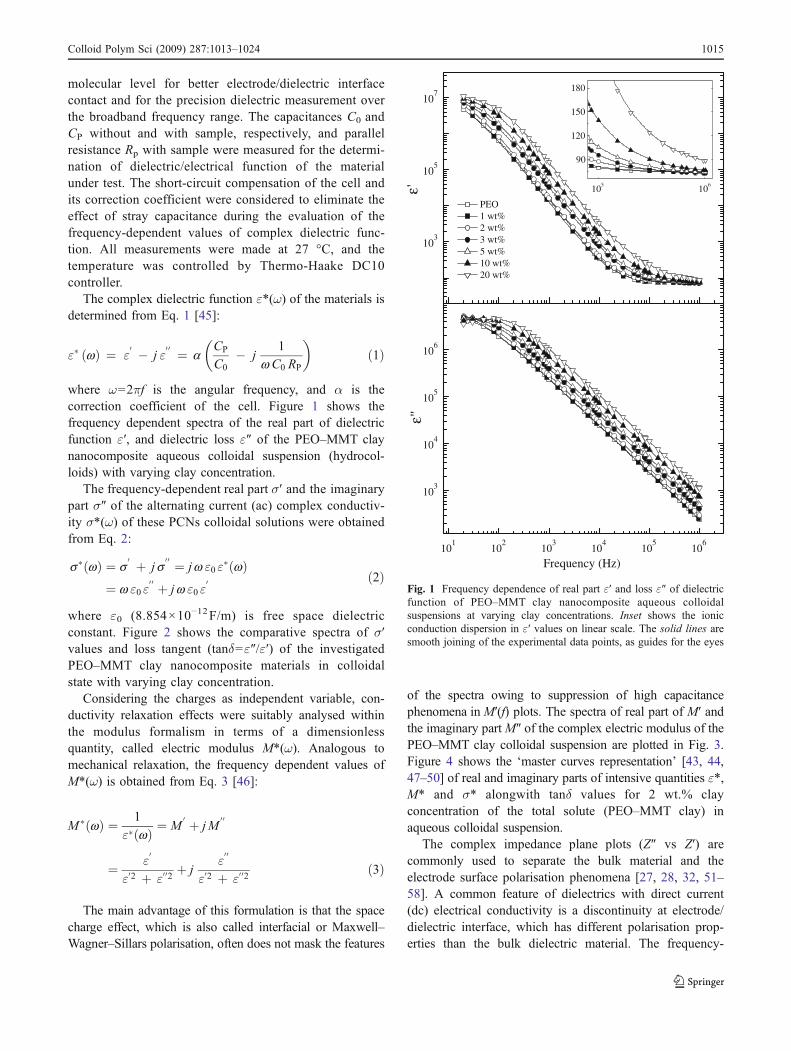
where ω=2πf is the angular frequency, and α is thecorrection coefficient of the cell. Figure 1 shows thefrequency dependent spectra of the real part of dielectricfunction ε′, and dielectric loss ε″ of the PEO–MMT claynanocomposite aqueous colloidal suspension (hydrocol-loids) with varying clay concentration.
The frequency-dependent real part σ′ and the imaginarypart σ″ of the alternating current (ac) complex conductiv-ity σ*(ω) of these PCNs colloidal solutions were obtainedfrom Eq. 2:
s wð Þ ¼ s0 þ j s
0 0 ¼ jw "0 " wð Þ
¼ w "0 "0 0 þ jw "0 "
0 ð2Þ
where ε0 (8.854×10⁻¹²F/m) is free space dielectricconstant. Figure 2 shows the comparative spectra of σ′values and loss tangent (tanδ=ε″/ε′) of the investigatedPEO–MMT clay nanocomposite materials in colloidalstate with varying clay concentration.
Considering the charges as independent variable, con-ductivity relaxation effects were suitably analysed withinthe modulus formalism in terms of a dimensionlessquantity, called electric modulus M*(ω). Analogous tomechanical relaxation, the frequency dependent values ofM*(ω) is obtained from Eq. 3 [46]:
M wð Þ ¼ 1
" wð Þ ¼ M0 þ j M
0 0
¼ "0
"02 þ "
0 02 þ j"0 0
"02 þ "
0 02 ð3Þ
The main advantage of this formulation is that the spacecharge effect, which is also called interfacial or Maxwell–Wagner–Sillars polarisation, often does not mask the features
of the spectra owing to suppression of high capacitancephenomena inM′(f) plots. The spectra of real part of M′ andthe imaginary partM″ of the complex electric modulus of thePEO–MMT clay colloidal suspension are plotted in Fig. 3.Figure 4 shows the ‘master curves representation’ [43, 44,47–50] of real and imaginary parts of intensive quantities ε*,M* and σ* alongwith tanδ values for 2 wt.% clayconcentration of the total solute (PEO–MMT clay) inaqueous colloidal suspension.
The complex impedance plane plots (Z″ vs Z′) arecommonly used to separate the bulk material and theelectrode surface polarisation phenomena [27, 28, 32, 51–58]. A common feature of dielectrics with direct current(dc) electrical conductivity is a discontinuity at electrode/dielectric interface, which has different polarisation prop-erties than the bulk dielectric material. The frequency-
101
102
103
104
105
106
103
104
105
106
Frequency (Hz)
103
105
107
PEO 1 wt% 2 wt% 3 wt% 5 wt% 10 wt% 20 wt%
105
106
90
120
150
180
Fig. 1 Frequency dependence of real part ε′ and loss ε″ of dielectricfunction of PEO–MMT clay nanocomposite aqueous colloidalsuspensions at varying clay concentrations. Inset shows the ionicconduction dispersion in ε′ values on linear scale. The solid lines aresmooth joining of the experimental data points, as guides for the eyes
Colloid Polym Sci (2009) 287:1013–1024 1015

dependent values of complex impedance of the PCNsmaterial were evaluated by Eq. 4:
Z wð Þ ¼ 1
Y wð Þ ¼ Z0 j Z
0 0
¼ Rp
1 þ wCp Rp
2 jwCp R2
p
1 þ wCp Rp
2 ð4Þ
Figure 5 shows the Z″ vs Z′ plots of the PEO–MMT clayaqueous colloidal solutions with varying clay concentration.
Results and discussion
Complex dielectric function spectra
The dielectric polarisation mechanisms at microwavefrequencies in liquid state polymeric materials in polar
solvents is mainly due to the orientation of permanentdipoles and reorientation motion of solvent molecules,whereas in low frequency dielectric dispersion polymerchain segmental motion, ionic conduction and electrodepolarisation phenomena contribute to the dielectric polar-isation [59, 60]. The increase of clay concentration in thePEO–MMT clay aqueous colloidal suspension graduallyincreases the ε′ and ε″ values over the entire low frequencyrange (Fig. 1). The overall increase of ε′ and ε″ of thesematerials resulted due to increase of both dipolar and freecharge contributions with increase of clay concentration[27, 28, 43, 44]. The intercalation and exfoliation of clay inaqueous colloidal suspension causes the Na+ cations toliberate from Na+-MMT clay nano platelets and formcomplexes with several ether oxygen units per unit volumewith increase of clay concentration. The inset of Fig. 1 alsoshows that there is significant increase in ε′ values in upperside range of the experimental frequency, i.e. 105–106Hz.The large increase in ε′ values at lower frequencies results
101
102
103
104
105
106
10-6
10-4
10-2
Frequency (Hz)
M''
10-6
10-4
PEO 1 wt% 2 wt% 3 wt% 5 wt% 10 wt% 20 wt%
M'
Fig. 3 Frequency dependence of real part M′ and loss M″ of electricmodulus of PEO–MMT clay nanocomposite aqueous colloidalsuspensions at varying clay concentrations. The solid lines are smoothjoining of the experimental data points, as guides for the eyes
101
102
103
104
105
106
0.00
0.02
0.04
0.06
σ' (
S/m
)
Frequency (Hz)
0
20
40
60
80 PEO 1 wt% 2 wt% 3 wt% 5 wt% 10 wt% 20 wt%
tanδ
Fig. 2 Frequency dependence of loss tangent (tanδ) and real part of acconductivity σ′ of PEO–MMT clay nanocomposite aqueous colloidalsuspensions at varying clay concentrations. The solid lines in tanδspectra are smooth joining of the experimental data points, as guidesfor the eyes. The continuous solid line in σ′ spectra represents the fitof experimental data to the Jonscher power law s
0wð Þ ¼ sdc þ Awn
1016 Colloid Polym Sci (2009) 287:1013–1024

in the strong upturn of the spectra (Fig. 1), which is mainlydue to the contribution of the electrode polarisation (EP)and Maxwell–Wagner (MW) interfacial polarisation [27,28, 43, 44, 51, 60–63].
The EP phenomena occurs due to formation of electricdouble layer (EDL) capacitances by the free charges thatbuild up at the interface between the electrolyte and theelectrode surfaces in plane geometry [48]. The buildup ofelectrical polarisation and the drop of the electric field inthe bulk are reflected by increase in the complex dielectricfunction and a decrease in the ac conductivity withdecreasing frequency. For completely blocking electrodes,conductivity is zero, of course. At high frequencies, thefast periodic reversal of the electric field leads to decreasein the long range drift of excess ion diffusion in thedirection of the field so that the charge accumulation forthe formation of EDL decreases, and consequently there is
decrease in the ε′ and ε″ values. Recently, Runt et al. [48,62, 63] extensively attempted the modelling of complexelectrode polarisation effect in polymer-based ionomers byconsidering its dependence on the sample length, electrodematerial surface smoothness and the frequency of appliedelectric field for the evaluation of molecular and ionmobility and mobile ion concentration. In the presentstudy, we have examined the EP phenomena effect inPEO–MMT clay hydrocolloids and its dependence on thematerial composition concentration and ac field frequencywith constant sample length using equally smooth surfaceelectrodes.
In the MW phenomena, the free charges build up duringthe electromigration at the interfacing boundaries of variouscomponents of different dielectric constant (or conductiv-ities) in the composite dielectric material, which results inthe formation of nanocapacitors in the dielectric material[64]. At sufficiently high frequencies, such short-rangemovements of free charges cannot follow the fast changesdeveloped in the ac field, and thus only molecular polar-isation occurs. The peak in tanδ spectra (Fig. 2) correspondsto electrode polarisation relaxation frequency (fEP) and isused to separate the bulk material and EP phenomena [47–50]. In the lower frequency range up to fEP, EP polarisationdominates over the MW polarisation. The electrode polar-isation relaxation time τEP values were obtained directlyfrom the value of fEP by the relation τEP ¼ 2p fEPð Þ1 [47,48, 62, 63].
The τEP involves charging and discharging time of EDLcapacitance, which is associated with the overall dynamicsof the adsorbed ions on the electrode surfaces in thealternating electric field [47, 48]. The calculated τEP valuesof the PEO–MMT clay aqueous colloids are plotted against
10 20 30 40 50 60 70 80
0
20
40
60
80
f =800kHz
f =30Hz
EP effect arc
Bulk material arc
54 kHz 44 kHz 29 kHz 27 kHz 17 kHz 16 kHz18 kHz
PEO; 1 wt%; 2 wt% 3 wt%; 5 wt%; 10 wt% 20 wt%
Z''
(Ω)
Z' (Ω)
Fig. 5 Complex impedance plane plots (Z″ vs. Z′) of PEO–MMT claynanocomposite aqueous colloidal suspensions at varying clay concen-trations. The solid lines are smooth joining of the experimental datapoints, as guides for the eyes
101
102
103
104
105
106
107
0
30
60
fEPta
nδ
Frequency (Hz)
10-4
10-3
10-2
fσ σ'
σ''
σ * (
S/m
)
10-8
10-5
10-2
M' M''
M*
101
104
107
ε' ε''
ε *
Fig. 4 Simultaneous superpositions of the extrapolated real andimaginary parts of the complex relative dielectric function ε*, theelectric modulus M* and the complex conductivity σ* at ionicconduction relaxation frequency fs. The loss tangent (tanδ) peakoccurs corresponding to strong upturn in ε′ and M′ values of PEO–MMT clay nanocomposite aqueous colloidal suspensions with 2 wt.%clay concentration. The solid lines are smooth joining of theexperimental data points, as guides for the eyes
Colloid Polym Sci (2009) 287:1013–1024 1017

MMT clay concentration (wt.%) in Fig. 6. The observed τEPvalues at 1 and 2 wt.% clay concentrations are slightlyhigher than the τEP value of PEO aqueous solution, but itdecreases significantly at 3 wt.% clay concentration, andthere is further decrease in τEP values for higher MMT clayconcentrations (Fig. 6, Table 1). The decrease of τEP valueswith increase of clay concentration above 2 wt.% suggeststhe enhancement in the dynamics of the EDL ions.
ac conductivity spectra
The σ′ spectra of the PEO–MMT clay aqueous colloidalsuspensions have frequency-independent plateau (Fig. 2),which corresponds to ionic or dc electrical conductivity σdc.The appearance of the dc plateau is an evidence of theformation of conducting path throughout in these materials.Further, it is found that the frequency region of dcconductivity plateau gradually extends to higher frequencieswith increasing MMT clay concentration. Generally, ionic
disordered materials show the power law behaviour, andtherefore, the frequency-dependent σ′ values of PEO–MMTclay hydrocolloids are fitted to the Jonscher power law [65]:
s0wð Þ ¼ sdc þ Awn ð5Þ
where A is the pre-exponential factor, and n is the fractionalexponent ranging between 0 and 1 for the electrolyte.Jonscher power law shows the best fit to real part ofdispersive conductivity of the materials at high frequencies.Figure 2 shows that the σ′ values of PEO–MMT clayhydrocolloids have the high frequency dispersion above theupper limit of the experimental frequency range, but thedispersion in EP regime of lower frequency side spectramake the suitability of the power law fit for the analysis ofion conduction behaviour in these materials. The solid line inthe σ′ spectra (Fig. 2) denotes the fit of experimental data tothe power law expression, and the fit values of σdc, A and nobtained by Origin® non-linear curve fitting software arerecorded in Table 1. The evaluated σdc values of thesematerials are plotted against clay concentration (wt.%) inFig. 6. The deviation from σdc (plateau region) value inlower frequency side of the conductivity spectra is theevidence of EP effect. The analysis of EP regime ofconductivity spectra for ion conductors placed betweenblocking electrodes have potential use for obtaining infor-mation about the number of mobile ions [48, 62, 63]. Incontinuation to this study, we will also attempt the EPconductivity spectra of various polymer–MMT clay colloidalsuspension ([43, 44, 61] and the present work) for theestimation of the number of mobile ions, that will be one ofthe future publications. For electrolyte, n value can bebetween 1 and 0.5, indicating the ideal long-range pathwaysand diffusion-limited hopping (tortuous pathway) conduc-tion, respectively [66]. Table 1 shows that the n values ofPEO–MMT clay hydrocolloids vary from 0.5 to 0.59 withincrease of MMT clay concentration up to 20 wt.%,suggesting the hopping conduction in these materials, inwhich sudden displacement of a charge carrier from oneposition to another close by (random walk) takes place. It isexpected because the ion motion in polymer matrix is mainlygoverned by the polymer chain segmental motion [59].
Dyre and coworkers [67–70] attempted various macro-scopic and microscopic models to explore the essentialphysics of dc and ac ion conduction in disordered materials.The random barrier model (RBM) of hopping conductionconfirms the universality of normalised ac conductivity ofexperimental data involving temperature and concentrationvariation in disordered materials. It has been establishedthat the scaling function of the RBM is universal, whichmeans that the shape of master curves of normalised acconductivity as a function of scaled frequency for alldisordered materials at varying temperature and composi-
0 5 10 15 20
0.02
0.04
0.06
σ dc (
S/m
)
clay concentration (wt%)
2
4
6
8
10
τ EP (
µs)
0.02
0.04
0.06
τ σ (µ
s)
Fig. 6 MMT clay concentration dependence of the ionic conductionrelaxation time ts , the electrode polarisation relaxation time τEP andthe dc conductivity σdc of PEO–MMT clay nanocomposite aqueouscolloidal suspensions. The solid lines are smooth joining of theexperimental data points, as guides for the eyes
1018 Colloid Polym Sci (2009) 287:1013–1024

tion concentration are same and obeys time–temperature–concentration superposition [67–71]. Macdonald [72] sug-gested that universality is an idealised concept which isindependent of both temperature and ionic concentration.Further, it is proved that complex-nonlinear-least-squaresfitting of ac conductivity dispersive data to the universalitymodel allows highly accurate discrimination between bulkionic response occurring in the high frequency regime andthat associated with electrode polarisation effect whichmask the features of the bulk spectra in lower frequencyregime [72]. We have also observed a correlation betweenelectrode polarisation relaxation time and ionic conductionrelaxation time of various polymers in solutions [49, 50, 54,55] and MMT clay colloidal suspension in polymersolutions [43, 44, 61].
In Fig. 7, scaled ac conductivity data of PEO–MMTclay hydrocolloids were plotted using various modelsdescribed in detail elsewhere [67–72]. Figure 7a shows thetraditional log–log scaling plot involving scaled acconductivity σ′(ω)/σ0 also known as normalised acconductivity with dc conductivity σdc (σ0) and scaledfrequency. For frequency scaling, we used the ionicconduction relaxation frequency fs f0ð Þ which is deter-mined from extrapolation of various intensive quantities assketched in ‘master curve representation’ (Fig. 4) atvarious MMT clay concentration because the dispersiveac conductivity in upper frequency regime is beyond theexperimental frequency range. Figure 7 shows that mastercurves of all the models have superposition in dcconductivity frequency range (governed by hoppingconduction), whereas plots show the electrode polarisationdeviation in lower frequency region which confirms thenonhopping conduction behaviour of these materials.Macdonald [72] attempted the electrode polarisation datausing complex-nonlinear-least-squares fitting and foundthat, after subtracting the electrode polarisation effect, thescaled data can be correctly represented by single mastercurve. Further, it concluded that fitting of real part ofdispersive conductivity data to the power law [65] in theelectrode polarisation frequency range has the similarsignificance to the fitting of dispersive conductivity datain higher frequency region, which is evident from the
increase of n value at higher concentration in PEO–MMTclay hydrocolloids. Further, the n value at higher clayconcentration of these materials is of the order of n valuesof planer crystals [70] confirming the formation of planernanostructures in PEO–MMT clay hydrocolloids. Thescaled dispersive conductivity data of PEO–MMT clayhydrocolloids in electrode polarisation and dc conduction
0
-1.0
-0.5
0.0
-1 0 1 4
-1.0
-0.5
0.0
-6 -5 -4 -3 -2 -1 0
-1.0
-0.5
0.0
a
b
log(
σ'/σ
0)lo
g(σ'
/σ0)
log(
σ'/σ
0)
log(ω/σ0T)
log(ω/ω0)
c
PEO; 1 wt%; 2 wt% 3 wt%; 5 wt%; 10 wt% 20 wt%
log(ω ∆ε ε0/σ0)2 3 5
1 2 3 4 5 6 7
Fig. 7 The log–log scaling plots of PEO–MMT clay hydrocolloidsplotted using various scaling law, a σ′ (ω)/σ0=F (ω/ω0); b σ′(ω)/σ0=F(ω/σ0 T); and c σ′(ω)/σ0=F (ω Δε ε0/σ0)
MMT clay (wt.%) A×107 Fractional exponent n σdc (S/m) τEP (μs) ts (μs)
0 3.1 0.52 0.013 8.80 0.067
1 3.0 0.50 0.013 9.75 0.058
2 3.0 0.50 0.016 9.24 0.043
3 3.0 0.50 0.022 5.97 0.032
5 3.2 0.53 0.027 5.51 0.028
10 3.3 0.55 0.040 3.64 0.018
20 3.5 0.59 0.061 2.93 0.016
Table 1 Values of parameters Aand n and σdc obtained from fitof the experimental data to thepower law s
0wð Þ ¼ sdc þ
Awn of various clay concentra-tion PEO–MMT clay hydrocol-loids and their values of electrodepolarisation relaxation time τEPand ionic conduction relaxationtime ts at 27 °C
Colloid Polym Sci (2009) 287:1013–1024 1019

frequency range are found in good agreement with theuniversality ac conduction of various disordered materials[67–72].
The electrical conductivity σ of an electrolyte is given byEq. 6 [73]:
s ¼X
nimi qi ð6Þ
where ni, μi and qi refer to charge carrier density, ionicmobility and ionic charge of ith ion, respectively. The ionicconductivity of a complex system increases due to theincrement of the number of mobile charge carriersintroduced/produced in the material and also due to theirmobility. In polymeric material, the mobility of free ions iscontrolled by the segmental motion of the polymer matrix[59, 74]. In the polymer–clay nanocomposite materials,there is existence of three H-bond phases, namely organicpolymer phase, inorganic polymer phase (some tactoids ofagglomerated clay nanocomposites) and organic and inor-ganic components phase [41]. Further, in inorganic–organicintercalated nanocomposites, polymer chains reside be-tween the layers of inorganic material forming 0.8–2.5 nmthin films, and in the exfoliated ones, the silicate layers aredispersed in the polymer matrix. The structural propertiesand dynamical behaviour of these intercalated and exfoli-ated nanocomposite phases govern the electrical conduc-tivity of the organic–inorganic nanocomposite. Figure 6shows that the σdc values of PEO–MMT clay aqueouscolloidal suspension increases with increase of clayconcentration (except 1 wt.% clay). To obtain the correla-tion between σdc and the structural properties of thesecomplex fluid materials, it is important to address some ofthe earlier findings on the structural behaviour of PEO–claynanocomposite films and also their aqueous colloidalsolutions.
The PEO–clay and polyethylene glycol (PEG)–claynanocomposite films are extensively attempted to maketheir use as solid electrolyte material with enhancedelectrical conductivity for rechargeable batteries [22–29].Different spectroscopy investigations on poly(ethyleneoxide) (PEO)–clay nanocomposites confirmed that theintercalated PEO molecules between silicate galleriesimpede the polymer crystallisation, which results in higherelectrolyte conductivity compared to the system withoutclay [75]. In regard to the structural behaviour of thePEO–MMT clay nanocomposites, it was postulated thatthe PEO chains exist in helical structure in the intercalatedstate, forming some kind of tunnel that increases themobility of the cations and hence also the electricalconductivity [18]. The X-ray diffraction (XRD) study ofthese materials confirmed that the intercalated oxyethyleneunits are arranged in flattened monolayer arrangementswith 4Å interlayer expansion [15]. It is supported by trans
conformation to at least a portion of (O–CH2–CH2–O)groups of the PEG chain [11]. Further, the main drivingforce for the intercalation reaction results from orientationof the polymer chains such that they form hydrogen bondwith the hydroxylated aluminate surfaces of the clay. Forthe maximum hydrogen bonding interaction, the PEGpolymer adopts a conformation such that its oxygenmatches up with the surface hydroxyl groups of the clay.For this, the distances between oxygens in the polymerchain is roughly comparable to the distances betweenhydroxyl groups in clay sheets. In case of clay, interhy-droxyl distance of ~2.8Å and the oxyethylene grouprepeating every 2.8Å and all facing towards the surface ofclay would be particularly favourable [11]. Recently,Hikosaka et al. [19] investigated systematically thePEO–MMT clay nanocomposites with 0.5–25 wt.% clayloading and prepared by different routes using XRD anddifferential scanning calorimetry aiming at clarifying thecontroversy on crystallisation mechanism in these nano-composites. Results confirmed that intercalation of PEOchain in MMT galleries significantly decreases thecrystallisation of the PEO matrix, whereas it is weaklyaffected by the presence of exfoliated silicate in PEO–MMT clay nanocomposites. Further, loading of 1 wt.%clay in PEO–MMT clay nanocomposites prepared byaqueous suspension results in the abrupt decrease in PEOcrystallinity.
In PEO–MMT clay aqueous colloidal suspension, thehetro-interactions between clay platelets, PEO chains andwater molecules originate their complex structures, whichcontrol the electrical conduction behaviour. The PEO is theonly water-soluble poly ether, probably due to the specifichydrogen bond formation between the ether oxygen of PEOand water and the organisation of water in the polymermatrix. From dielectric measurements, Kyritsis and Pissis[76] have suggested that the formation of strong PEO–water interactions in their hydrogels is because the watermolecule can fit within the PEO chain structure withoutproducing strong distortions in it. The aqueous suspensionof MMT clay has intercalated and exfoliated structures withsome agglomerates of staged silicate layers so totalexfoliation/intercalation of the MMT clay cannot beachieved through solution suspension process [9]. Theaddition of PEO molecules to the aqueous suspension ofnanometer-sized MMT clay platelets modify the structureand properties of the complex fluid due to interactionsbetween the clay particles and the PEO molecules, as wellas change in the particle–particle interactions in presence ofPEO chain and its interactions with water. In fact the MMTmiscibility in the PEO matrix is due to the large number ofNa+ ions in the MMT galleries that are coordinated by theether type oxygen atoms of the PEO. In PEO–MMT claynanocomposite colloidal aqueous suspension, free MMT
1020 Colloid Polym Sci (2009) 287:1013–1024

layers coexist with open aggregates and tactoids withdifferent features depending on the clay concentration.
Recently, Bruyn et al. [77] investigated the transientresponse to simple shear of aqueous dispersion of laponiteclay particles and PEO and confirmed that shear promotestheir network structure via formation of polymer–claybonds. Further, under quiescent conditions, PEO partiallyadsorbs on the surfaces of the aqueous suspended clayparticles. These materials can be tuned to obtain particularlydesired structural and rheological properties by varying thecomposition. Nelson and Cosgrove [78, 79] investigated PEOadsorbed on laponite in aqueous colloids by a small-angleneutron scattering and dynamic light scattering study. Theyconfirmed that, for the colloids of less than 1 wt.% laponiteconcentration, PEO is adsorbed on the face of clay particlebut that it also extends or “wraps” over the edges with thethicker edge layer compared to the face layer making the“plum-pudding” situation unlikely. Liu et al. [21] alsosynthesised the ordered assemblies of PEO-incorporatedMMT clay nano-platelets by sedimentation, centrifugation,slip casting, electrophoresis and filtration method andestablished that the parallel aligned layers of clay nano-platelets depends on the method of synthesis and also on thestructural properties in aqueous suspension.
Considering all the above facts, now we correlate thestructural behaviour of PEO–MMT clay nanocompositeaqueous colloidal suspension with their measured ionicconductivity. Figure 6 shows that the σdc values of thesematerials increases with increase of clay concentration(except 1 wt.% clay). The σdc represents the migration ofunbound charges in the material. For polymer–clay nano-composites, it has been established that the σdc value isgoverned by the segmental motion of polymer chain andthe polymer–clay network structure [34, 74]. The dcconductivity of Na+-MMT clay at 200 °C is ~10−7S/cm,and its value increases with increase of the relativehumidity or the water content [32, 80]. Pure PEO also hasthe σdc~10
−7S/cm at 40 °C [27].No change in σdc value at 1 wt.% clay concentration of
PEO–MMT clay aqueous colloidal suspension suggests theformation of cross-linked structures of clay platelets andpolymer matrix as the PEO chains form extended loops andtails. The strong interaction between the large adsorbedPEO on the surfaces of different orientational ordered clayplatelets reduces ion concentration and their mobility inPEO–MMT cross-linked structures, and hence there is noincrease in σdc value at 1 wt.% clay concentration. Ourspeculation on the nanocomposite structures is also sup-ported by the abrupt decrease in crystallinity of PEO–MMTclay nanocomposite at 1 wt.% MMT clay concentration[19]. Further, the crosslinking between PEO and MMT clayplatelets limit the mobility of the PEO chains, which doesnot favour the ion's mobility. Furthermore, it seems that the
thicker layer of adsorbed PEO on MMT surfaces and edgesalso reduces the concentration of mobile ions. At 2 wt.%and higher concentration of clay, it seems that the clayplatelets orient with their surfaces in the direction of themotion of ions, which form the PEO–clay lamellar nano-structures with spatial continuity of lamellae arrangementand leads to supramolecular ionic conductive structures,thus increasing σdc values. In these PEO–clay supramolec-ular lamellar nanostructures, the PEO crystallisation occursin the intercalated PEO chain outside the MMT gallery,which speed up the PEO segmental motion due to theinhibition of cooperative motions between neighbouringsegments in the confined space of the clay galleries. Theseeasy conductive paths with increase of MMT clay concen-tration also facilitate the ion mobility and increase the σdcvalue. Recently [74], the broadband ac electrical conduc-tivity study of polypropylene montmorillonite–polypyrrolecomposites also established the formation of polymer–clayinterconnected conductive path which controls the dcconduction in the materials. Miwa et al. [81], working onPEO–MMT clay nanocomposites by XRD, differentialscanning calorimetry and Fourier transform infrared studiesrevealed that the crystallisation of the intercalated PEO wasinhibited due to the confinement in the narrow claygalleries. The decrease in crystallisation of the intercalatedPEO accelerated the chain segmental dynamics in theconfined space of the clay galleries. This enhances themobility of Na+ cations complexed with PEO chain andhence increases the ionic conductivity of PEO–MMT clayaqueous colloidal suspension. The dielectric and ionicconduction study on PEO–salt ionomers also establishedthat the Na+ cation mobility is strongly coupled to thesegmental motion of the polymer chain and controlled bythe glass transition temperature of the polymer [62, 63].Elmahdy et al. [20] also confirmed the increase insegmental dynamics of PEO intercalated in clay galleriesby using temperature dependence dielectric spectroscopy ofPEO–MMT clay nanocomposite films. Besides PEO–MMTstructural behaviour and polymer dynamics, the contribu-tion of increase in number of free ions with increase of clayconcentration in PEO–clay aqueous colloidal suspensionalso favours the increase of σdc values. Further, it seemsthat there is an increase in spatial continuity of lamellaearrangements in the PEO–MMT clay aqueous colloidalsuspension with increase of MMT clay concentration [77],which favours the easy ionic paths and contributes to theincrease in dc conduction.
Electric modulus spectra
The M′ spectra of the PEO–MMT clay nanocompositeaqueous colloidal suspension, which are free from spacecharge effect, show a large dispersion in the ionic
Colloid Polym Sci (2009) 287:1013–1024 1021

conduction region (above fEP; Fig. 3). Figure 4 shows the‘master–curves representation’ of the intensive dielectricquantities of 2 wt.% clay for PEO–MMT clay aqueouscolloidal suspension as one of the representative plots. Suchplots are frequently used to find out the commonintersection frequency fs of the real and imaginary partsof all intensive quantities in the ion conduction region [43,44, 47, 49, 50, 61]. For PEO–MMT clay aqueous colloids,the fs value is above 1 MHz, that is the upper limit ofexperimental frequency range of the LCR meter, and hence,the fs values were estimated from the extrapolation of realand imaginary parts of intensive quantities as shown inFig. 4. These fs values are corresponding to Maxwell–Wagner or ionic conductivity relaxation process. In theconductivity spectra, fs value separates the change in ionsfrom dc to ac transport. The ionic conduction relaxationtime ts values obtained from the relation ts ¼ 2p fsð Þ1
of these materials decrease with increase of clay concen-tration (Fig. 6). The decrease of ts favours the increase ofionic mobility, and hence, there is increase of σdc values ofPEO–MMT clay nanocomposite aqueous colloidal suspen-sions. It has been established that the time constant ts ofMW polarisation process has the correlation with charac-teristic length in nanocomposites, and it provides informa-tion on dispersion and delamination/exfoliation of clayplatelets on a nanometer scale in on-line process [31] andoff-line process of the PCN materials [36]. The reduction ints value also suggests the enhancement in cooperativedynamics of the dipolar groups of the intercalated PEOchains, which favours the formation of PEO–MMT clayplanner structures in their aqueous colloidal suspension andincreases the ion mobility (transport of Na+ cations) andsimultaneously the ionic conductivity.
Noda et al. [31] applied the fs (also known as fMW)values for real-time measuring of the extent of clayexfoliation during the polymer–clay nanocomposites pro-cess. They observed that fs value depends upon the amountof clay aggregate and intercalated or exfoliated state or anycombination thereof. As exfoliation proceeds, nanosizesilicate flakes present an ever-expanding polymer/clayinterface area that increases the internal capacitance of thecomposite where conducting ions can accumulate. Silicateflakes act as nanocapacitors in the melt polymer. In general,the MW relaxation time ts tMWð Þ can be viewed as anelectrical RC time constant, where R is the resistance of thepolymer matrix, and C is the capacitance of the silicateparticle. The decrease of ts value with increase of clayconcentration in PEO–clay nanocomposite aqueous colloi-dal suspension suggests that the dynamics of the interfacialaccumulated charges increases, which may be due to theextent of clay exfoliation in dynamic state. Further, the H-bond interfacial bridging of exfoliated clay platelets withoxygen ether of PEO monomer units is attributed to an
increase of local free volume, resulting in the fasterdynamics of their network structures, which is alsofavoured by the decrease of ts value.
Complex impedance spectra
The frequency value of the experimental points increaseson going from right to left side on the arcs of the compleximpedance plane plot (Z″ vs Z′) of the PEO–MMT clayaqueous colloidal suspension (Fig. 5). All these plots havetwo separate arcs, which are corresponding to the bulkmaterial effect (the upper frequency arc) and the electrodesurface polarisation effect (the lower frequency arc) [27, 28,43, 44, 47, 49, 61]. Response of impedance spectra of acomposite material provides information on the nature ofconducting species, whether the conduction is by ions orelectrons [56–58]. The presence of low-frequency arcconfirms the ionic conduction in these complex fluids,which gives rise to EDL on the surface of each electrode ofthe sample holder. Further, the gradual disappearance of adepressed arc of the material with increase of clayconcentration in the upper experimental frequencies revealsthe decrease of material capacitive nature, and there is justdiffusion process. The frequency values corresponding toZ″ minimum value in the plots separate the bulk materialand electrode polarisation phenomena, and these frequenciesare marked in the same figure. The values of these frequenciesare exactly equal to the value of tanδ peak frequency fEP. Incomplex impedance plane plots, the extrapolated intercept onthe real axis Z′ of the common part of two arcs gives thevalue of dc bulk resistance Rdc, of the dielectric material[27, 28]. It is observed that the Rdc value of these materialsdecreases with the increase of MMT clay concentration, andhence the σdc values increases.
Conclusions
This paper reports the first systematic dielectric dispersionbehaviour and relaxation processes study of PEO–MMTclay nanocomposite aqueous colloidal suspension in thefrequency range 20 Hz to 1 MHz. Two relaxation processescorresponding to ionic conduction and electrode polar-isation phenomena were observed in these materials. Thecomparative analysis of the spectra of various dielectric/electrical quantities confirms that the ionic conduction ofthese complex fluids is governed by the structural proper-ties of the PEO–MMT clay networks. The MMT clayconcentration dependent ac conductivity spectra and dcconductivity behaviour revealed the formation of PEO–MMT clay supramolecular lamellar nanostructures due toorientational ordering of MMT clay nano-platelets andintercalated nano-thickness PEO structures with spatial
1022 Colloid Polym Sci (2009) 287:1013–1024
continuity of lamellae arrangements. Such structures speedup the PEO segmental motion in the confined space of theclay galleries and provide an easy path for the ionicconduction of Na+ cations complexed with PEO chain withincrease of clay concentration, which is confirmed from thedecrease of ionic conduction relaxation time. The clayconcentration-dependent ionic conductivity behaviour ofPEO–MMT clay aqueous colloidal suspension reveals thedesign of PEO–MMT clay solid electrolyte with desirableconduction properties from the solution intercalation route.The significant structural correlation with the dielectricdispersion, low-frequency relaxation phenomena and ionicconduction on the PEO–MMT clay nanocomposite aqueouscolloidal suspension prove the applications of dielectricspectroscopy for the reliable assessment of nanocompositesand nanoparticle dispersion (intercalation and exfoliation)specially in case of hydrophilic linear chain polymer–MMTclay nanocomposites.
Acknowledgements Authors are grateful to the Department ofScience and Technology, New Delhi for providing the experimentalfacilities through project No. SR/S2/CMP-09/2002. One of the authorsSS is grateful to the CSIR, New Delhi for providing the RAFellowship, and SC is thankful to the University Grants Commission,New Delhi for the award of RFSMS fellowship.
References
1. Pinnavaia TJ, Beall GW (2001) Polymer–clay nanocomposites.Wiley, New York
2. Carrado KA (2000) Appl Clay Sci 17:1–233. Ray SS, Okamoto M (2003) Prog Polym Sci 28:1539–16414. Tanaka T, Montanari GC, Mülhaupt R (2004) IEEE Trans Dielectr
Electr Insul 11:763–7845. Ray SS, Bousmina M (2005) Prog Mater Sci 50:962–10796. Burmistr MV, Sukhyy KM, Shilov VV, Pissis P, Spanoudak A,
Sukha IV, Tomila VI, Gomza YP (2005) Polymer 46:12226–12232
7. Aranda P, Darder M, Fernández-Saavedra R, López-Blanco M,Ruiz-Hitzky E (2006) Thin Solid Films 495:104–112
8. Gun'ko VM, Pissis P, Spanoudaki A, Zarko VI, Nychiporuk YM,Andriyko LS, Goncharuk EV, Leboda R, Skubiszewska-Zieba J,Osovskii VD, Ptushinskii YG (2007) J Colloid Interface Sci312:201–213
9. Bergaya F, Theng BKG, Lagaly G (2006) Handbook of clayscience. Elsevier, Amsterdam
10. Ogata N, Kawakage S, Ogihara T (1997) Polymer 38:5115–511811. Tunney JJ, Detellier C (1996) Chem Mater 8:927–93512. Liao B, Song M, Liang H, Pang Y (2001) Polymer 42:10007–
1001113. Shen Z, Simon GP, Cheng YB (2002) Polymer 43:4251–426014. Shen Z, Simon GP, Cheng YB (2003) Eur Polym J 39:1917–192415. Strawhecker KE, Manias E (2003) Chem Mater 15:844–84916. Chaiko DJ (2003) Chem Mater 15:1105–111017. Chen B, Evans JRG (2004) J Phys Chem B 108:14986–1499018. Reinholdt MX, Kirkpatrick RJ, Pinnavaia TJ (2005) J Phys Chem
B 109:16296–1630319. Hikosaka MY, Pulcinelli SH, Santilli CV, Dahmouche K,
Craievich AF (2006) J Non-Cryst Solids 352:3705–3710
20. Elmahdy MM, Chrissopoulou K, Afratis A, Floudas G, Anasta-siadis SH (2006) Macromolecules 39:5170–5173
21. Liu T, Chen B, Evans JRG (2008) Bioinsp Biomim 3:016005 (7pp)22. Chen HW, Chang FC (2001) Polymer 42:9763–976923. Chen W, Xu Q, Yuan RZ (2001) Comp Sci Tech 61:935–93924. Chen HW, Chiu CY, Wu HD, Shen IW, Chang FC (2002) Polymer
43:5011–501625. Loyens W, Maurer FHJ, Jannasch P (2005) Polymer 46:7334–
734526. Sandi G, Carrado KA, Joachin H, Lu W, Prakash J (2003) J Power
Sources 119–121:492–49627. Thakur AK, Pradhan DK, Samantaray BK, Choudhary RNP
(2006) J Power Sources 159:272–27628. Pradhan DK, Choudhary RNP, Samantaray BK (2008) Express
Polym Lett 2:630–63829. Kim S, Hwang EJ, Jung Y, Han M, Park SJ (2008) Colloids Surf
A: Physicochem Eng Asp 313–314:216–21930. Mousty C (2004) Appl Clay Sci 27:159–17731. Noda N, Lee YH, Bur AJ, Prabhu VM, Snyder CR, Roth SC,
McBrearty M (2005) Polymer 46:7201–721732. Okamoto M, Morita S, Kotaka T (2001) Polymer 42:2685–
268833. Pluta M, Jeszka JK, Boiteux G (2007) Eur Polym J 43:2819–283534. Mijović J, Lee H, Kenny J, Mays J (2006) Macromolecules
39:2172–218235. Rao Y, Pochan JM (2007) Macromolecules 40:290–29636. Böhning M, Goering H, Fritz A, Brzezinka KW, Turky G,
Schönhals A, Schartel B (2005) Macromolecules 38:2764–277437. Yi X, Duan HL, Chen Y, Wang J (2007) Physica Letters A
372:68–7138. Passaglia E, Bertoldo M, Ciardelli F, Prevosto D, Lucchesi M
(2008) Eur Polym J 44:1296–130839. Fritzsche J, Das A, Jurk R, Stöckelhuber KW, Heinrich G,
Klüppel M (2008) Express Polym Letts 2:373–38140. Kanapitsas A, Pissis P, Kotsilkova R (2002) J Non-Cryst Solids
305:204–21141. Mamunya Y, Kanapitsas A, Pissis P, Boiteux G, Lebedev E (2003)
Macromol Symp 198:449–45942. Gun'ko VM, Borysenko MV, Pissis P, Spanoudaki A, Shinyashiki
N, Sulim IY, Kulik TV, Palyanytsya BB (2007) Appl Surf Sci253:7143–7156
43. Sengwa RJ, Choudhary S, Sankhla S (2008) Express Polym Letts2:800–809
44. Sengwa RJ, Choudhary S, Sankhla S (2009) Colloids Surf A:Physicochem Eng Aspects 336:79–87
45. Technologies A (2000) Agilent 16452A liquid test fixture—operation and service manual. Agilent, Japan
46. Macedo PB, Moynihan CT, Bose R (1972) Phys Chem Glasses13:171–179
47. Zhang S, Dou S, Colby RH, Runt J (2005) J Non-Cryst Solids351:2825–2830
48. Klein RJ, Zhang S, Dou S, Jones BH, Colby RH, Runt J (2006) JChem Phys 124:144903 (8pp)
49. Sengwa RJ, Sankhla S (2007) Colloid Polym Sci 285:1237–1246
50. Sengwa RJ, Sankhla S (2007) J Macromole Sci Part B: Phys46:717–747
51. Macdonald JR (1987) Impedance spectroscopy. Wiley, New York52. Kyritsis A, Pissis P, Grammatikakis J (1995) J Polym Sci Part B:
Polym Phys 33:1737–175053. Pissis P, Kyritsis A (1997) Solid State Ionics 97:105–11354. Sengwa RJ, Sankhla S (2007) Polymer 48:2737–274455. Sengwa RJ, Sankhla S (2008) Polym Bulletin 60:689–70056. Plocharski J, Wycislik H (2000) Solid State Ionics 127:337–34457. Krishantha DMM, Rajapakse RMG, Tennakoon DTB, Dias HVR
(2006) Ionics 12:287–294
Colloid Polym Sci (2009) 287:1013–1024 1023

58. Subba Reddy ChV, Wu GP, Zhao CX, Zhu QY, Chen W, KalluruRR (2007) J Non-Cryst Solids 353:440–445
59. Kremer F, Schönhals A (2003) Broadband dielectric spectroscopy.Springer, New York
60. Shinyashiki N, Sengwa RJ, Tsubotani S, Nakamura H, Sudo S,Yagihara S (2006) J Phys Chem A 110:4953–4957
61. Sengwa RJ, Choudhary S, Sankhla S (2009) Polym Int 58:781–789
62. Fragiadakis D, Dou S, Colby RH, Runt J (2008) Macromolecules41:5723–5728
63. Fragiadakis D, Dou S, Colby RH, Runt J (2009) J Chem Phys130:064907 (11pp)
64. Kyritsis A, Pissis P (1997) Macromol Sympo 119:15–2465. Jonscher AK (1983) Dielectric relaxation in solids. Chelsea
Dielectric, London66. Mauritz KA (1989) Macromolecules 22:4483–448867. Dyre JC (1988) J Appl Phys 64:2456–246868. Dyre JC, Schrøder TB (2000) Rev Mod Phys 72:873–89269. Schrøder TB, Dyre JC (2002) Phys Chem Chem Phys 4:3173–
3178
70. Dyre JC, Maass P, Roling B, Sidebottom DL (2009) Rep ProgPhys 72:046501 (15pp)
71. Sidebottom DL (1999) Phys Rev Lett 82:3653–365672. Macdonald JR (2005) Phys Rev B 71:184307 (12pp)73. MacCallum JR, Vincent CA (1987) Polymer electrolyte reviews,
vol I. Elsevier, London74. Pandis C, Logakis E, Peoglos V, Pissis P, Omastová M,
Mravćáková M, Janke A, Pionteck J, Peneva Y, Minkova L(2009) J Polym Sci Part B: Polym Phys 47:407–423
75. Aranda P, Ruiz-Hitzky E (1999) Appl Clay Sci 15:119–13576. Kyritsis A, Pissis P (1997) J Polym Sci B: Polym Phys 35:1545–
156077. de Bruyn JR, Pignon F, Tsabet E, Magnin A (2008) Rheol Acta
47:63–7378. Nelson A, Cosgrove T (2004) Langmuir 20:2298–230479. Nelson A, Cosgrove T (2004) Langmuir 20:10382–1038880. Robledo A, Garcia NJ, Bazan JC (2001) Solid State Ionics
139:303–30881. Miwa Y, Drews AR, Schlick S (2008) Macromolecules 41:4701–
4708
1024 Colloid Polym Sci (2009) 287:1013–1024
Copyright © 2022 FDOKUMEN