Facile synthesis and enhanced photocatalytic activity of hierarchical porous ZnO microspheres
7
Facile synthesis and enhanced photocatalytic activity of porous Sn/Nd-codoped TiO 2 monoliths Jimin Du a,⇑ , Zhiyong Wang a , Guoyan Zhao a , Yongteng Qian a , Huijuan Chen a , Jie Yang a , Xinghui Liu a , Kaidi Li a , Chenxi He a , Weimin Du a , Imran Shakir b,⇑ a School of Chemistry and Chemical Engineering, Anyang Normal University, Henan Province, PR China b Deanship of Scientific Research, College of Engineering, PO Box 800, King Saud University, Riyadh 11421, Saudi Arabia article info Article history: Received 13 January 2014 Received in revised form 6 April 2014 Accepted 15 April 2014 Available online 29 April 2014 Keywords: Porous structure Photocatalyst Sol–gel method Codoped TiO 2 Anatase abstract Herein, we report a facile route of synthesis that includes sol–gel method followed by the high temper- ature calcination with the aim to synthesize porous Sn/Nd-codoped TiO 2 monoliths with crystallized ana- tase walls using polystyrene spheres as template. Our results showed that both Sn and Nd dopant were well dispersed in the host matrix of the final product. Moreover, this as-synthesized porous Sn/Nd-cod- oped TiO 2 composite showed relatively narrow band gap compared to the pure anatase phase of TiO 2 , which may have its origin from the contributions from the Sn 4+ and Nd 3+ impurities. Interestingly, beside the narrowing of band gap in the codoped TiO 2 , the doping also have a positive effect to help reduced the charge recombination rate, which can be seen from the enhanced lifetime of photogenerated electrons/ hole pairs. Finally, the photocatalytic activity of this interesting porous Sn/Nd-codoped TiO 2 monolith was examined by carrying out the dye degradation experiments on methyl orange under UV–vis irradi- ation. The porous Sn/Nd-codoped TiO 2 monolith showed better catalytic activity than the pure TiO 2 and Degussa P25 due to its narrow band gap, reduced photoinduced h + /e pair recombination rate, and rel- atively large surface area. The synergistic combination of doping and surface area enhancement (porous structure) can be adopted as a promising material design strategy to develop photocatalyst materials for degradation of organic pollutants. Ó 2014 Elsevier Inc. All rights reserved. 1. Introduction TiO 2 is the most studied semiconductor for environmental cleanup applications because of its unique ability of photocatalytic degradation of various organic contaminants, chemical inertness and nontoxicity [1–4]. In view of photocatalytic applications, TiO 2 has been widely used to catalyze the photo-degradation of pollutants [5], alcohol dehydration reaction [6], oxidation of aro- matic compounds [7], and nitrogen oxide reduction [8]. However, low quantum efficiency and high band gap of TiO 2 limit its com- mercial viability as a photocatalyst material. To address these issues, strategies such as doping metal ions and coupling TiO 2 with other semiconductor materials with appropriate electronic struc- ture have been successfully adopted with some limited success so far [9]. In this scenario, a number of studies have been carried out on doping various metal ions in TiO 2 with the aim to improve its photocatalytic activity [10–12]. As reported by Vinodgopal and Kamat, a high-photocatalytic degradation rate of organic dyes has been achieved using particulate film prepared from a mixture of TiO 2 and SnO 2 colloidal suspensions [13]. All these results can be attributed to the increase in the separation rate of photoinduced charge carriers due to the electron transfer from TiO 2 to SnO 2 . In addition, doping with lanthanide ions with 4f electron configura- tions can significantly enhance the photocatalytic activity of TiO 2 [14]. That is to say, the partly filled 4f electron orbits in rare earth ions can form a new energy level between the TiO 2 valence and conduction band, which results in the narrowed band gap. Thomas et al. reported that samarium-doped anatase TiO 2 with a higher photocatalytic activity than Degussa P25 was prepared via a low temperature hydrothermal route [15]. For the enhancement of photocatalytic performance, the porous structure of anatase TiO 2 is highly desirable due to its advantages such as a high specific surface area, multidimensional framework, and easy mass transport, which can afford more active sites for adsorption and photocatalytic reactions [16]. The Nd 3+ dopant are most likely located in interstitial positions of the lattice rather than directly in Ti 4+ sites because of the relatively large size differ- ence between dopant Nd 3+ of radius of 1.0 Å and Ti 4+ of 0.745 Å. http://dx.doi.org/10.1016/j.micromeso.2014.04.033 1387-1811/Ó 2014 Elsevier Inc. All rights reserved. ⇑ Corresponding authors. Tel.: +86 372 3300671; fax: +86 372 2900040 (J. Du). E-mail addresses: [email protected] (J. Du), [email protected] (I. Shakir). Microporous and Mesoporous Materials 195 (2014) 167–173 Contents lists available at ScienceDirect Microporous and Mesoporous Materials journal homepage: www.elsevier.com/locate/micromeso
-
Upload
independent -
Category
Documents
-
view
1 -
download
0
Transcript of Facile synthesis and enhanced photocatalytic activity of hierarchical porous ZnO microspheres

Microporous and Mesoporous Materials 195 (2014) 167–173
Contents lists available at ScienceDirect
Microporous and Mesoporous Materials
journal homepage: www.elsevier .com/locate /micromeso
Facile synthesis and enhanced photocatalytic activity of porousSn/Nd-codoped TiO2 monoliths
http://dx.doi.org/10.1016/j.micromeso.2014.04.0331387-1811/� 2014 Elsevier Inc. All rights reserved.
⇑ Corresponding authors. Tel.: +86 372 3300671; fax: +86 372 2900040 (J. Du).E-mail addresses: [email protected] (J. Du), [email protected] (I. Shakir).
Jimin Du a,⇑, Zhiyong Wang a, Guoyan Zhao a, Yongteng Qian a, Huijuan Chen a, Jie Yang a, Xinghui Liu a,Kaidi Li a, Chenxi He a, Weimin Du a, Imran Shakir b,⇑a School of Chemistry and Chemical Engineering, Anyang Normal University, Henan Province, PR Chinab Deanship of Scientific Research, College of Engineering, PO Box 800, King Saud University, Riyadh 11421, Saudi Arabia
a r t i c l e i n f o
Article history:Received 13 January 2014Received in revised form 6 April 2014Accepted 15 April 2014Available online 29 April 2014
Keywords:Porous structurePhotocatalystSol–gel methodCodoped TiO2
Anatase
a b s t r a c t
Herein, we report a facile route of synthesis that includes sol–gel method followed by the high temper-ature calcination with the aim to synthesize porous Sn/Nd-codoped TiO2 monoliths with crystallized ana-tase walls using polystyrene spheres as template. Our results showed that both Sn and Nd dopant werewell dispersed in the host matrix of the final product. Moreover, this as-synthesized porous Sn/Nd-cod-oped TiO2 composite showed relatively narrow band gap compared to the pure anatase phase of TiO2,which may have its origin from the contributions from the Sn4+ and Nd3+ impurities. Interestingly, besidethe narrowing of band gap in the codoped TiO2, the doping also have a positive effect to help reduced thecharge recombination rate, which can be seen from the enhanced lifetime of photogenerated electrons/hole pairs. Finally, the photocatalytic activity of this interesting porous Sn/Nd-codoped TiO2 monolithwas examined by carrying out the dye degradation experiments on methyl orange under UV–vis irradi-ation. The porous Sn/Nd-codoped TiO2 monolith showed better catalytic activity than the pure TiO2 andDegussa P25 due to its narrow band gap, reduced photoinduced h+/e� pair recombination rate, and rel-atively large surface area. The synergistic combination of doping and surface area enhancement (porousstructure) can be adopted as a promising material design strategy to develop photocatalyst materials fordegradation of organic pollutants.
� 2014 Elsevier Inc. All rights reserved.
1. Introduction
TiO2 is the most studied semiconductor for environmentalcleanup applications because of its unique ability of photocatalyticdegradation of various organic contaminants, chemical inertnessand nontoxicity [1–4]. In view of photocatalytic applications,TiO2 has been widely used to catalyze the photo-degradation ofpollutants [5], alcohol dehydration reaction [6], oxidation of aro-matic compounds [7], and nitrogen oxide reduction [8]. However,low quantum efficiency and high band gap of TiO2 limit its com-mercial viability as a photocatalyst material. To address theseissues, strategies such as doping metal ions and coupling TiO2 withother semiconductor materials with appropriate electronic struc-ture have been successfully adopted with some limited successso far [9]. In this scenario, a number of studies have been carriedout on doping various metal ions in TiO2 with the aim to improveits photocatalytic activity [10–12]. As reported by Vinodgopal and
Kamat, a high-photocatalytic degradation rate of organic dyes hasbeen achieved using particulate film prepared from a mixture ofTiO2 and SnO2 colloidal suspensions [13]. All these results can beattributed to the increase in the separation rate of photoinducedcharge carriers due to the electron transfer from TiO2 to SnO2. Inaddition, doping with lanthanide ions with 4f electron configura-tions can significantly enhance the photocatalytic activity of TiO2
[14]. That is to say, the partly filled 4f electron orbits in rare earthions can form a new energy level between the TiO2 valence andconduction band, which results in the narrowed band gap. Thomaset al. reported that samarium-doped anatase TiO2 with a higherphotocatalytic activity than Degussa P25 was prepared via a lowtemperature hydrothermal route [15].
For the enhancement of photocatalytic performance, the porousstructure of anatase TiO2 is highly desirable due to its advantagessuch as a high specific surface area, multidimensional framework,and easy mass transport, which can afford more active sites foradsorption and photocatalytic reactions [16]. The Nd3+ dopantare most likely located in interstitial positions of the lattice ratherthan directly in Ti4+ sites because of the relatively large size differ-ence between dopant Nd3+ of radius of 1.0 Å and Ti4+ of 0.745 Å.

20 30 40 50 60 70 80
b
cd
e
a
(004
)
(220
)(1
16)
(224
)
(215
)
(204
)
(105
)(2
11)
(206
)
(101
)
Rel
ativ
e In
tens
ity (a
.u.)
2θ (Degree)
Fig. 1. XRD patterns of the porous (a) pure, (b) 0.5%, (c) 1.0%, (d) 1.5% and (e) 2.0%Sn/Nd-codoped TiO2 monoliths calcined at 500 �C, respectively.
168 J. Du et al. / Microporous and Mesoporous Materials 195 (2014) 167–173
Probably, the formation of NdAOATi bonds inhibited the crystallitegrowth of TiO2 during calcination. Compared with pure anataseTiO2, the shift of doped TiO2 is obvious, as shown in the inset ofFig. 1.
For example, porous TiO2 nanorods showing high catalytic activ-ity were synthesized by the hydrothermal method [17]. MesoporousTiO2 nanocrystallite powders prepared by the ultrasonic methodprovided excellent activity for the photooxidation of formaldehydeand acetone mixtures at room temperature. The anatase TiO2 withmultidimensional framework is desirable to improve the photocat-alytic activity, since such multidimensional framework not onlyprovide a readily accessible pore-wall system and high specific sur-face area for light and reactants but also optimize the transport ofmatter by minimizing the pressure drop over the monolithic mate-rial. To further investigate the beneficial influence of macrochannelson photocatalytic activity, Yu groups performed the examinedexperiment to destroy the macroporous networks of the samples,and then their photocatalytic activity were decreased up to 10% [18].
Although a number of efforts have been made to prepare TiO2
photocatalyst, porous Sn/Nd-codoped TiO2 monoliths have notbeen reported, which may be more promising for practical applica-tions [19]. In the present work, we produced porous Sn/Nd-cod-oped TiO2 monoliths by a combinational route with a sol–gelmethod and high temperature calcination. The photocatalyticactivity of the porous Sn/Nd-codoped TiO2 monoliths was foundto be further enhanced owing to the narrowing band gap by dopingan appropriate amount of Sn and Nd. In addition, Sn doping cansuppress the electron/hole recombination through facilitatingcharge rectification. And Nd doping can increase the TiO2 surfacearea by hindering the growth of large TiO2 particles. Moreover,their porous structure can provide a large surface area, facilitatingenhanced adsorption and fast transfer of pollutants. This workshould be valuable for the practical application of TiO2 in the fieldof photocatalysis and helpful to understanding the mechanism ofthe photocatalytic process modified by doping.
2. Experiments
Titanium(IV) butoxide (Ti(OBT), AR), SnCl4�5H2O (AR), andNd(NO3)3�6H2O (AR) were purchased from Aladdin company. Sty-rene (AR), ammonium persulfate (AR), methyl orange (MO, AR)and ice acetate acid (AR) were purchased from Sinopharm Chemi-cal Reagent Co., Ltd. All chemicals except for styrene were used asreceived without further purification.
Monodispersed polystyrene spheres (PS) with sizes of �500 nmwere prepared as described in the Supporting information (SI) [20].
In a typical synthesis of the porous 0.5% Sn/Nd-codoped TiO2
(molar ratio of Sn:Nd:Ti = 0.5:0.5:100) photocatalyst, 2.7226 g ofTi(OBT) was added to 100 mL of anhydrous ethanol under stirring.Meanwhile, 13.6 mg of SnCl4�5H2O and 17.4 mg of Nd(NO3)3�6H2Owas added to a mixed solution of 10 mL anhydrous ethanol, 2 mLof nitric acid and 2 mL deionized water under magnetic stirring.Then, both reaction solutions mentioned above were slowly mixedunder stirring. After stirring for 30 min, the final reaction solutionwas transferred to a Teflon-lined stainless steel autoclave at 60 �Cfor 12 h to form a sol–gel. Then, 281.9 mg of PS latex beads wasadded into the as-synthesized sol–gel under vigorously stirringand again transferred to a Teflon-lined stainless steel autoclavethrough heat treatment at 70 �C for 8 h. Finally, the sol–gel witha PS template was calcined in an oxygen atmosphere at 500 �Cfor 6 h. Likewise, other products with the different dopant concen-tration of the Sn:Nd:Ti molar ratio of 1.0:1.0:100, 1.5:1.5:100, and2.0:2.0:100 were also produced, which are named with porous1.0%, 1.5% and 2.0% Sn/Nd-codoped TiO2 monoliths below. To studythe influence of the reaction temperature on the porous Sn/Nd-codoped TiO2 structure, the control experiments were also per-formed to prepare porous Sn/Nd-codoped TiO2 under the sameexperimental conditions except for that applying-sintering tem-peratures was 600 �C and 700 �C instead of 500 �C.
The X-ray diffraction (XRD) spectra of the as-prepared sampleswere obtained by a powder X-ray diffractometer (Rigaku UltimaIII), using Ka radiation (k = 1.5418 Å). Morphologies of the productswere examined by scanning electron microscopy (SEM; JEOL6701F) at an accelerating voltage of 5 kV. Thermogravimetric–dif-ferential thermal analysis (TG–DTA) measurements were per-formed using a thermal-analytical instrument (STA 409 PC,Germany). Nitrogen adsorption measurements were performedon a GEMINI VII 2390. The surface areas were calculated by theBrunauer–Emmett–Teller (BET) method. The UV–vis spectra wererecorded on a Cary 500 UV–vis spectrophotometer.
The measurement of photoelectrical response was performedwith a CHI660E electrochemical analyzer in a three-electrode sys-tem consisting of an indium tin oxide (ITO) covered with sample, aplatinum wire, and a saturated calomel electrode. The ITO coveredwith sample acted as a working electrode, the platinum wire as thecounter electrode, and the Ag/AgCl as the reference electrode. Thesurface of the working electrode exposed to the electrolyte was asquare film with the surface areas of 0.75 cm2. The electrolytewas 3 M KOH aqueous solution. The working electrode was irradi-ated with a 300 W Xenon lamp equipped with a UV cut-off filter(k > 365 nm) during the measurement.
The evaluation of the photocatalytic activity of the as-preparedsamples for photocatalytic decomposition of MO was performedunder UV–vis light irradiation. A 300 W Xenon lamp equipped witha UV cut-off filter (k > 365 nm) was used as the light source. Thephotocatalyst (20.0 mg) was added into a 100 mL quartz photoreac-tor containing 80 mL of a 10 mg L�1 MO solution. The suspensionwas stirred in the dark for 30 min to establish adsorption–desorption equilibrium. The suspension was then irradiated underUV–vis light. Samples were withdrawn periodically from the reac-tor vessel, centrifuged and analyzed by recording the variations inthe absorption in the UV–vis spectra of MO using a Cary 500UV–vis spectrophotometer at its characteristic wavelength.
3. Results and discussion
3.1. XRD patterns
XRD was employed to determine the crystal phase of the porousSn/Nd-codoped TiO2 products. Fig. 1 demonstrates the XRD patternsof the porous (a) pure, (b) 0.5%, (c) 1.0% and (d) 2.0% Sn/Nd-codoped

J. Du et al. / Microporous and Mesoporous Materials 195 (2014) 167–173 169
TiO2 products calcined at 500 �C for 6 h. All as-synthesized Sn/Nd-codoped TiO2 products show the diffraction peaks of (101), (004),(112), (200), (105), (211), (204), (116), (220), (215), and (224),which are an excellent match to the anatase TiO2 pattern (SG: I41/amd; JCPDS no, 21-1272) [21]. In addition, the diffraction peaks ofSnO2 and Nd2O3 are not observed in any of the as-prepared Sn/Nd-codoped TiO2 samples, indicating that bulk SnO2 and Nd2O3 is notpresent. The XRD peaks of Sn/Nd-codoped TiO2 samples withincreasing doping quantity from 0.5% to 2.0% relatively shift to lowdiffraction angle as shown in Fig. S1 in Supporting information(SI), indicating that Sn and Nd contents come into the TiO2 latticeto substitute Ti [22]. Meanwhile, the influence of the calcinationtemperature on the as-prepared crystal structures for the porous1.0% Sn/Nd-codoped TiO2 products annealed at (a) 600 �C and (b)700 �C for 6 h as shown in Fig. S2 in the SI. Clearly, the anatase Sn/Nd-codoped TiO2 samples were obtained by calcination at 600 �C(as shown in Fig. S2a). It is worth noting that the anatase phase is sta-ble up to 600 �C because the Nd dopant can hold back its crystalphase transformation from anatase to rutile. However, increasingthe calcination temperature up to 700 �C, the crystallized rutilephase was evidently observed with the typical rutiled diffractionpeaks of 2h = 27.4� (JCPDS no 87-920,) as given in Fig. S2b in the SI.
3.2. TG–DTA analysis
As shown in Fig. 2, there are some regions of weight loss whichare associated with a few endothermic and overlapped exothermicpeaks. It can be seen from the porous 1.0% Sn/Nd-codoped TiO2 fig-ure that there are four main processes. The first weight loss of�11.6% is attributed to the desorption of some substance in thegel such as adsorbed water and ethanol with the endothermicpeaks ranging from room temperature to 249 �C. The second exo-thermic peaks with the weight loss of �19.2% at about 312 �Cresult from combustion decomposition of reaction precursororganic compositions. The abrupt weight loss of 20.56% in the TGline is ascribed to the decomposition of the PS template, corre-sponding to the sharp exothermic peak at �425 �C in the DTAcurve [23]. The weight loss does not happen a little at the temper-ature range of higher 445 �C. The third endothermic peak is thephase transformation process from amorphous phase to anatasebetween 400 �C and 600 �C. And the last process at the tempera-ture range of higher 600 �C involves the phase transformation fromanatase to rutile [24].
3.2.1. Sn/Nd-codoped TiO2 morphologyThe template of PS latex beads was visually characterized by
SEM as shown in Fig. S3 in the SI, where the latex particles are
0 100 200 300 400 500 600 700 80040
50
60
70
80
90
100
-4
-3
-2
-1
0
1
Temperature(oC)
DSC
(mW
/mg)
Mas
s(%
) DTA
TG
Fig. 2. TG–DTA analysis of the 1.0% Sn/Nd-codoped TiO2 synthesized using a sol–gelmethod.
spherical in shape with a uniform size of �500 nm. After PS tem-plate removal via calcination at 500 �C for 6 h in the presence ofoxygen, porous Sn/Nd-codoped TiO2 monoliths were successfullyobtained. The formation mechanism is a combination of polymertemplating and inorganic gelification. The SEM image (Fig. 3a)shows that the 0.5% Sn/Nd-codoped TiO2 is a porous monolith witha size of tens of micrometers. The SEM image (Fig. 3b) shows thatthe average pore sizes are �300 nm, approximately �60% of theoriginal size of the PS spheres. The size shrinkage may be due todecomposition and vaporization of the PS template during the cal-cination process. Meanwhile, some pores are interconnected afterremoval of PS. It should be noted that the morphologies and porousstructures with the dopant quantities of 1.0%, 1.5% and 2.0%, arefound similar as shown in the SEM images (Fig. 3c–d, e–f, and h,g). Close observation of the SEM images also reveals that theporous structures are formed via the self-assembly of smallnanoparticles, producing the mesoporous characteristics. Energy-dispersive-spectroscopic measurement was also carried out todetermine the composition of the as-synthesized sample, showingthat the porous monolith chemical composition is uniformly dis-persed with Sn, Nd, Ti, and O elements as shown in Fig. S4 in the SI.
To study the influence of the calcination temperature on themorphology, the control experiments were performed at the sameexperimental conditions with a calcination temperature of 600 �Cand 700 �C. The 1.0% Sn/Nd-codoped monolith with porous charac-teristic was also prepared through calcination process at 600 �C, asshown in Fig. 4a. As shown in Fig. 4b, the porous motifs are slightlydestroyed, which are attributed to the framework collapse due tohigh temperature treatment. Further increasing the calcinationtemperature to 700 �C, a porous 1.0% Sn/Nd-codoped TiO2 mono-lith was successfully obtained (Fig. 4c). A comparison withFig. 4d reveals that porous characteristic nearly vanished withwell-crystallized particles.
3.3. BET surface area and pore size structure
The results of the N2-adsorption analysis are summarized inTable 1. The pristine porous TiO2 has a surface area of 72.6 m2/gand an average pore size of �10.8 nm, as shown in Table 1. Byincreasing the dopant amount to 0.5%, 1.0%, 1.5% and 2.0%, theas-prepared Sn/Nd-codoped TiO2 samples obtained by sinteringat 500 �C for 6 h were found to possess increased surface areas asgiven in Table 1. The typical isotherms for N2 adsorption anddesorption of the as-prepared 1.0% Sn/Nd-codoped TiO2 samplescalcined at 500 �C, 600 �C and 700 �C for 6 h are shown inFig. 5a–c. It can be seen that all porous 1.0% Sn/Nd-codoped TiO2
samples show type IV sorption isotherm according to the IUPACclassification, indicating the presence of mesopores [25]. In addi-tion, the typical isotherm of the porous 1.0% Sn/Nd-codoped TiO2
sample calcined at 500 �C for 6 h presents a typical hysteresis loopof type H2 (Fig. 5a), which is attributed to the difference in theadsorption and desorption mechanism occurring in the ‘‘ink-bottle’’pore [26]. Moreover, its specific surface area was 72.2 m2/g with anaverage pore sizes of �11.5 nm (inset in Fig. 5a) and a pore volumeof 0.211 cm3/g. The porous Sn/Nd-codoped TiO2 samples withdopant quantities of 0.5%, 1.5%, and 2.0% sintered at 500 �C for6 h embody surface areas of 69.8 m2/g, 74.6 m2/g and 77.2 m2/gas shown in Table 1, respectively. When the temperature increasedto 600 �C, the shape of the hysteresis loop of the porous 1.0%Sn/Nd-codoped TiO2 sample became narrow, indicating an increaseof the pore size within the nanostructures (Fig. 5b). Also, itpossesses a surface area of �32.7 m2/g with a pore volume of0.194 cm3/g while the pore distribution is centered at �23.7 nm(inset in Fig. 5b). Upon further increase of the calcination temper-ature to 700 �C, the hysteresis loop of the porous 1.0% Sn/Nd-codopedTiO2 shifts to a high relative pressure and the loop shape changes

Fig. 3. SEM images of porous Sn/Nd-codoped TiO2 monoliths with the dopantquantities of (a,b) 0.5%, (c,d) 1.0%, (e,f) 1.5%, (h,g) 2.0% obtained by calcination at500 �C for 6 h.
Fig. 4. SEM images of porous 1.0% Sn/Nd-codoped TiO2 obtained by calcination(a,b) at 600 �C and (c,d) 700 �C for 6 h.
Table 1Properties of the products.
Samples Surfacearea (m2/g)
Porevolume (cm3/g)
Poresize (nm)
0.5% Sn/Nd-codoped TiO2-500 �C 69.8 0.198 10.61.0% Sn/Nd-codoped TiO2-500 �C 72.2 0.211 11.51.5% Sn/Nd-codoped TiO2-500 �C 74.6 0.253 13.62.0% Sn/Nd-codoped TiO2-500 �C 77.2 0.276 15.90.5% Sn/Nd-codoped TiO2-600 �C 30.5 0.186 21.91.0% Sn/Nd-codoped TiO2-600 �C 32.7 0.194 22.71.5% Sn/Nd-codoped TiO2-600 �C 42.2 0.232 22.92.0% Sn/Nd-codoped TiO2-600 �C 44.7 0.241 23.50.5% Sn/Nd-codoped TiO2-600 �C 15.3 0.184 39.91.0% Sn/Nd-codoped TiO2-700 �C 17.4 0.191 42.41.5% Sn/Nd-codoped TiO2-700 �C 19.8 0.210 43.32.0% Sn/Nd-codoped TiO2-600 �C 21.2 0.232 24.9Pure porous TiO2-500 �C 72.6 0.251 10.8Degussa P25 51.3 22.8
170 J. Du et al. / Microporous and Mesoporous Materials 195 (2014) 167–173
from type H2 to H3, reflecting the appearance of a macroporousstructure (Fig. 5c). Furthermore, its specific surface area drasticallydecreased to 17.4 m2/g with a pore volume of 0.191 m3/g and apore size of �42.4 nm. After the porous Sn/Nd-codoped TiO2
sample was treated at 700 �C for 6 h, the sorption curve exhibiteda smaller hysteresis loop at P/P0 = 0.9, and the pore diameter distri-bution curve is spread more evenly throughout a wider range ofpore diameters (Fig. 5c). As discussed above, as the calcinationtemperature increased, the hysteresis loops shift toward higherrelative pressures, indicating decreases of the BET surface area
and pore volume. Also, the peaks of the pore size distributionshifted towards a large pore diameter.
3.4. UV–vis absorption
The UV–vis diffuse reflectance spectra of pure porous TiO2 andthe porous Sn/Nd-codoped TiO2 samples with dopant quantities of0.5%, 1.0%, 1.5% and 2.0% calcined at 500 �C for 6 h are shown inFig. 6. Although the shapes of the spectra of the TiO2 nanoparticleshardly change after Sn and Nd doping, a slight red shift of theabsorption edge occurred, which is attributed to the shallowenergy band structure between the TiO2 conduction and valencebands [27]. On the other hand, the slight red-shift for as-synthe-sized samples compared with pure TiO2 can be attributed to thecharge-transfer transitions between the dopant electrons and theTiO2 conduction band. Meanwhile, this may also originate fromdefects associated with oxygen vacancies that give rise to coloredcenters.
0.0 0.2 0.4 0.6 0.8 1.00
20
40
60
80
100
120
140
0 20 40 60 80 100 120 140 160 180
0.00
0.01
0.02
0.03
dV/d
Dcm
3 .g-1
. m-1
Pore Diameter (nm)
Qua
ntity
Ads
orbe
d (c
m3 /g
)
Relative Pressure (P/PO)(a)
0.0 0.2 0.4 0.6 0.8 1.00
20
40
60
80
100
120
140
0 20 40 60 80 100 120 140 160 180
0.000
0.005
0.010
dV/d
Dcm
3 . g-1
.m-1
Pore Diameter (nm)
Qua
ntity
Ads
orbe
d (c
m/g
)
Relative Pressure (P/PO )
(b)
(c)
0.0 0.2 0.4 0.6 0.8 1.00
20
40
60
80
0 20 40 60 80 100 120 140 160 1800.0000
0.0005
0.0010
0.0015
0.0020
dV/d
Dcm
3 .g-1
.m-1
Pore Diameter (nm)
Qua
ntity
Ads
orbe
d (c
m3 /g
)
Relative Pressure (P/PO )
Fig. 5. N2 adsorption–desorption isotherm curves and pore size distribution (inset)of porous 1.0% Sn/Nd-codoped TiO2 calcined at (a) 500 �C, (b) 600 �C, and (c) 700 �Cfor 6 h.
J. Du et al. / Microporous and Mesoporous Materials 195 (2014) 167–173 171
According to previous study [28], the relationship between theabsorption coefficient (a) and incident photon energy (hm) can bedescribed by the following equation:
a ¼ Biðhm� EgÞ2
hmð1Þ
where Bi is the absorption constant for indirect transitions. Thus,the band-gap energies can be estimated from a plot of (ahm)1/2
versus the photon energy (hm). As the absorbance (A) is proportionalto the absorption coefficient (a), we substituted a with A. Plots of(Ahm)1/2 versus the photon energy (hm) are presented in Fig. 6B.The intercepting tangent to the plot will give a good approximationof the band-gap energies of the samples. The band-gap energies forpristine porous TiO2 and the porous Sn/Nd-doped TiO2 sampleswith dopant amounts of pure, 0.5%, 1.0%, 1.5% and 2.0% wereestimated to be 3.05, 2.98, 2.87, 2.87 and 2.87 eV, respectively, asshown in Fig. 6B.
3.5. Photoelectrical response studies
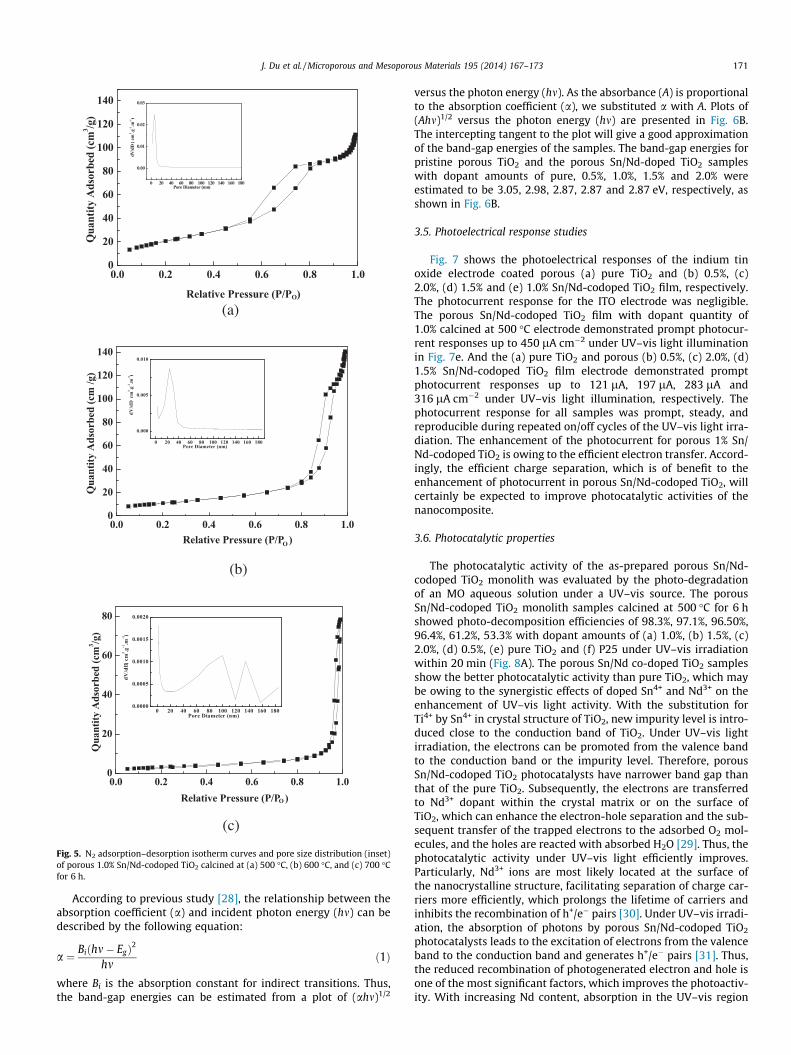
Fig. 7 shows the photoelectrical responses of the indium tinoxide electrode coated porous (a) pure TiO2 and (b) 0.5%, (c)2.0%, (d) 1.5% and (e) 1.0% Sn/Nd-codoped TiO2 film, respectively.The photocurrent response for the ITO electrode was negligible.The porous Sn/Nd-codoped TiO2 film with dopant quantity of1.0% calcined at 500 �C electrode demonstrated prompt photocur-rent responses up to 450 lA cm�2 under UV–vis light illuminationin Fig. 7e. And the (a) pure TiO2 and porous (b) 0.5%, (c) 2.0%, (d)1.5% Sn/Nd-codoped TiO2 film electrode demonstrated promptphotocurrent responses up to 121 lA, 197 lA, 283 lA and316 lA cm�2 under UV–vis light illumination, respectively. Thephotocurrent response for all samples was prompt, steady, andreproducible during repeated on/off cycles of the UV–vis light irra-diation. The enhancement of the photocurrent for porous 1% Sn/Nd-codoped TiO2 is owing to the efficient electron transfer. Accord-ingly, the efficient charge separation, which is of benefit to theenhancement of photocurrent in porous Sn/Nd-codoped TiO2, willcertainly be expected to improve photocatalytic activities of thenanocomposite.
3.6. Photocatalytic properties
The photocatalytic activity of the as-prepared porous Sn/Nd-codoped TiO2 monolith was evaluated by the photo-degradationof an MO aqueous solution under a UV–vis source. The porousSn/Nd-codoped TiO2 monolith samples calcined at 500 �C for 6 hshowed photo-decomposition efficiencies of 98.3%, 97.1%, 96.50%,96.4%, 61.2%, 53.3% with dopant amounts of (a) 1.0%, (b) 1.5%, (c)2.0%, (d) 0.5%, (e) pure TiO2 and (f) P25 under UV–vis irradiationwithin 20 min (Fig. 8A). The porous Sn/Nd co-doped TiO2 samplesshow the better photocatalytic activity than pure TiO2, which maybe owing to the synergistic effects of doped Sn4+ and Nd3+ on theenhancement of UV–vis light activity. With the substitution forTi4+ by Sn4+ in crystal structure of TiO2, new impurity level is intro-duced close to the conduction band of TiO2. Under UV–vis lightirradiation, the electrons can be promoted from the valence bandto the conduction band or the impurity level. Therefore, porousSn/Nd-codoped TiO2 photocatalysts have narrower band gap thanthat of the pure TiO2. Subsequently, the electrons are transferredto Nd3+ dopant within the crystal matrix or on the surface ofTiO2, which can enhance the electron-hole separation and the sub-sequent transfer of the trapped electrons to the adsorbed O2 mol-ecules, and the holes are reacted with absorbed H2O [29]. Thus, thephotocatalytic activity under UV–vis light efficiently improves.Particularly, Nd3+ ions are most likely located at the surface ofthe nanocrystalline structure, facilitating separation of charge car-riers more efficiently, which prolongs the lifetime of carriers andinhibits the recombination of h+/e� pairs [30]. Under UV–vis irradi-ation, the absorption of photons by porous Sn/Nd-codoped TiO2
photocatalysts leads to the excitation of electrons from the valenceband to the conduction band and generates h+/e� pairs [31]. Thus,the reduced recombination of photogenerated electron and hole isone of the most significant factors, which improves the photoactiv-ity. With increasing Nd content, absorption in the UV–vis region

250 300 350 400 450 500 550
bcde
a
Rela
tive
Inte
nsity
(a.u
.)
Wavelength (nm)2.5 3.0 3.5 4.0 4.5
0.0
0.5
1.0
1.5
2.0
2.5
edcba
(αhν
1/2 ) (
eV1/
2 cm
-1/2)
hν (eV)
(B)(A)
Fig. 6. (A) Diffuse reflection spectra of (a) pure porous TiO2 and porous Sn/Nd-codoped TiO2 with dopant quantities of (b) 1.0%, (c) 1.5%, (d) 2.0% and (e) 0.5% calcined at500 �C for 6 h, (B) plots of (ahm)1/2 versus the photon energy (hm) of (a) pure porous TiO2 and porous Sn/Nd-codoped TiO2 with dopant quantities of (b) 1.0%, (c) 1.5%, (d) 2.0%and (e) 0.5% calcined at 500 �C for 6 h according to the diffuse reflection spectra in (A).
0 100 200 300 400
0
100
200
300
400
500
Light off
Light on
b
cd
e
a
Cur
rent
(μΑ
cm
-2)
Time (s)
Fig. 7. Photocurrent performance at �0.22 V (versus NHE) of 550 �C-calcinedporous (a) pure TiO2, and Sn/Nd-codoped TiO2 with (b) 0.5%, (c) 2.0%, (d) 1.5% and(e) 1.0% electrodes in 3 M KOH solutions using periodic illumination intervals.
172 J. Du et al. / Microporous and Mesoporous Materials 195 (2014) 167–173
and the production of h+/e� pairs increases. It is speculated that thehigher photocatalytic activity of Sn/Nd-codoped TiO2, is due toeither one or a combination of the following factors: (i) increasedlight absorption capability of porous Sn/Nd-codoped TiO2 com-pared to undoped TiO2, (ii) the Nd doping hindering the growthof large TiO2 particles, which causes an increase of the specific sur-face area; and (iii) the action of both h+/e� traps reducing therecombination rate of h+/e� pairs during photo-degradation.
The samples exhibited different photo-degradation efficienciesfor MO, although these samples have similar surface areas. As seenin the results, the optimum photocatalytic efficiency was observedfor the porous 1.0% Sn/Nd-codoped TiO2 monolith, which resulted
0 5 10 15 20
0.0
0.3
0.6
0.9
C t/C0
t (min)
a b c d e f g
(A)
Fig. 8. Plots of (A) Ct/C0 and (B) ln(Ct/C0) versus the irradiation time for the porous Sn/Nd0.5% calcined at 550 �C for 6 h, pure porous (e) pure TiO2, (f) Degussa P25, and (g) with
in degradation of 98.30% of the MO after 20 min of UV–vis irradia-tion. As the Sn and Nd doping ratio was increased from 0% to 0.5%,the dopant ions can capture electrons to achieve a higher photocat-alytic activity. However, as the Sn and Nd doping ratio continued toincrease from 0.5% to 2.0%, the extra Sn4+and Nd3+ ions can intro-duce indirect recombination of h+/e� to reduce the photocatalyticactivity [32]. All of the porous Sn/Nd-codoped TiO2 samples exhib-ited better photocatalytic activities than the pristine porous TiO2,which showed a degradation rate of 68.6% due to its narrow bandgap and low efficiency of recombination of photogenerated h+/e�
pairs. In addition, the porous 1.0% Sn/Nd-codoped TiO2 monolithcalcined at 500 �C showed the best photocatalytic performancefor the corresponding samples sintered at 600 �C and 700 �C, whichis attributed to its large surface area (Fig. S4 in the SI). Meanwhile,the macropores are interconnected through windows owing to thefast transport of MO during the photo-degradation process. In addi-tion, the presence of larger pores and interpore necks should facil-itate surface accessibility, resulting in the high photocatalyticactivity. For the sake of comparison, the PS template with the diam-eter of 250 nm was applied to synthesize porous Sn, Nd co-dopedTiO2 monoliths, which posses the surface areas of 132 m2 g�1.And Sn, Nd co-doped TiO2 because a large surface area can offermore active adsorption sites and photocatalytic reaction centers.
Based on the photo-degradation of MO results, it may be deducedthat MO is not only decolorized but also mineralized by porous Nd-doped TiO2 photocatalysts under UV–vis irradiation. Fig. 8B depictsthe approximate linear relationship of ln(Ct/C0) versus the irradia-tion time (t) for the different samples, which indicates that thephoto-degradation process of MO can be considered as a pseudofirst-order kinetics reaction due to the low concentration of MO[33]. The apparent decomposition rate constants for porous Sn/Nd-codoped TiO2 monoliths were determined to be 0.2608 min�1,0.2245 min�1, 0.2116 min�1, 0.1682 min�1, 0.0643 and 0.0370 with
0 5 10 15 20-6
-5
-4
-3
-2
-1
0
Kb=0.2245 min-1
Kc=0.2116 min-1
Kd=0.1682 min-1
Ke=0.0643 min-1
Kf=0.0370 min-1
Ka=0.2608 min-1
f
g
bc
d
e
a
ln(C
t/C0)
t (min)
(B)
-codoped TiO2 monolith with dopant quantities of (a) 1.0%, (b) 1.5%, (c) 2.0% and (d)out TiO2 under UV–vis irradiation for 20 min.

J. Du et al. / Microporous and Mesoporous Materials 195 (2014) 167–173 173
dopant quantities of (a) 1.0%, (b) 1.5%, (c) 2.0%, (d) 0.5%, (e) pure TiO2
and (f) P25, respectively.
4. Conclusions
In summary, we report a facile sol–gel method for the prepara-tion of a porous Sn/Nd-codoped TiO2 photocatalyst using PSspheres as a template. The porous Sn/Nd-codoped TiO2 monolithexhibited an effective photocatalytic performance compared tothe pristine porous TiO2 and Degussa P25. In addition, the optimalphotocatalytic ability was observed with the porous 1.0% Sn/Nd-codoped sample calcined at 500 �C for 6 h. A positive effect of Snand Nd doping in TiO2 was observed that could be ascribed tothe combined contributions from the narrow band gap, high sur-face area, and reduced recombination rate of photogenerated h+/e� pairs. Our results demonstrate, the porous Sn/Nd-codopedTiO2 monolith, a promising photocatalyst that can be very usefulfor hydrogen production through water splitting, redox reactionof carbon dioxide and photosynthetic enzymes.
Acknowledgements
This work was supported by the National Natural Science Foun-dation of China (21003001, 21105002, and 21273010), Program forScience and Technology Innovation Talents at the University ofHenan Province (13HASTIT014), Outstanding Youth Foundationof Henan Province of Innovative Talents, and the projects of theMinistry of Education of returned overseas students. The authorswould like extend their sincere appreciation to the Deanship of Sci-entific Research at King Saud University for its funding of thisresearch through the Research Group Project No RGP-VPP-312,and Basic Science Research Program (2012R1A6A1040282) andWCU (World Class University) Program (R31-2008-000-10029-0)through the National Research Foundation of Korea (NRF) fundedby the Ministry of Education.
Appendix A. Supplementary data
Supplementary data associated with this article can be found, inthe online version, at http://dx.doi.org/10.1016/j.micromeso.2014.04.033.
References
[1] A. Fujishima, K. Honda, Nature 238 (1972) 37–38.[2] A.L. Linsebigler, G.Q. Lu, J.T. Yates, Chem. Rev. 95 (1995) 735–758.[3] X. Yang, Y. Wang, L. Xu, X. Yu, Y. Guo, J. Phys. Chem. C 112 (2008) 11481–
11489.[4] Q. Xiang, J. Yu, M. Jaroniec, J. Am. Chem. Soc. 134 (2012) 6575–6578.[5] G.L. Drisko, A. Zelcer, X. Wang, R.A. Caruso, G.J.de A.A. Soler-Illia, ACS Appl.
Mater. Int. 4 (2012) 4123–4130.[6] C. Zhang, F. Liu, Y. Zhai, H. Ariga, N. Yi, Y. Liu, K. Asakura, M.F. Stephanopoulos,
H. He, Angew. Chem. Int. Ed. 51 (2012) 9628–9632.[7] J. Xu, Y. Ao, D. Fu, Surf. Sci. 256 (2009) 884–888.[8] R. Dillert, J. Stotzner, A. Engel, D.W. Bahnemann, J. Hazard. Mater. 211 (2012)
240–246.[9] R. Khan, T.J. Kim, J. Hazard. Mater. 163 (2009) 1179–1184.
[10] D.V. Bavykin, J.M. Friedrich, F.C. Walsh, Adv. Mater. 18 (2006) 2807–2824.[11] X. Zhang, Q.Q. Liu, Mater. Lett. 62 (2008) 2589–2592.[12] J. Shang, W.Q. Yao, Y.F. Zhu, N.Z. Wu, Appl. Catal., A 257 (2004) 25–32.[13] K. Vinodgopal, Prashant V. Kamat, Environ. Sci. Technol. 29 (1995) 841–845.[14] Q. Wang, S. Xu, F. Shen, Appl. Surf. Sci. 257 (2011) 7671–7677.[15] J. Thomas, K.P. Kumar, S. Mathew, Sci. Adv. Mater. 2 (2010) 481–488.[16] J. Du, G. Zhao, H. Pang, Y. Qian, H. Liu, D.J. Kang, Mater. Lett. 93 (2013) 419–
422.[17] Y. Tang, P. Wee, Y. Lai, X. Wang, D. Gong, P.D. Kanhere, T.T. Lim, Z. Dong, Z.
Chen, J. Phys. Chem. C 116 (2012) 2772–2780.[18] J. Yu, W. Wang, B. Cheng, B.L. Su, J. Phys. Chem. C 113 (2009) 6743–6750.[19] M. Ye, Z. Chena, W. Wang, J. Shen, J. Ma, J. Hazard. Mater. 184 (2010) 612–619.[20] B.T. Holland, C.F. Blanford, T. Do, A. Stein, Chem. Mater. 11 (1999) 795–805.[21] J. Du, G. Zhao, Y. Shi, H. Yang, Y. Li, G. Zhu, Y. Mao, R. Sa, W. Wang, Appl. Surf.
Sci. 273 (2013) 278–286.[22] L. Jing, H. Fu, B. Wang, D. Wang, B. Xin, S. Li, J. Sun, Appl. Catal., B 62 (2006)
282–291.[23] S. Shang, X. Jiao, D. Chen, Mater. Int. 4 (2012) 860–865.[24] J. Du, H. Chen, H. Yang, R. Sang, Y. Qian, Y. Li, G. Zhu, Y. Mao, W. He, D.J. Kang,
Microporous Mesoporous Mater. 182 (2013) 87–94.[25] X. Yang, Y. Wang, L. Xu, X. Yu, Y. Guo, J. Phys. Chem. C 112 (2008) 11481–
11489.[26] J. Yu, H. Yu, B. Cheng, M. Zhou, X. Zhao, J. Mol. Catal. A: Chem. 246 (2006) 206–
211.[27] Z. Wang, C. Chen, F. Wu, B. Zou, M. Zhao, J. Wang, C. Feng, J. Hazard. Mater. 164
(2009) 615–620.[28] A.T. Kuvarega, R.W.M. Krause, B.B. Mamba, J. Phys. Chem. C 115 (2011) 22110–
22120.[29] M.A. Barakat, H. Schaeffer, G. Hayes, S. Ismat-Shah, Appl. Catal. B 57 (2005) 23–
30.[30] X. Yang, F. Ma, K. Li, Y. Guo, J. Hu, W. Li, M. Huo, Y. Guo, J. Hazard. Mater. 175
(2010) 429–438.[31] M. Fernández-García, A. Martínez-Arias, J.C. Hanson, J.A. Rodríguez, Chem. Rev.
104 (2004) 4063–4104.[32] Y. Yue, Z. Gao, Chem. Commun. 18 (2000) 1755–1756.[33] W.Q. Fang, J.Z. Zhou, J. Liu, Z.G. Chen, C. Yang, C.H. Sun, G.R. Qian, J. Zou, S.Z.
Qiao, H.G. Yang, Chem. Eur. J. 17 (2011) 1423–1427.