Stable isotope variation of a highly heterogeneous shallow freshwater system
Upload
khangminh22Category
view
1download
0
Indian Journal of Natural Sciences www.tnsroindia.org.in ©IJONS Vol.8 / Issue 43 / Aug 2017 International Bimonthly ISSN: 0976 – 0997
12564
Arecanut Mediated Facile Green Synthesis of Highly Stable CuO Nanoparticles and their Characterization Studies Hema Prabha.P1* and T.V.Ranganathan2
1Assistant Professor (SS), Department of Food Processing and Preservation Technology, Faculty of Engineering, Avinashilingam Institute for Home Science and Higher Education, Coimbatore -641108. TamilNadu, India. 2Professor, Food Processing and Engineering, Department of Bio Sciences and Technology, Karunya University, Coimbatore, TamilNadu, India.
Received: 13 May 2017 Revised: 18 June 2017 Accepted: 5 July 2017 *Address for correspondence Hema Prabha.P Assistant Professor (SS), Department of Food Processing and Preservation Technology, Faculty of Engineering,Avinashilingam Institute for Home Science and Higher Education, Coimbatore -641108. TamilNadu, India. Email: [email protected]
This is an Open Access Journal / article distributed under the terms of the Creative Commons Attribution License (CC BY-NC-ND 3.0) which permits unrestricted use, distribution, and reproduction in any medium, provided the original work is properly cited. All rights reserved. Biosynthesis of copper nanoparticles has gained a lot of attention recently among the researchers. Owing to the novel properties copper nanoparticles find wide applicability in various fields like food packaging, medicine, chemistry etc. In this study, we describe a benign and cost effective method of synthesizing copper nanoparticles by using Areca catechu extract that acts as both reducing agent and capping agent. Nanoparticles characterized using UV-Vis analysis, Fourier Transform Infrared analysis (FTIR), X-ray diffraction analysis (XRD), Scanning Electron Microscopy (SEM), Transmission Electron Microscopy (TEM), Energy Dispersive X-Ray analysis (EDX). The biosynthesized copper nanoparticles revealed an average particle size of 22 nm with uniformly dispersed structure. Keywords: CuO Nanoparticles, Arecanut, Antimicrobial, Characterization.
ABSTRACT
RESEARCH ARTICLE
Indian Journal of Natural Sciences www.tnsroindia.org.in ©IJONS Vol.8 / Issue 43 / Aug 2017 International Bimonthly ISSN: 0976 – 0997
12565
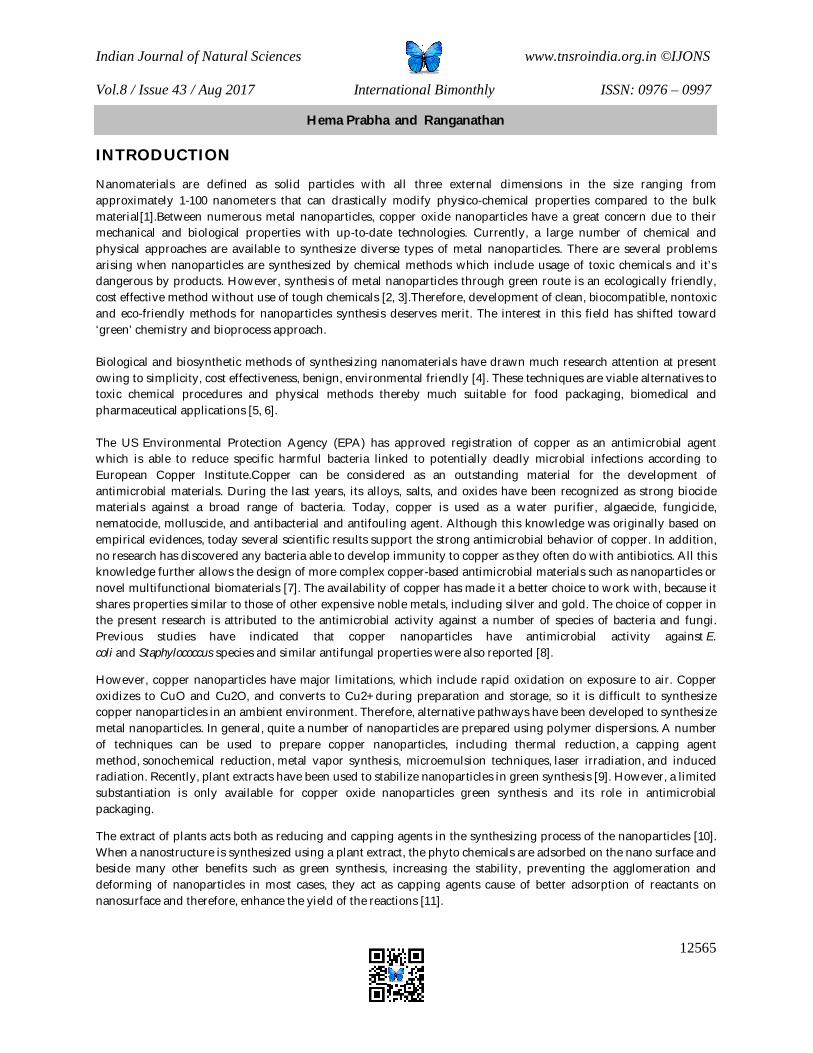
INTRODUCTION
Nanomaterials are defined as solid particles with all three external dimensions in the size ranging from approximately 1-100 nanometers that can drastically modify physico-chemical properties compared to the bulk material[1].Between numerous metal nanoparticles, copper oxide nanoparticles have a great concern due to their mechanical and biological properties with up-to-date technologies. Currently, a large number of chemical and physical approaches are available to synthesize diverse types of metal nanoparticles. There are several problems arising when nanoparticles are synthesized by chemical methods which include usage of toxic chemicals and it’s dangerous by products. However, synthesis of metal nanoparticles through green route is an ecologically friendly, cost effective method without use of tough chemicals [2, 3].Therefore, development of clean, biocompatible, nontoxic and eco-friendly methods for nanoparticles synthesis deserves merit. The interest in this field has shifted toward ‘green’ chemistry and bioprocess approach. Biological and biosynthetic methods of synthesizing nanomaterials have drawn much research attention at present owing to simplicity, cost effectiveness, benign, environmental friendly [4]. These techniques are viable alternatives to toxic chemical procedures and physical methods thereby much suitable for food packaging, biomedical and pharmaceutical applications [5, 6]. The US Environmental Protection Agency (EPA) has approved registration of copper as an antimicrobial agent which is able to reduce specific harmful bacteria linked to potentially deadly microbial infections according to European Copper Institute.Copper can be considered as an outstanding material for the development of antimicrobial materials. During the last years, its alloys, salts, and oxides have been recognized as strong biocide materials against a broad range of bacteria. Today, copper is used as a water purifier, algaecide, fungicide, nematocide, molluscide, and antibacterial and antifouling agent. Although this knowledge was originally based on empirical evidences, today several scientific results support the strong antimicrobial behavior of copper. In addition, no research has discovered any bacteria able to develop immunity to copper as they often do with antibiotics. All this knowledge further allows the design of more complex copper-based antimicrobial materials such as nanoparticles or novel multifunctional biomaterials [7]. The availability of copper has made it a better choice to work with, because it shares properties similar to those of other expensive noble metals, including silver and gold. The choice of copper in the present research is attributed to the antimicrobial activity against a number of species of bacteria and fungi. Previous studies have indicated that copper nanoparticles have antimicrobial activity against E. coli and Staphylococcus species and similar antifungal properties were also reported [8].
However, copper nanoparticles have major limitations, which include rapid oxidation on exposure to air. Copper oxidizes to CuO and Cu2O, and converts to Cu2+ during preparation and storage, so it is difficult to synthesize copper nanoparticles in an ambient environment. Therefore, alternative pathways have been developed to synthesize metal nanoparticles. In general, quite a number of nanoparticles are prepared using polymer dispersions. A number of techniques can be used to prepare copper nanoparticles, including thermal reduction, a capping agent method, sonochemical reduction, metal vapor synthesis, microemulsion techniques, laser irradiation, and induced radiation. Recently, plant extracts have been used to stabilize nanoparticles in green synthesis [9]. However, a limited substantiation is only available for copper oxide nanoparticles green synthesis and its role in antimicrobial packaging.
The extract of plants acts both as reducing and capping agents in the synthesizing process of the nanoparticles [10]. When a nanostructure is synthesized using a plant extract, the phyto chemicals are adsorbed on the nano surface and beside many other benefits such as green synthesis, increasing the stability, preventing the agglomeration and deforming of nanoparticles in most cases, they act as capping agents cause of better adsorption of reactants on nanosurface and therefore, enhance the yield of the reactions [11].
Hema Prabha and Ranganathan

Indian Journal of Natural Sciences www.tnsroindia.org.in ©IJONS Vol.8 / Issue 43 / Aug 2017 International Bimonthly ISSN: 0976 – 0997
12566
The areca nut (Areca catechu L. from the Palmaceae family) is a tropical fruit, which is also called betel nut and is widely distributed in different parts of the world. About 90% of the areca harvest is available as commercial preparations which are produced on a large scale [12]. The dried product is graded according to harvest, color, shape, and size. Nuts may first be boiled to reduce tannin content of nuts, and then dried. The seeds of areca nut account for 45% of the total weight of fruit. However, they are discarded during the process of producing the betel quid chewing (BQC) and/or areca nut chewing (ANC).The phenolic compound present in arecanut is catechin, a plant secondary metabolite which is a flavan-3-ol, type of natural phenol and antioxidant. This phytochemical exhibit antioxidant activity and consequently possess a beneficial physiological effect [13]. The phenolic compounds or polyphenols, secondary metabolites of plants, are phytochemicals that exhibit antioxidant activity and consequently possess a beneficial physiological effect. Polyphenols are the most prevalent antioxidant phyto chemicals in the plant kingdom and reportedly possess both singlet oxygen quenching activity and radical scavenging activity. They are able to delay lipid oxidation in foodstuffs and biological membranes, and they can act as a prophylactic agent, which have motivated research into food science and biomedicine [14].Considering their bioactivity and wide distribution, these substances are potential natural antioxidants, and the vegetable source can be considered as functional food. Available studies have already demonstrated that areca fruit contains many phenolics, tannins, antioxidants and polyphenols in areca seed. In the recent times, many novel chemical compounds have been isolated and characterized from this medicinal plant species [15,16].
MATERIALS AND METHODS Reagents Commercial reagent grade copper acetate was purchased from the Merck chemical company, Imperial chemicals, Coimbatore. Areca seed obtained from the areca plant (Areca catechu L.) was collected from Mettupalayam, Coimbatore District of Tamil Nadu in India and certified by The Directorate of Botanical Survey of India, Tamilnadu Agricultural University, Coimbatore, TamilNadu, India.
Preparation of Plant material Areca seed was obtained from the areca (Areca catechu L.) plant samples were cleaned to remove impurities, and washed with double distilled water and chopped into small pieces. These pieces were dried overnight in a hot air dryer at 40 °C, and finely ground to particles that pass by a 20-mesh sieve. 20gm of dried and powdered arecanut powder was added to 100ml of 70% ethanol which is a safe and effective method to extract polyphenols from plants and well mixed by using a magnetic stirrer for 24hrs. The resulting solution was centrifuged in 6000 rpm and filtered through Whatman No. 4 filter paper. Then the extract was refrigerated for further use.
Green synthesis of CuO Nanoparticles (NPs) using Arecanut extract The synthesis of copper nanoparticles was done by adding 10 ml of copper acetate with 100 ml arecanut extract in a 250 ml conical flask. The solution is continuously mixed by using a magnetic stirrer for 4hrs without heating followed by filtration and centrifugation at 4500 rpm for 30 minutes. The filtered extract with reduced copper acetate was washed with double distilled water to remove any impurities and dried at 70˚C for 4hrs to obtain the biosynthesized copper nanoparticles [17]. UV-Visible Spectroscopy
The biosynthesized copper nanoparticles were analyzed for particle size by UV–VIS spectral analysis, by sonicating a small aliquot of the sample for even dispersion (30min) and the aqueous component was subsequently analyzed at
Hema Prabha and Ranganathan
Indian Journal of Natural Sciences www.tnsroindia.org.in ©IJONS Vol.8 / Issue 43 / Aug 2017 International Bimonthly ISSN: 0976 – 0997
12567
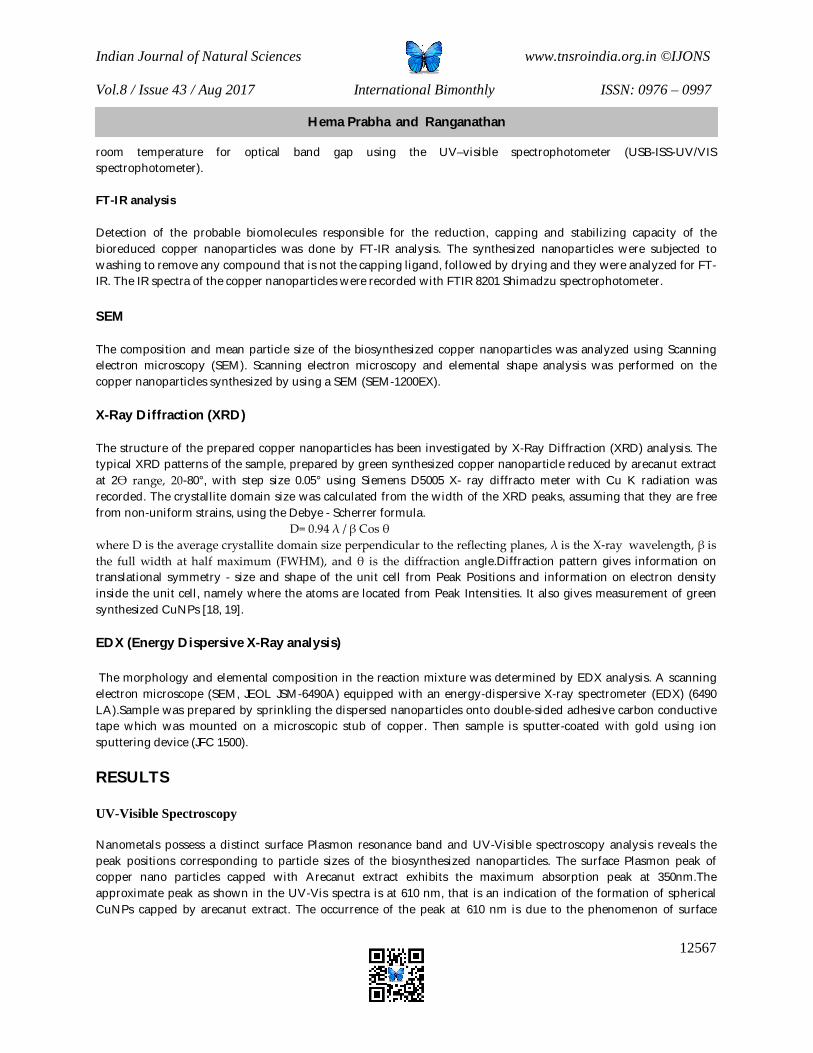
room temperature for optical band gap using the UV–visible spectrophotometer (USB-ISS-UV/VIS spectrophotometer).
FT-IR analysis Detection of the probable biomolecules responsible for the reduction, capping and stabilizing capacity of the bioreduced copper nanoparticles was done by FT-IR analysis. The synthesized nanoparticles were subjected to washing to remove any compound that is not the capping ligand, followed by drying and they were analyzed for FT-IR. The IR spectra of the copper nanoparticles were recorded with FTIR 8201 Shimadzu spectrophotometer. SEM
The composition and mean particle size of the biosynthesized copper nanoparticles was analyzed using Scanning electron microscopy (SEM). Scanning electron microscopy and elemental shape analysis was performed on the copper nanoparticles synthesized by using a SEM (SEM-1200EX). X-Ray Diffraction (XRD) The structure of the prepared copper nanoparticles has been investigated by X-Ray Diffraction (XRD) analysis. The typical XRD patterns of the sample, prepared by green synthesized copper nanoparticle reduced by arecanut extract at 2Ө range, 20-80°, with step size 0.05° using Siemens D5005 X- ray diffracto meter with Cu K radiation was recorded. The crystallite domain size was calculated from the width of the XRD peaks, assuming that they are free from non-uniform strains, using the Debye - Scherrer formula. D= 0.94 λ / β Cos θ where D is the average crystallite domain size perpendicular to the reflecting planes, λ is the X-ray wavelength, β is the full width at half maximum (FWHM), and θ is the diffraction angle.Diffraction pattern gives information on translational symmetry - size and shape of the unit cell from Peak Positions and information on electron density inside the unit cell, namely where the atoms are located from Peak Intensities. It also gives measurement of green synthesized CuNPs [18, 19].
EDX (Energy Dispersive X-Ray analysis)
The morphology and elemental composition in the reaction mixture was determined by EDX analysis. A scanning electron microscope (SEM, JEOL JSM-6490A) equipped with an energy-dispersive X-ray spectrometer (EDX) (6490 LA).Sample was prepared by sprinkling the dispersed nanoparticles onto double-sided adhesive carbon conductive tape which was mounted on a microscopic stub of copper. Then sample is sputter-coated with gold using ion sputtering device (JFC 1500).
RESULTS UV-Visible Spectroscopy
Nanometals possess a distinct surface Plasmon resonance band and UV-Visible spectroscopy analysis reveals the peak positions corresponding to particle sizes of the biosynthesized nanoparticles. The surface Plasmon peak of copper nano particles capped with Arecanut extract exhibits the maximum absorption peak at 350nm.The approximate peak as shown in the UV-Vis spectra is at 610 nm, that is an indication of the formation of spherical CuNPs capped by arecanut extract. The occurrence of the peak at 610 nm is due to the phenomenon of surface
Hema Prabha and Ranganathan

Indian Journal of Natural Sciences www.tnsroindia.org.in ©IJONS Vol.8 / Issue 43 / Aug 2017 International Bimonthly ISSN: 0976 – 0997
12568
Plasmon resonance, occurring due to the excitation of the surface plasmons present on the outer surface of the nanoparticles greater than 4 nm sizes, which gets excited due to the applied electromagnetic field [20]. FT-IR Analysis
The interactions among the different organic molecules and chemical composition of the mixture were identified from FT-IR analysis. The peak observed from 690.52 to 3728.4 cm-1 which can be assigned to catechin reduced copper nanoparticle. The IR spectrum of CuO nanoparticles shows band at 3419.79 cm-1, 2924 cm-1, 1614 cm-1, 1512 cm-1, 1198 cm-1 corresponds to carbonyl groups, primary amines at N-H bonds, C-N stretching of the aromatic amino group and C-O stretching alcohols, alcohols, ketones, aldehydes and carboxylic acid ethers respectively. The FTIR spectrum of Cu nanoparticles suggested that the polyhydroxyl groups facilitate the formation of complexes surrounded by hydroxyl molecules forming matrixes by intermolecular hydrogen bonding [21, 22]. Scanning Electron Microscope (SEM)
A Scanning electron microscope was employed to analyze the structure of the copper nanoparticles by chemical reduction method. The SEM micrograph shows the copper nanoparticles reduced by arecanut extract and aggregates. The typical SEM image shows that the product mainly consists of particle-like Cu nanoclusters and the size ranges from 0.2 micron. However, further observation with high magnification reveals that these Cu nanoclusters are assembled by smaller nanoparticles, which exhibit good uniformity and it clearly reveals the spherical nature of CuO NPs and TEM images in Fig.6b further confirms the results in Fig.6a. The micro structure is independent of the concentration of the arecanut extract. EDX (Energy Dispersive X-Ray analysis)
EDX results confirm the presence of CuO NPs in the green synthesized route from arecanut extract. The CuO NPs are nearly stoichiometric, when oxygen is taken into account in the relative composition. There is a slight decrease in the concentrations of Cu, O and Cl as the temperature increases.
XRD (X-ray diffraction)
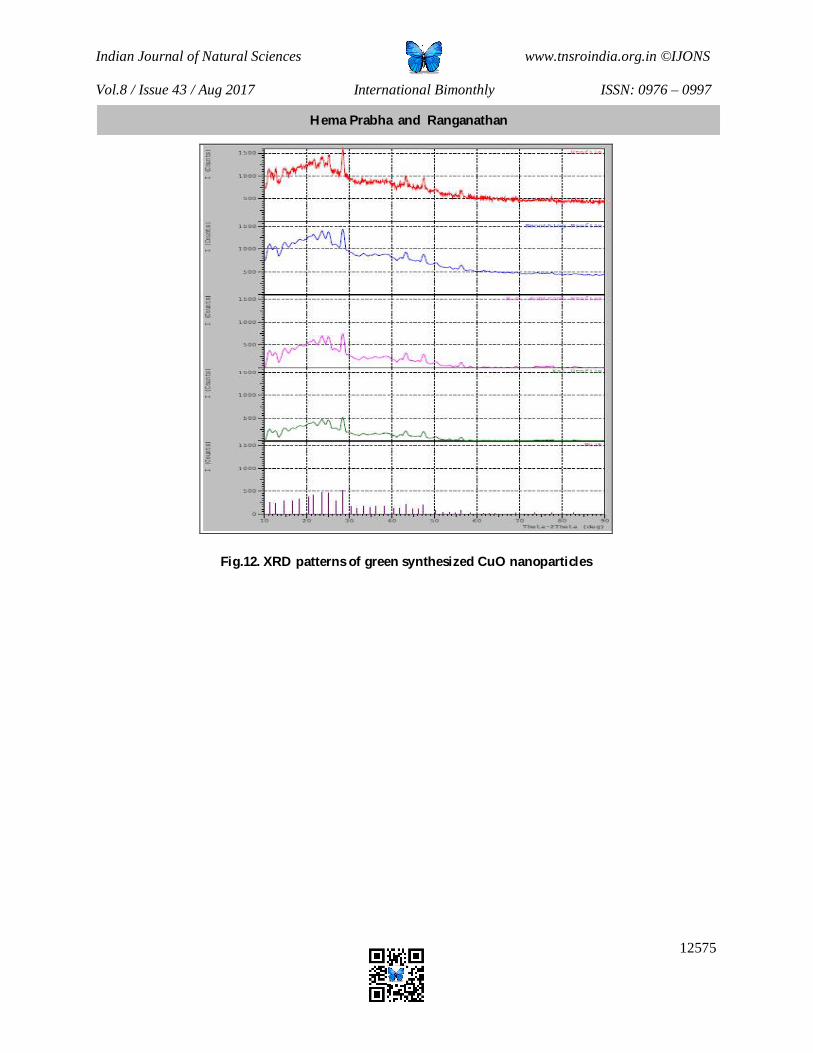
The structure of prepared copper nanoparticles investigated by X-Ray Diffraction (XRD) analysis, as shown in the XRD patterns of the green synthesized copper nanoparticle by reducing with catechin extract, reveals 2 theta values at 30.12, 43.52, 56.67 deg corresponding to (111), (200), and (220) planes of copper have been observed and compared with the JCPDS, copper file No. 04–0836 and ASTM 03-1005- face-centered cubic copper phase-standard powder diffraction card. Interfering peaks due to impurities were absent inferring that high purity CuO Nps were synthesized by this method. The strong intensity and narrow width of CuO diffraction peaks indicate that the resulting products were of highly crystalline in nature. The XRD study indicates that the resultant particles are (FCC) Copper Nanopowder formation of pure monoclinic structure of CuO Nps [23, 24]. DISCUSSION The investigations done in this study reports that green synthesis of CuO Nps prepared by bio reduction and wet chemical synthesis with arecanut extract. The UV–vis spectra of the formed CuO Nps exhibit the maximum absorption peaks at about 350 nm. In the spectrum, the peaks at 350 nm are due to surface plasmon absorption of metal oxide. The surface plasmon absorption in the metal oxide nanoparticles is due to the collective oscillation of the free conduction band electrons which is excited by the incident electromagnetic radiation. This type of resonance
Hema Prabha and Ranganathan

Indian Journal of Natural Sciences www.tnsroindia.org.in ©IJONS Vol.8 / Issue 43 / Aug 2017 International Bimonthly ISSN: 0976 – 0997
12569
is seen when the wavelength of the incident light far exceeds the particle diameter. Surface Plasmon absorption band with a maximum at 350 nm indicates the formation of CuO nanoparticles. The comparison of peaks between pure CuO NPs and that of arecanut extract CuO NPs (Fig. 5a and 5b) illustrate that the IR spectrum exhibited by pure CuO corresponds with the green synthesized CuO NPs showing strong bonds at ranges 3060 cm-1 to 3500 cm-1 corresponds to stretched in OH hydrogen band and peaks in the range at 1614.42 cm-1 corresponds to stretched C=C (1620-1680) in alkene functional group. The aromatic stretched C=C band was absorbed at the 1452.40 cm-1 in the aromatic functional groups. From this method of FTIR the functional group of alcohol, alkane, alkene, amine, aromatic band was absorbed by using ethanol from the Arecanut seed [25].SEM images clearly reveal the spherical nature of CuO NPs which exhibit good uniformity and it and TEM images in Fig.6b further confirms the results in Fig.6a. The micro structure is independent of the concentration of the arecanut extract and the sizes were found to be in the range 15–20 nm. The EDX results confirm the presence of Cu, Cl, Ca,O in the arecanut extract reduced Copper nanoparticles. The structure of prepared copper nanoparticles was investigated by X-Ray Diffraction (XRD) analysis. The XRD patterns of the green synthesized copper nanoparticle by reducing with arecanut extract, revealed the absence interfering peaks due to impurities were absent, inferring that high purity CuO Nps were synthesized by this method. The strong intensity and narrow width of CuO diffraction peaks indicate that the resulting products exhibit highly crystalline FCC structure
CONCLUSION The present study was done through the facile synthesis of CuO nanoparticles using the extract of arecanut seeds that acts both as reducing and capping agents. The functional group responsible for the reduction of copper nanoparticles was identified by FTIR analysis. The biosynthesized investigated by UV-spectrophotometer, FITR, SEM with EDAX, TEM and XRD revealed a narrow size distribution and a uniform shape dispersion capped with arecanut extract with size of approximately 22 nm. Thus, the copper nanoparticles were biosynthesized from arecanut extract by a green and eco friendly, cost effective and safe reduction method.
REFERENCES 1. Sundaresan, K., Sivakumar, A., Vigneswaran, C., & Ramachandran, T. Influence of nano titanium dioxide finish,
prepared by sol–the ultravio-let protection, antimicrobial, and self- cleaning characteristics of cotton fabrics. Journal gel technique, on of Industrial Textiles. 2012; 41: 259–277.
2. Renu Sankar , Perumal Manikandan , Viswanathan Malarvizhi, Tajudeennasrin Fathima ,Kanchi Subramanian Shivashangari, Vilwanathan Ravikuma. Green synthesis of colloidal copper oxide nanoparticles using Carica papaya and its application in photocatalytic dye degradation. Spectrochimica Acta Part A: Molecular and Biomolecular Spectroscopy.2014; 121: 746–750.
3. Abboud. Y, T. Saffaj , A. Chagraoui , A. El Bouari, K. Brouzi, O. Tanane , B. Ihssane Biosynthesis, characterization and antimicrobial activity of copper oxide nanoparticles (CONPs) produced using brown alga extract (Bifurcaria bifurcata).Appl Nanosci.2014; 4: 571–576.
4. Dang T.M.D, T.T.T. Le, E. Fribourg-Blanc, M.C. Dang. Adv. Nat. Sci. Nanosci.Nanotechnol. 2011; 2:6. 5. Abdel-Halim E.S., M.H. El-Rafie, S.S. Al-Deyab, Carbohydr. Polym. 2011; 85:692. 6. Chinna.M and Hema Prabha.P. Green synthesis of highly stable silver nanoparticles. Intl J of Nanotechnology
and Application , 2012; 39-57. 7. Humberto Palza. Antimicrobial Polymers with Metal Nanoparticles, Int. J. Mol. Sci. 2015; 16: 2099-2116. 8. Valli G and Suganya M. Biogenic synthesis of copper nanoparticles using Delonix elata flower extract.Journal of
Chemical and Pharmaceutical Research, 2015; 7(5):776-779.
Hema Prabha and Ranganathan

Indian Journal of Natural Sciences www.tnsroindia.org.in ©IJONS Vol.8 / Issue 43 / Aug 2017 International Bimonthly ISSN: 0976 – 0997
12570
9. Muhammad Sani Usman, Mohamed Ezzat El Zowalaty, Kamyar Shameli, Norhazlin,Zainuddin, Mohamed Salama, and Nor Azowa Ibrahim. Synthesis, characterization, and antimicrobial properties of copper nanoparticles, Int J Nanomedicine. 2013; 8: 4467–4479.
10. Huang X., H. Wu, S. Pu, W. Zhang, X. Liao, B. Shi, Green Chem. 2011. 13: 950. 11. Nasrollahzadeh M. Journal of Colloid and Interface Science.2016; 466: 113–119. 12. Zhang, C.M, Huang, Y.L, Cheng, F.F. Analysis of nine phenolic compounds of areca inflorescence extracts. Chin.
J. Trop. Crops. 2011; 32: 965–969. 13. Dey, T.B and Kuhad, R.C. Enhanced production and extraction of phenolic compounds from Wheat by solid-state
fermentation with Rhizopus oryzae. Biotechnol. Rep. 2014; 4: 120–127. 14. Cady. NC, Behnke. J.L. and Strickland. A.D. Copper-based nanostructured coatings on natural cellulose:
nanocomposites exhibiting rapid and efficient inhibition of a multidrug resistant wound pathogen. Adv Funct Mater .2011; 21: 2506–2514.
15. Zhang, C.J, Lv, F.J, Tai, J.X, Wang, Z.N and Fu, Q. Quantitative determination of total phenolics and tannin in areca nut and its products, Food Res. 2008; 29: 119–121.
16. Zhang, C.M, Huang, Y.L, Cheng, F.F. Analysis of nine phenolic compounds of areca inflorescence extracts. Chin. J. Trop. Crops. 2011; 32: 965–969.
17. Udayabhanu, P.C.Nethravathi, M.A.PavanKumar, D.Suresh, K. Lingaraju, H. Rajanaika,H.Nagabhushana, S.C.Sharma. Tinosporacordifolia mediated facile green synthesis of cupric oxide nanoparticles and their photocatalytic, antioxidant and antibacterial properties. Materials Science in Semiconductor Processing. 2015; 33: 81–88.
18. Ipsa Subhankari and P.L.Nayak. Antimicrobial Activity of Copper Nanoparticles Synthesised by Ginger (Zingiber officinale) Extract. World Journal of Nano Science & Technology. 2013; 2(1): 10-13.
19. Raja Naika, K. Lingaraju, K. Manjunathb, Danith Kumar, G. Nagaraju,D. Suresh, H. Nagabhushana .Green synthesis of CuO nanoparticles using Gloriosa superba L.extract and their antibacterial activity. Journal of Taibah University for Science. 2015; 9:7–12
20. Dhaneswar .D, B.C. Nath, P. Phukonc, S.K. Doluia. J. ColloidsSurf. B: Biointerfaces. 2013; 101: 430–433. 21. Ayesha Khan, Audil Rashid, Rafia Younas, Ren Chon . A chemical reduction approach to the synthesis of copper
nanoparticles.g2Int Nano Lett (2016) 6:21–26. 22. Subbaiya R, and M Masilamani Selvam. Green Synthesis of Copper Nanoparticles from Hibicus rosasinensis and
their antimicrobial, antioxidant activities. Research Journal of Pharmaceutical, Biological and Chemical Sciences 2015; 6:(2) 1183.
23. Ruimin Zhou, Xinfeng Wu, Xufeng Hao, Fei Zhou, Hongbin Li, Weihong Rao; Influences of surfactants on the preparation of copper nanoparticles by electron beam irradiation, Beam Interactions with Materials and Atoms, Volume 266, Issue 4, February 2008, Pages 599-603.
24. Khorsand Zak, W.H. AbdMajid, M.R.Mahmoudian, Majid Darroudi, RaminYousefi, Adv.Powder Technol. 2013; 24: 618–624.
25. Wei-Min Zhang. Optimization of Extraction Conditions of Areca Seed Polyphenols and Evaluation of Their Antioxidant Activities. Molecules, 2014; 19: 16416-16427.
Fig.1. Flowchart for green synthesis of CuO NPs
Arecanut seed extract extract
Copper acetate
Green synthesis Copper oxide nanoparticles
Hema Prabha and Ranganathan

Indian Journal of Natural Sciences www.tnsroindia.org.in ©IJONS Vol.8 / Issue 43 / Aug 2017 International Bimonthly ISSN: 0976 – 0997
12571
Fig. 2. Arecanut Extract Fig.3.Biosynthesized Copper Nanoparticles from
Arecanut Extract
Fig. 4. Steps in Biosynthesis and characterization of CuO NPs
Hema Prabha and Ranganathan

Indian Journal of Natural Sciences www.tnsroindia.org.in ©IJONS Vol.8 / Issue 43 / Aug 2017 International Bimonthly ISSN: 0976 – 0997
12572
Fig.5. UV–vis spectra of the formed CuO Nps
Fig.6. FTIR spectroscopic analysis of pure CuO NPs
Hema Prabha and Ranganathan

Indian Journal of Natural Sciences www.tnsroindia.org.in ©IJONS Vol.8 / Issue 43 / Aug 2017 International Bimonthly ISSN: 0976 – 0997
12573
Where, B– Catechin, T – Transmittance
Fig.7. FTIR spectroscopic analysis of green synthesized CuO NPs
Fig.8.SEM image of CuO nanoparticles Fig.9.TEM image of CuO nanoparticles
Hema Prabha and Ranganathan

Indian Journal of Natural Sciences www.tnsroindia.org.in ©IJONS Vol.8 / Issue 43 / Aug 2017 International Bimonthly ISSN: 0976 – 0997
12574
Fig.10. Energy Dispersive X-Ray analysis of green synthesized CuO NPs
Fig.11.EDX analysis for Arecanut extracted CuO NPs showing presence of Cu, Cl, Ca,O
Hema Prabha and Ranganathan
Indian Journal of Natural Sciences www.tnsroindia.org.in ©IJONS Vol.8 / Issue 43 / Aug 2017 International Bimonthly ISSN: 0976 – 0997
12575
Fig.12. XRD patterns of green synthesized CuO nanoparticles
Hema Prabha and Ranganathan

Indian Journal of Natural Sciences www.tnsroindia.org.in ©IJONS Vol.8 / Issue 43 / Aug 2017 International Bimonthly ISSN: 0976 – 0997
12576
Variations of Rectal Temperature following Treatment with Intravenous Bacterialcollagenase Therapy on RFM in Cows Mohan P1*, Krishnakumar K2, Kulasekar K3, KarthickeyanSMK4, MuruganM5 and Cecilia Joseph6. 1Associate Professor and Head, Livestock Research and Information Centre (A), Konehalli, Tiptur, and KVAFSU,Karnataka,India 2Professor and Section Head, Cattle and Buffalo Breeding Unit,Post Graduate Research Institute in Animal Sciences, Kattupakkam-603203, TamilNadu,India. 3Professor, Department of Veterinary Gynecology and Obstetrics, Madras Veterinary College, Vepery, Chennai -600 007,TamilNadu,India. 4Professor, Department of Animal Breeding and Genetics, Madras Veterinary College, Vepery, 600 007. 5Professor and Head, Department of Livestock Production and Management, Veterinary College and Research Institute, Thirunelveli,TamilNadu,India. 6Professor and Head, Department of Clinics,Madras Veterinary College, Vepery,Chennai- 600 007.
Received: 20 May 2017 Revised: 18 June 2017 Accepted: 22 July 2017 *Address for correspondence Dr. Mohan P Assistant Professor,Department of Veterinary Gynaecology and Obstetrics, Veterinary College, Shivamogga 577 204. Karnataka. Email: [email protected]
This is an Open Access Journal / article distributed under the terms of the Creative Commons Attribution License (CC BY-NC-ND 3.0) which permits unrestricted use, distribution, and reproduction in any medium, provided the original work is properly cited. All rights reserved. The collagenase administration through umbilical artery is the effective treatment for Retained Fetal Membrane (RFM) in dairy cows. RFM was treated with collagenase enzyme through jugular vein as it is easy route than previous study of experimenting on umbilical arteries which is very difficult in a delayed case in field conditions in bovines. The study was conducted in bovines with RFM and presented within 12 to 24 hours after parturition to Obstetrics Unit of Madras Veterinary College, Chennai.The experimental animals were divided in to four different treatment groups ( Gp-I, :n=7;Gp II, :n=15;Gp III, :n=15;Gp IV, :n=15). Data onweekly variations in body temperature was collected, compared and analyzed, and during the post treatment variations in body temperature were studied. It wasrevealedthatmean (±SE) rectal temperature was significantly (P<0.01) increased on day 7 in group II and days 0 and 7 postpartum in group IV. Keywords : Retained fetal membrane, Body temperature, Intravenous route bacterial collagenase therapy, cows.
ABSTRACT
RESEARCH ARTICLE
Indian Journal of Natural Sciences www.tnsroindia.org.in ©IJONS Vol.8 / Issue 43 / Aug 2017 International Bimonthly ISSN: 0976 – 0997
12577
INTRODUCTION Retained foetal membrane (RFM) is one of the most important postparturient disease (Stephen, 2008), leading to reproductive problems and economic losses in dairy industry (Pathak et al., 1991). The incidence of RFM ranges from 3 to 15 per centfollowingnormalparturitionindairycows ( Sheetalet al., 2015). A variety of methods have been used in the treatment of RFM, which includes manual removal and / or administration of oxytocin, PGF2α,antibiotics, immune modulators etc.,(Amin et al., 2013), although the efficacy of these treatments are questionable (Eiler, 1997). Hence, bacterialcollagenasefrom Clostridium histolyticum was used for the tratment of RFM as it could degrade several types of collagen (Azawi, 2013).The alternate route for the collagenase administration instead of umbilical arteries was reported by Eiler and Hopkins (1993) that the injection of collagenase(2.2 x 10⁶ U in 1000 ml of physiological saline solution over a period of 30 mts) through jugular vein caused release of foetalmembrane within 36 h, subsequent to and during treatment the variations in rectal temperatures were monitored, compared, analyzed after recording data.The RFM cows had markedly elevated body temperature combined with general depression and inappetance on days 1 to 4 postpartum (Bolinder et al., 1988). Devarajan (1992) recorded that the rectal temperature on days 0, 5, 15 and 30 postpartum were 38.7, 38.5, 38.5 and 38.5⁰C, respectively in normal puerperium buffaloes and 39.0, 39.0, 39.1 and 38.8⁰C in intact RFM buffaloes, respectively. Burfeind et al. (2014) recorded that 14 to 66 per cent of healthy cows exhibited the rectal temperature of 39.5⁰C or greater within the first 10 days in milking, however abnormal calving conditions (assisted calving, retained placenta, twins etc.,) influenced the body temperature in cows. Based on these, the study was formulated to find out the variations in body temperature following different treatment.
MATERIALS AND METHODS Fifty two healthy and parous cows less than 10 years of age, presented to the Large Animal Obstetrics Unit, Teaching Veterinary Clinical Complex, Madras Veterinary College,and Chennai-7 were utilized for the study.Seven healthy cows with normal calving and shedding of placenta were served as group I (control). Thirty cows and buffaloes with unassisted calving followed by retained foetal membranes between 12 and 24 h interval were selected and randomly allotted into groups II and III of fifteen each. Group I received placebo treatment with one litre of normal saline intravenously. Group II cows, treated with intrauterine proteolytic bolus containing nitrofurazone, metronidazole and urea and antibiotic therapy (Inj. Streptopenicillin @ 20,000 units/kg body weight) without manual removal for 7 days. Groups III cows, received single dose of 2, 00,000 CDU of collagenase plus 40 mg of calcium chloride and 40 mg of sodium bicarbonate dissolved in one litre of normal saline at a pH of 7.5 intravenously through jugular vein(Eiler and Hopkins ,1993). The rectal temperatures in all groups were recorded weekly interval on days 0, 7, 14, 21, 28, 35 and 42 postpartum. Statistical analysis of the data was carried out as per the standard procedure outlined bySnedecor and Cochran (1994).
RESULTS AND DISCUSSION Rectal temperature The mean (±SE) rectal temperature (Table) was significantly (P<0.01) elevated on day 7 (39.30±0.89⁰C) in group II and days 0 (39.04 ± 0.17⁰C) and 7 (39.60 ± 0.78 ⁰C) postpartum in group IV. The rectal temperature in group I and III did not differ significantly between days 0, 7, 14, 21, 28, 35 and 42 postpartum. In addition, the overall mean rectal temperature between all the groups did not differ significantly.Group I had the rectal temperature ranging from 38.27 ± 0.12 to 38.65 ± 0.16⁰C on days 0 and 42 postpartum and the overall mean rectal temperature was 38.58 ± 0.71
Mohan P et al.

Indian Journal of Natural Sciences www.tnsroindia.org.in ©IJONS Vol.8 / Issue 43 / Aug 2017 International Bimonthly ISSN: 0976 – 0997
12578
⁰C. These findings were in agreement with the observations ofFeitosa (2008) that the temperature on days 0, 7, 14, 21 and 28 postpartum were 38.7 ± 0.8, 38.6 ± 0.6, 38.1 ± 0.7, 38.0 ± 1.6 and 37.8 ± 2.6 ⁰C, respectively in normally calved dairy cows. Similar observations were made by Saut et al. (2011) who recorded that the body temperature was 38.7 ± 0.8, 38.8 ± 0.6, 38.6 ± 0.6, 38.7± 0.6, 38.1 ± 0.7, 38.0 ± 1.6, 37.8 ±2.6 and 37.3 ± 0.9 ⁰C on days 0, 3, 7, 10, 14, 21, 28 and 43 postpartum, respectively in normal puerperium dairy cows. Further, the cows experiencing no complications in calving or early postpartum had an average rectal temperature of 38.0 to 38.9 ⁰C during the first 10 days of postpartum. (Kristula et al., 2001; Azawi et al., 2007; Palenik et al., 2009). On day 0, group II (38.70 ± 0.12⁰ C) and III (38.56 ± 0.12 ⁰ C) had significantly (P<0.01) lower rectal temperature than groupIV (39.04 ± 0.17 ⁰ C). These findings were in contrast to the observations of Zobel and Tkalcic (2013) who reported that less than 42.5 per cent of dairy cows with normal calving followed by RFM had elevated rectal temperature of more than 40⁰ C within 10 days postpartum. These variations of temperature in the present study might be due to the environmental, climatic and managemental practices to whichthecowswereexposed (Shivhare et al., 2013). However, significantly (P<0.01) elevated temperature observed on day 0 (within 12 to 24 h after calving) in group IV concurred with the observations of Drillich et al. (2006) who reported that the untreated RFM cows had higher rectal temperature of 39 ⁰C at least one day within 10 days of postpartum; however, abnormal calving like assisted calving, retained placenta, twins etc., affected the body temperature in cows more than 39.5⁰C (Burfeind et al., 2014). Similar observations were made by Lalrintluanga and Hmar (2010) who stated that 35.11 per cent of cows with RFM had rectal temperature of 102.6 ⁰F. The results obtained in the present study were in contrast to the observations of Benzaquen et al. (2007) that the rectal temperature in abnormal calving between days 3 and 13 postpartum was 38.6 ± 0.01⁰C in dairy cows. The possible reason for the elevated rectal temperature in group IV on day 0 was associated with severe tissue damage due to over manipulation while handling dystocia followed by severe pain and failure of myometrial contractions with retained placenta, which leads to elevated rectal temperature (Eiler and Hopkins, 1992). Hence, monitoring of postpartum cows with dystocia becomes positively correlated between the elevated body temperature and puerperal metritis (Garcia, 2003; Tefera et al., 2007; Benzaquen et al., 2007). On day 7, group II had significantly (P<0.01) elevated rectal temperature; which concurred with the observations of Drillich et al. (2003) that the rectal temperature was more than 39⁰C on day 2 after administration of 2500 mg of Ampicillin and 2500 mg Cloxacillin through intrauterine route in RFM cows. The use of intrauterine proteolytic agents causes severe tissue damage and inflammatory reactions into the uterus, which inhibits the uterine defence mechanisms (Paisley et al., 1986), resulting in an acute systemic illness with signs of toxaemia leading to fever more than 39.5⁰C in dairy cows (Haimerl and Heuwieser, 2014). This might be the reason for the elevated rectal temperature on day 7 in group II. However, both the groups of II and IV attained normal rectal temperature since day 14 postpartum, which did not differ significantly between all the groups.The mean (± SE) rectal temperature was significantly (P<0.01) increased on day 7 in group II and days 0 and 7 postpartum in group IV. ACKNOWLEDGEMENT
The authors thank the Dean, Madras Veterinary College, Chennai and the Director of Clinics, TANUVAS for the facilities provided for this study. REFERENCES
1. Amin RU, BhatGR, Ajaz Ahmed, Parthasarathi swain and Arunakumari G. Understanding of pathophysiology of retained placenta and its management in cattle. A review. Vet. Clin. Sci., 2013; 1:1-9.
Mohan P et al.

Indian Journal of Natural Sciences www.tnsroindia.org.in ©IJONS Vol.8 / Issue 43 / Aug 2017 International Bimonthly ISSN: 0976 – 0997
12579
2. Azawi OI, Rahaway M A and HadadJ J Bacterial isolates associated with dystocia and retained placenta in Iraqi
buffaloes. J. Dairy Sci., 2007; 90: 4654- 4660. 3. Azawi OI Etiopathology and therapy of retained fetal membranes and postpartum uterine infection in buffaloes.
2013;Int. Vet. Informn. Service, Ithaca NY (www.ivis.org). 4. Benzaquen M E, RiscoArchbaldC A, Melendez P, Thatcher M J and ThatcherW W. Rectal temperature, calving
related factors and the incidence of puerperal metritis in postpartum dairy cows. Am.Dairy Sci. Assoc., 2007;90: 2804–2814.
5. Bolinder A, Seguin B,KindahlH, Bouley D and Otterby D. Retained fetal membranes in cows. Manual removal versus nonremoval and its effect on reproductive performance. Theriogenology,1988; 30: 45-56.
6. Burfeind O, SutharV,VoigtsbergerR, Bonk S and Heuwieser W. Body temperature in early postpartum dairy cows. Theriogenology, 2014; 82: 121- 131.
7. Devarajan R. Biochemical studies on blood in retained placenta in bovines and its effect on fallopian tube. 1992; M.V.Sc. thesis submitted to Tamil Nadu Veterinary and Animal Sciences University, Chennai-7.
8. Drillich M, PfutznerA, SabinH J, Sabin M and Heuwieser W. Comparison of two protocols for the treatment of retained fetal membranes in dairy cattle. Theriogenology, 2003; 59: 951-960.
9. Drillich M, ReichertU, Mahlstedt M and Heuwieser W. Comparison of two strategies for systemic antibiotic treatment of dairy cows with retained fetal membranes: Preventive Vs Selective Treatment. J. Dairy Sci.,2006; 89: 1502- 1508.
10. Eiler, H and F. M. Hopkins, 1993. Successful treatment of retained placenta with umbilical cord injections of collegenase in cows. J. Am. Vet. Med. Assoc., 203 : 436-443.
11. Eiler H and HopkinsFM. Bovine retained placenta: Effects of collagenase and hyaluronidase on detachment of placenta. Biol. Reprod.,1992; 46: 580-585.
12. Eiler H. Retained placenta. In: Current therapy in large Animal Theriogenology. W.B. Sounders Company, Philadelphia, 1997; Pp. 340-348.
13. Feitosa F L F. Exame fisico Geralou de Rotina. In. Feitosa, F.L.R. Semiologia Veterinaria – A arte do diagnostic, Z.Ed., Sao Paulo: Editoria Roca, 2008; Pp. 68-69.
14. Garcia M E, QuintelaL A,Taboada M J,Alonso G, Varela-Portas B,Diaz C, BarrioM,BecerraJ J, Pena A I and HerradonPG. The effect of metritis in reproductive performance in dairy cows. Arch. De Zootecnia, 2003; 52: 409–412.
15. Haimerl P and Heuwieser W. Invited review - Antibiotic treatment of metritis in dairy cows: A systematic approach. J.Dairy Sci., 2014;97: 6649-6661.
16. Kristula M, Smith B I and Simeone A. The use of daily postpartum rectal temperature to select dairy cows for treatment with systemic antibiotics. The Bovine Practioner,2001;35: 117-125.
17. Lalrintluanaga K and Hmar L. Incidence of retention of fetal membranes in crossbred dairy cows in Mizoram. Indian J. Anim.Res., 2010; 44: 217-218.
18. Paisley LG, MickelsenW D,AndersonPB. Mechanisms and therapy for retained fetal membranes and uterine infections of cows: A review. Theriogenology,1986; 25: 353- 381.
19. Palenik T, DolezelR,KratochvilJ,CechS,ZajicJ, Jan Z andVyskocil M. Evaluation of rectal temperature in diagnosis of puerperal metritis in dairy cows. Vet. Med., 2009;54: 149-155.
20. Pathak M M, Patel AV and MethaV M. Study of serum calcium and phosphorous during placental expulsion in Surti buffaloe. Indian J. Anim. Reprod., 1991; 12: 51-55.
21. Saut J P E, Raphael Soares de Barros Romos Oliveira, Cicero Fleury Guedes, Martins, Ana Rita Ferreira Moura, Suzana Akemi Tsuruta, Narayara Resende Nasciutti, Ricarda Maria dos Santos and Selwyn Arlington Headley, Clinical observations of postpartum uterine involution in crossbred dairy cows. Vet. Not.,2011; 17: 16-25.
22. Sheetal S K, ChoudryS K, Pandey R P and Sengupta D. Effect of season and parity on incidence of retention of placenta in crossbred cattle. Environ. Ecol., 2015; 33: 232-234.
23. Shivhare M, Misra A K and Gupta V K. Incidence of pre and postpartum complications in Frieswal cow. Int. J. Agri. Sci.Vet. Med.,2013; 1: 67-72.
Mohan P et al.

Indian Journal of Natural Sciences www.tnsroindia.org.in ©IJONS Vol.8 / Issue 43 / Aug 2017 International Bimonthly ISSN: 0976 – 0997
12580
24. Snedecor,G.W and Cochran, G.W. (1994). Statistical Methods. 8thEdi. Affliated East West Press Pvt. Ltd., New
Delhi. 25. Stephen J L, A postpartum uterine disease and dairy herd reproductive performance: A review. The Vet. J.,
2008;176: 102-114. 26. Tefera S, DlaminiB, Dlamini A and Mlambo V. Current range condition in relation to land management systems
in semi - arid savannas of Swaziland. Afr. J. Ecol., 2007; 46: 158-167. 27. Zobel R and Tikalcic S.Efficacy of ozone and other treatment modalities for retained placenta in dairy cows.
Reprod. Dom. Anim.,2013; 48: 121-125.
Table :1.Mean (± SE)rectal temperature (⁰C) during different phases of postpartum with different treatmentregimens of RFM cows. Groups / Days
Rectal temperature (⁰C) Overall mean 0 7 14 21 28 35 42
I (n=7) 38.27 ±0.12aA
38.52 ± 0.53aA
38.44 ± 0.16aA
38.65 ± 0.16aA
38.57 ± 0.19aA
38.27 ± 0.16aA
38.58 ± 0.15aA
38.58 ± 0.71a
II (n=15) 38.70 ±0.12aA
39.30 ± 0.89bB
38.60 ± 0.11aA
38.63 ± 0.11aA
38.61 ± 0.13aA
38.70 ± 0.11aA
38.74 ± 0.10aA
38.70 ± 0.49a
III (n=15)
38.56 ±0.12aA
38.68 ± 0.58aA
38.62 ± 0.11aA
38.58 ± 0.11aA
38.61 ± 0.13 aA
38.57 ± 0.11aA
38.58 ± 0.10aA
38.61 ± 0.49a
IV (n=15)
39.04 ±0.17bB
39.60 ± 0.78bB
38.66 ± 0.11aA
38.48 ± 0.11aA
38.60 ± 0.13aA
38.68 ± 0.11aA
38.66 ± 0.10aA
38.75 ± 0.49a
Means bearing different superscripts (A-B) in each row differ significantly (P < 0.01) Means bearing different superscripts (a-b) in each column differ significantly (P < 0.01)
Mohan P et al.
Indian Journal of Natural Sciences www.tnsroindia.org.in ©IJONS Vol.8 / Issue 43 / Aug 2017 International Bimonthly ISSN: 0976 – 0997
12581
Land Use/ Land Cover Mapping With Change Detection Analysis of Walayar Watershed Using Remote Sensing and GIS M.Balakrishnan1 and A.Ilanthirayan2* 1Research Scholar, Research & Development Centre, Bharathiar University, Coimbatore,Tamilnadu,India. 2Assistant Professor, Department of Geography, Government Arts College (Autonomous),Salem, Tamilnadu,India. Received: 17 May 2017 Revised: 20 June 2017 Accepted: 23 July 2017 *Address for correspondence Dr.A.Ilanthirayan
Assistant Professor, Department of Geography, Government Arts College (Autonomous),Salem,Tamilnadu,India. Email: [email protected].
This is an Open Access Journal / article distributed under the terms of the Creative Commons Attribution License (CC BY-NC-ND 3.0) which permits unrestricted use, distribution, and reproduction in any medium, provided the original work is properly cited. All rights reserved. Land use and land cover of a watershed area have an influence on water quality and stream strength. The Land Use Land Cover (LULC) refers to two separate terminologies that are often used interchangeably. Land Cover can be defined as the physical characteristics of the earth’s surface which involve vegetation, water, soil, and other physical features created through human activities like settlements, while Land Use refers to land used by humans for habitats concerning economic activities. Main objectives of the research study are: to prepare land use and land cover maps of Walayar watershed for the two time periods i.e. October 2006 and October 2011 and evaluate the land use and land cover change of the study area.Also to determine the extent of inter-class changes of land use and land cover. Integrated use of GIS and Remote Sensing and Digital Image Processing techniques was used for the study. The Information on land use / land cover and possibilities for their optimal use is essential for the selection, planning and implementation of land use schemes to meet the increasing demands for basic human needs and welfare. Keywords: Land Use Land Cover (LULC), watershed, Digital Image Processing techniques, Remote Sensing. INTRODUCTION
Land use and land cover of a watershed area have an influence on water quality and stream strength. The watershed’s land cover directly impacts stream hydrology by influencing the amount of storm-water runoff. Forests, natural meadows and wetlands naturally absorb rainwater, allowing a portion of it to percolate back into the ground. However, impervious surfaces such as pavement, parking lots, driveways, hard-packed dirt roads and
ABSTRACT
RESEARCH ARTICLE

Indian Journal of Natural Sciences www.tnsroindia.org.in ©IJONS Vol.8 / Issue 43 / Aug 2017 International Bimonthly ISSN: 0976 – 0997
12582
rooftops increase the amount of rainfall that flows over land and reduces the amount of rainfall that percolates into the soil to recharge groundwater wells and streams. The Land Use Land Cover (LULC) refers to two separate terminologies that are often used interchangeably. Land Cover can be defined as the physical characteristics of the earth’s surface which involve vegetation, water, soil, and other physical features created through human activities like settlements, while Land Use refers to land used by humans for habitats concerning economic activities. LULC patterns depend on human usage in terms of natural and socioeconomic development through space and time. In other words, Land Use changes have the ability to affect the Land Cover and vice versa. Shifting into possibility negative impact through the Land Use perspective for social activities is affecting Land Cover to change, especially in biodiversity, water and earth radiation, trace gas emission, and other processes that come together to affect the climate and biosphere. These changes are attributed to only one main factor in terms of size and pattern, namely, “population growth.” Increasing population growth directly and indirectly contributes to LULC changes, especially from the perspective of demand for built-up area, agricultural activities, and water resources. Ecological expertise is very concerned with LULC changes that impact biodiversity and aquatic ecosystems. LULC changes affect the watershed water quality, leading to increased surface runoff, reduced groundwater discharge, and transfer of pollutants. Therefore, LULC information at the watershed level is important for selection, planning, monitoring, and management of water resource so that the changes in Land Use meet the increasing demand for human needs and welfare without compromising water quality. Various research studies have been conducted about the change analysis of watersheds, which are important in developing effective management strategies to protect water resources. Watershed management is necessary because a watershed is not only a hydrological unit but also plays an important part in socioecological perspective by providing economical, food, and social security as well as provision of life support services to local residents. LULC changes in the watershed area for urbanization and deforestation will continuously have negative impacts on water quality and indirectly affect the nature of a watershed ecosystem. Hence, understanding of the spatial and temporal variations that occur in a watershed over time as well as explanation of the interaction between hydrological components of the watershed will allow better water conservation strategies to be formulated. Specifically, remote sensing has been widely used to classify and map LULC changes with different techniques and data sets, such as IRS LISS-III images that provide better classification of different landscape components at a large scale. Several change detection techniques have been developed in remotely sensed image with continuous debate on the advantages and disadvantages of each technique. These include unsupervised classification or clustering, supervised classification, hybrid classification, and fuzzy classification, which are all commonly applied and used in classification. Although various classification techniques have been proposed, supervised classification methods are considered as favorable for change detection analysis. More recently, researchers have applied supervised classification or un- supervised classification for several LULC change detection for several research aims and purpose. The Mohammad AG, Adam MA (2010) investigated the effects of different vegetation types on runoff generation and soil erosion. The results showed that there are significant and important changes in runoff generation and sediment production with respect to the different types of vegetative cover. They also concluded that the forests and natural vegetation dominated by S. spinosum prevent or decrease the risk of runoff and soil erosion. Based on the above review of literature, problem statement and importance of land use and land cover change detection study, the Walayar watershed has been taken to study the changing pattern of seasonal land use and land cover by using Remote Sensing and GIS, as a tool. The present study will be useful for further planning and management of the selected Walayar watershed and will be very effective to enhance the agricultural production.
Balakrishnan and Ilanthirayan
Indian Journal of Natural Sciences www.tnsroindia.org.in ©IJONS Vol.8 / Issue 43 / Aug 2017 International Bimonthly ISSN: 0976 – 0997
12583
Objectives of the Study Main objectives of the research study are: 1) To prepare land use and land cover maps of Walayar watershed for the two time periods i.e. October 2006 and October 2011. 2) To evaluate the land use and land cover change of the study area. 3) To determine the extent of inter-class changes of land use and land cover. Study area
The Walayar watershed area extent Coimbatore and Palakkad district lies between longitude from 76°45'9"E to 77°1'33.363"E and latitude from 10°46'3.905"N to 10°57'11.8"N and the total area of Walayar watershed is covered by 339 sqkm. The watershed include the Coimbatore(South) Taluk in Tamil Nadu and Palakkad Taluk in Kerala. The elevation of the watershed between 1164 to 140 meter from north to south. Walayar Watershed is situated at Palakkad Gap and the watershed composed of plains, valley bottoms. The gap is the lowest pass through the Western Ghats. The Palakkad gab is only breaking in the stretch of the Western Ghats that otherwise runs along the entire eastern edge of Kerala, isolating the State from neighboring Tamil Nadu. METHODOLOGY AND DATABASE
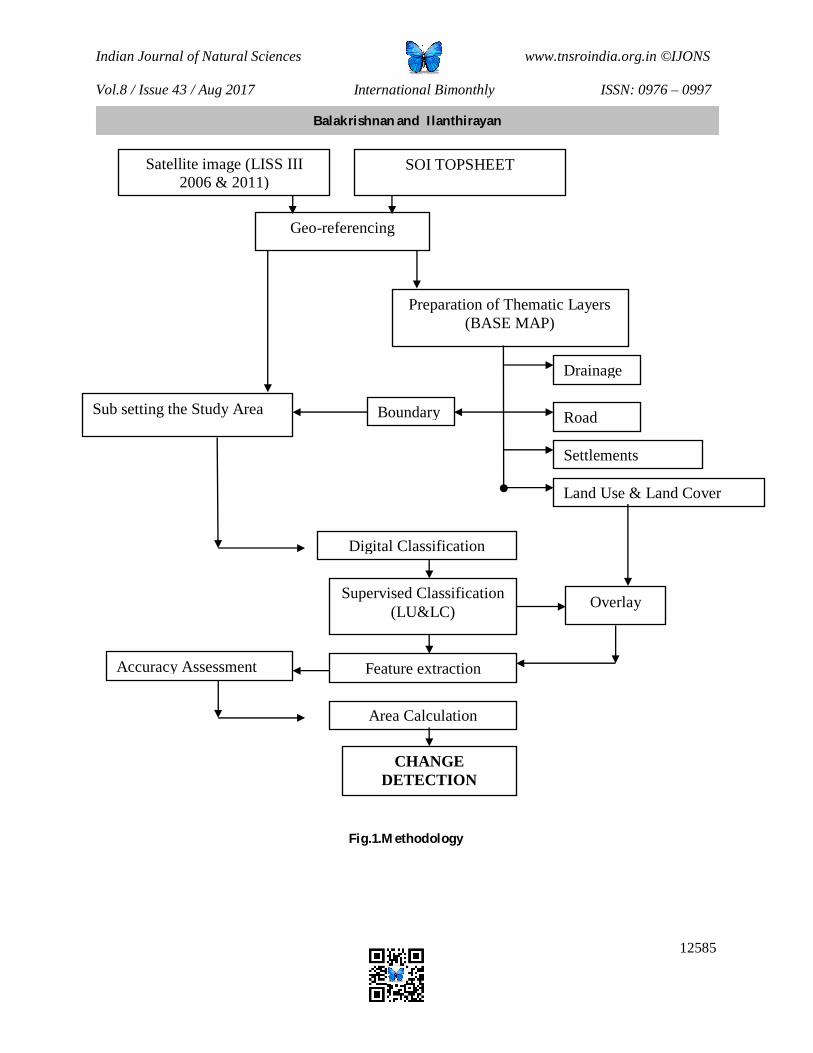
To achieve the objectives to study the density and type of vegetation and analyses the LULC following methodology was adopted. Integrated use of GIS and Remote Sensing and Digital Image Processing techniques was used for the study. The study was carried out specifically for the years, 2006 and 2011. The two multispectral satellite images (LISS III) of medium resolution were used to prepare the land use and land cover (LULC) maps of Walayar watershed for the two same time periods. The unsupervised/Supervise classification technique, which identifies natural spectral grouping, was used to classify the images considering the land use complexity of the study area. Landuse/Landcover Analysis Landuse/ Landcover Analysis of Walayar watershed were carried out for the year of 2006 and 2011 data to find out the changes in the study area. The satellite data based on Spectral reflectance combined with field knowledge, in attempt was made to classify the images under eleven classes viz. Agriculture-Crop land, Agriculture-Fallow, Agriculture-Plantation, Barren/Uncultivable/wasteland, Scrubland, Built -up Land Mining, Built-up Land Rural, Built-up Land Urban, Deciduous Forest, Evergreen Forest, Forest Plantation and Water Bodies. In the Walayar watershed more than 75 % of the land is belongs to Agricultural land area. Change of Landuse and Landcover (2006 to 2011) Through the study period all the categories showed both positive and negative growth in Walayar watershed area coverage. The maximum area changes are happened in Agricultural field, were the Agriculture - Crop land with 4002 hectare increased and there is major area is converted from Agriculture – Fallow to Crop lands. The second major positive changes happened in Buildup area, were the Built-up Land Rural with 158.91 hectares and Built-up Land Urban with 496.93 hectares are increased from 2006 to 2011 period. CONCLUSION The current study was undertaken with the purpose of highlighting the qualities of using remote sensing technology in the domain of Walayar watershed Landuse and Landcover and its changes of the area. The GIS mapping and monitoring of land use/land cover is important for various management and planning activities, as it is considered as
Balakrishnan and Ilanthirayan
Indian Journal of Natural Sciences www.tnsroindia.org.in ©IJONS Vol.8 / Issue 43 / Aug 2017 International Bimonthly ISSN: 0976 – 0997
12584
an important element for understanding the earth and its whole system. The LULC classified maps prepared by unsupervised classification methods and comparison revealed changes in area coverage of all the taken eleven categories. Here is the Agriculture - Crop land class expanded the most at the distribution of the other 10 categories. The Information on land use / land cover and possibilities for their optimal use is essential for the selection, planning and implementation of land use schemes to meet the increasing demands for basic human needs and welfare.
REFERENCES 1. J. S. Rawat and M. Kumar, “Monitoring land use/cover change using remote sensing and GIS techniques: a case
study of Hawalbagh block, district Almora, Uttarakhand, India,” The Egyptian Journal of Remote Sensing and Space Science, vol. 18, no. 1, pp. 77–84, 2015.
2. A.Butt, R. Shabbir, S. S. Ahmad, and N. Aziz, “Land use change mapping and analysis using remote sensing and GIS: a case study of simly watershed, Islamabad, Pakistan,” Egyptian Journal of Remote Sensing and Space Science, vol. 18, no. 2, pp. 251–259, 2015.
3. M. S. Boori and V. Vozenilek, “Land cover disturbance due to tourism in Jeseniky mountain region: a remote sensing and GIS based approach,” in Earth Resources and Environmental Remote Sensing/GIS Applications V, 92450T, vol. 9245 of Proceedings of SPIE, International Society for Optics and Photonics, Amsterdam, The Netherlands, September 2014.
4. C. K. Wright and M. C. Wimberly, “Recent land use change in the Western Corn Belt threatens grasslands and wetlands,” Proceedings of the National Academy of Sciences of the United States of America, vol. 110, no. 10, pp. 4134–4139, 2013.
5. A.Ashraf, Changing Hydrology of the Himalayan Watershed, InTech, Rijeka, Croatia, 2013. 6. S. Gajbhiye and S. K. Sharma, “Land use and land cover change detection of Indra river watershed through
remote sensing using multi-temporal satellite data,” International Journal of Geomatics and Geosciences, vol. 3, no. 1, p. 89, 2013.
7. H.-B. Hu, H.-Y. Liu, J.-F. Hao, and J. An, “Analysis of land use change characteristics based on remote sensing and GIS in the Jiuxiang River watershed,” International Journal on Smart Sensing and Intelligent Systems, vol. 5, no. 4, pp. 811–823, 2012.
8. P. Singh, A. Gupta, and M. Singh, “Hydrological inferences from watershed analysis for water resource management using remote sensing and GIS techniques,” Egyptian Journal of Remote Sensing and Space Science, vol. 17, no. 2, pp. 111–121, 2014.
9. Mohammad AG, Adam MA (2010). The impact of vegetative cover type on runoff and soil erosion under different land uses. Catena 81:97- 103.
10. Anderson, J.R., Hardy, E.E., Roach, J.T., and Witmer, R.E. 1976: A Land Use and Land Cover Classification System for Use with Remote Sensor Data. Geological Survey Professional Paper 964. United States Government Printing Office Washington.
11. Ansary, Z.R., Rao, L.A.K. and Saran, S. Effect of Geology and Geomorphology on Landuse/ Landcover in Himalayan Foothill, Dehradun. Journal Geological Society of India. 2013. (81) 827-834.
12. Census of India, Office of The Registrar General & Census Commissioner, India, New Delhi, Ministry of Home Affairs, Government of India, 2011.
13. Burrough P.A. (1986) “Principles of Geographic Information Systems for land Resources. 14. Morphometric analysis of a highland micro watershed in East Khasi Hills District of Meghalaya, India: Using
remote sensing and geographic information system (GIS) techniques by Kalyanjit Sarmah, L. K. Jha and B. K. Tiwari
15. Anji Reddy M. (2001) “A Text Book of Remote Sensing & GIS”, 2nd edition, B. S. Publications, Hyderabad. 16. https://en.wikipedia.org/wiki/Korayar_River
Balakrishnan and Ilanthirayan
Indian Journal of Natural Sciences www.tnsroindia.org.in ©IJONS Vol.8 / Issue 43 / Aug 2017 International Bimonthly ISSN: 0976 – 0997
12585
Land Use & Land Cover
Satellite image (LISS III 2006 & 2011)
SOI TOPSHEET
Geo-referencing
Preparation of Thematic Layers (BASE MAP)
Drainage
Boundary Road
Settlements
Sub setting the Study Area
Digital Classification
Supervised Classification (LU&LC)
Feature extraction
Area Calculation
CHANGE DETECTION
Overlay
Accuracy Assessment
Fig.1.Methodology
Balakrishnan and Ilanthirayan

Indian Journal of Natural Sciences www.tnsroindia.org.in ©IJONS Vol.8 / Issue 43 / Aug 2017 International Bimonthly ISSN: 0976 – 0997
12586
Table 1.Data Products Used - Satellite Images
Sl. No Satellite Sensor Resolution Month of Acquisition Year Source 1 Resourcesat‐2 LISS III 23.5 m October 2006 NRSC/ISRO 2 Resourcesat‐2 LISS III 23.5 m October 2011 NRSC/ISRO
Table 2. Landuse/ Landcover Analysis of Walayar watershed (2006-2011 period data)
# 2006 2011 Change in hectares
Change in percentage Land use Categories In Hectares % In
Hectares %
Agriculture - Crop land 4186.82 12.34 8188.83 24.13 4002.01 11.79 Agriculture - Fallow 8620.47 25.40 4514.62 13.30 -4105.85 -12.10 Agriculture - Plantation 9944.28 29.30 9344.35 27.54 -599.93 -1.77 Barren/Uncultivable/wasteland, Scrubland
1584.88 4.67 1600.08 4.72 15.20 0.05
Built-up Land Rural 461.25 1.36 620.16 1.83 158.91 0.47 Built-up Land Urban 1063.06 3.13 1559.19 4.60 496.13 1.46 Built -up Land Mining 47.05 0.14 34.41 0.10 -12.64 -0.04 Deciduous Forest 4102.77 12.09 4114.50 12.13 11.73 0.04 Evergreen Forest 2356.34 6.94 2346.49 6.92 -9.85 -0.03 Forest Plantation 1136.97 3.35 1174.85 3.46 37.88 0.11 Water Bodies 430.07 1.27 434.52 1.28 4.46 0.01
Fig.2.Land use/ Land cover Map in 2006
Balakrishnan and Ilanthirayan

Indian Journal of Natural Sciences www.tnsroindia.org.in ©IJONS Vol.8 / Issue 43 / Aug 2017 International Bimonthly ISSN: 0976 – 0997
12587
Fig 3. Land use/ Land cover chart -2006 period
In 2006, Agriculture - Plantation class constituted the largest category with spatial coverage of 9944.28 hectares, i.e. 29.30 percent of the total study area. Agriculture - Fallow with 8620.47 hectares, i.e. 25.40 percent, Agriculture - Crop land with 4186.82 hectares i.e. 12.34 percent, Barren/Uncultivable/wasteland, Scrubland with 1584.88 hectares i.e. 4.67 percent, Built-up Land Rural with 461.25 hectares i.e. 1.36 percent, Built-up Land Urban with 1063.06 hectares i.e. 3.13 percent, Built -up Land Mining with 47.05 hectares i.e. 0.14 percent, Deciduous Forest with 4102.77 hectares i.e. 12.09 percent, Evergreen Forest with 2356.34 hectares i.e. 6.94 percent, Forest Plantation with 1136.97 hectares i.e. 3.35 percent and Water Bodies with 430.07 hectares i.e. 1.27 percent occupied in terms of total area coverage.
Fig.4.Land use/ Land cover Map in 2011
Balakrishnan and Ilanthirayan
Indian Journal of Natural Sciences www.tnsroindia.org.in ©IJONS Vol.8 / Issue 43 / Aug 2017 International Bimonthly ISSN: 0976 – 0997
12588
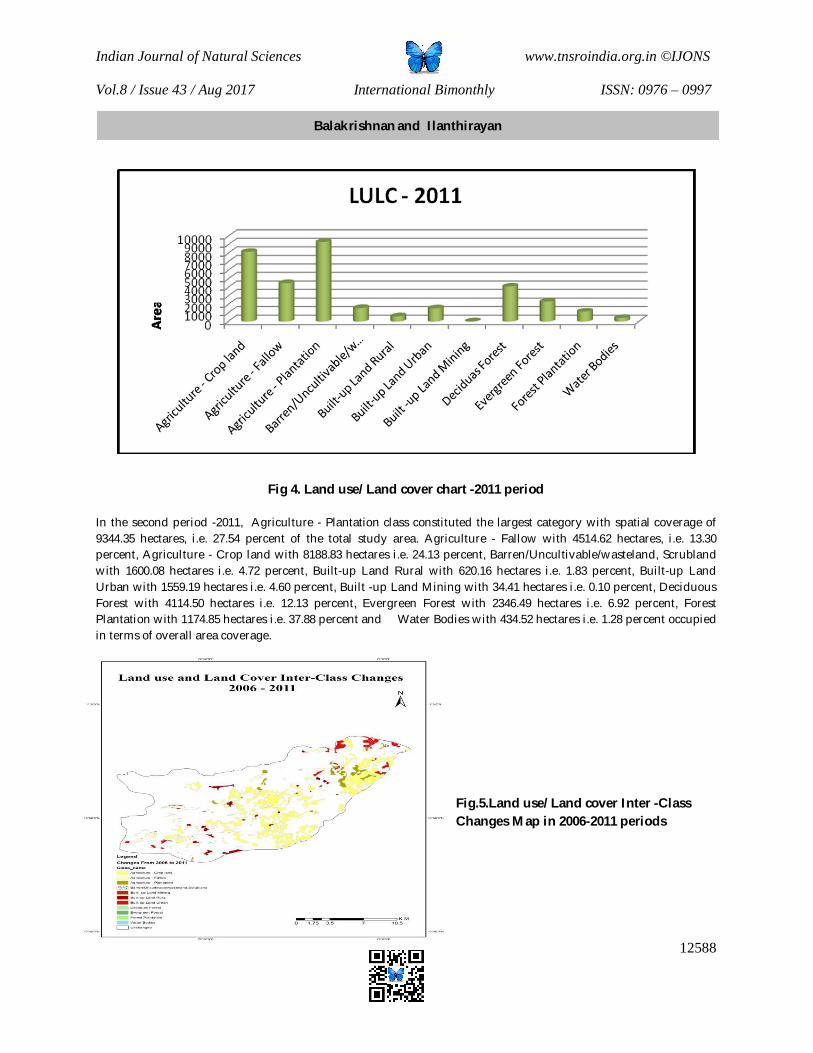
Fig 4. Land use/ Land cover chart -2011 period In the second period -2011, Agriculture - Plantation class constituted the largest category with spatial coverage of 9344.35 hectares, i.e. 27.54 percent of the total study area. Agriculture - Fallow with 4514.62 hectares, i.e. 13.30 percent, Agriculture - Crop land with 8188.83 hectares i.e. 24.13 percent, Barren/Uncultivable/wasteland, Scrubland with 1600.08 hectares i.e. 4.72 percent, Built-up Land Rural with 620.16 hectares i.e. 1.83 percent, Built-up Land Urban with 1559.19 hectares i.e. 4.60 percent, Built -up Land Mining with 34.41 hectares i.e. 0.10 percent, Deciduous Forest with 4114.50 hectares i.e. 12.13 percent, Evergreen Forest with 2346.49 hectares i.e. 6.92 percent, Forest Plantation with 1174.85 hectares i.e. 37.88 percent and Water Bodies with 434.52 hectares i.e. 1.28 percent occupied in terms of overall area coverage.
Fig.5.Land use/ Land cover Inter -Class Changes Map in 2006-2011 periods
Balakrishnan and Ilanthirayan

Indian Journal of Natural Sciences www.tnsroindia.org.in ©IJONS Vol.8 / Issue 43 / Aug 2017 International Bimonthly ISSN: 0976 – 0997
12589
Different Bio-chemical Parameters Following Treatment with Intravenous Bacterial Collagenase Therapy on RFM in Cows Mohan P1*, Krishnakumar K2, Kulasekar K3, Karthickeyan SMK4 , MuruganM5 and Cecilia Joseph6 1Associate Professor and Head, Livestock Research and Information Centre (A), Konehalli, Tiptur, and KVAFSU,Karnataka,India. 2Professor and Section Head, Cattle and Buffalo Breeding Unit,Post Graduate Research Institute in Animal Sciences, Kattupakkam -603203, TamilNadu,India. 3Professor, Department of Veterinary Gynecology and Obstetrics, Madras Veterinary College, Vepery, Chennai-600 007. TamilNadu,India. 4Professor, Department of Animal Breeding and Genetics, Madras Veterinary College, Vepery, 600 007. 5Professor and Head, Department of Livestock Production and Management, Veterinary College and Research Institute, Thirunelveli,TamilNadu,India. 6Professor and Head, Department of Clinics,Madras Veterinary College, Vepery, Chennai- 600 007.
Received: 24 May 2017 Revised: 28 June 2017 Accepted: 25 July 2017 *Address for correspondence Dr.Mohan P Assistant Professor, Department of Veterinary Gynaecology and Obstetrics, Veterinary College, Shivamogga 577 204,Karnataka,India. Email: [email protected]
This is an Open Access Journal / article distributed under the terms of the Creative Commons Attribution License (CC BY-NC-ND 3.0) which permits unrestricted use, distribution, and reproduction in any medium, provided the original work is properly cited. All rights reserved. The collagenase administration through umbilical artery is the effective treatment for Retained Fetal Membrane (RFM) in dairy cows. RFM was treated with collagenase enzyme through jugular vein as it is easy route than previous study of experimenting on umbilical arteries which is very difficult in a delayed case in field conditions in bovines. The study was conducted in bovines with RFM and presented within 12 to 24 hours after parturition to Obstetrics Unit of Madras Veterinary College, Chennai. The experimental animals were divided in to four different treatment groups ( Gp-I, :n=7;Gp II, :n=15;Gp III, :n=15;Gp IV, :n=15). Data on weekly variations in Creatinine Kinase, Total protein, Albumin and Globulin were collected, compared and analyzed and it was observed that the serum creatine kinase concentration was significantly (P<0.01) higher in group IV on day 0 and group II from days 21 to 42 postpartum. The mean serum total protein concentration was significantly (P<0.01) lower in group I on day 0 and significantly (P<0.01) higher in groups I, III and IV on day 14. The serum albumin concentration was significantly (P<0.01) lower in groups II, III and IV on day 0 and increased towards
ABSTRACT
RESEARCH ARTICLE

Indian Journal of Natural Sciences www.tnsroindia.org.in ©IJONS Vol.8 / Issue 43 / Aug 2017 International Bimonthly ISSN: 0976 – 0997
12590
day 14 postpartum in groups III and IV. In the present study, the globulin concentration on day 14 postpartum was significantly (P< 0.05) lower in group II (3.67 ± 0.10 g/dl) when compared with group I (3.82 ± 0.09 g/dl), III (3.82 ± 0.06 g/dl) and IV (3.69 ± 0.04 g/dl). Serum globulin concentration was significantly (p<0.05) increased on day 0, 7 and 14 in all the groups. Keywords: Retained fetal membrane, Biochemical parameters, Intravenous bacterial collagenase therapy, cows. INTRODUCTION
Retained foetal membrane (RFM) is one of the most important postparturient disease (Stephen, 2008), leading to reproductive problems and economic losses in dairy industry (Pathak et al., 1991). A variety of methods have been used in the treatment of RFM, which includes manual removal and / or administration of oxytocin, PGF2α, antibiotics, immune modulators etc., (Amin et al., 2013), as the efficacy of these treatments are questionable (Eiler, 1997), bacterial collagenase from Clostridium histolyticum was used for the treatment of RFM, alternate route instead ofumbilicalarteriesasreportedby Eiler and Hopkins (1993) that the injection of collagenase (2.2 x 10⁶ U in 1000 ml of physiological saline solution over a period of 30 mts) through jugular vein caused release of foetal membrane within 36 h. Various biochemical parameters subsequent to and during treatment like serum Creatinine kinase, Total protein, Albumin, Globulin data werecollected, compared, analyzed to understand the level of variations of above parameters during and after treatment. MATERIALS AND METHODS Source of animals and grouping Fifty two healthy and parous cows less than 10 years of age, presented to the Large Animal Obstetrics Unit, Teaching Veterinary Clinical Complex, Madras Veterinary College, and Chennai-7 were utilized for the study. Seven healthy cows with normal calving and shedding of placenta were served as group I (control). Thirty cows and buffaloes with unassisted calving followed by retained foetal membranes between 12 and 24 h interval were selected and randomly allotted into groups II and III of fifteen each. Treatment Schedule Group I received placebo treatment with one litre of normal saline intravenously. Group II cows, treated with intrauterine proteolytic bolus containing nitrofurazone, metronidazole and urea and antibiotic therapy (Inj. Streptopenicillin @ 20,000 units/kg body weight) without manual removal for 7 days. Groups III cows, received single dose of 2, 00,000 CDU of collagenase plus 40 mg of calcium chloride and 40 mg of sodium bicarbonate dissolved in one litre of normal saline at a pH of 7.5 intravenously through jugular vein (Eiler and Hopkins ,1993).
Blood collection Blood samples were collected from the jugular vein with the help of vacutainers on days0, 7, 14, 21, 28, 35 and 42 postpartum in all the groups.
Mohan P et al.

Indian Journal of Natural Sciences www.tnsroindia.org.in ©IJONS Vol.8 / Issue 43 / Aug 2017 International Bimonthly ISSN: 0976 – 0997
12591
Serum separation
The collected blood samples were allowed to clot at room temperature and centrifuged at 3000 rpm for 10 minutes. Serum was separated and stored at -20⁰C until estimation of serum biochemical parameters. Serum biochemistry Serum samples stored at -20⁰C were utilized to study the serum biochemistry.
Creatine kinase The serum creatine kinase was estimated using commercial ELISA kit supplied by Sigma Aldrich, U.S.A. Total protein, Albumin, Globulin were analysed using commercial kit supplied by Agappe diagnostics.Statistical analysis of the data was carried out as per the standard procedure outlined by Snedecor and Cochran (1994)
RESULTS AND DISCUSSION
SERUM BIOCHEMISTRY
Creatine kinase
The mean serum creatine kinase concentration reduced as the days of postpartum increases in all the groups. The concentration was significantlyhigher on day 0 and significantly lower on day 42 postpartum in all the groups (Table-1). These findings concurred with the observations of Bouhroum et al. (2013) that the serum creatine kinase concentration on days 0, 15, 30 and 45 postpartum were 160.70, 142.91, 89.57 and 59.17 u/l, respectively in lean cows, 195.0, 142.96, 91.38 and 54.3 u/l, respectively in fatty cows and the mean serum creatine kinase concentration were 186.05, 134.77, 85.78 and 52.75 u/l, respectively in cows. The serum creatine concentration was significantly (P<0.01) higher in group IV (225.70 ± 5.31 u/l) on day 0 than groups I (207.33 ± 3.11u/l), II (210.00 ± 3.11u/l) and III (219.94 ± 3.11 u/l). These findings concurred with the observations of Kleiser and Furll (1998) that the serum creatine kinase concentrations on day 3 postpartum were 121, 310 and 175 u/l in normal puerperium, dystocia and retained placenta cows, respectively. The higher concentration of serum creatine concentration in group IV might be due to the severe tissue damage and destruction of cells in the uterine wall with uterine infection, which induce the release of elevated level of serum creatine kinase (Azawi et al., 2008). The serum creatine kinase concentration in group II wassignificantly (P<0.01) higher from days 21 to 42 postpartum than the remaining groups.These elevated level of creatine kinase after administration of intrauterine proteolytic boluses causes low grade irritation leading to superficial cell necrosis in the endometrium accompanied by significant (P<0.01) increase of creatine kinase (Grubel and Busch, 1998), which might be the reason for the elevated level of creatine kinase in group II.Group III (91.33 ± 5.37 u/l) had significantly (P<0.01) lower concentration of serum creatine kinase than the other groups, except in group I (72.64 ± 2.24 u/ l) cows. These results revealed that the cows followed by RFM treated with 2, 00,000 CDU of collagenase through intravenous route might be involved in the complete expulsion of placenta and regeneration of endometrium than the cows treated with proteolytic agents. Based on these findings, it was suggested that the estimation of creatine kinase concentration in serum might be a valuable aid for the determination of uterine tissue destruction and diagnosis of subclinical endometritis (Sattler and Furll, 2004).
Mohan P et al.

Indian Journal of Natural Sciences www.tnsroindia.org.in ©IJONS Vol.8 / Issue 43 / Aug 2017 International Bimonthly ISSN: 0976 – 0997
12592
Total protein
The mean (±SE) serum total protein concentration on days 0, 7 and 14 postpartum were significantly increased towards the increasing days of postpartum in all the groups (Table-2).The mean serum total protein concentration on day 0 was significantly (P<0.01) lower in group I (5.85 ± 0.18 g/dl) than in groups II, III and IV, which ranged from 6.30 ± 0.12 to 6.42 ± 0.12 g/dl. These findings concurred with the observations of Radostitis et al. (2000) that the normal serum total protein concentration was 5.70 g/dl on day 0 postpartum in healthy cow. The present results were in agreement with the reports of Chassagne and Barnouin (1992) and Hashem and Amer (2008) that the plasma total protein concentration was higher in cows with RFM than in non-RFM cows. However, these findings were in contrast to the observations of Kumari et al. (2015) who reported that the serum total protein concentrationon day 0 postpartum was 5.68 and 6.60 g/dl in normal calving with RFM and without RFM, respectively. Similar incontrast observations were made by Patel et al. (1999) that the serum total protein concentration in control and RFM cows treated with ecbolics were 6.32 ± 0.07 and 5.00 ± 0.03 g/dl, respectively on day 1; 7.00 ± 0.07 and 6.48 ± 0.07 g/dl, respectively on day 30. The elevated level of serum total protein in cows with RFM might be due to the circulatory levels of oestrogen and progesterone imbalance at the time of parturition (Rajpal and Vadnere, 1985). On day 7 postpartum, the level of total protein did not reveal any significant difference, which ranged from 6.49 ± 0.05 to 6.58 ± 0.05 g/dl in all the groups. These results concurred with the observations of Piccinini et al. (2005) that the serum total protein concentration on day 7 postpartum was 6.5 ± 0.2 g/dl. Further, the serum total protein concentration on day 14 postpartumwas significantly (P<0.01) higher in group I (7.37 ± 0.14 g/dl) with normal parturition followed by normal shedding of placenta than groups III (6.78 ± 0.10 g/dl) and IV (6.76 ± 0.10 g/dl). However, group III and IV had significantly (P<0.01) higher concentration of serum total protein than group II (6.55 ± 0.10 g/dl). These findings were in-agreement with the observations of Eiler and Hopkins (1993) that the concentration of serum total protein on days 0, 7 and 14 postpartum were 6.6 ± 0.2, 6.3 ± 0.2 and 6.4 ± 0.2 g/dl, respectively in saline treated RFM cows and 6.6 ± 0.4, 6.3 ± 0.4 and 6.7 ± 0.3 g/dl, respectively in collagenase treated RFM cows. The elevated level of serum total protein on day 14 postpartum in groups III and IV could be used as an indicator for the normal physiological reproductive health status of the RFM cows compared to that of normal puerperium without RFM. Albumin
The mean (±SE) serum albumin concentration on days 0, 7 and14 postpartum significantly increased towards the increasing days of postpartum in all the groups, except in group II (Table-3). In group I, the serum albumin concentration was 3.02 ± 0.15, 3.06 ± 0.09 and 3.54 ± 0.08 g/dl on days 0, 7 and 14 postpartum. These findings were in agreement with the observations of Devarajan (1992) that the serum albumin concentration in normal calving cows were 3.24 ± 0.01, 3.48 ± 0.24 and 3.69 ± 0.11 g/dl on days 0, 15 and 30 postpartum, respectively. Similar observations were made by several researchers (Chassagne and Barnouin, 1992; Al-Mujali, 2008; Hashem and Amer, 2008; Ambika and Rao, 2012; Piccione et al., 2012; Yasar et al., 2012) that the serum albumin concentration immediately after postpartum ranged from 3.05 to 3.47 g/dl in normally calved crossbred cows. The values obtained in the present study were comparable with the values of normal cyclical crossbred cows as 3.84 ± 0.26 g/dl (Amle et al., 2014). However, these findings were in-contrast to the observations of Balasubramanian (1994) that the mean serum albumin concentration on days 1 and 7 postpartum was 5.79 ± 0.05 and 5.53 ± 0.05 g/dl, respectively in normal
Mohan P et al.

Indian Journal of Natural Sciences www.tnsroindia.org.in ©IJONS Vol.8 / Issue 43 / Aug 2017 International Bimonthly ISSN: 0976 – 0997
12593
puerperium buffaloes. The lower concentration of serum albumin in the present study might be due to the variations in the species, breed, feeding, managerial practices and climatic conditions (Shivhare et al., 2013). The serum albumin concentration in groups II, III and IV ranged from 2.71 ± 0.09 to 2.87 ± 0.67 g/dl on day 0 postpartum, which was significantly (P<0.01) lower than the group I (3.02 ± 0.15 g/dl). However, these lower concentrations increased towards day 14 postpartum in groups III (3.17 ± 0.11g/dl) and IV (3.06 ± 0.37g/dl), respectively. These findings were in agreement with the observations of Eiler and Hopkins (1993) who reported that the albumin concentration during first and third weeks of postpartum were 3.1 ± 0.2 and 3.4 ± 0.3 g/dl, respectively with saline treatment and 3.5 ± 0.1 and 3.4 ± 0.1 g/dl, respectively with 2,00,000 CDU of collagenase through intravenous route in dairy cows with retained placenta. In group II, the serum albumin concentration were 2.87 ± 0.67, 2.87± 0.09 and 2.90 ± 0.10 g/dl on days 0, 7 and 14 postpartum, respectively and the overall mean albumin concentration was 2.89 ± 0.50 g/dl, which was significantly (P<0.01) lower than groups III and IV. These findings were in agreement with the observations of Balasubramanian (1994) that the mean serum albumin concentration on days 1 and 7 postpartum in normal puerperium was significantly (P<0.01) higher than the buffaloes with normal calving followed RFM treated with proteolytic bolus through intrauterine route. Similar observations were made by Magnus and Lali (2009) that the serum albumin concentration with recent history of calving was 2.8 ± 0.29 g/dl in postpartum metritis cows. Globulin
The mean (±SE) serum globulin concentration on days 0, 7 and14 postpartum significantly (P<0.01) increased as the days of postpartum increased in all the groups (Table-4).The serum globulin concentration on day 0 postpartum ingroup I (3.17 ± 0.14 g/dl) were significantly (P<0.05) lower than the groups II (3.54 ± 0.06 g/dl), III (3.49 ± 0.10 g/dl) and IV (3.35 ± 0.10 g/dl). These findings were in agreement with the observations of Devarajan (1992) that the serum globulin concentration was 3.65 ± 0.18 g/dl on day 0 postpartum in normal puerperium cows. However, these findings were in contrast to the observations of Alberghina et al. (2013) who recorded that the serum globulin concentration ranged from 45.78 ± 8.31 to 47.77 ± 7.90 g/l in dairy cows during postpartum and these variations might be due to breed, age, parity and managerial conditions of the cow. However, there was no significant difference observed in the concentration of serum globulin on day 7 postpartum in all the groups. These findings were in agreement with the observations of Balasubramanian (1994) who reported that the mean serum globulin concentration on day 7 postpartum was 3.86 ± 0.02 g/dl in normal puerperium and 3.39 ± 0.04 g/dl in buffaloes followed by RFM treated with intrauterine proteolytic bolus. In the present study, the globulin concentration on day 14 postpartum was significantly (P< 0.05) lower in group II (3.67 ± 0.10 g/dl) when compared with group I (3.82 ± 0.09 g/dl), III (3.82 ± 0.06 g/dl) and IV (3.69 ± 0.04 g/dl). These findings were higher than the observations of Amle et al. (2014) that the serum globulin concentration was 2.73 ± 0.12 g/dl in normal cyclical crossbred cows. Similar in contrast observations made by Ruginosu et al. (2011) who reported that the concentration of globulin was 62.7 per cent (range: 45 to 60 %) between days 0 to 60 postpartum with puerperal genital infections, whereas 59.00 per cent (range: 52 to 56 %) in normal healthy dairy cows. The lowest concentration of serum globulin in the present study might be due to the less severity of infection, feeding, environmental influence and managerial conditions of the individual cows (Sheldon et al., 2006). However, the serum globulin concentration in groups I, III and IV did not differ significantly on day 14 postpartum. These positive results obtained in the present study might be due to the effect of exogenous administration of collagenase involved in the easy separation and expulsion of placenta and lower bacterial load, which results in establishment of normal reproductive status of the cow.
Mohan P et al.

Indian Journal of Natural Sciences www.tnsroindia.org.in ©IJONS Vol.8 / Issue 43 / Aug 2017 International Bimonthly ISSN: 0976 – 0997
12594
From the results of present study it was concluded that serum creatine kinase concentration was significantly (P<0.01) higher in group IV on day 0 and group II from days 21 to 42 postpartum. The mean serum total protein concentration was significantly (P<0.01) lower in group I on day 0 and significantly (P<0.01) higher in groups I, III and IV on day 14. The serum albumin concentration was significantly (P<0.01) lower in groups II, III and IV on day 0 and increased towards day 14 postpartum in groups III and IV and serum globulin concentration was significantly (p<0.05) increased on day 0, 7 and 14 in all the groups. ACKNOWLEDGEMENTS The authors thank the Dean, Madras Veterinary College, Chennai and the Director of Clinics, TANUVAS for the facilities provided for this study. REFERENCES 1. Alberghina D, PiccioneG. CasellaS,Panzera M,Morgante M and Gianesella A. The effect of the season on some
blood metabolites and heptoglobulin in dairy cows postpartum period. Archiv Tiezucht,2013; 56: 354-359. 2. Al-Mujalli AAM .. Studies on serum constituents of dairy cows in Soudi Arabia. Sci. J. King Faisal Univ. Basic and
Appl. Sci.,2008; 2:1429. 3. Ambica G and RaoDST. Haemato biochemical and therapeutic studies on subclinical hypocalcemia in crossbred
cows. Int. J. Pharm. Bio. Sci., 2012; 3:225-231. 4. Amin R U, BhatG. R, Ajaz Ahmed, Parthasarathi swain and Arunakumari G. Understanding of pathophysiology
of retained placenta and its management in cattle: A review. Vet. Clin. Sci.,2013; 1:1-9. 5. Amle M, PatodkarV, Shelar Rand BiradeH.Serum biochemical levels of repeat breeder crossbred cows under
rural conditions in Satara District of Maharstra. Int. J. Adv. Vet. Sci. and Tech.,2014; 3: 109-113. 6. Azawi O I, Omran S Nand HadadJ J.. A study of endometritis causing repeat breeding of cyclic Iraqi buffalo
cows. Reprod. Dom. Anim.,2008; 43: 735-743. 7. Azawi O I. Etiopathology and therapy of retained fetal membranes and postpartum uterine infection in buffaloes.
2013; Int. Vet. Informn. Service, Ithaca NY (www.ivis.org). 8. Balasubramanian S. Studies on retained foetal membranes in buffaloes. 1994. Ph.D Thesis. Submitted to Tamil
Nadu Veterinary and Animal Sciences University, Chennai. 9. Bouhroum N, Zouaghi R and BensahliB. Relationship among body condition score of some biochemical
parameters and uterine involution in dairy cow. Int. J. Biosci., 2013;3:1-6. 10. Chaquanda MG, LarsenT, Bjerrinq Mand IngvartsenK L.L-lactate dehydrogenase and N-acetyl-ß-D-
Glucosaminidase activities in bovine milk as indicators of non-specific mastitis.J. Dairy Res.,2006. 73: 431-440. 11. Chassagne M and Barnouin J. Circulating PGF2α and nutritional parameter at parturition in dairy cows with and
without placental relation to prepartum diet. Theriogeneology, 1992;38: 407-418. 12. Devarajan R, Biochemical studies on blood in retained placenta in bovines and its effect on fallopian tube. 1992.
M.V.Sc. thesis submitted to Tamil Nadu Veterinary and Animal Sciences University, Chennai-7. 13. Eiler H and HopkinsFM. Successful treatment of retained placenta with umbilical cord injections of collegenase in
cows. J. Am. Vet. Med. Assoc., 1993; 203: 436-443. 14. Eiler H.. Retained placenta. In: Current therapy in large Animal Theriogenology. W.B. Sounders Company, 1997;
Philadelphia, Pp. 340-348. 15. Grubel, T and W. Busch, 1998. Das Verhalten von Kuhen nach intrauteriner Applikation von Desinfizienzien zur
Behandlung der Endometritis. Tieraerztl Prax, 26: 67-72. 16. Hashem M A and AmerH A. Hormonal and biochemical anomalies in dairy cows affected by retained fetal
membranes. Int. J. Vet. Med.,2008; 3: 59-69 (http://www.priory.com/vet/cow_fetal_membrane.htm). 17. Hussain A M, Daniel R C Wand O’BoyleD. N-Acetyl-β-D- Glucosaminidase activity in bovine uterine fluid and
blood serum during postpartum period. Theriogenology, 1989; 32: 507- 514.
Mohan P et al.

Indian Journal of Natural Sciences www.tnsroindia.org.in ©IJONS Vol.8 / Issue 43 / Aug 2017 International Bimonthly ISSN: 0976 – 0997
12595
18. Kankofer M, Wiereinski Jand ZerbeH. Activity of placental β-N-Acetyl- Glucosaminidase in cows with and without retained fetal membranes. Reprod. Dom. Anim.,2000; 35: 97-100.
19. Kankofer M, Albera E and Rozanska- Boczula M. Activities of N-acetyl –ß-D-glucosaminidase and glutathione peroxidase in bovine colostrum and milk. Czech J.Anim.Sci.,2010; 55: 488-495.
20. Kitchen BJ. . Enzymatic methods for estimation of the somatic cell count in bovine milk. J. Dairy Sci.,1976; 43: 251-258.
21. Kleiser, L and M. Furll, 1998. Screening Zur Fruherkennung einer disposition fur die Dislocatio abomasi bei Kuhen. In: Furll, ta (Hrgh) Stoff wechselbelastung- diagnostic und stabilisier rung being Rind, 95-104.
22. Kumari S, Prasad S,PatbandhaT K, PathakR, KumaresanA, Boro P,Manimaran A and MohantyT K. Metabolic indicators for retained fetal membranes in zebu and crossbred dairy cattle. Anim. Prod. Sci.,2015; 47: 285-290.
23. Larsen T and AulrichK.. Optimizing the fluorometric beta-glucuronidase assay in ruminant milk for a more precise determination of mastitis. J. Dairy Res., 2012; 79: 7-15.
24. Magnus P and Lali F A. Serum Biochemical profile of postpartum metritic cow. Vet. World.,2009; 2: 27-28. 25. Nimni M E and HarknessR D. Molecular structures and function of collagen. In; Nimni, M. E., (Edn.,) 1988;
Collagen. CRC Press Inc., Boca Raton, Pp. 1-77. 26. Patel R D, NemaS. P,Sheela Tand Chauhan R A S.. Biochemical changes associated with retention of fetal
membranes in buffaloes. Indian J. Anim. Reprod.,1999; 20: 35-39. 27. Pathak, M. M., A.V. Patel and V. M. Metha, 1991. Study of serum calcium and phosphorous during placental
expulsion in Surti buffaloe. Indian J. Anim. Reprod.,12: 51-55. 28. Piccinini, R., E. Binda., M. Belotti, G. Casirani and A. Zecconi, 2005. Comparison of blood and milk non-specific
immune parameters in heifers after calving in relation to udder health. Vet. Res.,36: 747-757. 29. Piccione, G., V. Messina, S. Marafioti, S. Casella, C. Giannetto and F. Fazio, 2012. Changes of some haematological
parameters in dairy cows during late gestation, postpartum, lactation and dry periods. Vet. Med. Zoot.,5: 59-64. 30. Polat, B., A. Colak, M. Cengiz, L .Yanmaz, H. Oral, A. Bastan, S. Kaya and A. Hayirli, 2010. Sensitivity and
specificity of infrared thermography in detection of subclinical mastitis in dairy cows. J.DairySci.,93: 3525-3532. 31. Radostitis, O. M., C. C. Gay, D. C. Blood and K. W. Hinchcliff, 2000. Veterinary Medicine. 9th Edn., W.B.Suanders
Co., London, Pp. 1820-1821. 32. Rajpal and S.V.Vadnere, 1985. Biochemical studies and progesterone levels during placental retention and
vaginal prolapse in buffalos. Indian J. Anim. Reprod.,6: 29-32. 33. Ruginosu, E., St. Creanga, M. Sofronie, R. Malancus, V. Boghian and Gh. Solcan, 2011. The biochemical profile in
cows with reproductive disorders. Cercetari Agronomica in Moldova,2: 146. 34. Sattler, T and M. Furll, 2004. Creatine kinase and aspartate aminotransferase in cow as indicators for
endometritis. J. Vet. Med. Assoc., 51: 132-137. 35. Sheetal, S. K., S. K. Choudry, R. P. Pandey and D. Sengupta, 2015. Effect of season and parity on incidence of
retention of placenta in crossbred cattle. Environ. Ecol.,33: 232-234. 36. Sheldon, I. M., S. L. Lewis, S. Leblanc and R. O. Gilbert, 2006. Defining postpartum uterine disease in cattle.
Theriogenology, 65: 1516 – 1530. 37. Shivhare, M., A. K. Misra and V. K. Gupta, 2013. Incidence of pre and postpartum complications in Frieswal cow.
Int. J. Agri. Sci.Vet. Med.,1: 67-72. 38. Snedecor, G.W and W. G. Cochran, 1994. Statistical methods, 8th Edn., Iowa State Uuniversity Press, U.S.A. 39. Stephen, J. L., 2008. A postpartum uterine disease and dairy herd reproductive performance: A review. The Vet.
J.,176: 102-114. 40. Trevisi, E., A. Zecconi, B. Giuseppe and R. Piccinini, 2010. Blood and milk immune profile in periparturient dairy
cows showing a different liver activity index. J. Dairy Res.,77: 310–317. 41. Yasar, A., O. Kizil, N.Shat and M.Yukhel, 2012. The effect of oxytocin and cloprostenol application via umbilical
artery immediately after dystocia on time and rate of fetal membrane removal in cows. Turk. J.Vet. Anim Sci., 36: 275-281.
Mohan P et al.
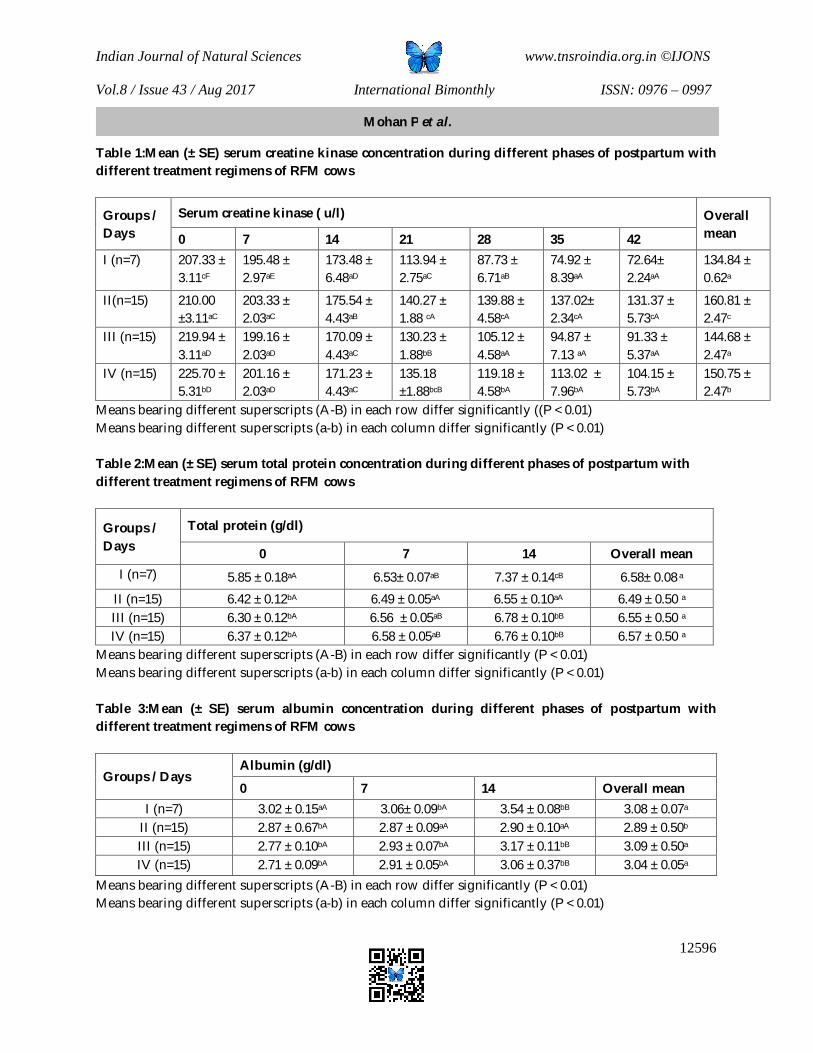
Indian Journal of Natural Sciences www.tnsroindia.org.in ©IJONS Vol.8 / Issue 43 / Aug 2017 International Bimonthly ISSN: 0976 – 0997
12596
Table 1:Mean (± SE) serum creatine kinase concentration during different phases of postpartum with different treatment regimens of RFM cows
Groups / Days
Serum creatine kinase ( u/l) Overall mean 0 7 14 21 28 35 42
I (n=7) 207.33 ± 3.11cF
195.48 ± 2.97aE
173.48 ± 6.48aD
113.94 ± 2.75aC
87.73 ± 6.71aB
74.92 ± 8.39aA
72.64± 2.24aA
134.84 ± 0.62a
II(n=15) 210.00 ±3.11aC
203.33 ± 2.03aC
175.54 ± 4.43aB
140.27 ± 1.88 cA
139.88 ± 4.58cA
137.02± 2.34cA
131.37 ± 5.73cA
160.81 ± 2.47c
III (n=15) 219.94 ± 3.11aD
199.16 ± 2.03aD
170.09 ± 4.43aC
130.23 ± 1.88bB
105.12 ± 4.58aA
94.87 ± 7.13 aA
91.33 ± 5.37aA
144.68 ± 2.47a
IV (n=15) 225.70 ± 5.31bD
201.16 ± 2.03aD
171.23 ± 4.43aC
135.18 ±1.88bcB
119.18 ± 4.58bA
113.02 ± 7.96bA
104.15 ± 5.73bA
150.75 ± 2.47b
Means bearing different superscripts (A-B) in each row differ significantly ((P < 0.01) Means bearing different superscripts (a-b) in each column differ significantly (P < 0.01) Table 2:Mean (± SE) serum total protein concentration during different phases of postpartum with different treatment regimens of RFM cows
Groups / Days
Total protein (g/dl)
0 7 14 Overall mean I (n=7) 5.85 ± 0.18aA 6.53± 0.07aB 7.37 ± 0.14cB 6.58± 0.08 a
II (n=15) 6.42 ± 0.12bA 6.49 ± 0.05aA 6.55 ± 0.10aA 6.49 ± 0.50 a III (n=15) 6.30 ± 0.12bA 6.56 ± 0.05aB 6.78 ± 0.10bB 6.55 ± 0.50 a IV (n=15) 6.37 ± 0.12bA 6.58 ± 0.05aB 6.76 ± 0.10bB 6.57 ± 0.50 a
Means bearing different superscripts (A-B) in each row differ significantly (P < 0.01) Means bearing different superscripts (a-b) in each column differ significantly (P < 0.01) Table 3:Mean (± SE) serum albumin concentration during different phases of postpartum with different treatment regimens of RFM cows
Groups / Days Albumin (g/dl)
0 7 14 Overall mean I (n=7) 3.02 ± 0.15aA 3.06± 0.09bA 3.54 ± 0.08bB 3.08 ± 0.07a
II (n=15) 2.87 ± 0.67bA 2.87 ± 0.09aA 2.90 ± 0.10aA 2.89 ± 0.50b III (n=15) 2.77 ± 0.10bA 2.93 ± 0.07bA 3.17 ± 0.11bB 3.09 ± 0.50a IV (n=15) 2.71 ± 0.09bA 2.91 ± 0.05bA 3.06 ± 0.37bB 3.04 ± 0.05a
Means bearing different superscripts (A-B) in each row differ significantly (P < 0.01) Means bearing different superscripts (a-b) in each column differ significantly (P < 0.01)
Mohan P et al.

Indian Journal of Natural Sciences www.tnsroindia.org.in ©IJONS Vol.8 / Issue 43 / Aug 2017 International Bimonthly ISSN: 0976 – 0997
12597
Table 4:Mean (± SE) serum globulin concentration during different phases of postpartum with different treatment regimens of RFM cows
Groups / Days Globulin ( g/dl )
0 7 14 Overall mean I (n=7) 3.17 ± 0.14aA 3.65± 0.10aB 3.82 ± 0.09bB 3.55± 0.07a
II (n=15) 3.54 ± 0.06bA 3.56 ± 0.07aA 3.67 ± 0.10aA 3.59 ± 0.50a III (n=15) 3.49 ± 0.10bA 3.62 ± 0.07aA 3.82 ± 0.06bB 3.64 ± 0.50a IV (n=15) 3.35 ± 0.10bA 3.45 ± 0.07aA 3.69 ± 0.04bB 3.50 ± 0.05a
Means bearing different superscripts (A-B) in each row differ significantly ( P< 0.05) Means bearing different superscripts (a-b) in each column differ significantly (P < 0.01)
Mohan P et al.
Indian Journal of Natural Sciences www.tnsroindia.org.in ©IJONS Vol.8 / Issue 43 / Aug 2017 International Bimonthly ISSN: 0976 – 0997
12598
Diagnostic Characteristics of Double Intussusception in a Non Descript Dog Pramod U.1*, Sooryadas S. 1, Dinesh P.T.1, JineshKumar N.S.1, Bipin K.C. 2, John Martin K.D.1 and Syam K.Venugopal3
1Department of Veterinary Surgery and Radiology,College of Veterinary and Animal Sciences, Kerala Veterinary and Animal Sciences University, Pookode,Wayanad,Kerala,India. 2Department of Veterinary Epidemiology and Preventive Medicine,College of Veterinary and Animal Sciences,Kerala Veterinary and Animal Sciences University, Pookode, Wayanad, Kerala,India. 3Professor and Head, University Veterinary Hospital, Kokalai,College of Veterinary and Animal Sciences, Mannuthy, Thrissur, Kerala,India. Received: 25 May 2017 Revised: 27 June 2017 Accepted: 5 July 2017 *Address for correspondence Dr.Pramod U Menon MVSc Student, Department of Veterinary Surgery and Radiology, College of Veterinary and Animal Sciences, Kerala Veterinary and Animal Sciences University, Pookode, Wayanad – 673 576,Kerala,India. Email : [email protected]
This is an Open Access Journal / article distributed under the terms of the Creative Commons Attribution License (CC BY-NC-ND 3.0) which permits unrestricted use, distribution, and reproduction in any medium, provided the original work is properly cited. All rights reserved. A 7 month old non descript dog was presented with a history of vomiting since one week and tenesmus and inappetance for two weeks, with evident weight loss. Abdominal palpation revealed a hard intra abdominal mass. Haematology and serum biochemistry were not specific. Radiographic findings were inconclusive. Ultrasonography revealed concentric ring like target sign, suggesting intussusception.Under general anaesthesia, minimal invasive diagnostic laparoscopy using a rigid endoscope was done for localising the intussusception, visualising the extent of damage before attempting surgical correction and reduction of the telescoped segment. Laparoscopy revealed an intussusception involving the ileo-colic region. The telescoped segments were tightly adhered inside, preventing reduction using endoscopic manipulations.Immediate explorative laparotomy revealed an ileo-ileo-colic intussusception. Telescoping into the colon was reduced by gentle traction with milking of the segment. Ileo-ileal intussusception was found strangulated and necrosed. The segment was hence resected followed by end-to-end entero anastomosis. Colopexy was also performed to prevent rectal prolapse. Laparotomy wound was apposed in a routine manner. The animal had an uneventful recovery, following a routine post-operative care. Keywords: Double intussusception, Dog, Radiography, Ultrasonography, Diagnostic laparoscopy.
ABSTRACT
RESEARCH ARTICLE

Indian Journal of Natural Sciences www.tnsroindia.org.in ©IJONS Vol.8 / Issue 43 / Aug 2017 International Bimonthly ISSN: 0976 – 0997
12599
INTRODUCTION Intussusception is a surgical condition wherein there is telescoping or invagination of one intestinal segment into the lumen of an adjacent segment. According to their location within the gastrointestinal tract, intussusceptions can be different types. Ileocolic or jejunojejunal intussusception is the most commonly encountered type in small animals (Radlinsky, 2013). Gastroesophageal, duodenojejunal and cecocolic are the other types of intestinal intussusception. Rarely are also reported. This paper, place in record a case of ileo-ileo-colic double intussusception and its diagnostic characteristics.
MATERIALS AND METHODS A seven month old non descript dog was presented with the history of vomiting, past one week. Tenesmus and inappetance for two weeks with evident weight loss was reported by the owner. Animal was dull and lethargic. Physical examination revealed a hard intra abdominal mass. Abdominal percussion revealed a dull sound, while on auscultation reduced motility was noticed. All physiological parameters were normal except for pale visible mucous membrane. There was reduced packed cell volume (32.4%), leucocytosis (23.4 X 10³/μL) and a high platelet count (8.85 X 10⁵/μL). Serum biochemistry values were normal; however the alkaline phosphatase level was towards the higher limit (100.6 U/L). A sequential diagnostic workup was conducted; initially radiography, then ultrasonography, followed by exploratory laparoscopy and finally exploratory laparotomy and surgical correction.
RESULTS Radiographic findings Gastro-intestinal segments were filled with fluid/ingesta, without any gas accumulation. The animal was lethargic and not taking any food orally. Hece, no contrast study was performed. No tentative diagnosis was made. Ultrasonographic findings In transverse view, concentric ringed target sign was observed in the caudal abdominal region, with a “reverse G” shaped interior, suggestive of intussusception (Fig.1). In longitudinal scan a layered appearance of alternating parallel hyperechoic and hypoechoic lines were demonstrated (Fig.2). Exploratory laparoscopy findings Flaccid intestinal loops were seen in the mid abdominal region. A distended, hard loop of ileum could be located towards the caudal abdomen, with an abrupt flaccid loop towards its caudal end (Fig.3 ). Serosa of the affected segment was oedematous, congested and fragile (Fig 4). An attempt was made to probe and lift the segment with a grasping forceps, which gave an impression of segment to be an intussuscipiens with an intussusceptum inside. An attempt was made to pull out the telescoped loops with graspers, but it was too tight to be extracted. An intussusception of distal intestinal segments, involving ileo-colic segment, was diagnosed. Laparotomy findings
Laparotomy revealed swollen and congested enterocolic junction. The intestinal lumen proximal to the obstruction was filled with fluids and inflammatory serous exudates. Distal to the obstruction, the bowel was empty and normal. Wall of the intestine was showing signs of ischemic necrosis and acute enteritis. Enterotomy revealed a segment of
Pramod U Menon et al.

Indian Journal of Natural Sciences www.tnsroindia.org.in ©IJONS Vol.8 / Issue 43 / Aug 2017 International Bimonthly ISSN: 0976 – 0997
12600
ileo-ileal intussusception telescoped into a segment of colon, forming a double intussusception, ileo-ileo-colic intussusception (Fig. 5 and 6). Surgical correction An attempt was made to relieve the intussusception by placing traction on the neck and milking the apex out of the intussusceptum and ileo-ileal segment telescoped into the colon was thus relieved. Attempt to relieve ileo-ileal intussusception failed and led to serosal and mesenteric tearing. Hence, enterectomy and end-to-end entero anastomosis were resorted to, followed by prophylactic colopexy. A routine post operative care was given. The animal had an uneventful recovery.
DISCUSSION Intussusceptions were usually seen in young animals of age less than one year (Dixon, 2004 and Khan et al., 2011). However, double intussusceptions (DI) were usually rare in dogs (Prathaban et al., 2013). The clinical signs observed are usually referable to partial or complete intestinal obstruction (Prathaban et al., 2013). Double intussusceptions might show symptoms and diagnostic features of standard intussusception and would be indistinguishable from classical intussusception preoperatively. After celiotomy, it could be easily detected (Prathaban et al., 2013). Ileo-caeco-colic intussusception elicited signs of vomiting and inappetance (Ravikumar, 2015). Abdominal palpation might reveal a tender, relatively mobile mass with multiple direction mobility in cases of intussusception (Kim et al., 2012). In this case however a hard relatively mobile mass was palpated. Low hematocrit value in the present study might be the result of minor intestinal hemorrhages (Dixon, 2004 and Khan et al., 2011). Elevated leucocyte count might be suggestive of stress and infection (Khan et al., 2011). Another reason could be presence of devitalized intestinal tissues (Dixon, 2004 and Khan et al., 2011). Abdominal radiography could sometimes give a diagnostic picture. However, both survey radiographs and contrast studies would often present nonspecific lesions (Patsikas et al., 2003 and Kim et al., 2012). If there is accumulation of gas proximal to the intussusception it might aid in diagnosis by a plain radiograph (Khan, 2011). Ultrasonography usually provided a more sensitive and specific method for accurate diagnosis of intestinal intussusception in young dogs (Patsikas et al., 2003 and Kim et al. 2012). A third ring (colic segment) was noticed during retrospective examination of sonogram in a case of double intussusception by Kim et al. (2012). The outer third ring was the distal segment (colic segment), the middle, the second ring and the inner first ring was the ileo-ileal intussusception. Laproscopic examination revealed gross changes and appearance of affected segments, like signs of necrosis, infarction, hemorrhage, and fibrin deposits on the serous surfaces. Intense hyperemia, enteritis and moderate to severe sero-fibrinous deposits might be seen on the segment of small intestine preceding the intussusception (Davide et. al., 2009). Wall of the intestine in the case of intussusception in a Labrador was showing signs of ischemic necrosis and acute enteritis as reported by Kumar et al. (2011) similar to what was observed in this case.
CONCLUSION In this case, diagnostic laparoscopy confirmed the intussusception in the ileo-colic region and laparotomy showed a double intussusception (ileo-ileo-colic intussusception). Use of diagnostic laparoscopy as a confirmatory diagnostic aid prior to exploratory laparotomy was found to be very effective in confirming the condition, localising the region, studying the gross lesion, assessing viability of affected region before attempting surgery and trying to relieve intussusception.
Pramod U Menon et al.

Indian Journal of Natural Sciences www.tnsroindia.org.in ©IJONS Vol.8 / Issue 43 / Aug 2017 International Bimonthly ISSN: 0976 – 0997
12601
REFERENCES 1. Radlinsky MG. Surgery of the digestive system. In: Fossum ZW, Curtis WD, Caroline VH, Ann LJ, Catriona MM,
Mary AGR, Kurt S, Schulz and Michael DW Small Animal Surgery. 4th Ed. Elsevier Inc; Missouri; 2013. p. 524-528.
2. Dixon BC. In: Tilley LP and K Smith FW. The 5-minute veterinary consult Canine and Feline 3rd ed, Lippincott Williams and Wilkins;2004.p.721-722
3. Khan M A, Ali MM, Azeem S, Safdar A, Ijaz A, Ziaullah and Sajjad MT. Ileocolic Intussusception In A Cocker Spaniel Dog: A Case Report. The Journal of Animal & Plant Sciences 2011; 21(3): 635-637
4. Prathaban S, Ramprabhu MR and Shiju Simon. Double Intussusception In A Dog. Indian Journal of Canine Practice 2013; 5(1): 45-47
5. Ravikumar S, Ranganath L, Nagaraja BN, Shivakumar E and Gowda AB. Successful Surgical Management Of Ileo-Ceacocolic Intussusception In An Adult Labrador Retriever Dog. Indian Journal of Canine Practice 2015; 7(1):38-41
6. Kim JM, Kang SS, Kim G and Choi SH. Double intussusception in a Shih-Tzu puppy: the triple-circle sign. Pak Vet J 2012; 32(2): 292-294.
7. Patsikas MN, Jakovljevic S, Moustardas N, Papazoglou LG, Kazakos GM and Dessiris AK. Ultrasonographic Signs of Intestinal Intussusception associated With Acute Enteritis or Gastroenteritis in 19 Young Dogs. J Am Anim Hosp Assoc 2003; 39:57-66.
8. Davide P, Marco NR, Pietro R, Davide DZ, Massimiliano S and Angelo GB. Repeated occurerence of jejuno-jejunal intessusception in a calf. Can. Vet. J 2009; 50(3): 287-290.
9. Kumar K, Shekhar P and Singh PK. Intussusception In A Labrador Dog- A Case Report. Exploratory Animal and Medical Research 2011;1(1): 91-92
Pramod U Menon et al.

Indian Journal of Natural Sciences www.tnsroindia.org.in ©IJONS Vol.8 / Issue 43 / Aug 2017 International Bimonthly ISSN: 0976 – 0997
12602
Pramod U Menon et al.

Indian Journal of Natural Sciences www.tnsroindia.org.in ©IJONS Vol.8 / Issue 43 / Aug 2017 International Bimonthly ISSN: 0976 – 0997
12603
Multi-Residue Analysis (GC-ECD) of Some Organochlorine Pesticides in Commercial Milk Samples Marketed in Bengaluru City, Karnataka Lokesha L.V1*, Jagadeesh S.Sanganal2, Shridhar N.B1, Rao, K.S, H.D.Narayanaswamy3, Girish KumarV4, Ranjith. D5 and Yogesh Gowda2
1Department of Veterinary Pharmacology andToxicology, Veterinary College, Shivamogga, Karnataka. 2Department of Veterinary Pharmacology and Toxicology, Veterinary College, Bengaluru, India. 3Department of Veterinary Pathology, Veterinary College, Bengaluru, Karnataka,India. 4Department of Veterinary Biochemistry, Veterinary College, Bengaluru, Karnataka, India. 5Department of Veterinary Pharmacology and Toxicology, Veterinary College, Pookode, Kerala,India. Received: 17 May 2017 Revised: 21 June 2017 Accepted: 25 July 2017 *Address for correspondence Dr. Lokesha L.V Assistant Professor, Department of Veterinary of Pharmacology and Toxicology, Veterinary College, KVAFSU, Shivamogga- 577 204, Karnataka,India. Email: [email protected]
This is an Open Access Journal / article distributed under the terms of the Creative Commons Attribution License (CC BY-NC-ND 3.0) which permits unrestricted use, distribution, and reproduction in any medium, provided the original work is properly cited. All rights reserved. Organochlorine (OC) insecticides are among the most important organotoxins and make a large group of pesticides.Physicochemical properties of these toxins, especially their lipophilicity, facilitate the absorption and storage of these toxins in the meat thus possess public health threat to humans.The presence of these toxins in broiler meat can be a quantitative and qualitative index for the presence of these toxins in animal bodies, which is attributed to Waste water of irrigation after spraying the crops, contaminated animal feeds with pesticides, polluted air are the potential sources of residues in animal products. Thirty milk samples were collected from different retail outlets of Bengaluru city, Karnataka state, in ice cold conditions and later stored under -20oC until analysis. All the samples were subjected to Gas Chromatograph attached to Electron Capture Detector (GC-ECD, VARIAN make) screening and quantification of OC pesticides viz; Alachlor, Aldrin, Alpha-BHC, Beta-BHC, Dieldrin, Delta-BHC, o,p-DDE, p,p-DDE, o,p-DDD, p,p-DDD, o,p-DDT, p,p-DDT, Endosulfan-I, Endosulfan-II, Endosulfan Sulphate and Lindane(all the standards were procured from Merck). The reconstituted samples (using n-hexane) (Merck chem) were injected to Gas Chromatograph - Electron Capture Detector (GC-ECD). The present study reveals that, among the thirty milk samples subjected for analysis, 60% (18/30), 16.67% (5/30), 10% (3/30), 6.67% (2/30), 6.67% (2/30) and 3.3%(1/30) of
ABSTRACT
RESEARCH ARTICLE
Indian Journal of Natural Sciences www.tnsroindia.org.in ©IJONS Vol.8 / Issue 43 / Aug 2017 International Bimonthly ISSN: 0976 – 0997
12604
samples contaminated with DDTs, endosulphan, Dieldrin, Aldrin, Alachlor, and lindane respectively. DDT metabolites, endosulphan were the most frequently detected OC pesticides. The detected levels of the pesticides were below the levels of MRL (according to WHO/FAO).
Keywords: Toxins, Accuracy, Chicken, Rotary Evaporator and Petroleum ether.
INTRODUCTION
Pesticides have been widely used throughout the world since middle of the last century. They are mainly used in agriculture crops to control pests that may reduce yields. Organochlorine pesticides are extensively used in tropical countries in malaria control programs, against livestock ectoparasites and agricultural pests (Flyianos et al., 1985, and Mathur, 1993).India being an agriculture based country was among the largest users of these pesticides in the world until recently (Mehrotra,1989). Wide spread contamination of milk samples with these residues have been reported throughout the country (Kalra, 1986; Mukharjee and Gopal, 1993).
Pesticides, human health and safety of the environment have been of global concern. Organochlorine compounds have a high toxic effects and persistence in the environment, posing considerable hazards. They pose a major threat to the living organisms in the environment, as they are lipid soluble and non biodegradable. The problem becomes more serious when bioaccumulation of these lipophilic compounds are taken in to consideration (Doyle, 2004) and their high toxicities, chemical, biological stabilities, lipophilicities make these compounds more prone to bio-accumulate along the food chain (Biziuk et al.,1996). Pesticide residues were accumulated in adipose tissue of meat and fat rich dairy products to significant levels of contamination (Bentabol and Jadral, 1995), this fact has caused concern since meat and dairy products play role in human nutrition.
Although the use of most organochlorine compounds has been restricted or even banned in many countries, they are still wide spread not only in environment but also in biotic matrices. The organochlorine pesticides (OCP) residues may concentrate in the adipose tissues and in the blood serum of animals leading to environmental persistence, bio concentration and biomagnifications through food chain. The pesticide contamination of broiler meat resulting from feeding a diet containing low concentration of pesticide is a well established fact(Aulakh et al.,2006). The importance of broiler meat consumption as a source of OCP has been established worldwide (Darko and Acquaah, 2007; Windal et al., 2009). These compounds can generate certain harmful effects on humans as well as on animals (Daston et al.,1997; Smith and Gangolli,2002). The usage of these persistent OCP has resulted in trace contamination of air, water and soil with their residues. The residues of these pesticides are accumulated in milk producing animals such as cow and buffaloes, if they feed on contaminated gross/hay and in inhaled air. Being highly lipophilic, OCPs are primarily stored in fat rich tissues in these animals and subsequently translocated and excreted through milk and meat. They get accumulated in fat rich dairy products such as butter, cheese etc and as such, consumers of milk and dairy products could be exposed to these residues (Kannan et al.,1992; Bentabol and Jordal, 1995;Waliezewski et al.,1997). This becomes a great concern with respect to food safety in India, as most Indians consume milk daily as a custom either in the form of beverages or in its various forms such as butter, butter milk, curds, cheese and sweets made out of milk. In fact, milk is considered as nutritious, wholesome food item for all age groups and a large proportion of the Indian population are vegetarians; their main source of animal protein is milk.
The toxicity of these residues slowly causes ill effects. Residues accumulate in fatty tissues, thus building up in the vital organs such as liver, heart, kidney, thyroid, mammary gland and testes. Several health effects ranging from systemic effects on cardiovascular, respiratory and genotoxic effects have been reported (Kalpana, 1999) and they are shown to be potential endocrine disrupts in humans even for low level exposures (Calborn et al.,1993). Therefore, the awareness and need for regular screening of these foodstuffs is necessary and is in interest of both international trade
Lokesha et al.

Indian Journal of Natural Sciences www.tnsroindia.org.in ©IJONS Vol.8 / Issue 43 / Aug 2017 International Bimonthly ISSN: 0976 – 0997
12605
and consumers. The problem of food contamination particularly with pesticides becomes more critical. Thus, all the 30 broiler meat samples were subjected to Gas Chromatograph attached to Electron Capture Detector(GC-ECD, VARIAN make) screening and quantification of OC pesticides viz; Alachlor, Aldrin, Alpha-BHC, Beta-BHC, Dieldrin, Delta-BHC, o,p-DDE, p,p-DDE, o,p-DDD, p,p-DDD, o,p-DDT, p,p-DDT, Endosulfan-I, Endosulfan-II, Endosulfan Sulphate and Lindane.
MATERIALS AND METHODS A total of thirty milk samples were collected from different retail outlets of Bengaluru city, Karnataka state, in ice cold conditions and later stored under -20oC until analysis.The sample extraction procedure of milk for the detection of residue of Organochlorine pesticides by Gas Chromatography-Electron Capture Detector (GC-ECD) was done as per the method described in Manualof Methods of Analysisof Foods by Food Safetyand Standards Authorityof India (2015). Pesticide residues were extracted from milk using following steps.
About 50 ml of milk sample was measured and transferred into 100ml volumetric flask and transfer it carefully into 1 liter separating funnel. To this added about 50 ml of methanol and 0.5 g of potassium oxalate and mixed well. To this 25 ml of ethyl ether added and shake well for one min and then added 25 ml petroleum ether and shake vigorously for 1min. Transfer this to centrifuge tubes and centrifuge this at about 1500rpm for about 5mins. Transfer the solvent layer in to 1 liter separating funnel (SF-II) containing 300ml distilled water and 15 ml saturated sodium chloride (NaCl) solution, re-extracted the residues in SF-I twice with 25ml of ethyl ether and petroleum ether, centrifuge and transferred the solvent layer into SF-II after each extraction. Discardedthe aqueous layerin SF-I after two extractions. Pour ether solution through sodium sulphate. Wash separator with small portions of ether. Collected it in rotary vacuum evaporator flask and evaporate the ether to dryness in rotary evaporator. Made the final volume to 5ml by using n-hexane and this solution was injected into gas chromatogram with electron capture detector.All the standards of OCP and chemicals were procured from Merck. The purity of the OCP standards greater than 99%. The pesticide residues were detected and determined according to Association of Official Analytical Chemists (AOAC, 1995) methods. The reconstituted samples [(using n-hexane), (Merck chem)] were injected to Gas Chromatograph - Electron Capture Detector(GC-ECD).The OCP residues in broiler meat were analysed using Gas Chromatograph(Varian CD-3800)with electron capture detector using a silica Column: Rtx-5 with diameter of 30 meter, 0.25 mm ID, 0.25µm. The carrier gas: nitrogen, flow rate 2 ml per minute and through the column and 30 ml per min make up. Column oven temperature was initiated 80oC to 0.00 2.0, raised to 280oC/min, the injector temp was 260oC, detector temp: 300oC and run time: 28 min. The sample volume injected was 1μl. In the GC-ECD analysis peaks were identified by comparing their retention times with those of standards under same operating conditions. The method for analysis of organochlorine pesticides using gas chromatography equipped with electron capture detector (GC-ECD) was successfully modified for separation of sixteen OCPs in a run of about 28 minutes. In this research paper seven OCPs were successfully validated at three fortification levels (0.25, 1, 2.5 µg/ml). The recoveries obtained ranged from 78.67 to 85.1%. The calibration curves were linear in the range (0.1-5 µg/ml) the evaluation was based on the squared correlation coefficient (r2), which was >0.9990. The method detection limits (MDL) were typically in the range (0.089-0.048 µg/ml) for the pesticides included in the study.
RESULTS AND DISCUSSION A total of thirty milk samples collected from the commercial outlets of Bengaluru were analysed for the presence of OCP residues. The present study reveals that, among the thirty broiler meatsamples subjected for analysis 60% (18/30), 16.67% (5/30), 10% (3/30), 6.67% (2/30) and 6.67 % (2/30) of samples contaminated with DDTs, endosulphan,
Lokesha et al.

Indian Journal of Natural Sciences www.tnsroindia.org.in ©IJONS Vol.8 / Issue 43 / Aug 2017 International Bimonthly ISSN: 0976 – 0997
12606
dieldrin, aldrin and alachlor respectively.DDT metabolites, endosulphan were the most frequently detected OC pesticides.The detected levels of the pesticides were below the levels of MRL(according to WHO/FAO).
CONFLICT OF INTEREST
None declared.
ACKNOWLEDGMENTS The authors are thankful to the Karnataka Veterinary, Animal and Fisheries Sciences University (KVAFSU), Bidar for providing necessary facilities.
REFERENCES 1. Aulakh R S, Gill J P, Bedi J, Sharma J K, Joia B and Ockerman H W(2006) Organochlorine pesticide residues in
poultry feed , chicken muscle and eggs at a poultry farm in Punjab, India. J.Sci. Food Agric86, 741-744. 2. Bentabol A and Jodral M (1995) Determination of organochlorine pesticides in cheese. J. AOAC Int. 78: 94-98. 3. Biziuk M, Przyjazny A, Czerwinski J and Wiergowski M (1996). Occurrence and determination of pesticides in
natural and treated waters. J. Chromatogr. A 754: 103-123. 4. Colborn T, Vomsaal F S and Soto A M (1993). Developmental effects of endocrine disrupting chemicals in
wildlife and humans. Environ. Health Perspectives 101, 378-384 5. Darko G and Acquaah S O(2007) The level of organochlorine pesticide residues in meat. Int. J. Environ.
Sci.Technol4,521-524. 6. Daston G P, Gooch J W, Breslin W J, Shuey D L, Nikiforov A I, Fico T A and Gorsuch J W (1997). Environmental
estrogens and reproductive health: A discussion of the human and environmental data. Reprod. Toxicol11, 465-481.
7. Doyle J (2004) Dow chemical and the toxic century, Canada. Available at:http://trespassagainstus.com. 8. Flyianos K, Vasilikiotis G, weil L, Kavlendis E and Laskaridis N (1985) Preliminary study of organochlorine
compounds in milk products, human milk and vegetables. Bull. of Environ. Contamination and Toxicol34, 504-508. 9. Kalpana B (1999). Human health risk assessment for exposures to pesticides: a case study of endocrine disrupters.
Proceedings of the Eighth National Symposium on Environment, Kalpakkam, India, 70-72. 10. Kalra R L (1986). Monitoring of pesticide residues in the Indian environment. Proceedings of the National
Symposium on Nuclear Technique in the Study of Pesticides in Food, Agriculture and Environment. 1-15 11. Kannan K, Tanabe S, Ramesh A, Subramanian A and Tatsukawa R (1992). Persistent organochlorine residues in
food stuffs from India and their implications on human dietary exposure. J of Agri. and Food Chem. 40, 518 - 524. 12. Mathur S C (1993) Pesticide industry in India. Pestic Inf19, 7-15. 13. Mehrotra K N (1989). The extent of pesticide use in India and its consequences. Pestic Res in Foods, 42. 14. Mukherjee I and Gopal M (1993) Organochlorine pesticide residues in dairy milk in and around Delhi. J. of the
Association of Analy. Chem.Interna 72: 283-286. 15. Smith A G and Gangolli S D(2002) Organochlorine chemicals in seafood: occurrence and health concerns. Food
Chem.Toxicol40, 767-779 16. Waliszewski S M, Pardio V T, Chantiri J N, Rivera J and Agurrie A A (1997) Organochlorine pesticide residues in
cow’s milk and butter in Mexico. Sci.of the Total Environ208, 127-132. 17. Windal I, Hanot V, Marchi J, Huysmans G, Van Overmeire I, Waegeneers N and Goeyens L(2009)PCB and
organochlorine pesticides in home produced eggs in Belgium. Sci.Total Environ.407,4430-4437.
Lokesha et al.

Indian Journal of Natural Sciences www.tnsroindia.org.in ©IJONS Vol.8 / Issue 43 / Aug 2017 International Bimonthly ISSN: 0976 – 0997
12607
Table 1: Organochlorine pesticides (mg/kgon fat basis) detected in milk
Pesticide Number of samples (n=30) Frequency Mean (ppb)
Alachlor 02 ˂ LOD Aldrin 02 10.17
Alpha-BHC ND - Beta-BHC ND - Dieldrin 03 13.64
Delta-BHC ND - o,p-DDE 01 ˂ LOD p,p-DDE 12 37.79 o,p-DDD 03 116.70 p,p-DDD 01 17.00 o,p-DDT ND - p,p-DDT 01 ˂ LOD
Endosulfan-I 05 13.79 Endosulfan-II ND -
Endosulfan Sulphate ND - Lindane 01 86.60
˂ LOD: below limit of detection
Lokesha et al.
Indian Journal of Natural Sciences www.tnsroindia.org.in ©IJONS Vol.8 / Issue 43 / Aug 2017 International Bimonthly ISSN: 0976 – 0997
12608
Effects of Bio-Organic Fertilizer on Evaporation under Different Saline Soils YJ Zhang1,2, TT Chang1,2*, QX Zhang1,2, XH Shao1,2,H Ye3, ZY Zhang1,2, JZhang1,2
1Key Laboratory of Efficient Irrigation-Drainage and Agricultural Soil-Water Environment in Southern China of Ministry of Education, Hohai University, Nanjing 210098, China. 2College of Water Conservancy and Hydropower Engineering, Hohai University, Nanjing210098, China. 3Changjiang Institute of Survey, Planning, Design and Research, Wuhan430010, China. Received: 9 July 2017 Revised: 10 July 2017 Accepted: 12 July 2017 *Address for correspondence TT Chang College of Water Conservancy and Hydropower Engineering, Hohai University, Nanjing210098, China. Email: [email protected]
This is an Open Access Journal / article distributed under the terms of the Creative Commons Attribution License (CC BY-NC-ND 3.0) which permits unrestricted use, distribution, and reproduction in any medium, provided the original work is properly cited. All rights reserved. Soil salinization is one of the main factors affecting crop production. Secondary salinization of greenhouse soil was induced by excessive nitrogen fertilizer and closed environment. A soil culture experiment was conducted to study the effects of bio-organic fertilizer on evaporation in greenhouse saline soil and coastal saline soil. Two bio-organic fertilizer rates (Rice bran, fish bone; 0, 75g kg-1) were applied at high humidity and low humidity in the two saline soils (soil salinity, 6‰) with constant temperature.Bio-organic fertilizer can effectively reduced saline soil evaporation for all treatments. During an irrigation cycle, greenhouse soil decreased 15% and coastal saline soil decreased 8% at high humidity, respectively; evaporation of both soil reduced about 20% at low humidity. Evaporation of greenhouse saline soil reached the peak at the later stage in low humidity, and evaporation of coastal saline soil has a maximum at the initial stage. Both saline soils reached the highest evaporation at the initial stage in low humidity. The soil evaporation (y) curves over time (x) in all treatments can be described by nonlinear equations: y=a*(x3)+b*(x2)+c*x+d.
Keywords: evaporation, soils, greenhouse saline soil, coastal saline soil , bio-organic fertilizer.
ABSTRACT
RESEARCH ARTICLE

Indian Journal of Natural Sciences www.tnsroindia.org.in ©IJONS Vol.8 / Issue 43 / Aug 2017 International Bimonthly ISSN: 0976 – 0997
12609
INTRODUCTION
Greenhouse cultivation has become one of the highest economic efficiency in agricultural industry for nearly 30 years (Figure1 for the greenhouse vegetable cultivation area since 1978 in China). Due to the closed environment of greenhouse, especially the greenhouse in the south of China (Figure 2 for the relative humidity in greenhouse of southern China), a very favorable conditions for pathogenic microorganism breeding, which can lead to the crop disease, can be provided by high humidity of greenhouse, The humidity in greenhouse has an impact of soil evaporation and crop transpiration. The relative humidity in greenhouse over 93% for more than 6 h, will seriously affect the growth of the crops. The relative humidity in greenhouse more than 93%, which is more than 6 h, will seriously affect the growth of the crops. Soil salinization is an obstacle to agricultural development. There are about 831 million hm2 of saline soil in the world (Mohammad et al., 2015). Saline soil, which is widely distributed in China, is one of the main soil type (Asgarzadeh et al., 2014). The area of saline soil in China is about 36 million hm2, accounted for 4.88% of the available land (Heshmati and Motahari, 2014). Higher salt content have influences on the soil hydraulic characteristics (mainly including capillary rise, saturated moisture content, field water moisture rate, water level, saturated permeability coefficient) and the speed of soil evaporation process. Soil secondary salinization scatters earth grain, which lead to poor soil quality, low effective soil water and nutrients with no structure. In the aspect of the composition of soluble soil salt, there is significantly different between greenhouse soil and coast or inland saline soil. Furthermore, the natural saline soil of our country is mainly composed of 12 salt ions, including K+, Na+, Ca2+, Mg2+, HCO3-, CO32-, Cl- and SO42-. Due to the excessive application chemical fertilizer, the cation in greenhouse soil is mainly K+, Na+, Ca2+, Mg2+ and Ca2+ is account for the dominance, in contrast, HCO3-, CO32-, Cl- and SO42- is the mainly anion in soil (Aldaood et al., 2014).Soil evaporation is an important way of farmland water consumption. Microbial product is an effective technology, which can improve saline soil and soil moisture availability, reducing soil evaporation (Li et al., 1991). The effect mechanism of fertilizer on soil evaporation characteristics of saline soil was studied by conducting simulation experiment. MATERIALS AND METHODS Experimental Design Experiment I: The simulation experiments were conducted in Hohai University (Jiangsu Province, China). The soils were collected from greenhouse in Gaochun, Hengxi andDongtai. The saline greenhouse soil collected from Gaochun (NS1) was loam soil, the soil bulk density was 1.32 g/cm3, and the soil salt content was 6 g/kg. The saline greenhouse soil collected from Hengxi (NS2) was loam soil, the bulk density was 1.31 g/cm3, and the soil salt content was 3 g/kg. The coastal saline soil from Dongtai (NaS) was sandy soil with low nutrient content, the bulk density was 1.20 g/cm3, and the soil salt content was 6 g/kg. Plastic beaker (250 ml) was chosen as culture vessel (200 g per cup soil). The amount of adding bio-organic fertilizer, straw powder, chemical water retention agent (polyacrylamide, SA) and Effective microorganisms (EM) was 15 g, 15 g, 2 g and10 ml, respectively. There are total 15 treatments with 3 replications (Table 1). Adding deionized water to the beaker and makes every treatment reach field capacity, and placed in the incubator with constant temperature (25◦ C). There were two stages in this experiment, the first phase for high humidity environment humidity (90%-100%), namely, besides take samples to determine other time incubator is closed, the second phase of low humidity environment humidity (50%-70%), namely in keeping the temperature conditions, the incubator of the door ajar. In every stage, the initial soil water content was irrigation to the field capacity.
TT Chang et al.

Indian Journal of Natural Sciences www.tnsroindia.org.in ©IJONS Vol.8 / Issue 43 / Aug 2017 International Bimonthly ISSN: 0976 – 0997
12610
Experiment II: Saline greenhouse soil from Gaochun (NS2) was chosen as the soil sample. After passing the 2 mm sieve, 1000 g soil was obtained in a volume of 2 L plastic bucket, and the proportion of adding different material with a beaker experiment. The amount of adding BO, straw (ST) and EM was 75 g, 75 g and 50 ml, respectively. A total of four processing were repeated twice (specific see table 2). In order to determine soil moisture/ temperature/ conductivity data, EM50 data collector (the United States, EM27438 and EM26974) was buried at 10 cm depth. Experiments carried out in 25◦ C temperature indoor.The Effective microorganisms contain lactic bacteria and yeasts as main components at pH 3.5 with a commercial name as EM (EM Laboratory Co., Ltd., Shizuoka, Japan). The bio-organic fertilizer (N, 5.2, P, 30, K, 20 g kg-1), which was fermented with oil mill sludge, rice bran and fish meal. Sampling and Testing Soil evaporation: weigh soil at 15:00 pm, and calculate the soil evaporation. Soil organic carbon (SOC) and total nitrogen (TN): Multi N/C 3000 analyzer (Germany, N3-343L) was applied to determinate of total organic carbon, total nitrogen content in soil. Statistic Analysis The Data from all measurement in the present study were statistically analyzed based on Tukey’s multiple comparisons using the software of DPS Data Processing System (Tang and Feng, 2006).
RESULTS AND DISCUSSION Soil evaporation Soil evaporation is an important component of agricultural water consumption in the process of water cycle. However, it does not participate in the process of crop physiology and production. Accordingly, it should be as far as possible to reduce soil evaporation.Figure 3 showed the variation of soil evaporation amount after the application of different material under high humidity and low humidity conditions. It can be seen in Figure 3 (the daily evaporation variation under the condition of humidity environment from 15 Nov to 26 Nov), with the time prolong, the daily evaporation of different overall increased. BO treatment, ST treatment and EM treatment for different soil had an effect of reducing the soil evaporation. In terms of NS1 and NS2, the irrigation and accumulated evaporation treated with BO treatment was less than the CK treatment after 12 days of irrigation. In addition, total evaporation of NS1, NS2 and NaS soil decreased by 15%, 15% and 8%, respectively, compared with the CK treatment. Research has been shown that straw mulching in inshore saline soil can reduce the soil evaporation effectively through the partition of soil and atmosphere(Li et al., 2013). In addition, Figure 3 was soil daily evaporation in the low humidity environment during November 27 to December 5. By calculating soil cumulative evaporation/water quantity of different treatments, the results showed that the cumulative evaporation/irrigation water of BO and EM were less than that of CK. In addition, compared with the CK treatment, the cumulative evaporation of coastal saline soil reduced about 20%.The results showed that the BO and EM treatments can effectively reduced soil evaporation, and BO steamed suppression effect was better. Using 1st OPT (V1.6) software to fit the curve of daily evaporation and time, the soil evaporation (y) curves over time (x) of NS1 and NaS treatments under high humidity and low humidity conditions can be described by nonlinear equations: y=a*(x^3)+b*(x^2)+c*x+d. The R2 of equations for NS1, BO-NS1, NaS and BO-NaS under high humidity were 0.8146, 0.9091, 0.9279 and 0.9835, and were 0.9305, 0.9706, 0.8751, 0.8184 for NS1, BO-NS1, NaS, BO-NaS under low humidity, respectively.
TT Chang et al.

Indian Journal of Natural Sciences www.tnsroindia.org.in ©IJONS Vol.8 / Issue 43 / Aug 2017 International Bimonthly ISSN: 0976 – 0997
12611
Currently, the study of soil evaporation more concentrated field crops, rarely involves greenhouse cultivation. Pei and Zhang (2002) and Khalimov et al (2013) stated that, inside the sunlight greenhouse, light intensity, temperature, ground temperature and soil evaporation was significantly positively related, relative humidity and soil evaporation was significantly negative correlation. Crop leaf area and leaf area index increased, soil evaporation of moisture loss ratio decreases, for example, Liu et al (2009) found that, sunlight greenhouse soil evaporation among plants with the passage of radish growth period tends to decrease, soil evaporation between tree accounted for 33.73% - 41.71% of the total water consumption in the whole stages. Soil evaporation among plants and solar radiation, air temperature and relative humidity are the main meteorological factors such as rendering good index relationship. This experiment results showed that evaporation of saline greenhouse soil had significant difference between the high humidity and low humidity environment. This study was carried out under the condition of indoor simulation, so the next step to carry out under field condition to carry out the microbial preparation research on the mechanism of the influence of soil evaporation among crops, through the analysis of measuring soil, evaporation and cumulative evaporation and crop photosynthesis, transpiration intensity, leaf area index, analysis of field soil evaporation and the change law of crop water consumption. Soil organic carbon and soil nitrogen content Soil organic matter (SOM) is to point to by microbial action form of humus, animal and plant residues and micro-organisms, including carbon to soil organic carbon (SOC). The content of soil organic carbon is the balance of soil biological residue organic material input and soil microbial decomposition of organic material loss. Soil organic carbon content (SOC) is one of the important characterizations for soil fertility, and fertilizer measures will have an obvious effect on organic carbon content. As shown in Figure 4, in NS1 different treatment of soil, BO, ST and EM was significantly higher than the CK of soil organic carbon content, increased by 17.1%, 23.5% and 24.9%, respectively. And SA to deal with the SOC was reduced by 1%, compared with control soil treatment, no significant differences between shows that water retention agent handling basic no effect on SOC. In coastal saline soil, SOC of EM, BO and ST processing was significantly higher than that of CK, respectively increased by 21.8%, 637.6% and 255.9%. SOC of ST treatment was higher than that of BO treatment processing, may be due to the C/N ratio was much higher than the bio-organic fertilizer processing, straw is more difficult to decompose organic matter, and bio-organic fertilizer after completely after fermentation of organic material, so the straw processing of organic carbon content is the highest. In addition, NS1 each processing of soil organic carbon content was higher than in NaS, analysis the reason was that the sandy soil organic matter content of background value is low. The results showed that the EM treatment and BO treatment can effectively improved soil organic carbon content. Figure 5 indicates the total nitrogen content (TN) of different types of soil. In terms of NS1 and NaS, bio-organic fertilizer (BO) treatment, straw, soil TN was significantly higher than CK treatment, EM and (SA) treatment of soil TN was slightly higher than the control. In addition, soil TN of S1 was higher than that of NaS. Accordingly, the bio-organic fertilizer can significantly increase the soil total nitrogen content. Dynamic variation of soil moisture content Figure 6 and Figure 7 showed the dynamic variation of soil volumetric moisture content and temperature with different treatments. It can be seen in Figure 6 that with the passage of time, the soil depth of 10 cm, soil moisture content in NS2 decreased after irrigation. Soil moisture content change curve of bio-organic fertilizer (BO) treatment has been higher than other treatment, and soil moisture content of ST treatment has been relatively low. Figure 7 showed that the soil temperature fluctuated slightly. The results showed that the soil moisture content of BO treatment was higher than other treatments.Yao et al (2007) found that organic fertilizer (peanut bran, food scraps, peat, etc.) can improve the soil moisture content, and it was helpful for keeping and utilization of soil water. Tobacco
TT Chang et al.

Indian Journal of Natural Sciences www.tnsroindia.org.in ©IJONS Vol.8 / Issue 43 / Aug 2017 International Bimonthly ISSN: 0976 – 0997
12612
was chosen for test crop, and the results showed that organic fertilizer can improve the soil moisture content (Han et al., 2003). This may be due to organic fertilizer could improve soil structure, resulting in the increasing of soil water content. Moreover, Feng et al (2012) found that different straw manures processing (using soybean straw, wheat straw and corn straw) soil moisture content were higher than powdered potassium sulfate and CK, and showed significant difference.
CONCLUSION Bio-organic fertilizer has obvious effect on saline soil moisture content. Application of bio-organic fertilizer can effectively reduce the soil evaporation under the condition of high humidity or low humidity. Under the condition of high humidity, the total evaporation of saline greenhouse soil and coastal saline soil reduced by 15% and 8%, respectively. Under the condition of low humidity, total evaporation of two kinds of saline greenhouse soil and coastal saline soil decrease about 20%. Processing under high humidity environment, soil evaporation to rise - lower - rising trend, peak appeared in the late days of soil evaporation, coastal saline soil peak appeared in the early day of soil evaporation; Processing under low humidity environment, soil evaporation to rise - lower - rising- lower trend. In addition, under the condition of high humidity or low humidity, the fitting curves of soil evaporation (y) over time (x) of NS1 and NaS treatments can be described by nonlinear equations: y=a*(x^3)+b*(x^2)+c*x+d. Soil moisture content of bio-organic fertilizer treatments was higher than other treatments. The results showed that the bio-organic fertilizer and EM treatment can reduce the soil evaporation. Bio-organic fertilizer steamed suppression effect is better. In addition, with the passage of time after irrigation, the bio-organic fertilizer processing of soil volumetric moisture content is higher, and water retention is best.
ACKNOWLEDGMENTS This work was financially supported by the National Natural Science Foundation of China (51509068), China Postdoctoral Science Foundation (2015M581716), Jiangsu Planned Projects for Postdoctoral Research Funds (1501043A) and Fundamental Research Funds for the Central Universities (2014B04814, 2015B05814).
REFERENCES 1. Aldaood A, Bouasker M, Al-Mukhtar M. Soil-water characteristic curve of lime treated gypseous soil. App Clay
Sci2014; 102: 128-138. 2. Asgarzadeh H, Mosaddeghi MR, Dexter AR, Mahboubid AA, Neyshabourie MR. Determination of soil available
water for plants: Consistency between laboratory and field measurements. Geoderma,2014; 226-227: 8-20. 3. Wang H, Yang GY, Jia YW, Wang JH. Connotation and assessment index system of soil water resources. J Hydraul
Eng-Asce 2006; 37(4): 389-394. 4. Feng RY, Yang WD, Wang HJ, Nan JF, Zhang ZJ. Effects of straw amendment fertilizers on water use efficiency, yield
and quality of potato. Transactions of CASE2012; 28(2): 100-105. 5. HanFG, SunDM, Liu GS, Chen SW, Zhang LD. Effect of fertilizers on soil moisture, yield and quality of flue-cured
tobacco. Tobacco Sci Technol 2003; (10): 35-38. 6. HeshmatiAA, Motahari MR.Modeling the dependency of suction stress characteristic curve on void ratio in
unsaturated soils. Ksce J Civ Eng 2014; 19(1): 91-97. 7. Lei ZD, Hu HP, Yang SX. Research progress in soil water. Advances in Water Science, 1999; 10(3): 311-318. 8. Khalimov AG, Khairiddinov BE, Kim VD, KhalimovGG. Modeling the heat balance of a solar greenhouse with a
passive heat accumulator. Applied Solar Energy 2013; 49(4): 211-214. 9. Li FR, Yang JS, Wu YK, YaoRJ, YuSP, ZhangJM. Effects of straw mulch at different depths on water-salt dynamic
changes of coastal saline soil in north Jiangsu province. Soils 2013; 45(6): 1101-1107. 10. Li KY, Li YS, Shao MA. Soil conservaton performance and water availability. Collected papers of institute of soil and
TT Chang et al.
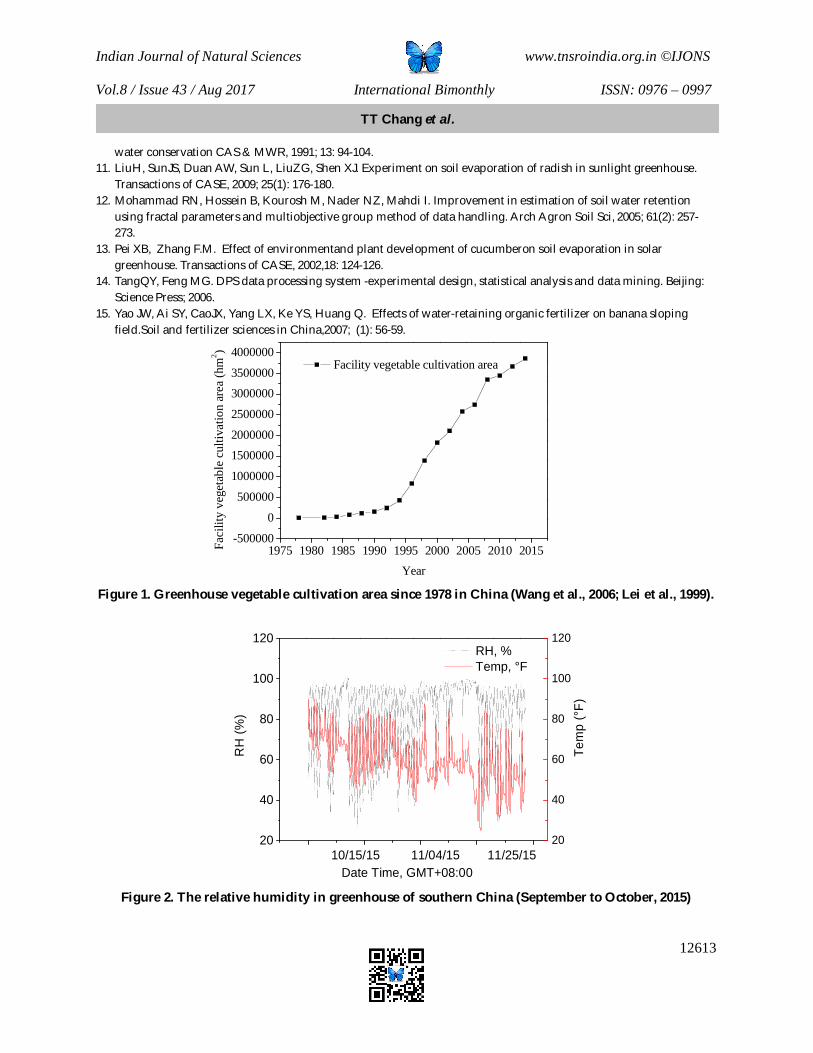
Indian Journal of Natural Sciences www.tnsroindia.org.in ©IJONS Vol.8 / Issue 43 / Aug 2017 International Bimonthly ISSN: 0976 – 0997
12613
water conservation CAS & MWR, 1991; 13: 94-104. 11. LiuH, SunJS, Duan AW, Sun L, LiuZG, Shen XJ. Experiment on soil evaporation of radish in sunlight greenhouse.
Transactions of CASE, 2009; 25(1): 176-180. 12. Mohammad RN, Hossein B, Kourosh M, Nader NZ, Mahdi I. Improvement in estimation of soil water retention
using fractal parameters and multiobjective group method of data handling. Arch Agron Soil Sci, 2005; 61(2): 257-273.
13. Pei XB, Zhang F.M. Effect of environmentand plant development of cucumberon soil evaporation in solar greenhouse. Transactions of CASE, 2002,18: 124-126.
14. TangQY, Feng MG. DPS data processing system -experimental design, statistical analysis and data mining. Beijing: Science Press; 2006.
15. Yao JW, Ai SY, CaoJX, Yang LX, Ke YS, Huang Q. Effects of water-retaining organic fertilizer on banana sloping field.Soil and fertilizer sciences in China,2007; (1): 56-59.
1975 1980 1985 1990 1995 2000 2005 2010 2015-500000
0
500000
1000000
1500000
2000000
2500000
3000000
3500000
4000000 Facility vegetable cultivation area
Faci
lity
vege
tabl
e cu
ltiva
tion
area
(hm
2 )
Year
Figure 1. Greenhouse vegetable cultivation area since 1978 in China (Wang et al., 2006; Lei et al., 1999).
20
40
60
80
100
120
10/15/15 11/04/15 11/25/15
RH
(%)
Date Time, GMT+08:00
RH, % Temp, °F
20
40
60
80
100
120
Tem
p (°
F)
Figure 2. The relative humidity in greenhouse of southern China (September to October, 2015)
TT Chang et al.

Indian Journal of Natural Sciences www.tnsroindia.org.in ©IJONS Vol.8 / Issue 43 / Aug 2017 International Bimonthly ISSN: 0976 – 0997
12614
0 5 10 15 20 250
2
4
6
8
10
12
14
Dai
ly e
vapo
ratio
n of
soi
l (g)
Days
NS1 EM-NS1 BO-NS1 ST-NS1
NS1
0 5 10 15 200
2
4
6
8
10
Dai
ly e
vapo
ratio
n of
soi
l (g)
Days
NS2 EM-NS2 BO-NS2 ST-NS2
NS2
(a) (b)
0 5 10 15 200
1
2
3
4
5
6
7
8
Dai
ly e
vapo
ratio
n of
soi
l (g)
Days
NaS EM-NaS BO-NaS ST-NaS
NaS
(c)
Figure 3. The daily evaporation variation under different treatments.
TT Chang et al.

Indian Journal of Natural Sciences www.tnsroindia.org.in ©IJONS Vol.8 / Issue 43 / Aug 2017 International Bimonthly ISSN: 0976 – 0997
12615
NS1 EM-NS1 BO-NS1 ST-NS1 SA-NS1 NaS EM-NaS BO-NaS ST-NaS SA-NaS
0
5
10
15
20
25
30
35
Tota
l soi
l org
anic
car
bon
(soi
l TC
, mg/
L)
Treatments
Soil TC (mg/L)
Figure 4. Total soil organic carbon.
NS1 EM-NS BO-NS ST-NS SA-NS NaS EM-NaSBO-NaSST-NaSSA-NaS0
5
10
15
20
25
30
Tota
l soi
l nitr
ogen
con
tent
(soi
l TN
, mg/
L)
Treatments
Soil TN (mg/L)
Figure 5. Total soil nitrogen content.
TT Chang et al.

Indian Journal of Natural Sciences www.tnsroindia.org.in ©IJONS Vol.8 / Issue 43 / Aug 2017 International Bimonthly ISSN: 0976 – 0997
12616
2015-11-162015-11-202015-11-242015-11-28 2015-12-2 2015-12-6 2015-12-100.0
0.2
0.4
0.6
0.8
1.0
1.2
1.4
1.6
1.8 NS2 EM-NS2 BO-NS2 ST-NS2
NS2
Date
Figure 6. Dynamic variation of soil volumetric moisture content.
2015-11-162015-11-202015-11-242015-11-28 2015-12-2 2015-12-6 2015-12-10
10
12
14
16
18
20
22
24
26 NS2 EM-NS2 Bo-NS2 ST-NS2
NS2
Date
Figure 7. Dynamic variation of soil temperature.
TT Chang et al.
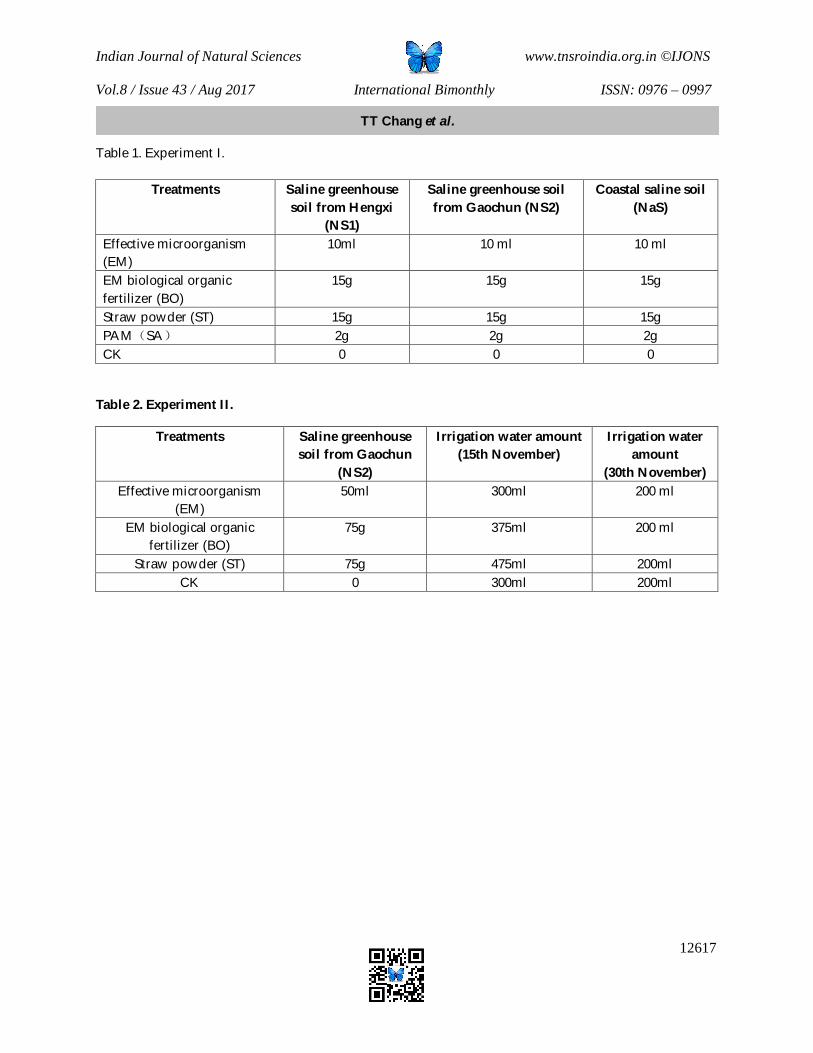
Indian Journal of Natural Sciences www.tnsroindia.org.in ©IJONS Vol.8 / Issue 43 / Aug 2017 International Bimonthly ISSN: 0976 – 0997
12617
Table 1. Experiment I.
Treatments Saline greenhouse soil from Hengxi
(NS1)
Saline greenhouse soil from Gaochun (NS2)
Coastal saline soil (NaS)
Effective microorganism (EM)
10ml 10 ml 10 ml
EM biological organic fertilizer (BO)
15g 15g 15g
Straw powder (ST) 15g 15g 15g PAM(SA) 2g 2g 2g CK 0 0 0
Table 2. Experiment II.
Treatments Saline greenhouse soil from Gaochun
(NS2)
Irrigation water amount (15th November)
Irrigation water amount
(30th November) Effective microorganism
(EM) 50ml 300ml 200 ml
EM biological organic fertilizer (BO)
75g 375ml 200 ml
Straw powder (ST) 75g 475ml 200ml CK 0 300ml 200ml
TT Chang et al.

Indian Journal of Natural Sciences www.tnsroindia.org.in ©IJONS Vol.8 / Issue 43 / Aug 2017 International Bimonthly ISSN: 0976 – 0997
12618
Estimation of Initial Moisture Content of Agricultural Products by an ASTM Experimental Procedure Gone Rajasheker and Chandramohan V.P*.
Mechanical Engineering Department, National Institute of Technology Warangal, Warangal– 506 004, India. Received: 18 May 2017 Revised: 11 June 2017 Accepted: 19 June 2017 *Address for correspondence Chandramohan V.P., Mechanical Engineering Department, National Institute of Technology Warangal, Warangal, India – 506 004, Email: [email protected]
This is an Open Access Journal / article distributed under the terms of the Creative Commons Attribution License (CC BY-NC-ND 3.0) which permits unrestricted use, distribution, and reproduction in any medium, provided the original work is properly cited. All rights reserved. Initial moisture content is a constant numeric value for a particular food material.The dearth of these values of agricultural products createsa lot of hurdles for industries and researchers for further investigation on drying. In this study, the initial moisture content of 24 different agricultural products isestimated. An internal calibrated hot air oven is used to achieve these values. A new method - an ASTM (American society for testing and methods) experimental procedure is used to retrieve this data for food products. Repeatability tests were carried out for each product and an average was taken to calculate the final result.Both dry and wet basis initial moisture content is estimated and tabulated. Keywords: initial moisture content, hot air oven, ASTM drying standards, food drying, repeatability test. INTRODUCTION
Initial moisture content of agricultural materials is the necessary data for any experimental, analytical and numerical analysis on drying.Drying is a simultaneous heat and mass transfer process and it is used in most of the industries such as agricultural, bio-oil industry, building materials, paper, nuclear waste disposal etc. Initial moisture content is useful (i) to solve the mass transfer equation as it serves as an initial condition, (ii) to predict the air flow velocity and temperature required to dry the product, (iii) to estimate the drying time, (iv) to estimate the other drying parameters such as, shrinkage, porosity, drying constant, moisture ratio, drying ratio [1], equilibrium moisture content, volume of bone dry material, moisture and air etc. (v) to design the drying experimental setup and commercial driers and (vi) to predict the energy requirement and manual work needed in drying.
ABSTRACT
RESEARCH ARTICLE
Indian Journal of Natural Sciences www.tnsroindia.org.in ©IJONS Vol.8 / Issue 43 / Aug 2017 International Bimonthly ISSN: 0976 – 0997
12619
A lot of mathematical analysis on drying has been found in the literature with the approximate initial moisture content value as the exact value is not available leading to poor prediction of the drying parameters[1]. There are a number of correlations developed by researchers to estimate the physical and thermal parameters of agricultural products[1-2] such as specific heat, density, thermal conductivity, moisture diffusivity in terms of initial moisture content. Once this value is estimated, other drying parameters and properties canbe estimated. Importance of this value may be identified by the above factors and thereby it is concluded that the drying related research works cannot be completed without this value. There are very few experiments on estimating the initial moisture content of food materials. Mahapatra and Imre [3] found the initial moisture content of 32 agricultural products. Mujumdar [4] mentioned the initial moisture content of food materials (wheat, corn, tomato seeds, red pepper, egg, black grapes etc) and few other chemicals such as polyvinyl chloride, poly carbonate granules, lignopol (sodium ignosulfonate) etc. Initial moisture content of some herbs by a convective drier was experimentally estimated by Chu [5]. Remington [6] estimated the initial moisture content of some pharmaceutical materials. There are abundant number of literature are using the initial moisture content values of agricultural products such as apple [7], banana [8], broccoli [9,10], carrot [11], guava [8], green chilly [4], green peas [12], mango [13], garlic [14],potato [8, 15-17], ginger [18]etc. Though the experimental procedures were not properly stated in any literature, still these values are frequently followed by researchers. The usual drying temperature range for agricultural products is 35 to 70 ºC [4,11]. This is the safe temperature range for agricultural products. If the temperature is increased further the product may be cooked or its natural color and flavor may be changed. By using this temperature range, 100% moisture from the product cannot be eliminated and so this temperature range cannot be used to find the initial moisture content. For finding the exact value, the entire moisture content should be eliminated, which means the material should be bone dry. For achieving this condition, an ASTM procedure (D 4442)[19] is introduced as this method serves as a basis for drying techniques in food, agricultural products, etc. Already, this procedure was successfully used for wood and other building materials to estimate the initial moisture content (ASTM International, D 4442 – 92, 2003). In the present work, this new approach is introduced in food drying application to find the initial moisture content. As per the ASTM procedure, the temperature of air inside the hot air oven is maintained at 105 ºC and the product is dried continuously for 24 hours. Though the exposure of food product to such a high temperature may lead to deterioration of the product, the present work is only interested in finding the total initial moisture content. By using this method, an additional manual/experimental work needed for researchers to estimate the same is restricted and further expenses are also reduced.
MATERIALS AND METHODS Fresh agricultural products harvested in India were purchased from local markets in Warangal, Telangana State, India. Most of the food productswere peeled, cut into slices of 2 cm x 2 cm x 2 cm and put in the hot air oven for 24 hours at 105 °C after it was wrapped in an aluminium paper. Some of the products (green chilli, capsicum, tomato, bitter gourd and black grapes) were sliced in small pieces or half pieces as cubical slices (2 cm x 2 cm x 2 cm)were not possible. But, the initial moisture content is a constant value and is irrespective of product’s size. 24 agricultural products were selected for this investigation as the initial moisture content of above products is not found in literature. For finding the initial moisture content, a thermostatically controlled hot air oven (Memmert type) was used. Its temperature range is 50 to 250 °C with an accuracy of ±1 ºC. It has a digital temperature controller with indicator. A known mass of cubical shaped product slice (2 cm x 2 cm x 2 cm) was wrapped with an aluminium paper and kept in the hot air oven where the temperature was maintained at 105 °C. The product wasallowed to dryfor upto 24 hours. Mass of the product slice was measured every 2 hours using an electronic weighing balance (OHAUS PA 214). It is
Gone Rajasheker and Chandramohan

Indian Journal of Natural Sciences www.tnsroindia.org.in ©IJONS Vol.8 / Issue 43 / Aug 2017 International Bimonthly ISSN: 0976 – 0997
12620
an internal calibrated instrument with a readability and accuracy of 0.1 mg. It is covered by glass plates on all sides to avoid any interference, with a pan arrangement to place the food product inside it for measuring the mass.
RESULTS AND DISCUSSION
24 agricultural products were selected and used in theseexperiments. Almost all the agricultural products used in this study had drastic mass reduction in the first 5 to 6 hours as the products lose moisture continuously. The moisture reduction was found to be low in the drying range at6 to 16 hours. The mass transfer was estimated as 0.1 to 0.01 g, which was even lower for certain products (0.05 to 0.001 g) during this stage. There is no mass (or moisture) variation noticed after 24 hours and this state is called bone dry state. Final mass of the bone dry material was measured and the initial moisture content (M0) of the object was estimated by,
kg/kg of db (1)
kg/kg of wb (2)
Where, mi = initial mass in g, mf = final or bone dry mass in g. The experiments are conducted in a closed room to reduce moisture content variation of air with weather changes. The initial moisture content of food products is tabulated in Table 1. The initial moisture content was estimated on both dry basis and wet basis through Eq. Nos (1) and (2). The botanical names of each product are also mentioned to avoid misinterpretation because of local names. From the wet basis initial moisture content, the percentage of moisture in a product was estimated by,
(3)
It is noticed that all the agricultural products contain 85 % moisture approximately (except Sapota - Manilkarazapota) and the rest is solid matter. The minimum % of moisture is noticed in Ginger (Zingiberofficinale) andit has 84.22 % moisture. The maximum (96.86 %) is for Courgette (Cucurbitapepo).The present experimental result of initial moisture contentof green chilli (0.8705 kg/kg of wb) is compared with the resultsfrom literature (0.9 kg/kg of wb). It has 3.34 % variation. Similarly the values were compared for carrot (Daucuscarota) and it’s showed 9.8 % variation. It is believed that the present work is more reliable as it follows a standard procedure. Repeatability Test
Repeatability tests were performed to check the accuracy of experimental results. The repeatability tests were conducted by the same observer, same instruments, same location and the same experimental procedures. An average was calculated after three different tests were performed in hot air oven. The maximum percentage variation of results with average value is estimated and mentioned. The maximum percentage variation of initial moisture content in dry basis is noticed as 2.45 % (for Brinjal: deep blue, Science name:Solanum melongena)with the average initial moisture content. The minimum % variation noticed is 0.2 %. Similarly, the average for wet basis is estimated. The maximum and minimum percentage variations are noticed as 0.65 (for Tomato - Solanumlycopersicum)and 0.011 % (for Brinjal - Green long, Science name:Solanummelongena)respectively. Hence, it is concluded that the percentage variation of the experimental results are within the accepted range. Some of the experimental results were compared with existing literature results. It is observed that the values match the actual values obtained in the literature rather well.
CONCLUSION
Initial moisture content of 24 products was estimated in this experimental analysis. An ASTM drying procedure was used to retrieve this data in food products. Repeatability tests were performed to check the error percentage with the average value. The percentage variation of initial moisture content is within the accepted range. Present
Gone Rajasheker and Chandramohan
Indian Journal of Natural Sciences www.tnsroindia.org.in ©IJONS Vol.8 / Issue 43 / Aug 2017 International Bimonthly ISSN: 0976 – 0997
12621
experimental results were compared with existing literature values and the values are in close agreement. This proves that the ASTM test method is a standard procedure to calculate the initial moisture content of agricultural products. Drying related research can be performed on the above agricultural products by using these initial moisture content results without further experimental setup, instruments or additional expenses. ACKNOWLEDGEMENTS
The author acknowledges with thanks the support received by way of proof reading from Dr. M.R. Vishwanathan, Assistant Professor of English, Humanities and Social Science Department, NIT Warangal, India. NOMENCLATURE ASTM -American society for testing and methods Db -dry basis M0-Initial moisture content (kg/kg of db) mi-initial mass of the object (g) mf-final mass of the object (g) wb-wet basis REFERENCES
[1].Hall CW. Dictionary of drying. Marcel Dekker, Inc., New York, USA; 1979. [2]. Srikiatden J, Roberts JS.Predicting moisture profiles in potato and carrot during convective hot air drying using
isothermally measured effective diffusivity. Journal of Food Engineering 2008;84:516-525. [3]. MahapatraAK, Imre L.Role of solar agricultural-drying in developing countries. International Journal of Ambient
Energy 1990;4:205. [4]. Mujumdar AS.Handbook of Industrial Drying. Third edition, Published by CRC press, Taylor and Francis group,
Boca Raton, FL 33487, USA; 2006. [5]. Chu ZD.Drying of small pieces of Chinese medicine, in Modern Drying Technology. Eds. YK Pan and XZ Wang,
Chemical Industry Press, Beijing, 1998;810–841. [6]. RemingtonJP.Remington’s Pharmaceutical Sciences. 16th ed., Mack Publishing Company, Easton; 1980. [7]. Kaya A, Aydın O,Dincer I.Numerical modeling of heat and mass transfer during forced convection drying of
rectangular moist objects. International Journal of Heat and Mass Transfer 2006;49:3094-3103. [8]. Abhay L, Chandramohan VP, Raju VRK.Design, Development and Performance of Indirect Type Solar Dryer for
Banana Drying. Energy Procedia 2017;109:409–416.. [9]. Hussain MM, DincerI.Two-dimensional heat and moisture transfer analysis of a cylindrical moist object
subjected to drying: A finite-difference approach. International Journal of Heat and Mass Transfer 2003;46:4033-4039.
[10]. Simal S, Rossello C, Berna A,Mulet A.Drying of Shrinking Cylinder-shaped Bodies. Journal of Food Engineering 1998;37:423-435.
[11].Barati E,Esfahani JA.Mathematical Simulation of Convective Drying: Spatially Distributed Temperature and Moisture in Carrot Slab. International journal of thermal science 2012;56:86-94.
[12].Arunsandeep G, Abhay L, Razatkumar N, Chandramohan VP, Raju VRK. Numerical solution and it’s analysis during solar drying of green peas, Journal of The Institution of Engineers (India): Series C, Accepted on 7th Mar., 2017.
Gone Rajasheker and Chandramohan
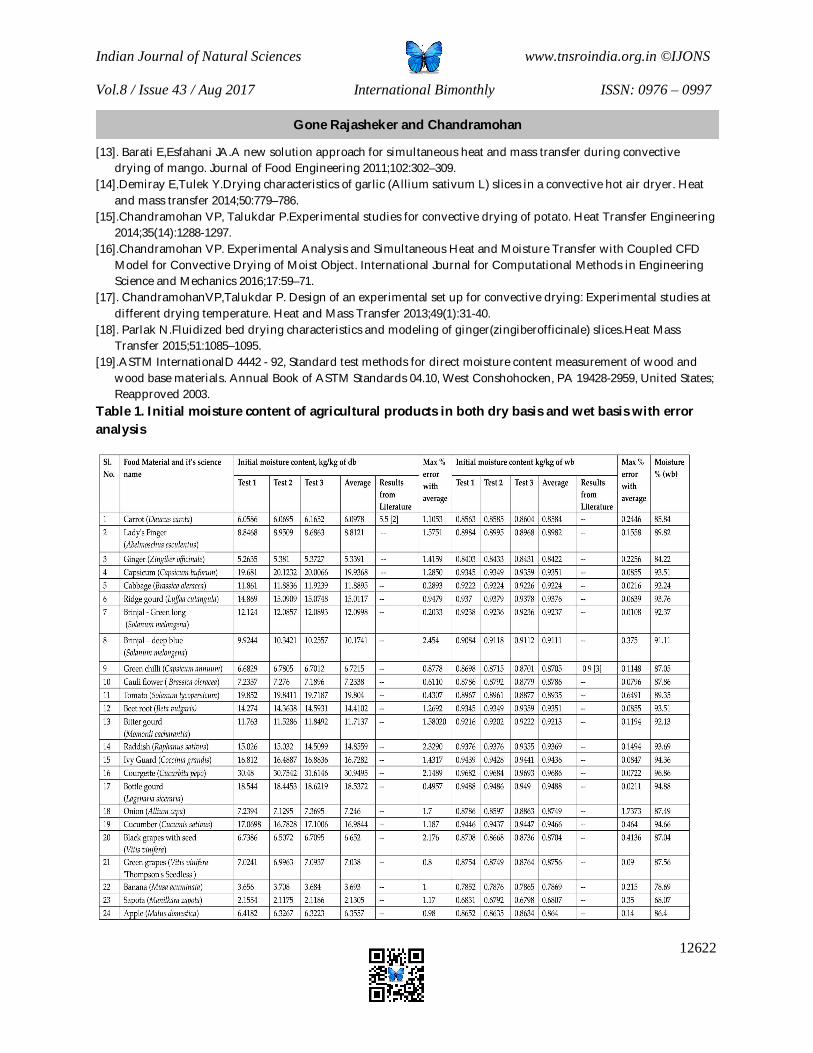
Indian Journal of Natural Sciences www.tnsroindia.org.in ©IJONS Vol.8 / Issue 43 / Aug 2017 International Bimonthly ISSN: 0976 – 0997
12622
[13]. Barati E,Esfahani JA.A new solution approach for simultaneous heat and mass transfer during convective drying of mango. Journal of Food Engineering 2011;102:302–309.
[14].Demiray E,Tulek Y.Drying characteristics of garlic (Allium sativum L) slices in a convective hot air dryer. Heat and mass transfer 2014;50:779–786.
[15].Chandramohan VP, Talukdar P.Experimental studies for convective drying of potato. Heat Transfer Engineering 2014;35(14):1288-1297.
[16].Chandramohan VP. Experimental Analysis and Simultaneous Heat and Moisture Transfer with Coupled CFD Model for Convective Drying of Moist Object. International Journal for Computational Methods in Engineering Science and Mechanics 2016;17:59–71.
[17]. ChandramohanVP,Talukdar P. Design of an experimental set up for convective drying: Experimental studies at different drying temperature. Heat and Mass Transfer 2013;49(1):31-40.
[18]. Parlak N.Fluidized bed drying characteristics and modeling of ginger(zingiberofficinale) slices.Heat Mass Transfer 2015;51:1085–1095.
[19].ASTM InternationalD 4442 - 92, Standard test methods for direct moisture content measurement of wood and wood base materials. Annual Book of ASTM Standards 04.10, West Conshohocken, PA 19428-2959, United States; Reapproved 2003.
Table 1. Initial moisture content of agricultural products in both dry basis and wet basis with error analysis
Gone Rajasheker and Chandramohan

Indian Journal of Natural Sciences www.tnsroindia.org.in ©IJONS Vol.8 / Issue 43 / Aug 2017 International Bimonthly ISSN: 0976 – 0997
12623
Resumption of Ovarian Cyclical Activity in Post-partum Malabari Goats by Trans-Rectal Ultrasonography and Serum Progesterone Assay Neethu M.1*, Leeba Chacko2, K.Promod2, Hiron M. Harshan2 and Shynu M.3
1MVSc scholar, Department of Animal Reproduction, Gynaecology and Obstetrics, College of Veterinary and Animal Sciences, Pookode,Wayanad 673576, Kerala,India. 2Assistant Professor, Department of Animal Reproduction, Gynaecology and Obstetrics, College of Veterinary and Animal Sciences, Pookode, Wayanad 673576, Kerala,India. 3Assistant Professor, Department of Veterinary Biochemistry, College of Veterinary and Animal Sciences, Mannuthy, Thrissur, Kerala-680651, India. Received: 20 June 2017 Revised: 13 July 2017 Accepted: 25 July 2017 *Address for correspondence Dr.Neethu M, M.V.Sc. Scholar, Department of Animal Reproduction, Gynaecology and Obstetrics, College of Veterinary and Animal Sciences, Kerala Veterinary and Animal Sciences University, Pookode, Wayanad – 673576,Kerala,India. Email: [email protected]
This is an Open Access Journal / article distributed under the terms of the Creative Commons Attribution License (CC BY-NC-ND 3.0) which permits unrestricted use, distribution, and reproduction in any medium, provided the original work is properly cited. All rights reserved. The ovarian functional status during the post-partum period in Malabari goats were studied using ultrasonography and serum progesterone profiling to assess the normal period of post-partum resumption of ovarian cyclical activity.Twelve healthy does were monitored by ultrasound examination using B-mode ultrasound machine with a multi frequency 5-10 MHz trans-rectal probe on day 3, 6, 9, 12, 15, 20, 25, 30, 35 and 40 post-partum and the blood samples were collected on day 9, 20, 30 and 40 post-partum and serum were separated and stored under -20°C until the day of estimation. The estimation of serum progesterone was done using competitive ELISA. Thepost-partum resumption of ovarian cyclical activity was detected in 33.33 per cent animals using ultrasonography and in 58.33 per cent animals using serum progesterone profiling within the period of study. The resumption of ovarian cyclical activity was not found to be associated with behavioural oestrum.
Keywords: post-partum,resumption, ovarian activity, ultrasonography, serum progesterone profile.
ABSTRACT
RESEARCH ARTICLE

Indian Journal of Natural Sciences www.tnsroindia.org.in ©IJONS Vol.8 / Issue 43 / Aug 2017 International Bimonthly ISSN: 0976 – 0997
12624
INTRODUCTION
Malabari goats are the indigenous breed of Kerala which arerenowned for meat purpose, high prolificacy (Asha, A. and Naicy, T. 2012), and well-adaptation to the tropical climate of Kerala. Small group holdings of Malabari goats are seen throughout the state than large flocks. Understanding the importance of this native breed to conservethe breed potential and thus contributing to the state economy is demanding. For obtaining optimum reproductive efficiency we should ensure three kidding in twoyears. Post-partum period is crucial in reproduction as it involves the involution process of uterus and resumption of ovarian cyclical activity, which are the two important factors determining the future fertility. Normal post-partum uterine involution, early resumption of ovarian activity and oestrus, short inter-kidding interval and absence of puerperal reproductive complications like retention of placenta, metritis, etc. are the key factors to achieve optimum reproductive potential. The functional status of the ovary, the presence and growth of various ovarian structures like follicles and corpus luteum, based on the difference in echogenicity can also be studied by ultrasonography (Vinoleset al., 2004). Estimation of progesterone in serum during the post-partum period also helps to correlate the ultrasonographic study for the presence of corpus luteum that in turn reflects the ovarian activity.The progesterone in serum is considered as one of the most important parameter to determine the reproductive status (Zarkawi and Soukouti, 2001).The follicular development observed during the early post-partum period usually do not reach ovulatory size and get atrophied. This shows that the resumption of ovarian cyclical activity is not always associated with behavioural oestrus and ovulation. It is also observed that the first post-partum oestrous cycle is having abnormal cycle length and is often anovulatory. So the imaging of the corpus luteum along with serum progesterone estimation is necessary for assessing the resumption of ovarian cyclical activity.
MATERIALS AND METHODS Twelve healthy post-partum Malabari goats with parity between two to five and without any post-partum complications were selected for the study and the study was started from day 3 after kidding.The study was conducted at the Sheep and Goat Farm under the Instructional Livestock Farm Complex, College of Veterinary and Animal Sciences, Pookode. The suckling was allowed and the bucks were housed in separate pens in the same goat farm. Ultrasonographic examination of the ovaries Resumption of ovarian activitywas monitored by ultrasound examination using B-mode ultrasound machine (My Lab Vet Gold ®, Esaote Pie Medical, Genova, Italy) with a multi frequency 5-10 MHz trans-rectal probe on day 3, 6, 9, 12, 15, 20, 25, 30, 35 and 40 post-partumfor detecting the presence of corpus luteum. CL could be visualised as round or oval homogeneous hypo-echoicstructure compared to echogenic ovarian stroma. Serum progesterone profile Blood collection Blood samples were collected in sterile serum vacutainers (Pro-coagulation Tube Clot Activator, Labtech Medico Pvt. Ltd. India) on day 9, 20, 30 and 40 post-partum for serum progesterone estimation by ELISA. The blood samples were stored overnight at 5°C and then centrifuged at 1500 rpm for 20 minutes for serum separation. The serum samples were stored in plastic vials at -20°C in deep freezer until analysis.
Neethu et al.

Indian Journal of Natural Sciences www.tnsroindia.org.in ©IJONS Vol.8 / Issue 43 / Aug 2017 International Bimonthly ISSN: 0976 – 0997
12625
The serum progesterone level in the animals were analysed using the commercial ELISA kits. The ELISA kit used in the present study wasSteroidEIA-Progesterone kit(AlkorBio,Inc.).The SteroidEIA-Progesterone kit is an Enzyme Immunoassay (EIA) designed for the quantitative analysis of total progesterone in serum or plasma.The kit consists of 96 wells coated with anti-Progesterone monoclonal antibodies. Analysis of the data The data was compiled and subjected to statistical analysis as per the method ofSnedecor and Cochran (1994). Variation in serum progesterone level in different days post-partum was tested by using Repeated Measures ANOVA followed by post-hoc analysis. Analysis of data was done by using SPSS software Version 21.0. RESULTS AND DISCUSSION Assessment of presence of corpus luteum by trans-rectal ultrasonography
In all the 12 animals under study, corpus luteum was not detected on day 12 post-partum by the trans-rectal ultrasonography. By day 15 post-partum, CL was detected in 8.33% (n=1) animals. By day 25 post-partum, CL was imaged in 16.67% (n=2) animals. By day 30 post-partum, CL was visualised in 25% (n=3) animals. By day 40 post-partum, CL was detected in 33.33% (n=4) animals.Table 1. and Fig.1
The result of resumption of ovarian activity observed in 33.33 per cent of animals withinday 40post-partum was lower than the observations byMascarenhaset al. (1995) who observed in 75 per cent animals with resumption of the ovarian activity between day 20 and 50 post-partum.This lower per cent of detection of CL may be due to the absence of a proper luteal tissue (Takayamaet al., 2010) which was supported by the findings of Kandielet al. (2011) who observed a post-partum ovarian activity in 83.3 per cent animals with a short luteal phase of 5 ± 0.3 days within 70 days post-partum.
In the present study, CL was visualised as hypo-echoic in echo-texture compared to the echogenic ovarian stroma with a round or oval contour.The echogenicity and shape of the CL was similar to the observations of Oritaet al. (2000), Simoes et al. (2005) and Kandiel (2008).
Assessment of presence of corpus luteum by serum progesterone profile
By day nine post-partum, 41.67 per cent (n=5) of animals had serum progesterone concentration more than 1 ng/ml, indicating the resumption of ovarian activity. By day 30 post-partum, 58.33 per cent (n=7) of animals resumed ovarian cyclicity (Table 2).
Mean (Mean ± SE) serum progesterone concentration (ng/ml) of 12 animals in day 9, 20, 30 and 40 post-partum were 0.76 ± 0.152, 0.53 ± 0.153, 0.73 ± 0.167 and 0.51 ± 0.140, respectively. The statistical analysis of the data revealed that there was no significant difference (p0.01) in the mean serum progesterone concentration (ng/ml) of 12 animals between days examined.By the end of the study period (day 40 post-partum), 58.33 per cent (n=7) of animals were shown with resumption of ovarian cyclicity. But in five animals (41.67 per cent) the concentration remained less than 1 ng/ml throughout the period of examination considered as having no resumption of the ovarian activity.Fig 2 and 3.
KatongoleandGombe (1985) considered 3 ng/ml as the baseline progesterone level in serum and observed the plasma progesterone levels remained below 3 ng/ml for five to eight monthsduringpost-partum. Llewelynet al. (1992) described the plasma progesterone > 2.0 ng/ml after post-partum as the onset of ovarian cyclicity. Khanum et al. (2007) in goats and Mitchell et al. (1998)and Medan and EL-Daek (2015) in ewesconsideredthe resumption of ovarian activity with level >1 ng/ml whileMascarenhaset al. (1995) andRubianeset al. (1995) consideredwith level > 0.5 ng/ml. Mbayahagaet al. (1998) measured 0.4 ng/ml as the baseline concentration.
Neethu et al.

Indian Journal of Natural Sciences www.tnsroindia.org.in ©IJONS Vol.8 / Issue 43 / Aug 2017 International Bimonthly ISSN: 0976 – 0997
12626
The maximum concentration of serum progesterone noticed in the present study was 2.05 ng/ml and this lower concentration may be due to the absence of a proper luteal tissue (Takayamaet al.,2010 and Kandielet al.,2011). A short luteal phase was observed in the case of low serum progesterone concentration (Rubianeset al., 1995 and Mbayahagaet al., 1998).Al-Hozabet al. (1999), Kawu (2007), Mondal (2013) andBadawiet al. (2014) stated that the serum progesterone remained at low level throughout a one month period study.
In the present study, the plasma progesterone concentration began to rise much earlier before the onset of behavioural oestrus which is similar to the findings of Telebet al. (2003).
ACKNOWLEDGEMENTS
The authors gratefully acknowledge Dr. Prejit, Assistant Professor, Department of Veterinary Public Health and Dr. Lijo John, Assistant Professor, Department of Veterinary Biochemistry, for their support during the serum progesterone profiling and the Kerala Veterinary and Animal Sciences University for providing research grants and facilities to carry out this work.
REFERENCES
1. Asha A, Naicy T. Role of fecundity genes in prolificacy of small ruminants. J.Indian. Vet. Assoc., Kerala. 2012;10(3): 34-35.
2. Vinoles C, Meikle A, Forsberg M. Accuracy of evaluation of ovarian structures by transrectal ultrasonography in ewes.Anim. Reprod. Sci. 2004; 80: 69–79.
3. Zarkawi M, Soukouti A. Serum progesterone level using radioimmunoassay during oestrus cycle of indigenous Damascus does. N. Z. J. Agric. Res. 2001; 44: 165-169.
4. Snedecor GW, Cochran WG. Statistical methods. (8th Ed). Iowa State University Press, USA. 1994. 5. Mascarenhas R, Nunes AS, Silva JR. Cyclic reproductive activity and efficiency of reproduction in Serrana goats.
Anim. Reprod. Sci. 1995; 38: 223-229. 6. Rubianes E, Ungerfeld R, Vifroles C, Carbajal B, de Castro T, D' lbarra. Uterine involution time and ovarian
activity in weaned and suckling ewes. Can. J. Anim. Sci. 1995; 76: 153-155. 7. Takayama H, Tanaka T, Kamomae H.Postpartum ovarian activity and uterine involution in non-seasonal Shiba
goats, with or without nursing. Small Ruminant Res.2010;88: 62–66. 8. Kandiel MMM, Watanabe G, Abou El-Roos MEA, El Azab AI, Abdel-Ghaffar AE, Sosa GA, Li JY, Manabe N,
Taya K. Ovarian follicular dynamics and concentrations of ovarian and pituitary hormones during the periovulatory phase of the postpartum goats. J. Benha. Vet. Med.2011; 1: 7-13.
9. Orita J, Tanaka T, Kamomae H, Kaneda Y. Ultrasonographic observation of follicular and luteal dynamics during the estrous cycle in Shiba goats. J. Reprod. Dev. 2000; 46(1): 31-37.
10. Simoes J, Potes J, Azevedo J, Almeida JC, Fontes P, Baril G, Mascarenhas R. Morphometry of ovarian structures by transrectal ultrasonography in Serrana goats. Anim. Reprod. Sci. 2005; 85: 263–273.
11. Katongole CB, Gombe S. In: Wilson, R.T. and Bourzat, D, editors. A study of the reproductive hormones of indigenous goats in Uganda. Ethiopia; 1985. p. 3-11.
12. Llewelyn CA, OgaaJS, Obwolo MJ. Plasma progesterone concentrations during pregnancy and pseudopregnancy and onset of ovarian activity postpartum in indigenous goats in Zimbabwe. Trop. Anim. Hlth. Prod. 1992; 24: 242-250.
13. Khanum S, Hussain M, Kausar R. Assessment of reproductive parameters in female Dwarf goat (Capra hircus) on the basis of progesterone profiles. Anim. Reprod. Sci. 2007; 102: 267–275.
14. Mitchell LM, King ME, Gebbie FE, Ranilla MJ, Robinson JJ. Resumption of oestrous and ovarian cyclicity during the postpartum period in autumn-lambing ewes is not influenced by age or dietary protein content. Anim. Sci. 1998; 67: 65 – 72.
Neethu et al.

Indian Journal of Natural Sciences www.tnsroindia.org.in ©IJONS Vol.8 / Issue 43 / Aug 2017 International Bimonthly ISSN: 0976 – 0997
12627
15. Medan MS, EL-Daek T. Uterine involution and progesterone level during the postpartum period in Barbary ewes in north Libya. Open Vet. J.Vol. 2015; 5(1): 18-22.N
16. Mbayahaga J, MandikiSNM, Bister JL, PaquayR. Body weight, oestrous and ovarian activity in localBurundian ewes and goats after parturition in thedry season. Anim. Reprod. Sci. 1998;51:289–300.
17. Al-Hozab A, Salem HAH, Amer HA. Postpartum levels of serum progesterone, oestrogen, prolactin, and thyroxine in native Zomri goat of Saudi Arabia.Pak. Vet. J. 1999; 19(1): 32-34.
18. Kawu M, Eduvie L, Lakpini L, Ayo J. Peripheral serum progesterone profile in multiparous Nigerian Red Sokoto goats between day one and 30 postpartum.Vet. Arch. 2007;77(6): 543-550.
19. Mondal S, Minj A, Pathak MC, Singh DN, Varshney VP. Importance of hormonal changes during the periparturition period in black Bengal goats. Int. J. Clin.Exp. Physiol. 2014; 1 (1): 20-25.
20. BadawiME, MakawiSEA, AbdelghafarRM, IbrahimMT.Assessment of postpartum uterine involution and progesterone profile in Nubian goats.J. Adv. Vet. Anim. Res. 2014; 1(2): 36-41.
21. Teleb DF, Gabr MK, Gaafar KM. Manipulation of lactation and suckling on the resumption of postpartum reproductive activity in Damascus goats. Small Ruminant Res. 2003;49: 183–192.
Table 1.Animals Resumed Ovarian Activity by Detecting the Presence of CL by Trans-Rectal Ultrasonography
Days post-partum Number of animals Per cent 3 6 9 12 15 20 25 30 35 40
0 0 0 0 1 1 2 3 3 4
0.00 0.00 0.00 0.00 8.33 8.33
16.67 25.00 25.00 33.33
Table 2.Animals Resumed Ovarian Activity Assessed by Serum Progesterone Profile (>1 ng/ml)
Days post-partum Number of animals Per cent 9
20 30 40
5 5 7 7
41.67 41.67 58.33 58.33
Neethu et al.

Indian Journal of Natural Sciences www.tnsroindia.org.in ©IJONS Vol.8 / Issue 43 / Aug 2017 International Bimonthly ISSN: 0976 – 0997
12628
Fig 1.Ultrasonographic image of corpus luteum observed on day 30 post-partum
Fig 2.Serum progesterone profile (ng/ml) of animals resumed ovarian activity (>1 ng/ml)
Fig 3.Serum progesterone profile (ng/ml) of animals not resumed ovarian activity (<1 ng/ml)
Neethu et al.

Indian Journal of Natural Sciences www.tnsroindia.org.in ©IJONS Vol.8 / Issue 43 / Aug 2017 International Bimonthly ISSN: 0976 – 0997
12629
Physical Characteristics of Lochial Discharge in Post-Partum Vechur Cows M.S.Meenuja1*, C.P. Abdul Azeez2, K. Promod2, K.Magnus Paul3 and Bindya Liz Abraham4
1Post graduate Scholar, Department of Animal Reproduction, Gynaecology and Obstetrics, College of Veterinary and Animal Sciences, Pookode, Wayanad, Kerala- 673576,India. 2Assistant Professor, Department of Animal Reproduction, Gynaecology and Obstetrics, College of Veterinary and Animal Sciences, Pookode, Wayanad, Kerala- 673576, India. 3Assistant Professor, Department of Animal Reproduction, Gynaecology and Obstetrics, College of Veterinary and Animal Sciences, Mannuthy, Thrissur, Kerala- 680 651, India. 4Assistant Professor, Department of Animal Breeding and Genetics, Mannuthy, Thrissur, Kerala- 680 651 India.
Received: 07 June 2017 Revised: 18 July 2017 Accepted: 27 July 2017 *Address for correspondence Dr. Meenuja M.S. Post graduate scholar, Department of Animal Reproduction, Gynaecology and Obstetrics, College of Veterinary and Animal Sciences, Kerala Veterinary and Animal Sciences University, Pookode,Wayanad, Kerala- 673576,India. Email- [email protected]
This is an Open Access Journal / article distributed under the terms of the Creative Commons Attribution License (CC BY-NC-ND 3.0) which permits unrestricted use, distribution, and reproduction in any medium, provided the original work is properly cited. All rights reserved. The present study was conducted to evaluate the physical characteristics of lochial discharge in Vechur cows. The study was conducted in eight post-partum Vechur cows that had a normal calving history without any puerperal complications.As per the characteristics of lochial discharge collected per-vaginally, it was graded as reddish brown moderately thick mucus discharge, off-white thick mucus discharge, light brown thin mucus discharge and clear transparent thick mucus discharge.Mean volume of lochial discharge was 93. 63 ± 11.355 ml with a range of 51 ml to 140 ml. Lochial discharge was observed in Vechur cows for 5.63 ± 0.375 days. Lochial discharge of all the animals was found to have neutral or non-foetid odour. This difference in the physical characteristics of lochial discharge when compared to other studies may be due to the breed difference, small size of the animal and its genitalia. Keywords: Lochial discharge, Vechur cows, Physical characteristics, Post-partum.
ABSTRACT
RESEARCH ARTICLE

Indian Journal of Natural Sciences www.tnsroindia.org.in ©IJONS Vol.8 / Issue 43 / Aug 2017 International Bimonthly ISSN: 0976 – 0997
12630
INTRODUCTION Post-partum period is a crucial time during which many physiological and endocrinological events crop up to establish future fertility of the animal. Puerperium of a cow experiences various processes like uterine involution, ovarian rebound, regeneration of endometrium and elimination of bacterial content from the reproductive tract. Disorders in the puerperal period will affect the future fertility of the animal. Uterine lochia is a normal physiological discharge consisting of necrosed caruncles, foetal blood and foetal fluids which is expelled during the uterine involution (Dhaliwalet al., 2001; Sheldon, 2004).Infection of the post-partum uterusresults the lochia to assumemucopurulent (Shwetha, 2016) thereby, disturbing the fertilityandintercalving interval of the animals. Knowledge in the normal physical characteristics of lochial discharge of an animal is desirable to predict the future reproductive status of the animal. So that, necessary interventions can be adopted to augment fertility. Vechur is the only recognised indigenous dwarf cattle breed from the Kerala state, India and is included in the critically maintained breed list (Scherf, 2000). Disease resistance, heat tolerance, adaptability to locally available feeds, the presence of high milk fat with small fat globules, usage of milk and urine in Ayurvedic medicines created a huge demand of this particular breed of cattle in the state (Iype, 2013; Bindya and Chinchu, 2016). No post-partum studies have been reported in this cattle breed to date. Thus this is a novel study in post-partum Vechur cows to assess the physical characteristics of lochial discharge.
MATERIALS AND METHODS The study was conducted in eight post-partum Vechur cows having parity between two to five maintained at the Vechur conservation unit of Kerala Veterinary and Animal Sciences University, Pookode (11.6854° N, 76.1320° E) during the period of August 2016 to June 2017. The cows studied were maintained at semi-intensive system of rearing and the cows were suckled by the calves.Per-rectal examinations were conducted to ensure uterine size, location and for the characteristics of lochial discharge from the day one post-partum till the cessation of the lochial discharge. Lochial discharge from the cows were collected per-vaginally using gloved hands(Sautet al., 2011)to assess the colour, consistency, volume and odour. Volume of lochial discharge was assessed after collecting in graduated containers. Consistency of the discharge was graded according to the presence of mucus as scanty, thin mucus, moderately thick mucus and thick mucus. Odour of the lochia was graded as neutral or no fetid odour and fetid odour.Statistical analysis of the data was analysed using descriptive statistics method by IBM-SPSS software (Snedecor and Cochran, 1994). RESULTS Characteristics of lochial discharge during first eight post-partum days in Vechur cowsare presented in the Table 1. and Fig 1.Lochial discharge in the post-partum Vechur cows wereobserved for mean days 5.63 ± 0.375 with a range from four to seven days. Presence of lochial discharge was observed in all the animals for the first four days of post-partum which later on decreased to 87.5, 50 and 25per cent on 5, 6, and 7 days post-partum, respectively and from eighth day post-partum onwards, the discharge became scanty or nil. Lochial discharge could not be observed externally in standing cows and hence the collection of the same was done per-vaginally. Colour Reddish brown lochial discharge was observed in all the cows (8/8) (Plate 1 (A)) on first day post-partum. On second day post-partum the lochial discharge was having off-white colour with necrosed tissue and blood stains (Plate 1 (B))in 50 per cent(4/8) of the cows which later on increased to 62.5 per cent (5/8) on third day post-partum. The colour of the lochia in 37.5 per cent (3/8) of the Vechur cows on third day was light brown (Plate 1(C)). Lochial discharge on
Meenuja et al.

Indian Journal of Natural Sciences www.tnsroindia.org.in ©IJONS Vol.8 / Issue 43 / Aug 2017 International Bimonthly ISSN: 0976 – 0997
12631
the fourth day post-partum was off-white, light brown and clear mucoid in 25 (2/8), 50 (4/8) and 25 (2/8) per cent of cows, respectively. On fifth day post-partum cows with light brown, clear and negligible vaginal discharge were 37.5 (3/8), 50 (4/8), and 12.5 (1/8) per cent, respectively. Later on, 50(4/8) and 25(2/8) per cent of the total cows examined had clear mucoid discharge (Plate 1(D)) on sixth and seventh day respectively.Vaginal discharge was absent in all other cows. On eighth day post-partum none of the animals had a vaginal discharge. Volume Mean volume of lochial discharge in post-partum Vechur cows was 93.63 ±11.355 mL ranging from 51 mL to 140 mL. Consistency Consistency of the lochial discharge varied between first to eighth day post-partum in the Vechur cows studied. On the initial day of lochial discharge, the consistency was moderately thick muco-haemorraghic which later on became thick with the presence of necrosed tissue and more mucus. Light brown lochial discharge initially had thin mucus content and this became thicker and clearer which later progressed to the final stage of scanty or no mucus. Odour All the Vechur cows observed for the odour of lochial discharge were neutral or without any foetid odour.
DISCUSSION Most of the studies on lochial discharge of cows have been done to assess the abnormal puerperium (Williams et al., 2005; López-Helguera et al., 2012 and Shwetha, 2016) and there is paucity of studies on grading of normal lochial discharge of cows .The duration of the presence of normal lochial discharge in cows is found to be highly variable in different studies. Lochial discharge have been visible as early as immediately after calving and extending upto 12 to 18 days in dairy cows (Sheldon, 2004). However, Shwetha (2016) has observed the presence of lochial discharge upto 20 to 30 days in post-partum Holstein cows. In the present study, presence of lochial discharge was observed in the Vechur cows around a mean of 5.63 ± 0.375 days and ranged from four to seven days. Vechur is an indigenous cattle breed with a very low body size and small genitalia when compared to other dairy cattle of Indian or exotic origin. Hence, shorter duration for the presence of lochia could be attributed to the small size of the breed and its genitalia. Colour The colour of lochial discharge in Vechur cows changed from the initial reddish brown colour to off white colour with necrosed tissue and blood stains indicating the presence of white caruncular pieces and slight haemorrhage. Later, the discharge became less coloured and transformed into a clear mucoid discharge. Shwetha (2016) also observed that, on approaching the disappearance the lochial discharge was clear mucoid. However on tenth day post-partum the author observed an increase in blood content of the discharge. This was not observed during present study which may be attributed to the possibility of decreased haemorrhage and shorter duration of presence of lochial discharge in post-partum Vechur cows. The variation in colour of lochial discharge at different days post-partum was also reported by Noakes (2009) and Sheldon et al. (2011). However Noakes (2009) reported a second cleansing characterised by an increase in fluid and tissue debris content during 7- 10 days post-partum. This was not observed in Vechur cows may be because of the short duration of lochial discharge.
Meenuja et al.

Indian Journal of Natural Sciences www.tnsroindia.org.in ©IJONS Vol.8 / Issue 43 / Aug 2017 International Bimonthly ISSN: 0976 – 0997
12632
Volume Mean volume of lochial discharge in post-partum Vechur cows were 93.63 ±11.355 mL with a range of 51 mL to 140 mL. None of the cows were observed to have a lochial discharge while standing. Lochial discharge was observed on per-rectal palpation. The mean volume of lochial discharge in Vechur was found to be much lower than the earlier reports of Roberts (1972) and Sane (1994). According to Roberts (1972) the amount of lochia in primipara dairy cows was about nil to 50 mL and in pluripara, it was about 800 to 2000 mL. Sane (1994) observed that the amount of lochial discharge in dairy cows were about 1400 to 1600 mL during first 48 hours after parturition and decreased later on. The decreased volume of lochia in Vechur cows may be due to its small body size and smaller genitalia when compared to other dairy breeds. Consistency Consistency of the lochial discharge was graded according to the content of mucus. A moderately thick mucus discharge was observed on day one post-partum in Vechur cows and this became more mucoid in the later days. Sautet al (2011) observed muco-haemorrhagic lochial discharge on day three post-partum. The blood content in the lochial discharge was very less when compared to other crossbred and exotic dairy cows. This may be due to less haemorrhage from caruncular region. The clear mucoid discharge prior to disappearance of the lochia was in agreement with the observations of Shwetha (2016). Odour The odour of the post-partum vaginal discharge in Vechur cows was neutral or no foetid odour. This finding was in agreement with the observations of Sautet al. (2011) and Shwetha (2016). Foetid odour of the post-partum vaginal discharge post-partum has been reported to be an indication of uterine infections (Dolezelet al., 2008). The present study was conducted in cows having normal puerperium, and this might be the reason for the non-foetid or neutral odour of the lochia.
CONCLUSION In the present study, Vechur cows were observed to have lochial discharge for short interval of days with less volume, cellular debris and blood content compared to the observations in exotic, crossbred or other indigenous cattle breeds. Second cleansing was not observed in Vechur cows studied. The reduced volume and difference in consistency may be due to the breed difference and smaller size of the genitalia.
REFERENCES 1. Bindya LA, and ChinchuPC. Evaluation of the compositional quality and mineral profiling of milk of desi cattle
of Kerala. In: Compendium, National Seminar on Green Economics and Desi Cow; 26th to 28th May, Kottayam, C.M.S., College. pp. 2016; pp.88- 89.
2. Dhaliwal GS, MurrayRD, and WoldehiwetZ.Some aspects of immunology of the bovine uterus related to treatments for endometritis. Anim. Reprod.Sci. 2001; 67: 135- 152.
3. Dolezel R, Vecera M, Palenik T, CechS, and Vyskocil M. Systematic clinical examination of early postpartum cows and treatment of puerperal metritis did not have any beneficial effect on subsequent reproductive performance. Vet. Med. 2008;53: 59–69.
4. IypeS.Vechur cattle – from extinction to sustainability.Anim. Genet. Res.2013;52: 105–110.
Meenuja et al.

Indian Journal of Natural Sciences www.tnsroindia.org.in ©IJONS Vol.8 / Issue 43 / Aug 2017 International Bimonthly ISSN: 0976 – 0997
12633
5. López-Helguera I, López-GatiusF and Garcia-Ispierto I. The influence of genital tract status in postpartum period on the subsequent reproductive performance in high producing dairy cows.Theriogenology.2012; 77: 1334–1342.
6. Noakes DE. The puerperium. In: Noakes DE, Parkinson TJ,and Gary CWE, editors. Veterinary Reproduction and Obstetrics.9th ed, W.B. Saunders, Philadelphia;2009; pp. 194- 201.
7. Roberts SJ. Veterinary Obstetrics and Genital Diseases. 2nded, CBS Publishers; 1971, pp.210. 8. Sane CR, Involution of uterus. Sane CR, Deshpande BR, Kaikini AS, Velhankar DP, Luktuke SN and Deopurkar
VL, editors. Reproduction in farm animals (Theriogenology)2nd ed. Varghese Publishing House.1994;pp.53-57. 9. Saut JPE, Oliveira RSR, Martins CFG, Moura ARF, Tsuruta SA, Nasciutti NR, dos Santos RM and Headley SA.
Clinical observations of postpartum uterine involution in crossbred dairy cows.Vet. Not. 2011; 17: 16-25. 10. ScherfBD.World watch list for domestic animal diversity. 3rded.FAO, Rome.2000. pp. 122 11. Shwetha, K. S. Studies on the course and characteristics of uterine involution following retention of fetal
membranes in dairy cows. M.V.Sc. thesis.Karnataka Veterinary, Animal and Fisheries Sciences University, Bidar.2016; 155p.
12. Snedecor GW, Cochran WG. Statistical methods. 8th ed., Iowa state University Press, Ames, Iowa, USA.1994; 539p.
13. Williams, E.J., Fischer, D.P., Pfeiffer, D.U., England, G.C.W., Noakes, D.E., Dobson, H and Sheldon, H.I. Clinical evaluation of postpartum vaginal mucus reflects uterine bacterial infection and the immune response in cattle. Theriogenology.2005; 63: 102–117.
A B C D
Plate 1. Characteristics of lochial discharge during first eight post-partum days in Vechur cows (A) Reddish brown moderately thick mucus discharge (B) Off-white thick mucus discharge (C) Light brown thin mucus
discharge (D) Clear transparent thick mucus discharge.
Meenuja et al.

Indian Journal of Natural Sciences www.tnsroindia.org.in ©IJONS Vol.8 / Issue 43 / Aug 2017 International Bimonthly ISSN: 0976 – 0997
12634
Table 1. Characteristics of lochial discharge during first eight post-partum days in Vechur cows (n=8)
R- Reddish brown moderately thick mucus discharge O- Off-white thick mucus discharge L- Light brown thin mucus discharge T- Clear transparent thick mucus discharge N- Absence of or scanty lochial discharge
Fig. 1.Characteristics of lochial discharge during first eight post-partum days of Vechur cows (n=8)
Nature of lochia
Per cent of Vechur cows observed with characteristic lochial discharge from day 1 to day 8 post-partum Day 1(%) Day 2(%) Day 3(%) Day 4(%) Day 5(%) Day 6(%) Day 7(%) Day 8(%)
R 100 (8/8) 50 (4/8) 0 (0/8) 0 (0/8) 0 (0/8) 0 (0/8) 0 (0/8) 0 (0/8) O 0 (0/8) 50 (4/8) 62.5 (5/8) 25 (2/8) 0 (0/8) 0 (0/8) 0 (0/8) 0 (0/8) L 0 (0/8) 0 (0/8) 37.5 (3/8) 50 (4/8) 37.5 (3/8) 0 (0/8) 0 (0/8) 0 (0/8) T 0 (0/8) 0 (0/8) 0 (0/8) 25 (2/8) 50 (4/8) 50 (4/8) 25 (2/8) 0 (0/8) N 0 (0/8) 0 (0/8) 0 (0/8) 0 (0/8) 12.5 (1/8) 50 (4/8) 75 (6/8) 100 (8/8)
Meenuja et al.

Indian Journal of Natural Sciences www.tnsroindia.org.in ©IJONS Vol.8 / Issue 43 / Aug 2017 International Bimonthly ISSN: 0976 – 0997
12635
Assessment of Spatial Variability in Soil Properties of Arumbanur Tank Command of Madurai through GIS Technique Indirani.R1*, V.E.Nethaji Mariappan 3 and M.Anbarasu1
1Department of Soils and Environment, Agricultural College and Research Institute, Madurai -625 104 2Department of Agronomy, Agricultural College and Research Institute, Madurai -625 104,T.N.,India. 3Sathyabama University, Chennai, T.N.,India. Received: 19 June 2017 Revised: 13 July 2017 Accepted: 25 July 2017 *Address for correspondence Indirani.R Department of Soils and Environment, Agricultural College and Research Institute, Madurai -625 104, TamilNadu,India. Email: [email protected]
This is an Open Access Journal / article distributed under the terms of the Creative Commons Attribution License (CC BY-NC-ND 3.0) which permits unrestricted use, distribution, and reproduction in any medium, provided the original work is properly cited. All rights reserved. The demand of water resources is increasing due to rapid increase in density of populations, fast urbanization, industrialization and agriculture.Therefore, the area under agriculture rapidly shrinking and the available soil resources have to be utilized properly to get desirable yield in crops. Filling up of system tank depends on the adequate storage in the Periyar Vaigai Command (PVC) area reservoirs and its time of release of irrigation water according to the prevailing climate and mechanical properties of tank bed and tank command has also got an influence on filling up of system tank and coverage of area. Soil properties are altered over time due to various reasons. Cultivation results in losses of organic matter to the extent of 20% after 35 years on all soils, Bulk density increases by 25 to 58%. The study of spatial and temporal trends in soil properties at a soil quality benchmark site in Central Nova Scotia indicated that over 5 years Organic C, C: N ratio, available P and saturated hydraulic conductivity declined by 7.9, 4.7, 12.5 and 53% respectively. The temporal changes in soil properties can be monitored over time using GIS technique. GIS is one of the important tools for integrating and analyzing spatial and temporal data from different sources or disciplines. Present study is carried out in Arumbanur tank command of Periyar Main Canal (PMC) using GIS. Therefore this research is taken up with the following objectives i) Collection of basic data of the study area through various sources and collection of soil samples ii) Assessment of temporal changes in soil properties and interpretation through GIS. Keywords: Periyar Vaigai Command, Arumbanur tank command, industrialization, GIS technique.
ABSTRACT
RESEARCH ARTICLE

Indian Journal of Natural Sciences www.tnsroindia.org.in ©IJONS Vol.8 / Issue 43 / Aug 2017 International Bimonthly ISSN: 0976 – 0997
12636
INTRODUCTION
The demand of water resources is increasing due to rapid increase in density of populations, fast urbanization, industrialization and agriculture. Therefore, the area under agriculture rapidly shrinking and the available soil resources have to be utilized properly to get desirable yield in crops. Filling up of system tank depends on the adequate storage in the Periyar Vaigai Command (PVC) area reservoirs and its time of release of irrigation water according to the prevailing climate and mechanical properties of tank bed and tank command has also got an influence on filling up of system tank and coverage of area. Soil properties are altered over time due to various reasons. The continuous use of fertilizers and manures in the intensive cropping system has resulted in the depletion of nutrients from the soil reserves (Dhane and Shukla, 1995). Application of fertilizers by the farmers without prior knowledge on soil fertility status may result in adverse effect on soils and crops; both in terms of nutrient deficiency and toxicity either by the inadequate or overuse of fertilizers. In the past, the sampling was done by random method and scanty attention was paid to collect the georeferenced soil sample. In this context, soil testing provides information regarding nutrient availability in soils, which forms the basis for the fertilizer recommendations for maximizing the crop yields. GPS and GIS helps in collecting a systematic set of georeferenced samples and generating spatial data about the distribution of nutrients (Sharma, 2004). In the present study, an attempt has been made to evaluate the soil fertility status and their spatial variability in Arumbanur tank command of Periyar Vaigai Command area. MATERIALS AND METHODS Study area The study is carried out in a system tank at Arumbanur village of Madurai district coming under Periyar Vaigai Command. The Arumbanur village is located in Madurai East Taluk in Madurai District of Tamil Nadu State, India. It is located 12 km towards East from District headquarters Madurai and 13 km from Madurai East. The source of water supply for the Arumbanur tank is 10L (units) of the 8th branch canal of Periyar Main Canal (PMC).The command under the sluice covers both Arumbanur and Pudhur villages of Madurai in the state of Tamil Nadu. The predominant crop under cultivation in the tank command is rice. Collection and analysis of soil samples A rapid field survey was undertaken to assess the nature of land or the topography of the Arumbanur tank command. An extensive field samples points were identified based on the topology or lie of the land. A GPS was used to mark the locations of the Ground Control Points were soil are planned to collect. After the field survey all the GPS points were potted on the map the ascertain the feasibility of sample collection spatially. Later a regular field survey was taken up to collect surface soil within the command area. Surface (0-15cm) soil samples from 100 locations were collected at random from the command area. The coordinates of the sampling locations were recorded using hand held GPS (Global Positioning System). Soil samples were processed and sieved through 2 mm sieve (0.2 mm sieve for organic carbon), labeled and stored. The samples were analysed for pH and EC (Jackson, 1973), organic carbon (Walkley and Black, 1934), available N (Subbiah and Asija, 1956), available P (Olsen et al.,1954; Bray and Kurtz,1945), available K (Stanford and English, 1949), and available Zn, Fe, Cu, and Mn (Lindsay and Norvell, 1978) and. The analytical results of each soil sample was categorized as low, medium and high for organic carbon (OC) and macronutrients; as deficient, moderate and sufficient based on the critical limits for micronutrients as followed in Tamil Nadu.
Indirani et al.

Indian Journal of Natural Sciences www.tnsroindia.org.in ©IJONS Vol.8 / Issue 43 / Aug 2017 International Bimonthly ISSN: 0976 – 0997
12637
Generation of thematic soil fertility maps Database on soil available nutrient status was generated in Microsoft Excel package at TNAU. Preparation of soil fertility maps using GIS: A dbf file consisting of data for X and Y coordinate in respect of sampling location is created. A shape file (vector data) showing the outline of the Arumbanur tank command was created in Arc view 10.1. The database soil sample points marked using GPS were fed into the GIS environment in digitized map of Arumbanur command.Values of different parameters (pH, EC, OC, available N, P, K and micronutrients) were tagged with corresponding points and interpolation maps for each individual parameter were prepared using GIS software.The maps so generated for all the parameters were later classified, taking the ranges for different parameters. GIS software was also used to estimate the area falling under different classes of available nutrients.
RESULTS AND DISCUSSION Spatial distribution of available macro and micronutrients soil organic carbon, soil reaction and electrical conductivity Soil reaction, Electrical Conductivity and Organic carbon The soils of the tank command in general were neutral to alkaline in reaction. The soil pH varied from 6.9 to 9.03 with a mean value of 8.04 and was classified (in) as four categories such as slightly acidic, neutral, slightly alkaline and alkaline. 1.88, 20.75,47.16 and 30.18 per cent soils were in the pH category of 5.5-6.5, 6.5-7.5,7.5-8.5 and more than 8.5 respectively(Table 1). The electrical conductivity recorded was in the range of 0.15 to 0.73dSm-1with an average of 0.35 dSm-1. None of the samples recorded EC above 2 dSm-1. The organic carbon in these soils ranged from low to medium (0.3 to 1.86%) with an average value of 0.87%. Per cent distribution of samples for organic carbon in range <0.5, 0.5 to 0.75 and >0.75% was 15.09, 20.75 and 62.26% respectively (Table1). In situ application of green manure crops like Theprosia purpurea and green leaf manures might have resulted in buildup of organic matter in the soil (Fig 1-3) which is primarily due to high temperature leading to higher rate of organic matter decomposition and little or no organic matter additions (Rego et al. 2003 and Sharma et al., 2008).The organic carbon status of the soil samples ranged from 0.12 to 2.67 with a mean value of 0.67 Available nitrogen Available nitrogen ranged from 150 to 398 kg/ha with mean value of 289 kg/ha. With regard to per cent distribution 62.26% samples were medium in available N and remaining 37.73% samples tested high in available N status (Table 1). This is attributed to the proper management practices and improved N use efficiency.
Phosphorus Percent distribution of samples in low, medium and high available phosphorus was 16.98, 24.52 and 58.49%, respectively. High available P ppm shows build-up of P in soils. The absence of any deficiency of available P, suggests very liberal use of P fertilizers. Rice crop takes up only 10-15% of applied P during the growing season and the rest remains in soil in the form of less soluble products. The continuous application of phosphatic fertilizers to individual crop results in the positive balance of this nutrient in soil. This results in very low efficiency of applied P. It is therefore, essential to apply soil test based phosphorus application. These results are in confirmation with the findings of Sharma et al. (2008).
Indirani et al.

Indian Journal of Natural Sciences www.tnsroindia.org.in ©IJONS Vol.8 / Issue 43 / Aug 2017 International Bimonthly ISSN: 0976 – 0997
12638
Potassium Less than 2% samples were found to be high in available potassium, 79% low and remaining 19% samples tested medium in available potassium (Table 1). This is taking toll on available potassium status in these soils. The continuous mining of K from the soil reserve over the years, without its replenishment has resulted in, the deficiency of K. This shows that if sufficient quantity of potassium is not added externally there will be potassium mining from the soil. These results are in confirmation with the findings of Bhangu and Sidhu, (1991), Naidu et al. (2011). Micronutrients As per Table 1 per cent distribution of medium and high available iron was 1.8, and 92.47%, respectively. Available Mn was distributed as Low (20.75%) , Medium (26.41%) and high (52.83%) . As for as copper is concerned 75.47% of samples recorded high and 20.75% samples medium in availability. Among the micronutrients the higher per cent in low availability in soil was recorded in case of zinc (56.60 %). The conversion of zinc cations to their oxides or hydroxides at higher pH, which are known to have lower solubility, might be the reason for low zinc status. Increase in pH and decreased with increase in organic carbon, CaCO3, and clay content (Table2). Similar observations were made by Takkar et al. (1977), Sood et al. (2009) and Velu et al. (2008). CONCLUSION The spatial classified maps generated under the study will be useful for identifying specific pockets with different nutrient management problems.The soil fertility maps clearly revealed that, major area of Arumbanur tank command is neutral to alkaline in reaction, non-saline and low to medium in OC; medium, high and low in available N, P and K, respectively. Among the micronutrients, Zn is predominantly deficient. The deficient nutrients have to be restored through chemical fertilizers and/or organic manures to maintain sustainable soil fertility status.
ACKNOWLEDGMENTS The authors gratefully acknowledge the ICAR - AICRP on Irrigation Water Management, Directorate Water Management Research, Bhuvaneshwar, Odhisha for funding and Department of Agronomy, Agricultural College and Research Institute, Tamil Nadu Agricultural University (TNAU), Madurai for permitting the research project and providing facilities to carry out study.
REFERENCES 1. Bhangu, S.S. and Sidhu, P.S. 1991. Potassium mineralogy of five benchmark soils of central Punjab. J. Potassium
Res., 8: 243-245. 2. Bray, R.H. and Kurtz, L.T. 1945. Determination of total, organic and available forms of phosphorus in soils. Soil
Sci., 59: 39-45. 3. Jackson, M.L. 1973. Soil chemical analysis. Prentice hall of India Pvt Ltd., New Delhi. 4. Lindsay, N.L. and Norvell, W.A. 1978. Development of DTPA soil test for zinc, iron, manganese and copper. Soil
Sci.Soc. Am.j., 42: 421-428. 5. Naidu, L.G.K., Ramamurthy, V., Sidhu, G.S. and Dipak Sarkar. 2011. Emerging deficiency of potassium in soils
and crops of India. Karnataka J. Agric.Sci.,24 (1): 12-19. 6. Olsen, S.R., Cole C.V., Watanabe, P.S. and Dean, L.A. 1954. Estimation of available phosphorus in soils by
extraction with sodium bicarbonate. U.S.D.A. Circ., 939.
Indirani et al.

Indian Journal of Natural Sciences www.tnsroindia.org.in ©IJONS Vol.8 / Issue 43 / Aug 2017 International Bimonthly ISSN: 0976 – 0997
12639
7. Rego T J, Rao, V N, Seeling B, Pardhasaradhi, G and Kumar Rao J V D K. 2003. Nutrient balances a guide to improving sorghum and groundnut based dry land cropping systems in semiarid tropical India. Field Crops Res., 81: 53-68.
8. Sharma P K, Sood A, Setia R K, Tur N S, Deepak Mehra and Harpinder Singh .2008. Mapping of Macronutrients in soils of Amritsar District(Punjab) – A GIS Approach. J.Indian Soc. Soil Sci., 56:34-41.
9. Sood, A., Sharma, P.K., Tur, N.S. and Nayyar, V.K. 2009. Micronutrients status and their spatial variability in soils of Muktsar district of Punjab- A GIS approach. J.Indian Soc.Soil Sci., 57(3): 300-306.
10. Stanford, S. and L. English. 1949. Use of Flame photometer in rapid soil test for K and Ca. Agron. J., 41: 446-447. 11. Subbiah, B.V. and G.L. Asija. 1956. A rapid procedure for estimation of available nitrogen in soils. Curr. Sci., 25:
259-260. 12. Takkar, P.N., Nayyar, V.K., Bansal, R.L., Dwivedi, R.S. and Mann, M.S. 1977. Annual progress Report of the ICAR
Coordinated Micronutrient scheme 1976- 77. Punjab Agricultural University, Ludhiana. 13. Velu V, Usha Mathew and Baskar A. 2008. Scenario of Micro and Secondary Nutrient Deficiencies in the states of
Tamil Nadu, Kerala and Pondicherry and Amelioration Practices for increasing Crop Production and Ensuring Food Security. Paper presented in the National Seminar on Micro and Secondary Nutrients for Balanced fertilization and food security held during 11-12 March 2008, pp 29-30.
14. Walkley, A. and Black, I.A. 1934. An examination of soil organic carbon by chromic acid titration method. Soil Sci., 37: 29.
Table 1. Percent soil samples falling in different ranges of organic carbon, NPK.
Properties/nutrient Soil (%) Range of soil properties
Low Medium High Minimum Maximum Average pH - - - 6.38 9.03 8.04
EC (dSm-1) - - 0.15 0.73 0.35 OC (%) 15.09 20.75 62.26 0.34 1.86 0.87
Available nitrogen (kg ha-1) - 62.26 37.73 150 398 289
Available phosphorus(kgha-1)
16.98 24.52 58.49 3 92 30
Available potassium(kgha-1)
28.30 69.81 1.88 60 369 154
Available Fe(ppm) 1.88 5.66 92.45 3.18 51.27 20.34 Available Mn(ppm) 20.75 26.41 52.83 0.08 22.56 4.51 Available Cu(ppm) 3.77 20.75 75.47 0.97 3.13 2.10 Available Zn(ppm) 56.60 28.30 15.09 0.27 3.66 1.20
Indirani et al.
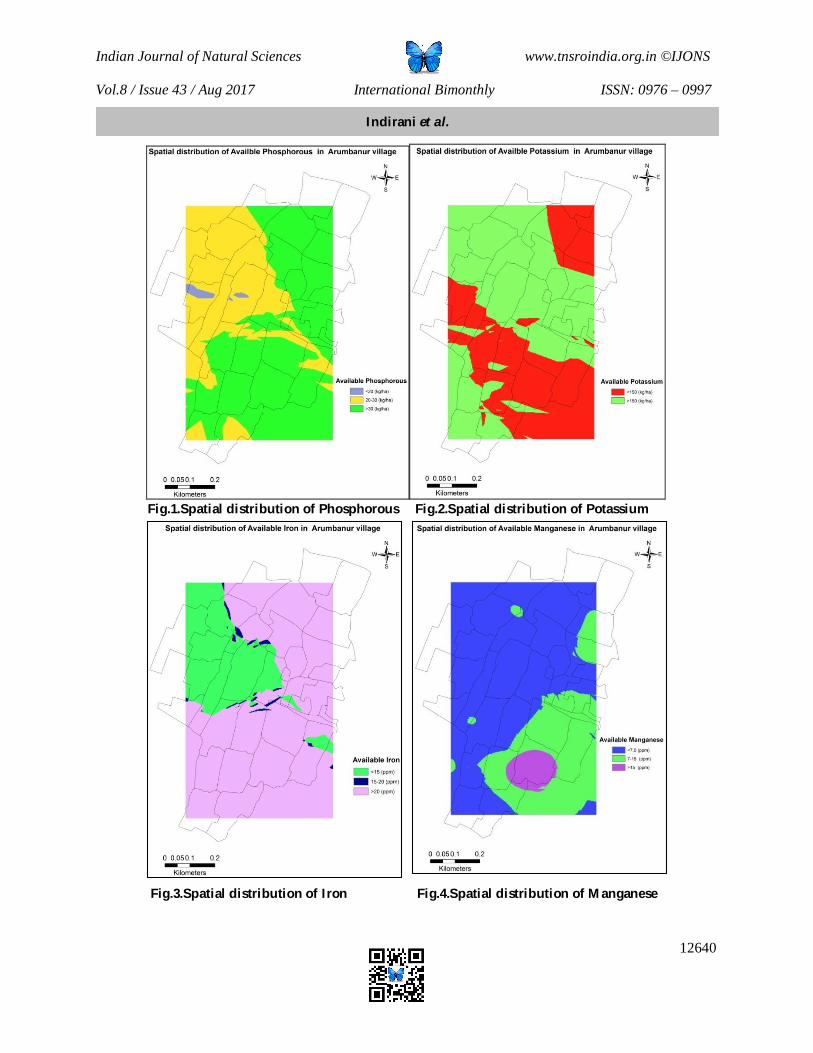
Indian Journal of Natural Sciences www.tnsroindia.org.in ©IJONS Vol.8 / Issue 43 / Aug 2017 International Bimonthly ISSN: 0976 – 0997
12640
Fig.1.Spatial distribution of Phosphorous Fig.2.Spatial distribution of Potassium Fig.3.Spatial distribution of Iron Fig.4.Spatial distribution of Manganese
Indirani et al.

Indian Journal of Natural Sciences www.tnsroindia.org.in ©IJONS Vol.8 / Issue 43 / Aug 2017 International Bimonthly ISSN: 0976 – 0997
12641
Table 2. Statistical value of chemical and fertility parameters of Arumbanur Tank Command of Madurai
pH EC OC N P K Fe Mn Zn Cu MIN 5.95 0.1 0.15 140 5 53 3.77 0.08 0.25 0.54 MAX 9.03 0.73 1.86 358 50 369 51.27 22.58 3.66 3.13 AVG' 7.67 0.29 0.32 234.70 19.01 141.23 19.49 5.19 1.02 1.88 SD 0.78 0.14 0.24 51.28 10.07 47.06 9.92 3.02 0.58 0.58
Indirani et al.

Indian Journal of Natural Sciences www.tnsroindia.org.in ©IJONS Vol.8 / Issue 43 / Aug 2017 International Bimonthly ISSN: 0976 – 0997
12642
Effect of Neutrons Irradiation on the Microstructure Properties of Hg1-x-y
TlxPbyBa2Ca2Cu3O8+δ for (0≤x≤0.4) and (0≤y≤0.4) System Ghazala.Y.Hermiz *, Maysoon F.A.Alias and Bushra A.Aljurani
Department of Physics, University of Baghdad, College of Science, Baghdad, Iraq. Received: 10 May 2017 Revised: 19 June 2017 Accepted: 25 July 2017 *Address for correspondence Ghazala.Y.Hermiz Department of Physics, University of Baghdad, College of Science, Baghdad, Iraq. Email: [email protected]
This is an Open Access Journal / article distributed under the terms of the Creative Commons Attribution License (CC BY-NC-ND 3.0) which permits unrestricted use, distribution, and reproduction in any medium, provided the original work is properly cited. All rights reserved. Scanning electron microscopy (SEM) has been used to identify the morphology of the superconducting phase of Hg1-x-yTlxPbyBa2Ca2Cu3O8+δ for (0≤x≤0.4) and (0≤y≤0.4) system .Also the influence of doping on HgBaCaCuO samples before and after irradiation with thermal and fast neutrons under different time was investigate.The microstructure for most samples before irradiation was found to be dense and the morphology of these samples shows needle-like and plate–like layered microstructure for different compositions. While irradiation with fast and thermal neutrons induced more voids and defect in most of the samples. Keywords: HgBaCaCuO, Thermal and Fast Neutrons, Microstructure Properties. INTRODUCTION The HgBa2Ca2Cu3O8+δ has attracted much attention due to its highest superconducting transition temperature of ~135K at ambient conditions [1]. However, Hg – based superconductors applications are not so wide, because of the difficulties in reproducibility of the synthesis of samples containing only one superconducting phases. The toxicity of several substances that may be formed during the synthesis (especially metallic mercury) and the chemical instability of the cuprates obtained are the main reasons of these difficulties. In addition to these, the absence of trivalent element in these compounds, causing the presence of excess oxygen vacancies, which is likely to make the Hg – based cuprates meta stable, hence the difficult by in its synthesize as in comparison with synthesize other HTSC phases of cuprate oxide family[2-4].Many attempts to overcome these problems have been attempted. It is now known that partial replacement of Hg+2 in oxygen deficient HgOδ layer by cations having higher oxidation states than Hg+2, (e.g. Tl+3, Sn+4, Bi+3, Pb+4 and transition elements as Re.) significantly improves the possibility of formation and enhances the stability of the superconducting phases without affecting the Tc[5,6].
ABSTRACT
RESEARCH ARTICLE

Indian Journal of Natural Sciences www.tnsroindia.org.in ©IJONS Vol.8 / Issue 43 / Aug 2017 International Bimonthly ISSN: 0976 – 0997
12643
Pb+4 and Tl+3 additions to the Hg+2 are believed to have an effect on the charge carrier concentration in the CuO2 planes. The specific substituted cationic characteristics that are taken into account are generally concern the oxidation number. The Tc will depend on the size of the dopant ions since mismatch of dopant ions size with native Hg ions will produce local pressure and distortion. Thus, band overlapping will change on substitution of cation of different size and this may lead to change in Tc[2,7].The degree of stability and microstructure due to the strain that is produced in the HgO layer are the other factors which will influence by the cationic size[7]. Babych et al.[8] show that Fe doping of HgBa2Ca2Cu3O8+δ samples shows decreasing Tc however gives rise to pinning enhancement of the material and increasing the critical current. Of the various techniques employed to introduce defects into high Tc superconducting material, the irradiation techniques are among the most promising [9-12]. Radiation defect generating procedures allow close control of the defect size, shape, morphology, and density, allowing then to tailor damage [13] .On one hand , irradiation creates atomic cascades and structural defects that can in some cases give rise to an increase of critical current , but on the other hand radiation disordering microstructure reduces the critical temperature of HTSC materials [14] . In the oxide HTSC, the main part of the defects is formed in the oxygen sub – lattice, i.e. in that part of the lattice which has the largest influence upon the superconducting properties. It is fortunate that the approximate size of damage introduced by radiation techniques is on the same order of magnitude as the coherence length in many high Tc superconductors [13] . Neutron irradiation has an advantage over electron and ion irradiation, in that the penetrating power of neutrons is quite large, and the resulting homogeneity of defect distribution is superior [9] .It has the disadvantage of weak interaction (neutron have comparatively huge penetration depths), thus requiring large irradiation doses or long irradiation times. [15].However, thermal neutrons have relatively low initial energy, 0.025 eV.While fast neutrons have large energy > 1Mev.In the previous work [16], the effect of neutrons (thermal and fast) irradiation for different time on the properties (structural and the transition temperature Tc) of Hg1-x-yTlxPbyBa2Ca2Cu3O8+δ polycrystalline superconducting materials were studied while, in this search, the microstructure properties under the same condition of the above system are investigated.
MATERIALS AND METHODS Appropriate weights of pure materials Hg2O, BaCO3, CaO, CuO, Pb3O4 and Tl2 O3 in proportion of their molecular weights were used in order to prepare the samples by two step solid state reactions. During the first step, mixing the oxides, and carbonates of Ca, Cu, and Ba developed Ba2 Ca2 Cu3 O8 precursor. The mixture homogenization takes place by adding a sufficient quantity of 2-propanol to form a paste during the process of grinding. In the second step, the Ba2Ca2Cu3O8 precursor was regrounded again and mixed with Hg2O, Pb3O4 and Tl2 O3 to obtain the nominal compositions Hg1-x-yTlxPbyBa2Ca2Cu3O8+δ This mixture was then pressed into pellets 1.3 cm in diameter and (0.2 – 0.3) cm thick, using hydraulic type (SPECAC), under pressure of 0.7GPa. The pellets were presintered at 880°C for 100 h with a rate of 120°C/h and then cooled to room temperature by the same rate of heating. Irradiation of the samples have been done at room temperature by using thermal neutron source 241Am/Be with energy 0.025 eV and neutron thermal flux 4.62 × 10² n/ cm2.sec Also, the samples were irradiated by fast neutrons with average energy 5 MeV and with neutron flux of 2.8× 10⁴ n/ cm2. sec using the same source 241Am / Be of activity 16 Ci. Scanning electron microscopy (SEM) ( type Jeol Model JSM –5600) and an Energy Dispersive X-ray(XL-30 Philips Holland) was used to study the nature of grains and to analyze the surface morphology of the specimens before and after irradiating the samples by fast and thermal neutrons under different time .
Ghazala.Y.Hermiz et al.
Indian Journal of Natural Sciences www.tnsroindia.org.in ©IJONS Vol.8 / Issue 43 / Aug 2017 International Bimonthly ISSN: 0976 – 0997
12644
RESULTS AND DISCUSSION The quantity test of the element content for Hg0.2Tl0.4Pb0.4Ba2Ca2Cu3O8+δ system were carried out by energy dispersive x-ray spectroscopy (EDX) .The spectrum illustrated in Fig.(1) shows the elemental distribution in the sample.EDX analysis indicated that Tl and Pb ions have partially replaced Hg ions in the system, while Ba and Ca or Cu were not replaced. This is an excellent proof that our preparation work is successful. Scanning Electron Microscopy (SEM) was used to characterize the microstructures of the as grown samples of various compositions before irradiated by neutrons are shown in Figs. (2-5). The morphological evaluation of the samples reveals some interesting features, which bear correlation with the doping elements Pb and Tl on the superconducting properties of Hg-1223.In order to investigate the effect of the increase of Tl concentration on the microstructure characteristics we explored the samples with two Pb concentrations 0.15 and 0.4 .Figs. (2a-c)depict the scanning electron micrograph of the samples with different nominal composition Hg0.75Tl0.1Pb0.15Ba2Ca2Cu3O8+δ, Hg0.65Tl0.2Pb0.15Ba2Ca2Cu3O8+δ and Hg0.45Tl0.4Pb0.15Ba2Ca2Cu3O8+δ from lower to higher Tl concentration. The figures reveal the dominant presence of different size needle-like grains that are randomly oriented in all these samples. They also show the low connectivity between the grains in samples with low Tl concentrations (x=0.1), but good connectivity between needle grains for sample with (x=0.2) forming bigger grains as shown in Fig.(2b). But with higher Tl concentration (x=0.4,y=0.15) the big grains cleave to primary grain , this relates to the low Tc .The little spherical grains are inclusion of CaHgO2 as indicated by Batista- Leyva et al.[17] in Hg-1223.For the samples that have (x=0, 0.1, 0.3, 0.4 and y=0.4), large aligned plate-like grains are dominant, indicating that the dopant are effective in promoting Hg-1223 growth. At low Tl concentration (x=0) as can be seen in Fig.(3a) a region with small plate-like piled grains with average grain size of 1µm and another region with grains of bigger cross section, with average grain size of 2.5µm can be seen, both with good connectivity between grains and relatively dense packing . Samples with nominal composition Hg0.5Tl0.1Pb0.4Ba2Ca2Cu3O8+δ, exhibit discontinuous/porous microstructure, this is shown in Fig.(3b).From this micrograph it is also clear that the grains are misaligned and thus, related to low Tc. The bright spherical dots are CaHgO2 as denoted by Su[18]..It is seen from Fig.(3c) that Hg0.3Tl0.3Pb0.4Ba2Ca2Cu3O8+δ sample have a large plate – like grains with different sizes which seem to have good connection between them, some of the plates have grown one through the other giving rise to polyhedral bigger grains. Thus, bigger grains with different sizes may be related to high-Tc. The SEM pictures taken for the Hg0.2Tl0.4Pb0.4Ba2Ca2Cu3O8+δ, sample show a clear plate –like morphology (Fig. (4a,b)).The elongated crystallites of size ( 7-10) µm in the longest dimension shown in Fig.(4b). The EDS show that those crystallites consist of Hg-Tl-Pb-Ba-Ca-Cu-O, as seen in Fig.(1) Fig.(5) displays the micrograph of Hg0.6Tl0..3Pb0.1Ba2Ca2Cu3O8+δ. Small plate-like grains grow in random directions are observed with voids between them among these grains.The bright spherical dots are CaHgO2 and CuO signify the non-superconductivity impurity phases that are responsible for reduction of the transition temperature of the sample as shown previously [16]. We conclude that the elongated grains are responsible for the superconductivity, possibly for both high and low Tc phase. Some defects such as amorphous phase and grain boundary which affect critical current density were observed as shown in Fig.(3b). The variation of the transition temperature depends on the oxygen content. It can be said that the Tc is reasonably dependent of microstructural features. However, the microstructural details may influence transport Jc as indicated by Pandey el al.[19].
Ghazala.Y.Hermiz et al.

Indian Journal of Natural Sciences www.tnsroindia.org.in ©IJONS Vol.8 / Issue 43 / Aug 2017 International Bimonthly ISSN: 0976 – 0997
12645
Fig.(7) shows the micrograph of the sample with nominal composition Hg0.3Tl0.3Pb0.4Ba2Ca2Cu3O8+δ. The original grains appeared to be covered by fluid like surface and as connected islands while beneath them the pin heads of the needle-like structure could be seen. There are also some flat grains with average size of 4µm .The role of neutrons in better connecting the structure lead to higher current density but lowered transition temperature. Thus in our opinion the fast neutrons enhanced second phase formation and grain boundaries connections. In general, electronic properties of superconductors are affected by neutron irradiation which results in a change in Tc and Hc. In fact irradiation with fast neutrons creates atomic cascades and structural defects (point defects, clusters or columnar tracks) that in some cases give rise to an increase of critical current due to the vortex pinning on these defects, but on the other hand radiation disordering of microstructure reduces the critical temperature of HTSC material, and influences negatively the inter-granular critical current[14].Fig.(8) exhibits the SEM microstructure of thermal neutrons irradiated sample Hg0.6 Pb0.4Ba2Ca2Cu3O8+δ for two weeks showing disordered in the grains which causes decreases of the transition temperature Tc as indicated previously [16]. Fig.(9) sample Hg0.5 Tl0.1 Pb0.4Ba2Ca2Cu3O8+δ is exposed to 3- weeks .Similar features, mainly some discontinuous grain boundary with voids was found. However, Fig.(10) shows SEM micrograph of Hg0.3Tl0.3 Pb0.4Ba2Ca2Cu3O8+δ treated for two weeks time, obviously the voids are very few due to coalescences. While, the micrograph of Hg0.2Tl0.4Pb0.4Ba2Ca2Cu3O8+δ Fig.(11) six weeks-irradiation displays that large grains have been cleaved to primary small grins with fewer voids. It is concluded that long time irradiation with thermal neutrons gives the same effect as with one week irradiation with fast neutrons and that is because thermal neutrons have low energy and low penetration depth while fast neutrons are of higher energy . CONCLUSION We conclude that the elongated grains are responsible for the superconductivity, possibly for both high and low Tc phase. Some defects such as amorphous phase and grain boundary which affect critical current density were observed. It can be said that the Tc is reasonably dependent of microstructural features. However, the microstructural details may influence transport Jc.In general, electronic properties of superconductors are affected by neutron irradiation which results in a change in Tc and Hc. In fact irradiation with fast neutrons creates atomic cascades and structural defects (point defects, clusters or columnar tracks) that in some cases give rise to an increase of critical current due to the vortex pinning on these defects, but on the other hand radiation disordering of microstructure reduces the critical temperature of HTSC material.
REFERENCES [1] A.Sehilling, M.Cantoni, J.D.Gou, and H.R.Ott,” Superconductivity above 130 K in the Hg-Ba-Ca-Cu-O system” Nature vol.363, pp.56-58,1993. [2] K.Yamawaki, S.Sasaki, M.Tanaka, H.Yamauchi and S.Lee,” Cation distribution in Hg sites of (Hg,Pb)-1223 determined by synchrotron X-ray anomalous scattering” Physica C,vol..361,pp.22-30, 2001. [3] D.A.Paviov,”Synthesis and Properties of Substituted Hg-Based Superconductors “PhD .Stockholm University, Department of Inorganic Chemistry (2004). [4] Md. Atikur Rahman, Md. Zahidur Rahaman, Md. Nurush Samsuddoha“A Review on Cuprate Based Superconducting Materials Including Characteristics and Applications” American Journal of Physics and Applications, vol.3, pp. 39-56,2015. [5]P.V.P.S.S.Sastry,K.M.Amm,D.C.Knoll,S.C.Peterson,C.H.Wolters,andJ.Schwartz,” Synthesis of (Hg,X) Ba2Ca2
Cu3Ox Superconductors”J.Supercond.vol.11, pp.49-52, 1998. [6] K.Isawa, A.Tokiwa-Yamamoto, M.Itoh, S.Adachi, and H.Yamauchi, “The effect of Pb doping in HgBa2Ca2Cu3O8+δ superconductor”Physica C vol..217, pp.11-15, 1993.
Ghazala.Y.Hermiz et al.

Indian Journal of Natural Sciences www.tnsroindia.org.in ©IJONS Vol.8 / Issue 43 / Aug 2017 International Bimonthly ISSN: 0976 – 0997
12646
[7] H.M.Sao, C.C.Lam, P.C.W.Fung, X.S.Wu, J.H.Du, G.J.Shen, J.C.L.Chow, S.L.Ho, K.C.Hung and X.X.Yao, “The synthesis and characterization of HgBa2Ca2Cu3O8+δ superconductors with substitution of Hg by Pb” Physica C, vol.246, pp.207-215,1995. [8] О.Babych, Ya.Boyko, I.Gabriel, R.Lutciv, M.Matviyiv,B.Sadovy, M. Vasyuk “Synthesis and properties of doped HgBa2Ca2Cu3O8+δ superconductors”Journal of Physics: Conference Series 289,012015,2011. [9] M.E.Mchenry and R.A.Sutton,” Flux pinning and dissipation in high temperature oxide superconductors” Materials Science,vol.38,pp.159-310, 1994. [10] A. Umezawa, G. W. Crabtree, J. Z. Liu, H. W. Weber, W. K. Kwok, L. H. Nunez, T. J. Moran, C. H. Sowers, "Enhanced critical magnetization currents due to fast neutron irradiation in single crystal YBa2Cu3O7^". Phys. Rev. B., vol.36, pp.7151, November 1987. [11] S. Tönies ,H. W. Weber Y. C. Guo and S. X. Dou R. Sawh and R. Weinstein” On the current transport limitations in Bi-based high temperature superconducting tapes”Appl.Phys.Lett.vol.78 (24),pp.3851-3853,2001. [12] M.C.Frischherz,M.A.Kirk,J.Farmer,and H.W.Weber,” Defect cascades produced by neutron irradiation in YBa2Cu3O7−δ”Physica C,vol.232 ,pp.309-327,1994. [13] R.Weinstein,An Overview of U/n Processing, in Proceedings of 12th International Symposium on Superconducttivity,Morioka,Japan,1999. [14] H.J.Hilgenkamp and J.Mannhart,” Grain boundaries in high-Tc superconductors” Rev.Mod. Phys., vol.74,pp.485-551, 2002. [15] S.J. Mantan and C.Beduz,Materials Science and Engineering B-Solid State Materials for Advanced Technology,vol.53,pp.182,1997. [16] B. A. Aljurani, G.Y.Hermiz, M. F.Alias,”Effect of Neutrons on the superconducting properties of Hg1-x-
yTlxPbyBa2Ca2Cu3O8+δ for (0≤x≤0.4) and (0≤y≤0.4) System” Proceeding of 3rd scientific conference of the College of Science, University of Baghdad 24 to 26 March,pp 2340-2349,2009. [17] A.J.Batista-Leyva,R.Cabas,E.Estevez-Rams,M.T.D.Orlando,C.Noda and E.Altshuler,” Hysteresis of the critical current density in YBCO, HBCCO and BSCCO superconducting polycrystals: a comparative study” Physica C , vol.331,pp.57,2000. [18] J.Y.Su “Fabrication and Characterization of Mercurocuprate Superconductor on Silver Substrate, Doctor of Philosophy, Degree Awarded, Spring Semester ,2004. [19]A.K.Pandey,G.D.Verma and O.N.Srivastara,” Investigations on the Tl-doped Hg–Ba–Ca–Cu– O high temperature superconductors in regard to hole doping and microstructural characteristics”Physica C ,vol.306,pp.47-57,1998. [20] W. H. Neumüller, W. Gerhäuser, G. Ries, P. Kummeth, W. Schmidt, S. Klaumünzer, and G. Saemann-Ischenko,” Ion irradiation of layered BSCCO compounds: flux line pinning and evidence for 2-D behaviour”Cryogenics vol.33, pp.14-20 ,1993. [21]V.Topal,L.Dorosinskii,H.Ozkan,and H.Yovuz,” Effect of thermal neutron irradiation in boron-doped melt-textured YBCO superconductors” Physica C,vol.388-389,pp.401-402, 2003. [22] T. Silver , J. Horvat , M. Reinhard , Y. Pei , S. Keshavarzi, P. Munroe , S.X. Dou ” Uranium Doping and Thermal Neutron Irradiation Flux Pinning Effects in MgB2”arXiv.org.cond-mat/0304070, 2003.
Ghazala.Y.Hermiz et al.

Indian Journal of Natural Sciences www.tnsroindia.org.in ©IJONS Vol.8 / Issue 43 / Aug 2017 International Bimonthly ISSN: 0976 – 0997
12647
Figure 1. EDX patterns for the Hg1-x-yTlxPbyBa2Ca2Cu3O8+δ sample with x=0,y=0.4 sintered in air
Figure 2. SEM micrographs of the fracture surface of the sample with a-x=0.1,y=0.15, b-x=0.2,y=0.15 , c- x=0.4,y=0.15,X=10000 .
Figure 3. SEM micrographs of the fracture surface of the sample with a- x=0,y=0.4,b-x=0.1,y=0.4 , c- x=0.3,y=0.4,X=10000 .
Ghazala.Y.Hermiz et al.

Indian Journal of Natural Sciences www.tnsroindia.org.in ©IJONS Vol.8 / Issue 43 / Aug 2017 International Bimonthly ISSN: 0976 – 0997
12648
Figure 4.SEM micrographs of the fracture surface of the sample with x=0.4,y=0.4, a-X=810,b-x=8000. Figure 5. SEM micrographs of the fracture surface of the sample with x=0.3,y=0.1,X=10000.
Figure 6 .SEM micrographs of the fracture surface of the sample with x=0.1,y=0.4 after irradiation with fast neutrons( one week), with different magnification (a) X=5000,(b) X=10000
Ghazala.Y.Hermiz et al.

Indian Journal of Natural Sciences www.tnsroindia.org.in ©IJONS Vol.8 / Issue 43 / Aug 2017 International Bimonthly ISSN: 0976 – 0997
12649
Figure 7.SEM micrographs of the fracture surface of the sample with x=0.3,y=0.4 after irradiation with fast neutrons( one week),with different magnification(a) X=3000,(b) X=10000.
Figure 8.SEM micrographs of the fracture surface of the sample with x=0,y=0.4 after irradiation with thermal neutrons (two weeks),with different magnification (a) X=10000, and (b) X=5000.
Figure 9.SEM micrographs of the fracture surface of the sample with x=0.1,y=0.4 after irradiation with thermal neutrons (three weeks), with different magnification (a) X=10000, and (b) X=5000.
Ghazala.Y.Hermiz et al.

Indian Journal of Natural Sciences www.tnsroindia.org.in ©IJONS Vol.8 / Issue 43 / Aug 2017 International Bimonthly ISSN: 0976 – 0997
12650
Figure 10. SEM micrographs of the fracture surface of the sample with x=0.3,y=0.4 after irradiation with thermal neutrons (two weeks) (a) X=3000 (b) X=10000.
Figure 11. SEM micrographs of the fracture surface of the sample with x=0.4,y=0.4 after irradiation with thermal neutrons (six weeks), with different magnification (a)X=10000, (b) X=3000.
Ghazala.Y.Hermiz et al.

Indian Journal of Natural Sciences www.tnsroindia.org.in ©IJONS Vol.8 / Issue 43 / Aug 2017 International Bimonthly ISSN: 0976 – 0997
12651
Effect of Anti-Stress Supplements on Hemato-Biochemical Blood Profiles in Early Weaned Piglets Vijin.V.L1*, Balusami.C2, John Abraham2, RohinAnie Jose2 and SenthilMurugan3 1PG scholar, Dept. of Department of Livestock Production Management, College of Veterinary Science and Animal Science, Pookode,Wayanad District-673 576 Kerala,India. 2Assistant Professor, Department of Livestock Production Management, College of Veterinary Science and Animal Science, Pookode,Wayanad District-673 576 Kerala,India. 3Assistant Professor, Department of Animal Nutrition, College of Veterinary Science and Animal Science, Pookode,Wayanad District-673 576 Kerala,India. Received: 22 May 2017 Revised: 10 June 2017 Accepted: 27 July 2017 *Address for correspondence Vijin.V.L PG Scholar, Department of Livestock Production Management, College of Veterinary Science and Animal Science, Pookode, Wayanad District-673 576 Kerala, India. Email: [email protected].
This is an Open Access Journal / article distributed under the terms of the Creative Commons Attribution License (CC BY-NC-ND 3.0) which permits unrestricted use, distribution, and reproduction in any medium, provided the original work is properly cited. All rights reserved. The present study was designed to determine and compare the effect of addition of anti- stress supplements viz., vitamin E, vitamin C and bamboo leaves extracts on hematological and biochemical blood profiles in early weaned piglets..Thirty two early weaned piglets (21 days) were selected from Pig farm, Instructional Livestock Farm Complex, College of Veterinary and Animal Sciences, Pookode, Wayanad. The piglets were randomly allotted to four treatments (T1 toT4) of eight each as per the design of experiment and maintained under similar housing on different feeding systems. The first group constituted as control (T1). The second group was offered 40 IU Vitamin E added in the basal ration in addition to normal diet (T2). The third group of piglets received 500 mg of vitamin C. The fourth group of piglets received bamboo leaves extract (BLE) 0.5 per cent on basal diet. All groups were fed with concentrate diet according to NRC (1998). Most of the hemato-biochemical profiles were studied. Hb, PCV, glucose, total protein, creatinine and BUN were significantly higher in adults as compared to the young ones. From the result it can be concluded that supplementation of bamboo leaves extract @ 0.5 per cent significantly improved the growth rate by 14 per cent and performance indices with economic profitability in the weaned piglets. However a detailed study is required before finally recommending the use of bamboo leaves extracts in early weaned piglets. Keywords: Early weaning, Anti- stress supplements, Vitamin C, Vitamin E, Hemato- bio chemical blood profiles.
ABSTRACT
RESEARCH ARTICLE
Indian Journal of Natural Sciences www.tnsroindia.org.in ©IJONS Vol.8 / Issue 43 / Aug 2017 International Bimonthly ISSN: 0976 – 0997
12652
INTRODUCTION Pig is an important but much ignored livestock species in India which has great potential to cater the food and nutritional requirement of the vast non-vegetarian population.With its inherent advantages such as higher prolificacy, growth rate, better feed conversion efficiency, ability to utilize all available feed resources without much competing with the human food and low initial investment. Weaning piglets at an early age of three weeks also helps to better utilize their capital investment in buildings and breeding animals.But early weaning causes high rates of diarrhea, diseases, reduced growth productivity and mortality [1].The stress experienced by the early weaned piglets can be overcome by improving the nutritional and managemental practices which will reduce the morbidity and mortality.High rate of efficiency and live weight gain can be achieved by supplementation of vitamins E, C and A to the pigs experiencing low or high levels of antigen exposure due to early weaning [2]. However, artificial supplementation of vitamins regularly on a larger scale is not economical for a small or marginal farmer. An alternative approach may be the exploration of naturally available herbal agents known for their anti-stressor properties. Hence supplementation of the bamboo parts in any form may be effective to reduce the stress of the weaned piglets and to improve the profitability. Reference values for hematological and biochemical blood profiles are required for data interpretation of health status is essential after supplementation bamboo leaves extract [3].As no information on these aspects was available, the present study was designed to determine and compare the effect of addition of anti- stress supplements viz., vitamin E, vitamin C and bamboo leaves extracts on hematological and biochemical blood profiles in early weaned piglets.
MATERIALS AND METHODS The study was carried out during December, 2016 to February, 2017 at the pig farm, Instructional Livestock Farm Complex, College of Veterinary and Animal Sciences, Pookode, Wayanad, Kerala. Thirty two early weaned piglets (21 days) were selected from Pig farm, Instructional Livestock Farm Complex, College of Veterinary and Animal Sciences, Pookode, Wayanad. The piglets were randomly allotted to four treatments (T1 toT4) of eight each as per the design of experiment and maintained under similar housing on different feeding systems.The first group constituted as control (T1). The second group was offered 40 IU Vitamin E added in the basal ration in addition to normal diet (T2). The third group of piglets received 500 mg of vitamin C (T3). The fourth group of piglets received bamboo leaves extract (BLE) 0.5 per cent on basal diet (T4). All groups were fed with concentrate diet according to NRC (1998). The blood samples were collected and subjected to hemato - biochemical analysis on 21st day and on 90th day. The ear veins are located along the cranial and caudal edges of the ear. Digital pressure was applied at the base of the ear to dilate the vessels. Blood was immediately transferred in to EDTA vials and clot activator vials 4ml each for blood and serum analysis in the lab. Uncoagulated blood was used for hematological assessment viz. Hemoglobin (Hb) and Packed Cell Volume (PCV). The Hb and PCV were estimated using standard procedure [4, 5,6 &7] .Serum Total Protein (TP) was estimated by Biuret method [8]. Creatinine content in the serum was determined by the alkaline picrate method [9].Serum urea was determined by diacetylmono-oxime (DAM) method.
RESULTS AND DISCUSSION The hematological parameters like Hemoglobin (Hb), Packed Cell Volume (PCV) were analyzed during 21st and 90th day.Most of the hematological indices recorded were within the normal ranges [9]. It is worth noting that all the values obtained were within the normal range for pigs [10].There were no significant differences (p>0.05) among the treatment means and significant differences (P>0.05) were observed before and after the study period. The differences could be as a result of the environmental, seasonal, diet and other factors [11].Biochemical blood
Vijin et al.

Indian Journal of Natural Sciences www.tnsroindia.org.in ©IJONS Vol.8 / Issue 43 / Aug 2017 International Bimonthly ISSN: 0976 – 0997
12653
parameters like glucose, total protein, creatinine and BUN were analyzed. The total protein, glucose, blood urea nitrogen and creatinine levels did not indicate significant (P>0.05) differences between treatment but significant differences (P>0.05) were observed before and after the study period. Similar finding also observed in growing pigs fed with varying level of whole cassava plant and recorded no significant (p>0.05%) differences across the treatments means of the various serum biochemical parameters[12].
CONCLUSION From the result, it can be concluded that supplementing bamboo leaves extract @ 0.5 per cent of diet had no adverse effect on the hematological and bio-chemical parameters of blood in early weaned piglets.
ACKNOWLEDGMENTS
The authors are grateful to Officer in charge,Pig farm, Instructional farm complex(ILFC) Pookode, Department of Livestock production and management, Department of Biochemistry, Department of Animal Nutrition and Department of Veterinary Pharmacology and Toxicology, College of veterinary and animal sciences , Pookode, Wayanad for providing facilities to carry out the study. REFERENCES 1. L.J. Bark, T.D. Crenshaw, V.D. Leibbrandt, 1986. The effect of meal intervals andweaning on feed intake of early weaned pigs.J. Anim. Sci., 62, 1233-1239. 2. Ayo and Oladele (1996) Ayo, J.O. and Oladele, S.B., 1996. Transport stress in food animals. A review. Niger. Vet. J. (Special edition), 1, 58-68. 3.Chen,Y., Qin, S., Ding,Y., Li, S.,Yang, G., Zhang, J., Li,Y., Cheng, J. and Lu,Y. (2011) Reference values of biochemical and hematological parameters for Guizhou mini pigs. Exp. Biol. Med236: 477-482. 4. Benjamin, M.M. 1985. Outline of veterinary clinical pathology. (3rdEd.). Kalyani Publisher, New Delhi, India.5. 5. Hawk, P.B. 1965. Hawks physiological chemistry. (14th Ed). McGraw Hill Book Co. London. 42-47. 6. Jain, N.C. 1993. Essentials of Veterinary Haematology. Lea and Febiger Publishers Malvern, Pennsylvania. 57-62. 7. Dumas, B.T., Watson, W.A. and Briggs, H.G. 1971. Albumin standards and the measurement of serum albumin with bromocresol green. Clinical Chem. Acta. 31: 87-96. 8. Bonses, R.W. and Tausskay, H.H. 1945. The colorimetric determination of creatinine by the Jaffe reaction. J. Biol. Chem. 158: 581. 9.Siegmund, O.H., Fraser, C.M., OH, S. and Clarence, M.F., 1979. The Merck veterinary manual: a handbook of diagnosis and therapy for the veterinarian. 10. Friendship, R., Lumsden, J.H., McMillan, I. and Wilson, M.R., 1984. Hematology and biochemistry reference values for Ontario swine. Canadian journal of comparative medicine, 48(4), p.390.
11.Harapin..,LjiljanaBedrica, Vladimir Hahn, BrankoSostaric, and DamjanGracner 2003.Haematological and biochemical values in blood of wild boar (Susscrofaferus). Veterinarski arhiv73 (6), 333-343 12. Akinfala, E.O. and Tewe, O.O., 2001. Utilisation of whole cassava plant in the diets of growing pigs in the tropics. Livestock research for rural development, 13(5), pp.13-21.
Vijin et al.

Indian Journal of Natural Sciences www.tnsroindia.org.in ©IJONS Vol.8 / Issue 43 / Aug 2017 International Bimonthly ISSN: 0976 – 0997
12654
Table .1 Hematological parameters of early weaned piglets
Parameters Group 21st day 90 th day t-value (p-value) Haemoglobin T1 11.11±0.18 14.22±0.43 10.818 ** (<0.001)
T2 11.18±0.24 12.95±0.68 2.562** (0.037) T3 11.28±0.24 14.32±0.40 9.581** (<0.001) T4 11.34±0.23 14.59±0.42 6.422** (<0.001)
F-value (p-value) 0.199 ns (0.896) 2.136 ns (0.118) PCV T1 33.36±0.63 43.21±1.33 9.686** (<0.001)
T2 33.28±0.67 38.82±1.88 3.074** (0.018)
T3 33.47±0.69 42.44±1.35 8.348** (<0.001) T4 33.58±0.73 43.27±1.32 5.787** (0.001)
F-value (p-value) 0.036 ns (0.991) 1.988 ns (0.139)
Table 2.Biochemical parameters of piglets for 21st and 90th day of study
Parameters Group 0 day 90 th day t-value (p-value) Total protein T1 8.07±0.19 7.32±0.54 1.439 ns (0.193)
T2 8.04±0.13 7.71±0.30 1.483ns (0.182) T3 8.22±0.15 7.02±0.45 2.434** (0.045) T4 7.98±0.14 6.48±0.31 6.226** (<0.001)
F-value (p-value) 0.401 ns (.753) 1.537 ns (.227) Glucose T1 774.75±32.89 353.25±38.06 20.719 ** (<0.001)
T2 781.50±31.75 299.63±37.71 11.047** (<0.001) T3 806.88±40.24 286.50±24.7 10.919**(<0.001) T4 846.50±36.57 264.63±24.27 10.647** (<0.001)
F-value (p-value) 0.836 ns (0.485) 1.396 ns (0.265) Creatinine T1 2.03±0.29 0.55±0.17 6.751** (<0.001)
T2 1.99±0.21 0.42±0.09 6.140**(<0.001) T3 2.66±0.13 0.35±0.08 12.085**(<0.001) T4 2.36±0.17 0.63±0.15 6.906** (<0.001)
F-value(p-value) 2.150 ns (0.116) 0.843 ns (0.482) Blood urea nitrogen.
T1 18.00±1.35 4.36±2.09 5.582** (0.001) T2 16.75±1.34 5.18±3.22 3.911** (0.006) T3 17.63±1.03 3.71±1.76 7.412** (<0.001) T4 17.25±1.23 2.34±1.02 8.191** (<0.001)
F-value(p-value) 0.183 ns (0.907) 0.304 ns (0.823)
** Means significant at 0.01 level; Ns not significant
Vijin et al.

Indian Journal of Natural Sciences www.tnsroindia.org.in ©IJONS Vol.8 / Issue 43 / Aug 2017 International Bimonthly ISSN: 0976 – 0997
12655
The Impact of Transformational Leadership on Job Satisfaction of the Northern Border University Academic Staff Mohamed Eid Kilase Ajoud1 and Tahar Jouili2 1Northern Border University, College of Business Administration, Department of Public Administration, Saudi Arabia. 2Northern Border University, College of Business Administration, Department of Economics, Saudi Arabia. Received: 19 Jul 2017 Revised: 28 July 2017 Accepted: 07 Aug 2017 *Address for correspondence Mohamed Eid Kilase Ajoud Northern Border University, College of Business Administration, Department of Public Administration,Saudi Arabia. [email protected], [email protected]
This is an Open Access Journal / article distributed under the terms of the Creative Commons Attribution License (CC BY-NC-ND 3.0) which permits unrestricted use, distribution, and reproduction in any medium, provided the original work is properly cited. All rights reserved. The style of leadership has become a significant element in achieving organizational goals. Consequently, leadership style is seen an important determinant of employee job satisfaction. The present study aims to investigate the impact of transformational leadership style of heads of departments and the job satisfaction of academic staff working in the Northern Border University in Saudi Arabia. A sample of 329 participants was recruited in the study. Descriptive statistics expressed by the mean, standard deviation and regression analysis are used to study the impact of transformational leadership components on job satisfaction. The principal component analysis (PCA), the Bartlett’s test of Sphericity and Kaiser-Meyer-Olkin (KMO) indicator are also used. Study findings revealed the existence of transformational leadership and job satisfaction among academic staff in the Northern Border University. Regarding the relationship between transformational leadership dimensions and job satisfaction, the results showed that the components of transformational leadership have positive effect on job satisfaction variables which are personal capacity, head of the department capacity, teamwork, accomplishment and creation. Finally, the study recommended that policy makers and academic leaders of higher education institutions should develop programs and activities that enhance leadership skills of academicians besides investigating the impact of TL on career satisfaction. Keywords: Leadership, transformational leadership, job satisfaction.
ABSTRACT
RESEARCH ARTICLE
Indian Journal of Natural Sciences www.tnsroindia.org.in ©IJONS Vol.8 / Issue 43 / Aug 2017 International Bimonthly ISSN: 0976 – 0997
12656
INTRODUCTION
The relationship between leadership and job satisfaction has become one of the favorite topics of study in the fields of organizational behavior, psychology, management and education. Leaders of any organization are expected to carry out tasks with limited resource in order to maintain the competitiveness and sustain profitability position of the organization and to attain the organization’s efficiency and effectiveness (Raiz and Haider, 2010). In the classic literature job satisfaction is being seen as a positive emotional response and experience resulting from the evaluation of one’s work (Sokolová et al. 2016). Several studies that have examined the impact of transformational leadership on job satisfaction looked at the satisfaction of workers as general satisfaction. However, the dimensions of job satisfactions were being controversial issue in some studies for example (Okpara, 2004) has identified five dimensions of job satisfaction which include: pay, promotion, supervision, work itself and coworkers. Meanwhile, (Morris, 1995) stated that job satisfaction of employees always comprises of elements such as: the job itself, the relationship with the supervisor and co-workers, management beliefs, future opportunity, work environment, and compensation. Therefore there are two approaches which are stated in the literature for measuring satisfaction. First, multifaceted constructs that assess satisfaction with specific job elements such as pay, co-worker, supervision, and job security, and the second is a general state of satisfaction that deals with the job as a whole without focusing on the elements of satisfaction (Steger, Dik, and Duffy, 2012). Although the two appraoches are valid but the multifaceted approach allows researchers to diagnose elements of problem deeply. The present study adopts multifacetd approach to investigate the job satisfaction among the academic staff. The study problem focuses on the phenomena of disatisfaction with job of academic staff in the university. Transformational Leadership
The concept of transformational leadership was first introduced by the James MacGregor Burns (1978). According to him transformational leadership is a process in which leaders and followers promote each other to higher levels of morality and motivation. The concept is also developed, elaborated, conceptualized and operationalized by (Leithwood, 1992), (Bass and Avolio, 1994), (Bass, 1999) and recently by (Bass and Rigo, 2012). In reference with Bass (1999) transformational leaders inspire followers beyond their immediate self interest through idealized influence, inspirational motivation, intellectual stimulation, and individualized consideration. Antonakis, et al. (2003) and Piccolo and Colquitt, (2006) stated that idealized influence is reflected in the charismatic actions of leaders based on high-order ideals, which inspires confidence in followers and causes them to identify with them. Inspirational motivation is displayed when the leader articulates appealing visions to followers and encourages them to pursue ambitious goals, and provides meaning to the task on hand. Intellectual stimulation reflects the way leaders encourage subordinates to think creatively, take risks and challenge stable assumptions. Individualized consideration is practiced when leaders show concern with the professional and personal development of followers. Each of the four components (4Is) can be measured by the multifactor leadership questionnaire (MLQ). Job Satisfaction
Job satisfaction is generally seen as an employee‘s response to conditions surrounding work that include pay, benefits, promotion, style of supervision, co-workers and job environment. Job satisfaction in its simplest form is being defined as how much a person likes his job. According to (Petty et al., 1984; Fisher, 2003; and Luthans 2007) job satisfaction is defined as a pleasurable or positive emotional state resulting from the appraisal of one’s job or job experience. Hence, job satisfaction is the emotional response of an individual toward his or her job or place of job coming out from his or her experience from the job. The relationship between job satisfaction and job performance can be understood within the framework of job satisfaction ultimately leads to job performance and organizational commitment which ensures organizational success (Spector, 2003).
Mohamed Eid Kilase Ajoud and Tahar Jouili

Indian Journal of Natural Sciences www.tnsroindia.org.in ©IJONS Vol.8 / Issue 43 / Aug 2017 International Bimonthly ISSN: 0976 – 0997
12657
In the explanation of job satisfaction, the job related characteristics are not enough for complete understanding; therefore we need to consider the personal characteristics as well (Churchill et al., 1976; Staw and Ross, 1985; Fried and Ferris, 1987). However, the dimensions of job satisfactions were being controversial issue in some studies for example (Okpara, 2004) has identified five dimensions of job satisfaction which include: pay, promotion, supervision, work itself and coworkers. Meanwhile, (Morris, 1995) stated that job satisfaction of employees always comprises from elements such as: the job itself, the relationship with the supervisor and co-workers, management beliefs, future opportunity, work environment, and compensation. The present study attempts to empirically investigate the impact of transformational leadership components mainly charisma, inspirational motivation, intellectual stimulation, and individualized consideration on job satisfaction among academic staff. The originality of this study represents in the adoption of new model that identifying the job satisfaction into five suggested dimensions which they are personal capacity, head of the department capacity, teamwork, accomplishment and creation, and work time. This study concerns with these five dimensions and with the nature of effect caused by the transformational leadership. In this context the research questions are raised as follows: Are transformational leadership components influence the five job satisfaction dimensions? Historically, academic contributions to knowledge in the fields of organizational behavior, management, leadership, psychology, and sociology have been few (Hallinger and Chen, 2015). Thus, limited amount of studies have been conducted on the impact of transformational leadership style on job satisfaction among academicians (Bolger, 2001). The same limitation of research amount is observed in the higher education institutions in the Kingdom of Saudi Arabia. Therefore, the present study attempts to fill this gap of knowledge by investigating the impact of transformational leadership dimensions on job satisfaction variables among the academicians in the Northern Border University. Moreover, this study has significance on the ground that it expands the limited transformational leadership studies and enlarges the theoretical framework. It also provides the university leaders empirical evidence that can be use as strategy with hope of increasing job satisfaction of the academic staff. Literature Review
A considerable amount of empirical research has examined the impact of transformational leadership on job satisfaction. Among these studies is the study of Riaz and Haider (2010) that showed the impact of transformational and transactional leadership styles on job success and career satisfaction in the context of Pakistan. The result of the study prevailed that transformational leadership style is positively related to job success and career satisfaction. In the same context of Pakistan, Fatima, et al. (2011) showed that the four dimensions of transformational leadership; inspirational motivation, intellectual stimulation, individual consideration and idealized influence have been positively related to job satisfaction in the banking sector of Lahore. Emery and Baker (2007) revealed that transformational factors of charisma, intellectual stimulation, and individual consideration were highly correlated with job satisfaction. The similar results obtained by Suleiman Ibraheem, et al. (2011) at Jordanian Private Hospitals. Walumbwa et al. (2004) conducted a study among 402 Chinese and Indian staff of banking and finance. The findings of the study exposed that transformational leadership is positively related to job satisfaction and organizational commitment, and negatively related to work withdrawal. Gill et al. (2010), found positive relationships between employees’ perceived transformational leadership used by managers and employees’ perceived job satisfaction among Indian restaurant employees. Elkordy (2013) pointed out that the path coefficient for the effect of transformational leadership to satisfaction show a considerable positive influence of leadership on satisfaction. Based on Mohamad (2012) many Arab and Islamic countries have witnessed extensive research activities which recognized the importance of transformational leadership, for the reason that such leadership contributes to better organizational outcomes and for the reasons that it similar to the Islamic approach of leadership. The study of Cook, et al. (1989) examined the impact of leadership styles on employee job satisfaction in different countries and in various settings such as
Mohamed Eid Kilase Ajoud and Tahar Jouili

Indian Journal of Natural Sciences www.tnsroindia.org.in ©IJONS Vol.8 / Issue 43 / Aug 2017 International Bimonthly ISSN: 0976 – 0997
12658
healthcare, military, education and business organizations. In agreement with Mosadeghrad (2003) the most common leadership styles that have been studied across all countries are: autocratic, bureaucratic, laissez-faire, charismatic, democratic, participative, situational, transactional, and transformational leadership. Some organizations might attempt to apply one or more of these leadership styles to increase the job satisfaction of their employees. Most of the recent research on teacher job satisfaction has cited the exceptional work of Herzberg, et al. (1959) who identified the satisfying and dissatisfying factors. The Herzberg’s (two-factor theory) associates the satisfying factors (the motivators), with the higher order needs and the dissatisfying factors, (the hygiene factors) with the lower order needs. The higher order needs, the satisfying factors, relate to the intrinsic aspects of work, such as achievement, recognition, the work itself, responsibility, and opportunity for advancement. The lower order needs, the dissatisfying factors, apply to extrinsic matters of work, such as working conditions, supervision, work policy, salary, and interpersonal relationships. Rad and Yarmohammadian (2006) figured out some factors that might contribute to the job satisfaction and these factors are: supervisor support, wages, benefits, accomplishment, independence, acknowledgment, communication, working job conditions, job importance, co-workers, professionalism, organizational climate, relationships, working for a reputable agency, positive, job security, workplace flexibility, team environment and genetic factors. Concerning the educational institutions a number of studies have been conducted to understanding the impact of transformational leadership on job satisfaction of teachers. Silins & Mulford (2002) found that teachers’ job satisfaction is largely reliant upon the degree by which principals are skilled in transformational leadership styles. A study carried out by Rossmiller (1992) revealed that teachers’ perception of principal transformational leadership skills has significant impact on teachers’ job satisfaction. The study concluded that principals of the school practicing transformational leadership are more likely to accelerate and enhance job satisfaction among teachers. Bogler (2002) indicated that teachers who perceived their principals as transformational leaders not only report higher job satisfaction. Kazi and Zadeh, (2011) believed that satisfaction is multi-facets and it is not necessarily for employee to feel with satisfaction in all areas; likewise, dissatisfaction in one area does not mean complete job dissatisfaction. In other words satisfaction with one facet might lead to dissatisfaction with another. METHODOLOGY This study attempts to examine the impact of transformational leadership on job satisfaction of the university academic staff. The sampling frame was based on the academic staff list from the Northern Border University. Simple random sampling technique was applied in selecting the respondents. 329 questionnaires were collected from 400 questionnaires distributed. The response rate was 82%. The questionnaire consisted close-ended questions applying five-point Likert scale. Transformational leadership was assessed by referring to Avolio and Bass (2004) dimensions; idealized influence, individualized consideration, inspirational motivation and intellectual stimulation. Job satisfaction was adapted from Minnesota Satisfaction Questionnaire (MSQ) by Weiss et al (1967). The data obtained from the respondents were summarized using descriptive statistics, while regression analysis is used to study the relationship between job satisfaction and transformational leadership components. Moreover, factor analysis is also used as statistical tool of analysis. RESULTS AND DISCUSSION Preliminary data analysis This study consists of four variables for transformational leadership and five variables for job satisfaction. Transformational leadership variables include charisma, inspirational motivation, intellectual stimulation and individual consideration, while the five variables concerns with job satisfaction are personal capacity, head of the department capacity, teamwork, accomplishment and creation, and work time. Transformational leadership was assessed with 20 questions which in turn were subdivided into four variables, while the job satisfaction variable was represented by 20 items.
Mohamed Eid Kilase Ajoud and Tahar Jouili

Indian Journal of Natural Sciences www.tnsroindia.org.in ©IJONS Vol.8 / Issue 43 / Aug 2017 International Bimonthly ISSN: 0976 – 0997
12659
Table 1 shows the descriptive statistics of the different variables of the study. The first part of table1 shows the mean and standard deviation. The result shows that all variables are characterized by a mean value greater than 3. This finding expresses that the sample of respondents was generally agreed for existence of the four dimensions of transformational leadership with values about 4. The same remark is verified for the existence of job satisfaction. Indeed, the mean of responses of job satisfaction takes the value of 3.909 which indicates that all the respondents were satisfied with their job at the NBU. Statistically, the above mentioned remarks could be confirmed by the t-test with null hypothesis where the mean value is less than 3 (Neutral). Then, this test is formulated as follows:
0 1: 3 vs : 3. (1)H H
The results of this test are given on the right part of table 1. They showed that all calculated statistics are greater than critical values of 1.96. Moreover, the significant probability is less than 5% which allow us to reject the null hypothesis and confirm the existence of transformational leadership and job satisfaction in the NBU. The Cronbach’s Alpha value for each dimension of both transformational leadership and job satisfaction ranges from 0.721 to 0.873 which indicates the reliability of scales used in this study. Factor analysis To determine the possibility and the importance of the factor analysis specially the principal component analysis (PCA), the Bartlett’s test of Sphericity and Kaiser-Meyer-Olkin (KMO) indicator are used.The result provided in table 2 shows that KMO values are greater than 0.70 and Bartlett’s Test of Sphericity has a strong Chi-square statistics that ranges between 553.23 and 2600.5 and also characterized by null significant probabilities for all dimensions. These results indicate that the null hypothesis of the Bartlett’s test is rejected. Subsequently, principle components analysis is appropriate in terms of data. By applying the PCA and the Kaiser criteria, only one principal factor is retained for each transformational leadership dimension by winning explained variance which ranges from 53.7% to 70.311%. Whereas the job satisfaction variable is represented by five principal factors, about 65% of explained variance is guaranteed. Standardized factor loadings and the correlation of each item to the main factors are presented in table 3. The left part of this table is specified to transformational leadership dimension while the right part concerned with the job satisfaction variable. Standardized factor loadings were greater than 0.5 for all items the things made us not to reject any item in the study. These results were already justified by the valid reliability analysis in table 1.The correlations analysis of job satisfaction’s items with the principal components extracted by the PCA is shown in the table 4. Indeed, the PCA allows the division of the job satisfaction items into 5 dimensions. The first dimension is explained by the satisfaction of the employee by his personal capacity (SPC) at the work in the university. The second dimension is interpreted by the satisfaction by the head of the department capacity (SHDC). In the third dimension we found strong correlation between the items 5, 6 and 7 which indicates the satisfaction of the academic employee by the teamwork (ST). The fourth and fifth dimensions were interpreted by the satisfaction via the accomplishment and creation (SAC) and satisfaction by the work time (SWT) respectively. Measurement model In light of these results, the conceptual model of the study takes the figure 1.
Mohamed Eid Kilase Ajoud and Tahar Jouili

Indian Journal of Natural Sciences www.tnsroindia.org.in ©IJONS Vol.8 / Issue 43 / Aug 2017 International Bimonthly ISSN: 0976 – 0997
12660
Correlation analysis The relationship between the various attributes of transformational leadership and facets of job satisfaction was studied using correlation analysis to. Correlations analysis was performed to further indicate the extent and nature of relationships between the various variables. The correlation matrix enabled us to extract many significant correlations between job satisfaction dimensions and transformational leadership at 5% level. Moreover, the most important correlation among these variables was found positive. For example, the correlation coefficient is equal to 0.479 which lies between individual considerations and job satisfaction by the personal capacity. The second dimension of job satisfaction (satisfaction to the head of the department capacity) was not statistically correlated with any dimension of the transformational leadership variable. On other hand, we noted significant correlation between all transformational leadership dimensions and the satisfaction by the teamwork. For the other job satisfaction dimension, we noted only a significant correlation between charisma and Individual consideration at 5% level. Regression analysis After analyzing the correlation matrix, 5 regressions are estimated in the following equations:
The empirical results of these equations are shown in the tables 6a, 6b, 6c,6d, and 6e. Table 6a shows that the three transformational leadership dimensions: inspirational motivation; intellectual stimulation; and individual consideration have significant effect on the personal capacity. The inspirational motivation and intellectual stimulation have significant effect at level of 10% and individual consideration at level of 1%, whereas the charisma has no effect. The personal capacity is considered as component of job satisfaction among academic staff. Table 6b indicates that the three transformational leadership dimensions: charisma; inspirational motivation and intellectual stimulation have strong significant effect on the head of the department capacity as component of job satisfaction at level of 1% along with individual consideration at level of 10%.Table 6c shows that the individual consideration is the only component of transformational leadership which has strong significant effect on job satisfaction at level of 1%. The effect of charisma and intellectual stimulation on accomplishment and creation as indicated in table 6d was found to be significant at level of (1%). The individualized consideration was also found to be signification at level of (10%).There is no significant relationship between transformational leadership components and the work time as shown in table 6e.
DISCUSSION AND CONCLUSION This study has investigated the impact of transformational leadership on employee job satisfaction of the academic in the NBU. Despite the limited studies in the area of transformational leadership and job satisfaction among academicians of Saudi universities. The present study makes substantial contributions in terms of theory and research. The presented study constitutes one of the few studies to have revealed the impact of transformational
Mohamed Eid Kilase Ajoud and Tahar Jouili

Indian Journal of Natural Sciences www.tnsroindia.org.in ©IJONS Vol.8 / Issue 43 / Aug 2017 International Bimonthly ISSN: 0976 – 0997
12661
leadership on job satisfaction of the academic staff in the NBU of Saudi Arabia. The new model of this study can be seen in the division of the job satisfaction items into new five variables which are personal capacity, head of the department capacity, teamwork, accomplishment and creation, and work time. These divisions are considered to be a new model in the field of job satisfaction according to our best knowledge. Each variable of job satisfaction is examined individually to know the degree of influence by the four transformational leadership components. The findings of this study show that the academic represented in heads of departments exhibited transformational leadership characters. Moreover, the study confirmed the existence of job satisfaction among academic staff of the NBU. Regarding the impact of transformational leadership on job satisfaction of academic staff in the NBU, r sesults how that transformational leadership had an impact on job satisfaction and this impact is positive. This findinding is in line with previous studies (Greenberg & Baron, 1995; Griffin & Bateman, 1986; Hatter & Bass, 1989; Koh, Steers, & Terborg, (1995); Lowe & Kroeck, 1996; Tossi Rizzo & Carroll, 1994) which confirm that transformational leadership is linked to follower job satisfaction. The present study also supports studies of Bolger (2001) and Nguni et al(2006) which also found evidence of the influence of transformational leadership on teacher job satisfaction and the relation of transformational leadership to a number of important organizational outcomes including perceived extra effort, organizational citizenship behaviors and job satisfaction (Bryman,1992). Based upon this established relationship, a further investigation into the impact of the transformational leadership components on the job satisfaction variables was made. Clearly the relationship between transformational leadership dimensions and job satisfaction variables, results show that personal capacity variable is strongly affected by individual consideration and in less degree with the inspirational motivation and intellectual stimulation. Concerning the head of the department capacity the study revealed that it is strongly affected by three components of transformational leadership dimensions: charisma; inspirational motivation and intellectual stimulation and in less degree with individual consideration. Concerning the teamwork variable of job satisfaction the result showed that the individual consideration is the only component of transformational leadership that has strong significant effect on it. Accomplishment and creation variable has strongly affected by charisma and intellectual stimulation and in less degree it has affected positively by individual consideration. About the work time variable of job satisfaction the result showed that has no significant effect. Concerning the new varibles of job satisfaction that affected by the transformational leadership components we can argue that we did not find any support for this finding from past research. As limited studies have been conducted in Saudi Arabia so far, therefore we suggest conducting more studies in Saudi Arabia context in order to explore this situation. Moreover training programs among academician in particular are needed to build transformational leadership skills on them the thing leads to followers' empowerment more than followers' dependence on the leader for inspiration and guidance (Kark, Shamira, and Chen, 2003).
ACKNOWLEDGEMENTS The authors would like to thank the Northern Border University (Kingdom of Saudi Arabia) for financing this study. REFERENCES 1. Antonakis J., Avolio, B. & Sivasubramaniam, N. (2003). Context and leadership: an examination of the nine factor
full Range leadership theory using the multifactor leadership questionnaire. The Leadership Quarterly, 14(3), 261-295.
2. Avolio, B.J., & Bass B.M. (2004). Multi Factor Leadership Questionnaire. (3rd.ed.). Menlo Park, CA: Mind Garden, Inc.
3. Bass B. M. & Avolio B. J. (1994). Improving organizational effectiveness through transformational leadership, Thousand Oaks, CA: Sage Publications.
4. Bass B.M. (1999). Two decades of research and development in transformational leadership. European Journal of Work and Organizational Psychology, 8(1), 9-32.
Mohamed Eid Kilase Ajoud and Tahar Jouili

Indian Journal of Natural Sciences www.tnsroindia.org.in ©IJONS Vol.8 / Issue 43 / Aug 2017 International Bimonthly ISSN: 0976 – 0997
12662
5. Bass B.M., & Riggio R. E. (2012). Transformational leadership. Psychology Press. 6. Bogler R. (2001). The influence of leadership style on teacher job satisfaction. Educational Administration
Quarterly, 37, 662–683. 7. Bogler, R. (2002). Two profiles of schoolteachers: a discriminant analysis of job satisfaction. Teaching and Teacher
Education, 18, 665 – 673. 8. Bryman A., (1992). Charisma and leadership in organizations. Sage Publications, London. 9. Burns, J. M. (1978). Leadership. New York: Harper and Row. 10. Churchill A.G., Ford, M.N., & Walker, C.O. (1976). Organizational climate and job satisfaction in the sales force.
Journal of Marketing Research, 13(4), 323-332. 11. Cook, J.D., Hepworth, S.J., Wall, T.D., & Warr, P.B. (1989). The experience of work. San Diego: Academic Press. 12. ElKordy, M. (2013). Transformational leadership and organizational culture as predictors of employees
attitudinal outcomes. Business Management Dynamics, 3(5), 15-26. 13. Emery, CR., & Baker, KJ (2007). The effect of transactional and transformational leadership styles on the
organizational commitment and job satisfaction of customer contact personnel, J. Organizational Culture, Communication and Conflict, 11(1): 77-90.
14. Fatima, B., Ahmad, U., & Asvir, N. (2011). Effect of transformational leadership on employees' job satisfaction and organizational commitment in banking sector of lahore (Pakistan). International Journal of Business and Social Sciences, 2(18), 261-266.
15. Fisher C.D. (2003). Why do lay people believe that satisfaction and performance are correlated? possible sources of a commonsense theory. Journal of Organizational Behavior, 24(6), 753-77.
16. Fried, Y., & Ferris, G. R. (1987). The validity of the job characteristics model: A review and meta analysis. Personnel Psychology, 40(2), 287–322.
17. Gill, A., Flaschner, A.B., Shah C., & Bhutani I., (2010). The relations of transformational leadership and empowerment with employee job satisfaction: A study among Indian restaurant employee. Business and Economics Journal, 8, 13-18.
18. Greenberg, J., & Baron, R.A.(1995). Behaviour in organizations: Understanding and managing the human side of work, 5th edition. Englewood Cliffs, NJ: Prentice Hall.
19. Griffin, R. W., & Bateman, T. S. (1986). Job satisfaction and organizational commitment. In C. L. Cooper & I. Robertson (Eds.), International review of industrial and organizational psychology (157 – 188). New York: Wiley.
20. Hallinger P., & Chen J. (2015). Review of research on educational leadership and management in Asia. A comparative analysis of research topics and methods, 1995–2012. Educational Management, Administration, and Leadership 43( 1), 5-27.
21. Hater, J., & Bass, B. (1988). Superiors' evaluations and subordinates' perceptions of transformational and transactional leadership. Journal of Applied Psychology, 73, 695-702.
22. Herzberg, F., Mausner, B., & Snyderman, B. (1959). The motivation to work. New York: John Wiley. 23. Kark, R., Shamir, B., & Chen, G. (2003). The two faces of transformational leadership: Empowerment and
dependency. Journal of Applied Psychology, 88 (2), 246-255. 24. Kazi, G, M., & Zadeh, Z, F. (2011). The contribution of individual variables: Job satisfaction and job turnover.
Interdisciplinary Journal of Contemporary Research in Business. 3(5), 984-991. 25. Koh, W. L., Steers, R. M. & Terborg, J. R. (1995). The effects of transformational leadership on teacher attitudes
and student performance in Singapore. Journal of Organizational Behavior, 16, 319 – 333. 26. Leithwood, K. A. (1992). The move toward transformational leadership. Educational Leadership, 49, 5, 8-12. 27. Lowe, K. B., Kroeck, K. G., & Sivasubramaniam, N. (1996). Effectiveness correlates of transformational and
transactional leadership: A meta-analytic review of the MLQ literature. The Leadership Quarterly, 7(3), 385–425. 28. Luthans F. (2007). Organizational behavior. New York: McGraw-Hill. 29. Mohamad, S.M. (2012). Transformational leadership and employees' job satisfaction and commitment: A
structural equation investigation. Journal of American Science, 8(7), 11-19. 30. Morris,T. (1995). Employee satisfaction: Maximizing the return on human capital. The Management Accounting
Magazine, 69(10), 15-18.
Mohamed Eid Kilase Ajoud and Tahar Jouili

Indian Journal of Natural Sciences www.tnsroindia.org.in ©IJONS Vol.8 / Issue 43 / Aug 2017 International Bimonthly ISSN: 0976 – 0997
12663
31. Mosadeghrad, A. M. (2003). The role of participative management (suggestion system) in hospital effectiveness and efficiency. Research in Medical Sciences, 8(3), 85-89.
32. Nguni, S., Sleegers, P. & Denessen, E. (2006). Transformational and transactional leadership effects on teachers’ job satisfaction, organizational commitment, and organizational citizenship behavior inprimary schools: The Tanzanian case. School Effectiveness and School Improvement, 17(2), 145-177.
33. Okpara, J. O. (2004). Personal characteristics as predictors of job satisfaction: An exploratory study of IT managers in a developing economy. Information Technology & People, 17(3), 327-338.
34. Petty M.M., McGee Gail W. & Cavender Jerry W. (1984). A meta-analysis of the relationships between individual job satisfaction and individual performance. The Academy of Management Review, 9(4), 712-21.
35. Piccolo R.F., & Colquitt, J.A. (2006). Transformational leadership and job behaviors: The mediating role of job characteristics. Academy of Management Journal, 49, 327-340.
36. Rad, A.M.M. & Yarmohammadian, M.H. (2006). A study of relationship between managers’ leadership style and employees’ job satisfaction. Leadership in Health Service, 19(2), 11-28.
37. Riaz A., & Haider, M.H. (2010). Role of transformational and transactional leadership on job satisfaction and career satisfaction. Business Economic Horizontal, 1(1), 29-38.
38. Rossmiller, R. A. (1992). The secondary school principal and teachers’ quality of work life. Educational Management and Administration, 20(3), 132-146.
39. Silins, H. & Mulford, B. (2002). Schools as learning organizations: The case for system, teacher and student learning. Journal of Educational Administration, 40, 425 – 446.
40. Sokolová M., Mohelská H., & Zubr V. (2016), Pay and offer of benefits as significant determinants of job satisfaction: A case Study in the Czech Republic. Economics and managemnt, 19(1), 108-120. DOI: dx.doi.org/10.15240/tul/001/2016-1-008.
41. Spector P.E. (2003). Industrial and organizational psychology. Research and practice. (3rd ed.). John Wiley & Sons, Inc, New York.
42. Staw B.M., & Ross J. (1985). Stability in the midst of a change: A dispositional approach to job attitudes. Journal of Applied Psychology, 70, 469-480.
43. Steger, M. F., Dik. B. J. & Duffy, R. D. (2012).Measuring Meaningful Work: The work and meaning Inventory (WAMI). Journal of Career Assessment, 20 (3), 322-337.
44. Suleiman Ibraheem, S.M., Hussein, A.A., & Ayat Mohammad, E.B. (2011).The relationship between transformational leadership and employees' satisfaction at Jordanian private hospitals. Business and Economic Horizons, 5(2), 35-46.
45. Walumbwa, F.O., Wang, P., Lawler, J.J. & Shi, K. (2004). The role of collective efficacy in the relations between transformational leadership and work outcomes. Journal of Occupational and Organizational Psychology, 77, 515-530.
46. Weiss, D.J., Dawis, R.V. England, G.W. & Lofquist, L.H. (1967), Manual for the minnesota satisfaction questionnaire. Vol. 22, Minnesota Studies in Vocational Rehabilitation, Minneapolis: University of Minnesota, Industrial Relations Center.
Mohamed Eid Kilase Ajoud and Tahar Jouili

Indian Journal of Natural Sciences www.tnsroindia.org.in ©IJONS Vol.8 / Issue 43 / Aug 2017 International Bimonthly ISSN: 0976 – 0997
12664
Table. 1: Descriptive statistics and preliminary analysis Variable Number
of items Mean Standard
Deviation Crombach
Alpha T- Test
T-value Sig
Charisma 8 4.095 0.854 0.873 31.864 0.000 Inspirational motivation
4 3.993 0.857 0.856 25.056 0.000
Intellectual stimulation
4 4.018 0.893 0.844 25.009 0.000
Individual Consideration
4 3.870 0.916 0.721 23.239 0.000
Job Satisfaction 20 3.909 0.859 0.847 37.459 0.000
Tab. 2: Factor analysis results Variable KMO Bartlett Test Number of
principal component
Initial Eigenvalues
> 1
Variance Explained
(%) Chi-
square p-value
Charisma (C) 0.855 1225.800 0.000 1 4.3 53.740% Inspirational motivation (IM)
0.793 636.260 0.000 1 2.812 70.311%
Intellectual stimulation (IS)
0.770 553.230 0.000 1 2.726 68.150%
Individual Consideration (IC)
0.675 309.690 0.000 1 2.191 54.774%
Job Satisfaction (JS) 0.710 2600.500 0.000 5 5.465 65.408%
Table.3: Factor loadings and principal component correlation with study variables Variable Standardized
factor loadings
Principal Component Correlations
Variable Standardized factor loadings
1stPrincipal Component Correlations
Charisma (C) Job Satisfaction (JS) C1 0.670 0.819 JS1 0.734 0.368 C2 0.692 0.832 JS2 0.773 0.308 C3 0.504 0.710 JS3 0.551 0.403 C4 0.623 0.651 JS4 0.804 0.401 C5 0.620 0.648 JS5 0.798 0.445 C6 0.633 0.577 JS6 0.645 0.436 C7 0.647 0.805 JS7 0.532 0.395 C8 0.610 0.781 JS8 0.785 0.376
Inspirational motivation (IM) JS9 0.627 0.498 IM1 0.738 0.810 JS10 0.536 0.498 IM2 0.871 0.832 JS11 0.593 0.621
Mohamed Eid Kilase Ajoud and Tahar Jouili

Indian Journal of Natural Sciences www.tnsroindia.org.in ©IJONS Vol.8 / Issue 43 / Aug 2017 International Bimonthly ISSN: 0976 – 0997
12665
IM3 0.896 0.878 JS12 0.647 0.656 IM4 0.841 0.779 JS13 0.568 0.667
Intellectual stimulation (IS) JS14 0.691 0.785 IS1 0.656 0.810 JS15 0.549 0.681 IS2 0.692 0.832 JS16 0.600 0.690 IS3 0.771 0.878 JS17 0.636 0.552 IS4 0.607 0.779 JS18 0.660 0.352
Intellectual stimulation (IS) JS19 0.657 0.624 IC1 0.357 0.597 JS20 0.697 0.310 IC2 0.738 0.859 IC3 0.673 0.820 IC4 0.624 0.651
Table 4: Job satisfaction dimension interpretation Dimension Correlated Items Dimension interpretation Dimension
name Total
Variance explained %
1 7, 9, 10, 11, 12, 13, 14, 15, 16, 17, 19
Satisfaction to personal capacity SPC 27.327%
2 2, 4, 18 Satisfaction to the head of the department capacity
SHDC 10.878
3 5, 6, 7 Satisfaction by the teamwork ST 8.674
4 3, 20 Satisfaction by accomplishment and creation
SAC 7.037
5 1, 8 Satisfaction by the work time SWT 6.139
Table 5: Correlation analysis C IM IS IC
Charisma (C) 1.000 Inspirational motivation (IM) 0.685** 1.000
Intellectuals stimulation (IS) 0.772** 0.702** 1.000 Individual consideration (IC) 0.726** 0.510** 0.642** 1.000
JS1 0.327** 0.267** 0.252** 0.479**
JS2 -0.080 0.081 -0.091 -0.004 JS 3 0.410** 0.217** 0.290** 0.390**
JS4 -0.198** -0.063 -0.040 -0.183**
JS5 0.158** 0.065 0.118* 0.202** Note: (*), (**) and (***) indicate that the correlation coefficient is significant at 10%, 5%, and 1% respectively.
Mohamed Eid Kilase Ajoud and Tahar Jouili

Indian Journal of Natural Sciences www.tnsroindia.org.in ©IJONS Vol.8 / Issue 43 / Aug 2017 International Bimonthly ISSN: 0976 – 0997
12666
Table 6a: Personal capacity as component of job satisfaction and its relationship with transformational leadership
Variables Coefficient S.E Student t Diagnostics
Personal capacity Charisma (C) -0.018 0.091 -0.198 R2 = 0.491
F = 25.772 Sig = 0.000
Inspirational motivation (IM) 0.120* 0.072 1.667 Intellectual stimulation (IS) -0.161* 0.084 -1.917 Individual consideration (IC) 0.534*** 0.072 7.417
Table 6b: The relationship between transformational leadership components and the head of the department capacity
Variables Coefficient S.E Student t Diagnostics
The head of the department capacity Charisma (C) -0.224*** 0.100 -2.240 R2 = 0.491
F = 5.766 Sig = 0.000
Inspirational motivation (IM) 0.332*** 0.080 4.150 Intellectual stimulation (IS) -0.246*** 0.093 -2.645 Individual consideration (IC) 0.147* 0.080 1.838
Table 6c: Regression Analysis Results between Transformational Leadership Components and the teamwork
Variables Coefficient S.E Student t Diagnostics
The teamwork Charisma (C) 0.379 0.930 0.408 R2 = 0.442
F = 19.710 Sig = 0.000
Inspirational motivation (IM) -0.104 0.074 -1.405 Intellectuals stimulation (IS) -0.063 0.086 -0.733 Individual consideration (IC) 0.208*** 0.074 2.811
Table 6d: Regression Analysis Results between Transformational Leadership Components and Accomplishment and creation as component of Job satisfaction
Variables Coefficient S.E Student t Diagnostics
Accomplishment and creation Charisma (C) -0.353*** 0.100 -3.530 R2 = 0.283
F = 7.044 Sig = 0.000
Inspirational motivation (IM) 0.045 0.079 0.570
Intellectual stimulation (IS) 0.287*** 0.092 3.120 Individual consideration (IC) -0.134* 0.079 -1.696
Mohamed Eid Kilase Ajoud and Tahar Jouili

Indian Journal of Natural Sciences www.tnsroindia.org.in ©IJONS Vol.8 / Issue 43 / Aug 2017 International Bimonthly ISSN: 0976 – 0997
12667
Table 6e: Regression Analysis Results between Transformational Leadership and Work time
Variables Coefficient S.E Student t Diagnostics
Work time Charisma (C) 0.088 0.102 0.863 R2 = 0.213
F = 3.831 Sig = 0.000
Inspirational motivation (IM) -0.082 0.080 -1.025 Intellectuals stimulation (IS) -0.014 0.940 -0.015 Individual consideration (IC) 0.190 0.800 0.238
Mohamed Eid Kilase Ajoud and Tahar Jouili
Indian Journal of Natural Sciences www.tnsroindia.org.in ©IJONS Vol.8 / Issue 43 / Aug 2017 International Bimonthly ISSN: 0976 – 0997
12668
A Comparative Study on the Diversity of Ornamental Fishes of Hirakud Reservoir to that of Cuttack Region on the Mahanadi River in Odisha and their Socio-Economic Benefit to the Livelihood of the Fishers’ of these Regions Tarun Kumar Singh1*, Bhikari Charan Guru1 and Saroj Kumar Swain2
1P.G. Department of Zoology, Utkal University, Bhubaneswar, Odisha, India. 2Central Institute of Freshwater Aquaculture, Indian Council of Agricultural Research, Kausalyaganga, Bhubaneswar, Odisha, India.
Received: 10 June 2017 Revised: 23 June 2017 Accepted: 25 July 2017 *Address for correspondence Tarun Kumar Singh Department of Animal Husbandry, Dairying and Fisheries, Ministry of Agriculture and Farmers’ Welfare, Government of India,Room No.482, Krishi Bhawan, New Delhi-110001, India. Email: [email protected], [email protected].
This is an Open Access Journal / article distributed under the terms of the Creative Commons Attribution License (CC BY-NC-ND 3.0) which permits unrestricted use, distribution, and reproduction in any medium, provided the original work is properly cited. All rights reserved. This study was conducted during January to August, 2014. The study while at Hirakud reservoir recorded 56 fish species belong to 36 genera, 19 families and 7 orders, about 43 fish species belong to 31 genera, 19 families and 7 orders recorded at Cuttack region. The analysis of compilation of the samples in the study further revealed that Cyprinidae was the most abundant family at both the region contributing 21 species at Hirakud and 15 species at Cuttack. At Hirakud, out of the 56 fish species recorded, 20 species were considered as ornamental fishes, 30 species as food fishes and 6 species as both ornamental and food fish whereas at Cuttack region, out of the 43 fish species, 18 species were considered as ornamental fishes, 20 species as food fishes and 6 species as both ornamental and food fishes. Among the recorded ornamental fishes, many species documented good abundance in these regions. The native ornamental fishes are fetching considerable price both in domestic market as well as international market. Since the livelihood of the fishers at both the study regions appeared to be socio-economically poor, the economically potential ornamental fish species recorded during study can be an important component of the agribusiness opportunity by systematic collection of the fishes from the wild. The study concluded that ornamental fish can be one of the alternatives for the fishers of the study regions for livelihood enhancement, if would be taken in a sustainable manner. Keywords : Ornamental fishes, Diversity, Jobra, Naraj, Hirakud, The Mahanadi river, Evenness, Jacquard index
ABSTRACT
RESEARCH ARTICLE
Indian Journal of Natural Sciences www.tnsroindia.org.in ©IJONS Vol.8 / Issue 43 / Aug 2017 International Bimonthly ISSN: 0976 – 0997
12669
INTRODUCTION Ornamental fish attracts hobbyist by its aesthetic value like colouration, peculiar body shape and swimming behaviour and mythological believe. This in turn become a trade practice globally due to the low operating cost and easy management system [1-2]. Ornamental fish farming is an important commercial component of aquaculture providing aesthetic requirements and up-keeping of environment [3]. Across the world, the ornamental aquatic industry is a business with a trade of approximately US$ 15 billion retail value with more than 2,500 species internationally [4-5]. It has been estimated that nearly 30-35 species of freshwater ornamental fishes have been dominating the global trade. Out of total freshwater ornamental fishes, nearly 90 per cent are developed through captive breeding. On the other hand, only 25 out of nearly 8,000 marine ornamental fish species are bred in captivity [1-6]. The trade of ornamental fish is growing with an annual growth rate of 8 to 9 per cent and offers a lot of scope for development of the sector [7]. Hirakud Reservoir, which stands largest man made reservoir in Asia with the longest dam in the world, a major irrigation reservoir commissioned in the year 1957 and is situated in Sambalpur, Jharsuguda and Bargarh districts of Odisha with location of 210 30’ N Latitude and 800 E Longitude and in the confluence of Mahanadi and the Ib. The reservoir has a water spread area of 463 km2. The catchment area of the reservoir is 83,395 km2 with shore line of 643.6 km [2-3, 8]. The commercial fishery of Hirakud Reservoir comprises nearly 40 species [9-10]. Although Hirakud is the longest man made earthen dam in the world, it remains one of the least researched reservoir in terms of its fishery potential [11]. The fish production from this large water body is comparatively low. However, the Reservoir provides bread and butter to more than 4000 fishermen families directly or indirectly dwelling in its periphery [11-12]. On the Mahanadi, at Jobra, Cuttack barrages were built in the 19th century during the British rule to irrigate 80,000 hectares of land in the Mahanadi Delta through the canals. On the Kathjodi, the barrage was made at Naraj in 1995 to control flood and to facilitate irrigation of the region. Both the barrages are located at 20˚ 29′ N 85˚ 25′ E. Though the barrages were incepted for irrigation and flood control, these are also considered potential fishing zones [13].
In view of the potentiality for fishery of both the regions, this study was envisaged to find out the diversity of ornamental fishes of these regions and correlate the findings in order to suggest possibilities of agribusiness through ornamental fishes in the selected regions on the Mahanadi River.
MATERIALS AND METHODS
The samples were collected from different landing centers and fish markets of the study regions. The samples were preserved in 5% formaldehyde solution. The taxonomic analysis was under taken by referring Day (1878), Talwar and Jhingran (1991) and Jayaram (1981) [14-16]. Scientific names of the identified fishes were confirmed by referring the website of fish base [17] and further confirmations of identifications of the fishes were done with the help of Zoological Survey of India, Kolkata. The threat status of the identified fishes were determined according to the Threatened Freshwater Fishes of India, National Bureau of Fish Genetic Resources, 2010 and IUCN Red list of Threatened Species, 2012.2 version [18].
Diversity index was calculated by following Shannon and Wiener (1963) formula:
S H= - ∑ Pi ln (Pi) i= 1
Tarun Kumar Singh et al.

Indian Journal of Natural Sciences www.tnsroindia.org.in ©IJONS Vol.8 / Issue 43 / Aug 2017 International Bimonthly ISSN: 0976 – 0997
12670
where; H= Shannon-Wiener index of diversity, S= total number of species, Pi= (Ni/N) proportion of total sample represented by species i, N= total number of individual of all species, Ni= total number of specimens of each species. Evenness of the diversity index was calculated by using the formula below [19]:
E= H/H max, where H max= ln(S)
Similarity of the species recorded at both the region under the study was calculated using Jacquard’s index:
Sj = j/(x+y-j) where: Sj is the similarity between any two zones X and Y, j is the number of species common to both the zones X and Y, x is the total number of species in zone X and y is the total number of species in zone Y [19]. Abundance of the fishes was calculated by the formula given below:
Abundance Index (AI) = (n×100)/N where: n=Number of specimen of a particular species
N= Total number of fish specimen in the sample (Kurup et al., 2004 and Sarkar et al., 2013) [20-21]. Personal interactions with the local fishers and fish retailers were held in order to collect information on the habitat and economic aspect of fishes of these regions. Besides, the socioeconomics of the fishers’ communities were studied by way of interviews with the fishers’ families of the study regions [2-3, 8, 20, 22]. RESULTS Species diversity and percentage of ornamental fishes Based on the taxonomic order, the entire collected specimen were identified and arranged, while the economic importance and their conservation status were also taken into account. At Hirakud, the study recorded 56 fish species belonging to 36 genera, 19 families and 7 orders. Cyprinidae was the most abundant family contributing 21 species. Out of these 56 fish species recorded, 20 species were considered as ornamental fishes, 30 species as food fishes and 6 species as both ornamental fish and food fish. Similarly, at Cuttack, 43 fish species belonging to 31 genera, 19 families and 7 orders were recorded and Cyprinidae was also the most abundant family contributing 15 species. Out of the recorded fish species, 18 species were considered as ornamental fishes, 20 species as food fishes and 6 species as both ornamental and food fishes. Table-1 and Table-2 alongwith the Fig.1, Fig.2 and Fig.3 demonstrate the above results.
During the study, it was also observed from the total composition of catch at both the regions that at Hirakud, small catfishes were higher followed by major carps and big catfishes whereas at Cuttack, major carps were higher followed by small catfishes and big catfishes (Fig.4). The calculated Shannon–Weiner diversity index was 3.59 at Hirakud whereas at Cuttack it was 3.34. The evenness was 0.90 at Hirakud and 0.93 at Cuttack. The threat status of the fishes at both the region revealed that at Hirakud, 13 species were vulnerable, 2 species were near threatened, 10 species were low risk near threatened, 25 species were low risk least concern, 5 species were found to be introduced and one species did not have sufficient data. At this same time, at Cuttack region it is found that 9 species were vulnerable, 1 species was near threatened, 8 species were
Tarun Kumar Singh et al.
Indian Journal of Natural Sciences www.tnsroindia.org.in ©IJONS Vol.8 / Issue 43 / Aug 2017 International Bimonthly ISSN: 0976 – 0997
12671
low risk near threatened, 22 species were low risk least concern, 2 species were found to be introduced and one species did not have sufficient data (Fig.5). The results stated that the species richness was slightly higher at Hirakud where as Cuttack region was slightly higher in diversity in fish species than Hirakud. The calculated similarity indices indicate that both the region substantially similar in diversity pattern with similarity index 0.737. The Abundance Index (AI) of both the regions revealed that most abundance species were Parambassis lala (Ham.), Xenentodon cancila (Ham.), Chanda nama (Ham.), Chanda ranga (Ham.), Gudusia chapra (Ham.), Lepidocephalichthys guntea (Ham.), Amblypharyngodon mola (Ham.), Osteobrama cotio (Ham.), Puntius sophore (Ham.), Rasbora daniconius (Ham.), Salmostoma bacaila (Ham.), Glossogobius giuris (Ham.), Mystus tengara (Ham.), Ompok pabda (Ham.), Wallago attu (Bl. & Schn.). Socio-economics of the fishers’ community A sample study of 100 fishers’ families at Hirakud was undertaken. All these families had a total population of 647 persons. While the number of females per thousand males was calculated as 830, the number of girls per 1000 boys was 872. The total monthly income of fishers’ family ranged from Rs. 1200 to Rs. 3100. The literacy rate of the fishers of this region was found as 51.1 per cent (Table-3).
The study found that at Cuttack region 50 fishers’ families were recorded with a total population of 375 persons. About 712 number of females was calculated against 1000 number of males. The number of girls against 1000 boys was about 847. The monthly income of the fishers’ families ranged between Rs.1100 and Rs.5300. The literacy rate was recorded as 60.9 per cent (Table-3). DISCUSSION Now-a-days, it is observed that the native fish species of India are not only in demand as ornamental fishes for trade in domestic market but also in international markets [23]. Some of these species are Chanda nama (Ham.), Mystus vitatus (Bloch), Notopterus notopterus (Pallas), Colisa fasciatus (Bloch &Schn.), Colisa laila (Ham.), Mastacembelus puncalus (Ham.), Brachydanio rerio (Ham.) and Botia lohachata (Chaudhuri.), etc. [24]. Among the 20 families of the collected fishes at both the study regions, baring 4 families, namely: Channidae, Cichlidae, Clupeidae and Synbranchidae, all families have ornamental fish representatives. This study reported good abundance of fishes considered as ornamental fish some of which are Parambassis lala (Ham.), Chanda nama (Ham.),Chanda ranga (Ham.), Amblypharyngodon mola (Ham.), Danio devario (Ham-Buch.), Osteobrama cotio (Ham.), Puntius sophore (Ham.), Puntius ticto (Ham.), Rasbora daniconius (Ham.),Glossogobius giuris (Ham.) and Notopterus notopterus (Pallas) etc. Besides, food fishes like Labeo gonius (Ham.), Channa marulius (Ham.) and Rita rita(Ham.) are also considered as ornamental fishes during their juvenile stages which substantially indicates the potentiality of these fish species with ornamental values [25].
The socioeconomic study of both the regions inferred that the fisher population was educationally backward. It was also found that female fishers were the most illiterate group. While the fishers at Cuttack were highly literate, fishers of Hirakud region had a higher number of females and girls per thousand males and boys respectfully. The average monthly income of fishers’ families at Cuttack region was found to be little higher than Hirakud region.
It is considered that inland fishers are more vulnerable in comparison to their counterparts in marine sector or aquaculture farmers. They are quite poor and give more efforts for life as they lack basic amenities. Without inclusive growth and improvement of their socio-economic condition, the ground reality of the fishery sector shall not be
Tarun Kumar Singh et al.
Indian Journal of Natural Sciences www.tnsroindia.org.in ©IJONS Vol.8 / Issue 43 / Aug 2017 International Bimonthly ISSN: 0976 – 0997
12672
changed. Poor condition of living standard, unequal access to monetary income, lack of basic amenities and most importantly the education may lead to terrible consequences and will put these fishers life in vulnerable condition [26-27]. Therefore, the time needs thoughtful attention in order to enhance the socioeconomic conditions of the fishers which in turn augment fish production [2-3, 8, 26-30].
The study suggests that the agribusiness concept mentioned in the studies by Mandal et al., 2007, Singh T.K, 2014 and Singh, T.K. et al., 2015 can be a suitable model and would give an opportunity to the fishers of both the regions under the study to take one step ahead towards augmenting their socioeconomic conditions. ACKNOWLEDGEMENTS The authors are thankful to the Directorate of Fisheries, Government of Odisha especially to Shri Arjun Charan Naik, the then Additional Director of Fisheries, Shri P. Ekka, Deputy Director of Fisheries (NZ), Sambalpur and Shri P.K. Patnaik, Junior Fishery Officer for rendering manifold help in conducting the study. The authors would also like to thank the fishers of the both the regions for their kind help.
REFERENCES 1. Swain, S.K., Sarangi, N. and Ayyappan, S., 2010. Ornamental Fish Farming, Hand Book of Fisheries and Aquaculture,
DIPA, ICAR, New Delhi, Reprint, 2013, 145p. 2. Singh, T.K., Guru, B.C. and Swain, S.K., 2013. Review of the Research on the Fish Diversity in the River Mahanadi
and Identifying the Probable Potential Ornamental Fishes among them with reference to threats and conservation measures. Research Journal of Animal, Veterinary and Fishery Sciences, ISCA, Vol. 1(3), April (2013), pp.16-24
3. Singh, T.K., Swain, S.K., and Guru, B.C. 2015. Biodiversity of Ornamental fishes of Hirakud Reservoir and their Socio-economic Benefits to the Fshers Communities of the Region. Indian Journal of Natural Sciences, Vol 6 (31), August (2015), p.9074-9082.
4. OFI, 2007.International Transport of Live Fish in the Ornamental Aquatic Industry. Reprinted by MPEDA, OFI educational publication-2.
5. FAO, 2016. Available at: http://www.fao.org. 6. Swain, S.K., 2006. Ornamental Fish Breeding and Culture, Hand Book of Fisheries and Aquaculture, DIPA, ICAR, New
Delhi, Reprint (2013), pp.500-532 7. MPEDA, 2016, Available at http://www.mpeda.com 8. Singh, T.K., 2014. Fish Diversity in Selected Stretch of the River Mahanadi in Odisha and Livelihood of Inhabiting
Fisher Community. International Research Journal of Biological Sciences, ISCA, Vol. 3(8), August (2014), p. 98-104
9. Mahapatra, D.K., 2003. Present Status of Fisheries of Hirakud Reservoir, Orissa, The Fishing Chimes, Vol.22 No. 10&11, Jan/Feb 2003, pp.76-79
10. Sugunan, V.V., 1995. Reservoir fisheries of India, Fisheries Aquaculture Department, FAO Corporate Documentary Repository. FAO, Rome
11. Parida, G. B. and Das, P.K., 2006. A Project Report on Fisheries Development in Hirakud Reservoir with Intervention for Livelihood of Fisherfolk, submitted to Fisheries Department, Govt. of Odisha.
12. Mondal, D.K., Kaviraj, A. and Saha, S., 2010. Water Quality Parameters and Fish Biodiversity Indices as Measures of Ecological Degradation: A Case Study in Two Floodplain Lakes of India, Journal of Water Resource and Protection, 2010, 2, pp.85-92
13. Yadav, Y.S. and Sugunan, V.V., 2009.Guidelines for Fisheries Management of Medium and Large Reservoirs in India. Department of Animal Husbandry, Dairying and Fisheries, Ministry of Agriculture, Government of India, 64p.
14. Department of Water Resources, Government of Odisha, 2016 (available at: www.dowrorissa.gov.in ).
Tarun Kumar Singh et al.

Indian Journal of Natural Sciences www.tnsroindia.org.in ©IJONS Vol.8 / Issue 43 / Aug 2017 International Bimonthly ISSN: 0976 – 0997
12673
15. Day, F., 1878. “The Fishes of India, being a natural history of the fishes known to inhabit the seas and freshwaters of India, Burma and Ceylon”,Dawson, London 1: 778; 2:195 plates reprint 1958.
16. Jayaram K. C., 1981. Freshwater Fishes of India Handbook, Zoological Survey of India. Calcutta. 17. Talwar, P.K., and Jhingran K.C., 1991.Inland fishes of India and adjacent countries, 3(1 and 2). Oxford and IBH Co.
Pvt. Ltd., New Delhi. 18. Fish Base, 2016. Available at: http://www.fishbase.org/search.php 19. IUCN, 2016. IUCN Red List of Threatened Species (ver.32012.2), available at: http://www.iucnredlist.org 20. Magurran, A. E., 1988. ‘Ecological Diversity and Its Measurement’ University Press, Cambridge 177p. 21. Kurup, B.M., Radhakrishnan, K.V., and Manojkumar, T.G., 2004; “Biodiversity status of fishes inhabiting rivers
of Kerala (S. India) with special reference to endemism, threats and conservation”, Proceedings of the Second International Symposium on the Management of Large Rivers for fisheries (Vol.II), FAO Corporate Documentary Repository, Produced by Regional Office for Asia and the Pacific: 164-182
22. Sarkar, U. K., Rebello, S. C., Khan, G.E., Dubey, V. K., Pathak, A. K. and Singh, S. P., 2013; Pattern of fish, Biodiversity in Uttar Pradesh: Current Status and Challenges for Sustainable Management of Resources, Uttar Pradesh State Biodiversity Board, International Day for Biologcal Diversity Water & Bioderversity:140-147
23. Bhattacharyya, R. C. and Dutta, A., 2012. Fishery Status of Undivided Goalpara District, Assam with reference to Socio-economic conditions of fishers. International Journal of Applied Biology and Pharmaceutical Technology Vol.3, Issue 3, July-Sept., 2012, pp.18-22.
24. Basu, A., Dutta, D and Banerjee, S; Indigenous ornamental fishes of West Bengal, Recent Research in Science and Technology, 4 (11): 12-21 (2012).
25. Ghosh, A., Mahapatra, K. C., and Datta, N.C., 2003.Hatibagan Haat, Kolkata, the largest wholesale ornamental fish market of Eastern India, The Fishing Chimes, Vol.23, No.1, April (2003),pp.166-168
26. Mandal, S., Mahapatra, B.K., Tripathi, Ngachan, S.V. , 2007; Agribusiness Opportunities of Ornamental Fisheries in North-Eastern Region of India, Agricultural Economics research review, Vol. 20 (Conference Issue): 471-488
27. Radhakrishnan, K.V. and Kurup, B.M. 2006. Distribution and stock size of freshwater ornamental fishes of Kerala (S India) with special reference to sustainability issue, Sustain Fish - International Symposium on Improved Sustainability of fish production systems and appropriate technologies for utilization, pp. 589-605.
28. Dutta, S.K. and Kundu, R., 2007. Socio-Economic Appraisal of Culture Based Fishermen: Case Study inWest Bengal. Journal of Social Science, 15(3): pp.255-262.
29. Sharma, S., Malakar, B., Sharma, R. and Chavhan, A., 2010. Socio-Economic& Technological Appraisal of Fishermen: A case study in Narmada River Basin (M.P.) India. Researcher, 2010; 2 (6) pp.17-22.
30. Lakra, W.S., 2010. Fish Biodiversity of Uttar Pradesh: Issues of Livelihood Security, Threats and Conservation, National Conference on Biodiversity, Development and Poverty Alleviation, Uttar Pradesh State Biodiversity Board, 22nd May (2010), pp.40-45.
31. Lakra, W. S., Sarkar, U. K., Kumar, R. S., Pandey, A., Dubey, V. K. and Gusain, O.P., 2010.Fish diversity, habitat ecology and their conservation and management issues of a tropical River in Ganga Basin, India, The Environmentalist, Springer Science+Business Media.
Tarun Kumar Singh et al.

Indian Journal of Natural Sciences www.tnsroindia.org.in ©IJONS Vol.8 / Issue 43 / Aug 2017 International Bimonthly ISSN: 0976 – 0997
12674
Table 1.The different fish species found during the present study and their categorization into different categories
Name of the Order Name of the Family Sl.No. Name of the species 1. Perciformes 1. Ambassidae 1 Parambassis lala (Ham.) 2. Anabantidae 2 Anabas testudineus (Bloch) 3 Colisa fasciatus (Bloch&Schn.) 3. Centropomidae 4 Chanda nama (Ham.) 5 Chanda ranga (Ham.) 4. Channidae 6 Channa gachua (Ham.) 7 Channa marulius (Ham.) 8 Channa punctatus (Bloch) 9 Channa striatus (Bloch) 5. Cichlidae 10 Oreochromis mossambicus (Peters) 11 Oreochromis niloticus (Linn.) 6. Gobiidae 12 Glossogobius giuris (Ham.) 7. Nandidae 13 Nandus nandus (Ham.) 2.Beloniformes 8. Belonidae 14 Xenentodon cancila (Ham.) 3.Clupeiformes 9.Clupeidae 15 Gudusia chapra (Ham.) 4. Cypriniformes 10.Cobitidae 16 Lepidocephalichthys guntea (Ham.) 11. Cyprinidae 17 Amblypharyngodon mola (Ham.) 18 Catla catla (Ham.) 19 Cirrhinus mrigala (Ham.) 20 Cirrhinus reba(Ham.) 21 Ctenophryngodon idella (Val.) 22 Cyprinus carpio (Linn.) 23 Danio devario (Ham-Buch.) 24 Danio (Brachydenio) rerio (Ham.) 25 Hypophthalmichthys molitrix (Val.) 26 Labeo bata (Ham.) 27 Labeo calbasu (Ham.) 28 Labeo fimbriatus (Bloch) 29 Labeo gonius (Ham.) 30 Labeo rohita (Ham.) 31 Osteobrama cotio (Ham.) 32 Osteobrama vigorsii (Sykes) 33 Puntius sarana (Ham- Buch.) 34 Puntius sophore (Ham.) 35 Puntius ticto(Ham.) 36 Rasbora daniconius (Ham.) 37 Salmostoma bacaila (Ham.) 5. Siluriformes 12. Bagridae 38 Mystus (Aorichthys) aor (Ham.)
Tarun Kumar Singh et al.

Indian Journal of Natural Sciences www.tnsroindia.org.in ©IJONS Vol.8 / Issue 43 / Aug 2017 International Bimonthly ISSN: 0976 – 0997
12675
39 Mystus (Aorichthys) seenghala (Sykes) 40 Mystus tengara (Ham.) 41 Mystus vitatus (Bloch) 13. Siluridae 42 Ompok bimaculatus (Bloch) 43 Ompok pabda (Ham.) 44 Ompokpabo (Ham.) 45 Wallago attu (Bl. &Schn.) 14. Sisoridae 46 Eriethistes hara(Ham.) 15. Saccobranchidae 47 Heteropneustes fossilis (Bloch) 16. Claridae 48 Clarias batrachus (Linn.) 17.Schilbeidae 49 Ailia coila (Ham.) 50 Clupisoma garua (Ham.) 51 Eutropiichthys vacha (Ham.) 6.Osteoglossiformes 18.Notopteridae 52 Chitala chitala (Ham.) 53 Notopterus notopterus(Pallas) 7. Synbranchiformes 19.Mastacembelidae 54 Macrognathus aral(Bloch &Schn.) 55 Mastacembelus armatus(Lacepede) 56 Mastacembelus puncalus (Ham.) 20. Synbranchidae 57 Monopterus cuchia(Ham.)
Table-2 Showing Species found, their threat status and the ornamental of food fish status.
Sl.No. Name of the species Hirakud Region
Cuttack Ornamental Fish (OF) / Food Fish (FF)
IUCN Status
1 Parambassis lala (Ham.) + + OF LRnt 2 Anabas testudineus (Bloch) + + OF VU 3 Colisa fasciatus (Bloch&Schn.) + + OF LRnt 4 Chanda nama (Ham.) + + OF LRlc 5 Chanda ranga (Ham.) + + OF LRlc 6 Channa gachua (Ham.) + + FF VU 7 Channa marulius (Ham.) + + FF LRnt 8 Channa punctatus (Bloch) + + FF LRnt 9 Channa striatus (Bloch) + + FF LRlc 10 Oreochromis mossambicus (Peters) + + FF Intrd. 11 Oreochromis niloticus (Linn.) + - FF Intrd. 12 Glossogobius giuris (Ham.) + + OF LRlc 13 Nandus nandus (Ham.) + + OF LRnt 14 Xenentodon cancila (Ham.) + + OF LRlc 15 Gudusia chapra (Ham.) + + OF LRlc 16 Lepidocephalichthys guntea (Ham.) + + OF LRlc 17 Amblypharyngodon mola (Ham.) + + OF LRlc 18 Catla catla (Ham.) + + F F VU 19 Cirrhinus mrigala (Ham.) + + F F LRlc
Tarun Kumar Singh et al.

Indian Journal of Natural Sciences www.tnsroindia.org.in ©IJONS Vol.8 / Issue 43 / Aug 2017 International Bimonthly ISSN: 0976 – 0997
12676
20 Cirrhinus reba(Ham.) + - F F VU 21 Ctenophryngodon idella (Val.) + - F F Intrd 22 Cyprinus carpio (Linn.) + + F F Intrd. 23 Danio devario (Ham-Buch.) + + OF LRlc 24 Danio (Brachydenio) rerio (Ham.) + + OF LRlc 25 Hypophthalmichthys molitrix (Val.) + - F F Intrd. 26 Labeo bata (Ham.) + - F F LRlc 27 Labeo calbasu (Ham.) + + F F NT 28 Labeo fimbriatus (Bloch) + + F F LRlc 29 Labeo gonius (Ham.) + + F F LRlc 30 Labeo rohita (Ham.) + + F F LRlc 31 Osteobrama cotio (Ham.) + + OF VU 32 Osteobrama vigorsii (Sykes) + - F F VU 33 Puntius sarana (Ham- Buch.) + + F F VU 34 Puntius sophore (Ham.) + + OF LRlc 35 Puntius ticto(Ham.) + - OF LRlc 36 Rasbora daniconius (Ham.) + + OF LRnt 37 Salmostoma bacaila (Ham.) + + F F LRlc 38 Mystus (Aorichthys) aor (Ham.) + + F F DD 39 Mystus (Aorichthys) seenghala (Sykes) + + F F LRlc 40 Mystus tengara (Ham.) + + OF LRlc 41 Mystus vitatus (Bloch) + - OF LRlc 42 Eriethistes hara(Ham.) - + OF/FF VU 43 Ompok bimaculatus (Bloch) + - FF VU 44 Ompok pabda (Ham.) + + FF LRnt 45 Ompok pabo (Ham.) + - FF LRnt 46 Wallago attu (Bl. &Schn.) + + OF LRlc 47 Heteropneustes fossilis (Bloch) + + OF/ FF VU 48 Clarias batrachus (Linn.) + + OF/ FF VU 49 Ailia coila (Ham.) + - FF NT 50 Clupisoma garua (Ham.) + - FF VU 51 Eutropiichthys vacha (Ham.) + - FF LRlc 52 Chitala chitala (Ham.) + - OF LRnt 53 Notopterus notopterus(Pallas) + + OF LRnt 54 Macrognathus aral(Bloch &Schn.) + + OF /FF LRlc 55 Mastacembelus armatus(Lacepede) + + OF/ FF LRlc 56 Mastacembelus puncalus (Ham.) + + OF/ FF LRlc 57 Monopterus cuchia(Ham.) + + FF VU
Total 56 43 Note: (+) = Reported, (-) = Not Reported LRnt: Low Risk near threatened, VU: Vulnerable,LRlc: Low Risk least concern,Intrd.:Introduced, NT: Near Threatened, DD: Data Deficient
Tarun Kumar Singh et al.

Indian Journal of Natural Sciences www.tnsroindia.org.in ©IJONS Vol.8 / Issue 43 / Aug 2017 International Bimonthly ISSN: 0976 – 0997
12677
Table-3 Socio-economic profile of the fishers of both the study regions
Soci-economic Parameters Hirakud Cuttack Number of Fishers families 100 50 Total Population 647 375 Number of Females per 1000 Males 830 712 Number of girls per 1000 boys 872 847 Total Monthly income Rs. 1200-3100 Rs.1100-5300 % of literacy 51.1% 60.9%
*A sample of 100 fisher families was collected during the study
Fig.1 Comparision of number of fish species in their respective families at Hirakud and Cuttack
Fig.2. Comparison of number of fish families in their respective orders at Hirakud and Cuttack
Tarun Kumar Singh et al.
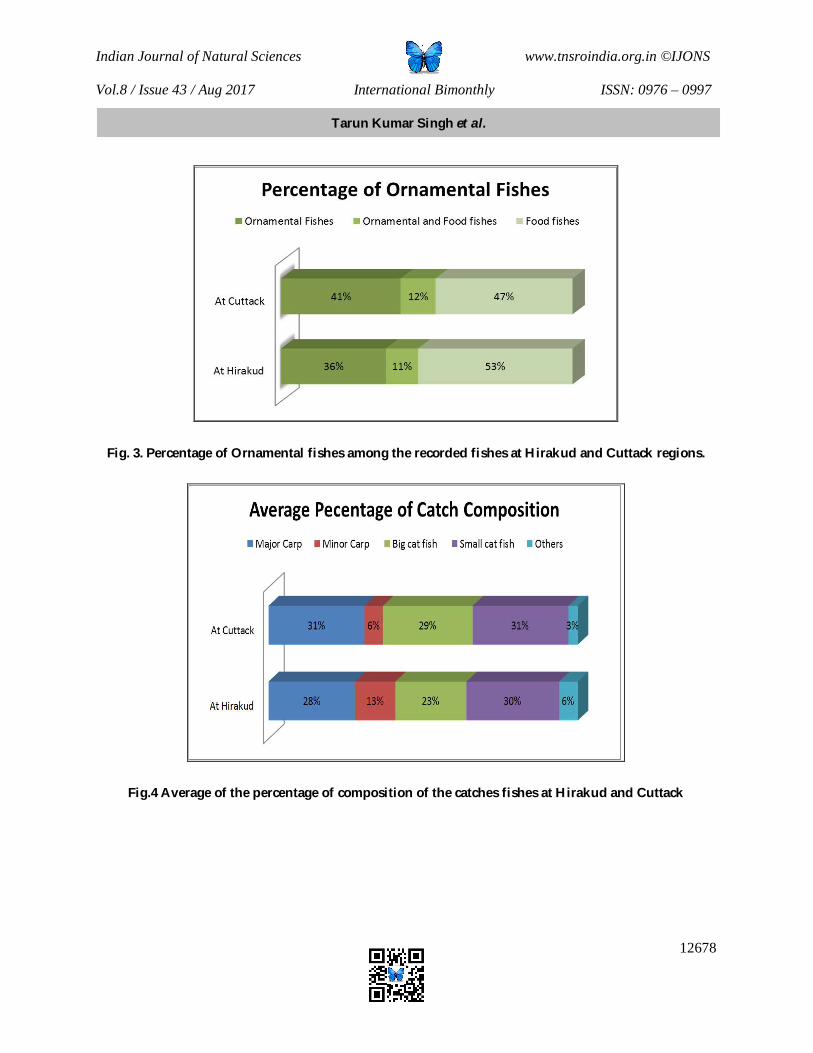
Indian Journal of Natural Sciences www.tnsroindia.org.in ©IJONS Vol.8 / Issue 43 / Aug 2017 International Bimonthly ISSN: 0976 – 0997
12678
Fig. 3. Percentage of Ornamental fishes among the recorded fishes at Hirakud and Cuttack regions.
Fig.4 Average of the percentage of composition of the catches fishes at Hirakud and Cuttack
Tarun Kumar Singh et al.

Indian Journal of Natural Sciences www.tnsroindia.org.in ©IJONS Vol.8 / Issue 43 / Aug 2017 International Bimonthly ISSN: 0976 – 0997
12679
Fig.5.Threat status of the fish species recorded in the study at Hirakud and Cuttack.
Tarun Kumar Singh et al.
Indian Journal of Natural Sciences www.tnsroindia.org.in ©IJONS Vol.8 / Issue 43 / Aug 2017 International Bimonthly ISSN: 0976 – 0997
12680
Haematology and Serum Biochemistry of Captive Adult Male Bonnet Macaques (Macaca radiata) Under Midazolam-Ketamine Anaesthesia after Haloperidol Premedication K.S.Kamalesh Kumar1*, George Chandy1, S.Sooryadas1, John Martin1, P.M.Deepa2, Binoy C. Babu3 and C.Sunanda4
1Department of Veterinary Surgery and Radiology, College of Veterinary and Animal Sciences, Kerala Veterinary and Animal Sciences University, Pookode,Wayanad – 673576, Kerala, India. 2Department of Veterinary Epidemiology and Preventive Medicine, College of Veterinary and Animal Sciences, Kerala Veterinary and Animal Sciences University, Pookode, Wayanad – 673576, Kerala, India. 3Veterinary Surgeon, State Museum and Zoo,Thrissur,Kerala, India. 4Department of Statistics, College of Veterinary and Animal Sciences,Kerala Veterinary and Animal Sciences University, Pookode, Wayanad – 673576, Kerala, India. Received: 21 July 2017 Revised: 28 July 2017 Accepted: 30 July 2017 *Address for correspondence Dr. K.S.Kamalesh Kumar M.V.Sc. Scholar Department of Veterinary Surgery and Radiology, College of Veterinary and Animal Sciences, Kerala Veterinary and Animal Sciences University, Pookode, Wayanad – 673576 Phone- +91 9164282969, 9526551456 Email: [email protected]
This is an Open Access Journal / article distributed under the terms of the Creative Commons Attribution License (CC BY-NC-ND 3.0) which permits unrestricted use, distribution, and reproduction in any medium, provided the original work is properly cited. All rights reserved. A study was conducted to estimate the haematological and serum biochemical parameters of six captive adult male healthy Bonnet Macaques which underwent vasectomy as part of routine population control measures at the State Museum and Zoo,Trichur,Kerala.The animals were premedicated orally using haloperidol(1 mg/kg body weight) and anaesthetised using midazolam(0.1 mg/kg body weight) and ketamine (10 mg/kg body weight) combination intramuscularly. Evaluation of haematological and serum biochemical parameters was performed using blood collected by cephalic venipuncture immediately after induction of anaesthesia. Mean±SE values of haemoglobin(g/dL), volume of packed red cells (per cent), total erythrocyte count of (106/µL) and total leucocyte count (103/µL) were found to be 13.33±0.47, 38.50±0.61, 5.06±0.21 and 15.84±0.65, respectively. Mean±SE values of granulocytes, lymphocytes, and monocytes were found to be 45.26±6.82, 43.38±3.88 and 13.01±2.33 percent, respectively. Mean±SE values
ABSTRACT
RESEARCH ARTICLE

Indian Journal of Natural Sciences www.tnsroindia.org.in ©IJONS Vol.8 / Issue 43 / Aug 2017 International Bimonthly ISSN: 0976 – 0997
12681
of mean corpuscular volume(fl), mean corpuscular haemoglobin(pg) and mean corpuscular haemoglobin concentration(%) were found to be 87.45±1.02, 24.91±0.47 and 28.03±0.44, respectively. Glucose(mg/dL), creatine kinase(U/L), aspartate aminotransferase(U/L),alanine aminotransferase(U/L), calcium(mmol/L), sodium(mg/dL) and potassium(mmol/L)levels were found to be 98.16±13.11,313.31±35.38,41.53±5.57, 26.31±3.42,0.61±0.07659,144.83±3.23 and 3.21±0.27, respectively. Keywords : Non-human primate, Bonnet Macaque (Macacaradiata), haematology, serum biochemistry INTRODUCTION
Non-human primates are very popular among zoo animals (McPherson et al., 2013; Palanivelrajan etal., 2015) and are also commonly used as experimental animals in biomedical research (Ramachandra etal., 1998; Mythili etal., 2005). Bonnet Macaques (Macacaradiata), an endemic Old World monkey species of South India, have tremendous scope in biomedical research. Haematological and serum biochemical parameters of Bonnet Macaques are less reported compared to that of other species of macaque like the Rhesus. Bonnet Macaques (Macacaradiata) are a common species of non-human primates endemic to the southern peninsular region of India (Mythili etal.,2005) and are common exhibits of Indian zoos. Haematological and serum biochemical examination are important tools to understand the health status as well as to diagnose diseases of animals (Pierre etal., 2011; Palanivelrajan etal., 2015). Haematological and serum biochemical parameters of Bonnet Macaques are less reported compared to that of other species of non-human primates commonly used for research purposes like the Rhesus Macaques (Macaca mulatta). Physical and chemical restraints have been found to alter haematological and serum biochemical values of non-human primates (Loomis etal.,1980; Yoshida etal.,1986; Hom etal.,1999). Similarly, habitat, living conditions and nutrition of an animal can affect its health status.So, a comprehensive approach considering the age, sex, habitat and nutrition of the animal has to be considered during interpretation of results obtained during similar studies. A study was conducted to estimate haematological and serum biochemical parameters of captive healthy adult male Bonnet Macaques under midazolam-ketamine anaesthesia after haloperidol premedication.
MATERIALS AND METHODS Animals The study was conducted during the month of March 2017in six healthy adult male captive Bonnet Macaques of different ages kept at the State Museum and Zoo, Thrissur (10.53°N 76.22°E), which were being anaesthetised for routine vasectomy procedure for controlling the population of these animals as per directions of Central Zoo Authority of India. The animals were randomly selected from a group of 95 Bonnet Macaques maintained in three enclosures of 9.1 x 4.5 x 9.1 metres (lxbxh). All the selected animals were separated from their enclosures and housed separately in cages of 90x55x55 cms (lxbxh) to facilitate easy handling. Mean±SE of body weight of the animals was 4.17±0.78 kgs. All animals were dewormed 15 days prior to the procedure and were fed with normal zoo diet. Chemical restraint and blood collection The health status of all the monkeys was visually assessed on the day prior to the day of the procedure. The animals were fasted for eight hours prior to oral premedication with haloperidol (Serenace 10®, RPG Life Sciences Ltd. Ankleshwar) at the rate of 1 mg/kg body weight in pineapple juice. After four hours of premedication, they were physically restrained and anaesthetised using a combination of midazolam (Napro-Mida®-1, Miracalus Pharma Pvt.
Kamalesh Kumar et al.

Indian Journal of Natural Sciences www.tnsroindia.org.in ©IJONS Vol.8 / Issue 43 / Aug 2017 International Bimonthly ISSN: 0976 – 0997
12682
Ltd., Mumbai) and ketamine hydrochloride (Zokent®, Miracalus Pharma Pvt. Ltd., Mumbai) intramuscularly at the rate of 0.1 and 10 mg/kg body weight, respectively. Once the anaesthesia was induced, hair over the antebrachial region of the forearm was shaved and the skin was prepared aseptically using isopropyl alcohol and povidone iodine. A 22G intravenous cannula (BD Venflon™ IV cannula, Becton Dickison India (P) Ltd.) was used to catheterise the cephalic vein in a standard manner and four ml of blood was collected. Half the volume of the blood sample was immediately transferred to K3 EDTA vacutainers (BD Vacutainer®, K3 EDTA, 3.6mg, 2ml, BD Franklin Lakes, NJ, USA) for haematology and the remaining blood was transferred to clot activator tubes (CML Biotech (P) Ltd., Kerala, India) for serum biochemical evaluation. Haematology and biochemistry The total erythrocyte count(TEC) (106/µL), total leucocyte count (TLC)(103/µL), haemoglobin concentration(g/dL), volume of packed red cells (VPRC) (percent), differential leucocyte count(DLC)(%), mean corpuscular volume (MCV) (fl), mean corpuscular haemoglobin (MCH) (pg) and mean corpuscular haemoglobin concentration (MCHC) (%) were analysed in a veterinary haematological analyser (Mythic 8 VET®, ORPHEE, Switzerland) which was calibrated for Bonnet Macaque blood cells and reference ranges were pre-set for analysis. Plasma glucose(mg/dl), plasma sodium ion concentration(mmol/l), calcium ion concentration(mmol/l) and potassium ion concentration (mmol/l) were estimated in portable blood gas analyser (epoc® Blood Analysis System, and epoc BGEM Test Card, Epocal, INC. Ottawa, ON Canada). Serum creatine kinase(u/l), serum aspartate aminotransferase (u/l) and serum alanine aminotransferase (u/l) were analysed in semi-automatic analyser(Master-T®, Hospitex Diagnostics, Italy) with appropriate kits. Statistical analysis All the obtained data was analysed using independent samples t-test using IBM-SPSS software.
RESULTS Mean±SE values of all the haematological and biochemical parameters observed during the study are presented in Tables 1 and 2.
DISCUSSION Studies have been reported earlier for haematology and biochemistry in chimpanzees (Herndon and Tigges, 2001), Cynomolgus Macaques (Kim et al., 2005; Bonfantiet al., 2009; Xieet al., 2013), Rhesus Macaques (Hom etal., 1999; Chen etal., 2009; Lugo-Roman etal., 2009), African Green Monkeys (Casaco etal.,2010), Tibetan Macaques (Wu et al., 2013; Wu et al.,2014) and Black Howler Monkeys (Rovirosa-Hernandez etal.2011). A review of available literature revealed existence of only few reports of haematological and serum biochemical parameters in Bonnet Macaques.Many studies on haematological and biochemical parameters of non-human primates other than Bonnet Macaques have been conducted under ketamine anaesthesia (Loomis etal., 1980; Wall etal., 1985; Bennett etal., 1992; Larsson et al., 1999; Pierre etal., 2011). Bolliger etal. (2012) observed that the most commonly used anaesthetic agents during haematological studies in non-human primates was ketamine followed by Telazol®, sevoflurane or isoflurane. Earlier studies on haemotological and biochemical parameters of Bonnet Macaques have been reported under physical restraint (Ramachandra et al., 1998; Mythili etal., 2005), ketamine anaesthesia (Pierre etal., 2011), ketamine and xylazine anaesthesia (Palanivelrajan etal., 2011; Palanivelrajan etal., 2015) and ether anaesthesia (Rahamanetal., 1975).
Kamalesh Kumar et al.

Indian Journal of Natural Sciences www.tnsroindia.org.in ©IJONS Vol.8 / Issue 43 / Aug 2017 International Bimonthly ISSN: 0976 – 0997
12683
Comparison of haematological and serum biochemical parameters of Bonnet Macaques observed by various authors following physical restraint as well as chemical restraint using various protocols is presented in Tables 3 and 4. Physical restraint and anaesthesia of untrained monkeys have been found to be stressful and to alter the levels of haematological and serum biochemical parameters(Loomis et al.,1980;Yoshida et al.,1986; Hom etal.,1999; Venkatesan etal.,2006).Earlier studies have been reported in both captive(Ramachandra etal., 1998; Balasubramanyamet al., 2011; Palanivelrajan etal.,2011; Pierre etal.,2011) and free ranging animals (Rahaman etal., 1975; Mythili etal., 2005). The haemoglobin level (13.33±0.47) obtained in the present study was in agreement with the findings of Rahaman etal. (1975), Ramachandra et al. (1998), Mythiliet al. (2005) and Pierre etal.(2011). The observations in the present study were slightly higher than that of other studies by Balasubramanyam etal (2011) and Palanivelrajanet al. (2011), which may have been due to the effect of ketamine anaesthesia (Bolliger etal., 2012). But haemoglobin level was found to be lower in the study of Palanivelrajan etal. (2011) during ketamine-xylazine anaesthesia. Total erythrocyte count (TEC) was found to be in agreement with the report of Ramachandra et al.(1998). Higher values of TEC were recorded by Palanivelrajanet al. (2011) and Pierre et al. (2011) during ketamine-xylazine and ketamine anaesthesia respectively. While lower values were obtained during other studies (Rahamanet al., 1975; Balasubramanyamet al., 2011). Total leucocyte counts(TLC) was found to be similar to that observed in the studies of Rahamanet al. (1975), Ramachandra etal.(1998), Mythiliet al.(2005) and Palanivelrajanet al (2011). But lower values were obtained during studies of Balasubramanyamet al (2011) and Pierre et al.(2011). Ketamine had been found to reduce TLC in Rhesus (Loomis et al., 1980) and Cynomolgus monkeys (Yoshida et al., 1986). Pierre et al.(2011) also reported lower TLC during ketamine anaesthesia. Variation in the haematological parameters observed from other studies may also have been due to difference in the geographical origin of the animals as mentioned by Bolliger etal.(2012). Monocyte count (13.01±2.33) was found higher in the present study in comparison with previous studies by Ramachandra etal(1998), Mythili etal. (2005), Balasubramanyamet al (2011) and Palanivelrajan etal (2011). The higher monocyte count may have been due to release of corticosteroids during physical restraint and induction of anaesthesia as suggested by Benjamin(1985). Lymphocyte count (43.38±3.88) was found to be higher in this study which was similar to the findings of Rahaman etal.(1975),Mythili etal.(2005), Balasubramanyam etal(2011), Palanivelrajan etal.(2011) and Pierre etal.(2011). Lower values were observed by Ramachandra etal (1998). Physical or chemical restraint may not have serious effects on lymphocyte counts. Granulocytes count (45.26±6.82) was found to be similar to that of the observations of Pierre et al.(2011), but was higher than that observed in the study of Rahamanet al (1975),Ramachandra etal (1998),Mythili etal.(2005) and Palanivelrajan etal. (2011). Differential count of granulocytes was not attempted in this study. Segmented neutrophils in studies of Mythili etal. (2005), Balasubramanyam etal.(2011) and Pierre et al.(2011) were found to be similar. Higher values were recorded in studies of Rahamanet al.(1975) and Ramachandra et al. (1998). Eosinophil counts were found to be similar to that of studies of Rahamanet al (1975), Ramachandra et al. (1998) and Pierre et al.(2011). Slightly higher value of 4.5±3.17 was obtained by Mythiliet al. (2005). Basophils were not obtained in studies of Rahaman etal.(1975) and Pierre etal.(2011). Values of 1.80±0.80 and 3.2±2.57 were noticed in the studies of Ramachandra et al (1998) and Mythili etal.(2005), respectively.
Volume of packed red cells (38.50±0.61) obtained in the present study was similar to that of Balasubramanyamet al. (2011) and Pierre et al. (2011), but was found to be slightly lower than that in the study by Palanivelrajanet al. (2011). This lowering of VPRC level may have been due to the effect of ketamine as suggested by Loomis etal. (1980) and Yoshida et al. (1986). Ketamine anaesthesia has been found to reduce VPRC levels in Rhesus (Loomis etal., 1980) and Cynomolgus monkeys (Yoshida et al., 1986).MCV, MCH and MCHC counts were found to be similar to that of other studies. MCV (87.45±1.02) and MCH (24.91±0.47) were found to be in agreement with the findings of Balasubramanyametal. (2011) and Pierre etal. (2011). A slightly lower value was observed by Palanivelrajanet al.
Kamalesh Kumar et al.
Indian Journal of Natural Sciences www.tnsroindia.org.in ©IJONS Vol.8 / Issue 43 / Aug 2017 International Bimonthly ISSN: 0976 – 0997
12684
(2011) during ketamine-xylazine anaesthesia. MCHC (28.03±0.44) was in agreement with the observation of Pierre etal.(2011), but a slight lower value of 25.90±1.80 was observed by Palanivelrajanet al. (2011). Glucose values (98.16±13.11) obtained during the present study were found to be similar to the study of Rahaman etal. (1975) and Ramachandra et al. (1998). Slightly lower levels were recorded by Mythili etal. (2005), Pierre etal. (2011) and Palanivelrajan etal. (2015). Hall and Everds (2003) reported that fasting blood glucose levels was lower (40-80 mg/dl) in macaques. Ketamine was found to increase the level of serum glucose in Cynomolgus monkeys (Yoshida etal., 1986). The higher levels of glucose in the present study may have been due to stress related to physical restraint and induction of anaesthesia. The level of creatine kinase (313.31±35.38) was found to be lesser than the observations of Ramachandra et al.(1998) and Pierre etal.(2011). Aspartate aminotransferase level (41.53±5.57) was found to be in agreement with that of Palanivelrajan etal. (2015) but a slightly lower value was recorded by Pierre etal. (2011). Alanine aminotransferase level (26.31±3.42) was found to be in agreement with reports of Pierre etal. (2011) and Palanivelrajan etal (2015). Increased levels of CK, AST and ALT have been observed during prolonged restraint in Rhesus Macaques (Tatsumiet al., 1990). The lower levels of creatine kinase and aspartate amino transferase indicate lesser skeletal muscle damage during physical restraint and anaesthesia, which may have been due to the calming effect of premedication.The serum calcium level (0.61±0.07) observed in the present study was lower than that of previous studies reported by Rahaman etal. (1975), Ramachandra et al. (1998), Mythili etal.(2005) and Pierre etal.(2011). Ketamine anaesthesia was also found to decrease the level of serum calcium in Cynomolgus monkeys (Yoshida etal., 1986). Sodium level (144.83±3.23) observed in the present study was in agreement with the reports of Ramachandra etal. (1998), Mythiliet al. (2005) and Pierre et al. (2011), whereas a lower value was obtained in the study of Rahaman etal.(1975). Potassium level (3.21±0.27) observed in the present study was in agreement with the reports of Ramachandra etal. (1998), Mythili etal. (2005) and Pierre etal. (2011). However, slightly higher values were noticed by Rahaman etal (1975). The variation observed in the electrolytes may be due to difference in the levels of nutrition and metabolism as noted by Palanivelrajan etal. (2015).
CONCLUSION A study was conducted to evaluate haematological and serum biochemical parameters of adult male captive Bonnet Macaques under midazolam-ketamine anaesthesia following haloperidol premedication. Physical restraint of untrained macaques or chemical restraint may alter the levels of haematological and serum biochemical parameters. The information provided in the study in adult male Bonnet Macaques could be used as references for these parameters.The limitation of the study was that sample size was small (six animals). Hence, a study involving a larger sample size comprising of healthy captive and free ranging individuals of the species from different habitats, geographical regions and management conditions would be needed to provide more standard reference ranges in future.
ACKNOWLEDGMENTS The authors gratefully acknowledge Dr.Binoy C. Babu, Veterinary Surgeon, State Museum and Zoo, Thrissur, Kerala, India and staff of the zoo for their support during the study and the Kerala Veterinary and Animal Sciences University for providing research grants and rendering facilities to carry out this work. REFERENCES 1. Balasubramanyam D, Geetha G, Shanthi G and Srinivasan, R. Haematological studies in Bonnet Macaque
monkey (Macacaradiata). Indian J Field Vet 2011;6:32-33.
Kamalesh Kumar et al.
Indian Journal of Natural Sciences www.tnsroindia.org.in ©IJONS Vol.8 / Issue 43 / Aug 2017 International Bimonthly ISSN: 0976 – 0997
12685
2. Benjamin MM. Outline of Veterinary Clinical Pathology. 3rd ed. Kalyani publications, New Delhi;2001 3. Bennett JS, Gossett KA, McCarthy MP andSimpson ED. Effect of ketamine hydrochloride on serum biochemical
and hematologic variables in Rhesus monkeys. Vet ClinPathol1992;21:15-18. 4. Bolliger AP, Everds NE, Zimmerman KL, Moore DM, Smith SA and Barnhart KF.Hematology of Laboratory
Animals. In: Weiss DJ, Wardrop KJ.Schlam’s Veterinary Hematology, 6th edn. Blackwell Publishing LTD., USA, 2010 pp. 852-887
5. Bonfanti U, Lamparelli D, Colombo P andBernardi C.Hematology and serum chemistry parameters in juvenile Cynomolgus monkeys (Macacafascicularis) of Mauritius origin: comparison between purpose‐bred and captured animals. J Med Primatol 2009;38:228-235.
6. Casaco A, Beausoleil I, Gonzalez B, Luaces P, Leon A, Arteaga ME, Prado P, Rodríguez V, Perez A, Guevara G. and Bada AM.Hematological, biochemical, respiratory, cardiovascular and electroneurophysiological parameters in African Green monkeys (Cercopithecus aethiopssabaeus). Its use in non‐clinical toxicological studies. J Med Primatol2010;39:177-186.
7. Chen Y, Qin S, Ding Y, Wei L, Zhang J, Li H, Bu H, Lu Y and Cheng J. Reference values of clinical chemistry and hematology parameters in Rhesus monkeys (Macacamulatta). Xenotransplantation 2009;16:496-501.
8. Hall RL andEverds NE. Factors affecting the interpretation of canine and non-human primates clinical pathology. ToxicolPathol2003;31:6-10.
9. Herndon JG andTigges, J. Hematologic and blood biochemical variables of captive chimpanzees: cross-sectional and longitudinal analyses. Comp Med 2001;51:60-69.
10. Hom GJ, Bach TJ, Carroll D, Forrest MJ, Mariano MA, Traino CE, Wang PR and MacIntyre DE. Comparison of cardiovascular parameters and/or serum chemistry and hematology profiles in conscious and anesthetized Rhesus Monkeys (Macaca mulatta). J Am Assoc Lab AnimSci 1999;38:60-64.
11. Kim CY, Lee HS, Han SC, Heo JD, Kwon MS, Ha CS and Han SS.Hematological and serum biochemical values in Cynomolgus monkeys anesthetized with ketamine hydrochloride. J Med Primatol 2005;34:96-100.
12. Larsson MHMA, Birgel EH, Benesi FJ, Birgel Jr EH, Lazaretti P, Fedullo JDL, Larsson Jr C E, Molina SR, Guerra PPCDA and Prada CS.Hematological values of Cebusapella anesthetized with ketamine. Braz J Vet Res AnimSci 1999;36:3.
13. Loomis MR, Henrickson RV and Anderson JH. Effects of ketamine hydrochloride on the hemogram of Rhesus monkeys (Macacamulatta). Lab AnimSci 1980;30:851-853.
14. McPherson FJ. Normal blood parameters, common diseases and parasites affecting captive non-human primates. J Primatol 2013;2:112.
15. Lugo‐Roman LA, Rico PJ, Sturdivant R, Burks R and Settle, TL. Effects of serial anesthesia using ketamine or ketamine/medetomidine on hematology and serum biochemistry values in Rhesus Macaques (Macacamulatta). J Med Primatol 2010;39:41-49.
16. Mythili MD, Vyas R, Patra SS, Nair SC, Akila G, Sujatha R and Gunasekaran S. Normal hematological indices, blood chemistry and histology and ultrastructure of pancreatic islets in the wild Indian Bonnet monkeys (Macacaradiataradiata). J Med Primatol 2005;34:35-40.
17. PalanivelrajanM, Jayarthangaraj MG, Sridhar R and Thirumurugan MPR. Serum bio-chemical indices in captive Bonnet Macaques (Macacaradiata). Indian J Vet AnimSci Res 2015;44:42-45.
18. Palanivelrajan M, Jayathangaraj MG, Sridhar R and Parthiban M.Haematology of captive Bonnet Macaques (Macacaradiata). Tamilnadu J Vet AnimSci2011;7:216-217
19. Pierre PJ, Sequeira MK, Corcoran CA, Blevins MW, Gee M, Laudenslager ML and Bennett AB.Hematological and serum biochemical indices in healthy Bonnet Macaques (Macacaradiata). J Med Primatol 2011;40:287-293.
20. Rahaman H, Srihari K, and Krishnamoorthy RV. Comparative haematology, haemochemistry and electrocardiography of the Slender Loris and Bonnet monkey. Lab Anim 1975;9:69-78.
21. Ramachandra SG, Ramesh V, Krishnamurthy HN, Ravindranath N and Shetty TK. Normal hematological and plasma biochemical parameters of the captive Bonnet monkey (Maccacaradiata). Primates 1998;39:127-134.
Kamalesh Kumar et al.

Indian Journal of Natural Sciences www.tnsroindia.org.in ©IJONS Vol.8 / Issue 43 / Aug 2017 International Bimonthly ISSN: 0976 – 0997
12686
22. Rovirosa‐Hernandez MJ, García‐Orduña F, Caba, M, Canales‐Espinosa D, Hermida‐Lagunes J and Torres‐Pelayo VR. Blood parameters are little affected by time of sampling after the application of ketamine in Black Howler monkeys (Alouattapigra). J Med Primatol 2011;40:294-299.
23. Tatsumi T, Komatsu H and Adachi J. Effects of chair restraint on plasma enzyme values in the Rhesus Monkey (Macacamulatta). ExpAnim 1990;39:353-359.
24. Venkatesan R, Nagarajan P, Rajaretnam RS andMajumdar SS. Hematologic and serum biochemical values in aged female Bonnet Macaques (Macacaradiata) anesthetized with ketamine hydrochloride. J Am Assoc Lab AnimSci 2006;45:45-48.
25. Wall HS, Worthamn C and Else JG. Effects of ketamine anesthesia stress and repeated bleeding on the hematology of vervet monkeys. Lab Anim1985;19:138–144.
26. Wu D, Jiang WY, Yang F, Wei SY, Zhou L, Yi Y, Wang HX, Zhang YA and Yue F.Somatometric measurements, and clinical chemistry and hematology parameters in Tibetan macaque (Macacathibetana). J Med Primatol 2013;42:318-324.
27. Wu D, Yi Y, Sun F, Zhou L, Yang F, Wang H, Zhang G, Zhang YA, and Yue F. Effects of Age and Sex on the Hematology and Blood Chemistry of Tibetan Macaques (Macacathibetana). J Am Assoc Lab AnimSci2014;53:12-17.
28. Xie L, Xu F, Liu S, Ji Y, Zhou Q, Wu Q, Gong W, Cheng K, Li J, Li L and Fang L. Age-and sex-based hematological and biochemical parameters for Macacafascicularis. Plos One 2013;8:e64892.
29. Yoshida T, Suzuki K, Shimizu T, Cho F andHonjo S. The effects of ketamine anesthesia on hematological and serum biochemical values in female Cynomolgus monkeys (Macacafascicularis). ExpAnim 1986;35:455-461.
Table 1: Haematological results
Table 2: Biochemical results
Parameter
Haemoglobin Conc. (g/dL)
TEC (×106/µL)
TLC (×103/µL)
Monocytes (%)
Lymphocytes (%)
Granulocytes (%)
VPRC (%)
MCV (fL)
MCH (pg)
MCHC (g/dL)
Mean±SE (n=6)
13.33±0.47 5.06± 0.21
15.84± 0.65
13.01± 2.33
43.38± 3.88
45.26± 6.82
38.5± 0.61
87.45± 1.02
24.91± 0.47
28.03± 0.44
Range of actual observations
9.8–14.5 3.98–6.83
7.1–16.8
4–14.6 30–66 24.3–66 34–43 83.7–92.4
24.6–28 27.4–31
Parameter Glucose (mg/dL)
CK (U/L) AST (U/L)
ALT (U/L)
Calcium (mmol/L)
Sodium (mg/dL)
Potassium (mmol/L)
Mean±SE of six observations
98.16±13.11 313.31±35.38 41.53±5.57 26.31±3.42 0.61±0.07659 144.83±3.23 3.21±0.27
Range of actual observations
68–140 208–432.4 24.3–57.2 16.9–38.7 0.34–0.8 133–154 2.2–4.2
Kamalesh Kumar et al.

Indian Journal of Natural Sciences www.tnsroindia.org.in ©IJONS Vol.8 / Issue 43 / Aug 2017 International Bimonthly ISSN: 0976 – 0997
12687
Kamalesh Kumar et al.

Indian Journal of Natural Sciences www.tnsroindia.org.in ©IJONS Vol.8 / Issue 43 / Aug 2017 International Bimonthly ISSN: 0976 – 0997
12688
The Role of University in the Community Service: Evidence from the Northern Border University Naif Fawzi Alruwaili1* and Mohamed Eid Kilase2 1Assistant Professor, Department of Human Resources,College of Business Administration,Northern Border University, Saudi Arabia. 2Assistant Professor, Department of Public Administration, College of Business Administration, Northern Border University, Saudi Arabia. Received: 19 July 2017 Revised: 22 July 2017 Accepted: 25 July 2017 *Address for correspondence Naif Fawzi Alruwaili Assistant Professor,Department of Human Resources, College of Business Administration, Northern Border University, Saudi Arabia. Email: naï[email protected], [email protected]
This is an Open Access Journal / article distributed under the terms of the Creative Commons Attribution License
(CC BY-NC-ND 3.0) which permits unrestricted use, distribution, and reproduction in any medium, provided the original work is properly cited. All rights reserved. The present study aims to investigate the role of the Northern Border University in the community service. Specifically, it aims to examine the role of the Northern Border University in the local community service and then through its public relations practices. Judgmental sampling technique is used to collect data from various respondents found in the Northern region and specifically from the Northern Border University, Health Affairs Administration, and Public Administration of Education in Arar city the capital of the Northern Border Region of Saudi Arabia.The principal component analysis (PCA), the Bartlett’s test of Sphericity and Kaiser-Meyer-Olkin (KMO) indicator are also used. The regression analysis is used to investigate the effect of some study variables on another and then to examine the existence of a hypothesized linear relationship between variables of the study. The study findings revealed that the Northern Border University has a role in the local community service. In addition, findings confirmed the existence of a role for the Directorate of Public Relations and Media in community service but only through its variable of the effectiveness of the Directorate of Public relations and Media, whereas, there is no role for the organizational structure in enhancing community service. Despite of the role of the new established universities in the local community service there is still strong need to learn more about the university role in local community service. Keywords : Local community service, public relations, university role. INTRODUCTION
The present study attempts to probe the role of the Northern Border University (NBU) in the local community service. The Northern Border University as new-established higher education institution was founded in 2007.It contains 12 colleges distributed in three cities of the Northern Border Region of the Kingdom of Saudi Arabia (KSA)
ABSTRACT
RESEARCH ARTICLE

Indian Journal of Natural Sciences www.tnsroindia.org.in ©IJONS Vol.8 / Issue 43 / Aug 2017 International Bimonthly ISSN: 0976 – 0997
12689
7 in Arar, 3 in Rafha, and 2 in Turaif. The kingdom has twenty-five public universities and eight private universities located in different geographic regions of the country (Hamdan, 2013). The Ministry of Education governs all these universities in terms of management, controlling and funding. The university lies in remote region of Saudi Arabia which did not witnessed any university before the year 2007. Therefore, this study is carried out to examine the role of the university in the local community service and to probe the role of public relations in community-university exchange relationship. Investigating the role of the NBU in community service means that there are unique significance and benefits to the research body and stockholders and decision makers of higher education in Saudi Arabia.Education plays a key role in community service. It is considered as the most powerful instrument to make social progress and economic growth of the entire society (Waseem, Farooghiy, & Afshan, 2013).Historically the primary role of universities has been teaching, scientific research and community service(Alharbi, 2016). The third role of universities had become an issue of study in the late decades of the 20th century. The reason behind that was change in the society (Chatterton & Goddard, 2000). The rapid expansion in the higher education institutions across the globe is among the most profound developments of the 20st century with deep and broad ranging impact on societies, national economies, culture, attitudes and values (Schofer & Meyer, 2005). Role of universities has evolved over time worldwide and universities are not only involved in the production and provision of knowledge through education and research, but are also becoming increasingly involved in community service and community development. Interactions between universities and society may range from informal contacts to strategic collaborations and partnership where Public Relations and Media Directorate play a great role in this interaction. In the management context public relations is regarded as a management function that describes any type of communication that aimed at bringing about mutual understanding between an organization and its publics. The practitioners of Public Relations and Media Directorate serve as mediators between an organization and its publics (Newsom, et al. 2000) and (Scott, 2007). The Public Relations and Media Directorate in any organization discharge different activities, which include: media relations, employee relations, community relations, promotions, crisis management, media relations, environmental scanning and sponsorship programs (Asemah, 2014). Public Relations and Media Directorate within universities context focuses on the history, mission, and purpose of the university. It also looks at the requirements of the diverse groups of publics and community stakeholders. In this context the problem of the study attempts to gain information and understanding about how the Northern Border University (NBU) serves its local community, and about the role of Public Relations (PR) in this process.The purpose of this article was to investigate the role of the Northern Border University in the local community service and to examine the role of the public relations (PR) on communal - university exchange relationships (Kim & Sung 2016).
The local community service as one of the most p function of the universities next to the teaching and research found special consideration in the NBU of the Kingdom of Saudi Arabia. As new-established university the NBU has strived to achieve the third role of the university. Although, the university needs some means to serve its local community, the Public Relations and Media Directorate are specified to be one of these means. The problem of the study focuses on the major question to what extent the university serves the local community. And what is the role of the public relations PR in this process? As one of the few studies that has examined the role of the university in the local community service, the study aims to achieve some objectives related to the role of the Northern Border University in the local community service and the role of public relations in activating the relationship between the university and its publics. Moreover, the study aims to test the strengths and weaknesses of the Public Relations and Media Directorate in the NBU and its impact on the local community services. In addition, this study aims to help educational institutions’ practices by providing a guideline for developing better relationships with their local communities. Finally, the study aims to contribute to the field of the university and community service by highlighting the role of the public relations and by providing solid empirical data. Hence, as the first study, as far as we are aware, that has empirically tested the role of the university in the local community service.
Naif Fawzi Alruwaili and Mohamed Eid Kilase

Indian Journal of Natural Sciences www.tnsroindia.org.in ©IJONS Vol.8 / Issue 43 / Aug 2017 International Bimonthly ISSN: 0976 – 0997
12690
Theoretical Consideration The theoretical aspects of public relation are closely associated with the practice of Public Relations and Media Directorate which continues to evolve over time from an organization to another. Originally, Grunig and Dozier (2003)identified four theoretical models for Public Relations and Media Directorate practice that have become key points for examining how the PR profession work and these four models include: press a gentry, public information, two-way asymmetric, and two-way symmetric. Press a gentry describes the use of one-way, frequently untruthful, communication, Grunig and Hunt (1984) explain that some of the communication resulting from this model includes information that is "incomplete, distorted, or only partially true". Practitioners using the public information model disseminated positive but essentially truthful (one-way) information; its practitioners are more likely to gather audience feedback than those in the press agent/publicity model. Through the use of two-way asymmetrical Public Relations and Media Directorate practitioners use the information gathered from research to persuade publics. The two-way symmetrical model described the attempt to build mutual understanding between organizations and publics through the use of research, negotiation and compromise.
Public Relations and Media Directorate in higher education institutions context has been practiced as one-way asymmetrical as explained by Prioz ek and Heskova, (2003). In that one-way asymmetrical approach, practitioners have engaged in Public Relations and Media Directorate practice with great concern of media relations. Currently, scholars have supported a strategic approach to university Public Relations and Media Directorate or two way symmetrical communications that goes beyond media relations and embraces strategic management. Moreover, the two-way symmetrical approach seems appropriate for the purpose of this study because it facilitates mutual understanding and communication within the university and its publics in the local community.
In the light of theoretical framework figure 1 illustrates the conceptual model of the study and addresses the relations between variables. Definition of Public Relations
Public Relations and Media Directorate in its broad sense are defined as communication within the organization and its external publics which include: local community, customers, government, suppliers, and investors. According to Cutlip (1962), public relations are defined as “the management function that identifies, establishes and maintains mutually beneficial relationships between an organization and the various publics on whom its success or failure depends”. Accordingly, communication within organization is a broader concept including also other forms of communication than those managed by the Public Relations and Media Directorate.
The importance of this definition is that it considers Public Relations and Media Directorate as part of management activity; the thing gives it credibility and shifts it away from the traditional activity that supports company’s sales and widening the scope of Public Relations and Media Directorate. Definition of Community Service
In this study community service means activities and programs offered by the members of the university which include interaction with individuals, groups and institutions at the local, regional, and national levels. LITERATURE REVIEW Unpredictably, there has been scarcity in the studies dealing with Public Relations and Media Directorate in Saudi Arabia in general and Saudi universities and Northern Border University in particular. An example of these studies that were intended to understand the effects of Public Relations and Media Directorate practices and evaluate their
Naif Fawzi Alruwaili and Mohamed Eid Kilase

Indian Journal of Natural Sciences www.tnsroindia.org.in ©IJONS Vol.8 / Issue 43 / Aug 2017 International Bimonthly ISSN: 0976 – 0997
12691
role at Saudi Arabia and Saudi universities include the study of Freitage and Stokes (2009) who have traced the history of modern Public Relations and Media Directorate in Saudi Arabia which goes back to the early 1930s when the Arab-American Oil Company (ARAMCO) began to search for oil in Saudi Arabia. At those times the American managers and workers found difficulties of communication with Saudi people that is why the ARAMCO established Public Relations and Media Directorate for the purposes of training Arabs to work with Americans and teach Americans how to understand, respect and adapt to Saudi culture.
Al-Badr (1979) affirms that the study entitled “Public Relations and Media Directorate Activities at Two Saudi Arabian Universities”, has determined the importance of Public Relations and Media Directorate to colleges and universities in developing countries. The University of Riyadh and King Abdulaziz were chosen to test the hypothesis that the attitude of the university public students, instructors and the citizens around it would be more favorable toward a university having programmed Public Relations and Media Directorate Results show major differences among groups of people in regard to their opinion toward universities.
Grunig and Repper (1992) state that Public Relations and Media Directorate practitioners search for communication with publics so that to enhance or threaten their organization’s mission.
Chatterton and Goddard (2000).explain the university’s role with community as follows: “The University’s effective engagement with the region involves bringing together teaching, research and service to the community in a coherent manner and establishing effective mechanisms for bridging the boundary between the university and the region”, and this ruled the intergovernmental relation between government and local communities (Ratyan &Mohammad, 2016) and (Mofolo, 2016).
Vaessen and van der Veld (2003) concluded that the existence of a university in a region increases the region’s prestige and the academic staff has next to their professional activity an impact on the neighborhood through their personal contacts as well as various formal and informal networking.
Gunasekara (2004) identifies two types of literature pertaining to the third role of universities which is community service. The first type of the literature is the triple helix model of university–industry–government relations, and the second type of the literature focuses on university engagement. The first stage of the triple helix model, (Leydesdorff & Etzkowitz, 1998) focused on the spheres of academia, industry and government and on the knowledge flows between them. The view of the university engagement literature is broader and the notion is developmental. The basic idea of the university engagement is to make teaching and research more regionally relevant. In other words university contributes to regional knowledge needs through teaching programs or regionally focused research and serving community and sharing activities (Brown, et al. 2016).
(F.W. Jefkins, 1977) and (F. Jefkins, 2016) emphasize that the skilled Public Relations and Media Directorate practitioner should be a master of the media knowing what is available, how it differs and how to use it to the best advantage. Grunig and Hunt (1984) assert that “relations with the news media are central to the practice of Public Relations and Media Directorate that many practitioners, especially those guided by the press a gentry and public information models of Public Relations and Media Directorate, believe that Public Relations and Media Directorate is nothing more than media relations”. Grunig and Dozier (2003) and (Schofer & Meyer, 2005) emphasize that Public Relations and Media Directorate makes an organization more effective when it identifies strategic stakeholders, and when it uses symmetrical communication to develop and maintain quality long-term relationships with them in teaching, social activities and internal social cases as unemployment, health issue, tourism services, training, etc. as stated by Freitag and Stokes, (2009), Toledano and Maplesden, (2016) and also by Dandan and Zoran, (2016).
Naif Fawzi Alruwaili and Mohamed Eid Kilase

Indian Journal of Natural Sciences www.tnsroindia.org.in ©IJONS Vol.8 / Issue 43 / Aug 2017 International Bimonthly ISSN: 0976 – 0997
12692
METHODOLOGY A systematic review of the literature was made and data analysis was done to meet the study objectives. The effectuated factorial analysis method expressed by the principal component analysis (PCA) was used to reduce the large set of variables. Furthermore, the regression analysis was also used to examine the role of the Northern Border University in the local community service through the tool of Public Relations and Media Directorate.
Sampling Technique
Judgmental sampling technique was used to collect data from various respondents found in the Northern region and specifically from the Northern Border University, Health Affairs Administration, and Public Administration of Education. The respondents of these three institutions were exclusively the employees of Public Relations and Media Directorates.
Data Collection Instrument
Primary data were collected through a self-constructed questionnaire from different employees of Public Relations and Media Directorate in the various institutions in the Arar city the capital of the Northern Border Region of Saudi Arabia. Study instrument was developed based on (Morris & Goldsworthy, 2015). There were 110 respondents and out of which 50 were selected for this study. RESULTS Descriptive Statistics
Only 50 of the total questionnaire administered was used in this study as some were incompletely responded to or were not returned. Preliminary study or descriptive statistics was presented in the tables below.
Table .1 illustrates descriptive statistics for the role of the university in the community service. The empirical analysis in this study begins with descriptive analysis of the mean, standard deviation and the coefficient of variation for each item of the three variables. Table 1 shows results about the first variable. The sample of the study has responses which was much closed to the central values (3) indicating that the responses were medium and the opinions of the respondents were medium about the role of the university in the community service. The most degree of agreement is associated with the four first items and most disagreement is associated with the last items. Moreover, for the second and third variables of the study which are the effectiveness of the Directorate of Public Relations and Media and the Directorate of Public Relations and strengthens and weaknesses of the organizational structure, we note the same results as shown in tables 2 and 3.
Factor Analysis
To determine the possibility and the importance of the factor analysis specially the principal component analysis (PCA), the Bartlett’s test of Sphericity and Kaiser-Meyer-Olkin (KMO) indicators are used.
Table.4 Shows the overall MSA expressed by the Kaiser-Meyer-Olkin for the three set of variables included in the analysis was higher than 0.8, which exceeds the minimum requirement of 0.50 for overall MSA. This result shows that the PCA is very appropriate for the three variables of the study.
In addition, principal component analysis requires that the probability associated with Bartlett's Test of Sphericity be less than the level of significance of 5%. In this study, the probability associated (p-value) with the Bartlett's test is equal to zero, which satisfies the requirement.
The present study adopts the Kaiser Propriety which suggests that the component is considered principal when the eigenvalues is greater than 1.
Naif Fawzi Alruwaili and Mohamed Eid Kilase
Indian Journal of Natural Sciences www.tnsroindia.org.in ©IJONS Vol.8 / Issue 43 / Aug 2017 International Bimonthly ISSN: 0976 – 0997
12693
The result obtained from the first variable about the role of the university in the community service requires the selection of one component because its eigenvalues is the only one that is greater than 1. This adopted principal component explains about 71.4% of the total variance. This percentage is very important in order to reduce the scale of 10 items into one component that allowing the explanation of the variance that was greater than 70%.
Based on the second and third variables which consist of 10 items, the number of principal component extracted is 2 for each variable. The two principal components for the second variable could explain 80.633% of the total variance, while the variance explained by the two principal components is about 79% for the third variable.
By using the component matrix, we explored that it is difficult to determine a clear interpretation for the second and third variables. Furthermore, the associated eigenvalues were very weak compared to eigenvalues that associated to the first principle component. Therefore, we adopted only one principle component for the first and second variables. All these results show that the PCA allows for the obtaining of important findings especially that related to the explanation of total variance of the three variables. Regression Analysis
To investigate the effect of some variables on another, we suppose the existence of a linear relationship between these variables. Then, we test the existence of a significant relationship between the three variables to test finally the different hypothesis of the study. After that we estimate the following models:
Where
● is the role of the university in the community service.
● is the effectiveness of the Directorate of Public Relations and Media Directorate and Media in supporting the communication with the local community.
● is strengthens and weaknesses of the organizational structure of the Directorate of Public Relations and Media Directorate and Media
● is the error term of the regression which is supposed and normally distributed.
Table .5 demonstrates the F-stat is very great having a null p-value allowing the rejection of the null hypothesis for which the model is generally not significant. Consequently, the model of the study is generally significant.
The estimation of results shows that only the effectiveness of the Directorate of Public Relations and Media in supporting the communication with the local community has a significant effect on the role of the university in the community service by a coefficient of regression equal to 0.736. Indeed, the t-stat of the student test is greater than the critical value of 1.96.
DISCUSSION AND CONCLUSION
It is obvious from the different literature review on the university’s role that the common functions of the universalities in the world are teaching, research, and service to the external community. The findings of this study emphasized the role of the Northern Border University in the local community service and this result refers to the commitment of the university to its vision and mission. In addition, this result is line with the study of Gunasekara (2014), who recognizes the third role of universities and the study of Al-Jenaibi (2015) who recognizes the social responsibility approaches toward the community.
Naif Fawzi Alruwaili and Mohamed Eid Kilase
Indian Journal of Natural Sciences www.tnsroindia.org.in ©IJONS Vol.8 / Issue 43 / Aug 2017 International Bimonthly ISSN: 0976 – 0997
12694
The results of the study clearly illustrate that the Northern Border University has a medium role in the community services, and this finding is pertaining to the fact that the NBU is newly established institution in Saudi Arabia, and despite that the university has role in community service which includes research, training programs, social awareness campaigns, conferences and cultural events as being confirmed by Valentini, (2016). Moreover, the university has regular meetings with the community stakeholders as being identified by Ruihley, et al. (2016).
Concerning the effectiveness of the of the Public Relation Directorate and Media in supporting the communication between the university and its local community and this point assigned by study results of Mofolo (2016), the regression analysis shows that PR has moderate and direct role in the community service. This result is in line with the studies of Ruihley et al. (2016), and (Greener,2016), and explanation of the public relations professional in the Northern Border University Mr. Sameer Mohammed Majed Dandan when he said during the interview with him: “The employees of Public Relations and Media Directorate in the three institutions specifically the Northern Border University, Health Affairs Administration, and Public Administration of Education have engaged in common communication not only that, but also the university has allowed the PR employees from other institution to conduct their activities in the campus of the university using its halls, libraries, laboratories and sport facilities, the thing increases the competition and effectiveness among the PR employees”.
Regarding the role of the organizational structure of the Public Relations and Media Directorate in the NBU, the results demonstrate that it has no genuine role in meeting the community demands, this result refers to the existence of few number of PR employees in the NBU against the heavy duties and tasks as mentioned by Greener, (2016), Wilcox and Reber, (2016) and Jefkins, (2016). For instance the editors of the newsletters work as photographer and so on, this type of dual work may enhance the experience of individuals but at the same time it leads to the overlapping of tasks, the thing which is against the principle of specialization, which cause a low level of performance, and interactivity between public relation directorate and community. Moreover, the low financial support for the employees of Public Relation Directorate, besides the shortage in the training courses is extra factors that weakened the employees’ capabilities to interact within the PR structure and hence serves the local community, this also will lead for low level of sharing and participating efforts, as same as organic organizations that haven’t clear procedures and missions to clarify internal task with external demands to me community daily services Dandan and Zoran, (2016).
So far, it is obvious that the Northern Border University has a role in the local community service and also the effectiveness of the Public Relations and Media Directorate has positively enhanced the community service. Nevertheless research is strongly needed to learn more about the role of the university and the Public Relations and Media Directorate in community service and this recommendation is line with the study of Almahraj et al. (2016).
Limitations of the Study and Future Research The authors of this study highlighted some limitations that should be considered as real constraints. First, the sample size was not large enough due to limitation of resources and time constraints. The second constrain of the study is that there might be certain mediating factors or variables between the university and community which have not been included in the current study but to be considered in future studies. Finally, future study could replicate the present study to include different Saudi universities in the kingdom of Saudi Arabia. Contribution of the Study The present study makes substantial contribution to the literature and existing body of knowledge on the role of the university in community service specially the NBU is considered as new-established university in remote region of Saudi Arabia.
Naif Fawzi Alruwaili and Mohamed Eid Kilase

Indian Journal of Natural Sciences www.tnsroindia.org.in ©IJONS Vol.8 / Issue 43 / Aug 2017 International Bimonthly ISSN: 0976 – 0997
12695
Recommendations
Based on the discussion of the results, the following recommendations are provided: (1) Community service should be incorporated at political solution through higher education that will make community wellbeing and services to remain a part of the university functions. (2) The present study should create an opportunity for Saudi universities rectors to consider developing effective public relations models that work for them and their publics or the local communities. (3) This study should be easily conducted in any Saudi university or higher education institute. Such studies can raise awareness amongst public relations practitioners and service providers within the university.
ACKNOWLEDGMENTS
The authors would like to acknowledge the Northern Border University, Kingdom of Saudi Arabia for financing this study.
REFERENCES 1. Al-Badr, H. A. (1979). Public relations activities at two Saudi Arabian universities: University Microfilms. 2. Alharbi, Eman Abdulrahman Radi (2016). Higher education in Saudi Arabia: Challenges to achieving world-class
recognition. International Journal of Culture and History, Vol. 2(4): p 169. 3. Al-Jenaibi, B. (2015). Current issues about public relations professionals: challenges and potentials of PR in UAE
organisations. Middle East Journal of Management, 2(4), 330-351. 4. Almahraj, Y., al-Nahee, O. A., Alammar, S., Wilson, P., Alfiz, M., Albasri, M. F., . . . Brooks, L. (2015). Public
Relations and Culture in Saudi Arabia. Paper presented at the Proceedings of the Eighth Saudi Students Conference in the UK.
5. Asemah, E. S. (2014). Public Relations Strategies and the Implementation of the Millennium Development Goals in Nigeria. Journal of Research in National Development, 9(2), 163-172.
6. Brown, K., Shephard, K., Warren, D., Hesson, G., & Fleming, J. (2016). Using phenomenography to build an understanding of how university people conceptualise their community-engaged activities. Higher Education Research & Development, 1-15.
7. Chatterton, P., & Goddard, J. (2000). The response of higher education institutions to regional needs. European Journal of Education, 35(4), 475-496.
8. Cutlip, S. M. (1962). Effective public relations: Pearson Education India. 9. Dandan, S. M., & Zoran, A. G. (2016). Organization’s Role in Serving Community by Enhancing: Corporate Social
Responsibilities. Indian Journal of Science and Technology, 9(33). 10. Freitag, A. R., & Stokes, A. Q. (2009). Global public relations: Spanning borders, spanning cultures: Routledge. 11. Greener, T. (2016). The secrets of successful public relations and image-making: Elsevier. 12. Grunig, J. E., & Dozier, D. M. (2003). Excellent public relations and effective organizations: A study of communication
management in three countries: Routledge. 13. Grunig, J. E., & Hunt, T. (1984). Managing public relations (Vol. 343): Holt, Rinehart and Winston New York. 14. Grunig, J. E., & Repper, F. C. (1992). Strategic management, publics, and issues. Excellence in public relations and
communication management, 117-157. 15. Gunasekara, C. (2004). Universities and communities: A case study of change in the management of a university.
Prometheus, 22(2), 201-211. 16. Hamdan, A. (2013). An exploration into private higher education in Saudi Arabia: Improving quality and
accessibility. The ACPET Journal for Private Higher Education, vol. 2, no. 2, 2013. 17. Jefkins, F. (2016). Public Relations: Made Simple: Elsevier. 18. Jefkins, F. W. (1977). Planned press and public relations: International Textbook Co.
Naif Fawzi Alruwaili and Mohamed Eid Kilase
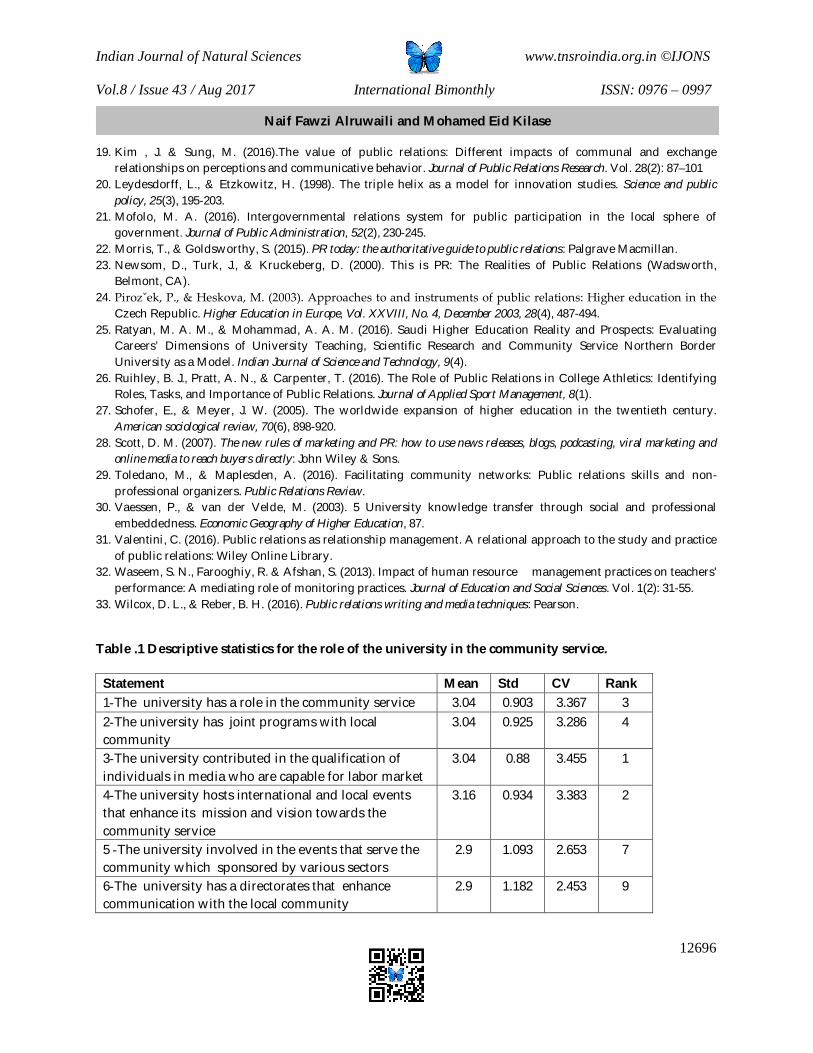
Indian Journal of Natural Sciences www.tnsroindia.org.in ©IJONS Vol.8 / Issue 43 / Aug 2017 International Bimonthly ISSN: 0976 – 0997
12696
19. Kim , J. & Sung, M. (2016).The value of public relations: Different impacts of communal and exchange relationships on perceptions and communicative behavior. Journal of Public Relations Research. Vol. 28(2): 87–101
20. Leydesdorff, L., & Etzkowitz, H. (1998). The triple helix as a model for innovation studies. Science and public policy, 25(3), 195-203.
21. Mofolo, M. A. (2016). Intergovernmental relations system for public participation in the local sphere of government. Journal of Public Administration, 52(2), 230-245.
22. Morris, T., & Goldsworthy, S. (2015). PR today: the authoritative guide to public relations: Palgrave Macmillan. 23. Newsom, D., Turk, J., & Kruckeberg, D. (2000). This is PR: The Realities of Public Relations (Wadsworth,
Belmont, CA). 24. Pirozˇek, P., & Heskova, M. (2003). Approaches to and instruments of public relations: Higher education in the
Czech Republic. Higher Education in Europe, Vol. XXVIII, No. 4, December 2003, 28(4), 487-494. 25. Ratyan, M. A. M., & Mohammad, A. A. M. (2016). Saudi Higher Education Reality and Prospects: Evaluating
Careers’ Dimensions of University Teaching, Scientific Research and Community Service Northern Border University as a Model. Indian Journal of Science and Technology, 9(4).
26. Ruihley, B. J., Pratt, A. N., & Carpenter, T. (2016). The Role of Public Relations in College Athletics: Identifying Roles, Tasks, and Importance of Public Relations. Journal of Applied Sport Management, 8(1).
27. Schofer, E., & Meyer, J. W. (2005). The worldwide expansion of higher education in the twentieth century. American sociological review, 70(6), 898-920.
28. Scott, D. M. (2007). The new rules of marketing and PR: how to use news releases, blogs, podcasting, viral marketing and online media to reach buyers directly: John Wiley & Sons.
29. Toledano, M., & Maplesden, A. (2016). Facilitating community networks: Public relations skills and non-professional organizers. Public Relations Review.
30. Vaessen, P., & van der Velde, M. (2003). 5 University knowledge transfer through social and professional embeddedness. Economic Geography of Higher Education, 87.
31. Valentini, C. (2016). Public relations as relationship management. A relational approach to the study and practice of public relations: Wiley Online Library.
32. Waseem, S. N., Farooghiy, R. & Afshan, S. (2013). Impact of human resource management practices on teachers' performance: A mediating role of monitoring practices. Journal of Education and Social Sciences. Vol. 1(2): 31-55.
33. Wilcox, D. L., & Reber, B. H. (2016). Public relations writing and media techniques: Pearson.
Table .1 Descriptive statistics for the role of the university in the community service.
Statement Mean Std CV Rank 1-The university has a role in the community service 3.04 0.903 3.367 3 2-The university has joint programs with local community
3.04 0.925 3.286 4
3-The university contributed in the qualification of individuals in media who are capable for labor market
3.04 0.88 3.455 1
4-The university hosts international and local events that enhance its mission and vision towards the community service
3.16 0.934 3.383 2
5 - The university involved in the events that serve the community which sponsored by various sectors
2.9 1.093 2.653 7
6-The university has a directorates that enhance communication with the local community
2.9 1.182 2.453 9
Naif Fawzi Alruwaili and Mohamed Eid Kilase

Indian Journal of Natural Sciences www.tnsroindia.org.in ©IJONS Vol.8 / Issue 43 / Aug 2017 International Bimonthly ISSN: 0976 – 0997
12697
7-The relationship between the university and it local community is seen integrated
2.7 1.147 2.354 10
8 - The university exercises important role in the enhancement of partnership with the local community
2.94 1.119 2.627 8
9-The university communicates with different sectors of the local community on a regular basis.
2.94 0.998 2.946 5
10 - The university enhances its leading role in the region through the achievements.
3.00 1.069 2.806 6
Table .2 Descriptive statistics for the effectiveness of the Directorate of Public Relations and Media in supporting the communication with the local community.
Statement Mean Std. VC Rank 1-The Directorate of Public Relations and Media in the university has relations with their counterparts in the various sectors of the local community
2.84 1.201 2.36 5
2-The Directorate of Public Relations and Media owns administrative and technical organs qualified to enhance communication with the local community
2.94 1.114 2.63 9
3-The Directorate of Public Relations and Media strengthening the communication among the university members.
3.08 1.047 2.94 2
4 - The Directorate of Public Relations and Media supports the various university events
3.00 0.728 4.12 1
5-The Directorate of Public Relations and Media provides the press with all answers and inquiries
2.82 0.896 3.14 7
6-The Directorate of Public Relations and Media owns adequate financial allocations to support the implementation of the various procedures and transactions
3.12 1.003 3.11 1
7-The Directorate of Public Relations and Media has vision and a clear mission
3.04 1.261 2.41 1
8-The Directorate of Public Relations and Media participates in the different events of the local community
2.84 1.251 2.27 0
9 - The Directorate of Public Relations and Media enhances the university media mission
2.94 1.114 2.63 9
10-The Directorate of Public Relations and Media contributes in the improvement of mental image about the university and its achievements .
3.02 0.742 4.07 0
Naif Fawzi Alruwaili and Mohamed Eid Kilase

Indian Journal of Natural Sciences www.tnsroindia.org.in ©IJONS Vol.8 / Issue 43 / Aug 2017 International Bimonthly ISSN: 0976 – 0997
12698
Table3.Descriptive statistics for the strengthens and weaknesses of the organizational structure of the Directorate of Public Relations and Media
Statement Mean Std VC Rank 1-The organizational structure enhances the role of the Directorate of Public Relations and Media to perform its duties effectively and efficiently
3.00 0.904 3.31 9
2-The Directorate of Public Relations and Media allocates its employees according to the organizational structure
2.86 0.729 3.92 3
3-There is a specific mechanism by which the tasks are being implemented
3.00 1.05 2.85 7
4-There are alternative plans to compensate the lack of staff against intense activities of the university.
2.68 0.844 3.17 5
5-The Directorate of Public Relations and Media rewards it employees.
2.72 0.73 3.72 6
6-The Directorate of Public Relations and Media owns an independent budget
2.52 0.762 3.30 7
7-The Directorate of Public Relations and Media Directorate always supports the training and development of its subordinates
2.56 0.705 3.63 1
8-The organizational structure of the Directorate of Public Relations and Media facilitates the process of providing accurate information and excellent service to public.
2.84 0.866 3.27 9
9-The Directorate of Public Relations and Media has clear administrative units in the university.
2.84 1.017 2.79 3
10-The Directorate of Public Relations and Media has development plans
2.98 1.097 2.71 6
Table 4.Factor analysis results
Variable 3 Variable 2 Variable 1 0.865 0.801 0.873 Kaiser-Meyer-Olkin
462.825 0.000
576.342 0.000
497.207 0.000
Bartlett's Test of Sphericity p-value
6.626 7.017 7.144 Eigenvalues 66.26% 70.17% 71.43 % %of Variance
Naif Fawzi Alruwaili and Mohamed Eid Kilase

Indian Journal of Natural Sciences www.tnsroindia.org.in ©IJONS Vol.8 / Issue 43 / Aug 2017 International Bimonthly ISSN: 0976 – 0997
12699
Table 5.Estimation results of the regression model
Coefficient Std. Error t-stat p-value β0 *** 0.056 -0.036 - 0.972 β1 0.736 0.127 5.670 0.000 β2 0.206 0.127 1.585 0.120 F-stat 133.080 )p-value( 0.000 R squared 0.925 Adjusted R-squared 0.849
Figure 1. Conceptual model of the study
Naif Fawzi Alruwaili and Mohamed Eid Kilase
Copyright © 2022 FDOKUMEN


![Highly Air‐Stable Thieno [3, 2‐b] thiophene‐Thiophene‐Thiazolo [5, 4‐d] thiazole‐Based Polymers for Light‐Emitting Diodes](https://static.fdokumen.com/doc/165x107/63314f6cc1adb6fc8c0f4a46/highly-airstable-thieno-3-2b-thiophenethiophenethiazolo-5-4d.jpg)