
Using 87Sr/86Sr, δ18O and δ2H isotopes along with major chemical composition to assess groundwater...
14
Using 87 Sr/ 86 Sr, d 18 O and d 2 H isotopes along with major chemical composition to assess groundwater salinization in lower Shire valley, Malawi Maurice Monjerezi a,c,⇑ , Rolf D. Vogt a , Per Aagaard b , Asfaw Gebretsadik Gebru a , John D.K. Saka c a Department of Chemistry, University of Oslo, P.O. Box 1033, Blindern, Oslo 0315, Norway b Department of Geosciences, University of Oslo, P.O. Box 1047, Blindern, Oslo, Norway c Department of Chemistry, Chancellor College, University of Malawi, P.O. Box 280, Zomba, Malawi article info Article history: Received 10 March 2011 Accepted 7 August 2011 Available online 16 August 2011 Editorial handling by P.B. McMahon abstract Groundwater resources in some parts of the lower section of Shire River valley, Malawi, are not useable for rural domestic water supply due to high salinity. In this study, a combined assessment of isotopic ( 87 Sr/ 86 Sr, d 18 O and d 2 H) and major ion composition was conducted in order to identify the hydro-geo- chemical evolution of the groundwater and thereby the causes of salinity. Three major end-members (representing fresh- and saline groundwater, and evaporated recharge) were identified based on major ion and isotopic composition. The saline groundwater is inferred to result from dissolution of evaporitic salts (halite) and the fresh groundwater shows influence of silicate weathering. Conservative mixing models show that brackish groundwater samples result from a three component mixture comprising the identified end-members. Hence their salinity is interpreted to result from mixing of fresh groundwa- ter with evaporated recharge and saline groundwater. On the other hand, the groundwater with low TDS, found at some distance from areas of high salinity, is influenced by mixing of evaporated recharge and fresh groundwater only. Close to the Shire marshes, where there is shallow groundwater, composition of stable isotopes of water indicates that evaporation may also be an important factor. Ó 2011 Elsevier Ltd. All rights reserved. 1. Introduction In most developing countries, groundwater is widely used for domestic water supply especially in small towns and rural regions. However, some aquifers are not of adequate quality due to natural factors or anthropogenic pressures. Groundwater with high salin- ity, as found in the lower section of Shire River valley, Malawi (Da- vis, 1969; Lockwood Survey Cooperation, 1970; Bradford, 1973; Bath, 1980; Monjerezi et al., 2011), is a major groundwater quality problem. An understanding of hydro-geochemical processes affect- ing water quality in saline aquifers is essential for achieving and sustaining usable water supplies. Sustainable exploitation of avail- able groundwater resources is almost impossible without adequate knowledge of the spatial distribution of fresh and saline groundwa- ter and understanding of the processes that determine spatial vari- ations of salinity (Bouchaou et al., 2008). In order to understand hydro-geochemical processes, it is important to constrain the effects of water–rock interaction, evapotranspiration, dissolution and precipitation of minerals, ion exchange and groundwater mixing. Assessment of major ion chemistry alone is often inconclusive or ambiguous. 87 Sr/ 86 Sr, 2 H/ 1 H and 18 O/ 16 O isotopic ratios of groundwater are important tracers of hydrological processes. Sr isotopes can reveal informa- tion on water–rock interaction. Groundwater in equilibrium with Sr-bearing minerals attains 87 Sr/ 86 Sr values that reflect the isotopic ratio of the minerals, leading to variation of the strontium isotopic ratio in groundwater from different lithologies (Bullen and Kendall, 1998; Shand et al., 2007). The strontium isotopic ratio is thus a sen- sitive tracer of groundwater flow paths and mixing relationships in regional flow systems. Stable isotopes of the water molecule are generally considered to be transported conservatively in aquifers and that their variations are therefore due to differences in climate when the rain was precipitated, mixing with different waters and evaporation (Clark and Fritz, 1997). In a preceding study of hydro-geochemistry in the study area, Monjerezi et al. (2011) postulated the major hydro-geochemical processes governing the spatial variation in water quality. Building on these findings, the present contribution uses d 18 O, d 2 H and 87 Sr/ 86 Sr isotope ratios to further restrain the assessment of possi- ble processes responsible for the observed chemical character of groundwater. It is thereby possible to conclude on the processes that affect groundwater quality in the lower Shire River valley, and identify major sources for the saline groundwater. This study is also the first to report on the d 18 O, d 2 H and 87 Sr/ 86 Sr isotopes of saline groundwater from the study area. 0883-2927/$ - see front matter Ó 2011 Elsevier Ltd. All rights reserved. doi:10.1016/j.apgeochem.2011.08.003 ⇑ Corresponding author at: Department of Chemistry, University of Oslo, P.O. Box 1033, Blindern, Oslo 0315, Norway. E-mail addresses: [email protected], [email protected] t.uio.no (M. Monjerezi). Applied Geochemistry 26 (2011) 2201–2214 Contents lists available at SciVerse ScienceDirect Applied Geochemistry journal homepage: www.elsevier.com/locate/apgeochem
Transcript of Using 87Sr/86Sr, δ18O and δ2H isotopes along with major chemical composition to assess groundwater...

Applied Geochemistry 26 (2011) 2201–2214
Contents lists available at SciVerse ScienceDirect
Applied Geochemistry
journal homepage: www.elsevier .com/ locate/apgeochem
Using 87Sr/86Sr, d18O and d2H isotopes along with major chemical compositionto assess groundwater salinization in lower Shire valley, Malawi
Maurice Monjerezi a,c,⇑, Rolf D. Vogt a, Per Aagaard b, Asfaw Gebretsadik Gebru a, John D.K. Saka c
a Department of Chemistry, University of Oslo, P.O. Box 1033, Blindern, Oslo 0315, Norwayb Department of Geosciences, University of Oslo, P.O. Box 1047, Blindern, Oslo, Norwayc Department of Chemistry, Chancellor College, University of Malawi, P.O. Box 280, Zomba, Malawi
a r t i c l e i n f o
Article history:Received 10 March 2011Accepted 7 August 2011Available online 16 August 2011Editorial handling by P.B. McMahon
0883-2927/$ - see front matter � 2011 Elsevier Ltd. Adoi:10.1016/j.apgeochem.2011.08.003
⇑ Corresponding author at: Department of ChemiBox 1033, Blindern, Oslo 0315, Norway.
E-mail addresses: [email protected] (M. Monjerezi).
a b s t r a c t
Groundwater resources in some parts of the lower section of Shire River valley, Malawi, are not useablefor rural domestic water supply due to high salinity. In this study, a combined assessment of isotopic(87Sr/86Sr, d18O and d2H) and major ion composition was conducted in order to identify the hydro-geo-chemical evolution of the groundwater and thereby the causes of salinity. Three major end-members(representing fresh- and saline groundwater, and evaporated recharge) were identified based on majorion and isotopic composition. The saline groundwater is inferred to result from dissolution of evaporiticsalts (halite) and the fresh groundwater shows influence of silicate weathering. Conservative mixingmodels show that brackish groundwater samples result from a three component mixture comprisingthe identified end-members. Hence their salinity is interpreted to result from mixing of fresh groundwa-ter with evaporated recharge and saline groundwater. On the other hand, the groundwater with low TDS,found at some distance from areas of high salinity, is influenced by mixing of evaporated recharge andfresh groundwater only. Close to the Shire marshes, where there is shallow groundwater, compositionof stable isotopes of water indicates that evaporation may also be an important factor.
� 2011 Elsevier Ltd. All rights reserved.
1. Introduction
In most developing countries, groundwater is widely used fordomestic water supply especially in small towns and rural regions.However, some aquifers are not of adequate quality due to naturalfactors or anthropogenic pressures. Groundwater with high salin-ity, as found in the lower section of Shire River valley, Malawi (Da-vis, 1969; Lockwood Survey Cooperation, 1970; Bradford, 1973;Bath, 1980; Monjerezi et al., 2011), is a major groundwater qualityproblem. An understanding of hydro-geochemical processes affect-ing water quality in saline aquifers is essential for achieving andsustaining usable water supplies. Sustainable exploitation of avail-able groundwater resources is almost impossible without adequateknowledge of the spatial distribution of fresh and saline groundwa-ter and understanding of the processes that determine spatial vari-ations of salinity (Bouchaou et al., 2008).
In order to understand hydro-geochemical processes, it isimportant to constrain the effects of water–rock interaction,evapotranspiration, dissolution and precipitation of minerals, ionexchange and groundwater mixing. Assessment of major ion
ll rights reserved.
stry, University of Oslo, P.O.
chemistry alone is often inconclusive or ambiguous. 87Sr/86Sr,2H/1H and 18O/16O isotopic ratios of groundwater are importanttracers of hydrological processes. Sr isotopes can reveal informa-tion on water–rock interaction. Groundwater in equilibrium withSr-bearing minerals attains 87Sr/86Sr values that reflect the isotopicratio of the minerals, leading to variation of the strontium isotopicratio in groundwater from different lithologies (Bullen and Kendall,1998; Shand et al., 2007). The strontium isotopic ratio is thus a sen-sitive tracer of groundwater flow paths and mixing relationships inregional flow systems. Stable isotopes of the water molecule aregenerally considered to be transported conservatively in aquifersand that their variations are therefore due to differences in climatewhen the rain was precipitated, mixing with different waters andevaporation (Clark and Fritz, 1997).
In a preceding study of hydro-geochemistry in the study area,Monjerezi et al. (2011) postulated the major hydro-geochemicalprocesses governing the spatial variation in water quality. Buildingon these findings, the present contribution uses d18O, d2H and87Sr/86Sr isotope ratios to further restrain the assessment of possi-ble processes responsible for the observed chemical character ofgroundwater. It is thereby possible to conclude on the processesthat affect groundwater quality in the lower Shire River valley,and identify major sources for the saline groundwater. This studyis also the first to report on the d18O, d2H and 87Sr/86Sr isotopesof saline groundwater from the study area.

2202 M. Monjerezi et al. / Applied Geochemistry 26 (2011) 2201–2214
2. Materials and methods
2.1. Study area
Malawi is situated in South East Africa (Fig. 1) and lies withinthe western branch of the East African Rift system (EARS). Thelower Shire River valley occupies the southernmost part of theMalawi section of the rift. The Shire River, the biggest river inMalawi, runs through the valley accounting for the outflow fromLake Malawi to Zambezi River. This study focuses on the upperdistrict of Chikhwawa (formerly Chikwawa; Fig. 1). The valleyflow flanking the River Shire is of low slope and relief, rangingfrom 50 m to 76 m above sea level. The area has a tropical cli-mate of Sahelo-Sudanese type and experiences annual moisturedeficit.
Habgood (1963) described the geology of the lower Shire valley.Situated within the EARS, the area is intensely faulted (Fig. 1) (Hab-good, 1963; Castaing, 1991; Chapola and Kaphwiyo, 1992). A base-ment of Precambrian to lower Palaeozoic Mozambique belt high-grade charnockitic granulites and biotite-hornblende gneisses(semi-pelitic), referred to as the Malawi Basement Complex under-lies the area (Habgood, 1963; Carter and Bennet, 1973; Bloomfield,1966; Morel, 1989). On the western bank of the Shire River, Karoo
Fig. 1. Map of the study area showing location, geology (after Habgood (1963)) an
sedimentary rocks overlay the basement rocks. Cretaceous Lupatasandstones, in turn, overlay the Karoo sedimentary rocks (Fig. 1;Habgood, 1963; Castaing, 1991). The climax of Karoo faultingwas the eruption of volcanic basalts and dolerites during the earlyJurassic epoch. Also present are hydrothermal fault rocks, associ-ated with the Karoo boundary faults. The valley floor is a piedmontplain consisting of a large amount of unconsolidated sediments(Habgood, 1963).
Bradford (1973) has reported upon the hydrogeology of thearea. The main aquifer units, in order of increasing importance asgroundwater resources, are (1) the weathered and/or fracturedbasement rocks, (2) Karoo and Cretaceous sedimentary rocks, (3)weathered basalts and (4) the unconsolidated alluvial deposits. Ingeneral, piezometric contours indicate a regime of groundwaterflow towards the central axis of the valley i.e. towards Shire River(Bradford, 1973). The aquifers are lenticular in shape and of limitedlateral extent, but there is partial hydraulic continuity betweenwater in the weathered bedrock at the valley sides and water inthe alluvium in the valley floor. Non-flowing confined aquiferswith upward leakage are generally found in the valley floor (Brad-ford, 1973). Hot springs are found along the Mwanza Fault repre-senting the most recent stages of the Cretaceous hydrothermalactivities (Cooper and Bloomfield, 1961).
d sample locations. Inset shows location of the study area in Malawi (Africa).
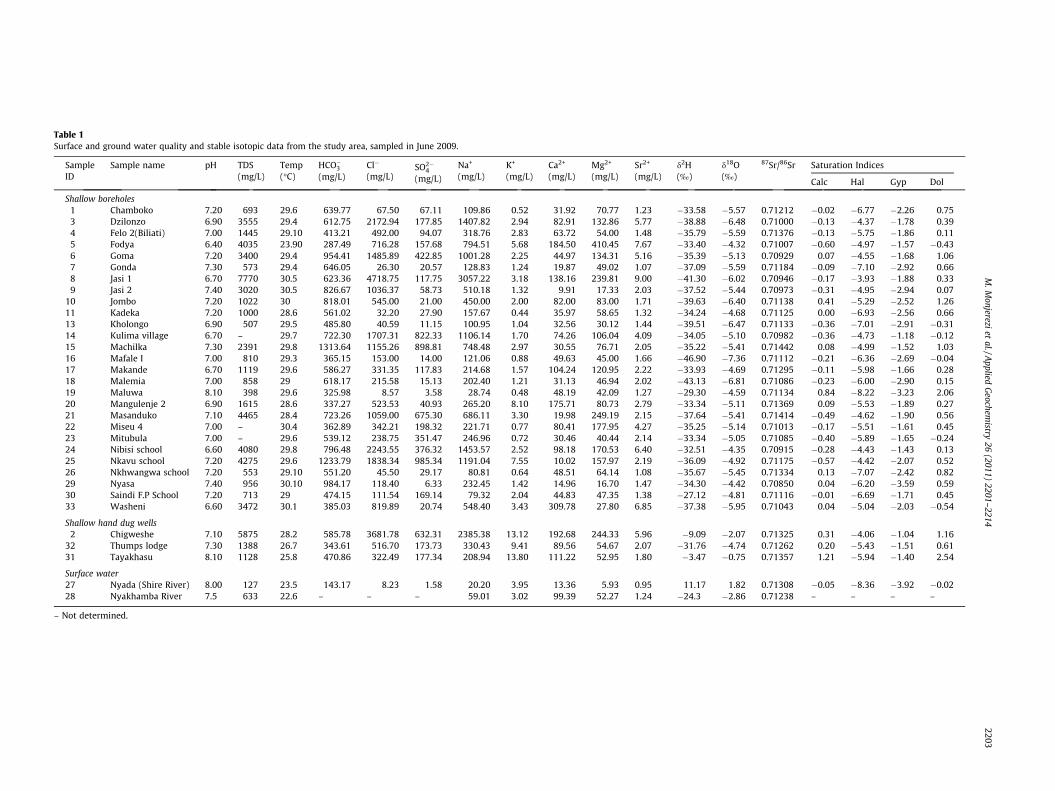
Table 1Surface and ground water quality and stable isotopic data from the study area, sampled in June 2009.
SampleID
Sample name pH TDS(mg/L)
Temp(�C)
HCO�3(mg/L)
Cl�
(mg/L)SO2�
4
(mg/L)
Na+
(mg/L)K+
(mg/L)Ca2+
(mg/L)Mg2+
(mg/L)Sr2+
(mg/L)d2H(‰)
d18O(‰)
87Sr/86Sr Saturation Indices
Calc Hal Gyp Dol
Shallow boreholes1 Chamboko 7.20 693 29.6 639.77 67.50 67.11 109.86 0.52 31.92 70.77 1.23 �33.58 �5.57 0.71212 �0.02 �6.77 �2.26 0.753 Dzilonzo 6.90 3555 29.4 612.75 2172.94 177.85 1407.82 2.94 82.91 132.86 5.77 �38.88 �6.48 0.71000 �0.13 �4.37 �1.78 0.394 Felo 2(Biliati) 7.00 1445 29.10 413.21 492.00 94.07 318.76 2.83 63.72 54.00 1.48 �35.79 �5.59 0.71376 �0.13 �5.75 �1.86 0.115 Fodya 6.40 4035 23.90 287.49 716.28 157.68 794.51 5.68 184.50 410.45 7.67 �33.40 �4.32 0.71007 �0.60 �4.97 �1.57 �0.436 Goma 7.20 3400 29.4 954.41 1485.89 422.85 1001.28 2.25 44.97 134.31 5.16 �35.39 �5.13 0.70929 0.07 �4.55 �1.68 1.067 Gonda 7.30 573 29.4 646.05 26.30 20.57 128.83 1.24 19.87 49.02 1.07 �37.09 �5.59 0.71184 �0.09 �7.10 �2.92 0.668 Jasi 1 6.70 7770 30.5 623.36 4718.75 117.75 3057.22 3.18 138.16 239.81 9.00 �41.30 �6.02 0.70946 �0.17 �3.93 �1.88 0.339 Jasi 2 7.40 3020 30.5 826.67 1036.37 58.73 510.18 1.32 9.91 17.33 2.03 �37.52 �5.44 0.70973 �0.31 �4.95 �2.94 0.07
10 Jombo 7.20 1022 30 818.01 545.00 21.00 450.00 2.00 82.00 83.00 1.71 �39.63 �6.40 0.71138 0.41 �5.29 �2.52 1.2611 Kadeka 7.20 1000 28.6 561.02 32.20 27.90 157.67 0.44 35.97 58.65 1.32 �34.24 �4.68 0.71125 0.00 �6.93 �2.56 0.6613 Kholongo 6.90 507 29.5 485.80 40.59 11.15 100.95 1.04 32.56 30.12 1.44 �39.51 �6.47 0.71133 �0.36 �7.01 �2.91 �0.3114 Kulima village 6.70 – 29.7 722.30 1707.31 822.33 1106.14 1.70 74.26 106.04 4.09 �34.05 �5.10 0.70982 �0.36 �4.73 �1.18 �0.1215 Machilka 7.30 2391 29.8 1313.64 1155.26 898.81 748.48 2.97 30.55 76.71 2.05 �35.22 �5.41 0.71442 0.08 �4.99 �1.52 1.0316 Mafale I 7.00 810 29.3 365.15 153.00 14.00 121.06 0.88 49.63 45.00 1.66 �46.90 �7.36 0.71112 �0.21 �6.36 �2.69 �0.0417 Makande 6.70 1119 29.6 586.27 331.35 117.83 214.68 1.57 104.24 120.95 2.22 �33.93 �4.69 0.71295 �0.11 �5.98 �1.66 0.2818 Malemia 7.00 858 29 618.17 215.58 15.13 202.40 1.21 31.13 46.94 2.02 �43.13 �6.81 0.71086 �0.23 �6.00 �2.90 0.1519 Maluwa 8.10 398 29.6 325.98 8.57 3.58 28.74 0.48 48.19 42.09 1.27 �29.30 �4.59 0.71134 0.84 �8.22 �3.23 2.0620 Mangulenje 2 6.90 1615 28.6 337.27 523.53 40.93 265.20 8.10 175.71 80.73 2.79 �33.34 �5.11 0.71369 0.09 �5.53 �1.89 0.2721 Masanduko 7.10 4465 28.4 723.26 1059.00 675.30 686.11 3.30 19.98 249.19 2.15 �37.64 �5.41 0.71414 �0.49 �4.62 �1.90 0.5622 Miseu 4 7.00 – 30.4 362.89 342.21 198.32 221.71 0.77 80.41 177.95 4.27 �35.25 �5.14 0.71013 �0.17 �5.51 �1.61 0.4523 Mitubula 7.00 – 29.6 539.12 238.75 351.47 246.96 0.72 30.46 40.44 2.14 �33.34 �5.05 0.71085 �0.40 �5.89 �1.65 �0.2424 Nibisi school 6.60 4080 29.8 796.48 2243.55 376.32 1453.57 2.52 98.18 170.53 6.40 �32.51 �4.35 0.70915 �0.28 �4.43 �1.43 0.1325 Nkavu school 7.20 4275 29.6 1233.79 1838.34 985.34 1191.04 7.55 10.02 157.97 2.19 �36.09 �4.92 0.71175 �0.57 �4.42 �2.07 0.5226 Nkhwangwa school 7.20 553 29.10 551.20 45.50 29.17 80.81 0.64 48.51 64.14 1.08 �35.67 �5.45 0.71334 0.13 �7.07 �2.42 0.8229 Nyasa 7.40 956 30.10 984.17 118.40 6.33 232.45 1.42 14.96 16.70 1.47 �34.30 �4.42 0.70850 0.04 �6.20 �3.59 0.5930 Saindi F.P School 7.20 713 29 474.15 111.54 169.14 79.32 2.04 44.83 47.35 1.38 �27.12 �4.81 0.71116 �0.01 �6.69 �1.71 0.4533 Washeni 6.60 3472 30.1 385.03 819.89 20.74 548.40 3.43 309.78 27.80 6.85 �37.38 �5.95 0.71043 0.04 �5.04 �2.03 �0.54
Shallow hand dug wells2 Chigweshe 7.10 5875 28.2 585.78 3681.78 632.31 2385.38 13.12 192.68 244.33 5.96 �9.09 �2.07 0.71325 0.31 �4.06 �1.04 1.16
32 Thumps lodge 7.30 1388 26.7 343.61 516.70 173.73 330.43 9.41 89.56 54.67 2.07 �31.76 �4.74 0.71262 0.20 �5.43 �1.51 0.6131 Tayakhasu 8.10 1128 25.8 470.86 322.49 177.34 208.94 13.80 111.22 52.95 1.80 �3.47 �0.75 0.71357 1.21 �5.94 �1.40 2.54
Surface water27 Nyada (Shire River) 8.00 127 23.5 143.17 8.23 1.58 20.20 3.95 13.36 5.93 0.95 11.17 1.82 0.71308 �0.05 �8.36 �3.92 �0.0228 Nyakhamba River 7.5 633 22.6 – – – 59.01 3.02 99.39 52.27 1.24 �24.3 �2.86 0.71238 – – – –
– Not determined.
M.M
onjereziet
al./Applied
Geochem
istry26
(2011)2201–
22142203

Fig. 2. Bivariate plots showing relationship between (a) Na+ (b) Cl� and (c) HCO3 –with total cations/anions (meq L�1). The diagonal lines are lines of 1:1 slope.Samples are grouped according to their HCA clusters (see Fig. 5b for explanation).
Fig. 3. Distribution of water types with respect to salinity distribution (data fromMonjerezi et al. (2011)). The geological units and other features are as explained inFig. 1. EC values are in lS/cm.
2204 M. Monjerezi et al. / Applied Geochemistry 26 (2011) 2201–2214
2.2. Water sampling and analytical methods
The water samples considered in this study were collected dur-ing the dry season in June 2009. They were taken from shallowboreholes and hand dug wells used for rural water supply and riv-ers (see Fig. 1), applying standard sampling procedures (APHA,1985; ISO 5667-11:1993). The shallow boreholes were typicallyto depths between 20 and 55 m, whilst the hand dug wells wereless than 10 m deep. The water samples were collected in pre-cleaned new polyethylene bottles in triplicates, two of which werefiltered. One of the filtered sample was acidified with HNO3 (to pH<2) and stored in pre-cleaned polyethylene bottles for major
cation, strontium isotope and Sr content analysis. The other filteredsample was stored unacidified in pre-cleaned new polyethylenebottles for anion analysis. The third (unfiltered) sample was usedfor stable-isotope (d2H and d8O) analyses. All samples were ana-lysed for main chemical descriptors (EC,TDS, pH, Na+, Ca2+, Mg2+,K+, HCO�3 , Cl�, SO2�
4 , NO�3 , Sr2+, 87Sr/86Sr, d2H and d18O) using stan-dard methods. Temperature, pH (ISO 10523-1:1994), electricalconductivity (EC) (ISO 7888:1985) and total dissolved solids(TDS) were measured in the field using Hanna model HI-9812pH-EC-TDS meter (Hanna Instruments Limited). The rest of theparameters (Na+, Ca2+, Sr2+, Mg2+, K+, CO2�
3 , HCO�3 , Cl�, NO�3 andSO2�
4 ) were determined at the Department of Chemistry, Universityof Oslo, Norway. Concentrations of Na+, K+, Ca2+, Sr2+ and Mg2+
were determined using ICP-OES (Vista AX CCD, Varian Ltd). Ionchromatography (DIONEX 2000) was used to determine amountsof sulphates, nitrates and chlorides. CO2�
3 and HCO�3 were deter-mined using acid titration (APHA, 1985). The stable isotopes(87Sr/86Sr, d2H and d18O) were determined at the Institute for En-ergy Technology (IFE), Norway. Oxygen-18 and deuterium weredetermined by mass spectrometry (Delta + XP stable isotope ratiomass spectrometry, Thermo Scientific, Germany), with the results

Fig. 4. (a) Sodium concentrations plotted against Cl� concentrations. (b) semi-logplot for Na+ and Cl� concentrations, showing the break in slope depending onsample salinity.
Fig. 5. (a) A dendrogram showing classification into seven clusters (C1–C7;counting from left). (b) Piper diagram for the groundwater samples, showing thehydro-geochemical water types of the seven clusters.
M. Monjerezi et al. / Applied Geochemistry 26 (2011) 2201–2214 2205
expressed as per mill relative to the Vienna Standard Mean OceanWater (VSMOW). The 87Sr/86Sr ratios were measured using ther-mal ionisation mass spectrometer (TIMS). Isotopic results were re-ported with an error margin of ±1.07‰, ±0.15‰ and ±0.000009‰
for d2H, d18O and 87Sr/86Sr, respectively.The geochemical modelling program PHREEQC v2.16 (Parkhurst
and Appelo, 1999), implemented with MINTEQ.v4 database (Alli-son et al., 1991) was used to calculate saturation indices (SI) withrespect to the main mineral phases. The fifteen chemical variables(which include 87Sr/86Sr, d2H and d8O) were also analysed using Q-mode Hierarchical Cluster Analysis (HCA) and Principal Compo-nent Analysis (PCA). The parameters (except pH, 87Sr/86Sr, d2Hand d8O) were log-transformed and then all of them were routinelystandardised prior to the multivariate analyses by subtracting themean value and dividing by the standard deviation of the parame-ter. Both HCA and PCA were performed using R statistical software(R Development Core Team, 2009). The HCA was implemented in Rusing stats package (R Development Core Team, 2009), and wasperformed using Ward’s linkage method (Ward, 1963), adoptingEuclidean distances as a measure of dissimilarity. The PCA wasimplemented using FactoMineR (Factor analysis and data Miningwith R) package (Husson et al., 2009).
Fig. 6. Plot of d2HVSMOW (‰) vs. d18OVSMOW (‰) for groundwater and surface watersamples. Samples marks are according to clusters (see Fig. 5b).
3. Results and discussion3.1. Major ions and hydro-geochemical characteristics
The chemical data of ground- and surface water samples con-sidered in this study are given in Table 1. The water samples had
average temperatures during sampling of around 30 �C (Table 1),reflecting the average yearly temperature of the study area. pH val-ues from 6.4 to 8.1 were found, with an average pH of 7.0. Electricconductivity (EC) varied considerably from 254 to 15540 lS cm�1

Fig. 7. (a) Distribution of Sr concentrations and isotope composition of groundwater samples from the study area. The geological units and other features are as explained inFig. 1. (b) Variation of Sr concentrations from west to east. (c) Variation of 87Sr/86Sr ratios from west to east. Sample marks are according to clusters (see Fig. 5b). Srconcentrations and EC values are in mg/L and lS/cm, respectively.
2206 M. Monjerezi et al. / Applied Geochemistry 26 (2011) 2201–2214
(Table 1). Na+ and Cl� are dominant major ions in saline samples,whereas bicarbonate is the dominant anion in the relatively lowTDS samples (Fig. 2). Fig. 3 shows the distribution of water typesfor the samples considered in this study superimposed over distri-bution of salinity in the study area (Monjerezi et al., 2011). Na–Clgroundwater type is associated with high salinity areas, whereasrelatively less saline groundwater in the proximity of the areas ofhigh salinity is characterised by Na-mixed anion or Na–Ca (Mg)–Cl and Na–HCO3, indicating possible interaction between salineand fresh groundwater. In general, groundwater salinity is high to-wards Shire River and in some selected areas upstream (Fig. 3) anddoes not show significant pattern of variation with depth (Mon-jerezi et al., 2011). Most of the groundwater samples were under-saturated with regards to gypsum and halite, in equilibrium withrespect to calcite and saturation with respect to dolomite (Table 1).
Since Na+ and Cl� are the two most dominant ions in the brack-ish groundwater samples (Fig. 2), and in many waters they havethe same source, they are plotted against each other in Fig. 4. Ingeneral, there is a strongly linear grouping of the data (Fig. 4a), alsosuggestive of a mixing trend of relatively saline water with freshgroundwater. The samples with relatively high salinity straddleacross the equivalence line of Na+ and Cl� suggesting an original
saline end-member from dissolution of halite, with rock-waterinteractions modifying the Na+ content. In the semilog plot ofNa+ vs Cl� (Fig. 4b), a steeper slope for samples in the broad rangeof Cl� < 100 mg L�1 and a gentle slope at higher concentrations isobserved. The median Na+/Cl� molar ratio for the steep slope is3.03, which is attributable to effects of silicate weathering, provid-ing Mg2+ and Ca2+. The shallow slope has a median molar ratio of0.95. The bimodal slope therefore suggests that there is a transitionfrom fresh groundwater, influenced by silicate weathering, togroundwater with relatively high salinity, originating from halitedissolution (c.f. Nordstrom et al., 1989).
3.2. Hierarchical Cluster Analysis
Hierarchical Cluster Analysis (HCA) provided an independentapproach for grouping the water samples. The groundwater sam-ples were classified by Q-mode HCA into seven clusters (Fig. 5)according to their chemical and isotopic composition. The numberof clusters was chosen based on the minimum number of clustersthat explain most of the variation in hydro-geochemical propertiesof the water samples.

Fig. 8. (a) Relationship between molar Sr and Ca. (b) Variation of molar Sr/Cl ratioswith salinity (TDS). The dotted horizontal line marks molar Sr/Cl ratio for seawater.Sample marks are according to clusters (see Fig. 5b).
M. Monjerezi et al. / Applied Geochemistry 26 (2011) 2201–2214 2207
Samples in clusters C1–C4 have a dominant chemical composi-tion of the Na–Cl type (Fig. 5b). The first cluster (C1) is character-ised by high salinity (median TDS = 3795 mg L�1) and is separatedfrom clusters C2, C3 and C4 at the second divide in the dendro-gram, showing that samples in C1 have distinct chemistry fromthe ones in C2, C3 and C4 (Fig. 5a). Samples in the second cluster(C2) have salinity intermediate between C1 and C6 (medianTDS = 1388 mg L�1). Conferring the sample numbers to their sam-pling site, we note that C2 samples were collected in the proximityof C1 samples (Figs. 3 and 7). C3 contains groundwater samplesfrom boreholes along the marshes, whereas samples from veryshallow hand dug holes are classified together in C4. Low TDS sur-face water (from Shire River) is classified into C5. Samples 9 and29, associated with the Cretaceous sandstones, are characterisedby low Sr concentration and isotopic composition and are clusteredtogether in cluster C6. The last cluster (C7) contains low TDSgroundwater samples (median TDS = 810 mg L�1) characterisedby mixed cationic composition and anionic composition domi-nated by bicarbonates. Thus, C6’s chemical composition can becharacterised as mixed cation-HCO�3 type (Fig. 5b).
3.3. Stable isotopes of water
Groundwater samples had d18OVSMOW and d2HVSMOW valuesranging from�7.4‰ to�2.1‰ and�46.9‰ to �9.1‰, respectively.For the surface water samples, the d18OVSMOW and d2HVSMOW valuesranged from �24.3‰ to 11.2‰ and �2.9‰ to 1.8‰, respectively(Table 1). Very shallow groundwater samples (samples 2 and 31)and surface water samples (samples 27 and 28), taken close to
the marshes (except sample 28), are relatively enriched in d18Oand d2H compared to the rest of the samples (Fig. 6). This enrich-ment in heavy isotopes of water is attributable to evaporation.Sample 27 is a surface water sample from Shire River, which is sub-jected to evaporation in Lake Malawi and Lake Malombe (Fig. 1), aswell as along the river’s course (approximately 240 km to the sam-ple area; Shela, 2000) and marshes, which form areas of shallowslow moving water. Samples 2 and 31 were taken within 1 mdepth. It is therefore likely that their isotopic composition is dueto influence of evaporation from the soil surface.
In Fig. 6, a few groundwater samples plot along the GlobalMeteoric Water Line (GMWL) (d2HVSMOW = 8d18OVSMOW + 10; Craig,1961), indicating a meteoric origin, whilst the majority of the sam-ples plot in a group to the right of the GMWL, indicating the effectof processes such as evaporation within the unsaturated zone dur-ing recharge or mixing with an evaporated source. Values of d18Oand d2H for local precipitation throughout the study area are notdocumented. A general estimate, however, can be derived fromdata and study results from nearby areas. Data from the nearestGlobal Network of Isotopes in Precipitation (GNIP) monthly sta-tions, with a similar climate, give slopes of 7.75 ± 0.12 (Ndola,Zambia) and 7.50 ± 0.12 (Harare, Zimbabwe) for plots of d2HVSMOW
(‰) vs d18OVSMOW (‰) for rainwater (IAEA/WMO, 2006). The mete-oric line for the Ndola station (d2HVSMOW = 7.75d18OVSMOW + 9.68;IAEA/WMO, 2006) is also plotted in Fig. 6 to represent a local mete-oric water line (LMWL) and it plots close to that of the GMWL. Theintercept of a line of best-fit through the data points(d2HVSMOW = 6.30d18OVSMOW � 1.65; r2 = 0.94) extrapolated to theLMWL should indicate the composition of infiltrating rainwater.The isotopic composition of this point (d18OVSMOW = -7.9‰ andd2HVSMOW = �51.7‰; point A in Fig. 6) is within the lower rangeof values for the present-day precipitation reported at the monthlyGNIP stations (IAEA/WMO, 2006) of Zambia (d18OVSMOW =�6.13 ± 1.68‰; d2HVSMOW = �36.7 ± 13.37‰) and Zimbabwe(d18OVSMOW = �5.96 ± 1.48‰; d2HVSMOW = �33.1 ± 13.23‰). Theisotopic composition of the infiltrating rainwater (locally gener-ated groundwater) is very close to that of sample 16 (Fig. 6 andTable 1).
3.4. Strontium and strontium isotope ratios
Strontium concentrations in groundwater ranged from 1.07 to9.0 mg/L, whereas surface water samples had Sr concentrationsof 0.95 and 1.24 mg/L (Table 1). Sr shows significant moderate tostrong correlations with TDS (r = 0.83; p < 0.001), Ca2+ (r = 0.69;p < 0.001), Cl� (r = 0.76; p < 0.001), Na+ (r = 0.79; p < 0.001) andMg2+ (r = 0.69; p < 0.001). Elevated Sr concentrations are observedin the samples with relatively high TDS found away from the Shiremarshes (Fig. 7a and b), decreasing with distance towards ShireRiver. The rest of the samples show a steady trend with distance,irrespective of their salinity (Fig. 7b). There is a general patternof increasing strontium with Ca2+ concentrations for the samples(Fig. 8a), showing two distinct trends based on salinity. This pat-tern in strontium concentrations is also suggestive of a salineend-member with high Sr concentrations affecting fresh ground-water. Values of 87Sr/86Sr ratios in groundwater samples rangedfrom 0.70850 to 0.71442 and the surface water samples had87Sr/86Sr ratios of 0.71238 and 0.71308 (Table 1). 87Sr/86Sr ratiosincrease with distance along flow path from the outcropping areasto Shire River (Fig. 7c). The least radiogenic groundwater samplesare those mainly associated with the Cretaceous Lupata sandstones(Fig. 7a and c). The observed changes in 87Sr/86Sr ratios along flowpaths imply that processes within the aquifer exert control on thestrontium isotope composition of the groundwater.
The high TDS groundwater samples have low Sr/Cl� molarratios (Fig. 8b), high strontium concentrations and low 87Sr/86Sr

Fig. 9. Results of PCA showing the four principal components. Individual (observations) graph (upper panel) and variables (chemical parameters) graph (lower panel). Samplemarks are according to clusters (see Fig. 5b).
2208 M. Monjerezi et al. / Applied Geochemistry 26 (2011) 2201–2214
ratios (Figs. 7 and 12) overlapping those of modern seawater(87Sr/86Sr = 0.70920; [Sr2+] = 8.1 mg L�1). However, the 87Sr/86Sr ra-tios are higher than those expected for Cretaceous marine (0.7068–0.7084; Burke et al., 1982) and non-marine evaporites (0.70825;Palmer et al., 2004). The relatively low 87Sr/86Sr ratios and highSr2+ concentrations may therefore be explained by mixing betweensaline groundwater derived from dissolution of evaporite mineralswith fresh groundwater (or meteoric water). For the relatively lowTDS, Sr2+/Cl� molar ratios are high (Fig. 8b), which, in addition tothe generally good correlation between Sr2+ and Ca2+ (Fig. 8a),may be attributed to one or more of the following processes: sili-cate weathering, dissolution of carbonate or gypsum in the unsat-urated zone and/or mineral reactions in the saturated zone.
Gypsum dissolution is expected to produce Sr2+/Ca2+ ratios low-er than those for seawater (c.f. Harrington and Herczeg, 2003; Cart-wright et al., 2007). However, the Sr2+/Ca2+ molar ratios of thegroundwater samples in the study area are higher (Fig. 8a) thanthat of seawater (molar Ca2+/Sr2+ = 109). In addition, Ca2+ andSO2�
4 are not correlated (r = �0.09) and all groundwater samplesare undersaturated with respect to gypsum (Table 1; Monjereziet al., 2011). Therefore, significant gypsum dissolution has not oc-curred and hence gypsum is precluded as a major control on Sr iso-tope geochemistry. In the studied section of the lower Shire area,carbonate cements and veins are locally present (Habgood, 1963;Bradford, 1973) and may affect Sr isotope geochemistry. Precipita-tion of carbonate minerals tends to increase the Sr2+/Ca2+ ratio inthe residual water due to rejection of Sr2+ in preference for Ca2+
in carbonates (Pingitore and Eastman, 1986). However, the Sr2+/Ca2+ ratios expected from significant carbonate dissolution are also
lower that the seawater ratio (Harrington and Herczeg, 2003; Cart-wright et al., 2007). In addition, the groundwater samples are gen-erally in equilibrium with respect to calcite (Table 1). Furthermore,concentration of strontium decreases and the groundwater be-comes more radiogenic with distance along flow paths (even forthe low TDS samples; Fig. 7), therefore carbonate precipitation can-not be the major process influencing the Sr isotope geochemistry.
The high Sr2+/Cl� molar ratios probably reflect silicate weather-ing that is locally important in controlling the chemistry of theleast saline groundwater (Monjerezi et al., 2011). The 87Sr/86Sr ra-tios of the groundwater are similar to those reported for aquiferswhere silicate weathering occurs (Négrel et al., 2001; Grobe andMachel, 2002). The increase in the 87Sr/86Sr ratios of groundwateraway from the basin margins (Fig. 7) is a reflection of variations inaquifer mineralogy. More radiogenic groundwater samples arefrom the colluviums close to Shire River marshes, the colluviumsdownstream of the basalts and in the clays upstream of the sugarestate (Fig. 7a). These sediments contain a high proportion of K-rich minerals (e.g. biotite, orthoclase, and muscovite) and labrador-ite derived from the Precambrian Basement Complex and the Kar-oo basalts (Habgood, 1963). The K- and Rb rich minerals will haverelatively high 87Sr/86Sr ratios (c.f. Négrel et al., 2001) and interac-tion with them may render groundwater more radiogenic. The ba-salt outcrop has an augite-labradorite composition. The Cretaceoussandstones consist of grits, shale, marl and calcareous cement,deposited mainly under the arid conditions and they are derivedfrom the Karoo and crystalline rocks (Habgood, 1963). The calcar-eous shales, marl and the Ca/Na-rich plagioclase (labradorite) willhave lower 87Sr/86Sr ratios.

Fig. 10. Plots of d18OVSMOW (‰) vs concentrations of (a) Cl�, (b) Na+ and (c) Sr2+, and TDS (d).
M. Monjerezi et al. / Applied Geochemistry 26 (2011) 2201–2214 2209
3.5. Principal Component Analysis
Principal Component Analysis (PCA) provided an independentapproach for correlating chemical parameters and linking themto the individual samples. Four principal components (PCs) wereextracted (eigenvalues P1; Kaiser, 1958), accounting for 84% ofthe total variance (Fig. 9). The first two PCs explain most (64%) ofthe total variance in the dataset (Fig. 9). The first principal compo-nent (PC1) explains 41% of total variance and shows strong positivecorrelation for salinity (TDS) and the ions Na+, Cl�, Mg2+, SO2�
4 andSr2+, and negative correlation for pH, 87Sr/86Sr, d18O and d2H(Fig. 9d). The sample scores along PC1 are typically high for sam-ples in clusters C1 and C3 (Fig. 9a). This PC composition is similarto the salinisation dimension reported by Monjerezi et al. (2011).The high scores in Na+ and Cl�, in association with TDS, suggestthat the high salinity is influenced by dissolution of halite (Mon-jerezi et al., 2011). Evaporative concentration and silicate weather-ing are precluded as major processes by the negative correlationsof d18O and d2H and pH, 87Sr/86Sr, respectively, along this PC(Fig. 9d). Principal component 2 (PC2) explained 23% of the totalvariance and had strong positive correlations for K+, d18O andd2H, and moderate positive correlations for 87Sr/86Sr and Ca(Fig. 9d). The sample scores for PC2 are high in C4 and C5, compris-ing very shallow groundwater and surface water (Fig. 9a). This sug-gests that these samples are influenced by evapo-concentration(d18O and d2H) and weathering (K+, 87Sr/86Sr and Ca). PC3 explained12% of the total variance, with positive correlations for HCO�3 , SO2�
4 ,pH, 87Sr/86Sr and weakly with Na+, and negative correlations forCa2+ and Sr2+ (Fig. 9e). This PC has characteristically high scores
for C3 which implies that C3 samples also show interaction withhigh 87Sr/86Sr sediment and possible exchange of bound Na+ withCa2+. PC4 explained only 8% of the total variance, with positive cor-relations for NO�3 , d18O and d2H, and negative correlation with87Sr/86Sr ratio (Fig. 9f). PC4 has high sample scores for samples inC6 and C5 (Fig. 9c). The positive correlation in NO�3 and negativein 87Sr/86Sr ratios suggests that samples in C6 may be influencedby anthropogenic activities as well as interaction with low87Sr/86Sr sediment, respectively.
PCA sample score plots are used in identifying end-membersand relevant mixing ratios in multivariate mixing and mass bal-ance (M3) (Laaksoharju et al., 2008; Laaksoharju et al. 1999a,1999b) and end member mixing analysis (EMMA) calculations(Christophersen et al., 1990; Hooper et al., 1990; Christophersenand Hooper, 1992; Liu et al., 2004). Most (64%) of the total variancein the dataset can be looked at when PC1 and PC2 are plotted. InFig. 9a, high TDS samples in C1, low TDS groundwater samples inC7 (circles) and surface water sample (C5) form the vertices of atriangle, indicating that the chemistry of the samples within thistriangle may be explained by mixtures involving representativesof C1, C5 and C7, as end-members. Sample 8, the most saline (ofsamples in this study), may represent high salinity boreholegroundwater (C1) and sample 16 may represent low TDS ground-water (C7) because it has a d18O and d2H isotopic compositionresembling that of locally generated groundwater (Fig. 6). Samplesin C4 plot outside the triangle in Fig. 9a, indicating that an extraprocess contributes to the chemistry of these samples. These sam-ples have high PC2 scores hence they are also affected by evapora-tion. In Fig. 9, the plot of PC2 vs PC3 shows very little dispersion.

Fig. 11. Plots of d2HVSMOW (‰) vs concentrations of (a) Cl�, (b) Na+ and (c) Sr2+, and TDS (d).
2210 M. Monjerezi et al. / Applied Geochemistry 26 (2011) 2201–2214
3.6. Effects of evaporation
Evaporative concentration is one of the major causes of salinityin arid environments. The interpretation of the PCA and the stableisotopes of water suggest that shallow groundwater close to ShireRiver may be under the influence of evaporation. We thereforecomputed the changes in d18O, d2H and Cl� of water undergoingevaporation. Values of d18O and d2H were computed for an opensystem undergoing evaporation via Rayleigh distillation, incorpo-rating both equilibrium, using fractionation factors given by Kakiu-chi and Matsuo (1979) and kinetic (humidity) (Gonfiantini, 1986)fractionation (c.f. Meyers et al., 1993 and Butler, 2007). The isoto-pic equilibrium enrichment factors were calculated at a tempera-ture of 26 �C, which is the yearly average temperature for thearea for the period 1971–2008 (data from Nchalo meteorologicalstation). Changes in Cl� concentrations during evaporation ofgroundwater were simulated by means of a simple evaporationmodel in PHREEQC (Parkhurst and Appelo, 1999). Sample 16 waschosen as the starting solution composition in these calculationsbecause its isotopic composition resembles that of locally gener-ated groundwater (Fig. 6).
The resultant open system evaporative fractionation model ford18O and d2H is shown in Fig. 6 (crosses). Each point, from left toright, represents a progressive evaporative reduction by 5% of theoriginal volume of water. The average relative humidity duringevaporation and infiltration of water was estimated at 78% by fix-ing the slope of the modelled evaporation trend line (Fig. 6) to thatof the best-fit trend line, found through linear regression of thesurface and groundwater samples (c.f. Butler, 2007). This calcu-lated value of relative humidity is comparable to monthly maxi-
mum relative humidity of the area (data not shown: Nchalometeorological station 1971–2008) for the more humid monthsof the rainy season.
Variations in Cl� concentration vs. d18O and d2H are depicted inFigs. 10a and 11a, respectively. The surface water sample 27 (ShireRiver) and the shallow groundwater sample 31 (EC = 2,269 lS cm�1) plot close to the evaporation model line. This corrob-orates the interpretation of PC2 that samples clustered in C4 andC5 show influence of evaporation. However, the other shallowgroundwater (sample 2) deviates from the evaporation model lineand plots towards the relatively high TDS cluster, C1. This is attrib-utable to mixing with saline groundwater with high Cl� content. Apattern of increasing salinity with d18O and d2H, as would havebeen expected if evaporation was the primary driver for d18O andd2H is not observed for the majority of the groundwater samplesin Fig. 6, Fig. 10a and Fig. 11a. For example, sample 8 has the high-est salinity (of all the samples considered in this study) but its iso-topic composition is not enriched in d18O and d2H (Fig. 6) and itsdepth (42 m) precludes the influence of in situ evaporation.Accordingly, an additional mechanism is needed in order to explainevolution of saline groundwater.
3.7. Groundwater mixing analysis
The PCA-plot (Fig. 9a) shows the possibility of describinggroundwater chemistry in terms of mixing of at least three end-members. The surface water sample 27 (Shire River) plots quiteclose to the evaporation model line (Figs. 10a and 11a) hence itcan also represent an evaporated groundwater recharge (c.f.Woods et al., 2000). This end-member is characterised by high

Fig. 12. Plots of Sr isotope ratios vs (a) Sr2+, (b) Cl� and (c) 1/Sr to showgroundwater mixing trends.
Fig. 13. Plots of Sr isotope ratios vs (a) Sr2+ and (b) 1/Sr showing mixing andmineral dissolution models.
M. Monjerezi et al. / Applied Geochemistry 26 (2011) 2201–2214 2211
87Sr/86Sr values and low Sr2+ concentration. The fresh groundwaterend-member has moderate 87Sr/86Sr and low Sr2+ levels (e.g. sam-ple 16), whereas the end-member representing saline groundwateris characterised by low 87Sr/86Sr and high Sr2+ levels (e.g. sample8).
Sr isotopes and stable isotopes of water can be used as tracers ofgroundwater mixing provided that two or more components aredefined. Concentrations of an element X in a mixture (M), compris-ing components A and B, in proportions, fA and fB, respectively, isgiven by equation:
XM ¼ fAXA þ ð1� fAÞXB ð1Þ
Whereas the 87Sr/86Sr ratio of such a mixture is given by the follow-ing equation (Faure and Mensing, 2005):
87Sr86Sr
� �M¼
87Sr86Sr
� �AfA
SrA
SrM
� �þ
87Sr86Sr
� �Bð1� fAÞ
SrB
SrM
� �ð2Þ
We compared the variation in isotopic compositions with vari-ations in salinity (TDS) and the ions that are strongly correlatedwith it (Na+: r = 0.95, p < 0.001; Cl�: r = 0.91; p < 0.001; Sr2+:r = 0.83; p < 0.001), by means of EMMA mixing diagrams (Christo-phersen et al., 1990 and Hooper et al., 1990). Mixing trends be-tween the three end-members are shown in Figs. 10–13. For thestable isotopes of water, most of the groundwater samples are en-closed within a triangle defined by mixing lines involving the threeend-members (Figs. 10 and 11). However, mixing between thethree end-members was not adequate to describe the strontiumisotope and concentration data for all groundwater samples(Fig. 12). Conservative behaviour is therefore more apparent withd18O and d2H than with 87Sr/86Sr ratios. In Figs. 10 and 11, themajority of the samples with relatively high salinity define a linebetween saline groundwater end-member and a mixture of thelow TDS surface water and groundwater end-members, indicatingsequential two-component mixtures (Faure and Mensing, 2005).The chemistry of these samples may therefore be interpreted asa result of the influence of evaporated groundwater recharge andsaline groundwater on fresh groundwater. This interpretation iscorroborated by the fact that these samples are spatially associatedwith the high salinity areas (see Fig. 3) and their arrangement inFigs. 10 and 11 coincides with their vicinity to these high salinity

Fig. 14. Comparison of estimated and observed values of (a) d2HVSMOW (‰), (b) Na+, (c) Sr2+ and (d) TDS.
2212 M. Monjerezi et al. / Applied Geochemistry 26 (2011) 2201–2214
areas, i.e. the samples that are collected in the vicinity of highsalinity areas shown in Fig. 3 plot closest to sample 8 (Figs. 10and 11).
Although considerable scatter exits, the effects of mixing onstrontium isotopic composition and concentration in groundwatersamples can be discerned in Fig. 12. Most samples with relativelyhigh salinity (with the exception of C2 and C3) plot on a mixingline between the saline and low TDS groundwater end-members,reflecting the influence of saline groundwater sources. Sample 9(TDS = 3020 mg L�1) is collected in the vicinity of sample 8 (TDS =7770 mg L�1) and downstream of sample 29 (TDS = 956 mg L�1).Fig. 12 shows that the lower salinity for sample 9 (relative to sam-ple 8) is due to dilution with less radiogenic, low TDS and Sr2+
groundwater upstream (e.g. sample 29). Sample 29 has the leastradiogenic strontium isotopic composition (0.7085) of all the sam-ples. This ratio similar to the range of Cretaceous marine 87Sr/86Srratios and thus probably reflects water–rock interaction with lessradiogenic calcareous matrix of the Cretaceous sandstones, with-out the effect of saline groundwater.
Deviations from the simple binary mixtures are apparent inFigs. 10–12. Using PCA and stable isotopes of water, we haveshown that sample 2 is also affected by evaporation. In addition,Fig. 3 shows an area of high salinity which is located upstreamand close to the location of sample 2. In Figs. 10a and 11a, sample2 would plot close to the mixing line of this sample([Cl�] = 172.5 mmol L�1; Monjerezi et al., 2011) as the saline end-member and the surface water end-member. Therefore, the devia-tion for sample 2 is attributable to either the effect of evaporation(non-conservative mixing) or inherent end-member variability. InFig. 12, in addition to sample 2, samples belonging to clusters C2and C3 plot above the mixing lines, indicating that mixing of the
three end-member solutions alone cannot account for the observedSr concentrations and isotope values. These samples have a moreradiogenic strontium isotope composition than predicted by mix-ing, suggesting that the observed 87Sr/86Sr ratios may be due tomixing of the three end-members with some modification by min-eral–water reactions.
To represent the mineral–water reactions, we simulated the ef-fect of adding moles of Sr, with a specified 87Sr/86Sr value, to sam-ple 27 (representing evaporated recharge), using a conservativemineral dissolution model (Banner et al., 1989; Uliana et al.,2007). The crossed line on Fig. 13 represents addition of Sr froma mineral phase with 87Sr/86Sr = 0.715578, with sample 15 as thetarget solution. Model results indicate that dissolution of1.25 � 10�5 moles of Sr per litre at that ratio will reproduce theSr concentration and isotope ratio of the target water composition(sample 15). The 87Sr/86Sr ratio of 0.715578 falls within the rangeof silicate bearing minerals reported elsewhere (e.g. Waightet al., 2000; Dogramaci and Herczeg, 2002; Cartwright et al.,2007). In Fig. 13, it is possible to explain the Sr concentrationand isotope ratio for samples in clusters C2 and C3 using a combi-nation of mass-balance mixing and conservative mineral dissolu-tion models.
The relative contributions of each of the three end-members toeach groundwater sample can be estimated (e.g. Kawanabe et al.,1999) by employing an overall mass balance and balances ontwo conservative tracers:
f1 þ f2 þ f3 ¼ 1 ð3Þ
C11f1 þ C1
2f2 þ C13f3 ¼ C1
t ð4Þ

Fig. 15. Distribution of contributions of the three possible end-members to watersamples. The geological units and other features are as explained in Fig. 1.
M. Monjerezi et al. / Applied Geochemistry 26 (2011) 2201–2214 2213
C21f1 þ C2
2f2 þ C23f3 ¼ C2
t ð5Þ
where f1 is the proportion for component 1, C12 is the concentration
of tracer 1 in component 2 and C1t denotes the concentration of tra-
cer 1 in the groundwater sample.Relative contribution for each source can be obtained by solving
simultaneously the three conservation equations, as:
f1 ¼ðC1
t � C13ÞðC
22 � C2
3Þ � ðC12 � C1
3ÞðC2t � C2
3ÞðC1
1 � C13ÞðC
22 � C2
3Þ � ðC12 � C1
3ÞðC21 � C2
3Þð6Þ
f2 ¼C1
t � C13
C12 � C1
3
� C11 � C1
3
C12 � C1
3
f1 ð7Þ
f3 ¼ 1� f1 � f2 ð8Þ
To facilitate the evaluation of these equations, d18O and Cl� con-centrations were used to give an estimate of the relative contribu-tions of the three end-members and d2H, Na+, Sr2+ and TDS wereused to compare the calculated compositions to the observed con-centrations. Fig. 14 shows the predicted vs. observed d2H Na+, Sr2+
and TDS. The trends in the d2H, Na+ and TDS were reasonablyreproduced, whereas there was more scatter in the trend for Sr(Fig. 14). The low correlation for Sr2+ is attributed to non-conserva-tive mixing due to water–rock interaction reactions such as silicateweathering, as discussed above. Fig. 15 shows spatial distributionof the computed estimates of relative contributions from theend-members. In the areas adjacent to the high salinity zones, con-tribution ratio of the saline end-member (sample 8) is generallyhigh. In contrast, the contribution from low TDS groundwater is
apparent in the low salinity areas, which are as such not influencedby sources of saline groundwater. These samples show insteadinfluence of fresh groundwater and evaporated recharge.
4. Conclusions
Identification of geochemical processes that control salinity andevolution of groundwater is essential for predicting long-term vari-ations in groundwater quality. In this study, a coupled geochemicalinvestigation of strontium isotopes, stable isotopes of water andmajor ions, provided additional constraints regarding the geo-chemical evolution of groundwater in an area where salinegroundwater occurs in several restricted locations.
The spatial distribution of 87Sr/86Sr ratios shows a generalincreasing trend along flow path and reflects sediment mineralogy.End-members representing fresh groundwater, evaporated re-charge and saline groundwater were identified based on majorion and isotopic composition. Statistical assessment of the data(using PCA), coupled with major ions ratios and a conceptual eval-uation of the strontium concentration and isotope compositionconclude that dissolution of halite is the main origin of the salineend-member. Conservative mixing models show that brackishgroundwater, in the vicinity of salinity hot spots, results from mix-ing of this saline groundwater with fresh groundwater and evapo-rated recharge. For groundwater samples with relatively lowsalinity, conservative mixing models indicate influence of mixingof evaporated recharge and fresh groundwater only. In addition,the PCA and stable isotopes of water suggest that evaporation isimportant only for shallow groundwater in the areas in the Shiremarshes. However, high Cl� levels could also only be explainedby mixing with the saline groundwater end-member.
The results of this study have implications for the developmentand management of groundwater salinity in this area, wheregroundwater is a major source of domestic water supply. Contin-ued water utilisation in and near the areas of saline groundwateris likely to further increase the contamination of the fresh ground-water resource and degradation of groundwater quality. Therefore,in future groundwater development in the area, high abstractionrates from the more vulnerable and contaminated groundwatershould be avoided, instead exploration of the high quality in theareas of low salinity should be encouraged.
Acknowledgments
This study was supported by a NUFU funded Project (NUFUPRO-2007-10079): ‘‘Capacity Building in Water Sciences for ImprovedAssessment and Management of Water Resources’’. The first andfourth authors are grateful to Cosmo Ngongondo, Boniface Chimw-aza and Dixon Mlelemba, Chancellor College, University of Malawi,for help with sample collection. We are also thankful to IngarJohansen (Institute for Energy Technology, Norway) and Illovo Su-gar Company, Malawi for isotope analysis and climate data for thestation at Nchalo Sugar Estate, respectively. We are grateful to Prof.Emeritus Hans Martin Seip, Department of Chemistry, University ofOslo, for his valuable comments on an earlier version of the man-uscript. We are also grateful to our reviewers whose commentsgreatly improved the presentation and content of this manuscript.
References
Allison, J.D., Brown, D.S., Novo-Gradac, K.J., 1991. MINTEQA2, a GeochemicalAssessment Model for Environmental Systems. Report EPA/600/3-91/0-21.USEPA, Athens, Georgia.
APHA (American Public Health Association), 1985. Standard methods of theexamination of water/wastewater’, 16th ed. APHA, AWWA, and WPCF, NewYork.
2214 M. Monjerezi et al. / Applied Geochemistry 26 (2011) 2201–2214
Banner, J.L., Wasserburg, G.J., Dobson, P.F., Carpenter, A.B., Moore, C.H., 1989.Isotopic and trace-element constraints on the origin and evolution of salinegroundwaters from central Missouri. Geochim. Cosmochim. Acta 53, 383–398.
Bath, A.H., 1980. Hydrochemistry in Groundwater Development: Report on anAdvisory Visit to Malawi. British Geological Survey Report. WD/OS/80/20.
Bloomfield, K., 1966. 1:1, 000,000 Geological Map of Malawi. Geol. Surv. Malawi.Bouchaou, L., Michelot, J.L., Vengosh, A., Hsissou, Y., Qurtobi, M., Gaye, C.B., Bullen,
T.D., Zuppi, G.M., 2008. Application of multiple isotopic and geochemical tracersfor investigation of recharge, salinization, and residence time of water in theSouss–Massa aquifer, southwest of Morocco. J. Hydrol. 352, 267–287.
Bradford, R.B., 1973. Groundwater Reconnaissance Study: Lower Shire Valley.Report RB/5. File T601. Geol. Surv. Malawi.
Bullen, T.D., Kendall, C., 1998. Tracing of weathering reactions and water flowpaths:a multi-isotope approach. In: Kendall, C.K., McDonnell, J.J. (Eds.), Isotope Tracersin Catchment Hydrology. Elsevier, pp. 611–646.
Burke, W.H., Dennison, R.E., Hetherington, E.A., Koepnick, R.B., Nelson, H.F., Otto,J.B., 1982. Variation of seawater 87Sr/86Sr throughout Phanerozoic time. Geology10, 516–519.
Butler, T.W., 2007. Application of multiple geochemical indicators, including thestable isotopes of water, to differentiate water quality evolution in a regioninfluenced by various agricultural practices and domestic wastewatertreatment and disposal. Sci. Total Environ. 388, 149–167.
Carter, G.S., Bennet, J.D., 1973. The Geology and Mineral Resources of Malawi. Bull 6.Geol. Surv. Mw.
Cartwright, I., Weaver, T., Petrides, B., 2007. Controls on 87Sr/86Sr ratios ofgroundwater in silicate-dominated aquifers: SE Murray Basin. Australia Chem.Geol. 246, 107–123.
Castaing, C., 1991. Post-Pan-African tectonic evolution of South Malawi in relationto the Karroo and recent East African rift systems. Tectonophysics 1991 (191),55–73.
Chapola, L.S., Kaphwiyo, C.E., 1992. The Malawi rift: geology, tectonics andseismicity. Tectonophysics 209, 159–164.
Christophersen, N., Hooper, R.P., 1992. Multivariate analysis of stream waterchemical data: the use of principal components analysis for the end-membermixing problem. Water Resour. Res. 28 (1), 99–107.
Christophersen, N., Neal, C., Hooper, R.P., Vogt, R.D., Andersen, S., 1990. Modelingstream water chemistry as a mixture of soil water end-members–a steptowards second-generation acidification models. J. Hydrol. 116, 307–320.
Clark, I., Fritz, P., 1997. Environmental Isotopes in Hydrogeology. CRC Press, pp. 328.Cooper, W.G.G., Bloomfield, K., 1961. Geology of the Tambani-Salambidwe Area.
Bull 13. Geol. Surv. Malawi.Craig, H., 1961. Isotopic variations in meteoric waters. Science 133, 1702–1703.Davis, R.W., 1969. Groundwater, gravity and rift valleys in Malawi. Groundwater 7
(2), 34–36.Dogramaci, S.S., Herczeg, A.L., 2002. Strontium and carbon isotope constraints on
carbonate-solution interactions and inter-aquifer mixing in groundwaters ofthe semi-arid Murray Basin. Australia J. Hydrol. 262, 50–67.
Faure, G., Mensing, T.M., 2005. Isotopes: Principles and Applications, third ed.Wiley.
Gonfiantini, R., 1986. Environmental isotopes in lake studies. In: Fritz, P., Fontes, J.-Ch. (Eds.), Handbook of Environmental Isotope Geochemistry. The TerrestrialEnvironment. Elsevier, BAmsterdam:, pp. 113–168.
Grobe, M., Machel, H.G., 2002. Saline groundwater in the Münsterland CretaceousBasin, Germany: clues to its origin and evolution. Mar. Pet. Geol. 19, 307–322.
Habgood, F., 1963. The Geology of the Country West of the Shire River betweenChikwawa and Chiromo. Bull 14. Geol. Surv. Malawi.
Harrington, G.A., Herczeg, A.L., 2003. The importance of silicate weathering of asedimentary aquifer in arid Central Australia indicated by very high 87Sr/86Srratios. Chem. Geol. 199, 281–292.
Hooper, R.P., Christophersen, N., Peters, N.E., 1990. Modeling stream waterchemistry as a mixture of soil water end-members – an application to thePanola mountain catchment, Georgia, USA. J. Hydrol. 116, 321–343.
Husson, F., Josse, J., Lê, S., Mazet, J., 2009. FactoMineR: Factor Analysis and DataMining with R. R Package Version 1.12. <http://CRAN.R-project.org/package=FactoMineR>.
IAEA/WMO, 2006. Global Network of Isotopes in Precipitation. The GNIP Database.<http://www.iaea.org/water>.
ISO (International Standards Organisation), 1985. Water Quality – Determination ofElectrical Conductivity. ISO 7888.
ISO (International Standards Organisation), 1993. Water Quality – Sampling – Part11: Guidance on Sampling of Ground Waters. ISO 5667-11.
ISO (International Standards Organisation), 1994. Water Quality – Determination ofpH. ISO 10523-1.
Kaiser, H.F., 1958. The varimax criteria for analytical rotation in factor analysis.Psychometrika 23, 187–200.
Kakiuchi, M., Matsuo, S., 1979. Direct measurements of the D/H and 18O/16Ofractionation factors between vapor and liquid water in the temperature rangefrom 10 to 40. Geochem. J. 13, 307–311.
Kawanabe, Y., Yasuhara, M., Mauri, A., Kohno, T., Satoh, Y., 1999. An isotopic study ofthe groundwater regime of a seepage caldera lake district, southern Japan. In:Proceedings of IUGG 99 Symposium HS4, Birmingham. IAHS Publ. No. 258, pp.183–192.
Laaksoharju, M., Tullborg, E.L., Wikberg, P., Wallin, B., Smellie, J., 1999a.Hydrogeochemical conditions and evolution at the Äspö HRL. Sweden Appl.Geochem. 14, 835–859.
Laaksoharju, M., Skarman, C., Skarman, E., 1999b. Multivariate mixing and massbalance (M3) calculations, a new tool for decoding hydrogeochemicalinformation. Appl. Geochem. 14, 861–871.
Laaksoharju, M., Gascoyne, M., Gurban, I., 2008. Understanding groundwaterchemistry using mixing models. Appl. Geochem. 23, 1921–1940.
Liu, F., Williams, M., Caine, N., 2004. Source waters and flowpaths in a seasonallysnow-covered catchment, Colorado Front Range, USA. Water Resour. Res. 40(W09401), 1–16.
Lockwood Survey Cooperation, 1970. Lower Shire Valley – Landforms, Soils andLand Classification. Food and Agricultural Organisation (FAO).
Meyers, J.B., Swart, P.K., Meyers, J.L., 1993. Geochemical evidence for groundwaterbehaviour in an unconfined aquifer, south Florida. J. Hydrol. 148, 249–272.
Monjerezi, M., Vogt, R.D., Aagaard, P., Saka, J.D.K., 2011. Hydro-geochemicalprocesses in an area with saline groundwater in Lower Shire River Valley,Malawi: an integrated application of hierarchical cluster and principalcomponent analyses. Appl. Geochem. 26, 1399–1413.
Morel, S.W., 1989. Chemical mineralogy and geothermometry of the middle Shiregranulites, Malawi. J. African Earth Sci. 9, 169–178.
Négrel, Ph., Casanova, J., Aranyossy, J.-F., 2001. Strontium isotope systematics usedto decipher the origin of groundwaters sampled from granitoids: the VienneCase (France). Chem. Geol. 177, 287–308.
Nordstrom, D.K., Ball, J.W., Donahoe, R.J., Whittemore, D., 1989. Groundwaterchemistry and water-rock interactions at Stripa. Geochim. Cosmochim. Acta 53,1727–1740.
Palmer, M.R., Helvaci, C., Fallick, A.E., 2004. Sulphur, sulphate, oxygen and strontiumisotope composition of Cenozoic Turkish evaporates. Chem. Geol. 209, 341–356.
Parkhurst, D.L., Appelo, C.A.J., 1999. User’s guide to PHREEQC (Version 2) – AComputer Program for Speciation, Batch-reaction, One-dimensional Transportand Inverse Geochemical Calculations. US Department of the Interior, USGeological Survey. Water Resources Investigation Report, 99-4259.
Pingitore, E.N., Eastman, P.M., 1986. The co-precipitation of Sr2+ with calcite at 25 �Cand 1 atm. Geoch. Cosmochim. Acta 50, 2195–2203.
R Development Core Team, 2007. R: A Language and Environment for StatisticalComputing. R Foundation for Statistical Computing, Vienna, Austria. ISBN 3-900051-07-0. <http://www.R-project.org>.
Shand, P., Darbyshire, F.D.P., Gooddy, D., Haria, A.H., 2007. 87Sr/86Sr as indicator offlowpaths and weathering rates in the Plynlimon experimental catchments,Wales, UK. Chem. Geol. 236, 247–265.
Shela, O.N., 2000. Naturalisation of Lake Malawi levels and shire river flows.Challenges of Water Resources Research and Sustainable Utilisation of the LakeMalawi-Shire River System. 1st Warfsa/Waternet Symposium: Sustainable Useof Water Resources, Maputo.
Uliana, M.M., Banner, J.L., Sharp, J.M., 2007. Regional groundwater flow paths inTrans-Pecos, Texas inferred from oxygen, hydrogen, and strontium isotopes. J.Hydrol. 334, 334–346.
Waight, T.E., Maas, R., Nicholls, I.A., 2000. Fingerprinting feldspar phenocrysts usingcrystal isotopic composition stratigraphy; implications for crystal transfer andmagma mingling in S-type granites. Contrib. Mineral Petrol. 139, 227–239.
Ward, J.H., 1963. Hierarchical grouping to optimize an objective function. J. Am.Stat. Assoc. 58, 236–244.
Woods, T.L., Fullagar, P.D., Spruill, R.K., Sutton, L.C., 2000. Strontium isotopes andmajor elements as tracers of groundwater evolution: example from the upperCastle Hayne aquifer of North Carolina. Ground Water 38 (5), 762–771.