Assessment of the Salinization Process at the Coastal Area with Hydrogeochemical Tools and...
20
Assessment of the Salinization Process at the Coastal Area with Hydrogeochemical Tools and Geographical Information Systems (GIS): Selçuk Plain, Izmir, Turkey Melis A. Somay & Ünsal Gemici Received: 17 March 2008 / Accepted: 10 November 2008 / Published online: 10 December 2008 # Springer Science + Business Media B.V. 2008 Abstract The salinization process was investigated with hydrogeochemical tools to evaluate the origin of salinity in the Selçuk Plain. Na/Cl and Cl/Br molar ratios of coastal zone that covers an alluvial aquifer, karstic discharges, and a wetland are similar to the local seawater ratio. According to mixing ratios, seawater addition can reach 9–18% in both seasons at the coastal zone especially in karstic springs that are a kind of seawater–freshwater mixing points. A thematic map of the Salinization zone was constructed for the Selçuk Plain using geographical information system tools with different parameters such as major ion ratios, EC values, mixing ratios, and sodium adsorption ratio values. High correlation between Cl and Br, B, Li and Sr explains the salinization process that comes from marine intrusion. The δ 18 O and δD composition of water samples varies between -6.7‰ and -2.9‰; -37‰ and -20‰, respectively. The coastal zone waters are plotted on the mixing line due to the effects of the salinization process in the plain. Keywords Salinization . Hydrogeochemistry . Environmental Isotopes . GIS . Izmir . Turkey 1 Introduction Salinization of groundwater as one of the most important natural pollution types is a major problem in the coastal aquifers of Turkey especially due to excessive pumping for agricultural purposes. When development for agriculture or public water supply are based on water extracted from a coastal aquifer in a semiarid area, sources of salinity can contribute to salinization of extracted groundwater (Carnoda et al. 2004). In the coastal plains, understanding the origin of salinization is necessary to differentiate the sources of salinization and establish their importance. The Selçuk plain is located 65 km south of Izmir, in western Turkey (Fig. 1). It is the wave-dominant delta of Küçük Menderes River, and one swamp (Eleman swamp) covers 45% of this plain. This swamp contains saline soil (DSI 1990), but other parts of Selçuk plain is used for agricultural purposes. Salinization leads to an increase in the content of certain dissolved chemical species, as well as affect- ing the overall water–chemical composition (Richter and Kreitler 1993). Salinization in the Selçuk Plain may be caused by a single process or combination of different processes; seawater intrusion (Aegean Sea) into lakes that lie below sea level (-1, -1.5 m) and/or high rate of an evapotranspiration in Selçuk Plain. Existence of an extensive wet zone (Küçük Menderes River Coastal Wetland: Eleman swamp, Lake Gebe- kirse, Lake Akgöl, Lake Kocagöz), the silt clay deposits that make up the zone, as well as water with Water Air Soil Pollut (2009) 201:55–74 DOI 10.1007/s11270-008-9927-1 M. A. Somay (*) : Ü. Gemici Geological Engineering Department, Dokuz Eylul University, Tinaztepe Yerleskesi, 35160 Buca, Izmir, Turkey e-mail: [email protected]
Transcript of Assessment of the Salinization Process at the Coastal Area with Hydrogeochemical Tools and...

Assessment of the Salinization Process at the Coastal Areawith Hydrogeochemical Tools and Geographical InformationSystems (GIS): Selçuk Plain, Izmir, Turkey
Melis A. Somay & Ünsal Gemici
Received: 17 March 2008 /Accepted: 10 November 2008 /Published online: 10 December 2008# Springer Science + Business Media B.V. 2008
Abstract The salinization process was investigatedwith hydrogeochemical tools to evaluate the origin ofsalinity in the Selçuk Plain. Na/Cl and Cl/Br molarratios of coastal zone that covers an alluvial aquifer,karstic discharges, and a wetland are similar to thelocal seawater ratio. According to mixing ratios,seawater addition can reach 9–18% in both seasonsat the coastal zone especially in karstic springs thatare a kind of seawater–freshwater mixing points. Athematic map of the Salinization zone was constructedfor the Selçuk Plain using geographical informationsystem tools with different parameters such as majorion ratios, EC values, mixing ratios, and sodiumadsorption ratio values. High correlation between Cland Br, B, Li and Sr explains the salinization processthat comes from marine intrusion. The δ18O and δDcomposition of water samples varies between −6.7‰and −2.9‰; −37‰ and −20‰, respectively. Thecoastal zone waters are plotted on the mixing line dueto the effects of the salinization process in the plain.
Keywords Salinization . Hydrogeochemistry .
Environmental Isotopes . GIS . Izmir . Turkey
1 Introduction
Salinization of groundwater as one of the mostimportant natural pollution types is a major problemin the coastal aquifers of Turkey especially due toexcessive pumping for agricultural purposes. Whendevelopment for agriculture or public water supplyare based on water extracted from a coastal aquifer ina semiarid area, sources of salinity can contribute tosalinization of extracted groundwater (Carnoda et al.2004). In the coastal plains, understanding the originof salinization is necessary to differentiate the sourcesof salinization and establish their importance.
The Selçuk plain is located 65 km south of Izmir,in western Turkey (Fig. 1). It is the wave-dominantdelta of Küçük Menderes River, and one swamp(Eleman swamp) covers 45% of this plain. Thisswamp contains saline soil (DSI 1990), but otherparts of Selçuk plain is used for agricultural purposes.
Salinization leads to an increase in the content ofcertain dissolved chemical species, as well as affect-ing the overall water–chemical composition (Richterand Kreitler 1993). Salinization in the Selçuk Plainmay be caused by a single process or combination ofdifferent processes; seawater intrusion (Aegean Sea)into lakes that lie below sea level (−1, −1.5 m) and/orhigh rate of an evapotranspiration in Selçuk Plain.Existence of an extensive wet zone (Küçük MenderesRiver Coastal Wetland: Eleman swamp, Lake Gebe-kirse, Lake Akgöl, Lake Kocagöz), the silt claydeposits that make up the zone, as well as water with
Water Air Soil Pollut (2009) 201:55–74DOI 10.1007/s11270-008-9927-1
M. A. Somay (*) :Ü. GemiciGeological Engineering Department,Dokuz Eylul University,Tinaztepe Yerleskesi,35160 Buca, Izmir, Turkeye-mail: [email protected]

a high salt content, are clearly determinants in thehydrogeochemical situations of the system. This is atemporarily inundated area, with abundant vegetationsthat are published by Kara (1997) and Seçmen andGemici (1997); Salicornia europea, Juntus acutus,Chenopodium sp., and Limnium bellidifolium, Ammo-phillia arenaria, Sporobolus virginicus, Pancratiummaritimum, Glyceria distans, Elymus elongates ssp.,Glycyrrhiza globra, and, these vegetations are indi-cators of salinization.
Use of natural tracers has been revealed as one of themost efficient tools to understand the mechanism ofgroundwater mineralization in coastal aquifers (Morellet al. 1986; Fidelibus and Tulipano 1986; Vengosh etal. 1996; Andreasen and Fleck 1997; Fakir 2002). Ingeneral, using the major ions to characterize thesalinization sources are common all around the world.In addition, in recent years, the minor ion compositionof the waters (Li, Br, B, Sr, etc.) have been used for theidentification of salinization process (Petalas and
Diamantis 1999; Sanches-Martos and Pulido-Bosch1999; Cruz and Silva 1999; Sanches-Martos et al.2002; Faye et al. 2004).
Both chemical and stable isotope data provideimportant supplemental information to more tradi-tional hydraulic data and unravel the processes thatunderpin the large variations in chemical and stableisotopic composition within a coastal wetland system(Marimuthu et al. 2005). Environmental isotopesprovide, much more than indications of groundwaterprovenance and age and may also be used forrecharge processes, subsurface processes, geochemi-cal reactions, and reaction rates (Clark and Fritz1997). The isotope δ18O and δD compositions aresensitive tracers and widely applied to studying thenatural water circulation and groundwater movement(Krabbenhoft et al. 1990; Herczeg et al. 1992; Turneret al. 1992; Chambers et al. 1996).
Geographical information system (GIS) is a col-lection of computer hardware, software, and geo-
Fig. 1 Location and the geological map (modified from Candan and Dora 1998; Çetinkaplan 2002) of the study area
56 Water Air Soil Pollut (2009) 201:55–74

graphic data for capturing, managing, analyzing, anddisplaying all forms of geographically referencedinformation (ESRI 2006). According to Gogu et al.(2001) that they were studied about “GIS-basedhydrogeological databases and groundwater model-ing,” a GIS is defined as a system for input, storage,manipulation, and output of geographically referenceddata (Goodchild 1996). GIS systems provide anintegrated tool for illustrating the physical character-istics within a certain area, as well as the presentationof relative statistical or elaborated data onto properlydesigned thematic maps. Therefore, they may be usedby authorities for the management of natural resour-ces within a certain extent (Kallioras et al. 2006).
As mentioned above, the main goal of this study isto determine the salinization process and distributionof the salinization in Selçuk Plain by Na/Cl, SO4/Cl,Mg/Ca, Na/Ca, Br/Cl, Sr/Ca ionic ratios and environ-mental isotopes.
Selçuk Plain has a dry–subhumid climate, with aforth mesothermal season of deficiency, a largeseasonal surplus, and a temperature-efficiency regimethird mesothermal (C1 B’4 S2 d) according to theThornthwaite classification system (1948). The dryseason occurs in summer (July through October), andthe wet season occurs in winter (November throughMay). According to the data of Izmir GüzelyalıMeteorological Station, the mean yearly temperaturehas been 16.4°C in long-year period (1963–2005).June is the hottest month with 26.4°C averagetemperatures and January is the coolest with anaverage temperature of 7.9°C. Average yearly rainfallin Selçuk Plain is estimated to be about 690 mm.Average yearly actual evapotranspiration is about870 mm according to the Thornthwaite method.Evapotranspiration was calculated using theThornthwaite method and shown in Table 1.
According to Table 1, the amount of rainfall isgreater than potential evapotranspiration in January,February, and March; therefore, potential evapotrans-piration is equal to real evapotranspiration. Excessivewater from rainfall (water surplus) recharges thesurface and groundwater. From Table 1, it can beseen that soil moisture utilization responds to waterdeficiency in April, May, and June. Potential evapo-transpiration is greater than rainfall; therefore, there isa water deficiency from June to September. FromTable 1, it can be seen that in November andDecember, potential evapotranspiration is equal to
real evapotranspiration as the rainfall is greaterthan potential evapotranspiration. Soil moisture isrecharged by excess water. The remaining waterrecharges the surface and groundwater.
2 Materials and Methods
The data sets, comprising 37 water samples, four riversamples, six lake water samples, two disposal sitewaters, one irrigation channel, one local seawater, and23 groundwater samples, upon which the currentstudy is based were collected during two periods ofsampling, dry and rainy seasons in December–Julyperiod of 2004 and 2005. Groundwater samples weretaken from an alluvial aquifer in the Selçuk Plain andfrom Menderes Massif rocks in the hilly area. Thekarstic springs discharges from marble-alluviumcontact at −1 m from the sea level. Physicochemicalparameters such as temperature, pH, electrical con-ductivity (EC), and alkalinity (HCO3) were measuredin situ. One sample filtered (0.45 μm) in the field wastaken at each site in an acid-washed, well-rinsed low-density polyethylene bottle and acidified with 1%HNO3 to a pH of <2 for the conversion of majorcations (Na, K, Ca, Mg) and trace metals (Li, Br, B,Sr) which would make them remain dissolved.Another sample was taken unfiltered, and no acidwas added for HCO3, CO3, Cl, SO4 analyses.Samples were stored at 4°C for no more than 1 weekprior to laboratory analyses, which were carried out inACME Laboratory in Vancouver, Canada with induc-tively coupled plasma-mass spectroscopy.
The isotopic composition (δ18O, δD) of some watersamples (samples 1*, 5*, 8*, 10*, 15*, and 16*) wereanalyzed at the Department of Technical Research andQuality Control of General Directorate of HydraulicWork (DSI). The others were done at the Universityof California, Davis Stable Isotope Laboratory byisotope ratio mass spectrometer with a GVI OptimaStable Isotope Ratio Mass Spectrometer (SIRMS).For Deuterium and δ18O analyses, 50 ml unfilteredwaters were sampled in polyethylene bottles.
To investigate the salinization zone in SelçukPlain, IDRISI Kilimanjaro (Eastman 1999) andArcGIS© (Booth and Mitchell 1999) GIS and remotesensing packages were used to calculate and illustratethe data. IDRISI© is a grid-based geographic infor-mation and image processing system developed by
Water Air Soil Pollut (2009) 201:55–74 57

the Graduate School of Geography at Clark Univer-sity and supported by the United Nations Institute forTraining and Research (UNITAR) and the UnitedNations Environment Programme Global ResourceInformation Database (UNEP/GRID; Ross and Beljin1994). IDRISI provides an extensive set of tools forimage processing, geographic and statistical analysis,spatial decision support, time series analysis, datadisplay, and import/export and conversion. In addi-tion, a set of independent program modules linked toa broad set of simple data structures.
GIS is used as a tool to determine the salinizationzone with the Na/Cl, Na/Ca, Mg/Ca ratios, EC,sodium adsorption ratio (SAR), and mixing ratios ofseawater and fresh water (MR). The flow chart isexplained as follows (Fig. 2):
1. The location of water samples were digitized inIDRISI as point data.
2. The database for the data obtained from thesample locations was constructed in IDRISIKilimanjaro package.
3. Digital point data and constructed database werelinked.
4. Point data that have database were converted toshape file, and these data were exported toArcGIS© package.
5. The distribution map of each ratio and EC, SAR,and MR were constituted in ArcGIS© package byusing point data. For these processes, appliedArcGIS© spatial analyst extension was used. The
“Inverse Distance” interpolation method wasapplied to obtain the distribution values.
6. The distribution value maps were queried usingthe “raster calculator” tool in ArcGIS© package.
7. The logical relationships were constructed be-tween each distribution value maps that representsaline and fresh water areas.
8. The zones showing the saline and fresh waterareas obtained from each distribution value mapswere gained.
9. These result maps are in Boolean format (1, 0)that represents saline and fresh water zones,respectively.
3 Geology and Hydrogeology
From a geological standpoint, the Selçuk Plainconstitutes an alluvial coastal plain within a groupof graben of the western Küçük Menderes Range. Tothe north, the plain is delimited by Mesozoic marbles,while the Paleozoic schist–marble intercalations ofMenderes Massif constitute the southern limit(Fig. 1). There are four different types of rock unitsthat constitute this basin. The basement rock of thestudy area is Menderes Massif (metamorphic units).The Menderes massif in western Anatolia is structur-ally bound to the northwest by the Late CretaceousBornova flysch zone and to the south by theMesozoic–Paleogene Lycian nappe complex (Candan
Data Jan Feb Mar Apr May Jun Jul Aug Sep Oct Nov Dec Total
T 7.9 8.7 10.8 14.6 19.3 24.1 26.4 25.4 21.3 16.7 12.4 9.5TI 1.9 2.4 3.2 5.1 7.7 10.8 12.4 11.7 9.0 6.2 4.0 2.6 77.0PE 16.7 19.7 28.6 48.2 77.9 114.3 133.7 125.1 92.4 60.7 36.3 23.0 776.7CF 0.9 0.8 1.0 1.1 1.2 1.2 1.3 1.2 1.0 1.0 0.9 0.8CPE 14.2 16.6 29.5 53.0 95.9 141.7 167.2 146.4 96.1 58.3 30.5 19.1 868.4P 118.4 105.7 84.1 50.8 25.3 6.1 1.4 1.5 17.6 40.6 97 140.5 689.2DS 0.0 0.0 0.0 2.2 70.6 27.3 0.0 0.0 0.0 0.0 66.5 33.5S 100 100 100 97.8 27.3 0.0 0.0 0.0 0.0 0.0 66.5 100ETR 14.2 16.6 29.5 53.0 95.9 33.4 1.4 1.5 17.6 40.6 30.5 19.1 353.1WD 0.0 0.0 0.0 0.0 0.0 108.4 165.8 144.9 78.5 17.7 0.0 0.0 515.2EW 104.2 89.1 54.6 0.0 0.0 0.0 0.0 0.0 0.0 0.0 0.0 121.4 369.4RO 52.1 96.6 71.9 27.3 0.0 0.0 0.0 0.0 0.0 0.0 0.0 60.7 308.7MR 7.3 5.3 1.9 0.0 -0.7 -1.0 -1.0 -1.0 -0.9 -0.3 2.1 6.4
Table 1 Table of Thorntwaite water balance (T (temperature—°C); TI (temperature indice); PE (potential evapotranspiration-mm); CF (correction factor); CPE (corrected PE-mm);
P (precipitation-mm); DS (storage change); S (storage); ETR(real evapotranspiration-mm); WD (Water Defiency); EW(excessive water); RO (runoff-mm);MR (moisture ratio))
58 Water Air Soil Pollut (2009) 201:55–74

et al. 2001). The general rock succession of the studyarea can be given in ascending order as follows: (1)Paleozoic (?) marble/schist intercalations, (2) LowerTriassic schist with quartz and carbonate metacon-glomerate layers, (3) Jurassic–Upper Cretaceousplatform-type thick marbles, (4) Paleocene metamor-phic olistostrome (Çetinkaplan 2002). According toNippon (1996); the schist units are practically
impervious, while marbles have high porosity andpermeability values due to fissures and/or karstifica-tion with an average of 156×10−11 m2 (Yazicigil et al.2000) intrinsic permeability. Especially in the north-ern part of the area, the springs are discharged at thealluvium contact. Late Cretaceous Bornova mélangeoverlies the basement rock by unconformity (Güngörand Erdoğan 2002) that is made up of a flysh-typesedimentary matrix with blocks of neritic limestoneand is overlaid in this basement rock by unconformity(Güngör and Erdoğan 2002). Neogene sedimentaryrocks that consist of course-grained conglomerate,limestone, and claystone up to the overlay of theBornova mélange have unconformity that has anarrow area in the northern part of the plain.According to DSI (1990), this sedimentary unitcontains more clayey layers than conglomerates andsedimentary units, and they have 1.32×10⁻¹¹ m2
mean intrinsic permeability (Yazicigil et al. 2000).Limestone levels of this unit act as an aquifer andclaystone–mudstone alternates are impermeable layerof this aquifer. The upper unit is the Quaternaryalluvium that continues to deposit. The fill of SelçukPlain consists of detrital Quaternary sediments thatcontain sand, silt, and clay that have little vertical orlateral continuity and frequent lateral changes infacies with 20–100 m thick (DSI 1973).
4 Results
Sample locations of water samples from the studyarea are shown in Fig. 3; some chemical analyses ofmajor ions, pH, and EC values; the major ion ratios,SAR and MR, and environmental isotope values aregiven in Tables 2 and 3. The minor ion values andratios are shown in Table 5. In the study area, pHvalues range between 7.02 and 8.62 and 6.69 and 8.52in rainy and dry season, respectively (Tables 2, 3). Inthe hilly area, pH values are about 7.3. Remarkabledifferences are seen in the EC values of these twozones. In the rainy season from inland to coastal zone,the EC values range from 624 to 5,800 μS/cm; in dryseason, these values increase (e.g., 10,250 μS/cm inKazangöl karstic spring). In contrast, in the hilly area,maximum EC value is found in sample 15* with997 μS/cm value. The mean EC value in the hilly areais 814 μS/cm. The average pH value was 7.52, and theEC values ranged from 776 to 5350 (from inland to
Fig. 2 Flow chart of GIS processes for this study
Water Air Soil Pollut (2009) 201:55–74 59

coastal area of plain, approximately) in 2001 (Somayand Filiz 2006). Standard deviations of Na and Cl ionsare higher than other ions that can be shown as thedifferences between coastal zone and hilly areasalinization theme. Ca, Mg, HCO3 and SO4 showsimilar ranges between in both seasons.
Two end members were chosen to determine theseawater intrusion and/or hydrogeochemical evalua-tion. The progressive salinity increases from the hillyarea (Şirince, Acarlar, Belevi) to the coastal area, andthe occurrence of seawater in the Selçuk Plainsuggests a mixing between these two end members:a low salinity groundwater (hilly area) and a highsalinity water (local seawater). The composition of
local seawater was determined by a sample taken forthis study in the Aegean Sea of Pamucak beach. Twohydrogeochemical zones are defined in the study area,and the processes that control the chemical composi-tions of waters are different in each zone. First, onehas occurred by seawater intrusion in the coastal zonein which the dominant ions are Na and Cl; in thesecond one, the hilly area forms the recharge basin ofcoastal zone where Ca–Mg silicate weathering isdominating. Fresh water of the basin that wasobserved in the eastern Selçuk plain (Şirince: samples17 and 17*) and southern of Selçuk plain (Acarlar:samples 14 and 14*) has Ca-HCO3 facies accordingto IAH water map standards (1979), evolving toward
Fig. 3 Digital Elevation Model (DEM) and sampling map of this study
60 Water Air Soil Pollut (2009) 201:55–74

the coastal strip to become more mineralized as Na–Cl facies. The Ca–HCO3 water type indicates the firstevolutionary stage of the process in the Selçuk Basin.Fresh water is commonly dominated by HCO3 ionsbecause the addition of the large amounts of CO2
from root zone and calcite, if present, is dissolved(Back et al. 1979). In the study area, the fresh water issupplied from both Paleozoic schist and metaolistos-trome that include calcareous layers. Ca and Mg ionsprobably derived from the weathering of Ca–Mg
Table 2 Chemical characteristics of the waters in the Selçuk Plain, RAINY SEASON
No. EC pH Na+ K+ Ca+2 Mg+2 Cl− HCO3−2 SO4
−2 Na/Cl (molar) SO4/Cl Mg/Ca Na/Ca HCO3/Cl SAR MR Water Type
(Stuyfzand 1986)
1 1,903 7.69 314 28 64 42 441 405.0 112 1.10 0.19 1.10 4.29 0.53 7.47 2.36 B3-NaClHCO3+
2 1,416 7.60 159 14 102 43 295 390.4 601 0.83 0.15 0.70 1.35 0.77 3.31 1.54 f3-NaCaMgClHCO3+
3 (●) 5,417 7.81 1268 35 14 16 1482 556.3 114 1.32 0.06 1.80 76.55 0.22 54.90 8.22 b4-NaCl+
4 1,288 8.30 150 11 104 39 375 139.1 42 0.62 0.08 0.62 1.25 0.22 3.17 1.99 B2-NaCaMgCl-
5 (●) 5,800 7.13 1071 26 134 121 1580 778.4 190 1.05 0.09 1.51 6.95 0.29 16.07 8.77 b4-NaClHCO3+
6 (●) 4,020 7.05 638 19 137 83 1107 366.0 168 0.89 0.11 1.01 4.06 0.19 10.58 6.11 b3-NaCl+
7 (●) 1,586 7.99 740 19 135 74 1125 300.0 250 1.02 0.16 0.91 4.77 0.16 12.66 6.21 b3-NaAlFeCl+
8 (●) 4,255 7.72 1107 35 130 105 1720 235.9 290 0.99 0.12 1.34 7.38 0.08 17.42 9.56 b3-NaCl+
9 1,608 7.43 180 15 98 46 326 356.8 125 0.85 0.28 0.78 1.60 0.64 3.76 1.72 B3-NaCaMgHCO3+
10 (●) 1,600 7.95 92 8 192 11 103 305.0 356 1.38 2.56 0.10 0.42 1.72 1.74 0.46 F3-FeAlMnSO4HCO3+
11 (●) 2,850 7.98 432 15 104 54 632 458.7 110 1.05 0.13 0.86 3.61 0.42 8.54 3.44 B4-FeNaClHCO3+
12 4,480 8.62 701 54 127 105 1290 300.3 342 0.84 0.20 1.37 4.79 0.14 11.10 7.14 b3-NaCl+
13 1,067 7.36 47 2 131 39 97 446.0 54 0.75 0.41 0.50 0.31 2.68 0.92 0.43 F3-CaMgHCO3Cl+
14 624 7.44 10 2 108 7 16 317.7 46 0.59 1.38 0.11 0.08 7.44 0.24 -0.03 g3-FeCaHCO3+
15 922 7.02 21 8 102 44 46 434.3 63 0.69 1.01 0.72 0.18 5.50 0.43 0.14 F3-CaMgHCO3+
16 845 7.26 30 3 108 44 67 453.8 73 0.69 0.81 0.67 0.24 3.94 0.61 0.26 F3-CaMgHCO3+
17 (●) 934 7.14 18 17 110 57 57 583.2 35 0.48 0.45 0.39 0.23 5.95 0.51 0.20 F4-CaMgFeHCO3+
Units: dissolved ions, mg/l; EC, μS/cm; ratios are molar and mixing ratio (MR) is %; (●) is cited Somay et al. 2008)
Table 3 Chemical characteristics of the waters in the Selçuk Plain, *DRY SEASON
No. EC pH Na K Ca Mg Cl HCO3 SO4 Na/Cl SO4/Cl Mg/Ca Na/Ca HCO3/Cl SAR MR δ18O (‰) δD (‰) Water Type
(Stuyfzand, 1986)
1* 1,717 7.44 175 5 111 30 381 254 45 0.71 0.09 0.45 1.36 0.388 3.78 2.05 -5.2 -31 B3-FeClHCO3-
2* 1,684 7.28 206 5 114 33 360 400 57 0.88 0.12 0.48 1.57 0.647 4.36 1.93 -5.4 -32 B3-NaCaClHCO3+
3* 5,790 7.90 1,127 37 40 54 1,500 671 174 1.16 0.09 2.27 24.62 0.260 27.18 8.34 – – b4-NaCl+
4*(●) 5,490 7.43 533 12 338 147 1,580 312 192 0.52 0.09 0.73 1.37 0.115 6.07 8.79 – – b3-NaCaCl-
5*(●) 10,250 7.25 1,489 56 184 194 2,980 277 432 0.77 0.11 1.76 7.05 0.054 18.19 16.66 -4.6 -28 b3-NaCl-
6*(●) 4,150 6.76 672 20 154 91 1,290 366 168 0.80 0.10 0.99 3.80 0.165 10.58 7.16 -5.1 -30 b3-NaCl-
7*(●) 2,020 7.38 203 7 143 33 391 446 75 0.80 0.14 0.39 1.24 0.664 3.96 2.11 – – B3-NaCaClHCO3-
8*(●) 11,510 8.13 1,873 66 217 200 3,340 266 471 0.87 0.10 1.53 7.49 0.046 21.96 18.69 -2.9 -20 b3-NaCl-
9*(●) 1,488 6.69 158 14 90 48 206 454 105 1.19 0.38 0.89 1.52 1.282 3.33 1.07 -4.6 -25 f3-MnFeHCO3Cl+
10*(●) 2,460 7.66 121 10 321 79 235 707 498 0.80 1.57 0.41 0.33 1.751 1.57 1.23 -3.4 -22 f4-MnFeHCO3SO4Cl+
11*(●) 2,900 7.90 507 16 145 59 745 522 176 1.05 0.17 0.68 3.04 0.408 8.93 4.10 – – B4-FeClHCO3+
12*(●) 4,550 8.52 658 43 133 116 1,230 481 84 0.83 0.05 1.46 4.32 0.227 10.03 6.82 – – b4-FeNaAlCl+
13*(●) 780 6.85 26 2 122 18 57 420 21 0.70 0.27 0.24 0.18 4.285 0.58 0.23 -5.9 -33 F3-CaAlHCO3+
14* 652 7.77 11 3 77 30 32 335 48 0.51 1.11 0.65 0.12 6.083 0.26 0.09 – – F3-CaMgHCO3+
15* 997 7.35 2 1 104 6 7 351 12 0.54 1.27 0.09 0.02 29.176 0.06 -0.05 -6.0 -36 g3-CaHCO3+
16* 813 7.43 26 3 94 33 64 395 60 0.63 0.69 0.58 0.24 3.589 0.59 0.27 -6.0 -36 F3-CaAlHCO3+
17*(●) 305 8.00 6 0 44 10 15 161 15 0.60 0.74 0.36 0.12 6.229 0.21 -0.01 -6.5 -38 g2-CaMgHCO3+
18 2,530 7.84 373 10 106 48 635 354 91 0.91 0.11 0.76 3.07 0.324 7.52 3.48 – – B3-NaAlFeClHCO3+
19 430 6.83 5 1 68 6 12 234 15 0.60 0.92 0.15 0.06 11.344 0.14 -0.03 -6.7 -37 g3-AlCaHCO3+
SW 58,800 8.28 12,720 399 413 1,381 21,702 156 2,379 0.90 0.08 5.52 26.88 0.004 67.56 100.0 1.6 8 s2-NaCl+
Units: dissolved ions, mg/l; EC, μS/cm; ratios are molar and mixing ratio (MR) is %; (●) is cited Somay et al. 2008).
Water Air Soil Pollut (2009) 201:55–74 61
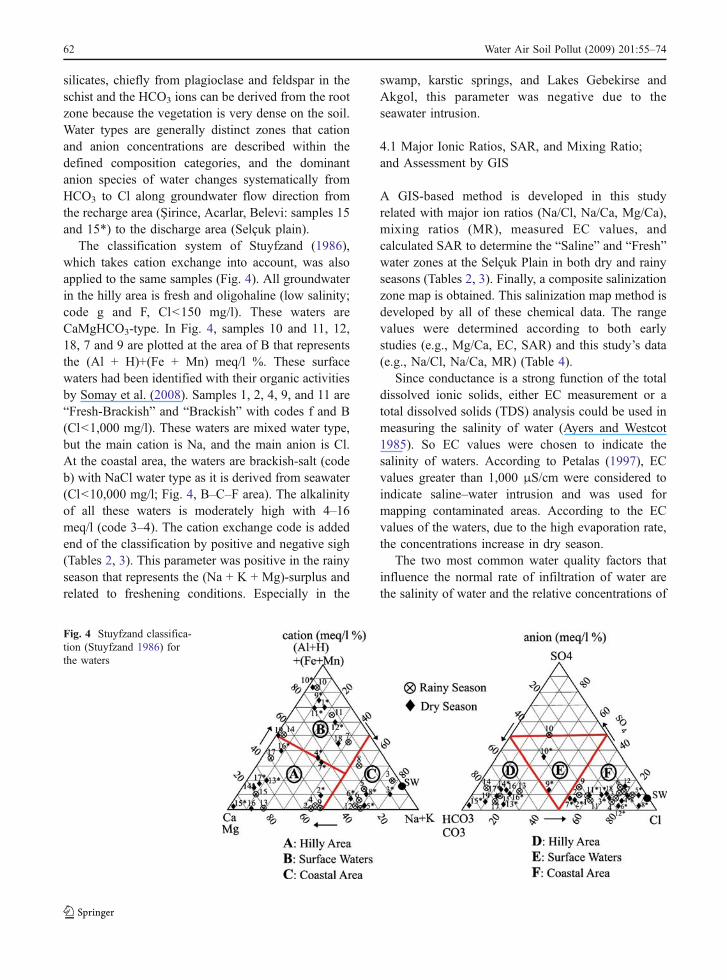
silicates, chiefly from plagioclase and feldspar in theschist and the HCO3 ions can be derived from the rootzone because the vegetation is very dense on the soil.Water types are generally distinct zones that cationand anion concentrations are described within thedefined composition categories, and the dominantanion species of water changes systematically fromHCO3 to Cl along groundwater flow direction fromthe recharge area (Şirince, Acarlar, Belevi: samples 15and 15*) to the discharge area (Selçuk plain).
The classification system of Stuyfzand (1986),which takes cation exchange into account, was alsoapplied to the same samples (Fig. 4). All groundwaterin the hilly area is fresh and oligohaline (low salinity;code g and F, Cl<150 mg/l). These waters areCaMgHCO3-type. In Fig. 4, samples 10 and 11, 12,18, 7 and 9 are plotted at the area of B that representsthe (Al + H)+(Fe + Mn) meq/l %. These surfacewaters had been identified with their organic activitiesby Somay et al. (2008). Samples 1, 2, 4, 9, and 11 are“Fresh-Brackish” and “Brackish” with codes f and B(Cl<1,000 mg/l). These waters are mixed water type,but the main cation is Na, and the main anion is Cl.At the coastal area, the waters are brackish-salt (codeb) with NaCl water type as it is derived from seawater(Cl<10,000 mg/l; Fig. 4, B–C–F area). The alkalinityof all these waters is moderately high with 4–16meq/l (code 3–4). The cation exchange code is addedend of the classification by positive and negative sigh(Tables 2, 3). This parameter was positive in the rainyseason that represents the (Na + K + Mg)-surplus andrelated to freshening conditions. Especially in the
swamp, karstic springs, and Lakes Gebekirse andAkgol, this parameter was negative due to theseawater intrusion.
4.1 Major Ionic Ratios, SAR, and Mixing Ratio;and Assessment by GIS
A GIS-based method is developed in this studyrelated with major ion ratios (Na/Cl, Na/Ca, Mg/Ca),mixing ratios (MR), measured EC values, andcalculated SAR to determine the “Saline” and “Fresh”water zones at the Selçuk Plain in both dry and rainyseasons (Tables 2, 3). Finally, a composite salinizationzone map is obtained. This salinization map method isdeveloped by all of these chemical data. The rangevalues were determined according to both earlystudies (e.g., Mg/Ca, EC, SAR) and this study’s data(e.g., Na/Cl, Na/Ca, MR) (Table 4).
Since conductance is a strong function of the totaldissolved ionic solids, either EC measurement or atotal dissolved solids (TDS) analysis could be used inmeasuring the salinity of water (Ayers and Westcot1985). So EC values were chosen to indicate thesalinity of waters. According to Petalas (1997), ECvalues greater than 1,000 μS/cm were considered toindicate saline–water intrusion and was used formapping contaminated areas. According to the ECvalues of the waters, due to the high evaporation rate,the concentrations increase in dry season.
The two most common water quality factors thatinfluence the normal rate of infiltration of water arethe salinity of water and the relative concentrations of
Fig. 4 Stuyfzand classifica-tion (Stuyfzand 1986) forthe waters
62 Water Air Soil Pollut (2009) 201:55–74

sodium vs. magnesium, and calcium ions in water isalso known as the SAR (Ayers and Westcot 1985).When the concentration of sodium becomes excessivein proportion to calcium plus magnesium, the soil issaid to be sodic. Excessive sodium causes soil mineralparticles to disperse and water penetration to decrease.The SAR of irrigation water is generally a goodindicator of the sodium status that will occur in thesoil. In the study area, only swamp, Lake Gebekirse,and Kazangöl karstic spring exceed the tolerance limitof 15 (EPA 1986) SAR values. SAR is a function ofsalinity, so in the dry season, the SAR values arehigher than in the rainy season due to the highevaporation rates in the dry season.
Chloride has been selected by some researchers asa fingerprint element because it is chemically conser-vative (Hem 1985; Richter and Kreitler 1993). Themajor ionic species in solution, chloride and sodium,show closely positive correlation (r2=0.99), and mostof the waters lie on the mixing line between two endmembers. The other major anion, sulfate, has a goodcorrelation with Cl as a result of fresh and salt water(seawater intrusion) mixture. The local seawater hasdistinct ionic ratios such as Na/Cl=0.90, SO4/Cl=0.08,Br/Cl=0.0028, Na/Ca=26.88, Mg/Ca=5.5, Sr/Ca=0.0174 in the study area (Tables 2, 3, 5).
If seawater intrudes into a freshwater aquifer, theNa/Cl ratio of the invaded groundwater is progres-sively changed along the mixing line (Custodio1987). According to Nordstrom et al. (1989), Na/Clratios above 0.5 are common in surface waters andlow salinity groundwater. Cl vs. Na/Cl relationship
shows the mixing of the coastal zone groundwaterswith fresh inland waters. In the Na/Cl mixed model,most of the saline groundwater samples that weretaken from coastal area plot very close or slightlybelow the conservation line indicating some depletionof Na through ion exchange reactions during themixing process. The high Na concentrations in coastalzone show Na deficiency with respect to the conser-vative mixing line due to reversible cation-exchangereactions. The Na/Cl molar ratio (Fig. 5a) for coastalzone shows consistently high values above thecorresponding seawater dilution line, whereas sam-ples from the hilly area lie below this line.
The Na/Cl ratio is about 1 in and around ElemanSwamp. In the dry season, this ratio has reachedseawater value in and around Lake Kocagöz that takes
Table 4 Parametres to determine the salinization zone in thestudy area
Parameters Range Suitability Booleanformat
References
Na/Cl >0.777 Saline 1<0.777 Fresh 0
Mg/Ca >1 Saline 1 M&E, 2000<1 Fresh 0
Na/Ca >1 Saline 1<1 Fresh 0
MR >1 (%) Saline 1<1(%) Fresh 0
EC >1,000 μS/cm Saline 1 Petalas, 1997<1,000 μS/cm Fresh 0
SAR >15 Saline 1 EPA, 1986<15 Fresh 0
Table 5 Minor ions, ratios and environmental isotope values ofwaters in the study area
Number Br B Li Sr Br/Cl B/Cl Sr/Cappb ppb ppb ppb (*10−3) (*10−4) (*10−3)
3 4,394 1,553 19.8 371.4 2.96 10.5 25.805 4,161 283 16.0 547.1 2.63 1.8 4.086 4,168 223 13.0 530.1 3.77 2.0 3.887 3,884 205 15.2 551.7 3.45 1.8 4.098 6,324 365 27.1 779.6 3.68 2.1 5.9810 466 47 4.0 509.4 4.52 4.6 2.6511 1,356 285 9.9 343.2 2.15 4.5 3.3017 37 15 3.4 230.6 2.47 10.0 2.1014 55 15 2.8 142.9 2.20 6.0 1.3215 171 37 11.6 460.6 3.72 8.0 4.541* 1,388 51 4.1 228.2 3.64 1.3 2.052* 1,112 56 4.3 217.4 3.09 1.6 1.913* 6,261 1,332 18.5 482.8 4.17 8.9 12.104* 6,338 268 15.0 1,693.7 4.01 1.7 5.015* 12,390 570 30.7 1,202.7 4.16 1.9 6.556* 3,689 219 13.8 548.1 2.86 1.7 3.577* 1,655 89 7.3 264.8 4.23 2.3 1.868* 14,627 695 40.3 1,363.2 4.38 2.1 6.279* 943 128 8.8 338.5 4.58 6.2 3.7510* 1,216 52 5.8 804.4 5.17 2.2 2.5011* 2,018 296 15.2 501.6 2.71 4.0 3.4612* 4,788 589 11.1 758.4 3.89 4.8 5.7213* 144 29 2.1 92.0 2.53 5.1 0.7514* 100 15 3.4 187.9 3.13 4.7 2.4515* 22 15 1.4 55.4 3.14 21.4 0.5316* 208 31 6.1 308.7 4.20 6.3 3.2717* 36 15 0.5 47.8 2.40 10.0 1.1018 1,977 119 7.9 311.7 3.11 1.9 2.9519 26 15 0.3 159.9 2.17 12.5 2.36SW 60,984 3,923 169.3 7,184.2 2.80 1.8 17.4
Water Air Soil Pollut (2009) 201:55–74 63

place south of the study area because of moreevaporation, and no precipitation. But in the rainyseason, due to the precipitation and so dilution, thehigh values recede to the coastal zone such as in theEleman Swamp.
According to M & E (2000), in the coastal aquifer,Mg/Ca molar ratio greater than 5 is a direct indicatorof seawater intrusion. The local seawater has 5.5 Mg/Caratio in the study area. In the coastal zone, all of thegroundwater and Lake Gebekirse have greater than 1
Fig. 5 a Na/Cl vs. Cl, b Mg/Ca vs. TDS diagram in both dry and rainy seasons
64 Water Air Soil Pollut (2009) 201:55–74

molar ratio that is indicating the seawater intrusion(Tables 2, 3). On the other hand, Mg/Ca vs. TDSshows a perfect linear correlation with r2=0.92 andr2=0.89 in rainy and dry season, respectively (Fig. 5b).
Direct cation-exchange reaction takes place duringrefreshening when fresh water flushes seawater in acoastal aquifer, displacing the freshwater/seawater inter-face toward the sea. At this reaction, Mg is considered as
Fig. 6 Na/Ca vs. TDS (A); HCO3/Cl vs. TDS (B); SO4/Cl vs. Cl (C) diagrams in both dry and rainy seasons
Water Air Soil Pollut (2009) 201:55–74 65

a freshwater cation, together with Ca, whereas in general,Mg is a seawater cation, together with Na (andK; Appelo1994). According to this reaction, it can be clearly seenfrom Tables 2 and 3 that Na/Ca values of coastal zoneare higher than that of freshwater. In rainy and dryseason, this ratio can reach 77 and 25, respectively;whereas the Na/Ca value of seawater is calculated as 27.
The TDS vs. interionic ratio (Na/Ca and HCO3/Cl)diagrams were examined to evaluate the effect ofseawater mixing qualitatively (Fig. 6). There is aspecific trend in the TDS vs. Na/Ca diagram (Fig. 6a),suggesting that Na/Ca ratios are controlled by theseawater mixing process.
In the TDS vs. HCO3/Cl diagram (Fig. 6b), goodcorrelation between the two variables is seen (r2=0.8in both seasons) suggesting that high TDS ground-waters are typically enriched in chloride ion, mainlydue to seawater mixing.
The SO4 mixing represents either the oxidation ofrock sulfur by a marine-derived groundwater or themixing of two different water masses, a deep marine-derived groundwater and oxidizing recharge water(Beaucaire et al. 1999). In the SO4/Cl vs. Cl diagram(Fig. 6c), coastal zone groundwaters take place on the“Seawater Influence” line in both seasons that showedthat the coastal zone is under seawater effect. On theother hand, high SO4/Cl ratios elsewhere have beenattributed to the application of gypsum fertilizers(Vengosh et al. 2002). At the study area, SO4/Cl ratioof the Belevi part of the river gives 1.5–2.5 values(samples 10 and 10*) that is higher than othersamples and can be explained by gypsum fertilizersbecause there is no gypsum levels and oxidation ofsulfide conditions in the study area.
Mixing ratios determined by using physically orchemically nonreactive component in hydrogeologicalstudies and chloride was selected due to its nonreac-tive character for this aim. In addition, for these ratios,two of the end members must be chosen in the studyarea. The fresh member in our study area is chosenfrom Acarlar village (samples 14 and 14*). Thesecond end member is the seawater chloride value inmeq/l (Tables 2, 3). Mixing ratio is calculated asshown below (Appelo and Postma 1993):
Mixing ratio %100ð Þ ¼ Clsample � Clfresh� ��
Clsea � Clfreshð Þ
From Tables 2, 3 in the rainy season, maximumseawater mixing areas are swamp, karstic, discharge
points and the nearby Lake Gebekirse (sample 3, 5, 6,7, 8) with 9.6% value. In the dry season, the sameplaces have more much values than hilly areaespecially in samples 5* and 8* with average of18% mixing value. In the dry season, in addition tohigh evaporation, irrigation is done every year forcrops in Selçuk Plain. So, the pumping rate ofgroundwater reached the maximum value causingthe seawater intrusion.
As explained above, finally, a composite map wasconstructed that contains both all of the parametersand all of the seasons (Fig. 7). Na/Cl, Na/Ca, Mg/Ca,EC, mixing ratio (MR), and SAR values are used toform this composite map in both dry and rainyseasons, and it identified the “Salinization ZoneMap” in the Selçuk Plain.
This “Salinization Zone Map” explained the saline/fresh zone in Selçuk Plain. The black area is “saline”zone in both dry and rainy seasons that covers LakeGebekirse and Kazangöl and Zeytinköy karsticsprings. This is also showing the relationship betweenkarstic springs and Lake Gebekirse. But the gray zonecan be wider or narrower based on the chemicalreactions, dilution, and evaporation in the study area.
4.2 Minor Ions and Ratios
The hydrogeochemistry of some minor elements, suchas Br, B, Li, and Sr are also good indicators ofseawater intrusion (Table 5). The relationship betweenthese minor elements with Cl shows a close positivecorrelation. In addition to the major ion chemistry, therecent investigations focused on the minor elements(bromide, strontium, and boron) to constrain origin(s),mixing rates, and salinization processes.
The bromide ion is considered as a good indicatorof seawater intrusion in coastal aquifers. Because oftheir similar geochemical behavior and low chemicalactivity, bromide and chloride are often associated tostudy the origin of chloride and the anomalies ofsalinity affecting groundwater (Tadolini and Tulipano1975; Marjoua et al. 1997; Hsissou et al. 1999).However, Br can be accumulated by marine organ-isms which as a consequence of diagenetic processescan be released, therefore increasing its concentrationin the water (Fabrika Martin et al. 1991). Also, Fontesand Matray (1993) reported that Cl/Br ratio valuesvary in the cases of precipitation or dissolution ofsolid chlorides and during convective or diffusive
66 Water Air Soil Pollut (2009) 201:55–74

mixing of saline solutions. Ratios of bromide tochloride (Br/Cl) have been extensively used in thedetermination of sources of salinity. Br and Cl arerelatively conservative in hydrological systems; theBr/Cl ratios of fresh waters are primarily controlledby the initial ratio in precipitation (Kim et al. 2003).
In this study, most of the chloride-enrichedsamples exhibit Br/Cl ratios close to seawater values(Fig. 8a). They correspond, in fact, to groundwaterslocated generally more than 1 km from the coastline andwhich are affected by seawater intrusion. The Br/Clmolar ratio of local seawater is equal to 2.8×10⁻³, andalmost the same ratios were found in Zeytinköyvillage, Lake Gebekirse, Lake Akgöl, Zeytinköykarstic discharge, Küçük Menderes River (PamucakBridge; Table 5). These areas were directly affectedby seawater. The average Br/Cl molar ratio in thesaline groundwaters of the study area is approximately3.1×10−3 and 3.8×10⁻³ in rainy and dry seasons,respectively, which is slightly greater than the averageratio in seawater of the study area (2.8×10⁻³). Thus,the mixing of intruded seawater with fresh watercaused only a slight change in the Br/Cl ratio.
Boron tends to be concentrated in environmentswith limited water circulation such as evaporates orbrines of marine or continental origin (Uhlman 1991).This is highlighted by the correlation between thesalinity of the environment and that of the sediments(Adams et al. 1965). The high boron concentration inseawater leads one to consider it as an indicator ofmarine intrusion processes (Gimenez 1994). Based onthese considerations, it could be deduced that a directrelationship exists between the conductivity of thegroundwaters and their boron content (Sanches-Martos and Pulido-Bosch 1999). Boron values vs.EC diagram is shown in Fig. 8b. In this diagram,surface waters, lakes, river and swamp do not fall onthe groundwater–seawater line due to the highevaporation rate in the area. The ratio B/Cl was usedto distinguish the marine influence on boron. In thestudy area, seawater has 1.8×10⁻⁴ B/Cl ratios. LakeGebekirse and Akgöl, karstic spring shows the sameratios in both season. In addition, in dry season, theriver (sample 10*), swamp (samples 3*–4*), karsticsprings (samples 5*–6*), and Zeytinköy villagegroundwater (sample 2*) show the similar ratios with
Fig. 7 General thematic map of the salinization zone
Water Air Soil Pollut (2009) 201:55–74 67

seawater. In some cases, the elevated boron content isrelated to the influence of other types of salinization,to contamination from anthropogenic origin associat-ed with urban wastewaters (Vengosh and Rosenthal1994). This explained why the irrigation channel(sample 18) and river (sample 10*) is similar withseawater (Table 5).
Lithium has been used as a tracer in the mixing ofbrines produced by evaporation of seawater (Fontes and
Matray 1993). In coastal aquifers suffering from marineintrusion, there is a linear relationship between the Liand Cl content, assuming that there are no other inputsof water (Brondi et al. 1983; Gimenez and Morell1991). In the study area, Cl vs. Li shows a near-perfectcorrelation in both dry and rainy season; r2=0.9 and r2=0.8, respectively (Fig. 8c). Clay minerals play animportant role for lithium, due to its capacity forreplacing Mg and Fe in the lattice (Gimenez and Morell
Fig. 8 Br/Cl vs. Cl (a); Boron vs. EC (b); Li and CI (c) diagram for rainy and dry seasons
68 Water Air Soil Pollut (2009) 201:55–74

1997). Lithium can be used as indicator of residencetime of water in aquifer, related to the rock–watercontact time or the residence time of seawater in theaquifer (Brondi et al. 1973; Tulipano and Fidellibus1984). Lithium is directly related to water temperature,while B content increases in more saline areas, since it isassociated with the presence of evaporitic and or marineinfluences (Sanchez-Martos et al. 2002). The lithiumconcentration of swamp, karstic discharges, lakes andriver are greater than other parts of the study area.Except the swamp water, all the waters show goodcorrelation with boron and lithium that suggests a com-mon origin. The existence of lithium as an exchangeableion in organic matter must also to be considered becauseof the high exchange capacity of these materials (Heierand Billings 1970). So in the swamp, the relationshipbetween B and Li can show an irregularity.
Although classified as a trace element, Sr occurs ineasily measurable quantities in most rock types andbehaves geochemical like Ca (Gosselin et al. 2004),and the aquifers have probably multiple sources ofdissolved strontium. Enrichment of Sr in some waterscould be related with the time of residence of water inthe aquifer, so that the ion is a good environmentaltracer (Brondi et al. 1983). There is a good correlationbetween Sr vs. Cl (r2=0.73). According to Meybeck(1984), a ratio of Sr/Ca greater than 1‰ characterizeswater of evaporitic origin. In the coastal zone, samples3, 5, 6, 7, and 8 in the rainy season, samples 3*, 4*,5*, and 6* in the dry season are exceeding 1‰ Sr/Camolar ratio due to the seawater effect. In our studyarea, the seawater has 7.2 mg/l Sr value. Sr concen-trations above 0.5 mg/l can be seen as an indicator ofseawater intrusion. On the other hand, high ratios of Sr/Ca indicate an additional input of strontium that can bederived from carbonate precipitation/dissolution reac-tions in the hilly area (samples 14*, 17*, 16*, and 19).The correlation coefficient between Ca and HCO3
supports this assumption with 0.87 value.
4.3 Environmental Isotopes
Environmental isotopes also were used to characterizethe salinization process in the study area. Therelationship between deuterium (δD) and oxygen-18(δ18O) provides the mixing process between freshwater and seawater along the straight line of the twomixing poles, with fresh water of the aquifer at oneend and seawater at the other end (Gat and Gonfian-
tini 1981; Gonfiantini and Simonot 1987; Gonfiantiniand Araguas 1988). The samples for isotope analyseswere chosen from wetland components (lakes,swamp, river, and karstic discharges) and fromrecharge area, Şirince, Acarlar, Belevi, Andon gorge,and Tire (Tables 2, 3, Fig. 9-a).
The relation between δD and δ18O values ofprecipitation in various parts of the world is asfollows, according to Craig (1961):
δD = 8* δ 18O+ 10‰ (Global Meteoric Water Line-GMWL)
At this study, not only GMWL but also Mediter-ranean meteoric water line (MMWL) (Yurtsever1983) with +22 deuterium excess and (Fig. 9a) localmeteoric water line with +12 deuterium excess(LMWL; La Ruffa et al. 1999) was used from KosIsland because the Kos Island meteoric line is the bestone for evaluation the isotope values.
From Fig. 9a, the δD and δ18O relation of the watersamples is formulated for the study area:
dD ¼ 5:5� d18O� 1:8
Samples 2*, 6*, 9* are located around the mixingline by slopes of 5.5. Fresh water samples aredistributed in the more negative part of the diagrambecause the seawater is heavier than the othersampled waters. The δ18O and δD composition ofwetland area (samples 1*, 6*, 8*, 9*) samples are inthe range of −5.4‰ and −2.9‰, and −32‰ and−20‰, respectively. The hilly area δ18O and δDvalues are more depleted (more negative) due to thenot only heavier value of seawater but also to the highelevation and more terrestrial effects than wetlandarea (Fig. 9b). It can be clearly seen that the coastalzone (samples 5*, 6*, 8*, and 10*) is plotted on themixing-evaporation line due the salinization processin the Selçuk Plain. On the other hand, the ground-water of the whole basin is plotted on the LMWLwhich is the nearest station to the study area. Incomparison with the coastal area groundwater, sam-ples 13*, 15*, 17* are distinctly more negative intheir stable isotope compositions and deviate signif-icantly from the LMWL (Fig. 9a) and are character-ized by comparatively low Cl contents (Tables 2, 3).
On the other hand, coastal area waters plot along aline having a slope of 5.5, that is, a slope considerably
Water Air Soil Pollut (2009) 201:55–74 69

Fig. 9 a δ18O and δD compositions of the groundwaters in the study area in dry season. b Altitude effect of δ18O in the study area (C)δ18O and Cl relationship of the waters in dry season
70 Water Air Soil Pollut (2009) 201:55–74
lower than that of the LMWL (8). Such a low slope canbe produced by evaporation and/or mixing of ground-water and seawater. Coastal zone and surface waters(lakes and river) are plotted near the seawater. There aretwo possibilities why these waters are located on themixing line: seawater–fresh water mixing and evapora-tion. To resolve this dilemma, δ18O–Cl relationship wasused. The source of salinization of brackish to highlymineralized groundwater and thermal water can bedefinitely detected by a –18O––Cl plot. Processes suchas dissolution and leaching of salt, enrichment byevaporation or mixing of fresh water with saline wateror seawater can be clearly and quantitatively distin-guished (Mook 2001). The sample points that weretaken from the coastal zone are distributed on themixing line between fresh and seawater (Fig. 9c)and are formulated as below:
d18O ¼ 0:0004Cl� 5:489 r2 ¼ 0:85� �
Groundwater from Belevi (sample 15*), Şirinceand around (samples 17*, 16*), and Tire (sample 19)represents freshwater samples that have no effect onseawater. The mixing waters that were plotted on themixing line are taken from swamp (sample 1*, 2*)and karstic spring (samples 5*, 6*). If the groundwa-ter is affected by evaporation, the samples will bedistributed around an exponential line (Gonfiantiniand Araguas 1988). It can be clearly seen in Fig. 9cthat Lake Gebekirse (sample 8*) lies between theevaporation and the mixing line that shows the effectof seawater on the lakes.
5 Conclusion
Hydrochemical characters of the waters from the Selçukplain in western Turkey were emphasized by the majorion ratios (Na/Cl, Na/Ca, Mg/Ca, SO4/Cl, HCO3/Cl),minor ions (B, Br, Li, Sr), minor ion ratios (Br/Cl, B/Cl,Sr/Ca), and environmental isotopes (δ18O and δD) toidentify the salinization process in the study area. Inaddition, GIS method was used as a new approach forthe Selçuk plain to identify the salinization zone basedon Na/Cl, Na/Ca, Mg/Ca, EC, SAR, and mixing ratios.
Major ion ratios of the groundwaters show seawa-ter character in the coastal zone. In the plain, the Na–Ca direct exchange reaction can be seen clearly due tothe seawater intrusion. On the other hand, Na/Cl,
SO4/Cl, and HCO3/Cl ratios come closer to the localseawater ratio from the hilly area to the coastal zonein Selçuk plain.
The thematic map of the Selçuk plain was con-structed using IDRISI Kilimanjaro and ArcGIS ©computer codes; it is clearly seen that especially LakeGebekirse, Lake Akgol, and Eleman Swamp areaffected by seawater intrusion. They could be affectedby seawater with their topographic positions (−0.5 m)and discharges from karstic structures.
Minor ions have good correlation with Cl ion thatcan be a result of the seawater influence. As major ionratios, the minor ion ratios are identified by thesalinization process (e.g., Cl/Br, B/Cl, Sr/Ca).
Lakes, swamp, and river are plotted on the mixingline with δD=5.5×δ18O–1.8 relationship according tothe stable isotope data of the waters. On the otherhand, the origin of these waters is meteoric. δ18Oenrichment can be seen in the surface and subsurfacewaters (lakes, swamp, and river).
The origin of salinization can be definitely detectedby a δ18O–Cl plot in which either of the processes isdominant: mixing or evaporation. Swamp, karsticsprings, and Lake Gebekirse that are under theseawater intrusion effect, were not influenced fromevaporation in the rainy season. But in the dry season,Lake Gebekirse is influenced by both evaporation andseawater intrusion.
From what has been discussed above, we maysafely draw the conclusion that the salinizationproblem mainly arises from seawater intrusion inSelçuk plain, and seawater has intruded almost 8-10 km from the sea. Especially, in and around Selçukvicinity, water quality degradation is remarkable.
Acknowledgments This paper forms a part of a PhD studycarried out by the first author. This study was financiallysupported by project no: 03.KB.FEN.057 from Dokuz EylülUniversity Scientific Research Fund (BAP). The authors wouldlike to thank Dr. Aykut Akgun, Karadeniz Technical University,to introduce to IDRISI and ArcGIS© computer codes. Theauthors are also greatful to Dr. Richard Wanty and anonymousreviewer for their critical comments and suggestions in theearlier version of the manuscript.
References
Adams, T. D., Hayenes, J. R., & Walker, C. T. (1965). Boron inHolocene illites of the Dovey Estuary, Wales, and itsrelationship to paleosalinity in cyclothems. Sedimentology,43, 189–l95.
Water Air Soil Pollut (2009) 201:55–74 71

Andreasen, D. C., & Fleck,W. B. (1997). Use of bromide: chlorideratio to differentiate potential sources of chloride in a shallow,unconfined aquifer affected by brackish-water intrusion.Hydrogeology Journal, 5(2), 17–26. doi:10.1007/s100400050104.
Appelo, C. A. J. (1994). Cation and proton exchange, pHvariations, and carbonate reactions in a freshening aquifer.Water Resources Research, 30(10), 2793–2805. doi:10.1029/94WR01048.
Appelo, C. A. J., & Postma, D. (1993). Geochemistry,groundwater pollution p. 536. Rotterdam: Balkema.
Ayers, R. S., & Westcot, D. W. (1985). Water quality foragriculture, FAO Irrigation and Drainage Paper No. 29,Rev. 1, U. N. Food and Agriculture Organization, Rome.
Back, W., Hanshaw, B. B., Pyle, T. E., Plummer, L. N., &Weidie, A. E. (1979). Geochemical significance ofgroundwater discharge and carbonate solution to theformation of Caleta Xel Ha, Quintana Roo, México. WaterResources Research, 15(6), 1521–1535. doi:10.1029/WR015i006p01521.
Beaucaire, C., Gassama, N., Tresonne, N., & Louvat, D. (1999).Saline groundwaters in the hercynian granites (ChardonMine, France): geochemical evidence for the salinity origin.Applied Geochemistry, 14, 67–84. doi:10.1016/S0883-2927(98)00034-1.
Booth, B., & Mitchell, A. (1999). Getting started withArcGIS™, ESRI, Redlands, CA.
Brondi, M., Dall’aglio, M. D., & Vitrano, F. (1973). Lithium aspathfinder element in the large scale hydrochemicalexploration for hydrothermal systems. Geothermics, 283,142–153.
Brondi, M., Fidelibus, M. D., Gragnani, R., & Tulipano, L.(1983). Hydrochemical study and distribution of sometrace elements in the most important coastal springs andgroundwater of the Ž. Apulian Region Southern Italy.Geologia Applicatta et Hidrogeologia, XVII II, 65–80.
Candan, O., & Dora, O. (1998). Menderes Masifinde Granulit,Eklojit ve Mavi Sist Kalintilari: Pan-Afrikan ve TersiyerMetamorfik Evrimine Bir Yaklasim. Türkiye JeolojiBulteni, 41(1), 1–35.
Candan, O., Dora, O., Oberhansli, M., Çetinkaplan, M.,Partzsch, J. H., Warkus, F. C., et al. (2001). Pan-Africanhigh-pressure metamorphism in the Precambrian basementof the Menderes Massif, western Anatolia, Turkey.International Journal of Earth Sciences, 89, 793–811.doi:10.1007/s005310000097.
Carnoda, A., Carillo-Rivera, J. J., Huizar-Alvarez, R., &Graniel-Castro, E. (2004). Salinization in coastal aquifersof arid zones: an example from Santo Domingo, BajaCalifornia sur, Mexico. Environmental Geology, 45, 350–366. doi:10.1007/s00254-003-0874-2.
Çetinkaplan, M. (2002). Tertiary High Pressure/Low Temper-ature Metamorphism in the Mesozoic Cover Series of theMenderes Massif and Correlation with the CycladicCrystalline Complex. PhD Thesis, Dokuz Eylul Universi-tesi Fen Bilimleri Enstitusu, İzmir (Unpublished).
Chambers, L. A., Bartleym, J. G., & Herczeg, A. L. (1996).Hydrogeochemical evidence for surface water recharge to ashallow regional aquifer in northern Victoria. Aust. Journal
of Hydrology (Amsterdam), 181, 63–83. doi:10.1016/0022-1694(95)02919-2.
Clark, I. D., & Fritz, P. (1997). Environmental isotopes inhydrogeology. New York: Lewis.
Constantin Gogu, R., Carabin, G., Hallet, V., Peters, V., &Dassargues, A. (2001). GIS-based hydrogeological data-bases and groundwater modelling. Hydrogeology Journal,9, 555–569. doi:10.1007/s10040-001-0167-3.
Craig, H. (1961). Isotopic variations in meteoric waters. Science,133, 1702–1703. doi:10.1126/science.133.3465.1702.
Cruz, J. V., & Silva, M. O. (1999). Groundwater salinization inPico Island (Azores, Portugal): origin and mechanisms.Environmental Geology, 39(10), 1181–1189. doi:10.1007/s002540000109.
Custodio, E. (1987). Hydrogeochemistry and tracers in ground-water problems in coastal areas. Studies and Reports inHydrology, 45, 213–269 UNESCO.
DSI. (1973). Küçük Menderes Ovası Hidrojeolojik Etüt Raporu.Devlet Su Isleri Gn. Md. Jeoteknik Hizmetler ve YeraltiSulari Dair. Bsk, Ankara (In Turkish).
DSI. (1990). İzmir-Selçuk-Pamucak Ovası ve Çevresi ÖnHidrojeolojik Etud raporu. DSI – İzmir Şb (In Turkish).
Eastman, R. (1999). IDRISI KILIMANJARO technical refer-ence. Worcester, MA: Clark University.
EPA. (1986). Quality Criteria for Water. EPA 440/5-86-001.ESRI. (2006). Environmental Systems Research Institute, from
www.esri.com.Fabrika-Martin, J. T.,Whittemore, D. O., Davis, S. N., Kubik, P. K.,
& Sharma, P. (1991). Geochemistry of halogens in the MilkRiver aquifer, Alberta Canada. Applied Geochemistry, 6,447–464. doi:10.1016/0883-2927(91)90044-P.
Fakir, Y. (2002). Some hydrogeological aspects of the Plioqua-ternary aquifer in the Sahel between Beddouza cape andOualidia (Province of Safi-Morocco). Bull Hydroge´ol., 19.
Faye, S., Maloszewski, P., Stichler, W., Trimborn, P., Faye, S. C.,& Gaye, C. B. (2004). Groundwater salinization in theSaloum (Senegal) delta aquifer: minor elements and isotopicindicators. Science of the Total Environment.
Fidelibus, M. D., & Tulipano, L. (1986). Mixing phenomenaowing to sea water intrusion for the interpretation ofchemical and isotopic data of discharge waters in theApulian coastal carbonate aquifer (Southern Italy). InR. H. Boekelman, et al. (Ed.), Proc 9th Salt WaterIntrusion Meet (SWIM) (pp. 591–600). The Netherlands:Water Management Group, Department of Civil Engineer-ing, Delft University of Technology.
Fontes, J. C., & Matray, J. M. (1993). Geochemistry and originof formation brines from the Paris basin, France: 1. Brinesassociated with triassic salts. Chemical Geology, 109,149–175. doi:10.1016/0009-2541(93)90068-T.
Gat, J. R., & Gonfiantini, R. (1981). Stable isotope hydrology.Vienna7 International Atomic Energy Agency; 1981.p. 223–40.
Gimenez, E. (1994). Caracterizacibn hidrogeoquimica de 10sprocesos salinizacibn en el Acuifero Detritico costero de laPlana de Castellbn, Thesis, University of Granada, p389
Giménez, E., & Morell, I. (1991). Consideraciones sobre lautilización de iones minoritarios en la caracterización dela intrusión marina. III SIAGA: 401–412
72 Water Air Soil Pollut (2009) 201:55–74

Gimenez, E., & Morell, I. (1997). Hydrogeochemical analysis ofsalinization processes in the coastal aquifer of Oropesa(Castellon, Spain).Environmental Geology, 29(1/2), 118–131.
Gonfiantini, R., & Araguás, L. (1988). Los isótopos ambientalesen el estudio de la intrusión marina. Simposio InternacionalTecnología de la Intrusión en Acuíferos Costeros. InstitutoGeológico y Minero de España, I, 135–190, Almuñécar.
Gonfiantini, R., & Simonot, M. (1987). Isotopic investigationsof groundwater in the Cul-de-Sac plain, Republic of Haiti.In: Isotope Techniques in Water Resources Development.Vienna: IAEA, pp. 483-504.
Goodchild, M. F. (1996). The application of advancedinformation technology in assessing environmentalimpacts. In: Corwin DL, Loague K (eds) Applications ofGIS to the modelling of non-point source of pollutants inthe vadose zone. Soil Sci Soc Am, 48:1–17.
Gosselin, D. C., Harvey, F. E., Frost, C., Stotler, R., &Macfarlane, P. A. (2004). Strontium isotope geochemistry ofgroundwater in the central part of Dakota (Great Plains)aquifer, USA. Applied Geochemistry, 19, 359–377.doi:10.1016/S0883-2927(03)00132-X.
Güngör, T., & Erdoğan, B. (2002). Tectonic significance of maficvolcanic rocks in a Mesozoic sequence of the MenderesMassif,West Turkey. International Journal of Earth Sciences,91, 386–397, Geol Rundsch, doi:10.1007/s00531-001-0231-1.
Heier, K. S., & Billings, G. K. (1970). Lithium. In K. H.Wedepohl (Ed.), Handbook of geochemistry, 2 vol. Berlin:Springer-Verlag.
Hem, J. D. (1985). Study and interpretation of the chemicalcharacteristics of natural waters. US Geological Survey-Water-Supply Paper 2254, 3rd edn. Washington, DC.
Herczeg, A. L., Barnes, C. J., Macumber, P. G., & Olley, J. M.(1992). A stable isotope investigation of groundwater-surface water interactions at Lake Tyrell, Victoria Specissue geochemistry of acid groundwaters. ChemicalGeology, 96, 19–32. doi:10.1016/0009-2541(92)90119-P.
Hsissou, Y., Mudry, J., Bouchaou, L., & Chauve, P. (1999).Utilisation du rapport Br/Cl pour de’terminer l’origine dela salinite´ des eaux souterraines: exemple de la plaine duSouss (Maroc). CR Acad Sci Paris, 328, 381–386.
IAH (International Association of Hydrogeologists). (1979).Map of Mineral and Thermal Water of Europe Scale:1:500,000. IAH, United Kingdom.
Kallioras, A., Pliakas, F., Diamantis, I., & Emmanouil, M.(2006). Application of Geographical Information Systems(GIS) for the Management of Coastal Aquifers Subjectedto Seawater Intrusion. Journal of Environmental Science& Health. Part A, 41, 2027–2044.
Kara, N. (1997). Selçuk ve cevresinin toprak kaynaklari,sorunlari ve cozum onerileri. I. Uluslararası GecmistenGünümüze Selçuk Sempozyumu, Selçuk Belediyesi veEge Universitesi, İzmir (In Turkish).
Kim, Y., Lee, K. S., Koh, D. C., Lee, D. H., Lee, S. G., Park,W. B.,et al. (2003). Hydrogeochemical and isotopic evidence ofgroundwater salinization in a coastal aquifer: a case study inJeju volcanic island, Korea. Journal of Hydrology (Amster-dam), 270, 282–294. doi:10.1016/S0022-1694(02)00307-4.
Krabbenhoft, D. P., Bowser, C. J., Anderson, M. P., & Valley, J. V.(1990). Estimating groundwater exchange with lakes: 1. The
stable isotope mass balance method. Water ResourcesResearch. 26:2445-
La Ruffa, G., Panichi, C., Kavouridis, T., Liberopoulou, V.,Leontiadis, J., Caprai, A., 1999. Isotope and chemicalassessment of geothermal potential of Kos Island\Greece.Geothermics, 28, 205–217.
M&E (Metcalf & Eddy Inc.). (2000). Integrated aquifermanagement plan: final report. Gaza coastal aquifermanagement program, USAID contract no. 294-C-00-99-00038-00.
Marimuthu, S., Reynolds, D. A., & Le Gal La Salle, C. (2005).A field study of hydraulic, geochemical and stable isotoperelationships in a coastal wetlands system. Journal ofHydrology, 315, 93–116.
Marjoua, A., Olive, P. L., & Jusserand, Q. (1997). Apports desoutils chimiques et isotopiques a` l’identification desorigines de la salinisation des eaux: cas de la nappe de laChaouia coˆtie`re (Maroc). Rev Sci Eau., 4, 489–505.
Meybeck, M. (1984). Les fleuves et le cycle ge´ochimique dese´le´ments. PhD; Univ Paris VI, France.
Mook, W. G. (2001). Environmental isotopes in the hydrolog-ical cycle. IHPV, Tech Doc in Hydrology, vol. 39 (1). ParisUNESCO.
Morell, I., Medina, J., Pulido-Bosch, A., & Fernandez-Rubio, R.(1986). The use of bromide and strontium as indicators ofmarine intrusion in the aquifer of Oropesa-Torreblanca.Castellon. Spain. Proc. 9th. Salt Water Intrusion Meeting,Delft, Denmark, 61–72.
Nippon, (1996). The Study on Küçük Menderes River BasinIrrigation Project in the Republic of Turkey. JaponInternational Cooperation Agengy (JICA) and Devlet SuIsleri (DSİ).
Nordstrom, D. K., Ball, J. W., Donahoe, R. J., & Whittemore,D. (1989). Groundwater chemistry and water–rock inter-actions at Stripa. Geochimica et Cosmochimica Acta, 53,1727–1740.
Petalas, C. P. (1997). Analysis of aquifer systems in theheterogeneous coastal plain of Rhodope Region. PhD.University of Thrace, dept of Civil Engineering, Xanthi.Greece.
Petalas, C. P., & Diamantis, I. B. (1999). Origin anddistribution of saline groundwaters in the upper Mioceneaquifer system, coastal Rhodope area, northeasternGreece. Hydrogeology Journal, 7(3), 305–316.
Richter, B. C., & Kreitler, W. C. (1993). Geochemicaltechniques for identifying sources of groundwater salini-zation. NY: CRC Press, ISBN: 1-56670-000-0.
Ross, R. R., Beljin M. S. (1994). MODRISI: A PC Approach toGIS and Ground-Water Modeling, National Conference onEnvironmental Problem-Solving with Geographic Infor-mation Systems, pp: 60-65, Ohio, USA.
Sanches-Martos, F., & Pulido-Bosch, A. (1999). Boron and theorigin of salinization in an aquifer in southeast Spain.Surface Geoscience, 328, 751–757.
Sanches-Martos, F., Pulido-Bosch, A., Molina-Sanches, L., &Vallejos-Izquierdo, A. (2002). Identification of the originof salinization in groundwater using minor ions LowerAndarax, (Southeast Spain). The Science of the TotalEnvironment, 297, 43–58.
Water Air Soil Pollut (2009) 201:55–74 73

Seçmen, O., & Gemici, Y. (1997). Selçuk (İzmir) civarinin dogalbitki ortusu. I. Uluslararası Gecmisten Günümüze SelçukSempozyumu, Selçuk Belediyesi ve Ege Universitesi İzmirArastirma ve Uygulama Merkezi, İzmir (In Turkish).
Somay, M. A., & Filiz, Ş. (2006). Küçük Menderes Nehri kıyısulak alanının hidrojeokimyasal değerlendirilmesi. Geo-sound, V: 48–49, 113–127, Adana (In Turkish).
Somay, M. A., Gemici, U., & Filiz, S. (2008). Hydrogeochem-ical investigation of Kücük Menderes River coastalwetland, Selçuk–Izmir, Turkey. Environmental Geology,55, 149–164. doi:10.1007/s00254-007-0972-7.
Stuyfzand, P. J. (1986). A new classification of groundwaterand application to the coastal dune aquifer system in theNetherlands. Proceed. Of the 9th Salt Water IntrusionMeeting, Delft, 641–655.
Tadolini, T., & Tulipano, I. (1975). La misura del contenuto inclorobromo e iodo delle acque sotterranee della PenisolaSalentina (Italia meridionale) in rapporto alle acque dimare di invasione continentale. In: Proc 39th Conv IntSulle Acque Sotterranee, Palermo, Italia.
Thornthwaite, W. C. (1948). An approach toward a rationalclassification of climate. Geographical Review, 38, 55–94.
Tulipano, L., & Fidelibus, M. D. (1984). Geochemicalcharacteristics of Apulian coastal springs (southern Italy)related to mixing processes of ground waters withseawater having different residence time in to the aquifer.In G. Tsakiris (Ed.), Proceedings, 5th InternationalConference on Water Resources Planning and Manage-ment. Water in the year 2000. Athens.
Turner, J. V., Townley, L. R., Rosen, M. R., & Sklash, M. K.(1992). Coupling the spatial distribution of solute concen-tration and stable isotope enrichments to hydrologicprocesses in hypersaline paleochannel aquifers. In: Y. K.Kharaka, & A. S. Maest (Eds.) Water-rock interaction,V:1, No: 7 (pp: 217–221). Balkema.
Uhlman, K. (1991). The Geochemistry of boron in a landfillmonitoring program. Ground Monit Rev., 11, 139–143.
Vengosh, A., & Rosenthal, E. (1994). Saline groundwater inIsrael: Its bearing on the water crisis in the country.Journal of Hydrology, 156, 389–430.
Vengosh, A., Spivack, A. J., Artzi, Y., & Ayalon, A. (1996).Boron, strontium and oxygen isotopic constraints on theorigin of brackish ground water from the Mediterraneancoast, Israel. In: Proc.American Geophysical Union FallMeet, San Francisco, CA.
Vengosh, A., Gill, J., Davisson, M. L., & Hudson, G. B. (2002).A multi-isotope (Br, S, O, H and C) and age dating studyof groundwater from Salinas valley, California: hydro-chemistry, dynamics and contamination process. Waterresources Research, 38(1), 1–17.
Yazicigil, H., Karahanoglu, N., Yilmaz, K., Gundogdu, A.,Sakiyan, J., Yesilnacar, E., et al. (2000). Investigation andmanagement of the Kucuk Menderes Basin groundwater.Hydrogeology, vol 5. Middle East Technical University,Ankara.
Yurtsever, Y. (1983). Models for tracer data analysis. In:Guidebook on nuclear techniques in hydrology. TechnicalReport. Series no.91, IAEA, Vienna.
74 Water Air Soil Pollut (2009) 201:55–74