Hydraulic and Hydrogeochemical Characteristics of a Riverbank Filtration Site in Rural India
13
Hydraulic and Hydrogeochemical Characteristics of a Riverbank Filtration Site in Rural India T. B. Boving 1,2 *, B. S. Choudri 3 , P. Cady 1 , A. Cording 4 , K. Patil 5 , Veerabaswant Reddy 5 ABSTRACT: A riverbank filtration (RBF) system was tested along the Kali River in rural part of the state of Karnataka in India. The polluted river and water from open wells served the local population as their principal irrigation water resource and some used it for drinking. Four RBF wells (up to 25 m deep) were installed. The mean hydraulic conductivity of the well field is 6.3 3 10 3 cm/s and, based on Darcy’s law, the water travel time from the river to the principal RBF well (MW3) is 45.2 days. A mixing model based on dissolved silica concentrations indicated that, depending on the distance from the river and closeness to irrigated rice fields, approximately 27 to 73% of the well water originated from groundwater. Stable isotopic data indicates that a fraction of the water was drawn in from the nearby rice fields that were irrigated with river water. Relative to preexisting drinking water sources (Kali River and an open well), RBF well water showed lower concentration of dissolved metals (60.1% zinc, 27.8% cadmium, 83.9% lead, 75.5% copper, 100% chromium). This study demonstrates that RBF technology can produce high-quality water from low-quality surface water sources in a rural, tropical setting typical for many emerging economies. Further, in parts of the world where flood irrigation is common, RBF well water may draw in infiltrated irrigation water, which possibly alters its geochemical composition. A combination of more than one mixing model, silica together with stable isotopes, was shown to be useful explaining the origin of the RBF water at this study site. Water Environ. Res., 86, 636 (2014). KEYWORDS: riverbank filtration, stable isotope, dissolved silica, heavy metals, water treatment, India, emerging economy, groundwater, flood irrigation, monsoon. doi:10.2175/106143013X13596524516428 Introduction More than one billion people in the world—11% of the global population—do not have access to safe drinking water (UNICEF, 2012). And although in developing countries, like India, measurable progress has been made in supplying safe water, gross disparity exists in coverage between urban and rural areas. For instance, latrine usage is low in rural areas of India and only 14% of rural Indians have access to a latrine (Water.org, 2012). Quite often wastewater, together with industrial effluent and agricultural runoff, is discharged to rivers and lakes with little or no treatment. Yet microbial and chemical contamination of water resources can often be addressed with simple solutions, such as improvements in sanitation, hygiene, and treatment. One potential promising solution is riverbank filtration (RBF), which is a water treatment technique that has been used in Europe for over 100 years (Ray et al., 2002; Schmidt et al., 2003). For example, RBF supplies 75% of the water supply to the German capital of Berlin (Hiscock, 2005). In the Netherlands, RBF contributes about 7% (80 Mm 3 /yr) of the national drinking water supply (Stuyfzand et al., 2004). In an RBF system, water is withdrawn from one or more wells near a river or lake. Wells may either be vertical or horizontal (Sandhu et al., 2011) and typically are installed more than 50 m away from the river (Grischek et al., 2002). By pumping an RBF well, the groundwater potential is lowered and river water (together with groundwater) is induced to flow through porous riverbed sediments (Hiscock and Grischek, 2002). As the raw surface water travels toward the RBF well, dissolved and suspended contaminants, as well as pathogens, are potentially removed or significantly reduced in numbers resulting from a combination of physical, chemical, and biological processes (Hubbs et al., 2004). Pathogen removal efficiencies of 3 to 4 log are quite common (Boving et al., 2010; Kelly and Rydlund, 2006; K¨ uhn and Mueller, 2000; Kumar and Mehrotra, 2009). Similarly, Schmidt et al. (2003) demonstrated that RBF systems can reduce heavy metals concentrations of zinc (82%), copper (51%), lead (75%), chromium (94%), and cadmium (75%). In general, the degree of pollutant removal depends largely on the properties of the materials through which the flow takes place. There is evidence that much of the contaminant removal occurs at the interface between the river and the sediments (Albrechtsen et al., 1998; Bellamy et al., 1985). This zone is known as the colmation zone or schmutzdecke and is characterized by high microbial activity and small grain size (Wang et al., 1995). It is thought that periodic scouring during flood events regenerates the treatment activity of the colmation layer (Gupta et al., 2009). Due to these auto-regenerative natural treatment processes, properly engineered RBF systems can maintain essentially unlimited treatment durations (Schubert, 2002). Riverbank filtration offers an inexpensive means to remove large amounts of contaminants and improve the quality of the water delivered for domestic use (Schubert, 2002). Although typically considered a pretreatment technology preceding more 1 University of Rhode Island, Department of Geosciences, Kingston, Rhode Island. 2 * University of Rhode Island, Department of Civil and Environmental Engineering, Woodward Hall, Rm. 315, Kingston, RI 02881; telephone: 401-874-7053, fax: 401-874-2190; boving@ uri.edu. 3 Sultan Qaboos University, Al-Khodh, PC 123, Muscat, Sultanate of Oman. 4 University of Vermont, Department of Plant and Soil Sciences, Burlington. 5 The Energy and Resources Institute (TERI), Western Regional Centre, Alto-St.Cruz, Goa, India. 636 Water Environment Research, Volume 86, Number 7
Transcript of Hydraulic and Hydrogeochemical Characteristics of a Riverbank Filtration Site in Rural India
Hydraulic and Hydrogeochemical Characteristicsof a Riverbank Filtration Site in Rural India
T. B. Boving1,2*, B. S. Choudri3, P. Cady1, A. Cording4, K. Patil5, Veerabaswant Reddy5
ABSTRACT: A riverbank filtration (RBF) system was tested along the
Kali River in rural part of the state of Karnataka in India. The polluted
river and water from open wells served the local population as their
principal irrigation water resource and some used it for drinking. Four
RBF wells (up to 25 m deep) were installed. The mean hydraulic
conductivity of the well field is 6.3310�3 cm/s and, based on Darcy’s law,
the water travel time from the river to the principal RBF well (MW3) is
45.2 days. A mixing model based on dissolved silica concentrations
indicated that, depending on the distance from the river and closeness to
irrigated rice fields, approximately 27 to 73% of the well water originated
from groundwater. Stable isotopic data indicates that a fraction of the
water was drawn in from the nearby rice fields that were irrigated with
river water. Relative to preexisting drinking water sources (Kali River and
an open well), RBF well water showed lower concentration of dissolved
metals (60.1% zinc, 27.8% cadmium, 83.9% lead, 75.5% copper, 100%
chromium). This study demonstrates that RBF technology can produce
high-quality water from low-quality surface water sources in a rural,
tropical setting typical for many emerging economies. Further, in parts of
the world where flood irrigation is common, RBF well water may draw in
infiltrated irrigation water, which possibly alters its geochemical
composition. A combination of more than one mixing model, silica
together with stable isotopes, was shown to be useful explaining the
origin of the RBF water at this study site. Water Environ. Res., 86, 636
(2014).
KEYWORDS: riverbank filtration, stable isotope, dissolved silica,
heavy metals, water treatment, India, emerging economy, groundwater,
flood irrigation, monsoon.
doi:10.2175/106143013X13596524516428
IntroductionMore than one billion people in the world—11% of the global
population—do not have access to safe drinking water (UNICEF,
2012). And although in developing countries, like India,
measurable progress has been made in supplying safe water,
gross disparity exists in coverage between urban and rural areas.
For instance, latrine usage is low in rural areas of India and only
14% of rural Indians have access to a latrine (Water.org, 2012).
Quite often wastewater, together with industrial effluent and
agricultural runoff, is discharged to rivers and lakes with little or
no treatment. Yet microbial and chemical contamination of
water resources can often be addressed with simple solutions,
such as improvements in sanitation, hygiene, and treatment.
One potential promising solution is riverbank filtration (RBF),
which is a water treatment technique that has been used in
Europe for over 100 years (Ray et al., 2002; Schmidt et al., 2003).
For example, RBF supplies 75% of the water supply to the
German capital of Berlin (Hiscock, 2005). In the Netherlands,
RBF contributes about 7% (80 Mm3/yr) of the national drinking
water supply (Stuyfzand et al., 2004).
In an RBF system, water is withdrawn from one or more wells
near a river or lake. Wells may either be vertical or horizontal
(Sandhu et al., 2011) and typically are installed more than 50 m
away from the river (Grischek et al., 2002). By pumping an RBF
well, the groundwater potential is lowered and river water
(together with groundwater) is induced to flow through porous
riverbed sediments (Hiscock and Grischek, 2002). As the raw
surface water travels toward the RBF well, dissolved and
suspended contaminants, as well as pathogens, are potentially
removed or significantly reduced in numbers resulting from a
combination of physical, chemical, and biological processes
(Hubbs et al., 2004). Pathogen removal efficiencies of 3 to 4 log
are quite common (Boving et al., 2010; Kelly and Rydlund, 2006;
Kuhn and Mueller, 2000; Kumar and Mehrotra, 2009). Similarly,
Schmidt et al. (2003) demonstrated that RBF systems can reduce
heavy metals concentrations of zinc (82%), copper (51%), lead
(75%), chromium (94%), and cadmium (75%).
In general, the degree of pollutant removal depends largely on
the properties of the materials through which the flow takes
place. There is evidence that much of the contaminant removal
occurs at the interface between the river and the sediments
(Albrechtsen et al., 1998; Bellamy et al., 1985). This zone is
known as the colmation zone or schmutzdecke and is
characterized by high microbial activity and small grain size
(Wang et al., 1995). It is thought that periodic scouring during
flood events regenerates the treatment activity of the colmation
layer (Gupta et al., 2009). Due to these auto-regenerative natural
treatment processes, properly engineered RBF systems can
maintain essentially unlimited treatment durations (Schubert,
2002).
Riverbank filtration offers an inexpensive means to remove
large amounts of contaminants and improve the quality of the
water delivered for domestic use (Schubert, 2002). Although
typically considered a pretreatment technology preceding more
1 University of Rhode Island, Department of Geosciences, Kingston,Rhode Island.2* University of Rhode Island, Department of Civil andEnvironmental Engineering, Woodward Hall, Rm. 315, Kingston,RI 02881; telephone: 401-874-7053, fax: 401-874-2190; [email protected] Sultan Qaboos University, Al-Khodh, PC 123, Muscat, Sultanate ofOman.4 University of Vermont, Department of Plant and Soil Sciences,Burlington.5 The Energy and Resources Institute (TERI), Western RegionalCentre, Alto-St.Cruz, Goa, India.
636 Water Environment Research, Volume 86, Number 7

advanced treatment operations (Ray, 2002; Schmidt et al., 2003;
Speth et al., 2003), RBF may in some cases serve as the final step
in providing drinking water (Dash et al., 2010). The advantages
of using RBF for water treatment are removal of particles and
turbidity (Dash et al., 2008, 2010; Dillon et al., 2002) and
attenuation of bacteria, viruses, and parasite loads (Berger 2002;
Boving et al., 2010; Dash et al., 2010; Gollnitz et al., 2003;
Havelaar et al., 1995; Schijven et al., 1998, 1999; Tufenkji et al.,
2002; Wang 2002; Weiss et al., 2003). Further, water treatment
by RBF typically increases the degradation of micropollutants
and lowers the concentration of pesticides and natural organic
matter (Doussan et al., 1997; Kuhn and Muller, 2000; Massmann
et al., 2003; Miettinen et al., 1994; Ray et al., 2002; Verstraeten et
al., 2002; Wang, 2002). Riverbank filtration also is known to
attenuate the concentration of disinfection byproduct precursors
(Weiss et al., 2002, 2003) and this technology is recognized for
smoothing out temperature and concentration variations and
compensating for peak pollution and shock loads (Ray, 2004).
Riverbed (alluvial) sediments are often highly permeable and
the depth to groundwater in the vicinity of rivers is commonly
relatively shallow. These attributes often make shallow RBF wells
located near rivers highly productive, less costly to drill than
typical groundwater resources (Schubert, 2002), and less prone
to contamination than surface water resources (Ray et al., 2002).
For these reasons, RBF technology is well suited for use in
developing and industrial countries (Boving et al., 2010; Dash et
al., 2010; Sandhu et al., 2011).
Historically, RBF has been used mostly along rivers in
temperate and cold climates such as Germany (Schubert
2002). Until recently, RBF has been relatively untested in
monsoonal climates, that is, locations dominated by strong
seasonal rains followed by a prolonged dry season (Kumar and
Mehrotra, 2009; Sandhu et al., 2011). Because of the limited
number of studies on RBF’s performance in these settings,
municipalities in developing countries appear reluctant to adopt
this water treatment technology (Cady et al., 2013). Using a field
site in the heavily polluted Kali River in southern India as a
showcase, the principal objective of this research was to evaluate
the performance of RBF under the environmental conditions of
a monsoon-influenced emerging economy, that is, a distinct dry
and wet seasons with highly variable river stage elevations
together with currently limited investments in water infrastruc-
ture. Another objective was to study possible effects on RBF
wells resulting from farming practices that rely on flood
irrigation using river water.
According to local health officials, the Kali River was the
major source of drinking and irrigation water for more than
160,000 people in this part of rural Karnataka, India, in 2007.
The river’s water quality is compromised by industrial influent
and untreated wastewater discharges in addition to monsoon
season runoff. These conditions are all too common in India and
other developing countries and could potentially affect the
performance of an RBF system. To evaluate if a small
community-sized RBF system is capable of producing high-
quality water from the low-quality local river water for
agricultural use and pretreatment for potable use, an RBF test
site was installed along the Kali River.
This paper summarizes the RBF well field hydrogeology and
hydraulics, including the results of a tracer test and the
geochemical analysis of stable isotopic data and dissolved silica
mixing model data. In a companion paper (Cady et al., 2013), the
results of a yearlong water quality study of microbial contam-
inants at the RBF test site are described. Other elements of this
study, such as testing the acceptance and economics of the RBF
system and an assessment of possible changes in the health of
the villagers served by RBF water have been summarized
elsewhere (Boving and Choudry, 2010; Boving et al., 2012;
Choudry and Boving, 2010).
MethodologyThe study was conducted in a rural area along the Kali River
in northwestern Karnataka, India (Figure 1a). The Kali River is a
185-km-long perennial river with a drainage basin of 3376 km2
(Manjunatha, Balakrishna, Shankar, Mahalingam, 2001; Man-
junatha, Balakrishna, Shankar, Sarin, 2001). This river flows west
out of the Western Ghats and passes four dams en route to the
Arabian Sea. The Kali River discharges at an average annual rate
of 197 m3/s at its lowest dam 35 km inland from the Arabian Sea
(Radhakrishna and Vaidyanadhan, 1997). It originates near the
Diggi village on the border of the states of Karnataka and Goa
and joins the Arabian Sea near the Uttara Kannada District
capital of Karwar. At the study site, the river’s maximum depth
was approximately 8 m and, according to local fishermen, varies
by 4 m or more during the seasons.
The RBF well field was installed near the village of
Kariyampalli (15813055.4’’ N, 74839055.6’’ E). This small village
(population ’1000) is located approximately 5 km downstream
from the town of Dandeli (population 46,760). Dandeli is a major
industrial city in Karnataka’s Uttara Kannada district and is
surrounded by several satellite villages. These villages commonly
have a single dirt road bordered by simple houses, a small
school, and perhaps a health clinic. The villages are surrounded
by irrigated paddy fields and typically lack secure sources of safe
drinking water. Industrial effluents released upstream from the
study site appear to cause water pollution throughout the year.
Resulting from the lack of other options and weak enforcement
of existing water quality regulations, contaminated river water
serves many uses, including drinking and flood irrigation of rice
paddies.
Hydrogeology and Climate. The geology of the study area is
characterized by the late Archaean Dharwar Schist Belt, which
forms a plateau and ridge system west of the site. The Shimoga
Basin of the Chitradurga Group, which encompasses the study
site, consists of schists, conglomerates, limestones, greywackes,
and cherts. Overlying these metasedimentary rocks are laterites
up to 60 m thick (Radhakrishna and Vaidyanadhan, 1997). These
clay-like, reddish laterites are structured soils that support the
movement of water. Alluvial deposits along the Kali River, where
present, are composed of partially rounded bedrock fragments of
variable sizes. These deposits range in thickness from a few
meters to 14 m and in the study area, the river fully penetrates
the alluvial aquifer (PRE, 2006).
According to the local Panchayat Raj Engineering office in
Haliyal, the mean depth to groundwater ranges from 3 to 30 m
below ground surface (bgs). At the study site, groundwater was
encountered at 3 to 4 m bgs. Main aquifers are formed in the
weaker, weathered, and fractured bedrock and in laterites along
with the alluvial patches found adjacent to major stream courses.
Groundwater in the alluvial and lateritic aquifer materials occurs
under unconfined, semiconfined, and confined conditions and is
typically extracted by dug or bore wells. Dug wells in the area are
2 to 3 m in diameter with depths from 4 to 20 m. Bore wells vary
Boving et al.
July 2014 637
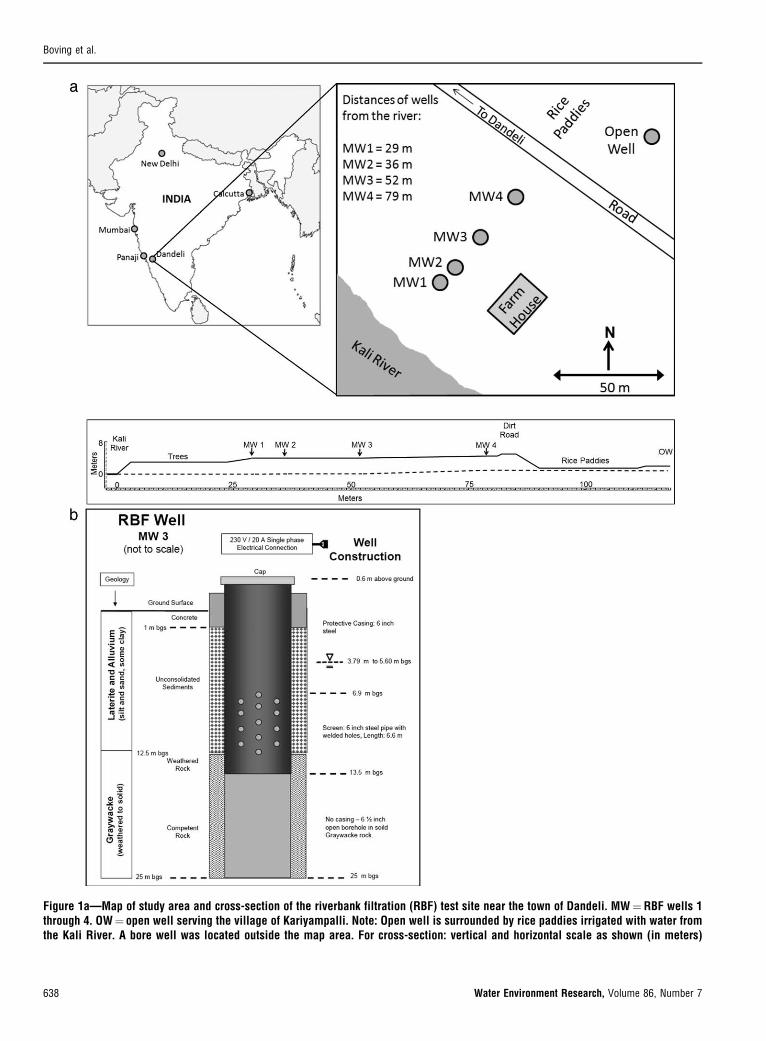
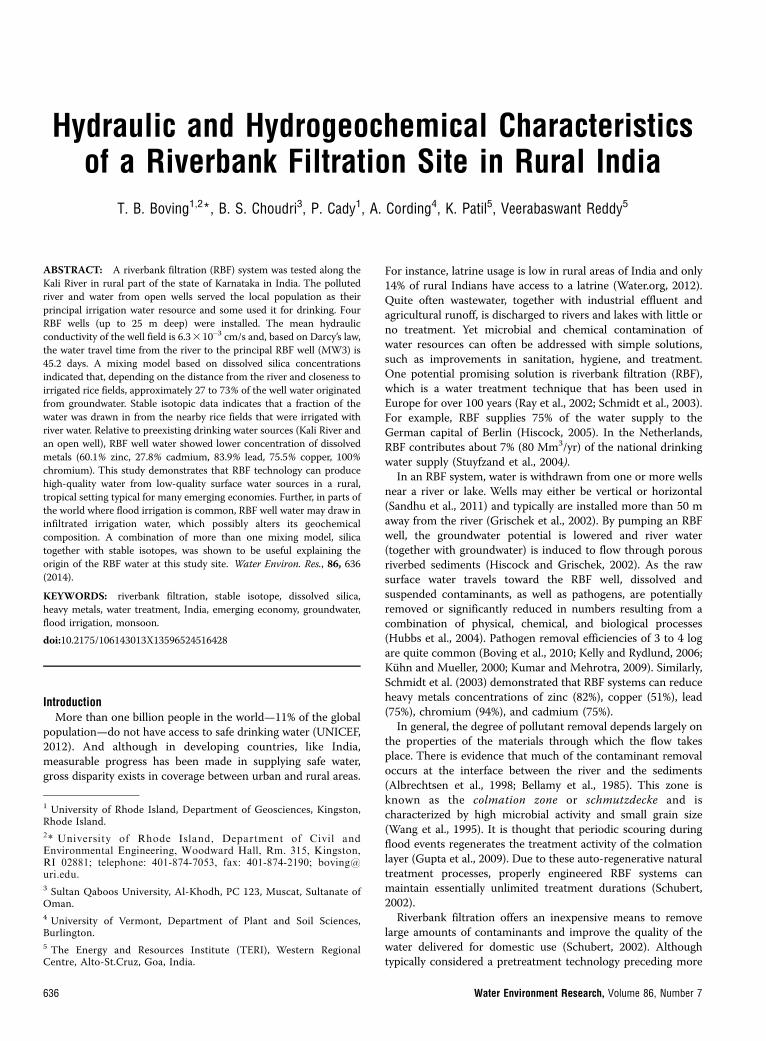
Figure 1a—Map of study area and cross-section of the riverbank filtration (RBF) test site near the town of Dandeli. MW¼ RBF wells 1through 4. OW¼ open well serving the village of Kariyampalli. Note: Open well is surrounded by rice paddies irrigated with water fromthe Kali River. A bore well was located outside the map area. For cross-section: vertical and horizontal scale as shown (in meters)
Boving et al.
638 Water Environment Research, Volume 86, Number 7
from 40 to 80 m in depth with an average of 70 m. The yields of
bore wells range from 50 to 250 m3/d with a specific capacity
between 15 to 95 m2/d. Drawdown varies from 2 to 10 m. Dug
well yields vary from 71 to 264 m3/d and specific capacity ranges
from 90 to 140 m2/d. Eighty percent of the wells in the area yield
150 m3/d (PRE, 2006).
The study area lies in the path of India’s southwestern
monsoon. The year may broadly be classified into two seasons. A
dry season from October to May is followed by the humid
monsoonal season, lasting from June to September. The total
annual precipitation is 1500 mm. July is the wettest month with
normal monthly rainfall in excess of 300 mm. Winds are
predominantly southwesterly during the summer monsoon and
northeasterly during the winter. Thunderstorms are common
during the monsoon. Generally, the weather is hot throughout
the year, peaking in May when the highest daytime temperatures
can rise to 38 8C.
Field Methods. In January 2008, the search for a suitable RBF
test site began with a hydrogeochemical survey of existing
surface- and groundwater resources, including tap water, in the
wider study area. Calibrated hand-held meters were employed to
test each water source for pH, temperature (T), oxidation
reduction potential (ORP) (tester HI98121; Hanna Instruments,
Smithfield, Rhode Island), electrical conductivity, and total
dissolved solids (TDS) (Hanna Instruments’ HI98129). During
the survey, test strips were used for estimating alkalinity (as
CaCO3) and hardness (Insta-Test5 pool and spa strips; LaMotte
Co., Chesterton, Maryland), iron (Fe2þ/Fe3þ; Orion Research
Aquafast; Thermo Fisher Scientific, Waltham, Massachusetts),
nitrate/nitrite, chloride, free chlorine (Sensafe; Industrial Test
Systems, Rock Hill, South Carolina), and total ammonia
(Aquacheck; Hach Co., Loveland, Colorado). Free chlorine was
included because of concern for the presence of bleach in the
effluent from an upstream paper mill. Test strips have obvious
limitations, but with reasonable accuracy they provide an
indication of the general water quality characteristics at each
location. All sample and survey locations were spatially
referenced with a hand-held global positioning system (GPS)
receiver (GPS 12 XL; Garmin, Ltd., Olathe, Kansas). The field
survey data set was supplemented by water quality data from the
literature and public records.
The principal water quality monitoring campaign lasted from
January through December 2009. Ion, metal, and silica samples
were collected in 100 mL HDPE plastic sample bottles. All
samples were field filtered with glass 2-lm microfiber filter
(Whatman, Inc., a division of GE Healthcare Bio-Sciences,
Pittsburgh, Pennsylvania) followed by 0.45-lm filters (What-
man, Inc.). Metal samples were acidified with hydrochloric acid
(Rankem, RFCL Ltd., New Delhi, India). Well water samples
were collected under routine operating conditions of the RBF
well field. The pump operated for about 6 hours every day,
usually during the morning. Samples were collected at least once
a week and after the pump had been running for at least 1 hour.
Samples collected during 2009 were shipped to the University of
Rhode Island (URI) and analyzed for anions and cations (Dionex
ion DX-120 chromatograph; Dionex Corp., Sunnyvale, Califor-
nia) and heavy metal concentrations by ICP-MS (Thermo
Electron Corporation [Waltham, Massachusetts] X-Series II
Quadrapole). One in 10 samples tested were duplicates or
standards for quality assurance and quality control. To study the
relative contributions of river and groundwater to the RBF
system, aqueous samples for naturally occurring silica and the
stable isotopes of oxygen and hydrogen were collected. Silica
samples were collected in 100-mL plastic bottles. The samples
were field filtered with glass microfiber and 0.45-lm pore size
filters (Whatman, Inc.). The samples were analyzed at the URI
following the dissolved silica analysis after APHA molybdosili-
cate method #3113C on a Shimadzu UV-Visible 1601 Spectro-
photometer (Shimadzu Corp., Kyoto, Japan). Stable isotope
samples were collected in 50-mL plastic bottles with no field
filtering or acidification. All isotope samples were sent to the
Northern Arizona University’s Colorado Plateau Stable Isotope
Laboratory (CPSIL) for analysis on a Los Gatos Research Laser
Mass Spectrometer. Samples were also analyzed for bacteria;
results are discussed in the companion paper (Cady et al., 2013).
Riverbank Filtration Well Field. Based on the results from
the 2008 survey, a site near the village of Kariyampalli was
selected. The site sits on the eastern bank of the Kali River and is
surrounded by rice fields and farm land (Figure 1). The site
selection criteria were (1) accessibility of land next to the river
and cooperation of the landowner, (2) need for safe water for
drinking and agriculture, (3) presence of alluvial sediments, (4)
degree of contamination of the Kali River, and (5) proximity of a
village to the RBF well.
Visual inspections of outcrops within the study area, the
examination of drill log data obtained from the local Panchayat
Raj Engineering office in Haliyal, and observations made during
the drilling of the RBF wells show that the geology in the study
area is characterized by lateritic brownish-red silty loam and
structured clay from the top to 8 to 10.5 m bgs, followed by a
silty-sandy clay or light brown fine sand and silt layers of about 2
m, followed by 1 to 3 m of weathered greywacke or sandy-silty
alluvium. The base of the strata is composed of solid greywacke.
In October 2008, four wells were drilled using the air hammer
rotary method. Drill mud was removed by flushing the wells
with pressurized water free of any additives. The wells were
installed approximately perpendicular to the river with the
farthest well (MW4) 79 m away from the riverbank (Figure 1a).
An existing open well (KOW) is located 125 m away from the
river and about 300 m from the village of Kariyampalli. The
depth of this brick-constructed open well was approximately 7
m and its diameter 2.1 m. The well was uncovered and buckets
were used to recover water for domestic uses. A small electric
pump provided water for irrigation to the adjacent rice paddies.
Four wells were installed to systematically study the well field
hydraulics and changes in RBF water quality with distance from
the river. The elevation of the well field site was 454 m above sea
level. A slight slope of the land surface toward the river was
observed but could not be measured accurately with the
available GPS equipment.
The thickness of the lateritic soil and the river bed sediments
ranged from 12.5 to 14.0 m followed by bedrock beneath (Table
(modified after Cady et al., 2013). Figure 1b—Riverbank filtration well construction diagram for well MW3 (RBF¼ riverbank filtration;bgs¼ below ground surface).
Boving et al.
July 2014 639
1). The construction of the well field is exemplified by well MW3
(Figure 1b). Solid steel 150-mm (6-in.) casing reached from
approximately 0.6 m above ground to 13.5 m bgs. The well
screen was manufactured at the site by cutting 10 mm wide and
approximately 100-mm-long slots with a blow torch into the
steel casing. The screen penetrated the unconfined aquifer from
6.9 m bgs down to the bedrock (Table 1). No casing or screen
was used in the bedrock. At the surface, concrete was poured
between the casing and the bore-hole to a depth of 1 m. The
remainder of the space between the casing and the bore-hole
was back-filled with collapsed natural sediment. The final depth
of the well at the time of drilling was 25 m. The construction of
the other three wells was similar except for MW1, which was
drilled to just 20 m bgs and not screened. The static water levels
were approximately 4 m bgs in all wells. Additional well field
information is provided in Table 1. An electric submersible
pump (CRI Pumps, Hubli, Karnataka) and calibrated class B
CM/L water meters (Dasmesh India; Malerkotla, Punjab, India)
were purchased locally. The 2 HP (1.49 kW) single phase 230-V
pump had approximately 8 m3/hr capacity at 100 m head.
All well heads were encased in a 1 m by 1 m concrete slab for
protection and covered by a steel cap. The location of each well
was documented with a hand-held GPS (Table 1). Prior to use,
all wells were sanitized with a solution of 1 part 5% sodium
hypochlorite (NaOCl) bleach to 3 parts water. The solution was
left in the well overnight and then the wells were pumped
continuously for at least 1 day.
Two aquifer tests were conducted on well MW3 (pumping
rate: 9 m3/hr). The pumping rate was about twice the anticipated
production rate during well field operation. Water levels in the
river, pumping well, and nearby wells were monitored electron-
ically (In-Situ LevelTroll 500 and BaroTroll 500). Additionally,
slug tests were conducted on all wells. The river stage was
monitored electronically (LevelTroll; InSitu, Inc., Ft. Collins,
Colorado) between January and April 2009.
The standard technique to determine the travel time from an
injection point to a well is to inject a pulse of an easy-to-measure
conservative tracer, such as a salt solution, and observe the
breakthrough curve in the well (e.g., Davis et al., 1980; Lin et al.,
2003). In this study, the tracer test was conducted to determine
the time it takes for the tracer to be drawn from the injection
well (MW2) to the pumping well (MW3). The test was
performed in May 2009 by dissolving 3 kg of common table
salt in 20 L of RBF water (150 g/L). The tracer solution was
poured into MW2 at a rate of about 2 L/min. Using a plunger,
the salt solution was mixed with the water within the injection
well. The initial salt concentration in the well after mixing was 8
g/L, which was sufficiently low to deter density-driven flow of
the tracer plume. The arrival of the tracer was measured by
monitoring the electrical conductivity with a data logger
(Levelogger; Solinst Canada Ltd., Georgetown, Ontario, Canada)
installed in MW3. The pumping rate at well MW3 was 9 m3/hr
on average. The distance between both wells was 16 m (Figure
1). The tracer test ran for more than 6 days. Daily electric power
outages, lasting from less than 1 hour to 12 hours, were
common.
Results and DiscussionHydrogeochemistry. During the initial water quality survey
in 2008, river water and water samples from 22 different
locations were tested (Table 2). All data, including pictures of
each sampling location, was tabulated for linkage to Internet-
accessible Google Earth maps (Google, Inc., Mountain View,
California). The Kali River water (n ¼ 6) was characterized by
near neutral pH values, positive ORP values, and comparably
low alkalinity, TDS, and electrical conductivity. These observa-
tions were similar to previous studies (Bharati and Krishnamur-
thy, 1990, 1992; Chavadi and Gokhale, 1984; Krishnamurthy and
Bharati, 1994, 1996; Manjunatha, Balakrishna, Shankar, Maha-
lingam, 2001; Subramanian et al., 1987). Distinctly different
measurements were recorded at an industrial wastewater
confluence point downgradient from the town of Dandeli (n ¼1; data not shown in Table 2), where the ORP was negative, the
temperature of the effluent more than 6 8C higher, and electrical
conductivity and TDS about 22 times higher than in the river.
The water quality of the open well (KOW; n ¼ 4), relative to
the river, is characterized by similar pH; lower ORP; and higher
alkalinity, TDS, and electrical conductivity values. The lower
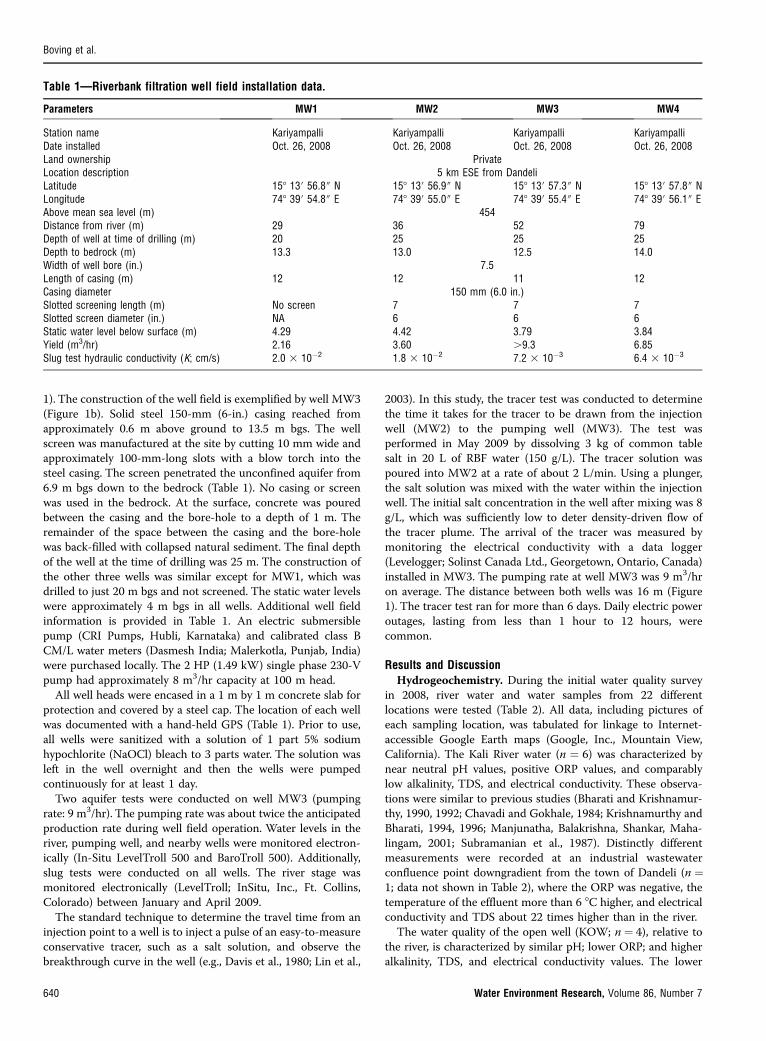
Table 1—Riverbank filtration well field installation data.
Parameters MW1 MW2 MW3 MW4
Station name Kariyampalli Kariyampalli Kariyampalli KariyampalliDate installed Oct. 26, 2008 Oct. 26, 2008 Oct. 26, 2008 Oct. 26, 2008Land ownership PrivateLocation description 5 km ESE from DandeliLatitude 158 130 56.8 00 N 158 130 56.9 00 N 158 130 57.3 00 N 158 130 57.8 00 NLongitude 748 390 54.8 00 E 748 390 55.0 00 E 748 390 55.4 00 E 748 390 56.1 00 EAbove mean sea level (m) 454Distance from river (m) 29 36 52 79Depth of well at time of drilling (m) 20 25 25 25Depth to bedrock (m) 13.3 13.0 12.5 14.0Width of well bore (in.) 7.5Length of casing (m) 12 12 11 12Casing diameter 150 mm (6.0 in.)Slotted screening length (m) No screen 7 7 7Slotted screen diameter (in.) NA 6 6 6Static water level below surface (m) 4.29 4.42 3.79 3.84Yield (m3/hr) 2.16 3.60 .9.3 6.85Slug test hydraulic conductivity (K; cm/s) 2.0 3 10�2 1.8 3 10�2 7.2 3 10�3 6.4 3 10�3
Boving et al.
640 Water Environment Research, Volume 86, Number 7

ORP values point to the degradation of dissolved organic matter
during passage through the aquifer, while the higher alkalinity,
TDS and electrical conductivity values suggest increased
dissolution of mineral matter. Water from hand pumps (n ¼ 6)
had a low average pH and a comparably wide range of ORP
values and very high electrical conductivity and TDS measure-
ments. Outliers were more common in hand pumps that were
used infrequently, if at all. Tap water (n¼ 4), available in Dandeli
only, had TDS and electrical conductivity values ranging
between that of the river and open wells. Alkalinity ranged
widely.
Nitrate was 5 mg/L or less at all locations, except in one hand-
pump water sample where 20 mg/L was detected. Sulfate
concentrations ranged from 0 to 250 mg/L. The Indian drinking
water quality standard for iron is 0.3 mg/L (as Fe; BIS, 1992;
reaffirmed 1993) and was exceeded frequently, including in the
Kali River. In general, compared to subsequent and more
accurate ion chromatography measurements of nitrate, sulfate,
and IC-PMS analysis of iron at the URI laboratories, the test
strips tended to overestimate the concentrations of these ions.
The BIS total hardness standard of 300 mg/L was exceeded only
in hand-pump samples and the wastewater effluent sampling
location. Total ammonia ranged from 0 to .6 mg/L and total
chlorine was 1 mg/L or less in all samples. The absence of
elevated chlorine concentrations indicated that any bleach that
may have been discharged from industrial sources to the river
upstream from the well field had been diluted or decayed. All
bacteria data are discussed in Cady et al., 2013.
During the 2009 monitoring campaign, cation (n ¼ 80) and
anion (n¼63) samples were analyzed. Fewer anion samples were
analyzed because of inadequate sample preservation. The
average concentrations, including the range of major cations
and anions collected from the RBF well field and samples from
nearby wells and the Kali River, are shown in Figure 2. Overall,
the RBF production well MW3 delivered water with a major
cation and anion content that falls between the river and local
shallow groundwater collected at KOW.
In addition to the major cations and anions, dissolved
concentrations of noteworthy metals were determined from
water sources in and around the RBF well field (Table 3).
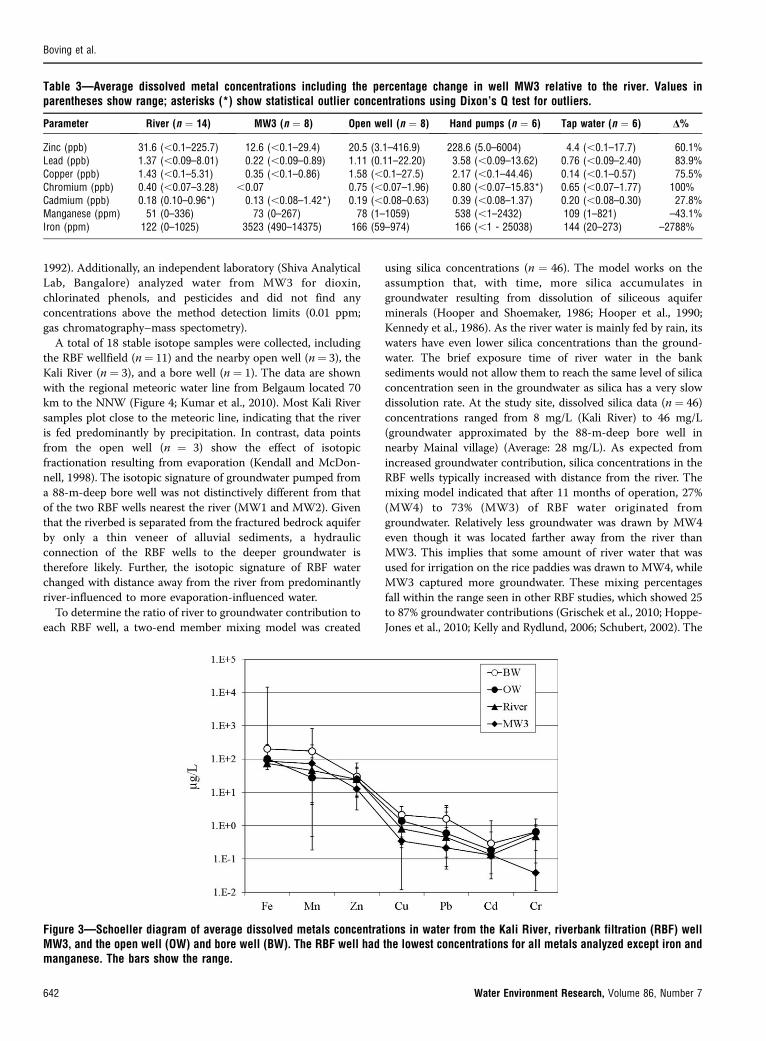
Relative to the Kali River (Figure 3), the water quality from well
MW3 was improved, that is, the concentration of dissolved
metals were lower by 27.8% cadmium, 60.1% zinc, 100%
chromium, 83.9% lead, and 75.5% copper. Concentrations of
manganese (�43.1%) and particularly iron (�2788%) were higherin the well water relative to the river. This was caused by initially
high levels of iron- and manganese-rich particulates mobilized
by pumping from newly installed wells in an iron/manganese-
rich lateritic aquifer. Both iron and manganese concentrations
decreased significantly after 1 year of pumping. Overall, the
average RBF water quality is superior to the river water and all
applicable drinking water standards for metals were met (BIS,
Table 2—2008 water quality survey data. Values in parentheses are averages.
Parameter River (n ¼ 7) Open well (n ¼ 4) Hand pumps (n ¼ 6) Tap water (n ¼ 4)
pH 7.3 to 7.6 (7.4) 6.9 to 7.4 (7.2) 6.3 to 7.2 (7.0) 7.3 to 7.5 (7.4)Electrical conductivity (lS/cm) 34 to 168 (69) 235 to 922 (490) 243 to 2327 (1120) 42 to 557 (344)Total dissolved solids (mg/L) 17 to 83 (34) 117 to 462 (247) 121 to 1162 (558) 20 to 278 (172)Alkalinity (mg/L) 0 to 40 40 to 180 40 to .180 0 to .180Oxydation reduction potential (mV) 207 to 284 (238) 150 to 233 (201) –149 to 140 (35) 241 to 434 (298)
Figure 2—Schoeller diagram of major dissolved ions from the Kali River, riverbank filtration (RBF) well MW3, and the open well (OW)and bore well (BW). The bars show the range.
Boving et al.
July 2014 641
1992). Additionally, an independent laboratory (Shiva Analytical
Lab, Bangalore) analyzed water from MW3 for dioxin,
chlorinated phenols, and pesticides and did not find any
concentrations above the method detection limits (0.01 ppm;
gas chromatography–mass spectometry).
A total of 18 stable isotope samples were collected, including
the RBF wellfield (n¼ 11) and the nearby open well (n¼ 3), the
Kali River (n ¼ 3), and a bore well (n ¼ 1). The data are shown
with the regional meteoric water line from Belgaum located 70
km to the NNW (Figure 4; Kumar et al., 2010). Most Kali River
samples plot close to the meteoric line, indicating that the river
is fed predominantly by precipitation. In contrast, data points
from the open well (n ¼ 3) show the effect of isotopic
fractionation resulting from evaporation (Kendall and McDon-
nell, 1998). The isotopic signature of groundwater pumped from
a 88-m-deep bore well was not distinctively different from that
of the two RBF wells nearest the river (MW1 and MW2). Given
that the riverbed is separated from the fractured bedrock aquifer
by only a thin veneer of alluvial sediments, a hydraulic
connection of the RBF wells to the deeper groundwater is
therefore likely. Further, the isotopic signature of RBF water
changed with distance away from the river from predominantly
river-influenced to more evaporation-influenced water.
To determine the ratio of river to groundwater contribution to
each RBF well, a two-end member mixing model was created
using silica concentrations (n ¼ 46). The model works on the
assumption that, with time, more silica accumulates in
groundwater resulting from dissolution of siliceous aquifer
minerals (Hooper and Shoemaker, 1986; Hooper et al., 1990;
Kennedy et al., 1986). As the river water is mainly fed by rain, its
waters have even lower silica concentrations than the ground-
water. The brief exposure time of river water in the bank
sediments would not allow them to reach the same level of silica
concentration seen in the groundwater as silica has a very slow
dissolution rate. At the study site, dissolved silica data (n ¼ 46)
concentrations ranged from 8 mg/L (Kali River) to 46 mg/L
(groundwater approximated by the 88-m-deep bore well in
nearby Mainal village) (Average: 28 mg/L). As expected from
increased groundwater contribution, silica concentrations in the
RBF wells typically increased with distance from the river. The
mixing model indicated that after 11 months of operation, 27%
(MW4) to 73% (MW3) of RBF water originated from
groundwater. Relatively less groundwater was drawn by MW4
even though it was located farther away from the river than
MW3. This implies that some amount of river water that was
used for irrigation on the rice paddies was drawn to MW4, while
MW3 captured more groundwater. These mixing percentages
fall within the range seen in other RBF studies, which showed 25
to 87% groundwater contributions (Grischek et al., 2010; Hoppe-
Jones et al., 2010; Kelly and Rydlund, 2006; Schubert, 2002). The
Figure 3—Schoeller diagram of average dissolved metals concentrations in water from the Kali River, riverbank filtration (RBF) wellMW3, and the open well (OW) and bore well (BW). The RBF well had the lowest concentrations for all metals analyzed except iron andmanganese. The bars show the range.
Table 3—Average dissolved metal concentrations including the percentage change in well MW3 relative to the river. Values inparentheses show range; asterisks (*) show statistical outlier concentrations using Dixon’s Q test for outliers.
Parameter River (n ¼ 14) MW3 (n ¼ 8) Open well (n ¼ 8) Hand pumps (n ¼ 6) Tap water (n ¼ 6) D%
Zinc (ppb) 31.6 (,0.1–225.7) 12.6 (,0.1–29.4) 20.5 (3.1–416.9) 228.6 (5.0–6004) 4.4 (,0.1–17.7) 60.1%Lead (ppb) 1.37 (,0.09–8.01) 0.22 (,0.09–0.89) 1.11 (0.11–22.20) 3.58 (,0.09–13.62) 0.76 (,0.09–2.40) 83.9%Copper (ppb) 1.43 (,0.1–5.31) 0.35 (,0.1–0.86) 1.58 (,0.1–27.5) 2.17 (,0.1–44.46) 0.14 (,0.1–0.57) 75.5%Chromium (ppb) 0.40 (,0.07–3.28) ,0.07 0.75 (,0.07–1.96) 0.80 (,0.07–15.83*) 0.65 (,0.07–1.77) 100%Cadmium (ppb) 0.18 (0.10–0.96*) 0.13 (,0.08–1.42*) 0.19 (,0.08–0.63) 0.39 (,0.08–1.37) 0.20 (,0.08–0.30) 27.8%Manganese (ppm) 51 (0–336) 73 (0–267) 78 (1–1059) 538 (,1–2432) 109 (1–821) –43.1%Iron (ppm) 122 (0–1025) 3523 (490–14375) 166 (59–974) 166 (,1 - 25038) 144 (20–273) –2788%
Boving et al.
642 Water Environment Research, Volume 86, Number 7
interpretation of the silica data is limited by uncertainty about
the local groundwater silica concentration. This is because the
land-side groundwater silica concentration came from an 88-m-
deep bore well and may therefore have a higher silica content
than the fairly shallow RBF wells (25 m). In that case, the
groundwater/river water mixing percentages at the RBF site
would be skewed toward greater river water contributions.
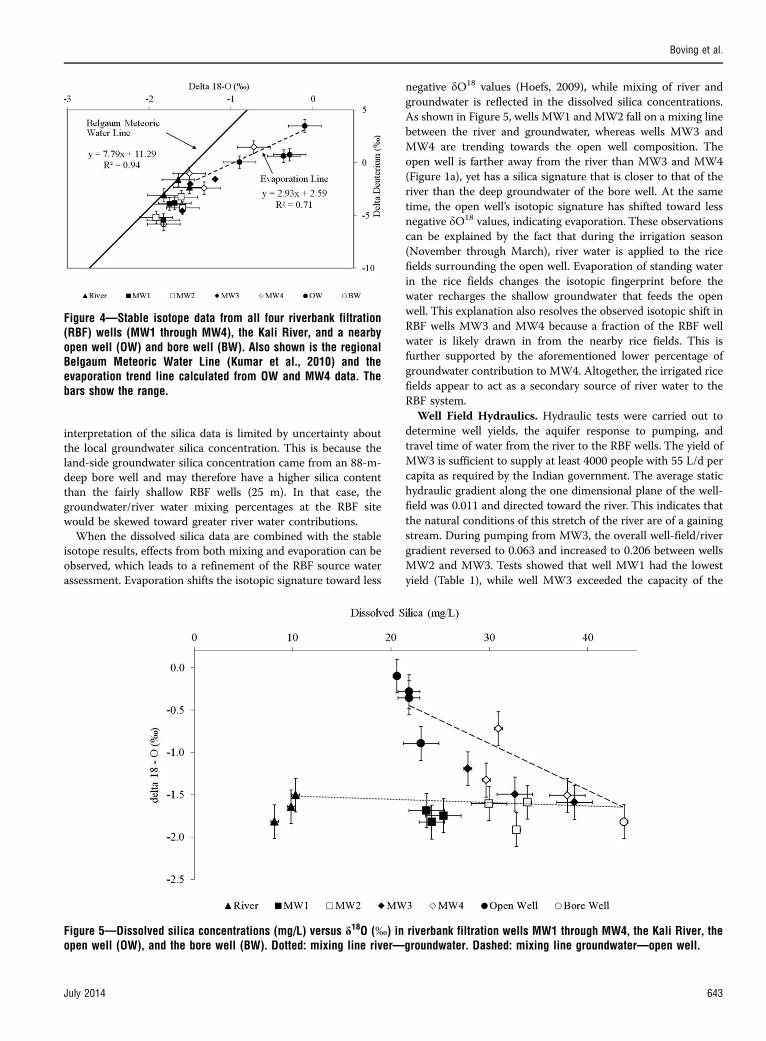
When the dissolved silica data are combined with the stable
isotope results, effects from both mixing and evaporation can be
observed, which leads to a refinement of the RBF source water
assessment. Evaporation shifts the isotopic signature toward less
negative dO18 values (Hoefs, 2009), while mixing of river and
groundwater is reflected in the dissolved silica concentrations.
As shown in Figure 5, wells MW1 and MW2 fall on a mixing line
between the river and groundwater, whereas wells MW3 and
MW4 are trending towards the open well composition. The
open well is farther away from the river than MW3 and MW4
(Figure 1a), yet has a silica signature that is closer to that of the
river than the deep groundwater of the bore well. At the same
time, the open well’s isotopic signature has shifted toward less
negative dO18 values, indicating evaporation. These observations
can be explained by the fact that during the irrigation season
(November through March), river water is applied to the rice
fields surrounding the open well. Evaporation of standing water
in the rice fields changes the isotopic fingerprint before the
water recharges the shallow groundwater that feeds the open
well. This explanation also resolves the observed isotopic shift in
RBF wells MW3 and MW4 because a fraction of the RBF well
water is likely drawn in from the nearby rice fields. This is
further supported by the aforementioned lower percentage of
groundwater contribution to MW4. Altogether, the irrigated rice
fields appear to act as a secondary source of river water to the
RBF system.
Well Field Hydraulics. Hydraulic tests were carried out to
determine well yields, the aquifer response to pumping, and
travel time of water from the river to the RBF wells. The yield of
MW3 is sufficient to supply at least 4000 people with 55 L/d per
capita as required by the Indian government. The average static
hydraulic gradient along the one dimensional plane of the well-
field was 0.011 and directed toward the river. This indicates that
the natural conditions of this stretch of the river are of a gaining
stream. During pumping from MW3, the overall well-field/river
gradient reversed to 0.063 and increased to 0.206 between wells
MW2 and MW3. Tests showed that well MW1 had the lowest
yield (Table 1), while well MW3 exceeded the capacity of the
Figure 4—Stable isotope data from all four riverbank filtration(RBF) wells (MW1 through MW4), the Kali River, and a nearbyopen well (OW) and bore well (BW). Also shown is the regionalBelgaum Meteoric Water Line (Kumar et al., 2010) and theevaporation trend line calculated from OW and MW4 data. Thebars show the range.
Figure 5—Dissolved silica concentrations (mg/L) versus d18O (%) in riverbank filtration wells MW1 through MW4, the Kali River, theopen well (OW), and the bore well (BW). Dotted: mixing line river—groundwater. Dashed: mixing line groundwater—open well.
Boving et al.
July 2014 643
pump (9 m3/hr). Examination of the drill logs indicate a greater
presence of finer sediments (sandy silt) in the vicinity of the
wells closer to the river (MW1 and MW2) versus those higher-
yielding ones farther away (MW3 and MW4). The difference in
geology is the likely explanation for the observed lower yields of
the wells closer to the river (Table 1).
The hydraulic conductivity (K) was derived from two aquifer
tests on MW3 conducted in January 2009. In general, for
pumping tests near rivers, it is recommended to use steady state
data, which can only be achieved by long-duration pumping
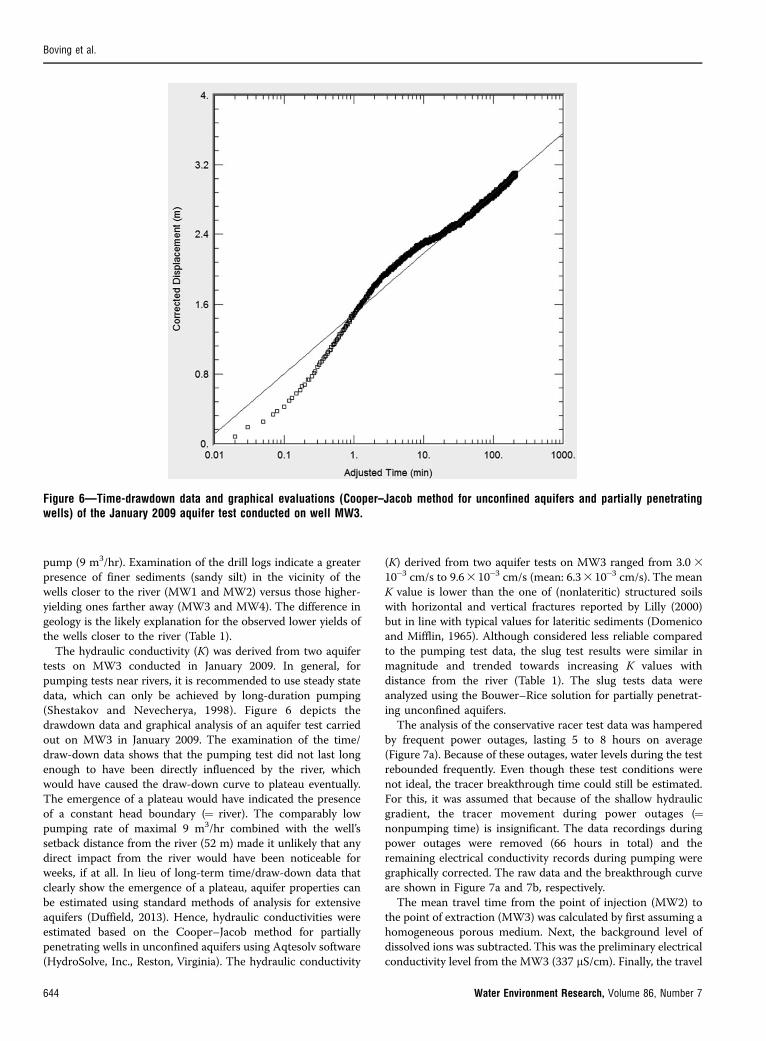
(Shestakov and Nevecherya, 1998). Figure 6 depicts the
drawdown data and graphical analysis of an aquifer test carried
out on MW3 in January 2009. The examination of the time/
draw-down data shows that the pumping test did not last long
enough to have been directly influenced by the river, which
would have caused the draw-down curve to plateau eventually.
The emergence of a plateau would have indicated the presence
of a constant head boundary (¼ river). The comparably low
pumping rate of maximal 9 m3/hr combined with the well’s
setback distance from the river (52 m) made it unlikely that any
direct impact from the river would have been noticeable for
weeks, if at all. In lieu of long-term time/draw-down data that
clearly show the emergence of a plateau, aquifer properties can
be estimated using standard methods of analysis for extensive
aquifers (Duffield, 2013). Hence, hydraulic conductivities were
estimated based on the Cooper–Jacob method for partially
penetrating wells in unconfined aquifers using Aqtesolv software
(HydroSolve, Inc., Reston, Virginia). The hydraulic conductivity
(K) derived from two aquifer tests on MW3 ranged from 3.0 3
10�3 cm/s to 9.63 10�3 cm/s (mean: 6.3310�3 cm/s). The mean
K value is lower than the one of (nonlateritic) structured soils
with horizontal and vertical fractures reported by Lilly (2000)
but in line with typical values for lateritic sediments (Domenico
and Mifflin, 1965). Although considered less reliable compared
to the pumping test data, the slug test results were similar in
magnitude and trended towards increasing K values with
distance from the river (Table 1). The slug tests data were
analyzed using the Bouwer–Rice solution for partially penetrat-
ing unconfined aquifers.
The analysis of the conservative racer test data was hampered
by frequent power outages, lasting 5 to 8 hours on average
(Figure 7a). Because of these outages, water levels during the test
rebounded frequently. Even though these test conditions were
not ideal, the tracer breakthrough time could still be estimated.
For this, it was assumed that because of the shallow hydraulic
gradient, the tracer movement during power outages (¼nonpumping time) is insignificant. The data recordings during
power outages were removed (66 hours in total) and the
remaining electrical conductivity records during pumping were
graphically corrected. The raw data and the breakthrough curve
are shown in Figure 7a and 7b, respectively.
The mean travel time from the point of injection (MW2) to
the point of extraction (MW3) was calculated by first assuming a
homogeneous porous medium. Next, the background level of
dissolved ions was subtracted. This was the preliminary electrical
conductivity level from the MW3 (337 lS/cm). Finally, the travel
Figure 6—Time-drawdown data and graphical evaluations (Cooper–Jacob method for unconfined aquifers and partially penetratingwells) of the January 2009 aquifer test conducted on well MW3.
Boving et al.
644 Water Environment Research, Volume 86, Number 7
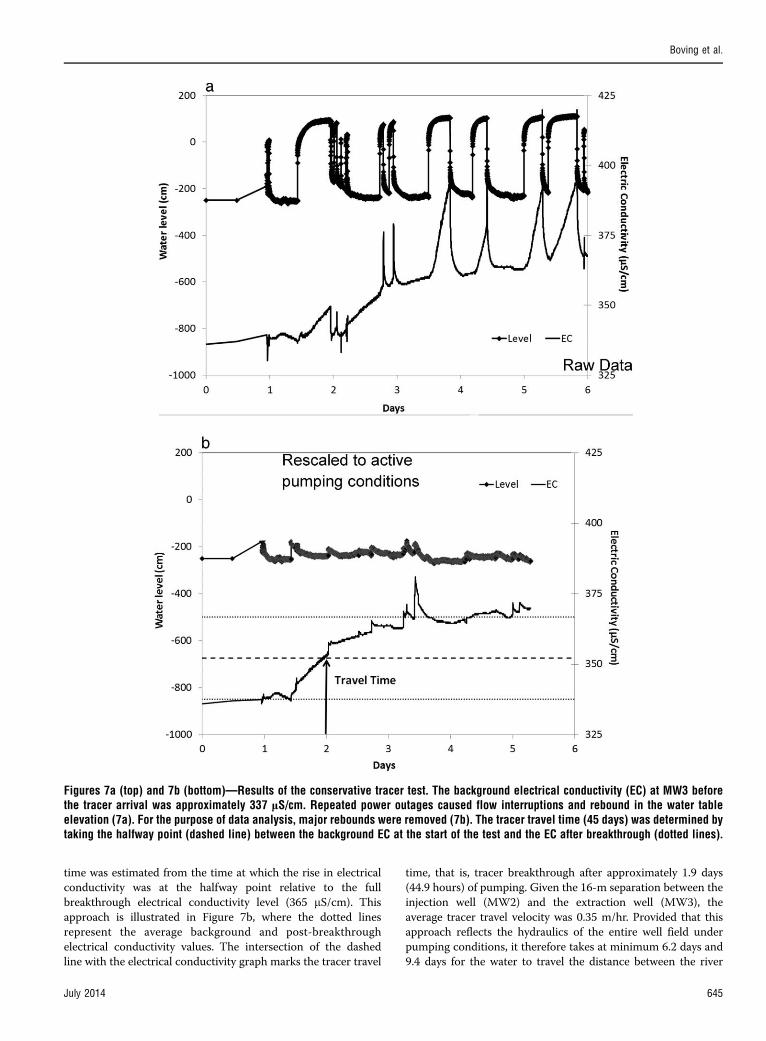
time was estimated from the time at which the rise in electrical
conductivity was at the halfway point relative to the full
breakthrough electrical conductivity level (365 lS/cm). This
approach is illustrated in Figure 7b, where the dotted lines
represent the average background and post-breakthrough
electrical conductivity values. The intersection of the dashed
line with the electrical conductivity graph marks the tracer travel
time, that is, tracer breakthrough after approximately 1.9 days
(44.9 hours) of pumping. Given the 16-m separation between the
injection well (MW2) and the extraction well (MW3), the
average tracer travel velocity was 0.35 m/hr. Provided that this
approach reflects the hydraulics of the entire well field under
pumping conditions, it therefore takes at minimum 6.2 days and
9.4 days for the water to travel the distance between the river
Figures 7a (top) and 7b (bottom)—Results of the conservative tracer test. The background electrical conductivity (EC) at MW3 beforethe tracer arrival was approximately 337 lS/cm. Repeated power outages caused flow interruptions and rebound in the water tableelevation (7a). For the purpose of data analysis, major rebounds were removed (7b). The tracer travel time (45 days) was determined bytaking the halfway point (dashed line) between the background EC at the start of the test and the EC after breakthrough (dotted lines).
Boving et al.
July 2014 645
and the RBF wells MW3 and MW4, respectively. Longer mean
travel times are likely as infiltration also occurs from the center
of the river and not just from the riverbed closest to the well
field or drawing-in water from along other, longer flow paths.
Travel times were also estimated on the basis of Darcy’s law
(eq 1) and the hydraulic conductivity values established by the
aquifer tests on well MW3 (range: 3.03 10�3 cm/s to 9.63 10�3
cm/s).
T ¼ dn
Kgrad: ð1Þ
where T is the travel time of a nonretarded solute, d is the
distance between the river and the well (52 m in case of MW3),
n is the porosity (30%), and grad is the hydraulic gradient
between the river and the well during pumping (0.063). The
travel time calculated from the mean K (6.3310�3 cm/s) value is
45.2 days, which is similar to the range reported in other RBF
studies (Grischek et al., 2010; Hoppe-Jones et al., 2010; Kuhn
and Muller, 2000; Schmidt et al., 2003; Tufenkji et al., 2002), but
approximately 5 to 7 times longer compared to the tracer test
results. Because the tracer test results needed to be adjusted for
the frequent power outages (Figures 7a and 7b) and it was
assumed that homogenous conditions prevailed in the entire
well field, that data set may be less reliable than the pump test
data.
ConclusionsConventional water treatment technologies employed in
industrialized countries are often too costly and technically
complex for effective use in emerging economies. This study
focused on riverbank filtration technology, which has a proven
record in Europe and the United States, but has only fairly
recently garnered the attention of researchers and water
managers in areas like India that have markedly different
temperature and rainfall patterns than Europe and the United
States.
A major objective of this study was to analyze and understand
the performance of a small riverbank filtration system to
determine its ability to supply treated water to a small rural
community in southwestern India. The hydraulic testing and
hydrogeochemical investigations over a 1-year period demon-
strated that the RBF water quality and quantity meets and
exceeds local standards of those parameters described in this
study. The yield of the principal RBF well MW3 was sufficient to
supply at least 4000 people with 55 L/d per capita as required by
the Indian government.
A hydraulic analysis based on Darcy’s law resulted in a mean
travel time of 45.2 days, which is in line other RBF studies.
Tracer test data indicated a comparatively high travel velocity of
0.35 m/d and minimum travel times from the river to the wells
of up to 9.4 days. Besides being representative for the hydro-
geological conditions between wells MW2 and MW3 only, one
problem encountered during the tracer test were multiple power
outages, which likely limit the value of these results. It would
take additional aquifer tests in conjunction with tracer tests at
other RBF wells and the river, together with numerical modeling
of the field site, to further narrow the range of these travel time
estimates.
Stable isotopic data indicated that the river was primarily
precipitation fed and that the RBF wells farther from the river,
including an existing open well in a nearby rice field, were
influenced by evaporation. Dissolved silica concentrations
indicated that 27% (MW4) to 73% (MW3) of RBF water
originated from groundwater. Furthermore, it is evident that a
fraction of the RBF well water, particularly in MW4, was drawn
in from nearby rice paddies that were irrigated with river water.
A comparison of Kali River water with MW3 well water showed
that the well water heavy metal concentrations were lower by
60.1% zinc, 27.8% cadmium, 83.9% lead, 75.5% copper, and 100%
chromium.
Overall, the findings reported herein support the suitability of
RBF technology for water pretreatment in small rural commu-
nities, particularly in developing countries where more complex
water treatment technologies are typically not affordable.
Further studies are needed to investigate alternate hydro-
geological settings. Even so, this study may help to convince
water managers in emerging economies to seriously consider
RBF technology for producing high quality water at sufficient
quantity from low quality surface water sources.
AcknowledgmentsThe project was supported by a grant from the World Bank,
Development Marketplace Program. The field studies were
supported by students, alumni, and faculty from Bangurnagar
Arts, Science, and Commerce College in Dandeli. The authors
thank local authorities, including the Alur Panchayat, Panchayat
Raj Engineering, Haliyal, and residents of Bada Khanshera,
Halmaddi, Harnouda, Kariyampalli, Kerwad, Mainal, Moulangi,
and Saksali for their cooperation and support.
Submitted for publication October 3, 2012; accepted for
publication October 15, 2013.
ReferencesAlbrechtsen, H. J.; Boe-Hansen, R.; Henze, M.; Mikkelsen, P. S. (1998)
Microbial Growth and Clogging in Sand Column Experiments
Simulating Artificial Recharge of Groundwater. In Artificial
Recharge of Groundwater; Peters, J. H., et al., Eds; Balkema:
Rotterdam, Netherlands; pp 73–77.
Bellamy, W. D.; Hendricks, D. W.; Logsdon, G. S. (1985) Slow Sand
Filtration: Influences of Selected Process Variables. J. Am. Water
Works Assoc., 77 (12), 62–66.
Berger, P. (2002) Removal of Cryptosporidium Using Bank Filtration.
Proceedings of the NATO Advanced Research Workshop on
Riverbank Filtration: Understanding Contaminant Biogeochemistry
and Pathogen Removal, Tihany, Hungary, September 2001; pp 85–
121.
Bharati, S. G.; Krishnamurthy, S. R. (1990) Effect of Industrial Effluents
on River Kali Around Dandeli, Karnataka; Part 1—Physico-
Chemical Complexes. Indian J. Environ. Health, 32, 167–171.
Bharati, S. G.; Krishnamurthy, S. R. (1992) Influence of Heavy Metals on
the Distribution of Algae in the River Kali, Around Dandeli (North
Kanara District) Karnataka State—India: J. Karnataka Univ.–Sci.,
36, 1–12.
Boving, T. B.; Al-Ghazawi, Z.; Saadoun, I.; Schijven, J.; Al-Rashdan, J.;
Shawaqfeh, M.; Blandford, W. (2010) River Bank Filtration for
Protection of Jordanian Surface and Groundwater. Final Report
Prepared for NATO Science for Peace and Security Program (Sfp),
Project Sfp – 981454, Brussels, Belgium.
Boving, T. B.; Choudri, B. S. (2010) Clean Water by Riverbank Filtration;
Final Report Prepared for World Bank, Development Marketplace
Program, DM 2007, Grant No. 2447; Washington, D.C.
Boving, T. B.; Choudri, B. S.; Cady, P.; Davis, A.; Patil, K.; Reddy, V. (2012)
Acceptance of a Riverbank Filtration System in Rural India. J.
Indian Water Works Assoc., Special Issue, December 2012, 33–41.
Boving et al.
646 Water Environment Research, Volume 86, Number 7
Bureau of Indian Standards (BIS) (1992) Indian Standard Specifications
for Drinking Water; BIS-10500; (Reaffirmed 1993); BIS: New Delhi,
India. http://hppcb.gov.in/eiasorang/spec.pdf (accessed June 6,
2013).
Cady, P.; Boving, T.; Choudri, B. S.; Davis, A.; Patil, K.; Reddy, V. (2013)
Attenuation of Bacteria at a Riverbank Filtration Site in Rural India.
Water Environ. Res., 85, 2164–2174.
Chavadi, V. C.; Gokhale, N. W. (1984) Preliminary Investigation on the
Seasonal Variation of Water Quality in the Kali River, Uttara
Kannada District, Karnataka. In Ecodevelopment of Western Ghats;
Kerala Forest Research Institute, Peechi: Karala, India; pp 249–251.
Choudri, B. S.; Boving, T. B. (2010) Riverbank Filtration for Sustainable
Water Supply in Underserved Areas: Field Studies Along the Kali
River in Karnataka, India. Proceedings of the ASCE–EWRI World
Environmental & Water Resources Congress (Groundwater Council),
the 8th Symposium on Groundwater Hydrology, Quality and
Management, Providence, Rhode Island, May 16–20, 2010.
Dash, R. R.; Bhanu Prakash, E. V.; Kumar, P.; Mehrotra, I.; Sandhu, C.;
Grischek, T. (2010) River Bank Filtration in Haridwar, India:
Removal of Turbidity, Organics, and Bacteria. Hydrogeol. J., 18,
973–983.
Dash, R. R.; Mehrotra, I.; Kumar, P.; Grischek, T. (2008) Lake Bank
Filtration at Nainital, India: Water Quality Evaluation. Hydrogeol J.,
16 (6), 1089–1099.
Davis, S.; Thompson, G.; Bentley, H.; Stiles, G. (1980) Ground-Water
Tracers—a Short Review. Ground Water 18 (1), 14–23.
Dillon, P. J.; Miller, M.; Fallowfield, H.; Hutson, J. (2002) The Potential of
River Bank Filtration for Drinking Water Supplies in Relation to
Microcystin Removal in Brackish Aquifers. J Hydrol., 266 (3), 209–
221.
Domenico, P. A.; Mifflin, M. D. (1965) Water from Low-Permeability
Sediments and Land Subsidence.Water Resour. Res., 1 (4), 563–576.
Doussan, C.; Poitevin, G.; Ledoux, E.; Detay, M. (1997) River Bank
Filtration: Modeling of the Changes in Water Chemistry with
Emphasis on Nitrogen Species. J. Contam. Hydrol., 25 (1–2), 129–
156.
Duffield, G. M. (2013) Pumping Tests in Bounded Aquifers. www.
aqtesolv.com/pumping-tests/pumping-tests-in-bounded-aquifers.
htm (accessed July 17, 2013).
Gollnitz, W. D.; Clancy, J. L.; Whitteberry, B. L.; Vogt, J. A. (2003) RBF as
a Microbial Treatment Process. J. Am.Water Works Assoc., 95 (12),
56–66.
Grischek, T.; Schoenheinz, D.; Ray, C. (2002) Siting and Design Issues for
River Bank Filtration Schemes. In Riverbank Filtration: Improving
Source Water Quality; Ray, C., et al., Eds.; Kluwer: Dordrecht,
Netherlands; pp 291–302.
Grischek, T.; Schoenheinz, D.; Syhre, C.; Saupe, K. (2010) Impact of
Decreasing Water Demand on Bank Filtration in Saxony, Germany.
Drinking Water Eng. Sci., 3, 11–20.
Gupta, V.; Johnson,W. P.; Shafieian, P.; Ryu, H.; Alum, A.; Abbaszadegan,
M.; Hubbs, S. A.; Rauch-Williams, T. (2009) Riverbank Filtration:
Comparison of Pilot Scale Transport with Theory. Environ. Sci.
Technol., 43 (3), 669–676.
Havelaar, A. H.; van Olphen, M.; Schijven, J. F. (1995) Removal and
Inactivation of Viruses by Drinking Water Treatment Processes
under Full-Scale Conditions.Water Sci. Technol., 31 (5–6), 55–62.
Hiscock, K. M.; (2005) Hydrogeology—Principles and Practice; Blackwell
Publishing: Malden, Massachusetts.
Hiscock, K. M.; Grischek, T. 2002) Attenuation of Groundwater
Pollution by Bank Filtration. J. Hydrol., 266 (3–4), 139–144.
Hoefs J. (2009) Stable Isotope Geochemistry, 6th ed.; Springer Verlag:
Berlin.
Hooper, R. P.; Christophersen, N.; Peters, N. E. (1990) Modeling
Streamwater Chemistry as a Mixture of Soilwater End-Members—
an Application to the Panola Mountain Catchment, Georgia, U.S.A.
J. Hydrol., 116, 321–343.
Hooper, R. P.; Shoemaker, C. A. (1986) A comparison of Chemical and
Isotopic Hydrogaph Separation.Water Resour. Res., 22, 1444–1454.
Hoppe-Jones, C.; Oldham, G.; Drewes, J. E. (2010) Attenuation of Total
Organic Carbon and Unregulated Trace Organic Chemicals in the
US Riverbank Filtration Systems.Water Res., 44, 4643–4659.
Hubbs, S.; Ray, C.; Mucha, I. (2004) Riverbank Filtration: Effect of
Riverbed Clogging on Water Quality and System Capacity. In
NATO Advanced Research Workshop: Clogging in Riverbank
Filtration, Bratislava, Slovakia Republic, Sept 7–10, 2004. http://
www.soulstatic.com/NATORBF (accessed June 12, 2013).
Kelly, B. P.; Rydlund, P. H. J. (2006) Water-Quality Changes Caused by
Riverbank Filtration Between the Missouri River and Three Pumping
Wells of the Independence, Missouri, Well Field 2003-05; USGS,
Report Scientific Investigations Report 2006–5174; U.S. Geological
Survey: Reston, Virginia; pp 1–48.
Kendall, C.; McDonnell, J. J., Eds. (1998) Isotope Tracers in Catchment
Hydrology; Elsevier BV: Oxford, U.K.
Kennedy, V. C.; Kendall, C.; Zellweger, G. W.; Wyerman, T. A.; Avanzino,
R. J. (1986) Determination of the Components of Stormflow Using
Water Chemistry and Environmental Isotopes, Mattole River Basin,
California. J. Hydrol., 84, 107–140.
Krishnamurthy, S. G.; Bharati, S. G. (1996) Distribution of Lead in the
Surface Waters of the Polluted River Kali Around Dandeli Area,
Karnataka, India. Environ. Ecol., 14, 390–393.
Krishnamurthy, S. R.; Bharati, S. G. (1994) Studies on the Metal Pollution
of the River Kali around Dandeli (North Kanara District),
Karnataka, India. Pollut. Res., 13, 249–252.
Kuhn, W.; Mueller, U. (2000) Riverbank Filtration: An Overview. J. Am.
Water Works Assoc., 92 (12), 60–69.
Kumar, B.; Rai, S. P.; Kumar, U. S.; Verma, S. K.; Garg, P.; Kumar, S. V. V.;
Jaiswal, R.; Purendra, B. K.; Kumar, S. R.; Pande, N. G. (2010)
Isotopic Characteristics of Indian Precipitation.Water Resour. Res.,
46, 1–15.
Kumar, P.; Mehrotra, I. (2009) Riverbank Filtration for Water Supply:
Indian Experience. Proceedings of the 2009 World Environmental
and Water Resources Congress, St. Louis, Missouri, May 17–21,
2009; American Society of Civil Engineers: Reston, Virginia; pp 1–9.
Lilly, A. (2000) the Relationship between Field-Saturated Hydraulic
Conductivity and Soil Structure: Development of Class Pedotransfer
Functions. Soil Use Manage., 16 (1), 56–60.
Lin, A. Y. C.; Debroux, J. F.; Cunningham, J. A.; Reinhard, M. (2003)
Comparison of Rhodamine WT and Bromide in the Determination
of Hydraulic Characteristics of Constructed Wetlands. Ecol. Eng., 20
(1), 75–88.
Manjunatha, B. R, Balakrishna, K.; Shankar, R.; Mahalingam, T. R. (2001)
Geochemistry and Assessment of Metal Pollution in Soils and River
Components of a Monsoon-Dominated Environment Near Karwar,
Southwest Coast of India. Environ. Geol., 40 (11–12), 1462–1470.
Manjunatha, B. R.; Balakrishna, K.; Shankar R.; Sarin M. M. (2001)
Distribution of U–Th Nuclides in the Riverine and Coastal
Environments of the Tropical Southwest Coast of India. J. Environ.
Radioact., 57 (1), 21–33.
Massmann, G.; Tichomirowa, M.; Merz, C.; Pekdeger, A. (2003) Sulfide
Oxidation and Sulfate Reduction in a Shallow Groundwater System
(Oderbruch Aquifer, Germany). J. Hydrol. 278 (1), 231–243.
Miettinen, I. T.; Martikainen, P. J.; Vartiainen, T. (1994) Humus
Transformation at the Bank Filtration Water Plant. Water Sci.
Technol., 30 (10), 179–187.
Panchayat Raj Engineering (PRE) (2006) Water Quality Details of
Observation Dug Well: Well #190304, Dandeli, India.
Radhakrishna, B.; Vaidyanadhan, R. (1997) Geology of Karnataka:
Bangalore. Geol. Soc. India, 353.
Ray, C. (2004) Modeling RBF Efficacy for Mitigating Chemical Shock
Loads. J. Am.Water Works. Assoc., 96 (5), 114–120.
Ray, C., Ed. (2002) Riverbank Filtration: Understanding Contaminant
Biogeochemistry and Pathogen Removal; Kluwer Academic Publish-
ers: Dordrecht, Netherlands.
Boving et al.
July 2014 647

Ray, C.; Schubert, J.; Linsky, R. B.; Melin, G. (2002) Introduction. In
Riverbank Filtration: Improving Source Water Quality; Ray, C.,
Melin, G., Linsky, R.B., Eds.; Kluwer Academic Publishers and
National Water Research Institute: Boston.
Sandhu, C.; Grischek, T.; Kumar, P.; Ray, C. (2011) Potential for
Riverbank Filtration in India. Clean Technol. Environ. Policy, 13
(2), 295–316.
Schijven, J. F.; Hoogenboezem, W.; Hassanizadeh, S. M.; Peters, J. H.
1999) Modeling Removal of Bacteriophages MS2 and PRD1 by
Dune Recharge at Castricum, Netherlands.Water Resour. Res., 35,
1101–1111.
Schijven, J. F.; Hoogenboezem,W.; Nobel, P. J.; Medema, G. J.; Stakelbeek,
A. (1998) Reduction of FRNA Bacteriophage and Faecal Indicator
Bacteria by Dune Infiltration and Estimation of Striking Efficiencies.
Water Sci. Technol., 38 (12), 127–131.
Schmidt, C. K.; Lange, F. T.; Brauch, H.-J.; Kuhn, W. (2003) Experiences
with Riverbank Filtration and Infiltration in Germany; DVGW-
Water Technology Center (TZW): Karlsruhe, Germany. http://www.
tzw.de/pdf/bankfiltration.pdf (accessed Jan 2, 2012).
Schubert, J. (2002) Hydraulic Aspects of Riverbank Filtration-Field
Studies. J. Hydrol., 266 (3), 145–161.
Shestakov, V.; Nevecherya, I. (1998) The Theory and Methods for
Interpreting the Pumping Test Results. Moscow: MGU (in Russian).
Cited in Ping, W.; Shestakov, V. M. (2008) Interpretation of
Groundwater Pumping Testing near Rivers by Means of Numerical
Simulation Methods. Moscow Univ. Geol. Bull., 63 (4), 289–293.
Speth, T.; Merkel, T.; Gusses, A. (2003) Riverbank Filtration as a
Pretreatment for Nanofiltration Membranes. Riverbank Filtration:
Improving Source-Water Quality.Water Sci. Technol. Libr., 43, 261–
265.
Stuyfzand, P. J.; Juhasz-Holterman, M. H. A.; de Lange, W. J. (2004)
Clogging in Riverbank Filtration. In NATO Advanced Research
Workshop: Bratislava, Slovakia Republic, Sept 7–10, 2004. http://
www.soulstatic.com/NATORBF (accessed June 12, 2013).
Subramanian, V.; Biksham, G.; Ramesh, R. (1987) Environmental geology
of peninsular river basins of India. J. Geol. Soc. India, 30, 393–402.
Tufenkji, N.; Ryan, J. N.; Elimelech, M. (2002) Bank Filtration. Environ.
Sci. Technol., 36 (21), 422A–428A.
UNICEF (2012) Progress on Sanitation and Drinking Water: 2012
Update. http://www.unicef.org/media/files/JMPreport2012.pdf (ac-
cessed July 22, 2013).
Wang, J., 2002. Riverbank Filtration Case Study at Louisville, Kentucky.
In Riverbank Filtration: Improving Source Water Quality; Ray, C., et
al., Eds.; Kluwer: Dordrecht, Netherlands; pp 117–146.
Wang, J.; Smith, J.; Dooley, L. (1995) Evaluation of Riverbank Infiltration
as a Process for Removing Particles and DBP Precursors.
Proceedings of the Water Quality Technology Conference, Nov 12–
16, New Orleans; American Water Works Association: Denver,
Colorado.
Water.org Home Page. http://water.org/country/india/ (accessed Jan 2,
2012).
Weiss, W. J.; Bouwer, E. J.; Ball, W. P.; O’Melia, C. R.; Arora, H.; Speth, T.
F. (2002) Reduction in Disinfection Byproduct Precursors and
Pathogens during Riverbank Filtration at Three Midwestern United
States Drinking-Water Utilities. In Riverbank Filtration: Improving
Source Water Quality; Ray, C., et al., Eds,; Kluwer: Dordrecht,
Netherlands; pp 147–174.
Weiss, W. J.; Bouwer, E. J.; Ball, W. P.; O’Melia, C. R.; Arora, H.; Speth, T.
F. (2003) Riverbank Filtration: Fate of DBP Precursors and Selected
Microorganisms. J. Am.Water Works Assoc., 95 (10), 68–81.
Boving et al.
648 Water Environment Research, Volume 86, Number 7