ADSORPTION, FILTRATION, AND REACTION
133
DEVELOPMENT AND APPLICATIONS OF NOVEL NANOSTRUCTURED MATERIALS IN WATER TREATMENT: ADSORPTION, FILTRATION, AND REACTION A Dissertation presented to the Faculty of the Graduate School at the University of Missouri-Columbia In Partial Fulfillment of the Requirements for the Degree Doctor of Philosophy By: Mohammed M. Numaan Dr. Maria M. Fidalgo, Dissertation Supervisor MAY 2021
-
Upload
khangminh22 -
Category
Documents
-
view
2 -
download
0
Transcript of ADSORPTION, FILTRATION, AND REACTION

DEVELOPMENT AND APPLICATIONS OF NOVEL
NANOSTRUCTURED MATERIALS IN WATER
TREATMENT: ADSORPTION, FILTRATION, AND
REACTION
A Dissertation
presented to
the Faculty of the Graduate School
at the University of Missouri-Columbia
In Partial Fulfillment
of the Requirements for the Degree
Doctor of Philosophy
By:
Mohammed M. Numaan
Dr. Maria M. Fidalgo, Dissertation Supervisor
MAY 2021

ii
The undersigned, appointed by the dean of the Graduate School, have examined the
dissertation entitled
DEVELOPMENT AND APPLICATIONS OF NOVEL
NANOSTRUCTURED MATERIALS IN WATER TREATMENT:
ADSORPTION, FILTRATION, AND REACTION
presented by
Mohammed M. Numaan
a candidate for the degree of Doctor of Philosophy in Environmental Engineering and
hereby certify that, in their opinion, it is worthy of acceptance.
_______________________________________________
Dr. Maria M. Fidalgo
_______________________________________________
Dr. Baolin Deng
_______________________________________________
Dr. Inniss Enos
_______________________________________________
Dr. Chung-Ho Lin

DEDICATION
This dissertation is dedicated to my father’s soul, my mother, and my sisters.
For their endless love, support, and encouragement.

ii
ACKNOWLEDGEMENTS
I would like to sincerely thank my advisor, Dr. Fidalgo, for her continuous guidance
and support, and, especially, for her confidence in me throughout this study. I also would
like to express my appreciation and gratitude to all the members in my dissertation
committee, Dr. Baolin Deng, Dr. Enos Innis, and Dr. Chung-Ho Lin, for providing their
knowledge, experience, inspirations and encouragement.
To all my friends, thank you for your understanding and encouragement in my all
moments. Your friendship makes my life a wonderful experience. I cannot list all the names
here, but you are always on my mind.

iii
Table of Contents
ACKNOWLEDGEMENTS .................................................................................. ii
Table of Contents ................................................................................................. iii
Table of Figures .................................................................................................. viii
List of Tables ...................................................................................................... xiv
Abstract ............................................................................................................... xv
Chapter 1: Introduction ......................................................................................... 1
1.1. Background ................................................................................................. 1
1.2. Research Objective ..................................................................................... 3
Chapter 2: Literature review .................................................................................. 5
2.1. Introduction to Nanotechnology ................................................................. 5
2.2. Adsorption Process ..................................................................................... 7
2.2.1. Graphene sheets (GSs) ............................................................................ 8
2.2.2. Nano metals oxides (NMOs) ................................................................ 10
2.3. Membrane Process .................................................................................... 11
2.3.1. Nanocomposite membranes .................................................................. 13
2.3.2. Nanofiber membranes ........................................................................... 13
2.4. Photocatalysis ........................................................................................... 14

iv
2.4.1. Titanium dioxide (TiO2) nanoparticles photocatalyst for advanced
oxidation technology: .................................................................................... 15
2.5. Arsenic (As); characteristics and occurrences in aqueous solutions ........ 17
2.6. Sulfamethazine (SMZ) .............................................................................. 20
Chapter 3: Synthesis of Iron Oxide/Graphene Oxide Composite Materials as
Adsorbents for As(V) Removal. ..................................................................... 23
3.1. Introduction ............................................................................................... 23
3.2. Methods and Materials .............................................................................. 24
3.2.1. Materials ............................................................................................... 24
3.2.2. Lepidocrocite synthesis ......................................................................... 25
3.2.3. Graphene Oxide (GO) Synthesis .......................................................... 25
3.2.4. Composite Material Production ............................................................ 26
3.2.5. Characterization of IOGOx nanocomposites ........................................ 27
3.2.6. Arsenic Adsorption ............................................................................... 27
3.3. Results and discussion .............................................................................. 29
3.3.1. Characterization of iron oxide (IO), graphene oxide (GO), and IOGO(x)
composite materials. ...................................................................................... 29
3.3.1.1. Zeta potential .................................................................................... 29
3.3.1.2. X-ray diffraction (XRD) ................................................................... 32
3.3.1.3. Scanning Electron Microscopy (SEM) images ................................. 33

v
3.3.1.4. Surface area ....................................................................................... 35
3.3.1.5. TGA .................................................................................................. 37
3.4. Arsenic Adsorption on IOGO(x) .............................................................. 39
3.4.1. Adsorption isotherms ............................................................................ 39
3.4.2. Adsorption kinetics of As(V) on the composite materials .................... 42
3.5. Adsorption mechanism of As(V) on IOGO composite adsorbent ............ 44
3.6. Conclusions ............................................................................................... 45
Chapter 4: Asymmetric Tubular Membranes coated by Multi-layers of
TiO2/Polyaniline ............................................................................................. 47
4.1. Introduction ............................................................................................... 47
4.2. Experimental ............................................................................................. 48
4.2.1. Materials ............................................................................................... 48
4.2.2. Preparation and coating of tubular microfiltration ceramic membrane 49
4.2.3. Experimental system setup ................................................................... 50
4.2.4. Structural characteristics of Membrane ................................................ 51
4.2.5. Permeation experiments ........................................................................ 51
4.2.5.1. Clean Water Flux (CWF) and Membrane Permeability (Pm) .......... 51
4.2.5.2. PEG vs. TOC Calibration curve........................................................ 52
4.2.5.3. Membrane fouling ............................................................................. 52
4.2.5.4. Analysis of rejection ......................................................................... 53

vi
4.3. Results and Discussion ............................................................................. 53
4.3.1. Membranes characterizations................................................................ 53
4.3.2. Permeability .......................................................................................... 56
4.3.3. Fouling analysis .................................................................................... 58
4.3.4. Rejection Analysis ................................................................................ 61
4.4. Conclusion ................................................................................................ 64
Chapter 5: Enhanced Degradation of Sulfamethazine by using Advance
Oxidation Processes (AOPs) Combined with Membrane Filtration. ............ 66
5.1. Introduction ............................................................................................... 66
5.2. Materials and methods .............................................................................. 69
5.2.1. Chemicals .............................................................................................. 69
5.2.2. Instruments ............................................................................................ 69
5.2.3. Membrane fabrication ........................................................................... 69
5.2.4. Experimental set-up. ............................................................................. 70
5.3. Filtration/Reaction experiments: ............................................................... 71
5.3.1. Preparation of SMZ standard curve ...................................................... 71
5.4. Results and discussion .............................................................................. 73
5.4.1. Effect of pH on SMZ removal .............................................................. 73
5.4.2. Effect of SMZ concentration ................................................................ 77
5.4.3. Effect of HA presence on SMZ degradation......................................... 79

vii
5.4.4. Effect of ionic strength on the SMZ degradation.................................. 82
5.5. Conclusion ................................................................................................ 88
Chapter 6: Conclusion and Future work .............................................................. 89
6.1. Conclusion. ............................................................................................... 89
6.2. Future work ............................................................................................... 90
6.2.1. Investigating the performance of the coated tubular ceramic membranes
by multilayers of TiO2 for removal a group of antibiotics contaminants. ...... 91
6.2.2. Degradation Mechanisms Analysis of Photocatalytic .......................... 91
6.2.3. Flow rates of inflow and retentate ........................................................ 91
6.2.4. Time of illumination by UV-light ......................................................... 91
7. Reference: ...................................................................................................... 92
VITA ................................................................................................................. 115

viii
Table of Figures
Figure Page
2.1. Schematic of nanotechnology used in wastewater
treatment …………………………………………………
6
2.2. Schematic structure of graphene oxide . ………………... 9
2.3. Schematic of membrane filtration ………………………. 12
2.4. Pollutant degradation after irradiation TiO2 particle by
UV-light ..………………………………………………...
14
2.5. Removal pollutants by TiO2 particle surfaces …………... 16
2.6. Eh-pH diagram for aqueous As species in the system As-
O2-H2O at 25°C and 1bar total pressure …………………
18
2.7. Distribution of arsenate and arsenite as a function of pH .. 19
2.8. Chemical structure of sulfamethazine…………………… 20
2.9. Distribution of cationic (SMZ+), neutral and zwitterionic
(SMZ0), and anionic (SMZ−) species in aqueous solution
as a function of pH ………………………………………..
21
3.1. Schematic of the synthesis process of IOGO composites ... 27
3.2. Zeta potentials of lepidocrocite and GO before sintering
and IO and IOGOx composites after sintering, suspended
in ultrapure water at different values of pH ………………
30
3.3. Point of zero charges of hematite and IOGOx composites.. 32

ix
3.4. XRD-diagrams for the studied adsorbents (a) before and
(b) after sintering …………………………………………
33
3.5. SEM images for: (a)IOGO5; (c)IOGO10; (e)IOGO15;
(g)IOGO20; (i)IOGO25 before sintering, and (b)IOGO5;
(d)IOGO10; (f)IOGO15; (h)IOGO20; (j)IOGO25 after
sintering ………………………………………………….
34
3.6. The relationship between percentage of total pores and
pore size for: (a)IOGO5; (b)IOGO10; (c)IOGO15;
(e)IOGO20; (d)IOGO25 composites ……………………..
36
3.7. Surface area and total pore volume of fabricated
composites after sintering, as a function of graphene
content …………………………………………………...
37
3.8. TGA curves Lepidocrocite, IOGOx, and GO in the air
atmosphere ……………………………………………….
38
3.9. As(V) adsorption isotherms at pH 7 and IS (1mM) of the
hematite control sample and IOGO(x) composites ……….
41
3.10. As(V) adsorption kinetic curves of (a) hematite control
sample and (b-f) IOGO(5-25) composite materials,
respectively ………………………………………………
43
4.1. The dimensions of the used membrane (a) the length (b)
the cross-section .………..……………………………….
49
4.2. Schematic of the experimental setup and the membrane
module .…………………………………………………..
51

x
4.3. SEM images for the membranes surfaces of (a) uncoated
and (b) 1-layer of TiO2 (c) 2-layers (d) 3-layers
(e) 4-layers ……………………………………………....
54
4.4. SEM images for the membranes cross-sections of
(a) uncoated (b) 1-layer of TiO2, and (c) 2-layers
(d) 3-layers (e) 4-layers …………………………………..
55
4.5. The relationship between flux and the number of coating
layers ………………………………………...…………...
56
4.6. The relationship between permeability and the number of
coating layers ………………………………….…………
57
4.7. TMP evolution vs time using (a) PEG (MW 20 kDa)
(b) PEG (MW 200 kDa) …………………………………
60
4.8. Comparison between the TMP of all the used membranes
before and after using …………………………………….
61
4.9. Rejection evolution vs time using PEG (MW 20,000 Da)
at a constant flux 33 ml/min ……………………………...
62
4.10. Rejection evolution vs time using PEG (MW 200,000 Da)
at a constant flux 33 ml/min ……………………………...
63
5.1. Tubular ceramic supports: (a) side view (b) cross-sectional
view ……………………………………………………...
70
5.2. Schematic of experimental setup for integrated direct
contact membrane filtration–UV photolysis treatment …..
71

xi
5.3. Influence of pH on the removal of SMZ, 5ppm initial
[SMZ] in the absence of UV light: (a) permeate (b) feed ...
74
5.4. Percentage removal (C/Co) vs time in the absence of UV
light (5ppm initial [SMZ]): (a) permeate (b) feed ………..
74
5.5. Influence of pH on the removal of SMZ, 10 ppm initial
[SMZ] in the absence of UV light: (a) permeate (b) feed ...
74
5.6. Percentage removal (C/Co) vs time in the absence of UV
light (10 ppm initial [SMZ]): (a) permeate (b) feed ………
75
5.7. Influence of pH on the removal of SMZ, 5ppm initial
[SMZ] under UV light: (a) permeate (b) feed …………….
77
5.8. Percentage removal (C/Co) vs time in the absence of UV
light (5 ppm initial [SMZ]): (a) permeate (b) feed ……….
77
5.9. Influence of the pH on the removal of SMZ, 5ppm and
10ppm initial [SMZ] under of UV light: (a) permeate
(b) feed …………………………………………………...
78
5.10. Percentage removal (C/Co) vs time in the absence of UV
light (5 ppm and 10 ppm initial [SMZ]): (a) permeate
(b) feed …………………………………………………...
79
5.11. Influence of pH on the removal of SMZ, 1ppm HA and
5ppm [SMZ] in the absence of UV light (a) permeate
(b) feed …………………………………………………..
79
5.12. Percentage removal (C/Co) vs time in the absence of UV
light (1ppm HA and 5ppm [SMZ]) (a) permeate (b) feed…
80

xii
5.13. The influence of the pHs solution on 1ppm HA and 5ppm
[SMZ] vs time under of UV light (a) permeate (b) feed …..
80
5.14. The normalized 1ppm HA and 5ppm [SMZ] plotted vs
time under of UV light (a) permeate (b) feed……………..
81
5.15. The influence of different levels of NaNO3 1,10,100 mM
and NaCl¯ 10 mM on an initial 5ppm [SMZ] solution at
pH5 vs time at the absence of UV light (a) permeate (b)
feed………………………………………………………..
82
5.16. Percentage removal (C/Co) vs time in the absence of UV
light (different levels of NaNO3 1,10,100 mM and
NaCl¯ 10 mM on an initial 5ppm [SMZ] solution at pH5).
(a) permeate (b) feed ……………………………………..
83
5.17. The influence of NaNO3 1,10,100mM on an initial 5ppm
[SMZ] solution at pH5 vs time under of UV-light
(a) permeate (b) feed ……………………………………..
84
5.18. The normalized of NaNO3 1,10,100mM on an initial 5ppm
[SMZ] solution at pH5 vs time under of UV-light (a)
permeate (b) feed.………………………………………...
84
5.19. Normalized pressure-time profiles vs time at absence of
UV light (a) 5ppm [SMZ] (b) 10ppm [SMZ] (c) 1ppm HA
and 5ppm [SMZ] (d) 1,10,100 mM NaNO3 at pH5 (e) 10
ppm [NaCl−] and 5ppm [SMZ] at pH5 ……………………
86

xiii
5.20. Normalized pressure-time profiles vs time under UV light
(a) 5ppm [SMZ] (b) 10ppm [SMZ] (c) 1ppm HA and 5ppm
[SMZ] (d) 1,10,100 mM NaNO3 at pH5 (e) 10 ppm
[NaCl−] and 5ppm [SMZ] at pH5 ………………………...
87

xiv
List of Tables
Table Page
2.1. Physical properties of arsenic …………………………… 17
2.2. Physicochemical characteristics of SMZ ………………... 21
3.1. The surface area of graphene oxide, hematite,
lepidocrocite, and IOGOx composites before and after
sintering .…………………………………………………
35
3.2. The initial concentrations of As(V) in adsorption isotherm
experiments ………………………………………………
39
3.3. Comparison of maximum As(V) adsorption capacity …… 40
3.4. Summary of model parameters and correlation
coefficients for Langmuir and Freundlich isotherms
removal of As(v) by hematite and IOGOx ……………….
42
3.5. Adsorption capacity normalized by specific surface area .. 42
3.6. Fitting parameters of As(v) adsorption kinetics on
IOGO(x) and hematite ……………………………………
45
4.1. Shows the flux decreasing ratios of all membranes ……… 58
5.1. Uses and disadvantages of some water and wastewater
technologies ……………………………………………...
67
5.2. The gradient conditions for HPLC method ………………
72

xv
Abstract
Nanomaterial-based adsorbents and photocatalysts have gained increasing attention
in the applications of water and wastewaters treatment due to their attractive properties and
strong adsorption capabilities for a wide range of contaminants. The objective of this study
is to fabricate, characterize, and apply a group of nanomaterials to adsorb, remove, and
degrade contaminants in water. An iron oxide/graphene oxide (IOGOx) composite was
evaluated for the effective As(V) removal from the aqueous solutions. Adsorption on
hematite and IOGO(25%) at 25°C, pH 7, and 1 mM NaNO3 showed 76% of As(V) removal
within the first 5 minutes and 95% at 40 minutes. As(V) adsorption efficiency increased
with increase GO loading; while, this efficiency decreased at high IO loading. Kinetic data
was a well fitted to pseudo-second-order, so those results suggested that the surface
complexation is the main mechanism for As(V) adsorption on the surface of adsorbents.
All composites were able to reduce the As(V) concentration below 10 μgL-1 that is the
recommended maximum permissible concentration of As(V) in drinking water by World
Health Organization (WHO).
A novel technique for coating a group of tubular ceramic membranes by multi-
layers of TiO2 was used to reduce the pore size of the support membranes and to improve
their performances. Polyethylene glycol was used as a model molecule to compare and
examine the coated membranes in the evolution of fouling and rejection over time. The
SEM images showed that TiO2 covered the surface and the active layer; therefore, the
permeable path sizes decreased gradually. The results of flux and permeability of
membranes confirmed the success of the coating. The transmembrane pressure (TMP)

xvi
increased with each coating layer, while the rejection of the membrane was improved. After
cleaning the membranes with ultrapure water, TMP of all the membranes decreased until
reaching to the clean material values. In this study, 4-layers coated membrane showed its
ability to be used many times after cleaning with ultrapure water.
The coated membranes were tested for a novel technique that combines filtration
and advanced oxidation processes for sulfamethazine (SMZ) removal and degradation
using a continues flow reactor and under different conditions. The system included a a
membrane module with UV-light. In the absence of UV-light, the results showed no
significant removal of 5 ppm and 10 ppm of SMZ during the experiment. Under UV-light,
the system was able to significantly degrade 5 ppm and 10 ppm of SMZ from the solution,
particularly, at pH 2. In the presence of humic acid (HA), there was a significant increase
in the SMZ degradation with all pH values by decreasing the required time to degrade SMZ
in clean water. When NO3− or Cl− ions were added, an increase in the degradation rate of
SMZ was observed in the presence of NO3− in comparison with clean water, but Cl− led to
a decrease in the SMZ degradation under UV light. The process could be applied for SMZ
removal from the water in water treatment plants.

1
Chapter 1: Introduction
1.1. Background
Water is considered an abundant natural resource either as groundwater, deep and
shallow, or as surface water, lakes, rivers, oceans, etc. Moreover, water is one of the most
important and integral aspects of daily life for every human being, such as clothing, food,
etc. On the other hand, the population around the world is expected to reach approximately
9.7 billion by 2050 and 11.2 billion by 2100; therefore, the water scarcity will become a
critical for environmental agencies and governments in the next few decades [1].
Because of the enormous growth of the human population nowadays, the demands
for vital resources has been increasing day by day. have been increasing day by day. This
increasing demand will threaten the availability and quality of water resources by
discharging a wide range of toxic contaminants into surrounding environments. Among all
the activities that have attracted the attention of environmental experts is industrialization.
Most of the industrial wastewater includes toxic and exotic pollutants to the environment,
such as dyes, pharmaceutical wastes, etc. [2]. As a result, those hazardous contaminants
will accumulate with time on the sediments in water bodies or stay dissolved. Therefore,
they will threaten human health by the direct contact between them and human bodies by
drinking polluted water, swimming, etc.[3]. The World Health Organization (WHO)
recently announced that one person out of three people around the world does not have
access to safe drinking water [4], and 10-20 million people were every year estimated to
die due to waterborne diseases [5]. As a result, the demand for supplying clean water has

2
become an urgent necessity around the world. Thus, strict environmental laws had been
issued to enforce the industries to achieve the allowable concentrations of pollutants for
discharging by using efficient treatment technologies [6].
To achieve this goal, many water and wastewater treatment technologies have been
used to overcome the levels of the harmful contaminants in wastewater effluent, such as
antibiotics, heavy metal ions, pesticides, etc. Most of the recent traditional water and
wastewater technologies need to develop to be economical, effective, and more stable for
this purpose [7]. Therefore, all the environmental researchers nowadays have been
modifying or developing some materials and methods to be cost-effective, efficient, and
reliable to achieve significant results for producing safe drinking water and reusing the
wastewater.
One of these techniques is conventional technologies such as bio-reduction,
chemical precipitation, and sorption, which are widely used to remove the heavy metals
from groundwater [8]. However, those methods have several drawbacks and
disadvantages, such as adding reagents requirements, producing high quantities of toxic
sludge, and achieving low sorption capacity. As a result, Therefore, those disadvantages
will result in secondary contamination and require unusual conditions, such as anaerobic
and carbonate-free [9]. On the other hand, physicochemical treatment processes such as
coagulation and flocculation are considered ineffective in removing the endocrine-
disrupting chemicals (EDCs) and pharmaceutical compounds [10].
Nowadays, scientists around the world are interested in and adapting the advanced
nanotechnologies more than the traditional methods because they provide a chance to
develop and invent economically feasible and environmentally stable treatment

3
technologies. Because of their unique properties such as fast diffusion, high reactivity, high
specific surface area, and strong sorption, nano-metal oxides (NMOs) such as iron oxide,
graphene oxide, titanium dioxide, etc. have been recently used to develop novel materials
for water and wastewater treatment processes such as adsorption materials, membranes,
nano-catalysts, etc. [11].
1.2. Research Objective
The overall objective of this work is to apply for advances in nanotechnology and
nanoparticle manipulation to fabricate better porous and high surface area materials for
water treatment. The research effort is focused on inorganic (metal oxide) nanoparticles to
create adsorbents, filters, and catalysts. For example, an iron oxide/graphene oxide
composite material was created with different weight ratios of iron oxide (IO) and graphene
oxide (GO). Those composites will be used as adsorbents for As(V) removal.
Subsequently, a novel nano-coating method was used to obtain titanium dioxide
(TiO2)/polyaniline asymmetric ceramic membranes: the rejection characteristics of the
membrane's layers were investigated as well as its application as a catalyst for the
degradation of organic compounds.
This document includes five chapters; chapter two presents a comprehensive
literature review about nanotechnology and its uses. Then, a general introduction about
their types and their recent applications in water and wastewater treatment processes, such
as adsorption, membrane, and photocatalysis treatment technologies.
Chapter three describes the synthesis of iron oxide/graphene oxide (IOGO)
composite materials, using different GO content (5, 10, 15, 20, 25 wt%). The surface area,
surface charge, surface morphology characteristics of the composite adsorbents were

4
studied to explore their morphological structure and to interpret the adsorption mechanism
for adsorbing arsenic(V) and removing it from the aqueous solution. In this objective, novel
hematite nanoparticles will be fabricated through using eco-friendly rout and applied to
assess for As(V) removal.
In chapter four, a group of tubular ceramic membranes was coated by multi-layers
of TiO2/Polyaniline by the sol-gel method. Their permeability was studied by calculating
the means of permeation experiments at a constant inflow of 33 ml/min and outflow 22.5
ml/min. Fouling and rejection experiments were also carried out to investigate the
membrane antifouling by using different molecular weight (20 and 200 kDa) of
polyethylene glycol (PEG) as a model. This chapter shows a novel method to coat the
tubular membrane by multiple layers of TiO2 to assess this approach for decreasing the
fouling and rejection by using different molecular weights of PEG as a feed solution.
Finally, chapter five presents the development of an advanced oxidation process
(AOP) coupled with a membrane technology to apply it for sulfamethazine (SMZ)
degradation. A LED UV strip was used to achieve this task and fixed inside a tubular
membrane reactor, used in chapter four, on a distance. This research will assess the
efficiency of the coated tubular membrane by TiO2/PANI for sulfamethazine degradation.

5
Chapter 2: Literature review
2.1.Introduction to Nanotechnology
In ancient times, the history of civilizations have always been named depending on
the kinds of materials used during the age such as, Bronze Age, Iron Age, Stone Age, etc.
while the current age is the age of Nanomaterials [12]. The nano-dimensions materials were
first invented by Nario Tanisguchi in 1974 when he described the instrument with a
tolerance of less than a micron [13]. Recently, nanotechnology played a key role in
addressing the fundamental issues of energy, health, and water [14], but the most emphasis
has been currently placed on the remediation and treatment of water and wastewater [15].
Nanotechnology has been developed by scientific researchers for providing a way
to create new structures that work at an atomic level [16]. This technology aims to use
nanosized particles (1-100 nm) and their unique characteristics in numerous applications,
such as engineering, medicine, and sciences [17]. Nanotechnologies have shown incredible
potential due to their unique properties for wastewater remediation [18]. Nanotechnologies
include wide ranges of nanomaterials such as colloids, films, nanotubes, particles, etc. At
this scale, the materials show different physical, chemical, and biological characteristics
comparing with their bulky counterparts [19]. Because of their high ratios of surface area
to volume, nanomaterials have been used as excellent adsorbents for removal various kinds
of contaminants. Also, the high ratios of surface area to volume enable catalyzation of the
surfaces of nanomaterials to degrade, oxidize, and reduce the pollutants. As a result, the
large surface to volume ratio is considered the most significant feature that makes

6
nanomaterials suitable for applicaton in water and wastewater treatment i.e., adsorption,
membrane, photocatalysis processes, as shown in figure 2.1. [20]. Thus, nanostructures
have completely different electrical, magnetic, and optical properties, greater reactivity
with contaminants faster chemical processes [21]. All these characteristics of
nanomaterials make nanotechnology attractive in terms of eliminating pollutants and
contaminants and making it as a proper technology for water and wastewater treatment
[22].
Nanotechnological water and wastewater treatment processes can be classified to
three major groups (a) pollution prevention (b) sensing and detection (c) treatment and
remediation [23]. The benefits of using nanotechnology has been observed in
environmental and industrial area, but this technology might be useful in future by bringing
helpful innovations to solve specific issues [24]. Therefore, the multiple benefits of large
infrastructure of nanotechnology have made nanotechnology more reliable for solving the
emerging issues in the world [20].
[25].
Figure 2. 1. Schematic of nanotechnology used wastewater treatment

7
2.2.Adsorption Process
In both natural aquatic and engineered systems, adsorption plays a critical role in
transport and fate the contaminants. Also, adsorption is responsible for accumulating the
contaminants in the silt which settles down in a river delta, in soil, or in the sludge of a
treatment plant, instead of remaining in the aqueous solution that passes through such
systems. Adsorption often reduces the high concentrations of dissolved contaminants to
significant low levels by providing cost effective means [26].
Adsorption process is known as the ability of substances, either solid or liquid, to
absorb the ions and the molecules of contaminants, either as gaseous or dissolved, on their
surfaces. The solid or liquid substances on which adsorption occurs are called “adsorbent”.
While the ions and molecules of gas or liquid which are adsorbed on the surface of the
adsorbent are called “adsorbate” [11]. There are two broad classifications of adsorption
depending on the nature of forces that exists between adsorbate and adsorbent molecules;
Chemical adsorption (chemisorption) and physical adsorption (physisorption). Chemical
adsorption: It happens when the attraction forces between the adsorbed molecules and the
active sites of adsorbents have same strength as chemical bonds. As a result, the desorption
process will be not easy because of the strong attraction forces [27]. Therefore,
chemisorption is used primarily to estimate quantitatively the number of active sites that
contribute in promoting (catalyze) chemical reaction [28].
Physical adsorption happens when the attraction forces between the adsorbate and
adsorbent are Vander Waal’s forces or long range of electrostatic interactions. This kind of
adsorption is usually weak; therefore, its desorption will be easy by changing the ionic
system, decreasing the pressure, and heating. The adsorption process range depends on

8
factors such as activation of the adsorbents and experimental conditions, such as ionic
strength of the solution, pressure, temperature, etc. [9].
The adsorption process is considered one of the most popular and broadly utilized
techniques for inorganic and organic contaminants removal from water and wastewater
[29]. Using adsorption technology has many advantages, such as economically viable,
simplicity of operation, and neutrality to toxic pollutants and harmful compounds [30][31].
Nowadays, the researchers have been trying to discover and develop reliable adsorbents
that can be extensively applied in the commercialized and industries. Some of these
adsorbents such as alumina silicates [32], clay [33], zeolites [34], graphene oxide (GO)
[35], iron oxide (IO), etc. are well known for targeting the heavy metals removal [36]. All
these adsorbents are porous inorganic or organic materials, and they have a high affinity to
adsorb the heavy metals on their surface [28][29]. To enhance their performances in the
adsorbing of heavy metals, NMOs will be functionalized by other promising materials such
as GO.
2.2.1. Graphene sheets (GSs)
In the past few years, Graphene oxide (GO) and reduced graphene oxide (rGO),
oxidized forms of graphene, have risen as one of the popular materials studied because of
their unique characteristics. Those characteristics are higher adsorption capacity, larger
surface area, various synthesis methods, abundant oxygen-containing functional groups
(i.e., carboxyl groups, epoxy groups, and hydroxyl groups), as shown in Figure 2.2, [37].
Therefore, those forms have been attracting significant attention from the researchers to
use them for adsorption applications.

9
GO is defined as one layer of sp2 allotropic carbon atoms, which arrange in a two-
dimensional hexagonal honeycomb lattice structure [38]. GO is known for its highly
oxygenated monolayer graphite oxide because of the exfoliation and oxidation processes
of graphene [39]. Therefore, GO and rGO nanoparticles render reactive sites and provide
a negatively charged surface to graft other functional groups to improve the capacity of
adsorption and to increase the surface area [40]. However, GO and rGO nanoparticles
usually tend to agglomerate because of their robust Van der Waals interactions and
hydrophilic surface, which leads to lower adsorption capacity and reduce surface area [41].
To overcome this deficiency, many researchers have been investigating some
nanocomposites by combining GO or rGO with magnetic metal oxides [36], metal-organic
frameworks [42][43][44], polymers [45]. As a result, GO and rGO will be as excellent
candidates for loading nanomagnetic particles such as iron oxides nanoparticles. This
process will combine the high sorption capacity of GO and rGO and the separation
convenience of magnetic materials [46].
GO sheets have been extensively used since it was used for the first time in 2004
as an adsorbent [47] for the removal of antibiotics [48], organic pollutants [49], oil [50],
Figure 2. 2. Schematic structure of graphene oxide [24].

10
pesticide [51], pharmaceuticals [52], heavy metals [53], etc. Particularly, GO has gotten
much attention for heavy metal adsorption due to its proper characteristics mentioned
previously.
2.2.2. Nano metals oxides (NMOs)
NMOs have shown impressive potential as a low-cost, environmentally friendly,
and sustainable in water and wastewater treatment technology. Moreover, NMOs have
significant characteristics, such as its easy reusability, high specific surface area, short
intraparticle diffusion distance, small size of their particles that ranged between 1 to 100
nm [54], and significant sites for adsorption [55]. Furthermore, NMOs can be reused and
regenerated easily through changing pH solution. Because of all these characteristics,
NMOs have been used widely in adsorption technology as adsorbents for contaminates
removal such as heavy metals from water and wastewater [56]. The mechanism of
adsorption is mainly carried out by the complexation between molecules of oxygen in metal
oxide groups and dissolved metals. Therefore, the efficient adsorption of heavy metals on
the outer surfaces of NMOs is activated along the walls by limiting the rate of diffusion
[57].
A wide range of metal oxides such as alumina, iron, titanium, zirconium, etc., have
enormous potential in water and wastewater treatment as an environmentally friendly, low
cost, and sustainable technology. As well as having all of these properties, some kinds of
NMOs (e.g., nanomaghemite and nanomagnetite) are superparamagnetic that are easy to
be removed and separated from the solution by applying a low magnetic field [25].
Therefore, they can be employed as an adsorptive media for filters and slurry reactors [19].

11
Iron materials, hydroxide and oxide, have been studied and used for many years in
water and wastewater treatment technologies. Scientific and engineering researchers have
been interested in using the unique physical and chemical properties of nanoparticles.
Recently, scientific researches have shown that iron oxide nanoparticles enhance abilities
to adsorb metals from aqueous solutions in comparison with conventional adsorbents of
iron oxides [58][9]. Adsorption of (Cd(II), Cu(II), Pb(II), Zn(II)) metal ions and heavy
metals (As(III) and As(V) onto iron oxide such as hematite was examined as a function of
adsorbent concentration, exhaustion, pH, and temperature [59]. Hematite nanoparticles
showed capability to adsorb metal oxide ions with adsorption increasing when the
concentration of nanoparticles increase.
Ghosh et al. [60] synthesized Goethite (-FeOOH) nanoparticles by using
hydrazine sulfate as a modifying agent for removal As(V) from solution. They achieved
adsorption capacity 76 mg g-1 at pH 3. Park et al. [61] prepared maghemite (-Fe2O3)
nanoparticles to remediate As(V) from solution, and it achieved adsorption capacity was
2.9 mg g-1 in the pH range 2-9. Their adsorbent was appropriate for remediating As(V) to
the recommended concentration by the World Health Organization (WHO). Kalhori et al.
[62] synthesized superparamagnetic permanently confined micelle array (Mag-PCMAs)
nanoparticle as adsorbents for removal metronidazole antibiotic at different values of pH
3-11. The study shows that the adsorption capacity was 84.55 mg g-1.
2.3.Membrane Process
In membrane technology, porous materials play an essential role in capturing and
trapping pollutants. The membranes will allow one component to transport through them
more than others, depending on the physical and chemical properties of the membrane and

12
the permeate components [63][64]. Recently, the membranes have numerous forms with
various pore sizes involving microfiltration, nanofiltration, reverse osmosis, and
ultrafiltration. All these forms depend on their materials which would be clean out through
each process, as shown in Figure 2.3. [65].
Nowadays, the membrane technology has been facing many challenges in water
purification, such as exchange link between permeability and selectivity in addition to low
resistance to fouling. Therefore, the recent novel researches have been focusing on
improving flux efficiency and selectivity by developing antifouling layers to overcome
these challenges [11]. Nanotechnology have offered recently growing new generation of
membranes for water purification [66].
Recently, different manufacturing techniques have been used for membranes
fabrication such as aerosol deposition, dip coating, film casting, ion exchange, layer-by-
layer deposition, spray coating, surface adsorption, etc. [67]. These techniques depend on
the membranes’ materials more than the pore size of the membrane itself.
Figure 2. 3. Schematic of membrane filtration [57].

13
2.3.1. Nanocomposite membranes
Nanocomposite membranes are considered as a new group of filtration materials
which includes a mixed matrix of nanofillers embedded either by inorganic oxide matrix
or polymeric. In most cases, nanofillers are characterized by their high ratio of surface area
to mass and surface-functionalized [68]. Using NMOs such as Al2O3, Fe3O4, SiO2, TiO2,
ZnO help to develop some of the characteristics of membranes like mechanical and thermal
stabilities in addition to permeate flux of polymeric membranes. For instance, Ping and
Guohua [69] designed a compact electro-microfiltration to treat humid acid (HA) by using
a moditf67fied Ti4O7/Al2O3 tubular membrane. They achieved the removal of 91-96.5%
HA and 86.7-88.3% TOC.
2.3.2. Nanofiber membranes
One of the techniques used to produces fibers is called nanofiber, which used in
filtration and separation processes. This technique draws very fine special materials such
as ceramics or polymers by using an electric field [11]. Nanofiber technique has many
benefits, such as ensuring a high specific surface area to mass ratio. Also, it will increase
the capacity to be tailored to details like interconnected open pore structure and membrane
thickness [70]. Suriyaraj et al. [71] synthesized crystalline TiO2 nanoparticles using
Bacillus licheniformis bacteria modified it by using Al2O3 precursor to fabricate
TiO2/Al2O3 nanocomposite. This nanocomposite was carried out using electro-spun
thermoplastic polyurethane (TPU) nanofibers. This study showed the size and diameter of
the nanocomposite and nanofiber particles were 506 nm and 23933 nm, respectively.
Moreover, the nanofibrous membrane was tested for fluoride removal from the solution,
and it achieved an adsorption capacity of 1.9 mg/g.

14
2.4. Photocatalysis
Photocatalysis, known as advanced oxidation processes (AOPs), is a treatment
technique that used to degrade organic contaminants in water and wastewater such as
estrogens, crude oil, dyes, inorganic molecules (NOx), pesticides, etc. by using UV-light
[72]. The main principles of this method lie in generating highly reactive species such as
OHº, O2, O3 to degrade the organics into biodegradable compounds and convert them
finally to CO2 and water. NMOs semiconductors have obtained significant attention by the
experts in the field of developing wastewater treatment techniques because of the excellent
properties of their bandgap, which upon irradiation of UV-light produces electron-hole
(e−/h+) pairs for waste degradation [73]. On the other hand, the size and geometry of NMOs
semiconductors such as TiO2 and ZnO play an important role in their (e−/h+) dynamics,
solid-phase transformation, and sorption. For instance, the efficiency of TiO2 will be low
when the recombination process of e− and h+ is fast; therefore, this recombination can be
lowered by decreasing the size of TiO2 particles, which leads to improving interfacial
charge carrier transfer [74]. Figure 2.4 shows the oxidative, and reductive reactions
occurred on the surface of TiO2.
Figure 2. 4. Pollutant degradation after irradiation TiO2 particle by UV-light.

15
TiO2 is widely used as a photocatalyst because of its significant properties, such as
cost efficiency, high availability, and low toxicity. Recently, many researchers around the
world have been investigating the combination between the catalytic and separation
processes through using the ceramic membrane filtration and photocatalysis together to
purify the water with keeping the particles of catalytic [75]. Most of the nanofiltration
processes that use highly efficient nanoparticles must be applied to a proper filtration
system to reject the harmful nanoparticles completely. Therefore, it is necessary to use
extensive and costly installation technologies, including high-pressure pumps [11].
2.4.1. Titanium dioxide (TiO2) nanoparticles photocatalyst for advanced oxidation
technology:
Titanium dioxide (TiO2) nanoparticles have been studied enormously because of
their unique characteristics, such as high specific surface area, abundant, non-toxicity, wide
bandgap semiconductors, and high chemical and thermal stability [76]. Therefore,
Titanium dioxide has broad applications with different fields, such as environmental
cleaning, and photocatalysis. To apply the photocatalysts for water treatment, the following
needs to be achieved; the process has to be fulfilled at room temperature, mineralization
has to be completed without producing by products, low costs for operations and repetitious
cycles. Titanium dioxide (TiO2) photocatalysis is considered as a photo-induced charge
separation phenomenon which happens on the surface of TiO2. Also, TiO2 has a high
reactive oxygen species which can cause organic mineralization without producing by
products. The decomposition reaction, mostly oxidative reaction, depends on the
photocatalyst’s valence band to degrade the contaminants in the water. Thus, the oxidative
reaction will improve when the photocatalyst’s valence band holes has higher oxidative
16
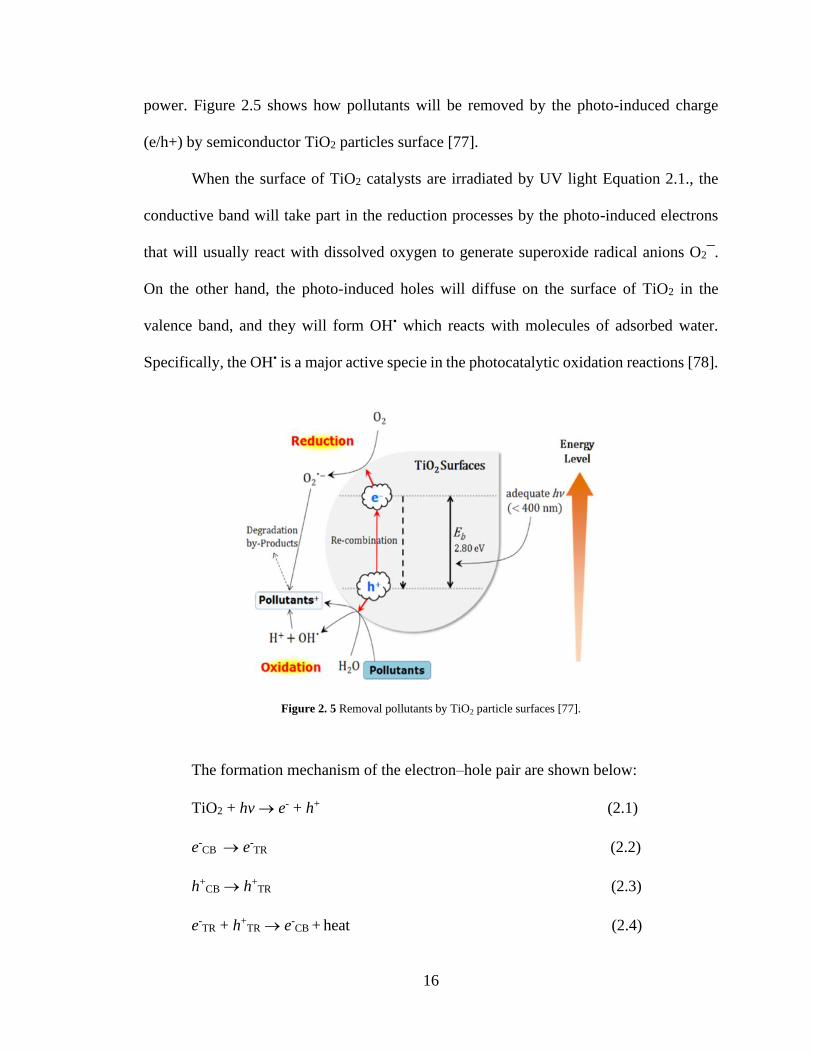
power. Figure 2.5 shows how pollutants will be removed by the photo-induced charge
(e/h+) by semiconductor TiO2 particles surface [77].
When the surface of TiO2 catalysts are irradiated by UV light Equation 2.1., the
conductive band will take part in the reduction processes by the photo-induced electrons
that will usually react with dissolved oxygen to generate superoxide radical anions O2¯.
On the other hand, the photo-induced holes will diffuse on the surface of TiO2 in the
valence band, and they will form OH• which reacts with molecules of adsorbed water.
Specifically, the OH• is a major active specie in the photocatalytic oxidation reactions [78].
Figure 2. 5 Removal pollutants by TiO2 particle surfaces [77].
The formation mechanism of the electron–hole pair are shown below:
TiO2 + hv → e- + h+ (2.1)
e-CB → e-
TR (2.2)
h+CB → h+
TR (2.3)
e-TR + h+
TR → e-CB + heat (2.4)

17
(O2)adsorbed + e- → O2•¯ (2.5)
OH- + h+ → OH• (2.6)
R-H + OH• → R+• → Intermediate(s)/final degradation products (2.7)
O2•¯ + OH• → HOO• (2.8)
HOO• + e- → HO2- (2.9)
HO2- + H+ → H2O2 (2.10)
Where:
e-TR : the surface trapped VB electron.
h+TR : the surface trapped CB hole.
2.5. Arsenic (As); characteristics and occurrences in aqueous solutions
Arsenic (As), often referred to as the king of poisons [79], is a common trace
element in the earth’s crust and widely spread in all the environments. Elemental Arsenic
is metallic gray or yellow in color, not soluble in water, and very brittle, and arsenic
structure is a semi-metallic crystalline. Arsenic oxidizes on heating to arsenous oxide, and
its smell in air as a garlic [80]. Arsenic physical properties are illustrated in Table 2.1.
Table 2.1. Physical properties of arsenic [81].
Atomic symbol As
Classification Metalloid
Color Gray
Crystal structure Rhombohedral
Density @ 293 K 5.72 g/cm3
Atomic mass 74.9216
Atomic number 33
Electronic configuration [As]4s23d104p3
Oxidation states 5, 3, 0, -3
Atomic radius 125 pm
Melting point ~817°C
Boiling point 603°C (sublimation)

18
There are many applications that arsenic is used in such as bronzing, making
agricultural insecticides and pesticides, etc. [82]. Arsenic has two forms; organic and
inorganic. Organic arsenic compounds includes many forms such as arseno-sugars,
dimethyl arsenic acid (DMAA), and monomethyl arsenic acid (MMAA). On the other
hand, inorganic form, known as high toxicity, exists in four main oxidation states, and the
most common are As(III) and As(V).
The oxidation states of arsenic in the hydrosphere depend on different
environmental factors such as pH conditions, ionic distribution states, reduction-oxidation
reactions, general hydrochemistry, microbial activity [83]. On the other hand, the
concentration of arsenic species depends mainly on pH and redox potential (Eh) [82]. The
distribution of arsenic species as a function of pH and redox potential (Eh) are depicted in
Figures 2.6 and 2.7, respectively [84].
Figure 2.6. Eh-pH diagram for aqueous As speciesin the system As-O2-H2O at 25°C and 1bar total pressure [85].

19
Arsenite As(III) is a dominant form under reducing conditions, as shown in Figures
2.6 and 2.7. while arsenate As(V) is generally more stable form thermodynamically in well
oxygenated environments. Arsenate (H2AsO4-) is the major species at pKa equal to 6.9,
and HAsO42- is dominant species at higher pH. However, these species of As will appear
when the values of pH range between 6 to 8. When pH is equal to 9.3 the species of As(III)
will be the dominant as an arsenious acid (H3AsO3).
Figure 2.7. Distribution of arsenate and arsenite as a function of pH [81].
Every day, a lot of people around the world such as Bangladesh, Ghana, India,
USA, etc., have been drinking contaminated water by arsenic; therefore, they are exposed
to it [86]. As a result, it is important to study the occurrence, toxicity, and mobility of
arsenic to develop and improve the treatment technologies for arsenic removal from
drinking water and wastewater. There are more than 320 minerals containing arsenic in
their structures such as arsenopyrite (FeAsS), orpiment (As2S3), realgar (As2S2), etc. [87].
Some of these minerals can be found in nature as sedimentary or volcanic rocks
because of adsorbing As by Fe(III) and Mn(IV) after weathering sulfide minerals [88].
These minerals are also produced by discharging the effluents of some industrial activities

20
such as agricultural chemicals, pharmaceuticals, applications in mining, etc. [89]. In the
United States, some of the states are depending on the groundwater as a source for drinking
water, so those states have been suffering from the high As concentrations (50 μg/L) [90].
Some environmental and health agencies, such as United States Environment Protection
Agency (EPA) and World Health Organization (WHO), established a standard for the
allowable recommended 10μg/L as a maximum As concentration allowable in drinking
water. Therefore, the world have adapted this standard to protect the consumers from the
chronic exposure to As in drinking water for the long-term [91].
2.6.Sulfamethazine (SMZ)
To protect animals’ health prophylactically and treat their diseases, veterinary
antibiotics (VPs) have been universally. For instance, in the united states alone there are
around 7.5-8.6 billion chickens, 104-110 million cattle, 275-292 million turkeys, and 60-
92 million swine which are fed with food containing varieties of veterinary
pharmaceuticals [92]. Sulfamethazine (SMZ), as a typical sulfonamide-class antibiotic, is
a one kind of antibiotics that are known as Pharmaceutical and Personal Care Products
(PPCPs), shown in Figure 2.8. SMZ is used in human and veterinary drugs as antibacterial
medicines and growth promoters [93].
Figure 2.8. Chemical structure of sulfamethazine [93].

21
SMZ enters in the aqueous environment by some predominant pathways. SMZ
exists in three different forms: cationic, neutral, and anionic, depending on pH values, as
shown in Figure 2.9 and Table 2.2.
Fig. 2. 9 Distribution of cationic (SMZ+), neutral and zwitterionic (SMZ0), and anionic (SMZ−) species in aqueous
solution as a function of pH [93].
Table 2. 2 Physicochemical characteristics of SMZ [93].
Molecular Formula: C12H14N4O2S
Molecular weight (MW) 278.33
Log Kow 0.89
Solubility 1500 mg/L
pKa1 2.65 ± 0.2
pKa2 7.42 ± 0.2
Those form are adsorbed by the bodies of animals by food that is excreted from
organism with the feces or urine. In many countries, those antibiotics are widely applied
to economic values, harmless property, and the land for toxic-free, and they could be
abundantly discharged from animals bodies as a waste [94]. Moreover, antibiotics have
few pathways for entering human body, including dairy and meat products derived from
dairy cattle and beef lactating being feed with food containing antibiotics.
As a result, SMZ has received a great concern by environmental scientists because
of its potential effects on the normal ecosystems functionalities [95]. Because of its ability

22
to treat a wide range of bacteria and its low cost, SMZ is commonly used to treat infections
by microbes [96]. On the other hand, SMZ can form antibiotic resistance bacteria at low
concentration ( 1ppm) [97] which make the conventional biological treatment processes
unable to remove it effectively because of their toxic nature and persistence [98].
Therefore, develop alternative treatment processes became necessary to deal with and
degrade these bio-recalcitrant contaminants effectively.
Therefore, SMZ has become a global contaminant because it is difficult removed
effectively by conventional water and wastewater treatment processes. There are many
technologies used to remove SMZ such as adsorption [99], membrane filtration [100], and
advanced oxidation processes [101].

23
Chapter 3: Synthesis of Iron Oxide/Graphene Oxide
Composite Materials as Adsorbents for As(V) Removal.
3.1. Introduction
Arsenic, with two inorganic forms; arsenite As(III) and arsenate As(V), exhibits
both acute and carcinogenic toxicity. It can be found in nature as part of geological
formations and volcanic deposits, etc. or due to anthropogenic activities such the
application of herbicides and pesticides in agriculture, or industry, such as electronic
components, pharmaceuticals, pigments, landfills, and mining wastes [102][103]. Because
of its high toxicity and analytical and removal difficulties [104], both the US
Environmental Protection Agency (EPA) and European Union adopted 0.010 mg/L as
maximum the allowable concentration of As in drinking water, in agreement with World
Health Organization (WHO) guidelines. WHO defined this concentration as analytical
achievability and treatment performance [105].
Nowadays, many technologies such as biological remediation,
coagulation/filtration, ion exchange, adsorption, membrane, and reverse osmosis have been
used to eliminate arsenic from water and wastewater [106][107]. Among those
technologies, adsorption is generally considered the most efficient and economical option,
especially at low concentrations [3][4]. A wide range of adsorbents are available for arsenic
removal: for example, activated carbon, metal oxides, and natural minerals [104]. Recently,
graphene oxide (GO) has received significant attention for adsorption processes because
of relevant properties such as a high surface area to mass ratio, good dispersion in water,
and abundant surface functional groups [110]. On the other hand, GO sheets suffer from

24
some challenges respecting with its application in water treatment. For instance,
interactions among adjacent sheets of GO may lead to agglomeration and loss the
promising high surface area, so the expected adsorption capacity will be limited [111].
Moreover, GO sheets need extra steps for separation them from the water after treatment
processes. To achieve those goals, GO sheets have been recently used to fabricate various
kinds of composite materials that would facilitate dispersion and stability [9][10]. One of
the materials that is loaded to GO is iron oxide which have been used in water treatment
by taking advantage of their magnetic property to assist in the separation processes between
the treated water and adsorbents. Iron with its varied forms; oxides, oxyhydroxides, and
hydroxides [3][9], has been extensively studied because of its attractive capacity
performance for arsenic adsorption, large abundance, low toxicity, and low cost [7][10].
Therefore, this work proposed fabricating iron/GO composites to be used as arsenic
adsorbents from the solution. The composites were fabricated at different iron oxide (IO)
to GO weight ratios. Subsequently, their compositional, structural, and textural properties
were characterized. Finally, the ability of all composites to adsorb As(V) from the solution
was investigated.
3.2. Methods and Materials
3.2.1. Materials
All the reagents used were of analytical grade. Graphite nanoplatelet (5um, xGnP
graphite nanoplatelet XG Sciences), sodium nitrate NaNO3 (Sigma-Aldrich, St. Louis, MO,
USA), sulfuric acid H2SO4 98% (w/w) (Fisher Scientific, Pittsburgh, PA, USA), hydrogen
peroxide 30% (w/w) in H2O (Fisher Scientific, Pittsburgh, PA, USA), potassium
permanganate KMnO4 (Flinn Scientific, Batavia, IL, USA), sodium hydroxide pellets 99%,

25
(ACROS Organics, Flinn Scientific, Batavia, IL, USA), sodium arsenate ≥98% (Sigma-
Aldrich, St. Louis, MO, USA) were purchased and used as received without any additional
purification. Ultrapure water was used in all experiments from Type I (18MΩ*cm) and
obtained from a Barnstead E-pure ultrapure Water Purification System (Thermo Scientific,
Waltham, MA, USA).
3.2.2. Lepidocrocite synthesis
Lepidocrocite was synthesized from industrial grade FeCl2 (28- 32% w/w; PPE
Argentina S.A., Buenos Aires, Argentina). Briefly, lepidocrocite γ-FeO(OH) was prepared
by oxidizing FeCl2 under controlled pH (6.7-6.8) [116]. A 0.2 M solution of iron (II)
chloride tetrahydrate (FeCl2 • 4H2O) was prepared in ultrapure water. During this reaction,
a diffuser was installed to provide air for the reaction. The pH was monitored and controlled
by adding 1 M solution of NaOH as needed to maintain the pH value between 6.7 and 6.8.
Agitation and aeration were kept for 3 hours, leading to an orange precipitate. Later, the
suspension was centrifuged at 3,500 rpm for 8 minutes, and the supernatant was discarded.
This step was repeated three times to remove the remaining NaCl. Finally, the produced
precipitate was dried in a crystallization dish at 50°C [9,10].
3.2.3. Graphene Oxide (GO) Synthesis
Graphene oxide was synthesized by a modified Hummer’s method from graphite
nanoplatelets [118]. In brief, 1 g of graphite and 1 g of NaNO3 were mixed in an ice-bath
followed by the addition of 46 ml of 98% (w/w) H2SO4. Then, 6 g of KMnO4 was carefully
added to the mixture. After stirring for 1 h at 35 ºC, 80 mL of ultrapure water (18mΩ*cm)
was added, and the temperature increased to 90 ºC for 30 min. Then, 200 ml of ultrapure

26
water and 6 ml of 30% (w/w) H2O2 were added to the reaction and stirred for 10 minutes
to eliminate the excess of KMnO4. Then, the product was washed several times by
centrifuged at 3,500 rpm (Eppendorf Centrifuge, model 5810 R, Hamburg, Germany) for
8 minutes. The supernatant was discarded, and the centrifuge tube was filled with ultrapure
water in each cycle until the pH of liquid equal to 5.
3.2.4. Composite Material Production
Five different composite materials with a content of 5, 10, 15, 20, and 25% w/w of
GO were fabricated by a co-precipitation method. The materials were designated IOGOx,
where x is the % weight of GO added in the precipitation step. The general procedure for
composite material fabrication is illustrated in Figure 3.1. For example, to prepare IOGO5,
237.5 mg of lepidocrocite and 12.5 mg of graphene oxide were weighted. Then, they were
suspended separately in ultrapure water using ultrasonication (Branson 2510 Sonicator, 42
kHz, Danbury, CT, USA) for 1 hr.
Both solutions were adjusted their pH to be equal to 4 by adding 1M solutions of
NaOH or H2SO4 and leaving for 6 hours to aggregate and settle together with checking the
solution pH. The sludge produced was dried in an oven at 80 °C and then sintered in a
furnace (Vulcan 3-550, Neytech, USA) with the following program: 1) the temperature
was raised to 100 °C at a constant rate of 1°C/min and held for 2 hours. 2) the temperature
was raised to 280 °C at a constant rate of 1°C/min and held for 3 hours. 3) finally, the
temperature was raised to 410 °C at a constant rate of 1°C/min and held for 4 hours.
IOGO10, IOGO15, IOGO20, and IOGO25 were fabricated, following the same procedure,
but a different starting mass of each component.

27
3.2.5. Characterization of IOGOx nanocomposites
The crystalline structure of lepidocrocite, GO, and all composites were
characterized by X-ray powder diffraction (XRD) using a Rigaku Ultima IV X-ray
diffractometer (Japan) using Cu Kα radiation (tension = 40 kV, current = 20 mA). Scanning
Electron Microscopy (SEM) (Quanta 650 FEG—FEI, USA) was used to investigate the
surface morphology of the fabricated composites before and after sintering, and their
elemental composition. Zeta potential was measured by a Zetasizer Nano ZS (ZEN3600-
Malvern, UK). Specific surface area and total pore volume were measured by the
Braunauer-Emmett-Teller (BET) method, using nitrogen adsorption at 77K (Coulter
SA3100-Beckman Coulter, USA). Thermogravimetric analysis (TGA) was conducted in a
Q500-TA instrument in an air atmosphere.
3.2.6. Arsenic Adsorption
Batch adsorption experiments were carried out to study the adsorption process of
IOGO5, IOGO10, IOGO15, IOGO20, IOGO25, and hematite (IO) as control. A 10 ppm
As(V) stock solution, 1mM ionic strength (NaNO3) and pH 7, was used to prepare working
solutions of variable As(V) concentrations between 0.5 ppm and 10 ppm. Then, 50 ml of
Figure 3. 1 Schematic of the synthesis process of IOGO composites.

28
each solution was poured into a 125 mL flask, and 20 mg of each adsorbent was added.
The flasks were sealed and shaken at 200 rev/min at room temperature (23 °C) for 48 hours.
Then, samples were taken from the solutions in each flask and filtered with a syringe filter
(0.22 µm PES, Bonna-Agela Tech. Inc., CA, USA) to separate the suspended adsorbent.
After that, residual concentrations of As(V) were measured by Atomic Absorption
Spectroscopy (BUCK Scientific, Model 210 VGP, with graphite furnace, at wavelength
193.7 nm, Lamp current 7 mA, slit width 0.7 nm, detection limits 200 ppb). All samples
were measured three times. Finally, the amount of As(V) adsorbed to the solid q (mg/g)
was calculated by Equation 3.1:
qt = (C0 – Ct)*V/W (3.1)
where C0 and Ct are the concentrations of As(V) at time 0 and t, respectively.
Whereas, w is the weight of added adsorbent, and V is the solution volume.
The adsorption isotherms were fitted using two models; Langmuir and Freundlich
isotherm models. The Langmuir model is presented in Equation 3.2.
qe = (a*b*Ce)/(1 + b*Ce) (3.2)
where qe is the amount of As(V) adsorbed per unit weight of adsorbent, a is the
maximum adsorption capacity, b is a constant, and Ce is the equilibrium liquid
concentration of As(V). The Freundlich isotherm model is represented in Equation 3.3
[119].
qe = K(Ce)1/n (3.3)
where K is the Freundlich constant, and 1/n is the adsorption intensity.

29
The adsorption kinetic of IO as a control sample, IOGO5, IOGO10, IOGO15,
IOGO20, and IOGO25, was investigated by following a similar approach used with
isotherm experiments. The initial As(V) concentration was 0.5 ppm, and the samples were
taken at time 0, 5, 10, 20, 40, and 60 min, filtered and analyzed.
Two models were used to fit the kinetic adsorption data of As(V): pseudo first-
order and pseudo second-order reactions, shown in Equations (3.4) and (3.5).
Ln(qe – qt) = Ln(qe) – (k1 * t) (3.4)
(t/qt) = (k2 * qe2)-1 + (t/qe) (3.5)
where qe and qt are the solid concentration at equilibrium and time t, respectively,
k1 is the first-order rate constant, and k2 is the second-order rate constant.
3.3.Results and discussion
3.3.1. Characterization of iron oxide (IO), graphene oxide (GO), and IOGO(x)
composite materials.
3.3.1.1.Zeta potential
Lepidocrocite and GO zeta potential was investigated in a pH range from 2.2 to 9.8.
The zeta potential values of both materials provide an indicator for the nature of surface
charge existing on the surface of both particles. At pH 4, lepidocrocite and graphene oxide
had zeta potential values with a similar magnitude but opposite signs, which suggests
attractive electrostatic forces may induce the formation of homogeneously mixed
composite materials.The zeta potential of lepidocrocite varied between 46.7 mV at pH 4.5

30
to -22.3 mV at pH 9.1, as shown in Figure 3.2, and its point of zero charge (PZC) was
determined to be 8.5.
The values of GO zeta potential were between -22.4 mV at pH 2.2 and -54.1 mV at
pH 9.3. All the values of GO zeta potential sheets recorded were negative, indicating the
presence of deprotonated surface groups, mostly hydroxyl and carboxyl groups, at the pH
range studied [120]. In summary, lepidocrocite particles showed strongly positive charged
at pH below 8.5, while the graphene oxide nanoparticles maintained its negative surface
charge at all the measured values of pH.
Electrostatic attraction plays a major role in the heteroaggregation of the two
particles. Lepidocrocite and graphene oxide showed negatively charged at pH > 9;
therefore, no aggregation was expected under this condition due to the electrostatic
repulsive forces. At pH 4, both materials showed an opposite surface charge which is a
Figure 3. 2 Zeta potentials of lepidocrocite and GO before sintering and IO and IOGOx composites after
sintering, suspended in ultrapure water at different values of pH.

31
good condition for the mixture of lepidocrocite and GO to produce the new composites.
Those differences in the values of zeta potential lead to an increase in the electrostatic
attraction between them.
With increasing the weight ratios of GO, the zeta potential of all composite
materials showed decreasing in their values and became close gradually to the values of
GO zeta potential. Those results reveal that weight ratios of GO added to lepidocrocite has
a significant effect through observing the continuous changes in the surface charges of all
composites progressively. In this context, the zeta potential values of all sintered
composites decreased with continuous increase of GO weight ratios leading to shift the
PZC of IOGO5-25 to be (6.9, 6.5, 6.2, 5.6, 4.8), respectively. All their surface charges are
positive at pH < PZC. As(V) is present under most of the pH conditions as a negative ionic
form (H2AsO4- at pH 2.2-6.5, and HAsO4
-2 at 6.5-11.5) [85]. The strong adsorption between
IOGOx and As(V) species will be at pH lower than PZC because of the electrostatic
interactions that happened between negatively charged As(V) species and positively
charged IOGOx. On the other hand, when the pH of the solution is greater than PZC of
IOGOx, the surface charge of all composites will be negatively charged, which leads to an
increase in the repulsion between IOGOx and As(V). As a result, the adsorption capacity
will decrease continuously for As(V).
PZC of all sintered composites showed decreasing values with decreasing IO
content, as presented in Figure 3.3. The obtained results revealed that the different weight
ratios of GO added to lepidocrocite have a significant effect on shifting PZC’s values of
the composites to be more acidic pHs because of the contribution of the negative charges
of surface functional groups.

32
Figure 3. 3 Point of zero charges of hematite and IOGOx composites.
3.3.1.2.X-ray diffraction (XRD)
The crystallinity and composition of the IOGOx before and after sintering were
studied by XRD. The X-ray diffraction patterns are presented in Figure 3.4 (a and b). All
diffractograms before sintering showed peaks attributable to lepidocrocite and to GO. A
strong peak of GO appeared at 2ϴ=11 as a result of the interlayer spacing among the
sheets of graphene oxide that contains functional groups on both sides [120]. This peak
was not present in the IOGOx diffractograms, which suggests that the lepidocrocite
produced the complete exfoliation of graphene sheets and promoted the stability of
individual sheets [113]. Also, a weak peak was observed at 43 due to the graphite powder
[24,25]. On the other hand, peaks associated with lepidocrocite were observed at 2ϴ=14,
27, 36, and 47, in agreement with the previous published results [117]. After sintering
at 410 C, the peak of GO shifted from 2ϴ=12 to 2ϴ=23 and 42 due to reducing the
oxygen functional groups [123].

33
Figure 3. 4 XRD-diagrams for the studied adsorbents (a) before and (b) after sintering.
Many distributed peaks appeared at 2ϴ=24.2, 33.2, 35.7, 40.8, 49.2, 54.1,
62.6, and 64.2 which all belong to hematite. Those peaks confirm that lepidocrocite was
converted to hematite due to the thermal conversion process at 410 C [124].
3.3.1.3.Scanning Electron Microscopy (SEM) images
SEM images of IOGOx composites before and after sintering are shown in Figure
3.5. The SEM images of all composites before sintering showed irregular surface
morphology with several wrinkles on their surfaces [125]. On the other hand, the SEM
images of IOGOx show that iron oxide was covered the GO sheets completely and
b a

34
irregularly. While after the thermal treatment, the SEM images of IOGOx surfaces confirm
that the GO sheets were reduced, and the iron oxide particles grew on their surfaces
uniformly. Therefore, it is expected that the number of active sites to adsorb As(V)
increased.
Figure 3. 5 SEM images for: (a)IOGO5; (c)IOGO10; (e)IOGO15; (g)IOGO20; (i)IOGO25 before sintering,
and (b)IOGO5; (d)IOGO10; (f)IOGO15; (h)IOGO20; (j)IOGO25 after sintering.

35
3.3.1.4.Surface area
The specific surface area of the IO, GO, and IOGOx composites before and after
sintering were measured. The GO added to the iron oxide led to an increase in the surface
area values of all composites before sintering concerning the control sample, lepidocrocite,
as mentioned in Table 3.1. A probable reason for this increase is that the GO sheets
attracted the lepidocrocite particles to settle down on their surface. As a result, iron oxide
particles will distribute uniformly on the GO surface. However, the surface area of
composites showed a slight decrease with increasing the weight ratio of GO. This decrease
may be interpreted that the single sheets of GO may form in the form of stacks, which
reduces the total available area to interact with the iron oxide.
Table 3. 1 The surface area of graphene oxide, hematite, lepidocrocite, and IOGOx composites before and after
sintering.
After sintering, the IO surface area showed decreasing in its value because of the
densification caused by the thermal treatment [117][126]. The surface area of IOGOx after
sintering at 410 ºC additionally decreased because of the reduction of GO by iron oxide
particles, which enhanced the contact between the surface of GO with air for combustion
[104].
Lepidocrocite
(m2/g)
Hematite
(m2/g)
Graphene
oxide
(m2/g)
IOGOx Composites (m2/g)
5% 10% 15% 20% 25%
Before
sintering 77.8±0.7 --- 135.2±0.8 96.9±0.5 95.1±0.4 94.5±0.4 90.3±0.3 87.2±0.5
After
sintering --- 30.4±0.4 --- 72.9±0.3 71.1±0.2 67.1±0.1 65.3±0.1 61.9±0.2

36
Figure 3. 6 The relationship between percentage of total pores and pore size for: (a)IOGO5; (b)IOGO10; (c)IOGO15;
(e)IOGO20; (d)IOGO25 composites.
The relationship between the percentage of pore volume and the pore size is
depicted in Figure 3.6. The results showed that the sintering process led to a slight increase
in the percentage of mesopore volume (pores 50 nm) in all composites resulting from
aggregation/packing of the crystalline of hematite nanoparticles [104]. Figure 3.7 shows
clearly that the surface area and the total pore volume of composite materials decreased

37
together after sintering because of burning GO that led to blocking the pores in composite
materials.
Figure 3. 7 Surface area and total pore volume of fabricated composites after sintering, as a function of graphene
content.
3.3.1.5.TGA
The TGA curves for lepidocrocite, GO, and IOGOx samples are shown in Figure
3.8. The mass loss for the GO particles happened in two stages: first, the loss of 40% of
GO mass occurred between 25 and 230 °C, due to the evaporation of adsorbed water on
the surface and some labile oxygen functional groups [127]. Second, 55% of the remaining
mass was lost between 230 and 550 °C, as a result of the combustion of GO framework
and the decomposition of more stable oxygen functionalities [18,19]. After 550 °C, the
mass loss of GO became negligible.
The TGA curve of iron oxide shows three stages of mass loss; first, lepidocrocite
lost 2.5% of its weight within 25 °C to 100 °C corresponding to the adsorbed water
molecules on its surface. In the second stage, between 200 °C and 275 °C, the iron oxide
lost 7% of its weight, which belongs to the evaporation of molecules of water in the
Graphene content

38
structure of lepidocrocite, and conversion from hydroxide to oxide [109]. During this step,
the lepidocrocite was transformed into maghemite (γ-Fe2O3). Finally, the weight loss in the
third stage, between 300 °C and 800 °C, was negligible, and the maghemite was
transformed to hematite (α-Fe2O3) in this step [130].
Figure 3. 8 TGA curves Lepidocrocite, IOGOx, and GO in the air atmosphere.
Three steps can be observed for weight loss of the composite materials. The first
occurred within 25 °C and 100 °C because of evaporating the adsorbed water molecules.
The second step happened between 200 °C and 280 °C because of decomposition of oxygen
that exists in functional groups of graphene. The last weight loss occurs between 300 °C
and 380 °C, and it may be related to the decomposition of the carbon skeleton of the
composite materials [21][22]. With increasing content of iron oxide, the temperature of
weight loss gradually decreased from 380 °C with IOGO25 to 350 °C with IOGO20 to 320
°C with IOGO15 to 270 °C IOGO10, and to 250 °C IOGO5. Those results could be
interpreted that the existence of iron oxide particles on the surface of GO acts as a catalyst

39
for the carbon combustion since their exothermic oxidation takes place at lower
temperatures [133].
3.4. Arsenic Adsorption on IOGO(x)
3.4.1. Adsorption isotherms
The performance of hematite and IOGOx as adsorbent of As(V) was systematically
examined in batch reactors at room temperature (23 ºC). The initial concentrations of As(V)
in the adsorption experiments of hematite and IOGOx were varied, and the mass of
adsorbent added was kept constant at 0.2 grams. The experimental conditions tested are
summarized in Table 3.2.
Table 3. 2 The initial concentrations of As(V) in adsorption isotherm experiments.
All experiments were conducted at pH 7. For each composite material, experiments
were conducted with increasing initial concentrations of As(V) until no changes in the final
(equilibrium) solid concentration (qe) between two experiments was observed, i.e., the
solid reached saturation.
The results showed that hematite had the lowest adsorption capacity of the materials
tested, with a qmax of 12.6 mg g-1. At the same time, IOGO25 recorded the highest
adsorption capacity, at 40.3 mg g-1, as shown in Figure 8. Isotherm curves of hematite,
IOGO5, and IOGO10 reached a plateau sooner, i.e., at lower initial As(V) concentrations
Adsorbents Initial As(V) concentrations (ppm)
Hematite
IOGO5
IOGO10
0.5, 1, 2, 3, 5, 6, 8, 10
IOGO15 0.5, 1, 2, 3, 5, 6, 8, 10, 15
IOGO20 0.5, 1, 2, 3, 5, 6, 8, 10, 15, 20, 25
IOGO25

40
than other adsorbents, as shown in Figure 3.9. Therefore, experiments with a higher initial
concentration of As(V) were conducted with the remaining adsorbents to investigate their
saturation. The results showed adsorption capacity of IOGO15, IOGO20, and IOGO25
were 21.11 mg g-1, 38.4 mg g-1, and 40.3 mg g-1, respectively, and they reached an apparent
plateau. Table 3.3. presents a comparison among As(V) adsorption capacities with some
studied that used various adsorbents as nanoparticles or composite materials by using IO,
GO, rGO.
The addition of GO to the iron oxide led to gradual improvements in the As(V)
adsorption capacity of the composite material, as shown in Figure 3.9. This increment
could be interpreted as an enhancing effect of the GO sheets, which led to a uniform
distribution of iron oxide particles on their surface and therefore develop and enhanced
accessibility to the adsorption sites.
Table 3. 3 Comparison of maximum As(V) adsorption capacity.
Adsorbent
Surface
area (m2
g-1)
Adsorbents weight
(mg)/ volume of
solution (ml)
Initial
As(V)
(ppm)
qmax (mg g-1)
for As(V) Ref.
-Fe2O3–Fe3O4–
GO composite
70.2 9/50 1-30 54.18 [134]
Iron-doped
activated micro/
nanocarbon
particles
231 100/20 0.5-20 5 [135]
-Fe2O3
nanoparticles
162 80/100 100 47 [136]
-Fe2O3
nanoparticles
168.73 0.005,7,10,20 0.095 95.37 [137]
-Fe2O3–GO
composite 341 0.1-1 350-1200 113 [104]
This is further facilitated by the increase in the ratio of mesoporosity to
microporosity after sintering, which means As(V) ions will reach the active sites faster.

41
This study showed the efficacy of the adsorption treatment because hematite and all
composites were able to reduce the concentration of As(V) from 0.5 mg/L to below 10
µg/L which is the recommended maximum permissible concentration of arsenic in drinking
water by World Health Organization (WHO) [105].
Langmuir and Freundlich adsorption isotherm models were applied to interpret the
experimental isotherm data. Table 3.4 shows the calculated parameters and correlation
coefficients (R2) for the two isotherm models. Although both models presented acceptable
R2 values, the results showed that Langmuir isotherm model was overall a better fit with
isotherm data of hematite and IOGO5, IOGO10, IOGO15, IOGO20, IOGO25, and their
correlation coefficients (R2) were above 0.9, which means the adsorption of As(V) on these
materials can be well described by the Langmuir expression [24].
Figure 3. 9 As(V) adsorption isotherms at pH 7 and IS (1mM) of the hematite control sample and IOGO(x)
composites.

42
Table 3. 4 Summary of model parameters and correlation coefficients for Langmuir and Freundlich isotherms removal
of As(v) by hematite and IOGOx.
Table 3.5 shows the adsorption capacity normalized by the surface area of hematite
and the composite adsorbents. As(V) adsorption capacity of all composites increased with
GO wt %, which suggests an enhancement of the surface area utilization, as the presence
of the graphene sheets may facilitate the access to the active sites of the iron oxide particles.
Table 3. 5 Adsorption capacity normalized by specific surface area.
3.4.2. Adsorption kinetics of As(V) on the composite materials
The adsorption kinetic curves of hematite and IOGOx adsorbents at the initial
As(V) concentration of 0.5 ppm are shown in Figure 3.10a-f. The adsorption process can
be divided into two distinct stages depending on the values of As(V) uptake rate. The first
stage showed that a fast adsorption rate on hematite 1.9 mg As(V)/L.hr and IOGO5 2.3 mg
As(V)/L.hr, respectively, happened within the first 10 minutes of adsorption kinetic
experiment. The second stage started at 10 mins until 40 min., and the uptake rates of As(V)
Adsorbents
Langmuir model Freundlich model
R2 b
(L/mg)
qmax
(mg g-1) kf n R2
Hematite (IO) 0.99 4.9 12.6 9.4 1.7 0.94
IOGO5 0.99 5.6 14.5 11.0 1.8 0.97
IOGO10 0.98 5.1 16.3 11.7 1.9 0.94
IOGO15 0.98 2.1 19.3 14.3 2.8 0.97
IOGO20 0.90 0.7 38.4 17.9 3.9 0.78
IOGO25 0.93 1.1 40.3 20.4 4.3 0.83
After sintering
Hematite IOGO Composites
5 10 15 20 25
Adsorption Capacity (mg/g)
----------------------------
Surface area (m2/g) 0.41±0.01 0.2±0.01 0.23±0.01 0.29±0.01 0.59±0.01 0.65±0.01
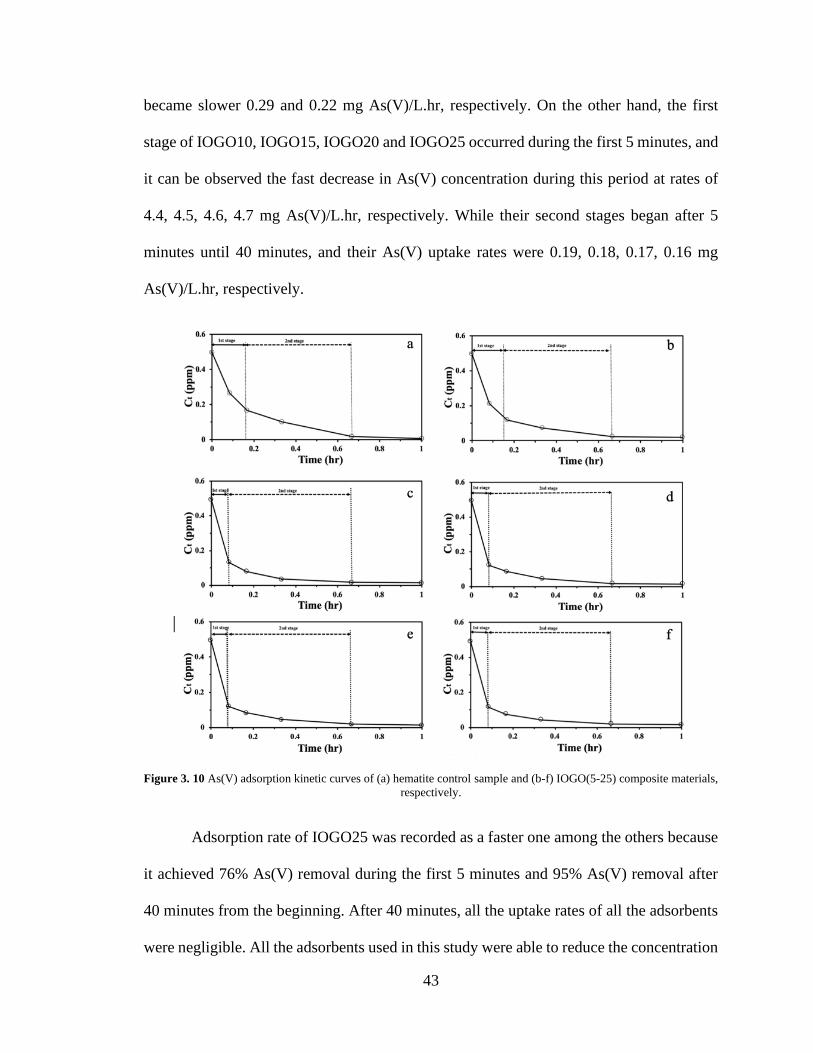
43
became slower 0.29 and 0.22 mg As(V)/L.hr, respectively. On the other hand, the first
stage of IOGO10, IOGO15, IOGO20 and IOGO25 occurred during the first 5 minutes, and
it can be observed the fast decrease in As(V) concentration during this period at rates of
4.4, 4.5, 4.6, 4.7 mg As(V)/L.hr, respectively. While their second stages began after 5
minutes until 40 minutes, and their As(V) uptake rates were 0.19, 0.18, 0.17, 0.16 mg
As(V)/L.hr, respectively.
Figure 3. 10 As(V) adsorption kinetic curves of (a) hematite control sample and (b-f) IOGO(5-25) composite materials,
respectively.
Adsorption rate of IOGO25 was recorded as a faster one among the others because
it achieved 76% As(V) removal during the first 5 minutes and 95% As(V) removal after
40 minutes from the beginning. After 40 minutes, all the uptake rates of all the adsorbents
were negligible. All the adsorbents used in this study were able to reduce the concentration

44
of As(V) in the solution to below 10 g/L with fast adsorption rates, which gives a good
indication about the benefits of loading GO on iron oxide through reducing the required
adsorption time for removal As(V) and increasing the adsorption capacity of adsorbents.
The pseudo first and second-order kinetic models were applied to understand the
adsorption behavior of the materials. Table 3.6 presents the parameters and regression
coefficients of the two kinetics models. Based on the R2 values, pseudo second-order rate
showed a better fit than the pseudo first-order rate to simulate the adsorption kinetic of
As(V) with all adsorbents used in this study. Therefore, the pseudo second-order model
suggests that chemical sorption should be the rate limiting step for As(V) adsorption by
composite materials [139].
3.5. Adsorption mechanism of As(V) on IOGO composite adsorbent
Several major and minor forms of As(V) undergo acid-base equilibrium, so the
predominant form of As(V) species present in water depends on pH value. Therefore, the
dissociation process of As(V) in water will follow those steps:
H3AsO4 H+ + H2AsO4- pKa1= 2.1 (1)
H2AsO4- H+ + HAsO4
2- pKa2= 6.7 (2)
HAsO42- H+ + AsO4
3- pKa3= 11.2 (3)
The governing forms of As(V) in this study were H2AsO4¯ (pH 2-7) and HAsO4
2¯
(pH 7-11) since all the experiments were conducted at pH 7 [140]. Two major mechanisms
have been proposed as responsible for the adsorption of As(V) ions on the surface of
IOGO(x) composites. The first mechanism is surface complexation which involves the
adsorption of H2AsO4¯ and HAsO4
2¯ ions on the surface of composites by forming inner
sphere complex between the surface of the iron oxide and As(V) acid through As-O-Fe

45
linkage; As-O(H) species can additionally undergo ligand exchange reactions with
hydroxide groups from the surface of Fe2O3 to form inner sphere complex. The second
mechanism comprises electrostatic interactions between As(V) ions and the functional
groups of graphene oxide, such as carboxyl and hydroxyl [138]. We suggested in this study
that surface complexation is the main mechanism for As(V) adsorption on the surface of
adsorbents because GO lost more than 50% of its weight after sintering it at high
temperature (410 °C) and, as a result, missed most of its functional groups on the surface.
Therefore, electrostatic interactions are expected to be a minor mechanism of adsorption.
The role of the GO is important in allowing iron oxide particles to distribute uniformly on
the GO surface, and to provide easy access to the active sites of iron oxide, as was observed
by the increased adsorption capacity of As(V) shown in Table 6.
Table 3. 6 Fitting parameters of As(v) adsorption kinetics on IOGO(x) and hematite.
3.6.Conclusions
In this project, new composite materials of iron/graphene oxides (IOGO) were
fabricated using different weight ratios of graphene oxide (5,10,15,20,25%). The produced
composites were first dried in an oven at 80 °C then sintered in a furnace at 410°C. Zeta
potential, X-ray diffraction (XRD), Scanning electronic microscopy (SEM), Surface area
(BET), and Thermogravimetric analysis (TGA) were investigated to study the composites
Adsorbents
Pseudo second order Pseudo first order
qeq (exp.)
(mg g-1) R2
k2
(g.mg-1.hr-1)
qeq (Cal.)
(mg g-1) R2
k1
(hr-1)
qeq (Cal.)
(mg g-1)
Hematite 1.24 1 24.9 1.24 0.57 0.34 0.043
IOGO5 1.23 1 0.345 1.23 0.66 0.38 0.092
IOGO10 1.23 1 0.384 1.23 0.55 0.32 0.079
IOGO15 1.22 1 0.472 1.22 0.69 0.36 0.062
IOGO20 1.22 1 0.497 1.22 0.73 0.49 0.065
IOGO25 1.21 1 0.577 1.21 0.59 0.56 0.056

46
morphologies and characteristics before and after sintering. The results of XRD confirmed
that graphite and lepidocrocite in the composites were transformed to graphene oxide and
hematite after sintering. The amounts of graphene oxide added to iron oxide led to increase
the surface area of all the composites as confirmed by BET. The results shows that As(V)
adsorption capacities increased significantly when the weight ratios of graphene oxide
increased. The higher As(V) adsorption capacity was noticed with IOGO25 composite, and
its reaction rate was faster than hematite control sample and other composites. Pseudo-
second order kinetic model was a well fit to describe the As(V) adsorption kinetics. This
study suggested that the surface complexation is the main mechanism for As(V) adsorption
on the surface of adsorbents. Because of their availability and their low cost, this research
highlights on using lepidocrocite and graphite to fabricating adsorbents that have a good
ability to remove As(V) from water.

47
Chapter 4: Asymmetric Tubular Membranes coated by Multi-
layers of TiO2/Polyaniline
4.1. Introduction
Freshwater availability plays an important role in developing economies,
industries, communities, etc. [141]. Recently, the fast growth of communities around the
world has led the industries and farms to increase their productivities to provide the
demands of communities. Therefore, the water consumption by industries has been
increasing day by day, and, as a result, the released toxic contaminants will increase
[2,3[144]. Experts and protection agencies in the environment field have been trying to
find proper technologies that make the treatment easier, more efficient, and cost-effective.
Membrane Separation Processes (MSPs) have been rapidly progressing in the field of water
and wastewater treatment because of minimizing the risk related with contaminants and
their sources, high-efficiency rate for removal low MW of organic pollutants, and their
ability and modularity to combine with other techniques [145][146]. Therefore, developing
cost-effective and stable materials and treatments has become an urgent necessity to deal
with the modern challenges for providing freshwater in a sufficient amount.
Recently, many new treatment technologies and methods have been invented, but
they need to be developed to be more economical, effective, and stable in comparison with
the used techniques nowadays. Thus, this is an important step to achieve significant saving
of potable water by reusing wastewater and treating the worsening drinking water quality
day by day [7].
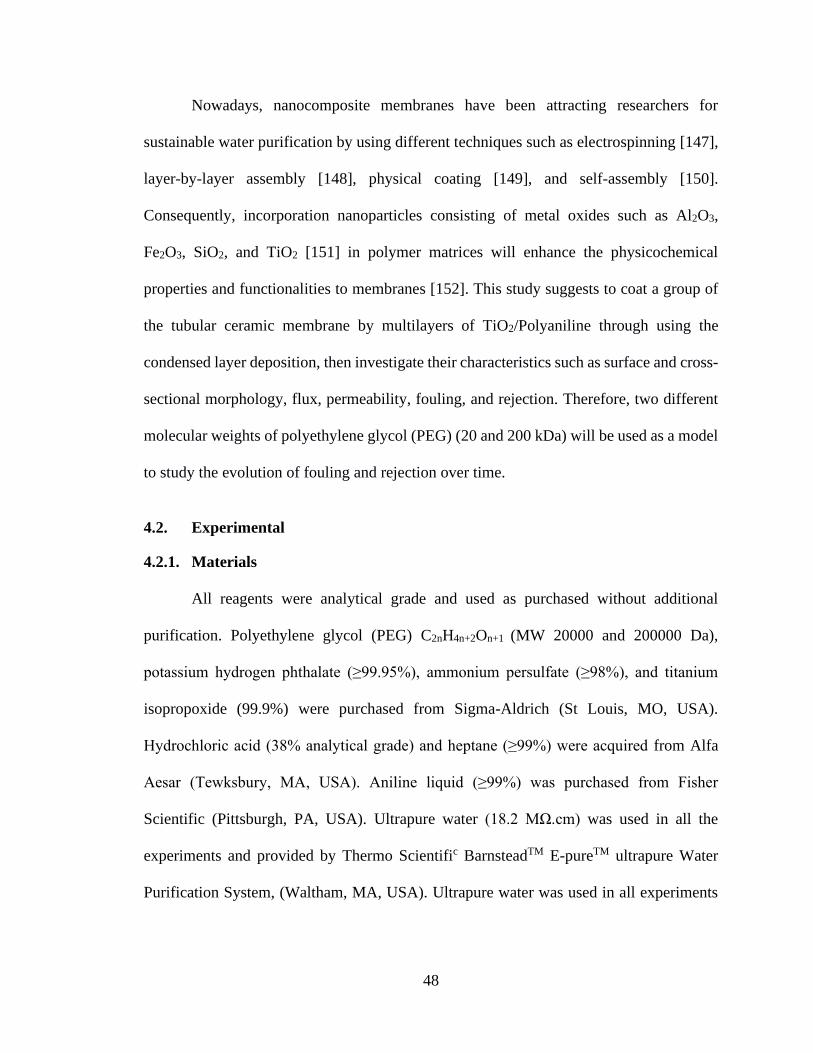
48
Nowadays, nanocomposite membranes have been attracting researchers for
sustainable water purification by using different techniques such as electrospinning [147],
layer-by-layer assembly [148], physical coating [149], and self-assembly [150].
Consequently, incorporation nanoparticles consisting of metal oxides such as Al2O3,
Fe2O3, SiO2, and TiO2 [151] in polymer matrices will enhance the physicochemical
properties and functionalities to membranes [152]. This study suggests to coat a group of
the tubular ceramic membrane by multilayers of TiO2/Polyaniline through using the
condensed layer deposition, then investigate their characteristics such as surface and cross-
sectional morphology, flux, permeability, fouling, and rejection. Therefore, two different
molecular weights of polyethylene glycol (PEG) (20 and 200 kDa) will be used as a model
to study the evolution of fouling and rejection over time.
4.2. Experimental
4.2.1. Materials
All reagents were analytical grade and used as purchased without additional
purification. Polyethylene glycol (PEG) C2nH4n+2On+1 (MW 20000 and 200000 Da),
potassium hydrogen phthalate (≥99.95%), ammonium persulfate (≥98%), and titanium
isopropoxide (99.9%) were purchased from Sigma-Aldrich (St Louis, MO, USA).
Hydrochloric acid (38% analytical grade) and heptane (≥99%) were acquired from Alfa
Aesar (Tewksbury, MA, USA). Aniline liquid (≥99%) was purchased from Fisher
Scientific (Pittsburgh, PA, USA). Ultrapure water (18.2 MΩ.cm) was used in all the
experiments and provided by Thermo Scientific BarnsteadTM E-pureTM ultrapure Water
Purification System, (Waltham, MA, USA). Ultrapure water was used in all experiments

49
from Type I (18MΩ*cm) and obtained from a Barnstead E-pure ultrapure Water
Purification System (Thermo Scientific, Waltham, MA, USA).
4.2.2. Preparation and coating of tubular microfiltration ceramic membrane
Alumina porous ceramic tubes that were used in this study as support material were
provided by Instituto Tecnológico de Buenos Aires. The dimensions of tubular ceramic
membranes were 15 cm long with an outer diameter of 9.5 mm and an inner diameter of
3.2 mm, as shown in Figure 4.1(a,b). Membranes were cut to 3 pieces, each 4 cm long.
Samples were subjected to 1,2,3,4 coating layers. The coating procedure was carried out in
a consecutive pattern, and it can be described as follow: to create the first layer, the tubular
membranes were placed in 200 ml heptane under gentle stirring for 10 minutes. Then 0.5
ml of 0.5 M of titanium isopropoxide was added to the solution.
Fig. 4. 1 The dimensions of the used membrane (a) the length (b) the cross-section.
The membrane was left for 30 minutes to form a titania layer on its surface. The
process conducted under ultrapure nitrogen gas flow is used to prevent any loss of the
precursor due to the air moisture. The second coating agent is the polyaniline (PANI),
which was proposed to enhance the bonding between the first and second layers of the TiO2
layer in addition to reduce the size of the micron level of the pores. The PANI-TiO2/rods
a b

50
composite was prepared by an oxidation polymerization process, as reported elsewhere
[153]. In a typical approach, 500 μL of aniline solution was first dissolved into 2ml of 0.5
M HCl solution, and then the TiO2/rods were added under stirring for 30 minutes. After
the above mixture was confirmed to be homogenous, 5 ml of 0.5 M ammonium persulfate
(as an oxidizer) solution was added dropwise with vigorous stirring. The above suspension
was stirred overnight, filtered, washed with DI-water, and finally dried at 80 ºC overnight.
To make the third layer of TiO2, the first step was repeated to create a TiO2-PANI-TiO2/rod
composite.
4.2.3. Experimental system setup
The experimental set up for the filtration studies and its membrane module with
tubular configuration, which was used to house the filters are shown in Figure 4.2. An 8 L
tank was used for the feed. Peristaltic Pump, flowmeters with flow control valves to
measure and control the values of inflow and outflow rates, and pressure gauge for
monitoring the pressure changes inside the system were purchased from (Cole-Parmer,
Vernon Hill, IL, USA).
The feed solution was pumped into the system at a constant inflow rate of 33
ml/min, and the retentate flow rate was 22.5 ml/min. The retentate flow was discarded and
not recirculated again to the feed tank. The operating flow rates were manually adjusted
using the flow control valves installed in the flowmeters and the valve in the permeate flow
line. The permeate samples were collected using four plastic tubes (25 ml) at open
atmosphere conditions, and the time was recorded since the start of the experiment.

51
Fig. 4. 2 Schematic of the experimental setup and the membrane module.
4.2.4. Structural characteristics of Membrane
Scanning electron microscopy (SEM) (Quanta 650 FEG—FEI, USA) was used to
analyze the visual information of the surface and cross-sectional morphologies of coated
tubular membranes.
4.2.5. Permeation experiments
4.2.5.1. Clean Water Flux (CWF) and Membrane Permeability (Pm)
Ultrapure water was used to measure the clean water flux (Jw). The permeated water
was collected by using a graduated cylinder at atmospheric pressure (101.325 kPa) and at

52
room temperature (25 C) and volume recorded as a function of time. The water flux (Jw)
was calculated by applying Equation 1:
Jw = V/(A*t) (2.1)
where, Jw is the water flux; V is permeated water volume; A is the effective filtration area
of the membrane, and t is the measured time. By the relationship between transmembrane
pressure P and water flux (Jw), membrane permeability (Pm) of all membranes was
calculated by using Equation 2.
Pm = Jw/P (2.2)
where Pm is the membrane permeability, P is the transmembrane pressure.
4.2.5.2. PEG vs. TOC Calibration curve
To convert the obtained TOC values to PEG concentrations (ppm), we first have to
establish a calibration curve of (MW 20,000 and 200,000 Da) PEG concentrations and their
TOC values. Therefore, different concentrations (0, 5, 10, 15, 20, 25, 50 ppm) of PEG were
prepared and send them to PC-Controlled Total Organic Carbon Analyzer (Shimadzu
Corporation Analytical & Measuring Instruments Division, Kyoto, Japan) to measure their
TOC values. Then, the Microsoft Excel program was used to draw the relationship between
PEG concentrations and TOC contents.
4.2.5.3. Membrane fouling
The membrane fouling was studied by observing the evolution of transmembrane
pressure (TMP) at constant inflow 33 ml/L and retentate flow 22.5 ml/L and temperature
(25 C) by using two different feed solutions 25 ppm of PEG (MW 20,000 and 200,000
Da). The purpose of using different molecular weights of PEG in this study is to compare

53
and study the effect of MWs on the fouling and rejection growth with increasing the
number of TiO2 layers and time.
4.2.5.4. Analysis of rejection
The rejection of PEG was investigated in this work by using uncoated membrane
and coated membranes. Before starting the experiment, one sample was taken from the
feed solution to measure the initial PEG concentration; subsequently, four samples (25 ml)
from permeate flow were taken when the experimental system started. The percentage of
PEG rejection was calculated by using Equation 2.3:
R(%) = (1 – Cf/Ci)*100 (2.3)
Where Cf and Ci are the concentration of PEG in the permeate flow and feed tank,
respectively.
4.3. Results and Discussion
4.3.1. Membranes characterizations
Figure 4.3 shows the SEM images of the surface morphology and the cross-
sectional of the active layers of the coated and uncoated tubular membranes in this study.
As the number of TiO2/Polyaniline coating layers increased, the surface coverage
increased, and, as a result, the diameters of the pores on their surfaces decreased. In this
study, we used ImageJ 1.52n software to measure the diameters of pores approximately on
the surface of membranes. The pores diameters of the uncoated tubular membrane ranged
between 117.18 m and 331.43 m.

54
Fig. 4. 3 SEM images for the membranes surfaces of (a) uncoated and (b) 1-layer of TiO2 (c) 2-layers (d) 3-layers
(e) 4-layers.
d c
e
a b

55
Fig. 4. 4 SEM images for the membranes cross-sections of (a) uncoated (b) 1-layer of TiO2, and (c) 2-layers (d) 3-
layers (e) 4-layers.
a
d c
b
e

56
With increasing the number of coating layers, the diameters of the pores decreased
gradually in 2,3,4 layers to be (74.5-166.8) (41.31-103.26) (19.95-67.43) m, respectively,
because of filling the pores by TiO2/Polyaniline layers that grow progressively on the
surfaces of membranes resulting decrease in the diameter of the pores of gradually.
Figure 4.4(a-e) presents the cross-sectional images of all the membranes used in
this study. The SEM images showed that there are abundant microporous with different
sizes formed on and in the active layer of membranes. Therefore, the porous structures
were formed and developed successfully in the active layer with increasing the number of
coating layers.
4.3.2. Permeability
The relationships between the flux and the permeability values of all membranes
with 1 to 4 coatings TiO2 layers are shown in Figures 4.5 and 4.6, respectively. All the
values were measured before coating, after coating, and after using them with various
molecular weights of PEG (MW 20,000 and 200,000 Da) after washing by ultrapure water
(18.2 MΩ.cm).
Fig. 4. 5 The relationship between flux and the number of coating layers.

57
Fig. 4. 6 The relationship between permeability and the number of coating layers.
The flux measurements showed a continuous decrease with increasing the number
of coated layers by TiO2 and TiO2/Polyaniline. Those results could be interpreted that the
coating process was achieved its goal by covering the surface of membranes and growing
the active layer, as the SEM images showed that in Figures 3 and 4.
After using them in the fouling experiments with PEG (MW 20,000 and 200,000
Da), both flux and permeability were measured again after flushing all the membranes by
using ultrapure water (18.2 MΩ.cm) to solve the clogging problem on their surfaces.
Higher recovery of flux and permeability was observed with 4 layers 95 and 96%,
subsequently. The new results of flux show slightly dropping in their values because of
accumulating the PEG on the surface of membranes and inside the permeable paths.
Therefore, PEG accumulation led to a decrease in the diameters of permeable pores on the
surface and in the active layer resulting in a reduction of the flux through the membranes.
The stuck PEG molecules on the inner surfaces of paths of pores.
Table 4.1 presents the decreasing ratios in flux before and after coating, and after
using them with PEG (MW 20,000 and 200,000 Da) feed solutions. The coating process
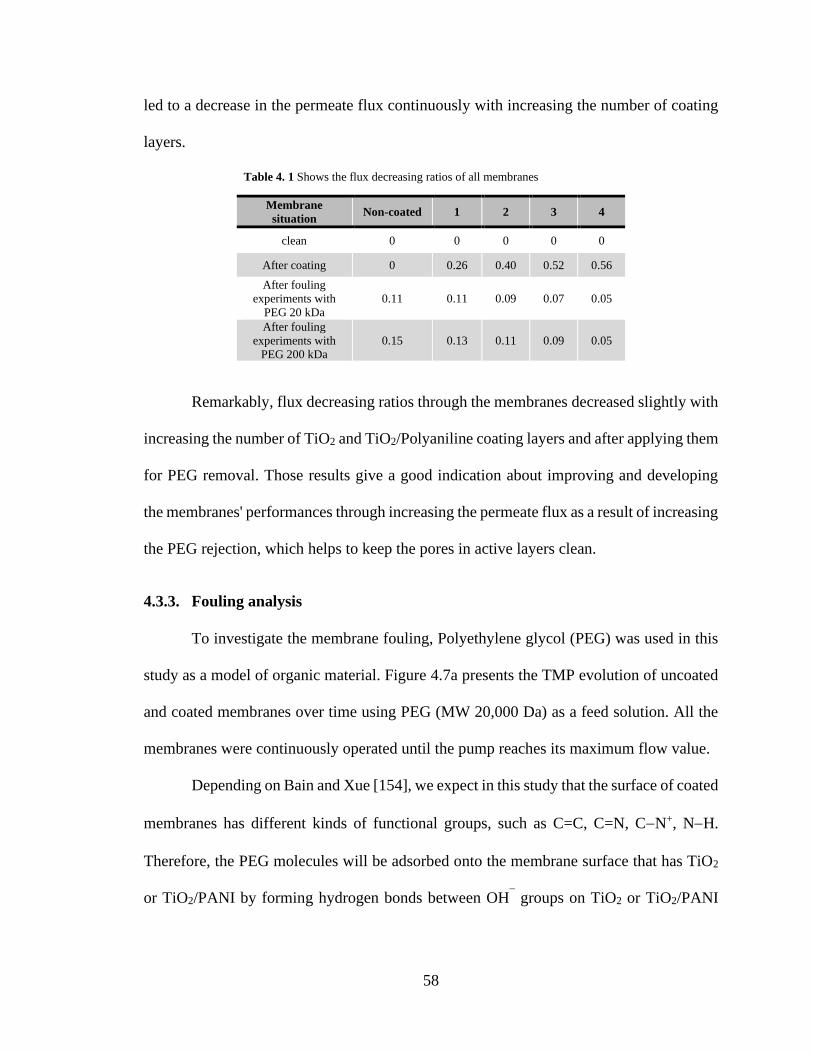
58
led to a decrease in the permeate flux continuously with increasing the number of coating
layers.
Table 4. 1 Shows the flux decreasing ratios of all membranes
Membrane
situation Non-coated 1 2 3 4
clean 0 0 0 0 0
After coating 0 0.26 0.40 0.52 0.56
After fouling
experiments with
PEG 20 kDa
0.11 0.11 0.09 0.07 0.05
After fouling
experiments with
PEG 200 kDa
0.15 0.13 0.11 0.09 0.05
Remarkably, flux decreasing ratios through the membranes decreased slightly with
increasing the number of TiO2 and TiO2/Polyaniline coating layers and after applying them
for PEG removal. Those results give a good indication about improving and developing
the membranes' performances through increasing the permeate flux as a result of increasing
the PEG rejection, which helps to keep the pores in active layers clean.
4.3.3. Fouling analysis
To investigate the membrane fouling, Polyethylene glycol (PEG) was used in this
study as a model of organic material. Figure 4.7a presents the TMP evolution of uncoated
and coated membranes over time using PEG (MW 20,000 Da) as a feed solution. All the
membranes were continuously operated until the pump reaches its maximum flow value.
Depending on Bain and Xue [154], we expect in this study that the surface of coated
membranes has different kinds of functional groups, such as C=C, C=N, C−N+, N−H.
Therefore, the PEG molecules will be adsorbed onto the membrane surface that has TiO2
or TiO2/PANI by forming hydrogen bonds between OH¯ groups on TiO2 or TiO2/PANI

59
and PEG oxygen atoms [155]. On the other hand, the PEG protons will form bonds nitrogen
atoms on the surface of coated membranes [156].
Thus, TMP values of all membranes in this study showed a continuous increase at
different rates because of accumulating PEG on the surface and inside the pores in active
layers of membranes over time. Also, it can be observed and compared the effect of the
number of coating layers on TMPs evolution during the fouling experiment. When the
number of TiO2 and TiO2/Polyaniline layers increased, the pores’ diameters on the
membranes surface decreased. As a result, PEG molecules will be rejected from passing
through the membrane.
The TMP of the non-coated membrane evolved slower than the other membranes
while the TMP of 4 layers membrane developed faster and became fouled during the first
10 min. On the other hand, the fouling happened quickly with 3 and 4-layers during the
first 15 minutes in comparison with others because of accumulating the PEG foulant on
their surfaces faster than removing them by the crossflow shear forces and diffusion
[157][158]. While the fouling evolved slower with (1 and 2) layers because of the pore
diameters on their surfaces that their sizes are larger than the pore diameters size on the
surfaces of 3 and 4 layers. Those large pore diameters let the PEG molecules pass through
the membranes. The permeate flow was gradually decreasing until the end of the
experiment because of the continuous accumulating of foulants on the top layer of
membranes and blocking the permeable paths [159].
Figure 4.7b shows the relationship between TMP vs. time for uncoated and coated
membranes by using PEG (MW 200,000 Da) as a feed solution. With using higher
molecular weight of PEG, TMP readings of all the membranes increased quickly over time

60
in comparison with the previous measurements with PEG (MW 20,000 Da). This increment
belongs to the pores plugging by PEG molecules, which made the pores narrower;
therefore, the values of permeability of all the membranes became lower after the fouling
experiment, as mentioned previously in Section 3.1.1.
Fig. 4. 7 TMP evolution vs time using (a) PEG (MW 20 kDa) (b) PEG (MW 200 kDa).
After completing the fouling experiments with all the membranes, ultrapure water
(18.2 MΩ.cm) was used to clean the membranes up from PEG accumulation by pumping
the water in the reverse direction, as shown in Figure 4.8. The new TMPs showed
decreasing in their values in comparison with the last values recorded at the end of the
fouling experiments. Therefore, the new TMPs values were almost the same as the values
of clean TMPs membranes before using them in the fouling experiments.
a b

61
Fig. 4. 8 Comparison between the TMP of all the used membranes before and after using.
4.3.4. Rejection Analysis
The measurements of PEG (MW 20,000 Da) rejection of all the membranes during
the fouling experiment at constant flux are presented in Figure 4.9. For constant flux
fouling, the rejection of all membranes decreased quickly during the first minutes because

62
of increasing TMP inside the system. As a result, the concentration of PEG in the permeate
flow showed increasing due to evolving the TMP, which lets PEG pass out of the pores in
the active and support layers, particularly with non-coated and 1 layer membranes.
On the other hand, the quick accumulation of PEG on the surfaces of membranes
2, 3, and 4 layers led to fill the small diameters of pores then resulting to prevent moving
the molecules of PEG toward the permeate flow. Therefore, PEG concentrations decreased
in permeate flow by increasing the number of coating layers.
Fig. 4. 9 Rejection evolution vs time using PEG (MW 20,000 Da) at a constant flux 33 ml/min.
Subsequently, the results show there are no significant differences between the
rejection ratios of uncoated and 1 layer membranes. Those close values of rejection could
be interpreted that the TiO2 nanoparticles in the 1 layer membrane didn’t fill most of the
pores in the support layer or cover the membranes surface completely, which led to permit
the PEG particles from leaving the membrane toward the permeate flow. While the other
coating layers showed increasing in the values of rejection because of filling the pores by
TiO2 nanoparticles, also, it should be noted that the number of Polyaniline that used to

63
increase the attachment among the TiO2 layers plays an important role with that. Finally,
this study showed an increase in the sampling time for the PEG rejection test over time.
Figure 4.10 presents a comparison of the rejection ratios of PEG (MW 200,000 Da)
for all the used membranes in this study. Because of using a higher molecular weight of
PEG, the rejection values of membranes 3 and 4 layers decreased slower than the other
membranes due to formed smaller pore diameters with increasing the number of coating
layers and blocked most of the pores by accumulating PEG molecules. On the other hand,
increase the TMP inside the system pushed PEG molecules out of the membranes towards
the permeate flow.
The rejection values of 1 layer and 2 layers membranes decreased quickly with
increasing the molecular weight of PEG. Those result indicates how the effect of increasing
the molecular weight of PEG on the membranes’ performances and how the number of
TiO2 coating layers affect the rejection process.
Fig. 4. 10 Rejection evolution vs time using PEG (MW 200,000 Da) at a constant flux 33 ml/min.

64
4.4. Conclusion
In this study, a group of tubular ceramic membranes were coated by multi-layers of
TiO2/PANI. Their characteristics were investigated using SEM analysis, flux,
permeability, fouling, and rejection. Two different molecular weights (20,000Da and
200,000Da) of polyethylene glycol (PEG) were used to study the as a model of organic
material. SEM images showed the pore diameters in the surface and active layer of coated
membranes gradually decreased with increase the coating layers. Moreover, the values of
flux and permeability also decreased when the number of coating layers increase.
Therefore, those results confirmed that the coating process was successfully achieved in
this work. Depending on the fouling results, TMP showed gradual increasing rates with
increase the coating layers because of accumulating PEG molecules on the membrane
surface and inside permeable paths. With using PEG (MW 200,000 Da), TMP evolved
quickly with using 4 layers membrane because its surface was fouled by PEG molecules;
whereas, it grew slower with the non-coated membrane.
Rejection results illustrated that PEG concentration in the permeate flow increased
because of evolving the TMP that will enforce PEG molecules pass through the non-coated
and coated membranes. On the other hand, the rejection ratios showed no significant
difference between uncoated and 1-layer membranes comparison with other 2,3,4-layers.
These results could be interpreted that the TiO2 nanoparticles did not completely cover the
pores on the membrane’s surface or fill permeable paths in the support layer. As a result,
PEG particles will leave the membrane quickly with increase TMP. After completing the
fouling and rejection experiments, all the membranes were cleaned using ultrapure water
(18.2 MΩ.cm) by pumping it in the reverse direction. The new membranes TMP presented

65
decrease and almost became the same as the values of TMPs before used them in fouling
and rejection experiments. As a result, it could be use the membranes many times after
clean them, and, particularly, the 4-layers showed a little change in its TMP values when
it is clean and after cleaned.

66
Chapter 5: Enhanced Degradation of Sulfamethazine by using
Advance Oxidation Processes (AOPs) Combined with Membrane
Filtration.
5.1. Introduction
Two-thirds of the human population around the world is affected by water scarcity
for a month at least per year [160]. Existing good quality water resources may reach their
limits rapidly in most parts of the world as a result of the continuous discharge of domestic
and industrial waste in addition to their non-biodegradable compounds such as antibiotics
[161]. Sulfamethazine (SMZ) is one kind of a wide range of antibiotics, and it belongs to
pharmaceutical active compounds (PhACs). Because of its broad applications as a
bacteriostatic agent, SMZ has become recently a widespread contaminant, and the
conventional treatment processes are unable to remove it effectively [162]. For instance,
coagulation and flocculation processes have been used to remove some kinds of pollutants
in water and wastewater. Regardless, these technologies have some disadvantages such as
generation toxic secondary by-products and unsatisfactory removal efficiency for some
recalcitrant compounds (e.g., antibiotics, dyes, pesticides, pharmaceutical, etc.) [163], as
mentioned in Table 5.1. Thus, improved treatment technologies, readily available and
simple to operate, could support actions to increase widespread access to clean water [164].
Many treatment technologies such as adsorption [99], membrane filtration [100], and
advanced oxidation processes [101] have been used to remove different types of
contaminants, and SMZ is one of them.

67
Table 5. 1. Uses and disadvantages of some water and wastewater technologies.
Water
technologies Contaminate removed Disadvantages
Biological
methods
Using biological cultures (pure
or mixed)
Need to generate optimal favorable environment,
requiring to manage and maintain the
microorganisms and/or physicochemical pre-
treatment, slow process (kinetics problems), low
dyes biodegradability, etc.
Coagulation and
flocculation
Removing bacteria, dissolved
organic carbon, turbidity, some
chemical contaminants, and
heavy metals such as arsenic,
fluorides, phosphorus, etc.
Non-reusable chemicals (aid chemicals,
coagulants, flocculants,) required, monitoring of
the effluent (pH), low arsenic removal, and
produced high sludge volume (cost, treatment,
management).
Chemical
precipitation
To uptake the pollutants and
separate the products formed
Ineffective in removing of the metal ions at low
concentrations, disposal and handling problems
(cost, treatment, management), High sludge
production, monitoring the effluent (pH)
Ozone
Effective in eliminating color,
iron, manganese, odor, and
tastes; Also, it is not affected
by pH and temperature
Chemicals needed, Oxidants production, transport,
and management, short half-life, influenced by the
kinds of oxidants
Membrane filtration technologies have been considered as a suitable solution to
remove the low concentrations of contaminants and pathogens from water and wastewater
to the allowable limits for drinking and discharging [165]. Because of providing barriers
for contaminants separation, membranes’ fouling is expected to increase during operation
with time. The fouling is originated from accumulating the contaminants on the surface of
membranes that lead to a decrease in the efficiency of the separation, shorter membrane
lifespan [166], reduction of permeate flux [167], an increase of the transmembrane pressure
(TMP), and amount and frequency of chemicals required for cleaning [168]. To minimize
or reverse membrane fouling, understanding the mechanisms of fouling and cleaning are
needed, but yet lacking. The fouling control and removal methods include; chemical,
electrical, hydraulic, and physical cleaning. However, all of these methods generate
undesired factors and challenges to the processes such as downtime, increased running
costs, and damage to the membrane [169].

68
Recently, advanced oxidation processes (AOPs) have successfully combined with
ceramic membrane filtration to overcome fouling issues and to degrade the contaminants
in water [170][11]. Membrane filtration processes could be improved by coating the
surface of membranes with photocatalytic materials such as titanium dioxide (TiO2), iron
oxide (IO), zinc oxide (ZnO), etc. Using metal oxide nanoparticles as a photocatalytic will
prevent the accumulation of organic contaminants on the surface of membranes, so they
will play a key role by degrading the pollutants to simple elements such as CO2 and H2O
after illuminating them with UV-light. Therefore, metal oxide nanoparticles will contribute
to solving the excessive fouling problems and, as a result, provide high flux for a long time
without increasing TMP. On the other hand, this technique will lead to avoid using the
chemicals for maintenance and cleaning to remove the secondary waste. This kind of
technology is called “self-cleaning” that regenerates itself continuously without needing to
use an external method for cleaning [166]. The oxidative degradation ability of the
photocatalysts and the separation role of the porous membrane could work together in one
unit to produce a superior hybrid membrane material [171].
Thus, this study aims to coat the tubular ceramic microfiltration membrane with
TiO2 nanoparticles as hybrid separation/degradation media. The coated membrane will be
installed in the module and surrounded by UV-LED strips as a source of radiation at 365
nm. This system will be applied to evaluate the performance of the SMZ photodegradation
process. pH, ionic strength (Cl− and NO3−), humic acid, SMZ concentrations were
considered in this work to study their presence effects on the membrane performance and
SMZ removal.

69
5.2. Materials and methods
5.2.1. Chemicals
All reagents were of analytical grade and used as purchased without additional
purification. Heptane (≥99%) and Hydrochloric acid (38% analytical grade) were obtained
from Alfa Aesar (Tewksbury, MA, USA). Ammonium Persulfate (≥98%), and titanium
isopropoxide (99.9%) were purchased from Sigma-Aldrich (St Louis, MO, USA). Aniline
liquid was provided from Fisher Scientific (Pittsburgh, PA, USA). Sulfamethazine (HPLC
Grade) were purchased from Sigma-Aldrich (St Louis, MO, USA). Calcium chloride
(CaCl2) (Isooctane, 99%) were obtained from Fisher Scientific.
5.2.2. Instruments
Ultrapure water (18.2 MΩ.cm) (Thermo Scientific BarnsteadTM E-pureTM ultrapure
Water Purification System, Waltham, MA, USA) was used to prepare all the solutions and
to clean all the parts of experimental system. A UV-LED flex strip was obtained from
LEDlightsworld (ShenZhen, China) with a nominal power: 14.4 W/m and main emission
wavelength of 365nm.
5.2.3. Membrane fabrication
As mentioned in chapter 4, alumina porous ceramic tube was used as a support
layer, and its dimensions are 15 cm long, inner diameter 3.15 mm, and outer diameter 9.5
mm, as shown in Figure 5.4(a,b). The membrane was cut to 3 pieces, 4 cm long each, and
prepared for coating by TiO2. The procedure of coating was carried out in a consecutive
pattern which can be described as follow: the piece of membrane was placed in 200 ml
heptane under a gentle stirring for 10 minutes, then 0.5 ml of 0.5 M of titanium
isopropoxide was added to the solution. Then, the membrane was submerged 30 minutes
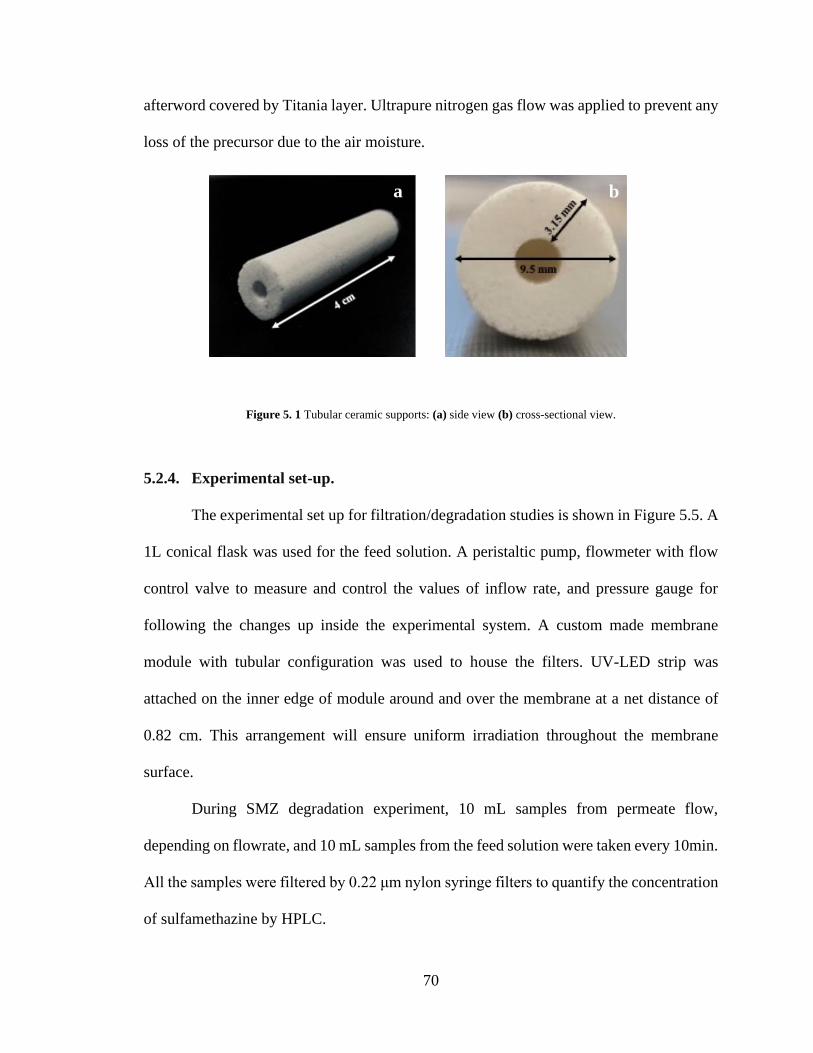
70
afterword covered by Titania layer. Ultrapure nitrogen gas flow was applied to prevent any
loss of the precursor due to the air moisture.
Figure 5. 1 Tubular ceramic supports: (a) side view (b) cross-sectional view.
5.2.4. Experimental set-up.
The experimental set up for filtration/degradation studies is shown in Figure 5.5. A
1L conical flask was used for the feed solution. A peristaltic pump, flowmeter with flow
control valve to measure and control the values of inflow rate, and pressure gauge for
following the changes up inside the experimental system. A custom made membrane
module with tubular configuration was used to house the filters. UV-LED strip was
attached on the inner edge of module around and over the membrane at a net distance of
0.82 cm. This arrangement will ensure uniform irradiation throughout the membrane
surface.
During SMZ degradation experiment, 10 mL samples from permeate flow,
depending on flowrate, and 10 mL samples from the feed solution were taken every 10min.
All the samples were filtered by 0.22 μm nylon syringe filters to quantify the concentration
of sulfamethazine by HPLC.
b a

71
Figure. 5. 2 Schematic of experimental setup for integrated direct contact membrane filtration–UV photolysis
treatment.
5.3. Filtration/Reaction experiments:
The membrane operation conditions were varied systematically to investigate the
influencing factors such as the initial SMZ concentration, pH, presence of NOM (humic
acid), and ionic strength and to optimize the degradation conditions, as explained in the
subsections below.
5.3.1. Preparation of SMZ standard curve
The calibration curve of SMZ was established by preparing different concentrations
(0, 0.1, 0.25, 1, 5, 10, 15, and 20 ppm) solution were kept at 4 °C in the refrigerator. All
SMZ samples were analyzed by HPLC within 24 hours after filtered with 0.22μm nylon

72
membrane filter. SMZ concentrations were quantified within 24 hours by High
Performance Liquid Chromatography (HPLC) (LC- 2010A HT, Shimadzu, Japan)
equipped with the C18 reversed-phase column (4.6 mm × 100 mm, Phenomenex, US) and
a diode array detector (DAD) at the detection wavelength of 254 nm. The column
temperature was 40 °C and the injection volume was 20 μL. The flow rate of mobile phases
used in this HPLC method was 0.5 mL/min, and mobile phases consisted of 0.1%
phosphoric acid in water and 100% acetonitrile. The gradient used is described below at
Table 5.2.
Table 5.2 The gradient conditions for HPLC method.
Time (min.) Acetonitrile
0 – 0.5 2%
0.5 – 7 2% - 80% (Linear)
7 – 9 80% - 98% (Linear)
9 – 10 98% - 2% (Linear)
10 -15 2%
The pH values have direct influence on the charge of contaminants and membrane’s
surface. Therefore, three different pH values (2, 5, 8) were selected depending on the acid-
base diagram to study the effect of pH on the membrane efficiency to degrade and remove
SMZ. For this purpose, the pH was adjusted to 2, 5 and 8, respectively, by adding 0.1 N
HCl and NaOH to the SMZ solution.
5.3.2. Effect of SMZ
To evaluate the efficiency of catalyst-coated membrane for SMZ photocatalytic
degradation, two feed initial concentrations, 5 and 10 ppm, were used at three different pH
(2,5,8).

73
5.3.3. Effect of presence of organic matter
In this study, humic acid (HA) was selected as a model of natural organic matter
(NOM) to study its effect on SMT degradation. A concentration of 1 ppm of HA was used
for this purpose.
5.3.4. Effect of ionic strength
Inorganic ions presence in water affect significantly SMZ degradation. The effect
of inorganic ions such as, chloride (Cl−) and nitrate (NO3−) ions, on SMZ photolysis were
systematically examined. Different NaNO3 concentration 1,10,100 mM and 10 ppm of
chloride were studied at 5ppm SMZ and pH5.
5.4. Results and discussion
5.4.1. Effect of pH on SMZ removal
The pH of the solution directly affects contaminants adsorption and degradation by
governing the degree of dissociation of the functional groups on the membrane surface and
changed the surface potential of the material. Before studying SMZ degradation by UV-
light, dark control experiments were carried out to compare the SMZ removal on catalyst-
coated membrane under different conditions, as shown in Figure 5.3-6. Two different
concentrations of SMZ 5ppm and 10ppm were used for this purpose as a feed solution at
different pH values (2,5,8).
In the absence of UV light, the experiments of SMZ removal showed no remarkable
change in its concentration at pH5 in both permeate flow and feed solution. Those results
confirmed that SMZ adsorption process on the membrane surface is not significant without
using UV-light. On the other hand, the large size of pores also plays an important role to

74
let SMZ molecules pass through the membrane's active and support layers without
significantly capturing them.
Figure 5.3 Influence of pH on the removal of SMZ, 5ppm initial [SMZ] in the absence of UV light:
(a) permeate (b) feed.
Figure 5.4 Percentage removal (C/Co) vs time in the absence of UV light (5ppm initial [SMZ]):
(a) permeate (b) feed.
Figure 5.5 Influence of pH on the removal of SMZ, 10 ppm initial [SMZ] in the absence of UV light:
(a) permeate (b) feed.
b
a b
a b
a

75
Figure 5.6 Percentage removal (C/Co) vs time in the absence of UV light (10 ppm initial [SMZ]):
(a) permeate (b) feed.
Moreover, the system that used in this study is a continuous flow, and the SMZ
molecules maybe did not get enough time to be adsorbed by active sites on the surface of
membrane. The results agree with many researchers and studies that previously mentioned
the stability of SMZ concentration in the absence of UV-light [166][167]. The other values
of pH, 2 and 8, almost showed same results of SMZ removal with pH5. Therefore, altering
the pH solution had no effect on SMZ adsorption. Those results confirm that electrostatic
force was not main role between TiO2 particles and SMZ molecules.
Under UV light, the influence of pH solution (2,5,8) on the degradation of 5ppm
SMZ as an initial concentration was investigated, as illustrate in figures 5.7 and 5.8. SMZ
degradation showed increase when the pH of solution became more acidic. This result can
be interpreted when TiO2 is illuminated by UV-light, an electron will migrate from the
valence band toward conduction band to produce electron (ecb¯) in the conduction band and
hole (hvb+). As a result, the electron will interact with the oxygen molecules and produce
superoxide (O2¯*) that will interact with the vicinity SMZ molecules.
Because the system used in this study is continuous flow reactor, the concentration
of dissolved oxygen was available without decreasing in comparison with batch reactor.
a b

76
Moreover, the holes will interact with the water molecules and produce hydroxyl radicals
(OH¯*) that will also interact with SMZ molecules and mineralize it completely releasing
concurrently the oxidative products of H2O and CO2.
In addition, TiO2 will produce H2O2 in the aerated aqueous solution through
reduction of oxygen molecular by exciting electron to the conduction band. Also, H2O2
will be formed by recombination of hydroxyl radicals on the TiO2 surface. This process is
considered the only pathway for H2O2 production when the dissolved oxygen is available
in systems. H2O2 will be continuously produced, specially, in the acidic solution because
of the proton availability that will react with superoxide (O2¯•) and produce Hydroperoxy
radical (HO2•). As a result, the molecules of hydroperoxy radical (HO2
*) will react with
each other and produce H2O2 in the solution [174].
The results, shown in figures 7 and 8, illustrated there is no increment in SMZ
degradation after 20 min., and the photochemical reaction reached to equilibrium situation.
Those results could be explained that the oxygen content inside the system was almost
exerted by the photoreaction, and, as a result, O2• that responsible about producing H2O2
was also decrease. Therefore, SMZ degradation rate decreased inside the experimental
setup [175].
At pH 5, the results showed degradation in SMZ molecules but less than in pH 2.
Those results can be explained in terms of PZC of TiO2. The particles of TiO2 will carry
positive charge on the surface of membrane when the solution pH is lower than PZC (6.5).
As a result, the surface of the membrane will be charged in positively because the surface
of TiO2 is protonated (TiO2H+). On the other hand, SMZ molecules will exist in neutral

77
form (SMZ0), at pH 2.65 and pH 7.42, and zwitterion (SMZ±) [176]. Thus, positively
charge of TiO2 will adsorb SMZ through the polarized group –SO2N– of SMZ.
SMZ degradation at pH 8 showed decrease in comparison with other pHs because
both SMZ molecules and TiO2 are in negative charged. In this case, SMZ molecules would
be more difficult to react with TiO2 because the force of electrostatic repulsive will be large
under neutral and basic conditions. As a result, the efficiency of SMZ degradation and
reaction rate will decrease when the pH > 6.5.
Figure 5.7 Influence of pH on the removal of SMZ, 5ppm initial [SMZ] under UV light (a) permeate (b) feed.
Figure 5.8 Percentage removal (C/Co) vs time in the absence of UV light (5 ppm initial [SMZ]):
(a) permeate (b) feed.
5.4.2. Effect of SMZ concentration
Two concentrations of SMZ, 5ppm and 10 ppm, were studied under different pH
values 2,5,8, as illustrated in figure 5.9 and 5.10. The concentrations of SMZ 5ppm and
a b
a b

78
10ppm showed decrease in permeate flow and feed solution together after 8min. and
20min., respectively, under illumination. On the other hand, degradation ratios C/Co of
SMZ shows increase in both concentrations in the permeate flow and the feed solution
when pH decreases. However, the removal efficiency of 10ppm SMZ concentration
decreased when pH values increased 65% at pH2, 37% at pH5, and 10% with pH8 after
1hr of photodegradation reaction. In same trend, the removal efficiency of 5ppm SMZ
decreased 62% at pH2, 30% at pH5, and 2% at pH8 after 1 hr. As noticed, the removal
efficiency of SMZ slightly decreased after increase SMZ concentration with all pH values.
The results revealed decrease in the membrane efficiency when the SMZ concentration
increase because the active layer was unable to handle with the excess amount of SMZ.
Therefore, SMZ molecules remained in the permeate flow without degrading. To keep the
efficiency of membrane, it may be needed to increase the active sites on the membrane
surface to be able dealing with excess amount of SMZ.
Figure 5.9 Influence of the pH on the removal of SMZ, 5ppm and 10ppm initial [SMZ] under of UV light
(a) permeate (b) feed.
a b

79
Fig. 5.10 Percentage removal (C/Co) vs time in the absence of UV light (5ppm and 10ppm initial [SMZ]):
(a) permeate (b) feed.
5.4.3. Effect of HA presence on SMZ degradation
To study the effect of presence HA on the removal of SMZ in the water, dark
control experiments were carried out first. The used feed solution in this experiment
includes 1ppm HA and 5ppm SMZ, at pH 2,5,8. The results showed that SMZ removal by
the coated membrane was not significant in both permeate flow and feed solution at the
three pH values tested, as depicted in Figure 5.11 and 12. In comparison with Figure 5.3,
the results showed that added HA to the solutions did not improve the ability of the
membrane to remove SMZ molecules.
Fig. 5.11 Influence of pH on the removal of SMZ, 1ppm HA and 5ppm [SMZ], in the absence of UV light
(a) permeate (b) feed.
a b
a b

80
Fig. 5.12 Percentage removal (C/Co) vs time in the absence of UV light (1ppm HA and 5ppm [SMZ]):
(a) permeate (b) feed.
Figures 5.13 and 5.14 illustrate the effect of the absence and presence of HA on the
SMZ degradation at pH 2,5,8. At pH 2, the results showed that there is a significant
enhancement in the SMZ degradation by decreasing the required time to degrade the same
concentration of SMZ in clean water.
Fig. 5.13 The influence of the pH solution on 1ppm HA and 5ppm [SMZ] vs time under of UV light (a) permeate
(b) feed.
a b
a b

81
Fig. 5.14 The normalized 1ppm HA and 5ppm [SMZ] plotted vs time under of UV light (a) permeate (b) feed.
SMZ degradation showed increase at pH 5 in the presence of HA, and this
increment became stable until the experiment completed. On the other hand, SMZ
degradation at pH 8 exhibited a simple increase at the beginning of experiment then became
unworthy. These increments in the SMZ degradation rates could be attributed to the
existence of dissolved organic matter (DOM), that has a pronounced effect on
photochemical based water treatment processes. Biomass after decomposed it is considered
as a major source of producing DOM which is composed of large carbon-based structures
with large number of light absorbing chromophores. DOM will lead to an excited state
(DOM*) upon light absorption Equation 5.1. DOM* can undergo electron or energy
transfer pathways with molecular oxygen to produce 1O2 (single oxygen) or O2•- Equation
5.2. These reactive oxygen species (ROS) will initiate SMZ degradation Equation 5.3.
Dissolved organic matter will sensitize TiO2 too Equation 5.4 which leads to charge carries
with the potential to start processes of degradation Equation 5.5 [177].
a b

82
DOM + hv → DOM* (5.1)
DOM* + O2 → 1O2(O2•-) (5.2)
1O2(O2•-) + SMZ → SMZ(OX) (5.3)
DOM* + TiO2 → TiO2* (5.4)
TiO2* → ecb- + hvb
+ → ROS + SMZ → SMZ (OX) (5.5)
5.4.4. Effect of ionic strength on the SMZ degradation
To study the effect of adding IS on SMZ degradation, three different concentrations
of ionic strength (1,10,100 mM of NaNO3) were prepared as feed solutions after adjusting
their pH solution at 5 with the absence of UV light. The results showed that SMZ
adsorption on the membrane surface was low with all IS values in both permeate flow and
feed solution, as illustrated in figures 5.15 and 5.16. The results confirmed that the SMZ
adsorption was negligible in the next SMZ photodegradation experiments by using IS
solutions.
Fig. 5.15 The influence of different levels of NaNO3 1,10,100 mM and NaCl¯ 10 mM on an initial 5ppm [SMZ]
solution at pH5 vs time at the absence of UV light (a) permeate (b) feed.
a b

83
Fig. 5.16 Percentage removal (C/Co) vs time in the absence of UV light (different levels of NaNO3 1,10,100 mM and
NaCl¯ 10 mM on an initial 5ppm [SMZ] solution at pH5): (a) permeate (b) feed.
Notably, the results showed a significant increase SMZ degraded with increase
nitrate ions within 1,10,100 mM after 1hr under UV-light, as shown in figures 5.17 and
5.18. After 8 min., SMZ had been decomposed and removed around 73, 95, 97%,
respectively, of its initial amount. It indicates that SMZ was converted after 1 hr. This result
attributed to a favorable electrostatic interaction between TiO2 particles and SMZ when the
value of pH is 5 [178]. Consistent with our observation, Hao et al. mentioned that promotes
of effect of presence nitrate ion on UV degradation sulphonamide compounds [1]. On the
other hands, nitrate ions will adsorb the excess UV light when its concentration increases
that will be led to competition for the number of photons available [180]. Therefore, SMZ
degradation didn’t enhanced proportionately when the nitrate ion concentration increased.
Because of its presence in significant concentration in water bodies over a varied
concentration range of 0.1-500 ppm [181], chloride (Cl−) ion was studied in this work to
investigate its effect on the SMZ degradation and the membrane performance. Therefore,
10ppm of Cl− was added to 5ppm SMZ solution at pH5 in the absence and under UV light.
a b

84
Fig. 5.17 The influence of NaNO3 1,10,100mM on an initial 5ppm [SMZ] solution at pH5 vs time under of UV-light
(a) permeate flow (b) feed.
Fig. 5.18 The normalized of NaNO3 1,10,100mM on an initial 5ppm [SMZ] solution at pH5 vs time under of UV-light
(a) permeate (b) feed.
In the absence of UV light, SMZ removal efficiency showed not significant
decrease after 1 hr., as shown in Figures 5.17 and 5.18. This result belongs to the affinity
of Cl− ions to be adsorbed by the positive active sites on the membrane surface, so the
membrane surface will be neutral to SMZ molecules. Thus, Cl− will lead to make the
adsorption of SMZ molecules by TiO2 particles slower by decreasing the electrostatic
interaction force between the membrane surface and SMZ molecules. Therefore, SMZ
adsorption will be not important role in the following SMZ photodegradation experiments.
b
b a
a

85
Under UV light, the results showed decrease slightly SMZ concentration in
comparison with clean water, as shown in figures 5.21 and 5.22. The reduction of SMZ
degradation in the presence of Cl− ion could be interpretated to the competition between
SMZ and Cl− ions for UV light. In addition, Cl− ion presence may generate some radicals
such as, Cl•, that may inhibit the degradation of SMZ [182]. Zhuang et al. mentioned that
a slightly reduction of SMZ removal efficiency in the presence of 2 mM Cl− [183].
5.4.5. Fouling and TMP evolution during membrane operation
Figures 5.19a-d shows the TMP profiles with absence UV light under different
values of pH, SMZ, HA, and IS, respectively, as feed solutions and during 1 hour of
filtration. The results showed slight differences between the beginning and final of TMP.
Those results confirmed that the membrane surface without illumining TiO2 particles will
let the SMZ pass the system without degradation or accumulation, as shown in figures 5.3-
6, 5.11 and 12, and 5.15 and 16. On the other hand, HPLC results confirmed that SMZ
passed the system without changing in its concentration. After illumination the surface of
membrane by UV-LED light, figures 5.20(a-d) show that no significant differences
between the TMP with or without illumination the membrane surface by UV-LED light.
The fouling didn’t change with using different values of pH, SMZ, HA, and IS as feed
solutions. Those results shows that the large pore size on the membrane surface will led to
delay accumulation of SMZ and HA in absence of UV-LED light. Therefore, the surface
of membranes stayed clean without significant fouling during the filtration processes [169].
Same situation happened with presence of UV-LED light. TMP didn’t change significantly
even with degradation of SMZ on the membrane surface after 1 hour of filtration.

86
Figure 5.19 Normalized pressure-time profiles vs time at absence of UV light (a) 5ppm [SMZ] (b) 10ppm [SMZ]
(c) 1ppm HA and 5ppm [SMZ] (d) 1,10,100 mM NaNO3 at pH5 (e) 10 ppm [NaCl−] and 5ppm [SMZ] at pH5.
a b
c d
e

87
Figure 5.20 Normalized pressure-time profiles vs time under UV light (a) 5ppm [SMZ] (b) 10ppm [SMZ] (c) 1ppm
HA and 5ppm [SMZ] (d) 1,10,100 mM NaNO3 at pH5 (e) 10 ppm [NaCl−] and 5ppm [SMZ] at pH5.
a b
c d
e

88
5.5. Conclusion
A novel technique that includes two processes: filtration and advanced oxidation
was used to examine the kinetic of photocatalytic degradation of SMZ on the supported
TiO2 ceramic tubular membrane. In the absence and presence of UV-light. A continues
flow reactor was performed to compare the SMZ degradation under different conditions.
In this study, two SMZ concentrations (5 ppm and 10 ppm) were examined their
degradation under different pH 2, 5, and 8 values in the absence and presence of UV-light.
The results showed that the SMZ removal was no significant in the absence of UV-light.
Under UV-light, the system significantly removed the SMZ from the solution at pH 2 after
1 hr. On the other hand, the presence of HA was investigated its effect on the degradation
of 5 ppm [SMZ] at pH 2,5, and 8 as an initial solution. The degradation efficiency of SMZ
was noteworthy improved in the presence of HA with all pH values by decreasing the
required time to degrade SMZ in clean water. NaNO3¯ (1,10,100 mM) and NaCl¯ (10 ppm)
ions were also studied their effects on the degradation of 5 ppm SMZ at pH 5. The rate of
SMZ degradation was faster in the presence of NO3− comparison with clean water, and this
rate decreased roughly with increase of NO3−. This decrease is interpreted that NO3
− ion
will adsorb the excess UV light and led to competition for the number of photons available.
Otherwise, SMZ degradation decreased in the presence of Cl− ion because of the
competition between SMZ and Cl− ions for UV light. In addition, Cl− ion will generate
some radicals such as, Cl•, which may inhibit the degradation of SMZ [182]. TMP of this
system was monitored, and the results showed there is no significant increase with SMZ
degradation. As a result, this system offers a suitable treatment to remove SMZ from water.

89
Chapter 6: Conclusion and Future work
6.1.Conclusion.
The application of metal oxides to water treatment processes was investigated in
order to address current challenges in drinking water quality. A new group of iron/graphene
oxides composite materials (IOGO) with composition varying form 5% to 25% GO in
weight were fabricated and characterized. XRD analysis showed that iron oxide was while
SEM images confirmed that IO particles distributed uniformly on the GO sheets. The
material was evaluated as adsorbent for As(V) removal from water. As(V) removal from
water. The adsorption capacity increased with GO content, which also the led to increase
the BET surface area. IOGO25 showed the highest efficiency for As(V) adsorption removal
of all composites. As(V) adsorption kinetics was well fit with a pseudo-second order
kinetic model; a correlation between GO content and faster kinetics was observed. The
surface complexation was proposed as the main mechanism for As(V) adsorption. The
IOGO composites were able to remove As(V) contamination below the recommended
MCL for drinking water. The incorporation of GO resulted in a more efficient material,
with higher adsorption capacity than hematite and faster adsorption kinetics.
In a seond approach, a group of tubular alumina ceramic membranes were coated
by multi-layers of TiO2. SEM images showed that pore diameters gradually decreased in
both surface and active layer of the coated membranes with the increase the number of
coating layers. The results of flux and permeability confirmed that the coating process was
successful, indicted by a decrease in their values. Polyethylene glycol (PEG) (MW 20 kDa
and 200 kDa) were used as a model organic compound to study the fouling and the rejection

90
evolution of the membranes. Transmembrane pressure (TMP) showed gradual increase
rates with increasing number of coating layers. On the other hand, TMP evolved quickly
with 4 layers membrane using PEG (MW 200 kDa). Rejection experiements showed that
PEG concentration in the permeate flow increased because evolving TMP. After a water
rinse, the membrane TMP decreases to practically the same as before being used in fouling
and rejection experiments, which suggests a very low level of irreversible fouling.
The TiO2 coated membranes were tested in filtration and reaction (advanced
oxidation) process for the degradation of sulfamethazine (SMZ). The membrane was tested
in the absence and presence of UV-light at continues flow reactor mode. Two initial SMZ
concentrations (5 ppm and 10 ppm),three pH levels (2, 5, and 8) , presence of humic acid
(HA 5 ppm), and ionic strength (10 ppm NaCl and 1,10,100 mM of NaNO3-), were
examined to study their effect on SMZ removal and degradation. In the absence of UV-
light, the results showed that SMZ was not removed by the membrane with the all
parameters studied. Under UV-light, the system was able to remove 67% of SMZ from the
solution at pH 2. The presence of HA led to an improvement of SMZ degradation at all pH
values, as well as the presence of NO3- . However, SMZ degradation decreased in the
presence of Cl- ion because of the competition between SMZ and Cl- ions for UV light.
The studied system offers a suitable treatment for SMZ degradation from water.
6.2.Future work
The works have stimulated us to make the following suggestions for future work.

91
6.2.1. Investigating the performance of the coated tubular ceramic membranes by
multilayers of TiO2 for removal a group of antibiotics contaminants.
After the successful coating process of the tubular ceramic membranes, their
efficiency of those membranes will be examined to remove of three antibiotics most
frequently identified in the aquatic environment such as, sulfamethazine, oxytetracycline,
tetracycline. Also, the effect of presence of organic and inorganic compounds on antibiotics
removal will be studied.
6.2.2. Degradation Mechanisms Analysis of Photocatalytic
The major intermediates formed during sulfamethazine photocatalytic degradation
and their analogues will be detected or deduced by analyzing the taken samples from the
influent and permeate flow using HPLC/MS/MS. Also, this study will investigate their
degradation behaviors.
6.2.3. Flow rates of inflow and retentate
The effects of using different flow rates of inflow and retentate will be investigated
on the degradation process of SMT. The operating flow rates will be adjusted by hand
operation using the flow control valves installed in the flowmeters and the valve in the
permeate flow line.
6.2.4. Time of illumination by UV-light
To study the effect of illumination time on photodegradation efficiency of SMZ,
the efficiency of photodegradation at different time periods will be carried out by turning
the UV-light at different time (20, 30, 40, 60 min) and pH (2, 5, 8).
92
7. Reference:
[1] D. Altieri, “The effects of overpopulation on water resources and water security,” Dep.
Eng. Swart. Coll. Available Fubini Swart. Edu∼ ENVS2danEssay4 Html, 2016.
[2] N. Ngwuluka, N. Ochekpe, and P. Odumosu, “An assessment of pharmaceutical waste
management in some Nigerian pharmaceutical industries,” Afr. J. Biotechnol., vol.
10, pp. 11259–11264, Sep. 2011.
[3] T. Dey, Nanotechnology for Water Purification. Universal-Publishers, 2012.
[4] “1 in 3 people globally do not have access to safe drinking water – UNICEF, WHO.”
https://www.unicef.org/press-releases/1-3-people-globally-do-not-have-access-safe-
drinking-water-unicef-who (accessed Oct. 05, 2019).
[5] M. T. Amin, A. A. Alazba, and U. Manzoor, “A review of removal of pollutants from
water/wastewater using different types of nanomaterials,” Adv. Mater. Sci. Eng., vol.
2014, 2014.
[6] M. Kamali, K. M. Persson, M. E. Costa, and I. Capela, “Sustainability criteria for
assessing nanotechnology applicability in industrial wastewater treatment: Current
status and future outlook,” Environ. Int., vol. 125, pp. 261–276, 2019.
[7] M. T. Amin, A. A. Alazba, and U. Manzoor, “A review of removal of pollutants from
water/wastewater using different types of nanomaterials,” Adv. Mater. Sci. Eng., vol.
2014, 2014.
[8] A. Kraus, K. Jainae, F. Unob, and N. Sukpirom, “Synthesis of MPTS-modified cobalt
ferrite nanoparticles and their adsorption properties in relation to Au (III),” J. Colloid
Interface Sci., vol. 338, no. 2, pp. 359–365, 2009.

93
[9] A. K. M. Hussain, “Application of advanced adsorption processes for dissolved organic
matter and heavy metal removal from water sources,” PhD Thesis, University of
Missouri–Columbia, 2015.
[10] N. Vieno, T. Tuhkanen, and L. Kronberg, “Removal of pharmaceuticals in drinking
water treatment: effect of chemical coagulation,” Environ. Technol., vol. 27, no. 2,
pp. 183–192, 2006.
[11] I. Gehrke, A. Geiser, and A. Somborn-Schulz, “Innovations in nanotechnology for
water treatment,” Nanotechnol. Sci. Appl., vol. 8, p. 1, 2015.
[12] R. J. Narayan, P. N. Kumta, C. Sfeir, D.-H. Lee, D. Choi, and D. Olton,
“Nanostructured ceramics in medical devices: applications and prospects,” Jom, vol.
56, no. 10, p. 38, 2004.
[13] A. Lagashetty and A. M. Bhavikatti, “Nanotechnology-an overview,” 2009.
[14] I. El Saliby, H. Shon, J. Kandasamy, and S. Vigneswaran, “Nanotechnology for water
and wastewater treatment: in brief,” Water Wastewater Treat. Technol. Encycl. Life
Support Syst. EOLSS, 2009.
[15] E. Zekić, Ž. Vuković, and I. Halkijević, “Application of nanotechnology in
wastewater treatment,” Gra\djevinar, vol. 70, no. 04., pp. 315–323, 2018.
[16] M. Taran, M. Safaei, N. Karimi, and A. Almasi, “Benefits and Application of
Nanotechnology in Environmental Science: an Overview.”
[17] S. Bayda, M. Adeel, T. Tuccinardi, M. Cordani, and F. Rizzolio, “The history of
nanoscience and nanotechnology: From chemical–physical applications to
nanomedicine,” Molecules, vol. 25, no. 1, p. 112, 2020.

94
[18] F. Sanchez and K. Sobolev, “Nanotechnology in concrete–a review,” Constr. Build.
Mater., vol. 24, no. 11, pp. 2060–2071, 2010.
[19] X. Qu, P. J. Alvarez, and Q. Li, “Applications of nanotechnology in water and
wastewater treatment,” Water Res., vol. 47, no. 12, pp. 3931–3946, 2013.
[20] D. V. Singh et al., “Wonders of Nanotechnology for Remediation of Polluted Aquatic
Environs,” in Fresh Water Pollution Dynamics and Remediation, Springer, 2020, pp.
319–339.
[21] S. Chaturvedi, P. N. Dave, and N. K. Shah, “Applications of nano-catalyst in new
era,” J. Saudi Chem. Soc., vol. 16, no. 3, pp. 307–325, 2012.
[22] S. Kanchi, “Nanotechnology for water treatment,” J Env. Anal Chem, vol. 1, no. 2,
pp. 1–3, 2014.
[23] D. Mohan and C. U. Pittman Jr, “Arsenic removal from water/wastewater using
adsorbents—a critical review,” J. Hazard. Mater., vol. 142, no. 1–2, pp. 1–53, 2007.
[24] J. Theron, J. A. Walker, and T. E. Cloete, “Nanotechnology and water treatment:
applications and emerging opportunities,” Crit. Rev. Microbiol., vol. 34, no. 1, pp.
43–69, 2008.
[25] A. M. Awad et al., “Adsorption of organic pollutants by nanomaterial-based
adsorbents: An overview,” J. Mol. Liq., p. 112335, 2020.
[26] M. M. Benjamin and D. F. Lawler, Water quality engineering: Physical/chemical
treatment processes. John Wiley & Sons, 2013.
[27] A. K. M. Hussain, “Application of advanced adsorption processes for dissolved
organic matter and heavy metal removal from water sources,” PhD Thesis, University
of Missouri–Columbia, 2015.

95
[28] Y. Jeong, “The adsorption of arsenic (V) by iron (Fe2O3) and aluminum (Al2O3)
oxides,” 2005.
[29] S. Z. N. Ahmad, W. N. W. Salleh, A. F. Ismail, N. Yusof, M. Z. M. Yusop, and F.
Aziz, “Adsorptive removal of heavy metal ions using graphene-based nanomaterials:
Toxicity, roles of functional groups and mechanisms,” Chemosphere, vol. 248, p.
126008, 2020.
[30] Y. Zhang, W. Peng, L. Xia, and S. Song, “Adsorption of Cd(II) at the Interface of
water and graphene oxide prepared from flaky graphite and amorphous graphite,” J.
Environ. Chem. Eng., vol. 5, no. 4, pp. 4157–4164, Aug. 2017, doi:
10.1016/j.jece.2017.08.004.
[31] Y. B. Onundi, A. A. Mamun, M. F. Al Khatib, and Y. M. Ahmed, “Adsorption of
copper, nickel and lead ions from synthetic semiconductor industrial wastewater by
palm shell activated carbon,” Int. J. Environ. Sci. Technol., vol. 7, no. 4, pp. 751–758,
2010.
[32] Y. Subbareddy et al., “A facile approach of adsorption of acid blue 9 on aluminium
silicate-coated fuller’s earth-equilibrium and kinetics studies,” Surf. Interfaces, p.
100503, 2020.
[33] S. P. Ghaleh, E. Khodapanah, and S. A. Tabatabaei-Nezhad, “Comprehensive
monolayer two-parameter isotherm and kinetic studies of thiamine adsorption on clay
minerals: Experimental and modeling approaches,” J. Mol. Liq., p. 112942, 2020.
[34] N. Jiang, R. Shang, S. G. Heijman, and L. C. Rietveld, “Adsorption of triclosan,
trichlorophenol and phenol by high-silica zeolites: Adsorption efficiencies and
mechanisms,” Sep. Purif. Technol., vol. 235, p. 116152, 2020.

96
[35] K. Balasubramani, N. Sivarajasekar, and M. Naushad, “Effective adsorption of
antidiabetic pharmaceutical (metformin) from aqueous medium using graphene oxide
nanoparticles: Equilibrium and statistical modelling,” J. Mol. Liq., vol. 301, p.
112426, 2020.
[36] H. Su, Z. Ye, and N. Hmidi, “High-performance iron oxide–graphene oxide
nanocomposite adsorbents for arsenic removal,” Colloids Surf. Physicochem. Eng.
Asp., vol. 522, pp. 161–172, 2017.
[37] F. Yu, J. Ma, and D. Bi, “Enhanced adsorptive removal of selected pharmaceutical
antibiotics from aqueous solution by activated graphene,” Environ. Sci. Pollut. Res.,
vol. 22, no. 6, pp. 4715–4724, Mar. 2015, doi: 10.1007/s11356-014-3723-9.
[38] S. Eigler and A. Hirsch, “Chemistry with Graphene and Graphene Oxide—
Challenges for Synthetic Chemists,” Angew. Chem. Int. Ed., vol. 53, no. 30, pp. 7720–
7738, 2014, doi: 10.1002/anie.201402780.
[39] A. Bianco et al., “All in the graphene family – A recommended nomenclature for two-
dimensional carbon materials,” Carbon, vol. 65, pp. 1–6, Dec. 2013, doi:
10.1016/j.carbon.2013.08.038.
[40] J. Wang et al., “Exploration of the adsorption performance and mechanism of zeolitic
imidazolate framework-8@graphene oxide for Pb(II) and 1-naphthylamine from
aqueous solution,” J. Colloid Interface Sci., vol. 542, pp. 410–420, Apr. 2019, doi:
10.1016/j.jcis.2019.02.039.
[41] G. Ersan, O. G. Apul, F. Perreault, and T. Karanfil, “Adsorption of organic
contaminants by graphene nanosheets: A review,” Water Res., vol. 126, pp. 385–398,
Dec. 2017, doi: 10.1016/j.watres.2017.08.010.

97
[42] N. M. Mahmoodi, M. Oveisi, and E. Asadi, “Synthesis of NENU metal-organic
framework-graphene oxide nanocomposites and their pollutant removal ability from
water using ultrasound,” J. Clean. Prod., vol. 211, pp. 198–212, Feb. 2019, doi:
10.1016/j.jclepro.2018.11.136.
[43] J. Wang et al., “Exploration of the adsorption performance and mechanism of zeolitic
imidazolate framework-8@graphene oxide for Pb(II) and 1-naphthylamine from
aqueous solution,” J. Colloid Interface Sci., vol. 542, pp. 410–420, Apr. 2019, doi:
10.1016/j.jcis.2019.02.039.
[44] L. Li, Z. Shi, H. Zhu, W. Hong, F. Xie, and K. Sun, “Adsorption of azo dyes from
aqueous solution by the hybrid MOFs/GO,” Water Sci. Technol., vol. 73, no. 7, pp.
1728–1737, Apr. 2016, doi: 10.2166/wst.2016.009.
[45] K. Soleimani, A. D. Tehrani, and M. Adeli, “Bioconjugated graphene oxide hydrogel
as an effective adsorbent for cationic dyes removal,” Ecotoxicol. Environ. Saf., vol.
147, pp. 34–42, Jan. 2018, doi: 10.1016/j.ecoenv.2017.08.021.
[46] J. Li et al., “Removal of Cu (II) and fulvic acid by graphene oxide nanosheets
decorated with Fe3O4 nanoparticles,” ACS Appl. Mater. Interfaces, vol. 4, no. 9, pp.
4991–5000, 2012.
[47] C. N. R. Rao, U. Maitra, and H. Matte, “Synthesis, characterization, and selected
properties of graphene,” Graphene Synth. Prop. Phenom., 2012.
[48] L. Jothinathan and J. Hu, “Kinetic evaluation of graphene oxide based heterogenous
catalytic ozonation for the removal of ibuprofen,” Water Res., vol. 134, pp. 63–73,
2018.

98
[49] N. M. Mahmoodi, M. Oveisi, and E. Asadi, “Synthesis of NENU metal-organic
framework-graphene oxide nanocomposites and their pollutant removal ability from
water using ultrasound,” J. Clean. Prod., vol. 211, pp. 198–212, 2019.
[50] H. Wang, C. Wang, S. Liu, L. Chen, and S. Yang, “Superhydrophobic and
superoleophilic graphene aerogel for adsorption of oil pollutants from water,” RSC
Adv., vol. 9, no. 15, pp. 8569–8574, 2019.
[51] M. Sarno, M. Casa, C. Cirillo, and P. Ciambelli, “Complete removal of persistent
pesticide using reduced graphene oxide- silver nanocomposite,” Chem. Eng. Trans.,
vol. 60, pp. 151–156, 2017.
[52] P. Chen et al., “Insights into the synergetic mechanism of a combined vis-
RGO/TiO2/peroxodisulfate system for the degradation of PPCPs: Kinetics,
environmental factors and products,” Chemosphere, vol. 216, pp. 341–351, 2019.
[53] M. S. Samuel, Sk. S. Shah, J. Bhattacharya, K. Subramaniam, and N. D. Pradeep
Singh, “Adsorption of Pb(II) from aqueous solution using a magnetic
chitosan/graphene oxide composite and its toxicity studies,” Int. J. Biol. Macromol.,
vol. 115, pp. 1142–1150, Aug. 2018, doi: 10.1016/j.ijbiomac.2018.04.185.
[54] W. J. Stark, P. R. Stoessel, W. Wohlleben, and A. Hafner, “Industrial applications of
nanoparticles,” Chem. Soc. Rev., vol. 44, no. 16, pp. 5793–5805, 2015.
[55] S. Singh, V. Kumar, R. Romero, K. Sharma, and J. Singh, “Applications of
Nanoparticles in Wastewater Treatment,” in Nanobiotechnology in Bioformulations,
Springer, 2019, pp. 395–418.

99
[56] K. R. Kunduru, M. Nazarkovsky, S. Farah, R. P. Pawar, A. Basu, and A. J. Domb,
“Nanotechnology for water purification: applications of nanotechnology methods in
wastewater treatment,” in Water Purification, Elsevier, 2017, pp. 33–74.
[57] N. Ilankoon, “Use of iron oxide magnetic nanosorbents for Cr (VI) removal from
aqueous solutions: A review,” J. Eng. Res. Appl., vol. 4, no. 10, pp. 55–63, 2014.
[58] K. E. Engates, Characterization, sorption, and exhaustion of metal oxide
nanoparticles as metal adsorbents. The University of Texas at San Antonio, 2010.
[59] H. J. Shipley, K. E. Engates, and V. A. Grover, “Removal of Pb (II), Cd (II), Cu (II),
and Zn (II) by hematite nanoparticles: effect of sorbent concentration, pH,
temperature, and exhaustion,” Environ. Sci. Pollut. Res., vol. 20, no. 3, pp. 1727–
1736, 2013.
[60] A. Fakhri and S. Adami, “Adsorption and thermodynamic study of Cephalosporins
antibiotics from aqueous solution onto MgO nanoparticles,” J. Taiwan Inst. Chem.
Eng., vol. 45, no. 3, pp. 1001–1006, 2014.
[61] H. Park, N. V. Myung, H. Jung, and H. Choi, “As (V) remediation using
electrochemically synthesized maghemite nanoparticles,” J. Nanoparticle Res., vol.
11, no. 8, p. 1981, 2009.
[62] Y. Huang, A. N. Fulton, and A. A. Keller, “Optimization of porous structure of
superparamagnetic nanoparticle adsorbents for higher and faster removal of emerging
organic contaminants and PAHs,” Environ. Sci. Water Res. Technol., vol. 2, no. 3,
pp. 521–528, 2016.
[63] M. Mulder, Basic principles of membrane technology. Springer Science & Business
Media, 2012.

100
[64] D. V. Quang et al., “Effective water disinfection using silver nanoparticle containing
silica beads,” Appl. Surf. Sci., vol. 266, pp. 280–287, 2013.
[65] A. Lee, J. W. Elam, and S. B. Darling, “Membrane materials for water purification:
design, development, and application,” Environ. Sci. Water Res. Technol., vol. 2, no.
1, pp. 17–42, 2016.
[66] F. Senusi, M. Shahadat, S. Ismail, and S. A. Hamid, “Recent advancement in
membrane technology for water purification,” in Modern Age Environmental
Problems and their Remediation, Springer, 2018, pp. 147–167.
[67] D. M. Warsinger et al., “A review of polymeric membranes and processes for potable
water reuse,” Prog. Polym. Sci., vol. 81, pp. 209–237, 2018.
[68] C. Feng, K. C. Khulbe, T. Matsuura, S. Tabe, and A. F. Ismail, “Preparation and
characterization of electro-spun nanofiber membranes and their possible applications
in water treatment,” Sep. Purif. Technol., vol. 102, pp. 118–135, 2013.
[69] P. Geng and G. Chen, “Antifouling ceramic membrane electrode modified by Magnéli
Ti4O7 for electro-microfiltration of humic acid,” Sep. Purif. Technol., vol. 185, pp.
61–71, 2017.
[70] M. Wegmann, B. Michen, and T. Graule, “Nanostructured surface modification of
microporous ceramics for efficient virus filtration,” J. Eur. Ceram. Soc., vol. 28, no.
8, pp. 1603–1612, 2008.
[71] S. P. Suriyaraj, A. Bhattacharyya, and R. Selvakumar, “Hybrid Al 2 O 3/bio-TiO 2
nanocomposite impregnated thermoplastic polyurethane (TPU) nanofibrous
membrane for fluoride removal from aqueous solutions,” RSC Adv., vol. 5, no. 34,
pp. 26905–26912, 2015.

101
[72] P. Lens, J. Virkutyte, V. Jegatheesan, and S. Al-Abed, Nanotechnology for water and
wastewater treatment. Iwa Publishing, 2013.
[73] “Nanotechnology for Water Remediation Jiban Saikia,... - Google Scholar.”
https://scholar.google.com/scholar?hl=en&as_sdt=0%2C26&q=Nanotechnology+fo
r+Water+Remediation+Jiban+Saikia%2C+Abhijit+Gogoi%2C+and+Sukanya+Baru
ah&btnG= (accessed May 09, 2020).
[74] Z. Zhang, C.-C. Wang, R. Zakaria, and J. Y. Ying, “Role of particle size in
nanocrystalline TiO2-based photocatalysts,” J. Phys. Chem. B, vol. 102, no. 52, pp.
10871–10878, 1998.
[75] V. Keuter and I. Gehrke, “Development of Multibarrier Systems Consisting of Nano-
Enhanced Membranes and UV-LEDs for Water Purification Applications,” Procedia
Eng., no. 44, pp. 544–545, 2012.
[76] A. Mezni et al., “Facile synthesis of highly thermally stable TiO 2 photocatalysts,”
New J. Chem., vol. 41, no. 12, pp. 5021–5027, 2017.
[77] S.-Y. Lee and S.-J. Park, “TiO2 photocatalyst for water treatment applications,” J.
Ind. Eng. Chem., vol. 19, no. 6, pp. 1761–1769, 2013.
[78] Q. Xiang, J. Yu, and P. K. Wong, “Quantitative characterization of hydroxyl radicals
produced by various photocatalysts,” J. Colloid Interface Sci., vol. 357, no. 1, pp.
163–167, 2011.
[79] W. T. Frankenberger Jr, Environmental chemistry of arsenic. CRC Press, 2001.
[80] J. F. Ferguson and J. Gavis, “A review of the arsenic cycle in natural waters,” Water
Res., vol. 6, no. 11, pp. 1259–1274, 1972.

102
[81] K. N. Ghimire, K. Inoue, H. Yamaguchi, K. Makino, and T. Miyajima, “Adsorptive
separation of arsenate and arsenite anions from aqueous medium by using orange
waste,” Water Res., vol. 37, no. 20, pp. 4945–4953, 2003.
[82] Y. Jeong, “The adsorption of arsenic (V) by iron (Fe2O3) and aluminum (Al2O3)
oxides,” 2005.
[83] J. G. Hering, P.-Y. Chen, J. A. Wilkie, M. Elimelech, and S. Liang, “Arsenic removal
by ferric chloride,” J.-Am. Water Works Assoc., vol. 88, no. 4, pp. 155–167, 1996.
[84] T. Yuan, J. Yong Hu, S. L. Ong, Q. F. Luo, and W. Jun Ng, “Arsenic removal from
household drinking water by adsorption,” J. Environ. Sci. Health Part A, vol. 37, no.
9, pp. 1721–1736, 2002.
[85] P. L. Smedley and D. G. Kinniburgh, “A review of the source, behaviour and
distribution of arsenic in natural waters,” Appl. Geochem., vol. 17, no. 5, pp. 517–
568, May 2002, doi: 10.1016/S0883-2927(02)00018-5.
[86] D. K. Nordstrom, Worldwide occurrences of arsenic in ground water. American
Association for the Advancement of Science, 2002.
[87] M.-J. Kim, J. Nriagu, and S. Haack, “Arsenic species and chemistry in groundwater
of southeast Michigan,” Environ. Pollut., vol. 120, no. 2, pp. 379–390, 2002.
[88] S. R. Hinkle and D. J. Polette, Arsenic in ground water of the Willamette Basin,
Oregon, vol. 98. US Department of the Interior, US Geological Survey, 1999.
[89] I. A. for R. on Cancer, “Arsenic, metals, fibres, and dusts. Volume 100 C. A review
of human carcinogens,” IARC Monogr. Eval. Carcinog. Risks Hum. Lyon FR Int.
Agency Res. Cancer Arsen. Arsen. Compd., pp. 41–94, 2012.

103
[90] A. H. Welch, D. B. Westjohn, D. R. Helsel, and R. B. Wanty, “Arsenic in ground
water of the United States: Occurence and geochemistry,” Ground Water, vol. 38, no.
4, p. 589, 2000.
[91] A. H. Smith, P. A. Lopipero, M. N. Bates, and C. M. Steinmaus, Arsenic epidemiology
and drinking water standards. American Association for the Advancement of
Science, 2002.
[92] A. K. Sarmah, M. T. Meyer, and A. B. Boxall, “A global perspective on the use, sales,
exposure pathways, occurrence, fate and effects of veterinary antibiotics (VAs) in the
environment,” Chemosphere, vol. 65, no. 5, pp. 725–759, 2006.
[93] “Pharmaceuticals, Hormones, and Other Organic Wastewater Contaminants in U.S.
Streams, 1999−2000: A National Reconnaissance | Environmental Science &
Technology.” https://pubs.acs.org/doi/10.1021/es011055j (accessed Jan. 22, 2021).
[94] R. Hirsch, T. Ternes, K. Haberer, and K.-L. Kratz, “Occurrence of antibiotics in the
aquatic environment,” Sci. Total Environ., vol. 225, no. 1, pp. 109–118, Jan. 1999,
doi: 10.1016/S0048-9697(98)00337-4.
[95] J. Wang, T. Zhou, J. Mao, and X. Wu, “Comparative study of sulfamethazine
degradation in visible light induced photo-Fenton and photo-Fenton-like systems,” J.
Environ. Chem. Eng., vol. 3, no. 4, pp. 2393–2400, 2015.
[96] C.-C. Lin and M.-S. Wu, “Feasibility of using UV/H2O2 process to degrade
sulfamethazine in aqueous solutions in a large photoreactor,” J. Photochem.
Photobiol. Chem., vol. 367, pp. 446–451, 2018.

104
[97] N. Wang et al., “Enhanced photocatalytic degradation of sulfamethazine by Bi-doped
TiO2 nano-composites supported by powdered activated carbon under visible light
irradiation,” Sep. Purif. Technol., vol. 211, pp. 673–683, 2019.
[98] M. G. Alalm, A. Tawfik, and S. Ookawara, “Comparison of solar TiO2 photocatalysis
and solar photo-Fenton for treatment of pesticides industry wastewater: operational
conditions, kinetics, and costs,” J. Water Process Eng., vol. 8, pp. 55–63, 2015.
[99] Z. Qiang, X. Bao, and W. Ben, “MCM-48 modified magnetic mesoporous
nanocomposite as an attractive adsorbent for the removal of sulfamethazine from
water,” Water Res., vol. 47, no. 12, pp. 4107–4114, 2013.
[100] M. Taheran, S. K. Brar, M. Verma, R. Y. Surampalli, T. C. Zhang, and J. R. Valéro,
“Membrane processes for removal of pharmaceutically active compounds (PhACs)
from water and wastewaters,” Sci. Total Environ., vol. 547, pp. 60–77, 2016.
[101] J. Wang and L. Chu, “Irradiation treatment of pharmaceutical and personal care
products (PPCPs) in water and wastewater: an overview,” Radiat. Phys. Chem., vol.
125, pp. 56–64, 2016.
[102] G. Ungureanu, S. Santos, R. Boaventura, and C. Botelho, “Arsenic and antimony in
water and wastewater: overview of removal techniques with special reference to latest
advances in adsorption,” J. Environ. Manage., vol. 151, pp. 326–342, 2015.
[103] T. S. Choong, T. G. Chuah, Y. Robiah, F. G. Koay, and I. Azni, “Arsenic toxicity,
health hazards and removal techniques from water: an overview,” Desalination, vol.
217, no. 1–3, pp. 139–166, 2007.

105
[104] H. Su, Z. Ye, and N. Hmidi, “High-performance iron oxide–graphene oxide
nanocomposite adsorbents for arsenic removal,” Colloids Surf. Physicochem. Eng.
Asp., vol. 522, pp. 161–172, 2017.
[105] J. A. Cotruvo, “2017 WHO Guidelines for Drinking Water Quality: First Addendum
to the Fourth Edition,” J.-Am. Water Works Assoc., vol. 109, no. 7, pp. 44–51, 2017.
[106] R. Zakhar, J. Derco, and F. Čacho, “An overview of main arsenic removal
technologies,” Acta Chim. Slovaca, vol. 11, no. 2, pp. 107–113, 2018.
[107] S. Lata and S. R. Samadder, “Removal of arsenic from water using nano adsorbents
and challenges: a review,” J. Environ. Manage., vol. 166, pp. 387–406, 2016.
[108] D. Mohan and C. U. Pittman Jr, “Arsenic removal from water/wastewater using
adsorbents—a critical review,” J. Hazard. Mater., vol. 142, no. 1–2, pp. 1–53, 2007.
[109] P. Sabbatini, F. Yrazu, F. Rossi, G. Thern, A. Marajofsky, and M. F. de Cortalezzi,
“Fabrication and characterization of iron oxide ceramic membranes for arsenic
removal,” Water Res., vol. 44, no. 19, pp. 5702–5712, 2010.
[110] T. M. McCoy, P. Brown, J. Eastoe, and R. F. Tabor, “Noncovalent magnetic control
and reversible recovery of graphene oxide using iron oxide and magnetic surfactants,”
ACS Appl. Mater. Interfaces, vol. 7, no. 3, pp. 2124–2133, 2015.
[111] R. Zacharia, H. Ulbricht, and T. Hertel, “Interlayer cohesive energy of graphite from
thermal desorption of polyaromatic hydrocarbons,” Phys. Rev. B, vol. 69, no. 15, p.
155406, 2004.
[112] J. Li et al., “Reduced aggregation and cytotoxicity of amyloid peptides by graphene
oxide/gold nanocomposites prepared by pulsed laser ablation in water,” Small, vol.
10, no. 21, pp. 4386–4394, 2014.

106
[113] I. Ahmad et al., “Graphene oxide-iron oxide nanocomposite as an inhibitor of Aβ 42
amyloid peptide aggregation,” Colloids Surf. B Biointerfaces, vol. 159, pp. 540–545,
2017.
[114] S. Yean et al., “Effect of magnetite particle size on adsorption and desorption of
arsenite and arsenate,” J. Mater. Res., vol. 20, no. 12, pp. 3255–3264, 2005.
[115] S. C. Tang and I. M. Lo, “Magnetic nanoparticles: essential factors for sustainable
environmental applications,” Water Res., vol. 47, no. 8, pp. 2613–2632, 2013.
[116] U. Schwertmann and R. M. Cornell, Iron oxides in the laboratory. John Wiley &
Sons, 2008.
[117] M. Storms, Surface interactions between nanoscale iron and organic material:
potential uses in water treatment process units. University of Missouri-Columbia,
2015.
[118] J. Chen, B. Yao, C. Li, and G. Shi, “An improved Hummers method for eco-friendly
synthesis of graphene oxide,” Carbon, vol. 64, pp. 225–229, 2013.
[119] N. S. Abdullah, S. S. Sharifuddin, and M. Hussin, “Study on Adsorption of Mercury
from Aqueous Solution on Activated Carbons Prepared from Palm Kernel Shell,” in
Key Engineering Materials, 2018, vol. 783, pp. 109–114.
[120] M. Li, C. Liu, Y. Xie, H. Cao, H. Zhao, and Y. Zhang, “The evolution of surface
charge on graphene oxide during the reduction and its application in electroanalysis,”
Carbon, vol. 66, pp. 302–311, 2014.
[121] D. C. Marcano et al., “Improved synthesis of graphene oxide,” ACS Nano, vol. 4, no.
8, pp. 4806–4814, 2010.

107
[122] F. T. Johra, J.-W. Lee, and W.-G. Jung, “Facile and safe graphene preparation on
solution based platform,” J. Ind. Eng. Chem., vol. 20, no. 5, pp. 2883–2887, 2014.
[123] M. Li, C. Liu, Y. Xie, H. Cao, H. Zhao, and Y. Zhang, “The evolution of surface
charge on graphene oxide during the reduction and its application in electroanalysis,”
Carbon, vol. 66, pp. 302–311, 2014.
[124] E. Repo, M. Mäkinen, S. Rengaraj, G. Natarajan, A. Bhatnagar, and M. Sillanpää,
“Lepidocrocite and its heat-treated forms as effective arsenic adsorbents in aqueous
medium,” Chem. Eng. J., vol. 180, pp. 159–169, 2012.
[125] P. Lian, X. Zhu, S. Liang, Z. Li, W. Yang, and H. Wang, “Large reversible capacity
of high quality graphene sheets as an anode material for lithium-ion batteries,”
Electrochimica Acta, vol. 55, no. 12, pp. 3909–3914, 2010.
[126] R. M. Cornell and U. Schwertmann, The iron oxides: structure, properties, reactions,
occurrences and uses. John Wiley & Sons, 2003.
[127] Z. Wang, D. Xu, Y. Huang, Z. Wu, L. Wang, and X. Zhang, “Facile, mild and fast
thermal-decomposition reduction of graphene oxide in air and its application in high-
performance lithium batteries,” Chem. Commun., vol. 48, no. 7, pp. 976–978, 2012.
[128] H. Su, Z. Ye, and N. Hmidi, “High-performance iron oxide–graphene oxide
nanocomposite adsorbents for arsenic removal,” Colloids Surf. Physicochem. Eng.
Asp., vol. 522, pp. 161–172, 2017.
[129] S. Stankovich et al., “Synthesis of graphene-based nanosheets via chemical reduction
of exfoliated graphite oxide,” carbon, vol. 45, no. 7, pp. 1558–1565, 2007.
[130] A. Lassoued, M. S. Lassoued, B. Dkhil, S. Ammar, and A. Gadri, “Synthesis,
photoluminescence and Magnetic properties of iron oxide (α-Fe2O3) nanoparticles

108
through precipitation or hydrothermal methods,” Phys. E Low-Dimens. Syst.
Nanostructures, vol. 101, pp. 212–219, 2018.
[131] V. Rebuttini, “Functional iron oxide-based hybrid nanostructures,” 2014.
[132] Y. Zhang et al., “What factors control the mechanical properties of poly
(dimethylsiloxane) reinforced with nanosheets of 3-aminopropyltriethoxysilane
modified graphene oxide?,” Polymer, vol. 54, no. 14, pp. 3605–3611, 2013.
[133] M. Baikousi et al., “Synthesis and characterization of γ-Fe2O3/carbon hybrids and
their application in removal of hexavalent chromium ions from aqueous solutions,”
Langmuir, vol. 28, no. 8, pp. 3918–3930, 2012.
[134] F. Yu, S. Sun, J. Ma, and S. Han, “Enhanced removal performance of arsenate and
arsenite by magnetic graphene oxide with high iron oxide loading,” Phys. Chem.
Chem. Phys., vol. 17, no. 6, pp. 4388–4397, 2015.
[135] A. Sharma, N. Verma, A. Sharma, D. Deva, and N. Sankararamakrishnan, “Iron
doped phenolic resin based activated carbon micro and nanoparticles by milling:
Synthesis, characterization and application in arsenic removal,” Chem. Eng. Sci., vol.
65, no. 11, pp. 3591–3601, Jun. 2010, doi: 10.1016/j.ces.2010.02.052.
[136] W. Tang, Q. Li, S. Gao, and J. K. Shang, “Arsenic (III, V) removal from aqueous
solution by ultrafine α-Fe2O3 nanoparticles synthesized from solvent thermal
method,” J. Hazard. Mater., vol. 192, no. 1, pp. 131–138, 2011.
[137] S. Lin, D. Lu, and Z. Liu, “Removal of arsenic contaminants with magnetic γ-Fe2O3
nanoparticles,” Chem. Eng. J., vol. 211, pp. 46–52, 2012.

109
[138] L. M. Tung et al., “Superparamagnetic Iron Oxide@ Carbon Core–Shell
Nanoparticles as Advanced Adsorbent for Efficient Removal of As (V) Ions From
Wastewater,” IEEE Trans. Magn., vol. 54, no. 6, pp. 1–6, 2018.
[139] Y. S. Ho and G. McKay, “The kinetics of sorption of divalent metal ions onto
sphagnum moss peat,” Water Res., vol. 34, no. 3, pp. 735–742, Feb. 2000, doi:
10.1016/S0043-1354(99)00232-8.
[140] M. Gallegos-Garcia, K. Ramírez-Muñiz, and S. Song, “Arsenic removal from water
by adsorption using iron oxide minerals as adsorbents: a review,” Miner. Process.
Extr. Metall. Rev., vol. 33, no. 5, pp. 301–315, 2012.
[141] P. S. Goh, W. J. Lau, M. H. D. Othman, and A. F. Ismail, “Membrane fouling in
desalination and its mitigation strategies,” Desalination, vol. 425, pp. 130–155, 2018.
[142] H. Ravishankar, J. Christy, and V. Jegatheesan, “Graphene oxide (GO)-Blended
polysulfone (PSf) ultrafiltration membranes for lead ion rejection,” Membranes, vol.
8, no. 3, p. 77, 2018.
[143] C. Liyanage and K. Yamada, “Impact of population growth on the water quality of
natural water bodies,” Sustainability, vol. 9, no. 8, p. 1405, 2017.
[144] S. Azizi, I. Kamika, and M. Tekere, “Evaluation of heavy metal removal from
wastewater in a modified packed bed biofilm reactor,” PloS One, vol. 11, no. 5, p.
e0155462, 2016.
[145] C. F. Couto, L. C. Lange, and M. C. S. Amaral, “A critical review on membrane
separation processes applied to remove pharmaceutically active compounds from
water and wastewater,” J. Water Process Eng., vol. 26, pp. 156–175, 2018.

110
[146] T. A. Kurniawan, G. Y. Chan, W.-H. Lo, and S. Babel, “Physico–chemical treatment
techniques for wastewater laden with heavy metals,” Chem. Eng. J., vol. 118, no. 1–
2, pp. 83–98, 2006.
[147] H. J. Kim, H. R. Pant, J. H. Kim, N. J. Choi, and C. S. Kim, “Fabrication of
multifunctional TiO2–fly ash/polyurethane nanocomposite membrane via
electrospinning,” Ceram. Int., vol. 40, no. 2, pp. 3023–3029, 2014.
[148] Y. Wang, R. Ou, Q. Ge, H. Wang, and T. Xu, “Preparation of
polyethersulfone/carbon nanotube substrate for high-performance forward osmosis
membrane,” Desalination, vol. 330, pp. 70–78, 2013.
[149] X. Song, Z. Liu, and D. D. Sun, “Energy recovery from concentrated seawater brine
by thin-film nanofiber composite pressure retarded osmosis membranes with high
power density,” Energy Environ. Sci., vol. 6, no. 4, pp. 1199–1210, 2013.
[150] S. Yang et al., “Polypropylene membrane surface modification by RAFT grafting
polymerization and TiO2 photocatalysts immobilization for phenol decomposition in
a photocatalytic membrane reactor,” Sep. Purif. Technol., vol. 83, pp. 157–165, 2011.
[151] H. Zhang et al., “Mineralization-inspired preparation of composite membranes with
polyethyleneimine–nanoparticle hybrid active layer for solvent resistant
nanofiltration,” J. Membr. Sci., vol. 470, pp. 70–79, 2014.
[152] M. R. Esfahani et al., “Nanocomposite membranes for water separation and
purification: Fabrication, modification, and applications,” Sep. Purif. Technol., 2018.
[153] G. Wu et al., “Titanium dioxide-supported non-precious metal oxygen reduction
electrocatalyst,” Chem. Commun., vol. 46, no. 40, pp. 7489–7491, 2010.

111
[154] C. Bian and G. Xue, “Nanocomposites based on rutile-TiO2 and polyaniline,” Mater.
Lett., vol. 61, no. 6, pp. 1299–1302, 2007.
[155] S. Rahim, M. S. Ghamsari, and S. Radiman, “Surface modification of titanium oxide
nanocrystals with PEG,” Sci. Iran., vol. 19, no. 3, pp. 948–953, 2012.
[156] Z. A. Boeva and V. G. Sergeyev, “Polyaniline: Synthesis, properties, and
application,” Polym. Sci. Ser. C, vol. 56, no. 1, pp. 144–153, 2014.
[157] Z. Cai, C. Wee, and M. M. Benjamin, “Fouling mechanisms in low-pressure
membrane filtration in the presence of an adsorbent cake layer,” J. Membr. Sci., vol.
433, pp. 32–38, 2013.
[158] G. Gésan, G. Daufin, U. Merin, J.-P. Labbé, and A. Quémerais, “Fouling during
constant flux crossflow microfiltration of pretreated whey. Influence of
transmembrane pressure gradient,” J. Membr. Sci., vol. 80, no. 1, pp. 131–145, 1993.
[159] D. J. Miller, S. Kasemset, D. R. Paul, and B. D. Freeman, “Comparison of membrane
fouling at constant flux and constant transmembrane pressure conditions,” J. Membr.
Sci., vol. 454, pp. 505–515, 2014.
[160] T. Distefano and S. Kelly, “Are we in deep water? Water scarcity and its limits to
economic growth,” Ecol. Econ., vol. 142, pp. 130–147, 2017.
[161] S. Kaniou, K. Pitarakis, I. Barlagianni, and I. Poulios, “Photocatalytic oxidation of
sulfamethazine,” Chemosphere, vol. 60, no. 3, pp. 372–380, 2005.
[162] Z. Wan, J. Hu, and J. Wang, “Removal of sulfamethazine antibiotics using CeFe-
graphene nanocomposite as catalyst by Fenton-like process,” J. Environ. Manage.,
vol. 182, pp. 284–291, Nov. 2016, doi: 10.1016/j.jenvman.2016.07.088.

112
[163] K. Alamelu and J. Ali, “TiO2-Pt composite photocatalyst for photodegradation and
chemical reduction of recalcitrant organic pollutants,” J. Environ. Chem. Eng., vol. 6,
no. 5, pp. 5720–5731, 2018.
[164] L. T. Nyamutswa, B. Zhu, D. Navaratna, S. Collins, and M. C. Duke, “Proof of
Concept for Light Conducting Membrane Substrate for UV-Activated Photocatalysis
as an Alternative to Chemical Cleaning,” Membranes, vol. 8, no. 4, p. 122, 2018.
[165] H. Vatankhah, C. C. Murray, J. W. Brannum, J. Vanneste, and C. Bellona, “Effect
of pre-ozonation on nanofiltration membrane fouling during water reuse
applications,” Sep. Purif. Technol., vol. 205, pp. 203–211, 2018.
[166] Z. Geng et al., “Self-cleaning anti-fouling hybrid ultrafiltration membranes via side
chain grafting of poly (aryl ether sulfone) and titanium dioxide,” J. Membr. Sci., vol.
529, pp. 1–10, 2017.
[167] R. Zhu et al., “Mechanism of humic acid fouling in a photocatalytic membrane
system,” J. Membr. Sci., vol. 563, pp. 531–540, 2018.
[168] L. De Angelis and M. M. F. de Cortalezzi, “Ceramic membrane filtration of organic
compounds: Effect of concentration, pH, and mixtures interactions on fouling,” Sep.
Purif. Technol., vol. 118, pp. 762–775, 2013.
[169] L. T. Nyamutswa, B. Zhu, S. F. Collins, D. Navaratna, and M. C. Duke, “Light
conducting photocatalytic membrane for chemical-free fouling control in water
treatment,” J. Membr. Sci., p. 118018, 2020.
[170] M. Hussain, “Ferroxane derived ceramic composite material as catalysts for
heterogenous Fenton reactions for dyes and pharmaceutical removal in water,” PhD
Thesis, University of Missouri–Columbia, 2016.

113
[171] S. Leong, A. Razmjou, K. Wang, K. Hapgood, X. Zhang, and H. Wang, “TiO2 based
photocatalytic membranes: a review,” J. Membr. Sci., vol. 472, pp. 167–184, 2014.
[172] S. Kaniou, K. Pitarakis, I. Barlagianni, and I. Poulios, “Photocatalytic oxidation of
sulfamethazine,” Chemosphere, vol. 60, no. 3, pp. 372–380, 2005.
[173] C. Zhou et al., “Visible-light-driven photocatalytic degradation of sulfamethazine by
surface engineering of carbon nitride: Properties, degradation pathway and
mechanisms,” J. Hazard. Mater., vol. 380, p. 120815, 2019.
[174] M. Diantoro, A. Kusumaatmaja, and K. Triyana, “Study on photocatalytic properties
of TiO2 nanoparticle in various pH condition,” in Journal of Physics: Conference
Series, 2018, vol. 1011, no. 1, p. 012069.
[175] C. Zhao, M. Pelaez, D. D. Dionysiou, S. C. Pillai, J. A. Byrne, and K. E. O’Shea,
“UV and visible light activated TiO2 photocatalysis of 6-hydroxymethyl uracil, a
model compound for the potent cyanotoxin cylindrospermopsin,” Catal. Today, vol.
224, pp. 70–76, 2014.
[176] D. Friedmann, C. Mendive, and D. Bahnemann, “TiO2 for water treatment:
Parameters affecting the kinetics and mechanisms of photocatalysis,” Appl. Catal. B
Environ., vol. 99, no. 3, pp. 398–406, Sep. 2010, doi: 10.1016/j.apcatb.2010.05.014.
[177] C. Zhao, M. Pelaez, D. D. Dionysiou, S. C. Pillai, J. A. Byrne, and K. E. O’Shea,
“UV and visible light activated TiO2 photocatalysis of 6-hydroxymethyl uracil, a
model compound for the potent cyanotoxin cylindrospermopsin,” Catal. Today, vol.
224, pp. 70–76, 2014.

114
[178] T.-W. Tzeng et al., “Photolysis and photocatalytic decomposition of sulfamethazine
antibiotics in an aqueous solution with TiO 2,” Rsc Adv., vol. 6, no. 73, pp. 69301–
69310, 2016.
[179] Z. Hao, C. Guo, J. Lv, Y. Zhang, Y. Zhang, and J. Xu, “Kinetic and mechanistic
study of sulfadimidine photodegradation under simulated sunlight irradiation,”
Environ. Sci. Eur., vol. 31, no. 1, p. 40, Dec. 2019, doi: 10.1186/s12302-019-0223-z.
[180] N. Zhang, G. Liu, H. Liu, Y. Wang, Z. He, and G. Wang, “Diclofenac
photodegradation under simulated sunlight: Effect of different forms of nitrogen and
Kinetics,” J. Hazard. Mater., vol. 192, no. 1, pp. 411–418, Aug. 2011, doi:
10.1016/j.jhazmat.2011.05.038.
[181] Y. Li, X. Qiao, Y. Zhang, C. Zhou, H. Xie, and J. Chen, “Effects of halide ions on
photodegradation of sulfonamide antibiotics: formation of halogenated
intermediates,” Water Res., vol. 102, pp. 405–412, 2016.
[182] R. Luo et al., “Singlet oxygen-dominated non-radical oxidation process for efficient
degradation of bisphenol A under high salinity condition,” Water Res., vol. 148, pp.
416–424, 2019.
[183] X. Zhuang et al., “Enhanced Sulfamerazine Removal via Adsorption–Photocatalysis
Using Bi2O3–TiO2/PAC Ternary Nanoparticles,” Water, vol. 12, no. 8, p. 2273,
2020.

115
VITA
Mohammed M. Numaan was born on January 1st, 1984 in Tikrit, Iraq. From 2001-
2005, he completed his bachelor’s degree in civil engineering at Tikrit University. He got
his master’s degree in Civil and Environmental Eng./water quality management at Tikrit
University in 2008. He has been working as a faculty member in Environmental Eng. Dept.,
and he published many articles in his field. In January 2016, he was sent by the Iraqi
Ministery of Higher education to complete his Ph.D from the University of Missouri-
Columbia/Civil and Environmental Eng. dept. He received his Ph.D degree in water
treatment on May 2021. He will start to find new solutions for contaminants removal from
water.