SUSTAINABLE WATER FILTRATION IN SANDIKHOLA
83
RUNNING HEAD: TEAM 21: SUSTAINABLE WATER FILTRATION IN SANDIKHOLA SUSTAINABLE WATER FILTRATION IN SANDIKHOLA Matthew FOSTER, Jordan BUTLER, Doug BIRD, Dylan ROBERTS, Craig BURNS, Faisal ALANAZI TEAM 21, EWB REPORT 2014 EDITH COWAN UNIVERSITY By
-
Upload
edithcowan -
Category
Documents
-
view
3 -
download
0
Transcript of SUSTAINABLE WATER FILTRATION IN SANDIKHOLA

RUNNING HEAD: TEAM 21: SUSTAINABLE WATER FILTRATION IN SANDIKHOLA
SUSTAINABLE WATER FILTRATION IN SANDIKHOLA
Matthew FOSTER, Jordan BUTLER, Doug
BIRD, Dylan ROBERTS, Craig BURNS, Faisal
ALANAZI
TEAM 21, EWB REPORT 2014
EDITH COWAN UNIVERSITY
By

SUSTAINABLE WATER FILTRATION IN SANDIKHOLA
1
EXECUTIVE SUMMARY
Sandikhola, Nepal, is a village whose water supply is heavily polluted with toxins
such as heavy metals, bacteria, viruses, pathogens and debris (Engineers Without
Borders, 2014).
Team 21 investigated five different systems equipped to handle the filtration and
purification of the local water sources, these designs were as follows:
Bio-sand Filter. The Bio-sand filter is an inexpensive system made from
local resources that requires little maintenance (Bradley, Straub, Maraccini,
Markazi, & Nguyen, 2011). The Bio-sand filter will cost 62,696 NPR ($700
AUD, price sourced from outside Nepal) and have a projected lifespan of 20
years.
The Lifestraw. A low cost, short lifespan device for personal use water
filtration. (Vestergaard, 2010). The Lifestraw will cost 109,090 NPR ($1200
AUD, price sourced from outside Nepal), it has a projected lifespan of a few
years.
The ceramic filter. A household level design that has effective levels of
filtration for bacteria and is relatively low cost, though its materials need to
be imported (Water and Sanitation Program, 2007). The ceramic filter will
cost 137,310 NPR ($1500 AUD, price sourced from outside Nepal) with a
projected lifespan of 5 years.
SODIS system. A low-tech solution using UV from the sun to filter water
(Developing Alternatives, 2011). The SODIS will cost 43,436 NPR (478
AUD, price sourced from outside Nepal).
Multi-layer filtration. A method developed by Team 21. This method draws
on the proven concepts of slow sand and carbon filtration and takes
advantage of the local resources to create a highly effective filter. Team 21
has proven its efficiency with preliminary experimentation. The Multi-layer
will cost 64,432 NPR ($745 AUD, price sourced from outside Nepal).
Through systematic elimination the Multi-layer filtration method, with the
construction method and size of the biosand filter, was selected. This was the best fit
to the client brief and trade off analysis. The cost of implementing this design at a
scale that handles the needs of the people of Sandikhola is 64,432 NPR ($745 AUD,

SUSTAINABLE WATER FILTRATION IN SANDIKHOLA
2
price sourced from outside Nepal). The time frame to implement the design is one
week. The impact to the environment is minimal, with only above ground materials
needing to be used to create the filters summing a total volume of less than 1 m3 of
material being displaced from the surrounding environment. The system has arguable
environmental benefit in the fact that it can be integrated with the existing waste
management programs in Sandikhola to take advantage of charcoal created by the
burning of their bio-waste.
RECOMMENDATIONS Recommendation 1
Use limestone sourced from the local environment and charcoal sourced from the
burning of bio-waste to make the filter virtually costless and not dependent on
purchases of filter mediums.
Recommendation 2
Allocate part of the budget to the purchase of personal protection equipment (PPE)
and invest time in the training of the local population.
Recommendation 3
Consider the cultural impacts of implementing this design in a Hindu community and
observe their practices.
Recommendation 4
Make sure the population understand implicitly how the chemical recycling process
of the filter works, so that calcium carbonate salt, fire and charcoal are not carelessly
wasted.

SUSTAINABLE WATER FILTRATION IN SANDIKHOLA
3
TEAM REFLECTION
There was a variable dynamic in team 21 with a wide variance in performances. A
balance was struck when the weighting of technical and scholarly proficiency was
left to the more advanced students and the tasks of team organization and generalized
research fell to the others. Ultimately this produced a desirable result and made for a
report well balanced in its scope and scientific merit.

SUSTAINABLE WATER FILTRATION IN SANDIKHOLA
4
CONTENTS EXECUTIVE SUMMARY ........................................................................................................... 1
RECOMMENDATIONS ............................................................................................................ 2
TEAM REFLECTION ................................................................................................................ 3
CONTENTS .................................................................................................................................. 4
I: INTRODUCTION ..................................................................................................................... 7
PRIMARY ISSUE ....................................................................................................................... 7
II: CONTEXT OF THE PROBLEM ............................................................................................. 8
GEOGRAPHY ............................................................................................................................ 8
ENVIRONMENT........................................................................................................................ 8
INFRASTRUCTURE ................................................................................................................. 9
DEMIOGRAPHIC ...................................................................................................................... 9
III: CLIENT BRIEF .................................................................................................................... 11
DISSECTION OF THE ISSUE ................................................................................................ 11
SANITATION ........................................................................................................................... 11
MALNUTRITION AND DEHYDRATION ............................................................................ 12
LOCAL POPULATION REQUIREMENTS............................................................................ 12
IV: PROPOSED DESIGNS ........................................................................................................ 13
DESIGN 1: LIFESTRAW ......................................................................................................... 13
DESIGN 2: SOLAR .................................................................................................................. 17
DESIGN 3: BIO SAND FILTER .............................................................................................. 21
DESIGN 4: CERAMIC WATER FILTER ............................................................................... 25
DESIGN 5: MULTI LAYER FILTRATION............................................................................ 28
V: DESIGN COMPARISION .................................................................................................... 33
MACRO FILTRATION ANALYSIS ....................................................................................... 34
TRADE OFF ANALYSIS ........................................................................................................ 35
CHOSEN DESIGN AND IMPLIMENTATION ...................................................................... 37
IMPLEMENTATION PLAN .................................................................................................... 47
ENVIRONMENTAL CONCERNS .......................................................................................... 54
DECOMMISION ...................................................................................................................... 56
CULTURAL CONCERNS ....................................................................................................... 57
CONCLUSION ......................................................................................................................... 60
VI: APPENDIX .......................................................................................................................... 61
APPENDIX 1: TEAM PROJECT PLAN / TEAM ORGANIZATION ................................... 61
TEAM BREAKDOWN............................................................................................................. 63

SUSTAINABLE WATER FILTRATION IN SANDIKHOLA
5
APPENDIX 2: DESIGN CALCULATIONS AND FORMULAE ........................................... 64
Table 1 Biosand Lab vs. Field Filtration (Centre for Affordable Water and Sanitation
Technology, 2009) ............................................................................................................ 21
Table 2 Concentrations of Limestone by Area (Neupane & Sharma, 2014) .................... 32
Table 3 Design Weightings, illustrated by Team 21 ......................................................... 33
Table 4 Macro breakdown of filtration, illustrated by Team 21 ....................................... 34
Table 5 Gantt chart for construction (Illustrated by Team 21) ......................................... 51
Table 6 Environmental trade off (Illustrated by Team 21) ............................................... 55
Table 7 Gantt chart, illustrated by Team 21...................................................................... 62
Table 8 Comparison of sample water ............................................................................... 74
Figure 1 Cross-Section Nepal Mountain Region (Neupane & Sharma, 2014) ................... 8
Figure 2 Life straw Reference (End All Diseases, 2011) ................................................. 14
Figure 3 Lifestraw Interior (Egenius Designs, 2011) ....................................................... 16
Figure 4 SODIS design (PotaVida, 2012) ......................................................................... 17
Figure 5 SODIS Blueprint, illustration by Team 21 ......................................................... 20
Figure 6 Biosand Cross-section (Centre for Affordable Water and Sanitation
Technology, 2009) ............................................................................................................ 23
Figure 7 Blueprint of Biosand Filter, illustrated by Team 21 ........................................... 24
Figure 8 Ceramic Filter Cross-section (Banbury, 2008) ................................................... 25
Figure 9 Blueprint of Ceramic Filter, illustrated by Team 21 .......................................... 27
Figure 10 Limestone vs. C33 filtration rates (Ericson, 2014) ........................................... 29
Figure 11 Cost filtration trade off, illustrated by Team 21 ............................................... 35
Figure 12 Construction process (Centre for Affordable Water and Sanitation
Technology, 2009) ............................................................................................................ 38
Figure 13 Biosand checklist (Centre for Affordable Water and Sanitation
Technology, 2009) ............................................................................................................ 40
Figure 14 Biosand checklist (Centre for Affordable Water and Sanitation
Technology, 2009) ............................................................................................................ 41
Figure 15 Biosand Checklist (Centre for Affordable Water and Sanitation
Technology, 2009) ............................................................................................................ 42
Figure 16 (Centre for Affordable Water and Sanitation Technology, 2009) .................... 43
Figure 17 Blueprint design of of Multilayer filter (Illustrated by Team 21) .................... 46

SUSTAINABLE WATER FILTRATION IN SANDIKHOLA
6
Figure 18 Water constructs (Turner, 2013) ....................................................................... 47
Figure 19 Risk Assessment Chart (RISK PENTAGON, 2010) ........................................ 49
Figure 20 Risk trade off (Illustrated by Team 21) ............................................................ 50
Figure 21 Inception to decommission flow chart (Illustrated by Team 21)...................... 52
Figure 22 Filtration flow chart (Illustrated by Team 21) .................................................. 54
Figure 23 Decommission flow chart ................................................................................. 56
Figure 24 Limestone filter prototype ................................................................................ 58
Figure 25 Hammer and limestone ..................................................................................... 68
Figure 26 Limestone dissolving in hydrochloric acid ....................................................... 69
Figure 27 Broken down charcoal ...................................................................................... 69
Figure 28 Calcium carbonate dissolved in water .............................................................. 69
Figure 29 Charcoal ............................................................................................................ 70
Figure 30 Limestone and C33 filters ................................................................................ 70
Figure 31 Ph of control water ........................................................................................... 71
Figure 32 Turbid water ..................................................................................................... 71
Figure 33 Turbid water Ph, C33 filtered water Ph, Limestone filtered water Ph
(right). ............................................................................................................................... 72
Figure 34 Low turbidity from limestone filter. ................................................................. 72
Figure 35 Turbid water Ph, C33 filtered water Ph, Limestone filtered water Ph,
Control water (right). ........................................................................................................ 73

RUNNING HEAD: TEAM 21: SUSTAINABLE WATER FILTRATION IN SANDIKHOLA
7
I: INTRODUCTION
ECU engineering students along with EWB (Engineers Without Borders) and BHP
Billiton are working in conjunction with NEWAH this year to help improve the quality
of life for the people in the isolated village of Sandikhola in the Gorkha region, Nepal.
A primary concern of NEWAH and EWB is the quality of potable water for the people
of Sandikhola.
PRIMARY ISSUE
Unclean water affects more than half the world’s population and is responsible for
deaths of 44,000 children in Nepal alone every year (MIT, 2001). Most water sources
in Nepal have contaminants that are responsible for e-coli outbreaks, diarrheic
associated illness as well as metals poisoning from magnesium and mercury (Rai, 2009)
(Suwal, 2014).
80% of the water supplied to the village populations in Nepal is through gravity
fed methods from rainfall (Engineers Without Borders, 2014). The rain of this region
of Nepal is acidic, with PH ranging from 5.04 to 6.63 (Shrestha, Pandey, Yoneyama, &
Kazama, 2013). Comparatively safe drinking water is between 6.5 and 8.5 (Queensland
Health, 2014). The water available to the population is polluted with F-, Cl-, NO3-,
SO42-, HCO3
-, Na+, NH4+, K+, Mg2+ and Ca2+ (Shrestha, Pandey, Yoneyama, &
Kazama, 2013).
Sandikhola, located in the Gorkha region of Nepal, situated close to the Himalayas and
Tibet. Sandikhola has a small population of about 460 people and has an abundance of
rainfall throughout most of the year. Catchment water from sources is largely polluted
from leached minerals from the ground (Shrestha, Pandey, Yoneyama, & Kazama,
2013)

SUSTAINABLE WATER FILTRATION IN SANDIKHOLA
8
II: CONTEXT OF THE PROBLEM
GEOGRAPHY
Sandikhola rests in the higher Himalaya region. The Gorkha region has a range of
different useful minerals and stones including limestone, iron, copper, nickel,
sandstone, and gold (Nepal Ministry for Industry, 2009). These naturally occurring
resources alongside, bad waste management practices and naturally occurring
contaminants are the main cause of the water contamination in this district. Soil varies
in Gorkha from sandy loam to clay loam and has reddish-brown colour.
Figure 1 Cross-Section Nepal Mountain Region (Neupane & Sharma, 2014)
ENVIRONMENT Weather
Due to being situated in a valley, Sandikhola benefits from an abundance of rain
boasting a higher average rainfall than most other regions. This is up to 2500mm per
annum (World Weather Online, 2014).
Nepal has a two season climate; a wet season and a dry season.
Monsoons and large amounts of rainfall are commonplace in the wet seasons (Climate
Data, 2014).
Clean water
The untreated waste from residential areas is the most detrimental to surface water
being responsible for majority of the contaminants found in water sources located

SUSTAINABLE WATER FILTRATION IN SANDIKHOLA
9
throughout the many districts of Nepal (Suwal, 2014).
In the Gorkha region the groundwater is not of the acceptable Standards due to more
than 1.9 mg/l of iron and coliform bacteria greatly exceeds limits at 267 CFU/100 ml
(Environment Agency, 2002). Traces of Arsenic and other low concentrate
contaminants have been found in Nepal groundwater (Pant, 2011).
INFRASTRUCTURE Electricity
40% of Nepal has access to electricity with a large deviation between rural and urban
areas. It is estimated that 90% of urban areas have electricity while only 5% of rural
areas have electricity (SARI, 2008).
Energy
Most of Nepal’s current sources of energy are largely imported from India. A
breakdown of those sources puts fuel wood at 68%, agricultural waste at 15%, animal
dung at 8%, and fossil fuel at 8% (Central Bureau of Statistics, 2012), (SARI, 2008).
DEMIOGRAPHIC Statistics
In Nepal 30,430,267 people occupy a land mass of 134,000 square kilometres (Central
Bureau of Statistics, 2012). The population causes large demand for food and water in
remote areas. Due to the population rate increasing by 1.34% per year (Central Bureau
of Statistics, 2012) the demand for clean water and uncontaminated produce steadily
climbs.
Villagers earn on average 2 dollars AUD per day (Engineers Without Borders, 2014).
90% of the Nepalese populous rely on farming and agriculture as a way of life (Royal
Botanic Garden Edinburgh, 2014).

SUSTAINABLE WATER FILTRATION IN SANDIKHOLA
10
Education
42% of women in Nepal have not been educated, 23% have an incomplete primary
education, 6% have primary education and 25% have high school education. 71% of
males have some literacy and education (Engineers Without Borders, 2014).

SUSTAINABLE WATER FILTRATION IN SANDIKHOLA
11
III: CLIENT BRIEF
2.4 Water purification:
“Water is piped from the natural springs to tap stands located throughout the
community where water is collected in containers for household use. Alternately water
is collected directly from a tap in the rainwater harvesting tank. The quality of the
water is an issue; however it is not always tested due to the expense and difficulty in
obtaining water quality testing kits. The water often contains low levels of microbial
contamination and further contamination can be added if the water containers are not
cleaned properly or if the water sits for long periods of time. This task is to look at
water purification methods to ensure that the water used for drinking and cooking is
potable.” (Engineers Without Borders, 2014)
DISSECTION OF THE ISSUE
Nepal has a prevalent issue with substandard water purity for its rural populations. This
issue is amplified for people who do not have running water that has been filtered. The
low income of village populations and lower education rates mean hi-tech and high
cost solutions are unviable. A viable solution must also be able to produce enough
water to satisfy the needs of the Sandikhola population and have reserves such that
water is available to the people in a reasonable time frame.
SANITATION
Due to the limited access to clean water, poor sanitation plays an important part in the
contamination of water with over 85% of water bodies in Nepal including Sandikhola
tested positive for human faecal matter and other bodily contaminants. (Environment
and Public Health Organization, 2011)

SUSTAINABLE WATER FILTRATION IN SANDIKHOLA
12
MALNUTRITION AND DEHYDRATION
Many of the pathogens contained in unclean water sources are linked to diarrheic
related illnesses and diseases. These pathogens are attributed to 88% of diarrheal deaths
worldwide (UNICEF; WHO, 2009). Due to the severity and length of the illness,
dehydration and malnutrition from the constant expelling of fluids are inevitable. In
Southern Asia more than 36% of children exhibit stunted growth with over 30% of them
experiencing malnutrition as a result of polluted water consumption (Guerrant,
Schorling, McAuliffe, & de Souza, 1992), (de Onis, Brown, Blössner, & Borghi, 2012)
LOCAL POPULATION REQUIREMENTS
Not much information exists on water consumption requirements for the specific
region we are looking at but estimates have been placed that third world villages use
25.3 litres per person per day (Gazzinelli, Souza, Nascimento II, Cadete, & Kloos,
1998)
These estimates take into account all uses of water including bathing and cooking. On
the basis that many of the concerns for water consumption in Gorkha are to do with
pathogens and bacteria, we have omitted bathing and cooking by boiling requirements.
Accordingly, we use the estimates of consumption of other rural villages, at 4 litres per
person per day. (Gazzinelli, Souza, Nascimento II, Cadete, & Kloos, 1998)

SUSTAINABLE WATER FILTRATION IN SANDIKHOLA
13
IV: PROPOSED DESIGNS
DESIGN 1: LIFESTRAW Overview
The Lifestraw is a small portable filter that is designed to be carried around a person’s
neck. It relies on human suction to push water through inbuilt filters. This creates a
‘filter as you drink’ experience. It consists of two pre filters, an iodine filter and a
carbon filter. The first pre filter removes sediments such as dirt, dust, sand, and other
micro-debris, whereas the second pre-filter is set to remove large clusters of harmful
micro-bacteria. The penultimate chamber contains beads coated in iodine designed to
kill parasites and viruses. The final chamber is a carbon filter designed to remove any
remaining parasites and also improve the taste.
Output
The Lifestraw is very effective at filtering water despite its small size. The iodine filter is
responsible for killing up to 99.3% of bacteria. Studies indicate that the output sanitation
level of the water is safe for human consumption, meaning thereis little or no health risk (V
estergaard, 2010).
The Lifestraw is capable of preventing diseases such as diarrhea, dysentery, typhoid, and
cholera. On top of this, they also filter micro-organisms responsible for diseases
such as E.Coli and Salmonella (End All Diseases, 2011) .The Life
straw can effectively filter a maximum of 1000L before needing replacement which, by the
consumption rates previously outlined, is a worst case figure of 250 days. It should be
noted that the 4 litre figure included in the overview assumes cooking water as well. The
Lifestraw as proposed here is only for personal hydration use.
The main advantages of the Lifestraw are the accessibility it creates and its high outflow
.
Having a filter that is portable allows any water source to become safely drinkable
(Vestergaard,
2010). Coupled with having local watersources from rainwater harvesting tanks, this could

SUSTAINABLE WATER FILTRATION IN SANDIKHOLA
14
very quickly alleviate the illness and fatality rates from water borne diseases whilst
maintaining a sustainable water source. Alongside this, the system that requires no ongoing
energy costs. It also means that it will not be creating any hazardous by-products.
Dimensions
The Lifestraw is 250mm long with a diameter of 29mm. The first textile
filter is grating with 100µm diameter holes. The second filter is smaller
with only 15µm holes. The final chambers will filter up to 0.2µm. The
system has no cache, so it is dependent on a water source and must be
consumed immediately. However, there are separate products called
Lifestraw Go and Lifestraw Family. The Lifestraw Go includes a bottle
outside attached to the straw. This model is illustrated in the
picture. The Lifestraw Family contains a 2 litre bucket feed (Vestergaar
d, 2010).
Cost
The Lifestraw can be purchased from Australian retailers for roughly $20 - $25 per device
(Barksdale & Kershner, 2009). The cost is the largest drawback of the feature, with its
current pricing being relatively high when compared with average salaries in Nepal. As
indicated in (Salary Explorer, 2014), most Nepalese would be earning between 8,000 NPR
to 50,000 NPR a year. The distribution thus far has been through donations by proxy
humanitarians and through the company itself, which donated over a million
units to Kenya in 2011 (Vestergaard, 2010). The product should be considered a band aid
solution only; while it may have strong short term effects, there is no long
term progression made towards creating a sustainable supply of drinking water.
Maintenance
The Lifestraw is primarily cleaned by blowing air back through the filter after
consumption to clear out clumps of particles. The design is simple so it requires no
maintenance on behalf of the user - a prominent advantage for Nepal which has a
Figure 2 Life straw Reference
(End All Diseases, 2011)

SUSTAINABLE WATER FILTRATION IN SANDIKHOLA
15
shortage of skilled workers. This could save time and money over an alternative
method that would require individuals to be flown over to maintain or repair a complex
filtration system.
The product is expendable, so if it becomes damaged or needs repairs on filter(s), the
best course of action is simply to replace it. While this may seem like a drawback of
the product, the Lifestraw is durable, made from a strong polymer casing and has no
moving parts (Vestergaard, 2010). It has been tested for durability against extreme heat
(50°C), dropping, transport, higher pressure and static load and passed all tests
(Vestergaard, 2010). As such, the risk of it needing repair prior to the recommended
1000L expiration is unlikely.

SUSTAINABLE WATER FILTRATION IN SANDIKHOLA
16
Figure 3 Lifestraw Interior (Egenius Designs, 2011)

SUSTAINABLE WATER FILTRATION IN SANDIKHOLA
17
DESIGN 2: SOLAR
Figure 4 SODIS design (PotaVida, 2012)
Overview
SODIS is an effective method for removing bacteria and viruses; the system is capable
of providing potable drinking and cooking water (Swiss Federal Institute of Aquatic
Science and Technology, 2014). The largest advantage of the SODIS is that it is
incredibly cost effective. This is due to its ability to be built using recycled materials.
The SODIS system is also comprised of a very basic method allowing it to be run by,
repaired and maintained by anyone with a basic understanding of the system. The most
complicated part of the system is the lux or UV sensor which acts as a timer. This
component ensures that the bottles have been exposed for an adequate length of time
for the treatment process to complete (PotaVida, 2012).
Output
The SODIS method effectively removes up to 99.9% of bacteria and viruses, and deals
with most contaminant issues because UV has no method of physical sieving or
adsorption it cannot deal with turbidity (Swiss Federal Institute of Aquatic Science and
Technology, 2014).
Acids and chloramines are not eliminated by low level UV (Bio UV, 2014).
Accordingly it can be difficult to predict whether or not chlorine in the water has been
treated.
Due to the system requiring prolonged UVA exposure, the design will take 10 to 48
hours depending on cloud conditions to treat water (Swiss Federal Institute of Aquatic

SUSTAINABLE WATER FILTRATION IN SANDIKHOLA
18
Science and Technology, 2014). The time required will be determined by a Lux sensor,
which will record the time during which there was adequate sunlight for the treatment
process (PotaVida, 2012). The timer will enable the people of Sandikhola to accurately
determine when the water is safe.
As seen in waste management photos there are old 2L PET bottles available (Engineers
Without Borders, 2014). The bottles will have to be changed out once they are full of
clean, treated water to ensure there is a consistent supply of potable water.
Consideration should also be made regarding how many bottles should be treated or
exposed at once. To ensure there is always potable water available enough bottles
should be treated at once to cover each person for up to 48 hours. Based on the average
person using 4l per 24 hours for drinking and cooking, as outlined in the context of the
problem, four 2l bottles or 8l worth of water should be under treatment per person at
any given time.
The design relies on direct exposure of the filter to the elements. Accordingly this
design may perform poorly or be damaged in the monsoonal weather experienced in
Sandikhola.
Dimensions
The SODIS design requires the use of numerous PET bottles. These bottles are placed
on a sheet of corrugated metal while being treated. The size of the metal sheet may be
any size, depending on how many bottles the locals wish to treat on it at once. For the
specific requirements of the Sandikhola population, this would mean 1840 bottles
being treated simultaneously to ensure enough water for the population. From this
figure it is possible to determine the minimum surface area required to treat enough
water to supply the population. It is the estimate of Team 21 that a required 55.2m2 of
corrugated metal surface area would be required. The metal sheet will act as a heat
conduct for the system, drawing warmth from the sunlight. This will improve the rate
at which the treatment will be completed as the process works better at higher
temperatures (Swiss Federal Institute of Aquatic Science and Technology, 2014)

SUSTAINABLE WATER FILTRATION IN SANDIKHOLA
19
Cost
The electronic components and wire – 448 NPR ($5 AUD, price sourced from outside
Nepal).per lux sensor (PotaVida, 2012).
Corrugated metal sheeting is free if we are able to recycle any local resources,
otherwise 770 NPR per sq. meter ($9 AUD, price sourced from outside Nepal) (Metal
Roofing Online, 2014). On the basis of having the most accurate worst case scenario data
we assume purchasing of corrugated metal sheets. Therefore, cost of corrugated metal
42,540 NPR ($450 AUD, price sourced from outside Nepal).
Plastic PET bottles are free as we will be recycling already purchased bottles
The initial setup of the system will cost upwards of 43,435 NPR ($455AUD, price
sourced from outside Nepal). This cost will be reduced if corrugated metal can be
sourced from recycling. Similarly, the cost will increase with the addition of more lux
sensors. The figure above assumes only one sensor however it is the recommendation
of team 21 to have multiple sensors. There is no associated running cost with a solar
system. The system may require additional lux sensors to be purchased every 5 years
on average.
There may also be a cost for building the lux sensors, as it requires soldering and is of a
technical nature. If possible several of the locals should be taught basic soldering and
how to build the sensors. This will allow them to cut costs and maintain and replace
parts as required on their own. If this cannot be achieved an electrician would be
required. A cost for this is currently unable to be determined given the remoteness of
Sandikhola.
Maintenance
Bottles will have to be replaced every 6 months (Wiki Water, 2014). This is due to the
degradation caused to the bottles by the sun, causing them to become cloudy and
inhibits the suns ability to treat the water.

SUSTAINABLE WATER FILTRATION IN SANDIKHOLA
20
Lux sensors will have to be maintained. Components may have to be replaced if they
fail and in some cases a whole new sensor may be required.
There is no down time for the system during maintenance. The bottles when swapped
over will still have potable water in them, which may be consumed while the new
bottles are in the treatment process. While a sensor is being repaired or replaced, the
sensors on other treatment stations may be used to determine when the water has been
exposed for adequate time.
Figure 5 SODIS Blueprint, illustration by Team 21

SUSTAINABLE WATER FILTRATION IN SANDIKHOLA
21
DESIGN 3: BIO SAND FILTER Overview
The biosand filter works on the principle of slow sand filtration and treatment from a
biofilm (Elliot, Stauber, Koksal, DiGiano, & Sobsey, 2008). The biosand filter is
superior to a normal slow sand filter because of its biolayer being able to deal with
pathogens that slow sand could not (Elliot, Stauber, Koksal, DiGiano, & Sobsey,
2008). Biosand filters work primarily using C33 sand (quartz sand). Though other sand
can be used, care must be taken to ensure its porosity and that it is free of contaminants
(Elliot, Stauber, Koksal, DiGiano, & Sobsey, 2008)
Output
Table 1 Biosand Lab vs. Field Filtration (Centre for Affordable Water and Sanitation Technology, 2009)
Bacteria from contaminated water sources have been reduced by 87.9 to 98.5% through
the filtration method. This includes the removal of harmful bacteria such as e-coli,
typhoid and other diarrhoea causing bacteria. This occurs over a time period of roughly
150 days to reach maximum efficiency, starting at 45 days of use to reduce
contamination of water by about 85% and slowly increasing. (Bradley, Straub,
Maraccini, Markazi, & Nguyen, 2011)
One of the downfalls of the bio-sand filter is its limited capacity to remove heavy

SUSTAINABLE WATER FILTRATION IN SANDIKHOLA
22
metals. Although it has been tested to remove up to 95-99% of zinc, copper and lead
(Imran, 2014), it seems that the efficiency of the biosand filter varies from site to site.
Whilst CAWST states iron removal at 90-95%, Mwabi states it to be up to 64% of iron
and 5% of magnesium from the water (Mwabi, et al., 2011). It should be noted that
whilst the Biosand filter is an improvement on a normal sand filter, it cannot deal with
acids, some metals and certain chemicals like chlorine and phosphorous (Ericson,
2014). It is recommended that slow sand filters include a metal for reactivity with acids
(Monroe & Chan, 2007). The biosand filter has a drawback in that it requires to be left
to sit for one hour after use to not over disrupt the biolayer (Centre for Affordable
Water and Sanitation Technology, 2009).

SUSTAINABLE WATER FILTRATION IN SANDIKHOLA
23
Dimensions
Figure 6 Biosand Cross-section (Centre for Affordable Water and Sanitation Technology, 2009)
The above dimensions are those proposed by the original designer of the Biosand filter.
70% of the unit’s volume must be comprised of 33 course sand whilst the bottom 10%
of the unit contains gravel to hold the sand in place and stop it from clogging the

SUSTAINABLE WATER FILTRATION IN SANDIKHOLA
24
gravity feed hose (Centre for Affordable Water and Sanitation Technology, 2009).
Cost
The cost for one of these per unit is about 8,955 NPR ($100 AUD, price sourced from
outside Nepal), this cost does not factor in the purchase of C33 sand and assumes its
availability in the surrounding environment (Livelihood Ngo, 2014).
By calculation of flow rate, population and daily consumption, Sandikhola would
require a minimum of seven of these filters (South Asia Pure Water Initiative, Inc.,
2013).
Maintenance
No constant maintenance should be required for this system apart from the shifting of
the sand to reset the sand and allow any thing it has trapped to more equally disperse
throughout the sand (Centre for Affordable Water and Sanitation Technology, 2009).
Figure 7 Blueprint of Biosand Filter, illustrated by Team 21

SUSTAINABLE WATER FILTRATION IN SANDIKHOLA
25
DESIGN 4: CERAMIC WATER FILTER
Figure 8 Ceramic Filter Cross-section (Banbury, 2008)
Overview
Ceramic water filters have been available for about 200 years (Safe Water Now, 2014).
Throughout the years ceramic water filtration has seen tremendous improvements and is
currently used to solve the issues of contaminated water around the world mainly in 3rd
world countries (Safe Water Now, 2014). It has a somewhat flowerpot design,
consisting of a lid, nozzle bucket and main chamber. The main storage chamber is
placed inside a plastic bucket with a nozzle attached to the side of the bucket. The
filtration system relies on gravity feeding, starting from pouring contaminated water
into the chamber which is then filtered into the plastic bucket and then accessible by the
nozzle.
The CWF’s (Ceramic Water Filters) remove approximately 99.99% of all contaminants
in the chamber (Safe Water Now, 2014). These contaminants consist of protozoa and
potential pathogenic bacteria (Banbury, 2008). The CWF’s can be made to any
dimensions specified dependent on necessity (Water and Sanitation Program, 2007).

SUSTAINABLE WATER FILTRATION IN SANDIKHOLA
26
The CWF is unable to remove chemicals and viruses (Plappally, Yakub, Brown,
Soboyejo, & Soboyejo, 2011)
Output
Typically they will hold 8-10 litres and filter on average 2 litres per hour, depending on
the volume of water in the chamber (Water and Sanitation Program, 2007).
A ceramic filter should have a larger adsorption rate than the sand filters as clay
(Hopmans, 2002), but when cured to a particular structure, that porosity is decreased.
Dimensions
A plastic bucket is needed large enough to fit a main chamber inside of average volume
8-10 litres. The chamber is a typically household flower pot sized, however the micro
pores contained in the chamber must be peened with silver, leaving it embedded in the
surface for reactivity with some bacteria and acids. Depending on the size of the
chamber, (Monroe & Chan, 2007). It will hold 10 litres of contaminated water and
release 10 litres of treated water at a rate of 1-3 litres per hour. (Water and Sanitation
Program, 2007)
Cost
The filters can be purchased commercially for approximately 2685 NPR ($30 AUD,
price sourced from outside Nepal) per unit. (Safe Water Now, 2014).
Construction time is 1-2 weeks. There are no on-going costs (Safe Water Now, 2014).
Maintenance
The major risk concerning destruction of the unit is the whole system is quite brittle
(Safe Water Now, 2014). If the main chamber is destroyed it will need replacement as

SUSTAINABLE WATER FILTRATION IN SANDIKHOLA
27
repair is not a viable option. The average lifespan of the ceramic filters is 5 years, but it
does not require continual maintenance (Safe Water Now, 2014).
Figure 9 Blueprint of Ceramic Filter, illustrated by Team 21

SUSTAINABLE WATER FILTRATION IN SANDIKHOLA
28
DESIGN 5: MULTI LAYER FILTRATION Overview
The layer design is a lo-tech solution that functions on similar principles to a
combination of the slow sand filter, ceramic filter, and using principles of chemistry
that will be later outlined. Rather than the standard use of C33 sand, the multi-layer
design uses firstly a filter made from limestone sand, and then a secondary filter of
activated carbon. In exactly the same method as slow sand, water is allowed to access
the top of the filter and slowly flows through the filtration medium (Biosand filters,
2004).
The reason behind using a Limestone sand over C33 is because slow sand filters rely
on the process of gravity and physical sieving for pollutant removal and have no means
of removing materials like phosphorous, acids and some metals (Ericson, 2014).
Normally this presents an issue for a slow sand filter. Limestone however, is
predominantly calcium carbonate and reacts with many of the contaminants in the
water in Nepal. A complete chemical proof is included in Appendix 2 (appendix 2.1)
Output:
Calcareous sand (limestone sand) performs as well as slow sand filtration in all fields
but has vast improvements with specific chemicals and acids as listed above (Ericson,
2014).
SUSTAINABLE WATER FILTRATION IN SANDIKHOLA
29
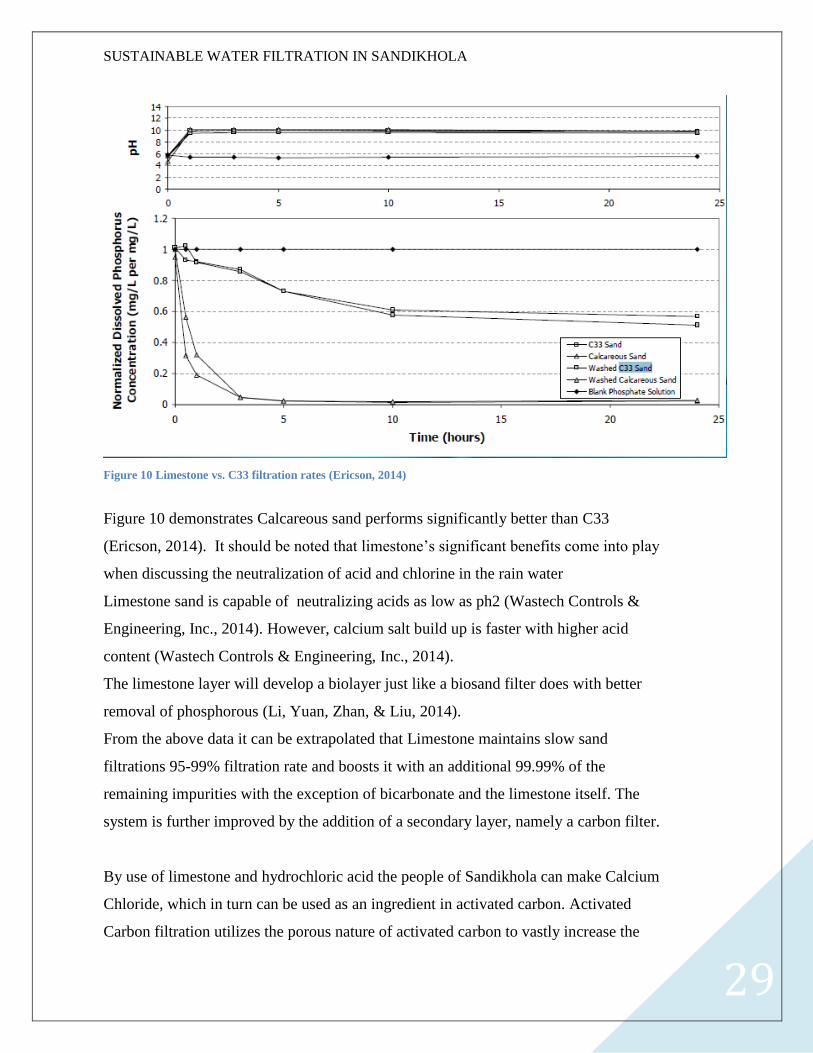
Figure 10 Limestone vs. C33 filtration rates (Ericson, 2014)
Figure 10 demonstrates Calcareous sand performs significantly better than C33
(Ericson, 2014). It should be noted that limestone’s significant benefits come into play
when discussing the neutralization of acid and chlorine in the rain water
Limestone sand is capable of neutralizing acids as low as ph2 (Wastech Controls &
Engineering, Inc., 2014). However, calcium salt build up is faster with higher acid
content (Wastech Controls & Engineering, Inc., 2014).
The limestone layer will develop a biolayer just like a biosand filter does with better
removal of phosphorous (Li, Yuan, Zhan, & Liu, 2014).
From the above data it can be extrapolated that Limestone maintains slow sand
filtrations 95-99% filtration rate and boosts it with an additional 99.99% of the
remaining impurities with the exception of bicarbonate and the limestone itself. The
system is further improved by the addition of a secondary layer, namely a carbon filter.
By use of limestone and hydrochloric acid the people of Sandikhola can make Calcium
Chloride, which in turn can be used as an ingredient in activated carbon. Activated
Carbon filtration utilizes the porous nature of activated carbon to vastly increase the

SUSTAINABLE WATER FILTRATION IN SANDIKHOLA
30
surface area over which the water has to travel, and in turn allow many impurities to be
caught in the pores (Deithorn & Mazzoni, 2014). Activated carbon can be made by
dissolving charcoal in water along with Calcium Chloride, and then baking the
remaining solute and crushing to a dust (Deithorn & Mazzoni, 2014).
This is advantageous not only for its low cost but also because the residences of
Sandikhola can burn their bio-waste and/or locally sources materials like bamboo to
make the charcoal and to bake the activated carbon. The only cost for the design of the
filtrates then is hydrochloric acid, which is needed to react with limestone to make
Calcium Chloride. The only pricing team 21 has been able to locate is for the cost of
Hydrochloric acid in Australia, it is assumed that the cost will be similar or less in
Nepal (Muriatic acid: pricing sourced from Bunnings Aus. 20 litres costs 4030NPR
/$45 AUD, price sourced from outside Nepal).
A carbon filter’s efficiency is proportionate to its surface area. Activated carbon has a
minimum surface area of 0.889 km2/kg (Cheremisinoff & Morresi, 1980). Carbon is
effective at removing acids, sediments such as limestone in sand form and silts/ muds,
and volatile organic chemicals like methane, and other complex isoprene or terpene
compounds created by fungi, mold, plants, animal matter and fecal matter (Niinemets,
Loreto, & Reichstein, 2004). (Carbon filters are ineffective at removing dissolved salts
and inorganic compounds (Cheremisinoff & Morresi, 1980).
The issue presented by inorganic compounds of which are predominantly those
listed in the analysis of the rainwater above is of very little concern. This is given
since Limestone is efficient at removing these compounds. The remaining salt
Calcium chloride which is water soluble will pass the filter in trace amounts,
however “It is considered as generally recognized as safe (GRAS) by the U.S. Food
and Drug Administration (Legal information institute, 1996). Carbon filters out
perform sand filters in the same concentrations of material due to carbon not
requiring disinfection (Water and Waste Engineering, 2014).
Though no specific data exists on the water volume output/flow rate of this system

SUSTAINABLE WATER FILTRATION IN SANDIKHOLA
31
reasonable approximations have been produced by team 21 with calculation based on
Darcy’s laws. (Appendix 2.2).
This yields a very similar result to the 0.4 litres per hour of a biosand filter, which was
0.377 in the case of the multilayer (Livelihood Ngo, 2014). The rate of adsorption in
limestone and carbon should be 2.76 times that of C33 sand, the proposed method by
bio filtration.
(Appendix 2.3).
Dimensions
It Is the proposition of Team 21 that the multi-layer filter be implemented at levels
equal to the size of pipes used in existing RWH tanks (Engineers Without Borders,
2014) or in plastic barrels, buckets and any other waste the village may have that could
suitably hold a few litres at a time. The reasoning for this is the sheer surface area of
carbon per kilogram (Cheremisinoff & Morresi, 1980) and limestone’s high reactivity
with the most prevalent compounds polluting the water (refer above).
Secondarily this reduces the cost and impact of integration into the community. It
should be noted that from experimentation (appendix 2.4) we have concluded
that slow sand filters perform poorly with turbidity on a small scale. It is the
recommendation of team 21 that the scale used for the Biosand filter is used for
the Multi-layer filter as well (Figure 6). This allows for the gravel to have a great
enough volume to effectively deal with Turbidity.
Cost
The cost of the unit is directly proportionate to the amount of acid required as it is the
only resource that needs to be purchased. In the chemical construction of Activated
carbon, for every 1 litre used a theoretical 4 kilograms of Activated Carbon can be
made (Deithorn & Mazzoni, 2014). Accordingly 20 litres would make 80kg, with a
massive surface area of up to 120,000,000m2 (Lenntech, 1998).
SUSTAINABLE WATER FILTRATION IN SANDIKHOLA
32
Region Estimated Tonnes of
Limestone (millions)
Rank
(concentration per
square km) Sindhali & Galtar
(Udaypur)(300km
from Gorkha)
180
1
Okhare and
Nibuwatar
(Makwanpur) (300km
from Gorkha)
164
2
Jogimara & Beldada
(Dhadhing) (100km
from Gorkha)
130
3
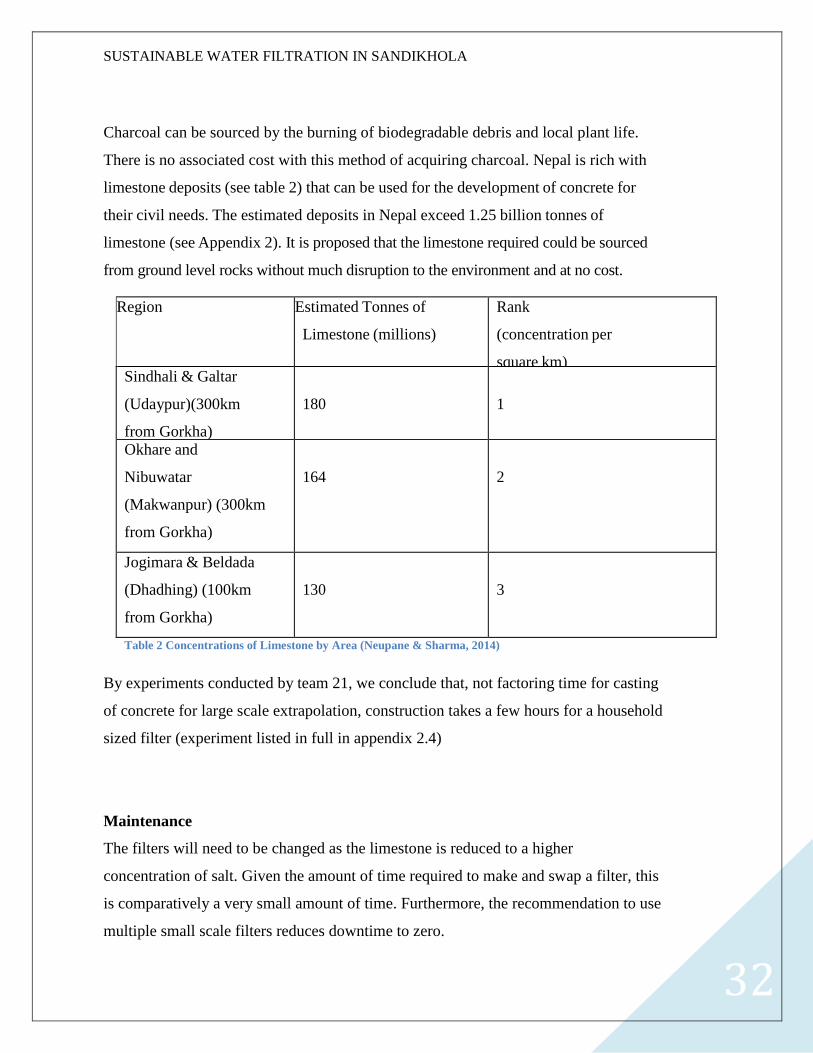
Table 2 Concentrations of Limestone by Area (Neupane & Sharma, 2014)
Charcoal can be sourced by the burning of biodegradable debris and local plant life.
There is no associated cost with this method of acquiring charcoal. Nepal is rich with
limestone deposits (see table 2) that can be used for the development of concrete for
their civil needs. The estimated deposits in Nepal exceed 1.25 billion tonnes of
limestone (see Appendix 2). It is proposed that the limestone required could be sourced
from ground level rocks without much disruption to the environment and at no cost.
By experiments conducted by team 21, we conclude that, not factoring time for casting
of concrete for large scale extrapolation, construction takes a few hours for a household
sized filter (experiment listed in full in appendix 2.4)
Maintenance
The filters will need to be changed as the limestone is reduced to a higher
concentration of salt. Given the amount of time required to make and swap a filter, this
is comparatively a very small amount of time. Furthermore, the recommendation to use
multiple small scale filters reduces downtime to zero.

SUSTAINABLE WATER FILTRATION IN SANDIKHOLA
33
V: DESIGN COMPARISION
Table 3 Design Weightings, illustrated by Team 21

SUSTAINABLE WATER FILTRATION IN SANDIKHOLA
34
MACRO FILTRATION ANALYSIS
Table 4 Macro breakdown of filtration, illustrated by Team 21

SUSTAINABLE WATER FILTRATION IN SANDIKHOLA
35
TRADE OFF ANALYSIS
Figure 11 Cost filtration trade off, illustrated by Team 21
Trade off analysis
Team 21 has presented five unique solutions that meet the design criteria. This section
of the report will analyse the trade-offs to determine the viability of each design when
meeting criteria and how each design weighs up against the others. The numerical data
of the trade-off is shown in table 3 Design weightings, and table 4 Macro breakdown of
filtration. Both charts have a weighting determined by Team 21 in correlation to what
they believe to be best matched up against the design parameters. The outputs of the

SUSTAINABLE WATER FILTRATION IN SANDIKHOLA
36
two charts have been graphed (Above) and we have drawn a line of cost/ filtration trade
off that we best believe fits the client brief. The first statement of the graph is that the
filtration, at no cost benefit, can fall beneath the minimum standard of filtration
required. In the field all designs (or parts thereof) have proven to produce exceptional
filtration results, however all designs have been argued in papers to only represent one
part of an overall filtration method including subsequent disinfections and treatments.
This drives the cost up, perhaps not an issue in the first world but something that must
certainly be considered for Sandikhola. Accordingly, the argument is made that as the
cost increases so must the efficiency, to a point of 200,000NPR ($2312 AUD) across a
20 year span. While this number is comparatively small (0.3% of the average wage per
annum) it should be noted that in all designs, at best 33% of their total cost was in the
setup costs. Extrapolated, this is equivalent with at best 12% of the village’s weekly
income in the week of construction (week used as an arbitrary measurement, the time
scale varies from design to design).
In the case of the Lifestraw and the ceramic filter, the cost was simply too high to be
viable. For the SODIS system, the ability to filter was too low, being unable to deal
with any turbidity or acids, heavy inorganic compounds etc. This left just the biosand
and layer design. While the biosand cost fell well within the acceptable margin relative
to the client brief, its filtration was significantly worse for dealing with a community
whose primary contaminants were inorganic compounds and acids. A method that
relied on exceptional adsorption and physical sieving was the best choice to fit the
client brief, assuming its cost effectiveness. The Biosand filter had a large drawback
with construction time. For the filtration to reach peek effectiveness it takes up to 150
days. Furthermore the biosand’s requirement to be rested for a minimum 1 hour
between uses made it unsuitable for development at a village level, where the
population would need to constantly use the filter (Centre for Affordable Water and
Sanitation Technology, 2009).

SUSTAINABLE WATER FILTRATION IN SANDIKHOLA
37
CHOSEN DESIGN AND IMPLIMENTATION The multilayer design meets the criteria best of fitting a budget well below 100,000
NPR (Under $1100 AUD) initial cost and equal or lesser maintenance cost. It also had
the highest rate of filtration for the particular pollutants in Sandikhola. When tested in
experimental situations the multilayer proved its ability to remove high concentrations
of acid and chlorine, as well as turbidity. However, it did not perform with as good a
flow rate as expected nor as good a turbidity removal as the proven abilities of the
biosand filter in the field. It is the proposal of Team 21 that the Layer design should be
built to the dimensions of the biosand filter to improve its flow rate and ability to deal
with turbidity. Given that the biosand’s cost was within the acceptable range the
mimicry of its size and proposed quantity is also acceptable for the Layer design.
Implementation
Given that tools already exist in the village and they have access to the ability to mix,
pour and set concrete (Engineers Without Borders, 2014) the preliminary work prior to
construction beginning for the layer design is limited to the sourcing of limestone rock
from the local environment and the purchase of hydrochloric acid. In the preliminary
design stage, the cost for sourcing hydrochloric acid is 4030NPR ($45 AUD, price
sourced from outside Nepal). The cost for all materials to construct the casings for the
filters will be assumed to be the same as the bio sand filter at 8,956 NPR per unit ($100
AUD, price sourced from outside Nepal). Calculating the flow rate of the biosand filter
against its output per minute and comparing against the Darcy equations for the
multilayer design we can conclude that the multilayer design will have an output of
377ml per minute. Accordingly a single filter could produce 542.88 litres per 24 hours.
The consumption requirement of the village is 1840 litres. While this means that 4
filters could cover the daily requirements for the village, it would require them to be
used 24 hours a day constantly to meet the demand. Accordingly we base the
requirement on the assumption that the filters could, or would only be used for half of
every hour. The minimum requirement is 7 filters to meet the needs of the population.
The associated cost is 64,432 NPR ($745 AUD, price sourced from outside Nepal).

SUSTAINABLE WATER FILTRATION IN SANDIKHOLA
38
Construction
Figure 12 Construction process (Centre for Affordable Water and Sanitation Technology, 2009)
Before any construction begins the materials must be sourced and a safety procedure
must be implemented. Throughout the construction process the safety of the villagers
involved in the construction is paramount to the construction speed. A training scheme
should be introduced that covers all aspects of the design from construction to
decommission.

SUSTAINABLE WATER FILTRATION IN SANDIKHOLA
39
Safety procedure
Avoid concrete dust getting into the eyes of the workers. The use of Safety
glasses is recommended to prevent this
Direct contact with hydrochloric acid must be absolutely avoided.
If hydrochloric acid makes contact with skin or eyes wash it immediately. If
limestone sand has been already made, consider rubbing it onto the site of
contact after washing to neutralize any acid that may have only been diluted and
maintained contact with the skin.
Avoid breathing in the vapour from hydrochloric acid. The use of a face mask is
recommended to best prevent this.
Ingesting of hydrochloric acid can be fatal, do not leave hydrochloric acid
anywhere nearby a potable water source or somewhere it could be mistakenly
consumed. If it consumed, do not cause the individual to vomit. Give them milk
to drink if possible. (Hindu culture does not prevent the consumption of dairy
products so there should not be a cultural aversion to this treatment).
Remove any jewellery in any construction process.
If possible wear long sleeved clothing and avoid the contact of cement with skin,
if cement does make contact with skin, wash it off immediately. Be sure to keep
wounds clear of cement.
Care must be taken when using any tools.
Personal protection equipment (PPE)
Personal protection equipment is integral to the safe practise and construction of the
water filter. The list of recommended PPE Includes:
Rubber Gloves
Long sleeve clothing
Safety glasses
Closed in shoes
Face masks

SUSTAINABLE WATER FILTRATION IN SANDIKHOLA
40
Figure 13 Biosand checklist (Centre for Affordable Water and Sanitation Technology, 2009)
SUSTAINABLE WATER FILTRATION IN SANDIKHOLA
41
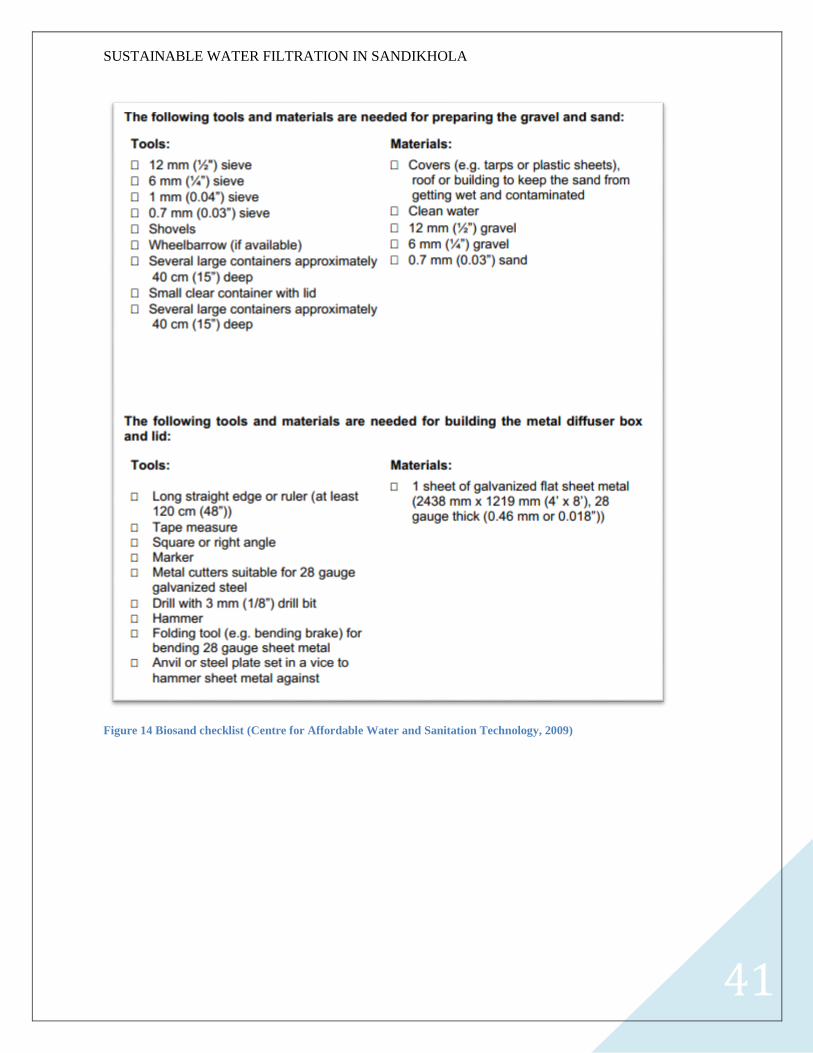
Figure 14 Biosand checklist (Centre for Affordable Water and Sanitation Technology, 2009)
SUSTAINABLE WATER FILTRATION IN SANDIKHOLA
42
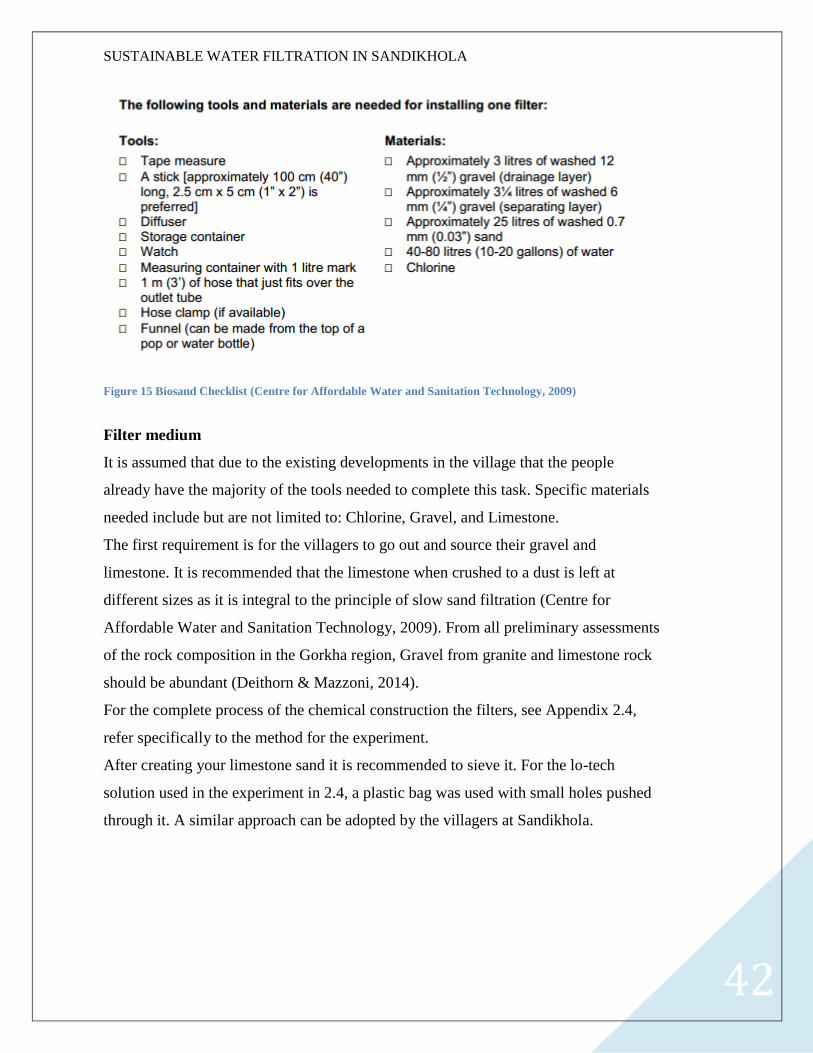
Figure 15 Biosand Checklist (Centre for Affordable Water and Sanitation Technology, 2009)
Filter medium
It is assumed that due to the existing developments in the village that the people
already have the majority of the tools needed to complete this task. Specific materials
needed include but are not limited to: Chlorine, Gravel, and Limestone.
The first requirement is for the villagers to go out and source their gravel and
limestone. It is recommended that the limestone when crushed to a dust is left at
different sizes as it is integral to the principle of slow sand filtration (Centre for
Affordable Water and Sanitation Technology, 2009). From all preliminary assessments
of the rock composition in the Gorkha region, Gravel from granite and limestone rock
should be abundant (Deithorn & Mazzoni, 2014).
For the complete process of the chemical construction the filters, see Appendix 2.4,
refer specifically to the method for the experiment.
After creating your limestone sand it is recommended to sieve it. For the lo-tech
solution used in the experiment in 2.4, a plastic bag was used with small holes pushed
through it. A similar approach can be adopted by the villagers at Sandikhola.

SUSTAINABLE WATER FILTRATION IN SANDIKHOLA
43
Figure 16 (Centre for Affordable Water and Sanitation Technology, 2009)
After having a clearly separated batch of materials, it is important for the people to
wash the gravel. The gravel should be repeatedly rinsed until such point as no visible
dirt comes off of it. After which it is recommended to leave the gravel in sunlight to
allow UV to kill any bacteria that may still live on it.
A similar approach should be used for the limestone sand to remove any clay or dirt
that may be present. Because it assumed that the limestone will be broken down from
rock form, contaminants will already be minimal. The amount of washing of the sand
will ultimately dictate the flow rate. It is the recommendation of Team 21 that a small

SUSTAINABLE WATER FILTRATION IN SANDIKHOLA
44
scale filter be built as was in appendix 2.4 to test the flow rate. A slower flow rate
means that the sand is not washed enough, likewise if it is too high there is not enough
resistance because the sand was washed too much, and the filters adsorption will be sub
optimal. The filters ideal pressure is 9.81kN/m3 (J.K.Mitchell, 1960).
The outlet pipe
Take the piping and cut to a length of 105cm. Shape the end of it to suit the desired
shape of the filter’s tap by means of mild heating.
The concrete outer casing
Shape the steel to make a rectangular prism of the desired size (Figure 6). It is
recommended to have the mould of the concrete casing made by a welder, such that its
accuracy can be assured. Whilst a specific figure for the cost of welding cannot be
determined by our report, it should fall within the demographical wage brackets
outlined earlier and accordingly cost around 179NPR ($2 AUD, price sourced from
Nepal) per day.
The overhead time for this is approximated at a week.
For the casting of the concrete the mould should be coated in oil to prevent the concrete
from sticking.
Pour the concrete into the mould. Add the plastic tubing such that it is encased in the
wall of the concrete but its main length is in the area where the sand will eventually
exist and its bottom is at the base of the mould. The reasoning for this is that the sand
will hold it in place, but were it placed in the concrete setting could deform the tube,
leaving it useless. Ensure that the outlet of the tube’s height is less than that of the
desired height of the full volume of sand, such that the water can be gravity fed through
the system.

SUSTAINABLE WATER FILTRATION IN SANDIKHOLA
45
Diffusers
To prevent large amounts of turbidity that have passed through the filter the final
course below the gravel is a metal diffuser that has small holes in it to allow only
water and very small particles to filter through to the tube. For the area of the base of
the filter, 100 holes would be acceptable (Centre for Affordable Water and Sanitation
Technology, 2009).
Final assembly
Once the concrete has set and been removed from its mould, the diffuser can be added
above the tubing. Thereafter the different sizes of gravel are added above the diffuser.
Then the activated carbon layer is added. The limestone sand is added above the carbon
layer. A diffuser is then placed at the top. A simple lid of wood or plastic must be made
to prevent contamination of the sand and water. It is to be placed on top of the filter
when not in use. The required amount of limestone sand and Activated carbon is 50
cubic centimetres per filter each.

SUSTAINABLE WATER FILTRATION IN SANDIKHOLA
46
Figure 17 Blueprint design of Multilayer filter (Illustrated by Team 21)

SUSTAINABLE WATER FILTRATION IN SANDIKHOLA
47
IMPLEMENTATION PLAN
A consideration must be made for the people who will be involved in the
implementation of the design including:
The population of Sandikhola
EWB
NEWAH
The second stage of implementation is the survey. It Important to know the landscape
the design will be implemented into. Because the proposal is communal water filters
rather than household, a flat surface that is somewhat protected from the elements is
optimal.
Figure 18 Water constructs (Turner, 2013)
Because of the previous developments in Sandikhola we can assume the ease of access
required for developing medium scale concrete structures.

SUSTAINABLE WATER FILTRATION IN SANDIKHOLA
48
Survey implementation
After the initial survey the following implementation plan can commence.
Initial consultation of EWB, NEWAH and the population of Sandikhola.
Preliminary training for the job including training for material handling, basic hand
tools, manual handling techniques, team work and cooperation, Work Health and
Safety, language proficiency, Chemical Handling, Device operation, Skilled and
unskilled labour and safe drinking water standards and on-going required maintenance.
Acquiring materials for the job. Limestone, charcoal, concrete etc.
Construction of the water filter.
Installation of the device.
Testing of device to ensure it functions correctly.
Once the device is proven to work safely and correctly it will be ready for use to the
local villagers.

SUSTAINABLE WATER FILTRATION IN SANDIKHOLA
49
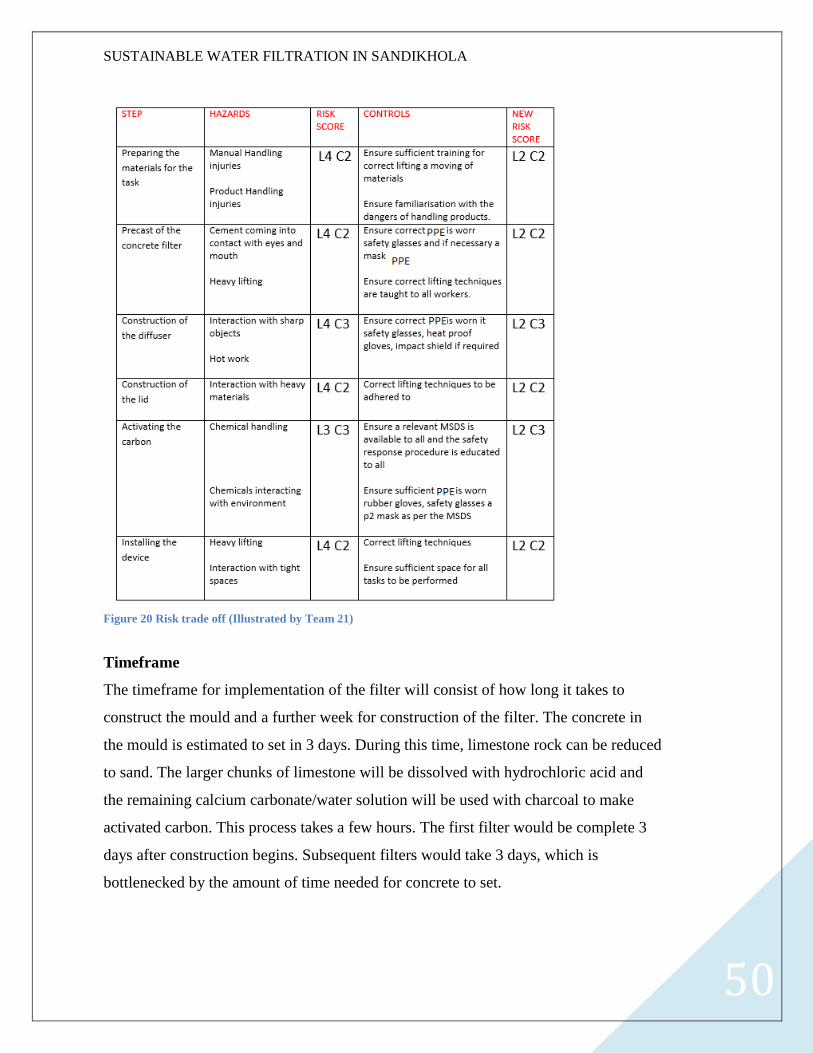
Risk assessment
Figure 19 Risk Assessment Chart (RISK PENTAGON, 2010)
Using the above risk matrix we can identify and restrict the associated hazard with this
specific task, refer to figure 20.
SUSTAINABLE WATER FILTRATION IN SANDIKHOLA
50
Figure 20 Risk trade off (Illustrated by Team 21)
Timeframe
The timeframe for implementation of the filter will consist of how long it takes to
construct the mould and a further week for construction of the filter. The concrete in
the mould is estimated to set in 3 days. During this time, limestone rock can be reduced
to sand. The larger chunks of limestone will be dissolved with hydrochloric acid and
the remaining calcium carbonate/water solution will be used with charcoal to make
activated carbon. This process takes a few hours. The first filter would be complete 3
days after construction begins. Subsequent filters would take 3 days, which is
bottlenecked by the amount of time needed for concrete to set.

SUSTAINABLE WATER FILTRATION IN SANDIKHOLA
51
Table 5 Gantt chart for construction (Illustrated by Team 21)
Training outline
Equally important to the plan for the implementation of the design is the training that
must accompany it. At each stage macro training of the population will be important to
ensure they understand how to properly develop and maintain the filters. This is not
only a guarantee of the design working most efficiently but an investment in their
ability to build more filters, or repair filters later.

SUSTAINABLE WATER FILTRATION IN SANDIKHOLA
52
Preperation of materials:
Assembly
Operation
Maintainence
Decommission
While reducing the limestone to dust PPE should be work to prevent the inhalation of dust and
debris striking the eyes and skin. Thick gloves and long sleeve clothing to be worn whilst handling
acid. Measures should be taken such that the people understand the size and consistency needed for
the limestone and carbon. Similarly the people need to be taught a low tech method of identifying
when the carbon has been “baked” enough. It is recommended that the carbon be exposed to two
hours on fire.
The people of Sandikhola will need to be taught the methodologies of pouring concrete and how to
avoid skin contact. Similarly the punching of holes in the SOURCE TERM will need to be done
safely; the operation of tools to do so is another education requirement. If they do not already
know, the people must be taught measurements and how to find them.
The people will need to be taught the flow rate of the filter and how frequently they can add water
to it. Similarly they must be educated on how much water must flow through daily to supply the
village needs so that there isn’t a rush at primary times (like meal times). The people will need to
be taught how to identify when the salt content has become too high in the filter. The
recommended low tech solution for this is to take a small amount of limestone sand from the top of
the filter and pour already filtered water through it. If the taste is too salty, the limestone must be
changed. The sand should be sourced from as much as one foot deep as salt will build up at the top
most quickly.
After the amount of time it takes for salt concentrations to reach levels unsafe to drink the filter
mediums will need to be replaced. The people need to be taught why this is the case as they may
consider the substandard chemical filtered water still superior to unfiltered water. While this may
be true, the people need to be educated in the risk of high salt and high acid water. It will take
multiple people to be able to turn the filter over without breaking it and remove the contents to
replace, the people should be taught a method of safe lifting. Though it will take some time for the
salt levels to hit unsafe levels (potentially decades) the time will come when the filter medium
needs to be replaced.
When the Filter reaches a level of fatigue that the concrete cracks through, the filter will need to be
destroyed and replaced. The villagers will need to be taught a safe method of reducing the concrete
to smaller pieces, and a method for its disposal, as well as combining the above mentioned use of
PPE and safe lifting techniques.
Figure 21 Inception to decommission flow chart (Illustrated by Team 21)

SUSTAINABLE WATER FILTRATION IN SANDIKHOLA
53
Cost
The final cost for the system is 64,432 NPR ($745 AUD, price sourced from outside
Nepal) assuming that all the materials listed in the biosand design are used. It is the
expectation of Team 21 that many of these materials such as sheet metal and plastics
will be available in the existing waste in Sandikhola, along with the concrete required
(Engineering Without Borders, 2014).

SUSTAINABLE WATER FILTRATION IN SANDIKHOLA
54
Acidic and turbid water
filters through limestone sand.
Reaction of the acids with Calcium
carbonate leaves calcium salt.
Water continues to carbon filter
stage where adsorption
removes most contaminants.
Water travels through courses
of gravel to remove
remaining turbidity.Safe potable
drinking water emerges from the end of the filter.
ENVIRONMENTAL CONCERNS
Environmental impact
The foreseeable impact to the environment includes the recovery of above ground
limestone rocks and gravel, as well as the burning of bio-waste to create charcoal and
for the curing process of activated carbon. For 7 filters to be created the sum of this
waste could not exceed 700 cubic centimetres. The benefit of such a system is the
burning of waste to create the charcoal needed in activated carbon is not just a good
solution to the waste issues in Sandikhola, but one that is already in use (Engineers
Without Borders, 2014).
when the filters need to be replaced the limestone can be
washed through for calcium carbonate salt
to make activated charcoal.
to seperate the salt from the water it must be boiled, the fire to do so can be fueled by the bio matter needed to make the charcoal for the activated carbon.
Figure 22 Filtration flow chart (Illustrated by Team 21)

SUSTAINABLE WATER FILTRATION IN SANDIKHOLA
55
As seen in figure 22 the design has many recyclable elements intentionally used in the
design. The purpose of limestone to nullify acid and make the salt specifically needed
to make activate carbon, the fire used to get the salt from the water creates the charcoal
and the remaining salt helps turn that charcoal into activated carbon.
The limestone sand will hit maximum salt concentration every 3 years, Team 21
recommends it be changed yearly (Appendix 2.5)
Environmental Trade-off
In any circumstances the impact on the environment can be reduced. The following
chart proposes potential trade-offs to reduce environmental impact.
Impact Trade off Potential Improvement
Gathering of Limestone Take only surface rocks
rather than digging for
limestone
No scarring to the
surrounding
environment
Burning of wood for
charcoal
Burn existing waste and
use the burning to treat
activated carbon and
boil off water with
calcium carbonate in it
Less burning with
greater utilization of the
waste and heat, as well
as managing waste
better
Sourcing gravel Sourcing surface gravel
or debris from existing
construction
Reduces scarring to the
landscape and clears up
existing debris from
previous developments
Diffuser construction Source metal from
recycled sources or
debris in the village
Creates less waste at
decommission
Table 6 Environmental trade off (Illustrated by Team 21)

SUSTAINABLE WATER FILTRATION IN SANDIKHOLA
56
Removal of the filter medium
Deconstruction of the body
Recycling of materials
DECOMMISION
Decommission outline
It is an important consideration that a plan is made for the eventual safe removal of the
design. The proposal to safely remove a dysfunctional filter is as follows.
Using a tool such as a shovel the filter mediums should be removed from the body of
the filter, with care being taken to keep the limestone and the carbon as separate as
possible. The reasoning for this is that the limestone can be washed through for
calcium carbonate to create more activated carbon, or the calcium carbonate (and
limestone for that matter) can be added to the new concrete mix to cast a new body.
If the diffuser is not damaged it can be recycled for another filter. Similarly the gravel
can be re-used.
The body, assuming it needs to be, can be tipped over by two people using correct
lifting methods. From that point, with the use of PPE, can be reduced to gravel-like
rubble by use of hammer or other tool and used as the gravel in another filter if needed.
If the design is being decommissioned without intent of making another then the
reduction to gravel or small chunks makes the moving of the concrete for discarding an
easier task. Tools such as a hammer or better and a wheelbarrow are strongly
recommended.
All the materials used in the design can be re-used in subsequent filters assuming they
are not damaged. If they are damaged, all the materials except the piping and diffuser
are safely discarded to the environment.
Figure 23 Decommission flow chart

SUSTAINABLE WATER FILTRATION IN SANDIKHOLA
57
CULTURAL CONCERNS
Cultural impact
There are many practiced religions in the country of Nepal, one of the largest being
Hinduism which makes up about 80% of practiced religion in Nepal (Nepal Link,
2012). Most of the cultural and religious beliefs should not affect the implementation
of the purification system, but consideration will still have to be taken to minimize the
chance of any offence.
A commonly shared belief in most Nepal religions is a respect for places of worship.
Without knowing if there are any sites of worship or shrines located in Sandikhola,
care will have to be taken to ensure that no system are built near or in any holy
locations. (United Religion Initiative, 2002)
When constructing buildings or excavation sites people who follow Hinduism have a
ritual called Bhoomi Pooja, which is performed by a priest, to seek forgiveness from
mother earth for violating her (DW, 2013). If we excavate limestone locally team 21
recommends a priest should be asked to perform the ritual at the excavation site, so as
not to offend the locals and keep in line with their practices.
Another issue with the placement of the purifier's will be in regard to the issue of open
defecation in Nepal (Dietvorst, 2008). Failure to install the systems in hygienic
locations may result in contamination. To combat this it is the recommendation of team
21 that a survey is conducted around the town to find what areas, if any, are affected by
open defecation and to install the purifiers in hygienic locations.
A misconception guided by Hindu beliefs is that cow dung has cleansing properties
(Naturally Nepal, 2012). If the locals of Sandikhola are maintaining and cleaning the
filter there is the chance that they may use this "cleansing material". This will introduce
contamination, possibly far enough down the filter that it seeps through into the
produced drinking water. To ensure that no health issues arise from this it is

SUSTAINABLE WATER FILTRATION IN SANDIKHOLA
58
recommended by team 21 that the locals are taught how to maintain and clean the filter
properly.
A cultural eating habit of the Nepal people is that food is eaten with the right hand, (the
left is used for cleaning one's self after the toilet). It is not polite to eat with your left
hand because it is viewed as unclean (Visit Nepal, 2003). This may also apply to
drinking water as it is consumed also. To ensure that no one offends the locals by
improper use of the purifier, the locals should be surveyed to find if any of them have
issues with the water being added or removed with the left hand. If the survey reveals
that this may be an issue it is team 21's recommendation that signs are place on or near
the purifiers to remind people to use they're right hands
Prototype
A prototype of the design was developed by team 21 to test the real world ability of the
filter. With slow sand filtrations ability to deal with bacteria well documented, our
testing was specifically to see how well the addition of limestone could deal with acid
and chlorine. A full experimental proof of the design can be found in Appendix 2.4.
Figure 24 Limestone filter prototype

SUSTAINABLE WATER FILTRATION IN SANDIKHOLA
59
The prototype performed as expected with its ability to removal chlorine and acid,
making it suitable for Nepal’s acidic rain. Greater testing is required to test the other
theoretical stoichiometric qualities of the filter.

SUSTAINABLE WATER FILTRATION IN SANDIKHOLA
60
CONCLUSION
Through rigorous stoichiometry proof and practical experimentation the hypothesized
benefits of the limestone/carbon filter were demonstrated. However the real world
application of the biosand filter and the similarities of the systems was something that
could not be overlooked and proved to be of great benefit when considering the
integration into the community. It was believed the hybridization of the designs would
prove greater than the sum of its parts. Through critical trade off analysis this was
realized.
Sandikhola’s issue with water filtration is best dealt with a method that has low
environmental impact, fast construction time, high filtration and low cost. It is the
recommendation of team 21 that the modified bio sand filter system with the
augmentation of limestone sand and activated charcoal is the best fit of those criteria.
The method is sustainable and utilized the waste and local resources of Sandikhola
effectively.

SUSTAINABLE WATER FILTRATION IN SANDIKHOLA
61
VI: APPENDIX
APPENDIX 1: TEAM PROJECT PLAN / TEAM ORGANIZATION
Week:
1
2
3
4
5
6
7
8
9
1
0
1
1
1
2
evaluate client
brief
report 1
planning
report 2
planning
report 3
planning
problem
definition
regional
research
design research
alternative
solutions

SUSTAINABLE WATER FILTRATION IN SANDIKHOLA
62
report 1
compilation
analysis
report 2
compilation
decision
cost trade off
analysis
evaluation of
design
evaluation of
report/structure
compilation of
final report and
presentation
Table 7 Gantt chart, illustrated by Team 21

SUSTAINABLE WATER FILTRATION IN SANDIKHOLA
63
TEAM BREAKDOWN
In line with the particular strengths and dynamics of the members of team 21 we have
devised a role set for each member here on out to play best towards their strengths.
We have elected Craig Burns as team leader, as we feel his empathy and
communication is best served in a role of mediation for the team. Doug Bird will take
the role of Compiler, as his preliminary report and design idea had very attentive and
intuitive layouts that we wish to mirror in our reports. Jordan Butler takes the role as
Primary Researcher, and Matt foster as collaborator, on the basis that they are both
doing second year units and have a greater technical understanding than the rest of the
team, their efforts are best invested in the mechanics of how the designs will work and
their implementation. Dylan Roberts assumes the role of time keeper for the project,
making sure that team meetings and the criteria of the Gantt chart are met. Finally
Faisal Alanazi will serve as the support of the team, because his proactive nature and
enthusiasm to work with the team makes him our go to guy.

SUSTAINABLE WATER FILTRATION IN SANDIKHOLA
64
APPENDIX 2: DESIGN CALCULATIONS AND FORMULAE
A2.1: Limestone is Calcium carbonate CaCO3
(RSC, 2014).
Its advantage over normal sand is the chemical bonds it forms, outlined below. The
pollutants described are selected on the basis of the % of contamination in the water
sourced from Nepal (Shrestha, Pandey, Yoneyama, & Kazama, 2013).
The chemical reaction of limestone and Hydrochloric acid:
CaCO3+2HCl→CaCl+CO2+H2O
CaCl: Calcium chloride, solid, too large to slip through filter.
CO2: Carbon Dioxide, gas.
H2O: Water, Liquid, will pass filter.
Reaction of limestone and sulphate (Silva, Lima, & Leão, 2012).
2CaCO3+2SO42-+O2→2CaCO4+2CO2
CaCO4: Calcium Carbonate ion, solid, will not pass filter.
CO2: Carbon Dioxide, gas.
Limestone and Nitrate:
CaCO2 + NO3 → CaNO3 + CO2
CaNO3: Calcium Nitrate, solid, will not pass filter. (The presence of calcium
nitrate can be used for treatment of waste water): (Einarsen, ÆeesØy,,
Rasmussen, Bungum, & Sveberg, 2000)
CO2: Carbon Dioxide, gas.
Limestone and Bicarbonate.
CaCO2+HCO3
Non-reactive. Bicarbonate is beneficial in ph balancing systems: (Biology
Arizona, 2006)

SUSTAINABLE WATER FILTRATION IN SANDIKHOLA
65
Calcium Chloride and Phosphate
3 CaCl2+ 2 K3PO4 → Ca3(PO4)2 + 6 KCl
the presence of Calcium chloride (as a product of Limestone and Hydrochloric
acid) assists in the removal of phosphate. It is also an important ingredient in the
construction of activated carbon.
A2.2:
Using Darcy’s laws to calculate the flow rate of the limestone multilayer filter:
Argument assumes a 1 meter deep prism, with a cross sectional area of 10cm^2
Where Q is output in litres, K is hydraulic conductivity in m/hour, A is cross sectional
area, h is Head loss, and L is distance travelled.
K=2x10⁻⁴m/sec (Duffield, 2014)
h= 5.24x10⁻³m (The Engineering Toolbox, 2014)

SUSTAINABLE WATER FILTRATION IN SANDIKHOLA
66
A2.3:
Langmuir calculations and specific surface area of filter materials:
the surface area of Limestone is 521m2/kg
the surface area of Activated Carbon is 889m3/kg
(Cheremisinoff & Morresi, 1980)
The surface area of C33 sand is 255 m2/kg
From the Langmuir equation, assuming constant temperature and pressure, we can
derive that the figure for θ can be scaled by the ratio of the filter media. (New Mexico
Institute of Mining and Technology, 2010)
From these figures you can extrapolate that the adsorption quality of a filter containing
equal parts limestone and Carbon is 2.76 times that of sand.

SUSTAINABLE WATER FILTRATION IN SANDIKHOLA
67
A2.4:
HYPOTHESIS
If Limestone sand and activated carbon is used in place of C33 quartz sand the
filtration of acid will increase dramatically from gravity fed water, adsorption will
increase by a factor of 2.7, chlorine will be removed from the water, and the flow rate
will remain at a similar rate to that of the traditional C33 sand filter.

PROPOSED SOLUTIONS AND METHODOLOGIES
68
MATERIALS AND METHODOLOGIES
Materials used:
Limestone brick.
Hammer.
Hydrochloric acid.
Charcoal.
C33 sand.
Gravel.
Ph and chlorine strip testing kit.
Empty Pet bottles 1.25 litres.
Method:
First we set out to make the limestone sand. As only limestone brick as available in
the area we sourced our materials from we took to it by hammer to reduce it to dust.
We consider this to be a relevant method of
reduction to sand as the people of Sandikhola
will need to use the same approach to reduce
limestone rock to sand.
Once small particles and sand were achieved they were separated by placing them
within a bag with small holes in the bottom and sifting through. The remaining large
particles were placed in a separate container and had 100ml of hydrochloric acid
added to produce Calcium chloride salt, water and carbon dioxide gas.
Figure 25 Hammer and limestone

PROPOSED SOLUTIONS AND METHODOLOGIES
69
Figure 26 Limestone dissolving in hydrochloric acid
Thereafter we reduced the Charcoal down to a dust by use of hammer as well.
Figure 27 Broken down charcoal
It should be noted that the grain size was significantly larger than that of the
purchased C33 sand, resulting in a lower adsorption than
optimal.
The water and Dissolved Calcium Chloride was filtered from
the reagent limestone
This solution was then added to the Crushed charcoal and
baked on fire to allow the water to evaporate through. This
Figure 28 Calcium carbonate dissolved in water

PROPOSED SOLUTIONS AND METHODOLOGIES
70
method of chemical activation is a widely used lo-tech method of creating activated
carbon (Charcoal House LLC , 2014).
After baking in open fire the carbon is again crushed to sand.
Figure 29 Charcoal
The pet bottles were then taken and had a small drip drain added to the base. Then
pebbles and gravel that had been washed and dried were used
to fill the base to prevent solids moving through. After the
gravel had settled, once Pet bottle received the C33 sand,
whilst the other received equal parts activated carbon and
limestone sand.
A control water of Australian Tap Water (ATW) was tested
for ph and chlorine levels.
Figure 30 Limestone and C33 filters

PROPOSED SOLUTIONS AND METHODOLOGIES
71
Figure 31 Ph of control water
We then created the dirty water with 10ml Hydrochloric acid per 700ml water.
Additional sand and debris was added to contaminate the water.
Figure 32 Turbid water

PROPOSED SOLUTIONS AND METHODOLOGIES
72
The contaminated water was then tested to have reference for our initial conditions.
The C33 sand was then used to filter through half of the contaminated water and also
tested for ph levels.
Figure 33 Turbid water Ph, C33 filtered water Ph, Limestone filtered water Ph (right).
The water was applied to the limestone filter at the same time as the C33 filter;
however, the limestone filter took longer to filter the water.
Figure 34 Low turbidity from limestone filter.
The limestone filter performed significantly better in the testing of ph and chlorine

PROPOSED SOLUTIONS AND METHODOLOGIES
73
than the c33 filter, however in both cases the water was discoloured and contained
trace amounts of solids.
Figure 35 Turbid water Ph, C33 filtered water Ph, Limestone filtered water Ph, Control water (right).
RESULTS
The ATW had a higher than expected PH. It contained no Chlorine and 30-50 parts
per million (ppm) Cyanuric acid. Its hardness was 500ppm. Alkalinity was 80ppm
the dirty water had a total hardness of 250ppm. Its PH was 6.2. It had a chlorine level
that was immeasurably high for the strips. The dirty water had an alkalinity of 0ppm
and a Cyanuric acid level of over 100ppm.
The sand filter increased the hardness of the water to 1000ppm. The PH was
unchanged at 6.2. The chlorine level was still immeasurably high. Cyanuric acid
levels were reduced to 30-50ppm. Alkalinity remained at 0.
The water was taste tested. It was inconsumable. It had a strong salt/chemical taste.
The water was very murky.

PROPOSED SOLUTIONS AND METHODOLOGIES
74
The limestone filter also increased hardness to 1000ppm. Chlorine was reduced to 0.
PH was restored to 7.2. Alkalinity was 80ppm. Cyanuric acid was 0. Water was
tasted; though it seemed safe to drink the water still had a notable taste of charcoal
and was considerably more difficult to drink that ATW.
DATA TABLE
Hardnes
s (ppm)
Chlorin
e (ppm)
P
H
Alkalinit
y
(ppm)
Cyanuri
c acid
(ppm)
colour turbidit
y
ATW 250 0 8.4 180 30-50 Clear 0
DIRTY 250 Above
20
6.2 0 Above
100
Slightl
y
cloudy
coarse
SAND
FILTER
1000 Above
20
6.2 0 30-50 cloudy fine
LIMESTON
E
1000 0 7.2 80 0 Slightl
y
cloudy
fine
Table 8 Comparison of sample water

PROPOSED SOLUTIONS AND METHODOLOGIES
75
CONCLUSIONS
Limestone carbon behaved as expected with respect to chlorine and acid filtration.
Water was restored to PH levels and Acid levels better than that of ATW. Filtration
occurred more slowly than anticipated, at current the design would not be fast
enough to meet the needs of a community and needs to be modified. Whilst
reasonable insight was gained drawbacks such as grain size and filter size reduced
the performance of all filters tested. Construction was proven to be fast and simple at
a low-tech level. Measured flow rate for Sand was consistent with data put forward
by Bio-sand filter constructors. Flow rate for limestone was negatively affected by
the compacting of the sand and it is the recommendation of team 21 that Limestone
sand and carbon should be used, but to the specifications of existing Bio-sand
Blueprints. More gravel is required at the bottom of the design, and of different
coarseness to prevent sand filtering through as well (in both designs.).
A2.5
If the consumption of the population is 4 litres per day, and the concentration of acid
at ph 5 is 1 part per 10,000 (Frostburg, 2014) then the following calculations can be
made.
molar mass of calcium carbonate: round 100g/mol
Limestone density 2560 kg/m3
knowing the dimensions of the filter we can conclude that the filter contains 320kg
of limestone. That is equivalent with 3200 mols. Hydrochloric acid is 36.46094
g/mol. Therefor at ph5 67.16 litres of acid pass the filter per year. It would then take
approximately 3 years to hit maximum salt content.

PROPOSED SOLUTIONS AND METHODOLOGIES
76
VII: REFERENCES
Banbury, J. (2008). A simple way to make bad water safe. Retrieved April 30, 2014,
from UNICEF:
http://fieldnotes.unicefusa.org/2008/10/such_a_simple_way_to_make_bad_1.h
tml
Barksdale, M., & Kershner, K. (2009). Lifestraw. Retrieved April 1, 2014, from How
Stuff Works: http://science.howstuffworks.com/environmental/green-
tech/remediation/lifestraw1.htm
Bio UV. (2014). The Water Treatment Specialist. Retrieved April 30, 2014, from Bio
UV: Ultraviolet Solutions: http://www.bio-uv.co.uk/FAQ/Do-the-low-
pressure-UV-systems-destroy-all-the-chloramines-_730_69.html#69
Biology Arizona. (2006). Clinical Correlates of pH Levels. Retrieved April 30, 2014,
from Biology Arizona:
http://www.biology.arizona.edu/biochemistry/problem_sets/medph/intro.html
Biosand filters. (2004). Sand filtration: rapid versus slow. Retrieved April 30, 2014,
from Biosand filters:
http://www.biosandfilter.org/biosandfilter/index.php/item/316
Bradley, I., Straub, A., Maraccini, P., Markazi, S., & Nguyen, T. (2011). Iron oxide
amended biosand filters for virus removal. Water Research, 4501-10.
Central Bureau of Statistics. (2012). National Population and Housing Census 2011.
Kathmandu: Government of Nepal.
Centre for Affordable Water and Sanitation Technology. (2009). BIOSAND FILTER
MANUAL. Alberta: Centre for Affordable Water and Sanitation Technology.
Charcoal House LLC . (2014). How to Make Activated Charcoal at Home. Retrieved
April 30, 2014, from Buy Activated Charcoal:
http://www.buyactivatedcharcoal.com/how_to_make_activated_charcoal
Cheremisinoff, P. N., & Morresi, A. C. (1980). Carbon Adsorption Handbook.
Michigan: Ann Arbor Science Publishers, Inc.
Climate Data. (2014). Climate: Gorhka. Retrieved April 30, 2014, from Climate-
Data.org: http://en.climate-data.org/location/28558/
de Onis, M., Brown, D., Blössner, M., & Borghi, E. (2012). Levels and Trends in
Child Malnutrition. Washington DC: WHO, UNICEF and The World Bank.
Deithorn, R. T., & Mazzoni, A. F. (2014). The Story of Activated Carbon. Retrieved
April 30, 2014, from Tigg: http://www.tigg.com/what-is-activated-carbon.html
PROPOSED SOLUTIONS AND METHODOLOGIES
77
Developing Alternatives. (2011). FREQUENTLY ASKED QUESTIONS (FAQs).
Retrieved April 1, 2014, from Devalt: www.devalt.org
Dietvorst. (2008). Nepal: Open defecation in Kathmandu. Retrieved May 24, 2014,
from Sanitation Updates:
https://sanitationupdates.wordpress.com/2008/04/29/nepal-open-defecation-in-
kathmandu/
Duffield, G. M. (2014). Representative Values of Hydraulic Properties. Retrieved
April 30, 2014, from Aqtesolv: http://www.aqtesolv.com/aquifer-
tests/aquifer_properties.htm
Dunar, A., & Mcbride, D. (2001). Building Hoover Dam: An Oral History of the
Great Depression. Nevada: University of Nevada.
DW. (2013). Respect for nature key to Hinduism. Retrieved May 24, 2014, from DW:
http://www.dw.de/respect-for-nature-key-to-hinduism/a-16730629
Egenius Designs. (2011). How the Lifestraw Works. Retrieved April 30, 2014, from
Egenius Designs: http://www.egeniusdesigns.com/lifestraw-personal.html
Einarsen, A., Æ. A., Rasmussen, A. I., Bungum, S., & Sveberg, M. (2000). Biological
prevention and removal of hydrogen sulphide in sludge at Lillehammer
Wastewater Treatment Plant. Water Science and Technology.
Elliot, M., Stauber, C., Koksal, F., DiGiano, F., & Sobsey, M. (2008). Reduction of E.
coli, echovirus type 12 and bacteriophages in an intermittently operated 2
houshold-scale slow sand filter. Water Research.
End All Diseases. (2011). Drinking Poop Water Through A Lifestraw. Retrieved April
1, 2014, from End All Diseases: http://www.endalldisease.com/drinking-poop-
water-through-a-life-straw/
Engineering Without Borders. (2014). Design area 2 - WASH. Retrieved April 1,
2014, from Ewbchallenge: http://www.ewbchallenge.org/nepal-water-health-
newah/design-area-2-wash
Engineers Without Borders. (2014). Design area 2 - WASH. Retrieved April 1, 2014,
from Ewbchallenge: http://www.ewbchallenge.org/nepal-water-health-
newah/design-area-2-wash
Environment Agency. (2002). Methods for the Examination of Waters and Associated
Materials. Retrieved April 1, 2014, from Department of the Environment:
www.environment-agency.gov.uk
Environment and Public Health Organization. (2011). Status of Drinking Water

PROPOSED SOLUTIONS AND METHODOLOGIES
78
Quality in Nepal. Retrieved April 1, 2014, from Environment and Public
Health Organization: http://www.enpho.org/programs/25-programs/safe-
water/70.html
Ericson, A. J. (2014). Enhanced Sand Filtration. Minnasota: University of Minnasota.
Frostburg. (2014). What is pH? . Retrieved from General Chemistry:
http://antoine.frostburg.edu/chem/senese/101/acidbase/faq/what-is-pH.shtml
Gazzinelli, A., Souza, M. C., Nascimento II, S., Cadete, M. M., & Kloos, H. (1998).
Domestic water use in a rural village in minas gerais, brazil, with an emphasis
on spatial patterns, sharing of water, and factors in water use. Cadernos de
Saúde Pública.
Guerrant, R. L., Schorling, J. B., McAuliffe, J. F., & de Souza, M. A. (1992). Diarrhea
as a cause and an effect of malnutrition: diarrhea prevents catch-up growth and
malnutrition increases diarrhea frequency and duration. American Journal of
Tropical Medicine and Hygeine.
Hopmans, J. W. (2002). CHAPTER 1. SOIL PHYSICAL PROPERTIES. Davis:
University of California.
Imran, S. (2014). The Muslim Village. Retrieved April 30, 2014, from Sunnah Money
: http://www.sunnahmoney.com/the-muslim-village/
J.K.Mitchell. (1960). Components of pore water pressure and their engineering
significance. Berkeley: University of California,.
Legal information institute. (1996). 21 CFR 184.1193 - Calcium chloride. Retrieved
April 30, 2014, from Legal information institute:
http://www.law.cornell.edu/cfr/text/21/184.1193
Lenntech. (1998). Adsorbtion. Retrieved April 30, 2014, from Lenntech:
http://www.lenntech.com/library/adsorption/adsorption.htm
Li, R., Yuan, Y., Zhan, X., & Liu, B. (2014). Phosphorus removal in a sulfur-
limestone autotrophic denitrification (SLAD) biofilter. Environmental science
and pollution research international.
Livelihood Ngo. (2014). HOUSEHOLD WATER TREATMENT. Retrieved April 30,
2014, from Livelihood Ngo:
http://livelihoodngo.cfsites.org/custom.php?pageid=39373
McSweeney, C., New, M., & Lizcano, G. (2012). Nepal. England: School of
Geography and Environment, University of Oxford.
Metal Roofing Online. (2014). Corrugated ZINCALUME® Roofing and Walling .

PROPOSED SOLUTIONS AND METHODOLOGIES
79
Retrieved April 30, 2014, from Metal Roofing Online:
http://www.metalroofingonline.com.au/en/48-corrugated-zincalume-
sheeting.html
MIT. (2001). Clean water for Nepal is focus of MIT research. Retrieved April 1,
2014, from http://newsoffice.mit.edu:
http://newsoffice.mit.edu/2001/nepalwater
Monroe, L. W., & Chan, K. L. (2007). The role of aluminum in slow sand filtration.
Water Research.
Mwabi, J. K., Adeyemo, F. E., Mahlangu, T. O., Mamba, B. B., Brouckaert, B. M.,
Swartz, C. D., et al. (2011). Household water treatment systems: A solution to
the production of safe drinking water by the low-income communities of
Southern Africa. Physics and Chemistry of the Earth, 1120-1128.
Naturally Nepal. (2012). Culture. Retrieved May 24, 2014, from Naturally Nepal:
http://welcomenepal.com/promotional/know-nepal/culture/
Nepal Link. (2012). Culture & Religion in Nepal. Retrieved May 24, 2012, from
Nepal Link: http://nepaltourisminfo.com/nepal/culture-religion.html
Nepal Ministry for Industry. (2009). General Geology. Retrieved April 1, 2014, from
Government of Nepal, Ministry for Industry:
http://www.dmgnepal.gov.np/index.php?option=com_content&view=arti
cle&id=98&Itemid
Neupane, B., & Sharma, R. P. (2014). An assessment of the effect of vegetation size
and type, and altitude on above ground plant biomass and carbon. Scienceweb
Publishing.
New Mexico Institute of Mining and Technology. (2010). The Langmuir Adsorption
Isotherm. New Mexico: New Mexico Institute of Mining and Technology.
Niinemets, Ü., Loreto, F., & Reichstein, M. (2004). Physiological and
physicochemical controls on foliar volatile organic compound emissions.
Trend in plant science.
Pant, B. R. (2011). Ground water quality in the Kathmandu valley of Nepal.
Environmental Monitoring and Assessment, 477-485.
Plappally, A. K., Yakub, I., Brown, L. C., Soboyejo, W. O., & Soboyejo, A. B.
(2011). Physical Properties of Porous Clay Ceramic-Ware. Journal of
Engineering Materials and Technology.
pokharel, P. (-). EXPLORATION OF CEMENT GRADE LIMESTONE DEPOSIT.

PROPOSED SOLUTIONS AND METHODOLOGIES
80
ALPHA CONSTRUCTION AND DEVELPOERS PVT.LTD.
PotaVida. (2012). SODIS Method. Retrieved April 30, 2014, from PotaVida:
http://potavida.org/sodis-method/
Queensland Health. (2014). Good Health in Tropical North Queensland . Retrieved
April 30, 2014, from Queensland Government:
http://www.health.qld.gov.au/goodhealthintnq/topics/water_industry.asp
Rai, O. K. (2009). Status of drinking water contamination in Mountain Region, Nepal.
Nepal Med Coll Journal, 281-3.
Rain Harvest. (2010). How a BioSand Water Filter Works. Retrieved April 1, 2014,
from Rain Harvest: http://www.rainharvest.co.za/2010/07/how-a-biosand-
water-filter-works/
RISK PENTAGON. (2010). TRIPLE BOTTOM LINE – (RPI RISK PENTAGON).
Retrieved May 24, 2014, from RISK PENTAGON:
http://www.risk8.com/pentagon/
Royal Botanic Garden Edinburgh. (2014). Plants of Nepal. Retrieved April 1, 2014,
from Royal Botanic Garden Edinburgh: http://rbg-web2.rbge.org.uk/nepal/
RSC. (2014). The chemistry of limestone: teacher’s notes. Retrieved April 30, 2014,
from RSC:
http://www.rsc.org/education/teachers/resources/jesei/chemlim/home.htm
Safe Water Now. (2014). Ceramic Water Filter. Retrieved April 30, 2014, from Safe
Water Now: http://www.safewaternow.org/?page_id=31
Salary Explorer. (2014). Salary Survey in Nepal. Retrieved April 30, 2014, from
Salary Explorer: http://www.salaryexplorer.com/salary-
survey.php?&loctype=1&loc=151
SARI. (2008). Nepal Energy Overview. Retrieved April 1, 2014, from South Asia
Regional Initiative for Energy Integration: http://www.sari-
energy.org/PageFiles/Countries/Nepal_Energy_detail.asp
Shrestha, S., Pandey, V. P., Yoneyama, Y., & Kazama, F. (2013). An evaluation of
rainwater quality in Kathmandu, Nepal. Sustainable Environment, 341-350.
Silva, A., Lima, R. M., & Leão, V. A. (2012). Mine water treatment with limestone
for sulfate removal. Journal of Hazardous Materials.
South Asia Pure Water Initiative, Inc. (2013). Filter FAQs. Retrieved April 30, 2014,
from South Asia Pure Water Initiative, Inc.:
http://www.sapwii.org/technology.html

PROPOSED SOLUTIONS AND METHODOLOGIES
81
Suwal, S. (2014). Water in Crisis - Nepal. Retrieved April 1, 2014, from The Water
Project: http://thewaterproject.org/water-in-crisis-nepal.php
Swiss Federal Institute of Aquatic Science and Technology. (2014). Microbiology.
Retrieved April 30, 2014, from SODIS:
http://www.sodis.ch/methode/forschung/mikrobio/index_EN
Tarsi, D. (2013). Frequently asked questions regarding slow sand filters. Retrieved
April 1, 2014, from Slow Sand Filters:
http://www.slowsandfilter.org/ssf_faq.html#fast
The Engineering Toolbox. (2014). Darcy-Weisbach Equation for Pressure and Head
Loss. Retrieved April 30, 2014, from The Engineering Toolbox:
http://www.engineeringtoolbox.com/darcy-weisbach-equation-d_646.html
Turner, J. (2013). ewb challenge. Retrieved from http://lh3.ggpht.com/-
sj79Ug9UbqY/Uu8Tshc5qiI/AAAAAAAAC6E/vLKRJspl_jg/DSC01675_A.J
PG
UNICEF; WHO. (2009). Diarrhoea: why children are still dying and what can be
done. Geneva: The United Nations Children’s Fund (UNICEF)/World Health
Organization (WHO).
United Religion Initiative. (2002). Hinduism: Sacred Spaces and Places. Retrieved
May 24, 2014, from United Religion Initiative:
http://www.uri.org/kids/world_hind_sacr.htm
Vestergaard. (2010). Lifestraw Brochure. Vestergaard S.A.
Visit Nepal. (2003). Do's and Don'ts. Retrieved May 24, 2014, from Visit Nepal:
http://www.visitnepal.com/travelers_guide/sensitive_traveler.htm
Wastech Controls & Engineering, Inc. (2014). Limestone Treatment of Acid Waste.
Retrieved April 30, 2014, from Wastech Controls & Engineering, Inc.:
http://www.wastechengineering.com/papers/limestone.htm
Water and Sanitation Program. (2007). Use of Ceramic Water In Cambodia. Unicef.
Water and Waste Engineering. (2014). Filtration. Retrieved April 30, 2014, from
Water and Waste Engineering: http://nptel.ac.in/courses/Webcourse-
contents/IIT-KANPUR/wasteWater/Lecture%2010.htm
Wiki Water. (2014). E19 -Treatment by sun exposure. SODIS and Solvatten methods.
Retrieved April 30, 2014, from Wiki Water: http://www.wikiwater.fr/e19-
treatment-by-sun-exposure.html
World Weather Online. (2014). Gorkha Monthly Climate Average, Nepal. Retrieved

PROPOSED SOLUTIONS AND METHODOLOGIES
82
April 30, 2014, from World Weather Online:
http://www.worldweatheronline.com/Gorkha-weather-averages/NP.aspx
Yousuf, M., Uy, B., . Tao, L. Z., & Shasha, W. (2014). Panchakanya Group.
Retrieved April 1, 2014, from TMT Steel Bar:
http://www.panchakanya.com/article-steel