Water-related Information System for the Sustainable ...
247
Abschlussbericht für den Projektträger Jülich, Projekt WISDOM II, 10/2010 – 02/2014 i Water-related Information System for the Sustainable Development of the Mekong Delta in Vietnam (WISDOM) Schlussbericht des Deutschen Zentrums für Luft- und Raumfahrt e.V. Teilprojekt 033L040AN Projektmanagement Information System Design und Bericht der Unterauftragnehmer UNU-EHS und TU Wien Berichtszeitraum 01.10.2010 – 28.02.2014
-
Upload
khangminh22 -
Category
Documents
-
view
2 -
download
0
Transcript of Water-related Information System for the Sustainable ...

Abschlussbericht für den Projektträger Jülich, Projekt WISDOM II, 10/2010 – 02/2014
i
Water-related Information System for the Sustainable Development of the Mekong Delta
in Vietnam (WISDOM)
Schlussbericht des Deutschen Zentrums für Luft- und Raumfahrt e.V.
Teilprojekt 033L040AN
Projektmanagement
Information System Design und
Bericht der Unterauftragnehmer UNU-EHS und TU Wien
Berichtszeitraum 01.10.2010 – 28.02.2014

Abschlussbericht für den Projektträger Jülich, Projekt WISDOM II, 10/2010 – 02/2014
ii
Abschlussbericht für den Projektträger Jülich, Projekt WISDOM II, 10/2010 – 02/2014
iii
Schlussbericht
BMBF - Forschungsvorhaben Förderkennzeichen 033L040AN
Verbundvorhaben WISDOM - Water-related Information System for the Sustainable
Development of the Mekong Delta in Vietnam Entwicklung eines Wasser-Informationssystems für die nachhaltige
Entwicklung des Mekong-Deltas in Vietnam
Teilvorhaben Arbeitspaket 1000 Project Management Projektmanagement
Deutsches Zentrum für Luft- und Raumfahrt Deutsches Fernerkundungsdatenzentrum
Teilvorhaben Arbeitspaket 3000 Information System Design
Design des Informationssystems Deutsches Zentrum für Luft- und Raumfahrt Deutsches Fernerkundungsdatenzentrum
Unterauftrag der UNU-EHS Pesticide Modelling and Monitoring
Pestizidmodellierung und -monitoring Vulnerability Assessment
Verwundbarkeitsforschung United Nations Universität Bonn
Department for Environment and Human Security
Unterauftrag der TU Wien Remote Sensing of Soil Moisture
Fernerkundung zur Ermittlung von Bodenfeuchteparametern Technische Universität Wien
Institut für Photogrammetrie und Fernerkundung
Berichterstatter: Dr. Claudia Künzer, Dr. Fabrice Renaud, Dr. Jörn Birkmann, Prof. Dr. Wolfgang Wagner
Laufzeit des Vorhabens: 01.10.2010 – 30.09.2013, kostenneutral verlängert bis 28.02.2014

Abschlussbericht für den Projektträger Jülich, Projekt WISDOM II, 10/2010 – 02/2014
iv

Abschlussbericht für den Projektträger Jülich, Projekt WISDOM II, 10/2010 – 02/2014
v
Inhalt ................................................................................................................................................................... ................................................................................................................................................. 1 A. Projekt Management – DLR ........................................................................................... 1 Kurze Darstellung ........................................................................................................... 1 11.1 Aufgabenstellung des Arbeitspaketes 1000 ............................................................. 1 1.2 Voraussetzungen ...................................................................................................... 1 1.3 Planung und Ablauf des Vorhabens ......................................................................... 2 1.4 Stand der Wissenschaft und Technik ....................................................................... 3
Projekt Management von Verbundvorhaben ...................................................... 3 1.4.11.5 Zusammenarbeit mit anderen Stellen ....................................................................... 3
Eingehende Darstellung ................................................................................................ 4 22.1 Erzielte Ergebnisse und Verwendung der Zuwendungen ......................................... 4
WP1100 Administrative Koordination ................................................................. 4 2.1.1 WP1200 Aufbau eines Netzwerkes und Harmonisierung mit dem 2.1.2
vietnamesischen Projektkonsortium ................................................................................. 5 WP1300 Aufbau eines internationalen Netzwerkes ............................................ 6 2.1.3 Gegenüberstellung der Ergebnisse mit vorgegebenen Zielen .......................... 12 2.1.4
2.2 Wichtigste Positionen des zahlenmäßigen Nachweises ......................................... 14 2.3 Notwendigkeit und Angemessenheit der geleisteten Arbeit ................................... 14 2.4 Nutzen und Verwertbarkeit der Ergebnisse ............................................................ 14 2.5 Während der Durchführung bekannt gewordener Fortschritt bei anderen Stellen . 14 2.6 Erfolgte und geplante Veröffentlichungen .............................................................. 15
Broschüren und Berichte .................................................................................. 15 2.6.1 Veröffentlichte Konferenzbeiträge .................................................................... 15 2.6.2 Journal-Beiträge ............................................................................................... 16 2.6.3 Wichtige Konferenzbeiträge der Projektkoordination (ohne Proceedings) ....... 17 2.6.4 Buchbeiträge ..................................................................................................... 18 2.6.5
B. Information System Design – DLR .............................................................................. 19 Kurze Darstellung ......................................................................................................... 19 11.1 Aufgabenstellung .................................................................................................... 19 1.2 Voraussetzungen, unter denen das Vorhaben durchgeführt wurde ....................... 19 1.3 Planungen und Ablauf des Vorhabens ................................................................... 20 1.4 Wissenschaftlich-technischer Stand ....................................................................... 22
Verwendete Software + Technologien .............................................................. 22 1.4.1 Verwendete Fachliteratur / Informations- und Dokumentationsdienste ............ 23 1.4.2
1.5 Zusammenarbeit mit anderen Stellen ..................................................................... 25 Eingehende Darstellung .............................................................................................. 26 22.1 Darstellung der erzielten Ergebnisse ...................................................................... 26
Übersicht über das Informationssystem ........................................................... 26 2.1.1 Technische Ausführungen ................................................................................ 39 2.1.2 Betreiberkonzept ............................................................................................... 45 2.1.3 Gegenüberstellung der Ergebnisse mit vorgegebenen Zielen .......................... 45 2.1.4
2.2 Wichtigste Positionen des zahlenmäßigen Nachweises ......................................... 47 2.3 Notwendigkeit der geleisteten Arbeit ...................................................................... 47 2.4 Voraussichtlicher Nutzen im Sinne des Verwertungsplans .................................... 47 2.5 Während der Durchführung des Vorhabens bekannt gewordener Fortschritt auf dem Gebiet des Vorhabens bei anderen Stellen ................................................................ 48 2.6 Veröffentlichungen .................................................................................................. 49
Journal Papers .................................................................................................. 49 2.6.1 Buchkapitel ....................................................................................................... 49 2.6.2 Konferenzbeiträge ............................................................................................ 49 2.6.3 Doktorarbeiten .................................................................................................. 51 2.6.4 Diplom/Masterarbeiten ...................................................................................... 51 2.6.5
Abschlussbericht für den Projektträger Jülich, Projekt WISDOM II, 10/2010 – 02/2014
vi
C. Bericht Projektteil „Pflanzenschutzmittel, Nährstoffe, Antibiotika, Schwermetalle“ (WP 4000, Task 4210) – UNU-EHS ....................................................................................... 53 Kurze Darstellung ......................................................................................................... 53 11.1 Aufgabenstellung .................................................................................................... 53 1.2 Voraussetzungen, unter denen das Vorhaben durchgeführt wurde ....................... 53 1.3 Planung und Ablauf des Vorhabens ....................................................................... 54 1.4 Wissenschaftlicher Stand, an den angeknüpft wurde ............................................. 54 1.5 Zusammenarbeit mit anderen Stellen ..................................................................... 55 1.6 Zitierte Literatur ...................................................................................................... 56
Eingehende Darstellung des Projektes ...................................................................... 57 22.1 Verwendung der Zuwendung und erzielte Ergebnisse ........................................... 57
Health-related risks associated with water sources used for drinking and 2.1.1domestic services in the rural areas of the Mekong Delta, Vietnam – nutrients, heavy metals and microbial pollution ........................................................................................ 57
Pesticide pollution in drinking water sources of the Mekong Delta, Vietnam .... 79 2.1.2 Antibiotics in the Vietnamese Mekong delta: occurrence and fate ................... 90 2.1.3 Impact of different rice production systems on the water quality in the Mekong 2.1.4
delta 103 Gegenüberstellung mit den ursprünglichen Zielen (besonders Arbeits- und 2.1.5
Zeitplanung) .................................................................................................................. 117 2.2 Zahlenmäßiger Nachweise ................................................................................... 117 2.3 Notwendigkeit und Angemessenheit der geleisteten Arbeit ................................. 117 2.4 Fortschreibung des Verwertungsplans ................................................................. 118 2.5 Sind inzwischen von dritter Seite Ergebnisse bekannt geworden, die für die Durchführung des Vorhabens relevant sind? ................................................................... 118 2.6 Erfolgte und geplante Veröffentlichungen ............................................................ 119
D. Bericht Projektteil Verwundbarkeits- und Anpassungs-forschung (in WP 5000) – UNU-EHS ............................................................................................................................. 123 Kurze Darstellung ....................................................................................................... 123 11.1 Aufgabenstellung .................................................................................................. 123 1.2 Voraussetzungen, unter denen das Vorhaben durchgeführt wurde ..................... 123 1.3 Planung und Ablauf des Vorhabens ..................................................................... 123 1.4 Wissenschaftlicher Stand, an den angeknüpft wurde ........................................... 124 1.5 Zusammenarbeit mit anderen Stellen ................................................................... 125
Eingehende Darstellung des Projektes .................................................................... 127 22.1 Verwendung der Zuwendung und erzielte Ergebnisse ......................................... 127
Introduction and rationale ............................................................................... 127 2.1.1 Conceptual approaches for assessing and evaluating risk-related adaptation 2.1.2
strategies ...................................................................................................................... 129 Conceptual framing developed for this study .................................................. 137 2.1.3 Selection of case study areas ......................................................................... 140 2.1.4 Methodology ................................................................................................... 143 2.1.5 Key results ...................................................................................................... 146 2.1.6 Concluding discussion and recommendations ............................................... 172 2.1.7 Gegenüberstellung mit den ursprünglichen Zielen (besonders Arbeits- und 2.1.8
Zeitplanung) .................................................................................................................. 181 2.2 Zahlenmäßiger Nachweise ................................................................................... 181 2.3 Notwendigkeit und Angemessenheit der geleisteten Arbeit ................................. 181 2.4 Fortschreibung des Verwertungsplans ................................................................. 182 2.5 Sind inzwischen von dritter Seite Ergebnisse bekannt geworden, die für die Durchführung des Vorhabens relevant sind? ................................................................... 184 2.6 Erfolgte und geplante Veröffentlichungen ............................................................ 184
E. Bericht zur Koordination des Doktorandenprogramms (WP 7000) – UNU-EHS .. 189 Scientific Seminars .................................................................................................... 190 1 List of PhD students and title of their PhD research: ............................................. 192 2

Abschlussbericht für den Projektträger Jülich, Projekt WISDOM II, 10/2010 – 02/2014
vii
F. Fernerkundung zur Ableitung von Bodenfeuchteparametern (WP 6250) – TU Wien 195 Kurze Darstellung ....................................................................................................... 195 11.1 Aufgabenstellung des Arbeitspaketes WP6250.................................................... 195 1.2 Voraussetzungen .................................................................................................. 195 1.3 Planung und Ablauf des Vorhabens ..................................................................... 196 1.4 Stand der Wissenschaft und Technik ................................................................... 197 1.5 Zusammenarbeit mit anderen Stellen ................................................................... 197
Eingehende Darstellung ............................................................................................ 198 22.1 Erzielte Ergebnisse und Verwendung der Zuwendungen ..................................... 198
Motivation ....................................................................................................... 198 2.1.1 Study region .................................................................................................... 198 2.1.2 Data ................................................................................................................ 199 2.1.3 Data procurement, software development, product generation and quality 2.1.4
assessment of the input data ........................................................................................ 202 Error characterization of the Scatteroemter-derived soil moisture .................. 208 2.1.5 ASCAT level-2 products ................................................................................. 211 2.1.6 Spatio-temporal analyses of the scatterometer-derived SSM ........................ 211 2.1.7 Comparison of the scatterometer-derived BWI product with available hydro-2.1.8
meteorological and climate data ................................................................................... 215 Masking scatterometer-derived SSM during flood period ............................... 219 2.1.9 Spatio-temporal analyses of the SAR-derived SSM in the LMB ..................... 221 2.1.10 Comparison of the ASAR-derived SSM with modeled soil moisture in the LMB2.1.11
224 Masking layer for the SAR-derived SSM ........................................................ 227 2.1.12 ASAR WS correlation layer ............................................................................. 235 2.1.13 References ..................................................................................................... 236 2.1.14
2.2 Wichtigste Positionen des zahlenmäßigen Nachweises ....................................... 239 2.3 Notwendigkeit und Angemessenheit der geleisteten Arbeit ................................. 239 2.4 Nutzen und Verwertbarkeit der Ergebnisse .......................................................... 239 2.5 Während der Durchführung bekannt gewordener Fortschritt bei anderen Stellen 239 2.6 Erfolgte und geplante Veröffentlichungen ............................................................ 239

Abschlussbericht für den Projektträger Jülich, Projekt WISDOM II, 10/2010 – 02/2014
Die Darstellung der Beiträge im vorliegenden Abschlussbericht des Verbundprojektes WISDOM (Phase2) umfassen die Projektarbeitspakete WP1000 zum Projektmanagement (zu finden in Abschnitt A), WP3000 zum System Design des Informationssystems (zu finden in Abschnitt B), den Bericht des Unterauftragnehmers United Nations University, Department Environment and Human Security (UNU-EHS) zu den Teilarbeitspaketen WP4330 zu Pestizidmodellierung und –monitoring (zu finden in Abschnitt C) und WP5200 zur Verwundbarkeitsforschung (zu finden in Abschnitt D), das Doktorandenprogramm WP7000 (zu finden in Abschnitt E), sowie den Bericht des Unterauftragnehmers TU Wien zum Teilarbeitsbereich WP 6250 Fernerkundung zur Ermittlung von Bodenfeuchteparametern (zu finden in Abschnitt F).
Abschlussbericht für den Projektträger Jülich, Projekt WISDOM II, 10/2010 – 02/2014
A. Projekt Management – DLR
Kurze Darstellung 1
1.1 Aufgabenstellung des Arbeitspaketes 1000
Ziel des Projektmanagements war die Administrative Koordination, Vernetzung und Harmonisierung der deutschen Projektarbeiten, der intensive Kontakt zu den vietnamesischen Partnern, sowie die Vernetzung in internationalem Kontext und Projekt-PR zur Sicherstellung des Projekterfolges. Das Arbeitspaket 1000 hatte wie in Phase 1 des Projektes zum einen das Ziel das Gesamtprojekt WISDOM administrativ, technisch und organisatorisch zu leiten, sowie die Kommunikation zwischen den Projektpartnern zu moderieren (Task 1100). In diesen Aufgabenbereich gehören außerdem die Planung und Abstimmung zu halbjährigen, ausführlichen Projektberichten an den Projektträger, die Organisation von Workshops und Jahrestreffen der Partner, die Moderation des wissenschaftlichen Austauschs zwischen den Partnern, die Forcierung der gemeinsamen Publikationstätigkeit, die regelmäßige Aktualisierung der Projektwebseite (www.wisdom.eoc.dlr.de), sowie die Außendarstellung des Projektes (Forschungsbereich und Öffentlichkeit).
SK 1210 – TECHNISCHE BEWERTUNG DER PROJEKTPERFORMANZ
Der zweite Aufgabenbereich (Task 1200) umfasste die Kommunikation und Harmonisierung der Kontakte zur vietnamesischen Projektkoordination sowie Partnerinstitutionen. Wie auf deutscher Seite wird das bilaterale Verbundprojekt WISDOM auf vietnamesischer Seite von einer Projektkoordination geleitet, die am Southern Institute für Water Resources Research ansässig (SIWRR) ist. Harmonische Zusammenarbeit sollte über den regen Austausch beider Koordinatoren über den Projektverlauf und Informationen der jeweiligen administrativen Stellen (u.a. Sichtbarkeit des Projektes, wissenschaftlicher Austausch bei z.B. gemeinsamen Feldkampagnen) gestaltet werden. Der Aufbau eines internationalen Kommunikationsnetzwerkes zur Projektvorstellung und -verankerung im Land Vietnam, sowie zur Kontaktierung potentieller Donor-Institutionen stellt den dritten Aufgabenbereich dar (Task 1300). Die Fortführung der Identifikation weiterer im Mekong Delta aktiv agierender, internationaler Institutionen, sowie potentieller Nutzer der Ergebnisse des WISDOM Projektes (Informationssystem zur Unterstützung der Planung regionaler Administrationen zur Anpassung an Klimawandel und Verbesserung des Wassermanagements) wurde angestrebt. Des Weiteren wurde die Ausweitung des Netzwerkes auf die Mekong Anrainerstaaten angestrebt, um die Möglichkeiten einer Projekterweiterung auf ein größeres Gebiet und neue Projektfelder entsprechend des Bedarfes in der Region zu eruieren.
1.2 Voraussetzungen
Die Voraussetzungen unter denen das Verbundprojekt durchgeführt wurde, sind zum einen in der umfassenden Expertise des DLR-DFD in der Koordination der WISDOM Phase I, als auch mit den technisch infrastrukturellen Möglichkeiten der Großforschungseinrichtung DLR, das WISDOM Projekt umzusetzen, begründet. In den Verantwortungsbereich des DLR-DFD fielen zum einen die Verbundprojektkoordination, sowie die technische Entwicklung des WISDOM Informationssystems. In enger Zusammenarbeit mit der Universität Würzburg wurden automatisierte Auswertemethoden für die Bereitstellung von Informationen aus Satellitendaten u. a. zur Ableitung von Überflutungsflächen und Landbedeckung entwickelt.
Abschlussbericht für den Projektträger Jülich, Projekt WISDOM II, 10/2010 – 02/2014
2
Institutionelle Voraussetzungen für die Durchführung eines bilateralen Verbundprojektes mit Vietnam sind in der langjährigen Kooperation beider Regierungen, u.a. auf dem Gebiet der Forschung, zu finden. Des Weiteren bedient das Vorhaben in Phase I und II auf der deutschen Seite zahlreiche Förderschwerpunkte des BMBF – Hightech Strategie des BMBF, Förderschwerpunkt Integriertes Wasserressourcenmanagement (IWRM), FONA, Programm Internationale Zusammenarbeit mit anderen Ländern–Asien/Pazifik (siehe Abschnitt 3.1 zum Beitrag zu förderpolitischen Zielen). Auf der vietnamesischen Seite ist die Durchführung des Vorhabens an den nationalen Zielplanungen Vietnams orientiert und angebunden – National Target Plan (NTP) Wasser und NTP Klimawandel.
1.3 Planung und Ablauf des Vorhabens
Planung und Ablauf der Aktivitäten im Arbeitspaket 1000 orientierten sich an den definierten Projektzielen, der Meilensteinplanung und der Anpassung an den realen Projektverlauf, dem Bedarf nach Workshops und Treffen, Feldaufenthalten etc. Die Gegenüberstellung mit der Meilensteinplanung ist in Abschnitt 2.1 zu finden. Im Folgenden sind die wesentlichen Meilensteine und Aktivitäten im Arbeitspaket 1000 tabellarisch dargestellt. Tabelle 1: Wesentliche Ergebnisse und Meilensteine im Arbeitspaket 1000 Zeitraum Aktivität in WP1000 2010 Oktober 2010 Teilnahme am Greater Mekong Subregion Workshop und Treffen mit Akteuren aus 6
Mekong-Anrainerstaaten November 2010 Kick Off Meeting in Ho Chi Minh City (HCMC), deutsches und vietnamesisches
Konsortium findet sich in leicht veränderter Konstellation zusammen (neue KMUs Hydromod, lat/lon und Aquaplaner)
November 2010 Besuch der MRC in Phnom Penh Dezember 2010 WISDOM-Projekt auf der IFAT Messe 2011 Januar 2011 Teilnahme am GIZ Workshop zu Coastal Ersoion und Climate Change – HCMC Februar 2011 Teilnahme am MRC Workshop zu Climate Change und Vulnerabilität – Luang
Prabang, Laos März 2011 Teilnahme am Mekong Delta Plan Workshop (NL) – HCMC April 2011 Mitgestaltung und Teilnahme am IWRM Workshop – Hanoi April 2011 1. WISDOM PhD Seminar – Can Tho City April 2011 Organisation des “Training of Trainers” für das Informationssystem (IS) in Hanoi April 2011 Organisation und Durchführung des Workshops zum Thema Geberkoordinierung und
Geodatenmanagement im Mekong Delta – Phu Quoc April 2011 Projektpartner und Stakeholder-Treffen – Hanoi Mai 2011 WISDOM-Projekt auf der WASSER BERLIN Messe Mai 2011 Abstimmungstreffen mit PtJ Juni 2011 WISDOM Jahrestreffen – Oberpfaffenhofen Juni 2011 Teilnahme am South-East Asia Regional Workshop on the Economics of
Ecosystems and Biodiversity (TEEB) and Green Economy: From Theory to Practice – Hanoi
Juli 2011 WISDOM auf der Singapore Water Week Oktober 2011 Abstimmungstreffen mit Projektkoordinatoren: DLR, MOST-SRO und SIWRR Oktober 2011 WISDOM auf dem EOC Symposium des DLR Oktober 2011 WISDOM auf der IWRM Konferenz – Dresden Oktober 2011 WISDOM auf dem IWRM Status Seminar des BMBF Oktober 2011 Teilnahme am USGS Workshop des University Network for Wetland Research –
HCMC November 2011 WTZ Gespräche zwischen D-VN in Bonn - Vortrag des WISDOM Projektes 2012 ca. Mai-Dezember 2012 Vorbereitungen des Mekong Environmental Symposiums (MES 2013) Februar 2012 2. WISDOM PhD Seminar – Bonn April 2012 WISDOM Vortrag auf der ISPRS Konferenz in Melbourne

Abschlussbericht für den Projektträger Jülich, Projekt WISDOM II, 10/2010 – 02/2014
3
Mai 2012 Abstimmungstreffen mit BMBF zu Organisation des MES 2013 Mai 2012 WISDOM Koordinatoren Treffen und Projektpartner Treffen Mai 2012 WISDOM Vortrag auf dem 32nd European Association of Remote Sensing
Laboratories (EARSeL) Symposium 2012 - Griechenland Mai 2012 WISDOM auf der IFAT Entsorga – München Juni 2012 WISDOM Vortrag beim AK Ostasien der Deutschen Gesellschaft für Geografie Juni/Juli 2012 Hochrangige Gespräche bei MONRE Vize Minister Dr. Lai zur Einladung zum MES
2013; Gespräche zu Implementierungsoptionen des WISDOM informationssystems bei MONRE und MOST
Juni 2012 Veröffentlichung des Springer Buches “The Mekong Delta System” Juli 2012 WISDOM Vortrag auf der IGARSS Konferenz - München September /Oktober/November 2012
Networking für die Teilnahme am MES 2013 in Laos, Kambodscha und Myanmar
November 2012 Teilnahme am IWRM Workshop zu Förderungsperspektiven November 2012 2. Vorstellung von WISDOM bei der KfW (nach 2009) 2013 Januar – März 2013 Intensive Vorbereitungen des MES 2013 5.-7.3. 2013 Durchführung des Mekong Environmental Symposiums 2013 - HCMC April 2013 Diverse WISDOM Vorträge auf der 35. ISRSE Konferenz in Beijing Mai 2013 Serverübergabe für das WISDOM IS am MONRE und MARD - Hanoi Mai 2013 Erfolgreiche Verteidigung der Doktorarbeit von Vo Quoc Tuan an der Uni Kiel Juni 2013 3. WISDOM PhD Seminar – Bonn September 2013 WISDOM Closure Meeting zum Abschluss des Projektes für die meisten Partner -
Oberpfaffenhofen Dezember 2013 Erfolgreiche Verteidigung der Doktorarbeit von Tran Thai Binh an der Uni Bonn
1.4 Stand der Wissenschaft und Technik
Projekt Management von Verbundvorhaben 1.4.1
Die Koordination und das Management internationaler Projektverbünde stellt für das Erreichen der Projektziele eine essentielle und dabei sehr umfangreiche Aufgabe dar. Neben der administrativen Komponente ist die wissenschaftliche Koordination besonders in interdisziplinären Verbundprojekten von großer Bedeutung. Hierfür ist ein fundiertes Wissen über den aktuellen Stand der Wissenschaft und Technik in den entsprechenden Arbeitsbereichen des Projektverbundes vonnöten, der in den folgenden Abschnitten B – F im Detail jeweils im Unterkapitel 1.4. erläutert wird.
1.5 Zusammenarbeit mit anderen Stellen
Die direkte Zusammenarbeit des Arbeitspaketes 1000 ist mit dem Fernerkundungslehrstuhl der Universität Würzburg durch eine direkte Anbindung gegeben. Alle fernerkundlichen Arbeiten werden in enger Zusammenarbeit mit dem Arbeitspaket 6000 durchgeführt. Eine der Hauptaufgaben des Arbeitspaktes 1000 ist die Vernetzung des Projektes. Dabei handelt es sich sowohl um die Vernetzung der Projektpartner untereinander, der Projektpartner zu interessierten Nutzern, die Vernetzung des Gesamtprojektes mit Akteuren in der Projektregion, mit externen Stellen und potentiellen Investoren und Donoren. Die Vernetzung mit den Projektpartnern erfolgte durch (i) regelmäßige Telefonate und regen Emailkontakt, (ii) durch Organisation und Teilnahme an regelmäßigen internen Projekttreffen, (iii) zahlreichen Präsentationen des Projektes bei Konferenzen, Messen etc. (iv) die Projektwebseite (www.wisdom.eoc.dlr.de) und deren regelmäßige Pflege – zum einen zur Verbreitung von Projektinformationen (Kontakte, Termine, etc.) und zum anderen zur gemeinsamen und abgestimmten Präsentation des Projektes nach außen hin. Die Zusammenarbeit mit der Projektkoordination auf vietnamesischer Seite wird als sehr gut eingeschätzt. Regelmäßige Telefonate und ausführliche Abstimmungen vor Meetings in Vietnam oder Meetings in Deutschland mit vietnamesischer Teilnahme stellen die Basis für die gute Zusammenarbeit dar.
Abschlussbericht für den Projektträger Jülich, Projekt WISDOM II, 10/2010 – 02/2014
4
Das Arbeitspaket ist aufgrund der genannten Aktivitäten hervorragend mit allen anderen Arbeitspaketen vernetzt.
Eingehende Darstellung 2
2.1 Erzielte Ergebnisse und Verwendung der Zuwendungen
Das Arbeitspaket 1000 befasste sich mit der Koordination des WISDOM Projektes auf der deutschen Seite. Zum Verantwortungsbereich gehörten die administrative Koordination (inklusive Monitoring des Projektfortschritts, Wissenstransfer zwischen den Arbeitspaketen, Kommunikation mit BMBF, Organisation von Projektmeetings etc.), die Netzwerkbildung mit dem vietnamesischen Projektkonsortium (inkl. technischer Abschätzung der dort erreichten Ziele, Wissens- und Datenaustausch, Anberaumen von regelmäßigen Treffen, Unterstützung gemeinsamer Kampagnen, Unterstützung von Personalaustausch, Kommunikation mit Nutzern und Institutionen in Vietnam), als auch internationale Netzwerkarbeit.
WP1100 Administrative Koordination 2.1.1
Im Rahmen von WP 1100 wird die Beobachtung des Projektfortschritts, der Wissenstransfer zwischen Arbeitspaketen, die Zusammenstellung von Progress-Reports, die Kommunikation mit BMBF und die Organisation von Projektmeetings geleistet. Das Monitoring des Projektfortschritts wird dabei durch folgende Aktivitäten sichergestellt:
Regelmäßige Telefonate der Projektkoordination mit den WP-Leitern, den Verantwortlichen der in WISDOM aktiven Partner.
Alle Projektpartner berichten nach Dienstreisen nach Vietnam telefonisch und schriftlich der Projektkoordination.
Austausch von Protokollen und Berichten nach Workshops, Inter-WP-Meetings. Der Wissenstransfer und die Kommunikation zwischen den Arbeitspaketen werden gewährleistet durch:
Intensive Kommunikation an alle Partner per email. über die Email-Listserver [email protected], [email protected] und [email protected].
Regelmäßige Telekonferenzen, Arbeitstreffen und Workshops (e.g. Datenmanagementworkshop etc.).
Die für das WISDOM Projekt erstellte Website www.wisdom.eoc.dlr.de, die in englischer und vietnamesischer Sprache zugänglich ist und auf der regelmäßig unter „News“ aktuelle Ereignisse veröffentlicht werden, als auch die Möglichkeit der Darstellung erster Ergebnisse besteht – zur Erweiterung des Interessentenkreises wurde die Webseite außerdem auf Chinesisch übersetzt und regelmäßig nachgeführt.
Regelmäßige Treffen im kleinen Kreis auf bilateraler und multilateraler Ebene (e.g. WISDOM WP-Leiter Meetings und Telefonkonferenzen, Annual Meetings in Oberpfaffenhofen, etc.).
Bereitstellung von Protokollen, Reports, Daten und Dokumenten auf dem für das Projekt eingerichteten FTP Server.
Sich bewusst überschneidende Feldaufenthalte in Vietnam.
2.1.1.1 Weiterführung des Einsatzes des CIM-Mitarbeiters als Integrierte Fachkraft für das WISDOM-Projekt am MOST-SRO
Ab dem Frühjahr 2008 wurde angestrebt, eine CIM Position beim MOST Southern Representative Office (MOST-SRO) in Ho-Chi-Minh-City zu installieren. Dieses Ziel konnte im Dezember 2009 umgesetzt werden und Herr Florian Moder bei Dr. Bui van Quyen am MOST-SRO eingesetzt werden. Dadurch wurde die Projektkoordination von Vietnam aus in
Abschlussbericht für den Projektträger Jülich, Projekt WISDOM II, 10/2010 – 02/2014
5
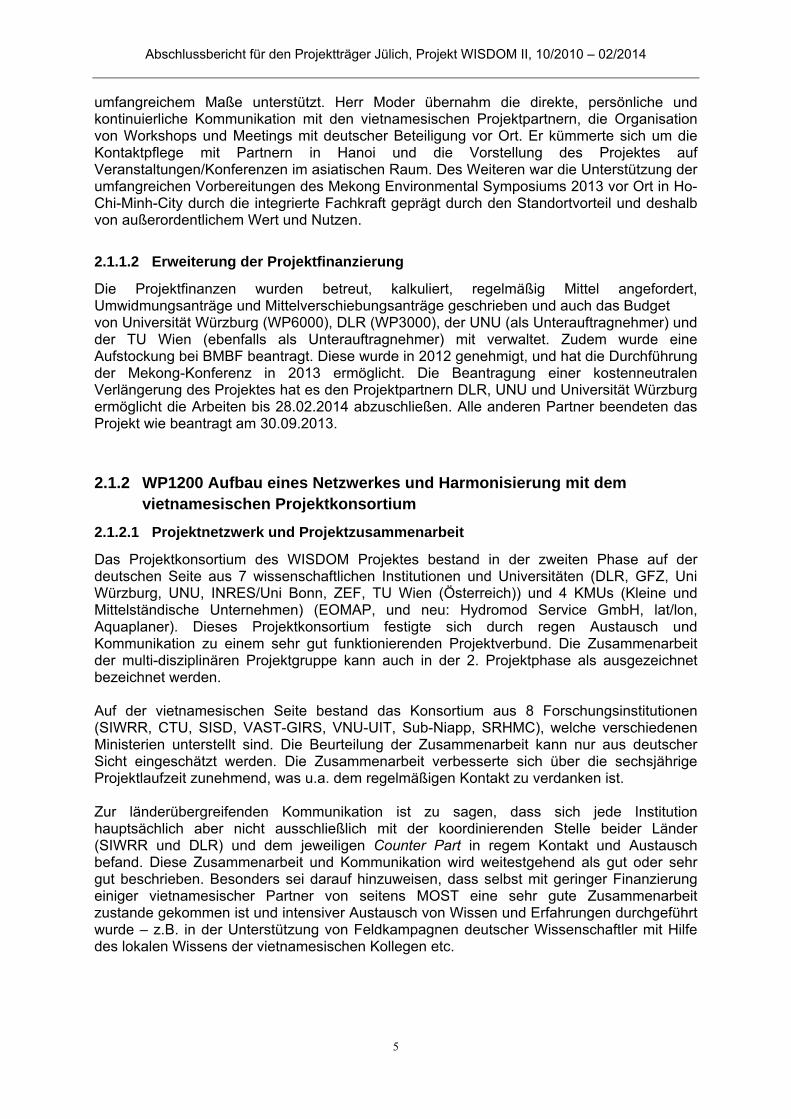
umfangreichem Maße unterstützt. Herr Moder übernahm die direkte, persönliche und kontinuierliche Kommunikation mit den vietnamesischen Projektpartnern, die Organisation von Workshops und Meetings mit deutscher Beteiligung vor Ort. Er kümmerte sich um die Kontaktpflege mit Partnern in Hanoi und die Vorstellung des Projektes auf Veranstaltungen/Konferenzen im asiatischen Raum. Des Weiteren war die Unterstützung der umfangreichen Vorbereitungen des Mekong Environmental Symposiums 2013 vor Ort in Ho-Chi-Minh-City durch die integrierte Fachkraft geprägt durch den Standortvorteil und deshalb von außerordentlichem Wert und Nutzen.
2.1.1.2 Erweiterung der Projektfinanzierung
Die Projektfinanzen wurden betreut, kalkuliert, regelmäßig Mittel angefordert, Umwidmungsanträge und Mittelverschiebungsanträge geschrieben und auch das Budget von Universität Würzburg (WP6000), DLR (WP3000), der UNU (als Unterauftragnehmer) und der TU Wien (ebenfalls als Unterauftragnehmer) mit verwaltet. Zudem wurde eine Aufstockung bei BMBF beantragt. Diese wurde in 2012 genehmigt, und hat die Durchführung der Mekong-Konferenz in 2013 ermöglicht. Die Beantragung einer kostenneutralen Verlängerung des Projektes hat es den Projektpartnern DLR, UNU und Universität Würzburg ermöglicht die Arbeiten bis 28.02.2014 abzuschließen. Alle anderen Partner beendeten das Projekt wie beantragt am 30.09.2013.
WP1200 Aufbau eines Netzwerkes und Harmonisierung mit dem 2.1.2vietnamesischen Projektkonsortium
2.1.2.1 Projektnetzwerk und Projektzusammenarbeit
Das Projektkonsortium des WISDOM Projektes bestand in der zweiten Phase auf der deutschen Seite aus 7 wissenschaftlichen Institutionen und Universitäten (DLR, GFZ, Uni Würzburg, UNU, INRES/Uni Bonn, ZEF, TU Wien (Österreich)) und 4 KMUs (Kleine und Mittelständische Unternehmen) (EOMAP, und neu: Hydromod Service GmbH, lat/lon, Aquaplaner). Dieses Projektkonsortium festigte sich durch regen Austausch und Kommunikation zu einem sehr gut funktionierenden Projektverbund. Die Zusammenarbeit der multi-disziplinären Projektgruppe kann auch in der 2. Projektphase als ausgezeichnet bezeichnet werden. Auf der vietnamesischen Seite bestand das Konsortium aus 8 Forschungsinstitutionen (SIWRR, CTU, SISD, VAST-GIRS, VNU-UIT, Sub-Niapp, SRHMC), welche verschiedenen Ministerien unterstellt sind. Die Beurteilung der Zusammenarbeit kann nur aus deutscher Sicht eingeschätzt werden. Die Zusammenarbeit verbesserte sich über die sechsjährige Projektlaufzeit zunehmend, was u.a. dem regelmäßigen Kontakt zu verdanken ist. Zur länderübergreifenden Kommunikation ist zu sagen, dass sich jede Institution hauptsächlich aber nicht ausschließlich mit der koordinierenden Stelle beider Länder (SIWRR und DLR) und dem jeweiligen Counter Part in regem Kontakt und Austausch befand. Diese Zusammenarbeit und Kommunikation wird weitestgehend als gut oder sehr gut beschrieben. Besonders sei darauf hinzuweisen, dass selbst mit geringer Finanzierung einiger vietnamesischer Partner von seitens MOST eine sehr gute Zusammenarbeit zustande gekommen ist und intensiver Austausch von Wissen und Erfahrungen durchgeführt wurde – z.B. in der Unterstützung von Feldkampagnen deutscher Wissenschaftler mit Hilfe des lokalen Wissens der vietnamesischen Kollegen etc.

Abschlussbericht für den Projektträger Jülich, Projekt WISDOM II, 10/2010 – 02/2014
6
2.1.2.2 Wissenschaftlicher Austausch
Der wissenschaftliche Austausch zwischen deutschen und vietnamesischen Projektpartnern umfasst eine Vielzahl unterschiedlicher Aktivitäten – als besonders hervorzuheben sind die folgenden:
das projekteigene Doktorandenprogramm mit 15 Doktoranden pro Projektphase (Ausführungen dazu im UNU Projektberichtsteil E) – insgesamt 30 Doktoranden im WISDOM-Programm + ca. 8 assoziierte WISDOM-Doktorarbeiten mit anderer Finanzierung (wie Weltbank o.ä.)
der Austausch von Gastwissenschaftlern von Deutschland nach Vietnam und umgekehrt
die Durchführung verschiedener Masterarbeiten, Diplomarbeiten von Studenten deutscher Universitäten mit Feldaufenthalten in Vietnam.
Im vorliegenden Bericht wird der Austausch zwischen DLR, der Uni Würzburg und vietnamesischen Institutionen beschrieben. In den Berichten der anderen Projektpartner finden sich alle weiteren Aktivitäten, die teils durch die Koordination initiiert und gefördert wurden, oder von den Partnerinstitutionen unabhängig in die Wege geleitet werden konnten. Von großer Bedeutung für den Austausch von wissenschaftlichem Personal am DLR war die Integration zweier vietnamesischer Doktoranden ins WISDOM Team des DLR. Herr Tran Thai Binh vom Partnerinstitut VAST-GIRS konnte über ein 3 Jahres-DAAD-DLR-Stipendium zum DLR kommen. Seine Arbeit über Ontologie von Daten für das WISDOM Informationssystem wurde zum 1. Juli 2009 begonnen und konnte am 31.12. 2012 beendet und am 3.12.2013 an der Universität Bonn erfolgreich verteidigt werden. Herr Vo Quoc Tuan vom Partnerinstitut Can Tho University konnte über ein Weltbankstipendium zum DLR kommen. Die Arbeit über die Evaluierung von Mangrovenökosystemen in der Ca Mau Provinz, in der sozio-ökonomische und fernerkundliche Forschungsaspekte miteinander verknüpft wurden, konnte am 1. September 2009 begonnen werden. Die erfolgreiche Verteidigung seiner Arbeit fand am 24. Mai 2013 an der Universität Kiel statt. Im November 2011 fand ein mehrwöchiger Forschungsaufenthalt von Juliane Huth am VAST-GIRS in Ho-Chi-Minh-City als Gastwissenschaftlerin vom DLR statt. In dieser Zeit konnte Frau Huth sich der Intensivierung der Zusammenarbeit der beiden Fernerkundungsteams widmen und aktuelle Arbeiten vorantreiben. Dabei half die enge Kooperation mit den Kollegen vom VAST-GIRS z.B. bezüglich der Integration von lokalem Wissen für die Planung und Durchführung einer anschließenden Feldkampagne im Mekong Delta.
2.1.2.3 Betreiberkonzept
Ein Betreiberkonzept für die nahtlose Weiterverwendung und den dauerhaften Betrieb des WISDOM Informationssystems (IS) in Vietnam, dessen Haltung und Wartung nach Projektabschluss wurde von der Projektleitung nach gemeinsamer Konzeption mit dem CIM-Experten erstellt. Detaillierte Ausführungen technischer Art sind im Berichtsteil des WP3000 zu finden.
WP1300 Aufbau eines internationalen Netzwerkes 2.1.3
Im Rahmen des gesamten WISDOM Projektes (Phase I und II) wurde intensiv nach weiteren Projekten (international und national), lokalen und internationalen Akteuren im Mekong Delta, sowie Interessenten und potentiellen Donoren recherchiert, Kontakte geknüpft und reger Austausch betrieben.
Abschlussbericht für den Projektträger Jülich, Projekt WISDOM II, 10/2010 – 02/2014
7
WISDOM wurde von der Projektkoordination sehr gut in der Region und der IWRM-Landschaft vernetzt. Beispielhaft werden im Folgenden die wichtigsten Zusammenkünfte und Kontakte genannt. Auswahl an Aktivitäten im Bereich der nationalen und internationalen Kooperation (von 2010 bis 2014):
IWRM Netzwerk – WISDOM als Teil des UFZ Schirmprojektes zu IWRM gut vernetzt, Teilnahme an allen Workshops und Konferenzen
Fortführung der Kontakte zu IWRM Projekten AKIZ, IWRM Vietnam
Aufnahme von Kontakten zu deutschen Projekten in Vietnam aus anderen BMBF Förderschwerpunkten, z.B. LUCCi, etc.
LOICZ – WISDOM Integration in das internationale Küstenzonennetzwerk, regelmäßige Beiträge im Newsletter etc.
Weiterer Ausbau der Kontakte zu GIZ Projekten im Mekong Delta (in Bac Lieu und Soc Trang), gegenseitige Einladung der integrierten Experten zu Workshops etc.
Intensivierung des Kontaktes zu GIZ Hanoi Im Zuge der Vorbereitungen des MES 2013 Aufnahme zahlreicher wissenschaftlicher
Kontakte zu Institutionen in allen 6 Mekong-Anrainerstaaten sowie Kontaktaufnahme zu internationalen Experten des USGS, Uni Wageningen, u.v.a.m.
Kontaktpflege und intensiver Austausch mit WWF Deutschland, WWF Vietnam, IUCN Vietnam
Kontaktpflege zu MRC Phnom Penh und Austausch mit IKMP Programm – sowie Kontaktaufnahme zu CEO der MRC Hans Gutman und erfolgreiche Einladung als Keynote bei MES2013
Kontakt zu und Treffen bei ADB Manila, KfW Frankfurt, IBM Singapur
2.1.3.1 Konferenz zur Übergabe des WISDOM Informationssystems und internationalem wissenschaftlichen Austausches
Um einen erfolgreichen und nachhaltigen Abschluss des WISDOM Projektes zu gewährleisten, sollte das Informationssystem an die vietnamesische Regierung übergeben werden. Laut Projektplan war in WISDOM II sowohl die Organisation einer Übergabezeremonie als auch eine Konferenz im IWRM Kontext vorgesehen (Task 1320 MS1 und Task 1340 MS2). Das Mekong Environmental Symposium 2013 konnte beides miteinander verbinden und in großem Maße ausbauen. Auf dieser Mekong Konferenz sollten sowohl das Informationssystem offiziell überreicht, als auch vor großem Publikum live präsentiert werden. Der wissenschaftliche Fokus der Konferenz richtete sich thematisch an alle sechs Mekong Anrainerstaaten und war außerdem an auch an internationale Teilnehmer adressiert. Durch einen intensiven Austausch der WISDOM-Projektleitung innerhalb des Mekong-bezogenen, internationalen, wissenschaftlichen Netzwerkes konnte ein exzellentes wissenschaftliches Komitee (Scientific Commitee) für das Symposium gewonnen werden. Fokussiert wurde auf die Beteiligung aller sechs Mekong-Anrainerstaaten und die Komplettierung durch angesehene internationale Experten. Es wurden Mekong-relevante und anerkannte Keynote Speaker und Session Chairs eingeladen, sowie deutsche KMUs und verwandte deutsche Projekte angesprochen, sich auf der Konferenz zu präsentieren. Umfangreiche Öffentlichkeitsarbeit im Rahmen der Vorbereitungen des MES 2013 umfasste den Versand von 3000 Flyern und 100 Postern an potentielle Teilnehmer und interessierte Kontakte des Symposiums. Fokus lag dabei auf den Anrainerstaaten des Mekong und
Abschlussbericht für den Projektträger Jülich, Projekt WISDOM II, 10/2010 – 02/2014
8
Deutschland. Zudem fanden vorbereitende Treffen in allen Mekong Anrainerstaaten mit relevanten Institutionen statt, um auf die Konferenz aufmerksam zu machen. Die Erstellung und ständige Aktualisierung der MES2013-Konferenzwebseite http://www.mekong-environmental-symposium-2013.org sowie das Erstellen eines regelmäßigen Newsletters, versandt an mehr als 800 potentielle Interessenten, stellt eine weitere Kernaktivität der Vorbereitungen dar. Die Webseite wurde auf verschiedenen kooperierenden Seiten promotet – wie z.B. beim LOICZ Netzwerk. Die Konferenzwebseite kann auch 1 Jahr nach der Konferenz weiterhin besucht werden, um z.B. Konferenz-Vorträge, Abstracts und Fotos herunterzuladen. Vom 5. bis 7.März 2013 fand das Mekong Environmental Symposium in Ho Chi Minh City statt. Die überwältigende Teilnehmerzahl betrug 428 Teilnehmer aus ca. 20 Ländern am ersten Tag und je 380 Teilnehmer am 2. und 3. Tag der Veranstaltung. Die Konferenz war zu 40% überbucht und es mussten gegen Ende der Anmeldungsfrist Teilnehmer zurückgewiesen werden. Das Interesse an der Konferenz und den vom Konsortium ausgewählten Themen war immens. Schlagwortartig aufgelistet wurde das Symposium in folgende Highlights aufgegliedert:
- 5. März 2013 o Eröffnung durch MinR Wilfried Kraus, BMBF und die WISDOM Projektleitung o Keynotes hochrangiger Entscheidungsträger aus allen sechs Anrainerstaaten o Live-Präsentation und offizielle Übergabe des WISDOM Informationssystems
an das Umweltministerium und das Landwirtschaftsministerium Vietnams, begleitet von hochwertigen Fachvorträgen anerkannter, internationaler Mekong-Experten
o User Statement von DONRE Can Tho o Social Event zur intensiven Vernetzung bei bi-oder multilateralen Gesprächen
- 6. und 7. März 2013
o 120 Fachvorträge in 3 parallelen Sessions und 60 Poster-Präsentationen. Die Kaffeepausen wurden von unterschiedlichen Sponsoren finanziert.
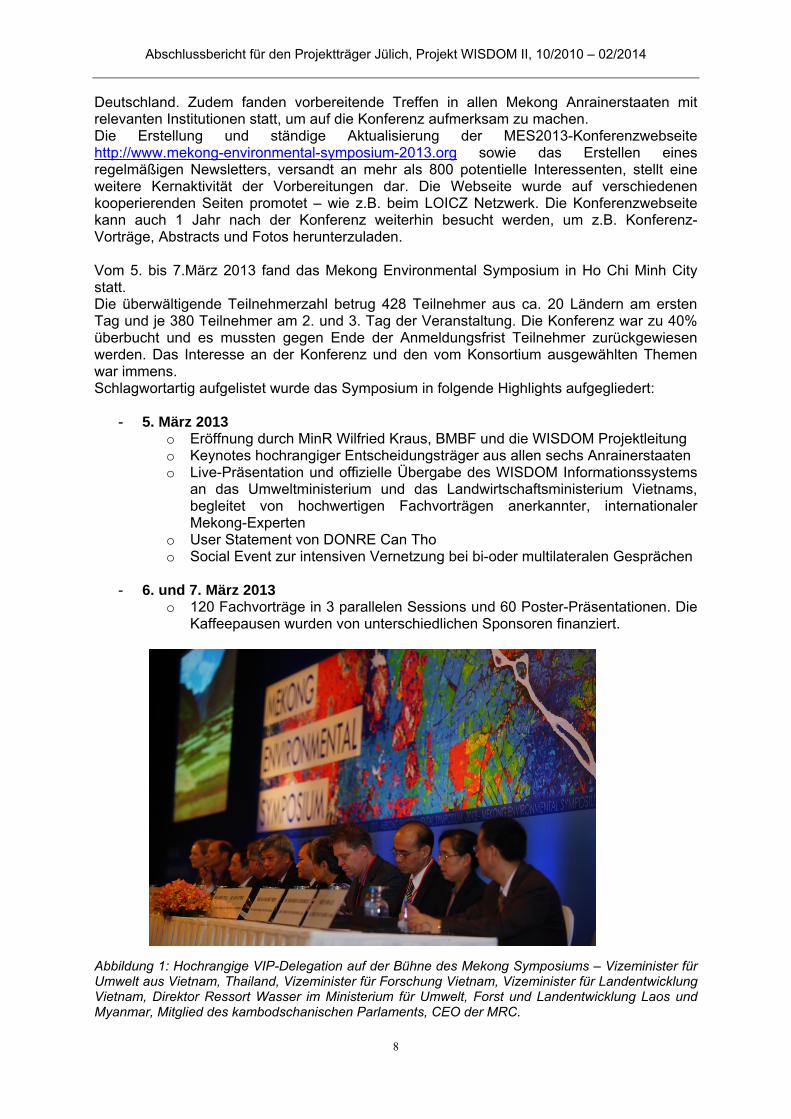
Abbildung 1: Hochrangige VIP-Delegation auf der Bühne des Mekong Symposiums – Vizeminister für Umwelt aus Vietnam, Thailand, Vizeminister für Forschung Vietnam, Vizeminister für Landentwicklung Vietnam, Direktor Ressort Wasser im Ministerium für Umwelt, Forst und Landentwicklung Laos und Myanmar, Mitglied des kambodschanischen Parlaments, CEO der MRC.
Abschlussbericht für den Projektträger Jülich, Projekt WISDOM II, 10/2010 – 02/2014
9
Neben dem durchführenden Projektträger des BMBF Projektträger Jülich (PtJ) war außerdem eine Delegation des BMBF, des PTKA und des Internationalen Büros IB des BMBF eingeladen und empfangen worden. Weiterhin zeichnete sich das Symposium dadurch aus, dass neben zahlreichen hochrangigen Teilnehmern aus verschiedenen wasserbezogenen Institutionen der 6 Mekong-Anrainerstaaten, auch eine große Zahl internationaler Teilnehmer anwesend war – zahlreiche Professoren aus Deutschland und weiteren europäischen Ländern (z.B. Niederlande), NGOs wie IUCN, 5 deutsche nicht WISDOM-KMUs, die GIZ, etc.
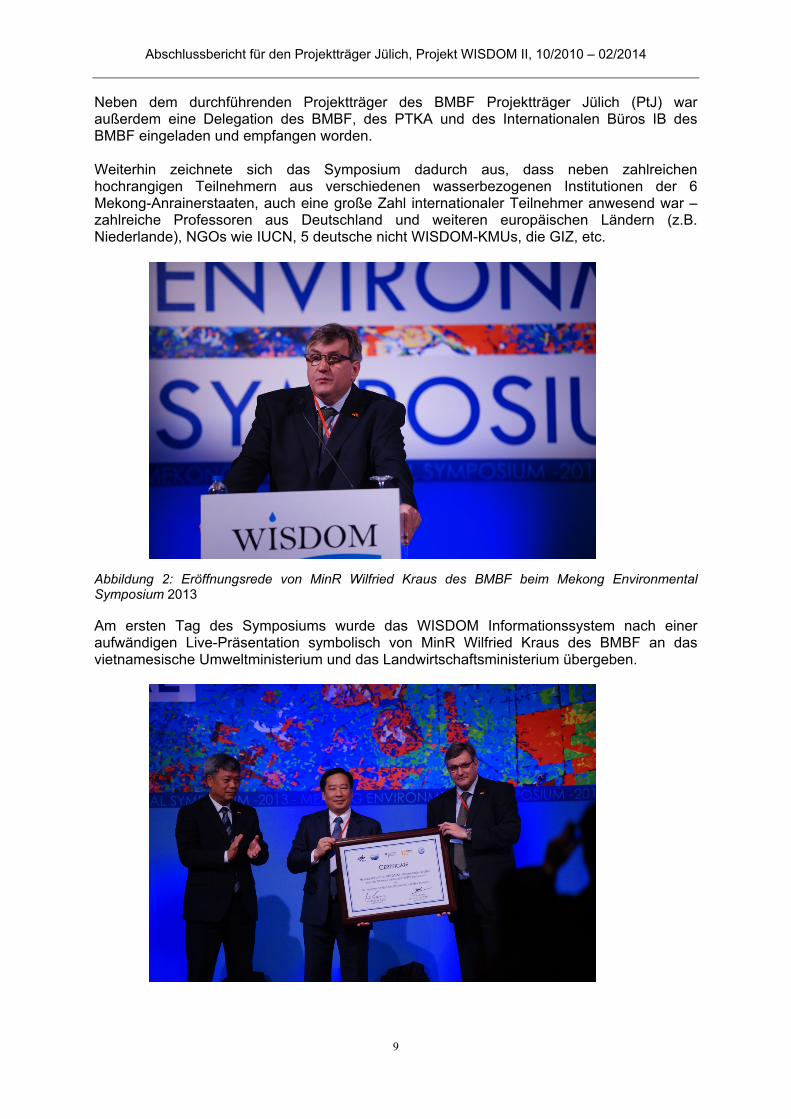
Abbildung 2: Eröffnungsrede von MinR Wilfried Kraus des BMBF beim Mekong Environmental Symposium 2013 Am ersten Tag des Symposiums wurde das WISDOM Informationssystem nach einer aufwändigen Live-Präsentation symbolisch von MinR Wilfried Kraus des BMBF an das vietnamesische Umweltministerium und das Landwirtschaftsministerium übergeben.

Abschlussbericht für den Projektträger Jülich, Projekt WISDOM II, 10/2010 – 02/2014
10
Abbildung 3: Offizielle Übergabe des WISDOM Informationssystems an das Umweltministerium und das Landwirtschaftsministerium Vietnams – v.l. Hoang Van Thang, Nguyen Thai Lai, MinR Wilfried Kraus Außerdem wurde in Gesprächen zwischen dem BMBF und den beiden Ministerien vor Ort erörtert, wie eine nachhaltige Nutzung umgesetzt werden soll. Die Server-Übergabe der Hardware fand im Mai 2013 in Hanoi statt (siehe Berichtsteil B).
Abschlussbericht für den Projektträger Jülich, Projekt WISDOM II, 10/2010 – 02/2014
11
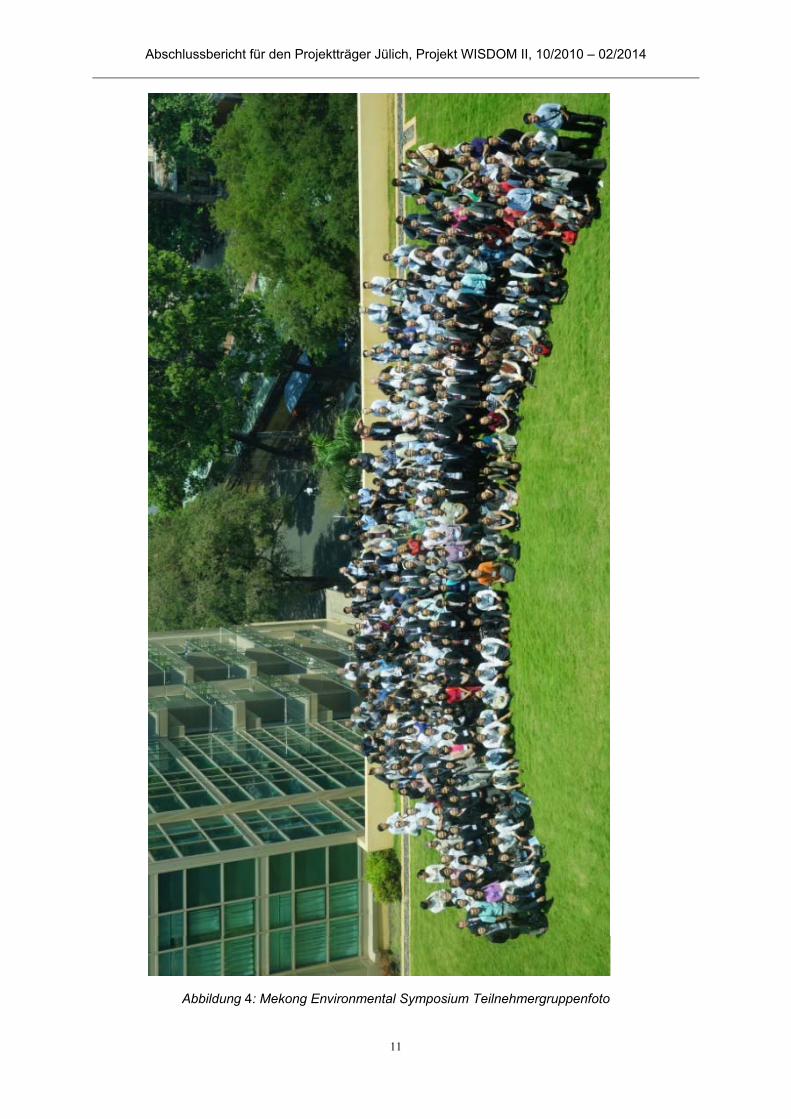
Abbildung 4: Mekong Environmental Symposium Teilnehmergruppenfoto

Abschlussbericht für den Projektträger Jülich, Projekt WISDOM II, 10/2010 – 02/2014
12
Gegenüberstellung der Ergebnisse mit vorgegebenen Zielen 2.1.4
Alle Zielsetzungen konnten gemäß dem ausgegebenen Zeitplan eingehalten werden. Folgende Auflistung zeigt die definierten Meilensteine der Aktivitäten der Projektkoordination im Arbeitspaket 1000 und beschreibt deren Status bei Projektende. WP1100 Task 1110
MS1-5: Compilation of project progress reports for the reporting periods January to July and July to December, for all three years. Request of Information Generation of all partners as Input for the WISDOM Website
Task 1120 MS1: Scientific/Technical Inter WP Work package Meetings to integrate results and
expand synergy (WP2000-5000; 4000-6000, 3000 with 20000,5000,6000 and all)
MS2: Scientific/Technical Inter WP Work package Meetings to integrate results and expand synergy (WP2000-5000; 4000-6000, 3000 with 20000,5000,6000 and all)
MS3: Scientific/Technical Inter WP Work package Meetings to integrate results and expand synergy (WP2000-5000; 4000-6000, 3000 with 20000,5000,6000 and all)
Task 1130 MS1-6: Midterm reporting to BMBF and half-yearly meetings with IB-IWRM/PTJ
and (if requested) BMBF ‘Referate’
Task 1140 MS1: Organization of whole consortium Kick Off meeting in Vietnam
MS2: Organization of WP leader meeting in Germany
MS3: Organization of annual German partner consortium meeting in Germany
MS4: Organization of WP leader meeting in Germany
MS5: Organization of annual German partner consortium meeting in Germany MS6: Organization of WP leader meeting in Germany
Alle Meilensteine sind erreicht worden – und können im Einzelnen in der tabellarischen Darstellung (siehe Tabelle 1 in Abschnitt 1.3) nachvollzogen werden.
WP1200 Task 1210
MS1-3: Review of Project Performance by Consortium supported through external experts and advisory group
Task 1220 MS1-6: bi-annual Workshops between coordination / partially consortium and
Vietnamese side on project performance, communication, technical issues etc.
Task 1230 MS1: ongoing User Requirements Actualization for the Information System
finalized
MS2: Preparation of final implementation and ensuring long term sustainability
(‘Betreiberkonzept’) Workshop 1

Abschlussbericht für den Projektträger Jülich, Projekt WISDOM II, 10/2010 – 02/2014
13
MS3: Preparation of final implementation and ensuring long term sustainability (‘Betreiberkonzept’) Workshop 1
Die Meilensteine des WP 1200 sind alle erreicht worden, wenn auch teilweise nicht jeweils in diesen Einzelschritten. Meetings in Hanoi zu engmaschig gesetzten Terminen wurden durchgeführt und die Implementierungsbestrebungen mit dem MONRE und MARD gemeinsam vorangetrieben. Weiterhin wurden oft parallel Workshops vom DLR des WP 3000 an den vietnamesischen Ministerien durchgeführt, um die technischen Voraussetzungen der Mitarbeiter auf das Informationssystem vorzubereiten. Die das Informationssystem betreffenden Meilensteine müssen in Zusammenhang mit dem WP3000 betrachtet werden, da sie eng miteinander verbunden sind. WP1300 Task 1310
MS1-3: Update of Assessment of project landscape
Task 1320 MS1: Large Conference on IWRM and Climate Change in the Mekong Delta
organized in Vietnam
Task 1330 MS1: Publication of book of project results “Integrated Water Ressources
Management in the Mekong Delta”
Task 1340 MS1: WISDOM Kick off meeting in Vietnam, including external experts
MS2: Official „pass over“ event of the WISDOM Information System to the Vietnamese side, including all ministries
Alle Zielsetzungen des WP1300 konnten gemäß dem vorgegebenen Zeitplan eingehalten werden. Die Analyse der Projektlandschaft entwickelte sich im Laufe der Projektlaufzeit stark weiter, da es sich beim Projektgebiet Mekong Delta um eine stark von ausländischen Projekten frequentierten Region handelt. Kontaktaufbau und Analyse der Möglichkeit eventueller Zusammenarbeit wurden kontinuierlich vorangetrieben und ausgebaut. Im Jahr 2013 wurde eine Mekong Umweltkonferenz mit über 400 Besuchern aus 20 Ländern durch das DLR- und Universität Würzburg-WISDOM-Team organisiert und durchgeführt. Die Projektkoordination hat gemeinsam mit dem CIM-Experten in umfassender Weise diese Konferenz angebahnt, organisiert und durchgeführt. Ziel war es, zum einen das WISDOM Informationssystem an die vietnamesischen Ministerien MONRE und MARD offiziell zu übergeben und weitreichende, wissenschaftliche Kontakte im Mekongbecken anzubahnen und auszubauen. Weiterhin wurden zahlreiche Publikationen zu WISDOM Projektergebnissen in SCI gelisteten Zeitschriften veröffentlicht und auf wissenschaftlichen Konferenzen vorgestellt. Das Projekt wurde außerdem auf technischen Messen in Deutschland und Asien, wie der u.a. WasserBerlin, der IFAT München und der Singapore Water Week vorgestellt. Eine umfassende Aufstellung der Publikationen in Zeitschriftenreihen, Konferenzbeiträge etc. ist dem Unterkapitel 2.6 zu Erfolgten und geplanten Veröffentlichungen zu entnehmen.
Abschlussbericht für den Projektträger Jülich, Projekt WISDOM II, 10/2010 – 02/2014
14
2.2 Wichtigste Positionen des zahlenmäßigen Nachweises
Die Ausgaben für Personalkosten umfasste eine volle Stelle. Diese Stelle war in vollem Umfang ausgefüllt von Koordinations- und Vernetzungsaufgaben und der umfassenden Organisation des Verbundprojektes. Zu Ausgaben für Dienstreisen zählen im wesentlichen Reisen nach Vietnam, um die vietnamesischen Projektpartner, Ministerien, Stakeholder etc. vor Ort für direkte Abstimmungen zu treffen, sowie Workshops zu organisieren und durchzuführen. Weiterhin handelt es sich bei den Ausgaben für Reisen um Treffen innerhalb Deutschlands mit WISDOM-Projektpartnern, dem BMBF, und weiteren zahlreichen projektrelevanten Kontakten, wie dem IWRM Vernetzungsprojekt des BMBF am UFZ etc.
2.3 Notwendigkeit und Angemessenheit der geleisteten Arbeit
Die im Arbeitspaket 1000 geleisteten Arbeiten waren essentiell für den Fortgang und den Erfolg des Projektes und machten eine Zuwendung durch öffentliche Mittel unbedingt notwendig.
2.4 Nutzen und Verwertbarkeit der Ergebnisse
Der voraussichtliche Nutzen und die Verwertbarkeit der einzelnen Projektforschungsergebnisse der Projektpartner soll hier nicht ausführlich dargestellt werden, da man diese Informationen in den einzelnen Abschnitten der Endberichte der Partner der mehr technisch- und forschungsorientierten Arbeitspakete 2000-7000 finden kann. Im vorliegenden Bericht kann der Nutzen im Sinne des Verwertungsplans aus Arbeitspaket 3000 im Kapitel B-2.3, sowie die entsprechende Darstellung der UNU-EHS zu WP 4000 und 5000 in Kapitel C-2.4 und D-2.4 nachgelesen werden. Im Arbeitspaket 1000 erarbeitete und ausgebaute Kontaktnetzwerke bilden eine exzellente Basis für die Entwicklung neuer Ideen und die Planungen weiterer Projekte, die sich thematisch und räumlich mit den Mekong-Anrainerstaaten befassen könnten. Eine Projektskizze für ein Projekt zur Analyse der Auswirkung von Entwicklungen am Oberlauf auf den Unterlauf des Flusses durch u.a. geplante und durchgeführte Wasserkraftprojekte entlang des Mekong wurde im August 2013 unter CLIENT beim BMBF eingereicht. Die hervorragende Zusammenarbeit des deutschen Projektverbundes stellt ein Fundament für intensive fachliche Zusammenarbeit in zukünftigen Projekten dar. Der ausgebaute und weitestgehend sehr gute Kontakt und die enge Kooperation der deutschen Projektpartner mit ihren jeweiligen Counter Parts bildet die Voraussetzung für die weitere Zusammenarbeit in geplanten oder bereits neuangebahnten, kleineren Projekten des BMBF (DeltAdapt) im Mekong Delta Kontext und anderer Geldgeber wie z.B. die Beteiligung der Universität Würzburg am DELTAS Projekt, das durch die amerikanische National Science Foundation gefördert (Belmont Forum) und von der Universität Minnesota geleitet wird und sich mit der der nachhaltigen Entwicklung internationaler Fluss-Deltas beschäftigt. Weitere Folge-Projektaktivitäten sind in Berichtsteilen der Partner (z.B. ZEF und UNU) nachzulesen.
2.5 Während der Durchführung bekannt gewordener Fortschritt bei anderen Stellen
Von dritter Seite sind im Berichtszeitraum keine relevanten Ergebnisse bekannt geworden. Die Zahl der im Mekong Delta auftretenden und agierenden, internationalen Projekte ist sehr groß, es ist aber während der Projektlaufzeit kein Projekt bekannt geworden, dass ebenfalls

Abschlussbericht für den Projektträger Jülich, Projekt WISDOM II, 10/2010 – 02/2014
15
zum Ziel hat, ein Informationssystem für das Mekong Delta aufzubauen, um Klimawandelanpassung und Wassermanagement in vietnamesischen Ministerien oder Regionalbehörden zu unterstützen.
2.6 Erfolgte und geplante Veröffentlichungen
Im Folgenden werden Veröffentlichungen aus dem WP1000 zum Thema WISDOM aus der zweiten Projektphase generell aufgeführt, sowie diverse Präsentation und Beiträge der Projektkoordination auf Konferenzen und Messen genannt:
Broschüren und Berichte 2.6.1
WISDOM-Beitrag “The German-Vietnamese WISDOM Project: Water-related Information System for the Sustainable Development of the Mekong Delta” in der Broschüre des LOICZ-Netzwerkes (Land-Ocean Interactions in the Coastal Zone). ISSN 2070-2442. 2012 Issue 1, 5-7 pp.
Konferenzflyer (3000) und Konferenzposter (50) zur Bekanntmachung und Ankündigung der Mekong Konferenz. September 2012.
WISDOM-Beiträge in zwei IWRM Broschüren (Statusbroschüre 2011 und Implementierungsbroschüre 2013) – in Deutsch und Englisch.
WISDOM Beitrag in der BMBF-Hanoi-Wasserbüro-Broschüre 2013 Literaturflyer Publications „Geoinformation“ related to the WISDOM project.
February 2013, Updates Oktober 2013 / Januar 2014.
Veröffentlichte Konferenzbeiträge 2.6.2
Kuenzer, C., Huth, J., Gebhardt, S., Leineinkugel; P., Lam Dao, N., and S. Dech, 2011: Environmental and Climate Change related Trends in River Deltas – Examples from the Mekong. Proceedings of the 34th International Symposium for remote Sensing of the Environment, 10-15 April, Sydney, Australia.
Kuenzer, C, Huth, J., and S. Dech (2012): Inundation Monitoring of the Mekong Delta – Rainy Season Assessments based on TerraSAR-X and Envisat ASAR Data. In: Proceedings of the 32nd EARSeL Symposium and 36th General Assembly, Mykonos, Greece, 21-24 May, 2012.
Kuenzer, C., Ottinger, M., Klein, I. and Dech, S., 2012: Dynamics of the Yellow River Delta. In: Proceedings of the XXII Congress of the International Society for Photogrammetry and Remote Sensing. XXII Congress of the International Society for Photogrammetry and Remote Sensing, 25. Aug. - 01. Sep. 2012, Melbourne, Australia. (including substantial part of general topic CoASTAL Zone Dynamics with example of the Mekong Delta mentioned as well).
Vo Quoc, T., Kuenzer, C., Vo Quang, M. and Oppelt, N., 2012: Mangrove Ecosystem Services in the Mekong Delta: Combining Socio‐Economic Household Surveying with Remote Sensing based Analyses. In: Proceedings of the 32nd International Geographical Congress, 26‐30 August, Cologne, Germany.
MES2013, 05-07 March, 2013, in Ho Chi Minh City, Vietnam: Claudia Kuenzer (German Aerospace Center, DLR): WISDOM Project results,
showing the achievements of the last 6 years, and the pathway ahead. Claudia Kuenzer (German Aerospace Center), Florian Moder (CIM): Live
demonstration of the WISDOM Information System. Patrick Leinenkugel (German Aerospace Center, DLR): A Phenological Land Cover
Map for the Mekong Basin on the Basis of Multitemporal and Multispectral Satellite Data from the MODIS Sensor.
Abschlussbericht für den Projektträger Jülich, Projekt WISDOM II, 10/2010 – 02/2014
16
Quoc Tuan Vo (Can Tho University, Vietnam): Mangrove Ecosystem Services in the Mekong Delta: Combining Socio-Economic Household Surveying with Remote Sensing Based Analyses.
35. ISRSE 2013, 21-25 April, 2013, in Beijing, China: Claudia Kuenzer (German Aerospace Center, DLR): Global Retrieval of Snow
Cover Parameters from Medium Resolution Optical Time Series. Claudia Kuenzer (German Aerospace Center, DLR) - Flooding in the Mekong
Delta: Scale Issues in Multi Resolution Radar Time Series. Tuan Vo Quoc (Can Tho University, Vietnam); N. Oppelt - Quantifying Mangrove
Ecosystem Services Based on Remote Sensing and Household Surveys. Juliane Huth (German Aerospace Center, DLR); T. Funkenberg; C. Kuenzer -
Advances towards Automated Derivation of Land Cover Classifications Utilizing TWOPAC.
Verena Klinger (German Aerospace Center, Germany); M. Ahrens; M. Fabritius; T. Andresen; C. – Intuitive, OGC-Conformant Search for Spatial and Non-Spatial Data in a Web-Based Information System.
Patrick Leinenkugel (German Aerospace Center, DLR); C. Kuenzer; N. Oppelt; S. Dech – A Phenological Land Cover Map for the Mekong Basin on the Basis of Multitemporal and Multispectral Satellite Data from the MODIS Sensor.
Manuel Fabritius (Julius Maximilians University Wuerzburg, Germany); V. Klinger; M. Ahrens; T.: Funkenberg; C. Kuenzer – The WISDOM Information System - Its Architecture and Potential for a Spatial Data Infrastructure.
Journal-Beiträge 2.6.3
Kuenzer, C., Bluemel, A., Gebhardt, S., Vo Quoc, T., and S. Dech, 2011: Remote Sensing of Mangrove Ecosystems: A Review. Remote Sens. 2011, 3, 878-928; doi:10.3390/rs3050878.
Kuenzer, C., Campbell, I., Roch, M., Leinenkugel, P., Vo Quoc, T. and Dech, S., 2012: Understanding the Impacts of Hydropower Developments in the context of Upstream‐ Downstream Relations in the Mekong River Basin. Sustainability Science, 8 (4), 565-584, doi:10.1007/s11625-012-0195-z.
Vo Quoc, T., Kuenzer, C., Vo Quang, M., Moder, F. & Oppelt, N., 2012: Review of Valuation Methods for Mangrove Ecosystem Services. Journal of Ecological Indicators, 23, 431-446, doi:10.1016/j.ecolind.2012.04.022.
Kuenzer, C. and Knauer, K., 2013: Remote Sensing of Rice Crop Areas. International Journal of Remote Sensing, 34 (6), 2101‐2139, doi: 10.1080/01431161.2012.738946.
Leinenkugel, P., Kuenzer, C. and Dech, S., 2013: Comparison and enhancement of MODIS cloud mask products for South East Asia. In print at: International Journal of Remote Sensing, doi: 10.1080/01431161.2012.750037.
Leinenkugel, P., Kuenzer, C., Oppelt, N., Dech, S., 2013: Characterisation of land surface phenology and land cover based on moderate resolution satellite data in cloud prone areas — A novel product for the Mekong Basin. Remote Sensing of Environment, 136: 180-198. doi:10.1016/j.rse.2013.05.004.
Kuenzer, C., Guo, H.D., Leinenkugel, P., Huth, J., Li, X.W. and Dech, S., 2013: Flood and inundation dynamics in the Mekong Delta: an ENVISAT ASAR based time series analyses. Remote Sensing, 5(2), 687-715; doi:10.3390/rs5020687.
Kuenzer, C. & Vo Quoc, T., 2013: Assessing the Ecosystem Service Value of Can Gio Mangrove Biosphere Reserve: Combining Earth Observation and Household Survey based Analyses, Applied Geography, 45, 53-68, doi:10.1016/j.apgeog.2013.08.012.
Abschlussbericht für den Projektträger Jülich, Projekt WISDOM II, 10/2010 – 02/2014
17
Vo Quoc, T., Oppelt, N., Leinenkugel, P. & Kuenzer, C., 2013: Remote Sensing in Mapping Mangrove Ecosystems - An Object-based Approach. Remote Sensing, 5 (1), 183-201, doi:10.3390/rs5010183.
Kuenzer, C., Guo, H.D., Schlegel, I., Vo Quoc, T., Li, X. & Dech, S., 2013: Scale and the Capability of Envisat ASAR-WSM and Terra-SAR-X Scansar and Stripmap Data to assess urban Flood Situations: A Case Study in Can Tho Province of the Mekong Delta, Accepted at: Remote Sensing.
Wichtige Konferenzbeiträge der Projektkoordination (ohne Proceedings) 2.6.4
Moder, F., Kuenzer, C., and V.K. Tri, 2011: Water Related Information System for
the Sustainable Development of the Mekong Delta in Vietnam, Proceedings of the Singapore Water Convention, 04-08 July, 2011, Singapore.
Kuenzer, C., Liu, G., Renaud, F., Ottinger, M. and S. Dech, 2011: Asian River Deltas experiencing slow onset hazards: Vulnerability, Resilience and Adaptation to Environmental- and Degradation and Climate Change. Proceedings of the International Risk and Disaster Reduction Conference, IRDR, 31. Oct-02. Nov, 2011, Beijing, China.
Kuenzer, C. (2012): Der Mekong: Oberlauf–Unterlauf Beziehungen im Spannungsfeld von Staudammbau und integriertem Wasserressourcenmanagement. In: Proceedings of the ‚Jahrestagung des Arbeitskreises Ostasien der Deutschen Geographischen Gesellschaft‘, 13 May, 2012, Duisburg, Germany.
Abschlussbericht für den Projektträger Jülich, Projekt WISDOM II, 10/2010 – 02/2014
18
Buchbeiträge 2.6.5
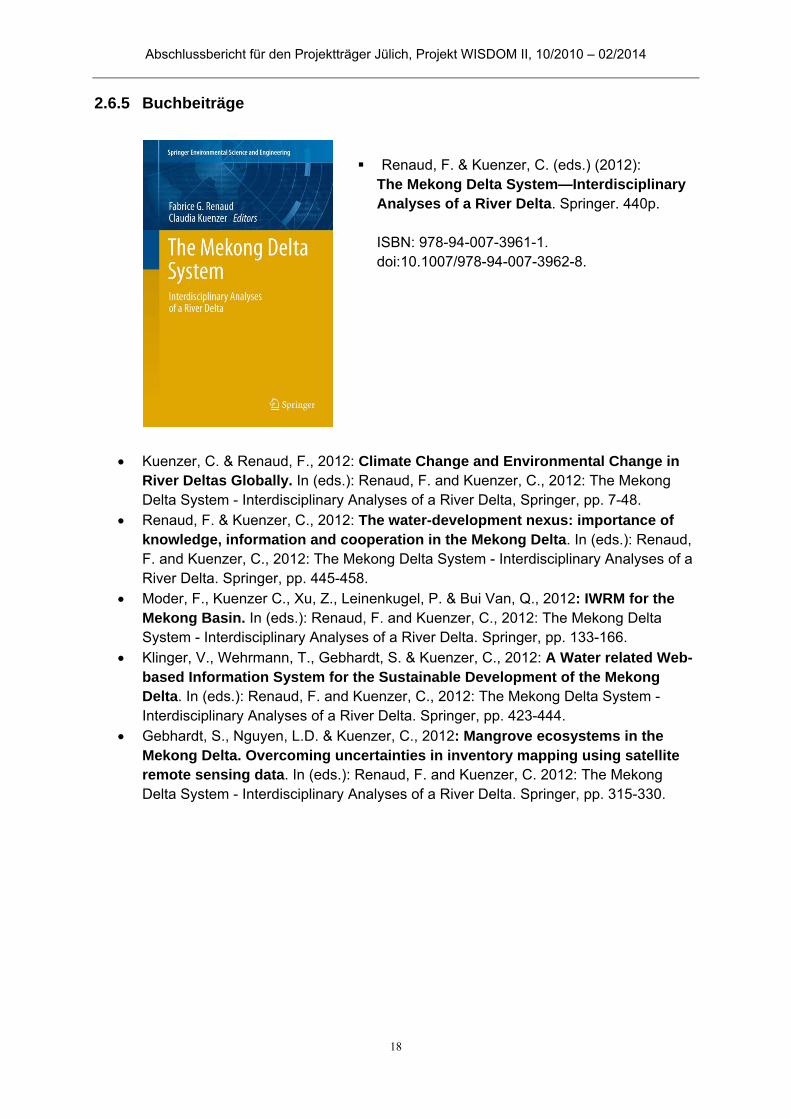
Renaud, F. & Kuenzer, C. (eds.) (2012): The Mekong Delta System—Interdisciplinary Analyses of a River Delta. Springer. 440p. ISBN: 978-94-007-3961-1. doi:10.1007/978-94-007-3962-8.
Kuenzer, C. & Renaud, F., 2012: Climate Change and Environmental Change in River Deltas Globally. In (eds.): Renaud, F. and Kuenzer, C., 2012: The Mekong Delta System - Interdisciplinary Analyses of a River Delta, Springer, pp. 7-48.
Renaud, F. & Kuenzer, C., 2012: The water-development nexus: importance of knowledge, information and cooperation in the Mekong Delta. In (eds.): Renaud, F. and Kuenzer, C., 2012: The Mekong Delta System - Interdisciplinary Analyses of a River Delta. Springer, pp. 445-458.
Moder, F., Kuenzer C., Xu, Z., Leinenkugel, P. & Bui Van, Q., 2012: IWRM for the Mekong Basin. In (eds.): Renaud, F. and Kuenzer, C., 2012: The Mekong Delta System - Interdisciplinary Analyses of a River Delta. Springer, pp. 133-166.
Klinger, V., Wehrmann, T., Gebhardt, S. & Kuenzer, C., 2012: A Water related Web-based Information System for the Sustainable Development of the Mekong Delta. In (eds.): Renaud, F. and Kuenzer, C., 2012: The Mekong Delta System - Interdisciplinary Analyses of a River Delta. Springer, pp. 423-444.
Gebhardt, S., Nguyen, L.D. & Kuenzer, C., 2012: Mangrove ecosystems in the Mekong Delta. Overcoming uncertainties in inventory mapping using satellite remote sensing data. In (eds.): Renaud, F. and Kuenzer, C. 2012: The Mekong Delta System - Interdisciplinary Analyses of a River Delta. Springer, pp. 315-330.
Abschlussbericht für den Projektträger Jülich, Projekt WISDOM II, 10/2010 – 02/2014
19
B. Information System Design – DLR
Kurze Darstellung 1
1.1 Aufgabenstellung
Ziel des Arbeitspakets 3000 in der WISDOM Phase II war die Weiterentwicklung des Informationssystems. Die prototypische Umsetzung aus der ersten WISDOM Phase stellt hierfür die Grundlage für weitere Entwicklungen. Dazu gehörten die Konsolidierung der einzelnen Komponenten sowie eine gezielte Anpassung der Benutzerschnittstelle. Durchgeführte Analysen zur Nutzbarkeit und Bedienerfreundlichkeit am System lieferten die nötigen Informationen, das Design zu optimieren. Des Weiteren wurde die technische Kooperation mit vietnamesischen Partnern weiter ausgebaut. Ein gezielter Wissenstransfer und Training der Projektpartner an der VNU-ITP sowie an den Ministerien MONRE und MARD dienten so auch als Vorbereitung für die Systemübergabe zum Projektende. Außedem wurde eine ausführliche Dokumentation aller Prozesse und Algorithmen als auch informationssystem-spezifische Verwaltungsaufgaben angefertigt, sowohl auf Englisch als auch Vietnamesisch. Ein kontinuierlicher Betrieb und hohe Verfügbarkeit zur Projektlaufzeit und darüber hinaus wurde gewährleistet.
1.2 Voraussetzungen, unter denen das Vorhaben durchgeführt wurde
In WISDOM II wurde direkt an die erste WISDOM Phase angeknüpft. Der dort entwickelte Prototyp bot Funktionen wie Datensuche auf Geodaten, Statistiken, in-situ Sensormessungen, Litarturen, Organisation und veröffentlichte Gesetzestexte,als auch unterschiedliche Möglichkeiten zur Visualisierung. Jedoch fehlte die nötige Robustheit, um das System großflächig einsetzen zu können, was somit ein Schwerpunkt der weiterführenden Entwicklungen in WISDOM II war. Wichtige Erfahrungen wurden auch im Bereich Metadaten gesammelt. So wurde in WISDOM I eine Kombination von zwei Lösungen (exist / Geonetwork) eingesetzt. Dies führte zu einer redundanten Datenhaltung, die die Aktualisierung der Metadaten erschwerte. Aus diesem Grund wurde die zugrunde liegende Architektur komplett überarbeitet um alle Redundanzen zu eliminieren und so auch die Administration zu vereinfachen. Im Zuge dieser Arbeiten wurden alle Metadaten ins Vietnamesische übersetzt. Um das WISDOM System besser administrieren zu können, wurde eine Komponente zur Administration von Benutzern und Organisationen eingebaut. Somit braucht man nun kein Spezialwissen, Nutzer und Organisation anzulegen oder zu ändern. Im Prototyp war es bisher nur für Entwickler möglich, Benutzer anzulegen. Das Data Entry Portal (DEP) des Prototyp aus WISDOM I konnte nur von Kommandozeile aus gestartet werden. Außerdem mussten bei jeder Datenintegration die Metadaten aufs Neue eingegeben werden. Deswegen wurde in der graphischen Nutzerschnittstelle (GUI) eine Komponente integriert, die das Hochladen von Geodaten erleichtert. Die Verwendung von standardisierten Schnittstellen zum Austausch von Daten hatte sich bisher bewährt und wurde weiter ausgebaut. Eingesetzte Standards zum Austausch von Geodaten sind vom Open Geospation Consortium (OGC) definiert. Diese ermöglichen einen Austausch von Geodaten mit anderen Stellen, welche ebenfalls die OGC Standards einsetzen. So entstand auch die Idee mit der zwischenstaatlichen Mekong River Commission (MRC) enger zu kooperieren, indem die Metadatenkataloge in einem gemeinsamen Portal
Abschlussbericht für den Projektträger Jülich, Projekt WISDOM II, 10/2010 – 02/2014
20
zusammengeführt werden sollten. Allerdings konnten diese Bemühungen nach einem Personalwechsel bei der MRC nicht mehr weiter verfolgt werden. Neben Verbesserungen und Erweiterungen am Prototyp galt es weiterhin die Open Source Strategie Vietnams zu unterstützen und somit konsequent auf Open Source Software zu setzen.
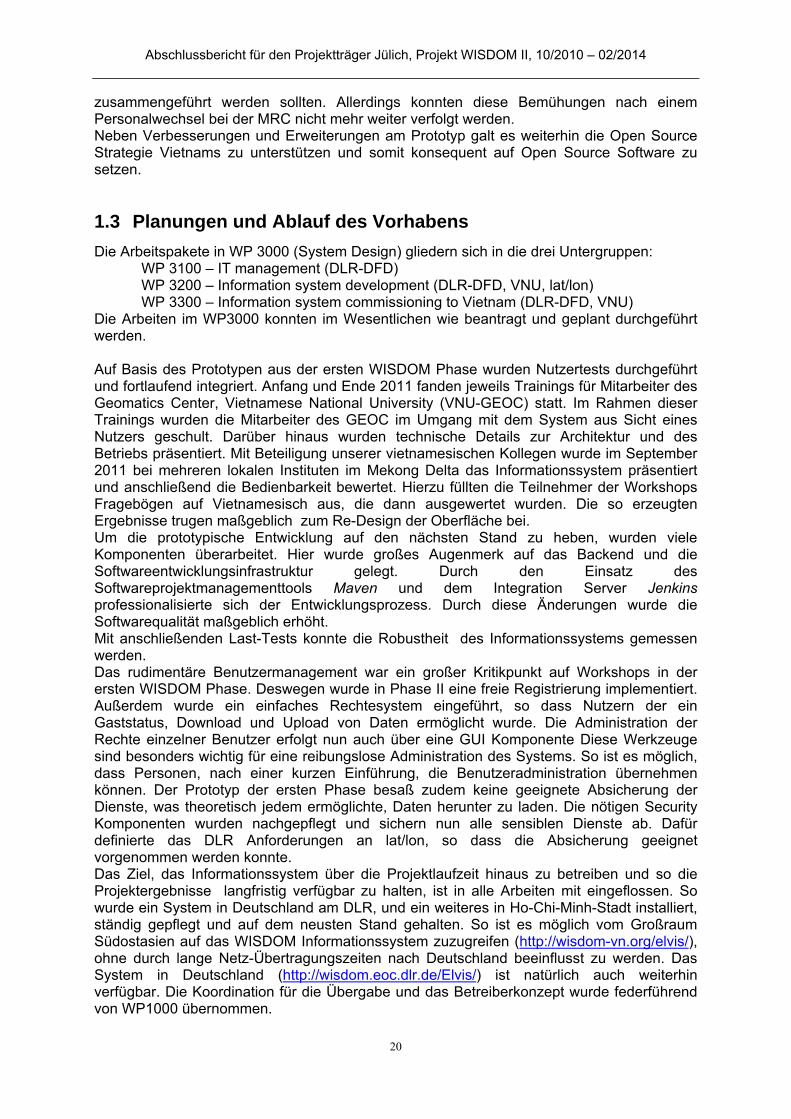
1.3 Planungen und Ablauf des Vorhabens
Die Arbeitspakete in WP 3000 (System Design) gliedern sich in die drei Untergruppen: WP 3100 – IT management (DLR-DFD) WP 3200 – Information system development (DLR-DFD, VNU, lat/lon) WP 3300 – Information system commissioning to Vietnam (DLR-DFD, VNU)
Die Arbeiten im WP3000 konnten im Wesentlichen wie beantragt und geplant durchgeführt werden. Auf Basis des Prototypen aus der ersten WISDOM Phase wurden Nutzertests durchgeführt und fortlaufend integriert. Anfang und Ende 2011 fanden jeweils Trainings für Mitarbeiter des Geomatics Center, Vietnamese National University (VNU-GEOC) statt. Im Rahmen dieser Trainings wurden die Mitarbeiter des GEOC im Umgang mit dem System aus Sicht eines Nutzers geschult. Darüber hinaus wurden technische Details zur Architektur und des Betriebs präsentiert. Mit Beteiligung unserer vietnamesischen Kollegen wurde im September 2011 bei mehreren lokalen Instituten im Mekong Delta das Informationssystem präsentiert und anschließend die Bedienbarkeit bewertet. Hierzu füllten die Teilnehmer der Workshops Fragebögen auf Vietnamesisch aus, die dann ausgewertet wurden. Die so erzeugten Ergebnisse trugen maßgeblich zum Re-Design der Oberfläche bei. Um die prototypische Entwicklung auf den nächsten Stand zu heben, wurden viele Komponenten überarbeitet. Hier wurde großes Augenmerk auf das Backend und die Softwareentwicklungsinfrastruktur gelegt. Durch den Einsatz des Softwareprojektmanagementtools Maven und dem Integration Server Jenkins professionalisierte sich der Entwicklungsprozess. Durch diese Änderungen wurde die Softwarequalität maßgeblich erhöht. Mit anschließenden Last-Tests konnte die Robustheit des Informationssystems gemessen werden. Das rudimentäre Benutzermanagement war ein großer Kritikpunkt auf Workshops in der ersten WISDOM Phase. Deswegen wurde in Phase II eine freie Registrierung implementiert. Außerdem wurde ein einfaches Rechtesystem eingeführt, so dass Nutzern der ein Gaststatus, Download und Upload von Daten ermöglicht wurde. Die Administration der Rechte einzelner Benutzer erfolgt nun auch über eine GUI Komponente Diese Werkzeuge sind besonders wichtig für eine reibungslose Administration des Systems. So ist es möglich, dass Personen, nach einer kurzen Einführung, die Benutzeradministration übernehmen können. Der Prototyp der ersten Phase besaß zudem keine geeignete Absicherung der Dienste, was theoretisch jedem ermöglichte, Daten herunter zu laden. Die nötigen Security Komponenten wurden nachgepflegt und sichern nun alle sensiblen Dienste ab. Dafür definierte das DLR Anforderungen an lat/lon, so dass die Absicherung geeignet vorgenommen werden konnte. Das Ziel, das Informationssystem über die Projektlaufzeit hinaus zu betreiben und so die Projektergebnisse langfristig verfügbar zu halten, ist in alle Arbeiten mit eingeflossen. So wurde ein System in Deutschland am DLR, und ein weiteres in Ho-Chi-Minh-Stadt installiert, ständig gepflegt und auf dem neusten Stand gehalten. So ist es möglich vom Großraum Südostasien auf das WISDOM Informationssystem zuzugreifen (http://wisdom-vn.org/elvis/), ohne durch lange Netz-Übertragungszeiten nach Deutschland beeinflusst zu werden. Das System in Deutschland (http://wisdom.eoc.dlr.de/Elvis/) ist natürlich auch weiterhin verfügbar. Die Koordination für die Übergabe und das Betreiberkonzept wurde federführend von WP1000 übernommen.
Abschlussbericht für den Projektträger Jülich, Projekt WISDOM II, 10/2010 – 02/2014
21
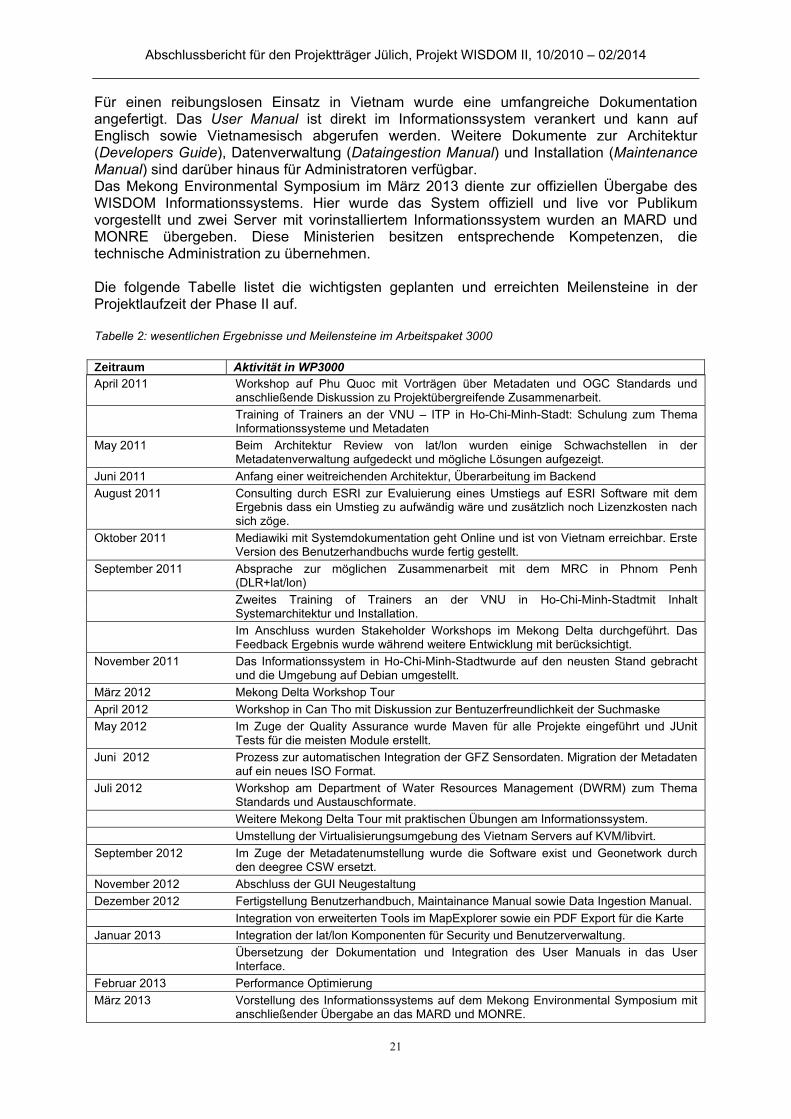
Für einen reibungslosen Einsatz in Vietnam wurde eine umfangreiche Dokumentation angefertigt. Das User Manual ist direkt im Informationssystem verankert und kann auf Englisch sowie Vietnamesisch abgerufen werden. Weitere Dokumente zur Architektur (Developers Guide), Datenverwaltung (Dataingestion Manual) und Installation (Maintenance Manual) sind darüber hinaus für Administratoren verfügbar. Das Mekong Environmental Symposium im März 2013 diente zur offiziellen Übergabe des WISDOM Informationssystems. Hier wurde das System offiziell und live vor Publikum vorgestellt und zwei Server mit vorinstalliertem Informationssystem wurden an MARD und MONRE übergeben. Diese Ministerien besitzen entsprechende Kompetenzen, die technische Administration zu übernehmen. Die folgende Tabelle listet die wichtigsten geplanten und erreichten Meilensteine in der Projektlaufzeit der Phase II auf. Tabelle 2: wesentlichen Ergebnisse und Meilensteine im Arbeitspaket 3000 Zeitraum Aktivität in WP3000 April 2011 Workshop auf Phu Quoc mit Vorträgen über Metadaten und OGC Standards und
anschließende Diskussion zu Projektübergreifende Zusammenarbeit.
Training of Trainers an der VNU – ITP in Ho-Chi-Minh-Stadt: Schulung zum Thema Informationssysteme und Metadaten
May 2011 Beim Architektur Review von lat/lon wurden einige Schwachstellen in der Metadatenverwaltung aufgedeckt und mögliche Lösungen aufgezeigt.
Juni 2011 Anfang einer weitreichenden Architektur, Überarbeitung im Backend
August 2011 Consulting durch ESRI zur Evaluierung eines Umstiegs auf ESRI Software mit dem Ergebnis dass ein Umstieg zu aufwändig wäre und zusätzlich noch Lizenzkosten nach sich zöge.
Oktober 2011 Mediawiki mit Systemdokumentation geht Online und ist von Vietnam erreichbar. Erste Version des Benutzerhandbuchs wurde fertig gestellt.
September 2011 Absprache zur möglichen Zusammenarbeit mit dem MRC in Phnom Penh (DLR+lat/lon)
Zweites Training of Trainers an der VNU in Ho-Chi-Minh-Stadtmit Inhalt Systemarchitektur und Installation.
Im Anschluss wurden Stakeholder Workshops im Mekong Delta durchgeführt. Das Feedback Ergebnis wurde während weitere Entwicklung mit berücksichtigt.
November 2011 Das Informationssystem in Ho-Chi-Minh-Stadtwurde auf den neusten Stand gebracht und die Umgebung auf Debian umgestellt.
März 2012 Mekong Delta Workshop Tour
April 2012 Workshop in Can Tho mit Diskussion zur Bentuzerfreundlichkeit der Suchmaske
May 2012 Im Zuge der Quality Assurance wurde Maven für alle Projekte eingeführt und JUnit Tests für die meisten Module erstellt.
Juni 2012 Prozess zur automatischen Integration der GFZ Sensordaten. Migration der Metadaten auf ein neues ISO Format.
Juli 2012 Workshop am Department of Water Resources Management (DWRM) zum Thema Standards und Austauschformate.
Weitere Mekong Delta Tour mit praktischen Übungen am Informationssystem.
Umstellung der Virtualisierungsumgebung des Vietnam Servers auf KVM/libvirt.
September 2012 Im Zuge der Metadatenumstellung wurde die Software exist und Geonetwork durch den deegree CSW ersetzt.
November 2012 Abschluss der GUI Neugestaltung
Dezember 2012 Fertigstellung Benutzerhandbuch, Maintainance Manual sowie Data Ingestion Manual.
Integration von erweiterten Tools im MapExplorer sowie ein PDF Export für die Karte
Januar 2013 Integration der lat/lon Komponenten für Security und Benutzerverwaltung.
Übersetzung der Dokumentation und Integration des User Manuals in das User Interface.
Februar 2013 Performance Optimierung
März 2013 Vorstellung des Informationssystems auf dem Mekong Environmental Symposium mit anschließender Übergabe an das MARD und MONRE.
Abschlussbericht für den Projektträger Jülich, Projekt WISDOM II, 10/2010 – 02/2014
22
April 2013 Kleinere Überarbeitung der Benutzerführung im System
May 2013 Stakeholder Trainings bei MONRE
Juni 2013 Integration der lat/lon Komponenten für das Data Entry Portal.
Dezember 2013 Nach der Fehlerbeseitigung und Stabilisierung des Systems wurde eine neue Version in Deutschland und Vietnam verteilt.
1.4 Wissenschaftlich-technischer Stand
Die zweite WISDOM Phase führte die technischen Arbeiten aus der ersten Phase weiter und griff auch den technischen Stand wieder auf. So wurden die existierenden Standards vom Open Geospation Consortium (OGC) weiter verwendet. Diese Schnittstellendefinitionen werden von internationalen Unternehmen gefördert und sind daher auch weit verbreitet. Des Weiteren wurden standardisierte Metadatenformate, festgelegt von der International Standardisation Organisation (ISO), konsequent eingesetzt. Die Katalogsysteme, welche in der ersten Phase eingesetzt wurden, mussten überarbeitet und neu konzeptioniert werden, da hier unnötige Redundanzen geschaffen wurden. So werden die Open Source Lösungen Geonetwork und exist nicht weiter verwendet – dafür aber deegree CSW mit Unterstützung von lat/lon eingesetzt. So wurde die redundante Datenhaltung beseitigt und ein umfangreicherer ISO (19139) Standard konnte genutzt werden. Im Bereich Software Engineering wurde das Software Project Management Tool Maven eingesetzt, um Projektabhängigkeiten besser verwalten zu können. Außerdem führte die Konfiguration des Continuous Integration Jenkins zu einer Professionalisierung des Deployments des Systems. Dies wurde gerade im Zuge der Zusammenarbeit mit lat/lon notwendig, um zu gewährleisten, dass die einzelnen Softwaremodule während der Integration miteinander harmonisierten.
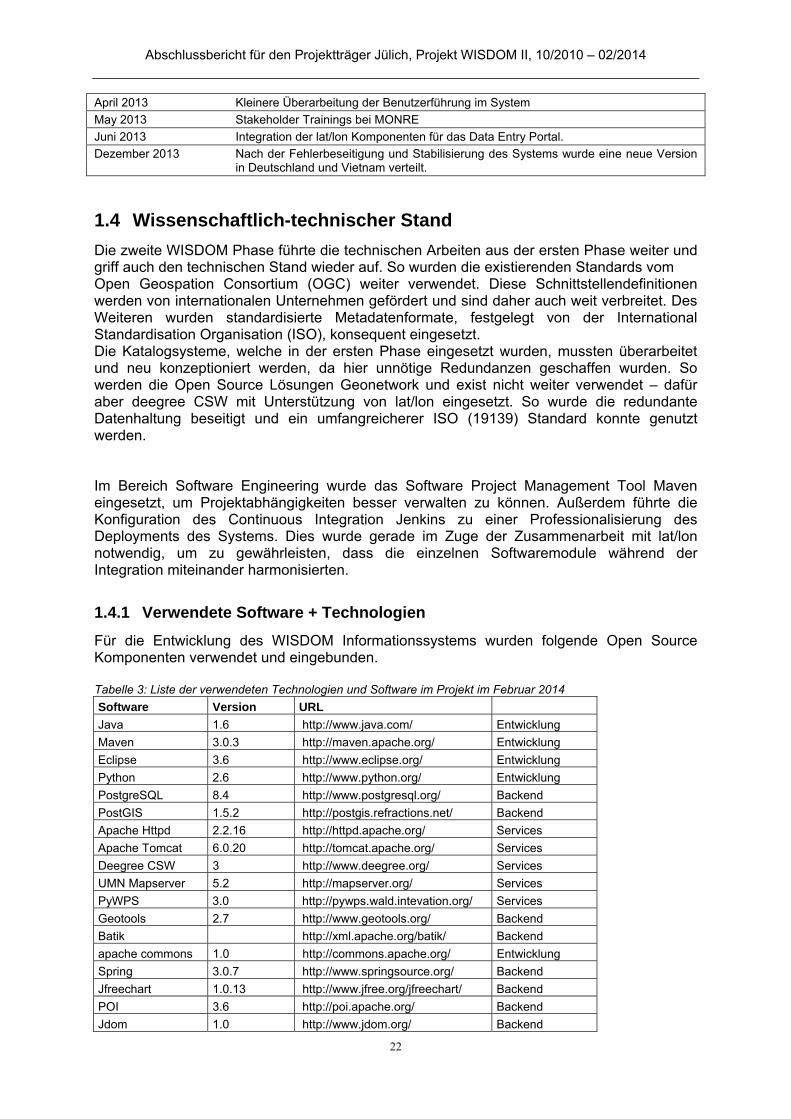
Verwendete Software + Technologien 1.4.1
Für die Entwicklung des WISDOM Informationssystems wurden folgende Open Source Komponenten verwendet und eingebunden. Tabelle 3: Liste der verwendeten Technologien und Software im Projekt im Februar 2014
Software Version URL
Java 1.6 http://www.java.com/ Entwicklung
Maven 3.0.3 http://maven.apache.org/ Entwicklung
Eclipse 3.6 http://www.eclipse.org/ Entwicklung
Python 2.6 http://www.python.org/ Entwicklung
PostgreSQL 8.4 http://www.postgresql.org/ Backend
PostGIS 1.5.2 http://postgis.refractions.net/ Backend
Apache Httpd 2.2.16 http://httpd.apache.org/ Services
Apache Tomcat 6.0.20 http://tomcat.apache.org/ Services
Deegree CSW 3 http://www.deegree.org/ Services
UMN Mapserver 5.2 http://mapserver.org/ Services
PyWPS 3.0 http://pywps.wald.intevation.org/ Services
Geotools 2.7 http://www.geotools.org/ Backend
Batik http://xml.apache.org/batik/ Backend
apache commons 1.0 http://commons.apache.org/ Entwicklung
Spring 3.0.7 http://www.springsource.org/ Backend
Jfreechart 1.0.13 http://www.jfree.org/jfreechart/ Backend
POI 3.6 http://poi.apache.org/ Backend
Jdom 1.0 http://www.jdom.org/ Backend

Abschlussbericht für den Projektträger Jülich, Projekt WISDOM II, 10/2010 – 02/2014
23
Jasperreport 3.1.2 http://jasperforge.org/jasperreports Backend
Gwt 2.5.1 http://code.google.com/webtoolkit/ Frontend
OpenLayers http://openlayers.org/ Frontend
Smartgwt 3.0 http://code.google.com/p/smartgwt/ Frontend
Jenkins 1.540 http://jenkins-ci.org/ Entwicklung
Subversion 1.6.12 http://subversion.tigris.org/ Entwicklung
Sonatype Nexus 1.9.1.1 http://www.sonatype.org/nexus/ Entwicklung
Trac 0.11.7 http://trac.edgewall.org/ Entwicklung
Verwendete Fachliteratur / Informations- und Dokumentationsdienste 1.4.2
Im Laufe des Projektes wurde eine Vielzahl von Quellen verwendet. Im Folgenden wird eine Auswahl an Webressourcen aufgelistet. Tabelle 4: Verwendete Quellen während der Entwicklung Dokumentation Webressourcen OGC http://www.opengeospatial.org/ ISO http://www.iso.org/iso/iso_catalogue.htm Java http://java.sun.com/reference/api/ Web services http://www.w3.org/2002/ws XML http://www.w3.org/XML Web architecture http://www.w3.org/standards/webarch/ O Reilly Verlag http://www.safaribooksonline.com/ Spring http://spring.io/docs SmartGWT http://www.smartclient.com/smartgwt/showcase/ Alameh, N. 2003. Chaining geographic information Web services. IEEE Internet Computation. 7(5). pp 22-29.
Allamaraju, S. 2010. RESTful Web Service Cookbook. O’Reilly Media. Andersen, T. and Amdor, L. Leveraging Maven 2 for Agility Agile Conference, 2009. AGILE '09., 2009, 383-386. http://dx.doi.org/10.1109/AGILE.2009.20 Antoniou G., Harmelen F., 2008, A Semantic Web Primer, 2nd Edition, the MIT Press. Bernard, L., Kanellopoulos, I., Annoni, A., Smits, P. 2005. The European geoportal-one step towards the establishment of a European Spatial Data Infrastructure, Computer, Environment and Urban Systems. 29(1). pp 15-31.
Berners-Lee, 1998, Semantic Web Road Map.http://www.w3.org/DesignIssues/Semantic.html
Beaumont, P., Longley, P.A., Maguire, D.J. 2005. Geographic information portals – a UK perspective. Computers, Environment and Urban Systems. 29. pp 49-69.
Booth, D., Hass, H., McCabe, F., Newcomer, E., Champion, M., Ferris, C., Orchard, D. 2004. Web services architecture. W3C working group note. http://www.w3.org/TR/ws-arch/ (accessed 2.9.2010)
Egenhofer Max J. 2002, Toward the Semantic GEospatial Web, In The 10th ACM International Symposium on Advances in Geographic Information Systems (ACM-GIS)
Fielding, R.T. 2000. Architectural Styles and the Design of Network-based Software Architectures. Dissertation. University of California. Fielding, R., Gettys, J et al. 1999. RFC2616 - Hypertext Transfer Protocol -- HTTP/1.1. http://tools.ietf.org/html/rfc2616 (assessed: 2010-09-13)

Abschlussbericht für den Projektträger Jülich, Projekt WISDOM II, 10/2010 – 02/2014
24
Foerster, T., Schaeffer, B., Brauner, J., Jirka, S. 2009. Integrating Web-based Sensor Information into Geospatial Mass-market Applications through OGC Web Processing Services. International Journal on Advances in Intelligent Systems. 2(2&3). pp 278-287
Ho, C. (2012). Introducing IoC and DI in Spring. In Pro Spring 3 (pp. 53-112). Apress.
Hoe, N. S. (2006). Breaking barriers: The potential of free and open source software for sustainable human development. A Compilation of Case Studies from Across the World. UNDP. Elsevier.
INSPIRE Metadata Implementing Rules: Technical Guidelines based on EN ISO 19115 and EN ISO 19119, 2013. European Commission Joint Research Centre. http://inspire.jrc.ec.europa.eu/documents/Metadata/MD_IR_and_ISO_20131029.pdf ISO1, 2003. ISO 19115 Geographic Information - Metadata. International Organization for Standardization (ISO), Geneva
ISO2, 2003. ISO 19139 Geographic information Metadata XML schema implementation. International Organization for Standardization (ISO), Geneva
Keens, S. (ed.). 2007. OWS-4 WPS IPR. Discussions, findings, and use of WPS in OWS-4. OGC Publicly available standard OGC 06-182r1. Open Geospatial Consortium. Wayland, MA, USA.
Kiehle, C. 2006. Business logic for geoprocessing of distributed geodata. Computers & Geosciences. 32. pp 1746-1757.
Loechel, A. & Schmid, S., 2013. Comparison of Different Caching Techniques for High-Performance Web Map Services International Journal of Spatial Data Infrastrucutre Research, 8, 43-73 Longley, P. (Ed.), 2005. Geographic information systems and science. John Wiley & Sons Maguire D., Longley P., 2005. The emergence of geoportals and their role in spatial data infrastructures. Computers, Environment and Urban Systems 29(1):3–14 Meng, X., Xie, Y. Bian, F. 2010. Distributed geospatial analysis through web processing service: a case study of earthquake disaster assessment. Journal of Software, 5(6), pp. 671-679.
Peng, Z. R., & Tsou, M. H. (2003). Internet GIS . Hoboken, NJ: John Wiley & Sons. Richardson, L. and Ruby S. 2007. RESTful Web Services - Web services for the real world. O’Reilly Media Schut, P., 2007. OpenGIS Web Processing Services. Version 1.0.0. OGC Publicly available standard OGC 05-007r7. Open Geospatial Consortium. Wayland, MA, USA.
Veerawarana, S., Curbera, F., Leymann, F., Storey, T., Ferguason, D.F. 2005. Web services platform architecture: soap, wsdl, ws-policy, ws-addressing, ws-bpel, ws-reliable messaging and more. Prentice Hall.
Wache H., Voegele T., Stuckenschmidt H., Schuster G., Neumann H. and Huebner S.(2002), Ontology-Based Integration of Information - A survey of Existing Approaches
Weiser, A., Zipf, A. 2007. Web service orchestration of OGC web services for disaster management. Geomatics solutions for disaster management, Toronto. Canada. pp. 239-254.

Abschlussbericht für den Projektträger Jülich, Projekt WISDOM II, 10/2010 – 02/2014
25
1.5 Zusammenarbeit mit anderen Stellen
Die Projektpartner und assoziierten Partner aus WISDOM I waren auch in Phase II weiterhin beteiligt. In Abbildung 1 wird die Zusammenarbeit zwischen Partnern und Endnutzern gezeigt. Diese kann untergliedert werden in Durchführung von/Teilnahme an Workshops, Trainingsmaßnahmen, Erhebung von Nutzeranforderungen und gemeinsame Definition von Spezifikationen und Implementierungen. Ziel der Maßnahmen war die Demonstration/Präsentation des Informationssystems und der dazu notwendigen Kenntnisse seit dem Start des Projektes. Darüber hinaus wurden im April und September 2011 Mitarbeiter des Geomatics Center der Vietnamese National University geschult, das System inhaltlich und fachlich präsentieren zu können. So haben diese Kollegen während den Mekong-Delta-Provinz-Touren erheblich dazu beigetragen, die Kommunikation mit den lokalen Behörden zu verbessern. Und durch ihre Mitarbeit konnte die Präsentation des Informationssystems direkt auf Vietnamesisch durchgeführt werden. Die enge Zusammenarbeit mit WP6000 (Datenintegration) wurde weiter fortgeführt. In WISDOM II wurde die deutsche Firma lat/lon als neuer KMU-Projektpartner mit aufgenommen. Sie verfügen über langjährige Erfahrung mit Metadatenverwaltung und Geodateninfrastrukturen und entwickeln federführend das Open Source Produkt deegree. In enger Zusammenarbeit wurden strukturelle Änderungen am System geplant und durchgeführt. Dabei hat lat/lon die Implementierung einiger Softwaremodule durchgeführt, Diese wurden dann vom DLR in das Informationssystem integriert. Für weitere Informationen und Details bitte auch im separaten Schlussbericht der Firma lat/lon nachlesen.
Abbildung 1 Kommunikation mit den Projektpartnern und Endnutzern

Abschlussbericht für den Projektträger Jülich, Projekt WISDOM II, 10/2010 – 02/2014
26
Eingehende Darstellung 2
Informationssysteme werden in vielen verschiedenen wissenschaftlichen und administrativen Bereichen eingesetzt. Sie werden genutzt um Daten und Informationen zu verwalten, zu prozessieren, zu analysieren, zu verteilen und zu visualisieren. Je nach den Anforderungen können sie ein spezielles Thema abdecken (Expertensystem). Die Eingabedaten variieren von alphanumerischen Werten über unstrukturierten, eindimensionalen Daten zu mehrdimensionalen Daten. Komplexe Informationsprodukte, die sowohl räumliche als auch zeitliche Dimensionen haben, können ebenfalls Eingabedaten für ein Informationssystem sein. Im Kontext Wassermanagement werden ebenfalls Informationssysteme eingesetzt, um einen holistischen Zugang zu diesem Themenkomplex zu ermöglichen. Im Kontext des WISDOM Projektes ist das Informationssystem die Plattform, die die Endnutzer und die WISDOM Projektpartner verbindet. Sie beinhaltet alle gesammelten Ergebnisse aus den einzelnen Forschungsdisziplinen und stellt sie den Endnutzern zur Verfügung. Die finale Implementierung des Systems besteht aus verschiedenen Funktionalitäten um den Zugriff auf diese, zum Teil sehr heterogenen, Daten zu ermöglichen. Zu diesen Funktionalitäten gehören das Suchen nach Datensätzen über einen Datenkatalog, „Browsing“ der Metadaten, Datenvisualisierung über einen Kartenclient, das Anzeigen von Ground Truth aus verschiedenen Feldkampagnen, die Suche nach Organisation und Instituten im Bereich Wassermanagement mit den von ihnen veröffentlichten Gesetzestexten, die Suche nach Sekundärliteratur, das Visualisieren von statistischen Daten, u.a.. Ein vollständiges User Manual, welches alle Funktionen des Systems eingehend beschreibt, ist online verfügbar. Im nachfolgenden Abschnitt werden die Ergebnisse im WP3000 auch aus der Benutzersicht dargestellt. Zur Veranschaulichung dienen einige Screenshots aus dem finalen System welches derzeit in Deutschland und Vietnam online ist. Außerdem wird ein Einblick in die Architektur und die verschiedenen verwendeten Techniken und Schnittstellen zur Implementierung des Systems gegeben.
2.1 Darstellung der erzielten Ergebnisse
Im Folgenden wird das Informationssystem, so wie es heute online ist, beschrieben. Dazu wird die generelle Architektur aufgezeigt und weiter auf die einzelnen Bausteine des Systems eingegangen.
Übersicht über das Informationssystem 2.1.1
In diesem Abschnitt werden die Hauptfunktionalitäten aus Sicht des Nutzers aufgezeigt. Außerdem wird die Architektur des Systems kurz vorgestellt. Funktionalität aus Benutzersicht Der nächste Abschnitt zeigt die Hauptfunktionalitäten des webbasierten Informationssystems aus Benutzersicht. Webbasiert bedeutet, dass der Benutzer nur einen Standard-Internetbrowser benötigt, um das System bedienen zu können. Der Benutzer kann sich am System über ein Fenster, siehe Abbildung 2, anmelden. Hierzu kann er zwischen Englisch oder Vietnamesisch wählen. Die Anwendung ist in beiden Sprachen verfügbar.

Abschlussbericht für den Projektträger Jülich, Projekt WISDOM II, 10/2010 – 02/2014
27
Abbildung 2: WISDOM Informationssystem vor Anmeldung. Wenn noch kein Benutzerkonto für die entsprechende Person besteht, kann man sich frei registrieren (Abbildung 3). Beantragung von erweiterten Nutzerrechten ist möglich, in dem der Nutzer nach erfolgreicher Registrierung in seinem Profil eine Anfrage dazu ausfüllt und abschickt. Der Datenmanager des Systems prüft diese Anfrage und kann ihr stattgeben.
Abbildung 3: Registrierung am WISDOM System

Abschlussbericht für den Projektträger Jülich, Projekt WISDOM II, 10/2010 – 02/2014
28
Nach der Anmeldung wird der Nutzer in seinen Home-Bereich, der später beliebig ausgebaut werden kann, geleitet (Abbildung 4). Erst dann werden weitere mögliche Funktionen oben in der Leiste angezeigt.
Abbildung 4: Die Home-Seite eines WISDOM Nutzers nach der Anmeldung Im Vergleich zum Prototypen aus der ersten Projektphase, hat der Dataset Explorer die größte Änderung erfahren. Auf einem Nutzerworkshop in Can Tho, wo das System detailliert vorgestellt und diskutiert wurde, zeigte sich, dass die Datensuche noch zu kompliziert war und damit für viele Nutzer eine Hürde darstellte. Das Suchkonzept wurde komplett überarbeitet. Mit dem neuen Konzept bekommt ein Nutzer stets Ergebnisse, die er dann über verschiedene Filtermöglichkeiten (Raum, Thema, Zeit, Datentyp) immer weiter einschränken kann. Abbildung 5 zeigt den initialen Zustand, nachdem der Nutzer sich auf der Seite angemeldet hat und in den Dataset Explorer wechselte. Ohne eine Auswahl zu treffen, werden ihm bereits Daten angezeigt. Durch das Auswählen einer Region, oder eines Themas wird ein Filter gesetzt, der dann im oberen Bereich in einer Leiste angezeigt wird. Die Suche wird darüber automatisch eingeschränkt. In Abbildung 6 hat der Nutzer mehrere Filter gesetzt, so dass nur noch 10 Datensätze angezeigt werden. Die Filter können beliebig gelöscht werden, um die Treffer zu erhöhen. Im Hintergrund findet die Suche nicht mehr wie bisher auf dem WISDOM Datenmodell über eine proprietäre Schnittstelle statt, sondern über die von lat/lon bereitgestellte Schnittstelle eines Catalogue Service for the Web (CSW). Damit wird die Suche in WISDOM nach den OGC-Prinzipien standardkonform. Dies erlaubt eine einfachere Integration von weiteren Metadatenkatalogen. Natürlich bedeutete dies, die Metadaten aller im System vorhandenen Daten aufzubereiten, damit sie die Suche aus dem Dataset Explorer geeignet unterstützen. Die Filtergalerie kann über einen Knopfdruck ausgeblendet werden, so dass mehr Platz für die Ergebnisse zur Verfügung steht. Die nachfolgende Abbildung zeigt, den Dataset Explorer mit Filtermöglichkeiten und Ergebnisliste an. Rot hervorgehoben sind die Filteroptionen.
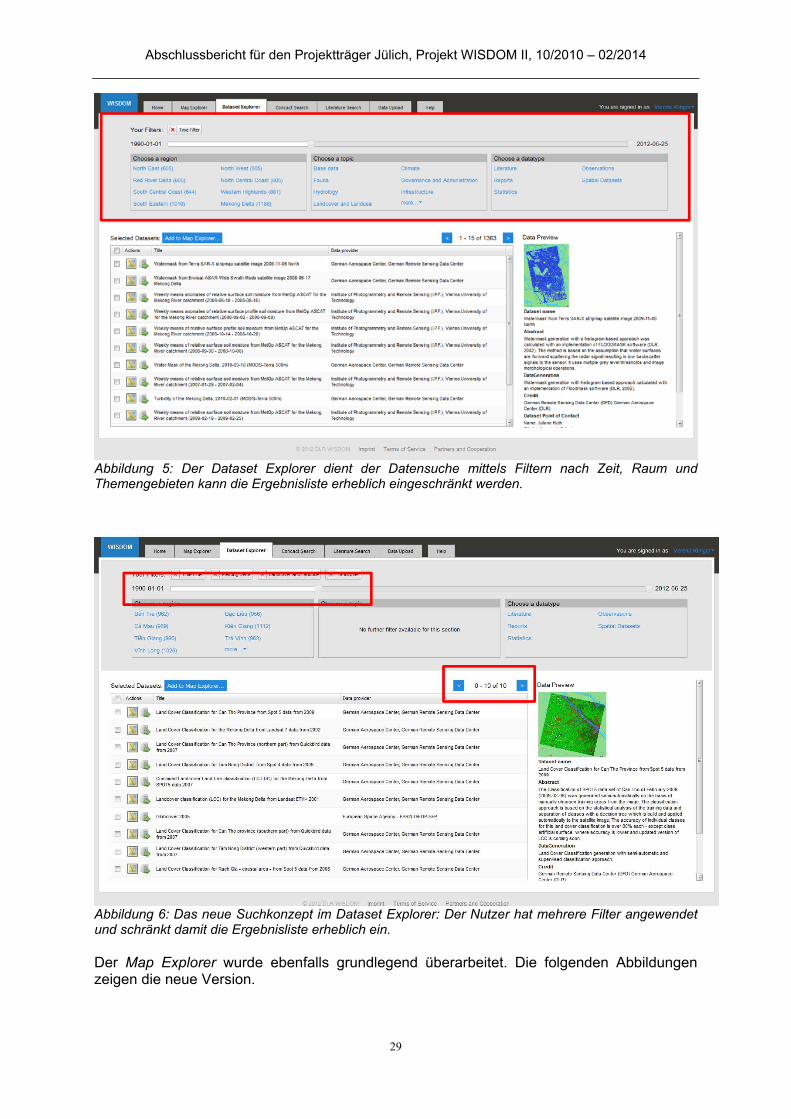
Abschlussbericht für den Projektträger Jülich, Projekt WISDOM II, 10/2010 – 02/2014
29
Abbildung 5: Der Dataset Explorer dient der Datensuche mittels Filtern nach Zeit, Raum und Themengebieten kann die Ergebnisliste erheblich eingeschränkt werden.
Abbildung 6: Das neue Suchkonzept im Dataset Explorer: Der Nutzer hat mehrere Filter angewendet und schränkt damit die Ergebnisliste erheblich ein. Der Map Explorer wurde ebenfalls grundlegend überarbeitet. Die folgenden Abbildungen zeigen die neue Version.

Abschlussbericht für den Projektträger Jülich, Projekt WISDOM II, 10/2010 – 02/2014
30
Abbildung 7: Neues Design des Map Explorers. Die Übersichtskarte wird standardmäßig oben links angezeigt und kann jedoch ausgeblendet werden um dem neu gestaltetem „Layer Manager“ mehr Platz zu geben. Layer können nun vom User in Ordnern verwaltet werden. Layer können sichtbar/unsichtbar geschalten und verschoben werden. Außerdem können so mehrere Layer auf einmal gelöscht werden.
Abbildung 8: Verwaltung von Layern Unabhängig vom Dataset Explorer können über „Questions & Answer“ (Abbildung 9) fertige Karten, die aus mehreren Layern bestehen, geladen werden. Diese Karten beantworten
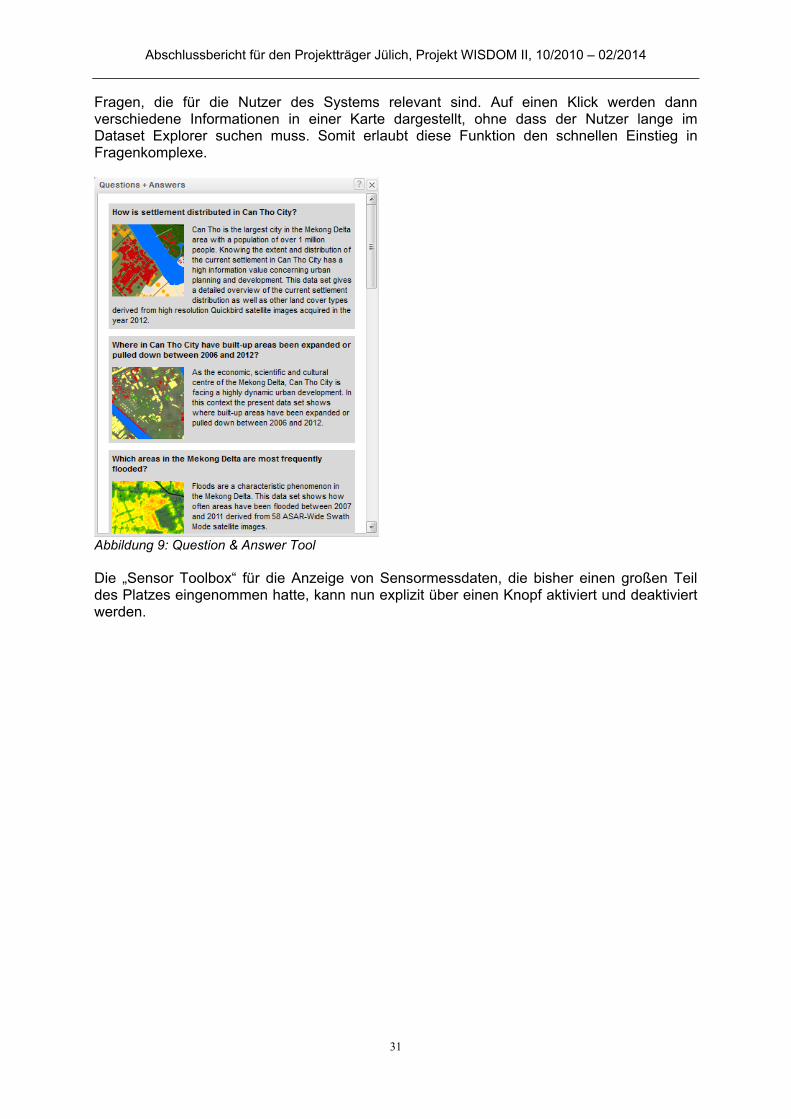
Abschlussbericht für den Projektträger Jülich, Projekt WISDOM II, 10/2010 – 02/2014
31
Fragen, die für die Nutzer des Systems relevant sind. Auf einen Klick werden dann verschiedene Informationen in einer Karte dargestellt, ohne dass der Nutzer lange im Dataset Explorer suchen muss. Somit erlaubt diese Funktion den schnellen Einstieg in Fragenkomplexe.
Abbildung 9: Question & Answer Tool Die „Sensor Toolbox“ für die Anzeige von Sensormessdaten, die bisher einen großen Teil des Platzes eingenommen hatte, kann nun explizit über einen Knopf aktiviert und deaktiviert werden.

Abschlussbericht für den Projektträger Jülich, Projekt WISDOM II, 10/2010 – 02/2014
32
Abbildung 10: Abruf von in-sito Sensormessdaten als Diagramm Die Umgebungsbilder (Fotos der Feldarbeiten = Field Data) können mit dem Knopf “Field Data” ein-/ausgeblendet werden (Abbildung 11). Die Fotos werden in verschiedene Kategorien unterteilt – u.a. Vegetation, Non-Vegetation, Water – und sind entsprechend farblich auf der Karte gekennzeichnet.
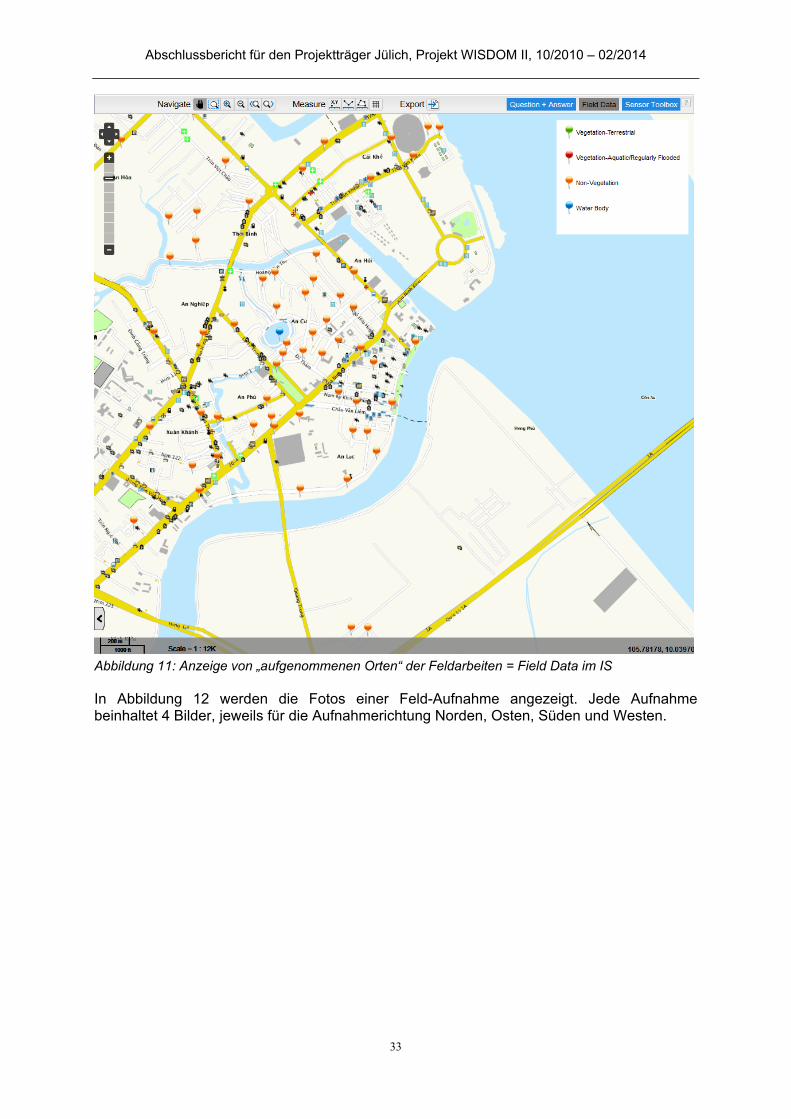
Abschlussbericht für den Projektträger Jülich, Projekt WISDOM II, 10/2010 – 02/2014
33
Abbildung 11: Anzeige von „aufgenommenen Orten“ der Feldarbeiten = Field Data im IS In Abbildung 12 werden die Fotos einer Feld-Aufnahme angezeigt. Jede Aufnahme beinhaltet 4 Bilder, jeweils für die Aufnahmerichtung Norden, Osten, Süden und Westen.
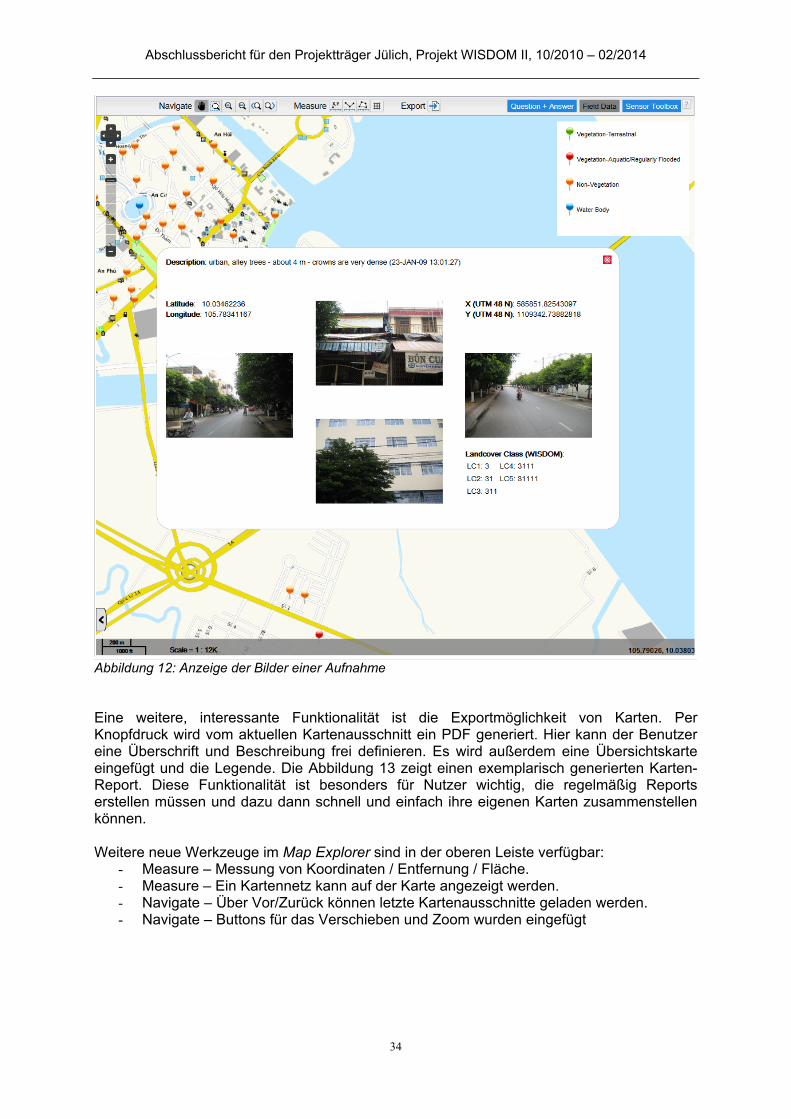
Abschlussbericht für den Projektträger Jülich, Projekt WISDOM II, 10/2010 – 02/2014
34
Abbildung 12: Anzeige der Bilder einer Aufnahme Eine weitere, interessante Funktionalität ist die Exportmöglichkeit von Karten. Per Knopfdruck wird vom aktuellen Kartenausschnitt ein PDF generiert. Hier kann der Benutzer eine Überschrift und Beschreibung frei definieren. Es wird außerdem eine Übersichtskarte eingefügt und die Legende. Die Abbildung 13 zeigt einen exemplarisch generierten Karten-Report. Diese Funktionalität ist besonders für Nutzer wichtig, die regelmäßig Reports erstellen müssen und dazu dann schnell und einfach ihre eigenen Karten zusammenstellen können. Weitere neue Werkzeuge im Map Explorer sind in der oberen Leiste verfügbar:
- Measure – Messung von Koordinaten / Entfernung / Fläche. - Measure – Ein Kartennetz kann auf der Karte angezeigt werden. - Navigate – Über Vor/Zurück können letzte Kartenausschnitte geladen werden. - Navigate – Buttons für das Verschieben und Zoom wurden eingefügt
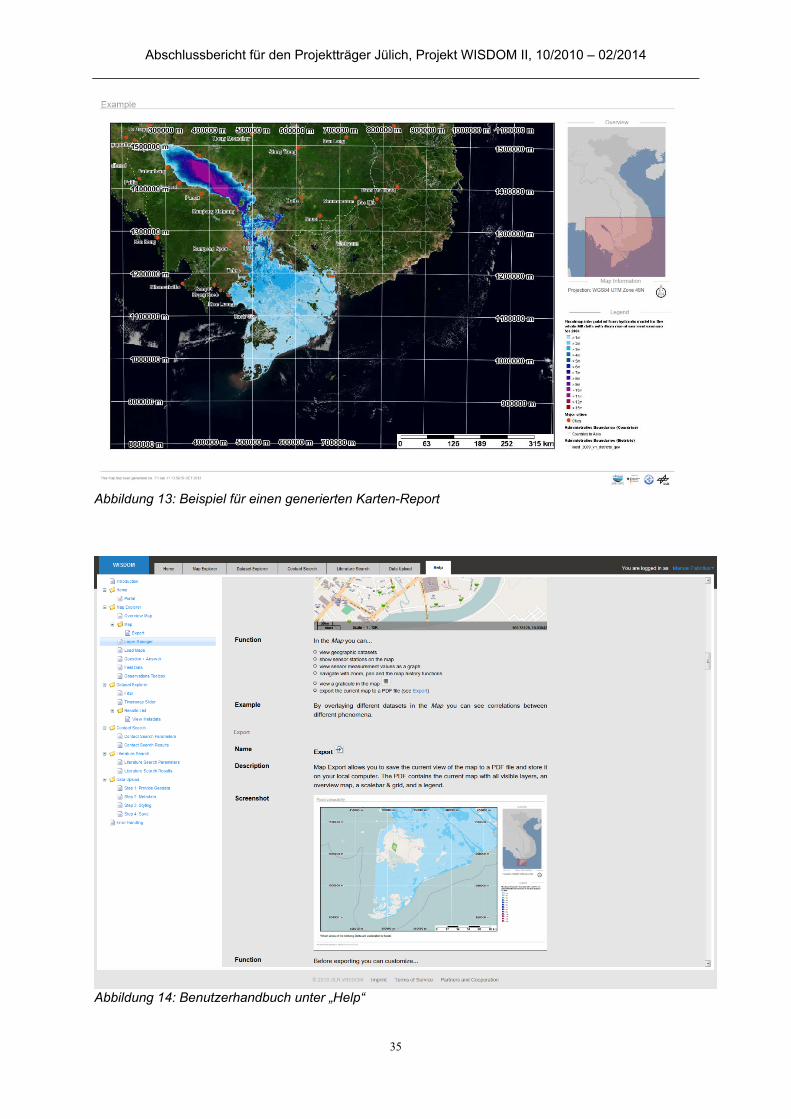
Abschlussbericht für den Projektträger Jülich, Projekt WISDOM II, 10/2010 – 02/2014
35
Abbildung 13: Beispiel für einen generierten Karten-Report
Abbildung 14: Benutzerhandbuch unter „Help“

Abschlussbericht für den Projektträger Jülich, Projekt WISDOM II, 10/2010 – 02/2014
36
Die Hilfe-Seite innerhalb des Informationssystems ermöglicht allen Benutzern Informationen zu den genutzten Komponenten (z.B. Map Explorer, Dataset Explorer, Contact Search, Literature Search, Data Upload, etc.) interaktiv abzurufen (Abbildung 15). Alternativ lässt sich das Manual auch als ganzes anzeigen (Abbildung 14).
Abbildung 15: interaktives Benutzerhandbuch Ein administrativer Bereich für autorisierte Personen bietet Funktionen zum Verwalten von Organisationen (z.B. Organisationen, die Daten liefern) und Benutzern des Informationssystems. Ein Benutzer mit „administrativen Rechten“ ist in der Lage Benutzer zu erstellen, zu löschen, Details sowie Rechte zu ändern. Abbildung 16 zeigt die Benutzerverwaltung. Außerdem ist es möglich, direkt über das Informationssystem, eine E-Mail Benachrichtigungen (z.B. über den Verlauf / Abschluss der Registrierung) an bestimmte Benutzer zu senden. Des Weiteren können Organisationen neu angelegt, gelöscht oder verändert werden.
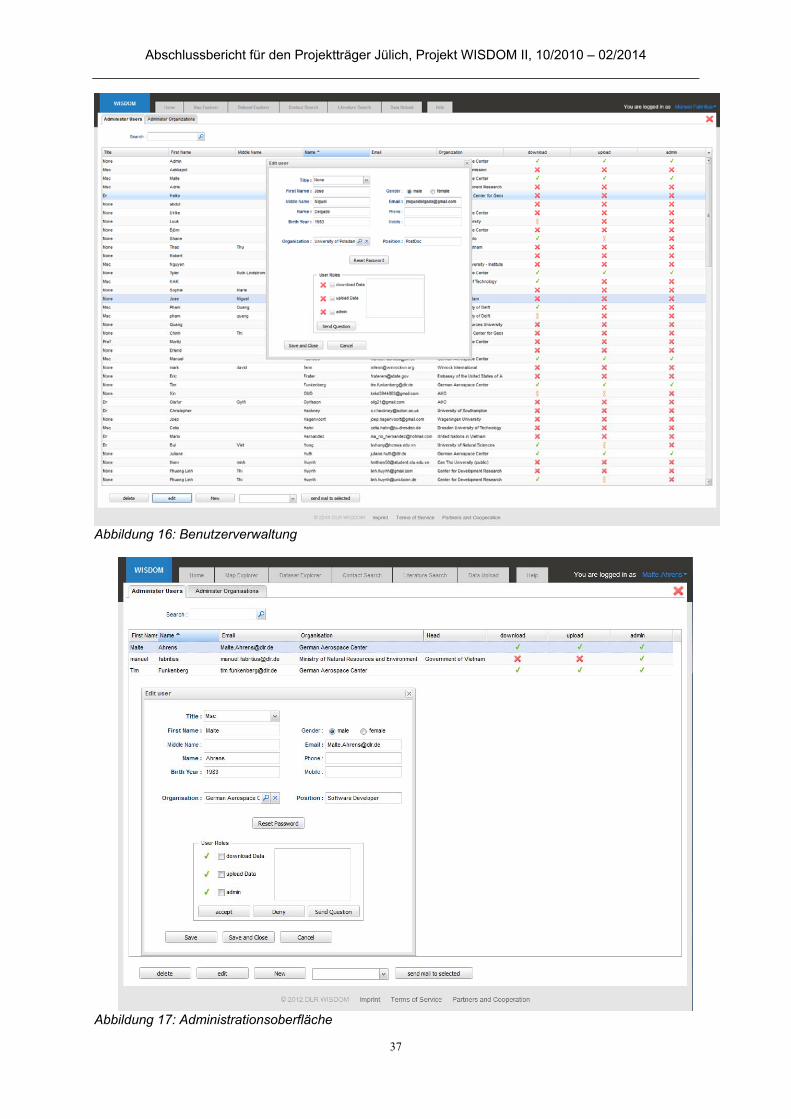
Abschlussbericht für den Projektträger Jülich, Projekt WISDOM II, 10/2010 – 02/2014
37
Abbildung 16: Benutzerverwaltung
Abbildung 17: Administrationsoberfläche
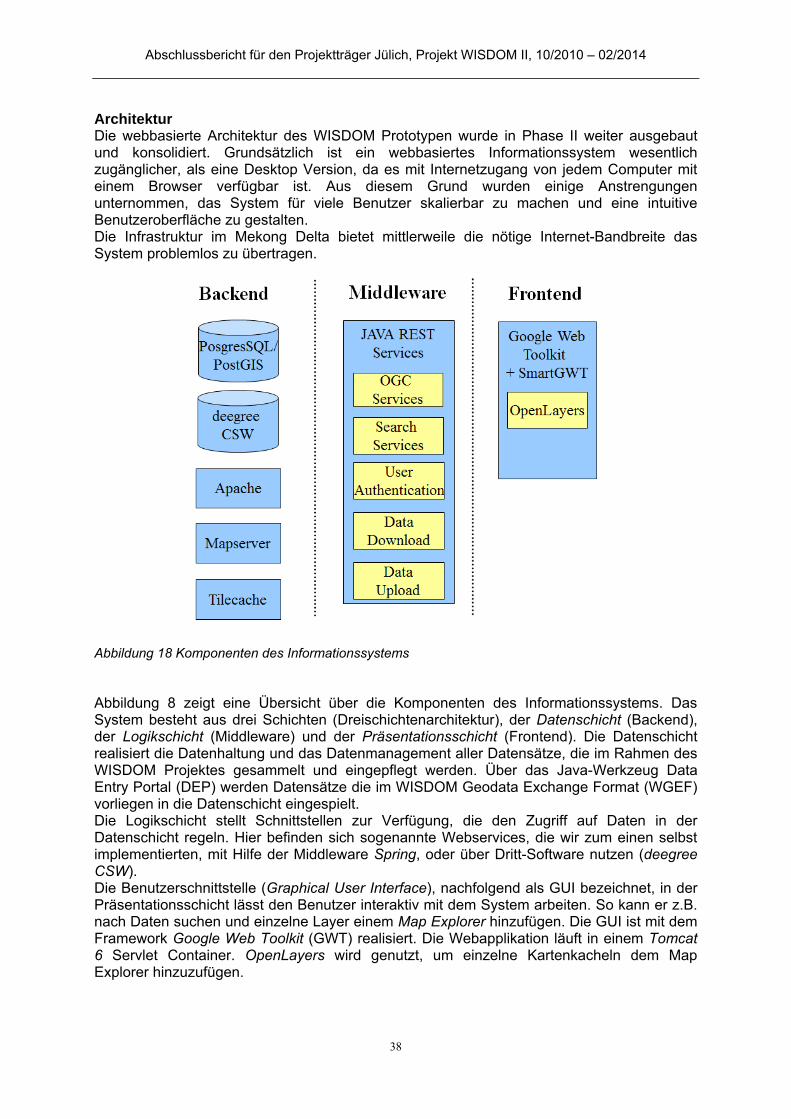
Abschlussbericht für den Projektträger Jülich, Projekt WISDOM II, 10/2010 – 02/2014
38
Architektur Die webbasierte Architektur des WISDOM Prototypen wurde in Phase II weiter ausgebaut und konsolidiert. Grundsätzlich ist ein webbasiertes Informationssystem wesentlich zugänglicher, als eine Desktop Version, da es mit Internetzugang von jedem Computer mit einem Browser verfügbar ist. Aus diesem Grund wurden einige Anstrengungen unternommen, das System für viele Benutzer skalierbar zu machen und eine intuitive Benutzeroberfläche zu gestalten. Die Infrastruktur im Mekong Delta bietet mittlerweile die nötige Internet-Bandbreite das System problemlos zu übertragen.
Abbildung 18 Komponenten des Informationssystems Abbildung 8 zeigt eine Übersicht über die Komponenten des Informationssystems. Das System besteht aus drei Schichten (Dreischichtenarchitektur), der Datenschicht (Backend), der Logikschicht (Middleware) und der Präsentationsschicht (Frontend). Die Datenschicht realisiert die Datenhaltung und das Datenmanagement aller Datensätze, die im Rahmen des WISDOM Projektes gesammelt und eingepflegt werden. Über das Java-Werkzeug Data Entry Portal (DEP) werden Datensätze die im WISDOM Geodata Exchange Format (WGEF) vorliegen in die Datenschicht eingespielt. Die Logikschicht stellt Schnittstellen zur Verfügung, die den Zugriff auf Daten in der Datenschicht regeln. Hier befinden sich sogenannte Webservices, die wir zum einen selbst implementierten, mit Hilfe der Middleware Spring, oder über Dritt-Software nutzen (deegree CSW). Die Benutzerschnittstelle (Graphical User Interface), nachfolgend als GUI bezeichnet, in der Präsentationsschicht lässt den Benutzer interaktiv mit dem System arbeiten. So kann er z.B. nach Daten suchen und einzelne Layer einem Map Explorer hinzufügen. Die GUI ist mit dem Framework Google Web Toolkit (GWT) realisiert. Die Webapplikation läuft in einem Tomcat 6 Servlet Container. OpenLayers wird genutzt, um einzelne Kartenkacheln dem Map Explorer hinzuzufügen.

Abschlussbericht für den Projektträger Jülich, Projekt WISDOM II, 10/2010 – 02/2014
39
Technische Ausführungen 2.1.2
Projekt Infrastruktur Das WISDOM Projekt unterhält zwei aktive Informationssysteme (Ho-Chi-Minh-Stadt / DLR) und entwickelt aktiv das System weiter. Des Weiteren ist es möglich die Software auf weitere Projektregionen anzupassen. Um dies zu ermöglichen, ist eine ganze Reihe von Werkzeugen nötig. Virtualization Grundsätzlich bietet eine virtualisierte Hardwareumgebung eine ganze Reihe von Vorteilen. So ist es möglich eine Virtuelle Maschine (VM) komplett zu kopieren (clonen/klonen) ohne den Betriebszustand zu ändern. Ein Clone kann man als Sicherung verwenden oder auf einer anderen Hardware zusätzlich betreiben. So wird das WISDOM Informationssystem regelmäßig auf einen sichereren Speicherbereich geklont. Eine solche Kopie ist nötig um bei einem Hardwarefehler das System wiederherzustellen. Zusätzlich werden die Clone verwendet um das zweite System, dass in Ho-Chi-Minh-Stadt läuft, regelmäßig zu aktualisieren. Ein weiterer Clone wird als Testsystem genutzt. Ein Testsystem ist zwingend notwendig, um Fehler in der Software zu analysieren und zu beseitigen – bevor die Software für den Endnutzer zugänglich ist. Weitere VMs werden benötigt um Entwicklungswerkzeuge bereitzustellen und unabhängig von dem Informationssystem zu halten. Zum Einsatz kommt in Ho-Chi-Minh-Stadt ein Hostsystem mit Debian Squeeze und Kernel based Virtualization (KVM) in Kombination mit libvirt. Hierbei handelt es sich um leichtgewichtige Open Source Lösungen. Für die Infrastruktur beim DLR in Deutschland ist ein komplexeres System nötig. Hier wurde Citrix XenServer eingesetzt. Die Software ermöglicht die Administration von mehreren Servern – welche nötig sind, um die Rechenkapazitäten die für WISDOM benötigt wird, zu verwalten. Die VMs der beiden Lösungen sind miteinander kompatibel. Entwicklungswerkzeuge Für die Softwareentwicklung wird eine ganze Reihe von Werkzeugen benötigt, um eine weitgehen reibungslosen Ablauf zu ermöglichen. Dazu gehört zu allererst ein Versionssystem, dass jegliche Änderung am Source Code speichert. So lassen sich alte Stände wieder herstellen und eingeschlichene Fehler lassen sich zurückverfolgen. Subversion ist ein gängiges System und kommt auch bei WISDOM zum Einsatz. Des Weiteren werden Systeme für die Dokumentation sowie Verwaltung der Arbeitsschritte benötigt. Das eingesetzte Mediawiki beinhaltet sämtliche Dokumentation zu dem WISDOM Informationssystem und ist über das Intranet für alle zugänglich. Selbiges gilt für das Trac Ticketsystem. Softwareentwicklung in Java kann zudem durch das Build Management Tool Maven unterstützt werden. Dies definiert, welche Struktur ein Maven Projekt haben soll und verwaltet jegliche Abhängigkeiten. So wurde der Java Code in viele kleine Module unterteilt, jedes für sich zuständig für eine bestimmte Aufgabe. Über das Maven Buildsystem werden alle Module in der richtigen Reihenfolge gebaut. Dazu kommt, dass kleinere Software Module besser getestet und somit auch gewartet werden können. Für nahezu alle Module wurden JUnit Tests angelegt was maßgeblich zur Softwarequalität beiträgt. Während des Maven Build Prozesses werden alle definierten Tests ausgeführt und bei einem Fehler ggf. abgebrochen. Dieser ganze Prozess kann von jedem Entwickler manuell angestoßen werden – oder ein spezielles System übernimmt diese Aufgabe. Spezielle Continuous Integration Server übernehmen diese Aufgabe – für WISDOM wurde Jenkins eingesetzt. Das System überwacht automatisch das Subversion Repository und baut bei einer Änderung alle Abhängigkeiten automatisch. Nach einem erfolgreichen Durchlauf wird das
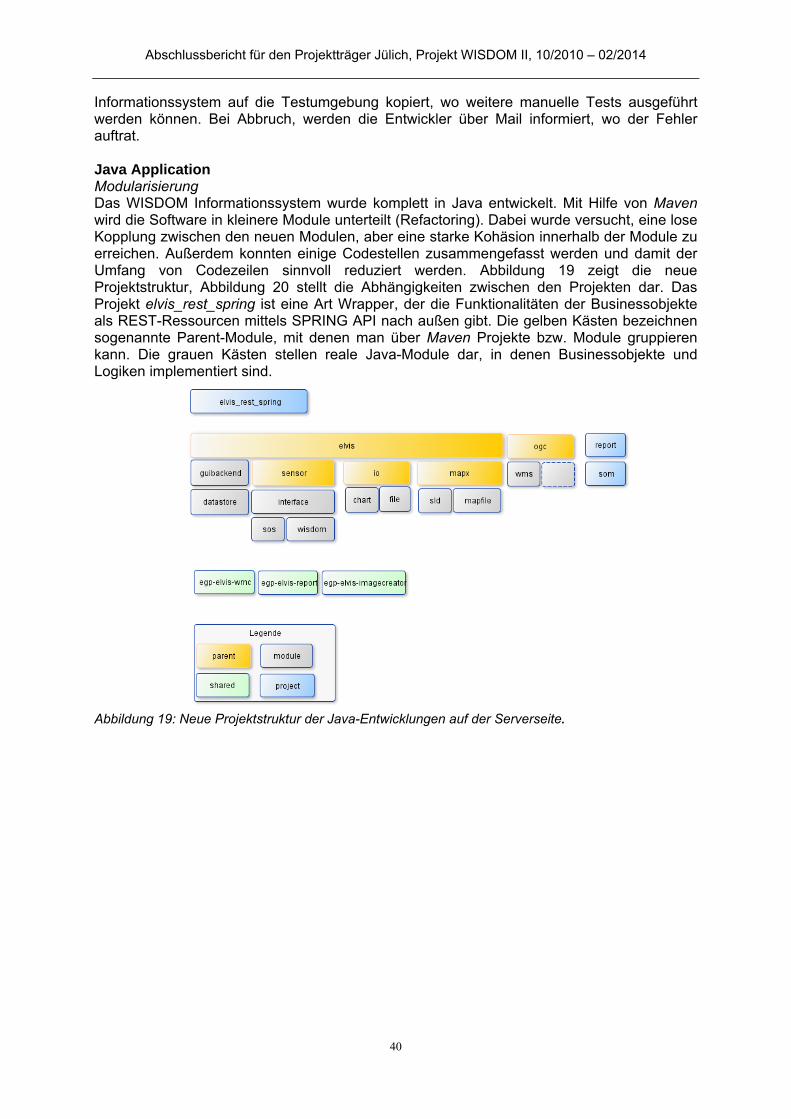
Abschlussbericht für den Projektträger Jülich, Projekt WISDOM II, 10/2010 – 02/2014
40
Informationssystem auf die Testumgebung kopiert, wo weitere manuelle Tests ausgeführt werden können. Bei Abbruch, werden die Entwickler über Mail informiert, wo der Fehler auftrat. Java Application Modularisierung Das WISDOM Informationssystem wurde komplett in Java entwickelt. Mit Hilfe von Maven wird die Software in kleinere Module unterteilt (Refactoring). Dabei wurde versucht, eine lose Kopplung zwischen den neuen Modulen, aber eine starke Kohäsion innerhalb der Module zu erreichen. Außerdem konnten einige Codestellen zusammengefasst werden und damit der Umfang von Codezeilen sinnvoll reduziert werden. Abbildung 19 zeigt die neue Projektstruktur, Abbildung 20 stellt die Abhängigkeiten zwischen den Projekten dar. Das Projekt elvis_rest_spring ist eine Art Wrapper, der die Funktionalitäten der Businessobjekte als REST-Ressourcen mittels SPRING API nach außen gibt. Die gelben Kästen bezeichnen sogenannte Parent-Module, mit denen man über Maven Projekte bzw. Module gruppieren kann. Die grauen Kästen stellen reale Java-Module dar, in denen Businessobjekte und Logiken implementiert sind.
Abbildung 19: Neue Projektstruktur der Java-Entwicklungen auf der Serverseite.
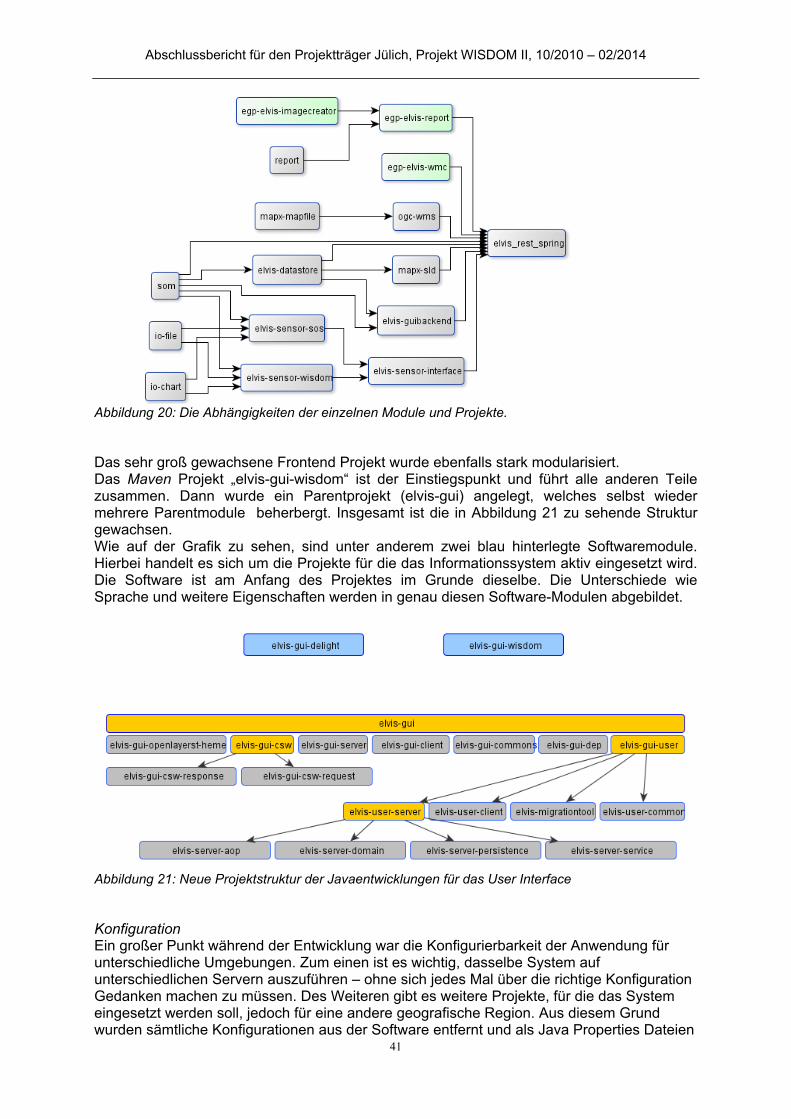
Abschlussbericht für den Projektträger Jülich, Projekt WISDOM II, 10/2010 – 02/2014
41
Abbildung 20: Die Abhängigkeiten der einzelnen Module und Projekte. Das sehr groß gewachsene Frontend Projekt wurde ebenfalls stark modularisiert. Das Maven Projekt „elvis-gui-wisdom“ ist der Einstiegspunkt und führt alle anderen Teile zusammen. Dann wurde ein Parentprojekt (elvis-gui) angelegt, welches selbst wieder mehrere Parentmodule beherbergt. Insgesamt ist die in Abbildung 21 zu sehende Struktur gewachsen. Wie auf der Grafik zu sehen, sind unter anderem zwei blau hinterlegte Softwaremodule. Hierbei handelt es sich um die Projekte für die das Informationssystem aktiv eingesetzt wird. Die Software ist am Anfang des Projektes im Grunde dieselbe. Die Unterschiede wie Sprache und weitere Eigenschaften werden in genau diesen Software-Modulen abgebildet.
Abbildung 21: Neue Projektstruktur der Javaentwicklungen für das User Interface Konfiguration Ein großer Punkt während der Entwicklung war die Konfigurierbarkeit der Anwendung für unterschiedliche Umgebungen. Zum einen ist es wichtig, dasselbe System auf unterschiedlichen Servern auszuführen – ohne sich jedes Mal über die richtige Konfiguration Gedanken machen zu müssen. Des Weiteren gibt es weitere Projekte, für die das System eingesetzt werden soll, jedoch für eine andere geografische Region. Aus diesem Grund wurden sämtliche Konfigurationen aus der Software entfernt und als Java Properties Dateien
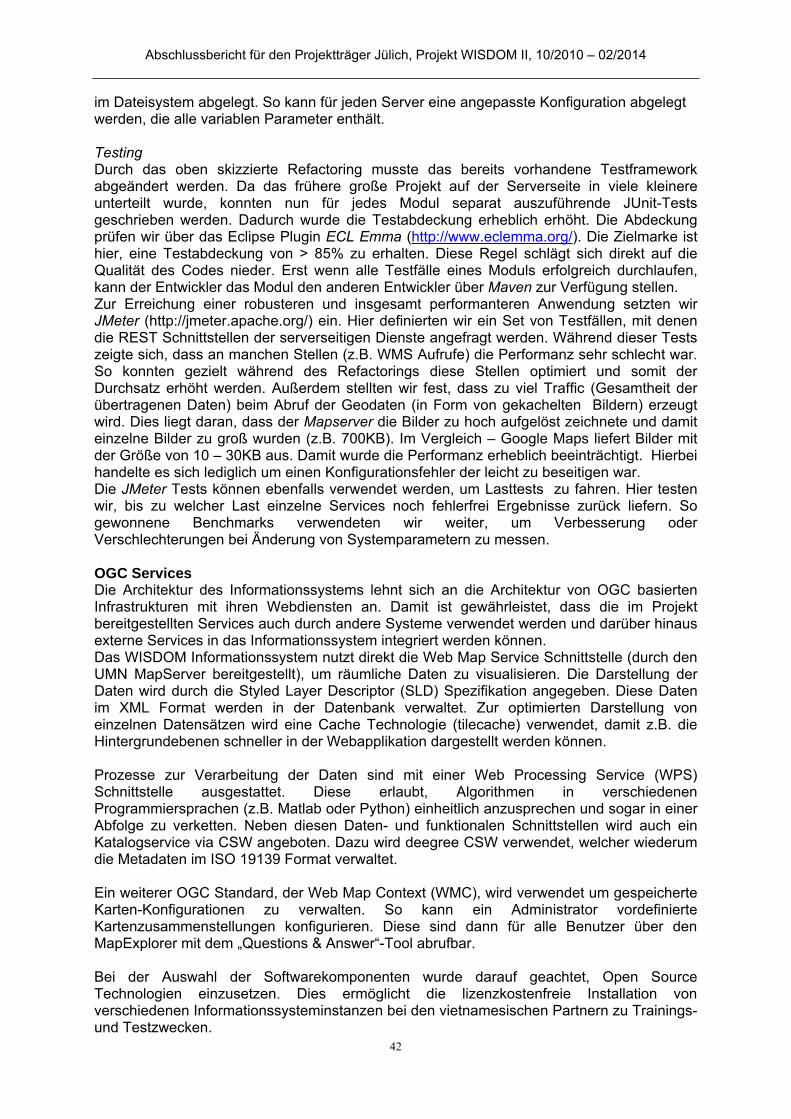
Abschlussbericht für den Projektträger Jülich, Projekt WISDOM II, 10/2010 – 02/2014
42
im Dateisystem abgelegt. So kann für jeden Server eine angepasste Konfiguration abgelegt werden, die alle variablen Parameter enthält. Testing Durch das oben skizzierte Refactoring musste das bereits vorhandene Testframework abgeändert werden. Da das frühere große Projekt auf der Serverseite in viele kleinere unterteilt wurde, konnten nun für jedes Modul separat auszuführende JUnit-Tests geschrieben werden. Dadurch wurde die Testabdeckung erheblich erhöht. Die Abdeckung prüfen wir über das Eclipse Plugin ECL Emma (http://www.eclemma.org/). Die Zielmarke ist hier, eine Testabdeckung von > 85% zu erhalten. Diese Regel schlägt sich direkt auf die Qualität des Codes nieder. Erst wenn alle Testfälle eines Moduls erfolgreich durchlaufen, kann der Entwickler das Modul den anderen Entwickler über Maven zur Verfügung stellen. Zur Erreichung einer robusteren und insgesamt performanteren Anwendung setzten wir JMeter (http://jmeter.apache.org/) ein. Hier definierten wir ein Set von Testfällen, mit denen die REST Schnittstellen der serverseitigen Dienste angefragt werden. Während dieser Tests zeigte sich, dass an manchen Stellen (z.B. WMS Aufrufe) die Performanz sehr schlecht war. So konnten gezielt während des Refactorings diese Stellen optimiert und somit der Durchsatz erhöht werden. Außerdem stellten wir fest, dass zu viel Traffic (Gesamtheit der übertragenen Daten) beim Abruf der Geodaten (in Form von gekachelten Bildern) erzeugt wird. Dies liegt daran, dass der Mapserver die Bilder zu hoch aufgelöst zeichnete und damit einzelne Bilder zu groß wurden (z.B. 700KB). Im Vergleich – Google Maps liefert Bilder mit der Größe von 10 – 30KB aus. Damit wurde die Performanz erheblich beeinträchtigt. Hierbei handelte es sich lediglich um einen Konfigurationsfehler der leicht zu beseitigen war. Die JMeter Tests können ebenfalls verwendet werden, um Lasttests zu fahren. Hier testen wir, bis zu welcher Last einzelne Services noch fehlerfrei Ergebnisse zurück liefern. So gewonnene Benchmarks verwendeten wir weiter, um Verbesserung oder Verschlechterungen bei Änderung von Systemparametern zu messen. OGC Services Die Architektur des Informationssystems lehnt sich an die Architektur von OGC basierten Infrastrukturen mit ihren Webdiensten an. Damit ist gewährleistet, dass die im Projekt bereitgestellten Services auch durch andere Systeme verwendet werden und darüber hinaus externe Services in das Informationssystem integriert werden können. Das WISDOM Informationssystem nutzt direkt die Web Map Service Schnittstelle (durch den UMN MapServer bereitgestellt), um räumliche Daten zu visualisieren. Die Darstellung der Daten wird durch die Styled Layer Descriptor (SLD) Spezifikation angegeben. Diese Daten im XML Format werden in der Datenbank verwaltet. Zur optimierten Darstellung von einzelnen Datensätzen wird eine Cache Technologie (tilecache) verwendet, damit z.B. die Hintergrundebenen schneller in der Webapplikation dargestellt werden können. Prozesse zur Verarbeitung der Daten sind mit einer Web Processing Service (WPS) Schnittstelle ausgestattet. Diese erlaubt, Algorithmen in verschiedenen Programmiersprachen (z.B. Matlab oder Python) einheitlich anzusprechen und sogar in einer Abfolge zu verketten. Neben diesen Daten- und funktionalen Schnittstellen wird auch ein Katalogservice via CSW angeboten. Dazu wird deegree CSW verwendet, welcher wiederum die Metadaten im ISO 19139 Format verwaltet. Ein weiterer OGC Standard, der Web Map Context (WMC), wird verwendet um gespeicherte Karten-Konfigurationen zu verwalten. So kann ein Administrator vordefinierte Kartenzusammenstellungen konfigurieren. Diese sind dann für alle Benutzer über den MapExplorer mit dem „Questions & Answer“-Tool abrufbar. Bei der Auswahl der Softwarekomponenten wurde darauf geachtet, Open Source Technologien einzusetzen. Dies ermöglicht die lizenzkostenfreie Installation von verschiedenen Informationssysteminstanzen bei den vietnamesischen Partnern zu Trainings- und Testzwecken.
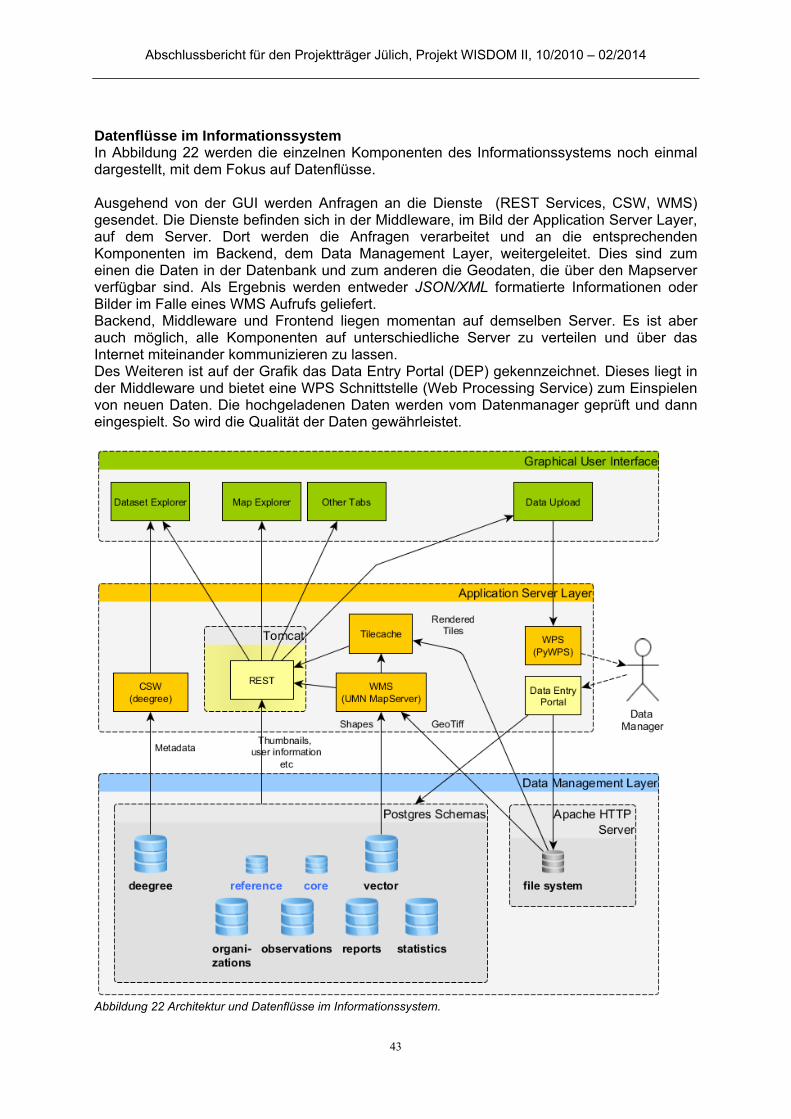
Abschlussbericht für den Projektträger Jülich, Projekt WISDOM II, 10/2010 – 02/2014
43
Datenflüsse im Informationssystem In Abbildung 22 werden die einzelnen Komponenten des Informationssystems noch einmal dargestellt, mit dem Fokus auf Datenflüsse. Ausgehend von der GUI werden Anfragen an die Dienste (REST Services, CSW, WMS) gesendet. Die Dienste befinden sich in der Middleware, im Bild der Application Server Layer, auf dem Server. Dort werden die Anfragen verarbeitet und an die entsprechenden Komponenten im Backend, dem Data Management Layer, weitergeleitet. Dies sind zum einen die Daten in der Datenbank und zum anderen die Geodaten, die über den Mapserver verfügbar sind. Als Ergebnis werden entweder JSON/XML formatierte Informationen oder Bilder im Falle eines WMS Aufrufs geliefert. Backend, Middleware und Frontend liegen momentan auf demselben Server. Es ist aber auch möglich, alle Komponenten auf unterschiedliche Server zu verteilen und über das Internet miteinander kommunizieren zu lassen. Des Weiteren ist auf der Grafik das Data Entry Portal (DEP) gekennzeichnet. Dieses liegt in der Middleware und bietet eine WPS Schnittstelle (Web Processing Service) zum Einspielen von neuen Daten. Die hochgeladenen Daten werden vom Datenmanager geprüft und dann eingespielt. So wird die Qualität der Daten gewährleistet.
Abbildung 22 Architektur und Datenflüsse im Informationssystem.

Abschlussbericht für den Projektträger Jülich, Projekt WISDOM II, 10/2010 – 02/2014
44
Ein großer Vorteil, den die REST Dienste mitbringen, ist die Interoperabilität. Die Dienste sind offen zugänglich und so können andere Anwendungen dort Daten abrufen – sofern das entsprechende Interface implementiert wurde. So ist es möglich mit Desktop GIS Anwendungen auf den WISDOM WMS Service zu verbinden und Geodaten direkt in das Desktop GIS zu laden. Es ist natürlich auch möglich, externe WMS Dienste anzusprechen und die Daten in das Informationssystem zu laden. Auf diesem Wege sind z.B die Open Streetmap Karten im MapExplorer verfügbar. Intelligente Suche ermöglicht effizienten Datenzugriff Das im Projekt entwickelte Datenmodell erlaubt die Verknüpfung der integrierten Daten mit bekannten räumlichen und thematischen Begriffen, wie z.B. Provinz- und Distriktnamen oder eine hierarchische Einteilung der verschiedenen Wissensdomänen (Hydrologie, Administration, etc.). Damit kann der Nutzer unterschiedliche Filterkriterien auf die Ergebnisliste anwenden, und so die Ergebnisse verkleinern.
Abbildung 23: Der Suchmechanismus im WISDOM IS Möglich sind Filter für Zeit, Geografische Lage, Thematik und Daten Typ. In diesen Bereichen sind jeweils vorgefertigte Schlüsselwörter definiert aus denen der Benutzer ohne Vorkenntnisse wählen kann. Des Weiteren wird eine Rückmeldung angezeigt, wenn ein Filter keine Ergebnisse mehr liefert. So kommt man nicht in die Situation eine leere Ergebnisliste zu bekommen. Abbildung 23 zeigt den Suchmechanismus. Ganz oben werden die angewendeten Filter gelistet. Darunter ist ein Zeitstrahl zwischen 1980 und heute. So kann eine Zeitspanne ausgewählt werden. Den meisten Platz nimmt die Auflistung der verschiedenen Filtertypen ein. Die Zahl in Klammern zeigt die Anzahl der Ergebnisse – wenn dieser Filter angewendet wird. Bei der Auswahl eines Filters, werden die Daten sofort abgerufen und Ergebnisliste aktualisiert. Ein manuelles Absenden der Anfrage ist nicht mehr nötig. Alternativ kann man auch alle Ergebnisse seitenweise durchblättern. Datenupload Neben dem bekannten Dateneingangsportal (DEP), welches Daten im WGEF Format annimmt, wurde die Benutzeroberfläche zur grafischen Eingabe weitgehend überarbeitet. Hier kann der Benutzer nun ISO 19139 konforme Metadaten erzeugen und diese auch als Template abspeichern. So wird der Prozess erheblich beschleunigt, da bei ähnlichen Daten schnell ein Template herangezogen werden kann. Selbiges gilt für die Styled Layer Descriptor, welche ebenfalls als Template abgespeichert werden können. Alternativ ist es möglich aus einer Liste von vordefinierten SLDs eines auszuwählen. Des Weiteren wird beim Upload der Daten direkt alles auf Konsistenz geprüft und ggf. Rückmeldung gegeben. Bei korrekter Durchführung aller nötigen Schritte, werden die Daten auf das System geladen – sind aber noch nicht sichtbar. Ein Benutzer mit administrativen Rechten bekommt in diesem Fall eine Mail und muss die neuen Daten bestätigen und für alle Nutzer freigeben.
Abschlussbericht für den Projektträger Jülich, Projekt WISDOM II, 10/2010 – 02/2014
45
Betreiberkonzept 2.1.3
Das WP 3200 hatte zum Ziel, ein Betreiberkonzept vorzubereiten, welches den Betrieb des WISDOM Systems auch nach Projektende gewährleistet. Verschiedene Trainigsmaßnahmen wurden am GEOC, bei verschiedenen Stellen bei MARD und MoNRE sowohl in Ho-Chi-Minh-Stadt als auch Hanoi durchgeführt, um Personal im Umgang und in den technischen Details des Systems zu schulen. Eine große Herausforderung lag hier darin, die Kontinuität der Maßnahmen zu gewährleisten. Da immer wieder neue Teilnehmer die Trainings absolvierten, mussten einige Inhalte wiederholt werden, was den Gesamtablauf der Trainings verlangsamte. Zusätzlich zu diesen Trainings wurde in den Mekong Delta Touren in regelmäßigen Abständen die Anforderungen der lokalen DoSTS, DARDs und DoNREs analysiert, um weitere Entwicklung am System direkt an den lokalen Bedarf auszurichten. So versuchten wir sicherzustellen, dass die tatsächlichen Anforderungen der Behörden sich im System wiederfanden. Im Rahmen einer von der Gesellschaft für Internationale Zusammenarbeit (GIZ) beauftragten Studie für das MARD stellten vietnamesische Experten fest, dass das WISDOM System großes Potential besitzt, relevante Daten aus dem Bereich Wasserressourcenmanagement zu verwalten. Allerdings müssten weitere Datenintegrationsschnittstellen (Dateneingabe per SMS) bereitgestellt werden, sowie eine Anbindung an hydrologische Modelle erfolgen. Die Stärke des WISDOM Systems im Vergleich zu anderen in der Region liegt v.a. darin, dass das Datenmanagement verschiedener Daten ausgereift ist, ausreichende Visualisierungsmöglichkeiten von Raster- und Vektordaten und in-situ Sensormessungen vorliegen, es eine einfache Nutzeradministration gibt. Darüber hinaus wurde in der Studie hervorgehoben, dass WISDOM auf Open Source Softwaren basiert und somit keine Lizenzgebühren zu erwarten sind. Durch eine gezielte Erweiterung des Systems könnte das WISDOM System also für MARD für die tägliche Arbeit zum Einsatz kommen. Die genannten Erweiterungen konnten im Rahmen des Projektes nicht durchgeführt werden, da dazu die personellen Ressourcen fehlten, und die Anforderungen auch erst durch die Studie sehr spät formuliert wurden. Allerdings sind die Erweiterungen technisch machbar, v.a. weil das System modular gestaltet wurde und auf standardisierte Schnittstellen aufbaut.
Gegenüberstellung der Ergebnisse mit vorgegebenen Zielen 2.1.4
Grundsätzlich konnten alle Meilensteine innerhalb der Projektlaufzeit erreicht werden. Eine Auflistung findet sich in Tabelle 9. Der Task 3320 wurde nicht vollständig zur Zeit der Berichterstellung geklärt, da die Frage der weiteren Finanzierung eines Betriebs von WISDOM noch offen ist. Tabelle 5: Geplante und erreichte Meilensteine in der Projektlaufzeit Task Meilenstein Durchführung 3110 MS1: Installation of development environment Die Entwicklungsumgebung wurde
kontinuierlich gepflegt. MS2: Installation of support applications 3120 MS1, MS3, MS5 Yearly workshop / training with Vietnamese
partners Training an der VNU sowie in mehreren Provinzen im Mekong Delta. Partnerworkshops beim DLR und in Can Tho City.
MS2, MS4: Yearly workshop / training with German partners
3130 MS1: Definition of documentation standards Technische Dokumente sowie User Manuals sind in Vietnamesisch und Englisch verfügbar und wurden an vietnamesischen Partner ausgehändigt. Das User Manual ist zusätzlich online im Informationssystem verfügbar.
MS2: Technical documentation for prototype MS3: User manuals for prototype MS4: Technical documentation for final system MS5: User manuals for final system MS6: Vietnamese version of technical documentation and user
manuals 3140 MS1: Release monitoring procedure Mehrere Mekong Delta Touren und
Training of Trainers im Mekong Delta lieferten gute Ergebnisse zur
MS2: Test design for user acceptance tests MS3: Execution of user acceptance tests

Abschlussbericht für den Projektträger Jülich, Projekt WISDOM II, 10/2010 – 02/2014
46
MS4: Prototype system review Useability des Systems. 3210 MS1: Concept of system architecture Alle Planungen zum Re-Design der
GUI, Webservices und Authentifizierung wurden vorgenommen und auch eingehalten.
MS2: Document of changes in data management MS3: Web services implementation plan MS4: Concept of data processing framework with process
orchestration MS5: Concept of SSO authentication and rights management MS6: Portal implementation plan 3220 MS1: Refined data management component with appropriate
DEP Alle Meilensteine wurden erreicht und im finalen System implementiert. MS2: Set of visualisation methods attachable to information
products MS3: Processing environment with orchestration MS4: Complete set of web services with link to data model MS5: Security component MS6: Refinement of the portal MS7: Administrative GUIs MS8: Implementation of prototype MS9: Implementation of final system 3230 MS1: Establishment of testing environment Der Source Code wurde mit JUnite
tests angereichert und die Anwendung ausführlichen JMeter tests unterzogen.
MS2: Security Test Suite MS3: Performance Test Suite MS4: Robustness Test Suite MS5: System packaging and deployment routine 3310 MS1: Concept of Commissioning Ein vom DLR betreutes System
läuft in Saigon. Des Weiteren wurde das System an die Projektpartner MARD und MONRE übergeben.
MS2: Installations of prototype MS3: Installation of final system MS4: Start of Commissioning phase 3320 MS1: “Betreiberkonzept”: Identify Vietnamese consortium Eine Studie im Auftrag der GIZ,
durchgeführt von vietnamesischen Consultants, zeigt die Potentiale des WISDOM Systems.
MS2: “Betreiberkonzept”: Document: concept of operation MS3: “Betreiberkonzept”: Terms of support agreement MS4: “Betreiberkonzept”: Terms of maintenance agreement

Abschlussbericht für den Projektträger Jülich, Projekt WISDOM II, 10/2010 – 02/2014
47
2.2 Wichtigste Positionen des zahlenmäßigen Nachweises
Darunter fallen insbesondere die Personalmittel für die Mitarbeiter am DLR. Innerhalb der Projektlaufzeit konnten zwei Mitarbeiter (Kat I.) voll für das Arbeitspaket WP3000 arbeiten. Diese Mitarbeiter konzipierten und entwickelten das Informationssystem und führten weiterführende Schulungen bei den Projektpartnern in Deutschland und Vietnam durch. Darüber hinaus wurden Schulungen und Workshops bei den lokalen Behörden im Mekong Delta und in Hanoi durchgeführt. Die enge Zusammenarbeit mit den vietnamesischen Partnern und der Austausch mit den künftigen Nutzern des Systems erforderte eine enge Kommunikation vor Ort und damit Dienstreisen nach Ho Chi Minh Stadt, Can Tho, in die Mekong Delta Provinzen und nach Hanoi, sowie zu Workshops und Konferenzen. Zur Realisierung der Arbeiten wurden folgende Werkverträge vergeben:
- Übersetzung der Metadaten ins Vietnamesische - Übersetzung der Dokumentation ins Vietnamesische - VNU-ITP: Organisation der Mekong-Delta –Touren (technische Ausstattung,
Raummieten, Übersetzer) - Hosting des Servers in Vietnam
- SIWRR: Organisation eines Workshops für Entscheidungsträger der Deltaprovinzen
2.3 Notwendigkeit der geleisteten Arbeit
Der Verlauf der Arbeit im Projekt folgte der im Projektantrag formulierten Planung. Alle im Arbeitsplan formulierten Aufgaben wurden erfolgreich bearbeitet, es waren keine zusätzlichen Ressourcen für das Projekt nötig. Eines der Ziele des Projektes ein Informationssystem zur Unterstützung der nachhaltigen Entwicklung des Mekong Deltas in Vietnam zu entwickeln, machte alle Arbeiten im WP3000 unbedingt notwendig. Die erfolgreiche Übergabe an zwei vietnamesische Ministerien und damit der erfolgreiche Abschluss der Arbeiten zur Schaffung des Informationssystems unterstreicht die Wichtigkeit der Durchführung der Arbeiten im WP3000 deutlich.
2.4 Voraussichtlicher Nutzen im Sinne des Verwertungsplans
Mit der langjährigen Verfügbarkeit des WISDOM Informationssystems konnte die Sichtbarkeit des gesamten Projektes ausgebaut werden. Personen aus verschiedensten Ländern und unterschiedlichen Forschungsdisziplinen registrieren sich fortlaufend für das System und nutzen es, um die WISDOM Projektergebnisse zu visualisieren. Die so gewonnene Sichtbarkeit erleichtert es erheblich ggf. an die Ergebnisse anzuknüpfen. Mit der Möglichkeit Daten in das System einzuspielen, wurde eine Plattform zum Austausch von Geodaten und Forschungsergebnissen für das Mekong Delta geschaffen. Des Weiteren wurde das Informationssystem samt Dokumentation zum Projektabschluss an MONRE und MARD übergeben. Damit steht den Ministerien eine Plattform zum Austausch von Geodaten zur Verfügung. Nach der Übergabe wurde beim MONRE eine Schulung zum Thema Administration und Verwaltung des Informationssystems durchgeführt, die auf großes Interesse stieß, um sich diese komplexen Technologien anzueignen. Die in WISDOM entwickelten Komponenten und Module wurden für das Projekt CAWa (Central Asian Water) eingesetzt. CAWa, gefördert durch das Auswärtige Amt, hat die Kernprobleme im Wassersektor der Region Zentralasien wissenschaftlich untersucht.
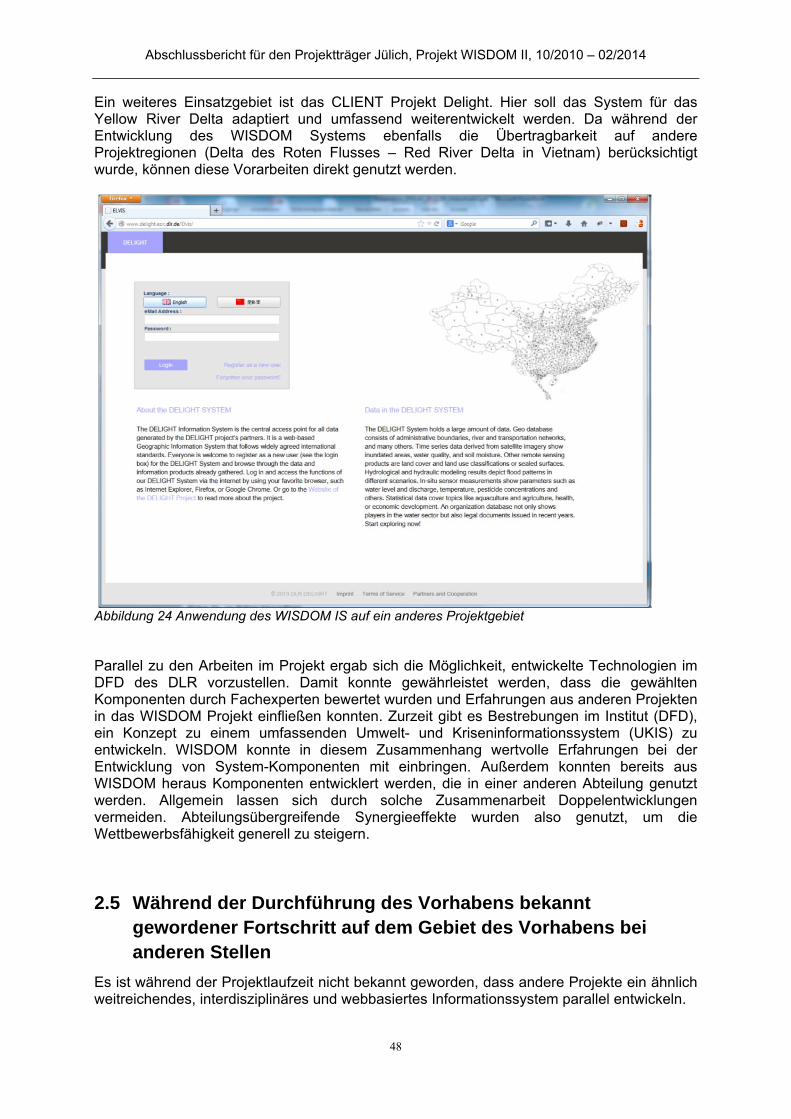
Abschlussbericht für den Projektträger Jülich, Projekt WISDOM II, 10/2010 – 02/2014
48
Ein weiteres Einsatzgebiet ist das CLIENT Projekt Delight. Hier soll das System für das Yellow River Delta adaptiert und umfassend weiterentwickelt werden. Da während der Entwicklung des WISDOM Systems ebenfalls die Übertragbarkeit auf andere Projektregionen (Delta des Roten Flusses – Red River Delta in Vietnam) berücksichtigt wurde, können diese Vorarbeiten direkt genutzt werden.
Abbildung 24 Anwendung des WISDOM IS auf ein anderes Projektgebiet Parallel zu den Arbeiten im Projekt ergab sich die Möglichkeit, entwickelte Technologien im DFD des DLR vorzustellen. Damit konnte gewährleistet werden, dass die gewählten Komponenten durch Fachexperten bewertet wurden und Erfahrungen aus anderen Projekten in das WISDOM Projekt einfließen konnten. Zurzeit gibt es Bestrebungen im Institut (DFD), ein Konzept zu einem umfassenden Umwelt- und Kriseninformationssystem (UKIS) zu entwickeln. WISDOM konnte in diesem Zusammenhang wertvolle Erfahrungen bei der Entwicklung von System-Komponenten mit einbringen. Außerdem konnten bereits aus WISDOM heraus Komponenten entwicklert werden, die in einer anderen Abteilung genutzt werden. Allgemein lassen sich durch solche Zusammenarbeit Doppelentwicklungen vermeiden. Abteilungsübergreifende Synergieeffekte wurden also genutzt, um die Wettbewerbsfähigkeit generell zu steigern.
2.5 Während der Durchführung des Vorhabens bekannt gewordener Fortschritt auf dem Gebiet des Vorhabens bei anderen Stellen
Es ist während der Projektlaufzeit nicht bekannt geworden, dass andere Projekte ein ähnlich weitreichendes, interdisziplinäres und webbasiertes Informationssystem parallel entwickeln.
Abschlussbericht für den Projektträger Jülich, Projekt WISDOM II, 10/2010 – 02/2014
49
2.6 Veröffentlichungen
Journal Papers 2.6.1
Gebhardt, S., Wehrmann, T., Klinger, V., Schettler, I., Huth, J., Kuenzer, Claudia und Dech, Stefan (2010): Improving data management and dissemination in web based information systems by semantic enrichment of descriptive data aspects. Computers & Geosciences, 36 (10), Seiten 1362-1373. Elsevier.
Buchkapitel 2.6.2
Klinger, V., Wehrmann, T., Gebhardt, S., Kuenzer, C. (2012): A Water-Related Web-Based Information System for the Sustainable Development of the Mekong Delta, In: Renaud, F.G. and C. Kuenzer(Eds.): The Mekong Delta System. Interdisciplinary Analyses of a River Delta, Springer Environmental Science and Engineering, XV, Springer Netherlands, p. 423-444.
Konferenzbeiträge 2.6.3
Ahrens, M., Fabritius, M., Jaspersen, V., Funkenberg, T. and Kuenzer, C. (2013): The WISDOM Information System - Its architecture and potential for Spatial Data Infrastructure (SDI), Oral presentation, International Symposium of Remote Sensing of Environment 2013, 22-26 April 2013, Beijing, China. Ahrens, M., Jaspersen, V., Andresen, T. and Kuenzer, C. (2013): Intuitive, OGC-Conformant Search for Spatial and Non-Spatial Data in a Web-Based Information, Oral presentation, International Symposium of Remote Sensing of Environment 2013, 22-26 April 2013, Beijing, China. Funkenberg, T., Klinger, V., Kuenzer, C. (2012): Data standardization and modeling in a web based information system. In: Proceedings of the International Geoscience and Remote Sensing Symposium. 22-27 July 2012, Munich, Germany. Kuenzer, C., Moder, F., Klinger, V., Fabritius, M., Huth, J., Wehrmann, T., Vo Khac, T., Trinh, Thi, L., Le Van, T., Bui Van, Q., (2011): A Water related Information System for the Sustainable Development of the Mekong Delta in Vietnam - Past Achievements and the Pathway ahead. Proceedings of the WORLD DELTA SUMMIT, “The Pulse of Deltas and Impact on the Future”, 21-24 November 2011, Jakarta, Indonesia. Thai, B. T., Wehrmann T., Klinger V., Kuenzer C., Greve K. (2011): Ontology based description of satellite imageries for application based data quering. Innovations in Sharing Environmental Observations and Information EnviroInfo Ispra 2011, Proceedings of the 25th International Conference Environmental Informatics. ISBN: 978-3-8440-0451-9 Gebhardt, S., Wehrmann, T., Klinger, V., Huth, J. und Kuenzer, C. (2010): Modelling, management and distribution of heterogeneous data for a web based
Abschlussbericht für den Projektträger Jülich, Projekt WISDOM II, 10/2010 – 02/2014
50
information system. In: Proceedings of the 31st Asian Remote Sensing Conference, 31st Asian Remote Sensing Conference, 01.-05. Nov. 2010, Hanoi, Vietnam. Klinger, V., Wehrmann, T., Gebhardt, S. und Kuenzer, C. (2010): RESTful WISDOM (Water-related Information System for the sustainable development of the Mekong Delta). In: Proceedings of the 31st Asian Remote Sensing Conference, 31st Asian Remote Sensing Conference, 01.-05. Nov. 2010, Hanoi, Vietnam. Tran Thai, B., Wehrmann, T., Gebhardt, S., Klinger, V., Huth, J., Vo Quoc, T. und Kuenzer,C.(2010): Ontology Based Approach for geospatial Semantic Web. In: Proceedings of the 31st Asian Remote Sensing Conference, 31st Asian Remote Sensing Conference, 01.-05. Nov. 2010, Hanoi, Vietnam. Wehrmann, T., Klinger, V., Gebhardt, S. und Kuenzer, C. (2010): Web services enabled architecture coupling data and processing resources. In: Proceedings of the ISPRS Technical Commission IV, Geospatial and Geovisualization: Environment, Security and Society. ISPRS Technical Commission IV, Geospatial and Geovisualization: Environment, Security and Society, 15.-19. Nov. 2010, Orlando/FL, USA. Kuenzer, C., Wehrmann; T., Gebhardt, S., Schmidt, M., and Mehl; H. (2009): A Water Related Information System for the Mekong (Lancang) Proceedings of the 6th International Symposium on Digital Earth (ISDE6), September 2009, Beijing, China, digital version. Kuenzer, C., Renaud, F., Waibel, G., Gebhardt, S., Wehrmann, T. Schmidt, M., and H. Mehl (2009): Water related Information System for the sustainable development of the Mekong Delta in Vietnam: The WISDOM Project. AWRA (American Water Resource Association) 2009 Summer Speciality Conference, Snowbird, Utah, June 29-July 1, 2009. Schettler, I., S. Gebhardt, T. Wehrmann, J. Huth and C. Kuenzer. (2009): Das WISDOM-Projekt - Entwicklung eines wasserbezogenen Informationssystems zur Unterstuetzung des Wasser- und Ressourcenmanagements im Mekong Delta. DWA-Tagung - GIS in der Wasserwirtschaft, Kassel, Germany, 21.-22.01.09 Gebhardt, S., Kuenzer, C., Huth, J., Wehrmann, T., Schettler, I., Schmidt, M. (2008): "The WISDOM Project - A Water-related Information System for the Mekong Delta, Vietnam: first results of remote sensing". 13th World Water Congress. 01.-04.09.2008. Montpellier, France. Schettler, I., Wehrmann, T., Phuoc, T. V., Gebhardt, S., Huth, J., Kuenzer, C. (2008): WISDOM - multidisciplinary information system in the water related context. 21.-23.10.2008. GISpro conference 2008, Ho Chi Minh City, Viet Nam. Wehrmann, T., Tran, T. B., Gebhardt, S., Huth, J., Kuenzer, C., Lam, D. N., Schettler, I., Schmidt, M., Dech, S. (2008): Wisdom demostration module - open source technology managing water related, spatial information. 04.-06.12.2008. GIS IDEAS conference 2008, Hanoi, Viet Nam. Gebhardt, S., Kuenzer, C., Huth, J., Wehrmann, T., Schettler, I., Schmidt, M. (2008): The WISDOM Project - A Water-related Information System for the Mekong Delta, Vietnam: first results of remote sensing. 13th World Water Congress. 01.-04.09.2008. Montpellier, France

Abschlussbericht für den Projektträger Jülich, Projekt WISDOM II, 10/2010 – 02/2014
51
Doktorarbeiten 2.6.4
Tran Thai Binh (2013): The knowledge-based search for water-related information system for the Mekong Delta, Vietnam. Universität Bonn.
Diplom/Masterarbeiten 2.6.5
Ahrens, Malte (2010): Integration raumbezogener Daten in ein Umweltinformationssystem. FH Karlsruhe – Technik und Wirtschaft. Noohukhan, Magith (2010): Evaluation of performance testing tools and performance analysis of web services. Fachbereich Elektrotechnik und Informationstechnik. TU Darmstadt.
Abschlussbericht für den Projektträger Jülich, Projekt WISDOM II, 10/2010 – 02/2014
52

Abschlussbericht für den Projektträger Jülich, Projekt WISDOM II, 10/2010 – 02/2014
53
Unterauftrag UNU-EHS – separater Bericht
Dem Institut für Umwelt und menschliche Sicherheit der Universität der Vereinten Nationen (UNU-EHS) unterlag die Bearbeitung bzw. Koordination folgender Teilbereiche:
Im Arbeitspaket 4000 (Wasserresourcen und Wasserqualität), Unterarbeitspaket 4200, Aufgabenbereich „Pflanzenschutzmittel, Nährstoffe, Antibiotika, Schwermetalle“ (Task 4210),
Im Arbeitspaket 5000 (Wasser, Transformation und Adaptation) Aufgabenbereich „From Vulnerability to Adaptation Strategies“ (Task 5200) mit weiteren Beiträgen zu den Aufgabenbereichen „Water related risks in the context of climate change“ (Task 5100) und „Socio-economic transformation“ (Task 5300)
Koordination des Doktorandenprogramms (WP 7000) Der Endbericht gibt einen Überblick über die Aktivitäten und Ergebnisse in den oben genannten Bereichen.
C. Bericht Projektteil „Pflanzenschutzmittel, Nährstoffe, Antibiotika, Schwermetalle“ (WP 4000, Task 4210) – UNU-EHS
Kurze Darstellung 1
1.1 Aufgabenstellung
Im Arbeitsbereich „Pflanzenschutzmittel, Nährstoffe, Antibiotika, Schwermetalle“ (Task 4210) verfolgte UNU-EHS das Ziel, die Bezugsquellen für Trinkwasser im ländlichen Mekong Delta, wie Oberflächenwasser, Grundwasser, Regenwasser und Leitungswasser auf ihre Kontamination mit Pflanzenschutzmitteln, Antibiotika, Nährstoffen, Salzen, Schwermetallen und mikrobiellen Indikatoren zu überprüfen und das resultierende Risiko für die ländliche Bevölkerung zu ermitteln und zu visualisieren. Zudem wurden verschiedene als „gute landwirtschaftliche Praxis“ eingestufte Reisanbauformen auf ihre Wirksamkeit hinsichtlich der Minderung der Pflanzenschutzmittel- und Nährstoffbelastung der Gewässer im Mekong Delta untersucht. Ein weiteres Ziel der Erfassung entsprechender Daten bestand darin, die mitwirkenden vietnamesischen Behörden über die Problematik zu informieren und sensibilisieren -- und durch Datenerfassung und Handlungsempfehlungen letztlich zur Verringerung des Risikos beizutragen.
1.2 Voraussetzungen, unter denen das Vorhaben durchgeführt wurde
Das Vorhaben ist Teil des WISDOM-Projektes. Dabei handelt es sich um den Aufbau eines integrierten Informationssystems zur Unterstützung von Entscheidungsfindungsprozessen im Bereich IWRM im Mekong Delta. Die Aktivitäten von UNU-EHS im Bereich „Pflanzenschutzmittel, Nährstoffe, Antibiotika, Schwermetalle“ tragen hierzu auf vierfache Weise bei: 1) durch die ausgeführten Untersuchungen der Wasserqualität, 2) durch die Analysen der Gründe der Wasserverschmutzung,
Abschlussbericht für den Projektträger Jülich, Projekt WISDOM II, 10/2010 – 02/2014
54
3) durch die Analyse verschiedener als „gute landwirtschaftliche Praxis“ eingestufte Reisanbauformer hinsichtlich der Minderung der Schadstoffbelastung der Gewässer 3) mit den daraus abgeleiteten Risikokarten, sowie 4) durch den kontinuierlichen und gegenseitige Informationsaustausch mit relevanten Behörden und abgeleiteten Handlungsempfehlungen zur Verbesserung der (Trink)Wasserqualität und zur Verminderung des Gesundheitsrisikos.
1.3 Planung und Ablauf des Vorhabens
Planung und Ablauf des Vorhabens lassen sich in sechs wesentliche Unterpunkte gliedern:
1. Auswahl repräsentativer Untersuchungsgebiete in Kooperation mit Partnern des WP4000, vietnamesischen Partnern und Behörden
2. Erfassung relevanter Trinkwasserquellen für die ländliche Bevölkerung 3. Erfassung verschiedener, insbesondere die als „gute landwirtschaftliche Praxis“
eingestufte Reisanbauformen 4. Wasserqualitätsüberwachung im Oberflächen-, Grund-, Regen- und Leitungswasser 5. Sensibilisierung relevanter Akteure aus Wissenschaft und Praxis (Vorträge,
Workshops, insbesondere im Hinblick auf vietnamesische Behörden und landwirtschaftliche Strukturen)
6. Verbreitung der Ergebnisse (Veröffentlichungen, webbasierte Informationen, Konferenzen)
Die Arbeiten im Bereich (Trink-)Wasserqualität wurden von zwei Doktoranden bearbeitet. Die Abgrenzung der beiden Arbeitsgebiete erfolgte auf Basis der zu untersuchenden Schadstoffe. Ein Doktorand erarbeitete eine Risikoabschätzung hinsichtlich der Belastung mit Schwermetallen, Salzen, mikrobiellen Indikatoren und Nährstoffen. Die zweite Doktorandin analysierte die Belastung durch Pflanzenschutzmittel und Antibiotika. Die dritte Doktorandin befasste sich mit den verschiedenen Reisanbauformen und deren Auswirkung auf die Wasserqualität, mit besonderem Augenmerk auf den von der vietnamesischen Regierung als „gute landwirtschaftliche Praxis“ eingestuften Reisanbauformen. Des Weiteren wurden im begrenzten Umfang Sedimentproben analysiert, um eine genauere Beurteilung der Umweltbelastung zu ermöglichen.
1.4 Wissenschaftlicher Stand, an den angeknüpft wurde
Im Mekong Delta führte die Modernisierung bzw. die Intensivierung der Landwirtschaft, zusammen mit der schnellen sozioökonomische Entwicklung der letzten 30 Jahre, zu einer ansteigenden Verunreinigung der Wasserressourcen. Die Verunreinigung beeinträchtigt aquatische Organismen – es hemmt deren Wachstum, verursacht eine erhöhte Anfälligkeit für Krankheiten oder schränkt deren Lebensraum ein. Ebenso werden die Bewohner des Deltas, deren Lebensqualität, Gesundheit und Einkommen vielfach und unmittelbar von der Verfügbarkeit des Wassers abhängt, stark beeinträchtigt (e.g. Svobodova et. al. 1993, Crumlish et al. 2002, Phan et al. 2009, Khoi et al. 2011). Viele Flussabschnitte und Kanäle in Vietnam weisen auf eine schlechte Wasserqualität auf, wobei die Datengrundlage zur die Beurteilung der Wasserqualität sowohl hinsichtlich der untersuchten Schadstoffe als auch deren raumzeitlicher Abdeckung lückenhaft ist (World Bank, 2006). Neben der regulär von vietnamesischen Behörden untersuchten Parametern der Wasserqualität (wie Sauerstoff- und Nährstoffgehalt, pH, elektrische Leitfähigkeit oder Temperatur) spielen auch Pflanzenschutzmittel, Bakterien, Viren und Parasiten eine zunehmend wichtige Rolle für die Überwachung der Wasserqualität. Pflanzenschutzmittel zum Beispiel werden in der Landwirtschaft des Deltas in großen Mengen eingesetzt. Dies erfolgt aus vielerlei Gründen, zu nennen sind v.a. der höhere Schädlingsdruck in
Abschlussbericht für den Projektträger Jülich, Projekt WISDOM II, 10/2010 – 02/2014
55
Monokulturen, die größere Anfälligkeit der Hochertragssorten gegenüber Schädlingen und Pflanzenkrankheiten sowie die umfangreiche Nutzung von Düngemitteln, was ebenfalls zu einer erhöhten Anfälligkeit führt. Während sich Vietnam von einem Reisimporteur zu einem der größten Reisexporteure der Welt entwickelt hat, (Exportmenge: 1,7 Mio. Tonnen in 1989, 3,4 Mio. Tonnen in 2000 und 4.7 Mio. Tonnen in 2008) nahm die Pestizidnutzung in Folge die Verschmutzung aquatischer Ökosysteme zu (Dung und Dung 2003, MRC, 2007). Laut dem Ministerium für Landwirtschaft und ländliche Entwicklung (MARD) nahm die Menge an importierten Pestiziden in den Jahren 1991, 2000, und 2004 von 20.300 über 33.637 auf 48.288 Tonnen zu, bei gleichzeitiger Unerfahrenheit in der Anwendung von Pflanzenschutzmitteln (Pham et al 2000, Pingali and Xuan, 1992). Dies führte zur Beeinträchtigung von aquatischen Organismen und menschlicher Gesundheit (z.B. Margni, 2001). Während in der Vergangenheit hauptsächlich chlororganische Verbindungen und Phosphorsäureester im Pflanzenschutz verwendet wurden, nimmt der Anteil der Carbamate, Nikotinoide, Biopestizide, Pyrethroide etc. weiter zu (Berg, 2001). Vietnamesische Behörden sind auf die Überprüfung der Umweltkonzentrationen von Pestiziden bisher nicht hinreichend eingerichtet. Im Mekong Delta erfolgt nur eine unregelmäßige Überwachung von einigen – mittlerweile wenig genutzten – chlororganischen Pestiziden. Neben der Auswahl der betrachteten Schadstoffe spielen Zeit und Ort der Probenentnahme eine wichtige Rolle. Häufig werden die Wasserproben in den Hauptarmen der Gewässer entnommen, wo die Wasserqualität zumeist deutlich besser ist als in den Nebenarmen und Kanälen (Sebesvari et al. 2012). Diese Feststellung ist besonders relevant, weil die ländliche Bevölkerung das Oberflächenwasser teilweise heute noch als Trinkwasser nutzt (Toan et al. 2013). Zudem wird Oberflächenwasser zum Baden, Zähneputzen, Spülen, Kochen, Waschen von Nahrungsmitteln usw. genutzt, so dass die Bevölkerung den Schadstoffen wiederkehrend ausgesetzt ist (Beobachtung während Feldarbeit). Im Hinblick auf die Trinkwasserversorgung der ländlichen Bevölkerung liegen keine gesicherten Informationen vor, die eine Risikobewertung ermöglichen würden. Hierzu sind verlässliche Daten über die verschiedenen Wasserbezugsquellen, deren Qualität und Anteil in der Versorgung der Bevölkerung notwendig. In Bezug auf die Belastung mit Pestiziden knüpfte der vorliegende Beitrag direkt an die Vorarbeiten des Antragstellers in WISDOM Phase I an. Die dort verfolgten Ziele und Methodiken wurden jedoch deutlich ausgeweitet, sowohl hinsichtlich der dabei betrachteten Schadstoffe (zusätzlich zu den Pflanzenschutzmitteln, die in Phase I betrachtet wurden auch Schwermetallen, mikrobiellen Indikatoren, Nährstoffen und Antibiotika) als auch in der deutlich vergrößerten räumlichen Abdeckung und einem direkten Bezug auf die menschliche Gesundheit. Zudem wird mit der Analyse von verschiedenen Reisanbauformen und deren Einfluss auf die Wasserqualität ein Ausblick auf mögliche zukünftige Lösungsansätze geliefert.
1.5 Zusammenarbeit mit anderen Stellen
Neben dem regelmäßigen Informations- und Datenaustausch mit den anderen am Projekt beteiligten Partnern haben wir intensiv v.a. mit Partnern in Can Tho zusammengearbeitet Als Beispiel seien hier das Zentrale Labor der Universität Can Tho (Kooperation im Bereich Analytik); das Institut für Bodenkunde der Landwirtschaftliche Fakultät der Universität Can Tho (gemeinsame Betreuung von Doktorarbeiten, Labornutzung); das „Department of Natural Resources and Environment“ in Can Tho City (Unterstützung für Genehmigungen, Labornutzung), das BMBF-finanzierte AKIZ Projekt in Can Tho (Datenaustausch, Labornutzung), die Institute INRES-Pflanzenernährung und INRES-Bodenkundler der Universität Bonn (gemeinsame Betreuung von Doktorarbeiten, Labornutzung) genannt. Mit diesen Partnern hat über den Projektzeitraum ein reger wissenschaftlicher Austausch und intensive Kooperation stattgefunden.
Abschlussbericht für den Projektträger Jülich, Projekt WISDOM II, 10/2010 – 02/2014
56
1.6 Zitierte Literatur
Berg, H. (2001). Pesticide use in rice and rice–fish farms in the Mekong Delta, Vietnam. Crop
protection 20, pp. 897–905. Crumlish, M., Dung, T. T., Turnbull, J. F., Ngoc & Ferguson, H. (2002). Identification of
Edwardsiella ictaluri from diseased freshwater catfish Pangasius hypopfthalmus (Sauvage) cultured in Mekong delta, Vietnam, Journal of Fish Diseases, 25, pp. 733-736.
Dung, N.H., Dung, T.T.(2003). Economic and health concequences of pesticide use in paddy
production in the Mekong Delta, Vietnam. Economy and environment case studies in Vietnam. Economy and environment program for Southeast Asia.
Khoi, L.N.D. (2011). Quality management in the Pangasius export supply chain in Vietnam.
The case of small-scale Pangasius farming in the Mekong River Delta. University of Groningen, Groningen, The Netherlands.
Mekong River Committee Secretariat (MRCS) (2007). Environmental health concerns related
to agro-chemical use in the Mekong Delta. Environmet training case studies. Margni,m., Rossier D., Crettaz P., Jolliet O., (2001). Life cycle impact assessment of
pesticides on human health and ecosystems. Agriculture, Ecosystems and Environment 93, pp. 379-392.
Phan, L.T., Bui, T.M., Thuy, N. T.T., Gooley, G. F., Ingram, B. A., Hao, N. V. N., Phuong, N.
T. , De Silva, S. S. (2009). Current status of farming practices of striped catfish, Pangasianodon hypophthalmus in the Mekong Delta, Vietnam. Aquaculture, 296, pp. 227-236.
Pham Xuan Nam, Be Viet Dang, Hainsworth, G. B. (2000). Rural development in Viet Nam:
the search for sustainable livelihoods. P. Boothroyd and Pham Xuan Nam (eds.) Socioeconomic renovation in Viet Nam: the origin, evolution, and impact of Doi Moi. Ottawa, ON, Canada, IDRC, pp. 1-49.
Pingali P. L., Xuan, V. T. (1992). Vietnam: Decollectivization and Rice Productivity Growth.
Economic Development and Cultural Change, Vol. 40, pp.697-718 Sebesvari, Z., Huong, L.T.T., Toan, P.V., Arnold, U., Renaud, F.G. (2012). Agriculture and
Water Quality in the Mekong Delta, Vietnam. In: Renaud, F.; Kuenzer, C. (Eds.): The Mekong Delta System - Interdisciplinary Analyses of a River Delta. Springer.
Svobodová, Z., Lloyd, R., Máchová, J., Vykusová, B. (1993).Water quality and fish health.
EIFAC Technical Paper, EIFAC/T54, Rome, FAO Toan, P.V., Sebesvari, Z., Bläsing, M., Rosendahl, I., Renaud, F.G. (2013): Pesticides in the
Mekong Delta Vietnam – application practices and residues in sediment, surface and drinking water. Science of the Total Environment 452-453:28-39.Toan (2013)
World Bank (Hrsg.) (2006). Vietnam Environment Monitor 2006 - Water Quality in Vietnam
with a focus on the Cau, Nhue-Day and Dong Nai River Basins. .
Abschlussbericht für den Projektträger Jülich, Projekt WISDOM II, 10/2010 – 02/2014
57
Eingehende Darstellung des Projektes 2
2.1 Verwendung der Zuwendung und erzielte Ergebnisse
The following paragraphs lay out the most important scientific results of the activities in Task 4210 “Pesticides, nutrients, antibiotics and heavy metals” and report how the resources have been used for the research. The results are presented in three main sections: 1) Risk assessment for various drinking water sources focusing on nutrients, metal (loid)s and microbial pollution based on the work of Mr Gert-Jan Wilbers, 2) Risk assessment for various drinking water sources focusing on pesticides and antibiotics based on the work of Ms Nguyen Dang Chau and 3) Assessment of the impact of various improved practices in rice production (e.g. Good Agricultural Practices, GAP) on water quality based on the work of Ms La Thi Nga.
Health-related risks associated with water sources used for drinking and 2.1.1domestic services in the rural areas of the Mekong Delta, Vietnam – nutrients, heavy metals and microbial pollution
In the rural areas of the Vietnamese Mekong Delta (MD), many people lack access to safe water sources (like piped-water and bottled water) and therefore rely on naturally available water sources such as surface-, ground- and rainwater. Piped-water supply stations are widely developed but less than 10% of rural households actually use this water source. The exposure of inhabitants to untreated natural water sources via ingestion or dermal contact could lead to severe health-related concerns. For the Mekong Delta, Kotsila (2012) reported for example the occurrence of typical water-borne diseases like diarrhoea, cholera, typhoid fever in the rural communities of the MD. A systematic review by Gundry et al. (2004), showed a clear relationship between cases of cholera and microbial water quality at the point-of-use in households in various countries as measured by faecal indicator bacteria although there was no clear relationship between water quality and the occurrence of diarrhoea. A study from the World Health Organisation found that 8.5% of all deaths in Southeast Asia are caused by diarrhoea while the world-wide percentage is 4% (WHO, 2013). Contaminated water supplies could also cause diseases like cancer and skin lesions (e.g. as a result from arsenic pollution). When a large proportion of inhabitants are suffering from water-related diseases, this has a social as well as an economic impact on the region. In this context, the prevalence of water-related diseases might partially be linked to the poverty rate present in the MD. Moreover, diseases cause discomfort and stress to entire families and thus affect the quality of life in general. There is therefore a need to assess the risks associated with water sources used for drinking and domestic purposes in the MD.
2.1.1.1 Hypotheses and objectives of this study
Risks associated with water sources used for drinking and domestic services in the Mekong Delta are dependent on the i) the quality (pollution status) of water sources, ii) the exposure of people to water sources, and iii) people’s own perception regarding these sources and applied actions (treatment). For the study design we used the following assumptions as point of departure: Surface water is commonly available for inhabitants in the Mekong Delta. However, this water source is expected to be severely contaminated due to pollution from intensive agricultural activities and/or industrial and urban discharges while salinity intrusion could be an additional concern in coastal regions. Groundwater availability is not expected to be problematic in the Mekong Delta but is most likely contaminated with heavy metal(loid)s like arsenic as is the case in many other regions in Southeast Asia. In coastal areas, salinity intrusion of groundwater bodies may be problematic with respect to drinking and irrigation. Rainwater has most

Abschlussbericht für den Projektträger Jülich, Projekt WISDOM II, 10/2010 – 02/2014
58
probably good quality which can be used for drinking within the entire Mekong Delta. Its availability is however problematic in the dry season. In rural areas, the access to piped-water supplies is low and is not in a sufficient quantity to fulfil the water needs of rural communities. On the other hand, the quality is most probably good compared to untreated sources since supply stations use purification techniques prior to supply. Bottled water is the best expected drinking water source in the Mekong Delta in terms of quality, although the access to it is problematic for poor rural households due to high costs. Most likely, people do not perceive each water source equally regarding quality which results in different usage, handling, storage and treatment practices. All these aspects may most likely influence health-risks associated with water sources. Nevertheless, the highest health-related risks associated with water sources are expected for surface water and groundwater while rainwater, piped-water and bottled water are expected to be the most clean and safe water sources for the inhabitants of the MD. The goal of this study was: i) to inform decision makers about the specific water quality and/or water perception problems for each water source used by rural communities in the MD: ii) to identify (potential) health related risks associated for all used water sources and iii) to develop policy advice to assist decision makers in securing safe, sufficient, clean and sustainable water supplies for present and future generations. In order to test the above hypotheses and to reach the goal of this study, the following objectives were formulated:
1. identify water sources and their importance for rural communities with respect to drinking and domestic services;
2. investigate the quality of water sources used for drinking and domestic services for salinity, nutrients, heavy metal(loid)s and microbial pollution and to assess the main causes of pollution;
3. spatially visualize ‘hot-spot’ areas of pollution and to identify regions where water is (not) safe for daily usage;
4. to assess people’s perception regarding the quality of different water sources, costs and efforts of collection and whether the water sources’ quantity is sufficient for daily use;
5. to carry out a comparative risk assessment based on water quality and water quality perceptions to identify water sources with the highest and lowest health-related risks;
6. to provide policy-related advice aiming to reduce health-related risks associated with the use/consumption of water sources in the Mekong Delta.
2.1.1.2 Study sites
Study sites were selected based on land-use characteristics and soil types which were expected to influence water quality strongly. The identification of representative land-use and soil type systems were performed by i) digital maps like a land-cover classification map of 2012 for the MD (Huth et al., 2012) and ii) interviews with local and provincial governmental institutions (DONRE). The selection of locations for water sampling in the study sites were performed in close collaboration with governmental institutes like the Centre for Natural Resources and Environment (DONRE) and district/commune governmental organizations selected in Can Tho, Hau Giang and Soc Trang provinces. These organizations showed potentially interesting water sampling locations and provided additional information regarding water quality and agricultural activities and demographical data of the region. To support the work, the DONRE’s of the three selected provinces arranged the required research permissions in order to carry out the field work in the study sites (water sampling and household interviews). Selected study areas are shown in Figure 1.

Abschlussbericht für den Projektträger Jülich, Projekt WISDOM II, 10/2010 – 02/2014
59
Figure 1 – Overview of the selected study sites (Can Tho, Hau Giang and Soc Trang provinces) in the MD indicated by dark grey color. Source: Gert-Jan Wilbers 2013 Land use in the MD A majority of the surface area of the MD is used for agricultural production with nearly 50% covering rice (GSO, 2012). Also fruits are intensively cultivated such as mango, banana, pomelo and many others. Upland crops such as lettuce, sugar cane, maize, sweet potatoes are also present although cultivated in lower quantities compared to rice and fruits. Pig farming is dominating the livestock sector and accounts for more than 70% of total meat production in Vietnam (Fisher and Gordon, 2008). Other relevant livestock production includes poultry and cows. Duck farms are also widely present in and around canals, partially to control snail plagues but also for its meat and eggs. Freshwater aquaculture sector has significantly grown in the last years due to export possibilities and is present in almost all inland provinces of the Mekong Delta with catfish (Pangasius) being the most popular species in culture (Sebesvari et al., 2012). In coastal regions, shrimp cultivation is the most dominant form of land-use although also rice and upland crops are cultivated in the wet season. Beside agricultural activities, the MD also has main industrial zones and urbanized agglomerations. Industries in the Mekong Delta mostly focus on food processing, the production of inputs (such as feed) needed for agriculture and aquaculture and related industries for equipment and machinery. Also textile and building material production is present (Garschagen et al., 2012). The largest industrial/urbanized agglomeration of the MD is Can Tho City. Soil types in the MD Based on soil types, the MD can be classified in four main categories (Guong and Hoa, 2012): i) Alluvial soils occur along main rivers. These are the most productive soils for rice, fruit orchards and upland crops. ii) Acid sulphate soils occupy about 40% of the total agricultural area in the MD. The acid conditions of these soils causes a leaching of toxic metals to surface water which negatively affect agricultural production, fish farming and the use of surface water for drinking. iii) Saline soils occur in coastal regions. Although nutrient levels are high, high salinity levels limit plant growth. iv) Degraded soils mostly occur in coastal regions in the form of sandy ridges and sand bars. Nutrient concentrations and microbial activities in these soils are generally low although rice and upland crops are cultivated on these soils.

Abschlussbericht für den Projektträger Jülich, Projekt WISDOM II, 10/2010 – 02/2014
60
2.1.1.3 Selected parameters, sampling and analytical procedures
One essential part of the risk assessment was to investigate the pollution status of water sources used for drinking and domestic purposes. Analysed parameter The assessed water quality parameters are listed in Table 1. Table 1- Selected water quality parameters analyzed in drinking/domestic water sources. Source: Gert-Jan Wilbers 2013
The rational for the selection of the analysed parameter was: Saline water is not suitable for drinking due to unfavorable taste as well as for other functions like irrigation of crops. However, saline water does not directly lead to health-related risk when consumed by humans. From the nutrients, NO2 and NO3 have defined health-related drinking water guidelines set by the WHO (2011). The other analysed nutrients do not pose direct risks to human health but are included in this study to investigate and assess the presence and sources of nutrient contamination in water in the MD. Except for Mg, all selected metals have defined drinking water quality guidelines values since elevated concentrations in water may cause severe health-related concerns (WHO, 2011). To describe microbial water quality, the concentration of E. coli was determined which is widely accepted as indicator bacteria and included in many drinking water standards. In addition, total coliform bacteria counts were analyzed since these bacteria could also indicate the presence of pathogens and are included in drinking water standards set by WHO (2011). Besides water quality parameters for salinity, nutrients, metal(loid)s and microbial indicator bacteria, some general parameters were analyzed as well (Table 1). On the one hand, these parameters serve as control parameters to assess whether observed nutrient, salt and metal concentrations are reliable (i.e. comparison of TDS and EC values with salt and metal concentrations). On the other hand, general parameters can be used to assess the sources and reasons of pollution (i.e. relationship between pH and turbidity with metal concentrations). Sampling and analytical procedures All water samples were collected from November 2011 to October 2012. A total of 248 surface water, 123 groundwater, 78 stored household harvested rainwater, and 41 piped-water samples were collected. In addition to these samples, 20 household stored surface water, 20 household stored groundwater and 5 direct, un-stored rainwater samples were collected to assess differences between microbial contamination of raw water sources and water quality after storage. The household stored water samples were collected in areas close to sampling locations of untreated water sources in order to prevent spatial differences.
Abschlussbericht für den Projektträger Jülich, Projekt WISDOM II, 10/2010 – 02/2014
61
Prior to sampling the household stored water, the house owners were asked which water source they used in their storage basin. The responses of people were cross-checked in-situ (i.e. confirm the presence of a groundwater well when people indicated to use groundwater and the intake location at the canal when people indicated to drink surface water). All sampling locations were recorded with a GPS device (Garmin ETrex, Olathe, KS, USA). The direct rainwater samples were all collected in Can Tho City. Ten bottled water samples were also selected by buying sealed bottles from different brands in local shops near Can Tho City. Samples were analyzed in the laboratory for total dissolved solids (TDS), electrical conductivity (EC), chloride (Cl), pH, dissolved oxygen (O2) turbidity, chemical oxygen demand (COD), total organic carbon (TOC), for nutrients ammonium (NH4), Nitrate (NO3), Nitrite (NO2), ortho-phosphate (o-PO4), Total-N and sulphate (SO4), for metal(loid)s including aluminum (Al), total arsenic (As), barium (Ba), cadmium (Cd), chromium (Cr), copper (Cu), mercury (Hg), manganese (Mn), nickel (Ni), zinc (Zn), iron (Fe), magnesium (Mg) and lead (Pb) and for microbial indicators (E. coli and total coliforms). Unfiltered water was used for turbidity measurements by using a HACH Turbidimeter (Loveland, CO, USA) and EC, pH and O2 were measured by WTW Multi 340i instrument (Weilheim, Germany) in the laboratory. TDS was measured with WTW Profiline Cond 197i (Weilheim, Germany). For nutrients, Cl and COD, all samples were stored at 5 °C, pre-treated by syringe filters (0.45 µm, Minisart Satorius, Goettingen, Germany) and analyzed within 24 hours of collection. The NO3, NO2, o-PO4, NH4, Total-N, SO4, Cl and COD concentrations were measured by using Spectroquant® cell tests (Merck Millipore, Billerica, MA, USA) by applying the following ranges: NO3-N: 0.5 – 18.0 mg L-1; NO2-N: 0.002 – 1.00 mg L-1; PO4-P: 0.05 – 5.00 mg L-1; NH4-N: 0.20 – 8.00 mg L-1 and 0.5 – 16.0 mg L-1; Total N: 0.5 – 15.0 mg L-1; SO4: 50 – 500 mg L-1; Cl: 2.5 – 250 mg L-1; COD: 10 – 150 mg L-1. For samples with Cl concentrations > 250 mg L-1, NO3-N was measured by seawater proof cell tests of Spectroquant® cell tests range 0.2 – 17.0 mg L-1 while Total N was not analyzed for those samples. The other nutrient tests were not negatively affected by high Cl levels. Prior to SO4 analysis, the colorimetric sulphate test with test strips MQuantTM was applied to define the measurement range. Unfiltered water was used for TOC measurements by applying Low Range Test ‘N tubeTM (HACH, Loveland, CO, USA) with measurement range of 0.3 – 20.0 mg L-1. Samples with Cl > 500 mg L-1 were excluded for TOC analysis. Acidified samples for metal and Na analysis were stored at 5°C and analyzed within six months by inductively coupled plasma atomic emission spectroscopy (Thermo iCAP 6000, Thermo Scientific, FL, USA). Samples for microbial analysis were treated within 8 hours after sampling under sterile conditions by plating 1 mL of sample water on 3MTM petrifilmTM coliforms count plates (3M, St. Paul, MN, USA) in duplicates. E. coli and other coliform colonies were counted 24±4 hours after incubation at 37 ºC.
2.1.1.4 Results
The main results of the study are presented in the following sequence i) exposure to polluted water (drinking and domestic water sources), ii) harvested rainwater quality assessment, iii) surface water quality assessment and spatial visualization; iv) ground water quality assessment and spatial visualization, v) piped-water quality assessment, vi) comparative risk assessment associated with water sources used by rural communities.
Exposure to polluted water 2.1.1.4.1
To assess the potential health risk associated with drinking water consumption the actual use of different water sources and perceptions of rural communities towards available water sources were investigated. A total of 542 household interviews were conducted at the study sites with a predefined questionnaire, which mainly focused on drinking water (Figure 2).

Abschlussbericht für den Projektträger Jülich, Projekt WISDOM II, 10/2010 – 02/2014
62
Figure 2 – Structure of the questionnaire conducted at rural households in Can Tho, Hau Giang and Soc Trang Provinces of the MD to assess the water sources used for drinking and perceptions towards the water sources (n=542). Source: Gert-Jan Wilbers 2014 The intention of the questionnaire was: i) to assess the sources of water used for drinking and to define whether the mentioned sources function as main or additional drinking water supply for the household; ii) to investigate the perceptions and handling practices with respect to different drinking water sources; iii) to assess potential differences in the use of drinking water sources between seasons and iv) to assess the kind and rate of water treatments applied on drinking water sources prior to consumption. These aspects are all relevant for the risks associated with drinking water sources since they influence the exposure to contaminated drinking water. The responses of people with respect to used drinking water sources were cross-checked on site. In addition, the number of family members of interviewed households was determined to further assess whether the indicated drinking water volumes and storage capacity were sufficient for the entire household. Households were selected randomly in the study sites but were geographically spread in order to cover the three provinces. Besides the above mentioned questionnaire, household were also asked to list the water sources used for washing, cleaning, cooking, since this could be another pathway of exposure to contaminated water which may cause health concerns. Drinking water sources used by rural communities Five types of drinking water sources were identified which include i) surface water from rivers or canals, ii) groundwater from own dug wells, iii) harvested rainwater, iv) piped-water from supply stations and v) bottled water. The usage of these sources for drinking fluctuates seasonally (Figure 3).
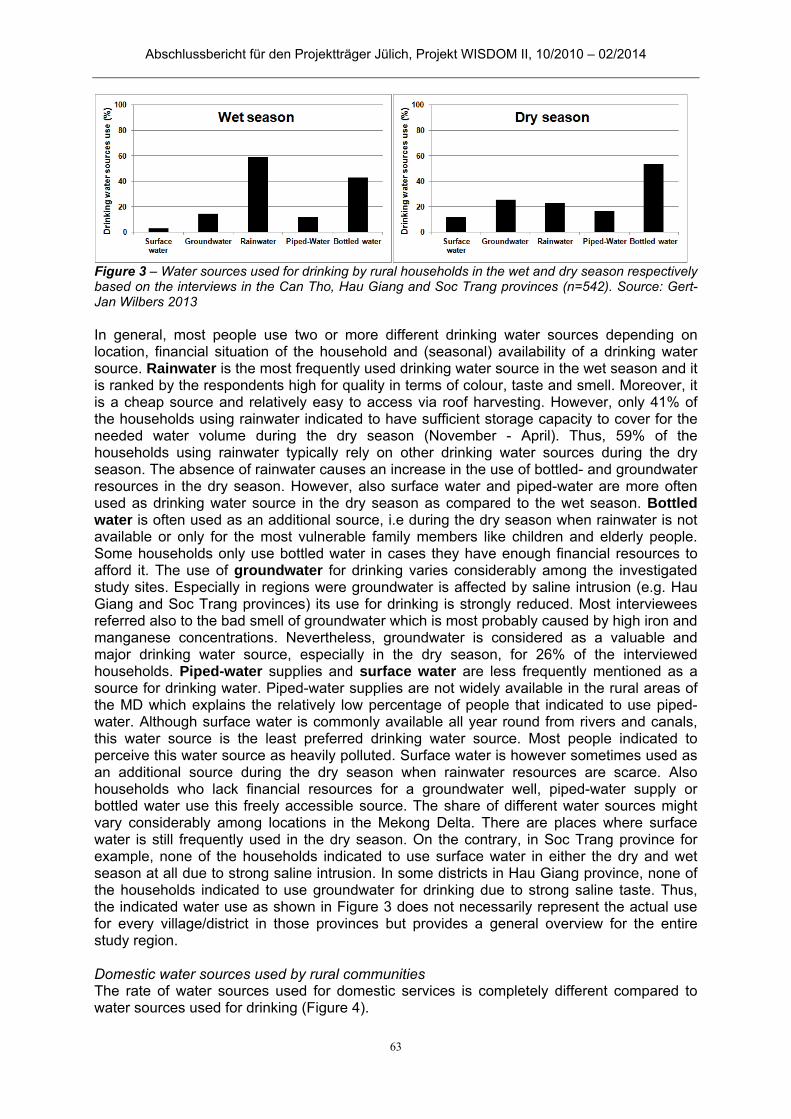
Abschlussbericht für den Projektträger Jülich, Projekt WISDOM II, 10/2010 – 02/2014
63
Figure 3 – Water sources used for drinking by rural households in the wet and dry season respectively based on the interviews in the Can Tho, Hau Giang and Soc Trang provinces (n=542). Source: Gert-Jan Wilbers 2013 In general, most people use two or more different drinking water sources depending on location, financial situation of the household and (seasonal) availability of a drinking water source. Rainwater is the most frequently used drinking water source in the wet season and it is ranked by the respondents high for quality in terms of colour, taste and smell. Moreover, it is a cheap source and relatively easy to access via roof harvesting. However, only 41% of the households using rainwater indicated to have sufficient storage capacity to cover for the needed water volume during the dry season (November - April). Thus, 59% of the households using rainwater typically rely on other drinking water sources during the dry season. The absence of rainwater causes an increase in the use of bottled- and groundwater resources in the dry season. However, also surface water and piped-water are more often used as drinking water source in the dry season as compared to the wet season. Bottled water is often used as an additional source, i.e during the dry season when rainwater is not available or only for the most vulnerable family members like children and elderly people. Some households only use bottled water in cases they have enough financial resources to afford it. The use of groundwater for drinking varies considerably among the investigated study sites. Especially in regions were groundwater is affected by saline intrusion (e.g. Hau Giang and Soc Trang provinces) its use for drinking is strongly reduced. Most interviewees referred also to the bad smell of groundwater which is most probably caused by high iron and manganese concentrations. Nevertheless, groundwater is considered as a valuable and major drinking water source, especially in the dry season, for 26% of the interviewed households. Piped-water supplies and surface water are less frequently mentioned as a source for drinking water. Piped-water supplies are not widely available in the rural areas of the MD which explains the relatively low percentage of people that indicated to use piped-water. Although surface water is commonly available all year round from rivers and canals, this water source is the least preferred drinking water source. Most people indicated to perceive this water source as heavily polluted. Surface water is however sometimes used as an additional source during the dry season when rainwater resources are scarce. Also households who lack financial resources for a groundwater well, piped-water supply or bottled water use this freely accessible source. The share of different water sources might vary considerably among locations in the Mekong Delta. There are places where surface water is still frequently used in the dry season. On the contrary, in Soc Trang province for example, none of the households indicated to use surface water in either the dry and wet season at all due to strong saline intrusion. In some districts in Hau Giang province, none of the households indicated to use groundwater for drinking due to strong saline taste. Thus, the indicated water use as shown in Figure 3 does not necessarily represent the actual use for every village/district in those provinces but provides a general overview for the entire study region. Domestic water sources used by rural communities The rate of water sources used for domestic services is completely different compared to water sources used for drinking (Figure 4).
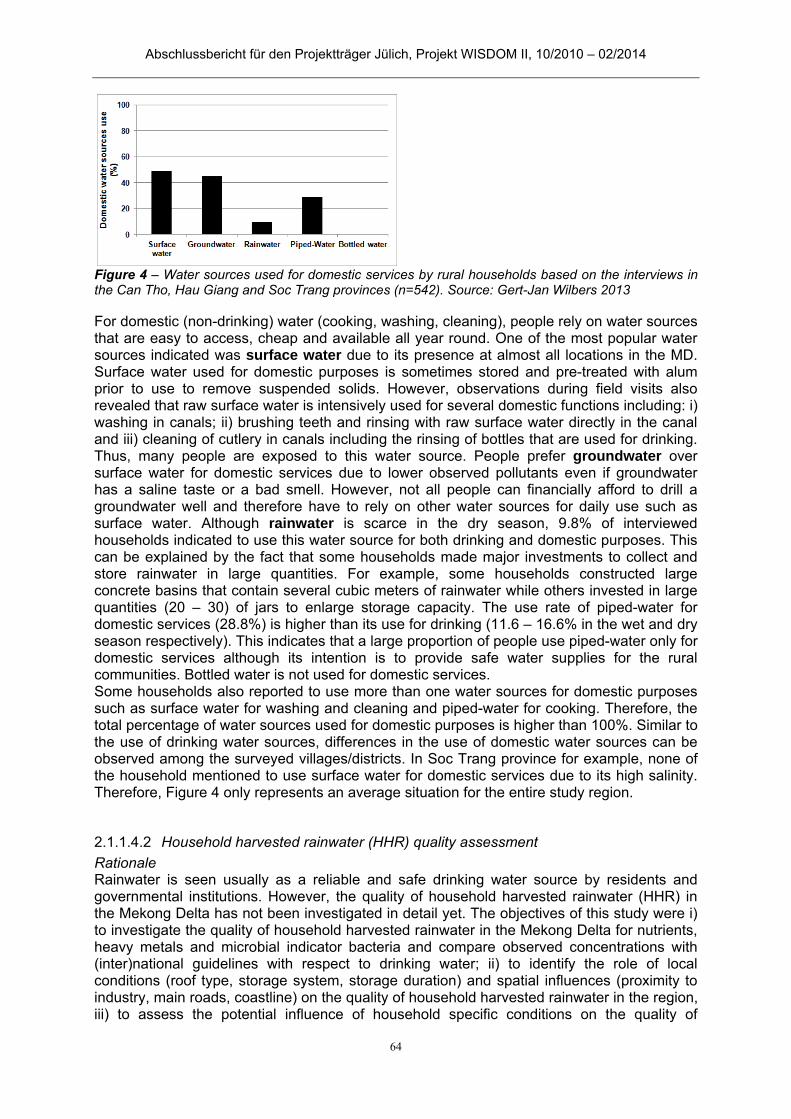
Abschlussbericht für den Projektträger Jülich, Projekt WISDOM II, 10/2010 – 02/2014
64
Figure 4 – Water sources used for domestic services by rural households based on the interviews in the Can Tho, Hau Giang and Soc Trang provinces (n=542). Source: Gert-Jan Wilbers 2013 For domestic (non-drinking) water (cooking, washing, cleaning), people rely on water sources that are easy to access, cheap and available all year round. One of the most popular water sources indicated was surface water due to its presence at almost all locations in the MD. Surface water used for domestic purposes is sometimes stored and pre-treated with alum prior to use to remove suspended solids. However, observations during field visits also revealed that raw surface water is intensively used for several domestic functions including: i) washing in canals; ii) brushing teeth and rinsing with raw surface water directly in the canal and iii) cleaning of cutlery in canals including the rinsing of bottles that are used for drinking. Thus, many people are exposed to this water source. People prefer groundwater over surface water for domestic services due to lower observed pollutants even if groundwater has a saline taste or a bad smell. However, not all people can financially afford to drill a groundwater well and therefore have to rely on other water sources for daily use such as surface water. Although rainwater is scarce in the dry season, 9.8% of interviewed households indicated to use this water source for both drinking and domestic purposes. This can be explained by the fact that some households made major investments to collect and store rainwater in large quantities. For example, some households constructed large concrete basins that contain several cubic meters of rainwater while others invested in large quantities (20 – 30) of jars to enlarge storage capacity. The use rate of piped-water for domestic services (28.8%) is higher than its use for drinking (11.6 – 16.6% in the wet and dry season respectively). This indicates that a large proportion of people use piped-water only for domestic services although its intention is to provide safe water supplies for the rural communities. Bottled water is not used for domestic services. Some households also reported to use more than one water sources for domestic purposes such as surface water for washing and cleaning and piped-water for cooking. Therefore, the total percentage of water sources used for domestic purposes is higher than 100%. Similar to the use of drinking water sources, differences in the use of domestic water sources can be observed among the surveyed villages/districts. In Soc Trang province for example, none of the household mentioned to use surface water for domestic services due to its high salinity. Therefore, Figure 4 only represents an average situation for the entire study region.
Household harvested rainwater (HHR) quality assessment 2.1.1.4.2
Rationale Rainwater is seen usually as a reliable and safe drinking water source by residents and governmental institutions. However, the quality of household harvested rainwater (HHR) in the Mekong Delta has not been investigated in detail yet. The objectives of this study were i) to investigate the quality of household harvested rainwater in the Mekong Delta for nutrients, heavy metals and microbial indicator bacteria and compare observed concentrations with (inter)national guidelines with respect to drinking water; ii) to identify the role of local conditions (roof type, storage system, storage duration) and spatial influences (proximity to industry, main roads, coastline) on the quality of household harvested rainwater in the region, iii) to assess the potential influence of household specific conditions on the quality of

Abschlussbericht für den Projektträger Jülich, Projekt WISDOM II, 10/2010 – 02/2014
65
household stored rainwater and iv) to provide recommendations aiming to improve the quality of harvested rainwater as a safe drinking water resource. Local specific conditions were assessed through household interviews. The interviews were structured with open questions including the type of roof that was used for rainwater harvesting, applied storage system and duration, the application of treatments before consumption, the separation of first flush rainwater and their judgment about the quality of harvested rainwater for drinking. Interviewees were also asked to show how they collect rainwater from their storage basin to get insight into household specific aspects such as behavioral patterns. The distance from each selected measurement location to main roads, industrial zone and the coastline was calculated by applying spatial-join techniques in ArcGIS 10. All statistical tests were carried out with SPSS version 20.0. Harvested rainwater quality Recorded pH values in HHR varied between 4.3 and 8.2 although in 42% of the samples, pH was lower than 7.0 and in 19%, below 6.5. Turbidity exceeded the guidelines for 71% and 17% of the samples for Vietnamese and WHO drinking water standards, respectively. Nutrient concentrations were low and did not exceed any of the guidelines. Nevertheless, weak but significant relationships between o-PO4 and Mg and Zn were observed (Table 1). At most measurement locations, heavy metals were detected only at trace levels, while Pb, Fe and Zn occurred with median concentrations of 5.0, 13.2 and 83.8 µg L-1, respectively. In one sample, Ni (28.6 µg L-1) and Hg (1.7 µg L-1) exceeded the Vietnamese drinking water standards. Zn was found in high concentrations at many locations, although drinking water guidelines were not exceeded. Pb was detected in many samples and exceeded water quality standards for 17% of the samples. The earth metals Mg and Na were found with a median concentration of 148.0 and 124.6 µg L-1, respectively; however, these substances are relatively unproblematic with respect to human health. Microbial pollution, on the other hand, was detected in a large number of samples and exceeded guideline values in 35% and 92% of the samples for E. coli and total coliforms, respectively. Influence of local conditions From all investigated local and spatial conditions on the quality of HHR, ‘roof types’ had the strongest influence on the quality of harvested rainwater (Figure 5).

Abschlussbericht für den Projektträger Jülich, Projekt WISDOM II, 10/2010 – 02/2014
66
Figure 5 – Differences between Household Harvested Rainwater quality and roof types in the Mekong Delta. Roof types consist of (1) asbestos and concrete tiles, (2) thatch cover and (3) galvanized metal sheets. The bars show from bottom to top: minimum – 25 percentile – median – 75 percentile – maximum concentrations. The letters “a” and “b” above the bars indicate significantly different concentrations between the roof types at the p<0.05 level; a/b indicates no significant difference with any other roof type. The dashed lines for turbidity indicate the Vietnamese (2 FTU) and WHO (5 FTU) drinking water guidelines. Source: Gert-Jan Wilbers 2013 Microbial and lead pollution Neither E. coli nor total coliform amounts correlated with any of the studied roof types and or other spatial / local specific parameters. Most probably, the extent of microbial pollution is influenced by a combination of several other household specific aspects including storage cover type, storage place (inside or outside, distance to sanitary facilities, etc.), differences in fecal deposition on roofs due to presence or absence of overhanging vegetation, human handling aspects and lack of hygiene perspectives, as well as the frequency of cleaning of storage basins, first flush separation and the rate of water use. Another possible reason for the observed large variations is the mixing of water from different sources since the same vessels are used to store surface- and groundwater in the dry season. Thus, at the beginning of the rainy season, when residents start to harvest rain water, the vessels might still contain high loads of microbes and metals as a residue from the former source of water. There were no significant correlation between Pb concentrations and local and spatial conditions. Plumbing systems on gutters and roofs, which are a frequent source for contaminants in drinking water, could be a major source of Pb contamination in harvested rainwater. Furthermore, the burning of household waste is a common practice in the MD; this could result in background Pb concentrations in air, which could be flushed out by rainfall.
Abschlussbericht für den Projektträger Jülich, Projekt WISDOM II, 10/2010 – 02/2014
67
Surface water quality assessment and spatial visualization 2.1.1.4.3
Rationale To date, most studies on surface water quality in the MD focus on main waterways like the branches of the Mekong River and on assessments of the effects of acid sulphate soils on surface water quality. Smaller rivers and lower order canals are generally not considered for water quality monitoring. However, the total length of small man-made canals in the MD is more than 50,000 km, which is a factor 10 higher than the entire length of the Mekong River. Both the hydrological regime and their use by local population differ from the main waterways with a much more intensive use for various domestic purposes. It cannot a priori be assumed that the quality of these secondary canals is similar to that of the main waterways. It is therefore important to assess the water quality and its spatio-temporal variability in these lower order canals and to determine the potential health-related risks associated with their use. To provide insight into the status of water quality and describe the main sources of pollution in these canals, this study part had following objectives: 1) analyze the water quality in lower order canals in representative areas and compare the results with Vietnamese guidelines for drinking and domestic use; 2) compare water quality in lower order canals between inland and coastal regions and water quality attributes from main waterways; 3) identify the factors which explain the spatial variability in surface water quality in lower order canals; 4) assess the effects of tidal regime and seasonality on water quality; 5) spatially visualize water quality of these waterways to identify hot-spot areas of pollution. Water quality in lower order canals Surface water in secondary canals of the MD shows extremely low dissolved oxygen (DO) concentrations (median 1.7 – 6.0 mg L-1). However, COD concentrations were in the range of 10 – 88 mg L-1. Significant differences in O2 and COD concentrations were found between inland and coastal regions. In general, higher O2 were found in the coastal region. The highest concentrations of salts (Na and Cl) are in the secondary canals of the coastal areas exceeding drinking water guidelines for almost all samples (median 205 and 2757 mg L-1 for Na and Cl respectively). In contrast, guideline values were not exceeded in secondary canals in inland regions and in river water (<200 mg L-1 for Na and <250 mg L-1 for Cl). In the MD the nutrient concentrations were relatively low compared with drinking water guidelines especially for NO2 and NO3 (median 0.05 mg L-1 for NO2 and 0.6 mg L-1 for NO3). In contrast, higher NH4 (median 0.8 mg L-1) and total-N concentrations (median 2.7 mg L-1) were detected. For some metals, guideline exceedings were observed including for As (max. 44.1 µg L-1), Cr (max. 84. 7 µg L-1), Hg (max. 45.5 µg L-1), Mn (max. 1660 µg L-1), Al (max. 14.5 mg L-1) and Fe (max. 17.0 mg L-1). Most metal concentrations in coastal regions were higher compared to inland regions. The cell counts of E. coli as well as other coliforms were high and exceeded thresholds for drinking water for almost all samples (E. coli: 0 – 87 272 CFU 100 mL-1; total coliforms: 8 163 – 2 569 090 CFU 100 mL-1). In general, for most investigated pollutants the concentrations were higher in lower order canals compared to main waterways. A Principal Component Analysis revealed that 85% of the total variance of surface water contamination in lower order canals for the selected parameters is caused by four main components: i) urbanization related pollution¸ii) soil leaching, iii) mixing with water intruding due to the tidal regime and iv) aquaculture emissions. Spatial visualization Regression models, based on the relationship between water quality with land-use and distance to main rivers, were developed to predict and visualize surface water quality for some selected parameter such as DO, o-PO4, NH4, one metal (Mn) and total coliforms. The selected parameters were chosen because of their strong relationship with either land-use and/or river distance. The results are presented in Figure 6. The lowest DO concentrations (Figure 6b) are visible at the furthest locations from the Hau River. This pattern could be explained by the continuous accumulation of organic pollutants at locations further away from main rivers that reduce the available oxygen in surface water as a result of biological degradation. In some cases, this leads to almost anoxic conditions. However, low DO concentrations are also related to urbanization. The highest concentrations
Abschlussbericht für den Projektträger Jülich, Projekt WISDOM II, 10/2010 – 02/2014
68
of o-PO4 are located close to fish farms near the Hau River (indicated with black arrows) with observed concentrations of 1.5 mg L-1 (Figure 6c). Lowest o-PO4 concentrations are visible at locations far away from the Hau River. The pattern of lower o-PO4 concentrations at these locations could be explained by elevated organic pollution at locations further away from the rivers that potentially adsorbs the available o-PO4 in water. The lowest NH4 concentrations (Figure 6d) are in areas that contain high densities of orchards (<0.50 mg L-1). However, the majority of the map shows concentrations above 0.50 mg L-1 which are areas generally dominated by rice fields. The observed peaks with concentrations up to >2 mg L-1 are visible near urbanized areas such as Can Tho City and fish farms which are visible as small orange to red dots on the map. This finding is particularly relevant for water supply companies for selection of water sourcing sites since NH4 concentrations >0.50 mg L-1 could severely affect the disinfection efficiency by chemical treatment such as chlorination. The concentrations of Mn (Figure 6e) are strongly related to the distance to main rivers with concentration of concerns in areas further away from the river. These high concentrations are in line with PCA analysis which also indicated an accumulation of this metal in surface water where mixing with fresh water is reduced. The concentrations of total coliforms (Figure 6e) are, similar to that of NH4, being lowest in orchard dominated areas although drinking water guideline values are exceeded at all locations. Nevertheless, large differences are visible in total coliform concentrations with the highest observed values within urbanized areas as well as along main roads that also harbour high densities of houses. These findings are especially relevant to policy makers to detect hot-spot areas of pollution and to develop water management strategies. The presented maps could also be of interest for water supply and ice-producing companies to define treatment systems and optimal locations for water extraction. The presented maps show the surface water quality in lower order canals during outgoing tide, since all water samples were collected during low tide. However, during incoming tide the water from smaller canals is refreshed by water from main rivers which is generally of better quality compared to the lower order canals. Thus, surface water quality may be better at high tide compared to low tide. Seasonal effects of surface water quality were also assessed. However, significant differences in water quality between the dry and wet season were not observed. This is most probably caused by counteracting effects of low dilution of point source pollution in the dry season versus rainwater run-off from agricultural and urbanized areas during the wet season which are both main sources of pollution in the MD.
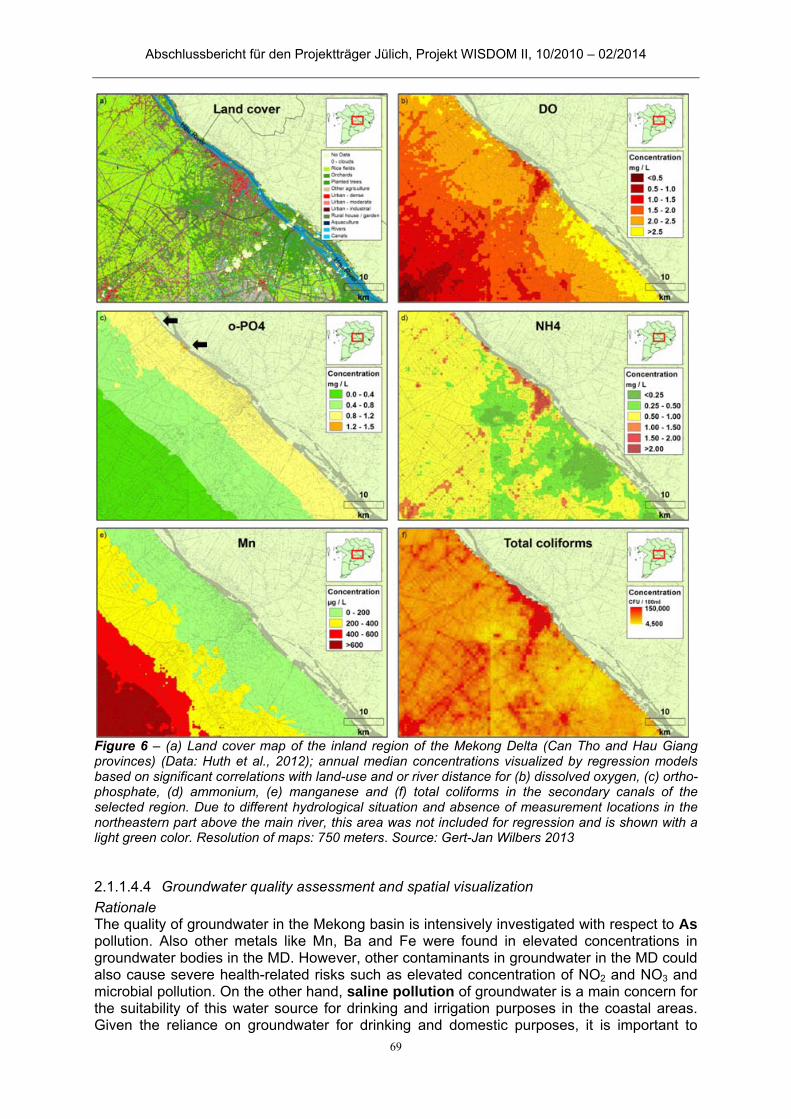
Abschlussbericht für den Projektträger Jülich, Projekt WISDOM II, 10/2010 – 02/2014
69
Figure 6 – (a) Land cover map of the inland region of the Mekong Delta (Can Tho and Hau Giang provinces) (Data: Huth et al., 2012); annual median concentrations visualized by regression models based on significant correlations with land-use and or river distance for (b) dissolved oxygen, (c) ortho-phosphate, (d) ammonium, (e) manganese and (f) total coliforms in the secondary canals of the selected region. Due to different hydrological situation and absence of measurement locations in the northeastern part above the main river, this area was not included for regression and is shown with a light green color. Resolution of maps: 750 meters. Source: Gert-Jan Wilbers 2013
Groundwater quality assessment and spatial visualization 2.1.1.4.4
Rationale The quality of groundwater in the Mekong basin is intensively investigated with respect to As pollution. Also other metals like Mn, Ba and Fe were found in elevated concentrations in groundwater bodies in the MD. However, other contaminants in groundwater in the MD could also cause severe health-related risks such as elevated concentration of NO2 and NO3 and microbial pollution. On the other hand, saline pollution of groundwater is a main concern for the suitability of this water source for drinking and irrigation purposes in the coastal areas. Given the reliance on groundwater for drinking and domestic purposes, it is important to
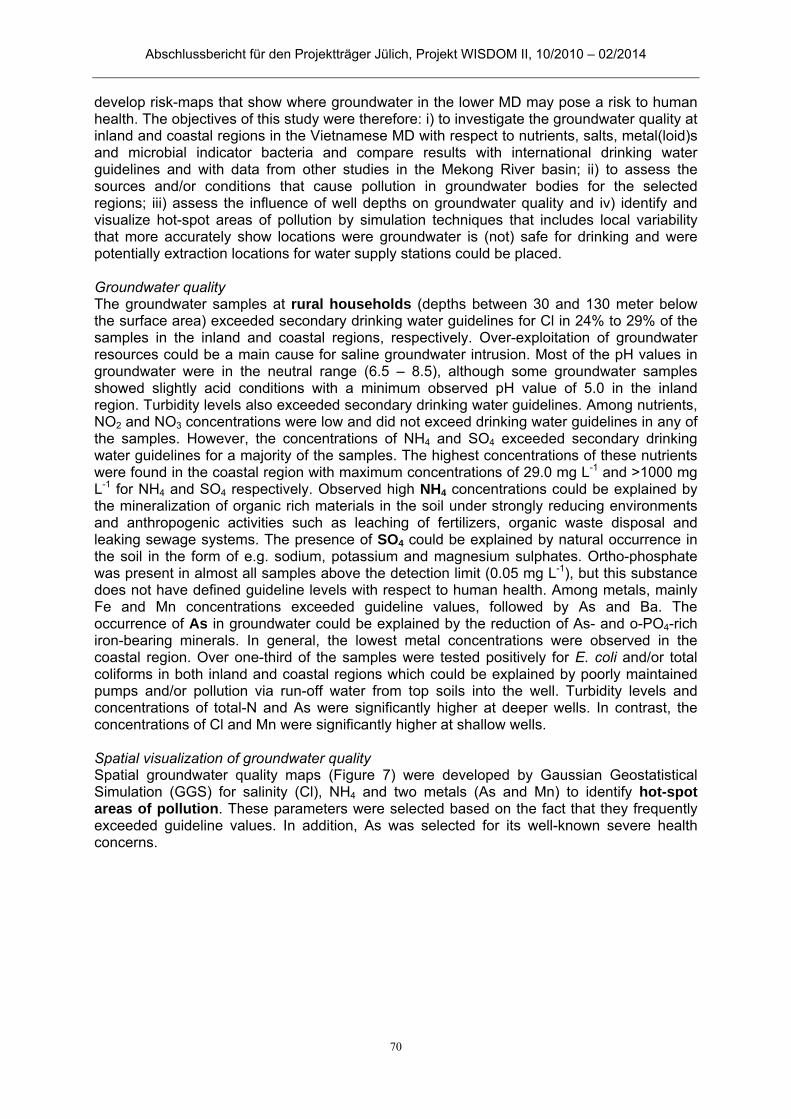
Abschlussbericht für den Projektträger Jülich, Projekt WISDOM II, 10/2010 – 02/2014
70
develop risk-maps that show where groundwater in the lower MD may pose a risk to human health. The objectives of this study were therefore: i) to investigate the groundwater quality at inland and coastal regions in the Vietnamese MD with respect to nutrients, salts, metal(loid)s and microbial indicator bacteria and compare results with international drinking water guidelines and with data from other studies in the Mekong River basin; ii) to assess the sources and/or conditions that cause pollution in groundwater bodies for the selected regions; iii) assess the influence of well depths on groundwater quality and iv) identify and visualize hot-spot areas of pollution by simulation techniques that includes local variability that more accurately show locations were groundwater is (not) safe for drinking and were potentially extraction locations for water supply stations could be placed. Groundwater quality The groundwater samples at rural households (depths between 30 and 130 meter below the surface area) exceeded secondary drinking water guidelines for Cl in 24% to 29% of the samples in the inland and coastal regions, respectively. Over-exploitation of groundwater resources could be a main cause for saline groundwater intrusion. Most of the pH values in groundwater were in the neutral range (6.5 – 8.5), although some groundwater samples showed slightly acid conditions with a minimum observed pH value of 5.0 in the inland region. Turbidity levels also exceeded secondary drinking water guidelines. Among nutrients, NO2 and NO3 concentrations were low and did not exceed drinking water guidelines in any of the samples. However, the concentrations of NH4 and SO4 exceeded secondary drinking water guidelines for a majority of the samples. The highest concentrations of these nutrients were found in the coastal region with maximum concentrations of 29.0 mg L-1 and >1000 mg L-1 for NH4 and SO4 respectively. Observed high NH4 concentrations could be explained by the mineralization of organic rich materials in the soil under strongly reducing environments and anthropogenic activities such as leaching of fertilizers, organic waste disposal and leaking sewage systems. The presence of SO4 could be explained by natural occurrence in the soil in the form of e.g. sodium, potassium and magnesium sulphates. Ortho-phosphate was present in almost all samples above the detection limit (0.05 mg L-1), but this substance does not have defined guideline levels with respect to human health. Among metals, mainly Fe and Mn concentrations exceeded guideline values, followed by As and Ba. The occurrence of As in groundwater could be explained by the reduction of As- and o-PO4-rich iron-bearing minerals. In general, the lowest metal concentrations were observed in the coastal region. Over one-third of the samples were tested positively for E. coli and/or total coliforms in both inland and coastal regions which could be explained by poorly maintained pumps and/or pollution via run-off water from top soils into the well. Turbidity levels and concentrations of total-N and As were significantly higher at deeper wells. In contrast, the concentrations of Cl and Mn were significantly higher at shallow wells. Spatial visualization of groundwater quality Spatial groundwater quality maps (Figure 7) were developed by Gaussian Geostatistical Simulation (GGS) for salinity (Cl), NH4 and two metals (As and Mn) to identify hot-spot areas of pollution. These parameters were selected based on the fact that they frequently exceeded guideline values. In addition, As was selected for its well-known severe health concerns.

Abschlussbericht für den Projektträger Jülich, Projekt WISDOM II, 10/2010 – 02/2014
71
Figure 7 – Simulated groundwater quality maps for 0.1 and 0.9 quantile concentrations to identify (potential) hot-spot areas of pollution for Cl, NH4, As and Mn using Gaussian Geostatistical Simulation. Potential hot-spot areas of pollution are distinguished when guidelines are exceeded (red-brown colors) for the 0.9 quantile maps but not for the 0.1 quantile maps. Hot-spot areas of pollution are identified when guideline exceedings are observed in both 0.1 and 0.9 quantile maps. Source: Gert-Jan Wilbers 2013 The output of these simulations are presented through groundwater quality maps for selected parameters for the calculated 0.1 and 0.9 quantile concentrations which represent a ‘good case’ and a ‘bad case’ scenario, respectively. Hot-spot areas of pollution were defined for areas that exceed drinking water guidelines for both the 0.1 and 0.9 quantile maps. Potential hot-spot areas are defined in areas that exceed WHO drinking water guidelines for the 0.9

Abschlussbericht für den Projektträger Jülich, Projekt WISDOM II, 10/2010 – 02/2014
72
quantile maps but not for the 0.1 quantile maps. Non hot-spot areas of pollution are defined as region where no guidelines were exceeded at the 0.9 quantile maps. Potential hot-spot areas of elevated Cl concentrations are predicted to occur near Can Tho City, Co Do district and at some locations close to the Hau River. However, the maps also show that in many locations groundwater does not have elevated Cl concentrations, even in the coastal region (Figure 7a2). NH4 concentrations of concern are predicted in almost all investigated sites although areas with lower NH4 concentrations are also found in the western part of the inland region. Nevertheless, guidelines could also be exceeded at those locations given the concentrations above 0.5 mg L-1 for the 0.9 quantile map (Figure 7b2). No obvious hot-spot areas of pollution are identified for As, as simulated concentrations are below 10 µg L-1 for the As 0.1 quantile map (Figure 7c1). However, based on the As 0.9 quantile map (Figure 7c2), several potential hot-spot areas in the inland region can be identified. Large differences in simulated Mn concentrations are visible between the 0.1 and 0.9 quantile maps for the inland region (Figure 7d1,2). Therefore, obvious hot-spot areas of Mn pollution cannot be identified. However, the maps show that Mn can potentially be found almost everywhere in the inland region at concentrations exceeding drinking water standards. In comparison, Mn concentrations in the coastal region are low and do not show any (potential) hot-spot area of pollution.
Piped-water quality assessment and related perceptions 2.1.1.4.5
Rationale In rural areas in Southeast Asia, such as the MD, access to and availability of safe drinking water supplies is still limited to date although water resources are abundant. Access to safe and clean water is a priority in the region and water supply facilities are considered as a main solution to this problem. However, studies on the quality of the water supplied by these stations and people’s perception towards piped-water supply stations are scarce to date. Water supply stations use either groundwater or surface water and apply various treatment techniques like sand and rock filtration, alum additive, chlorination and in some cases active coal. However, the quality of piped-water cannot a priori be assumed to be better than its original sources when treatments are not well applied or maintenance of supply stations is limited which could be, based on the literature, a main concern in the MD. Moreover, perceptions could severely affect the actual usage of piped-water supplies. The objectives of this study were therefore to: i) investigate the piped-water quality from different sources (surface water and groundwater) for general parameters, Cl, nutrients, metal(loid)s and microbial indicator bacteria and compare results with international drinking water guidelines; ii) to assess spatial differences in piped-water quality; iii) compare piped-water quality with the quality of untreated water sources to assess the efficiency of applied treatments and iv) to assess reasons for the low connection rate to piped-water supplies in rural areas of the MD. Piped-water quality Although piped-water is considered as a safe drinking water source, some water quality parameters were found to exceed the drinking water guidelines set by the World Health Organization. The quality of piped-water was also found to be dependent on the original source (groundwater or surface water). Significantly higher EC and pH levels were found in water from supply stations using groundwater. Guideline values for pH were exceeded for both supply systems. Turbidity levels were also found to exceed guideline values although no significant difference was observed between supply systems using different water sources. Cl exceeded water quality guidelines for 18% of the water supply stations with groundwater intake while supply stations with surface water intake did not exceed the guidelines. For nutrients, the concentrations of NO2 and NO3 in all samples were low when compared with guideline values. However, relatively high concentrations of NH4 were found for some supply stations with groundwater intake but there was no significant difference in median NH4 concentrations between the water supply systems with different intake sources. For metals,

Abschlussbericht für den Projektträger Jülich, Projekt WISDOM II, 10/2010 – 02/2014
73
the concentrations of As, Ba, Cd, Mg and Zn were significantly different between the two types of supply systems although guideline values were not exceeded for any of the samples. In general, most investigated piped-samples showed metal(loid) concentrations close to or below detection limit. However, Fe and Hg exceeded guideline values for 8% and 13% respectively of the samples from piped-water with groundwater intake. Microbial indicator bacteria were more commonly detected in piped-water samples indicating that drinking of this water can lead to severe health-related risks. No significant differences in microbial indicator bacteria cell counts were observed between the two types of supply stations. Water supply stations apply various treatment techniques before supplying the water to the local communities. Interviews with water supply managers at the selected stations revealed that water was generally treated by rock and sand filters in combination with disinfection (chlorine) while at one site active coal was used. Water supply companies using surface water indicated to additionally apply a chemical treatment step with alum to remove suspended particles. In general, the water treatments significantly remove pollutants from raw water sources except for Cl, Cu and Zn. Household perceptions towards piped-water Only 43% of potential household connections are actually used for drinking (Figure 8).
Figure 8 - Availability and connection rate to piped-water in the rural areas of the selected sites in the MD. Source: Gert-Jan Wilbers 2013 Costs were found to be the main reason for the low connection rate. Another reason for rejecting piped-water supplies is the preference for other water sources for domestic services and drinking. Some households indicated to have a groundwater well and/or harvesting rainwater for daily purposes including drinking and do therefore not require a connection to piped-water. Other households were found to invest in large storage basins for rainwater storage such as large tanks and do therefore not require piped-water. Preference for other potential water sources can therefore be considered as a major cause for the low connection rate as well. A third observed reason for rejecting piped-water supplies is the perceived poor quality of piped-water. Lastly, the quantity of supplied piped-water was also a concern.
2.1.1.5 Comparative risk assessment between water sources
Rationale In most rural areas in the Mekong Delta, people rely on stored water collected from naturally available water sources for drinking and/or treated piped- and bottled water. It was shown in the above chapters that surface water, groundwater and piped water is contaminated with various pollutants including pathogens and metals. However, a comparison of water quality and associated risks between all household drinking different water sources has not yet been carried out. To address this gap, the concentrations of E. coli and total coliforms, selected metals (As, Ba, Mn, Fe, Hg), nutrients (NO3, NO2, NH4) and salinity (Cl) were investigated in (stored) water sources used by rural communities in the MD for drinking. In addition, the
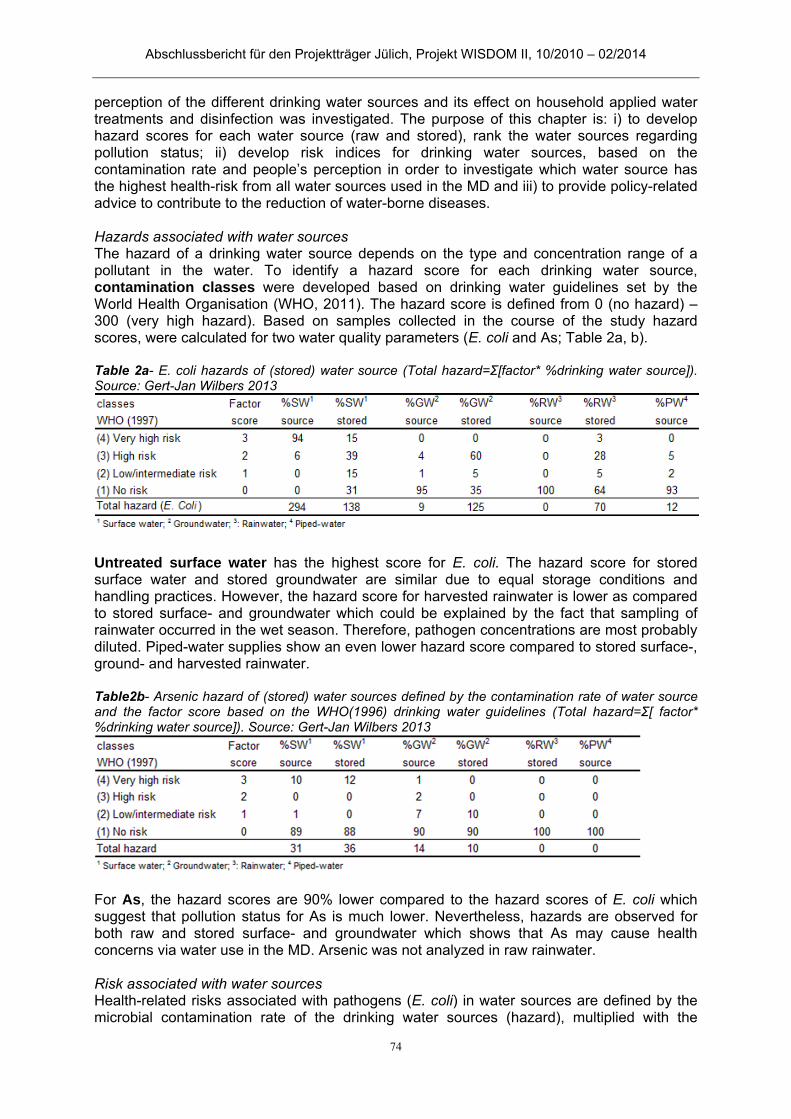
Abschlussbericht für den Projektträger Jülich, Projekt WISDOM II, 10/2010 – 02/2014
74
perception of the different drinking water sources and its effect on household applied water treatments and disinfection was investigated. The purpose of this chapter is: i) to develop hazard scores for each water source (raw and stored), rank the water sources regarding pollution status; ii) develop risk indices for drinking water sources, based on the contamination rate and people’s perception in order to investigate which water source has the highest health-risk from all water sources used in the MD and iii) to provide policy-related advice to contribute to the reduction of water-borne diseases. Hazards associated with water sources The hazard of a drinking water source depends on the type and concentration range of a pollutant in the water. To identify a hazard score for each drinking water source, contamination classes were developed based on drinking water guidelines set by the World Health Organisation (WHO, 2011). The hazard score is defined from 0 (no hazard) – 300 (very high hazard). Based on samples collected in the course of the study hazard scores, were calculated for two water quality parameters (E. coli and As; Table 2a, b). Table 2a- E. coli hazards of (stored) water source (Total hazard=Ʃ[factor* %drinking water source]). Source: Gert-Jan Wilbers 2013
Untreated surface water has the highest score for E. coli. The hazard score for stored surface water and stored groundwater are similar due to equal storage conditions and handling practices. However, the hazard score for harvested rainwater is lower as compared to stored surface- and groundwater which could be explained by the fact that sampling of rainwater occurred in the wet season. Therefore, pathogen concentrations are most probably diluted. Piped-water supplies show an even lower hazard score compared to stored surface-, ground- and harvested rainwater. Table2b- Arsenic hazard of (stored) water sources defined by the contamination rate of water source and the factor score based on the WHO(1996) drinking water guidelines (Total hazard=Ʃ[ factor* %drinking water source]). Source: Gert-Jan Wilbers 2013
For As, the hazard scores are 90% lower compared to the hazard scores of E. coli which suggest that pollution status for As is much lower. Nevertheless, hazards are observed for both raw and stored surface- and groundwater which shows that As may cause health concerns via water use in the MD. Arsenic was not analyzed in raw rainwater. Risk associated with water sources Health-related risks associated with pathogens (E. coli) in water sources are defined by the microbial contamination rate of the drinking water sources (hazard), multiplied with the
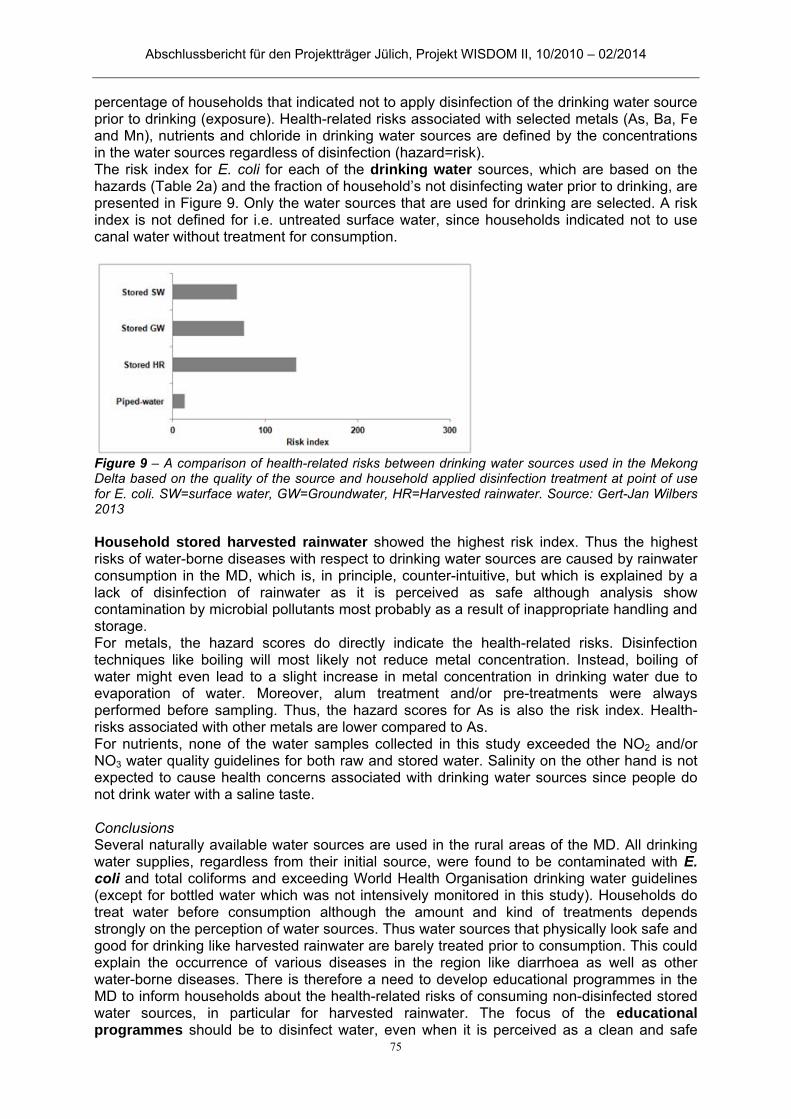
Abschlussbericht für den Projektträger Jülich, Projekt WISDOM II, 10/2010 – 02/2014
75
percentage of households that indicated not to apply disinfection of the drinking water source prior to drinking (exposure). Health-related risks associated with selected metals (As, Ba, Fe and Mn), nutrients and chloride in drinking water sources are defined by the concentrations in the water sources regardless of disinfection (hazard=risk). The risk index for E. coli for each of the drinking water sources, which are based on the hazards (Table 2a) and the fraction of household’s not disinfecting water prior to drinking, are presented in Figure 9. Only the water sources that are used for drinking are selected. A risk index is not defined for i.e. untreated surface water, since households indicated not to use canal water without treatment for consumption.
Figure 9 – A comparison of health-related risks between drinking water sources used in the Mekong Delta based on the quality of the source and household applied disinfection treatment at point of use for E. coli. SW=surface water, GW=Groundwater, HR=Harvested rainwater. Source: Gert-Jan Wilbers 2013 Household stored harvested rainwater showed the highest risk index. Thus the highest risks of water-borne diseases with respect to drinking water sources are caused by rainwater consumption in the MD, which is, in principle, counter-intuitive, but which is explained by a lack of disinfection of rainwater as it is perceived as safe although analysis show contamination by microbial pollutants most probably as a result of inappropriate handling and storage. For metals, the hazard scores do directly indicate the health-related risks. Disinfection techniques like boiling will most likely not reduce metal concentration. Instead, boiling of water might even lead to a slight increase in metal concentration in drinking water due to evaporation of water. Moreover, alum treatment and/or pre-treatments were always performed before sampling. Thus, the hazard scores for As is also the risk index. Health-risks associated with other metals are lower compared to As. For nutrients, none of the water samples collected in this study exceeded the NO2 and/or NO3 water quality guidelines for both raw and stored water. Salinity on the other hand is not expected to cause health concerns associated with drinking water sources since people do not drink water with a saline taste. Conclusions Several naturally available water sources are used in the rural areas of the MD. All drinking water supplies, regardless from their initial source, were found to be contaminated with E. coli and total coliforms and exceeding World Health Organisation drinking water guidelines (except for bottled water which was not intensively monitored in this study). Households do treat water before consumption although the amount and kind of treatments depends strongly on the perception of water sources. Thus water sources that physically look safe and good for drinking like harvested rainwater are barely treated prior to consumption. This could explain the occurrence of various diseases in the region like diarrhoea as well as other water-borne diseases. There is therefore a need to develop educational programmes in the MD to inform households about the health-related risks of consuming non-disinfected stored water sources, in particular for harvested rainwater. The focus of the educational programmes should be to disinfect water, even when it is perceived as a clean and safe
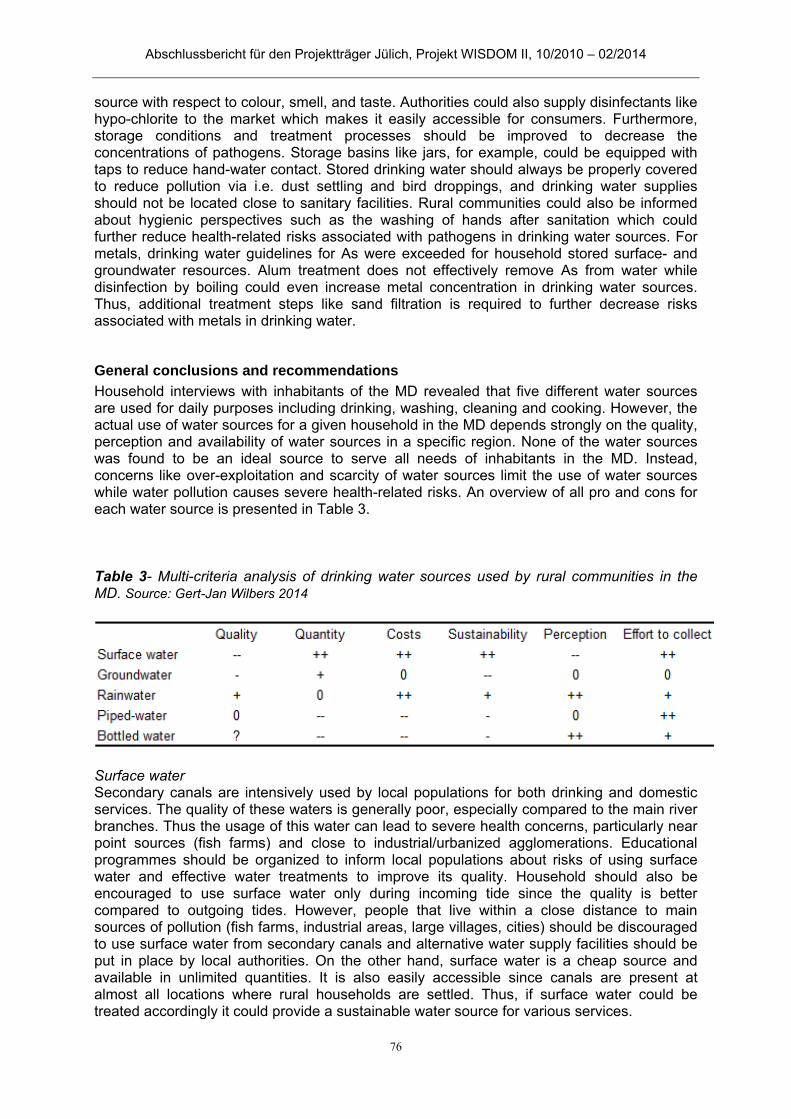
Abschlussbericht für den Projektträger Jülich, Projekt WISDOM II, 10/2010 – 02/2014
76
source with respect to colour, smell, and taste. Authorities could also supply disinfectants like hypo-chlorite to the market which makes it easily accessible for consumers. Furthermore, storage conditions and treatment processes should be improved to decrease the concentrations of pathogens. Storage basins like jars, for example, could be equipped with taps to reduce hand-water contact. Stored drinking water should always be properly covered to reduce pollution via i.e. dust settling and bird droppings, and drinking water supplies should not be located close to sanitary facilities. Rural communities could also be informed about hygienic perspectives such as the washing of hands after sanitation which could further reduce health-related risks associated with pathogens in drinking water sources. For metals, drinking water guidelines for As were exceeded for household stored surface- and groundwater resources. Alum treatment does not effectively remove As from water while disinfection by boiling could even increase metal concentration in drinking water sources. Thus, additional treatment steps like sand filtration is required to further decrease risks associated with metals in drinking water.
General conclusions and recommendations
Household interviews with inhabitants of the MD revealed that five different water sources are used for daily purposes including drinking, washing, cleaning and cooking. However, the actual use of water sources for a given household in the MD depends strongly on the quality, perception and availability of water sources in a specific region. None of the water sources was found to be an ideal source to serve all needs of inhabitants in the MD. Instead, concerns like over-exploitation and scarcity of water sources limit the use of water sources while water pollution causes severe health-related risks. An overview of all pro and cons for each water source is presented in Table 3. Table 3- Multi-criteria analysis of drinking water sources used by rural communities in the MD. Source: Gert-Jan Wilbers 2014
Surface water Secondary canals are intensively used by local populations for both drinking and domestic services. The quality of these waters is generally poor, especially compared to the main river branches. Thus the usage of this water can lead to severe health concerns, particularly near point sources (fish farms) and close to industrial/urbanized agglomerations. Educational programmes should be organized to inform local populations about risks of using surface water and effective water treatments to improve its quality. Household should also be encouraged to use surface water only during incoming tide since the quality is better compared to outgoing tides. However, people that live within a close distance to main sources of pollution (fish farms, industrial areas, large villages, cities) should be discouraged to use surface water from secondary canals and alternative water supply facilities should be put in place by local authorities. On the other hand, surface water is a cheap source and available in unlimited quantities. It is also easily accessible since canals are present at almost all locations where rural households are settled. Thus, if surface water could be treated accordingly it could provide a sustainable water source for various services.
Abschlussbericht für den Projektträger Jülich, Projekt WISDOM II, 10/2010 – 02/2014
77
Groundwater Groundwater extracted at household level from the upper-middle Pleistocene aquifer of the MD exceeds drinking water guidelines for various water quality parameters. Moreover, due to continuous over-exploitation and to potential consequences of other anthropogenic influences, the risk of salinity intrusion into groundwater bodies is expected to increase in the near future. Desalinization techniques may be too expensive for widespread use in the MD. Therefore, it is recommended to carefully manage groundwater resources in order to sustain them for future generations in order to be a sustainable water source for future generations. It is recommended to treat groundwater with i.e. sand filters prior to drinking to remove metals from groundwater. Responsible agencies should consider developing educational programmes for rural communities to raise awareness regarding microbial contamination of groundwater resources, even when the water “looks clean and safe”. Possible causes of microbial contamination in groundwater resources, such as poor maintenance of the pump, should be addressed in order to prevent microbial contamination. Furthermore, disinfection of groundwater resources is required and should be done preferably by boiling. Disinfection with chlorine is less effective due to generally high NH4 concentrations in groundwater bodies of the MD. Rainwater Rainwater is a main drinking water source in the MD due to the perception that it is of good quality, low costs and the low efforts to collect. However, quantity is often a problem as rainwater supplies are not sufficient to cover the needs in the dry season for most households. The most severe health risks associated with the consumption of HHR are caused by faecal contamination and Pb which were frequently detected in elevated concentrations. Faecal and Pb contamination is not explained by local and/or spatial parameters but most likely by a variety of household-specific conditions like storage, collection, coverage, handling, and other conditions. Based on our investigated water quality parameters, harvested rainwater could be a good drinking water source in the region if measures are taken to ensure appropriate harvesting, handling, and treatment prior to consumption. Thus, educational programs would likely help maximize the safety of harvested rainwater and raise awareness about the necessity to boil the water before consuming it. Piped-water Although piped-water is considered to be a safe and clean water source by the national government, WHO drinking water guidelines are exceeded (among the investigated parameters in this study) for pH, turbidity, Cl, NH4, Fe, Hg, E. coli and total coliforms. An additional aeration process is recommended to further decrease concentrations of NH4 and metals like Fe in piped-water. Water supply stations should also improve the management of their treatment system and prevent post-treatment pollution in order to prevent the occurrence of pathogens in piped-water supplies. Due to overexploitation of groundwater resources in the MD, groundwater levels continue to drop which increases saline intrusion. This affects the sustainability of piped-water supply stations. In the generally poor rural areas of the MD, many people cannot financially afford or do not switch to piped water due to presence of other easily accessible sources or perceived poor quality and quantity of piped water. Therefore, less than 50% of the rural community with a connection actually uses this source for drinking. Only when supply stations are better maintained and are more reliable in terms of delivered quantity, could the coverage increase. If supply companies provide water with sufficient quality and quantities, the perceptions may most probably increase. However, in remote areas with scattered settlements, it is recommended to focus on alternatives like proper rainwater harvesting techniques and Point-of-Use treatment systems that can also provide safe water for these generally low-income households. Bottled water Bottled water is generally accepted as a safe drinking water source. However, most people indicated not to have sufficient bottled water supplies to cover the entire family over the year partly because they cannot afford it. Instead, bottled water is usually an additional drinking
Abschlussbericht für den Projektträger Jülich, Projekt WISDOM II, 10/2010 – 02/2014
78
water source and is not used for domestic services. The costs of this water source are relatively high which could explain the relatively low volumes used by rural communities. A disadvantage of bottled water is the sustainability factor since the production and transportation is an energy consuming process. Moreover, used bottles may become waste after usage. Waste collection systems are not widely developed in the MD thus bottles may end up in the canals or burned at the households causing air pollution.
2.1.1.6 References
Fisher, H., Gordon, J., 2008. Breeding and feeding pigs in Vietnam: assessment of capacity building and an update on impacts. ACIAR impact assessment series report 52. http://aciar.gov.au/files/node/8921/IAS52%20full%20text.pdf. Accessed 17 May 2011.
Garschagen, M., Diez, J.R., Nhan, D.K., Kraas, F., 2012. Socio-Economic development in
the Mekong Delta: between the prospects for progress and the realms of reality, in: Renaud, F.G., Kuenzer, C. (eds.), The Mekong Delta system; Interdisciplinary Analysis of a River Delta. Springer Environmental Science and Engineering, Dordrecht, The Netherlands, pp. 83-132.
GSO, 2012. Statistical handbook for agriculture, forestry and fishery [Website]. General
Statistical Office of Vietnam, Hanoi, Vietnam. www.gso.gov.vn/default_en.aspx?tabid=469&idmid=3. Accessed January 09, 2014.
Gundry, S., Wright, J., Conroy, R., 2004. A systematic review of the health outcomes related
to household water quality in developing countries. J. Water Health 02.1, 1-13. Guong, V.T., Hoa, N.M., 2012. Aquaculture and agricultural production in the Mekong Delta
and its effects on nutrient pollution of soil and water, in: Renaud, F.G., Kuenzer, C. (eds.), The Mekong Delta system; Interdisciplinary Analysis of a River Delta. Springer Environmental Science and Engineering, Dordrecht, The Netherlands, pp 363-393.
Huth, J., Kuenzer, C., Wehrmann, T., Gebhardt, S., Tuan, V.Q., Dech, S., 2012. Land Cover
and Land Use Classification with TWOPAC: towards Automated Processing for Pixel- and Object-Based Image Classification. Remote Sens. 4, 2530-2553.
Kotsila, P., 2012. “Health is gold”: Institutional structures and the realities of health access in
the Mekong Delta, Vietnam. Working Paper 105, Center for Development Research (ZEF), University of Bonn, Bonn, Germany.
Sebesvari, Z., Le, T.T.H., Toan, P.V., Arnold, U., Renaud, F.G., 2012. Agriculture and water
quality in the Vietnamese Mekong Delta, in: Renaud, F.G., Kuenzer, C. (eds.), The Mekong Delta system; Interdisciplinary Analysis of a River Delta. Springer Environmental Science and Engineering, Dordrecht, The Netherlands, pp 331-361.
WHO, 2011. Guidelines for drinking-water quality. World Health Organization, Fourth Edition,
Geneva, Switzerland. WHO, 2013. Water sanitation and health – Water-related diseases [Website]. World Health
Organization, Geneva, Switzerland. www.who.int/water_sanitation_health/diseases/diarrhoea/en/. Accessed July 17, 2013.
Abschlussbericht für den Projektträger Jülich, Projekt WISDOM II, 10/2010 – 02/2014
79
Pesticide pollution in drinking water sources of the Mekong Delta, 2.1.2Vietnam
2.1.2.1 Introduction and purpose of the study
In the context of the rapid agriculture development in the Mekong delta since the mid 1980s, pesticides have been used increasingly in large quantities. Expenditure for and application of pesticides in the Vietnamese Mekong delta were reported to be higher than in other Asian countries like India, Philippines, Indonesia, etc. (Dung et al, 1999). These chemicals can reach the water systems of the delta, causing adverse effects to non-target organisms in aquatic environment (Sebesvari et al, 2012). Unsafe pesticide handling and improper labor protection in correlation with poor awareness for related health concerns were also reported (Toan et al, 2013, Berg 2001). Information on the pollution with pesticides in different water sources of the Vietnamese Mekong delta is still scarce. Carvalho (2008) quantified the residues of several organochlorine and organophosphate pesticides in water body of the Mekong Delta (Carvalho et al, 2008). Diazinon concentrations ranged from 3.5 10-3 to 42.8 10-3 µg L-1, followed by fenitrothion, and endosulfan sulphate. More recently, Toan et al. (2013) conducted one year monitoring of 15 currently used pesticides (buprofezin, butachlor, cypermethrin, difenozonazole, α-endosulfan, β-endosulfan, endosulfan-sulfate, fenobucarb, fipronil, hexaconazole, isoprothiolane, pretilachlor, profenofos, propanil and propiconazole). Twelve of them were quantified in surface water with average concentrations ranging from 0.02 to 3.34 µg L-1 and from 0.01 to 0.37 µg L-1 at the intensive rice cultivation and mixed agricultural production areas, respectively. However, this study focused on two small case study sites where mainly edge-of-field samples were taken. Toan et al. also reported that 7 out of 15 studied pesticides occurred in drinking water samples with average concentrations ranging from 0.01 to 0.47 µg L-1. However, this study was only designed as a screening study; it highlighted the need for further assessments. Groundwater contamination by pesticide residues have been documented worldwide, e.g. in China (Zhao et al, 2012), in Denmark (Malaguerra et al, 2012), and in the USA (Gilliom et al, 2007). However, no studies have been implemented so far in the Mekong delta. Given the above, this study aims to 1) link the current status of pesticide use with the resulting pollution in main drinking water sources at large spatial scale, and to 2) provide an assessment of the potential health risk derived from pesticide pollution in drinking water.
2.1.2.2 Study sites
The study was carried out in the lower Mekong delta of Vietnam. Four selected study sites were located in Can Tho City (in the middle of the Mekong delta) and An Giang provinces (in the northern part of the delta) (Figure 10). The first selected site was located in O Mon district in Can Tho City and represents a typical triple rice – orchard system on alluvial soil without irrigation dike system.Three sampling stations (OM1:10°.02.980‘N, 105°.38.167'E, OM2: 10°.02.880’N, 105°.38.034’E, and OM3: 10°.03.109’N, 105°.38.045‘E) were set up in a secondary canal which served as an important water source for the local people in terms of domestic use. The second study site was located in Co Do district in Can Tho City. The site represents a double rice area with a mix of further land uses such as vegetables, fruit trees and fish farms on slightly acid sulfate soils. The dike system for irrigation is not fully closed. The main aquaculture activity here is fish hatchery, e.g. pangasius, carp, perch, etc, in which the hatchery sectors were interspersed with rice fields. The three sampling stations (CD1: 10°.08.203‘N, 105°.33.730’E, CD2: 10°.07.923‘N, 105°.33.932‘E, and CD3: 10°.07.759‘N, 105°.35.056’E) were located in a secondary canal which received discharge directly from rice fields and fish ponds. The third study site was located in Thoi Lai district, Can Tho City with monoculture paddy rice cultivated year-round on slightly acid sulfate soils. The sowing and harvesting periods of rice cultivation in Co Do and Thoi Lai districts were similar to that in O Mon. Three sampling points (TL1: 10°.06.723‘N, 105°.34.672’E, TL2: 10°.06.413’N, 105°.34.726’E, TL3:
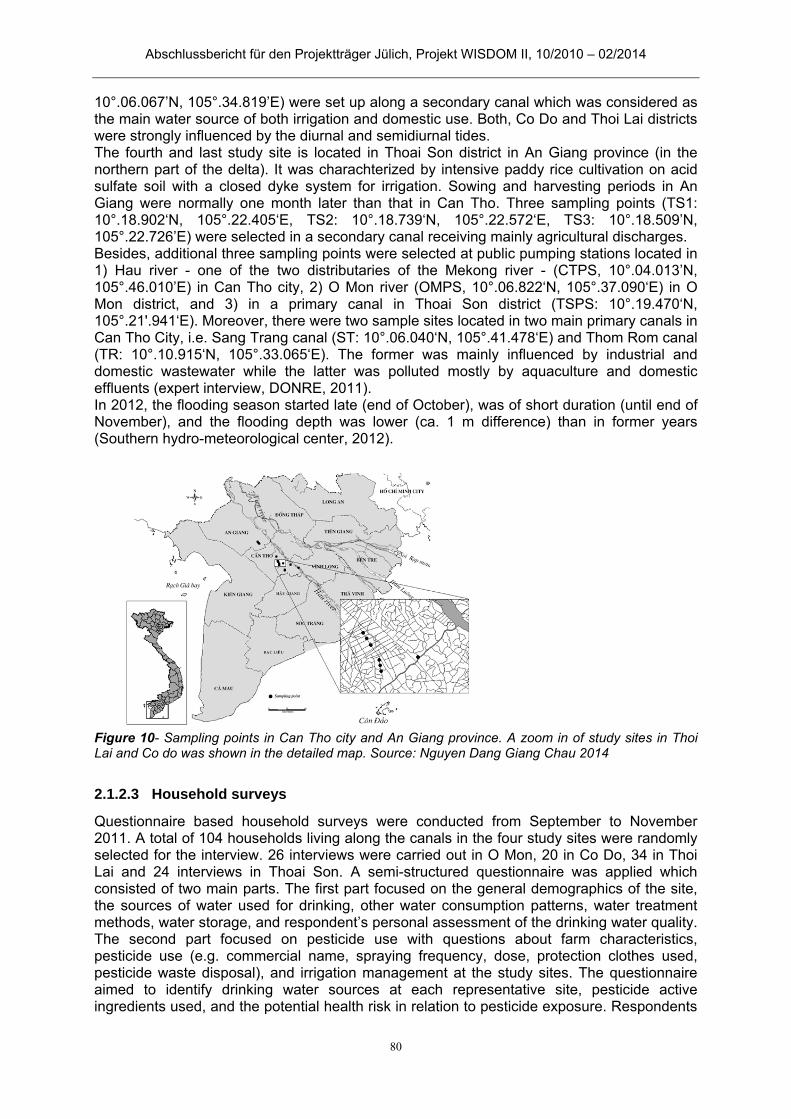
Abschlussbericht für den Projektträger Jülich, Projekt WISDOM II, 10/2010 – 02/2014
80
10°.06.067’N, 105°.34.819’E) were set up along a secondary canal which was considered as the main water source of both irrigation and domestic use. Both, Co Do and Thoi Lai districts were strongly influenced by the diurnal and semidiurnal tides. The fourth and last study site is located in Thoai Son district in An Giang province (in the northern part of the delta). It was charachterized by intensive paddy rice cultivation on acid sulfate soil with a closed dyke system for irrigation. Sowing and harvesting periods in An Giang were normally one month later than that in Can Tho. Three sampling points (TS1: 10°.18.902‘N, 105°.22.405‘E, TS2: 10°.18.739‘N, 105°.22.572‘E, TS3: 10°.18.509’N, 105°.22.726’E) were selected in a secondary canal receiving mainly agricultural discharges. Besides, additional three sampling points were selected at public pumping stations located in 1) Hau river - one of the two distributaries of the Mekong river - (CTPS, 10°.04.013’N, 105°.46.010’E) in Can Tho city, 2) O Mon river (OMPS, 10°.06.822‘N, 105°.37.090‘E) in O Mon district, and 3) in a primary canal in Thoai Son district (TSPS: 10°.19.470‘N, 105°.21'.941‘E). Moreover, there were two sample sites located in two main primary canals in Can Tho City, i.e. Sang Trang canal (ST: 10°.06.040‘N, 105°.41.478‘E) and Thom Rom canal (TR: 10°.10.915‘N, 105°.33.065‘E). The former was mainly influenced by industrial and domestic wastewater while the latter was polluted mostly by aquaculture and domestic effluents (expert interview, DONRE, 2011). In 2012, the flooding season started late (end of October), was of short duration (until end of November), and the flooding depth was lower (ca. 1 m difference) than in former years (Southern hydro-meteorological center, 2012).
Figure 10- Sampling points in Can Tho city and An Giang province. A zoom in of study sites in Thoi Lai and Co do was shown in the detailed map. Source: Nguyen Dang Giang Chau 2014
2.1.2.3 Household surveys
Questionnaire based household surveys were conducted from September to November 2011. A total of 104 households living along the canals in the four study sites were randomly selected for the interview. 26 interviews were carried out in O Mon, 20 in Co Do, 34 in Thoi Lai and 24 interviews in Thoai Son. A semi-structured questionnaire was applied which consisted of two main parts. The first part focused on the general demographics of the site, the sources of water used for drinking, other water consumption patterns, water treatment methods, water storage, and respondent’s personal assessment of the drinking water quality. The second part focused on pesticide use with questions about farm characteristics, pesticide use (e.g. commercial name, spraying frequency, dose, protection clothes used, pesticide waste disposal), and irrigation management at the study sites. The questionnaire aimed to identify drinking water sources at each representative site, pesticide active ingredients used, and the potential health risk in relation to pesticide exposure. Respondents
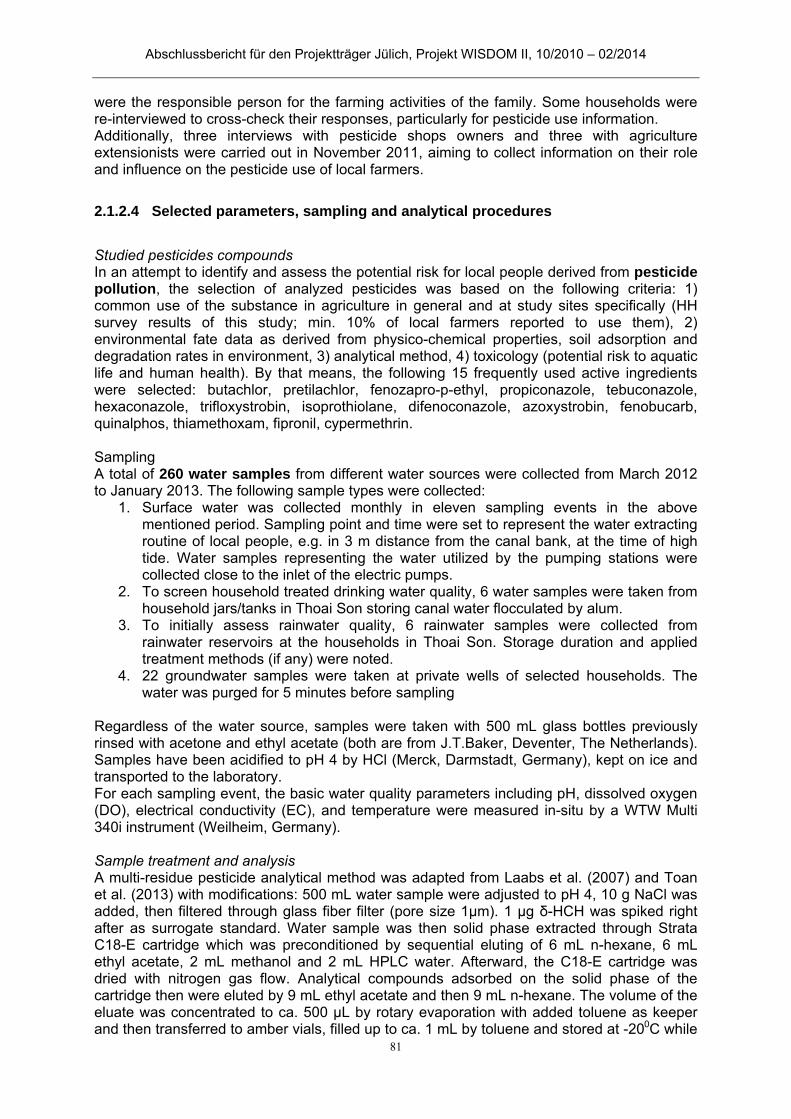
Abschlussbericht für den Projektträger Jülich, Projekt WISDOM II, 10/2010 – 02/2014
81
were the responsible person for the farming activities of the family. Some households were re-interviewed to cross-check their responses, particularly for pesticide use information. Additionally, three interviews with pesticide shops owners and three with agriculture extensionists were carried out in November 2011, aiming to collect information on their role and influence on the pesticide use of local farmers.
2.1.2.4 Selected parameters, sampling and analytical procedures
Studied pesticides compounds In an attempt to identify and assess the potential risk for local people derived from pesticide pollution, the selection of analyzed pesticides was based on the following criteria: 1) common use of the substance in agriculture in general and at study sites specifically (HH survey results of this study; min. 10% of local farmers reported to use them), 2) environmental fate data as derived from physico-chemical properties, soil adsorption and degradation rates in environment, 3) analytical method, 4) toxicology (potential risk to aquatic life and human health). By that means, the following 15 frequently used active ingredients were selected: butachlor, pretilachlor, fenozapro-p-ethyl, propiconazole, tebuconazole, hexaconazole, trifloxystrobin, isoprothiolane, difenoconazole, azoxystrobin, fenobucarb, quinalphos, thiamethoxam, fipronil, cypermethrin. Sampling A total of 260 water samples from different water sources were collected from March 2012 to January 2013. The following sample types were collected:
1. Surface water was collected monthly in eleven sampling events in the above mentioned period. Sampling point and time were set to represent the water extracting routine of local people, e.g. in 3 m distance from the canal bank, at the time of high tide. Water samples representing the water utilized by the pumping stations were collected close to the inlet of the electric pumps.
2. To screen household treated drinking water quality, 6 water samples were taken from household jars/tanks in Thoai Son storing canal water flocculated by alum.
3. To initially assess rainwater quality, 6 rainwater samples were collected from rainwater reservoirs at the households in Thoai Son. Storage duration and applied treatment methods (if any) were noted.
4. 22 groundwater samples were taken at private wells of selected households. The water was purged for 5 minutes before sampling
Regardless of the water source, samples were taken with 500 mL glass bottles previously rinsed with acetone and ethyl acetate (both are from J.T.Baker, Deventer, The Netherlands). Samples have been acidified to pH 4 by HCl (Merck, Darmstadt, Germany), kept on ice and transported to the laboratory. For each sampling event, the basic water quality parameters including pH, dissolved oxygen (DO), electrical conductivity (EC), and temperature were measured in-situ by a WTW Multi 340i instrument (Weilheim, Germany).
Sample treatment and analysis A multi-residue pesticide analytical method was adapted from Laabs et al. (2007) and Toan et al. (2013) with modifications: 500 mL water sample were adjusted to pH 4, 10 g NaCl was added, then filtered through glass fiber filter (pore size 1µm). 1 µg δ-HCH was spiked right after as surrogate standard. Water sample was then solid phase extracted through Strata C18-E cartridge which was preconditioned by sequential eluting of 6 mL n-hexane, 6 mL ethyl acetate, 2 mL methanol and 2 mL HPLC water. Afterward, the C18-E cartridge was dried with nitrogen gas flow. Analytical compounds adsorbed on the solid phase of the cartridge then were eluted by 9 mL ethyl acetate and then 9 mL n-hexane. The volume of the eluate was concentrated to ca. 500 µL by rotary evaporation with added toluene as keeper and then transferred to amber vials, filled up to ca. 1 mL by toluene and stored at -200C while

Abschlussbericht für den Projektträger Jülich, Projekt WISDOM II, 10/2010 – 02/2014
82
waiting for the measurement. Target pesticides were analyzed in a gas chromatograph equipped with mass spectrometry detector using electron impact (EI) mode (GCMS - QP 2010 plus, Shimadzu, Japan). A DB-1 fused silica capillary column (length 30 m; inner diameter 0.25 mm; film thickness 0.25 µm) was employed. The temperature program of the gas chromatograph oven was: 80oC initial temperature in 2 minutes, increased to 150oC at a rate of 10oC/min, held for 5 minutes, then increased to 230oC at a rate of 5oC/min, kept on increasing to 250oC/min at a rate of 2oC/min, and finally increased to 280oC at 20oC, held for 10 minutes. A post temperature of 300oC in 10 minutes was applied.
2.1.2.5 Quality assurance and quality control
Analytical grade purified water was extracted as blank sample regularly for each analytical batch. Accepted recovery of surrogate standard δ-HCH was in the range from 70% to 130%. Extracted samples with surrogate recovery rates out of this range were removed. Detection concentrations were not corrected for recovery rates of the surrogate standard. Recovery rates of the 15 target pesticides (spiked concentration of 1µg/mL) achieved through this analytical method were between 73.4% and 117,0% with relative standard deviations (RSDs) from 2.3% to 22.9% (n = 3). Method detection limit (MDL) of each target compound was determined by conducting four replicated experiments, spiking with pesticide amounts close to and higher than the expected detection limit (Ripp et al, 1996). Due to the differences in physico-chemical characteristics of the studied compounds e.g. boiling point, solubility, etc., which would be influenced by the extraction process, or the measurement conditions in GC/MS instrument, three different spike concentrations were employed for three different pesticide groups, namely 200 ng for propiconazoles, triflorxystrobin, cypermethrin, difenoconazole and azoxystrobin, 100 ng for fenozaprop-p-ethyl, and 20 ng for butachlor, pretilachlor, tebuconazole, hexaconazole, isoprothiolane, fenobucarb, quinalphos, thiamethoxam, and fipronil. Based on the standard deviation (SD), the MDL was calculated by: MDL = 3.14 x SD. Only samples with detected concentrations higher than the specific MDL values were used for further assessments.
2.1.2.6 Assessment of potential risk
The parametric guideline value of the European Commission (EC, 1998) for pesticide concentrations in drinking water and WHO toxicity classes for pesticides (WHO, 2010) were used to assess potential health risks from pesticides pollution. The WHO toxicity classes are: Class I-a: extremely hazardous, Ib: highly hazardous, II: moderately hazardous, III: slightly hazardous, U: unlikely to present acute hazard. The European Commission set 0.1 μg L−1 as a threshold for single pesticide concentration in drinking water and the parametric guideline value for total pesticide concentrations was set by 0.5 μg L−1. EPA’s Aquatic life benchmarks (US EPA, laste update 2012) were used to evaluate environmental risk. Quantified concentrations were then compared with the guideline values.
2.1.2.7 Statistics
IMB SPSS Statistics version 20.0 and Sigma Plot version 11.0 statistic softwares were employed to perform the statistical analysis. The Kolmogorov–Smirnov test was applied to test the normal distribution of the data (p=0.05). If the data was normally distributed, one way ANOVA was run to find significant differences between groups. Otherwise non-parametric tests were used. Kruskal-Wallis H test was applied to find differences between groups. The Mann–Whitney U tests then were used to find differences within groups.

Abschlussbericht für den Projektträger Jülich, Projekt WISDOM II, 10/2010 – 02/2014
83
2.1.2.8 Results
Pesticide use and water management 2.1.2.8.1
Among the fifteen pesticide active ingredients analysed in this study, the following nine have been studied also by Toan et al. (2013) in WISDOM phase I: butachlor (used by 16.3% of total respondents in this study), pretilachlor (64.3%), propiconazole (57.1%), hexaconazole (25.5%), isoprothiolane (43.9%), difenoconazole (71.4%), fenobucarb (16.3%), fipronil (39.8%) and cypermethrin (12.2%). Further six different pesticides monitored in this study have been used with the following frequency: fenoxapro-p-ethyl (13.3% used), tebuconazole (14.3%), trifloxystrobin (12.2%), azoxystrobin (34.7%), quinalphos (17.3%), and thiamethoxam (33.7%). Out of all studied pesticides, propiconazole, difenoconazole, isoprothiolane, fenobucarb, fipronil and cypermethrin is classified in group II of moderately hazardous pesticides according to WHO (WHO, 2010). The others are listed in group III – slightly hazardous, except the two herbicides pretilachlor and fenoxapro-p ethyl which are classified as unlikely to present acute hazard. Depending on the sample site (and thus land use system), the use of pesticides differed as indicated in Figure 11. Rice farmers in O Mon and Co Do took in and discharged irrigation water 3 to 4 times per season. Meanwhile, a more intensive irrigation scheme was applied in Thoi Lai (5-7 times) and Thoai Son (4-5 times). Consequently, water runoff containing not only fertilizers but also pesticides would likely contaminate the surrounding aquatic environment.
Figure 11 - Proportion of respondents at four study sites applied different pesticides. Source: Nguyen Dang Giang Chau 2014
Pesticide pollution in surface water and potential health risk 2.1.2.8.2
A summary of the detection frequency and residue levels of the studied pesticides in surface water is shown in Table 3. Table 3 - Summary of the residues of pesticides in surface water samples. Bold numbers indicate the top three pesticides in each category (detection and quantification frequency, median and maximum concentration, % samples exceeded EC guidelines value 0.1 ug/L for individual pesticide), n=181. Source: Nguyen Dang Giang Chau 2014.
Abschlussbericht für den Projektträger Jülich, Projekt WISDOM II, 10/2010 – 02/2014
84
The fungicide isoprothiolane was quantified most frequently, in 97.8% of the surface water samples, followed by the insecticides fenobucarb (91.2%) and fipronil (83.4%). The median concentration of isoprothiolane was at 0.55 µg L-1 while fipronil and fenobucarb were quantified at lower levels with median concentrations of 0.13 and 0.15 µg L-1, respectively. Isoprothiolane and fipronil are both widely used in the Mekong Delta. Commercial products containing fipronil include “Regent 80WG” and “Regent Hai lúa xanh”. Isoprothiolane is the active ingredient in e.g. “Bump 650WP” and “Fuan 40EC” which were very frequently used by local farmers. The most often used pesticide, difenoconazole (71.4% of respondents) was quantified in only 9.4% of analyzed surface water samples, yet it was detected at highest median concentration (1.10 µg L-1) and at maximum quantified level of 3.18 µg L-1. One of the most used pesticides, propiconazole (57.1%), was also detected in 39.2 % of the analyzed samples with maximum concentration of 4.76 µg L-1. All these compounds are classified in group II of moderately hazardous pesticides (WHO, 2010). Fenoxapro-p ethyl was not found in any of the samples while cypermethrin was quantified in only one sample collected in Thoai Son in March 2012 which corresponds with the infrequent use of these pesticides by the interviewed farmers (cypermethrin 12.2%, fenoxapro-p ethyl 14.3%). The number of pesticides detected simultaneously in one sample varied from 3 to 11. In Thoai Son and Thoi Lai, the share of samples where a mixture of more than 5 pesticides occurred was 91% and 94 % respectively, while these proportions in O Mon and Co Do were 87% and 81%. A comparable rate was reported by Toan et al (2013). Mixture toxicity of pesticides still needs much attention and respective risk assessment is difficult (Verbruggen et al, 2010). The high frequency of co-occurrence of pesticides in the samples likely generates combination toxicity (based on concentration addition concept) to aquatic ecosystems and to human health which might cause higher risk compared to the effect of any single pesticide (Kortenkamp et al, 2009). As surface water is still used for drinking, cooking and other domestic purposes in rural areas, compounds with either high frequency of use, frequent detection in water, high detected concentrations or high acute toxicity should be monitored carefully due to the potential risk their might pose to human health and the environment. However, specific regulations for drinking water quality with respect to the monitored 15 pesticides exist only for a few of them. Therefore, health risk assessment was based on European Commission drinking water guideline values (EC, 1998) (0.1 µg L-1 for individual pesticide and 0.5 µg L-1
for total concentration of pesticides in drinking water). Besides, risk for aquatic life was assessed referring to EPA’s Aquatic life benchmarks (US EPA, last update 2012).
Compound
MDL
(µgL-1)
Quantifi-
cation
frequency
(%)
Max.
conc.
(µgL-1)
Median
conc.
(µg.L-1)
Exceed
0.1 ug/L
(%)
WHO
toxicity
classify-
cation
Herbicides
1 Butachlor 0.007 55.8 0.81 0.25 50.3 III 2 Pretilachlor 0.005 71.8 0.85 0.21 63.0 U 3 Fenoxapro P ethyl 0.002 0.0 0.00 0.00 0.0 U
Fungicides 4 Propiconazole 0.083 39.2 4.76 0.50 39.2 II 5 Tebuconazole 0.004 37.0 1.34 0.34 30.9 III 6 Hexaconazole 0.021 67.4 1.79 0.46 60.8 III 7 Trifloxystrobin 0.003 16.0 0.56 0.16 15.5 III 8 Isoprothiolane 0.005 97.8 8.49 0.55 91.7 II 9 Difenoconazole 0.500 7.2 3.18 1.10 7.2 II 10 Azoxystrobin 0.036 66.3 2.41 0.49 61.3 III Insecticides 11 Fenobucarb 0.016 91.2 2.32 0.15 64.1 II 12 Quinalphos 0.003 78.5 1.33 0.17 63.0 III 13 Thiamethoxam 0.007 4.4 0.95 0.63 4.4 III 14 Fipronil 0.005 83.4 0.41 0.17 51.4 II 15 Cypermethrin 0.500 0.6 0.77 0.77 0.6 II
Abschlussbericht für den Projektträger Jülich, Projekt WISDOM II, 10/2010 – 02/2014
85
Accordingly, EC guideline value for concentration of total pesticides in drinking water (0.5 µg L-1) was exceeded in 95.6% of collected surface water samples. High concentrations of isoprothiolane caused most often that this guidline value was exceeded. For this pesticide the individual limit of 0.1 µg L-1 was exceeded in 95.6% of samples, followed by fenobucarb, pretilachlor and quinalphos (> 0.1 µg L-1 in in over 60% of analyzed samples) (Table 3). Seven out of the 15 studied pesticides are listed in the table of Aquatic life benchmarks, including cypermethrin, fenoxapro-p ethyl, fipronil, propiconazoe, tebuconazole, thiamethoxam and trifloxystrobin. Fipronil concentrations exceeded the benchmark concentration for acute risk for invertebrates (0.11 µg L-1) in 76.8% of the surface water samples while the benchmark concentration for chronic risk (0.011 µg L-1) was still exceeded in 50.3% of the samples. Cypermethrin occurred in only one sample (0.77 µg L-1) and exceeded all the acute benchmarks for both fish and invertebrates. The other pesticide compounds occurred at levels lower than the guideline values.
Screening study of pesticide pollution in groundwater, harvested rainwater, treated 2.1.2.8.3canal water and bottled water
This chapter describes results of a screening study conducted to provide first insights about the pesticide contamination in groundwater, harvested rainwater, treated canal water and bottled water. The number of samples analyzed is not sufficient for an in-depth analyzis but meant to bring the contamination of these water sources to the attention of responsible authorities. Groundwater Private groundwater wells supply a substantial share of drinking water in the Mekong delta, particularly in Thoi Lai and Co Do. Intensive pesticide use caused pollution not only of surface water but also groundwater resources mainly through leaching. Contamination of groundwater by pesticides used at the study sites was investigated in a screening study by analyzing a limited number of groundwater samples collected at private wells in June 2012 (Table 2). Pesticides occurred in 5 out of 22 collected groundwater samples and the EC parametric guidline value for individual pesticides in drinking water (0.1 µg L-1) was exceeded in these 5 samples. In one sample collected in Thoai Son total pesticide concentration was 1.14 µg L-1. Mixture of pesticide compounds in one single sample was less prevalent than in surface water: maximum 4 compounds co-occurred in these groundwater samples. Isoprothiolane was found in 3 samples, followed by preilachlor and fenobucarb (occurred in 2 samples), and then quinalphos and fipronil. Their long half-life and moderate partition between the organic carbon and water content in the soil explains likely their potential to reach groundwater. This initial evaluation of pesticide contamination in groundwater calls for a broader monitoring campaign of pesticides in groundwater in the Mekong delta due to its important role especially in the coastal area where surface water salinization has forced local population to consume groundwater as a main water source (Danh, 2008). “Water in the tanks” – harvested rainwater and flocculated canal water To screen the contamination of other popular water sources by pesticides, six samples were taken from harvested rainwater and canal water collected and treated with alum (flocculation), both stored in jars. All of the analyzed samples were contaminated by high residue levels of pesticides, exceeding EC allowable value (0.5 µg L-1). Number of pesticides in one single sample was found ranging from 3 to 9 compounds for harvested rainwater samples, and from 5 to 11 compounds in flocculated canal water samples. Isoprothiolane and fenobucarb occurred in all samples, followed by fipronil, butachlor and quinalphos. Although differences in median concentration between flocculated canal water and rainwater (1.25 µg L-1 vs 0.98 µg L-1) was not statistically significant (p-value 0.05), pollution problem of the former was more severe in terms of the number of pesticides quantified and that co-occurred. Improper pesticide storage, disposal and the ubiquitous use of pesticides facilitated the accumulation and occurrence of pesticides in the water supposed to be clean and ready to use.

Abschlussbericht für den Projektträger Jülich, Projekt WISDOM II, 10/2010 – 02/2014
86
Bottled water A total of 48 bottled water samples were collected for pesticide pollution assessment. More than 50% of analyzed bottled water samples were contaminated by pesticide concentrations higher than LOQ of the GC-MS machine (Table 4). The number of pesticides detected in the 21L bottled water sample was 5 which was less than that found in the 500 mL bottled water, accounted for 8 different compounds. The fungicide isoprothiolane and herbicide pretilachlor were the most often quantified pesticides in 500 ml bottles, while fenobucarb, hexaconazole and isoprothiolane were most common in the 21L bottles. The highest total pesticide residue was 1.38 g L-1, and 0.53 g L-1 in the 500 mL and 21L bottled water, respectively. The EC benchmark (0.5 g L-1) was exceeded in six of the analyzed samples. The quality control of bottled water follows Vietnam’s National technical regulation for bottled/packaged natural mineral waters and drinking waters issued by the Ministry of Health (QCVN 6-1:2010/BYT, 2010). This documents set guideline values for Pb2+, NO2-, NO3-, Cl-, total Fe, E. coli, coliforms, Streptococci fecal, and Pseudomonas aeruginosa. In this regulation, the maximum pesticide residue is specified as to be lower than the “Limit of quantitation (LOQ) of Liquid chromatographic method with ultraviolet detector”. This study employed Gas chromatography – Mass spectrometry (GC-MS) for the determination of pesticides in water, thus the results cannot be directly related to the LOQ of liquid chromatography. However, detected concentrations are well above water quality guidelines used e.g. in the European Union. Although these local bottled water brands usually advertise to use groundwater or piped-water for the bottled water production, the occurrence of pesticides at substantial concentration raises questions regarding the origin of the water used. Application of modern treatment techniques and tightened inspections from local control agencies would be advantageous to protect the health of customers. Table 4- Pesticide residues in groundwater, rainwater, tank-water and bottled water. Source: Nguyen Dang Giang Chau 2014
2.1.2.9 Conclusions
"Access to safe drinking-water is important as a health and development issue at a national, regional and local level" (WHO, 2008). Our study showed that a pollution of water with pesticides is currently a big challenge for the Vietnamese Mekong Delta. Annually, an estimated half a million tons of pesticides are used in the Mekong Delta (Hien, 2009). Pesticide pollution originating from agriculture activities was rated as one of the top 3
Groundwater Rainwater
Tank-water
Bottled 500mL
Bottled 21L O
Mon Co Do
Thoi Lai
ThoaiSon
No. of analyzed samples 5 6 5 5 6 6 26/10 brands
22/8 brands
No. of samples contaminated by pesticides 1 2 1 1 6 6 17 13
Max total pesticide concentration (�g/L) 0.38 0.22 0.15 1.14 5.75 14.15 1.38 0.53 No. of samples detected individual pesticide residues Fenobucarb 1 1 6 6 2 6
Quinalphos 1 4 5 1 1
Butachlor 5 5 4
Isoprothiolane 1 1 1 6 6 8 6
Tebuconazole 5
Propiconazole 1 2
Difenoconazole 1
Pretilachlor 1 1 3 3 12 3
Fipronil 1 4 6 4
Hexaconazole 1 2 1 6
Trifloxystrobin 1 1
Azoxystrobin 1 2 1
No. of samples exceeding the EC guideline (0.5 µg/L)
0 0 0 1 6 6 4 2
Abschlussbericht für den Projektträger Jülich, Projekt WISDOM II, 10/2010 – 02/2014
87
pollution problems of the world (Blacksmith Institute, 2011). Monitoring findings showed that all collected surface water samples were contaminated by pesticides. EC guideline value for concentration of total pesticides in drinking water (0.5 µg L-1) (EC, 1998) was exceeded in over 95% of those samples. Moreover, pesticides were detected in a number of groundwater, rainwater and bottled water samples. These are the alarming results for local governments at all levels and policy makers regarding to the chronic exposure of the population to pesticides, especially in rural areas where the number of populations having access to clean water is limited. A feasible mitigation measure would be to invest in the wider spread of good management practices - GAP (FAO, 2008) in rice cultivation in the Mekong Delta in order to reduce the use of agrichemicals as well as to improve water management. Besides, multi residue pesticide analysis requires sophisticated and expensive methods in sample preparation combined with high instrumental cost to measure. Therefore, the implementation of large-scale pesticide monitoring programs has been limited in developing countries (Ikpesu et al., 2013). Our research is one of few studies focusing on the occurrence of pesticides in different available drinking water sources at a large scale in the Mekong Delta with corresponding risk assessments.
2.1.2.10 References
Berg, H., Pesticide use in rice and rice–fish farms in the Mekong Delta, Vietnam. Crop
protection 20 (2001): 897–905. Berg, M., Stengel, C., Trang, P.T.K., Pham, H.V., Sampson, M.L., Leng, M., Magnitude of
arsenic pollution in the Mekong and Red River Deltas — Cambodia and Vietnam. Science of Total Environment 372 (2007): 413–25.
Blacksmith Institute, The World’s Worst Toxic Pollution Problems. Report 2011. Balcksmith Institute. New York, USA. http://www.worstpolluted.org/
Buschmann, J., Berg, M., Stengel, C., Winkel, L., Sampson, M.L., Trang, P.T.K., Viet, P.H., Contamination of drinking water resources in the Mekong Delta floodplains: arsenic and other trace metals pose serious health risks to population. Environment International 34 (2008): 756 - 764.
Carvalho, F.P., Villeneuve J.P., Cattini C., Tolosa I., Thuan D. D., Nhan D.D., Agrochemical and polychlorobyphenyl (PCB) residues in the Mekong River delta, Vietnam, Marine Pollution Bulletin 56 (2008):1476–1485.
Danh, V. T., Household Switching Behavior In The Use Of Groundwater in The Mekong Delta, Vietnam. Economy and Environment Program for Southeast Asia (EEPSEA). Research report (2008). http://www.eepsea.net/pub/rr/12312287701Danh_RR3.pdf
Delta Alliance, Mekong Delta Water Resources Assessment Studies. Vietnam - Netherlands Mekong Delta Masterplan Project 2011. Deltares, Delft, The Netherlands, 12-13.
DONRE Can Tho, 1998 - 2008, A ten - year report 1998 – 2008 of Department of Natural resources and Environment of Can Tho city (2009) (in Vietnamese)
Dung, N.H., and Dung, T.T.T., Economic and health consequences of pesticide use in paddy production in the Mekong Delta,Vietnam. Economy and Environment program for Southest Asia, Research report 1999. http://idl-bnc.idrc.ca/dspace/bitstream/10625/25143/10/113557.pdf
EC, European Commission. Council Directive 98/83/EC of 3 November 1998 on the quality of water intended for human consumption. Official Journal of the European Communities (1998) L 330:32–54.
FAO, Food and Agriculture Organization of the United Nations (2008). http://www.fao.org/prods/gap/index_en.htm
Gilliom, R.J. Pesticides in U.S. Streams and Groundwater. United States Geological Survey. Technical Report (2007). Reston, Virginia, USA
GSO, 2008, General Statistics Office. Results of the survey on household living standards 2008. General Statistic Office. Statistical publishing house, Vietnam.
GSO, 2012, General Statistics Office. Statistical yearbook of Vietnam 2012. Statistical Publishing House; Vietnam
Abschlussbericht für den Projektträger Jülich, Projekt WISDOM II, 10/2010 – 02/2014
88
Hien, N.X., The Natural resources of the Vietnamese Mekong delta, Journal of Water resource Sciences and Technology, 1910/VL (2009): 24-32, (in Vietnamese).
Hoai, P.M., Sebesvari, Z., Minh, T.B., Viet, P.H., Renaud, F.G., Pesticide pollution in agricultural areas of Northern Vietnam: case study in Hoang Liet and Minh Dai communes. Environ Pollut 159 (2011): 3344–50.
Ikpesu, T.O. and Ariyo, A.B. Health Implication of Excessive Use and Abuse of Pesticides by the Rural Dwellers in Developing Countries: The Need for Awareness. Greener Journal of Environment Management and Public Safety Vol 2 (5) (2013): 180-188. (Review article)
Kortenkamp A, Backhaus T, Faust M. State of the art report on mixture toxicity. Final report of a project on mixture toxicology and ecotoxicology commissioned by the European Commission, DG Environment; 2009
Laabs, V., Wehrhan, A., Pinto, A., Dores, E., Amelung, W., Pesticide fate in tropical wetlands of Brazil: an aquatic microcosm study under semi-field conditions. Chemosphere 67 (2007): 975–989.
Malaguerra, F., Albrechtsen, H-J., Thorling, L., Binning, P.J., Pesticides in water supply wells in Zealand, Denmark: A statistical analysis. Science of the Total Environment 414 (2012) 433–444
MRC, Mekong River Commission. The flow of the Mekong. MRC Management Information booklet series 2009. http://www.mrcmekong.org/assets/Publications/report-management-develop/MRC-IM-No2-the-flow-of-the-mekong.pdf
Özdemir, S., Elliott, M., Brown, J., Nam, P.K., Hien, V.T., Sobsey, M.D., Rainwater harvesting practices and attitudes in the Mekong Delta of Vietnam. Journal of Water, Sanitation and Hygiene for Development 1 (3) (2011): 171 - 177.
QCVN 6-1:2010/BYT, Vietnam’s National technical regulation for bottled/packaged natural
mineral waters and drinking waters. Ministry of Health (2010).
Renaud, F.G., Syvitski, J.P.M., Sebesvari, Z., Werners, S.E., Kremer, H., Kuenzer, C., Ramesh, R., Jeuken, A., Friedrich, J., Tipping from the Holocene to the Anthropocene: How threatened are major world deltas? Current Opinion in Environmental Sustainability 5 (2013): 644–654
Ripp, J., Analytical detection limit guidance and Laboratory Guide for Determining Method Detection Limits. Wisconsin Department of Natural Resources. Laboratory Certification Program (1996) USA
Sebesvari, Z., Huong, L.T.T., Toan, P.V., Arnold, U., Renaud, F.G., Book chapter: Agriculture and Water Quality in the Vietnamese Mekong Delta, The Mekong Delta System - Interdisciplinary Analyses of a River Delta, Springer Environmental Science and Engineering (2012)
Sinh, N.N., Thuy, L.T.B., Kinh, N.K., Thang, L.B., The persistent organic pollutants and their management in Vietnam, In: Proceedings of the Regional Workshop on the Management of Persistent Organic Pollutants (POPs), United Nations Environment Program, Hanoi, Vietnam (1999): 385–406.
SNV, Netherlands Development Organisation. Study of Rural Water Supply Services Delivery Models in Vietnam. Report from the Deutsch Technical Cooperation (2010). http://www.snvworld.org/en/regions/asia/publications?filter=~Study%2520of%2520Rural%2520Water%2520Supply
Thuy, P.T., Van Geluwe, S., Nguyen, V.A., Van der Bruggen, B., Current pesticide practices and environmental issues in Vietnam: management challenges for sustainable use of pesticides for tropical crops in (South-East) Asia to avoid environmental pollution. J Mater Cycle Waste Manag 14 (2012b): 379–387.
Toan, P.V., Sebesvari, Z., Bläsing, M., Rosendahl, I., Renaud, F.G., Pesticide management and their residues in sediments and surface and drinking water in the Mekong Delta, Vietnam. Science of the Total Environment 452-453 (2013) 28–39
UNICEF, Study on the correlation between sanitation, household water supply, mother's hygiene behaviors for children under 5 and the status of child nutrition in Vietnam, (2011). http://www.un.org.vn/images/stories/pub_trans/wash_and_nutrition_study_eng.PDF
Abschlussbericht für den Projektträger Jülich, Projekt WISDOM II, 10/2010 – 02/2014
89
US EPA, U. S. Environmental Protection Agency. Aquatic life benchmark table (2009). http://www.epa.gov/oppefed1/ecorisk_ders/aquatic_life_benchmark.htm
Verbruggen, E.M.J., van den Brink, P.J., Review of recent literature concerning mixture toxicity of pesticides to aquatic organisms. Report 601400001/2010, RIVM – National institute for Public health and the Environment (2010). http://edepot.wur.nl/155269
WHO, 2010. World health organization. Water for health. WHO guidelines for drinking water quality. 2010. http://www.who.int/water_sanitation_health/WHS_WWD2010_guidelines_2010_6_en.pdf?ua=1
WHO, 2011. World health organization. Guidelines for Drinking-water Quality. Fourth edition. WHO press, Geneva, Switzerland, 2011. http://whqlibdoc.who.int/publications/2011/9789241548151_eng.pdf
Wilbers, G.J., Sebesvari, Z., Rechenburg, A., Renaud, F.G., Effects of local and spatial conditions on the quality of harvested rainwater in the Mekong Delta, Vietnam. Environmental Pollution 182 (2013) 225 - 232.
Zhao, Y.Y., Pei, Y.S., Risk evaluation of groundwater pollution by pesticides in China: a short review. Procedia Environmental Sciences 13 (2012) 1739 – 1747

Abschlussbericht für den Projektträger Jülich, Projekt WISDOM II, 10/2010 – 02/2014
90
Antibiotics in the Vietnamese Mekong delta: occurrence and fate 2.1.3
2.1.3.1 Introduction
In Southeast Asia, Vietnam, Indonesia, Bangladesh, Thailand, Myanmar and the Philippines are the top producers of aquaculture products (FAO, 2012). Total area used for marine and freshwater aquaculture in Vietnam was ca. 1.04 million ha in 2012 delivering more than 5.7 million tons of aquaculture products for both domestic food demand and export. The lower Mekong delta contributed 57% of this output in 2011 (GSO, 2012). However, disease outbreaks caused by bacterial infection or parasites have affected fish and shrimp farms strongly in the last few years. As a reaction, farmers started to apply larger amounts of chemical and biological products, particularly antibiotics to promote growth, and to prevent and treat diseases. In the absence of treatment facilities, antibiotics likely reach the water system causing water pollution and contributing to the development of resistant strains of parasites and bacteria (Rico et al, 2012). Antibiotic pollution has been assessed in few studies in the Mekong Delta. In mangrove areas located in Thai Binh, Nam Dinh, Ca Mau provinces and in Can Gio forests high residues of the antibiotics trimethoprim, sulfamethoxazole, norfloxacin and oxolinic acid were found in mud samples at concentrations of 734.61, 820.49, 2615.96, 426.31 µg g-1, and in water samples collected from shrimp ponds and surrounding canals at concentrations of 1.04, 2.39, 6.06 and 2.50 mg L-1, respectively (Tuan et al, 2004). In a study published in 2007, sulfamethazine, sulfamethoxazole, trimethoprim and erythromycin-H2O were reported at concentrations ranging from 7 to 360 ng L-1 in surface waters of the Mekong Delta. However, in pig farm wastewaters and in canals near chicken and pig farms, sulfamethazine concentrations ranged up to 19.2 µg L-1 (Managaki et al, 2007). The above mentioned antibiotics are relatively stable and water soluble. Knowing that inhabitants in rural areas use surface water frequently for domestic uses and in some cases also for drinking, long-term chronic exposure to these antibiotics is likely to occur. After application, antibiotics can be transported or transformed following different pathways. They are eventually excreted, either maintaining the same chemical structure or as metabolites that have been transformed into epimers or isomers (Kemper et al, 2008). Degradation in manure and soil and elimination in wastewater of erythromycin, tylosin, oleandomycin, salinomycin and tiamulin has been studied by Schlüsener (2006). Alvaré (2010) has studied the transformation of oxytetracycline and chlortetracycline under anaerobic digestion in pig manure using discontinuous batch assays. Schauss and co-workers (2010) published a review on the fate of sulfadiazine in soil ecosystems while Rosendahl (2011) investigated the dissipation and sequestration of sulfadiazine under field conditions. Earlier, Giger (2003) has investigated the fate of fluoroquinolones and macrolides classes in municipal and hospital wastewater, sewage sludge and surface water. In Vietnam, Anh (2010) studied the occurrence and behavior of several floroquinolones in hospital wastewaters in Hanoi. These publications provide important information on antibiotic pollution hazard under different conditions that could translate to environmental risk assessments of the particular antibiotics. This study aims to 1) provide a more comprehensive picture about the occurrence of commonly used antibiotics in the Mekong Delta and 2) first scientific information about the fate of commonly used antibiotics in different semi-field experimental systems.

Abschlussbericht für den Projektträger Jülich, Projekt WISDOM II, 10/2010 – 02/2014
91
Study sites and sampling locations for monitoring 2.1.3.1.1
Figure 12. Sampling points in Can Tho City and An Giang province. The detailed map shows the sampling points at the study site in Chau Phu in An Giang. Source: Nguyen Dang Giang Chau 2014 The study was carried out in the lower Mekong delta of Vietnam, specifically in Can Tho City (in the middle of the Mekong delta) and An Giang province (in the northern part of the delta) (Figure 12). The sampling sites were selected in order to cover for two major aquaculture steps in the aquaculture production: fish hatcheries and mature fish cultivation. The first selected site is located next to the Hau River (a distributary of the Mekong River) in Chau Phu district, An Giang province. This site was representative for intensive mature catfish cultivation. Total area of the study site was 140 hectares. This area had 35 fish farms with average farm size of 1.8 ha. Mature fish was harvested normally after 8 month cultivation. Water was exchanged by using electric pumps. Wastewater from fish ponds was discharged either to the rice fields close by or directly to the canals. Main domestic water sources in the area were piped water (30% interviewed household) and surface water (67%) in which up to 33% respondents reported to use surface water for drinking and cooking as well (field survey, 2011). Six sampling locations were identified in two parallel secondary canals including Chau Phu A (CPa1:10o.36.711'N, 105o.12.247'E; CPa2: 10o.36.318'N, 105o.11.889'E; CPa3: 10o.35.979'N, 105o.11.615'E) where aquaculture wastewater were discharged to the rice field before reaching the canal; and Chau Phu B (CPb1: 10o.39.057'N, 105o.10.973'E; CPb2: 10o.38.572'N, 105o.10.480'E; CPb3: 10o.38.142'N, 105o.10.050'E) which received discharges from the fish farms and also served as domestic water source for local people. Besides, an additional sample site was identified in Chau Phu at a public pumping station located in a primary canal (CPPS: 10o.35.926'N, 105o.11.410'E). The other selected site was located in Co Do district, Can Tho City. The site covers an area of 80 hectares with 10 fish farms with average farm size of 2.9 ha. This site was representative for fish hatcheries – mainly for carp, tilapia, and catfish. The hatchery cycle lasted 2 to 3 month, depending on species. Nine of the ten farms discharged the wastewater directly to the adjacent canals. One farm had a lake to pre-treat wastewater before discharging. Paddy rice, upland crops and fruit trees co-occurred with the hatcheries at this site. Groundwater and surface water were the main water sources for the inhabitants (70% and 40% of respondents, respectively) (field survey, 2011). Three sampling locations (CD1: 10°.08.203‘N, 105°.33.730’E, CD2: 10°.07.923‘N, 105°.33.932‘E, and CD3: 10°.07.759‘N, 105°.35.056’E) were located in a secondary canal where local people extracted water for domestic purposes. Additionally, two sampling locations were set at points where pumping stations source water for piped water supply station. Sample sites were located in 1) the Hau river (CTPS, 10°.04.013’N, 105°.46.010’E) in Can Tho City, 2) the O Mon river (OMPS, 10°.06.822‘N, 105°.37.090‘E) in O Mon district, (also Can Tho City). Moreover, two additional
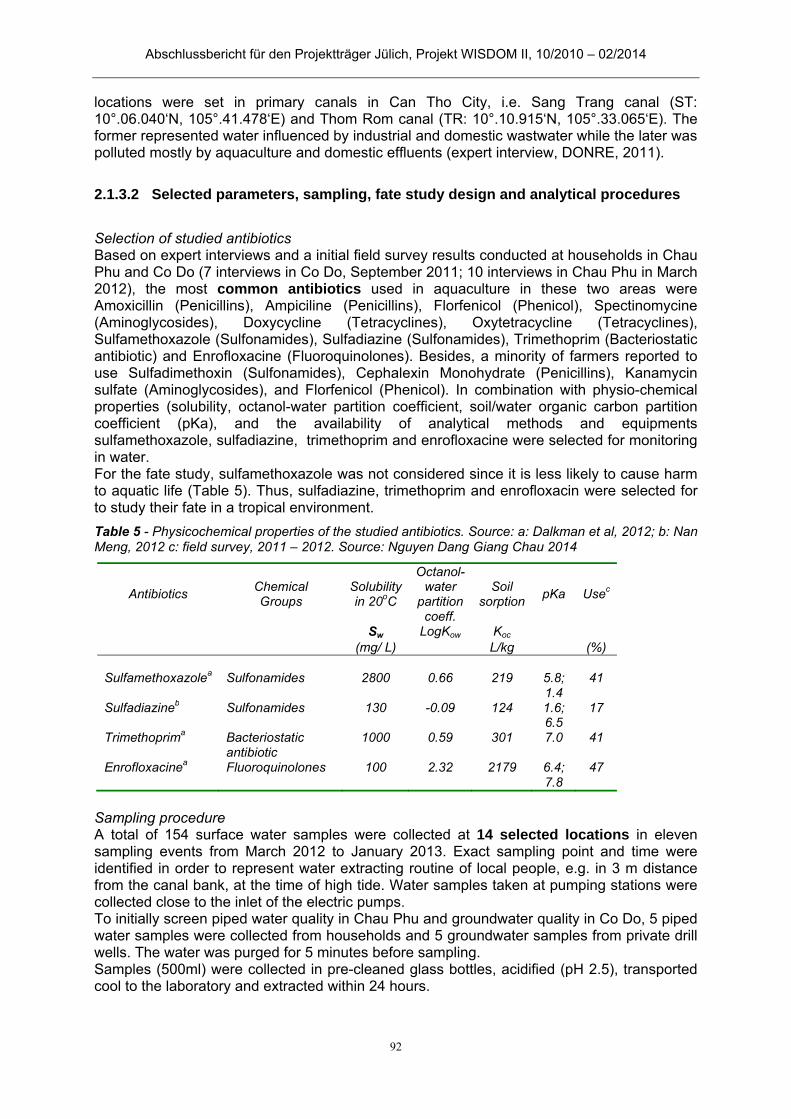
Abschlussbericht für den Projektträger Jülich, Projekt WISDOM II, 10/2010 – 02/2014
92
locations were set in primary canals in Can Tho City, i.e. Sang Trang canal (ST: 10°.06.040‘N, 105°.41.478‘E) and Thom Rom canal (TR: 10°.10.915‘N, 105°.33.065‘E). The former represented water influenced by industrial and domestic wastwater while the later was polluted mostly by aquaculture and domestic effluents (expert interview, DONRE, 2011).
2.1.3.2 Selected parameters, sampling, fate study design and analytical procedures
Selection of studied antibiotics Based on expert interviews and a initial field survey results conducted at households in Chau Phu and Co Do (7 interviews in Co Do, September 2011; 10 interviews in Chau Phu in March 2012), the most common antibiotics used in aquaculture in these two areas were Amoxicillin (Penicillins), Ampiciline (Penicillins), Florfenicol (Phenicol), Spectinomycine (Aminoglycosides), Doxycycline (Tetracyclines), Oxytetracycline (Tetracyclines), Sulfamethoxazole (Sulfonamides), Sulfadiazine (Sulfonamides), Trimethoprim (Bacteriostatic antibiotic) and Enrofloxacine (Fluoroquinolones). Besides, a minority of farmers reported to use Sulfadimethoxin (Sulfonamides), Cephalexin Monohydrate (Penicillins), Kanamycin sulfate (Aminoglycosides), and Florfenicol (Phenicol). In combination with physio-chemical properties (solubility, octanol-water partition coefficient, soil/water organic carbon partition coefficient (pKa), and the availability of analytical methods and equipments sulfamethoxazole, sulfadiazine, trimethoprim and enrofloxacine were selected for monitoring in water. For the fate study, sulfamethoxazole was not considered since it is less likely to cause harm to aquatic life (Table 5). Thus, sulfadiazine, trimethoprim and enrofloxacin were selected for to study their fate in a tropical environment.
Table 5 - Physicochemical properties of the studied antibiotics. Source: a: Dalkman et al, 2012; b: Nan Meng, 2012 c: field survey, 2011 – 2012. Source: Nguyen Dang Giang Chau 2014
Sampling procedure A total of 154 surface water samples were collected at 14 selected locations in eleven sampling events from March 2012 to January 2013. Exact sampling point and time were identified in order to represent water extracting routine of local people, e.g. in 3 m distance from the canal bank, at the time of high tide. Water samples taken at pumping stations were collected close to the inlet of the electric pumps. To initially screen piped water quality in Chau Phu and groundwater quality in Co Do, 5 piped water samples were collected from households and 5 groundwater samples from private drill wells. The water was purged for 5 minutes before sampling. Samples (500ml) were collected in pre-cleaned glass bottles, acidified (pH 2.5), transported cool to the laboratory and extracted within 24 hours.
Antibiotics Chemical Groups
Solubility in 20oC
Octanol-water
partition coeff.
Soil sorption
pKa Usec
Sw LogKow Koc (mg/ L) L/kg (%) Sulfamethoxazolea Sulfonamides 2800 0.66 219 5.8;
1.4 41
Sulfadiazineb Sulfonamides 130 -0.09 124 1.6; 6.5
17
Trimethoprima Bacteriostatic antibiotic
1000 0.59 301 7.0 41
Enrofloxacinea Fluoroquinolones 100 2.32 2179 6.4; 7.8
47
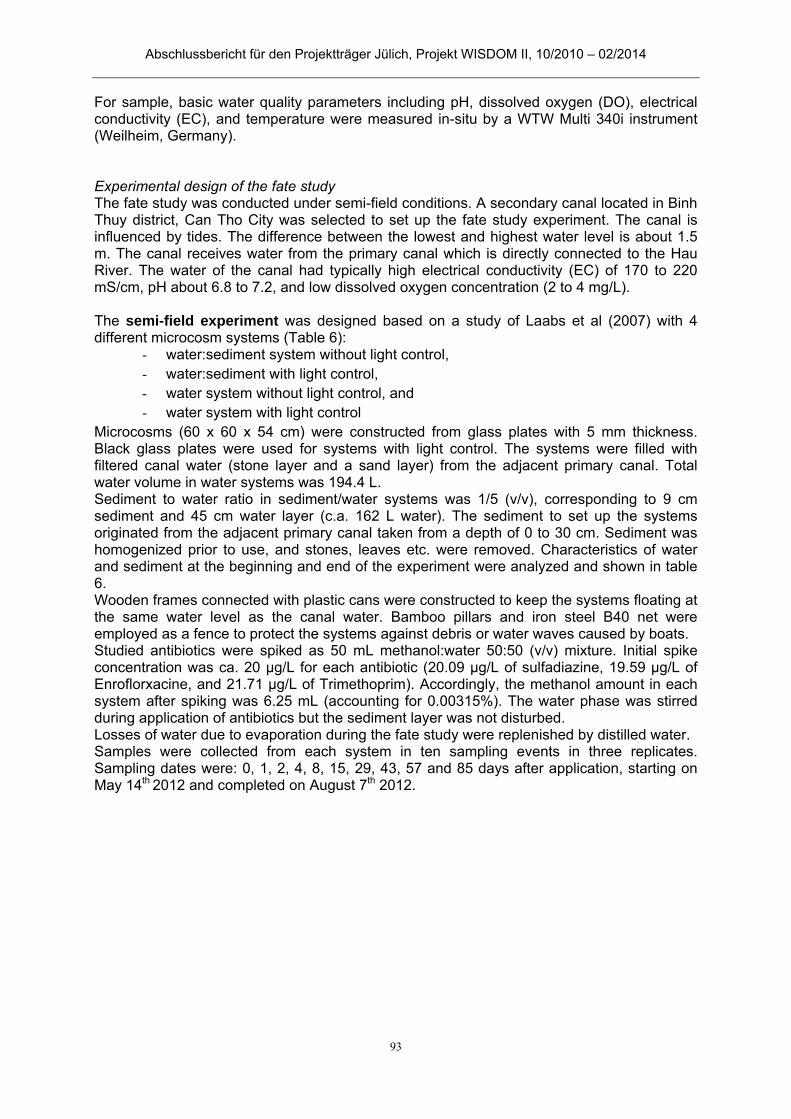
Abschlussbericht für den Projektträger Jülich, Projekt WISDOM II, 10/2010 – 02/2014
93
For sample, basic water quality parameters including pH, dissolved oxygen (DO), electrical conductivity (EC), and temperature were measured in-situ by a WTW Multi 340i instrument (Weilheim, Germany).
Experimental design of the fate study The fate study was conducted under semi-field conditions. A secondary canal located in Binh Thuy district, Can Tho City was selected to set up the fate study experiment. The canal is influenced by tides. The difference between the lowest and highest water level is about 1.5 m. The canal receives water from the primary canal which is directly connected to the Hau River. The water of the canal had typically high electrical conductivity (EC) of 170 to 220 mS/cm, pH about 6.8 to 7.2, and low dissolved oxygen concentration (2 to 4 mg/L). The semi-field experiment was designed based on a study of Laabs et al (2007) with 4 different microcosm systems (Table 6):
- water:sediment system without light control, - water:sediment with light control, - water system without light control, and - water system with light control
Microcosms (60 x 60 x 54 cm) were constructed from glass plates with 5 mm thickness. Black glass plates were used for systems with light control. The systems were filled with filtered canal water (stone layer and a sand layer) from the adjacent primary canal. Total water volume in water systems was 194.4 L. Sediment to water ratio in sediment/water systems was 1/5 (v/v), corresponding to 9 cm sediment and 45 cm water layer (c.a. 162 L water). The sediment to set up the systems originated from the adjacent primary canal taken from a depth of 0 to 30 cm. Sediment was homogenized prior to use, and stones, leaves etc. were removed. Characteristics of water and sediment at the beginning and end of the experiment were analyzed and shown in table 6. Wooden frames connected with plastic cans were constructed to keep the systems floating at the same water level as the canal water. Bamboo pillars and iron steel B40 net were employed as a fence to protect the systems against debris or water waves caused by boats. Studied antibiotics were spiked as 50 mL methanol:water 50:50 (v/v) mixture. Initial spike concentration was ca. 20 µg/L for each antibiotic (20.09 µg/L of sulfadiazine, 19.59 µg/L of Enroflorxacine, and 21.71 µg/L of Trimethoprim). Accordingly, the methanol amount in each system after spiking was 6.25 mL (accounting for 0.00315%). The water phase was stirred during application of antibiotics but the sediment layer was not disturbed. Losses of water due to evaporation during the fate study were replenished by distilled water. Samples were collected from each system in ten sampling events in three replicates. Sampling dates were: 0, 1, 2, 4, 8, 15, 29, 43, 57 and 85 days after application, starting on May 14th 2012 and completed on August 7th 2012.
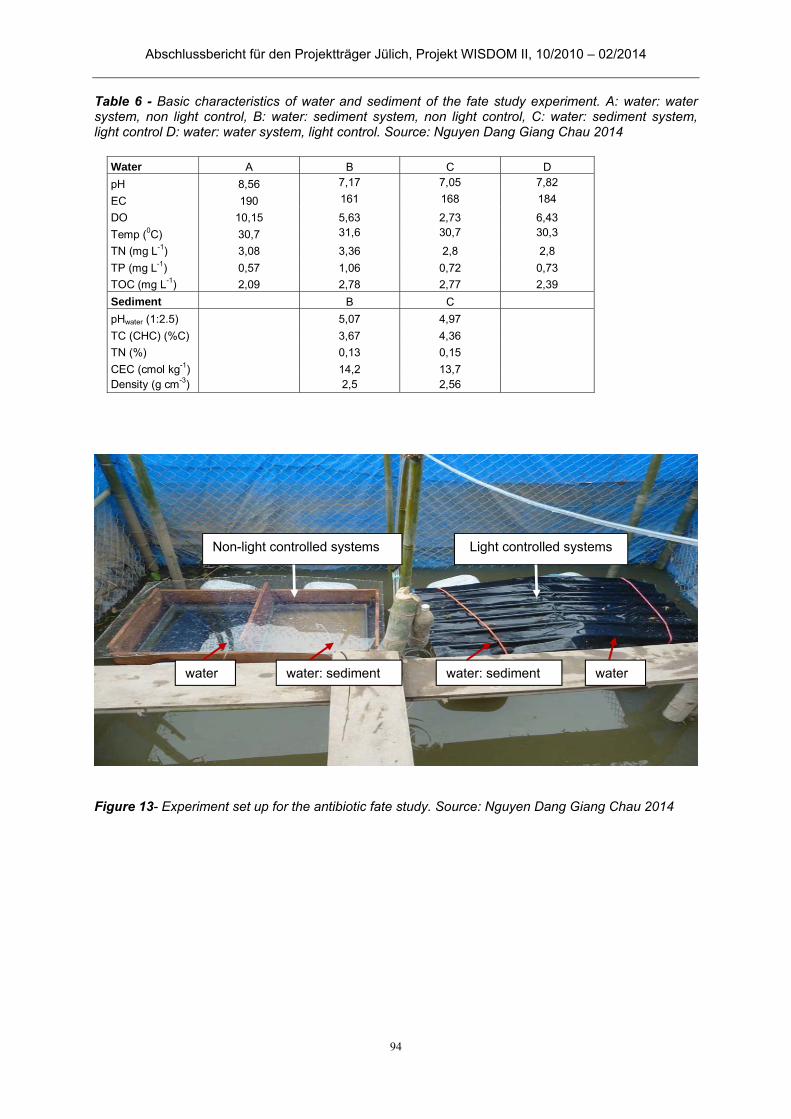
Abschlussbericht für den Projektträger Jülich, Projekt WISDOM II, 10/2010 – 02/2014
94
Table 6 - Basic characteristics of water and sediment of the fate study experiment. A: water: water system, non light control, B: water: sediment system, non light control, C: water: sediment system, light control D: water: water system, light control. Source: Nguyen Dang Giang Chau 2014
Figure 13- Experiment set up for the antibiotic fate study. Source: Nguyen Dang Giang Chau 2014
Water A B C D
pH 8,56 7,17 7,05 7,82
EC 190 161 168 184
DO 10,15 5,63 2,73 6,43
Temp (0C) 30,7 31,6 30,7 30,3
TN (mg L-1) 3,08 3,36 2,8 2,8
TP (mg L-1) 0,57 1,06 0,72 0,73
TOC (mg L-1) 2,09 2,78 2,77 2,39
Sediment B C
pHwater (1:2.5) 5,07 4,97
TC (CHC) (%C) 3,67 4,36
TN (%) 0,13 0,15
CEC (cmol kg-1) 14,2 13,7 Density (g cm-3) 2,5 2,56
Non-light controlled systems Light controlled systems
water water water: sediment water: sediment
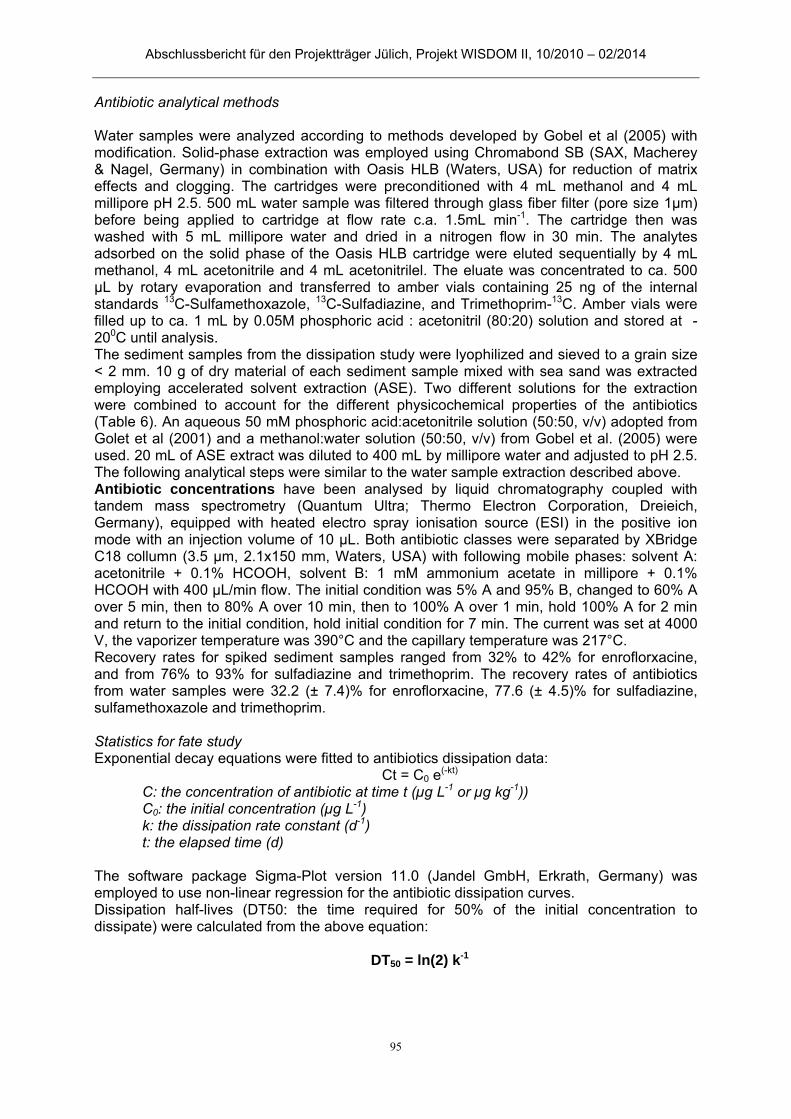
Abschlussbericht für den Projektträger Jülich, Projekt WISDOM II, 10/2010 – 02/2014
95
Antibiotic analytical methods
Water samples were analyzed according to methods developed by Gobel et al (2005) with modification. Solid-phase extraction was employed using Chromabond SB (SAX, Macherey & Nagel, Germany) in combination with Oasis HLB (Waters, USA) for reduction of matrix effects and clogging. The cartridges were preconditioned with 4 mL methanol and 4 mL millipore pH 2.5. 500 mL water sample was filtered through glass fiber filter (pore size 1µm) before being applied to cartridge at flow rate c.a. 1.5mL min-1. The cartridge then was washed with 5 mL millipore water and dried in a nitrogen flow in 30 min. The analytes adsorbed on the solid phase of the Oasis HLB cartridge were eluted sequentially by 4 mL methanol, 4 mL acetonitrile and 4 mL acetonitrilel. The eluate was concentrated to ca. 500 µL by rotary evaporation and transferred to amber vials containing 25 ng of the internal standards 13C-Sulfamethoxazole, 13C-Sulfadiazine, and Trimethoprim-13C. Amber vials were filled up to ca. 1 mL by 0.05M phosphoric acid : acetonitril (80:20) solution and stored at -200C until analysis. The sediment samples from the dissipation study were lyophilized and sieved to a grain size < 2 mm. 10 g of dry material of each sediment sample mixed with sea sand was extracted employing accelerated solvent extraction (ASE). Two different solutions for the extraction were combined to account for the different physicochemical properties of the antibiotics (Table 6). An aqueous 50 mM phosphoric acid:acetonitrile solution (50:50, v/v) adopted from Golet et al (2001) and a methanol:water solution (50:50, v/v) from Gobel et al. (2005) were used. 20 mL of ASE extract was diluted to 400 mL by millipore water and adjusted to pH 2.5. The following analytical steps were similar to the water sample extraction described above. Antibiotic concentrations have been analysed by liquid chromatography coupled with tandem mass spectrometry (Quantum Ultra; Thermo Electron Corporation, Dreieich, Germany), equipped with heated electro spray ionisation source (ESI) in the positive ion mode with an injection volume of 10 µL. Both antibiotic classes were separated by XBridge C18 collumn (3.5 µm, 2.1x150 mm, Waters, USA) with following mobile phases: solvent A: acetonitrile + 0.1% HCOOH, solvent B: 1 mM ammonium acetate in millipore + 0.1% HCOOH with 400 µL/min flow. The initial condition was 5% A and 95% B, changed to 60% A over 5 min, then to 80% A over 10 min, then to 100% A over 1 min, hold 100% A for 2 min and return to the initial condition, hold initial condition for 7 min. The current was set at 4000 V, the vaporizer temperature was 390°C and the capillary temperature was 217°C. Recovery rates for spiked sediment samples ranged from 32% to 42% for enroflorxacine, and from 76% to 93% for sulfadiazine and trimethoprim. The recovery rates of antibiotics from water samples were 32.2 (± 7.4)% for enroflorxacine, 77.6 (± 4.5)% for sulfadiazine, sulfamethoxazole and trimethoprim. Statistics for fate study Exponential decay equations were fitted to antibiotics dissipation data:
Ct = C0 e(-kt)
C: the concentration of antibiotic at time t (µg L-1 or µg kg-1)) C0: the initial concentration (µg L-1) k: the dissipation rate constant (d-1) t: the elapsed time (d)
The software package Sigma-Plot version 11.0 (Jandel GmbH, Erkrath, Germany) was employed to use non-linear regression for the antibiotic dissipation curves. Dissipation half-lives (DT50: the time required for 50% of the initial concentration to dissipate) were calculated from the above equation:
DT50 = ln(2) k-1

Abschlussbericht für den Projektträger Jülich, Projekt WISDOM II, 10/2010 – 02/2014
96
2.1.3.3 Results
Differences in fish farming practices and antibiotic use at the study sites 2.1.3.3.1
Results from the interviews conducted from September 2011 and March 2013 are summarized in Table 7. In Co Do (fish hatcheries) farmers cultured ca. 2.6 million fishes per hectare with an average production yield of ca. 5.1 tons ha-1 (ca. 30 g weight at the time of harvest). Mortality was typically high (40% - 50% per season) due to the sensitivity of fingerlings to diseases. Average fish density at the mature fish farms in Chau Phu was 374,074 fishes per hectare; production yield was ca. 230 tons ha-1 per season (from 800 to 900 g weight at the time of harvest) with a loss rate of mature fish around 30%. Prevalent fish diseases recorded at both sites were 1) red spot disease with the occurrence of hemorrhages on head, mouth and fins, 2) necrosis causing spots on liver, kidney, spleen. Antibiotics were applied not only to treat the diseases and prevent the outbreak but also prophylacticaly. Antibiotics for disease treatment were applied following the instruction of aquaculture extentionists in the case of Co Do, or the recommendation of the production label or instruction of the antibiotic retailers in Chau Phu. Prophylactic use was normally based on personal experience of fish farmers or on their fellows (field survey, 2011). Table 7 - Fish farming and antibiotic use in Co Do and Chau Phu. Source: Nguyen Dang Giang Chau 2014 Co Do (n = 7) Chau Phu (n = 10)
Ave. farm size (ha) 2.9 1.8 Ave. fish weight (gr) 30 960
Density (fishes/ha) 2,665,485 374,074
Ave. production (tons ha-1) per season Hatchery Mature
5.1
230
Loss rate per season (%) 40 - 50 30
Water exchange frequency (days) 35 Everyday
Water level in pond (m) 1 - 1.5 2.5 - 5
Antibiotic use technique Instruction on label, Antibiotic retailers
Aquaculture extensionists
Direct expose to antibiotics when applying (%) 100 100
Ave. type of antibiotics use per season 2 3 Overdose application 40% -
Farmers at both sites used their unprotected hands to mix antibiotics with food or water (in case of bath treatments). In general two different antibiotic active ingredients (a.i) were applied per farm in Co Do and three in Chau Phu. No information could be collected on antibiotic dosage in mature pangasius farms in Chau Phu because local fish farmers refused to answer and asserted to completely follow the instruction of aquaculture extension officers. In the hatchery fish farms in Co Do, 40% of farmers reported to apply higher dosage than the recommendation on the product's label. At the mature pangasius farms, pond water was partly refreshed every day and the wastewater was normally discharged to the surrounding fields or in some cases to the adjacent canals where local people extracted water for domestic use. In Co Do, the hatchery fish farms discharged water from the ponds every 35 days in average. Water was taken in or discharged out from the same canal (where sampling locations were set). Water treatment before discharge was only reported at one farm.
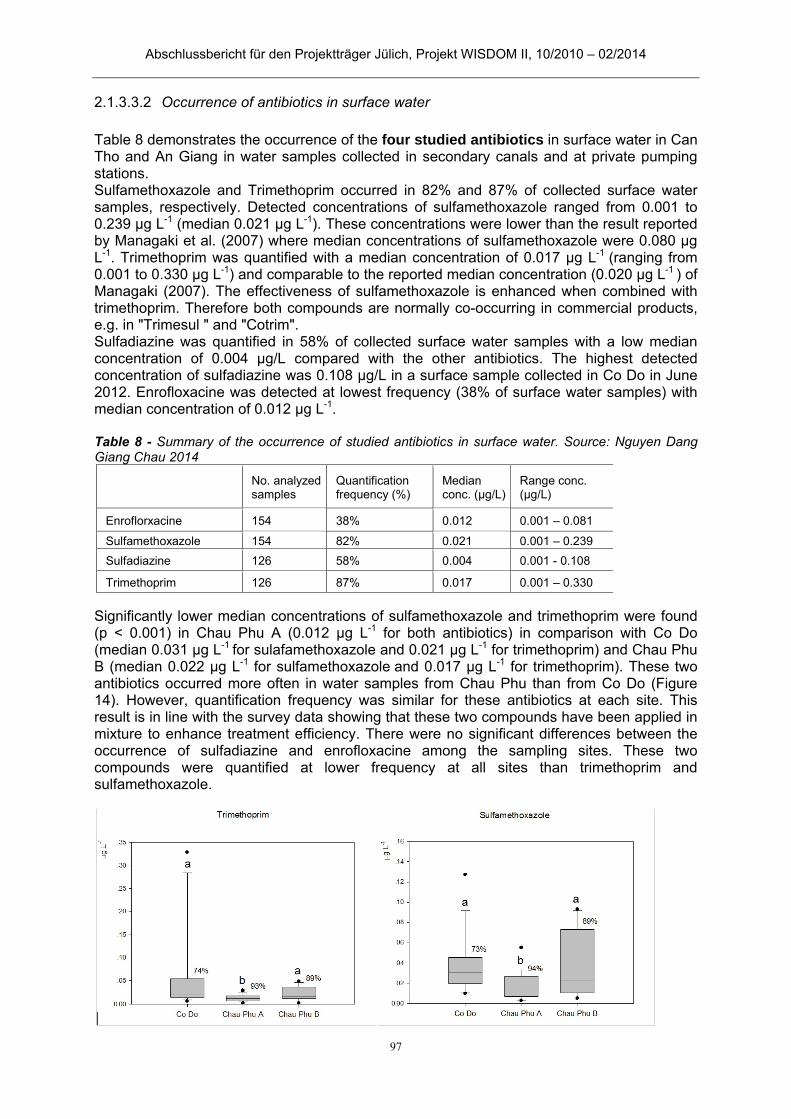
Abschlussbericht für den Projektträger Jülich, Projekt WISDOM II, 10/2010 – 02/2014
97
Occurrence of antibiotics in surface water 2.1.3.3.2
Table 8 demonstrates the occurrence of the four studied antibiotics in surface water in Can Tho and An Giang in water samples collected in secondary canals and at private pumping stations. Sulfamethoxazole and Trimethoprim occurred in 82% and 87% of collected surface water samples, respectively. Detected concentrations of sulfamethoxazole ranged from 0.001 to 0.239 µg L-1 (median 0.021 µg L-1). These concentrations were lower than the result reported by Managaki et al. (2007) where median concentrations of sulfamethoxazole were 0.080 µg L-1. Trimethoprim was quantified with a median concentration of 0.017 µg L-1 (ranging from 0.001 to 0.330 µg L-1) and comparable to the reported median concentration (0.020 µg L-1 ) of Managaki (2007). The effectiveness of sulfamethoxazole is enhanced when combined with trimethoprim. Therefore both compounds are normally co-occurring in commercial products, e.g. in "Trimesul " and "Cotrim". Sulfadiazine was quantified in 58% of collected surface water samples with a low median concentration of 0.004 µg/L compared with the other antibiotics. The highest detected concentration of sulfadiazine was 0.108 µg/L in a surface sample collected in Co Do in June 2012. Enrofloxacine was detected at lowest frequency (38% of surface water samples) with median concentration of 0.012 µg L-1. Table 8 - Summary of the occurrence of studied antibiotics in surface water. Source: Nguyen Dang Giang Chau 2014
Significantly lower median concentrations of sulfamethoxazole and trimethoprim were found (p < 0.001) in Chau Phu A (0.012 µg L-1 for both antibiotics) in comparison with Co Do (median 0.031 µg L-1 for sulafamethoxazole and 0.021 µg L-1 for trimethoprim) and Chau Phu B (median 0.022 µg L-1 for sulfamethoxazole and 0.017 µg L-1 for trimethoprim). These two antibiotics occurred more often in water samples from Chau Phu than from Co Do (Figure 14). However, quantification frequency was similar for these antibiotics at each site. This result is in line with the survey data showing that these two compounds have been applied in mixture to enhance treatment efficiency. There were no significant differences between the occurrence of sulfadiazine and enrofloxacine among the sampling sites. These two compounds were quantified at lower frequency at all sites than trimethoprim and sulfamethoxazole.
No. analyzed samples
Quantification frequency (%)
Median conc. (µg/L)
Range conc. (µg/L)
Enroflorxacine 154 38% 0.012 0.001 – 0.081
Sulfamethoxazole 154 82% 0.021 0.001 – 0.239
Sulfadiazine 126 58% 0.004 0.001 - 0.108
Trimethoprim 126 87% 0.017 0.001 – 0.330

Abschlussbericht für den Projektträger Jülich, Projekt WISDOM II, 10/2010 – 02/2014
98
Figure 14 - Residues of studied antibiotics in Co Do and Chau Phu A, Chau Phu B. The box-and-Whisker plots show the 10th percentile, 25th percentile, median, 75th percentile, and 90th percentile. The dots show outlier concentrations. The letters “a” and “b” above the boxes for sulfamethoxazole and trimethoprim indicate significantly different concentrations between the sites at p < 0.001. The numbers above the boxes indicate the quantification frequency. Source: Nguyen Dang Giang Chau 2014 Antibiotics were been detected in any of the collected ground- or piped water samples.
Risk assessment 2.1.3.3.3
To assess the potential risk associated with antibiotic residues in aquatic environment, the results were compared with Predicted No Effect Concentrations (PNEC) for aquatic organisms. Concentrations lower than the PNEC, are assumed not to pose risk to the environment (EC, 2003). The toxicity data of individual studied compounds consisting of different EC-values (effect concentration) and NOECs (no effect concentrations) is shown in Table 9. Where possible, the NOEC was used, since it is assumed to be the more conservative value. Assessment factors were based on EC guidelines (2003). Accordingly, measured concentrations of studied antibiotics did not pose risk to the aquatic environment since the ratio of the quantified concentrations of all collected water samples and the calculated PNEC values was lower than 1 (Table 9). Table 9 - Toxicity data from different aquatic organisms exposed to studied antibiotics and calculated PNEC. Source: Nguyen Dang Giang Chau 2014

Abschlussbericht für den Projektträger Jülich, Projekt WISDOM II, 10/2010 – 02/2014
99
Fate of sulfadiazine, trimethoprim and enrofloxacine 2.1.3.3.4
Experimental data (Table 10) showed that in water systems trimethoprime was the most persistent antibiotic (DT50 > 29 days), while enrofloxacine was the least persistent one (DT50 <1 day). In water:sediment systems, sulfadiazine showed the highest persistence in the both the water phase and in the water:sediment system in total (DT50 >24 days). Dissipation of sulfadiazine and enrofloxacin was affected by light with faster dissipation under light influence. Similar pattern was found for sulfadiazine in the water phase of the water:sediment system.
Enroflorxacin showed a strong sorption to sediment after application (much higher portion of subtance in sediment phase causing low extraction efficiency and low recovery). Therefore, it is neccessary to develop a high performance method for the determination of enroflorxacin residue in sediment/soil samples in the future.
Antibiotics Species Test Duration
Concentration
Sources Factor
PNEC
h mg L-1 µg L-1
Sulfamethoxazole
Daphnia Danio rerio (fish) Oryzias latipes (fish)
EC50 LC50 LC50
96 96 96
177 - 204 >1000 562.5
Li et al, 2009 Li et al, 2009 Li et al, 2009
1000 562.5
Sulfadiazine Daphnia magna Algae
EC50 NOEC
48 96
>57 <1
UoH, 2011 UoH, 2011
100 10
Trimethoprim
Oryzias latipes (fish) Daphnia magna Algae
LC50 LC50 NOEC
96 48 96
>100 123 25.5
UoH, 2011 UoH, 2011 UoH, 2011
100 255
Enrofloxacine
Oryzias latipes (fish) Oryzias latipes (fish) Daphnia magna
LC50 NOEC NOEC
96 21 days 21 days
10 1 1
UoH, 2011 UoH, 2011 UoH, 2011 50 20
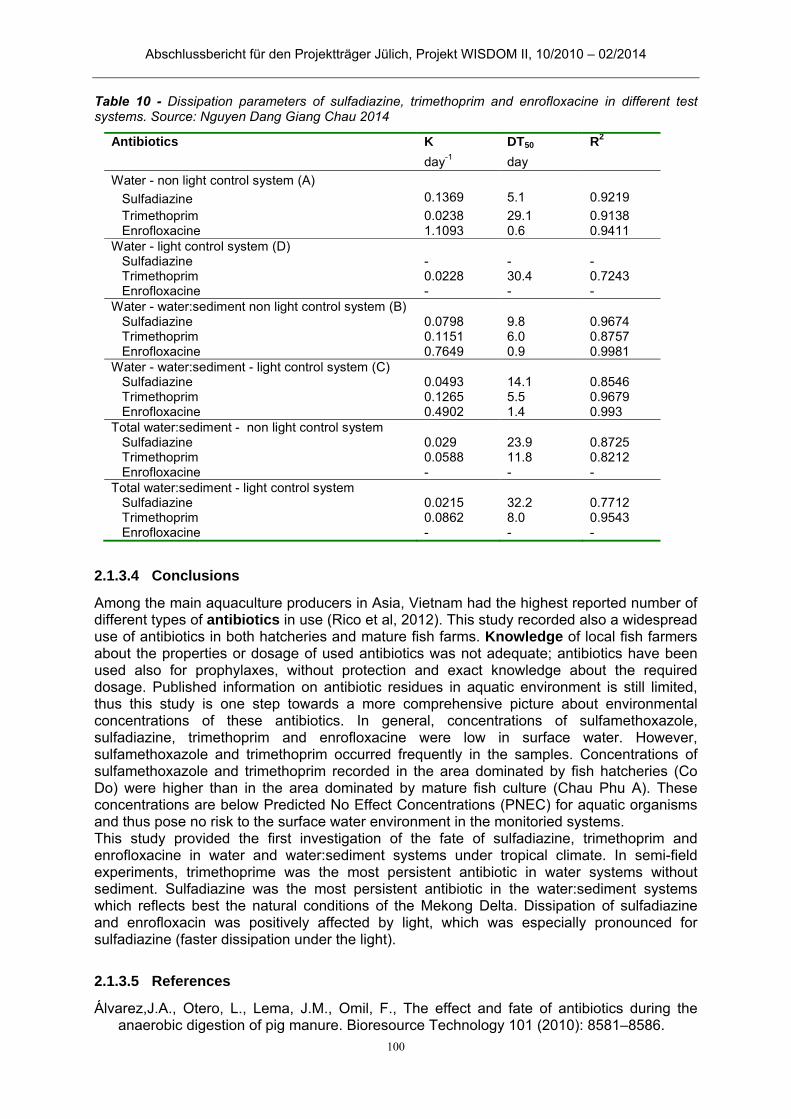
Abschlussbericht für den Projektträger Jülich, Projekt WISDOM II, 10/2010 – 02/2014
100
Table 10 - Dissipation parameters of sulfadiazine, trimethoprim and enrofloxacine in different test systems. Source: Nguyen Dang Giang Chau 2014
2.1.3.4 Conclusions
Among the main aquaculture producers in Asia, Vietnam had the highest reported number of different types of antibiotics in use (Rico et al, 2012). This study recorded also a widespread use of antibiotics in both hatcheries and mature fish farms. Knowledge of local fish farmers about the properties or dosage of used antibiotics was not adequate; antibiotics have been used also for prophylaxes, without protection and exact knowledge about the required dosage. Published information on antibiotic residues in aquatic environment is still limited, thus this study is one step towards a more comprehensive picture about environmental concentrations of these antibiotics. In general, concentrations of sulfamethoxazole, sulfadiazine, trimethoprim and enrofloxacine were low in surface water. However, sulfamethoxazole and trimethoprim occurred frequently in the samples. Concentrations of sulfamethoxazole and trimethoprim recorded in the area dominated by fish hatcheries (Co Do) were higher than in the area dominated by mature fish culture (Chau Phu A). These concentrations are below Predicted No Effect Concentrations (PNEC) for aquatic organisms and thus pose no risk to the surface water environment in the monitoried systems. This study provided the first investigation of the fate of sulfadiazine, trimethoprim and enrofloxacine in water and water:sediment systems under tropical climate. In semi-field experiments, trimethoprime was the most persistent antibiotic in water systems without sediment. Sulfadiazine was the most persistent antibiotic in the water:sediment systems which reflects best the natural conditions of the Mekong Delta. Dissipation of sulfadiazine and enrofloxacin was positively affected by light, which was especially pronounced for sulfadiazine (faster dissipation under the light).
2.1.3.5 References
Álvarez,J.A., Otero, L., Lema, J.M., Omil, F., The effect and fate of antibiotics during the anaerobic digestion of pig manure. Bioresource Technology 101 (2010): 8581–8586.
Antibiotics K DT50 R2
day-1 day
Water - non light control system (A)
Sulfadiazine 0.1369 5.1 0.9219
Trimethoprim 0.0238 29.1 0.9138 Enrofloxacine 1.1093 0.6 0.9411 Water - light control system (D) Sulfadiazine - - - Trimethoprim 0.0228 30.4 0.7243 Enrofloxacine - - - Water - water:sediment non light control system (B) Sulfadiazine 0.0798 9.8 0.9674 Trimethoprim 0.1151 6.0 0.8757 Enrofloxacine 0.7649 0.9 0.9981 Water - water:sediment - light control system (C) Sulfadiazine 0.0493 14.1 0.8546 Trimethoprim 0.1265 5.5 0.9679 Enrofloxacine 0.4902 1.4 0.993 Total water:sediment - non light control system Sulfadiazine 0.029 23.9 0.8725 Trimethoprim 0.0588 11.8 0.8212 Enrofloxacine - - - Total water:sediment - light control system Sulfadiazine 0.0215 32.2 0.7712 Trimethoprim 0.0862 8.0 0.9543 Enrofloxacine - - -
Abschlussbericht für den Projektträger Jülich, Projekt WISDOM II, 10/2010 – 02/2014
101
Anh, D. H., Ha, P. N., a, Tung, N. H., Thuong, H. T., Viet, P. H., Ca, P. V., Berg, M., Giger, W., Alder, A. C., Occurrence, fate and antibiotic resistance of fluoroquinolone antibacterials in hospital wastewaters in Hanoi, Vietnam, Chemosphere 72 (2008): 968–973.
Dalkmann, P., Broszat, M., Siebe, C., Willaschek, E., Sakinc, T., Huebner, J., Accumulation of pharmaceuticals, enterococcus, and resistance genes in soils irrigated with wastewater for zero to 100 years in central Mexico. PLoS ONE 7(9) (2012): e45397. Doi:10.1371/journal.pone.0045379
FAO, 2012. Food and agriculture organization of the United Nations. The state of world fisheries and aquaculture 2012. http://www.fao.org/docrep/017/i3028e/i3028e.pdf
Giger, W., Alder, A.C., Golet, E. M., Kohler, H. E., McArdell, C. S., Molnar, E., Siegrist, H., Suter, Marc J.-F., Occurrence and fate of antibiotics as trace contaminants in wastewaters, sewage sludge, and surface saters, Chimia 57 (2003): 485–491.
Göbel, A., Thomsen, A., McArdell, C.S., Alder, A.C., Giger, W., Theiß, N., Löffler, D., Ternes, T.A, Extraction and determination of sulfonamides, macrolides, and trimethoprim in sewage sludge. Journal of Chromatography A, 1085 (2) (2005): 179-189.
Golet, E.M., Alder, A.C., Hartmann, A., Temes, T.A., Giger, W., Trace determination of fluoroquinolone antibacterial agents in urban wastewater by solid-phase extraction and liquid chromatography with fluorescence detection. Analytical Chemistry 73 (201), 3632-3638.
GSO, 2012, General Statistics Office. Statistical yearbook of Vietnam 2012. Statistical Publishing House; Vietnam
Kemper N., Veterinary antibiotics in the aquatic and terrestrial environment, Ecological Indicators 8 (2008): 1 – 13.
Laabs, V., Wehrhan, A., Pinto, A., Dores, E., Amelung, W., Pesticide fate in tropical wetlands of Brazil: an aquatic microcosm study under semi-field conditions. Chemosphere 67 (2007): 975–989
Li, Z. H., Randak, T., Residual pharmaceutically active compounds (PhACs) in aquatic environment – status, toxicity and kinetics: a review. Veterinarni Medicina, 52 (2009) (7): 95–314
Managaki, S., Murata, A., Takada, H., Tuyen, B.C., Chiem, N.H., Distribution of macrolides, sulfonamides and trimethoprim in tropical waters: ubiquitous occurrence of veterinary antibiotics in the Mekong Delta, Environmental Sciences & Technology 41(2007): 8004-8010.
Nan Meng. Fate of the Antibiotic Sulfadiazine in Yangtze River Sediments: Transformation, Sorption and Transport. Doctoral dissertation. Aachen University (2010). http://darwin.bth.rwth-aachen.de/opus3/volltexte/2011/3804/pdf/3804.pdf
Rico, A., Satapornvanit, K., Haque, M. M., Min, J., Phuong, N. T., Telfer, T. C., and van den Brink, P. J., Use of chemicals and biological products in Asian aquacultur and their potential environmental risks: a critical review. Reviews in Aquaculture 4 (2012): 1 - 19.
Rosendahl, I., Siemens, J., Groeneweg, J., Linzbach, E., Laabs, V., Herrmann, C., Vereecken, H., Amelung, W., Dissipation and Sequestration of the Veterinary Antibiotic Sulfadiazine and Its Metabolites under Field Conditions. Environmental science and technology 45 (2011): 5216–5222
Schauss, K., Focks, A., Heuer, H., Kotzerke, A., Schmitt, H., Thiele-Bruhn, S., Smalla, K., Wilke, B.-M., Matthies, M., Amelung, W., Klasmeier J., Schloter M., Analysis, fate and effects of the antibiotic sulfadiazine in soil ecosystems. Trends in Analytical Chemistry 28(5) (2009): 612 – 618.
Schlüsener, M., Fate, pathways and methods for the determination of selected antibiotics and steroid hormones in the environment. Dissertation, University of Duisburg-Essen, Campus Essen, Institute for Environmental Analysis and Applied Geochemistry, 2006.
TGD, 2003. Technical Guidance Document on Risk Assessment Part II (2003). European Commission. http://ihcp.jrc.ec.europa.eu/our_activities/public-health/risk_assessment_of_Biocides/doc/tgd
Tuan, X.L., Munekage, Y., Residues of selected antibiotics in water and mud from shrimp ponds in mangrove areas in Vietnam, Marine Pollution Bulletin 49 (2004) 922-929.
Abschlussbericht für den Projektträger Jülich, Projekt WISDOM II, 10/2010 – 02/2014
102
UoH, 2011. University of Hertfordshire. VSDB: Veterinary substances database. Last updated 2011. http://sitem.herts.ac.uk/aeru/vsdb/1745.htm
Abschlussbericht für den Projektträger Jülich, Projekt WISDOM II, 10/2010 – 02/2014
103
Impact of different rice production systems on the water quality in the 2.1.4Mekong delta
2.1.4.1 Introduction and objectives
The Mekong delta was formed by slow deposition of alluvial materials from upstream. It is a very fertile alluvial floodplain. About 75% of the land is used for agricultural production with rice (Oryza sativa L.) being the main product (GSO, 2002; De, 2006). From 1995 to 2013, the Mekong Delta contributed with more than 50% of the total rice production in Vietnam (GSO, 2013). Rice output of the delta was 10-13 million tons/year during 1976-1995; 14-19 million tons/year during 1996-2004, and reached 19-24 million tons/year during 2005-2012 (GSO, 1976-2012). The increase in yield corresponded with increasing inputs of agrichemicals. Fertilizer use increased constantly in the Mekong delta. The amount ranged from 40 kg of N-P2O5-K2O in 1976 (Lang et al., 2006) to 62 kg/ha during 1978-79 (Dung, 2007), 120 kg/ha during 1987-88 (Lang et al., 2006); 198 kg/ha in 1996-97 (Khiem and Khai, 2008; Dung et al., 1999; Lang et al., 2006), and reached the highest reported amount during 1995-2003 with more than 220 kg/ha (Dung, 2007; Berg, 2002; Lang et al., 2006). The amount was ca. 190 kg/ha during 2011-2012 (own field survey, 2011-2012). Recommended amount for fertilizer input is 120; 30; 30 kg/ha for N-P2O5-K2O in the dry season; and 100; 30; 50 for the wet season (CTU, 2003; Huan et al., 2005). The number of pesticide applications per season increased also constantly from 5.3 times/season in 1995 (World Bank, 1995) to 7.2 times in 1999 (Berg, 2002). In 2005, farmers sprayed an average of 6.1 times/season (Lang et al., 2006), while a recent study reported 6.8-8.0 application/season in 2008-2009 in Dong Thap (Toan, 2011). The amount of pesticide active ingredient (a.i) used per hectare also increased consistently over the period of 1979-2005 from 0.9 – to 3.0 kg a.i/ha (IRRN, 1980; Rothius 1998; Dung and Dung, 2003; UNEP, 2005; Berg, 2003; Lang et al,. 2006; Dung, 2003; Phuong and Gopalakrishnan, 2003). In the period of 2007-2009 amounts dropped to 2.1 kg a.i/ha (Toan, 2011; Berg and Tam, 2012), and recently to 1.4 kg a.i/ha for all seasons (own Field Survey 2011-2012). Pesticides have been applied mainly in order to fight diseases and pests and at the beginning of the rice season also to kill weeds. The brown plant hopper (BPH) is one of the pests of concern. The first hopper burn occurred 1975 in several locations (Dyck and Thomas, 1979). During 1976-1979, brown plant hopper (BPH) damaged more than 100,000 ha of rice crop. At the same time, many provinces like Can Tho, An Giang, Tien Giang, Tra Vinh faced difficulties to control rice blast disease (Huynh, 2004; De, 2006). BPH caused serious losses in 1978, 1991, 1992; in the years of 1999-2003; and in 2006 (Chau, 2007). In 2006-2007 rice production was seriously affected by virus diseases transmitted by planthoppers (Heong et al., 2008). Heavy damage was caused by rice grassy stunt virus (RGSV) or Rice ragged stunt virus (Thong, 2008; Lam, 2007). Next to BPH, the leaf folder (Cnaphalocrocis medinalis) was considered as serious problem by farmers and triggered pesticide application in the 1990s (Huan et al., 1999). The rice caseworm (Nymphula depunctalis) appeared first in the Mekong delta in 1998 and infested 21,815 ha rice fields in 2002 (De, 2006). The golden apple snail (Pomacea canaliculata) appeared first in the Mekong delta in 1988-1989. It causes problems in rice fields with direct-seeding and in rice fields in the flood-prone area (De, 2006). Recently, the estimated damage by golden apple snail in the Mekong delta was about 10,000 ha of rice (Nhan Dan news, 2013). Farmers use either molluscicides or remove the snails by hand-picking. Some farmers also raise ducks on the fields to fight the golden apple snail (Field survey, 2011-2012). Intensive rice cultivation (up to 3.5 rice crops/year) together with intensive agrichemical use caused negative impacts such as i) severe insect pests and disease outbreaks (Sebesvari et al. 2011) and pollution of the environment as well as drinking water and food items (Sebesvari et al. 2012, Toan et al. 2013). In order to lower inputs such as agrichemicals and seeds, enhance farmer´s income as well as the sustainability of rice production, the government launched various programs aiming to establish better crop management and
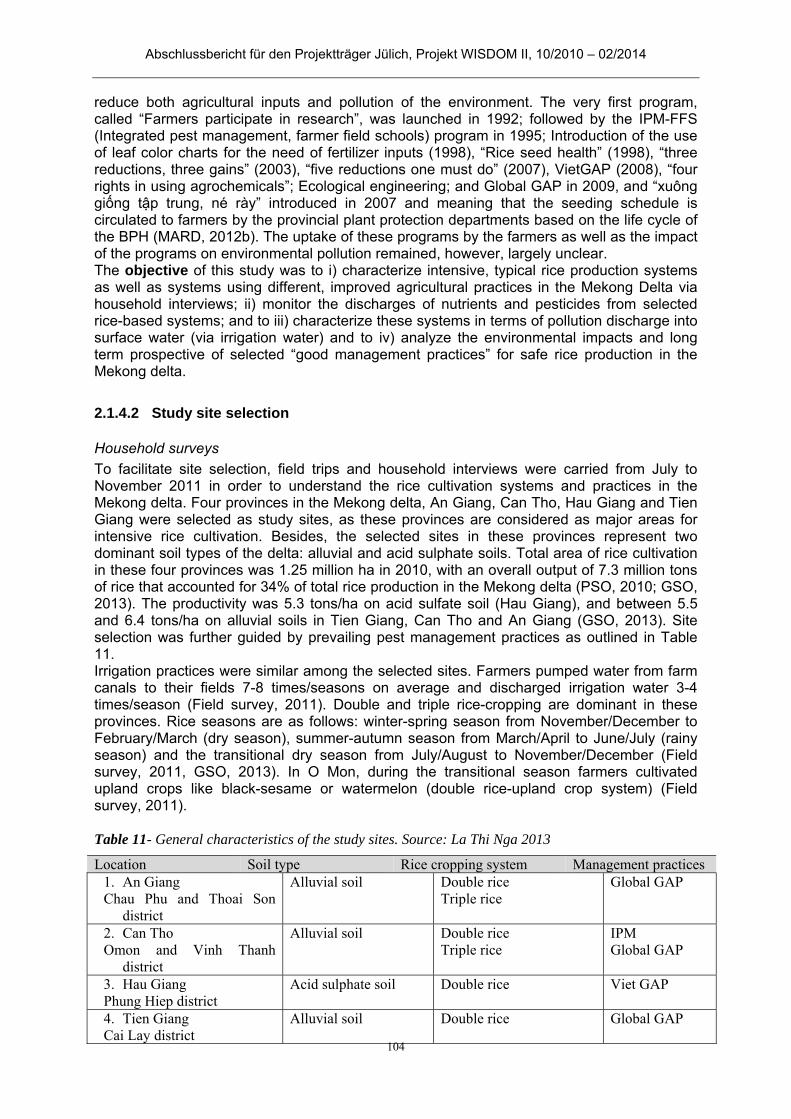
Abschlussbericht für den Projektträger Jülich, Projekt WISDOM II, 10/2010 – 02/2014
104
reduce both agricultural inputs and pollution of the environment. The very first program, called “Farmers participate in research”, was launched in 1992; followed by the IPM-FFS (Integrated pest management, farmer field schools) program in 1995; Introduction of the use of leaf color charts for the need of fertilizer inputs (1998), “Rice seed health” (1998), “three reductions, three gains” (2003), “five reductions one must do” (2007), VietGAP (2008), “four rights in using agrochemicals”; Ecological engineering; and Global GAP in 2009, and “xuông giống tập trung, né rày” introduced in 2007 and meaning that the seeding schedule is circulated to farmers by the provincial plant protection departments based on the life cycle of the BPH (MARD, 2012b). The uptake of these programs by the farmers as well as the impact of the programs on environmental pollution remained, however, largely unclear. The objective of this study was to i) characterize intensive, typical rice production systems as well as systems using different, improved agricultural practices in the Mekong Delta via household interviews; ii) monitor the discharges of nutrients and pesticides from selected rice-based systems; and to iii) characterize these systems in terms of pollution discharge into surface water (via irrigation water) and to iv) analyze the environmental impacts and long term prospective of selected “good management practices” for safe rice production in the Mekong delta.
2.1.4.2 Study site selection
Household surveys
To facilitate site selection, field trips and household interviews were carried from July to November 2011 in order to understand the rice cultivation systems and practices in the Mekong delta. Four provinces in the Mekong delta, An Giang, Can Tho, Hau Giang and Tien Giang were selected as study sites, as these provinces are considered as major areas for intensive rice cultivation. Besides, the selected sites in these provinces represent two dominant soil types of the delta: alluvial and acid sulphate soils. Total area of rice cultivation in these four provinces was 1.25 million ha in 2010, with an overall output of 7.3 million tons of rice that accounted for 34% of total rice production in the Mekong delta (PSO, 2010; GSO, 2013). The productivity was 5.3 tons/ha on acid sulfate soil (Hau Giang), and between 5.5 and 6.4 tons/ha on alluvial soils in Tien Giang, Can Tho and An Giang (GSO, 2013). Site selection was further guided by prevailing pest management practices as outlined in Table 11. Irrigation practices were similar among the selected sites. Farmers pumped water from farm canals to their fields 7-8 times/seasons on average and discharged irrigation water 3-4 times/season (Field survey, 2011). Double and triple rice-cropping are dominant in these provinces. Rice seasons are as follows: winter-spring season from November/December to February/March (dry season), summer-autumn season from March/April to June/July (rainy season) and the transitional dry season from July/August to November/December (Field survey, 2011, GSO, 2013). In O Mon, during the transitional season farmers cultivated upland crops like black-sesame or watermelon (double rice-upland crop system) (Field survey, 2011). Table 11- General characteristics of the study sites. Source: La Thi Nga 2013
Location Soil type Rice cropping system Management practices 1. An Giang Chau Phu and Thoai Son
district
Alluvial soil Double rice Triple rice
Global GAP
2. Can Tho Omon and Vinh Thanh
district
Alluvial soil Double rice Triple rice
IPM Global GAP
3. Hau Giang Phung Hiep district
Acid sulphate soil Double rice Viet GAP
4. Tien Giang Cai Lay district
Alluvial soil Double rice Global GAP
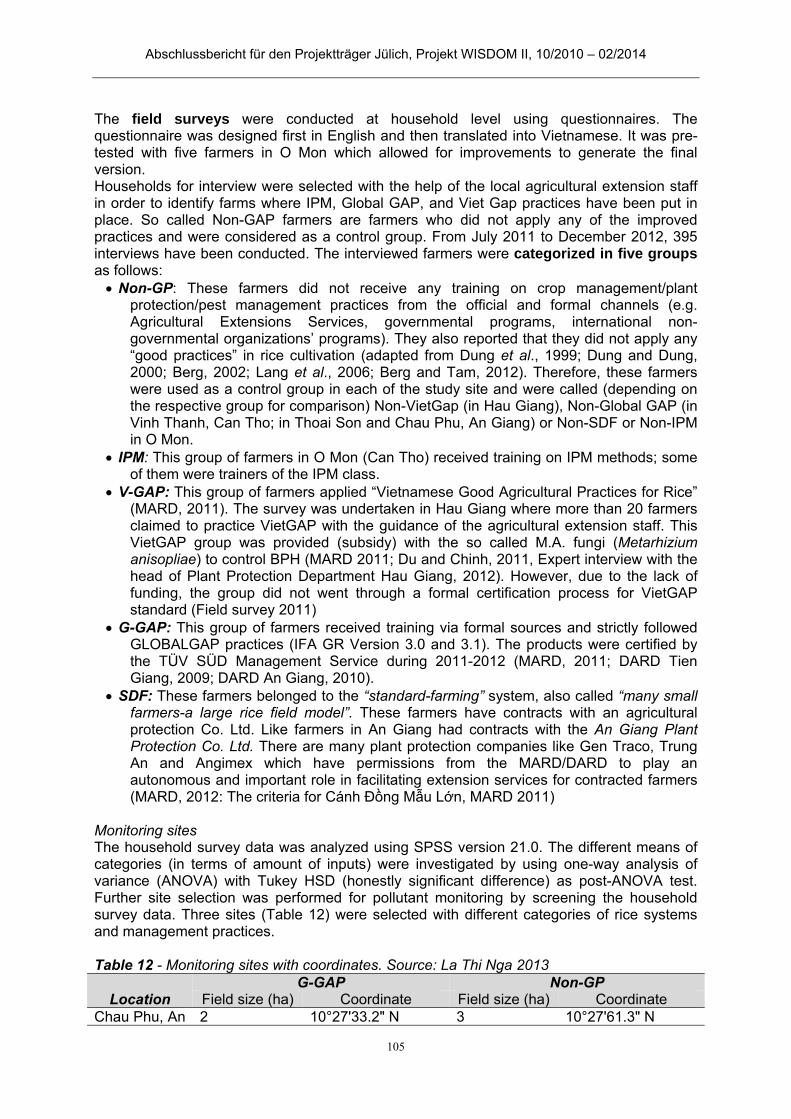
Abschlussbericht für den Projektträger Jülich, Projekt WISDOM II, 10/2010 – 02/2014
105
The field surveys were conducted at household level using questionnaires. The questionnaire was designed first in English and then translated into Vietnamese. It was pre-tested with five farmers in O Mon which allowed for improvements to generate the final version. Households for interview were selected with the help of the local agricultural extension staff in order to identify farms where IPM, Global GAP, and Viet Gap practices have been put in place. So called Non-GAP farmers are farmers who did not apply any of the improved practices and were considered as a control group. From July 2011 to December 2012, 395 interviews have been conducted. The interviewed farmers were categorized in five groups as follows: Non-GP: These farmers did not receive any training on crop management/plant
protection/pest management practices from the official and formal channels (e.g. Agricultural Extensions Services, governmental programs, international non-governmental organizations’ programs). They also reported that they did not apply any “good practices” in rice cultivation (adapted from Dung et al., 1999; Dung and Dung, 2000; Berg, 2002; Lang et al., 2006; Berg and Tam, 2012). Therefore, these farmers were used as a control group in each of the study site and were called (depending on the respective group for comparison) Non-VietGap (in Hau Giang), Non-Global GAP (in Vinh Thanh, Can Tho; in Thoai Son and Chau Phu, An Giang) or Non-SDF or Non-IPM in O Mon.
IPM: This group of farmers in O Mon (Can Tho) received training on IPM methods; some of them were trainers of the IPM class.
V-GAP: This group of farmers applied “Vietnamese Good Agricultural Practices for Rice” (MARD, 2011). The survey was undertaken in Hau Giang where more than 20 farmers claimed to practice VietGAP with the guidance of the agricultural extension staff. This VietGAP group was provided (subsidy) with the so called M.A. fungi (Metarhizium anisopliae) to control BPH (MARD 2011; Du and Chinh, 2011, Expert interview with the head of Plant Protection Department Hau Giang, 2012). However, due to the lack of funding, the group did not went through a formal certification process for VietGAP standard (Field survey 2011)
G-GAP: This group of farmers received training via formal sources and strictly followed GLOBALGAP practices (IFA GR Version 3.0 and 3.1). The products were certified by the TÜV SÜD Management Service during 2011-2012 (MARD, 2011; DARD Tien Giang, 2009; DARD An Giang, 2010).
SDF: These farmers belonged to the “standard-farming” system, also called “many small farmers-a large rice field model”. These farmers have contracts with an agricultural protection Co. Ltd. Like farmers in An Giang had contracts with the An Giang Plant Protection Co. Ltd. There are many plant protection companies like Gen Traco, Trung An and Angimex which have permissions from the MARD/DARD to play an autonomous and important role in facilitating extension services for contracted farmers (MARD, 2012: The criteria for Cánh Đồng Mẫu Lớn, MARD 2011)
Monitoring sites The household survey data was analyzed using SPSS version 21.0. The different means of categories (in terms of amount of inputs) were investigated by using one-way analysis of variance (ANOVA) with Tukey HSD (honestly significant difference) as post-ANOVA test. Further site selection was performed for pollutant monitoring by screening the household survey data. Three sites (Table 12) were selected with different categories of rice systems and management practices. Table 12 - Monitoring sites with coordinates. Source: La Thi Nga 2013
Location
G-GAP Non-GP Field size (ha) Coordinate Field size (ha) Coordinate
Chau Phu, An 2 10°27'33.2" N 3 10°27'61.3" N
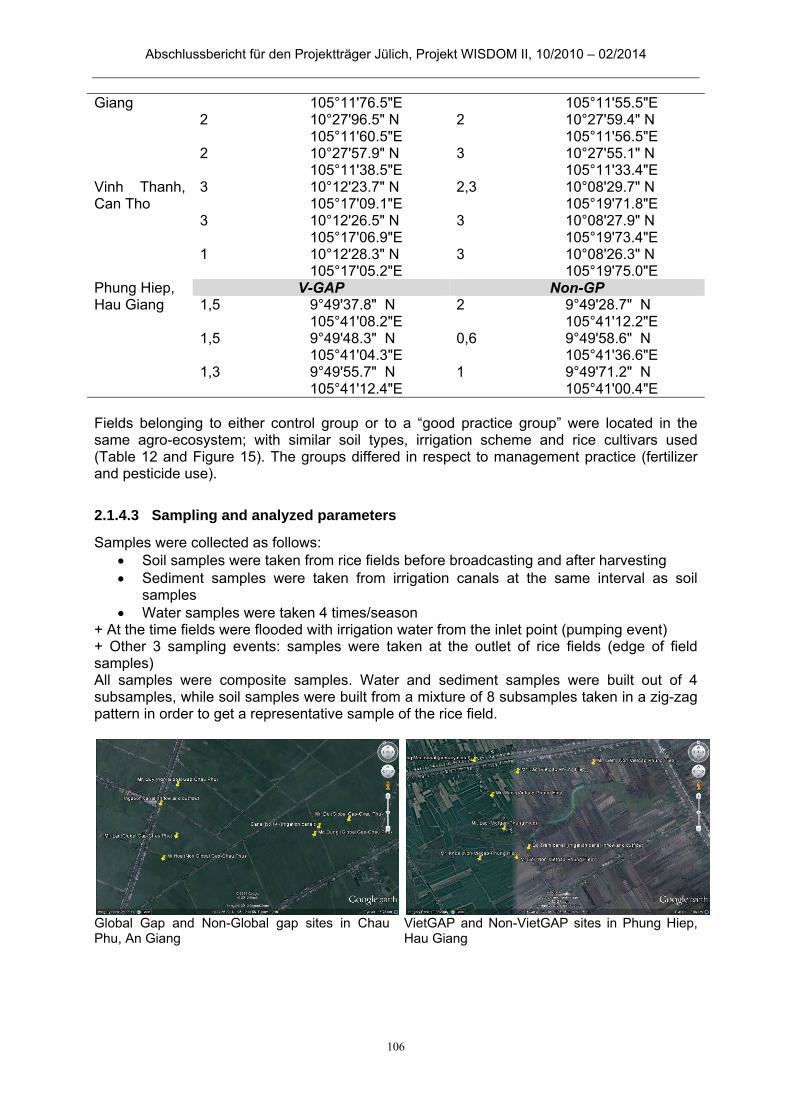
Abschlussbericht für den Projektträger Jülich, Projekt WISDOM II, 10/2010 – 02/2014
106
Giang 105°11'76.5"E 105°11'55.5"E 2 10°27'96.5" N
105°11'60.5"E 2 10°27'59.4" N
105°11'56.5"E 2 10°27'57.9" N
105°11'38.5"E 3 10°27'55.1" N
105°11'33.4"E Vinh Thanh, Can Tho
3 10°12'23.7" N 105°17'09.1"E
2,3 10°08'29.7" N 105°19'71.8"E
3 10°12'26.5" N 105°17'06.9"E
3 10°08'27.9" N 105°19'73.4"E
1 10°12'28.3" N 105°17'05.2"E
3 10°08'26.3" N 105°19'75.0"E
Phung Hiep, Hau Giang
V-GAP Non-GP 1,5 9°49'37.8" N
105°41'08.2"E 2 9°49'28.7" N
105°41'12.2"E 1,5 9°49'48.3" N
105°41'04.3"E 0,6 9°49'58.6" N
105°41'36.6"E 1,3 9°49'55.7" N
105°41'12.4"E 1 9°49'71.2" N
105°41'00.4"E Fields belonging to either control group or to a “good practice group” were located in the same agro-ecosystem; with similar soil types, irrigation scheme and rice cultivars used (Table 12 and Figure 15). The groups differed in respect to management practice (fertilizer and pesticide use).
2.1.4.3 Sampling and analyzed parameters
Samples were collected as follows: Soil samples were taken from rice fields before broadcasting and after harvesting Sediment samples were taken from irrigation canals at the same interval as soil
samples Water samples were taken 4 times/season
+ At the time fields were flooded with irrigation water from the inlet point (pumping event) + Other 3 sampling events: samples were taken at the outlet of rice fields (edge of field samples) All samples were composite samples. Water and sediment samples were built out of 4 subsamples, while soil samples were built from a mixture of 8 subsamples taken in a zig-zag pattern in order to get a representative sample of the rice field.
Global Gap and Non-Global gap sites in Chau Phu, An Giang
VietGAP and Non-VietGAP sites in Phung Hiep, Hau Giang
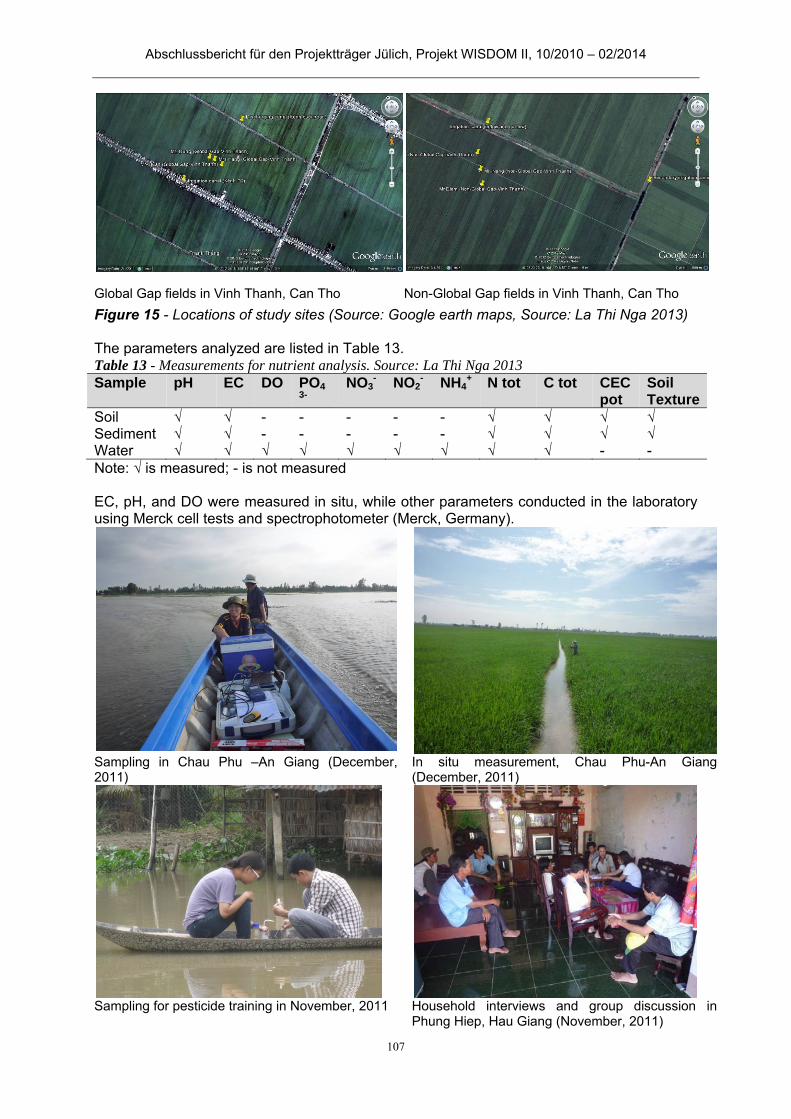
Abschlussbericht für den Projektträger Jülich, Projekt WISDOM II, 10/2010 – 02/2014
107
Global Gap fields in Vinh Thanh, Can Tho Non-Global Gap fields in Vinh Thanh, Can Tho
Figure 15 - Locations of study sites (Source: Google earth maps, Source: La Thi Nga 2013) The parameters analyzed are listed in Table 13. Table 13 - Measurements for nutrient analysis. Source: La Thi Nga 2013 Sample pH EC DO PO4
3- NO3
- NO2- NH4
+ N tot C tot CEC pot
Soil Texture
Soil √ √ - - - - - √ √ √ √ Sediment √ √ - - - - - √ √ √ √ Water √ √ √ √ √ √ √ √ √ - - Note: √ is measured; - is not measured EC, pH, and DO were measured in situ, while other parameters conducted in the laboratory using Merck cell tests and spectrophotometer (Merck, Germany).
Sampling in Chau Phu –An Giang (December, 2011)
In situ measurement, Chau Phu-An Giang (December, 2011)
Sampling for pesticide training in November, 2011 Household interviews and group discussion in Phung Hiep, Hau Giang (November, 2011)
Abschlussbericht für den Projektträger Jülich, Projekt WISDOM II, 10/2010 – 02/2014
108
Figure 16 - Household interviews, group discussions, and sampling. Source: La Thi Nga 2013 For pesticides, the selection, sampling and analysis followed the process described in chapter II.1.2.4 while for soil and sediment extraction procedures are detailed below. Microwave-assisted extraction (MAE) was used. Different solvents (HA 1:1- mixture of n-Hexane and Acetone (1:1, v/v), HA 3:2- a mixture of n-hexane and Acetone (3:2, v/v), HEM 3:4:1- a mixture of n-hexane, ethyl-acetate and methanol (3:4:1,v/v/v)) were selected for pre-tests as shown in Table 6 together with achieved recovery rates for two spike levels of a mixture of pesticide compounds at concentrations of 0.2 µg/g and 1.0 µg /g (n=3 for each spike level). The mixture of n-hexane, ethyl-acetate and methanol (HEM 3:4:1, v/v/v) was selected with recoveries above 70% for all selected compounds.
2.1.4.4 Results
Rice production according to “Good agricultural practices? 2.1.4.4.1
This section aims to describe a wide range of different “good management” practices in the Mekong Delta, review published evaluations of these practices in combination with the field observations of this study. IPM-FFS: IPM was known as the first improved management practice in the Mekong Delta starting in 1995 with four principles i) producing healthy plants; ii) protecting natural pest enemies; iii) undertake regular field monitoring; and iv) improve the farmer´s knowledge about the natural pest management options (FAO, 2002). Rice IPM farmers were encouraged not to use pesticides (especially insecticides) for the first 40 days after seeding (De, 2006). By 2006, more than 1000 farmers from 38 communities in 13 provinces of the delta received training in IPM. Farmers also attended post-IPM training programs, formed IPM clubs etc. (De, 2006). The consequence of the message “no early sprays in the first 40 days after seeding” was evaluated by Huan et al. (1999). It was reported that insecticide use was widely reduced while yield remained unchanged. However, our study, based on household surveys, showed that insecticide use was widespread and most of the IPM farmers only took up certain elements of the program without comprehensive compliance or a change of mindset (field survey 2011-2012). Similar findings have been reported by Toan et al. (2013) based on a field survey in Dong Thap and Can Tho: only a minority of farmers applied elements of IPM (15% and 14%, respectively) while no farmer followed the IPM in full. Farmers and rural communities in the Mekong delta are considered to be passive receivers of knowledge for development (Hanh, 2010); low education levels are also considered as a barrier for farmers for engagement in IPM programs (Berg 2002). In many cases, farmers did not adopt IPM or 3R3G because they believe that it will not improve their income (Chi, 2008). Further, different programs implemented at the same time by different institutions, top-down approaches, low budgets for agricultural extension programs also hampered the success of IPM in the Mekong delta. 3R3G: The program “Three reductions, three gains”- 3R3G or in Vietnamese: Ba giảm, Ba tăng” was launched to help farmers in reducing 3 inputs: seed rate, fertilizer and pesticide for 3 gains: increase yield, grain quality and thus benefit. 3R3G has been officially recognized as a good practice by the Ministry of Agricultural and Rural Development (MARD) in the decree 1579 QĐ/BNN-KHCN dated 30 June 2005. 3R3G was also nominated as best practice in 2008 by the Dubai International Award for Best Practices. The science behind the practice is that high seeding rates coupled with high fertilizer rates lead to a dense crop canopy and nitrogen-enriched plants which provide favorable conditions for pest infestation and diseases outbreaks (Escalada et al., 1999; Huan et al., 2005). Especially BHP preferss nitrogen-rich rice plants (Lu and Heong, 2009). Thus, the aim of 3R3R was to reduce input costs, increase profits, and lower exposure to toxic pesticides (Heong et al., 2010). The first launch was in 1999, the official release by MARD in 2003. The first 30 farmers in Long An voluntary
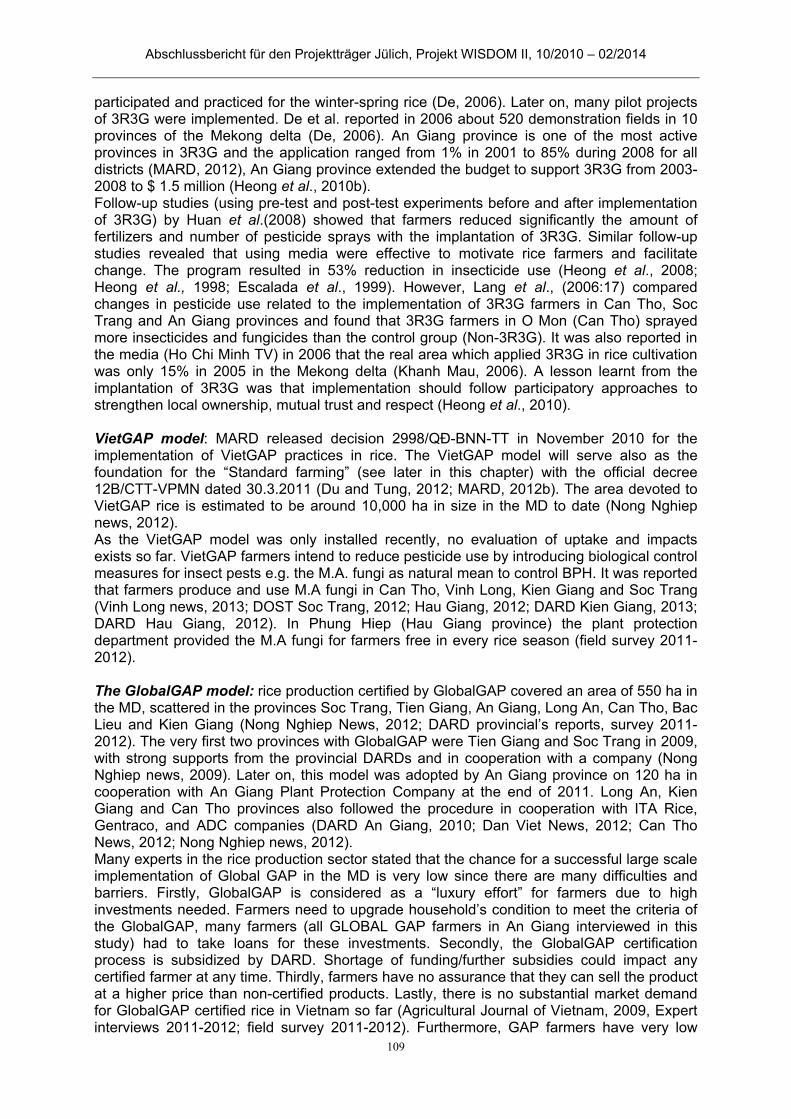
Abschlussbericht für den Projektträger Jülich, Projekt WISDOM II, 10/2010 – 02/2014
109
participated and practiced for the winter-spring rice (De, 2006). Later on, many pilot projects of 3R3G were implemented. De et al. reported in 2006 about 520 demonstration fields in 10 provinces of the Mekong delta (De, 2006). An Giang province is one of the most active provinces in 3R3G and the application ranged from 1% in 2001 to 85% during 2008 for all districts (MARD, 2012), An Giang province extended the budget to support 3R3G from 2003-2008 to $ 1.5 million (Heong et al., 2010b). Follow-up studies (using pre-test and post-test experiments before and after implementation of 3R3G) by Huan et al.(2008) showed that farmers reduced significantly the amount of fertilizers and number of pesticide sprays with the implantation of 3R3G. Similar follow-up studies revealed that using media were effective to motivate rice farmers and facilitate change. The program resulted in 53% reduction in insecticide use (Heong et al., 2008; Heong et al., 1998; Escalada et al., 1999). However, Lang et al., (2006:17) compared changes in pesticide use related to the implementation of 3R3G farmers in Can Tho, Soc Trang and An Giang provinces and found that 3R3G farmers in O Mon (Can Tho) sprayed more insecticides and fungicides than the control group (Non-3R3G). It was also reported in the media (Ho Chi Minh TV) in 2006 that the real area which applied 3R3G in rice cultivation was only 15% in 2005 in the Mekong delta (Khanh Mau, 2006). A lesson learnt from the implantation of 3R3G was that implementation should follow participatory approaches to strengthen local ownership, mutual trust and respect (Heong et al., 2010). VietGAP model: MARD released decision 2998/QĐ-BNN-TT in November 2010 for the implementation of VietGAP practices in rice. The VietGAP model will serve also as the foundation for the “Standard farming” (see later in this chapter) with the official decree 12B/CTT-VPMN dated 30.3.2011 (Du and Tung, 2012; MARD, 2012b). The area devoted to VietGAP rice is estimated to be around 10,000 ha in size in the MD to date (Nong Nghiep news, 2012). As the VietGAP model was only installed recently, no evaluation of uptake and impacts exists so far. VietGAP farmers intend to reduce pesticide use by introducing biological control measures for insect pests e.g. the M.A. fungi as natural mean to control BPH. It was reported that farmers produce and use M.A fungi in Can Tho, Vinh Long, Kien Giang and Soc Trang (Vinh Long news, 2013; DOST Soc Trang, 2012; Hau Giang, 2012; DARD Kien Giang, 2013; DARD Hau Giang, 2012). In Phung Hiep (Hau Giang province) the plant protection department provided the M.A fungi for farmers free in every rice season (field survey 2011-2012). The GlobalGAP model: rice production certified by GlobalGAP covered an area of 550 ha in the MD, scattered in the provinces Soc Trang, Tien Giang, An Giang, Long An, Can Tho, Bac Lieu and Kien Giang (Nong Nghiep News, 2012; DARD provincial’s reports, survey 2011-2012). The very first two provinces with GlobalGAP were Tien Giang and Soc Trang in 2009, with strong supports from the provincial DARDs and in cooperation with a company (Nong Nghiep news, 2009). Later on, this model was adopted by An Giang province on 120 ha in cooperation with An Giang Plant Protection Company at the end of 2011. Long An, Kien Giang and Can Tho provinces also followed the procedure in cooperation with ITA Rice, Gentraco, and ADC companies (DARD An Giang, 2010; Dan Viet News, 2012; Can Tho News, 2012; Nong Nghiep news, 2012). Many experts in the rice production sector stated that the chance for a successful large scale implementation of Global GAP in the MD is very low since there are many difficulties and barriers. Firstly, GlobalGAP is considered as a “luxury effort” for farmers due to high investments needed. Farmers need to upgrade household’s condition to meet the criteria of the GlobalGAP, many farmers (all GLOBAL GAP farmers in An Giang interviewed in this study) had to take loans for these investments. Secondly, the GlobalGAP certification process is subsidized by DARD. Shortage of funding/further subsidies could impact any certified farmer at any time. Thirdly, farmers have no assurance that they can sell the product at a higher price than non-certified products. Lastly, there is no substantial market demand for GlobalGAP certified rice in Vietnam so far (Agricultural Journal of Vietnam, 2009, Expert interviews 2011-2012; field survey 2011-2012). Furthermore, GAP farmers have very low

Abschlussbericht für den Projektträger Jülich, Projekt WISDOM II, 10/2010 – 02/2014
110
knowledge about GAP and GAP requirements which is combined with poor infrastructure in rural areas (Trung, 2007). The standard farming model (SDF): is considered as the newest development in rice cultivation in the Mekong delta. The very first decree 77/2002/ QĐ-BNN was released 28.8.2002 on contract farming and followed by the decree 2056/TTg-KTN (7.11.2011) to improve rice quality. It emphasized the need to build stronger “brands” for rice export and improves rice quality, as well as enhances the farmer´s role in production to ensure both food security and sustainable development. This model is operated currently in 12 out of 13 provinces in the MD. It started with 7,800 ha in 2001 (Huan, 2012) and reached an average of 5,000-10,000 ha per province in late 2012 (Du and Tung, 2012; provincial reports on SDF, 2012). SDF was associated with VietGAP standards first but with a recommendation that the SDF model should not be limited to VietGAP but also apply other good practices like 3R3G, 1P5G (Huan, 2012). 2 years after launch it was reported that there was no change in seeding rate, farmers still used very high rate (150-170 kg/ha) and pesticides have been used without following the recommendations. Farmers continued to follow the advertisement programs by agrochemicals companies (Huan, 2012). Farmers in the MD were exposed to many different programs in the recent past, and were very creative in combining different approaches of different practices in cultivation activities. No one practice is applied exclusively in one place (Toan et al., 2013, for the case of IPM in Dong Thap and Can Tho). For example, farmers in Tien Giang grow flowers on rice field embankments (Ecological engineering EE) and claimed to practice 1P5G (Huan et al., 2010). Farmers in Thoai Son (An Giang) also grow flowers on the embankment of their rice fields and claimed GLOBAL GAP practice (field observation 2012).
Nutrient levels in discharge water 2.1.4.4.2
At every sampling event, the basic measurements like pH, electric conductivity (EC) dissolved oxygen (DO) and temperature - were measured in situ. The monitoring results were compared with the National Technical Regulation for surface water (QCVN 08: 2008/BTNMT) and for irrigation water (QCVN 39: 2011/BTNMT). Table 15 - Regulations for surface water and irrigaiton water (2008 and 2011)
QCVN 08: BTNMT QCVN 39: 2011
pH DO (mg/L)
NO3-
(mg/L) NH4
+ (mg/L)
NO2-
(mg/L)
PO43-
(mg/L)
A1: water supply 6-8.5 ≥ 6 2 0.1 0.01 0.1
A2: treat before supplying
6-8.5 ≥ 5 5 0.2 0.02 0.2
B1:Irrigation water 5.5-9,0 ≥ 4 10 0.5 0.04 0.3
B2: transportation 5.5-9,0 ≥ 2 15 1.0 0.05 0.5
In total, 300 water samples were collected during 3 rice seasons, of which 20% had DO values above 4.0 mg/L. For nutrient levels, neither farm canal water nor discharge water from rice fields had critical pollution levels when compared with the irrigation guidelines. However, in case surface water is used for drinking purposes, further evaluation is needed. This was the subject of the study reported in chapter 2.1.
Pesticides in canal water and edge-of-field discharge water 2.1.4.4.3
Pesticide concentrations in canal water and in water discharged from rice fields in An Giang are shown for the rainy season (SA 2012) in table 16. In the rainy season, 113 water

Abschlussbericht für den Projektträger Jülich, Projekt WISDOM II, 10/2010 – 02/2014
111
samples have been taken: 63% from canals, 37% from rice field outflows (discharged water). 63% of the samples had a sufficient recovery rate of the surrogate standard d-HCH ranging from 70 to 120%. The samples with insufficient recovery have been excluded from further evaluation. Table 16 presents the monitoring results for 16 selected compounds in the wet season 2012 in An Giang. Butachlor, fenobucarb, isoprothiolane and hexaconazole were detected in all canal water samples. Fipronil, propiconazole and difenoconazole were detected in all G-GAP discharge water samples while thiamethoxam, fipronil, hexaconazole and difenoconazole occured in all N-GP discharges samples. Table 16 - Pesticide concentrations in farm canal water and field discharge water in An Giang in the wet season 2012 (SA 2012). Source: La Thi Nga 2013
Compounds
Canal water G-GAP discharge N-GP discharge
MDL (µg/L)%
detect.
Max conc. (µg/L)
Median conc. (µg/L)
% detect.
Max conc. (µg/L)
Median conc. (µg/L)
% detect.
Max conc. (µg/L)
Median conc. (µg/L)
Butachlor 100% 0,49 0,34 75% 0,28 0,27 75% 0,55 0,48 0,007
Pretilachlor 78% 1,40 1,08 50% 1,30 1,19 75% 0,99 0,97 0,002
FenoxapropPethyl 0% n.d n.d 25% 0,05 0,05 0% n.d n.d 0,021
Chlorluazuron 0% n.d n.d 0% n.d n.d 0% n.d n.d 0,003
Thiamethoxam 11% blw.d blw.d 50% blw.d blw.d 100% blw.d blw.d 0,023
Fipronil 67% 0,12 0,08 100% 0,38 0,12 100% 0,44 0,08 0,001
Fenobucarb 100% 0,19 0,12 75% 0,12 0,12 50% 0,12 0,12 0,016
Quinalphos 89% 0,18 0,13 50% 0,33 0,33 25% 0,18 0,18 0,004
Cypermethrine 0% n.d n.d 0% n.d n.d 0% n.d n.d -
Isoprothiolane 100% 1,41 0,50 75% 32,16 0,70 75% 10,99 0,70 0,005
Propiconazole 11% 0,79 0,79 100% 0,94 0,76 50% 5,17 3,63 0,099
Tebuconazole 0% n.d n.d 75% 1,32 1,09 0% n.d n.d 0,005
Hexaconazole 100% 1,05 0,77 75% 53,79 0,99 100% 27,52 1,48 0,013
Trifloxystrobin 22% 0,58 0,57 0% n.d n.d 0% n.d n.d 0,041
Difenoconazole 67% 21,64 0,66 100% 3,38 2,53 100% 5,28 1,28 0,485
Azoxystrobin 0% n.d n.d 25% 1,79 1,79 25% 2,59 2,59 0,045
Note: n.d is no detection; blw.d is below detection limits Hexaconazole followed by isoprothiolane had the highest detected concentration in both, the GAP and non-GAP site. For 6 pesticides (pretolachlor, fenoxaprop-P ethyl, fipronil, quinalphos, tebuconazole and difenoconazole), median concentrations were higher at the G-GAP sites than at the Non-GAP site, while 4 pesticides (butachlor, propiconazole, hexaconazole and azoxystrobin) had higher median concentrations at the Non-GAP site. The GAP sites showed neither lower pesticide concentrations nor had they less hazardous pesticides in the water. For example, fipronil – an insecticides with high risk for aquatic invertebrates - occurred in 100% of the discharge water samples of both, GAP and Non-GAP fields and exceeded frequently the chronic and occasionally the acute benchmark concentrations for aquatic invertebrates (chronic: 0.011 µg/L, acute: 0.11 µg/L).
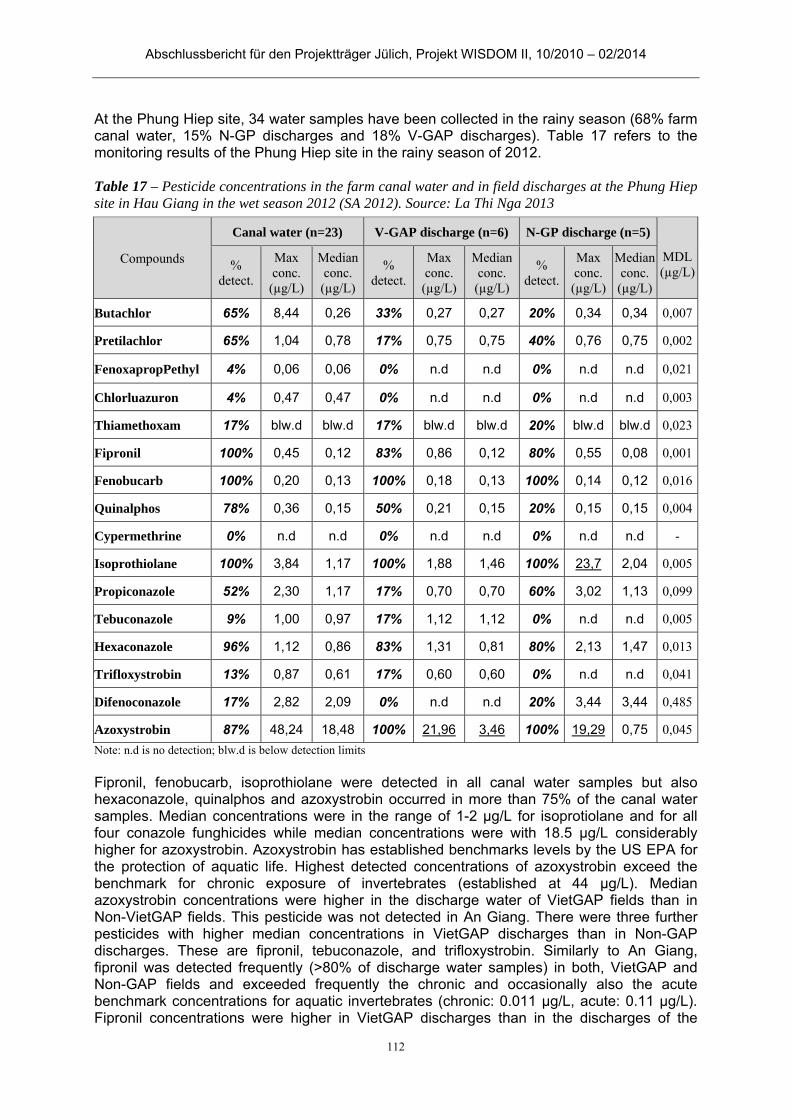
Abschlussbericht für den Projektträger Jülich, Projekt WISDOM II, 10/2010 – 02/2014
112
At the Phung Hiep site, 34 water samples have been collected in the rainy season (68% farm canal water, 15% N-GP discharges and 18% V-GAP discharges). Table 17 refers to the monitoring results of the Phung Hiep site in the rainy season of 2012. Table 17 – Pesticide concentrations in the farm canal water and in field discharges at the Phung Hiep site in Hau Giang in the wet season 2012 (SA 2012). Source: La Thi Nga 2013
Note: n.d is no detection; blw.d is below detection limits Fipronil, fenobucarb, isoprothiolane were detected in all canal water samples but also hexaconazole, quinalphos and azoxystrobin occurred in more than 75% of the canal water samples. Median concentrations were in the range of 1-2 µg/L for isoprotiolane and for all four conazole funghicides while median concentrations were with 18.5 µg/L considerably higher for azoxystrobin. Azoxystrobin has established benchmarks levels by the US EPA for the protection of aquatic life. Highest detected concentrations of azoxystrobin exceed the benchmark for chronic exposure of invertebrates (established at 44 µg/L). Median azoxystrobin concentrations were higher in the discharge water of VietGAP fields than in Non-VietGAP fields. This pesticide was not detected in An Giang. There were three further pesticides with higher median concentrations in VietGAP discharges than in Non-GAP discharges. These are fipronil, tebuconazole, and trifloxystrobin. Similarly to An Giang, fipronil was detected frequently (>80% of discharge water samples) in both, VietGAP and Non-GAP fields and exceeded frequently the chronic and occasionally also the acute benchmark concentrations for aquatic invertebrates (chronic: 0.011 µg/L, acute: 0.11 µg/L). Fipronil concentrations were higher in VietGAP discharges than in the discharges of the
Compounds
Canal water (n=23) V-GAP discharge (n=6) N-GP discharge (n=5)
MDL (µg/L)%
detect.
Max conc. (µg/L)
Median conc. (µg/L)
% detect.
Max conc. (µg/L)
Median conc. (µg/L)
% detect.
Max conc. (µg/L)
Median conc. (µg/L)
Butachlor 65% 8,44 0,26 33% 0,27 0,27 20% 0,34 0,34 0,007
Pretilachlor 65% 1,04 0,78 17% 0,75 0,75 40% 0,76 0,75 0,002
FenoxapropPethyl 4% 0,06 0,06 0% n.d n.d 0% n.d n.d 0,021
Chlorluazuron 4% 0,47 0,47 0% n.d n.d 0% n.d n.d 0,003
Thiamethoxam 17% blw.d blw.d 17% blw.d blw.d 20% blw.d blw.d 0,023
Fipronil 100% 0,45 0,12 83% 0,86 0,12 80% 0,55 0,08 0,001
Fenobucarb 100% 0,20 0,13 100% 0,18 0,13 100% 0,14 0,12 0,016
Quinalphos 78% 0,36 0,15 50% 0,21 0,15 20% 0,15 0,15 0,004
Cypermethrine 0% n.d n.d 0% n.d n.d 0% n.d n.d -
Isoprothiolane 100% 3,84 1,17 100% 1,88 1,46 100% 23,7 2,04 0,005
Propiconazole 52% 2,30 1,17 17% 0,70 0,70 60% 3,02 1,13 0,099
Tebuconazole 9% 1,00 0,97 17% 1,12 1,12 0% n.d n.d 0,005
Hexaconazole 96% 1,12 0,86 83% 1,31 0,81 80% 2,13 1,47 0,013
Trifloxystrobin 13% 0,87 0,61 17% 0,60 0,60 0% n.d n.d 0,041
Difenoconazole 17% 2,82 2,09 0% n.d n.d 20% 3,44 3,44 0,485
Azoxystrobin 87% 48,24 18,48 100% 21,96 3,46 100% 19,29 0,75 0,045
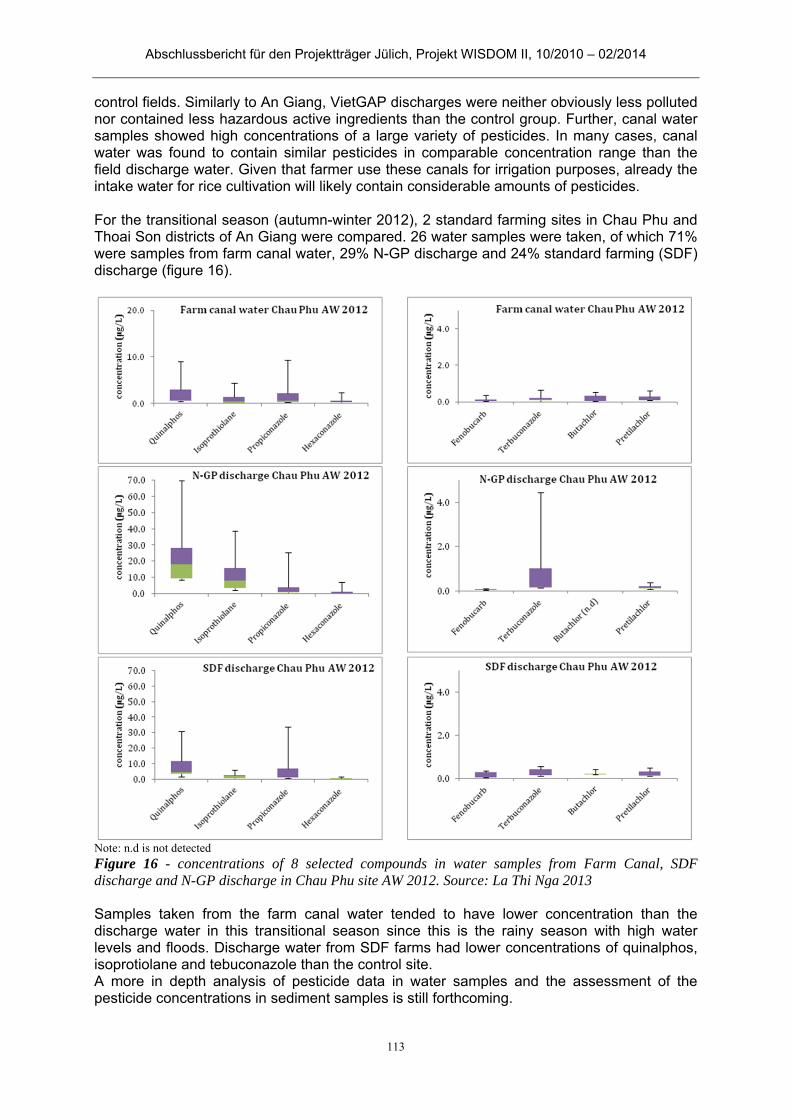
Abschlussbericht für den Projektträger Jülich, Projekt WISDOM II, 10/2010 – 02/2014
113
control fields. Similarly to An Giang, VietGAP discharges were neither obviously less polluted nor contained less hazardous active ingredients than the control group. Further, canal water samples showed high concentrations of a large variety of pesticides. In many cases, canal water was found to contain similar pesticides in comparable concentration range than the field discharge water. Given that farmer use these canals for irrigation purposes, already the intake water for rice cultivation will likely contain considerable amounts of pesticides. For the transitional season (autumn-winter 2012), 2 standard farming sites in Chau Phu and Thoai Son districts of An Giang were compared. 26 water samples were taken, of which 71% were samples from farm canal water, 29% N-GP discharge and 24% standard farming (SDF) discharge (figure 16).
Note: n.d is not detected Figure 16 - concentrations of 8 selected compounds in water samples from Farm Canal, SDF discharge and N-GP discharge in Chau Phu site AW 2012. Source: La Thi Nga 2013 Samples taken from the farm canal water tended to have lower concentration than the discharge water in this transitional season since this is the rainy season with high water levels and floods. Discharge water from SDF farms had lower concentrations of quinalphos, isoprotiolane and tebuconazole than the control site. A more in depth analysis of pesticide data in water samples and the assessment of the pesticide concentrations in sediment samples is still forthcoming.
Abschlussbericht für den Projektträger Jülich, Projekt WISDOM II, 10/2010 – 02/2014
114
2.1.4.5 References
An,Giang (2010, 2011, 2013).Plant Protection Department, annual reports on rice cultivation and pest problems. Vietnamese
An, Giang Statistical Office (2010). Long Xuyen city, An Giang province. Berg H. (2002). Rice monoculture and integrated rice-fish farming in the Mekong Delta, Vietnam.
Ecol Econ. 41, pp.95-107. Berg, H. (2001). Pesticide use among rice farmers in the Mekong Delta, Vietnam. Crop Prot. 20, pp.
897-905. Berg, H., Tam, N.T. (2012). Use of pesticides and attitude to pest management strategies among rice
and rice-fish farmers in the Mekong Delta, Vietnam. Int. J. Pest. Manage. 54 (2), pp. 339-346. Can Tho News, 27/08/2012. Trao chứng nhận Global GAP cho Tổ hợp tác sản xuất lúa Khiết Tâm (in
Vietnamese language). Can Tho Plant Protection Department(2010,2011,2012). Annual reports on rice cultivation and pest
problems (in Vietnamese). Can Tho University (CTU), School of Agriculture (2003). Seminar document: Measures to raise
summer-autumn yields in the Mekong delta. Chau, L.M., 20007. Short communication state of insecticide resistance of Brown Plant Hopper in Mekong delta, Vietnam. Omonrice Cuu Long Delta Rice Research Institute. 15, pp.185-190.
Chau, L.M., Trang, T.T.K., Cat, H.D., Phuong, L.T., Shoenly, K., Heong, K.L. (2002). Interaction
between multiple pest problems and rice yields in Mekong delta of Vietnam. Omonrice 10,pp. 31-44.
Dan Viet News, 29/08/2012:10:08. Trồng lúa Global GAP ở vùng rốn phèn (in Vietnamese language) Department of Agricultural and Rural Development (DARD) of An Giang, 21/12/2010. Triển khai
thêm điểm sản xuất lúa theo tiêu chuẩn GlOBALGAP. Department of agricultural and rural development, Hau Giang. (2012). Reports on training Farmers
how to produce Metarzhizium anisopliae at household (in Vietnamese) Department of agricultural and rural development, Kien Giang. 2013. Quy tình kỹ thuật sản xuất nấm
xanh Metarzhizium anisopliae tại nông hộ. Department of Science and Technology of Soc Trang (DOST). Tình hình sử dụng nấm xanh để phòng
trừ rầy nâu hại láu và rầy đầu vàng hại mía ở tỉnh Sóc Trăng. By Duong Hong Nga. Dyck, V.A., Thomas B., 1979. The brown planthopper problem, in Brown planthopper: Threat to rice
production in Asia, International Rice Research Institute (IRRI), Los Baños, Philippines, pp. 376. Escalada, M.M., Heong, K.L., Huan, N.H., Mai,V. (1999). Communications and behavior change in
rice farmers’ pest management: the case of using mass media in Vietnam. J. Appl. Commun. 83, pp.7-26.
Food and Agriculture Organization of the United Nations (FAO). (2002). From farmer field school to
community IPM: ten years of IPM training in Asia. Ed. John Pontius, Russell Dilts, Andrew Bartlett. FAO Regional Office for Asia and the Pacific Phra Athit Road, Bangkok 10200, Thailand.

Abschlussbericht für den Projektträger Jülich, Projekt WISDOM II, 10/2010 – 02/2014
115
Heong, K.L., 2009. Are planthopper problems caused by a breakdown in ecosystem services? In Heong KL, Hardy B, editors. 2009. Planthoppers: new threats to the sustainability of intensive rice production systems in Asia. Los Baños (Philippines): International Rice Research Institute, pp. 221-232.
Heong, K.L., Escalada, M.M., 1997. Pest Management Practices of Rice Farmers in Asia.
International Rice Research Institute, Los Banos, Philippines. Heong, K.L., Escalada, M.M., Huan, N.H., Chien, H.V., Quynh, P.V., 2010. Scaling out
communication to rural farmers: lessons from the “Three Reductions, Three Gains” campaign in Vietnam, pp 207-220
Huan, N.H.,( 2012). Evaluation of 2 years after Standard farming operation ( in Vietnamese: Nhìnlại
sau hai năm triển khai cánh đồng mẫu lớn”. The agricultural extension forum. Plant Protection department, MARD, pp. 14-16.
Huan, N.H., Chien, H.V., Hai, L.H., An, N.H., Huynh, N.V. (2010). Application of ecological. Huan,
N.H., Mai, V., Escalada, M.M., Heong, K.L., (1999). Changes in rice farmers’ pest management in the Mekong delta, Vietnam. Crop Protection. 18 , pp. 557-563.
Huan, N.H., Thiet, L.V., Chien, H.V., Heong, K.L., 2005. Farmers’ participatory evaluation of
reducing pesticides, fertilizers and seed rates in rice farming in the Mekong delta, Vietnam. Crop Protection: 24 pp.457-464
Huynh, N.V., (1975). Brown planthopper and white-backed planthopper infestitation in the Mekong
delta (Vietnam). Rice Entomol. Newsl. 2:4. Huynh, N.V., (2004). Intensification of rice production adversely affecting its insect pest control in the
Mekong delta of Vietnam, Paper presented at the Mekong Rice conference, HCM city, Vietnam. Huynh, N.V.,( 2010). Construction technology in the field of ecological. Journal of Agriculture
ofVietnam (article was translated from Vietnamese to English, IRRN, International Rice Research newsletter,(1980). Vol. 5, No. 3 (June 1980). IRRI, Los Banos, Philippines
Khanh Mau. (2006). The Provinces in The Mekong : Total production increased more than 732.000
tons of rice. Copy right of Ho Chi Minh Television Station (in Vietnamese language). Khiem, N.T., Khai, T.T. (2008). Technology change in rice production and rice farmer income in
Vietnam Mekong Delta lowland. Proceeding of The Forum on "Rice Policy Research: Key Issues from National Perspectives" Workshop. International Rice Research Institute. 18-19 Feb 2008. Los Banos, the Philippines, pp.15.
Lam, P.V., (2007). Scientific methods to control BHP, virulent diseases in rice (in Vietnamese: Cơ sở
khoa học của các giải pháp phòng chống dịch rầy nâu, bệnh virus lúa cỏ và lúa lùn xoăn lá), pp. 6. Lang, N.T. (2011). Research on rice cultivars selection in the Mekong delta (in Vietnamese: Nghiên
cứu chọn giống lúa xuất khẩu cho vùng ĐBSCL, MARD, Institute of Agricultural Sciences, Cuu Long Rice Research Institute). Conference in Can Tho.
Ministry of Agricultural and Rural Development (MARD) of Vietnam, (2011). Vietgap procedure and
diary book for farmers (in Vietnamese: Sổ tay ghi chép tình hình sản xuất lúa theo hướng VietGAP), Agricultural Publishing house, Hanoi, Vietnam, pp. 40.
Ministry of Agricultural and Rural Development (MARD) of Vietnam, (2012). Report on evaluations
of the innovative practices in rice cultivation in the Mekong delta (in Vietnamese), pp. 31.
Abschlussbericht für den Projektträger Jülich, Projekt WISDOM II, 10/2010 – 02/2014
116
Ministry of Agricultural and Rural Development (MARD) of Vietnam, (2012). National Agricultural Extension programs; Forum on Agricultural extension @ Agriculture (in Vietnamese: Diễn Đàn Khuyến Nông @ Nông Nghiệp: Liên kết sản xuất lúa theo cánh đồng mẫu lớn). Agricultural Publishing house, Hanoi, Vietnam, pp.211.
Nhan Dan News. http://www.nhandan.com.vn/bandoc/ban-doc-viet/item/21643102-cang-chan cang-
thu-gom-oc-buou-vang.html Nong Nghiep news, 22/09/2009 (Báo Nông nghiệp VN). ĐBSCL: Mở rộng vùng trồng lúa Global
GAP (in Vietnamese language) Nong Nghiep news. 23/3/2012 (Báo Nông nghiệp VN). Khó khăn gì khi làm GAP? Lúa GlobalGAP
khó mở rộng diện tích. Toan, P.V., Sebesvari, Z., Bläsing, M., Rosendahl, I., Renaud, F.G.,(2013). Pesticide management and
their residues in sediments and surface and drinking water in the Mekong Delta, Vietnam. Sc. Tota. Environ: 452-453 pp. 28-39.
Trung, H.M., (2007). GAP status in Vietnam. Vietnam Gardening Association (VACVINA), 15 World
Bank. (1995). "Environmental Program and Policy Priorities for a Socialist Economy in Transition." Vietnam.

Abschlussbericht für den Projektträger Jülich, Projekt WISDOM II, 10/2010 – 02/2014
117
Gegenüberstellung mit den ursprünglichen Zielen (besonders Arbeits- 2.1.5und Zeitplanung)
2.1.5.1 Arbeitsplan
Der Projektteil „Pflanzenschutzmittel, Nährstoffe, Antibiotika, Schwermetalle“ konnte wie beantragt und geplant durchgeführt werden. Es konnten sogar folgende Forschungselemente zusätzlich zur ursprünglichen Planung durchgeführt werden:
1) Im ländlichen Raum wird Regenwasser häufig als Trinkwasser verwendet. Eine Pilotstudie wurde aufgesetzt, um i) den Anteil der Haushalte zu ermitteln, welche Regenwasser als Trinkwasser verwenden; ii) um die Bedingungen unter denen Regenwasser aufgefangen und aufbewahrt wird zu erfassen; und iii) um die Qualität dieser Trinkwasserquelle zu bewerten und das resultierende Risiko abzuschätzen.
2) Ähnlich dazu wurde eine geringe Anzahl an Proben für die Überprüfung der Qualität des Leitungswassers und kommerziell erhältlichen Wasserprodukten (Flaschen und 21L Plastikbehälter) analysiert.
2.1.5.2 Zeitplan
Während der Projektlaufzeit gab es einige Verschiebungen im Zeitplan, über die in den Zwischenberichten regelmäßig berichtet wurde. Die Verzögerung im Zeitplan konnte jedoch während der gesamten Projektlaufzeit wieder abgebaut werden, so dass der Zeitplan über die ganze Projektlaufzeit gesehen eingehalten werden konnte. Die Probenahmen, Analysen und Haushaltsbefragungen in den Untersuchungsgebieten wurden plangerecht durchgeführt. Die Auswertung der Analysen ist weitgehend abgeschlossen, zurzeit werden noch die Doktorarbeiten und Anschlussveröffentlichungen fertiggestellt. Die Verwertung der Ergebnisse wird über die Projektlaufzeit hinweg fortgeführt. Hierzu erhalten die Doktoranden zusätzliche Unterstützung aus Mitteln von UNU-EHS.
2.2 Zahlenmäßiger Nachweise
Da der zahlenmäßige Nachweis gemeinschaftlich für den gesamten Unterauftrag von UNU-EHS geleistet wird (d.h. für die Arbeitsbereiche in WP 4000 und 5000 sowie für das Doktorandenprogramm in WP 7000) wird hier auf die gemeinsame Darlegung der Finanzen am Ende des Berichtes verwiesen.
2.3 Notwendigkeit und Angemessenheit der geleisteten Arbeit
Der Verlauf der Arbeit im Projekt folgte der im Projektantrag formulierten Planung. Es waren keine zusätzlichen Ressourcen für die Durchführung notwendig. Wie aus der obigen Darlegung der einzelnen Arbeitsschritte hervorgeht, wurden die Arbeiten im Wesentlichen von drei Doktoranden unter der Betreuung von Dr. Fabrice Renaud und Dr. Zita Sebesvari ausgeführt. Die geleistete Arbeit war den Zielstellungen des Projektes angemessen. Zudem wurde eine integrierte Planung der Arbeiten, die Zusammenführung und effektive Verwertung der Ergebnisse von einem wissenschaftlichen Mitarbeiter betreut und durchgeführt. Darüber hinaus waren alle beteiligten Mitarbeiter in der Verwertung der Ergebnisse und in der Verbreitung der Daten, Ergebnisse und Empfehlungen beteiligt.
Abschlussbericht für den Projektträger Jülich, Projekt WISDOM II, 10/2010 – 02/2014
118
2.4 Fortschreibung des Verwertungsplans
Die Ergebnisse wurden auf projektinternen Seminaren und Workshops, in Workshops mit Vietnamesischen Behörden, auf Fachtagungen sowie in wissenschaftlichen Publikationen vorgestellt. Darüber hinaus sind die Ergebnisse über die Projekthomepage sowie über das Informationssystem zugänglich. Neben projektinternen Meetings (3 Doktorandenseminare und Weiterbildungsveranstaltungen für Doktoranden) hat UNU-EHS an verschiedenen Veranstaltungen anderer BMBF-finanzierter Projekte teilgenommen. Als Beispiel seien hier der zweite Projekt-Workshop des AKIZ Projektes in Can Tho (29/30 November 2011) sowie Veranstaltungen von LEGATO genannt, z.B. der Workshop "Rice Ecosystem Services" am 28. August 2013 in Bali, Indonesia im Rahmen der Konferenz des Ecosystem Services Partnerships (ESP). Mit dem AKIZ Projekt war die Zusammenarbeit besonders eng. Die Labore von AKIZ in Can Tho konnten für die Ausführung der Analysen im Bereich der mikrobiellen Analytik und Schwermetallanalytik mitbenutzt werden. Zudem sind wir als assoziierter Partner in das LEGATO Projekt aufgenommen worden. Mit den für die Wasserqualitätsüberwachung zuständigen lokalen Behörden wurde ein intensiver Kontakt gepflegt. Zwei der UNU-Doktoranden waren explizit als Kooperationspartner des DONRE (Department of Natural Resources and Environment) in Can Tho aufgenommen, haben dort die Labore mitbenutzt und auch Schreibtischplätze zugewiesen bekommen. Ein kontinuierlicher Austausch der Informationen, Daten und Erkentnisse konnte somit sichergestellt werden. Verschiedene Mitglieder des UNU-Teams haben während der Projektlaufzeit vietnamesische Behörden kontaktiert, um über Detailfragen zu diskutieren und Ergebnisse vorzustellen. Des Weiteren wurden gute Kontakte zu drei nicht zum Projekt gehörenden Laboratorien gepflegt, in denen die Arbeiten zur Pestizidanalytik stattfanden. Die Methodenentwicklung und die Routineanalytik wurden am Institut für Nutzpflanzenwissenschaften und Ressourcenschutz (INRES) - Bereich Bodenkunde - der Universität Bonn ausgeführt. Eine Weiterbildung im Bereich Pestizidanalytik fand im zentralen Laboratorium der Universität Can Tho statt. Diese Kooperation wurde zudem durch die Unterzeichnung eines „Institutional Contract Agreement“ gefestigt. Darüber hinaus wurde am 26.-27. Juni 2012 in Can Tho ein zweitägiger Workshop organisiert, um die bisher erzielten Ergebnisse sowohl mit Wissenschaftlern als auch mit Verantwortlichen aus lokalen Behörden (DONRE, Department of Natural Resources and Environment, und DARD, Department of Agriculture & Rural Development, von mehreren Delta Provinzen) zu diskutieren. Sowohl die Einladung als auch die Präsentation der Ergebnisse wurde seitens der Behörden begrüßt. Auch wurde unsere Initiative, die Ergebnisse unmittelbar mit den Behörden zu diskutieren (und nicht nur zu präsentieren), sehr positiv bewertet.
2.5 Sind inzwischen von dritter Seite Ergebnisse bekannt geworden, die für die Durchführung des Vorhabens relevant sind?
Obwohl die Probleme der Wasserqualität im Mekong Delta zunehmend Beachtung finden, sind nach bestem Wissen der Antragsteller keine vergleichbaren Arbeiten bekannt geworden, die sich in diesem Umfang und mit einer ähnlichen Herangehensweise mit den hier bearbeiteten Forschungsthemen beschäftigt hätten. Haben sich die Aussichten für die Erreichung der Ziele des Vorhabens innerhalb des angegebenen Berichtszeitraums gegenüber dem ursprünglichen Antrag geändert (Begründung)? Alle Ziele des Vorhabens konnten wie angestrebt erreicht werden.

Abschlussbericht für den Projektträger Jülich, Projekt WISDOM II, 10/2010 – 02/2014
119
Sind oder werden Änderungen in der Zielsetzung notwendig? Es waren keine Änderungen der Zielsetzung nötig.
2.6 Erfolgte und geplante Veröffentlichungen
Nachfolgend werden die Publikationen und Konferenzbeiträge, die im Zusammenhang des WISDOM Projektes stehen gelistet. Personen, die im Bereich „Wasserqualität“ zu dem UNU-EHS WISDOM Team gehören, sind hervorgehoben. Die folgenden Publikationen sind bereits erschienen: Wilbers, G., Sebesvari, Z., Rechenburg, A., Renaud, F.G. (2013). Effects of local and
spatial conditions on the quality of harvested rainwater in the Mekong Delta, Vietnam. Environmental Pollution 182, 225-232.
Renaud F.G., Syvitski J.P.M., Sebesvari Z., Werners S.E., Kremer H., Kuenzer C., Ramesh
R., Jeuken A., Friedrich J. (2013). Tipping from the Holocene to the Anthropocene: how threatened are major world deltas? Current Opinion in Environmental Sustainability 5, 644-654.
Toan, P.V., Sebesvari, Z., Bläsing, M.; Rosendahl, I., Renaud, F.G. (2013).Pesticides in the
Mekong Delta Vietnam – application practices and residues in sediment, surface and drinking water. Science of the Total Environment 452-453, 28-39.
Renaud, F.G., Kuenzer, C. (Eds.) (2012). The Mekong Delta System. Interdisciplinary
Analyses of a River Delta. Springer Environmental Science and Engineering, Springer. Garschagen, M., Renaud, F. G., Birkmann, J. (2011). Dynamic Resilience of Peri-Urban
Agriculturalists in the Mekong Delta Under Pressures of Socio-Economic Transformation and Climate Change. In: Stewart, M.A., Coclanis, P.A. (Eds.), Environmental Change and Agricultural Sustainability in the Mekong Delta. Springer Netherlands, Advances in Global Change Research. vol. 45, 141–163.
Sebesvari, Z., Le, T.T. H., Renaud, F. (2011).Climate Change Adaptation and
Agrichemicals in the Mekong Delta, Vietnam. In: Stewart, M.A., Coclanis, P.A. (Eds.), Environmental Change and Agricultural Sustainability in the Mekong Delta. Springer Netherlands, Advances in Global Change Research. vol. 45, 219–239.
Renaud, F.G. and C. Kuenzer (2012). Introduction, The Mekong Delta System: The Mekong
Delta System. Renaud, F.G. and C. Kuenzer(Eds.): Interdisciplinary Analyses of a River Delta, Springer Environmental Science and Engineering, XV, Springer Netherlands, 1-6.
Kuenzer, C., Renaud F.G. (2012). Climate and Environmental Changes in River Deltas
Globally: Expected Impacts, Resilience, and Adaptation, Renaud, F.G. and C. Kuenzer(Eds.): The Mekong Delta System: The Mekong Delta System. Interdisciplinary Analyses of a River Delta, Springer Environmental Science and Engineering, XV, Springer Netherlands, pp.7-47.
Wagner, F., Vuong Bui Tran and F.G. Renaud (2012). Groundwater Resources in the
Mekong Delta: Availability, Utilization and Risks, Renaud, F.G. and C. Kuenzer(Eds.): The Mekong Delta System: The Mekong Delta System. Interdisciplinary Analyses of a River Delta, Springer Environmental Science and Engineering, XV, Springer Netherlands, pp.201-220.
Abschlussbericht für den Projektträger Jülich, Projekt WISDOM II, 10/2010 – 02/2014
120
Sebesvari, Z, Huong T.T.L., Toan, P.V., Arnold, U., Renaud, F.G. (2012). Aquaculture and Agricultural Production in the Mekong Delta and its Effects on Nutrient Pollution of Soil and Water, Renaud, F.G. and C. Kuenzer(Eds.): The Mekong Delta System: The Mekong Delta System. Interdisciplinary Analyses of a River Delta, Springer Environmental Science and Engineering, XV, Springer Netherlands, pp.331-362.
Renaud, F.G. and C. Kuenzer (2012).The Water-Development Nexus: Importance of
Knowledge, Information and Cooperation in the Mekong Delta, Renaud, F.G. and C. Kuenzer(Eds.): The Mekong Delta System: The Mekong Delta System. Interdisciplinary Analyses of a River Delta, Springer Environmental Science and Engineering, XV, Springer Netherlands, pp.445-458.
Die folgenden Publikationen sind akzeptiert und „in print“: Renaud, F.G., Huong, T.T.L., Lindener, C., Guong, V.T., Sebesvari, Z. Resilience and
shifts in agro-ecosystems facing increasing sea-level rise and salinity intrusion in Ben Tre Province, Mekong Delta. Climatic Change (accepted)
Wilbers, G., Becker, M., Nga, L.T., Sebesvari, Z., Renaud, F.G. Spatial and temporal
variability of surfacewater pollution in the Mekong Delta, Vietnam. Science of the Total Environment. (accepted)
Die folgenden Publikationen sind in Bearbeitung bzw. Review: Wilbers, G., Sebesvari, Z., Renaud, F.G., Spatial visualization of groundwater quality
contamination in the lower Mekong Delta, Vietnam: pressure of salinity intrusion and identification of health-related risks. Environment International (in review)
Wilbers, G., Sebesvari, Z., Renaud, F.G. Water supply stations for rural communities in Southeast Asia provide safe, clean and sufficient drinking water? Experiences from the
Mekong Delta, Vietnam. Water (in review) Wilbers, G., Sebesvari, Z., Renaud, F.G. A comparative risk assessment associated with
the microbial quality of drinking water sources in the Mekong Delta, Vietnam. (in preparation)
Renaud, F.G., Friedrich, J., Sebesvari, Z., Giosan, L. Tipping points in major world deltas:
examples from the Danube and Mekong deltas. (in preparation) Wissenschafltiche Vorträge: Chau, D.G.N, Sebesvari, Z., Renaud, F.G. (2013). Drinking water quality in the Mekong
Delta: Pesticide and antibiotic application and resulting pollution. Oral Presentation. Mekong Environmental Symposium. 5-7 March 2013. Ho Chi Minh City, Vietnam.
Nga, L.T., Sebesvari, Z., Arnold, U., Kreye, C., Guong, V.T., Becker, M., Renaud, F.G.
(2013). Good practices in Rice Production in the Mekong delta: Challenges and Opportunities. Oral presentation. Conference Water-Food Security in Vietnam Assessing risk and alternatives under an altered flow regime, December 5-6, 2013, Can Tho, Vietnam.
Abschlussbericht für den Projektträger Jülich, Projekt WISDOM II, 10/2010 – 02/2014
121
Renaud, F.G., Sebesvari, Z. (2013). The Mekong Delta: a giant with feet of clay? Oral Presentation. Mekong Environmental Symposium. 5-7 March 2013. Ho Chi Minh City, Vietnam.
Sebesvari, Z., Rodrigues, S., Renaud, F.G. (2013). "Water quality in the Mekong basin –
Making the case for water related ecosystem services". Oral Presentation. Mekong Environmental Symposium. 5-7 March 2013. Ho Chi Minh City, Vietnam.
Sebesvari, Z., Renaud, F.G. (2013). Rice production, water pollution and ecosystem
services in The Mekong Delta, Vietnam. Oral presentation at the 6th annual ESP conference from 26-30 2013 August Bali, Indonesia.
Wilbers, G.W., Sebesvari, Z., Rechenburg, A., Renaud, F.G. (2013). Microbial Health Risks
Associated with Drinking Water Sources in the Mekong Delta, Vietnam. Oral Presentation. Environmental Health 2013. Science and Policy to Protect Future Generations. 3rd - 6th March 2013, Boston, USA.
Wilbers, G., Sebesvari, Z., Renaud, F., Becker, M., (2013). The relationship between land-
use and tidal regime with surface water quality in the Mekong Delta, Vietnam. Poster presentation. Land-use and Water Quality conference, The Hague, The Netherlands, 10 – 13 June, 2013.
Sebesvari, Z., Huong, T.T.L., Renaud, F.G. (2012).Ecosystem services and food security in
the Mekong Delta, Vietnam. Oral Presentation. 5th Annual Ecosystem Services Partnership Conference: Ecosystem Services Come of Age. July 31-August 4, 2012: Portland, Oregon, United States.
Bläsing, M., Rosendahl, I., Sebesvari, Z., Renaud, F. G, Amelung, W. (2011). Pesticide
residues in soils and sediments in the Mekong Delta, Vietnam. Tropentag 2011. Development on the margin, October 5-7, 2011, University of Bonn, Bonn, Germany.
Bläsing, M.; Rosendahl, I., Sebesvari, Z., Renaud, F., Amelung, W. (2011).
Pestizidrückstände in Böden und Sedimenten des Mekong Deltas, Vietnam. Poster, Jahrestagung der Deutschen Bodenkundlichen Gesellschaft 2011, 3-9 September 2011, Berlin.
Renaud, F.G., Huong, T.T.L., Lindener, C., Sebesvari, Z. (2011). Increasing salinity
intrusion in the Mekong Delta, Vietnam: how could the recognition of ecosystem services approach make a difference? Ecosystem Services: integrating Science and Practice, 4th International ESP Conference, 4 – 7 October 2011, Wageningen, The Netherlands.
Renaud, F.G., Huong, T.T.L., Lindener, C., Sebesvari, Z. (2011) Resilience and shifts in
agro-ecosystems facing increasing salinity intrusion in Ben Tre Province, Mekong Delta, presented at LOICZ Open Science Conference in China, 12-15 September, Yantai, China.

Abschlussbericht für den Projektträger Jülich, Projekt WISDOM II, 10/2010 – 02/2014
122
Abschlussbericht für den Projektträger Jülich, Projekt WISDOM II, 10/2010 – 02/2014
123
D. Bericht Projektteil Verwundbarkeits- und Anpassungs-forschung (in WP 5000) – UNU-EHS
Kurze Darstellung 1
1.1 Aufgabenstellung
Aufbauend auf den Ergebnissen der Verwundbarkeitsforschung in der ersten Projektphase von WISDOM (Risiko- und Verwundbarkeitsprofilierung in drei ausgewählten bio-physikalischen und sozio-ökonomischen Zonen des Mekongdelta und Indikatorenentwicklung zur Messung und zum Monitoring von Verwundbarkeit gegenüber Naturgefahren), bestand die Hauptaufgabe in der zweiten Projektphase darin, ein multidimensionales und integriertes Evaluationsraster für verschiedene momentan angedachte sowie umgesetzte Maßnahmen zur Anpassung an die im Mekongdelta vorherrschenden Naturgefahren (Überschwemmung, Versalzung, Wirbelstürme) zu entwickeln und dieses für die Analyse anzuwenden.
1.2 Voraussetzungen, unter denen das Vorhaben durchgeführt wurde
Das Vorhaben ist Teil des WISDOM-Projektes und trägt zu dessen Zielerfüllung bei, d.h. zum Aufbau eines integrierten Informationssystems zur Unterstützung von Entscheidungsfindungsprozessen im Bereich des Integrierten Wasserressourcenmanagements (IWRM) im Mekongdelta. Die Einbindung einer sozial- und wirtschaftswissenschafltlichen Verwundbarkeits- und v.a. Anpassungsperspektive in IWRM-Konzepte ist bislang unzureichend ausgeprägt, v.a. im Hinblick auf zukünftige Herausforderungen des IWRM unter den Bedingungen des Klimawandels. Letztere wird vermehrt Anpassungsmaßnahmen an sich intensivierende Naturgefahren und Extremereignisse erfordern. Eine umfassende Evaluierung und strategische Abwägung von verschiedenen denkbaren Anspassungsmaßnahmen ist aber bislang nur schwach entwickelt.
1.3 Planung und Ablauf des Vorhabens
Das Vorhaben steuerte Bausteine zu drei Aufgaben im Work Package 5000 bei, wobei gemäß des Projektantrages der Schwerpunkt deutlich auf Task 5200 lag (From Vulnerability to Adaptation Strategies). Gemäß diesen Aufgaben lassen sich Planung und Ablauf des Vorhabens in vier wesentliche Unterpunkte gliedern:
Analyse von Verwundbarkeits- und integrierten Risikodaten aufbauend auf der ersten Projektphase und die Übersetzung dieser Daten in Verwundbarkeits- und Risikokarten gemeinsam mit dem Projektpartner GFZ (A5120 und A5150)
Identifizierung und Analyse aktueller Bewältigungs- und Anpassungsmaßnahmen im Umgang mit Naturgefahren. Diese Analyse umfasst Maßnahmen sowohl staatlicher als auch nicht-staatlicher Akteure.
Entwicklung eines Evaluierungsrasters zur multidimensionalen Einschätzung und Abwägung verschiedener, möglicher Anpassungsmaßnahmen.
Analyse der Rahmenfaktoren, welche die Umsetzung von verschiedenen Anpassungsmaßnahmen unterstützen oder hemmen können.
Gemäß dieser Arbeitsabläufe und der im Projektantrag dargelegten Planungen, spiegelt die folgende Tabelle die einzelnen Arbeitsschritte (Activities) wieder:
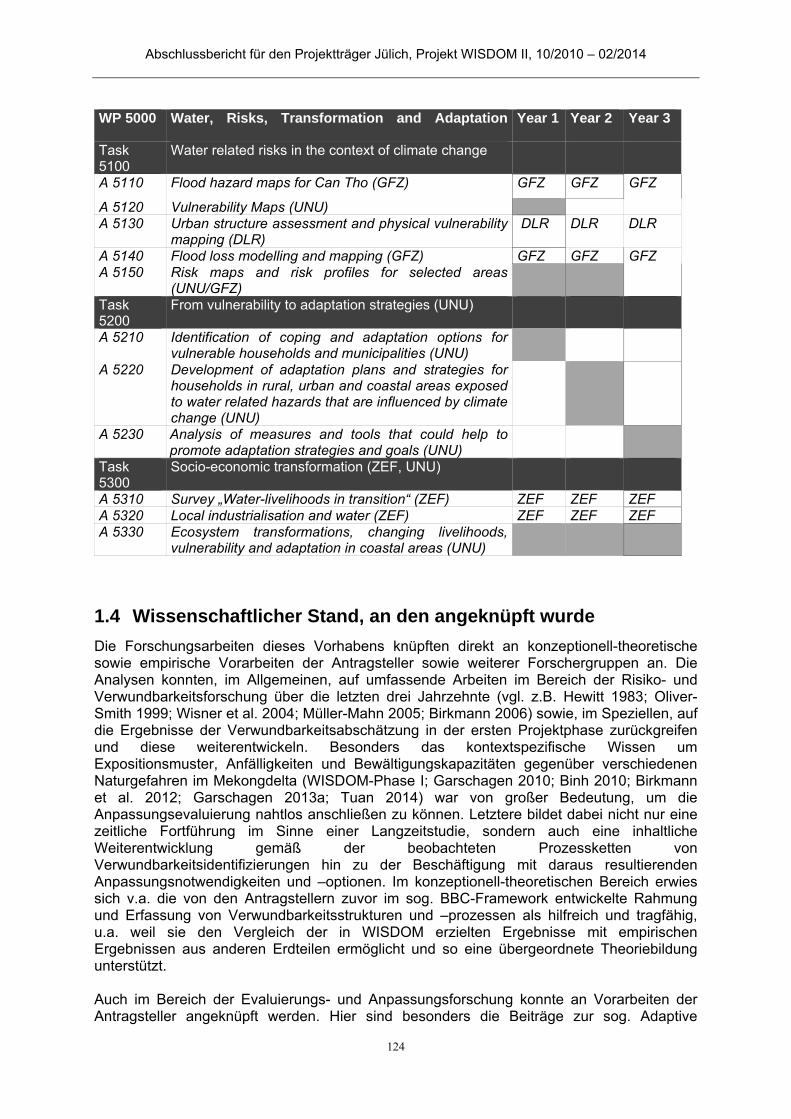
Abschlussbericht für den Projektträger Jülich, Projekt WISDOM II, 10/2010 – 02/2014
124
WP 5000 Water, Risks, Transformation and Adaptation
Year 1 Year 2 Year 3
Task 5100
Water related risks in the context of climate change
A 5110 Flood hazard maps for Can Tho (GFZ) GFZ GFZ GFZ
A 5120 Vulnerability Maps (UNU) A 5130 Urban structure assessment and physical vulnerability
mapping (DLR) DLR DLR DLR
A 5140 Flood loss modelling and mapping (GFZ) GFZ GFZ GFZ A 5150 Risk maps and risk profiles for selected areas
(UNU/GFZ)
Task 5200
From vulnerability to adaptation strategies (UNU)
A 5210 Identification of coping and adaptation options for vulnerable households and municipalities (UNU)
A 5220 Development of adaptation plans and strategies for households in rural, urban and coastal areas exposed to water related hazards that are influenced by climate change (UNU)
A 5230 Analysis of measures and tools that could help to promote adaptation strategies and goals (UNU)
Task 5300
Socio-economic transformation (ZEF, UNU)
A 5310 Survey „Water-livelihoods in transition“ (ZEF) ZEF ZEF ZEF A 5320 Local industrialisation and water (ZEF) ZEF ZEF ZEF A 5330 Ecosystem transformations, changing livelihoods,
vulnerability and adaptation in coastal areas (UNU)
1.4 Wissenschaftlicher Stand, an den angeknüpft wurde
Die Forschungsarbeiten dieses Vorhabens knüpften direkt an konzeptionell-theoretische sowie empirische Vorarbeiten der Antragsteller sowie weiterer Forschergruppen an. Die Analysen konnten, im Allgemeinen, auf umfassende Arbeiten im Bereich der Risiko- und Verwundbarkeitsforschung über die letzten drei Jahrzehnte (vgl. z.B. Hewitt 1983; Oliver- Smith 1999; Wisner et al. 2004; Müller-Mahn 2005; Birkmann 2006) sowie, im Speziellen, auf die Ergebnisse der Verwundbarkeitsabschätzung in der ersten Projektphase zurückgreifen und diese weiterentwickeln. Besonders das kontextspezifische Wissen um Expositionsmuster, Anfälligkeiten und Bewältigungskapazitäten gegenüber verschiedenen Naturgefahren im Mekongdelta (WISDOM-Phase I; Garschagen 2010; Binh 2010; Birkmann et al. 2012; Garschagen 2013a; Tuan 2014) war von großer Bedeutung, um die Anpassungsevaluierung nahtlos anschließen zu können. Letztere bildet dabei nicht nur eine zeitliche Fortführung im Sinne einer Langzeitstudie, sondern auch eine inhaltliche Weiterentwicklung gemäß der beobachteten Prozessketten von Verwundbarkeitsidentifizierungen hin zu der Beschäftigung mit daraus resultierenden Anpassungsnotwendigkeiten und –optionen. Im konzeptionell-theoretischen Bereich erwies sich v.a. die von den Antragstellern zuvor im sog. BBC-Framework entwickelte Rahmung und Erfassung von Verwundbarkeitsstrukturen und –prozessen als hilfreich und tragfähig, u.a. weil sie den Vergleich der in WISDOM erzielten Ergebnisse mit empirischen Ergebnissen aus anderen Erdteilen ermöglicht und so eine übergeordnete Theoriebildung unterstützt. Auch im Bereich der Evaluierungs- und Anpassungsforschung konnte an Vorarbeiten der Antragsteller angeknüpft werden. Hier sind besonders die Beiträge zur sog. Adaptive
Abschlussbericht für den Projektträger Jülich, Projekt WISDOM II, 10/2010 – 02/2014
125
Governance (Birkmann et al. 2010; Garschagen 2013b) und zum integrierten Risiko- und Klimawandelanpassungsmanagement (Birkmann und Teichmann 2010; Garschagen et al. 2009) zu nennen. Die Forschungsarbeiten in WISDOM II erlaubten daher eine zielgerichtete Weiterentwicklung dieser Ansätze. Dies bezieht sich insbesondere auf die bislang nur schwach ausgeprägte Literatur zu integrierten Ansätzen der Evaluierung von Anpassungsmaßnahmen im Naturgefahrenkontext, welche über herkömmliche ökonometrische Ansätze der Kosten-Nutzen-Rechnung hinausgehen und multidimensionale Aspekte z.B. der kulturellen Akzeptanz oder der politischen Umsetzbarkeit von Anpassungsmaßnahmen berücksichtigen. Die Vorarbeiten der Antragsteller haben deutlich gezeigt, dass solch weiter gefasste Evaluierungen von großer Bedeutung sind, um Handlungsempfehlungen entwickeln zu können, die eine effektive und nachhaltig funktionale Umsetzung von Anpassungsmaßnahmen gewährleisten, v.a. im Kontext des IWRM.
1.5 Zusammenarbeit mit anderen Stellen
Die Arbeiten im Verwundbarkeits-, Risiko- und Anpassungsbereich wurden v.a. in enger Kooperation mit Partnern in Can Tho sowie Ho Chi Minh City durchgeführt. Besonders zu erwähnen sind dabei das Department for International Relations der Can Tho University, das Mekong Delta Development Institute (MDI) der Can Tho University sowie das Southern Institute for Water Resources Research (SIWRR). Darüber hinaus greift die Anpassungsevaluierung aber auf ein großes Netzwerk an nationalen und internationalen Instituten zurück (z.B. UN-HABITAT Vietnam, UNDP Vietnam). Mit diesen Partnern hat über den Projektzeitraum ein reger wissenschaftlicher Austausch und intensive Kooperation stattgefunden, z.B. im Rahmen von gemeinsamen Publikationen. Für eine genaue Aufstellung siehe Kapitel 2.4 in diesem Bericht „Fortschreibung des Verwertungsplans“. Cited references:
Binh, N.T. (2010): Vulnerability and adaptation to salinity intrusion in the Mekong delta of Vietnam -- Preliminary findings from Tra Vinh province. Setiadi, N., Birkmann, J, & Buckle, P. (eds.): Disaster Risk Reduction and Climate Change Adaptation: Case Studies from South and Southeast Asia. SOURCE, 14: 32-39.
Birkmann J (2006) Measuring vulnerability to natural hazards. Towards disaster resilient societies. UNU-Press, Tokyo
Birkmann, J., Garschagen, M., Kraas, F., and N. Quang (2010). Adaptive Urban Governance: New Challenges for the Second Generation of Urban Adaptation Strategies to Climate Change. In Sustainability Science. vol. 5, no. 2, pp. 185-206.
Birkmann, J., Garschagen, M., Tuan, V.V., and N.T. Binh (2012). Profiling Present and Future Vulnerability to Water-Related Hazards in the Mekong Delta. In Renaud, F., Künzer, C. (eds.): The Mekong Delta System - Interdisciplinary Analyses of a River Delta. Springer.
Birkmann, J.; von Teichmann, K. (2010): Integrating disaster risk reduction and climate change adaptation: key challenges—scales, knowledge, and norms. In: Sustainability Science. vol. 5(2), pp. 171-184
Garschagen , M., Binh, N.T., and L.N. Thach (2009). Vietnam: The Challenge of Integrating Disaster Risk Reduction and Climate Change Adaptation. In Birkmann, J.; Tetzlaff, G.; Zentel, K. (eds.). Addressing the Challenge: Recommendations and Quality Criteria for Linking Disaster Risk Reduction and Adaptation to Climate Change. DKKV Publication Series, 38. pp. 18-20.
Garschagen, M. (2010). Potential Humanitarian Crises and Climate Change Adaptation in the Coupled Social-Ecological Systems of the Mekong Delta, Vietnam. In Shen, X.; Downing, T.E.; Hamza, M. (eds.): Tipping Points in Humanitarian Crises: From Hot Spots to Hot Systems. SOURCE No.13/2010. pp. 45-55. Bonn: United Nations University Institute for Environment and Human Security (UNU-EHS).
Abschlussbericht für den Projektträger Jülich, Projekt WISDOM II, 10/2010 – 02/2014
126
Garschagen, M., (2013a). Risky change? Dynamics in vulnerability and adaptation to natural hazards between transformation and climate change in Can Tho City, Vietnam (PhD Thesis). University of Cologne. Successfully defended in October 2013.
Garschagen, M. (2013b). Resilience and Organisational Institutionalism from a Cross-Cultural Perspective – An Exploration based on Urban Climate Change Adaptation in Vietnam. In Natural Hazards. vol. 67, no. 1, pp. 25-46.
Hewitt K (1983) Interpretations of Calamity from the Viewpoint of Human Ecology. Allen & Unwin, London
Müller-Mahn D (2005) Von „Naturkatastrophen“ zu „Complex Emergencies“ : Die Entwicklung integrativer Forschungsansätze im Dialog mit der Praxis. In: Müller-Mahn D, Wardenga U (eds) Integrative Forschungsansätze. Leipzig, pp 69-78
Oliver-Smith A, Hoffman S M (1999) The Angry Earth: Disaster in Anthropological Perspective. New York
Tuan, Vo Van (2014): Vulnerability assessment of different socio-economic groups to floods in the rural Mekong Delta of Vietnam. PhD thesis. Rheinischen Friedrich-Wilhelms-Universität zu Bonn, Bonn, Germany. Institut für Geographie.
Wisner B, Blaikie P, Cannon T, Davis I (2004) At Risk: natural hazards, people’s vulnerability and disasters., 2nd edn. Routledge; London
Abschlussbericht für den Projektträger Jülich, Projekt WISDOM II, 10/2010 – 02/2014
127
Eingehende Darstellung des Projektes 2
2.1 Verwendung der Zuwendung und erzielte Ergebnisse
The following paragraphs lay out the most important scientific results of UNU-EHS’ vulnerability, risk and adaptation research in WISDOM II. The chapter thereby shows how the resources in the project have been deployed for the scientific work. In order to guarantee a coherent and easy-to-follow presentation of the results, the activities of UNU-EHS activities within Task 5100, 5200 and 5300 will be presented in an integrated fashion. In accordance with the work plan and project proposal, the focus will therein be on the analysis of adaptation decisions and the evaluation of adaptation options from Task 5200. The results of Task 5100 can therefore be found in part 2.1.6.2 A (on the risk context) while the results of Task 5300 are integrated into the coastal assessment in Tra Vinh Province.
Introduction and rationale 2.1.1
Water-related risk is an integral part of human activity throughout the Vietnamese Mekong Delta (cf. results of WISDOM I) and requires comprehensive adaptation action and, hence, the strategic identification, comparison and evaluation of different adaptation options. In the last decades, water-related hazards in the Mekong Delta have caught the attention of the scientific and public community (cf. Delgado et al. 2009, Künzer et al. 2013, Le Thi Viet Hoa et al. 2007), especially in the light of a rapidly changing climate (cf. Carew-Reid 2008; Chaudhry and Ruysschaert 2007). After years of focusing primarily on the geo-physical hazards (most notably floods, sea level rise and salinization), the need to also examine social and economic vulnerabilities and adaptive capacities amongst the Delta’s population has increasingly been recognized (cf. Adger et al. 2001, Le Anh Tuan, Chinvanno 2011, McElwee 2010). Also the scholars of the first phase of WISDOM have addressed those topics by assessing the vulnerability to flooding and saline intrusion in the urban areas of Can Tho City and in rural areas in Tra Vinh and Dong Thap province and by appraising the adaptive capacity of state and non-state actors (Birkmann et al. 2012; Nguyen Thanh Binh 2010; Garschagen 2013; Vo Van Tuan 2013). However, building on these achievements for understanding the factors that shape vulnerabilities and adaptive capacities throughout different geo-physical and socio-economic settings in the Mekong Delta, there is a strong need to better assess and evaluate the different adaptation options that are currently implemented or debated in those settings. A strategic comparison and evaluation based on multi-dimensional criteria for assessing different adaptation options is greatly lacking to date – despite of it being highly relevant in order to steer current and future adaptation decisions in the face of intensifying hazard patterns with climate change. This relevance as well as the complexity and challenges of assessing and evaluating risk-related strategies can be illustrated at the example of flooding in the year 2011: In that year, flood levels reached alarming heights for long periods of time. As a result of prevalent vulnerability patterns, flooding resulted in a total economic loss of almost 800 billion VND, i.e. ca. 28 million Euro at that time (CFSC 2011), and, most gravely, the loss of 89 lives. These numbers are startling, however, not only as indicators for the threatening nature of water-related hazards but also as marker for the quality of risk-related response mechanisms. After the extreme flood in the year 2000, a large number of state and non-state-led measures were taken in order to be better prepared and mitigate the impacts of flooding. Most prominent were in this context resettlement policies and the continuous improvement of the dike system. In 2000, the flood levels had been only marginally higher than in 2011. And yet, the floods in 2000 caused an economic loss nearly 15 times higher than in 2011 and the loss of lives was with 448 casualties five times higher than in 2011 (Kazama et al. 2002). This

Abschlussbericht für den Projektträger Jülich, Projekt WISDOM II, 10/2010 – 02/2014
128
seems to be a clear indication for the necessity and the quality of the previously implemented adaptation measures. Nevertheless, these numbers reveal only one side of the implemented strategies. They do not show how expensive those measures were, which groups and regions had to bear the costs of their implementation (in terms of both hard economic as well as soft social costs), how high opportunity costs have been, whether the efficiency and effectiveness of the strategies have been sufficient, which long-term consequences may occur for nature and society, and in how far these measures might be adequate for even higher floods than the ones in 2000 and 2011. Several scholars have therefore assessed adaptation strategies in the context of water-related risks by integrating some of those aspects (cf. Fortier 2010; Vo Thanh Danh, Mushtaq 2011; Pham Cong Huu 2011). Moreover, NGOs underscore the relevance of such assessments in each and every project proposal (cf, Oxfam 2008; GIZ 2014; CARE 2012) and the government has included a multitude of evaluation criteria as integral part of more recent policies such as the National Strategy on Natural Disaster Prevention, Control and Mitigation (NS-DPCM) and the National Target Program to Respond to Climate Change (NTP-RCC) (MONRE July 2008; GoV November 2007). However, most of those assessments merely are one-dimensional, focus on single government-led strategies, are considerate of one actor-group only, or neglect spatial and temporal interconnectivities. Those drawbacks not only hold true for the Mekong Delta but also for studies in different regional or scientific contexts. Many scholars evaluate strategies based on narrow assumptions such as that the most cost-efficient alternative is also the ‘right’ one to choose (see e.g. Stern 2007). However, there exists a large variety of notable criteria and it is debatable as to how far ‘right’ can be measured in such absolute terms. ‘Good’ adaptation for one person or group can be ‘bad’ for others, which is why individual values are important issues to be considered. Hence, subjective evaluations are essential for generating an understanding why certain actions are put in place while others are not. Doing justice to all those aspects requires more comprehensive and integrative conceptual and methodological approaches. Those have, however, only rarely been developed in the literature so far. The scholars of the second phase of WISDOM therefore address the question how and why different actors perceive and evaluate their adaptation options and, consecutively, take their adaptation decisions. The overall goals have accordingly been to analyse what “good” risk-related response mechanisms mean, to assess the barriers to a successful implementation of “good” strategies, and to identify context-specific ways of overcoming the barriers to “good” adaptation and coping. In order to achieve these goals, the UNU-EHS’ PhD scholars in work package 5000 of WISDOM II have developed an innovative and integrative evaluation framework that is considerate of multiple dimensions and timescales. Hereby, actor-specific and subjective decision-making aspects are integrated and matched with a systemic view on the vulnerability of different household groups. Empirically, this evaluation framework was applied to rural and urban areas in the Vietnamese Mekong Delta and was assessed by a mixed-method approach. In the following sections, firstly, the existing state of the art in risk research, decision-making literature and evaluation research will be reviewed (2.1.2) based on which the common conceptual framework used for this study will be developed (2.1.3). Consequently, the selection of the case study areas will be introduced against the background of their relevance for the current research context (2.1.4). This conceptual and regional framing provides the basis for describing and reasoning the methodological proceeding (2.1.5). The most important empirical results from both urban and rural areas will be analysed in the subsequent section (2.1.6). Finally, the findings will be discussed and empirical, conceptual, and methodological conclusions will be drawn (2.1.7).
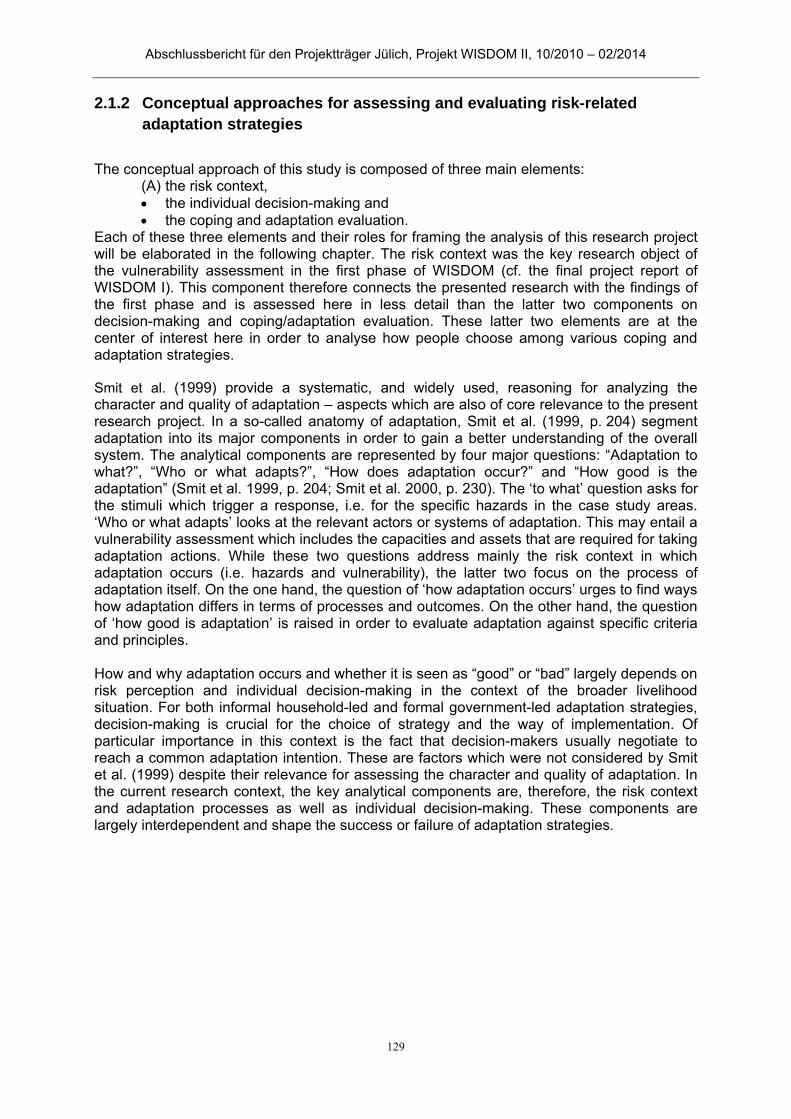
Abschlussbericht für den Projektträger Jülich, Projekt WISDOM II, 10/2010 – 02/2014
129
Conceptual approaches for assessing and evaluating risk-related 2.1.2adaptation strategies
The conceptual approach of this study is composed of three main elements:
(A) the risk context, the individual decision-making and the coping and adaptation evaluation.
Each of these three elements and their roles for framing the analysis of this research project will be elaborated in the following chapter. The risk context was the key research object of the vulnerability assessment in the first phase of WISDOM (cf. the final project report of WISDOM I). This component therefore connects the presented research with the findings of the first phase and is assessed here in less detail than the latter two components on decision-making and coping/adaptation evaluation. These latter two elements are at the center of interest here in order to analyse how people choose among various coping and adaptation strategies. Smit et al. (1999) provide a systematic, and widely used, reasoning for analyzing the character and quality of adaptation – aspects which are also of core relevance to the present research project. In a so-called anatomy of adaptation, Smit et al. (1999, p. 204) segment adaptation into its major components in order to gain a better understanding of the overall system. The analytical components are represented by four major questions: “Adaptation to what?”, “Who or what adapts?”, “How does adaptation occur?” and “How good is the adaptation” (Smit et al. 1999, p. 204; Smit et al. 2000, p. 230). The ‘to what’ question asks for the stimuli which trigger a response, i.e. for the specific hazards in the case study areas. ‘Who or what adapts’ looks at the relevant actors or systems of adaptation. This may entail a vulnerability assessment which includes the capacities and assets that are required for taking adaptation actions. While these two questions address mainly the risk context in which adaptation occurs (i.e. hazards and vulnerability), the latter two focus on the process of adaptation itself. On the one hand, the question of ‘how adaptation occurs’ urges to find ways how adaptation differs in terms of processes and outcomes. On the other hand, the question of ‘how good is adaptation’ is raised in order to evaluate adaptation against specific criteria and principles. How and why adaptation occurs and whether it is seen as “good” or “bad” largely depends on risk perception and individual decision-making in the context of the broader livelihood situation. For both informal household-led and formal government-led adaptation strategies, decision-making is crucial for the choice of strategy and the way of implementation. Of particular importance in this context is the fact that decision-makers usually negotiate to reach a common adaptation intention. These are factors which were not considered by Smit et al. (1999) despite their relevance for assessing the character and quality of adaptation. In the current research context, the key analytical components are, therefore, the risk context and adaptation processes as well as individual decision-making. These components are largely interdependent and shape the success or failure of adaptation strategies.
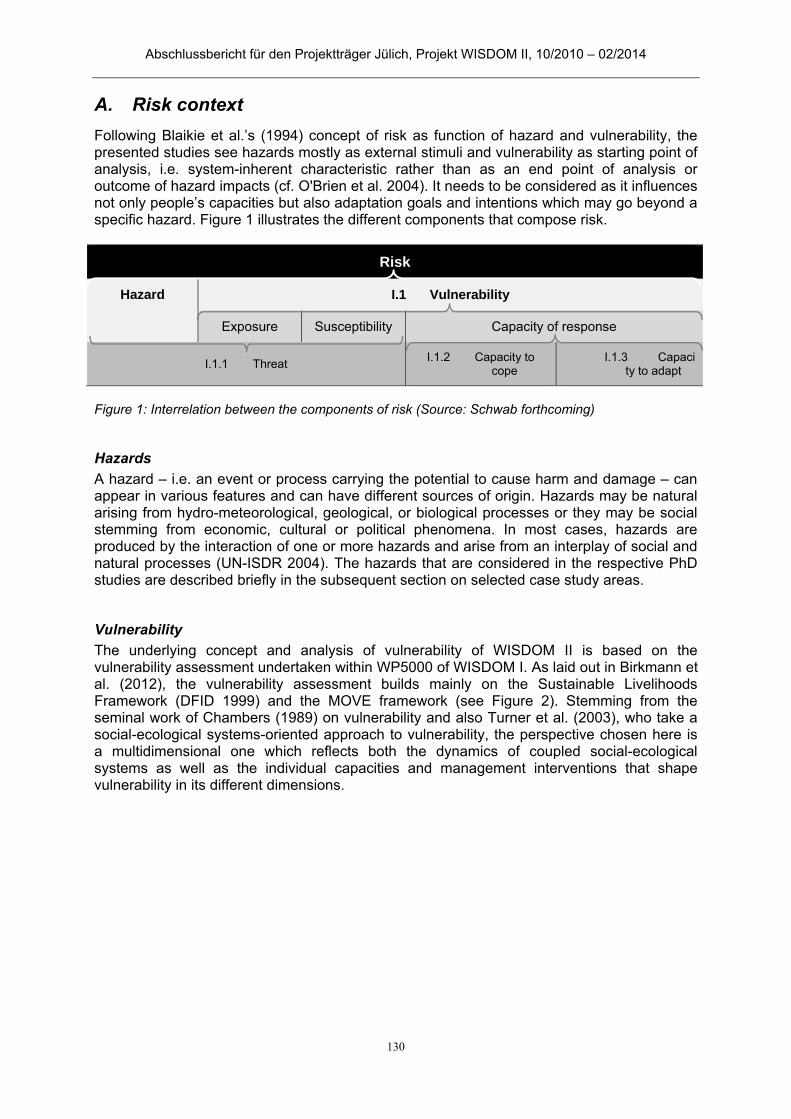
Abschlussbericht für den Projektträger Jülich, Projekt WISDOM II, 10/2010 – 02/2014
130
A. Risk context
Following Blaikie et al.’s (1994) concept of risk as function of hazard and vulnerability, the presented studies see hazards mostly as external stimuli and vulnerability as starting point of analysis, i.e. system-inherent characteristic rather than as an end point of analysis or outcome of hazard impacts (cf. O'Brien et al. 2004). It needs to be considered as it influences not only people’s capacities but also adaptation goals and intentions which may go beyond a specific hazard. Figure 1 illustrates the different components that compose risk.
Risk
Hazard I.1 Vulnerability
Exposure Susceptibility Capacity of response
I.1.1 Threat I.1.2 Capacity to
cope I.1.3 Capaci
ty to adapt
Figure 1: Interrelation between the components of risk (Source: Schwab forthcoming)
Hazards
A hazard – i.e. an event or process carrying the potential to cause harm and damage – can appear in various features and can have different sources of origin. Hazards may be natural arising from hydro-meteorological, geological, or biological processes or they may be social stemming from economic, cultural or political phenomena. In most cases, hazards are produced by the interaction of one or more hazards and arise from an interplay of social and natural processes (UN-ISDR 2004). The hazards that are considered in the respective PhD studies are described briefly in the subsequent section on selected case study areas.
Vulnerability
The underlying concept and analysis of vulnerability of WISDOM II is based on the vulnerability assessment undertaken within WP5000 of WISDOM I. As laid out in Birkmann et al. (2012), the vulnerability assessment builds mainly on the Sustainable Livelihoods Framework (DFID 1999) and the MOVE framework (see Figure 2). Stemming from the seminal work of Chambers (1989) on vulnerability and also Turner et al. (2003), who take a social-ecological systems-oriented approach to vulnerability, the perspective chosen here is a multidimensional one which reflects both the dynamics of coupled social-ecological systems as well as the individual capacities and management interventions that shape vulnerability in its different dimensions.
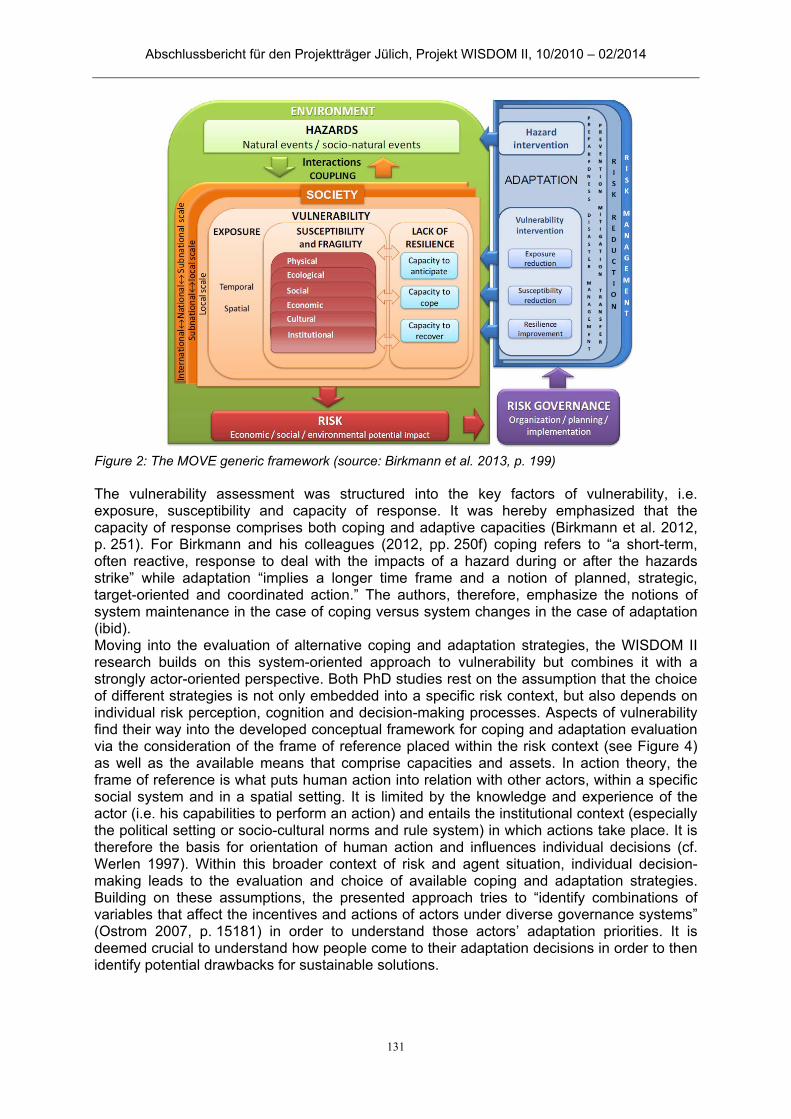
Abschlussbericht für den Projektträger Jülich, Projekt WISDOM II, 10/2010 – 02/2014
131
Figure 2: The MOVE generic framework (source: Birkmann et al. 2013, p. 199) The vulnerability assessment was structured into the key factors of vulnerability, i.e. exposure, susceptibility and capacity of response. It was hereby emphasized that the capacity of response comprises both coping and adaptive capacities (Birkmann et al. 2012, p. 251). For Birkmann and his colleagues (2012, pp. 250f) coping refers to “a short-term, often reactive, response to deal with the impacts of a hazard during or after the hazards strike” while adaptation “implies a longer time frame and a notion of planned, strategic, target-oriented and coordinated action.” The authors, therefore, emphasize the notions of system maintenance in the case of coping versus system changes in the case of adaptation (ibid). Moving into the evaluation of alternative coping and adaptation strategies, the WISDOM II research builds on this system-oriented approach to vulnerability but combines it with a strongly actor-oriented perspective. Both PhD studies rest on the assumption that the choice of different strategies is not only embedded into a specific risk context, but also depends on individual risk perception, cognition and decision-making processes. Aspects of vulnerability find their way into the developed conceptual framework for coping and adaptation evaluation via the consideration of the frame of reference placed within the risk context (see Figure 4) as well as the available means that comprise capacities and assets. In action theory, the frame of reference is what puts human action into relation with other actors, within a specific social system and in a spatial setting. It is limited by the knowledge and experience of the actor (i.e. his capabilities to perform an action) and entails the institutional context (especially the political setting or socio-cultural norms and rule system) in which actions take place. It is therefore the basis for orientation of human action and influences individual decisions (cf. Werlen 1997). Within this broader context of risk and agent situation, individual decision-making leads to the evaluation and choice of available coping and adaptation strategies. Building on these assumptions, the presented approach tries to “identify combinations of variables that affect the incentives and actions of actors under diverse governance systems” (Ostrom 2007, p. 15181) in order to understand those actors’ adaptation priorities. It is deemed crucial to understand how people come to their adaptation decisions in order to then identify potential drawbacks for sustainable solutions.
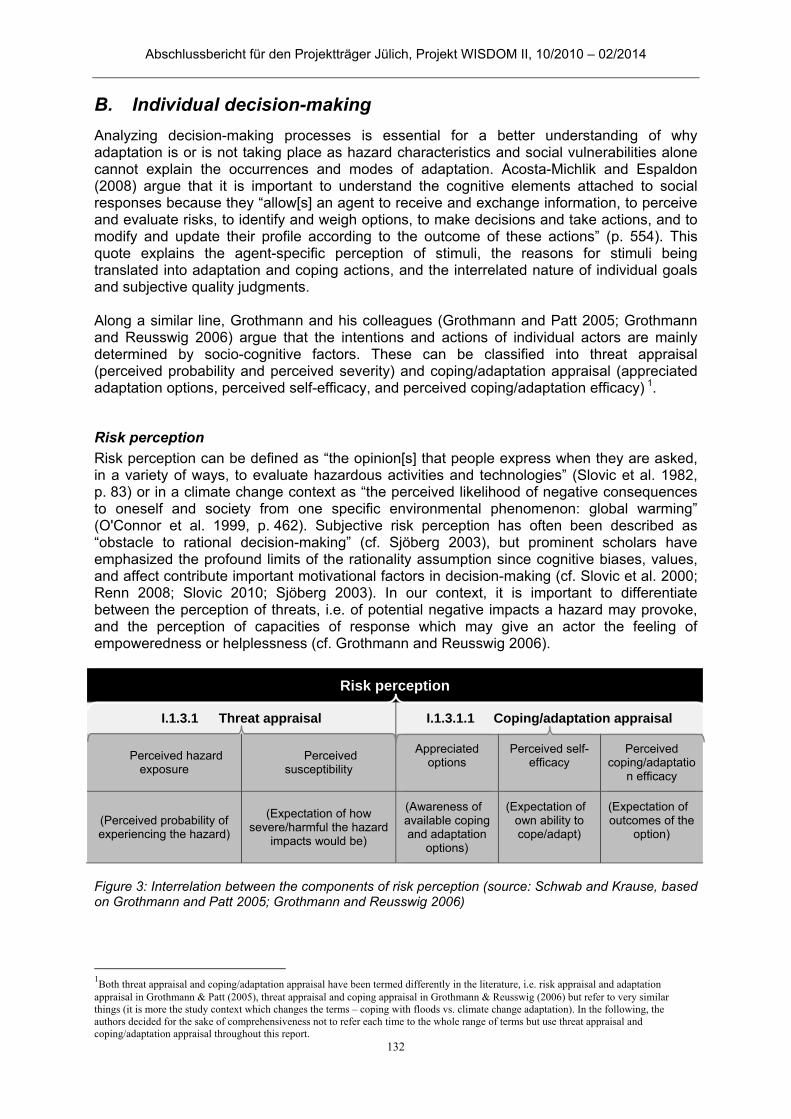
Abschlussbericht für den Projektträger Jülich, Projekt WISDOM II, 10/2010 – 02/2014
132
B. Individual decision-making
Analyzing decision-making processes is essential for a better understanding of why adaptation is or is not taking place as hazard characteristics and social vulnerabilities alone cannot explain the occurrences and modes of adaptation. Acosta-Michlik and Espaldon (2008) argue that it is important to understand the cognitive elements attached to social responses because they “allow[s] an agent to receive and exchange information, to perceive and evaluate risks, to identify and weigh options, to make decisions and take actions, and to modify and update their profile according to the outcome of these actions” (p. 554). This quote explains the agent-specific perception of stimuli, the reasons for stimuli being translated into adaptation and coping actions, and the interrelated nature of individual goals and subjective quality judgments. Along a similar line, Grothmann and his colleagues (Grothmann and Patt 2005; Grothmann and Reusswig 2006) argue that the intentions and actions of individual actors are mainly determined by socio-cognitive factors. These can be classified into threat appraisal (perceived probability and perceived severity) and coping/adaptation appraisal (appreciated adaptation options, perceived self-efficacy, and perceived coping/adaptation efficacy) 1.
Risk perception
Risk perception can be defined as “the opinion[s] that people express when they are asked, in a variety of ways, to evaluate hazardous activities and technologies” (Slovic et al. 1982, p. 83) or in a climate change context as “the perceived likelihood of negative consequences to oneself and society from one specific environmental phenomenon: global warming” (O'Connor et al. 1999, p. 462). Subjective risk perception has often been described as “obstacle to rational decision-making” (cf. Sjöberg 2003), but prominent scholars have emphasized the profound limits of the rationality assumption since cognitive biases, values, and affect contribute important motivational factors in decision-making (cf. Slovic et al. 2000; Renn 2008; Slovic 2010; Sjöberg 2003). In our context, it is important to differentiate between the perception of threats, i.e. of potential negative impacts a hazard may provoke, and the perception of capacities of response which may give an actor the feeling of empoweredness or helplessness (cf. Grothmann and Reusswig 2006).
Risk perception
I.1.3.1 Threat appraisal I.1.3.1.1 Coping/adaptation appraisal
Perceived hazard exposure
Perceived susceptibility
Appreciated options
Perceived self-efficacy
Perceived coping/adaptatio
n efficacy
(Perceived probability of experiencing the hazard)
(Expectation of how severe/harmful the hazard
impacts would be)
(Awareness of available coping and adaptation
options)
(Expectation of own ability to cope/adapt)
(Expectation of outcomes of the
option)
Figure 3: Interrelation between the components of risk perception (source: Schwab and Krause, based on Grothmann and Patt 2005; Grothmann and Reusswig 2006)
1Both threat appraisal and coping/adaptation appraisal have been termed differently in the literature, i.e. risk appraisal and adaptation
appraisal in Grothmann & Patt (2005), threat appraisal and coping appraisal in Grothmann & Reusswig (2006) but refer to very similar things (it is more the study context which changes the terms – coping with floods vs. climate change adaptation). In the following, the authors decided for the sake of comprehensiveness not to refer each time to the whole range of terms but use threat appraisal and coping/adaptation appraisal throughout this report.

Abschlussbericht für den Projektträger Jülich, Projekt WISDOM II, 10/2010 – 02/2014
133
Figure 3 shows that threat appraisal corresponds largely with the definitions of hazard exposure and susceptibility elaborated in the vulnerability assessment undertaken during the first phase of WISDOM. The second part on coping/adaptation appraisal looks at the perceived capacity of response. It thus emphasizes the role of perception and cognition for understanding how different adaptation options are evaluated by individual actors. The above-depicted conceptualization of perceived threats builds on Grothmann and Patt’s (2005) definition which states that it “expresses the perceived probability of being exposed to climate change impacts and to the appraisal of how harmful these impacts would be to things an actor values (perceived severity), relative to the appraisal of how harmful and urgent other problems or challenges in life are” (p. 202) and is the “main determinant of the motivation to adapt” (ibid). This motivation is a key premise for but does not necessarily lead to an intention to take adaptation actions. At this point, the coping and adaptation appraisal comes into play. Only if an actor perceives that he has the available means to act and only if he thinks that the options are expected to have positive outcomes, will he form an intention to adapt or cope (Grothmann and Patt 2005). It is therefore an essential component not only in the frameworks of Grothmann and his colleagues but also of the present research.
Adaptation intention and avoidant maladaptation
The interplay of perception, cognition, available means and goal orientation leads to either an adaptation intention or avoidant maladaptation which are both still at the level of “project of the action” (cf. Werlen 1993), thus before action is taking place. Adaptation intention is generated from the combined perception of (a) high threat and (b) high capacity of response (resulting from the coping/adaptation appraisal). In contrast, avoidant maladaptation mainly arises if risk perception is high while the perceived adaptive capacity is low. Avoidant maladaptation represents the avoidance of responding to a given risk. This means that even if an agent feels threatened by a hazard he would avoid taking action because he does not see himself capable of an adequate response. Grothmann and Reusswig (2006) also integrate externally given barriers which can influence whether an agent goes for maladaptation or forms the intention to adapt. On the other side, Grothmann and Patt (2005) speak of incentives that are important in this context. Barriers or incentives can, for example, arise from the institutional context and political measures such as regulations, taxes or subsidies. In the current research, both incentives and barriers are considered and seen as integral part of the frame of reference. Finally, if an actor intends to take measures, it does not necessarily mean that these are also implemented. Sometimes, an actor bases his intention to act on an overestimation of his2 adaptive capacity. The implementation can then fail to materialize because the available means do not meet the means necessary to complete the intended action (Grothmann and Patt 2005; Kuruppu and Liverman 2011).
Individual cognition
Socio-cognitive models of decision-making, as the one developed in this research, furthermore account for cognitive biases and heuristics. They emerge because “perceptions differ among individuals depending on their needs, cultural values and preconceptions of a particular stimulus” (Kuruppu and Liverman 2011, p. 659). At that, heuristics are often
2 In order not to compromise the readability, we refer to an actor as ‘he’ throughout the report, yet of course acknowledging that male and female actors are covered under this term.
Abschlussbericht für den Projektträger Jülich, Projekt WISDOM II, 10/2010 – 02/2014
134
referred to as “simple rules of thumb” (Nicholls 1999, p. 1387) or common sense. They reduce cognitive challenges related to the vast number of decisions which have to be taken every day. Cognitive biases arise, for instance, from misjudgments based on unrealistic optimism, i.e. from the fact that people often underestimate the likelihood of being affected by a hazard (Nicholls 1999, p. 1390; Grothmann and Patt 2005). Another widespread misjudgement is referred to as availability effect, i.e. the memorability of an event or state is decisive for its perception (Slovic et al. 2000, p. 15). Accordingly, hazards which were experienced more recently are perceived to occur at a higher probability.
Available means and goal orientation
Based on the seminal works of Talcott Parsons, the situation in which action takes place is characterized by means and conditions where “[c]onditions refer only to those elements of the situation ‘over which the actor has no control, and means over which he has control’” (cited in Werlen 1993, p. 187). In our context, the available means of an actor comprise assets and capacities the actor can employ in order to complete an action which is geared towards a specific goal. The present approach makes, in contrast to prior adaptation decision-making research (see Rogers 1975, Grothmann and Patt 2005, Kurrupu and Livermann 2011) an explicit reference to goal orientation and the deliberate nature of action. It is these factors which distinguish action from behavior. Behavior is usually described as mere reaction to a stimulus. In contrast, action can be defined as „intentionally effecting or preventing a change in the world“ (Wright 1971, p. 83, cited in Werlen 1993, p. 11). It is thus important to note that action can be directed towards either change or maintaining the status quo depending on the actor’s goal. Hence, both the intention (Sheeran et al. 2005) and “any limits to adaptation depend on the ultimate goals of adaptation, which are themselves dependent upon diverse values” (Adger et al. 2009, p. 338). Actions which respond to problems in everyday life are, for example, often preferred over measures which aim at changing the situation in the long-run (Wisner et al. 2004; IPCC 2012, p. 45). Such preferences can be irrespective of the commonly referred to financial costs or benefits they may have. It is therefore necessary to also consider diverse values and goals of the actors in order to understand what they want to do – and not only what they can do. Renn (2008, p. 64), for example, finds that “[p]eople are willing to suffer harm if they feel it is justified or if it serves other goals”. In the context of strategy evaluation, goals are of particular interest, as they are at the center of each effectiveness evaluation (i.e. certain aspects of the adaptation process are measured against pre-set or overall goals of the agent who adapts) (Dolan et al. 2001; Eriksen and Brown 2011). For that reason, it was crucial to address goal orientation so prominently in this approach. In general, any decision involves an evaluation of available options based on different criteria important to the respective actor. “At any time, an individual, an organization or a society as a whole faces several options for taking action (including doing nothing), each of which is associated with potential positive or negative consequences” (Renn 2008, p. 50). Adaptation research therefore needs to put greater emphasis on the way different strategies are evaluated by the relevant actors and how adaptation is negotiated by actors with differing opinions and differing levels of power.

Abschlussbericht für den Projektträger Jülich, Projekt WISDOM II, 10/2010 – 02/2014
135
C. Coping and adaptation evaluation
Generally, the evaluation of measures, projects, or strategies is essential and often taken up in research and practice. Being already established in the disaster risk community for a long time, interest in the field of climate change adaptation arose in the more recent years (e.g. Brooks et al. 2011; McKenzie Hedger et al. 2008; World Bank 2010). Evaluations on governmental (e.g. Jacob and Mehiriz 2012; UNFCCC 2010) and on project level (e.g. GIZ 2011; CARE 2012; IISD et al. 2009) have played a very important role here. In contrast, household strategies have not found much attention so far (IPCC 2012, p. 330). In the present analysis, where both household and government-led strategies are at the center of interest, private and public strategies are conjointly analyzed and evaluated. A review of current evaluation research and practice also revealed that in most cases only one or a limited number of strategies is evaluated (e.g. ADB 2008, Vo Thanh Danh 2011; Brennan et al. 2002). It is important to have these in-depth analyses of single measures, yet, in many cases it is also crucial to see strategies in relation to other options. Economics points at the issue of opportunity costs which matter particularly in the light of scarce resources; i.e. resources spent on coping or adaptation cannot be used for the implementation of other activities (Scheraga and Grambsch 1998, p. 91). Opportunity costs thereby represent the benefits foregone from not implementing the second best alternative (Mechler 2008). These trade-offs do not only arise from tangible costs and benefits alone, such as monetarily expressed ones, but also from intangible ones which are much harder to assess. Both are, however, necessary when it comes to deciding for the, subjectively judged, best alternative. Many program and project evaluations are based on so-called theories of change which offer “essentially an explanation of how a group of stakeholders expects to reach a commonly understood long-term goal” (Anderson 2005, p. 3, cf. Bours et al. 2014). Theory, in this context, refers to assumptions and analyses of the causal linkages between preconditions, inputs, activities, and outputs of programs or strategies and the resulting outcomes and impact on the system of interest – of which all terms are defined in Table 1 (3ie 2012, p. 9; GEF Evaluation Office 2007, p. 8). Objectives and goals of a program can thereby be clarified and measured with regard to their immediate, mid- and long-term results. Table1: Definition of key terms used in theory of change approaches
Term Definition Inputs Human, organizational, financial and material resources contributed to a
project Outputs Immediate product of project actions Outcomes Intermediate result brought about by producing outputs Impacts Ultimate result of a combination of outcomes contributed by the project Source: Leeuw & Vaessen 2009, p. 92 In contrast to the conceptual call for a balanced perspective, many of the evaluations conducted by development agencies focus exclusively on measuring the outputs since they are usually easier to count and can directly be linked to hard project objectives (Lamhauge et al. 2012, p. 24). This is problematic, as it can easily lead to an overestimation of success and neglects “soft” factors that are not easily “tickable” - for example, if an output is abandoned after project completion because it is not culturally accepted. From an action-oriented perspective, one can argue in accordance with Werlen (1993, p. 46) that a strong focus on goals (which primarily reflect desired outputs) fails to address unintended consequences of actions that cause problems.
Abschlussbericht für den Projektträger Jülich, Projekt WISDOM II, 10/2010 – 02/2014
136
Indicators that are used for such evaluations do not only target input, output and outcome of program activities but also address characteristics of the adaptation process, for example the level of local participation in decision-making (Lamhauge et al. 2012). Other process indicators pointed out by several scholars relate, for example, to an activity’s effectiveness (Ashton et al. 2006; Dolan et al. 2001; Debels et al. 2009; Brooks et al. 2011; Silva Villanueva 2011; McKenzie Hedger et al. 2008), equity (Nelson 2009; Silva Villanueva 2011; McKenzie Hedger et al. 2008; Pelling 2011) or to the institutional competence (Smith et al. 2009; Pahl-Wostl 2009; Pahl-Wostl et al. 2010; Ashton et al. 2006; Dolan et al. 2001; Brooks et al. 2011; GIZ 2011). Theory of change approaches are essential for strategic and regular assessments but are usually targeted at the evaluation of specific activities and for specific groups. This has the advantage of allowing the formulation of very clear and precise goals and indicators, but neglects divergent impacts on different temporal and spatial scales. Furthermore, theory of change based approaches rely too strongly on rigid approaches – based on predetermined targets, criteria and proceeding regardless of the specific context of the project. This often leads to the neglect of more implicit aspects and interconnectivities and does not question the meta-level assumptions behind evaluation. Birkmann et al. (2010, p. 204) thus call for „a stronger emphasis on the need to adapt procedures and principles of adaptation -assessment, -planning, -implementation and –evaluation itself”. Especially in the context of highly complex human-environment interactions and of divergent outcomes for different socio-economic groups, the consideration of non-linear effects is crucial. Moreover, it is not clear how such evaluation results are taken up and feed back into individual decision-making. The often assumed objectivity of such assessments leads to absolutist judgements which reduce the relative importance of more flexible adaptation measures. Flexibility is an important factor, though, as climate change is fraught with a high level of uncertainty. A more promising approach in our context is therefore to combine aspects of theories of change and multi-criteria decision analysis (MCDA) (cf. Linkov et al. 2006; Eakin and Bojórquez-Tapia 2008; Mendoza and Martins 2006; Gamper et al. 2006; Kort and Booij 2007). MCDAs aim at formally integrating multiple criteria in a decision-making process (Gamper et al. 2006). These approaches are thereby not only able to integrate a range of context-specific and relevant criteria but also provide a tool for integrating subjective weighting and judgements of different actor groups. In consequence, a consideration of objective and subjective perspectives can better assess the influence of strategy consequences on decision-making and weigh pros and cons of available alternatives. It also allows the consideration of aspects that may play a role in decision-making although not directly linked to a proposed measure.
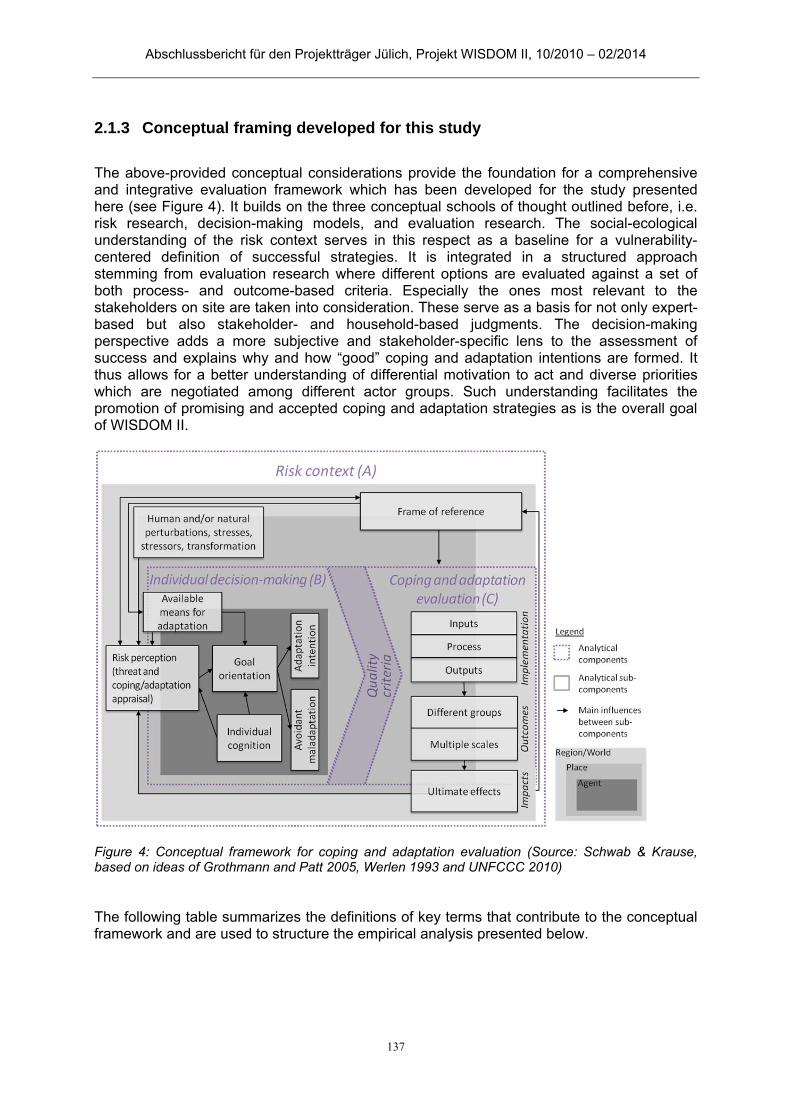
Abschlussbericht für den Projektträger Jülich, Projekt WISDOM II, 10/2010 – 02/2014
137
Conceptual framing developed for this study 2.1.3
The above-provided conceptual considerations provide the foundation for a comprehensive and integrative evaluation framework which has been developed for the study presented here (see Figure 4). It builds on the three conceptual schools of thought outlined before, i.e. risk research, decision-making models, and evaluation research. The social-ecological understanding of the risk context serves in this respect as a baseline for a vulnerability-centered definition of successful strategies. It is integrated in a structured approach stemming from evaluation research where different options are evaluated against a set of both process- and outcome-based criteria. Especially the ones most relevant to the stakeholders on site are taken into consideration. These serve as a basis for not only expert-based but also stakeholder- and household-based judgments. The decision-making perspective adds a more subjective and stakeholder-specific lens to the assessment of success and explains why and how “good” coping and adaptation intentions are formed. It thus allows for a better understanding of differential motivation to act and diverse priorities which are negotiated among different actor groups. Such understanding facilitates the promotion of promising and accepted coping and adaptation strategies as is the overall goal of WISDOM II.
Figure 4: Conceptual framework for coping and adaptation evaluation (Source: Schwab & Krause, based on ideas of Grothmann and Patt 2005, Werlen 1993 and UNFCCC 2010) The following table summarizes the definitions of key terms that contribute to the conceptual framework and are used to structure the empirical analysis presented below.
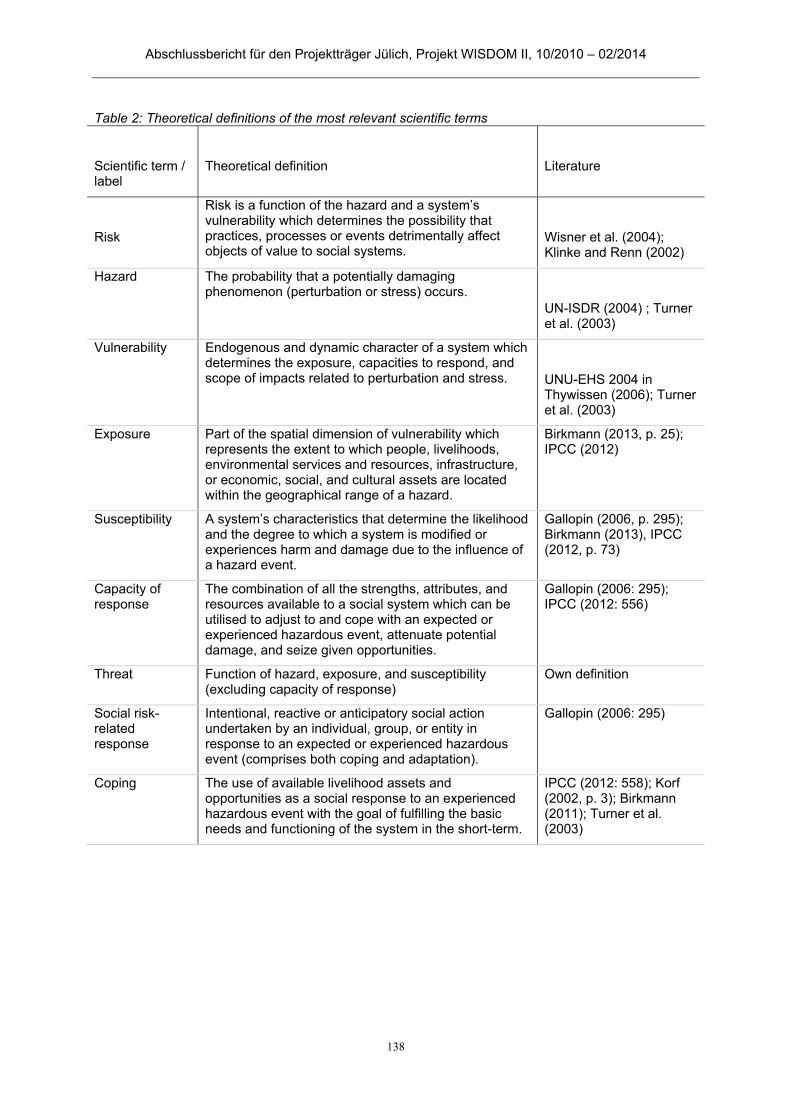
Abschlussbericht für den Projektträger Jülich, Projekt WISDOM II, 10/2010 – 02/2014
138
Table 2: Theoretical definitions of the most relevant scientific terms
Scientific term / label
Theoretical definition Literature
Risk
Risk is a function of the hazard and a system’s vulnerability which determines the possibility that practices, processes or events detrimentally affect objects of value to social systems.
Wisner et al. (2004); Klinke and Renn (2002)
Hazard The probability that a potentially damaging phenomenon (perturbation or stress) occurs.
UN-ISDR (2004) ; Turner et al. (2003)
Vulnerability Endogenous and dynamic character of a system which determines the exposure, capacities to respond, and scope of impacts related to perturbation and stress. UNU-EHS 2004 in
Thywissen (2006); Turner et al. (2003)
Exposure Part of the spatial dimension of vulnerability which represents the extent to which people, livelihoods, environmental services and resources, infrastructure, or economic, social, and cultural assets are located within the geographical range of a hazard.
Birkmann (2013, p. 25); IPCC (2012)
Susceptibility A system’s characteristics that determine the likelihood and the degree to which a system is modified or experiences harm and damage due to the influence of a hazard event.
Gallopin (2006, p. 295); Birkmann (2013), IPCC (2012, p. 73)
Capacity of response
The combination of all the strengths, attributes, and resources available to a social system which can be utilised to adjust to and cope with an expected or experienced hazardous event, attenuate potential damage, and seize given opportunities.
Gallopin (2006: 295); IPCC (2012: 556)
Threat Function of hazard, exposure, and susceptibility (excluding capacity of response)
Own definition
Social risk-related response
Intentional, reactive or anticipatory social action undertaken by an individual, group, or entity in response to an expected or experienced hazardous event (comprises both coping and adaptation).
Gallopin (2006: 295)
Coping The use of available livelihood assets and opportunities as a social response to an experienced hazardous event with the goal of fulfilling the basic needs and functioning of the system in the short-term.
IPCC (2012: 558); Korf (2002, p. 3); Birkmann (2011); Turner et al. (2003)
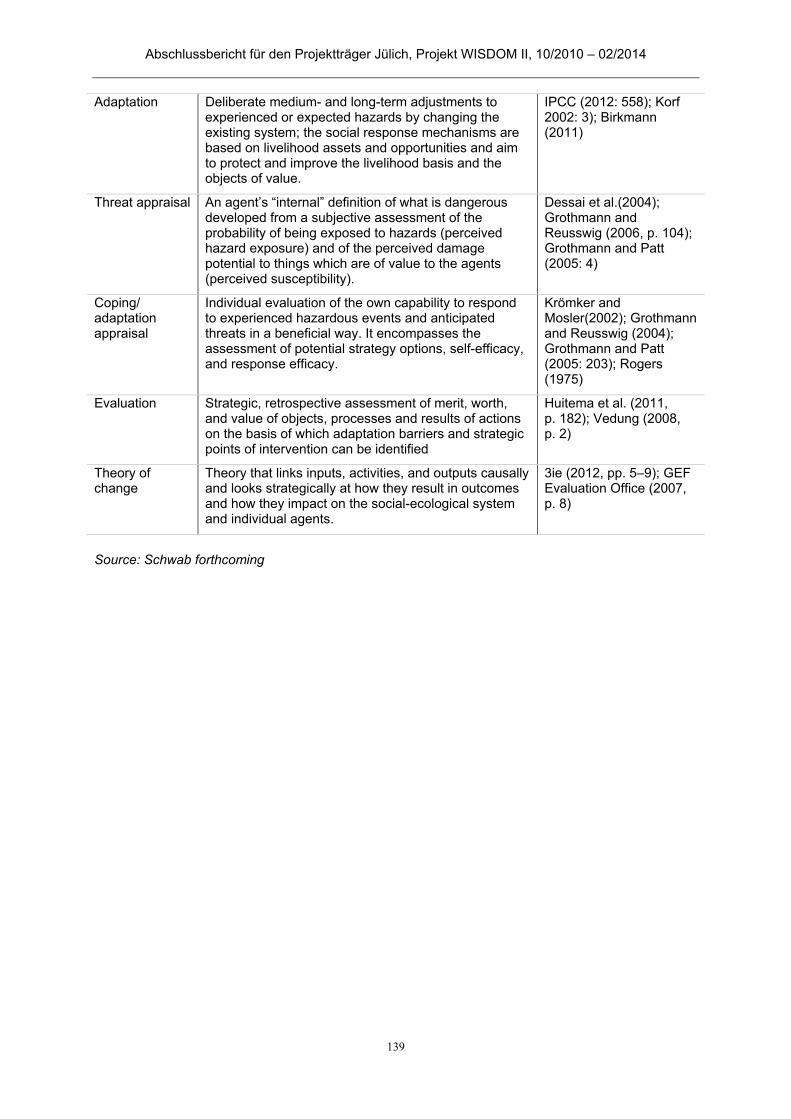
Abschlussbericht für den Projektträger Jülich, Projekt WISDOM II, 10/2010 – 02/2014
139
Adaptation Deliberate medium- and long-term adjustments to experienced or expected hazards by changing the existing system; the social response mechanisms are based on livelihood assets and opportunities and aim to protect and improve the livelihood basis and the objects of value.
IPCC (2012: 558); Korf 2002: 3); Birkmann (2011)
Threat appraisal An agent’s “internal” definition of what is dangerous developed from a subjective assessment of the probability of being exposed to hazards (perceived hazard exposure) and of the perceived damage potential to things which are of value to the agents (perceived susceptibility).
Dessai et al.(2004); Grothmann and Reusswig (2006, p. 104); Grothmann and Patt (2005: 4)
Coping/ adaptation appraisal
Individual evaluation of the own capability to respond to experienced hazardous events and anticipated threats in a beneficial way. It encompasses the assessment of potential strategy options, self-efficacy, and response efficacy.
Krömker and Mosler(2002); Grothmann and Reusswig (2004); Grothmann and Patt (2005: 203); Rogers (1975)
Evaluation Strategic, retrospective assessment of merit, worth, and value of objects, processes and results of actions on the basis of which adaptation barriers and strategic points of intervention can be identified
Huitema et al. (2011, p. 182); Vedung (2008, p. 2)
Theory of change
Theory that links inputs, activities, and outputs causally and looks strategically at how they result in outcomes and how they impact on the social-ecological system and individual agents.
3ie (2012, pp. 5–9); GEF Evaluation Office (2007, p. 8)
Source: Schwab forthcoming
Abschlussbericht für den Projektträger Jülich, Projekt WISDOM II, 10/2010 – 02/2014
140
Selection of case study areas 2.1.4
In line with the idea to move from the vulnerability analysis of WISODM’s phase I in a continuous fashion into the assessment and evaluation of different adaptation options in WISDOM phase II, the same case study areas as in the first project phase have been chosen. However, as laid out in the first two midterm reports as well as in chapter 2.1.8.A (Arbeitsplan) no research permission was granted by the Vietnamese government for Dong Thap Province. Hence, the research in WISDOM II had to concentrate on the two remaining of the three original case study areas from WISDOM I. That is, the adaptation research focused on an
urban risk profile in Can Tho City as well as on a rural coastal risk profile in Tra Vinh Province.
The selection allowed for a comparison along the lines of different
natural hazards and socio-economic profiles and livelihood patterns.
This selection pays tribute to the importance of rural, mostly agriculture-based, livelihood profiles in the Mekong Delta (also called the rice-bowl of Vietnam) as well as the Delta’s significant urbanization (see in detail Garschagen et al. 2012). Hence, it allowed capturing adaptation processes in the Delta’s most relevant settings. A more detailed introduction into both case study areas – and their hazards as well as socio-economic profiles and livelihood patterns – was provided in the final report of WISDOM I along with the comprehensive account on the vulnerability profiles in both areas (see also Birkmann et al. 2012). This information shall, hence, not be repeated here. The following paragraphs therefore only provide a brief introduction into the main characteristics of the Can Tho and Tra Vinh case study areas – now only focusing on the specific aspects of relevance to the adaptation evaluation in this project phase. Can Tho City
Within Can Tho City, the following three wards were selected as case study sites: An Lac and Cai Khe in Ninh Kieu district and Hung Phu in Cai Rang district (see Figure 5). The wards were chosen according to their exposure as well as their differences in functionality. Whereas the areas covered in An Lac are mainly residential with very small-scale businesses and low average income, Cai Khe comprises the trade center area, serves as entertainment area for the city’s residents and has less low-income, but more middle and high income residents including a villa area. Hung Phu ward covers a relatively densely populated area along Can Tho and Hau rivers with relatively low average income and significant erosion risk in the past as well as a large urban development zone that ought to serve up to 250,000 middle-class residents until 2030 according to the Master Plan. This area has been planned according to the expectations of continuous rapid development and increasing income and was included as case study area mainly to examine whether flood risk and future climate change impacts were considered in the construction of high-value property and to see whether people who are not currently affected still perceive flooding and climate change as a potential risk to their livelihoods.

Abschlussbericht für den Projektträger Jülich, Projekt WISDOM II, 10/2010 – 02/2014
141
Figure 5: Case study areas in Can Tho City (Source: Krause forthcoming) Can Tho City represents the urban core of the Mekong Delta and functions as economic hub of regional importance. The city is shaped by rapid urbanization and socio-economic development processes. The most central district of Ninh Kieu grew, for example, from 221,429 inhabitants in 2008 to 252,189 inhabitants in 2012. Can Tho presents a highly interesting case study for adaptation assessment, as it has been affected in the past by regularly occurring urban flooding which the local population is used and adapted to. Yet, the flood characteristics are changing with climate and human-induced changes that has triggered an unprecedented case of urban flooding in September and October 2011 and will exacerbate the situation in the future. It is therefore particularly interesting to study the effects of these changes on risk perception and adaptation decision-making. Tra Vinh
Within Tra Vinh Province, three research areas have been chosen in Tra Cu District (see Figure 6). These three areas are located in the same three zones chosen in the first phase of WISDOM, hence allowing to base the adaptation evaluation on the knowledge on vulnerability generated in phase I. The main natural hazards in Tra Cu – to which people have to adapt – are
saline intrusion (predominant in coastal areas during the dry season) as well as flooding, i.e. mostly tidal flooding (predominant in riverine and coastal areas
during the rainy season).
In addition, the choice of the three case study areas allowed comparing three different agro-ecological zones and their respective agricultural production patterns – which has significant implications not only on the vulnerability profile but also on the availability and choice of adaptation options (see in detail below).
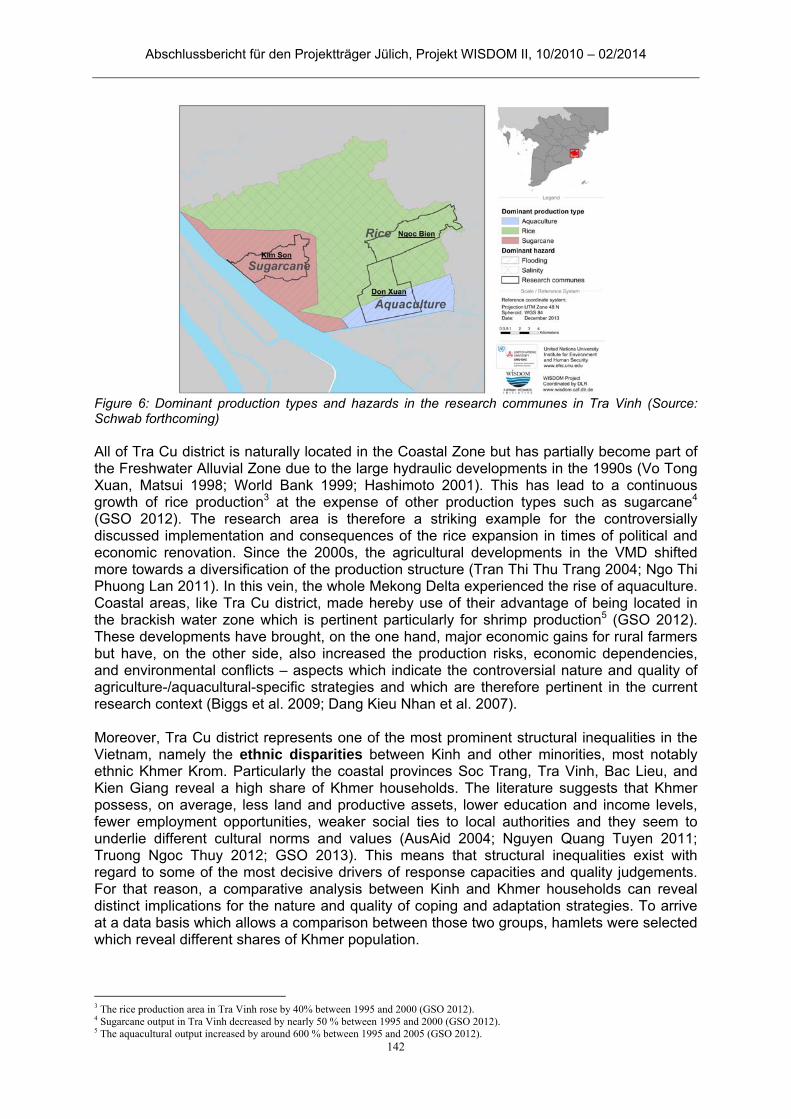
Abschlussbericht für den Projektträger Jülich, Projekt WISDOM II, 10/2010 – 02/2014
142
Figure 6: Dominant production types and hazards in the research communes in Tra Vinh (Source: Schwab forthcoming) All of Tra Cu district is naturally located in the Coastal Zone but has partially become part of the Freshwater Alluvial Zone due to the large hydraulic developments in the 1990s (Vo Tong Xuan, Matsui 1998; World Bank 1999; Hashimoto 2001). This has lead to a continuous growth of rice production3 at the expense of other production types such as sugarcane4 (GSO 2012). The research area is therefore a striking example for the controversially discussed implementation and consequences of the rice expansion in times of political and economic renovation. Since the 2000s, the agricultural developments in the VMD shifted more towards a diversification of the production structure (Tran Thi Thu Trang 2004; Ngo Thi Phuong Lan 2011). In this vein, the whole Mekong Delta experienced the rise of aquaculture. Coastal areas, like Tra Cu district, made hereby use of their advantage of being located in the brackish water zone which is pertinent particularly for shrimp production5 (GSO 2012). These developments have brought, on the one hand, major economic gains for rural farmers but have, on the other side, also increased the production risks, economic dependencies, and environmental conflicts – aspects which indicate the controversial nature and quality of agriculture-/aquacultural-specific strategies and which are therefore pertinent in the current research context (Biggs et al. 2009; Dang Kieu Nhan et al. 2007). Moreover, Tra Cu district represents one of the most prominent structural inequalities in the Vietnam, namely the ethnic disparities between Kinh and other minorities, most notably ethnic Khmer Krom. Particularly the coastal provinces Soc Trang, Tra Vinh, Bac Lieu, and Kien Giang reveal a high share of Khmer households. The literature suggests that Khmer possess, on average, less land and productive assets, lower education and income levels, fewer employment opportunities, weaker social ties to local authorities and they seem to underlie different cultural norms and values (AusAid 2004; Nguyen Quang Tuyen 2011; Truong Ngoc Thuy 2012; GSO 2013). This means that structural inequalities exist with regard to some of the most decisive drivers of response capacities and quality judgements. For that reason, a comparative analysis between Kinh and Khmer households can reveal distinct implications for the nature and quality of coping and adaptation strategies. To arrive at a data basis which allows a comparison between those two groups, hamlets were selected which reveal different shares of Khmer population.
3 The rice production area in Tra Vinh rose by 40% between 1995 and 2000 (GSO 2012). 4 Sugarcane output in Tra Vinh decreased by nearly 50 % between 1995 and 2000 (GSO 2012). 5 The aquacultural output increased by around 600 % between 1995 and 2005 (GSO 2012).
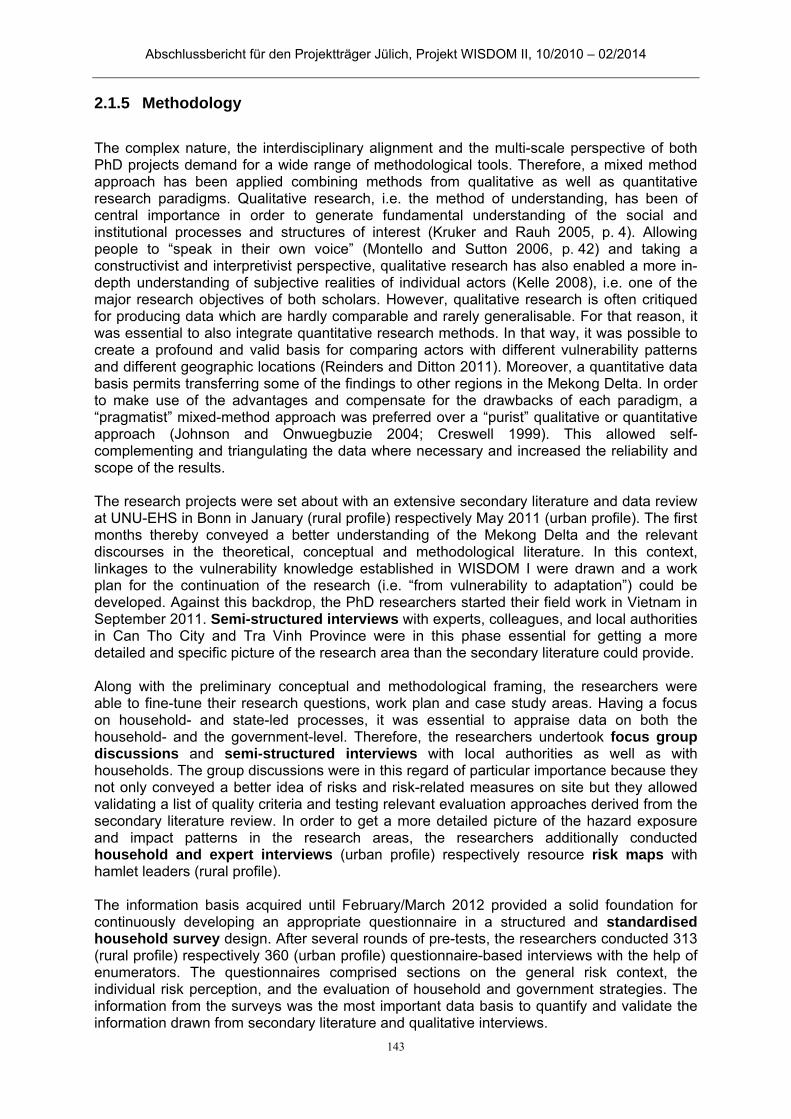
Abschlussbericht für den Projektträger Jülich, Projekt WISDOM II, 10/2010 – 02/2014
143
Methodology 2.1.5
The complex nature, the interdisciplinary alignment and the multi-scale perspective of both PhD projects demand for a wide range of methodological tools. Therefore, a mixed method approach has been applied combining methods from qualitative as well as quantitative research paradigms. Qualitative research, i.e. the method of understanding, has been of central importance in order to generate fundamental understanding of the social and institutional processes and structures of interest (Kruker and Rauh 2005, p. 4). Allowing people to “speak in their own voice” (Montello and Sutton 2006, p. 42) and taking a constructivist and interpretivist perspective, qualitative research has also enabled a more in-depth understanding of subjective realities of individual actors (Kelle 2008), i.e. one of the major research objectives of both scholars. However, qualitative research is often critiqued for producing data which are hardly comparable and rarely generalisable. For that reason, it was essential to also integrate quantitative research methods. In that way, it was possible to create a profound and valid basis for comparing actors with different vulnerability patterns and different geographic locations (Reinders and Ditton 2011). Moreover, a quantitative data basis permits transferring some of the findings to other regions in the Mekong Delta. In order to make use of the advantages and compensate for the drawbacks of each paradigm, a “pragmatist” mixed-method approach was preferred over a “purist” qualitative or quantitative approach (Johnson and Onwuegbuzie 2004; Creswell 1999). This allowed self-complementing and triangulating the data where necessary and increased the reliability and scope of the results. The research projects were set about with an extensive secondary literature and data review at UNU-EHS in Bonn in January (rural profile) respectively May 2011 (urban profile). The first months thereby conveyed a better understanding of the Mekong Delta and the relevant discourses in the theoretical, conceptual and methodological literature. In this context, linkages to the vulnerability knowledge established in WISDOM I were drawn and a work plan for the continuation of the research (i.e. “from vulnerability to adaptation”) could be developed. Against this backdrop, the PhD researchers started their field work in Vietnam in September 2011. Semi-structured interviews with experts, colleagues, and local authorities in Can Tho City and Tra Vinh Province were in this phase essential for getting a more detailed and specific picture of the research area than the secondary literature could provide. Along with the preliminary conceptual and methodological framing, the researchers were able to fine-tune their research questions, work plan and case study areas. Having a focus on household- and state-led processes, it was essential to appraise data on both the household- and the government-level. Therefore, the researchers undertook focus group discussions and semi-structured interviews with local authorities as well as with households. The group discussions were in this regard of particular importance because they not only conveyed a better idea of risks and risk-related measures on site but they allowed validating a list of quality criteria and testing relevant evaluation approaches derived from the secondary literature review. In order to get a more detailed picture of the hazard exposure and impact patterns in the research areas, the researchers additionally conducted household and expert interviews (urban profile) respectively resource risk maps with hamlet leaders (rural profile). The information basis acquired until February/March 2012 provided a solid foundation for continuously developing an appropriate questionnaire in a structured and standardised household survey design. After several rounds of pre-tests, the researchers conducted 313 (rural profile) respectively 360 (urban profile) questionnaire-based interviews with the help of enumerators. The questionnaires comprised sections on the general risk context, the individual risk perception, and the evaluation of household and government strategies. The information from the surveys was the most important data basis to quantify and validate the information drawn from secondary literature and qualitative interviews.

Abschlussbericht für den Projektträger Jülich, Projekt WISDOM II, 10/2010 – 02/2014
144
An analysis of the survey data, the interviews, and the group discussions revealed that further in-depth interviews with specific thematic foci were required in order to triangulate and further sharpen the results. Most important were in this context more in-depth information about the institutions on site and the applied strategies. Problem-centred interviews with the communal authorities in charge of the most prevalent state-led measures were therefore conducted in Tra Vinh Province and in Can Tho City. These data sets provided detailed information about coping and adaptation strategies on governmental side. Similarly, also representatives from international projects and researchers were interviewed about their activities relevant to the two research areas. To gain a better idea about household-led strategies, the researchers conducted additional problem-centred interviews in both case study areas. The analysis of the qualitative data followed a directed qualitative content analysis (Hsieh and Shannon 2005). Therefore, a coding system was developed in accordance to the given conceptual framework and the data were analysed by means of the software program MaxQDA. This program allowed, beside a qualitative computer-assisted content analysis, a combined quantitative and qualitative analysis. The quantitative data from the household survey were statistically analysed using SPSS software. Following the data entry, data quality checks and variable transformations, descriptive and inferential statistical analyses guided by the overall research questions were conducted. Besides these analyses, spatial data sets drawn from the WISDOM server, secondary sources, collection of GIS points during the survey (in urban areas only), and the resource risk maps from interviews with hamlet leaders (rural areas only) were combined with statistical data from reports and the survey in a range of thematic GIS maps. Figure 7 summarizes and the main research steps and links the epistemic focus of each step to the respective methods for data generation.
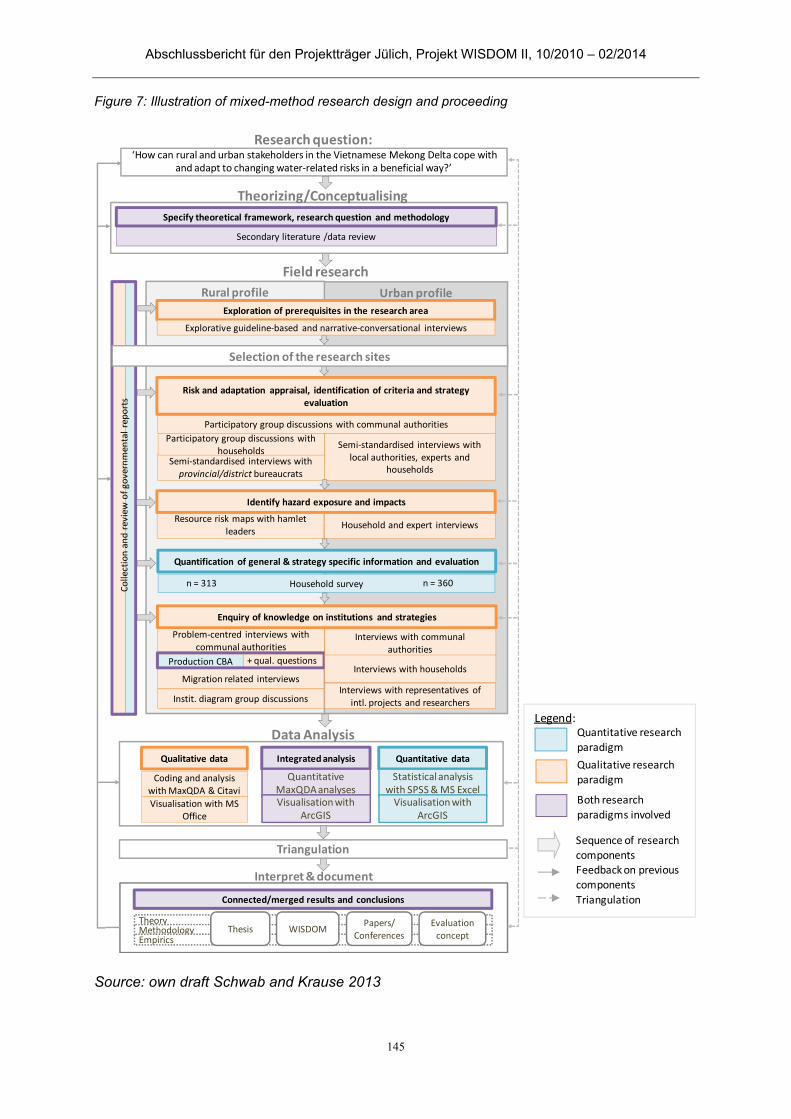
Abschlussbericht für den Projektträger Jülich, Projekt WISDOM II, 10/2010 – 02/2014
145
Figure 7: Illustration of mixed-method research design and proceeding
Source: own draft Schwab and Krause 2013
Rural profile Urban profile
Specify theoretical framework, research question and methodology
Exploration of prerequisites in the research area
Secondary literature /data review
Research question: ‘How can rural and urban stakeholders in the Vietnamese Mekong Delta cope with
and adapt to changing water‐related risks in a beneficial way?’
Field research
Explorative guideline‐based and narrative‐conversational interviews
Quantitative dataQualitative data
Coding and analysis with MaxQDA & Citavi
Visualisation with MS Office
Statistical analysis with SPSS & MS Excel
Theorizing/Conceptualising
Connected/merged results and conclusions
Interpret & document
TheoryMethodologyEmpirics
Thesis WISDOMPapers/
ConferencesEvaluation concept
Visualisationwith ArcGIS
Quantification of general & strategy specific information and evaluation
+ qual. questions
Household survey
Instit. diagram group discussions
Production CBA
Migration related interviews
Participatory group discussions with communal authorities
Problem‐centred interviews with communal authorities
Resource risk maps with hamlet leaders
Semi‐standardised interviews with provincial/district bureaucrats
Integrated analysis
Quantitative MaxQDAanalysesVisualisationwith
ArcGIS
Data Analysis
Collection and review of governmental reports
Selection of the research sites
Semi‐standardised interviews with local authorities, experts and
households
Household and expert interviews
Triangulation
Risk and adaptation appraisal, identification of criteria and strategy evaluation
Enquiry of knowledge on institutions and strategies
Identify hazard exposure and impacts
Interviews with communal authorities
Interviews with representatives of intl. projects and researchers
Interviews with households
Participatory group discussions with households
n = 313 n = 360
Legend:
Triangulation
Feedback on previous components
Sequence of research components
Qualitative research paradigm
Both research
paradigms involved
Quantitative research
paradigm
Abschlussbericht für den Projektträger Jülich, Projekt WISDOM II, 10/2010 – 02/2014
146
Key results 2.1.6
This chapter summarizes the key results of the analysis. In line with the conceptual framework presented in chapter 2.1.2, the findings are presented in three parts:
(A) risk context, (B) decision making processes and (C) evaluation of adaptation and coping measures.
The first part of the chapter will concentrate on the urban case study areas Can Tho City while the second part will present the results from the rural risk profile in Tra Vinh Province.
2.1.6.1 Can Tho City
A. Risk context
The hazard against which vulnerability and adaptation were assessed in Can Tho City is urban flooding which occurs regularly in the city center as a result of tidal inundation, heavy precipitation and poor drainage at times of high water levels of the main rivers (primarily during rainy season). In general, the tide is a semi-diurnal one with a range of 1.5 to 2 m at Can Tho (Le Anh Tuan et al. 2007, p. 40), i.e. most of the flooding occurs regularly, twice a day for a couple of days towards the middle and the end of the lunar month. The water level usually increases rapidly and also recedes quickly, so that most of the affected streets and houses are flooded for a couple of hours at maximum. A special focus of the research lies on the increasing levels of inundation which are the result of interactions of hydraulic infrastructures, urbanization and the associated sealing of surfaces as well as environmental changes. As a result, urban flooding has not only increased in terms of water depth, but also in extent and time span, as water backlogs occur in low-lying areas leading to much longer inundations: 12% of the flooded households reported a flood duration of at least several days instead of several hours per day (n=284). This change in duration poses a new kind of risk to the people affected who now need to change their coping mechanisms as they can no longer arrange their daily lives around the flood as they used to. The flood situation in 2011 with very high levels of riverine flooding affected large parts of Can Tho City and was described by the experts and households as the worst inner-city inundation to date. At a level of 2.15m at Can Tho gauging station on 27 October, the water level was at a record high since the beginning of monitoring data in 1940 and flooded most major roads and alleys, causing obstructions to traffic and community life (Can Tho CFSC 2012, cf. Figure 8).
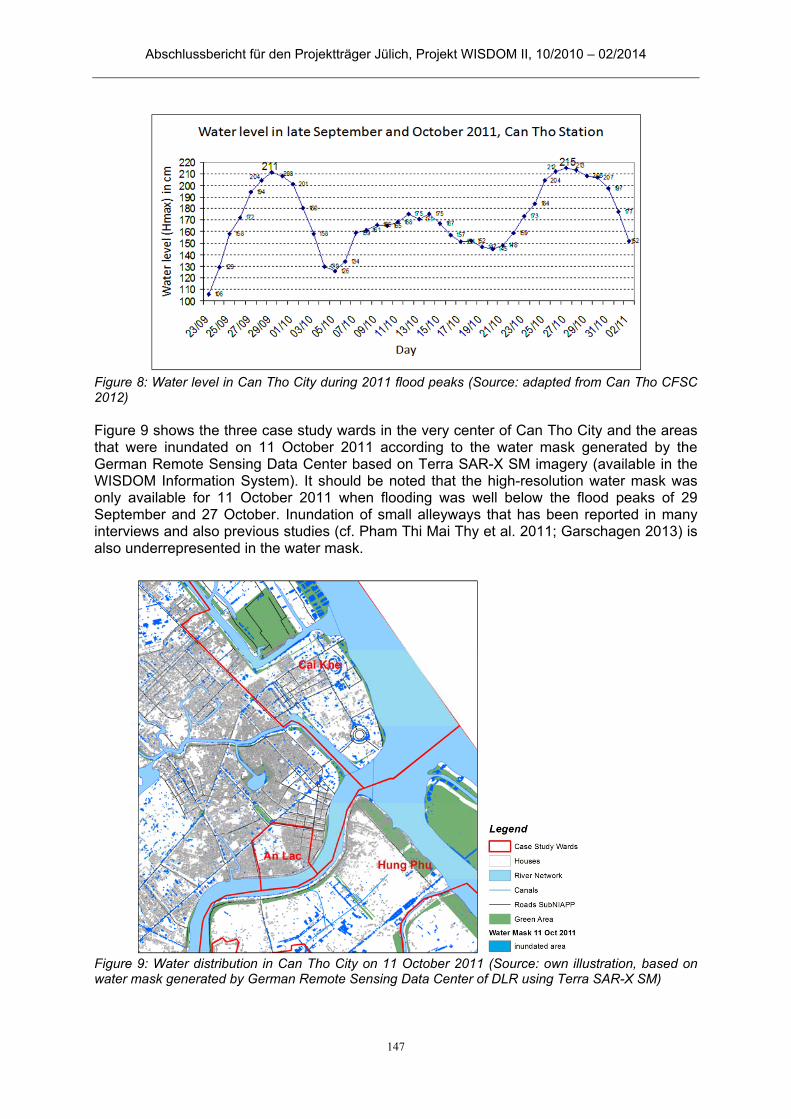
Abschlussbericht für den Projektträger Jülich, Projekt WISDOM II, 10/2010 – 02/2014
147
Figure 8: Water level in Can Tho City during 2011 flood peaks (Source: adapted from Can Tho CFSC 2012) Figure 9 shows the three case study wards in the very center of Can Tho City and the areas that were inundated on 11 October 2011 according to the water mask generated by the German Remote Sensing Data Center based on Terra SAR-X SM imagery (available in the WISDOM Information System). It should be noted that the high-resolution water mask was only available for 11 October 2011 when flooding was well below the flood peaks of 29 September and 27 October. Inundation of small alleyways that has been reported in many interviews and also previous studies (cf. Pham Thi Mai Thy et al. 2011; Garschagen 2013) is also underrepresented in the water mask.
Figure 9: Water distribution in Can Tho City on 11 October 2011 (Source: own illustration, based on water mask generated by German Remote Sensing Data Center of DLR using Terra SAR-X SM)
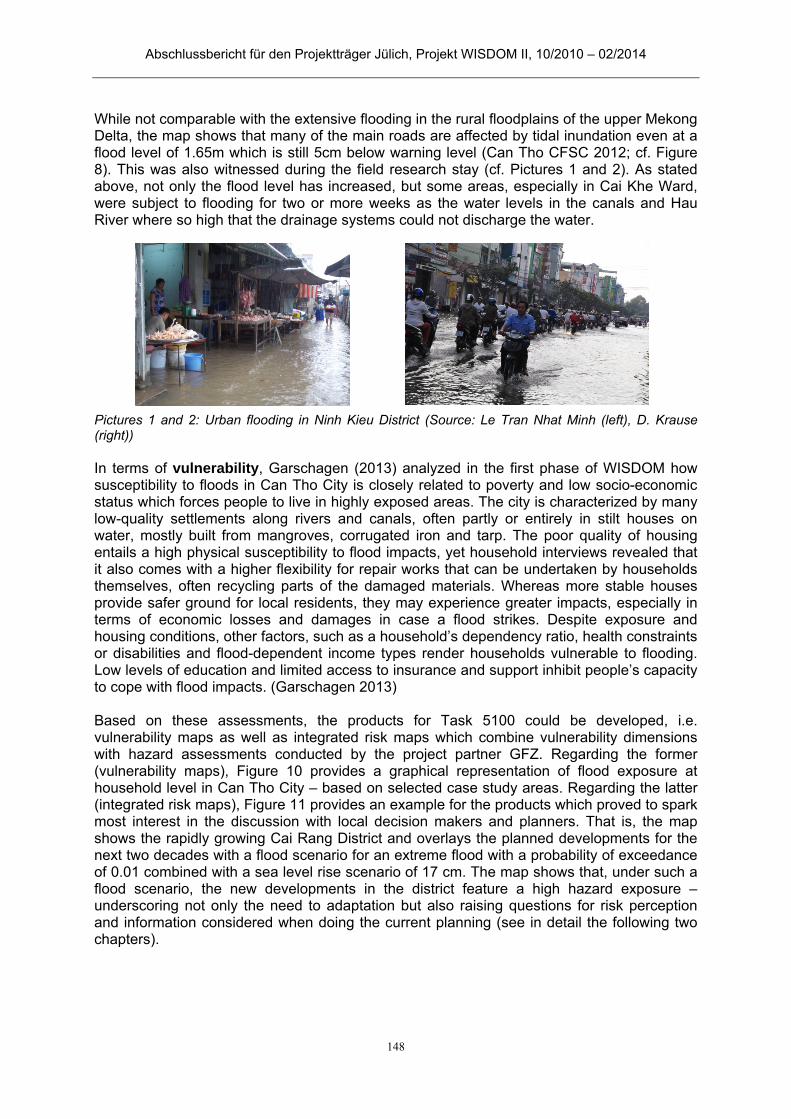
Abschlussbericht für den Projektträger Jülich, Projekt WISDOM II, 10/2010 – 02/2014
148
While not comparable with the extensive flooding in the rural floodplains of the upper Mekong Delta, the map shows that many of the main roads are affected by tidal inundation even at a flood level of 1.65m which is still 5cm below warning level (Can Tho CFSC 2012; cf. Figure 8). This was also witnessed during the field research stay (cf. Pictures 1 and 2). As stated above, not only the flood level has increased, but some areas, especially in Cai Khe Ward, were subject to flooding for two or more weeks as the water levels in the canals and Hau River where so high that the drainage systems could not discharge the water.
Pictures 1 and 2: Urban flooding in Ninh Kieu District (Source: Le Tran Nhat Minh (left), D. Krause (right)) In terms of vulnerability, Garschagen (2013) analyzed in the first phase of WISDOM how susceptibility to floods in Can Tho City is closely related to poverty and low socio-economic status which forces people to live in highly exposed areas. The city is characterized by many low-quality settlements along rivers and canals, often partly or entirely in stilt houses on water, mostly built from mangroves, corrugated iron and tarp. The poor quality of housing entails a high physical susceptibility to flood impacts, yet household interviews revealed that it also comes with a higher flexibility for repair works that can be undertaken by households themselves, often recycling parts of the damaged materials. Whereas more stable houses provide safer ground for local residents, they may experience greater impacts, especially in terms of economic losses and damages in case a flood strikes. Despite exposure and housing conditions, other factors, such as a household’s dependency ratio, health constraints or disabilities and flood-dependent income types render households vulnerable to flooding. Low levels of education and limited access to insurance and support inhibit people’s capacity to cope with flood impacts. (Garschagen 2013) Based on these assessments, the products for Task 5100 could be developed, i.e. vulnerability maps as well as integrated risk maps which combine vulnerability dimensions with hazard assessments conducted by the project partner GFZ. Regarding the former (vulnerability maps), Figure 10 provides a graphical representation of flood exposure at household level in Can Tho City – based on selected case study areas. Regarding the latter (integrated risk maps), Figure 11 provides an example for the products which proved to spark most interest in the discussion with local decision makers and planners. That is, the map shows the rapidly growing Cai Rang District and overlays the planned developments for the next two decades with a flood scenario for an extreme flood with a probability of exceedance of 0.01 combined with a sea level rise scenario of 17 cm. The map shows that, under such a flood scenario, the new developments in the district feature a high hazard exposure – underscoring not only the need to adaptation but also raising questions for risk perception and information considered when doing the current planning (see in detail the following two chapters).
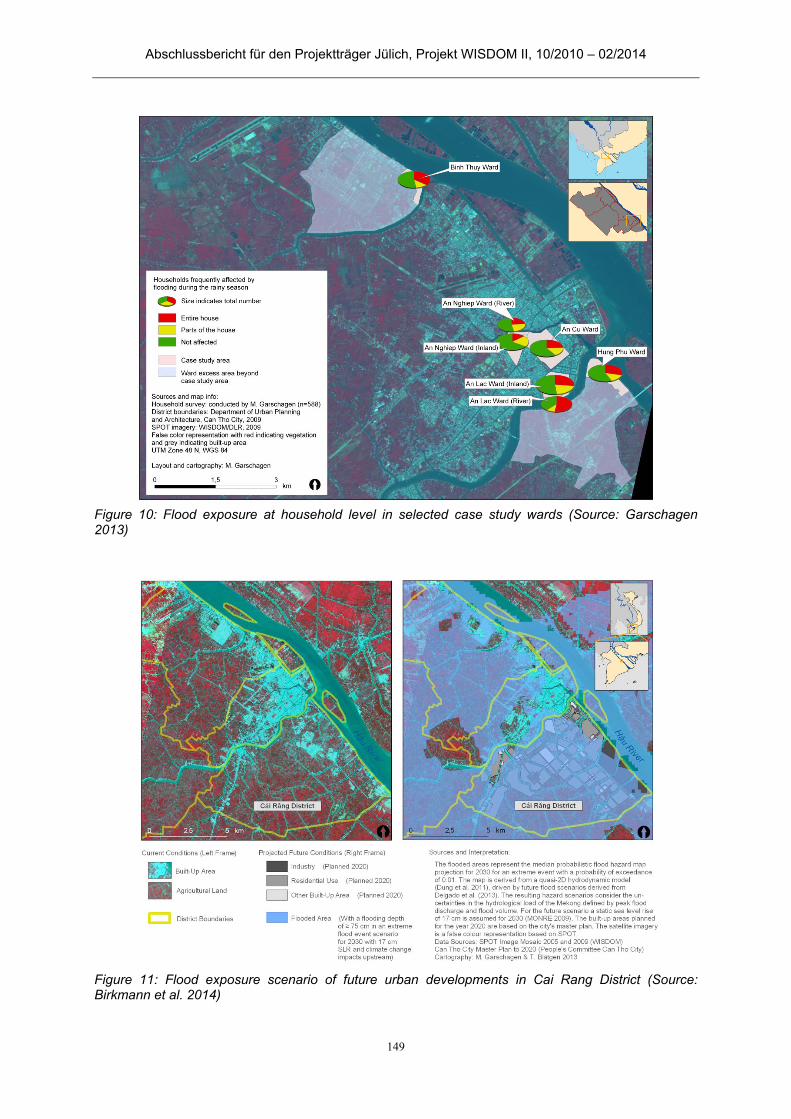
Abschlussbericht für den Projektträger Jülich, Projekt WISDOM II, 10/2010 – 02/2014
149
Figure 10: Flood exposure at household level in selected case study wards (Source: Garschagen 2013)
Figure 11: Flood exposure scenario of future urban developments in Cai Rang District (Source: Birkmann et al. 2014)
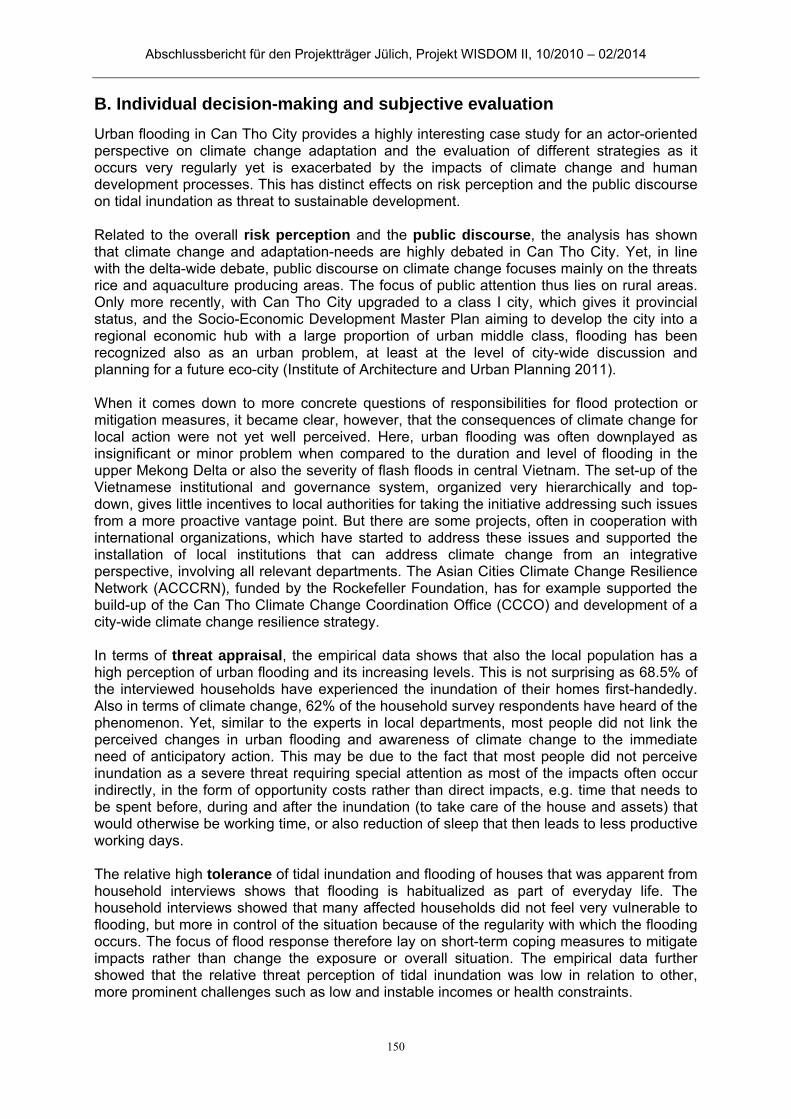
Abschlussbericht für den Projektträger Jülich, Projekt WISDOM II, 10/2010 – 02/2014
150
B. Individual decision-making and subjective evaluation
Urban flooding in Can Tho City provides a highly interesting case study for an actor-oriented perspective on climate change adaptation and the evaluation of different strategies as it occurs very regularly yet is exacerbated by the impacts of climate change and human development processes. This has distinct effects on risk perception and the public discourse on tidal inundation as threat to sustainable development. Related to the overall risk perception and the public discourse, the analysis has shown that climate change and adaptation-needs are highly debated in Can Tho City. Yet, in line with the delta-wide debate, public discourse on climate change focuses mainly on the threats rice and aquaculture producing areas. The focus of public attention thus lies on rural areas. Only more recently, with Can Tho City upgraded to a class I city, which gives it provincial status, and the Socio-Economic Development Master Plan aiming to develop the city into a regional economic hub with a large proportion of urban middle class, flooding has been recognized also as an urban problem, at least at the level of city-wide discussion and planning for a future eco-city (Institute of Architecture and Urban Planning 2011). When it comes down to more concrete questions of responsibilities for flood protection or mitigation measures, it became clear, however, that the consequences of climate change for local action were not yet well perceived. Here, urban flooding was often downplayed as insignificant or minor problem when compared to the duration and level of flooding in the upper Mekong Delta or also the severity of flash floods in central Vietnam. The set-up of the Vietnamese institutional and governance system, organized very hierarchically and top-down, gives little incentives to local authorities for taking the initiative addressing such issues from a more proactive vantage point. But there are some projects, often in cooperation with international organizations, which have started to address these issues and supported the installation of local institutions that can address climate change from an integrative perspective, involving all relevant departments. The Asian Cities Climate Change Resilience Network (ACCCRN), funded by the Rockefeller Foundation, has for example supported the build-up of the Can Tho Climate Change Coordination Office (CCCO) and development of a city-wide climate change resilience strategy. In terms of threat appraisal, the empirical data shows that also the local population has a high perception of urban flooding and its increasing levels. This is not surprising as 68.5% of the interviewed households have experienced the inundation of their homes first-handedly. Also in terms of climate change, 62% of the household survey respondents have heard of the phenomenon. Yet, similar to the experts in local departments, most people did not link the perceived changes in urban flooding and awareness of climate change to the immediate need of anticipatory action. This may be due to the fact that most people did not perceive inundation as a severe threat requiring special attention as most of the impacts often occur indirectly, in the form of opportunity costs rather than direct impacts, e.g. time that needs to be spent before, during and after the inundation (to take care of the house and assets) that would otherwise be working time, or also reduction of sleep that then leads to less productive working days. The relative high tolerance of tidal inundation and flooding of houses that was apparent from household interviews shows that flooding is habitualized as part of everyday life. The household interviews showed that many affected households did not feel very vulnerable to flooding, but more in control of the situation because of the regularity with which the flooding occurs. The focus of flood response therefore lay on short-term coping measures to mitigate impacts rather than change the exposure or overall situation. The empirical data further showed that the relative threat perception of tidal inundation was low in relation to other, more prominent challenges such as low and instable incomes or health constraints.
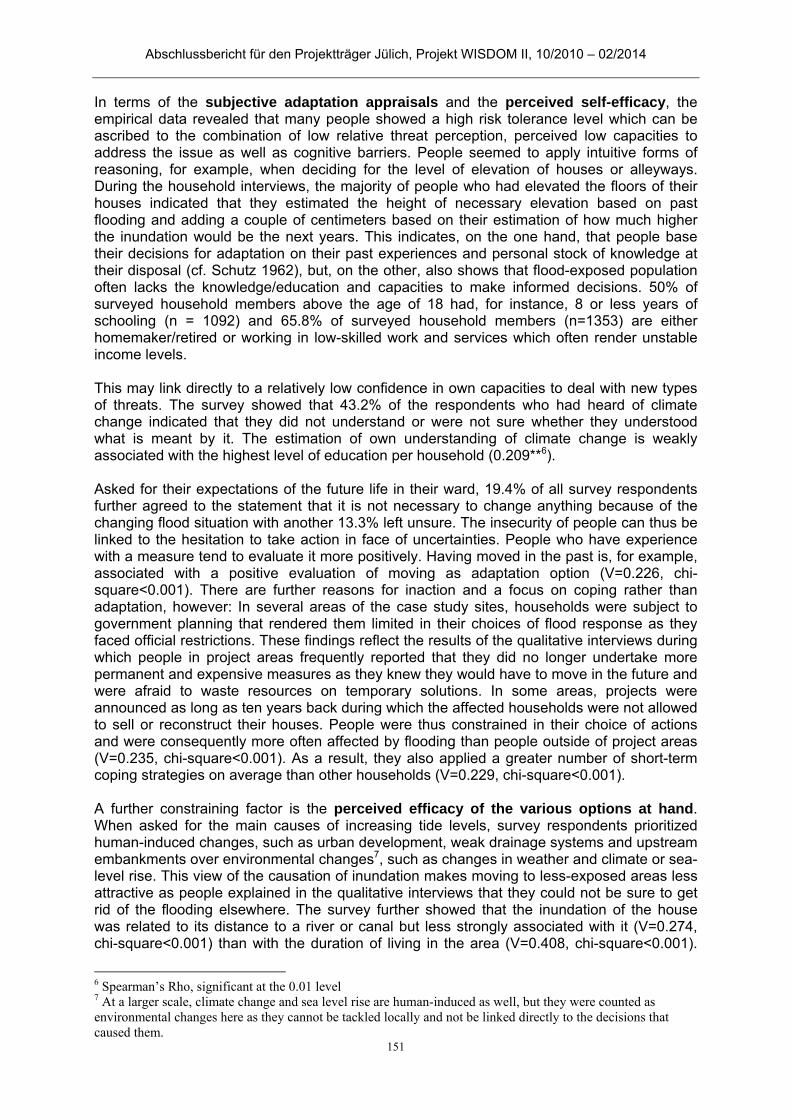
Abschlussbericht für den Projektträger Jülich, Projekt WISDOM II, 10/2010 – 02/2014
151
In terms of the subjective adaptation appraisals and the perceived self-efficacy, the empirical data revealed that many people showed a high risk tolerance level which can be ascribed to the combination of low relative threat perception, perceived low capacities to address the issue as well as cognitive barriers. People seemed to apply intuitive forms of reasoning, for example, when deciding for the level of elevation of houses or alleyways. During the household interviews, the majority of people who had elevated the floors of their houses indicated that they estimated the height of necessary elevation based on past flooding and adding a couple of centimeters based on their estimation of how much higher the inundation would be the next years. This indicates, on the one hand, that people base their decisions for adaptation on their past experiences and personal stock of knowledge at their disposal (cf. Schutz 1962), but, on the other, also shows that flood-exposed population often lacks the knowledge/education and capacities to make informed decisions. 50% of surveyed household members above the age of 18 had, for instance, 8 or less years of schooling (n = 1092) and 65.8% of surveyed household members (n=1353) are either homemaker/retired or working in low-skilled work and services which often render unstable income levels. This may link directly to a relatively low confidence in own capacities to deal with new types of threats. The survey showed that 43.2% of the respondents who had heard of climate change indicated that they did not understand or were not sure whether they understood what is meant by it. The estimation of own understanding of climate change is weakly associated with the highest level of education per household (0.209**6). Asked for their expectations of the future life in their ward, 19.4% of all survey respondents further agreed to the statement that it is not necessary to change anything because of the changing flood situation with another 13.3% left unsure. The insecurity of people can thus be linked to the hesitation to take action in face of uncertainties. People who have experience with a measure tend to evaluate it more positively. Having moved in the past is, for example, associated with a positive evaluation of moving as adaptation option (V=0.226, chi-square<0.001). There are further reasons for inaction and a focus on coping rather than adaptation, however: In several areas of the case study sites, households were subject to government planning that rendered them limited in their choices of flood response as they faced official restrictions. These findings reflect the results of the qualitative interviews during which people in project areas frequently reported that they did no longer undertake more permanent and expensive measures as they knew they would have to move in the future and were afraid to waste resources on temporary solutions. In some areas, projects were announced as long as ten years back during which the affected households were not allowed to sell or reconstruct their houses. People were thus constrained in their choice of actions and were consequently more often affected by flooding than people outside of project areas (V=0.235, chi-square<0.001). As a result, they also applied a greater number of short-term coping strategies on average than other households (V=0.229, chi-square<0.001). A further constraining factor is the perceived efficacy of the various options at hand. When asked for the main causes of increasing tide levels, survey respondents prioritized human-induced changes, such as urban development, weak drainage systems and upstream embankments over environmental changes7, such as changes in weather and climate or sea-level rise. This view of the causation of inundation makes moving to less-exposed areas less attractive as people explained in the qualitative interviews that they could not be sure to get rid of the flooding elsewhere. The survey further showed that the inundation of the house was related to its distance to a river or canal but less strongly associated with it (V=0.274, chi-square<0.001) than with the duration of living in the area (V=0.408, chi-square<0.001).
6 Spearman’s Rho, significant at the 0.01 level 7 At a larger scale, climate change and sea level rise are human-induced as well, but they were counted as environmental changes here as they cannot be tackled locally and not be linked directly to the decisions that caused them.

Abschlussbericht für den Projektträger Jülich, Projekt WISDOM II, 10/2010 – 02/2014
152
The qualitative and expert interviews revealed that more recent constructions usually entailed land filling to a higher elevation to reduce flood exposure. This resulted in topography changes at very small-scale so that older areas have a lower elevation than newly constructed roads and areas. Flooding was therefore not always directly related to proximity to the next water body. Overall, 70.4% of households do not perceive moving as a promising adaptation option in comparison with less costly options. Exposure reduction was not an overarching goal of most people given their livelihood situation and more pressuring concerns. The empirical research further proved the high importance to consider subjective goal orientations. People’s priorities evolved around securing their livelihoods and social networks that often function as social security net in times of crises. The household interviews revealed, for example, that people relied more often on the mutual support in their neighborhood than on governmental support when dealing with flood-related issues. In 32.1% of cases, households ascribed the responsibility for supporting the affected to those households who were not affected themselves. The maintenance of good relations with neighbors was thus an important goal for overall livelihood security for nearly all interviewed households and 20.6% of people indicated that it is more important to spend money on social events such as weddings and gifts than on a more stable house. Cultural aspects and beliefs played another role that varied among respondents and influenced the evaluation of adaptation options. The prioritization of one of the following four statements (Table 3) showed that flood avoidance is people’s least concern in relation to other goals: Table 3: Priorities of flood mitigation compared to other goals
Item to be prioritized Percentage of answers (n=351)
I live close to my work, the market, school, hospital 33.3
I live on my ancestors’ land 31.3
I know my neighbors, have a good relationship with the people in my
neighborhood
19.7
Inundation does not affect my house 15.7
Source: own draft based on household survey data, D. Krause In general, the qualitative interviews revealed that goal conflicts are a very important aspect in choosing from various options which has so far often been neglected in coping and adaptation assessments. Such goal conflicts can occur between different groups (e.g. in upstream-downstream user conflicts) but also within households or even for individuals as people usually have multiple goals that are not equally relevant and attainable to them (some people would, for example, rather keep living on their ancestors’ land than move away, even if this entails the recurring struggle with inundation). Some of the regularly flooded households further explained that they did not apply exposure-reducing measures, such as elevating the house or installing a small flood barrier, because these measures were either to costly or hampered income-earning opportunities (for shop owners, installation of a flood barrier would, for example, restrain potential customers’ access to the house) and also made daily activities, such as moving motorbikes inside the house over night much more strenuous. Choosing between flood response strategies was thus usually a comprehensive decision deeply embedded in the overall livelihood situation and associated with trade-offs. The following section will elaborate the main evaluation criteria identified and illustrate adaptation decision-making at the example of moving versus house elevation in the case study site of An Lac Ward. The example serves the illustration of mismatches in adaptation
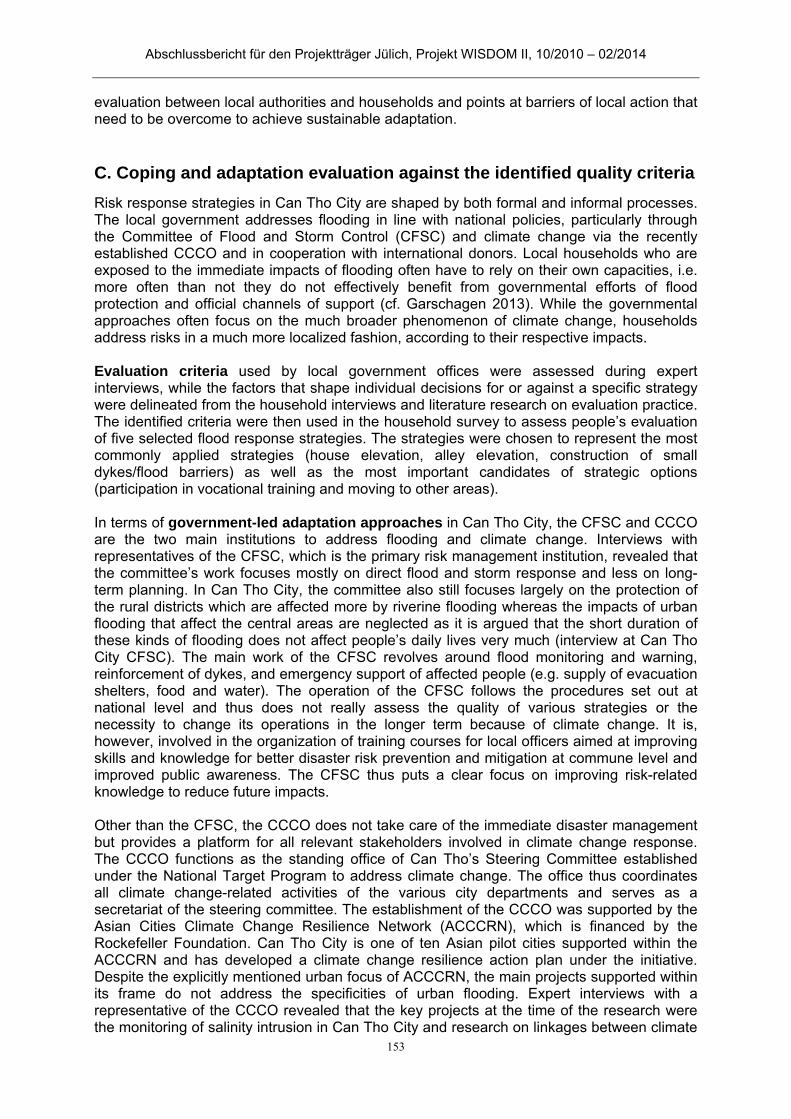
Abschlussbericht für den Projektträger Jülich, Projekt WISDOM II, 10/2010 – 02/2014
153
evaluation between local authorities and households and points at barriers of local action that need to be overcome to achieve sustainable adaptation.
C. Coping and adaptation evaluation against the identified quality criteria
Risk response strategies in Can Tho City are shaped by both formal and informal processes. The local government addresses flooding in line with national policies, particularly through the Committee of Flood and Storm Control (CFSC) and climate change via the recently established CCCO and in cooperation with international donors. Local households who are exposed to the immediate impacts of flooding often have to rely on their own capacities, i.e. more often than not they do not effectively benefit from governmental efforts of flood protection and official channels of support (cf. Garschagen 2013). While the governmental approaches often focus on the much broader phenomenon of climate change, households address risks in a much more localized fashion, according to their respective impacts. Evaluation criteria used by local government offices were assessed during expert interviews, while the factors that shape individual decisions for or against a specific strategy were delineated from the household interviews and literature research on evaluation practice. The identified criteria were then used in the household survey to assess people’s evaluation of five selected flood response strategies. The strategies were chosen to represent the most commonly applied strategies (house elevation, alley elevation, construction of small dykes/flood barriers) as well as the most important candidates of strategic options (participation in vocational training and moving to other areas). In terms of government-led adaptation approaches in Can Tho City, the CFSC and CCCO are the two main institutions to address flooding and climate change. Interviews with representatives of the CFSC, which is the primary risk management institution, revealed that the committee’s work focuses mostly on direct flood and storm response and less on long-term planning. In Can Tho City, the committee also still focuses largely on the protection of the rural districts which are affected more by riverine flooding whereas the impacts of urban flooding that affect the central areas are neglected as it is argued that the short duration of these kinds of flooding does not affect people’s daily lives very much (interview at Can Tho City CFSC). The main work of the CFSC revolves around flood monitoring and warning, reinforcement of dykes, and emergency support of affected people (e.g. supply of evacuation shelters, food and water). The operation of the CFSC follows the procedures set out at national level and thus does not really assess the quality of various strategies or the necessity to change its operations in the longer term because of climate change. It is, however, involved in the organization of training courses for local officers aimed at improving skills and knowledge for better disaster risk prevention and mitigation at commune level and improved public awareness. The CFSC thus puts a clear focus on improving risk-related knowledge to reduce future impacts. Other than the CFSC, the CCCO does not take care of the immediate disaster management but provides a platform for all relevant stakeholders involved in climate change response. The CCCO functions as the standing office of Can Tho’s Steering Committee established under the National Target Program to address climate change. The office thus coordinates all climate change-related activities of the various city departments and serves as a secretariat of the steering committee. The establishment of the CCCO was supported by the Asian Cities Climate Change Resilience Network (ACCCRN), which is financed by the Rockefeller Foundation. Can Tho City is one of ten Asian pilot cities supported within the ACCCRN and has developed a climate change resilience action plan under the initiative. Despite the explicitly mentioned urban focus of ACCCRN, the main projects supported within its frame do not address the specificities of urban flooding. Expert interviews with a representative of the CCCO revealed that the key projects at the time of the research were the monitoring of salinity intrusion in Can Tho City and research on linkages between climate
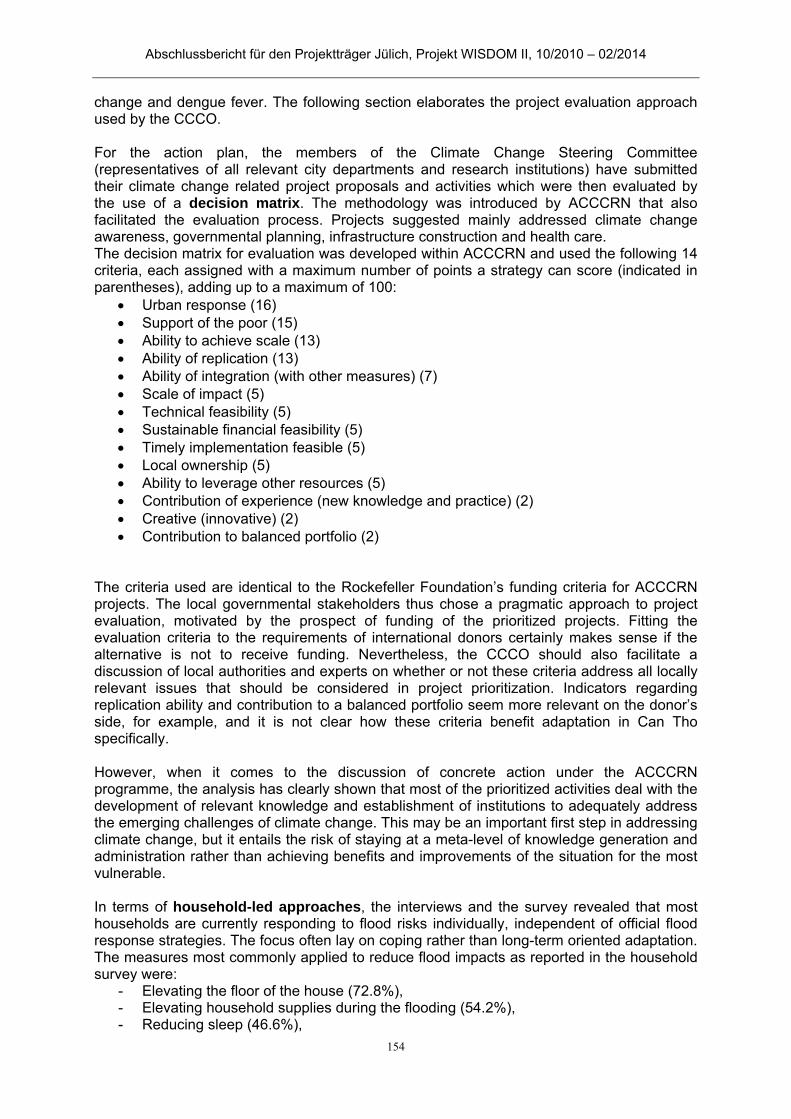
Abschlussbericht für den Projektträger Jülich, Projekt WISDOM II, 10/2010 – 02/2014
154
change and dengue fever. The following section elaborates the project evaluation approach used by the CCCO. For the action plan, the members of the Climate Change Steering Committee (representatives of all relevant city departments and research institutions) have submitted their climate change related project proposals and activities which were then evaluated by the use of a decision matrix. The methodology was introduced by ACCCRN that also facilitated the evaluation process. Projects suggested mainly addressed climate change awareness, governmental planning, infrastructure construction and health care. The decision matrix for evaluation was developed within ACCCRN and used the following 14 criteria, each assigned with a maximum number of points a strategy can score (indicated in parentheses), adding up to a maximum of 100:
Urban response (16) Support of the poor (15) Ability to achieve scale (13) Ability of replication (13) Ability of integration (with other measures) (7) Scale of impact (5) Technical feasibility (5) Sustainable financial feasibility (5) Timely implementation feasible (5) Local ownership (5) Ability to leverage other resources (5) Contribution of experience (new knowledge and practice) (2) Creative (innovative) (2) Contribution to balanced portfolio (2)
The criteria used are identical to the Rockefeller Foundation’s funding criteria for ACCCRN projects. The local governmental stakeholders thus chose a pragmatic approach to project evaluation, motivated by the prospect of funding of the prioritized projects. Fitting the evaluation criteria to the requirements of international donors certainly makes sense if the alternative is not to receive funding. Nevertheless, the CCCO should also facilitate a discussion of local authorities and experts on whether or not these criteria address all locally relevant issues that should be considered in project prioritization. Indicators regarding replication ability and contribution to a balanced portfolio seem more relevant on the donor’s side, for example, and it is not clear how these criteria benefit adaptation in Can Tho specifically. However, when it comes to the discussion of concrete action under the ACCCRN programme, the analysis has clearly shown that most of the prioritized activities deal with the development of relevant knowledge and establishment of institutions to adequately address the emerging challenges of climate change. This may be an important first step in addressing climate change, but it entails the risk of staying at a meta-level of knowledge generation and administration rather than achieving benefits and improvements of the situation for the most vulnerable. In terms of household-led approaches, the interviews and the survey revealed that most households are currently responding to flood risks individually, independent of official flood response strategies. The focus often lay on coping rather than long-term oriented adaptation. The measures most commonly applied to reduce flood impacts as reported in the household survey were:
- Elevating the floor of the house (72.8%), - Elevating household supplies during the flooding (54.2%), - Reducing sleep (46.6%),
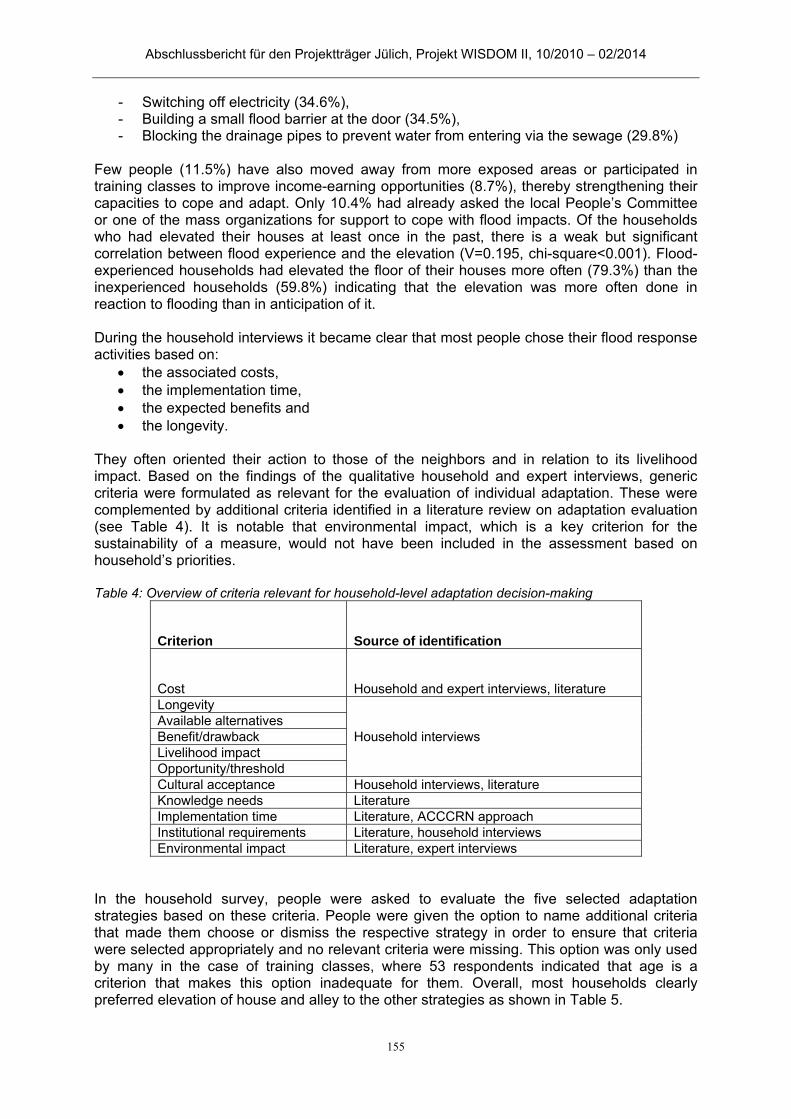
Abschlussbericht für den Projektträger Jülich, Projekt WISDOM II, 10/2010 – 02/2014
155
- Switching off electricity (34.6%), - Building a small flood barrier at the door (34.5%), - Blocking the drainage pipes to prevent water from entering via the sewage (29.8%)
Few people (11.5%) have also moved away from more exposed areas or participated in training classes to improve income-earning opportunities (8.7%), thereby strengthening their capacities to cope and adapt. Only 10.4% had already asked the local People’s Committee or one of the mass organizations for support to cope with flood impacts. Of the households who had elevated their houses at least once in the past, there is a weak but significant correlation between flood experience and the elevation (V=0.195, chi-square<0.001). Flood-experienced households had elevated the floor of their houses more often (79.3%) than the inexperienced households (59.8%) indicating that the elevation was more often done in reaction to flooding than in anticipation of it. During the household interviews it became clear that most people chose their flood response activities based on:
the associated costs, the implementation time, the expected benefits and the longevity.
They often oriented their action to those of the neighbors and in relation to its livelihood impact. Based on the findings of the qualitative household and expert interviews, generic criteria were formulated as relevant for the evaluation of individual adaptation. These were complemented by additional criteria identified in a literature review on adaptation evaluation (see Table 4). It is notable that environmental impact, which is a key criterion for the sustainability of a measure, would not have been included in the assessment based on household’s priorities. Table 4: Overview of criteria relevant for household-level adaptation decision-making
Criterion Source of identification
Cost Household and expert interviews, literature Longevity
Household interviews Available alternatives Benefit/drawback Livelihood impact Opportunity/threshold Cultural acceptance Household interviews, literature Knowledge needs Literature Implementation time Literature, ACCCRN approach Institutional requirements Literature, household interviews Environmental impact Literature, expert interviews
In the household survey, people were asked to evaluate the five selected adaptation strategies based on these criteria. People were given the option to name additional criteria that made them choose or dismiss the respective strategy in order to ensure that criteria were selected appropriately and no relevant criteria were missing. This option was only used by many in the case of training classes, where 53 respondents indicated that age is a criterion that makes this option inadequate for them. Overall, most households clearly preferred elevation of house and alley to the other strategies as shown in Table 5.
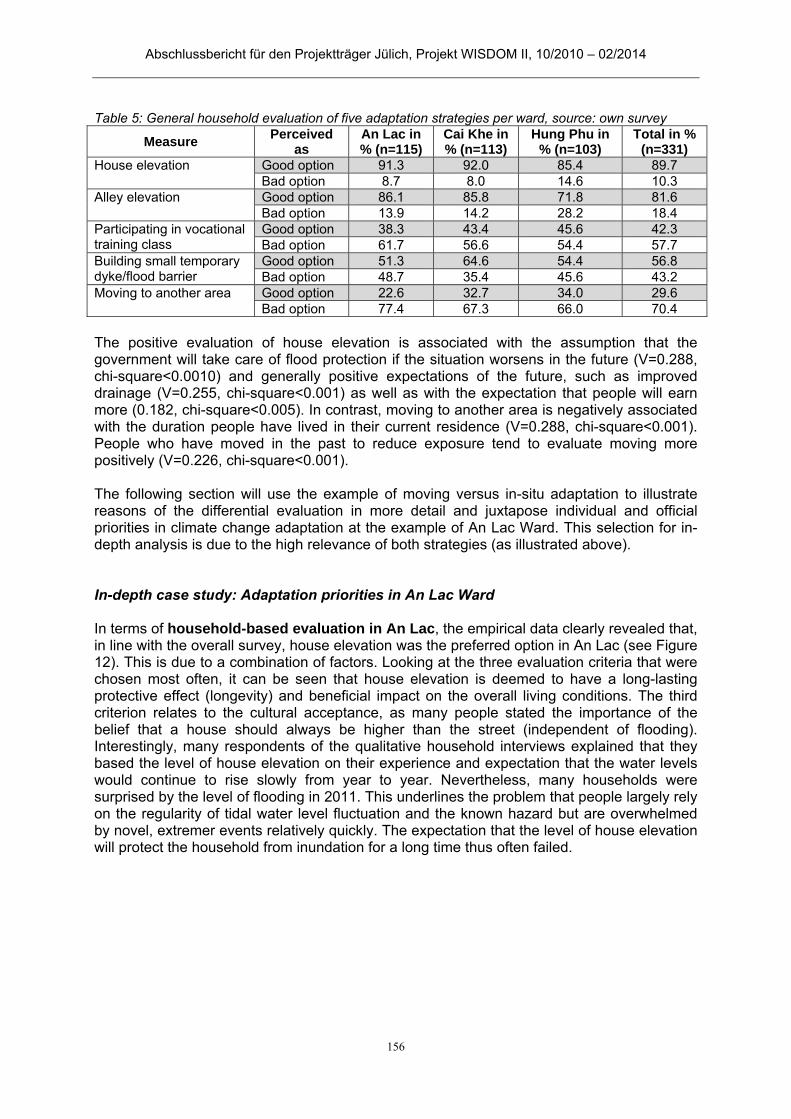
Abschlussbericht für den Projektträger Jülich, Projekt WISDOM II, 10/2010 – 02/2014
156
Table 5: General household evaluation of five adaptation strategies per ward, source: own survey
Measure Perceived
as An Lac in % (n=115)
Cai Khe in % (n=113)
Hung Phu in % (n=103)
Total in %(n=331)
House elevation Good option 91.3 92.0 85.4 89.7 Bad option 8.7 8.0 14.6 10.3
Alley elevation Good option 86.1 85.8 71.8 81.6 Bad option 13.9 14.2 28.2 18.4
Participating in vocational training class
Good option 38.3 43.4 45.6 42.3 Bad option 61.7 56.6 54.4 57.7
Building small temporary dyke/flood barrier
Good option 51.3 64.6 54.4 56.8 Bad option 48.7 35.4 45.6 43.2
Moving to another area Good option 22.6 32.7 34.0 29.6 Bad option 77.4 67.3 66.0 70.4
The positive evaluation of house elevation is associated with the assumption that the government will take care of flood protection if the situation worsens in the future (V=0.288, chi-square<0.0010) and generally positive expectations of the future, such as improved drainage (V=0.255, chi-square<0.001) as well as with the expectation that people will earn more (0.182, chi-square<0.005). In contrast, moving to another area is negatively associated with the duration people have lived in their current residence (V=0.288, chi-square<0.001). People who have moved in the past to reduce exposure tend to evaluate moving more positively (V=0.226, chi-square<0.001). The following section will use the example of moving versus in-situ adaptation to illustrate reasons of the differential evaluation in more detail and juxtapose individual and official priorities in climate change adaptation at the example of An Lac Ward. This selection for in-depth analysis is due to the high relevance of both strategies (as illustrated above). In-depth case study: Adaptation priorities in An Lac Ward In terms of household-based evaluation in An Lac, the empirical data clearly revealed that, in line with the overall survey, house elevation was the preferred option in An Lac (see Figure 12). This is due to a combination of factors. Looking at the three evaluation criteria that were chosen most often, it can be seen that house elevation is deemed to have a long-lasting protective effect (longevity) and beneficial impact on the overall living conditions. The third criterion relates to the cultural acceptance, as many people stated the importance of the belief that a house should always be higher than the street (independent of flooding). Interestingly, many respondents of the qualitative household interviews explained that they based the level of house elevation on their experience and expectation that the water levels would continue to rise slowly from year to year. Nevertheless, many households were surprised by the level of flooding in 2011. This underlines the problem that people largely rely on the regularity of tidal water level fluctuation and the known hazard but are overwhelmed by novel, extremer events relatively quickly. The expectation that the level of house elevation will protect the household from inundation for a long time thus often failed.

Abschlussbericht für den Projektträger Jülich, Projekt WISDOM II, 10/2010 – 02/2014
157
Figure 12: Flood occurrence and moving preference in An Lac Ward (Source: own figure, based on household survey and WISDOM spatial data) As depicted in Figure 13, there were only very few people who judged house elevation negatively, so that the criteria functioning as disincentives cannot be interpreted based on the An Lac judgements alone. In the overall survey, the three criteria named most often as barriers for house elevation were the costs (45.7% of cases), the threshold of too low ceiling height, where the entire roof would have to be elevated along with the floor (28.6% of cases) and the availability of better alternatives for getting rid of the problem (17.1%). In the case of moving, people perceived a high threshold of leaving their social networks and livelihoods behind to start over new (44.8% of cases). They further were reluctant to give up their ancestors’ land (cultural acceptance, 43.1% of cases) and also dreaded the costs (40.7% of cases) as land and construction prices in non-exposed areas were unaffordable for most of the affected households. It sticks out, that the reasons against house elevation can be explained to a large extent by the two above-mentioned financial criteria whereas reasons against moving are related to softer criteria.
Figure 13: Criteria rating for moving vs. house elevation in An Lac (Source: household survey)
‐60,0%
‐40,0%
‐20,0%
0,0%
20,0%
40,0%
60,0%
80,0%
100,0%
Percentage
of cases
Criteria rating for house elevation and moving as adaptation to flood
Elevation advantage (n=110) Move advantage (n=28) Elevation disadvantages (n=10) Move disadavantages (n=92)
Abschlussbericht für den Projektträger Jülich, Projekt WISDOM II, 10/2010 – 02/2014
158
In terms of governmental priorities for adaptation in An Lac, the local authorities prioritize their own adaptation projects either based on the national-level guidance or according the ACCCRN decision matrix. It became clear during the interviews with experts and local officials that the evaluation of different strategies based on criteria has not been mainstreamed into the operating procedures of government departments. The recent approaches led by ACCCRN and the Prime Ministerial decision on evaluation criteria for the approval of priority projects supporting the response to climate change (Decision 1719/QD-TTg 2011) thus provide good mechanisms to trigger the introduction of more standardized evaluation in the general work of departments. At ward level, the focus group discussion with local officers revealed that a discussion of climate change adaptation needs does not yet take place. The officers explained that they had heard of climate change but no clear understanding of it, concluding that it is not very important to them. Therefore, the shorter term impacts of urban flooding and socio-economic development were named as the most important issues to address. The discussion also showed that reliance on government propagates itself to the higher level: The ward officers, who many people rely on as a source of information and guidance, also expect guidance and clear directives from the higher levels of government concerning potential adaptations. Accordingly, climate change planning at city level formally follows the guidance and instructions of the national level. A discussion on the integration of climate change adaptation measures into ongoing projects and flood protection approaches therefore does not really take place at the local level. Climate change response planning at ward level therefore equals regular risk management. It sets responsibilities for flood protection, search and rescue and designated shelters for affected people in each hamlet (An Lac PC 2011). In An Lac, the relocation of food-affected households settling between Can Tho river and the main road was approved in 2001, along with the detailed planning of the ward (Decision 42/2001/QD-UB), but had not been initiated at the time of the research. However, the official preference for relocation of those most exposed in order to construct embankments does thus not result from a strategic evaluation of various adaptation options, but from the overall planning preferences to develop Can Tho City into a modern, regional hub for the Mekong Delta. Flood protection is clearly one of the factors considered, but not the only reason for the upgrading of low-income areas which needs to be seen rather in the context of general urban upgrading. Interim Synthesis Weighing the advantages and disadvantages of various strategies in relation to each other and from different viewpoints can help to better understand adaptation priorities and barriers. It can explain, for example, why people are reluctant to move despite recognizing that it presents the only promising long-term strategy in terms of avoiding flooding and improving the overall livelihood situation. Here, it is important to consider aspects of affective reasoning and cognitive biases that prevent people from rationally assessing their own risk and capacities of response. Given the alarming scenarios of climate change impacts, one can argue that people’s preference for in-situ adaptation presents an example of avoidant maladaptation. This is the result of the underlying levels of perception of threat and capacity. In general, the research has underlined that despite lacking financial resources to move to a less flood-prone area, lacking information seemed to be the major barrier. It is argued, that the relocation can be the right choice for some wards in Can Tho City in the long-term, as it will serve the remaining population of the ward and also reduce the threat for the resettled significantly. The implementation of the planning without sufficient consideration of climate change scenarios and the neglect of local people’s priority may result in further problems, however. On the one hand, the planned embankments may not suffice as flood
Abschlussbericht für den Projektträger Jülich, Projekt WISDOM II, 10/2010 – 02/2014
159
protection measures with sea level rise and continuing increases in flood levels as the integration of climate change into local development planning has not been finalized. On the other hand, relocating people into clusters that are not adjusted to the livelihoods and needs of the people moves the problem without solving it. Here, the qualitative interviews revealed serious shortcomings in the government’s information policy towards the project-affected households. After the project had been announced people knew that they would have to move at some point in the future, but were left in the dark regarding the time frame of project implementation as well as location of resettlement cluster. This inhibited their motivation to take individual flood response measures. These findings underline the potential of improved acceptance of official resettlement programs. It is argued that clearer information on the conditions of resettlement and the decision of resettlement projects only when the required budget for timely implementation is secured would contribute to people’s acceptance of these measures.
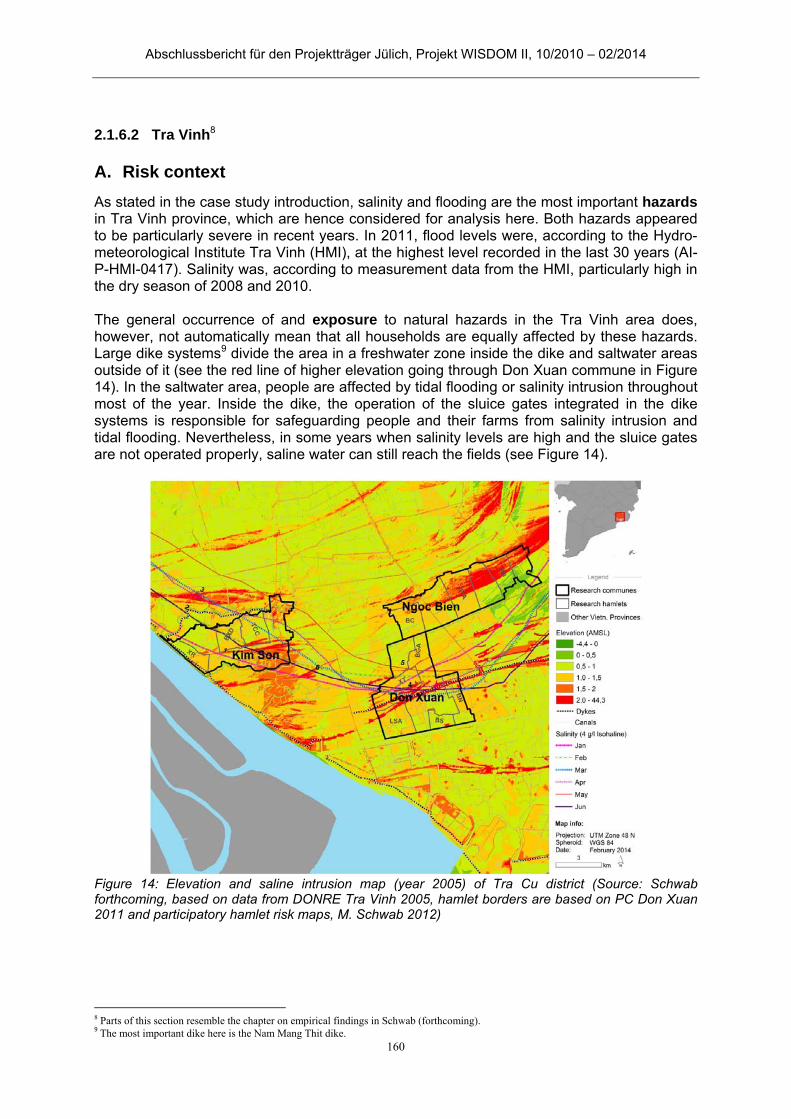
Abschlussbericht für den Projektträger Jülich, Projekt WISDOM II, 10/2010 – 02/2014
160
2.1.6.2 Tra Vinh8
A. Risk context
As stated in the case study introduction, salinity and flooding are the most important hazards in Tra Vinh province, which are hence considered for analysis here. Both hazards appeared to be particularly severe in recent years. In 2011, flood levels were, according to the Hydro-meteorological Institute Tra Vinh (HMI), at the highest level recorded in the last 30 years (AI-P-HMI-0417). Salinity was, according to measurement data from the HMI, particularly high in the dry season of 2008 and 2010. The general occurrence of and exposure to natural hazards in the Tra Vinh area does, however, not automatically mean that all households are equally affected by these hazards. Large dike systems9 divide the area in a freshwater zone inside the dike and saltwater areas outside of it (see the red line of higher elevation going through Don Xuan commune in Figure 14). In the saltwater area, people are affected by tidal flooding or salinity intrusion throughout most of the year. Inside the dike, the operation of the sluice gates integrated in the dike systems is responsible for safeguarding people and their farms from salinity intrusion and tidal flooding. Nevertheless, in some years when salinity levels are high and the sluice gates are not operated properly, saline water can still reach the fields (see Figure 14).
Figure 14: Elevation and saline intrusion map (year 2005) of Tra Cu district (Source: Schwab forthcoming, based on data from DONRE Tra Vinh 2005, hamlet borders are based on PC Don Xuan 2011 and participatory hamlet risk maps, M. Schwab 2012)
8 Parts of this section resemble the chapter on empirical findings in Schwab (forthcoming). 9 The most important dike here is the Nam Mang Thit dike.

Abschlussbericht für den Projektträger Jülich, Projekt WISDOM II, 10/2010 – 02/2014
161
The susceptibility to flooding and salinity, i.e. the predisposition to suffer harm if exposed to these hazards, is generally high in Tra Vinh, yet varying between the different hamlets, production types, and socio-economic groups. The review of secondary literature, most notably the results from WISDOM I, and the analysis of impact patterns have shown that rice is the most sensitive crop to saline water intrusion in the research area, particularly when grown in the dry season (winter-spring rice). According to official reports, most of the households who grew a third rice crop in the dry season of 2009/2010 (see the next section for their motivations) lost the entire production already in the following year 2011. In contrast, in the flood affected hamlets in Kim Son, the produced commodity, i.e. sugarcane, were less sensitive to saline intrusion. In these hamlets and in the aquaculture hamlets, the quality of the protective infrastructure played an important role. The stakeholder interviews showed that the quality of the individual and commune- or district-level embankments was lowest in the sugarcane producing hamlets. The empirical and conceptual literature also suggests that the livelihood diversity is an important driver of susceptibility. This is based on the assumption, that detrimental impacts on one source of livelihood can be compensated by another source of livelihood. If the production of one produce is, for instance, lost, the production on another produce which is not affected would still provide yield and income. In the research area, crop producing households often grew only one product on one plot. The household survey revealed that this was mostly the case in the sugar cane producing areas and among poor households. The access to non-farm sources of income was higher in all hamlets. Only very few of the interviewed households possessed not at least one other job outside of agriculture or aquaculture. Disparities with regard to vulnerability patterns also arose due to distinct capacities of response (see Table 6). The poverty rate among the affected interviewed households was as high as 40 percent in the rice and sugarcane producing hamlets, hence, indicating a low financial capacity to respond to risk and crises situations. Furthermore, people in those hamlets were poorly endowed with natural and physical capital. The average land size, which has shown to be the most decisive indicator for natural capital, was smallest in the sugarcane producing hamlets and largest in the rice producing hamlets. The indicators for human capital endowment (formal education level, participation in training classes, and dependency ratio) did not differ significantly between the production hamlets and poor respectively not-poor households. In contrast to what most of the literature in the Vietnamese context states, major differences with regard to these capacity indicators could also not be found between Kinh and Khmer. In the light of climate change, the risks of flooding and salinity intrusion are predicted to become more adverse (DONRE Tra Vinh 2012; MONRE 2012). Higher temperature, less precipitation in the dry season and sea level rise will most likely raise the hazard exposure with regard to salinity intrusion in the dry season. At the same time, the likelihood of severe flood events in the rainy season is predicted to increase. These predictions are based on a high likelihood of increased rainfall in the rainy season and an increase of tidal flooding and inundation due to sea level rise. In addition to a general increase of the likelihood and intensity of these hazard occurrences, also the variability of precipitation and temperature is expected to amplify. Besides climate change, also social, economic and political transformation will alter vulnerability patterns. Especially the improvement of the dyke-system and the building of new dykes, like for example in Kim Son commune, are aiming to decrease the risks of salinity and flooding (GD-A-KS-0112). Moreover, the expected changes in the economic structure as well as a planned intensification of agriculture and aquaculture will likely improve the productivity and increase the employment opportunities in situ (PC Tra Vinh 2011; Tra Vinh Economic Zone Authority 2012). On the negative side, these developments may disadvantage households outside the dike, raise the demand for water, and increase the dependencies on agro-chemicals and world market fluctuations. These shifts and the different potential
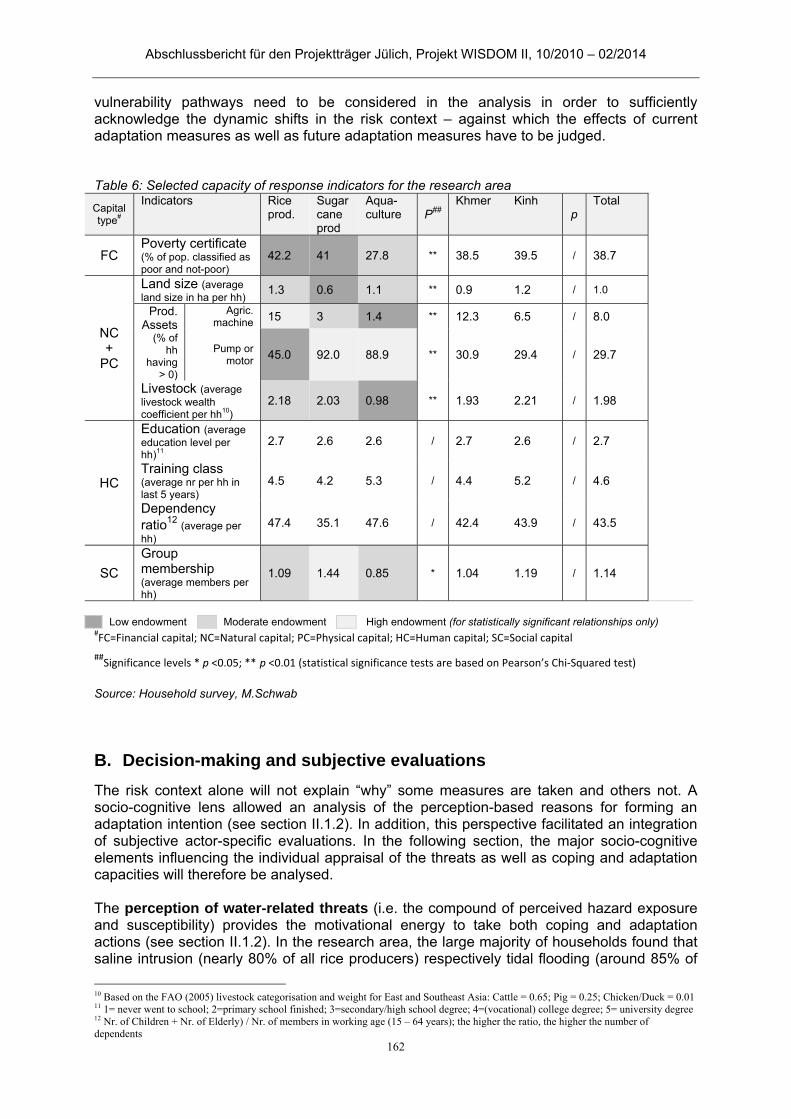
Abschlussbericht für den Projektträger Jülich, Projekt WISDOM II, 10/2010 – 02/2014
162
vulnerability pathways need to be considered in the analysis in order to sufficiently acknowledge the dynamic shifts in the risk context – against which the effects of current adaptation measures as well as future adaptation measures have to be judged. Table 6: Selected capacity of response indicators for the research area
Capital type#
Indicators Rice prod.
Sugarcane prod
Aqua-culture P##
Khmer Kinh p
Total
FC Poverty certificate (% of pop. classified as poor and not-poor)
42.2 41 27.8 ** 38.5 39.5 / 38.7
NC +
PC
Land size (average land size in ha per hh) 1.3 0.6 1.1 ** 0.9 1.2 / 1.0
Prod. Assets
(% of hh
having > 0)
Agric. machine 15 3 1.4 ** 12.3 6.5 / 8.0
Pump or motor 45.0 92.0 88.9 ** 30.9 29.4 / 29.7
Livestock (average livestock wealth coefficient per hh10)
2.18 2.03 0.98 ** 1.93 2.21 / 1.98
HC
Education (average education level per hh)11
2.7 2.6 2.6 / 2.7 2.6 / 2.7
Training class (average nr per hh in last 5 years)
4.5 4.2 5.3 / 4.4 5.2 / 4.6
Dependency ratio12 (average per hh)
47.4 35.1 47.6 / 42.4 43.9 / 43.5
SC
Group membership (average members per hh)
1.09 1.44 0.85 * 1.04 1.19 / 1.14
Low endowment Moderate endowment High endowment (for statistically significant relationships only)
#FC=Financial capital; NC=Natural capital; PC=Physical capital; HC=Human capital; SC=Social capital
##Significance levels * p <0.05; ** p <0.01 (statistical significance tests are based on Pearson’s Chi‐Squared test)
Source: Household survey, M.Schwab
B. Decision-making and subjective evaluations
The risk context alone will not explain “why” some measures are taken and others not. A socio-cognitive lens allowed an analysis of the perception-based reasons for forming an adaptation intention (see section II.1.2). In addition, this perspective facilitated an integration of subjective actor-specific evaluations. In the following section, the major socio-cognitive elements influencing the individual appraisal of the threats as well as coping and adaptation capacities will therefore be analysed. The perception of water-related threats (i.e. the compound of perceived hazard exposure and susceptibility) provides the motivational energy to take both coping and adaptation actions (see section II.1.2). In the research area, the large majority of households found that saline intrusion (nearly 80% of all rice producers) respectively tidal flooding (around 85% of
10 Based on the FAO (2005) livestock categorisation and weight for East and Southeast Asia: Cattle = 0.65; Pig = 0.25; Chicken/Duck = 0.01 11 1= never went to school; 2=primary school finished; 3=secondary/high school degree; 4=(vocational) college degree; 5= university degree 12 Nr. of Children + Nr. of Elderly) / Nr. of members in working age (15 – 64 years); the higher the ratio, the higher the number of dependents
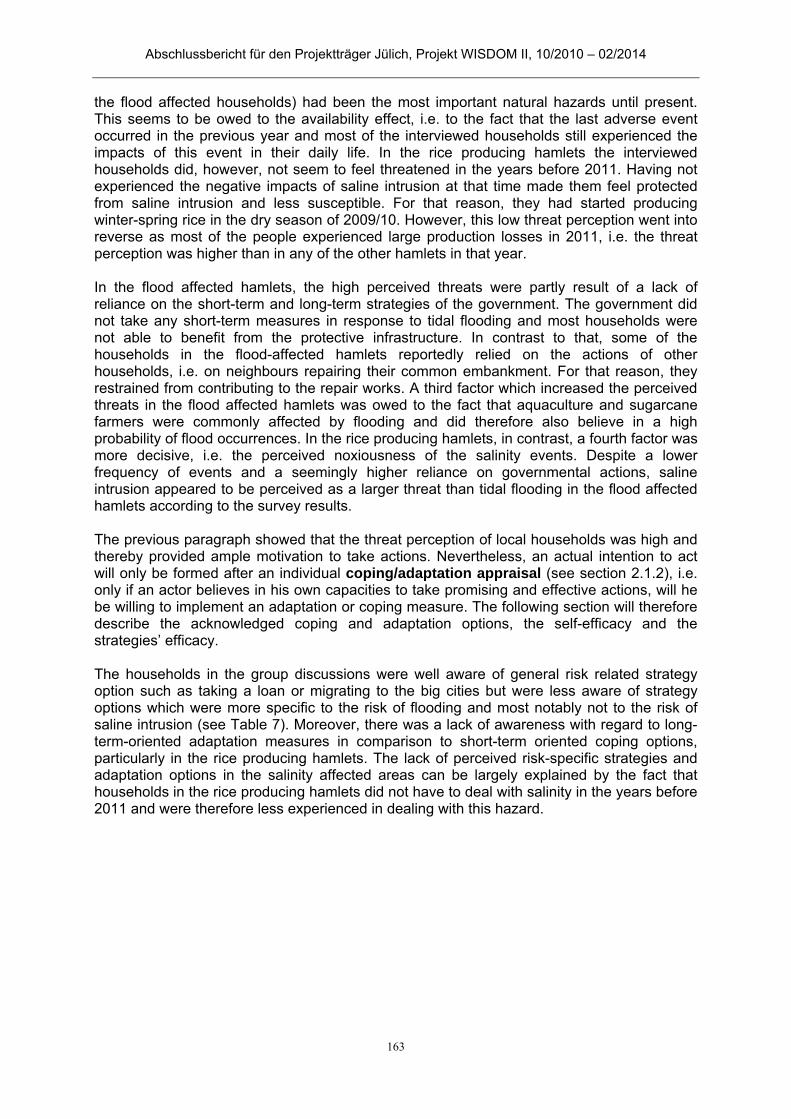
Abschlussbericht für den Projektträger Jülich, Projekt WISDOM II, 10/2010 – 02/2014
163
the flood affected households) had been the most important natural hazards until present. This seems to be owed to the availability effect, i.e. to the fact that the last adverse event occurred in the previous year and most of the interviewed households still experienced the impacts of this event in their daily life. In the rice producing hamlets the interviewed households did, however, not seem to feel threatened in the years before 2011. Having not experienced the negative impacts of saline intrusion at that time made them feel protected from saline intrusion and less susceptible. For that reason, they had started producing winter-spring rice in the dry season of 2009/10. However, this low threat perception went into reverse as most of the people experienced large production losses in 2011, i.e. the threat perception was higher than in any of the other hamlets in that year. In the flood affected hamlets, the high perceived threats were partly result of a lack of reliance on the short-term and long-term strategies of the government. The government did not take any short-term measures in response to tidal flooding and most households were not able to benefit from the protective infrastructure. In contrast to that, some of the households in the flood-affected hamlets reportedly relied on the actions of other households, i.e. on neighbours repairing their common embankment. For that reason, they restrained from contributing to the repair works. A third factor which increased the perceived threats in the flood affected hamlets was owed to the fact that aquaculture and sugarcane farmers were commonly affected by flooding and did therefore also believe in a high probability of flood occurrences. In the rice producing hamlets, in contrast, a fourth factor was more decisive, i.e. the perceived noxiousness of the salinity events. Despite a lower frequency of events and a seemingly higher reliance on governmental actions, saline intrusion appeared to be perceived as a larger threat than tidal flooding in the flood affected hamlets according to the survey results. The previous paragraph showed that the threat perception of local households was high and thereby provided ample motivation to take actions. Nevertheless, an actual intention to act will only be formed after an individual coping/adaptation appraisal (see section 2.1.2), i.e. only if an actor believes in his own capacities to take promising and effective actions, will he be willing to implement an adaptation or coping measure. The following section will therefore describe the acknowledged coping and adaptation options, the self-efficacy and the strategies’ efficacy. The households in the group discussions were well aware of general risk related strategy option such as taking a loan or migrating to the big cities but were less aware of strategy options which were more specific to the risk of flooding and most notably not to the risk of saline intrusion (see Table 7). Moreover, there was a lack of awareness with regard to long-term-oriented adaptation measures in comparison to short-term oriented coping options, particularly in the rice producing hamlets. The lack of perceived risk-specific strategies and adaptation options in the salinity affected areas can be largely explained by the fact that households in the rice producing hamlets did not have to deal with salinity in the years before 2011 and were therefore less experienced in dealing with this hazard.

Abschlussbericht für den Projektträger Jülich, Projekt WISDOM II, 10/2010 – 02/2014
164
Table 7: Perceived household strategy options
C/A*
Risk-relatedness
**
Household strategies***
Place of group discussion – Prod. area and hamlet name (n=Number of participants)
Rice area
Sugarcane area Aquac.
area Sa Van A
hamlet Tra Cu C hamlet
Xoai Rum hamlet
Bau Sau hamlet
(n=15) (n=9) (n=13) (n=31) C F Fill-up/ re-produced crops o x C F Repair the embankment (1) C S Pump water in/out of the field (3) C S F Increase fertiliser and pesticides (1) (2) (2) C G Buy fertiliser/pesticides on
credit x (3)
C F G Change product temporarily x C/A F G Storage of rainwater x C/A G Take a loan x x x (2) C/A G Sell land x x C/A G Migrate to the large cities (2) x x x A G Open a small business x x A G Work for My Phong x A F G Change to rice farming o o A S F G Change to sugarcane A F G Change to aquaculture (3) A G Change to livestock o o (3) A S F G Change to other products o o A F Build an embankment (1) (1) A F Build a drainage ditches around
the field
(1)
A F Build a small gate to control the
water
x
* Classification in coping (C), adaptation (A), and strategies which can be both depending on the circumstances (C/A) ** Classification in salinity-specific (S), flood-specific (F), and general risk-related responses (G) o Perceived options which were not applied in the hamlet in the past x Perceived options which were applied in the hamlet (n) Ranking of the strategy’s importance in the context of salinity/flood risk
Source: Household group discussions 2012, M. Schwab
Being aware of strategy options is one important part in the coping/adaptation appraisal; another vital component is the perceived self-efficacy, i.e. the ability to perform these actions (see section II1.2). Asking the people in the survey and discussion which capability-oriented criteria were an advantage/disadvantage of implementing a given strategy (i.e. costs, autonomy and implementability) indicated what people judged as inhibiting or facilitating for forming an intention to act (see Table 8). Overall, high costs were perceived to be the most important factor inhibiting the implementation of strategies (e.g. for introducing a third rice season, building an embankment or investing in assets, see Figure 16). This was most commonly the case in the aquaculture hamlets. In these hamlets, the cost-intensity of most aquaculture-related strategies seemed to restrain households from adaptation and coping – interestingly despite a better endowment with financial capital. In contrast, poor households perceived high costs less often as decisive factors in decision-making than better-off households – although the endowment with financial and physical capital was lowest in this group of households. This indicates that a mere consideration of the capital endowment of a household is often not sufficient for explaining why an intention to act is formed. The implementability of risk-related strategies was less commonly perceived as a restraining factor, especially not for buying things on credit or selling land (see Figure 16). On
Abschlussbericht für den Projektträger Jülich, Projekt WISDOM II, 10/2010 – 02/2014
165
the contrary, it was often perceived to be the most decisive advantage of strategies, particularly for the more general not risk-specific strategies (see Figure 15). This was also the case in the rice producing hamlets - despite the fact that the endowment with human capital was comparatively low there. In those hamlets, the people may not have been very experienced in applying risk-specific measures but they were well acquainted and experienced with regard to more general risk-related strategies. Table 8: Identification and scoring of relevant evaluation criteria in household decision-making
Evaluation criteria for household strategies Scoring of relevant criteria for decision-making (total of 25 points)
Average (all hh-discussions)
Xoai Rum hamlet
Bau Sau hamlet
Sa Van A hamlet
Sugarcane Aquaculture Rice
Cap
abili
ty
orie
nted
cr
iteria
Costs 7 10 6 5 Autonomy/Implementability 1 0 1 2
Out
com
e or
ient
ed
crite
ria
Income 10 8 11 12 Environment 1 0 0 4 Long-term impact 2 0 5 0
Other criteria 4 7 2 2
Total of ascribed points 25 25 25 25 Number of participants 61 13 31 15
Legend: > 9 points ascribed to the criterion 4-6 points ascribed to the criterion 7-9 points ascribed to the criterion 1-3 points ascribed to the criterion
Explanation: The given criteria were selected by the participants from a long-list of general quality criteria for strategy evaluation derived from a secondary literature review. After having selected the most relevant quality criteria, the households were asked to distribute 25 points amongst each of these criteria in order to obtain a scoring of the evaluation criteria. In the table, the criteria are split up into capability-oriented criteria which can be used as indicator for perceived self-efficacy (i.e. what one thinks he can do) and outcome-oriented criteria which depict the perceived response efficacy (i.e. one’s outcome expectations with regard to a strategy),
Source: Group discussions and authority interviews, M. Schwab 2012
In contrast to the perceived self-efficacy which refers to the subjective judgements of the own capabilities, response efficacy describes the expected outcome of the respective strategy option in principle, i.e. irrespective of one’s own capability to implement this option (see section II.1.2). Outcome-oriented criteria and their valuation provided the basis for judging the response efficacy of coping and adaptation in the current research. Group discussions showed that income was rated as being the by far most important criterion in the decision-making of households whereas future-oriented criteria such as long-term impacts and environmental protection were not named to be of larger relevance (see Table 8). The household survey revealed how different strategies were evaluated according to outcome-oriented criteria (see Figure 15 and Figure 16). Income was perceived to be the most important advantage of strategies such migration or changing the crop. Reducing the inputs was, in contrast, judged to have a predominantly negative impact on the income situation of the surveyed household and was therefore only rarely applied. Long-term impacts have also shown to be the most decisive criterion in the decision for or against certain strategies. Taking children out of school or selling assets were, for instance, nearly always judged to be negative strategies irrespective of advantages such as positive income effects. Negative environmental impacts were only acknowledged by a larger number of interviewees for the case of increasing inputs. Considering that the majority of households did still increase the

Abschlussbericht für den Projektträger Jülich, Projekt WISDOM II, 10/2010 – 02/2014
166
fertilizer, chemicals, or feed in times of flooding/salinity, the negative environmental implication seemed to have played an only subordinate role. Also income was not in all cases a decisive criterion. Migration, a strategy which was perceived to bring a large increase in income (and was easily implementable), was for instance only rarely preferred over other strategies in a pairwise comparison in the survey.
Explanations: The survey interviewees were asked to judge and rank the three most important advantages and disadvantages (out of two lists with seven options each) for 18-20 different strategies (number of strategies depended on the production type). This table depicts the percentage of households which judged the respective criterion as most important advantage of a given of strategy. The selection of strategies in this table is meant to represent the range of differential quality judgements. Therefore, different criteria take on a higher or lower weight depending on the strategy. Figure 15: Most important advantages of selected strategy options (Source: own draft based on Household survey, M. Schwab 2012)
Explanations: The survey interviewees were asked to judge and rank the three most important advantages and disadvantages (out of two lists with seven options each) for 18-20 different strategies (number of strategies depended on the production type). This table depicts the percentage of households which judged the respective criterion as most important disadvantage of a given of strategy. The selection of strategies in this table is meant to represent the range of differential quality judgements, i.e. different criteria take on a higher or lower weight depending on the strategy. Figure 16: Most important disadvantages of selected strategy options (Source: own draft based on household survey, M. Schwab 2012
Abschlussbericht für den Projektträger Jülich, Projekt WISDOM II, 10/2010 – 02/2014
167
C. Coping and adaptation evaluation against the identified quality criteria
Having gained an understanding of the overall risk context, decision-making processes and subjective strategy evaluations, it is important to assess in a next step which intentions to act were put in place and how the respective strategies impact the overall risk context. A strategic assessment along the lines of theories of change can address these aspects and provides a basis for comparing the “objectively” assessed quality of given strategies with the subjective dimension of evaluations. At the household level, the low intention to adapt was translated in few and often rarely applied anticipatory adaptation strategies – as illustrated above. Merely the construction and reparation of an individual embankment were strategies commonly applied (yet in flood affected hamlets only). Coping strategies were, as expected from the analysis of the decision-making processes, numerous and common to the majority of households. An unusually high consumption of input factors and purchases of food and input on credit were hereby the most common strategies taken. In flood affected hamlets, also re-production was applied prevalently. Among the applied coping and adaptation strategies, not all were related to flood- or salinity risks but were applied in the context of other natural and socio-economic risks. Overall, only few households applied strategies which change their exposure to tidal flooding respectively salinity intrusion. Selling exposed productive land was one such strategy. Around 36 out of the 312 interviewed households told that they sold land in recent years. There was, however, only one interviewee who decided to sell the field because he did not want to be affected by salinity in the future. Most of the households told that they had to do so because health care costs exceeded their financial capacity or because they had to pay back their debt. Accordingly, the respective households sold some of their land (which was exposed to water-related risks) in order to increase their short-term capacity to cope with current problems. Having less production land likely decreases the income from agriculture in the long-run and therefore also the financial capacities to better adapt to and cope with water-related risks in future, however. These potentially detrimental consequences were also reflected in the negative subjective judgment of this strategy. There were several strategies applied which aimed at changing the susceptibility of households. In the salinity affected rice producing areas, it was hereby of particular importance to look at the crops which were grown in the winter-spring season. While nearly all of the interviewed households produced rice in this season in 2011, only around 5-10 percent of all households produced winter-spring rice in 2012, according to local officials. The other households either decided not to grow anything in the dry season of that year or changed to more saline resistant crops such as corn or vegetables. Overall, most of the interviewed households were therefore less susceptible to salinisation in 2012 than in the previous years. A detailed analysis of cost-benefit calculations showed that growing winter-spring rice required more inputs in terms of time and effort than the other seasons but required less fertilizer than the summer-autumn crop and was easier to implement in terms of know-how than growing vegetables and corn (which they were not well acquainted with). Moreover, in years with no salinity problems, such as in the year 2012, an increase in income could compensate for the higher efforts and risks. Accordingly, higher financial capital could raise the capacity of response. This was the case for the households who produced winter-spring rice in 2012. As the others saw the successful production in 2012, nearly 90 percent of all interviewees told that they would introduce a third season of rice production again in the future. The susceptibility reduction therefore seemed to be more of a short-term than a long-term change whereby the effects of on adaptive capacity were for the most part subject to salinity related risks.
Abschlussbericht für den Projektträger Jülich, Projekt WISDOM II, 10/2010 – 02/2014
168
In the flood affected hamlets, the construction, maintenance and reparation of the embankments around the ponds and fields were highly influential with regard to susceptibility because they determined the chances of future levee failures. In-depth interviews and group discussions revealed that the costs for repairing the embankments breached by flooding were highest in the aquaculture hamlets and often ate up a large share of the revenues from production, i.e. it reduced the capacity to cope, often substantially. Several other strategies such as increasing inputs, pumping freshwater and filling-up or newly producing the crops in the field aimed at reducing the hazard-related losses, particularly in the rice producing hamlets. In these hamlets, only very few people could reduce crop failures and if they did it was to an only insignificant degree. The large majority of the strategies applied by the survey interviewees were meant to increase the capacity of response either in the short- or in the long-term. Three main groups of such strategies could be identified. First, taking a loan or purchasing goods on credit was a way of receiving financial means to cope with a current situation of income loss or high costs. The acquired financial resources were, however, merely used to adapt to future risks. In the long-run, debts were therefore likely to reduce the capacity of response substantially. Accordingly, only little money was left to pay for other expenses. Moreover, an increasing indebtedness reduced the chances to get another loan in times of crisis or increased the interest rates in future. Second, other strategies aimed at reducing the costs of living and production. Taking children out of school could for instance reduce the education-related expenses (although to an only minor degree) and increase the labour force in the family. However, this came at the expense of future non-farm employment opportunities and was therefore the reason why the majority of households judged it to be a bad strategy and did not implement it very often. Under consideration of the fact that the purchase of agro-chemicals made a large share of the household expenses, according to the production-centred interviews, a reduction of these inputs could be a pertinent way of increasing the short-term capacity to cope with current crises. Nevertheless, being afraid of production losses, only a small share of households in the survey applied this strategy. Third, a group of capacity changing strategies was related to the improvement of the capital endowment. Migration was hereby the most notable strategy applied in the research context. Household interviews revealed that a job in the urban centres promised a multiple of the agricultural income and brought despite higher costs of living larger returns for the families. This seemed to have increased the capacity of response for several households in both the short- and long-run. Being also concerned with the governmental side of risk-management and its interplay with household level strategies, government-led strategies were assessed as well. This included an analysis of the characteristics which shape the quality of the governmental measures and a consideration of the quality of strategies as subjectively perceived by local households. The “government” is not a single agent who acts merely according to his own goals and motivation. Governmental reports and interviews with authorities have shown that a multitude of institutions and individual actors implemented risk-related strategies in a diverse and hierarchically organised network of authorities. The policies and regulations were created on central and provincial level whereas local level authorities implemented them and collected information for higher level authorities. There also existed a subjective dimension to this system, i.e. each private and public actor perceived the responsibilities, relevance, and power distribution differently. In contrast to what the formally defined system of central control would suggest, households stated in group discussions that local authorities and religious institutions were the most important actors in risk management, most of all the hamlet leaders. Government authorities, on the contrary, often referred to the respective higher authority as decisive agents in the context of many salinity- and flood-related measures. The local state agents implemented a range of coping and adaptation strategies in the context of salinity and tidal flooding. Among these strategies were only two short-term

Abschlussbericht für den Projektträger Jülich, Projekt WISDOM II, 10/2010 – 02/2014
169
oriented direct responses, i.e. the payment of compensation and the issuing of flood/salinity warning alerts. The compensation payments were provided to only 2% of the interviewed flood-affected households whereas 90% of the rice producers got this compensation. This is owed to the fact that the province level authorities decided that the decision 142/2009/QĐ-TTG of the central government to improve agricultural production after natural disasters only applied to the case of saline intrusion in 2011. The households which received the compensation told that they could by far not recover for the losses with this money because the amount was too low. The warning alerts were also more often received in the salinity affected areas (50% of all surveyed households) than in the flood affected hamlets (less than 20% of all surveyed households) and the ones who received the warning alerts only rarely said that it prevented losses. For those reasons, both strategies were judged comparatively negatively by the majority of surveyed households, particularly with regard to the income effects (see Figure 17). The fact that income was rated as most decisive criterion in the group discussions makes these strategies appear even more negative in comparison with other strategies.
Explanation: Households were asked whether a statement which positively described the characteristics of the respective governmental strategy applies (only strategies which were implemented in the last 5 years were considered). This was undertaken for a set of process- and outcome-oriented criteria and was judged according to the following rating scale: The statement applies: 0=‘not at all’; 1=slightly; 2=moderately; 3=‘very much’. Only households who benefited/were affected by the respective measure were asked to rate it. For that reason, the population varies between the different strategies. The following strategies were not considered due to a too small number of valid responses (n< 20): Building a dike, upgrading the dike, vocational training classes, and other strategies.
Figure 17: Average rating of selected governmental measures according to given evaluation criteria Source: own draft based on household survey, M. Schwab 2012) Adaptation strategies were more commonly implemented. Among those strategies, exposure-reducing measures related to the protective infrastructure were most prominent and formative in the given risk context. A complex system of dikes and sluice gates which was mostly built in the 1990s reduced the areas exposed to flooding and increased the freshwater availability. These projects seemed to comply with some of the most important good governance criteria13,according to official dike planning and documentation reports. The fulfilment of these standards was not confirmed by the interviewed local authorities and households, however. Furthermore, the construction of dikes had a number of negative consequences. The susceptibility of the people inside the dike was raised because they
13 The reports put emphasis in particular on local participation requirements and regular assessments of the state of the dike.

Abschlussbericht für den Projektträger Jülich, Projekt WISDOM II, 10/2010 – 02/2014
170
started growing more sensitive crops in hazardous times of the year and the agricultural land outside the dike was often exposed to a larger degree than before. Particularly the latter resulted in the fact that the income effect and the long-term impacts were rated comparatively low by a considerable amount of affected interviewees (see Figure 17Figure ). Moreover, the existing dikes were rarely repaired or upgraded and the operation of the sluice gates in those dikes was not always appropriate and reliable. In 2011, for instance, the operation was neither in accordance with the formal institutions nor timely. As a result, water with salinity levels above a critical threshold got into the irrigation canals and lead to large production losses. In reaction to these losses, provincial and district level authorities enforced a new regulation and stricter control mechanisms in favour of rice producers in the research area. However, a large share of the surveyed rice producers still thought that the reliability and the competence of the sluice gate management were comparatively low (see Figure 17). The canals seemed to be dredged regularly and reliably according to official reports and authority interviews. The households confirmed this assumption as nearly 70% of all survey interviewees reported to have benefited from the dredging of the canal and the majority of households judged it to be among the most reliable strategies implemented in the research area. Also with regard to other criteria it was rated positively by most of the interviewed households (see Figure 17). Susceptibility reduction could be achieved by the promotion of crop changes and crop calendars. This potential was did not materialize, however, because only few households followed these suggestions and/or it did not have a notable effect on the susceptibility patterns. The promotion of a new crop or species, however, seemed to have a positive effect on the income of most of the households who changed the product, according to the subjective strategy evaluation in the household survey. Those households which changed the crop calendar and/or the crop furthermore stated that the promotion of these strategies could improve the situation in the long-run and that the proportion of beneficiaries was comparatively high (see Figure 17). The majority of government strategies aimed at an increase in the capacity of response. The most prevalent, although not risk-specific, strategy in this context was the provision of agricultural extension and trainings. More than 60% of all interviewed households participated in the trainings and the large majority of these households found that it was a reliable and competently implemented strategy which brought benefits to a large share of people also in the long-run (see Figure 17). However, salinity- and flood-specific information was rarely included in the training so that the know-how with regard to risk-specific private strategies was strengthened to an only minor degree. The financial capacity to cope and adapt was commonly strengthened by governmental loan schemes which were accessible to the majority of households. Among the survey interviewees, particularly aquaculture producers made use of these loans. Nevertheless, it was also the aquaculture producers which rated the loans schemes lower with regard to reliability, income effects, and long-term effects than rice and sugarcane producers. Moreover, flood-specific adaptation measures were only rarely financed by loans neither in the aquaculture hamlets nor in the other hamlets. Further governmental measures such as the vocational trainings and the support of cooperatives would also have the potential to increase the capacity to respond but reached only a small number of households and affected the adaptive capacity of those households to an often only minor degree. Interim synthesis
Abschlussbericht für den Projektträger Jülich, Projekt WISDOM II, 10/2010 – 02/2014
171
Overall, the analysis guided by the context-specific and adaptive conceptual evaluation framework developed for WISDOM II drew a distinct picture of “good” coping and adaptation strategies in the rural areas of Tra Vinh Province. Addressing both the revealed and perceived risk context has shown that flooding and saline intrusion have not only been serious water-related threats as recorded by official sources (especially against the background of climate change) but that they have also been perceived as most important threats. They thereby provided ample motivation to take action. Despite this motivation, measures to adapt to future risks were rarely applied by local households. This was widely owed to the results of the individual coping and adaptation appraisal of the local actors. In the research area, many households were not aware of respectively did not trust in their capacity to implement promising adaptation and coping options. The perceived quality of strategies was in this context of central relevance. An actor-oriented subjective evaluation of different coping and adaptation measures has revealed that the income effect of a strategy was rated as most important criterion in the evaluation of strategies. This did not only hold true for the subjective judgement of household strategies but also for the judgement of government strategies. Nevertheless, a notable number of strategies were judged to be good/bad despite their negative/positive influence on the income because other criteria outweighed the significance of the income effect (especially long-term effects and implementability). In addition to that, the analysis revealed the stakeholder-specific nature of evaluations. Process-oriented criteria were, for instance, perceived to be of major importance by local authorities while households did not ascribe much importance to them. An integration of a theory-of-change based approach in the evaluation framework facilitated comparing these stakeholder-specific multi-criteria assessments with the processes and vulnerability-related impacts of given measures. This revealed, for instance, that many of the preferred infrastructural measures had highly debatable vulnerability-related impacts and did not fulfil basic standards with regard to process-oriented criteria. Overall, the evaluation approach developed for WISDOM II has proven to open up a multi-faceted view on coping and adaptation and could thereby strengthen the identification of “good” and accepted strategies on different scales, with regard to various dimensions, and for different actor groups.
Abschlussbericht für den Projektträger Jülich, Projekt WISDOM II, 10/2010 – 02/2014
172
Concluding discussion and recommendations 2.1.7
The presented research has underlined the importance of risk context, decision-making and the evaluation from different perspectives for the identification of “good” coping and adaptation strategies. The empirical findings underpin that it is key to understand not only the risk context in which coping and adaptation takes place, but also the factors that shape human decision-making and thereby the evaluation of different options.
Risk context
In continuation of the risk and vulnerability assessment conducted in WISODM I, the consideration of the risk context in WISDOM II allowed not only for deepening the understanding on risk factors but also the for applying a longer term perspective in order to assess the dynamics in risk pathways and drivers. The findings from both risk profiles (urban Can Tho City and rural Tra Vinh) underscore the duality of risk as being not only shaped by the natural hazards (flooding and salinity intrusion) but also by the human vulnerability, i.e. the susceptibility, exposure and lack of response capacity all of which are determined by the set-up of the social and economic system in the given context. The analysis showed in particular how these vulnerabilities are influenced by an interplay of individual action, collective action and state action. In this regard, the findings clearly emphasize that in contrast to much of the scientific and political debate, the current changes in risk profiles are not only driven by changes in the hazard conditions (e.g. increased likelihood of severe flood events) but in particular by the shifts in the causal fabric of vulnerability as Vietnam continues its economic transformation process. The vulnerability effects of increased global integration and the consequent changes in agro-economic production profiles in Tra Vinh have shown this very clearly. Strong effects can also be observed in Can Tho City, e.g. with regards to the massive growth and economic changes in Hung Phu ward and the related shifts in risk and vulnerability patterns. Acknowledging these driving forces of risk dynamics is an important component for future policy advice – especially in the field of IWRM – as it challenges the current concentration on hazard mitigation and urges to address the processes that drive up human vulnerability – as being the other and often even more immediate factor or water-related risk. The findings allow for very specific policy recommendations that pay tribute to the specifications of the risk contexts in each case study profile.
Decision-making on adaptation: empirical insight and conceptual guidance
In line with the literature on socio-cognitive decision-making models, risk perception stood out in our analysis as a key factor for shaping coping and adaptation. The empirical findings from Tra Vinh Province underscore the relevance of addressing the dynamics in risk perception – an aspect which did not find much attention in socio-cognitive adaptation decision-making literature so far (cf. section 2.1.2). In the rice producing hamlets, for instance, the strong feeling of being protected had been almost entirely lost after a single event, i.e. the loss of rice production in 2011. This event did not only produce a more pronounced feeling of being threatened to the households but raised the motivation to take actions on governmental side. The public attention on the severe losses provoked compensation payments for salinity-affected farmers - payments which have never been considered for flood affected households despite the fact that flood losses were often not much smaller and more common. Nevertheless, as fast as the threat perception had appeared in 2011, did it dissolve the following year – at least on household side. The news that the government implemented policies to improve sluice gate operation and the observed success of some farmers who grew winter-spring rice in 2011/2012 brought back a feeling of being protected from saline intrusion. For these reasons, the large majority of households intended to cultivate winter-spring rice again in the dry season of 2012/2013. This example
Abschlussbericht für den Projektträger Jülich, Projekt WISDOM II, 10/2010 – 02/2014
173
shows how important it is, to account for the dynamics and drivers of threat perception. Currently, those aspects are rarely integrated in the manifold governmental and non-governmental programs that try to promote more sustainable agriculture- and non-agriculture-based strategies. The distinction between threat and capacity of response proved useful as it allows the separate reflection of perception of the hazard (and its potential impacts) and of response capabilities. This is helpful with regard to climate change and transformation as to the fact that climate change is strongly linked to threats whereas transformation is interwoven with the capacity of response. In terms of individual decision-making, climate change will affect mostly people’s threat appraisal while socio-economic development and transformation influences the coping and adaptation appraisal – not only due to the transforming risk context but also on a level of newly produced uncertainties. The Can Tho City case study revealed that people’s adaptation in less disaster-experienced areas does not focus on exposure reduction but on maintaining or strengthening self-efficacy (for example by remaining within a known context and social network). Given the alarming scenarios of climate change impacts, one can argue that people’s preference for in-situ adaptation presents an example of avoidant maladaptation as the probability and severity of threat are very likely to increase. The empirical data has revealed that, despite the Vietnamese success in poverty reduction, many households are still struggling with securing their day-to-day livelihoods. Therefore, most people do not perceive their self-efficacy as high as would be necessary for a more long-term adaptation intention. For the evaluation of coping and adaptation, next to actual response capacities, the perception of options and the perceived efficacy of the options and the perception of self-efficacy play a major role. Including the awareness of coping and adaptation options in the coping and adaptation appraisal (see section 2.1.2) has proven to be a helpful analytical component in the current research context. Nevertheless, this is an aspect which has not been addressed in other socio-cognitive adaptation decision-making models so far. The low awareness of adaptation and risk-specific options indicates, for instance, that people are often not restrained from taking more sustainable response mechanisms because they think that they do not have the capability to respond in a beneficial way but because they are not aware of such options in the first place. This has shown to be mainly related to the degree of risk experiences and the nature of the social discourses in the given risk context – with substantial implications on the need for training and knowledge dissemination in IWRM and adaptation policy in order to spread best practices. Moreover, the inclusion of more general risk-related strategy options in the appraisal has revealed the perceived quality of options which are not applied in the context of flooding/salinity today but could well be an option in an altered future environment.
Evaluation criteria
Owing to the mixed-method approach, it was possible to first identify and understand criteria playing a role in people’s perception of options and decision-making and then evaluate different response measures against those criteria more strategically. In the urban context, a number of criteria not usually integrated in evaluation approaches were delineated from the qualitative household interviews. These include, for example, the longevity of a measure, hazard-independent benefits or drawbacks, opportunity or threshold and cultural acceptance. While often mentioned in other studies as “soft factors”, these aspects have not yet been assessed strategically. Comparing the quality criteria delineated for the rural and the urban context, it was found that rural households placed a greater emphasis on financial implications of a strategy while urban households ranked “soft factors” higher. In Tra Vinh, process-oriented criteria such participation and long-term criteria such as environmental impacts were in this respect of only minor importance to the households. The stakeholder-specific perspective on evaluation showed that those weightings, however,
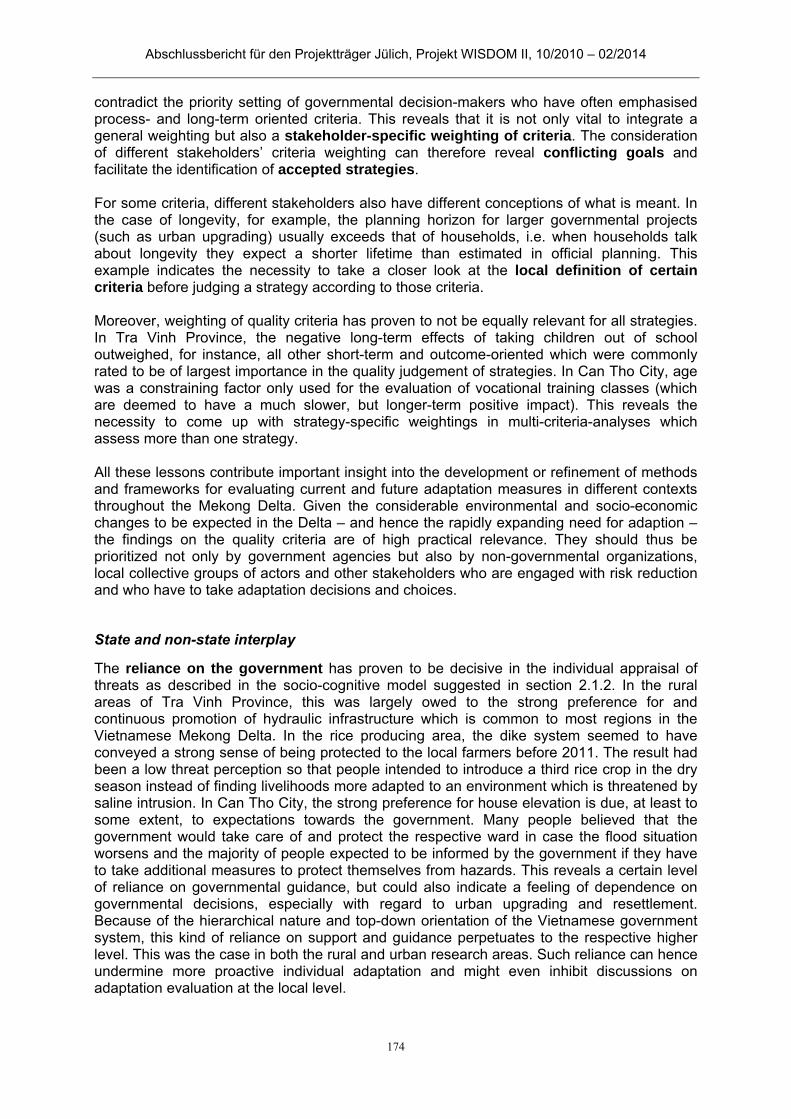
Abschlussbericht für den Projektträger Jülich, Projekt WISDOM II, 10/2010 – 02/2014
174
contradict the priority setting of governmental decision-makers who have often emphasised process- and long-term oriented criteria. This reveals that it is not only vital to integrate a general weighting but also a stakeholder-specific weighting of criteria. The consideration of different stakeholders’ criteria weighting can therefore reveal conflicting goals and facilitate the identification of accepted strategies. For some criteria, different stakeholders also have different conceptions of what is meant. In the case of longevity, for example, the planning horizon for larger governmental projects (such as urban upgrading) usually exceeds that of households, i.e. when households talk about longevity they expect a shorter lifetime than estimated in official planning. This example indicates the necessity to take a closer look at the local definition of certain criteria before judging a strategy according to those criteria. Moreover, weighting of quality criteria has proven to not be equally relevant for all strategies. In Tra Vinh Province, the negative long-term effects of taking children out of school outweighed, for instance, all other short-term and outcome-oriented which were commonly rated to be of largest importance in the quality judgement of strategies. In Can Tho City, age was a constraining factor only used for the evaluation of vocational training classes (which are deemed to have a much slower, but longer-term positive impact). This reveals the necessity to come up with strategy-specific weightings in multi-criteria-analyses which assess more than one strategy. All these lessons contribute important insight into the development or refinement of methods and frameworks for evaluating current and future adaptation measures in different contexts throughout the Mekong Delta. Given the considerable environmental and socio-economic changes to be expected in the Delta – and hence the rapidly expanding need for adaption – the findings on the quality criteria are of high practical relevance. They should thus be prioritized not only by government agencies but also by non-governmental organizations, local collective groups of actors and other stakeholders who are engaged with risk reduction and who have to take adaptation decisions and choices.
State and non-state interplay
The reliance on the government has proven to be decisive in the individual appraisal of threats as described in the socio-cognitive model suggested in section 2.1.2. In the rural areas of Tra Vinh Province, this was largely owed to the strong preference for and continuous promotion of hydraulic infrastructure which is common to most regions in the Vietnamese Mekong Delta. In the rice producing area, the dike system seemed to have conveyed a strong sense of being protected to the local farmers before 2011. The result had been a low threat perception so that people intended to introduce a third rice crop in the dry season instead of finding livelihoods more adapted to an environment which is threatened by saline intrusion. In Can Tho City, the strong preference for house elevation is due, at least to some extent, to expectations towards the government. Many people believed that the government would take care of and protect the respective ward in case the flood situation worsens and the majority of people expected to be informed by the government if they have to take additional measures to protect themselves from hazards. This reveals a certain level of reliance on governmental guidance, but could also indicate a feeling of dependence on governmental decisions, especially with regard to urban upgrading and resettlement. Because of the hierarchical nature and top-down orientation of the Vietnamese government system, this kind of reliance on support and guidance perpetuates to the respective higher level. This was the case in both the rural and urban research areas. Such reliance can hence undermine more proactive individual adaptation and might even inhibit discussions on adaptation evaluation at the local level.
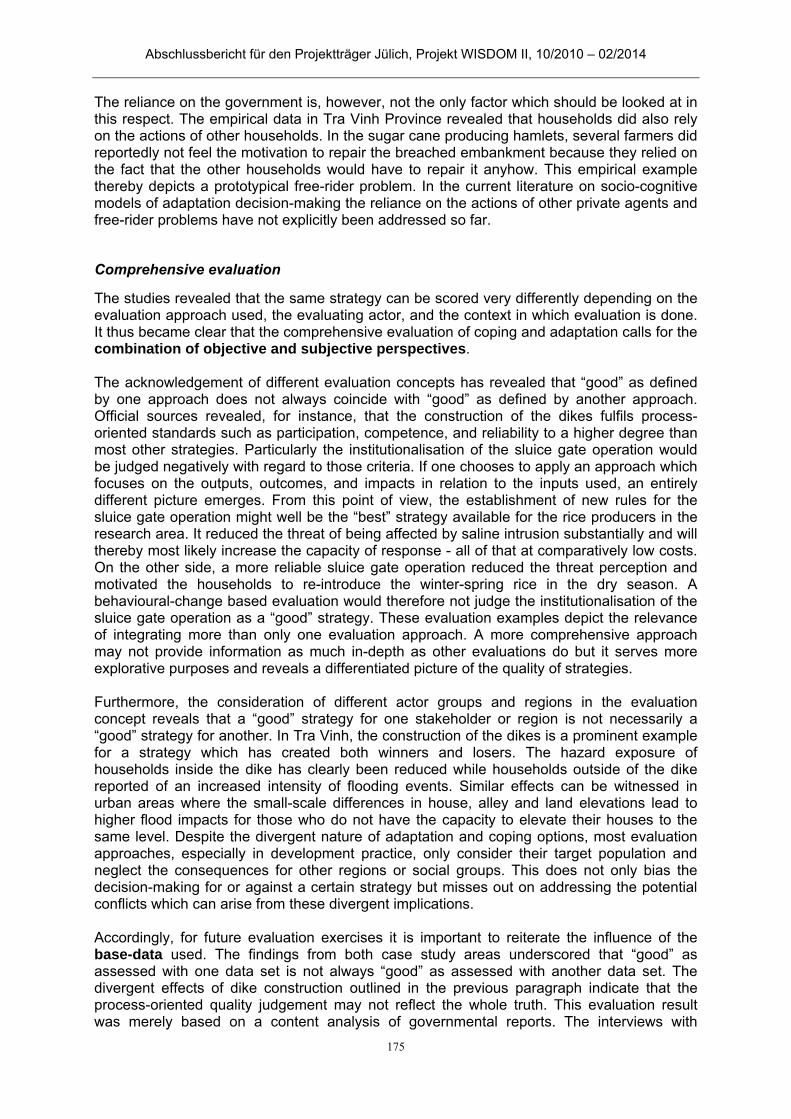
Abschlussbericht für den Projektträger Jülich, Projekt WISDOM II, 10/2010 – 02/2014
175
The reliance on the government is, however, not the only factor which should be looked at in this respect. The empirical data in Tra Vinh Province revealed that households did also rely on the actions of other households. In the sugar cane producing hamlets, several farmers did reportedly not feel the motivation to repair the breached embankment because they relied on the fact that the other households would have to repair it anyhow. This empirical example thereby depicts a prototypical free-rider problem. In the current literature on socio-cognitive models of adaptation decision-making the reliance on the actions of other private agents and free-rider problems have not explicitly been addressed so far.
Comprehensive evaluation
The studies revealed that the same strategy can be scored very differently depending on the evaluation approach used, the evaluating actor, and the context in which evaluation is done. It thus became clear that the comprehensive evaluation of coping and adaptation calls for the combination of objective and subjective perspectives. The acknowledgement of different evaluation concepts has revealed that “good” as defined by one approach does not always coincide with “good” as defined by another approach. Official sources revealed, for instance, that the construction of the dikes fulfils process-oriented standards such as participation, competence, and reliability to a higher degree than most other strategies. Particularly the institutionalisation of the sluice gate operation would be judged negatively with regard to those criteria. If one chooses to apply an approach which focuses on the outputs, outcomes, and impacts in relation to the inputs used, an entirely different picture emerges. From this point of view, the establishment of new rules for the sluice gate operation might well be the “best” strategy available for the rice producers in the research area. It reduced the threat of being affected by saline intrusion substantially and will thereby most likely increase the capacity of response - all of that at comparatively low costs. On the other side, a more reliable sluice gate operation reduced the threat perception and motivated the households to re-introduce the winter-spring rice in the dry season. A behavioural-change based evaluation would therefore not judge the institutionalisation of the sluice gate operation as a “good” strategy. These evaluation examples depict the relevance of integrating more than only one evaluation approach. A more comprehensive approach may not provide information as much in-depth as other evaluations do but it serves more explorative purposes and reveals a differentiated picture of the quality of strategies. Furthermore, the consideration of different actor groups and regions in the evaluation concept reveals that a “good” strategy for one stakeholder or region is not necessarily a “good” strategy for another. In Tra Vinh, the construction of the dikes is a prominent example for a strategy which has created both winners and losers. The hazard exposure of households inside the dike has clearly been reduced while households outside of the dike reported of an increased intensity of flooding events. Similar effects can be witnessed in urban areas where the small-scale differences in house, alley and land elevations lead to higher flood impacts for those who do not have the capacity to elevate their houses to the same level. Despite the divergent nature of adaptation and coping options, most evaluation approaches, especially in development practice, only consider their target population and neglect the consequences for other regions or social groups. This does not only bias the decision-making for or against a certain strategy but misses out on addressing the potential conflicts which can arise from these divergent implications. Accordingly, for future evaluation exercises it is important to reiterate the influence of the base-data used. The findings from both case study areas underscored that “good” as assessed with one data set is not always “good” as assessed with another data set. The divergent effects of dike construction outlined in the previous paragraph indicate that the process-oriented quality judgement may not reflect the whole truth. This evaluation result was merely based on a content analysis of governmental reports. The interviews with
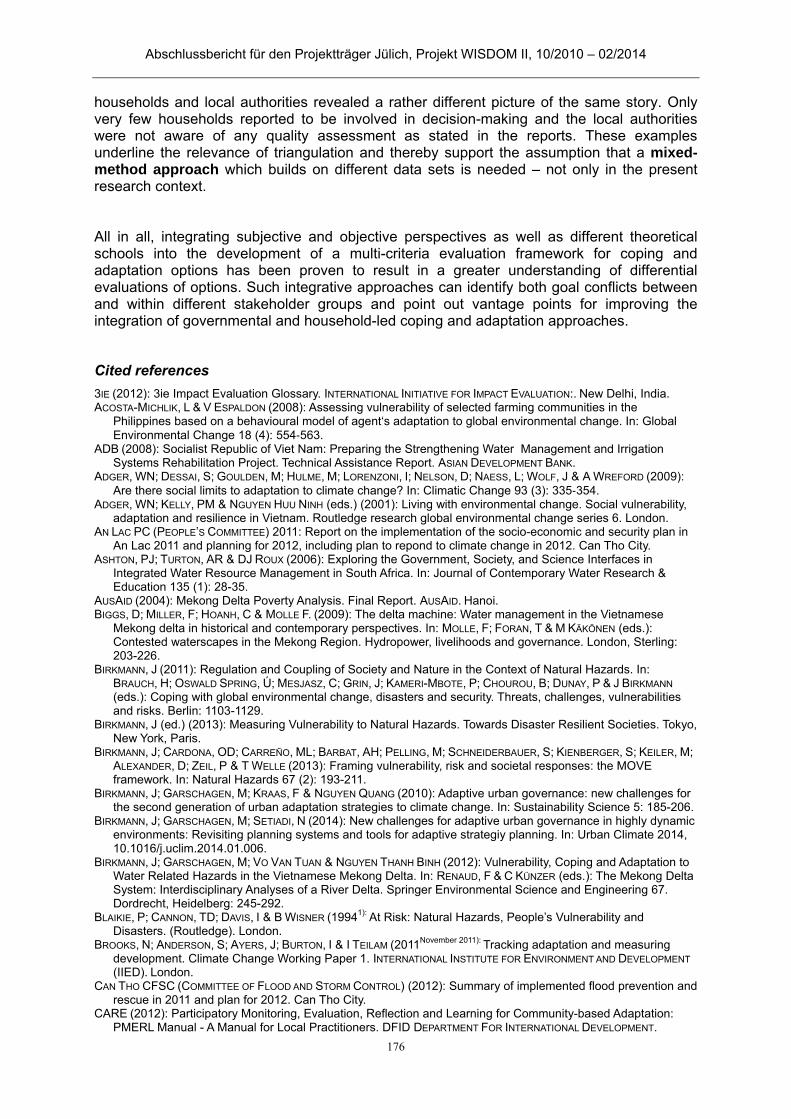
Abschlussbericht für den Projektträger Jülich, Projekt WISDOM II, 10/2010 – 02/2014
176
households and local authorities revealed a rather different picture of the same story. Only very few households reported to be involved in decision-making and the local authorities were not aware of any quality assessment as stated in the reports. These examples underline the relevance of triangulation and thereby support the assumption that a mixed-method approach which builds on different data sets is needed – not only in the present research context. All in all, integrating subjective and objective perspectives as well as different theoretical schools into the development of a multi-criteria evaluation framework for coping and adaptation options has been proven to result in a greater understanding of differential evaluations of options. Such integrative approaches can identify both goal conflicts between and within different stakeholder groups and point out vantage points for improving the integration of governmental and household-led coping and adaptation approaches.
Cited references
3IE (2012): 3ie Impact Evaluation Glossary. INTERNATIONAL INITIATIVE FOR IMPACT EVALUATION:. New Delhi, India. ACOSTA-MICHLIK, L & V ESPALDON (2008): Assessing vulnerability of selected farming communities in the
Philippines based on a behavioural model of agent‘s adaptation to global environmental change. In: Global Environmental Change 18 (4): 554‐563.
ADB (2008): Socialist Republic of Viet Nam: Preparing the Strengthening Water Management and Irrigation Systems Rehabilitation Project. Technical Assistance Report. ASIAN DEVELOPMENT BANK.
ADGER, WN; DESSAI, S; GOULDEN, M; HULME, M; LORENZONI, I; NELSON, D; NAESS, L; WOLF, J & A WREFORD (2009): Are there social limits to adaptation to climate change? In: Climatic Change 93 (3): 335‐354.
ADGER, WN; KELLY, PM & NGUYEN HUU NINH (eds.) (2001): Living with environmental change. Social vulnerability, adaptation and resilience in Vietnam. Routledge research global environmental change series 6. London.
AN LAC PC (PEOPLE’S COMMITTEE) 2011: Report on the implementation of the socio-economic and security plan in An Lac 2011 and planning for 2012, including plan to repond to climate change in 2012. Can Tho City.
ASHTON, PJ; TURTON, AR & DJ ROUX (2006): Exploring the Government, Society, and Science Interfaces in Integrated Water Resource Management in South Africa. In: Journal of Contemporary Water Research & Education 135 (1): 28-35.
AUSAID (2004): Mekong Delta Poverty Analysis. Final Report. AUSAID. Hanoi. BIGGS, D; MILLER, F; HOANH, C & MOLLE F. (2009): The delta machine: Water management in the Vietnamese
Mekong delta in historical and contemporary perspectives. In: MOLLE, F; FORAN, T & M KÄKÖNEN (eds.): Contested waterscapes in the Mekong Region. Hydropower, livelihoods and governance. London, Sterling: 203-226.
BIRKMANN, J (2011): Regulation and Coupling of Society and Nature in the Context of Natural Hazards. In: BRAUCH, H; OSWALD SPRING, Ú; MESJASZ, C; GRIN, J; KAMERI-MBOTE, P; CHOUROU, B; DUNAY, P & J BIRKMANN (eds.): Coping with global environmental change, disasters and security. Threats, challenges, vulnerabilities and risks. Berlin: 1103-1129.
BIRKMANN, J (ed.) (2013): Measuring Vulnerability to Natural Hazards. Towards Disaster Resilient Societies. Tokyo, New York, Paris.
BIRKMANN, J; CARDONA, OD; CARREÑO, ML; BARBAT, AH; PELLING, M; SCHNEIDERBAUER, S; KIENBERGER, S; KEILER, M; ALEXANDER, D; ZEIL, P & T WELLE (2013): Framing vulnerability, risk and societal responses: the MOVE framework. In: Natural Hazards 67 (2): 193-211.
BIRKMANN, J; GARSCHAGEN, M; KRAAS, F & NGUYEN QUANG (2010): Adaptive urban governance: new challenges for the second generation of urban adaptation strategies to climate change. In: Sustainability Science 5: 185-206.
BIRKMANN, J; GARSCHAGEN, M; SETIADI, N (2014): New challenges for adaptive urban governance in highly dynamic environments: Revisiting planning systems and tools for adaptive strategiy planning. In: Urban Climate 2014, 10.1016/j.uclim.2014.01.006.
BIRKMANN, J; GARSCHAGEN, M; VO VAN TUAN & NGUYEN THANH BINH (2012): Vulnerability, Coping and Adaptation to Water Related Hazards in the Vietnamese Mekong Delta. In: RENAUD, F & C KÜNZER (eds.): The Mekong Delta System: Interdisciplinary Analyses of a River Delta. Springer Environmental Science and Engineering 67. Dordrecht, Heidelberg: 245-292.
BLAIKIE, P; CANNON, TD; DAVIS, I & B WISNER (19941): At Risk: Natural Hazards, People’s Vulnerability and Disasters. (Routledge). London.
BROOKS, N; ANDERSON, S; AYERS, J; BURTON, I & I TEILAM (2011November 2011): Tracking adaptation and measuring development. Climate Change Working Paper 1. INTERNATIONAL INSTITUTE FOR ENVIRONMENT AND DEVELOPMENT
(IIED). London. CAN THO CFSC (COMMITTEE OF FLOOD AND STORM CONTROL) (2012): Summary of implemented flood prevention and
rescue in 2011 and plan for 2012. Can Tho City. CARE (2012): Participatory Monitoring, Evaluation, Reflection and Learning for Community-based Adaptation:
PMERL Manual - A Manual for Local Practitioners. DFID DEPARTMENT FOR INTERNATIONAL DEVELOPMENT.
Abschlussbericht für den Projektträger Jülich, Projekt WISDOM II, 10/2010 – 02/2014
177
London. CAREW-REID, J (2008): Rapid Assessment of the Extent and Impact of Sea Level Rise in Viet Nam. Climate
Change Discussion Paper 1. INTERNATIONAL CENTRE FOR ENVIRONMENTAL MANAGEMENT. Hanoi. CFSC (2011): Relief support matrix Mekong Delta floods 2011. (state 11.11.2011). COMMITTEE FOR FLOOD AND
STORM CONTROL. Hanoi. CHAMBERS, R (1989): Editorial Introduction: Vulnerability, Coping and Policy. In: ids bulletin 20 (2): 1-7. CHAUDHRY, P & G RUYSSCHAERT (2007): Climate Change and Human Development in Viet Nam. Human
Development Report Occasional Paper. UNDP. http://hdr.undp.org/en/reports/global/hdr2007-2008/papers/Chaudhry_Peter%20and%20Ruysschaert_Greet.pdf (accessed: 10 Jun 2012).
CRESWELL, J (1999): Mixed-method research: Introduction and application. In: CIZEK, GJ (ed.): Handbook of educational policy. San Diego, US: 455‐472.
CTC PC SC 158 (CAN THO CITY PEOPLE’S COMMITTEE STEERING COMMITTEE FOR DECISION 158)(2010): Can Tho City Climate Change Resilience Plan. English Synthesis Report. Can Tho.
DANG KIEU NHAN; NGUYEN VAN BE & NGUYEN HIEU TRUNG (2007): Water Use and Competition in the Mekong Delta. In: Challenges to Sustainable Development in the Mekong Delta: Regional and National Policy Issues and Research Needs. Bangkok: 143-189.
DEBELS, P; SZLAFSZTEIN, C; ALDUNCE, P; NERI, C; CARVAJAL, Y; QUINTERO-ANGEL, M; CELIS, A; BEZANILLA, A & D
MARTÍNEZ (2009): IUPA: a tool for the evaluation of the general usefulness of practices for adaptation to climate change and variability. In: Natural Hazards 50 (2): 211-233.
DECISION 1719/QD-TTG (04 October 2011): Decision of the Prime Minister regarding evaluation criteria for approval of priority projects to support the response to climate change. Hanoi.
DECISION42/2001/QD-UB (26 April 2001): Decision of the People’s Committee of Can Tho Province to approve the detailed planning of An Lac Ward (scale 1/500). Can Tho.
DELGADO, J; APEL, H & B MERZ (eds.) (2009): Hydrological change in the Mekong river - trends and variability,. European Geoscience Union Annual Assembly, Vienna, Austria.
DESSAI, S; ADGER, WN; HULME, M; TURNPENNY, J; KÖHLER, J & R WARREN (2004): Defining and experiencing dangerous climate change. In: Climatic Change 64 (1): 11‐25.
DFID (1999): Sustainable livelihoods guidance sheets. DOLAN, A; SMIT, B; SKINNER, MW; BRADSHAW, B & C BRYANT (2001): Adaptation to Climate Change in Agriculture:
Evaluation of Options. Occasional papers in geography 26. DEPARTMENT OF GEOGRAPHY, UNIVERSITY OF
GUELPH. Guelph, Canada. DONRE TRA VINH (2012): Evaluation of the impacts of climate change on the socio-environmental situation in Tra
Vinh province. Báo cáo đánh giá tác động của BĐKH lên kinh tế-xã hội tỉnh Trà Vinh và đề xuất các giải pháp ứng phó. DEPARTMENT FOR NATURAL RESOUCES AND THE ENVIRONMENT (DONRE) TRA VINH. Tra Vinh, Vietnam.
EAKIN, H & L BOJÓRQUEZ-TAPIA (2008): Insights into the composition of household vulnerability from multicriteria decision analysis. In: Global Environmental Change 18 (1): 112‐127.
ERIKSEN, S & K BROWN (2011): Sustainable adaptation to climate change. In: Climate and Development 3 (1): 3-6. FORTIER, F (2010): Taking a climate chance: A procedural critique of Vietnam's climate change strategy. In: Asia
Pacific Viewpoint 51 (3): 229-247. GALLOPIN, GC (2006): Linkages between vulnerability, resilience, and adaptive capacity. In: Global Environmental
Change 16 (3): 293‐303. GAMPER, CD; THÖNI, M & H WECK-HANNEMANN (2006): A conceptual approach to the use of Cost Benefit and Multi
Criteria Analysis in natural hazard management. In: Natural Hazards and Earth System Science 6: 293-302. GARSCHAGEN, M (2013): Risky change? Dynamics in vulnerability and adaptation to natural hazards between
transformation and climate change in Can Tho City, Vietnam (PhD Thesis). University of Cologne. Successfully defended in October 2013.
GEF EVALUATION OFFICE (2007): GEF Impact Evaluation. Final Report on a Proposed Approach to GEF Impact Evaluation. Impact Evaluation Information Document 2. GLOBAL ENVIRONMENT FACILITY (GEF) EVALUATION
OFFICE. New York. GIZ (2011August 2011): Making Adaptation Count. Concepts and Options for Monitoring and Evaluation of Climate
Change Adaptation. DEUTSCHE GESELLSCHAFT FÜR INTERNATIONALE ZUSAMMENARBEIT. Eschborn, Germany. GIZ (2014): Monitoring and Evaluating Adaptation at Aggregated Levels: A Comparative Analysis of Ten Systems.
DEUTSCHE GESELLSCHAFT FÜR INTERNATIONALE ZUSAMMENARBEIT. Eschborn, Germany. GOV (GOVERNMENT OF VIETNAM) (2007): National Strategy for Natural Disaster Prevention, Response and
Mitigation to 2020. No: 172/2007/QĐ-TTg. GOV (GOVERNMENT OF VIETNAM) (2008): National Target Program to Respond to Climate Change. NTP-RCC. GROTHMANN, T & A PATT (2005): Adaptive capacity and human cognition: the process of individual adaptation to
climate change. In: Global Environmental Change in Alpine Regions: Impact und Mitigation 15 (3): 199‐213. GROTHMANN, T & F REUSSWIG (2006): People at Risk of Flooding: Why Some Residents Take Precautionary Action
While Others Do Not. In: Natural Hazards 38 (1-2): 101-120. GSO (2012): Results of the 2011 Rural, Agricultural and Fishery Census. GENERAL STATISITICS OFFICE VIETNAM.
Hanoi. GSO (2013): Statistical handbook of Vietnam 2010. GENERAL STATISITICS OFFICE VIETNAM. Hanoi.
http://www.mpi.gov.vn/portal/page/portal/mpi_en/3094/30946?p_page_id=417757&p_cateid=417268&item_id=21070584&p_details=1.
HASHIMOTO, T (2001): Environmental issues and recent infrastructure development in the Mekong Delta. Review, analysis and recommendations with particular reference to large-scale water control projects and the development of coastal areas. Working Paper Series 4. AUSTRALIAN MEKONG RESOURCE CENTRE; UNIVERSITY OF
Abschlussbericht für den Projektträger Jülich, Projekt WISDOM II, 10/2010 – 02/2014
178
SYDNEY. Sydney. HSIEH, H & SE SHANNON (2005): Three approaches to qualitative content analysis. In: Qualitative health research
15 (9): 1277‐1288. HUITEMA, D; JORDAN, A; MASSEY, E; RAYNER, T; ASSELT, H; HAUG, C; HILDINGSSON, R; MONNI, S & J STRIPPLE (2011):
The evaluation of climate policy: theory and emerging practice in Europe. In: Policy Sciences 44 (2): 179-198. IISD; SEI; IUCN & INTERCOOPERATION (20094): CRiSTAL: Community-based Risk Screening Tool – Adaptation and
Livelihoods. INTERNATIONAL INSTITUTE FOR SUSTAINABLE DEVELOPMENT. Winnipeg, Canada. Institute of Architecture and Urban Planning (2011): Evaluation report on the adjustment of general planning for
Can Tho City to 2030. Ho Chi Minh City. IPCC (2012): Managing the Risks of Extreme Events and Disasters to Advance Climate Change Adaptation.
Special Report of the Intergovernmental Panel on Climate Change. (Cambridge University Press). Cambridge, New York.
JACOB, J & K MEHIRIZ (2012): Elements of a frame of reference for evaluating adaptation to climate change: The RAC-Québec case. Research Report. CREXE CENTRE DES RECHERCHE ET D'EXPERTISE EN EVALUATION. Québec, Canada.
JOHNSON, RB & AJ ONWUEGBUZIE (2004): Mixed methods research: A research paradigm whose time has come. In: Educational researcher 33 (7): 14‐26.
KAZAMA, S; MUTO, Y; NAKATSUJI, K & K INQUE (2002): Study on the 2000 Flood in the Lower Mekong by Field Survey and Numerical Simulation. JAPAN SOCIETY OF CIVIL ENGINEERS. Tokyo.
KELLE, U (2008): Die Integration qualitativer und quantitativer Methoden in der empirischen Sozialforschung: Theoretische Grundlagen und methodologische Konzepte. (VS Verlag für Sozialwissenschaften). Wiesbaden, Germany.
KLINKE, A & O RENN (2002): A new approach to risk evaluation and management: risk-based, precaution-based, and discourse-based strategies. In: Risk Analysis 22 (6): 1071‐1094.
KORF, B (ed.) (2002): Rural livelihoods at risk: Land use and coping strategies of war-affected communities in Sri Lanka. Deutscher Tropentag (Conference on International Agricultural Research for Development). 9-11 October 2002, Witzenhausen, Germany.
KORT, IAT & MJ BOOIJ (2007): Decision making under uncertainty in a decision support system for the Red River. In: Environmental Modelling & Software 22 (2): 128-136.
KRÖMKER, D & H MOSLER (2002): Human vulnerability: factors influencing the implementation of prevention and protection measures: an agent based approach. In: STEININGER, KW & H WECK-HANNEMANN (eds.): Global environmental change in Alpine regions: Recognition, impact, adaptation and mitigation. Cheltenham, UK, Northampton, USA: 93‐112.
KRUKER, VM & J RAUH (2005): Arbeitsmethoden der Humangeographie. (Wissenschaftliche Buchgesellschaft). Darmstadt, Germany.
KÜNZER, C; GUO, H; HUTH, J; LEINENKUGEL, P; LI, X & S DECH (2013): Flood Mapping and Flood Dynamics of the Mekong Delta: ENVISAT-ASAR-WSM Based Time Series Analyses. In: Remote Sensing 5 (2): 687‐715.
KURUPPU, N & D LIVERMAN (2011): Mental preparation for climate adaptation: The role of cognition and culture in enhancing adaptive capacity of water management in Kiribati. In: Global Environmental Change 21 (2): 657-669.
LAMHAUGE, N; LANZI, E & S AGRAWALA (2012): Monitoring and Evaluation for Adaptation: Lessons from Development Co-operation Agencies. OECD Environment Working Papers 38. OECD ORGANISATION FOR
ECONOMIC CO-OPERATION AND DEVELOPMENT (ACCESSED: 23 Aug 2013). LE ANH TUAN & S CHINVANNO (2011): Climate Change in the Mekong River Delta and Key Concerns on Future
Climate Threats. In: STEWART, MA & PA COCLANIS (eds.): Environmental Change and Agricultural Sustainability in the Mekong Delta. Dordrecht, Heidelberg, London, New York: 207-217.
LE ANH TUAN; CHU THAI HOANH; MILLER, F & BACH TAN SINH (2007): Chapter 1: Flood and Salinity Management in the Mekong Delta, Vietnam. In: TRAN THANH BE; BACH TAN SINH & F MILLER (eds.): Literature Analysis. Challenges to Sustainable Development in the Mekong Delta: Regional and National Policy Issues and Research Needs. Bangkok.
LE THI VIET HOA; NGUYEN HUU NHAN; WOLANSKI, E; TRAN THANH CONG & H SHIGEKOA (2007): The combined impact on the flooding in Vietnam‘s Mekong River delta of local man-made structures, sea level rise, and dams upstream in the river catchment. In: Estuarine, Coastal and Shelf Science 71 (1-2): 110‐116.
LINKOV, I; SATTERSTROM, FK; KIKER, G; BATCHELOR, C; BRIDGES, T & E FERGUSON (2006): From comparative risk assessment to multi-criteria decision analysis and adaptive management: Recent developments and applications. In: Environment International 32 (8): 1072-1093.
MCELWEE, P (2010): The social dimensions of adaptation of climate change in Vietnam. Discussion Paper 17. WORLD BANK. Washington.
MCKENZIE HEDGER, M; MITCHELL, T; LEAVY, J; GREELEY, M; DOWNIE, A & L HORROCKS (2008): Desk Review: Evaluation of Adaptation to Climate Change from a Development Perspective. INSTITUTE OF
DEVELOPMENT STUDIES (IDS). London (accessed: 29 Oct 2012). MECHLER, R. (2008): The Cost-Benefit Analysis Methodology. Edited by M. Moench, E. Caspari, A. Pokhrel. From
Risk to Resilience Working Paper, 1. ISET; ISET-Nepal; ProVention. Kathmandu. MENDOZA, G & H MARTINS (2006): Multi-criteria decision analysis in natural resource management: A critical review
of methods and new modelling paradigms. In: Forest Ecology and Management 230 (1-3): 1-22. MONRE (2012): Climate Change Scenarios (Vietnamese). MINISTRY OF NATURAL RESOURCES AND ENVIRONMENT
VIETNAM. Hanoi. MONTELLO, D & P SUTTON (2006): An introduction to scientific research methods in geography. (Sage Publications).
Abschlussbericht für den Projektträger Jülich, Projekt WISDOM II, 10/2010 – 02/2014
179
Thousand Oaks, USA. NELSON, D (2009): Conclusions: Transforming the world. In: ADGER, NW; LORENZONI, I & KL O'BRIEN (eds.):
Adapting to climate change. Thresholds, Values, Governance. Cambridge, New York: 491-500. NGO THI PHUONG LAN (2011): From Rice to Shrimp: Ecological Change and Human Adaptation in the Mekong
Delta of Vietnam. In: STEWART, MA & PA COCLANIS (eds.): Environmental Change and Agricultural Sustainability in the Mekong Delta. Dordrecht, Heidelberg, London, New York: 271-285.
NGUYEN QUANG TUYEN (2011): Diversification Strategies of Livelihood of Khmer and Kinh Farmers in Mekong Delta since 1993 Land Reform. PhD. CHIANG MAI UNIVERSITY.
NGUYEN THANH BINH (2010): Vulnerability and adaptation to salinity intrusion in the coastal province of Tra Vinh, Vietnam. In: SETIADI, N; BIRKMANN, J & P BUCKLE (eds.): Disaster Risk Reduction and Climate Change Adaptation: Case Studies from South and Southeast Asia. SOURCE - Studies of the University: Research,Counsel,Education 14/2010. Bonn: 33-39.
NICHOLLS, N (1999): Cognitive illusions, heuristics, and climate prediction. In: Bulletin-American Meteorological Society 80: 1385‐1398.
O'BRIEN, KL; ERIKSEN, S; SCHJOLDEN, A & L NYGAARD (2004): What's in a word? Conflicting interpretations of vulnerability in climate change research. CICERO Working Paper 2004:04. Oslo (accessed: 02 Nov 2012).
O'CONNOR, RE; BARD, RJ & A FISHER (1999): Risk Perceptions, General Environmental Beliefs, and Willingness to Address Climate Change. In: Risk Analysis 19 (3): 461-471.
OSTROM, E (2007): A diagnostic approach for going beyond panaceas. In: Proceedings of the National Academy of Sciences of the United States of America 104 (39): 15181-15187.
OXFAM (2008): Evaluation of Participatory Disaster Preparation and Mitigation Project in Tien Giang and Dong Thap Provinces, Vietnam. Full Report Oxfam GB Programme Evaluation. OXFAM GB. London.
PAHL-WOSTL, C (2009): A conceptual framework for analysing adaptive capacity and multi-level learning processes in resource governance regimes. In: Global Environmental Change 19 (3): 354‐365.
PAHL-WOSTL, C; HOLTZ, G; KASTENS, B & C KNIEPER (2010): Analyzing complex water governance regimes: the Management and Transition Framework. In: Environmental Science & Policy 13 (7): 571-581.
PC DON XUAN (2011): Report about the land use planning until 2020 and the plan for the land use for the first five year period from 2011 to 2015 of Don Xuan Commune, Tra Cu District (draft report). Báo cáo thuyết minh tổng hợp quy hoạch sử dụng đất đến năm 2020, kế hoạch sử dụng đất 5 năm đầu kỳ (2011-2015) Xã Đôn Xuân, huyện Trà Cú (Dự thảo). PEOPLE'S COMMITTEE DON XUAN COMMUNE. Don Xuan Commune, Vietnam.
PC TRA VINH (2011): Socio-economic report in 2010 and plan for 2011. Báo cáo kết quả thực hiện nhiệm vụ phát triển kinh tế xã hội năm 2010 và kế hoạch 2011. Tra Vinh, Vietnam. http://www.travinh.gov.vn/wps/portal/ (accessed: 10 Jul 2013).
PELLING, M (2011): Adaptation to climate change. From resilience to transformation. (Routledge). Abingdon, Oxon, England, , New York.
PHAM CONG HUU (2011): Planning and Implementation of the Dyke Systems in the Mekong Delta, Vietnam. PhD Thesis. University of Bonn.
PHAM THI MAI THY; RAGHAVAN, V & S MASUMOTO (2011): Detection of Landcover Change and its Impact on Flood Inundation in Central Can Tho City, Vietnam (カントー市(ベトナム)の土地被覆変化抽出と洪水氾濫への影
響評価). In: Journal of Informatics 8 (2). REINDERS, H & H DITTON (2011): Überblick Forschungsmethoden. In: REINDERS, H; DITTON, H; GRÄSEL, C & B
GNIEWOSZ (eds.): Empirische Bildungsforschung. Wiesbaden, Germany: 45‐51. RENN, O (2008): Concepts of Risk: An Interdisciplinary Review Part 1: Disciplinary Risk Concepts. In: GAIA -
Ecological Perspectives for Science and Society 17: 50-66. ROGERS, RW (1975): A Protection Motivation Theory of Fear Appeals and Attitude Change1. In: The Journal of
Psychology 91 (1): 93-114. SCHERAGA, JD & AE GRAMBSCH (1998): Risks, opportunities and adaptation to climate change. In: Climate
Research 11: 85‐95. SCHUTZ, A (1962): Collected papers. Volume 1. The problem of social reality. (Martinus Nijhoff). The Hague. SCHWAB, M (forthcoming): Value and nature of risk-related strategies - An evaluation of rural coping and
adaptation in response to changing water-related risks in the Vietnamese Mekong Delta. PhD. UNIVERSITY OF
BONN. SHEERAN, P; WEBB, TL & PM GOLLWITZER (2005): The interplay between goal intentions and implementation
intentions. In: Personality and Social Psychology Bulletin 31 (1): 87‐98. SILVA VILLANUEVA, P (2011): Learning to ADAPT: monitoring and evaluation approaches in climate change
adaptation and disaster risk reduction – challenges, gaps and ways forward. SCR Discussion Paper 9. IDS STRENGTHENING CLIMATE RESILIENCE (SCR) - INSTITUTE OF DEVELOPMENT STUDIES. Brighton, UK.
SJÖBERG, L (2003): Risk perception is not what it seems: The psychometric paradigm revisited. In: ANDERSSON, K (ed.): VALDOR 2003. VALues in Decisions On Risk. Proceedings. 9 - 13 June 2003. Stockholm: 14-29.
SLOVIC, P (2010): The Psychology of Risk. In: Saúde e Sociedade 19 (4): 731-747. SLOVIC, P; FISCHHOFF, B & S LICHTENSTEIN (1982): Why Study Risk Perception? In: Risk Analysis 2 (2): 83-93. SLOVIC, P; KUNREUTHER, H & G WHITE (2000): Decision Processes, Rationality and Adjustments to Natural
Hazards. In: SLOVIC, P (ed.): The Perception of Risk. Risk, Society and Policy Series. London, Sterling: 1‐31. SMIT, B; BURTON, I; KLEIN, R & J WANDEL (2000): An anatomy of adaptation to climate change and variability. In:
Climatic Change 45 (1): 223‐251. SMIT, B; BURTON, I; KLEIN, R & R STREET (1999): The science of adaptation: a framework for assessment. In:
Mitigation and Adaptation Strategies for Global Change 4 (3): 199‐213. SMITH, JB; VOGEL, JM & JEC III (2009): An architecture for government action on adaptation to climate change. An
Abschlussbericht für den Projektträger Jülich, Projekt WISDOM II, 10/2010 – 02/2014
180
editorial comment. In: Climatic Change 95 (1-2): 53-61. STERN, NH (2007): The economics of climate change: the Stern review. (Cambridge University Press). London. THYWISSEN, K (2006): Components of Risk: A comparative glossary. SOURCE - Studies of the University:
Research,Counsel,Education 2/2006. Bonn. TRA VINH ECONOMIC ZONE AUTHORITY (2012): Decision on approval of Dinh An economic zone to 2030. Quyết định
về việc phê duyệt đồ án quy hoạch chung xây dựng khu kinh tế Định An đến năm 2030. Tra Vinh, Vietnam. TRAN THI THU TRANG (2004): Vietnam's rural transformation. In: MCCARGO, D (ed.): Rethinking Vietnam. London,
New York: 110-124. TRUONG NGOC THUY (2012): Poverty reduction strategies in an ethnic minority community: Multiple definitions of
poverty among Khmer villagers in the Mekong Delta, Vietnam. In: Asian Social Science 8 (6): p196. TURNER, BL; KASPERSON, RE; MATSON, PA; MCCARTHY, JJ; CORELL, RW; CHRISTENSEN, L; ECKLEY, N; KASPERSON,
JX; LUERS, A; MARTELLO, ML & OTHERS (2003): A framework for vulnerability analysis in sustainability science. In: Proceedings of the National Academy of Sciences 100 (14): 8074-?8079.
UNFCCC (2010): Synthesis report on efforts undertaken to monitor and evaluate the implementation of adaptation projects, policies and programmes and the costs and effectiveness of completed projects, policies and programmes, and views on lessons learned, good practices, gaps and needs. Nairobi work programme on impacts, vulnerability and adaptation to climate change. UNFCCC UNITED NATIONS FRAMEWORK CONVENTION
FOR CLIMATE CHANGE. Bonn, Germany. UN-ISDR (2004): Living with risk. A global review of disaster reduction initiatives. Volume I. (United Nations
International Strategy for Disaster Reduction (UN-ISDR)). New York, Geneva. VEDUNG, E (2008): Public policy and program evaluation. (Transaction Publishers). VO THANH DANH & S MUSHTAQ (2011): Living with Floods: An Evaluation of the Resettlement Program of the
Mekong Delta of Vietnam. In: STEWART, MA & PA COCLANIS (eds.): Environmental Change and Agricultural Sustainability in the Mekong Delta. Dordrecht, Heidelberg, London, New York: 181-204.
VO TONG XUAN & S MATSUI (eds.) (1998): Development of Farming Systems in the Mekong Delta. Ho Chi Minh City.
VO VAN TUAN (2013): Vulnerability assessment of different socio-economic groups to floods in the rural areas of the Mekong Delta of Vietnam. PhD Thesis. University of Bonn.
WERLEN, B (1993): Society, action and space: an alternative human geography. translated by Gayna Walls. (Routledge). London.
WERLEN, B (19973): Gesellschaft, Handlung und Raum. Grundlagen handlungstheoretischer Sozialgeographie. (Steiner). Stuttgart.
WISNER, B; BLAIKIE, P; CANNON, T & I DAVIES (20042): At Risk: Natural Hazards, People´s Vulnerability and Disasters. (Routledge). London, New York.
WORLD BANK (1999): Project appraisal document on a proposed credit of SDR 72.8 Million to the Socialist Republic of Vietnam for the Mekong Delta Water Resources Project. Report No: 18732-VN. WORD BANK. Washington.
WORLD BANK (2010): Economics of Adaptation to Climate Change. Vietnam. WORLD BANK. Washington. WRIGHT, GH VON (1971): Explanation and Understanding. (Routledge and Kegan Paul). London.
Abschlussbericht für den Projektträger Jülich, Projekt WISDOM II, 10/2010 – 02/2014
181
Gegenüberstellung mit den ursprünglichen Zielen (besonders Arbeits- 2.1.8und Zeitplanung)
2.1.8.1 Arbeitsplan
Der in der Vorhabensbeschreibung angestrebte Arbeitsplan konnte weitestgehend wie geplant umgesetzt werden. Änderungen in der Fragestellung und Methodik waren nicht nötig. Wie im ersten und zweiten Zwischenbericht im Detail dargelegt, konnte allerdings die Anpassungsevaluierung im Verwundbarkeitsprofil des ländlichen Dong Thap nicht durchgeführt werden, da für diese Provinz die ursprünglich zugesagte Forschungsgenehmigung nicht erteilt wurde. Die genauen Gründe hierfür lassen sich nur bedingt durchblicken. Vietnamesische Projektpartner der Can Tho University teilten uns mit, dass das lokale Volkskomitee aufgrund der in den letzten Jahren stark gestiegenen Anzahl an Forschungsprojekten in Dong Thap momentan in den meisten Fällen keine Genehmigungen mehr für Forschungsvorhaben in dieser Provinz erteilt. Aufgrund der geringeren Ressourcen an Feldarbeitsmöglichkeiten im Vergleich zur ersten Projektphase (Reduzierung von drei auf zwei eingegliederte Doktorarbeiten) fiel der Wegfall des Untersuchungsgebietes Dong Thap aber nicht weiter ins Gewicht. Dies erlaubte sogar – im Gegenteil – der im ländlichen Raum arbeitenden Doktorandin, sich tiefergehend mit dem Untersuchungsgebiet in Tra Vinh zu beschäftigen, was der Analyse der überaus komplexen Risikolage dort zuträglich war. Auch durch die frühe Anpassung des Arbeitsplanes im Projektablauf konnte der Arbeitsplan für die anderen Untersuchungsgebiete (Tra Vinh und Can Tho) voll umgesetzt werden.
2.1.8.2 Zeitplan
Der angestrebte Zeitplan der Risiko-, Verwundbarkeits- und Anpassungsforschung in WISDOM II konnte eingehalten werden. Die Datensammlung in den Untersuchungsgebieten wurde plangerecht durchgeführt. Die Auswertung der verschiedenen Sekundär- und Primärdaten zu Verwundbarkeitsmustern und Anpassungsmaßnahmen wurde zeitgemäß durchgeführt. Auch die Entwicklung und Anwendung der Evaluierungsmethodik konnte wie geplant durchgeführt und abgeschlossen werden. Die Ergebnisse konnten bereits in zahlreichen Publikationen und wissenschaftlichen Fachvorträgen vor internationalem Publikum vorgestellt werden (s. 2.6). Beide von UNU-EHS betreuten Doktorarbeiten sind weit fortgeschritten und stehen zum Zeitpunkt der Berichterstattung kurz vor der Einreichung bzw. Verteidigung. Eine der Doktorandinnen konnte zu Beginn des Projektes nur mit leichter zeitlicher Verzögerung von zwei Monaten rekrutiert werden (s. frühere Zwischenberichte). Dieser Rückstand konnte weitestgehend aufgeholt werden, so dass die Fertigstellung der Arbeit nicht in Gefahr steht.
2.2 Zahlenmäßiger Nachweise
Da der zahlenmäßige Nachweis gemeinschaftlich für den gesamten Unterauftrag von UNU-EHS geleistet wird (d.h. für die Pestizidanalysen, die Risiko- und Anpassungsforschung sowie das Doktorandenprogramm gemeinschaftlich) wird hier auf den gemeinsamen Finanzbericht am Ende des Berichtes verwiesen.
2.3 Notwendigkeit und Angemessenheit der geleisteten Arbeit
Aus der obigen, detailierten Darlegung der einzelnen Arbeitsschritte und Analysekomponenten (vgl. 2.1) geht deutlich der erhebliche Umfang der geleisteten Arbeit hervor. Die Notwendigkeit und Angemessenheit dieses Arbeitsumfangs ergibt sich aus der zu Beginn dargelegten empirischen sowie theoretisch-konzeptionellen Innovationskraft der geleisteten Arbeit im Bereich der bislang wenig beachteten Anpassungsevaluierung sowie

Abschlussbericht für den Projektträger Jülich, Projekt WISDOM II, 10/2010 – 02/2014
182
der schwierigen Bedingungen von empirischer Sozialforschung in der zentralistischen administrativen Struktur Vietnams. Die beiden Untersuchungsgebiete (Can Tho und Tra Vinh) wurden je von einer Doktorandin bearbeitet (unter Betreuung von PD Dr. Jörn Birkmann). Integrierende Arbeiten zur Verknüpfung der Untersuchungsgebiete sowie zur Zusammenführung der Verwundbarkeits- und Anpassungskomponenten und gemeinsamen Weiterentwicklung von übergreifenden Risikoanalysen mit anderen Projektpartnern wurden von einem wissenschaftlichen Mitarbeiter durchgeführt. Dieser hatte zudem die Rolle der administrativen und inhaltlichen Unterstützung der Doktorandinnen sowie der inhaltlichen Verwertung gemeinsamer Ergebnisse inne. Darüber hinaus waren alle beteiligten Mitarbeiter im Bereich des weiteren Ausbaus und der Pflege der wissenschaftlichen Netzwerke sowie der Verbreitung von Handlungsempfehlungen aktiv.
2.4 Fortschreibung des Verwertungsplans
Die Ergebnisse der Verwundbarkeits- und Anpassungsforschung konnten bereits zum Zeitpunkt der Berichterstattung in vielfältiger Weise kommuniziert und verwertet werden:
Zum einen wurden sie neben den Präsentationen auf projekteigenen Workshops und Konferenzen, auf zahlreichen nationalen und internationalen Fachtagungen sowie in wissenschaftlichen Publikationen vorgestellt (vgl. 2.6 für eine detailierte Publikations- und Vortragsliste).
Daneben fanden die Forschungsergebnisse und die daraus abgeleiteten Handlungsempfehlungen direkten Eingang in eine Reihe zentraler Gutachten und Berichte von Organisationen und Plattformen des Policy-Science-Interface auf globaler Ebene. Die Kommunikation der Ergebnisse in diesen Organen ist von hoher Bedeutung und Reichweite, da sie Entscheidungsfindungsprozesse und Paradigmen auf höchster Ebene beeinflussen. Zu nennen sind in diesem Zusammenhang besonders die Platzierung einer Can Tho City-spezifischen Fallstudie im Global Assessment Report 2013, herausgegeben von der United Nations International Strategy for Disaster Risk Reduction (UNISDR), sowie die Präsentation von Projektergebnissen auf einer unter starker ministerialer Beteiligung in Hanoi abgehaltenen Sonderveranstaltung anlässlich des vom International Panel for Climate Change (IPCC) verfassten Special Report on Managing the Risks of Extreme Events and Disasters to Advance Climate Change Adaptation (SREX). Zudem werden die bislang publizierten Ergebnisse im nächsten großen Sachstandsbericht (Fifth Assessment Report) des IPCC rezipiert, wobei sie nicht nur direkt zum übergeordneten wissenschaftlichen Erkenntnisgewinn beitragen, sondern auch durch den Multiplikatoreffekt des IPCC in ihrer Sichtbarkeit aufgewertet werden.
Des Weiteren fanden die Ergebnisse der Verwundbarkeits- und Anpassungsforschung in WISDOM direkten Eingang in verschiedene Lehrmittel in deutschen, vietnamesischen und internationalen Bachelor- und Masterstudiengängen, z.B. an der Universität zu Bonn, der Technischen Hochschule Dortmund, der Can Tho University oder der Maastricht University. Auf diese Weise können die innovativen Projektergebnisse direkt an die nächste Generation von Entscheidungsträgern und Wissenschaftlern vermittelt werden.
Außerdem sind die zahlreichen Workshops mit Entscheidungsträgern in Vietnam zu nennen, in denen die Ergebnisse vorgestellt und diskutiert sowie entwickelte Methodiken vermittelt wurden.
Darüber hinaus sind die Ergebnisse durch die Projekthomepage einer breiten Öffentlichkeit zugänglich.
Abgeleitete Produkte sind außerdem über das Informationssystem verfügbar und finden somit auch über diesen Weg Eingang in Planungs- und Entscheidungsfindungsprozesse im IWRM im Mekongdelta sowie in die wissenschaftliche Diskussion in Vietnam und darüber hinaus.
Abschlussbericht für den Projektträger Jülich, Projekt WISDOM II, 10/2010 – 02/2014
183
Um diese vielschichtigen Verwertungen der Ergebnisse voranzutreiben wurde darüber hinaus über den gesamten Projektzeitraum ein ausgeprägtes Netzwerk an Partnern aus Wissenschaft und Anwendung aufgebaut und intensiver Austausch mit diesen Stellen gepflegt. Eine Auswahl der wichtigsten Partner sind der folgenden englischsprachigen Aufstellung zu entnehmen: Vietnamese Governmental Organisations: People’s Committees in all case study areas at Province, District and Commune / Ward
level and special departments and committees under these People’s Committees at all three levels, the for the purpose of constant exchange to discuss research objectives, collect governmental documents and data, discuss fieldwork permissions, and explore stakeholders’ perspectives through focus group discussions, workshops and expert interviews. Experts included in particular decision makers from the:
Departments for Natural Resources and the Environment, Departments for Agriculture and Rural Development, Departments for Construction, Departments for Labour, Invalids and Social Affairs, Departments of Finance, Committees for Flood an Storm Control, Centres for Land Fund Development,
Vietnamese Institute of Architecture, Urban and Rural Planning (VIAP) under the Ministry of Construction: Exchange of master plans and discussion of requirements for urban and rural spatial planning imposed by natural hazards and climate change.
Vietnamese and International Research Institutions: Mekong Delta Development Institute (MDI) under Can Tho University: Being official
project member and the most important partner for the empirical research. There has been a strong exchange with staff members and students from MDI not only for joint activities like the household surveys but also for workshops and publications.
Southern Institute of Sustainable Development (SISD), HCMC: Exploration of future research needs in particular in the field of climate change adaptation and rural-urban linkages.
Vietnam National University Ho Chi Minh City, University of Social Sciences and Humanities, Faculty of Geography: Joint workshops and joint fieldtrips in the framework of teaching activities.
College of Environment and Natural Resources under Can Tho University: Strong exchange and joint fieldwork activities in the field of climate change adaptation science.
Mekong Delta Institute under the Delta Research and Global Observation Network (DRAGON): Joint activities at workshops and conferences.
Brandenburgische Technische Universität (BTU), Cottbus: BTU was one of the main partners in the BMBF sponsored Megacity-Project in HCMC. As this projects shares similar interests to the adaptation component within WISDOM, there has been exchange on methodologies and conceptual approaches.
International Development Organisations: UNDP Vietnam: Close exchange on lessons learned and activities in the fields of disaster
risk management and climate change adaptation. UN-HABITAT, Hanoi: Joint assessment of urban climate change adaptation governance
in Vietnam. Deutsche Gesellschaft für Internationale Zusammenarbeit (GIZ): Exchange on activities
in the Mekong Delta, particularly in Tra Vinh.
Abschlussbericht für den Projektträger Jülich, Projekt WISDOM II, 10/2010 – 02/2014
184
2.5 Sind inzwischen von dritter Seite Ergebnisse bekannt geworden, die für die Durchführung des Vorhabens relevant sind?
Der Bereich der Anpassungsforschung zeichnet sich vor allem in den letzten Jahren durch verstärkte Forschungsintensität aus, besonders im Kontext des globalen Klimawandels. Daher werden fortlaufend neue Beiträge publiziert, die für das hier angesprochene Forschungsfeld im Allgemeinen von Relevanz sind. Im Speziellen allerdings findet die Evaluierung von unterschiedlichen Anpassungsoptionen und –entscheidungen weiterhin wenig Beachtung, so dass in diesem Bereich trotz seiner zentralen Bedeutung (vgl. 2.1) nach bestem Wissen der Antragsteller keine Ergebnisse von dritter Seite publiziert wurden, die sich detailiert mit der Kernfrage der hier geleisteten Forschung beschäftigen. Haben sich die Aussichten für die Erreichung der Ziele des Vorhabens innerhalb des angegebenen Berichtszeitraums gegenüber dem ursprünglichen Antrag geändert (Begründung)? Alle Ziele des Vorhabens konnten wie angestrebt erreicht werden. Sind oder werden Änderungen in der Zielsetzung notwendig? Es wurden keine Änderungen der Zielsetzung nötig.
2.6 Erfolgte und geplante Veröffentlichungen
Anknüpfend an die zahlreichen Veröffentlichungen aus dem Verwundbarkeits-Assessment der ersten Projektphase (mit Publikationsdatum von 2009 und älter; s. Endbericht Phase I), konnten auch die Ergebnisse aus der Risikoforschung und Anpassungsevaluierung aus WISDOM II in vielfältiger Weise verbreitet und verwertet werden. Dabei sind neben der Präsentation auf projekteigenen Formaten – wie den WISDOM Scientific Seminars, dem Informationssystem oder der Projekt-Homepage – vor allem die zahlreichen wissenschaftlichen Veröffentlichungen in angesehenen Publikationsorganen (v.a. ‚Peer Reviewed Journals with SCI Indexing‘ sowie ‚Reviewed Books‘) sowie die Vorträge auf international renommierten Konferenzen zu nennen. Die folgenden Publikationen sind bereits erschienen:
2014
BIRKMANN, J., GARSCHAGEN, M. & SETIADI, N. (2014): New Challenges for Adaptive Urban Governance in Highly Dynamic Environments: Revisiting Planning Systems and Tools for Adaptive and Strategic Planning. In: Urban Climate, DOI: 10.1016/j.uclim.2014.01.006.
BIRKMANN, J., GARSCHAGEN, M., FERNANDO, N., HETTIGE, S., TUAN, V.V. & OLIVER-SMITH, A. (2014): Relocation: Reduction in Exposure – Increase in Susceptibility? Measuring Dynamics of Vulnerability Before, During and After Relocation Processes in the Context of Disasters and Natural Hazards .- In: BIRKMANN, J. (ed.). Measuring Vulnerability to Natural Hazards. Towards Disaster Resilient Societies. 2nd Edition. UNU-Press: 505-550.
2013
BIRKMANN, J., CUTTER, S., ROTHMAN, D., WELLE, T., GARSCHAGEN, M., VAN RUIJVEN, B., O’NEILL, B., PRESTON, B., KIENBERGER, S., CARDONA, O., SIAGIAN, T., HIDAYATI, D., SETIADI, N., BINDER, C., HUGHES, B. & PULWARTY, R. (2013): Scenarios for Vulnerability: Opportunities and Constraints in the Context of Climate Change and Disaster Risk. In: Climatic Change. Online First, DOI 10.1007/s10584-013-0913-2

Abschlussbericht für den Projektträger Jülich, Projekt WISDOM II, 10/2010 – 02/2014
185
GARSCHAGEN, M. (2013): Resilience and Organisational Institutionalism from a Cross-Cultural Perspective – An Exploration based on Urban Climate Change Adaptation in Vietnam.- In: Natural Hazards, 67(1): 25-46.
SUDMEIER-RIEUX, K., FRA PALEO, U., GARSCHAGEN, M., ESTRELLA, M., RENAUD, F.G., JABOYEDOFF, M. (2013): Toward Risk-Sensitive Land Use Planning. Case Studies from Nepal, Spain and Vietnam.- Background Paper to the 2013 Global Assessment Report on Disaster Risk Reduction. Geneva.
2012
BIRKMANN, J., GARSCHAGEN, M., TUAN, V.V. & BINH, N.T. (2012): Vulnerability, Coping and Adaptation to Water Related Hazards in the Vietnamese Mekong Delta.- In: RENAUD, F. & KÜNZER, C. (eds.) The Mekong Delta System - Interdisciplinary Analyses of a River Delta. Springer: 245-289.
GARSCHAGEN, M., REVILLA-DIEZ, J., NHAN, D.K. & KRAAS, F. (2012): Socio-Economic Development in the Mekong Delta: Between the Prospects for Progress and the Realms of Reality.- In: RENAUD, F. & KÜNZER, C. (eds.) The Mekong Delta System - Interdisciplinary Analyses of a River Delta. Springer: 83-132.
2011
GARSCHAGEN, M. & KRAAS, F. (2011): Urban Climate Change Adaptation in the Context of Transformation – Lessons Learned from Vietnam.- In: Zimmermann, K. (ed.) Cities and Adaptation to Climate Change. Springer: 131-139.
GARSCHAGEN, M., RENAUD, F. & BIRKMANN, J. (2011): Dynamic Resilience of Peri-Urban Agriculturalists in the Mekong Delta Under Pressures of Climate Change and Socio-Economic Transformation.- In: STEWARD, M. & COCLANIS, P. (eds.): Environmental Change and Agricultural Sustainability in the Mekong Delta. Springer: 141-163.
2010
BINH, N.T. (2010): Vulnerability and adaptation to salinity intrusion in the Mekong delta of Vietnam -- Preliminary findings from Tra Vinh province. SETIADI, N., BIRKMANN, J, & BUCKLE, P. (EDS.): Disaster Risk Reduction and Climate Change Adaptation: Case Studies from South and Southeast Asia. SOURCE, 14: 32-39.
BIRKMANN, J., GARSCHAGEN, M, KRAAS, F. & QUANG, N. (2010): Adaptive Urban Governance: New Challenges for the Second Generation of Urban Adaptation Strategies to Climate Change.- In: Sustainability Science, 5(2): 185-206.
GARSCHAGEN, M. & KRAAS, F. (2010): Assessing Future Resilience to Natural Hazards – The Challenge of Capturing Dynamic Changes under Conditions of Transformation and Climate Change.- In: CUSTER, R., SUTTER, C. & AMMANN, W. (eds.): Proceedings. International Disaster and Risk Conference, IDRC 2010, 30 May – 03 June 2010, Davos: 209-213.
GARSCHAGEN, M. (2010): Opportunities and Challenges of Climate Change Adaptation in High Risk Areas Using the Example of the Mekong Delta, Vietnam.- In: DÖLEMEYER, A., ZIMMER, J. & TETZLAFF, G. (eds.): Risk and Planet Earth. Vulnerability, Natural Hazards, Integrated Adaptation Strategies. Stuttgart: 56-65.
GARSCHAGEN, M. (2010): Potential Humanitarian Crises and Climate Change Adaptation in the Coupled Social-Ecological Systems of the Mekong Delta, Vietnam.- In: SHEN, X., DOWNING, T.E. HAMZA, M. (eds): SOURCE. Tipping Points in Humanitarian Crises: From Hot Spots to Hot Systems. 45-55.

Abschlussbericht für den Projektträger Jülich, Projekt WISDOM II, 10/2010 – 02/2014
186
Die folgenden Publikationen sind akzeptiert und „in print“: GARSCHAGEN, M. (in press): Urban Upgrading and Resettlement of Slum Dwellers in the Mekong Delta
– Long-term Sustainability or Vulnerability Pitfall?- In: KRAAS, F., REVILLA DIEZ, J., GARSCHAGEN, M. & HOA, L.T. (eds.): Mega-Urban Development and Transformation Processes in Vietnam. Lit-Verlag. (accepted, in press).
Die folgenden Publikationen sind in Bearbeitung bzw. Review: SUDMEIER-RIEUX, K., FRA PALEO, U., GARSCHAGEN, M., ESTRELLA, M., RENAUD, F.G., JABOYEDOFF, M.:
Toward Risk-Sensitive Land Use Planning. Case Studies from Nepal, Spain and Vietnam. (currently under review in the ‘International Journal of Disaster Risk Reduction’)
GARSCHAGEN, M.: Risky change? Vietnam’s urban disaster risk governance between climate dynamics and transformation. Manuscript prepared for Submission to Pacific Affairs.
Wissenschafltiche Vorträge: 2014 GARSCHAGEN, M. (2014): Risky Change? Vietnam’s Urban Disaster Risk Governance between Climate
Change Dynamics and Transformation. Invited Oral Presentation. International Workshop on Governing Flooding in Asia’s Urban Transition, 20 January 2014, National University of Singapore, Singapore.
2013 APEL, H., GARSCHAGEN, M., DELGADO, J.M., DUNG, N.V., TUAN, V.V., BING, N.T., BIRKMANN, J. & MERZ B.
(2013): Integrated Flood Risk Assessment of Flood hazard Change and Social Vulnerability.- Oral presentation. Annual Meeting of the European GeoSciences Union, EGU 2013. Vienna, Austria.
APEL, H., GARSCHAGEN, M., DELGADO, J.M., DUNG, N.V., TUAN, V.V., BING, N.T., BIRKMANN, J. & MERZ B. (2013): Integrated flood risk assessment for the Mekong Delta through the combined assessment of flood hazard change and social vulnerability.- Oral presentation. Mekong Environmental Symposium, 05-07 March 2013, Ho Chi Minh City, Vietnam.
GARSCHAGEN, M. (2013): Das Mekong-Delta in Vietnam: Opfer, Profiteur oder Treiber des Globalen Wandels?- Oral Presentation. Vortragsreihe „Globaler Wandel“ der Gesellschaft für Erdkunde zu Köln, 20.06.13, Cologne, Germany.
GARSCHAGEN, M. (2013): Dynamics in Vietnam’s Urban Risk Governance: Lessons for Southeast Asia? Invited Guest Lecture, Yangon University, 19 November 2013, Yangon, Myanmar.
GARSCHAGEN, M. (2013): Risky change? Vietnam’s Urban Disaster Risk Governance Between Climate Dynamics and Transformation. – Oral Presentation. International Conference on Disaster Governance: The Urban Transition in Asia, 07-08 November 2013, Singapore.
GARSCHAGEN, M. (2013): Risky Change? Vietnam’s Urban Risk Governance between Climate Dynamics and Politico-economic Transformation. Invited Oral Presentation. International Seminar of LIPI-ICIAR, 11 November 2013, Jakarta, Indonesia.
KRAUSE, D. (2013): “Evaluating adaptation to foster local DRR. Findings from the Vietnamese Mekong Delta”, presented at the 4th Global Forum on Urban Resilience & Adaptation, 31 May – 2 June 2013, Bonn, Germany.
KRAUSE, D., SCHWAB, M., GARSCHAGEN, M., & BIRKMANN, J. (2013): Evaluation of Climate Change Adaptation Options in the Mekong Delta and Beyond.- Oral presentation. Mekong Environmental Symposium, 05-07 March 2013, Ho Chi Minh City, Vietnam.
Abschlussbericht für den Projektträger Jülich, Projekt WISDOM II, 10/2010 – 02/2014
187
KRAUSE, D.; SCHWAB, M.; GARSCHAGEN, M.; DANH, V.T.; BE, T.N. (2013): Developing a vulnerability-based approach to the evaluation of climate change adaptation options in the Mekong Delta and beyond. Mekong Environmental Symposium, Ho Chi Minh City, 5.-7. March 2013.
SCHWAB, M.; BIRKMANN, J. (2013): Anpassung an Klimawandelfolgen im vietnamesischen Mekongdelta – Ein transdisziplinärer Evaluationsansatz für gerechtere und lokal angepasste Strategien. Geographentag, Passau, 03.-06. October 2013.
2012
BIRKMANN, J. & GARSCHAGEN, M. (2012): Synergies, Benefits, Mismatches and Conflicts between Risk Management, Climate Change Adaptation and Mitigation as well as General Development Trends in Megacities in Coastal Areas.- Oral Presentation. Planet under Pressure. 26-29 March, London, UK.
BIRKMANN, J. & GARSCHAGEN, M. (2012): Vulnerability Scenarios and Development Pathways: Advancing Key Components for Comprehensive Climate Change Risk and Adaptation Science.- Poster Presentation. Planet under Pressure. 26-29 March, London, UK.
BORK-HÜFFER, T., GARSCHAGEN, M. & KRAAS, F. (2012): Pathways and Challenges of Urban Development Under Transformation in China and Vietnam: Commonalities and Differences.- Oral Presentation. Annual Meeting of the Working Group on Southeast Asia of the German Geographic Associations. 12 May 2012, Bochum, Germany.
GARSCHAGEN, M. & BIRKMANN, J. (2012): Adaptive Urban Governance: The need for new ways in urban climate change adaptation.- Oral Presentation. Planet under Pressure. 26-29 March, London, UK.
GARSCHAGEN, M. (2012): Nested response capacities to multiple risks in Vietnamese cities – Empirical lessons for advancing conceptual guidance on risk governance.- Oral Presentation (accepted). 32rd International Geographical, 26-30 August 2012, Cologne, Germany.
GARSCHAGEN, M. (2012): Social and economic tipping points in adaptive capacity – empirical lessons from small scale adaptation.- Oral Presentation. 32rd International Geographical, 26-30 August 2012, Cologne, Germany.
GARSCHAGEN, M. (2012): Tapping into Institutional and Organizational Theory for Understanding Opportunities and Barriers related to Resilience Building.- Poster Presentation. Planet under PRESSURE. 26-29 MARCH, LONDON, UK.
KRAUSE, D. (2012): Adaptation in the face of socioeconomic transformation: Differing impacts and drivers of formal and informal adaptation strategies to urban flooding in the Mekong Delta, 32nd International Geographical Congress, 26-30 August 2012, Cologne, Germany.
SCHWAB, M. (2012): A TRANSDISCIPLINARY approach to the evaluation of coping and adaptation. International Geographical Congress, 26. – 30. August 2012, Cologne, Germany.
SCHWAB, M.; Evaluierung von Anpassungsmaßnahmen im Kontext wasserbezogener Risiken im vietnamesischen Mekong Delta. PhD-Workshop and conference ‚Social-science Research on Climate Change Adaptation‘, University of Kassel, 21. – 23. November 2012, Kassel, Germany.
SCHWAB, M.; KRAUSE, D. (2012): Verwundbarkeit und Anpassung im Mekong-Delta. DKKV Forum Katastrophenvorsorge, 13.-14. November 2012, Bonn Germany.
SCHWAB, M.; KRAUSE, D., GARSCHAGEN, M.; BIRKMANN, J. (2012): Developing an evaluation framework for climate change adaptation options in the Mekong Delta. DRAGON Institute workshop ‘From the River banks to the Coast -Integrated Approaches of land- and water use coping with Climate Change in the Mekong Delta’, 29-30 March 2012, Can Tho City, Vietnam.
Abschlussbericht für den Projektträger Jülich, Projekt WISDOM II, 10/2010 – 02/2014
188
2011
BIRKMANN, J., GARSCHAGEN, M., KIENBERGER, S. & STORCH, H. (2011): Advancing the Development of Socio-Economic Scenarios through the Lens of Vulnerability and Adaptive Capacity.- International Workshop on the Nature and Use of Socio-Economic Pathways for Climate Change Research. 02-04 November, Boulder, USA.
GARSCHAGEN, M. (2011): Sozial-ökologische Krisen am Beispiel von Klimawandel und Extremereignissen im Mekong Delta, Vietnam.- Graduiertenkolleg Interdisziplinäre Umweltgeschichte. 15. November 2012, Göttingen, Germany.
GARSCHAGEN, M. & MAYER, M. (2011): Merging the International Climate Agenda with National Interests: The Cases of China and Vietnam.- AAG 2011, Annual Meeting of the Association of American Geographers, 12-16 April 2011, Seattle, USA.
2010
APEL, H., GARSCHAGEN, M., DUNG, N.V., DELGADO, J.M., ZIMMER, J. & TUAN, V.V. (2010) Climate Change Impact on Flood Hydrology and Vulnerabilities in the Mekong Delta.- Poster Presentation, Hydrology Conference 2010. The Changing Physical and Social Environment: Hydrologic Impacts and Feedbacks, 11-13 October 2010, San Diego, USA.
BIRKMANN, J. & GARSCHAGEN, M. (2010): Integrative and Dynamic Vulnerability Assessment as a Basis for Adaptive Urban Governance.- 21st IAPS Conference: Vulnerability, Risk and Complexity: Impacts of Global Change on Human Habitats, 27 June – 02 July 2010, Leipzig, Germany.
BIRKMANN, J. & GARSCHAGEN, M. (2010): The Information Base for Adaptive Urban Governance – Measuring and Assessing Urban Vulnerability to Natural Hazards and Climate Change.- World Bank Expert Meeting on Urban Vulnerability Assessment, 22 February 2010, Washington D.C., USA.
GARSCHAGEN, M. & KRAAS, F. (2010): Assessing Future Resilience to Natural Hazards – The Challenge of Capturing Dynamic Changes under Conditions of Transformation and Climate Change. International Disaster and Risk Conference, IDRC 2010, 30 May – 03 June 2010, Davos, Switzerland.
GARSCHAGEN, M. & KRAAS, F. (2010): Urban Climate Change Adaptation in the Context of Transformation – Lessons Learned from Vietnam.- 1st World Congress on Cities and Adaptation to Climate Change, 28-30 May 2010, Bonn, Germany.
GARSCHAGEN, M. (2010): Predicting Future Vulnerabilities to Climate Change Impacts in Vietnam – The Challenge of Capturing Dynamic Pathways Under Conditions of Transformation.- 6th Conference of the European Association for South East Asian Studies, EUROSEAS, 26-28 August 2010, Gothenburg, Sweden.
GARSCHAGEN, M. (2010): Resilience and Climate Change Adaptation in the Coupled Social-Ecological Systems of the Mekong Delta, Vietnam: Rethinking Concepts and Policies.- Poster. International Disaster and Risk Conference, IDRC 2010, 30 May – 03 June 2010, Davos, Switzerland.
GARSCHAGEN, M. (2010): Urban Upgrading and Resettlement of Slum dwellers in the Mekong Delta – Long-term Sustainability or Vulnerability Pitfall?- Socio-economically Sustainable Urban Development. 01-03 December 2010. Hanoi, Vietnam.
GARSCHAGEN, M. (2010): Verwundbarkeiten gegenüber Naturgefahren in urbanen und peri-urbanen Gebieten des Mekongdeltas in Vietnam – Zu den Herausforderungen einer zukunftsorientierten Abschätzung vor dem Hintergrund von Transformation und Klimawandel.- Jahrestagung des Arbeitskreises Südostasien in der Deutschen Gesellschaft für Geographie, 18.-20. June 2010, Marburg, Germany.
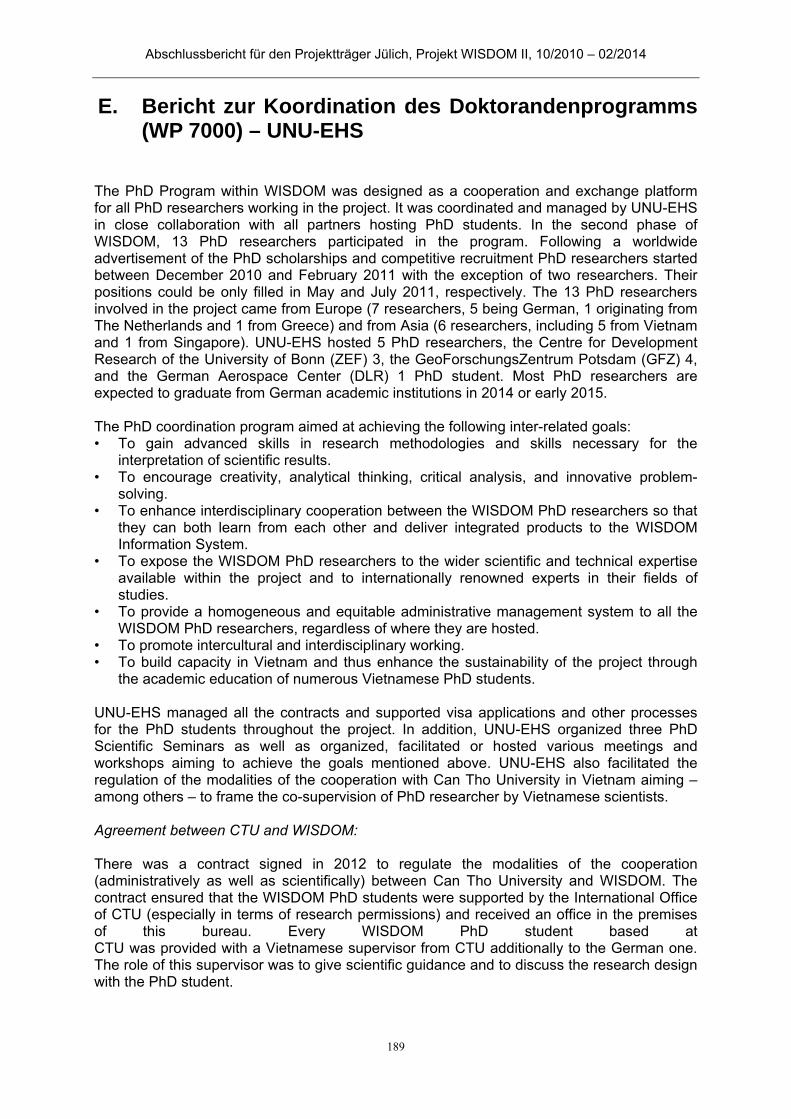
Abschlussbericht für den Projektträger Jülich, Projekt WISDOM II, 10/2010 – 02/2014
189
E. Bericht zur Koordination des Doktorandenprogramms (WP 7000) – UNU-EHS
The PhD Program within WISDOM was designed as a cooperation and exchange platform for all PhD researchers working in the project. It was coordinated and managed by UNU-EHS in close collaboration with all partners hosting PhD students. In the second phase of WISDOM, 13 PhD researchers participated in the program. Following a worldwide advertisement of the PhD scholarships and competitive recruitment PhD researchers started between December 2010 and February 2011 with the exception of two researchers. Their positions could be only filled in May and July 2011, respectively. The 13 PhD researchers involved in the project came from Europe (7 researchers, 5 being German, 1 originating from The Netherlands and 1 from Greece) and from Asia (6 researchers, including 5 from Vietnam and 1 from Singapore). UNU-EHS hosted 5 PhD researchers, the Centre for Development Research of the University of Bonn (ZEF) 3, the GeoForschungsZentrum Potsdam (GFZ) 4, and the German Aerospace Center (DLR) 1 PhD student. Most PhD researchers are expected to graduate from German academic institutions in 2014 or early 2015. The PhD coordination program aimed at achieving the following inter-related goals: • To gain advanced skills in research methodologies and skills necessary for the
interpretation of scientific results. • To encourage creativity, analytical thinking, critical analysis, and innovative problem-
solving. • To enhance interdisciplinary cooperation between the WISDOM PhD researchers so that
they can both learn from each other and deliver integrated products to the WISDOM Information System.
• To expose the WISDOM PhD researchers to the wider scientific and technical expertise available within the project and to internationally renowned experts in their fields of studies.
• To provide a homogeneous and equitable administrative management system to all the WISDOM PhD researchers, regardless of where they are hosted.
• To promote intercultural and interdisciplinary working. • To build capacity in Vietnam and thus enhance the sustainability of the project through
the academic education of numerous Vietnamese PhD students. UNU-EHS managed all the contracts and supported visa applications and other processes for the PhD students throughout the project. In addition, UNU-EHS organized three PhD Scientific Seminars as well as organized, facilitated or hosted various meetings and workshops aiming to achieve the goals mentioned above. UNU-EHS also facilitated the regulation of the modalities of the cooperation with Can Tho University in Vietnam aiming – among others – to frame the co-supervision of PhD researcher by Vietnamese scientists. Agreement between CTU and WISDOM: There was a contract signed in 2012 to regulate the modalities of the cooperation (administratively as well as scientifically) between Can Tho University and WISDOM. The contract ensured that the WISDOM PhD students were supported by the International Office of CTU (especially in terms of research permissions) and received an office in the premises of this bureau. Every WISDOM PhD student based at CTU was provided with a Vietnamese supervisor from CTU additionally to the German one. The role of this supervisor was to give scientific guidance and to discuss the research design with the PhD student.
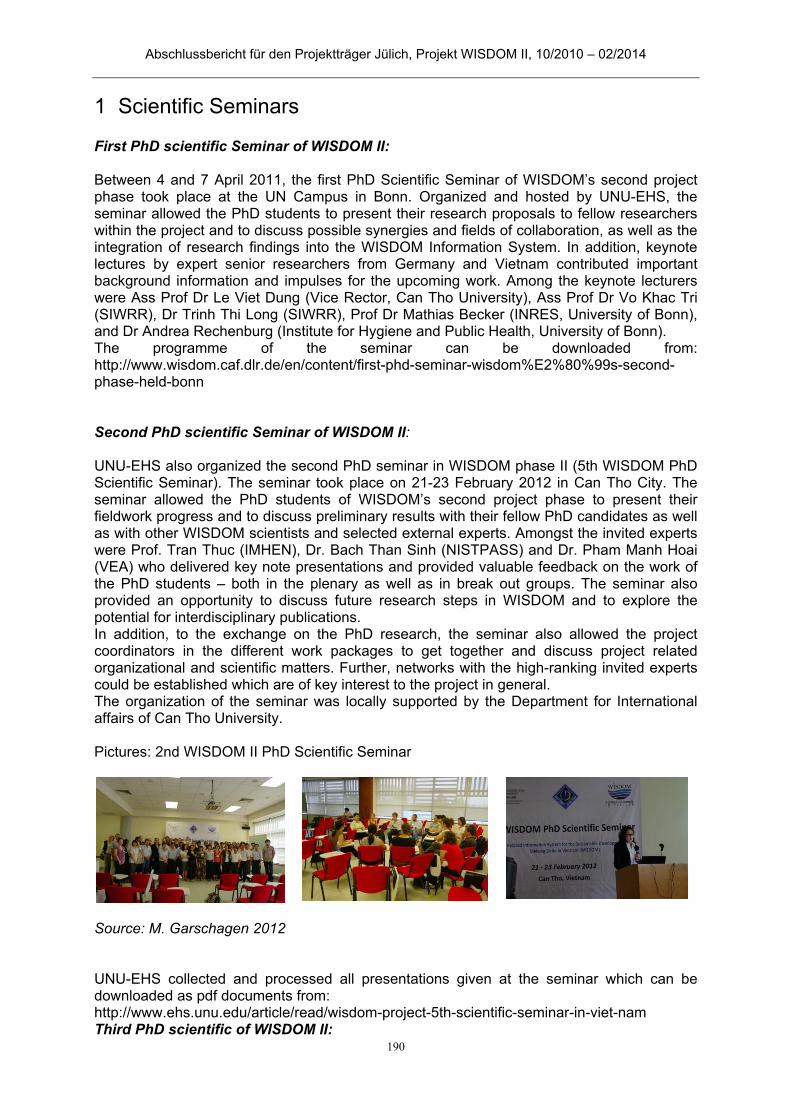
Abschlussbericht für den Projektträger Jülich, Projekt WISDOM II, 10/2010 – 02/2014
190
Scientific Seminars 1
First PhD scientific Seminar of WISDOM II: Between 4 and 7 April 2011, the first PhD Scientific Seminar of WISDOM’s second project phase took place at the UN Campus in Bonn. Organized and hosted by UNU-EHS, the seminar allowed the PhD students to present their research proposals to fellow researchers within the project and to discuss possible synergies and fields of collaboration, as well as the integration of research findings into the WISDOM Information System. In addition, keynote lectures by expert senior researchers from Germany and Vietnam contributed important background information and impulses for the upcoming work. Among the keynote lecturers were Ass Prof Dr Le Viet Dung (Vice Rector, Can Tho University), Ass Prof Dr Vo Khac Tri (SIWRR), Dr Trinh Thi Long (SIWRR), Prof Dr Mathias Becker (INRES, University of Bonn), and Dr Andrea Rechenburg (Institute for Hygiene and Public Health, University of Bonn). The programme of the seminar can be downloaded from: http://www.wisdom.caf.dlr.de/en/content/first-phd-seminar-wisdom%E2%80%99s-second-phase-held-bonn Second PhD scientific Seminar of WISDOM II: UNU-EHS also organized the second PhD seminar in WISDOM phase II (5th WISDOM PhD Scientific Seminar). The seminar took place on 21-23 February 2012 in Can Tho City. The seminar allowed the PhD students of WISDOM’s second project phase to present their fieldwork progress and to discuss preliminary results with their fellow PhD candidates as well as with other WISDOM scientists and selected external experts. Amongst the invited experts were Prof. Tran Thuc (IMHEN), Dr. Bach Than Sinh (NISTPASS) and Dr. Pham Manh Hoai (VEA) who delivered key note presentations and provided valuable feedback on the work of the PhD students – both in the plenary as well as in break out groups. The seminar also provided an opportunity to discuss future research steps in WISDOM and to explore the potential for interdisciplinary publications. In addition, to the exchange on the PhD research, the seminar also allowed the project coordinators in the different work packages to get together and discuss project related organizational and scientific matters. Further, networks with the high-ranking invited experts could be established which are of key interest to the project in general. The organization of the seminar was locally supported by the Department for International affairs of Can Tho University. Pictures: 2nd WISDOM II PhD Scientific Seminar
Source: M. Garschagen 2012 UNU-EHS collected and processed all presentations given at the seminar which can be downloaded as pdf documents from: http://www.ehs.unu.edu/article/read/wisdom-project-5th-scientific-seminar-in-viet-nam Third PhD scientific of WISDOM II:
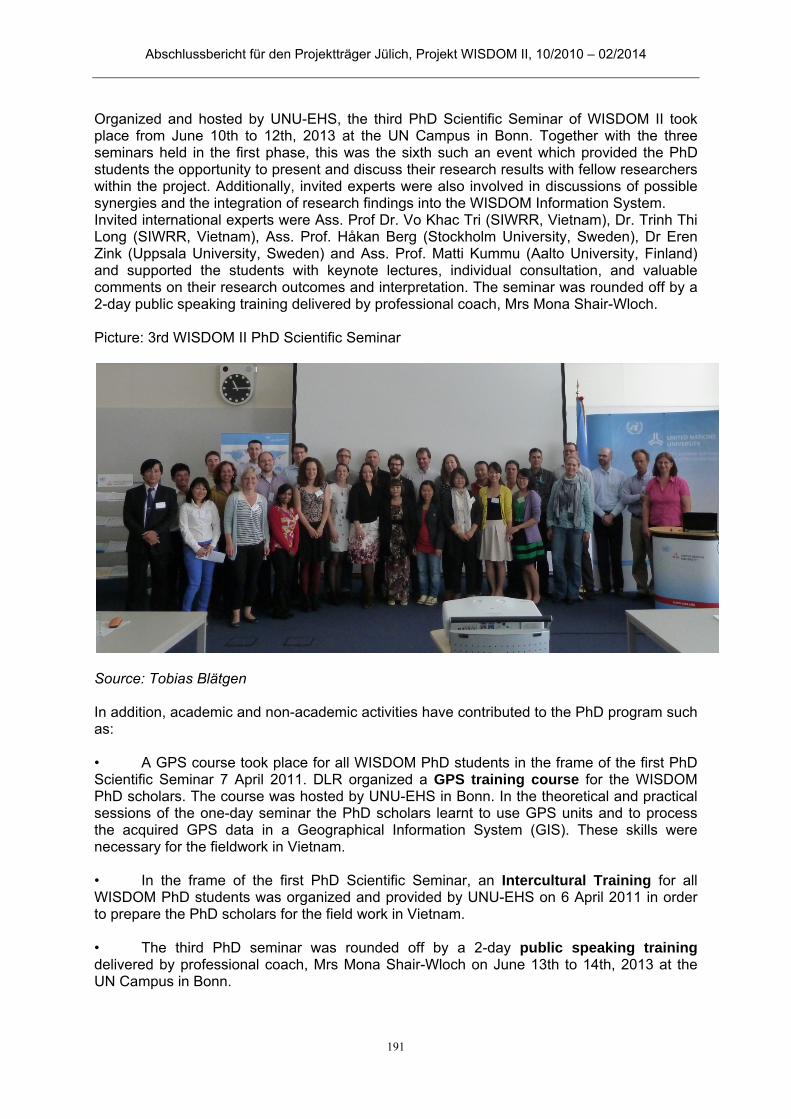
Abschlussbericht für den Projektträger Jülich, Projekt WISDOM II, 10/2010 – 02/2014
191
Organized and hosted by UNU-EHS, the third PhD Scientific Seminar of WISDOM II took place from June 10th to 12th, 2013 at the UN Campus in Bonn. Together with the three seminars held in the first phase, this was the sixth such an event which provided the PhD students the opportunity to present and discuss their research results with fellow researchers within the project. Additionally, invited experts were also involved in discussions of possible synergies and the integration of research findings into the WISDOM Information System. Invited international experts were Ass. Prof Dr. Vo Khac Tri (SIWRR, Vietnam), Dr. Trinh Thi Long (SIWRR, Vietnam), Ass. Prof. Håkan Berg (Stockholm University, Sweden), Dr Eren Zink (Uppsala University, Sweden) and Ass. Prof. Matti Kummu (Aalto University, Finland) and supported the students with keynote lectures, individual consultation, and valuable comments on their research outcomes and interpretation. The seminar was rounded off by a 2-day public speaking training delivered by professional coach, Mrs Mona Shair-Wloch. Picture: 3rd WISDOM II PhD Scientific Seminar
Source: Tobias Blätgen In addition, academic and non-academic activities have contributed to the PhD program such as: • A GPS course took place for all WISDOM PhD students in the frame of the first PhD Scientific Seminar 7 April 2011. DLR organized a GPS training course for the WISDOM PhD scholars. The course was hosted by UNU-EHS in Bonn. In the theoretical and practical sessions of the one-day seminar the PhD scholars learnt to use GPS units and to process the acquired GPS data in a Geographical Information System (GIS). These skills were necessary for the fieldwork in Vietnam. • In the frame of the first PhD Scientific Seminar, an Intercultural Training for all WISDOM PhD students was organized and provided by UNU-EHS on 6 April 2011 in order to prepare the PhD scholars for the field work in Vietnam. • The third PhD seminar was rounded off by a 2-day public speaking training delivered by professional coach, Mrs Mona Shair-Wloch on June 13th to 14th, 2013 at the UN Campus in Bonn.
Abschlussbericht für den Projektträger Jülich, Projekt WISDOM II, 10/2010 – 02/2014
192
List of PhD students and title of their PhD research: 2
1) Name: Mr Patrick Leinenkugel Host Institute: DLR PhD research title: Analysing spatio-temporal patterns of land cover in the Mekong Basin 2) Name: Ms Dunja Krause Host Institute: UNU-EHS PhD research title: Arenas of adaptation. A stakeholder-based evaluation of selected strategies that address changing hazards in Can Tho City, Vietnam. 3) Name: Ms Maria Schwab Host Institute: UNU-EHS PhD research title: Nature and values of risk-related strategies - An evaluation of rural coping and adaptation in response to changing water-related risks in the Vietnamese 4) Name: Ms Nguyen Dang Giang Chau Host Institute: UNU-EHS PhD research title: Development of risk assessment (hot spot) maps for drinking water quality (pesticides and antibiotics) in the Mekong Delta 5) Name: Ms La Thi Nga Host Institute: UNU-EHS PhD research title: Environmental footprint of agricultural practices with respect to surface water pollution 6) Name: Mr Gert-Jan Wilbers Host Institute: UNU-EHS PhD research title: Risks associated with drinking water sources in the Mekong Delta, Vietnam 7) Name: Ms Do Thi Chinh Host Institute: GFZ PhD research title: Development of region specific flood damage models: case study for tidal-influence-flood in Can Tho city 8) Name: Ms Jamila Beckheinrich Host Institute: GFZ PhD research title: GNSS Reflectometry for flood monitoring 9) Name: Mr Nguyen Van Manh Host Institute: GFZ PhD research title: Quantification of sediment and nutrient dynamic in the Mekong Delta
Abschlussbericht für den Projektträger Jülich, Projekt WISDOM II, 10/2010 – 02/2014
193
10) Name: Mr Stefan Luedtke Host Institute: GFZ PhD research title: Sediment dynamics and climate change in the Mekong basin. 11) Name: Ms Panagiota Kotsila Host Institute: ZEF PhD research title: Socio-political and cultural determinants of diarrheal disease in the Mekong Delta: From Discourse to Incidence 12) Name: Ms Siwei Tan Host Institute: ZEF PhD research title: Wastewater management in the industrial zones of the Vietnamese Mekong Delta: An instance of a socio-spatial explanation of environmental management 13) Name: Ms Huynh Thi Phuong Linh Host Institute: ZEF PhD research title: Water management at the local level

Abschlussbericht für den Projektträger Jülich, Projekt WISDOM II, 10/2010 – 02/2014
194

Abschlussbericht für den Projektträger Jülich, Projekt WISDOM II, 10/2010 – 02/2014
195
Unterauftrag TU Wien – separater Bericht des Projektteils
F. Fernerkundung zur Ableitung von Bodenfeuchteparametern (WP 6250) – TU Wien
Kurze Darstellung 1
1.1 Aufgabenstellung des Arbeitspaketes WP6250
Das Arbeitspaket WP6250 mit dem Titel “Soil Moisture retrieval using active microwave remote sensing“ befasst sich mit der Ableitung von Bodenfeuchteinformationen aus Mikrowellendaten. In diesem Arbeitspaket verfolgte die Fernerkundungsgruppe der Abteilung für Geodäsie und Geoinformation, GEO (vormals Institut für Photogrammetrie und Fernerkundung) der Technischen Universität Wien (TU Wien) das Ziel, die Prozessierung umfangreicher Datenbestände der Sensoren ASAR Global Monitoring (GM), Wide Swath (WS) und ASCAT, die sich an Bord des Europäische Umweltsatelliten ENVISAT und MetOp befinden. Die ASAR und ASCAT Datenbank umfasst für das Interessensgebiet zehntausende Aufnahmen. Die gesamten historischen Zeitreihen von ASCAT und ASAR GM Level-1 Daten wurden für die Ableitung von verschiedenen Parametern, die für die Bodenfeuchtekalkulation notwendig sind, vorbearbeitet. Die Vorverarbeitungsverfahren bezogen sich auf Geokodierung, Kalibrierung, und Resampling der Rohdaten im Untersuchungsgebiet. Die vorverarbeiteten Daten wurden für die Ableitung von folgenden Level-1 & -2 Produkten verwendet: “Surface Soil Moisture (SSM)“, Soil Water Index (SWI), und “Basin Water Index (BWI)“. Eine deskriptive Analyse wurde zur Erfassung der räumlich-zeitlichen Verteilung der Bodenfeuchte im Untersuchungsgebiet durchgeführt. Eine anschließende Bewertung, Analyse und Fehlercharakterisierung der ASAR und ASCAT Bodenfeuchtigkeitsdaten hat zu Verbesserungen der Algorithmen geführt. Aufgrund der Tatsache dass das Untersuchungsgebiet in der tropischen Klimazone liegt sowie verbunden mit der dichten Bewaldung und der teilweisen Lage im Hochwassergebiet, wurden permanente Wasserflächen und Vegetationsflächen maskiert.
1.2 Voraussetzungen
Die Voraussetzungen unter denen das Arbeitspaket durchgeführt wurde, sind zum einem die Expertise der TU Wien in der Koordination von nationalen und internationalen Projekten mit verschiedenartige Forschungsthemen von Mikrowellenfernerkundung und zum anderen die hoch leistungsfähige infrastrukturelle und technische Kompetenz der TU Wien für die Verarbeitung von großen Datenmengen. Die GEO Fernerkundung-Forschungsgruppe der TU Wien beschäftigt sich mit der Forschung, Beobachtung und Modellierung von räumlich-zeitlichen Prozessen in der Natur, insbesondere der geometrischen und geophysikalischen Parameter. Die GEO-Fernerkundungsgruppe ist einer der führenden europäischen Forschungsgruppen zum Thema Bodenfeuchte-Ableitung und Überwachung von hydrologischen Prozessen (Wasserflächen, Feuchtgebiete, Frost/Tau-Status) mittels Radarfernerkundung. Die GEO-Fernerkundungsgruppe wurde von der ESA mit der Vergabe der Leitung des ESA-Projekts “Climate Change Initiative (CCI)“ beauftragt, und hat Bodenfeuchte darin als “Essential Climate Variable (ECV)“ anerkannt. Im Namen der Europäischen Organisation für die Nutzung Meteorologischer Satelliten (EUMETSAT) bzw. als Partner einer “Satellite Application Facility (SAF)-Netzwerk“, hat die Gruppe Software für die Echtzeit-Verarbeitung von MetOp ASCAT Daten entwickelt, um ein globales Bodenfeuchte-Produkt und weitere
Abschlussbericht für den Projektträger Jülich, Projekt WISDOM II, 10/2010 – 02/2014
196
Derivate zu erstellen. Die Fernerkundungsgruppe hat auch Verarbeitungsketten für ENVISAT ASAR für die Bereitstellung von hydrologischen Landoberfläche-Produkten entwickelt. Die Bodenfeuchte-Produkte wurden bereits über 1100 Nutzern aus Forschung, Öffentlichkeit, Nichtregierungsorganisationen und dem privaten Sektor geliefert. Die IT-Infrastruktur der TU Wien ermöglicht die Verarbeitung von Großdatensätzen von Satelliten wie Metop ASCAT und Envisat ASAR und besteht aus 1) speziell entwickelten Verarbeitungsketten für die Ableitung geophysikalischer Variablen, 2) mehreren Hochleistungs-PCs, 3) einem Daten-Server mit einer Kapazität von 600 Terabyte, und 4) einer Bandbibliothek mit einer Kapazität von 1 Petabyte.
1.3 Planung und Ablauf des Vorhabens
Die Planung der Aktivitäten im Arbeitspaket WP6250 basierte auf den definierten Projektzielen und Meilensteinen. Die Arbeiten im WP6250 konnten im Wesentlichen wie beantragt und geplant durchgeführt werden. Der Ablauf kann wie folgend zusammengefasst werden:
- Sichtung der Daten und Vorverarbeitungsschritte von ASCAT und ASAR Daten für die Untersuchungsgebiete: radiometrische Kalibrierung, Orthorektifizierung, Geokodierung, Resampling.
- Qualitätskontrolle der Eingangsdaten: Wahl der besten Resampling-Methode, Identifikation fehlerhafter Szenen (z.B. Artefakte/Streifenmuster wegen Instrumentenfehler), Ausschluss fehlerhafter Szenen von der Normalisierungs-Prozedur.
- Normalisierung, Skalierung, und Ableitung der Bodenfeuchte der Sensoren SCAT, ASCAT und ASAR GM.
- Erstellung und Aktualisierung von Meta-Daten und Integration in das WISDOM-Information-System (ELVIS).
- Fehlercharakterisierung der ASCAT-Daten im gesamten Mekong-Einzugsgebiet: räumliche Analyse der Bodenfeuchte; Vergleich mit Parameter wie Sensitivity, ESD, Noise sowie externen Datensätzen wie Landnutzung/-bedeckung, Topographie, Klima-klassifikationen, etc.
- Erstellung der ASCAT Level-2 Daten: Soil Water Index (SWI), Basin Water Index (BWI).
- Räumlich-zeitliche Analyse von Scatterometer-abgeleiteten Produkten im Lower Mekong Basin.
- Validierung der ASCAT Level-2 Daten: Vergleich der Zeitserien mit in-situ Niederschlag und Evapotranspiration im sub-Einzugsgebietsbereich; Vergleich des BWI mit GPCC Klimadaten; Untersuchung des BWI in Verbindung mit Klimaphänomenen (z.B. El Nino).
- Visualisierung der Produkte (wöchentliche ASCAT und monatliche ASAR SSM Produkte).
- Maskierung von Wasseroberflächen in Hochwasserperioden basierend auf SSM Noise (2 abgeleitete Bänder für trockene/feuchte Perioden); Beobachtung der antezedenten Bodenfeuchtebedingungen; Erstellung einer Wasser-Maske für die ASAR Produkte.
- Validierung der ASAR Bodenfeuchte: Vergleich mit ERA-Interim und GLDAS.
- Analyse von Vegetationsindices (EVI, fPAR, LAI) und Erstellen einer dynamischen Vegetationsmaske.
Abschlussbericht für den Projektträger Jülich, Projekt WISDOM II, 10/2010 – 02/2014
197
- Erstellung eines Maßes für die räumliche Skalierung (correlation layer) als Qualitätsindikator für das ASAR Bodenfeuchte-Produkt.
1.4 Stand der Wissenschaft und Technik
Die Ableitung von Bodenfeuchteinformationen aus Mikrowellendaten war seit den 1970er Jahren ein wichtiger Forschungsbereich innerhalb der Fernerkundung, aber erst in den letzten Jahren hat es bedeutende Fortschritte hin zu operationellen Bodenfeuchtedienstleistungen gegeben. Dies wurde ermöglicht durch Entwicklungen im Bereich der Sensortechnologie und der Algorithmenentwicklung. Im Hinblick auf das Sensordesign haben jüngste Projektanträge für Bodenfeuchtesatelliten vor allem auf passive Mikrowellentechnologien im Frequenzbereich von 1-2 GHz zurückgegriffen. Eine Mission ist die „Soil Moisture and Ocean Salinity Misson“ (SMOS) der europäischen Raumfahrtagentur (ESA), welche im November 2009 gestartet wurde. Die nationale Raumfahrtbehörde der USA (NASA) plant den Start einer weiteren Mission, der „Soil Moisture Active Passive“ (SMAP) Mission, deren Start im Jahr 2014 geplant ist. Neben Innovationen in der Satellitentechnologie, hat eine eher weniger beachtete Revolution bei der Entwicklung von Algorithmen zur Ableitung von Bodenfeuchte stattgefunden. Mithilfe von verbesserten Algorithmen konnten Bodenfeuchteinformationen aus Daten existierender operationeller, im Bereich des C-und X-Bandes betriebener Mikrowellensensoren abgeleitet werden. Der erste globale Bodenfeuchtedatensatz basierend auf Daten der ERS-1/2-Scatterometer wurde im Jahr 2002 veröffentlicht. Bodenfeuchteinformationen aus Daten des „Advanced Microwave Scanning Radiometer“ (AMSR-E) sind seit 2003 verfügbar. Die erste nahezu in Echtzeit ablaufende Bodenfeuchtedienstleistung (Aussendung 130 Minuten nach der Aufnahme) wurde im Mai 2008 von der zwischenstaatlichen Organisation EUMETSAT gestartet. Dieses Produkt basiert auf Daten des METOP ASCAT Sensors, dem Nachfolger der ERS-1/2 Scatterometer. Der Near-Real-Time (NRT) Prozessor für ASCAT Oberflächenbodenfeuchte (SSM) stellt bereits seit fast drei Jahren SSM Daten über das Datenportal von EUMETSAT zu Verfügung und ist mittlerweile an der zweiten Stelle der meistheruntergeladenen Produkte. Die Algorithmen zur Ableitung von Bodenfeuchteinformationen aus Scatterometer-Daten der ERS-1/2 und des METOP Satelliten wurden an der Technischen Universität Wien (TU Wien) entwickelt.
1.5 Zusammenarbeit mit anderen Stellen
Es gab eine direkte Anbindung und Zusammenarbeit mit der Abteilung Landoberfläche des Deutschen Fernerkundungsdatenzentrums (DFD) des Deutschen Zentrums für Luft- und Raumfahrt (DLR) und mit dem Fernerkundungslehrstuhl des Geographischen Instituts der Universität Würzburg.
Abschlussbericht für den Projektträger Jülich, Projekt WISDOM II, 10/2010 – 02/2014
198
Eingehende Darstellung 2
2.1 Erzielte Ergebnisse und Verwendung der Zuwendungen
Nach folgend werden die technischen Ergebnisse in englischer Sprache verfasst präsentiert – entsprechend der Vereinbarung zur Berichterstattung in WISDOM-Zwischenberichten.. The work package WP-6250 deals with the soil moisture retrieval in the Mekong Basin using active microwave remote sensing. Historical data acquisitions from the European active sensors are used to extract soil moisture dynamics in the Mekong Basin using the TU Wien change detection methodology. The analyses carried out in this work package include signal processing, level-1 and -2 product generation, data integration to the WISDOM information system, quality assessments and validation, and algorithm modifications to improve the final products.
Motivation 2.1.1
The natural environment and livelihoods in the Lower Mekong Basin (LMB) are significantly affected by the annual hydrological cycle. The livelihoods and food security of most people in many parts of the LMB are tightly dependent on water resources which this makes the life of people highly vulnerable to availability and quality of the resources. The flat terrains in the LMB are used for crop irrigation, animal raising and fish farm operations. About 80–90% of all water from the Mekong River is used for agriculture, most of which for crop cultivation [1] The riparian people and the ecosystem of the Mekong basin are strongly affected by the river’s annual cycle of rainy and dry season and the hydrologic cycle plays a fundamental role in maintaining the health of the Mekong Basin environment. Monitoring of soil moisture as a key variable in the hydrological cycle is of great interest in a number of hydrological and agricultural applications. It functions as a link between the energy and water fluxes at the soil surface and the atmosphere interface. The local and regional hydrological processes, partitioning of precipitation into infiltration and runoff as well as the availability of water to plants and so also the partitioning of latent and sensible heat are influenced and controlled by soil moisture [2]. Furthermore, soil moisture has been recognized as an essential variable in the climate system [3]. It is, along with snow, the most important component of meteorological memory over land [4]. Knowledge of soil moisture variations is valuable for understanding the hydrological cycle and predicting extreme events and their impacts on environment, climate change and weather forecasting [5]. Radar remote sensing technologies offer powerful tools for retrieval of hydrological information such as soil moisture content and the extent of water bodies and floods providing frequent measurements (up to twice a day in case of scatterometer) over large areas. Microwave remote sensing specially in the low frequency domain (1–10 GHz) offers a relatively direct method of soil moisture retrieval thanks to the strong relationship between the moisture content and dielectric constant of the soil [6]. A high sensitivity to soil moisture content is achieved due to the high dielectric constant of water compared to most other naturally abundant materials.
Study region 2.1.2
The Mekong Basin is divided into two major parts above and below the Me-kong River’s descent from the Yannan highlands. The part of the basin within China and easternmost Myanmar in the north is known as the Lancang or Upper Mekong Basin. The part downstream of the divide is called the Lower Mekong Basin (LMB). The LMB represents about 70% of the Mekong River Basin’s total area and is considered the most important part of the basin, both socio-economically and environmentally [7]. The diverse ecosystems in the LMB are crucial to the livelihood of over 60 million people. Two thirds of its largely rural population lives directly from agriculture and fisheries. An overview of the geography of the Mekong Basin and its major physiographic sub-regions are given in Figure 1. The “Northern Highlands” with elevations of up to about 2,800 m comprise the northern parts of Thailand

Abschlussbericht für den Projektträger Jülich, Projekt WISDOM II, 10/2010 – 02/2014
199
and Laos, the upland region of northeast Myanmar, and eastward into the northern end of the Annamite Range in Vietnam. The Northern Highlands region receives the highest amount of rainfall in the LMB. The “Khorat Plateau” is bound to the northeastern region of Thailand and the Annamite Mountains to the east and northeast. The Khorat Plateau is the driest
region in the LMB with the highest evapotranspiration rate despite the annual rainfall between 1,000 to 1,600 mm [8]. The “Tonle Sap” Basin, situated in Cambodia, is the catchment area of the Tonle Sap River at its confluence with the Mekong River. The western and central parts of the Tonle Sap Basin form a low-relief region in which the Tonle Sap Lake, the largest freshwater lake in Southeast Asia, is located. The “Mekong Delta” is defined as the flat region in southwestern Vietnam where the Mekong River approaches and drains into the sea through a vast network of natural distributaries and man-made channels. The climate of the Mekong Basin is strongly influenced by the rainy southwest monsoon occurring between May and October and dry northeast monsoon in the period of October-March. Therefore rainfall is strongly seasonal. About 90% of precipitation falls between the months of May and October with mean annual totals ranging from 1,000 mm in northeast Thailand to more than 3,200 mm in the mountainous regions of Laos. The hydrologic cycle in the LMB is dominated by a single-wet-season flow peak. Annual floods in the Mekong Basin are characterized as natural occurrences with a distinct peak and large amplitude, bringing fertile and nutrients-rich sediments [9].
Data 2.1.3
2.1.3.1 Scatterometer data
The scatterometer soil moisture (SSM) product used in this study is retrieved from C-band (5.3 GHz) active sensors aboard European Remote Sensing Satellites (ERS-1&2) [10] and the first Meteorological Operation (Metop-A) satellite [11] by using the TUWien soil moisture retrieval algorithm developed at the Vienna University of Technology [12, 13]. The SSM product generation is carried out by employing two sets of model parameters, extracted separately from backscatter time series measured by the scatterometers onboard ERS-1&2 (SCATs) and the advanced scatterometer (ASCAT) onboard Metop-A. The Metop-A is the first of three foreseen meteorological satellites planned by the European Organization for the Exploitation of Meteorological Satellites (EUMETSAT). The SCATs data acquisitions in the Mekong river basin are available from August 1991 to January 2001 with a spatial resolution
Figure 1. Maps of the Southeast Asian countries, Mekong Basin and its sub-catchments
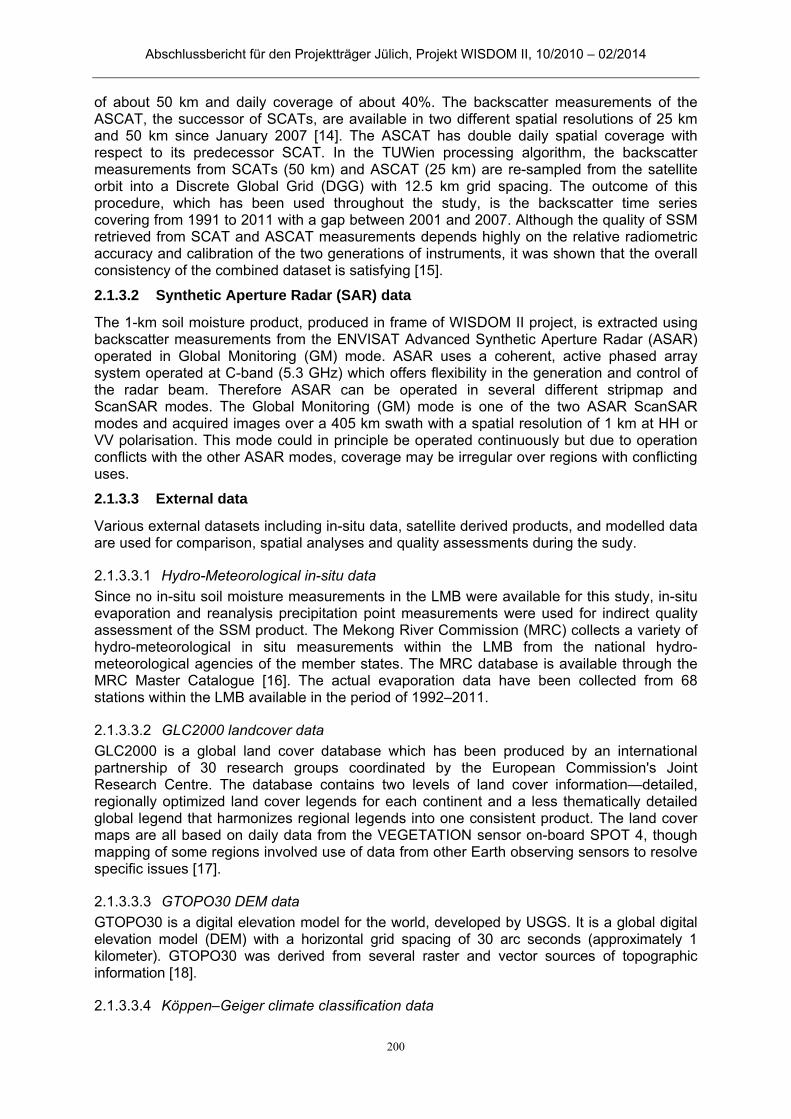
Abschlussbericht für den Projektträger Jülich, Projekt WISDOM II, 10/2010 – 02/2014
200
of about 50 km and daily coverage of about 40%. The backscatter measurements of the ASCAT, the successor of SCATs, are available in two different spatial resolutions of 25 km and 50 km since January 2007 [14]. The ASCAT has double daily spatial coverage with respect to its predecessor SCAT. In the TUWien processing algorithm, the backscatter measurements from SCATs (50 km) and ASCAT (25 km) are re-sampled from the satellite orbit into a Discrete Global Grid (DGG) with 12.5 km grid spacing. The outcome of this procedure, which has been used throughout the study, is the backscatter time series covering from 1991 to 2011 with a gap between 2001 and 2007. Although the quality of SSM retrieved from SCAT and ASCAT measurements depends highly on the relative radiometric accuracy and calibration of the two generations of instruments, it was shown that the overall consistency of the combined dataset is satisfying [15].
2.1.3.2 Synthetic Aperture Radar (SAR) data
The 1-km soil moisture product, produced in frame of WISDOM II project, is extracted using backscatter measurements from the ENVISAT Advanced Synthetic Aperture Radar (ASAR) operated in Global Monitoring (GM) mode. ASAR uses a coherent, active phased array system operated at C-band (5.3 GHz) which offers flexibility in the generation and control of the radar beam. Therefore ASAR can be operated in several different stripmap and ScanSAR modes. The Global Monitoring (GM) mode is one of the two ASAR ScanSAR modes and acquired images over a 405 km swath with a spatial resolution of 1 km at HH or VV polarisation. This mode could in principle be operated continuously but due to operation conflicts with the other ASAR modes, coverage may be irregular over regions with conflicting uses.
2.1.3.3 External data
Various external datasets including in-situ data, satellite derived products, and modelled data are used for comparison, spatial analyses and quality assessments during the sudy.
Hydro-Meteorological in-situ data 2.1.3.3.1
Since no in-situ soil moisture measurements in the LMB were available for this study, in-situ evaporation and reanalysis precipitation point measurements were used for indirect quality assessment of the SSM product. The Mekong River Commission (MRC) collects a variety of hydro-meteorological in situ measurements within the LMB from the national hydro-meteorological agencies of the member states. The MRC database is available through the MRC Master Catalogue [16]. The actual evaporation data have been collected from 68 stations within the LMB available in the period of 1992–2011.
GLC2000 landcover data 2.1.3.3.2
GLC2000 is a global land cover database which has been produced by an international partnership of 30 research groups coordinated by the European Commission's Joint Research Centre. The database contains two levels of land cover information—detailed, regionally optimized land cover legends for each continent and a less thematically detailed global legend that harmonizes regional legends into one consistent product. The land cover maps are all based on daily data from the VEGETATION sensor on-board SPOT 4, though mapping of some regions involved use of data from other Earth observing sensors to resolve specific issues [17].
GTOPO30 DEM data 2.1.3.3.3
GTOPO30 is a digital elevation model for the world, developed by USGS. It is a global digital elevation model (DEM) with a horizontal grid spacing of 30 arc seconds (approximately 1 kilometer). GTOPO30 was derived from several raster and vector sources of topographic information [18].
Köppen–Geiger climate classification data 2.1.3.3.4

Abschlussbericht für den Projektträger Jülich, Projekt WISDOM II, 10/2010 – 02/2014
201
The Köppen climate classification is one of the most widely used climate classification systems. The system is based on the concept that native vegetation is the best expression of climate. Thus, climate zone boundaries have been selected with vegetation distribution in mind. It combines average annual and monthly temperatures and precipitation, and the seasonality of precipitation [19].
MODIS Vegetation Indices (LAI, fPAR, EVI) 2.1.3.3.5
Three vegetation indices retrieved from data acquisitions of the Moderate-Resolution Imaging Spectroradiometer (MODIS) aboard Aqua and Terra sattelites are used for the vegetation analysis. 1) Leaf area index (LAI) defined as the one-sided green leaf area per unit ground area in broadleaf canopies and as one-half the total needle surface area per unit ground area in coniferous canopies [20]. 2) Fraction of Photosynthetically Active Radiation absorbed by vegetation (FPAR) defined as the fraction of incident photosynthetically active radiation (400-700 nm) absorbed by the green elements of a vegetation [20]. 3) Enhanced vegetation index (EVI) an optimized index designed to enhance the vegetation signal with improved sensitivity in high biomass regions and improved vegetation monitoring through a de-coupling of the canopy background signal and a reduction in atmosphere influences [21].
GPCC Reanalysis Precipitation Data 2.1.3.3.6
The Global Precipitation Climatology Centre (GPCC) provides monthly precipitation and relative climatological normal produced based on long-term in situ rain-gauge observations. In this study, the full reanalysis product with the spatial resolutions of 0.5° × 0.5° is used which was generated using the complete GPCC monthly rainfall station database covering the period from 1901 to 2010 [22,23]. The GPCC products are freely available from http://gpcc.dwd.de
ECMWF ERA-Interim Data 2.1.3.3.7
ECMWF ReAnalysis (ERA-Interim) data set is produced by the European Centre for Medium-Range Weather Forecasts (ECMWF) based on the ECMWF Integrated Forecast Model, a global numerical weather prediction model. It includes an “interim” reanalysis of the period 1989-present in preparation for the next-generation extended reanalysis to replace ERA-40. The data set provides various meteorological variables on a reduced Gaussian grid (ECMWF T255) with 0.7◦ spatial resolution at the equator. The ERA-Interim reanalysis is performed using a sequential data assimilation scheme, advancing forward in time using 12 hourly analysis cycles. A large number of in situ and satellite observations, nearly 107 per day in 2010, have been assimilated in ERA-Interim data [24]
GLDAS-NOAH data 2.1.3.3.8
The Global Land Data Assimilation System (GLDAS)-Noah data set is the output of the GLDAS, which has been jointly developed by scientists at the National Aeronautics and Space Administration, Goddard Space Flight Center and the National Oceanic and Atmospheric Administration, National Centers for Environmental Prediction. The GLDAS uses satellite and ground-based observational data products to generate fields of land-surface states (such as soil moisture, snow, surface temperature) and fluxes using advanced land surface modeling and data assimilation techniques. GLDAS surface temperature data set is available from February 2000 onward in 3-h temporal resolution on a 0.25◦ regular global grid [25]
ENSO Index 2.1.3.3.9
A Multivariate ENSO Index (MEI) was used to investigate the link between the seasonal soil moisture dynamics and climatological phenomena. The MEI used in this study is based on long-term marine measurements derived from tropical Pacific Comprehensive Ocean-Atmosphere Data Set (COADS) records and is a multivariate measure of the ENSO signal extracted from six observed variables over the tropical pacific: sea-level pressure, surface
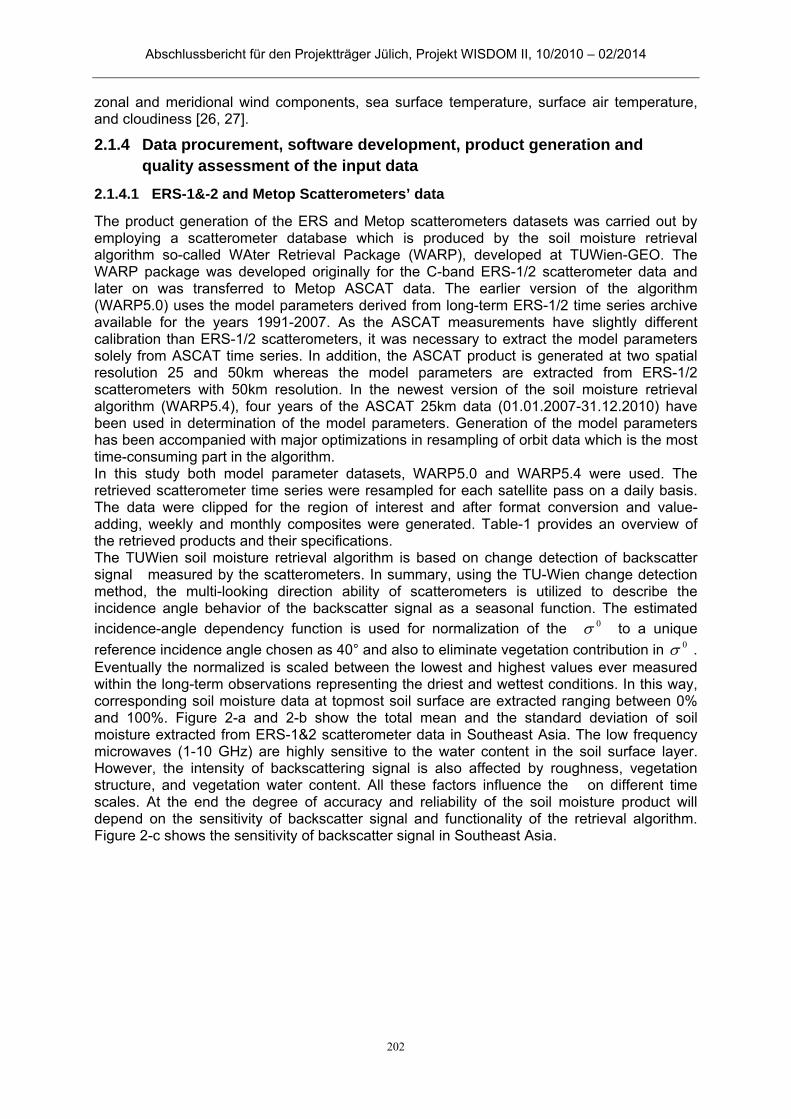
Abschlussbericht für den Projektträger Jülich, Projekt WISDOM II, 10/2010 – 02/2014
202
zonal and meridional wind components, sea surface temperature, surface air temperature, and cloudiness [26, 27].
Data procurement, software development, product generation and 2.1.4quality assessment of the input data
2.1.4.1 ERS-1&-2 and Metop Scatterometers’ data
The product generation of the ERS and Metop scatterometers datasets was carried out by employing a scatterometer database which is produced by the soil moisture retrieval algorithm so-called WAter Retrieval Package (WARP), developed at TUWien-GEO. The WARP package was developed originally for the C-band ERS-1/2 scatterometer data and later on was transferred to Metop ASCAT data. The earlier version of the algorithm (WARP5.0) uses the model parameters derived from long-term ERS-1/2 time series archive available for the years 1991-2007. As the ASCAT measurements have slightly different calibration than ERS-1/2 scatterometers, it was necessary to extract the model parameters solely from ASCAT time series. In addition, the ASCAT product is generated at two spatial resolution 25 and 50km whereas the model parameters are extracted from ERS-1/2 scatterometers with 50km resolution. In the newest version of the soil moisture retrieval algorithm (WARP5.4), four years of the ASCAT 25km data (01.01.2007-31.12.2010) have been used in determination of the model parameters. Generation of the model parameters has been accompanied with major optimizations in resampling of orbit data which is the most time-consuming part in the algorithm. In this study both model parameter datasets, WARP5.0 and WARP5.4 were used. The retrieved scatterometer time series were resampled for each satellite pass on a daily basis. The data were clipped for the region of interest and after format conversion and value-adding, weekly and monthly composites were generated. Table-1 provides an overview of the retrieved products and their specifications. The TUWien soil moisture retrieval algorithm is based on change detection of backscatter signal measured by the scatterometers. In summary, using the TU-Wien change detection method, the multi-looking direction ability of scatterometers is utilized to describe the incidence angle behavior of the backscatter signal as a seasonal function. The estimated incidence-angle dependency function is used for normalization of the 0 to a unique
reference incidence angle chosen as 40° and also to eliminate vegetation contribution in 0 . Eventually the normalized is scaled between the lowest and highest values ever measured within the long-term observations representing the driest and wettest conditions. In this way, corresponding soil moisture data at topmost soil surface are extracted ranging between 0% and 100%. Figure 2-a and 2-b show the total mean and the standard deviation of soil moisture extracted from ERS-1&2 scatterometer data in Southeast Asia. The low frequency microwaves (1-10 GHz) are highly sensitive to the water content in the soil surface layer. However, the intensity of backscattering signal is also affected by roughness, vegetation structure, and vegetation water content. All these factors influence the on different time scales. At the end the degree of accuracy and reliability of the soil moisture product will depend on the sensitivity of backscatter signal and functionality of the retrieval algorithm. Figure 2-c shows the sensitivity of backscatter signal in Southeast Asia.
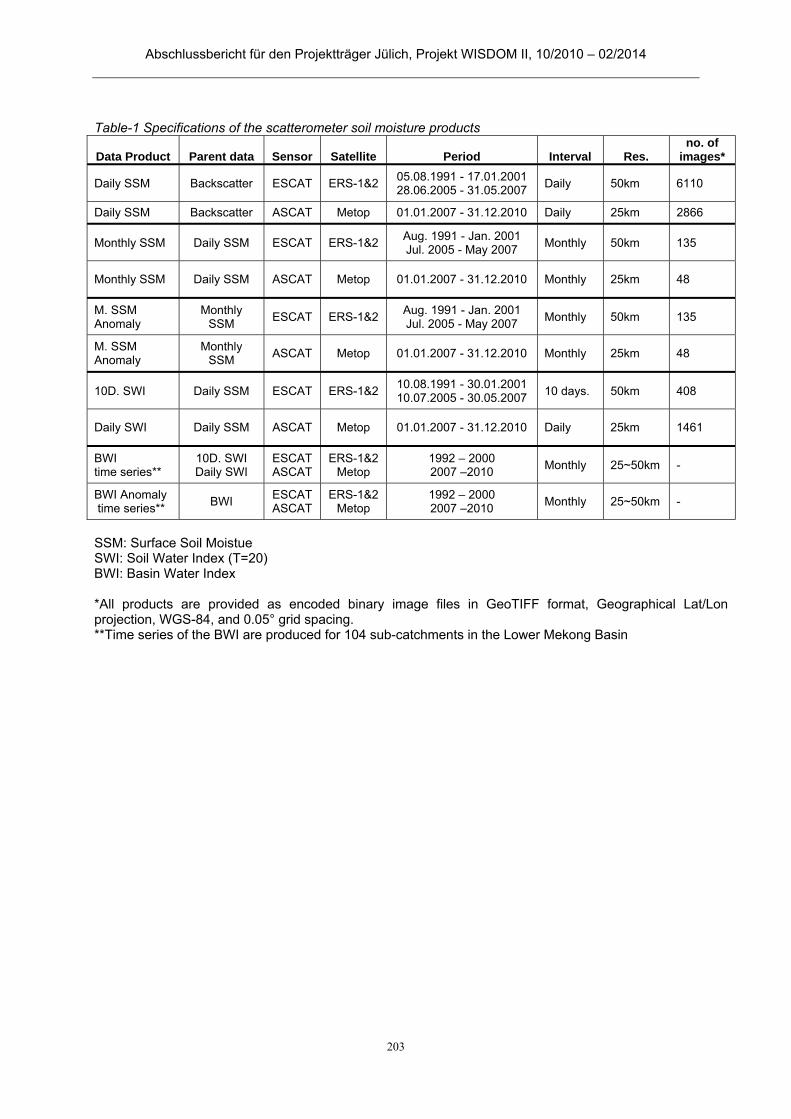
Abschlussbericht für den Projektträger Jülich, Projekt WISDOM II, 10/2010 – 02/2014
203
Table-1 Specifications of the scatterometer soil moisture products Data Product Parent data Sensor Satellite Period Interval Res.
no. of images*
Daily SSM Backscatter ESCAT ERS-1&2 05.08.1991 - 17.01.2001 28.06.2005 - 31.05.2007
Daily 50km 6110
Daily SSM Backscatter ASCAT Metop 01.01.2007 - 31.12.2010 Daily 25km 2866
Monthly SSM Daily SSM ESCAT ERS-1&2 Aug. 1991 - Jan. 2001 Jul. 2005 - May 2007
Monthly 50km 135
Monthly SSM Daily SSM ASCAT Metop 01.01.2007 - 31.12.2010 Monthly 25km 48
M. SSM Anomaly
Monthly SSM
ESCAT ERS-1&2 Aug. 1991 - Jan. 2001 Jul. 2005 - May 2007
Monthly 50km 135
M. SSM Anomaly
Monthly SSM
ASCAT Metop 01.01.2007 - 31.12.2010 Monthly 25km 48
10D. SWI Daily SSM ESCAT ERS-1&2 10.08.1991 - 30.01.2001 10.07.2005 - 30.05.2007
10 days. 50km 408
Daily SWI Daily SSM ASCAT Metop 01.01.2007 - 31.12.2010 Daily 25km 1461
BWI time series**
10D. SWI Daily SWI
ESCAT ASCAT
ERS-1&2 Metop
1992 – 2000 2007 –2010
Monthly 25~50km -
BWI Anomaly time series**
BWI ESCAT ASCAT
ERS-1&2 Metop
1992 – 2000 2007 –2010
Monthly 25~50km -
SSM: Surface Soil Moistue SWI: Soil Water Index (T=20) BWI: Basin Water Index *All products are provided as encoded binary image files in GeoTIFF format, Geographical Lat/Lon projection, WGS-84, and 0.05° grid spacing. **Time series of the BWI are produced for 104 sub-catchments in the Lower Mekong Basin

Abschlussbericht für den Projektträger Jülich, Projekt WISDOM II, 10/2010 – 02/2014
204
2.1.4.2 Envisat ASAR data
Management of the high resolution ASAR data in time series format is challenging due to the large amount of data in global scale. Many improvements have been made with respect to hardware infrastructure and software development in order to improve database access and storage. ASAR database has been restructured and reorganized using a new Distributed File System, which facilitates data resampling and processing. The ASAR processing steps for soil moisture retrieval consisted of 1- Orthorectification, geocoding and radiometric calibration the orbit scenes (raw input data) 2- Resampling the geocoded images to a regular grid (re-ordering from images to time series format) 3- Normalization of the backscatter measurement to a reference incidence angle (30°) using the model parameters 4- Scaling the normalized backscatter measurements. ASAR GM level 1b raw data were needed to be georeferenced before the resampling procedure. For georeferencing ASAR images the Next ESA SAR Toolbox (NEST) has been employed, which is an open source toolbox for reading, post-processing, analysing and visualising the large archive of data (from Level 1) from ESA SAR missions including ERS-1 & 2, ENVISAT. The geocoding software employs the Range-Doppler method, with the use of DORIS precise state vectors and a DEM for terrain correction. Absolute radiometric calibration was carried out based on the elevation antenna pattern parameters contained in the ASAR GM datasets. The software generates, in addition to the geocoded and calibrated sigma nought images, also the corresponding local incidence angle images. The model parameters have been retrieved based on analysis of time series of backscatter measurements. It is necessary to have the full time series of data for each location readily accessible. Therefore, the sigma nought and local incidence angle acquisitions must be re-ordered from image format to a time series format. For this purpose, the data were resampled to a fixed grid and stored in a database structure. The grid was defined in the Plate Carée map projection, based on the WGS84 datum, with a sample distance of 15 arc-seconds and the coordinate system origin
Figure 2 a) Mean of surface soil moisture b) Standard deviation of soil moisture c) Sensitivity, difference between the highest and lowest backscatter values over a multi-year period.

Abschlussbericht für den Projektträger Jülich, Projekt WISDOM II, 10/2010 – 02/2014
205
at latitude 90°S and longitude 180°W. The grid was divided into tiles of 0.5°x0.5°, with 120x120 grid samples per tile. After normalization and scaling steps, ASAR soil moisture data are extracted for an area limited to 8.1°-34.4°N, 93.2°-109.4°, covering the region of interest in WISDOM project. The extracted images are then stored in GeoTIFF format for further processing. The ASAR GM coverage in Southeast Asia is shown in Figure 3. Over the major part of the of the Mekong river basin, there is a good ASAR GM coverage (typically > 250 images), while over the Mekong delta in Vietnam it is somewhat lower. However, the ASAR Wide Swath data were also used to improve data coverage. Figure 4 illustrates the coverage of ASAR WS data for the Mekong. While the standard approach for SSM retrieval is usage of ASAR GM data, it is possible to use also ASAR WS data. The WS data can beneficially complement the GM data, in particular for the Delta. Another benefit of using WS data is the higher radiometric quality as compared to GM (Figure 5). Therefore, it was decided to process WS data also for the entire Mekong Basin. In total, more than 4000 ASAR GM dataset were geocoded and resampled for the Mekong Basin.In addition to ASAR GM data, 935 ASAR WS datasets covering the entire Mekong Basin were geocoded and resampled to the common ASAR GM and WS backscatter time series database.
For the generation of soil moisture product from the ASAR GM and WS observations, SAR Geophysical Retrieval Toolbox (SGRT) developed at TU Wien-GEO, has been used. The SGRT has the capability of bridging to Next ESA SAR Toolbox (NEST) for orthorectification, georeferencing and radiometric calibration. Figure 6 illustrates the updated part of SGRT as flowchart. Before running the SGRT for the Mekong Basin, possible improvements in the method for normalizing the dependence of sigma naught on local incidence angle were investigated. Currently, a linear model is used to normalize all sigma naught measurements to a reference local incidence angle, based on knowledge of the sensitivity of sigma naught to changes in local incidence angle. This parameter is termed slope and is given in dB/degree and retrieved through temporal analysis of SAR data. In some cases striping artifacts are generated along the edges of overlapping swaths. Several different alternative methods were tested, including using a Gaussian weighting in the linear fit of the sigma naught measurements across the swath. This reduced the striping to some degree but introduced more noise to the normalized sigma naught values. Also a retrieval where only measurements acquired at incidence angles above 20 degrees were included was tested, with the result of removing about half of the artifacts. Also here, the noise was higher than
Figure 3 ENVISAT ASAR Global Mode coverage of south-east Asia
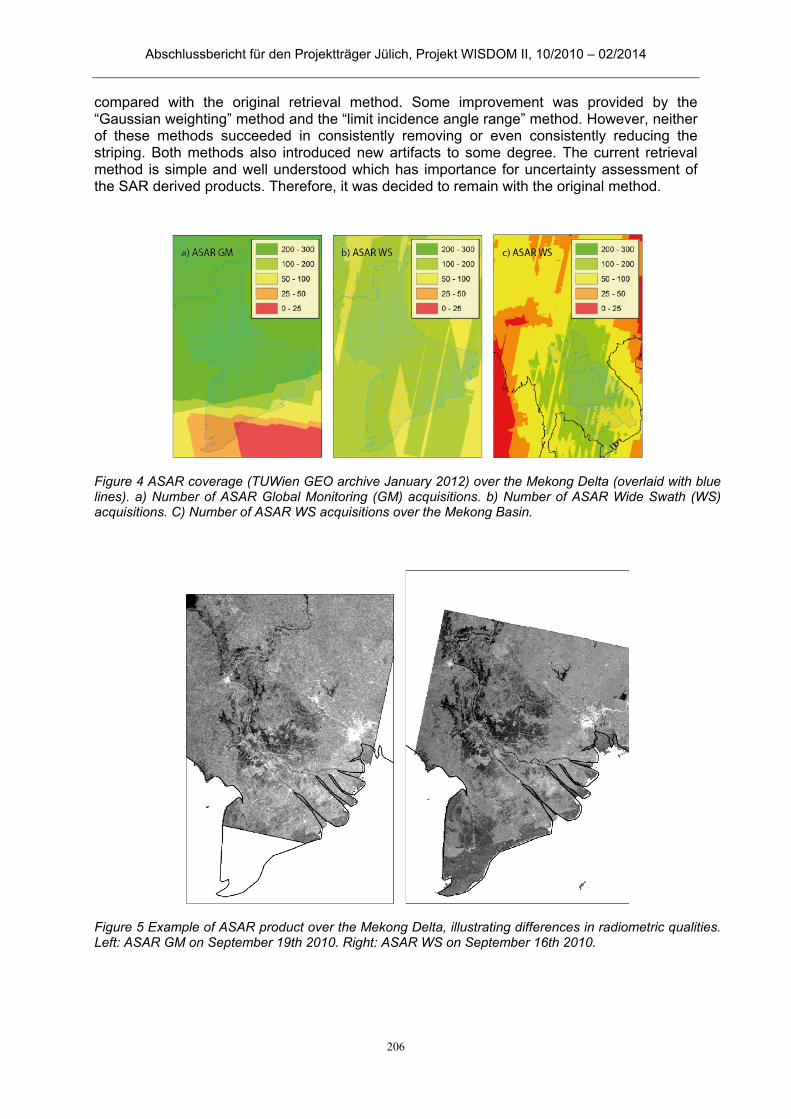
Abschlussbericht für den Projektträger Jülich, Projekt WISDOM II, 10/2010 – 02/2014
206
compared with the original retrieval method. Some improvement was provided by the “Gaussian weighting” method and the “limit incidence angle range” method. However, neither of these methods succeeded in consistently removing or even consistently reducing the striping. Both methods also introduced new artifacts to some degree. The current retrieval method is simple and well understood which has importance for uncertainty assessment of the SAR derived products. Therefore, it was decided to remain with the original method.
Figure 4 ASAR coverage (TUWien GEO archive January 2012) over the Mekong Delta (overlaid with blue lines). a) Number of ASAR Global Monitoring (GM) acquisitions. b) Number of ASAR Wide Swath (WS) acquisitions. C) Number of ASAR WS acquisitions over the Mekong Basin.
Figure 5 Example of ASAR product over the Mekong Delta, illustrating differences in radiometric qualities. Left: ASAR GM on September 19th 2010. Right: ASAR WS on September 16th 2010.
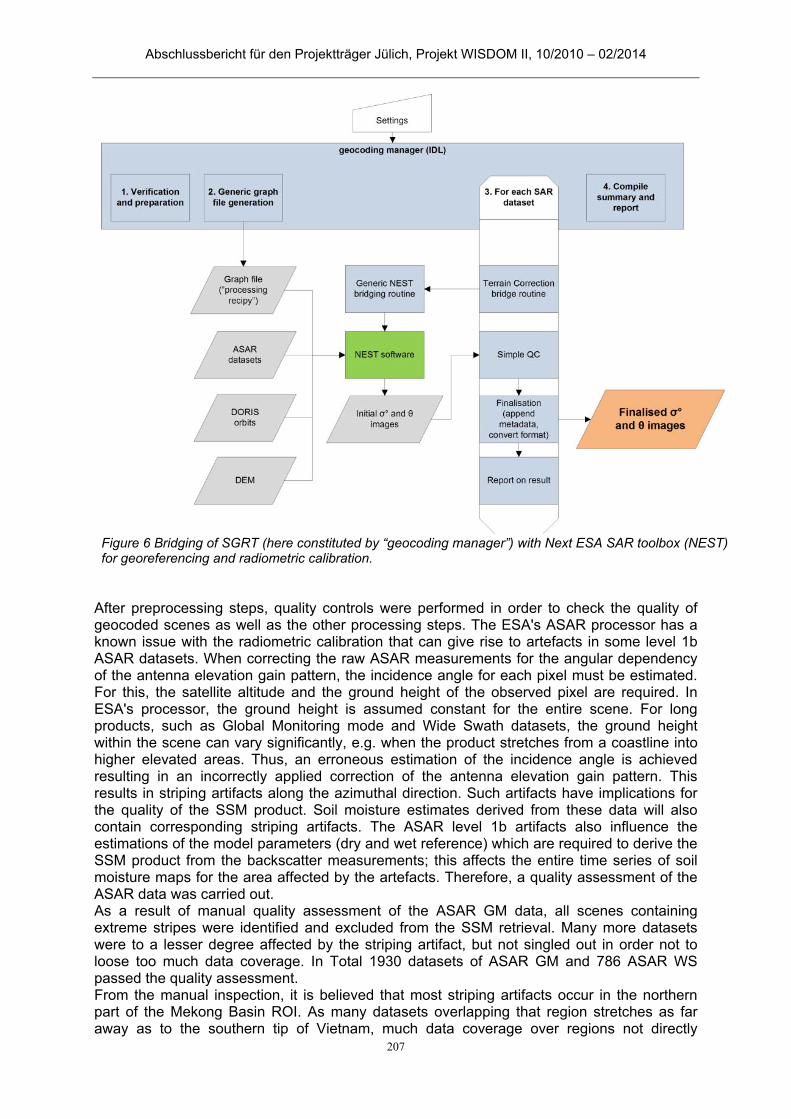
Abschlussbericht für den Projektträger Jülich, Projekt WISDOM II, 10/2010 – 02/2014
207
After preprocessing steps, quality controls were performed in order to check the quality of geocoded scenes as well as the other processing steps. The ESA's ASAR processor has a known issue with the radiometric calibration that can give rise to artefacts in some level 1b ASAR datasets. When correcting the raw ASAR measurements for the angular dependency of the antenna elevation gain pattern, the incidence angle for each pixel must be estimated. For this, the satellite altitude and the ground height of the observed pixel are required. In ESA's processor, the ground height is assumed constant for the entire scene. For long products, such as Global Monitoring mode and Wide Swath datasets, the ground height within the scene can vary significantly, e.g. when the product stretches from a coastline into higher elevated areas. Thus, an erroneous estimation of the incidence angle is achieved resulting in an incorrectly applied correction of the antenna elevation gain pattern. This results in striping artifacts along the azimuthal direction. Such artifacts have implications for the quality of the SSM product. Soil moisture estimates derived from these data will also contain corresponding striping artifacts. The ASAR level 1b artifacts also influence the estimations of the model parameters (dry and wet reference) which are required to derive the SSM product from the backscatter measurements; this affects the entire time series of soil moisture maps for the area affected by the artefacts. Therefore, a quality assessment of the ASAR data was carried out. As a result of manual quality assessment of the ASAR GM data, all scenes containing extreme stripes were identified and excluded from the SSM retrieval. Many more datasets were to a lesser degree affected by the striping artifact, but not singled out in order not to loose too much data coverage. In Total 1930 datasets of ASAR GM and 786 ASAR WS passed the quality assessment. From the manual inspection, it is believed that most striping artifacts occur in the northern part of the Mekong Basin ROI. As many datasets overlapping that region stretches as far away as to the southern tip of Vietnam, much data coverage over regions not directly
Figure 6 Bridging of SGRT (here constituted by “geocoding manager”) with Next ESA SAR toolbox (NEST) for georeferencing and radiometric calibration.

Abschlussbericht für den Projektträger Jülich, Projekt WISDOM II, 10/2010 – 02/2014
208
affected by the artifacts would be lost if all datasets affected by artifacts would be removed entirely.
Error characterization of the Scatteroemter-derived soil moisture 2.1.5
In parallel to the soil moisture retrieval, an error analysis is carried out within the TUWien algorithm to determine the uncertainties associated with the measurements and the model parameters. The noise model is initialized with a so-called azimuthal noise, caused by surface anisotropy, and propagated through the retrieval algorithm. Using such an error propagation procedure, the uncertainties in the measured variables are carried over to determine the final surface soil moisture noise. The noise of soil moisture retrieved from the scatterometer data comprises errors coming from the instrument, azimuthal anisotropy, speckle, as well as the uncertainties associated with the model parameters. Backscatter has the lowest sensitivity to changes at the soil surface in very densely vegetated area like rainforest, where the penetration of the C-band signal is limited and therefore the majority of backscatter comes from the vegetation canopy. The lowest sensitivity in Southeast Asia is evident in Central Vietnam and parts of Laos, northern Myanmar, southwest Cambodia and the southern part of Thailand where dense vegetation dominates (e.g., Thorn forest, evergreen forest). Figure 7-a shows the Estimated Standard Deviation of backscatter (ESD) and Figure 7-b shows the mean of the estimated SSM noise in Southeast Asia.
The estimated SSM noise can be used to identify areas where the algorithm has the lowest performance. This includes areas with dense vegetation cover, sand deserts, coastal areas, water bodies, areas covered with permanent snow or ice, and areas with complex topography. Figure 8 shows the range and magnitude of the SSM noise averaged for
Figure 7 a) Estimated Standard Deviation (ESD) of the backscatter signal; b) Mean of the TUWien soil moisture retrieval noise.
Abschlussbericht für den Projektträger Jülich, Projekt WISDOM II, 10/2010 – 02/2014
209
different land cover types based on GLC2000 land cover data in Southeast Asia. However, because of the large footprint size of the scatterometer sensor, the impact of land cover on the SSM noise is not very clear in areas that are characterized by a mixture of different classes of land cover. The highest uncertainty in the soil moisture retrieval occurs when the soil surface is partly covered with water because retrieval is not possible over water bodies. Backscattering from water depends on roughness of the water surface. When the water
surface is calm then specular reflection occurs and 0 is the lowest. The large water reservoirs, shallow bodies of water like swamps, marshes, estuaries, rivers and any set of small bodies of water increases the soil moisture noise depending on the water extent compared to the spatial resolution of the scatterometer. However, the magnitude of backscatter noise can be moderated in presence of vegetation as it is the case in swamp areas in the LMB. In the Mekong river basin, the effect of water on SSM retrieval is becoming critical during the flooding season. The structural properties of the surface and the three dimensional architecture of vegetation have also a clear influence on the backscatter sensitivity and SSM retrieval uncertainty. In general, backscatter from the land surfaces covered by vegetation is governed by the scattering properties of the geometrical elements that can be considered to be made up of vegetation, soil surface and the interaction between the vegetation volume and soil surface in the form of multiple scattering [28–31]. The highest sensitivity and therefore lowest uncertainty in the SSM retrieval is obtained in agricultural regions, shrubs and grasslands. The quality of soil moisture retrieval is degraded over anisotropic surfaces, which could be classified as Barren, Gravels, or even Savannas. The quality of the SSM retrieval is also affected in areas with complex topography. The most problematic situation occur when the scatterometer beam reaches the base of a slant feature such as a mountainside tilted towards the satellite track, the local incidence angles of the fore and aft beams varies depending on the look angle of the scatterometer antennas and the slope of the mountainside. Maximum deviation of local incidence angle occurs when the satellite track is parallel to the slant surface. If the look direction becomes perpendicular to the orientation of surface feature, a large portion of incident energy will be reflected back to the sensor. The more oblique look direction in relation to the feature orientation, the less energy will be returned to the sensor. The look direction can significantly influence the azimuthal noise, particularly when ground features are arranged in a linear structure, such as mountain ranges. The higher azimuthal noise is observable in areas with complex topography, where the standard deviation of elevation is large. Figure 9 (right) indicates the normalized standard deviation of elevation in Southeast Asia based on GTOPO30 digital elevation model data. Scatterplots in Figure 9 show the increasing of the averaged SSM noise with intensifying the degree of topographic complexity.
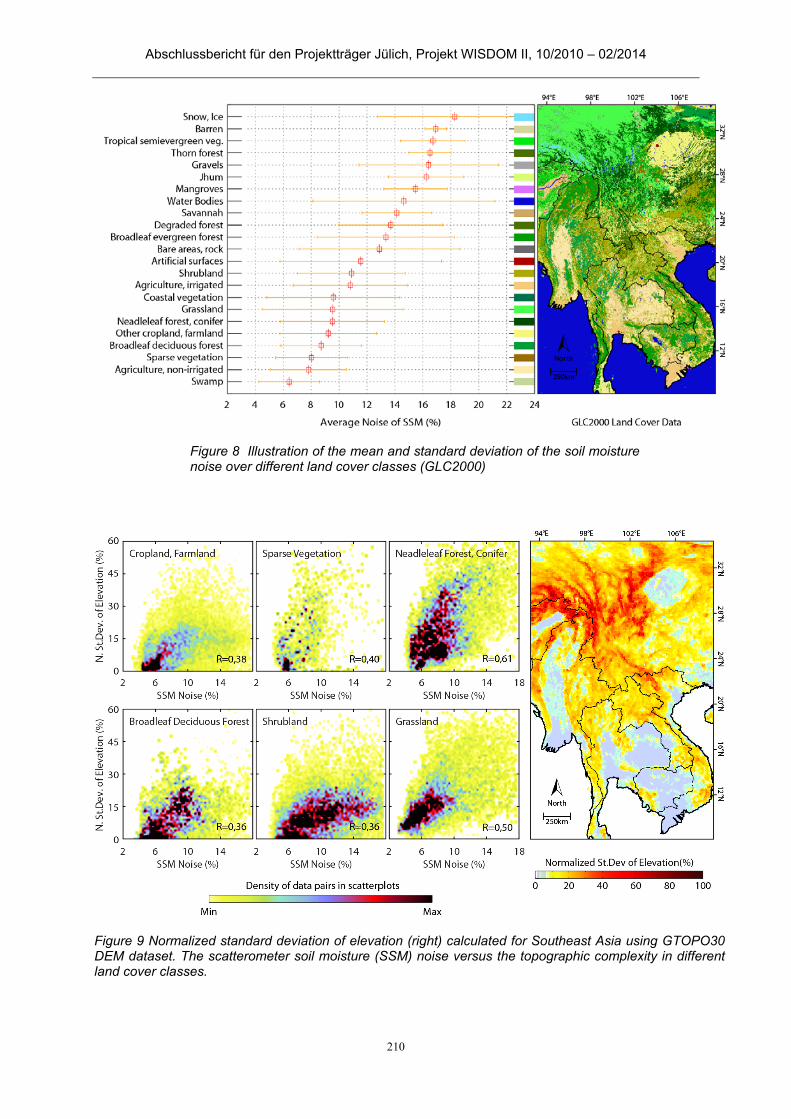
Abschlussbericht für den Projektträger Jülich, Projekt WISDOM II, 10/2010 – 02/2014
210
Figure 8 Illustration of the mean and standard deviation of the soil moisture noise over different land cover classes (GLC2000)
Figure 9 Normalized standard deviation of elevation (right) calculated for Southeast Asia using GTOPO30 DEM dataset. The scatterometer soil moisture (SSM) noise versus the topographic complexity in different land cover classes.
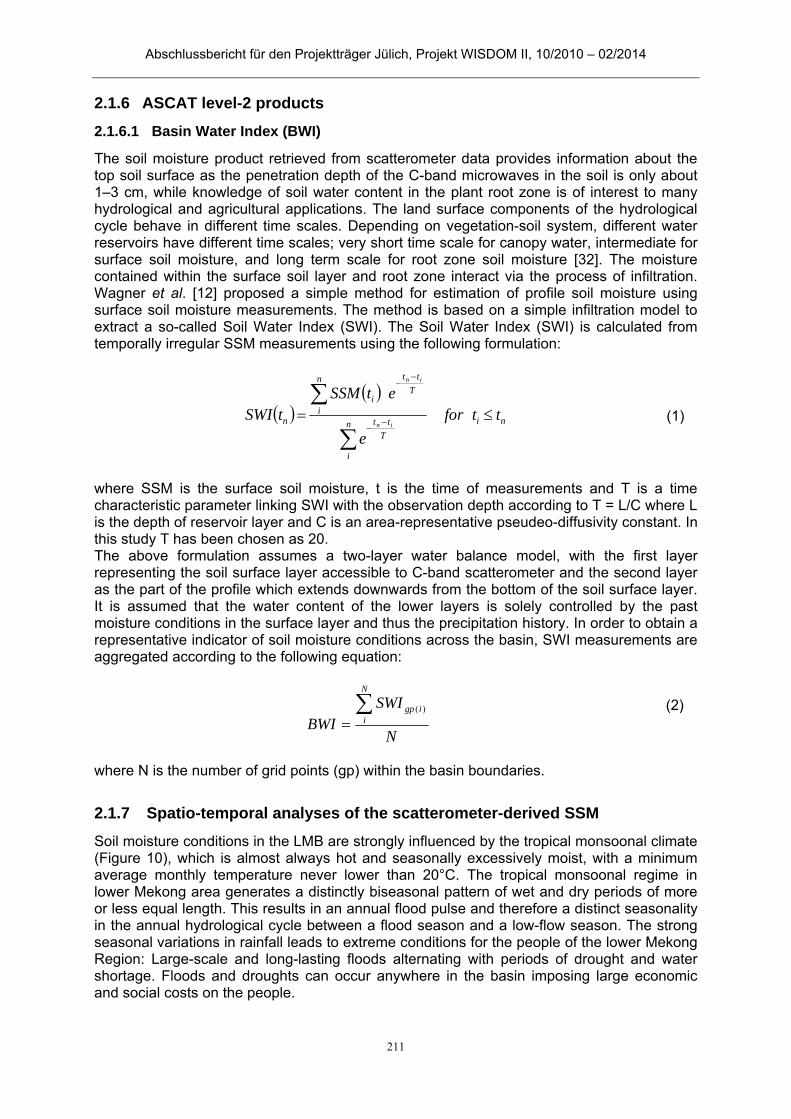
Abschlussbericht für den Projektträger Jülich, Projekt WISDOM II, 10/2010 – 02/2014
211
ASCAT level-2 products 2.1.6
2.1.6.1 Basin Water Index (BWI)
The soil moisture product retrieved from scatterometer data provides information about the top soil surface as the penetration depth of the C-band microwaves in the soil is only about 1–3 cm, while knowledge of soil water content in the plant root zone is of interest to many hydrological and agricultural applications. The land surface components of the hydrological cycle behave in different time scales. Depending on vegetation-soil system, different water reservoirs have different time scales; very short time scale for canopy water, intermediate for surface soil moisture, and long term scale for root zone soil moisture [32]. The moisture contained within the surface soil layer and root zone interact via the process of infiltration. Wagner et al. [12] proposed a simple method for estimation of profile soil moisture using surface soil moisture measurements. The method is based on a simple infiltration model to extract a so-called Soil Water Index (SWI). The Soil Water Index (SWI) is calculated from temporally irregular SSM measurements using the following formulation:
nin
i
T
tt
n
i
T
tt
i
n ttfor
e
etSSMtSWI
in
in
(1)
where SSM is the surface soil moisture, t is the time of measurements and T is a time characteristic parameter linking SWI with the observation depth according to T = L/C where L is the depth of reservoir layer and C is an area-representative pseudeo-diffusivity constant. In this study T has been chosen as 20. The above formulation assumes a two-layer water balance model, with the first layer representing the soil surface layer accessible to C-band scatterometer and the second layer as the part of the profile which extends downwards from the bottom of the soil surface layer. It is assumed that the water content of the lower layers is solely controlled by the past moisture conditions in the surface layer and thus the precipitation history. In order to obtain a representative indicator of soil moisture conditions across the basin, SWI measurements are aggregated according to the following equation:
N
SWIBWI
N
iigp
)(
(2)
where N is the number of grid points (gp) within the basin boundaries.
Spatio-temporal analyses of the scatterometer-derived SSM 2.1.7
Soil moisture conditions in the LMB are strongly influenced by the tropical monsoonal climate (Figure 10), which is almost always hot and seasonally excessively moist, with a minimum average monthly temperature never lower than 20°C. The tropical monsoonal regime in lower Mekong area generates a distinctly biseasonal pattern of wet and dry periods of more or less equal length. This results in an annual flood pulse and therefore a distinct seasonality in the annual hydrological cycle between a flood season and a low-flow season. The strong seasonal variations in rainfall leads to extreme conditions for the people of the lower Mekong Region: Large-scale and long-lasting floods alternating with periods of drought and water shortage. Floods and droughts can occur anywhere in the basin imposing large economic and social costs on the people.

Abschlussbericht für den Projektträger Jülich, Projekt WISDOM II, 10/2010 – 02/2014
212
The annual mean temperature in the LMB region varies just only few degrees between the hottest and coldest months of the year and the annual rainfall and evaporation are roughly equal over the major part of the basin. However, the variability of soil moisture is high throughout the LMB. Soil moisture patterns in the LMB are closely related to seasonal hydro-meteorological factors as well as the sub-catchments characteristics. The variability of soil moisture differs significantly, depending on region and month of the year, and changes year to year. Transition from dry to wet season in the LMB occurs in the period between March and May and transition from wet to dry season happens sometime between November and January [8]. The annual variability of normalized backscatter can be used for determination of the seasonal transition times. The transition times are calculated by using a least square fitting method of a step function applied on backscatter time series in the period of 2007–2010 [33]. According to this parameter, it can be seen in Figure 11 that the transition from dry to wet soil conditions in the LMB is observed foremost in the Delta region followed by in the agricultural regions in the northern Vietnam and southeastern Tonle Sap sub-catchments during the second half of March which is most likely related to irrigation activities. The onset of wet season begins in the Northern Highlands during April and in the rest of LMB sometime in May.
Figure 10 Koeppen-Geiger climate map of Southeast Asia.
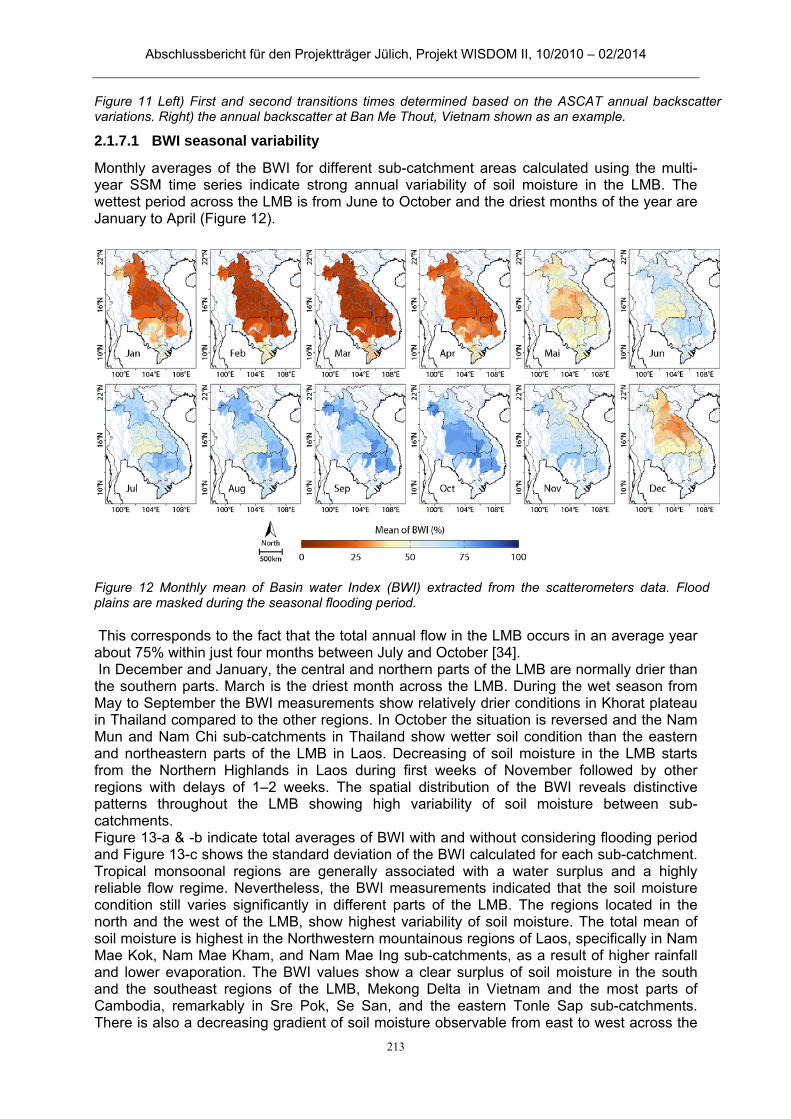
Abschlussbericht für den Projektträger Jülich, Projekt WISDOM II, 10/2010 – 02/2014
213
2.1.7.1 BWI seasonal variability
Monthly averages of the BWI for different sub-catchment areas calculated using the multi-year SSM time series indicate strong annual variability of soil moisture in the LMB. The wettest period across the LMB is from June to October and the driest months of the year are January to April (Figure 12).
This corresponds to the fact that the total annual flow in the LMB occurs in an average year about 75% within just four months between July and October [34]. In December and January, the central and northern parts of the LMB are normally drier than the southern parts. March is the driest month across the LMB. During the wet season from May to September the BWI measurements show relatively drier conditions in Khorat plateau in Thailand compared to the other regions. In October the situation is reversed and the Nam Mun and Nam Chi sub-catchments in Thailand show wetter soil condition than the eastern and northeastern parts of the LMB in Laos. Decreasing of soil moisture in the LMB starts from the Northern Highlands in Laos during first weeks of November followed by other regions with delays of 1–2 weeks. The spatial distribution of the BWI reveals distinctive patterns throughout the LMB showing high variability of soil moisture between sub-catchments. Figure 13-a & -b indicate total averages of BWI with and without considering flooding period and Figure 13-c shows the standard deviation of the BWI calculated for each sub-catchment. Tropical monsoonal regions are generally associated with a water surplus and a highly reliable flow regime. Nevertheless, the BWI measurements indicated that the soil moisture condition still varies significantly in different parts of the LMB. The regions located in the north and the west of the LMB, show highest variability of soil moisture. The total mean of soil moisture is highest in the Northwestern mountainous regions of Laos, specifically in Nam Mae Kok, Nam Mae Kham, and Nam Mae Ing sub-catchments, as a result of higher rainfall and lower evaporation. The BWI values show a clear surplus of soil moisture in the south and the southeast regions of the LMB, Mekong Delta in Vietnam and the most parts of Cambodia, remarkably in Sre Pok, Se San, and the eastern Tonle Sap sub-catchments. There is also a decreasing gradient of soil moisture observable from east to west across the
Figure 11 Left) First and second transitions times determined based on the ASCAT annual backscatter variations. Right) the annual backscatter at Ban Me Thout, Vietnam shown as an example.
Figure 12 Monthly mean of Basin water Index (BWI) extracted from the scatterometers data. Flood plains are masked during the seasonal flooding period.

Abschlussbericht für den Projektträger Jülich, Projekt WISDOM II, 10/2010 – 02/2014
214
Mekong River within the regions located in the central LMB. The highest evaporation occurs over the Khorat Plateau in northeast Thailand, one of the driest parts of Southeast Asia [8], which is also reflected in the soil moisture observations. In spite of significant soil moisture excess during the rainy season in summer, the total mean of soil moisture in this region is rather low compared to the other regions across the LMB. This implies that the area is particularly vulnerable to critically low levels of soil moisture during winter and has a high occurrence potential of agricultural drought conditions
2.1.7.2 BWI anomalies in the LMB
The anomalies of BWI were calculated for all sub-catchments in the LMB using the total mean and standard deviation of soil moisture in catchment scale. Figure 14 illustrates the anomaly maps of BWI. Soil moisture retrieval is not possible during flooding period in Tonle Sap basin and Mekong Delta as the soil surface is usually covered largely with water. Therefore during the flooding period, the scatterometer measurements in these sub-catchments are excluded from the BWI anomaly calculation. Occurrence and location of the extreme events across the LMB differs each year depending on rainfall patterns and climate conditions. According to [8], there is no significant connection in the severity of the annual flood or drought between the northern and southern parts of the LMB, as the weather generating mechanisms which cause extreme conditions such as tropical storms and cyclones are usually not large enough to affect the region as a whole. The extreme wet conditions across the LMB between July and October are associated each year with a massive flood wave towards the LMB lowlands. During the flood season, water flows from the Mekong and Bassac rivers into the Tonle Sap Lake. From October onwards the flow direction is reversed and the water is drained back into the Mekong and Bassac rivers [35]. Each year, vast regions across the Cambodian lowlands and Vietnam delta are flooded for 2–4 months, affecting the life of several million people [1].
Figure 13 (a) Total mean of the calculated BWI; (b) Total Mean of the BWI after excluding flooding period; (c) Standard deviation of the BWI, during the periods of 1991–200 and 2007–2011.
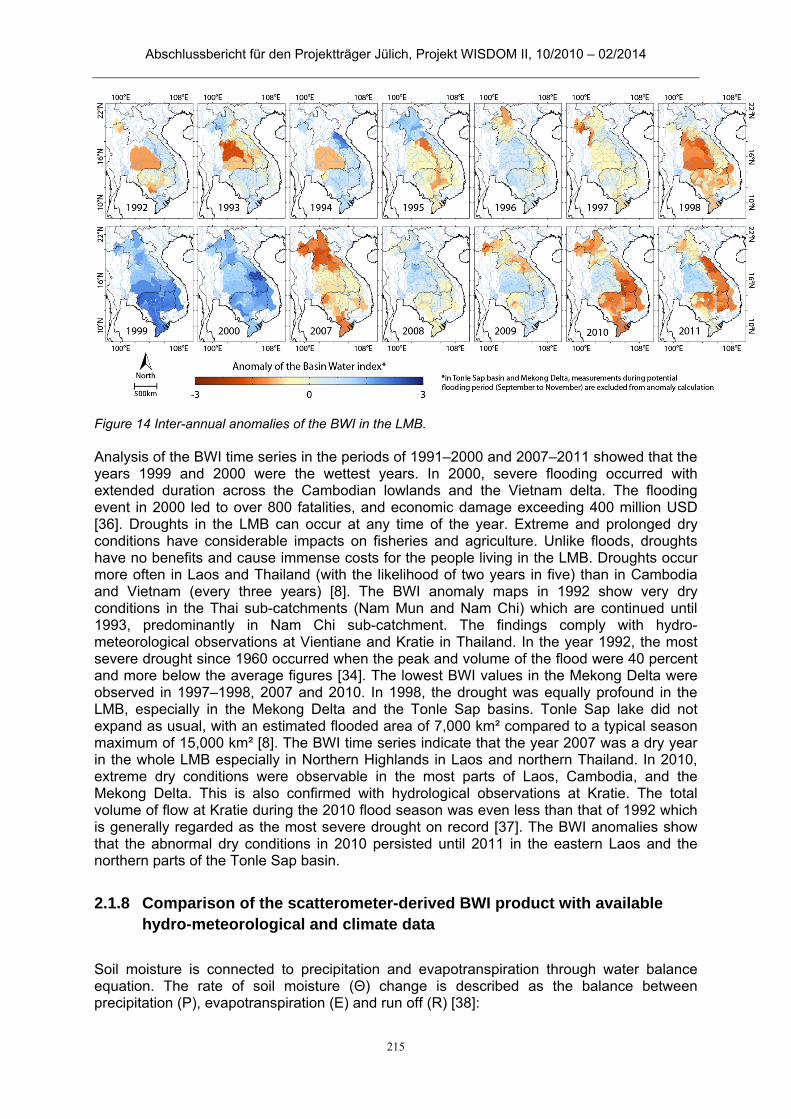
Abschlussbericht für den Projektträger Jülich, Projekt WISDOM II, 10/2010 – 02/2014
215
Analysis of the BWI time series in the periods of 1991–2000 and 2007–2011 showed that the years 1999 and 2000 were the wettest years. In 2000, severe flooding occurred with extended duration across the Cambodian lowlands and the Vietnam delta. The flooding event in 2000 led to over 800 fatalities, and economic damage exceeding 400 million USD [36]. Droughts in the LMB can occur at any time of the year. Extreme and prolonged dry conditions have considerable impacts on fisheries and agriculture. Unlike floods, droughts have no benefits and cause immense costs for the people living in the LMB. Droughts occur more often in Laos and Thailand (with the likelihood of two years in five) than in Cambodia and Vietnam (every three years) [8]. The BWI anomaly maps in 1992 show very dry conditions in the Thai sub-catchments (Nam Mun and Nam Chi) which are continued until 1993, predominantly in Nam Chi sub-catchment. The findings comply with hydro-meteorological observations at Vientiane and Kratie in Thailand. In the year 1992, the most severe drought since 1960 occurred when the peak and volume of the flood were 40 percent and more below the average figures [34]. The lowest BWI values in the Mekong Delta were observed in 1997–1998, 2007 and 2010. In 1998, the drought was equally profound in the LMB, especially in the Mekong Delta and the Tonle Sap basins. Tonle Sap lake did not expand as usual, with an estimated flooded area of 7,000 km² compared to a typical season maximum of 15,000 km² [8]. The BWI time series indicate that the year 2007 was a dry year in the whole LMB especially in Northern Highlands in Laos and northern Thailand. In 2010, extreme dry conditions were observable in the most parts of Laos, Cambodia, and the Mekong Delta. This is also confirmed with hydrological observations at Kratie. The total volume of flow at Kratie during the 2010 flood season was even less than that of 1992 which is generally regarded as the most severe drought on record [37]. The BWI anomalies show that the abnormal dry conditions in 2010 persisted until 2011 in the eastern Laos and the northern parts of the Tonle Sap basin.
Comparison of the scatterometer-derived BWI product with available 2.1.8hydro-meteorological and climate data
Soil moisture is connected to precipitation and evapotranspiration through water balance equation. The rate of soil moisture (Θ) change is described as the balance between precipitation (P), evapotranspiration (E) and run off (R) [38]:
Figure 14 Inter-annual anomalies of the BWI in the LMB.
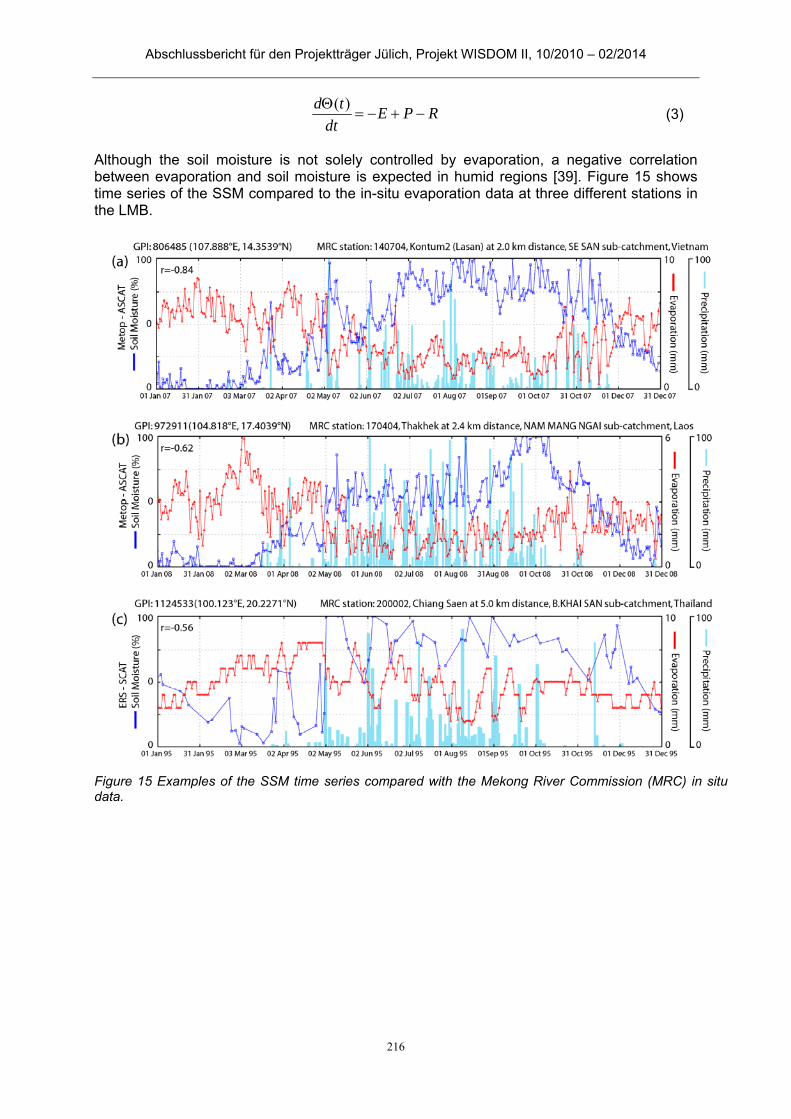
Abschlussbericht für den Projektträger Jülich, Projekt WISDOM II, 10/2010 – 02/2014
216
RPEdt
td
)( (3)
Although the soil moisture is not solely controlled by evaporation, a negative correlation between evaporation and soil moisture is expected in humid regions [39]. Figure 15 shows time series of the SSM compared to the in-situ evaporation data at three different stations in the LMB.
Figure 15 Examples of the SSM time series compared with the Mekong River Commission (MRC) in situ data.

Abschlussbericht für den Projektträger Jülich, Projekt WISDOM II, 10/2010 – 02/2014
217
The results of comparison reveal a significant linear relationship between the SSM and the evaporation across the basin with the most significant correlation of R = −0.85 at Se San sub-catchment in Vietnam. Figure 16 shows the results of analysis for all available evaporation measuring stations. It is shown that the inverse correlation was intensified in wet season after excluding the measurements during the flooding period most evidently in Khorat plateau and Delta region. Soil moisture variation due to evaporation, runoff and precipitation occurs on different time scales influenced by soil physical properties and vegetation. Soil texture and structure determine pore size distribution in the soil and therefore they are important factors in determining the rate of water movement in unsaturated soil [40]. Vegetation type and density have also impact on soil water storage dynamics due to different evapotranspiration patterns. Nevertheless, considering the water balance equation, soil moisture increases when precipitation or irrigation exceed evaporation, evapotranspiration and run off. Figure 17 shows three examples of monthly GPCC data compared to weekly composites of SSM indicating a noticeable relation between soil moisture and precipitation. Although the total soil water content depends on sum of input precipitation and output evaporation and run off, it is expected that precipitation anomalies are reflected in soil moisture observations. Figure 18 indicates the results of correlation analysis between GPCC monthly anomalies and SSM monthly composites.
Figure 16 Comparison results of the SSM with in situ evaporation data.
Figure 17 Comparison of the monthly GPCC data with the SSM weekly composites.
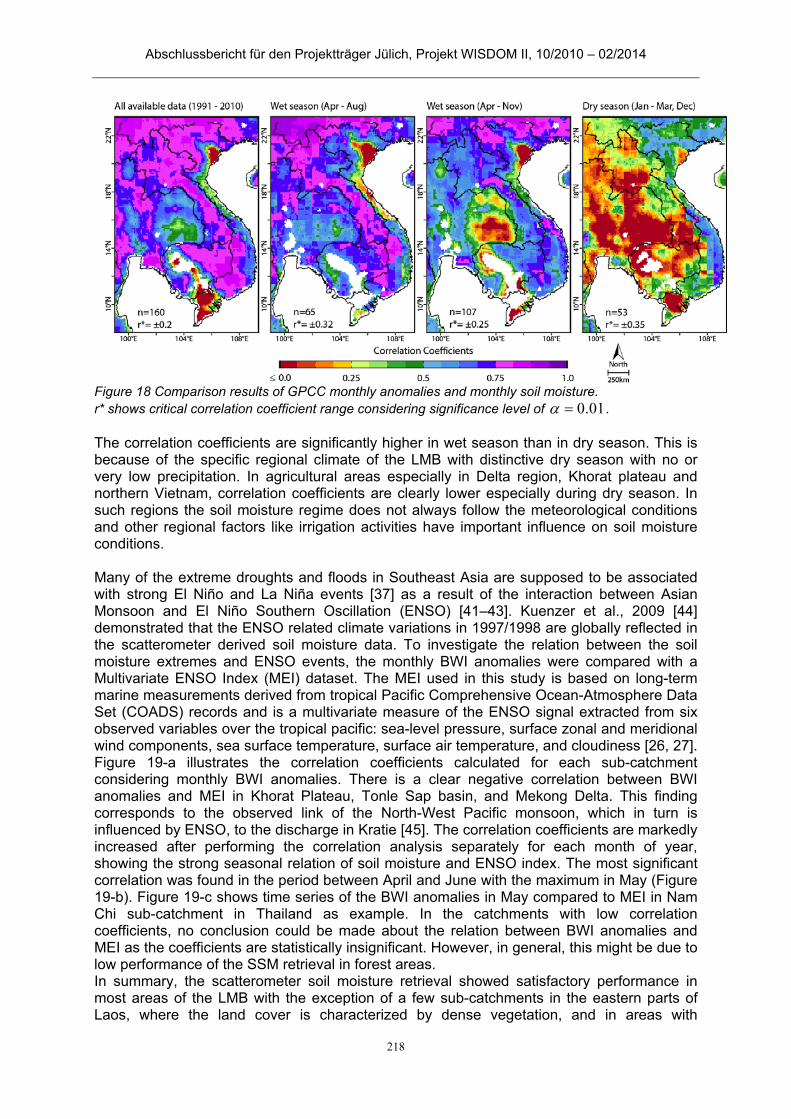
Abschlussbericht für den Projektträger Jülich, Projekt WISDOM II, 10/2010 – 02/2014
218
The correlation coefficients are significantly higher in wet season than in dry season. This is because of the specific regional climate of the LMB with distinctive dry season with no or very low precipitation. In agricultural areas especially in Delta region, Khorat plateau and northern Vietnam, correlation coefficients are clearly lower especially during dry season. In such regions the soil moisture regime does not always follow the meteorological conditions and other regional factors like irrigation activities have important influence on soil moisture conditions. Many of the extreme droughts and floods in Southeast Asia are supposed to be associated with strong El Niño and La Niña events [37] as a result of the interaction between Asian Monsoon and El Niño Southern Oscillation (ENSO) [41–43]. Kuenzer et al., 2009 [44] demonstrated that the ENSO related climate variations in 1997/1998 are globally reflected in the scatterometer derived soil moisture data. To investigate the relation between the soil moisture extremes and ENSO events, the monthly BWI anomalies were compared with a Multivariate ENSO Index (MEI) dataset. The MEI used in this study is based on long-term marine measurements derived from tropical Pacific Comprehensive Ocean-Atmosphere Data Set (COADS) records and is a multivariate measure of the ENSO signal extracted from six observed variables over the tropical pacific: sea-level pressure, surface zonal and meridional wind components, sea surface temperature, surface air temperature, and cloudiness [26, 27]. Figure 19-a illustrates the correlation coefficients calculated for each sub-catchment considering monthly BWI anomalies. There is a clear negative correlation between BWI anomalies and MEI in Khorat Plateau, Tonle Sap basin, and Mekong Delta. This finding corresponds to the observed link of the North-West Pacific monsoon, which in turn is influenced by ENSO, to the discharge in Kratie [45]. The correlation coefficients are markedly increased after performing the correlation analysis separately for each month of year, showing the strong seasonal relation of soil moisture and ENSO index. The most significant correlation was found in the period between April and June with the maximum in May (Figure 19-b). Figure 19-c shows time series of the BWI anomalies in May compared to MEI in Nam Chi sub-catchment in Thailand as example. In the catchments with low correlation coefficients, no conclusion could be made about the relation between BWI anomalies and MEI as the coefficients are statistically insignificant. However, in general, this might be due to low performance of the SSM retrieval in forest areas. In summary, the scatterometer soil moisture retrieval showed satisfactory performance in most areas of the LMB with the exception of a few sub-catchments in the eastern parts of Laos, where the land cover is characterized by dense vegetation, and in areas with
Figure 18 Comparison results of GPCC monthly anomalies and monthly soil moisture. r* shows critical correlation coefficient range considering significance level of 01.0 .
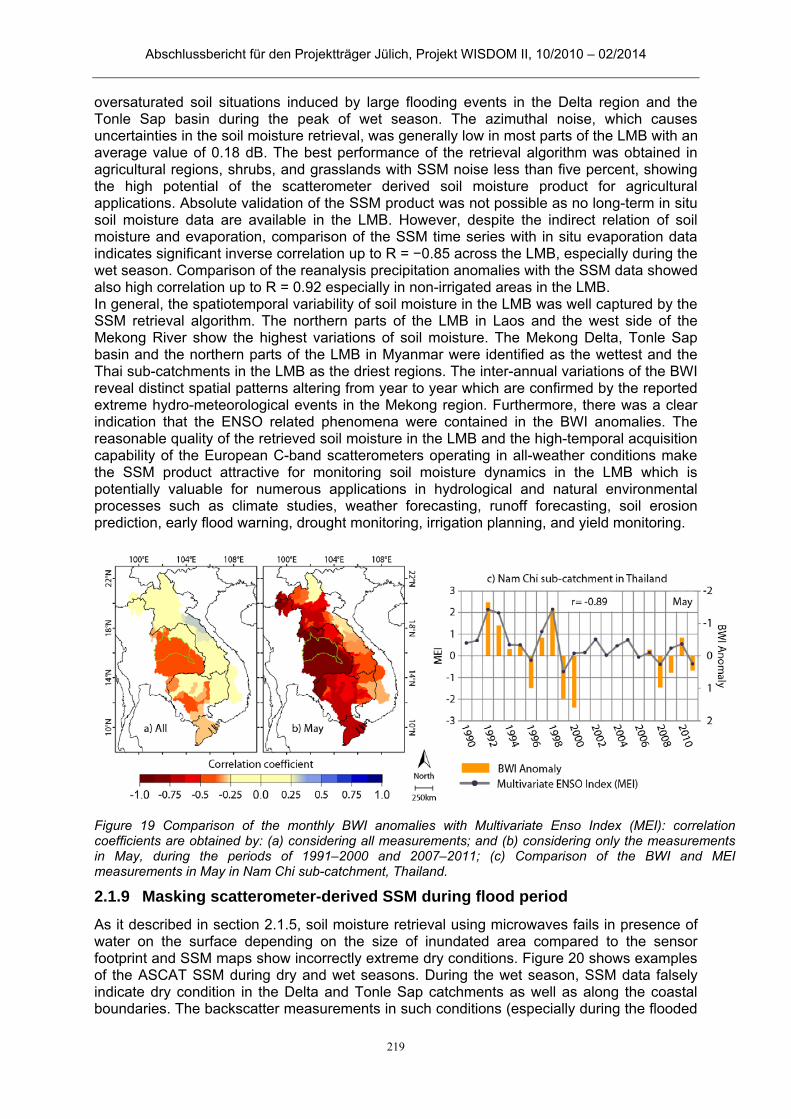
Abschlussbericht für den Projektträger Jülich, Projekt WISDOM II, 10/2010 – 02/2014
219
oversaturated soil situations induced by large flooding events in the Delta region and the Tonle Sap basin during the peak of wet season. The azimuthal noise, which causes uncertainties in the soil moisture retrieval, was generally low in most parts of the LMB with an average value of 0.18 dB. The best performance of the retrieval algorithm was obtained in agricultural regions, shrubs, and grasslands with SSM noise less than five percent, showing the high potential of the scatterometer derived soil moisture product for agricultural applications. Absolute validation of the SSM product was not possible as no long-term in situ soil moisture data are available in the LMB. However, despite the indirect relation of soil moisture and evaporation, comparison of the SSM time series with in situ evaporation data indicates significant inverse correlation up to R = −0.85 across the LMB, especially during the wet season. Comparison of the reanalysis precipitation anomalies with the SSM data showed also high correlation up to R = 0.92 especially in non-irrigated areas in the LMB. In general, the spatiotemporal variability of soil moisture in the LMB was well captured by the SSM retrieval algorithm. The northern parts of the LMB in Laos and the west side of the Mekong River show the highest variations of soil moisture. The Mekong Delta, Tonle Sap basin and the northern parts of the LMB in Myanmar were identified as the wettest and the Thai sub-catchments in the LMB as the driest regions. The inter-annual variations of the BWI reveal distinct spatial patterns altering from year to year which are confirmed by the reported extreme hydro-meteorological events in the Mekong region. Furthermore, there was a clear indication that the ENSO related phenomena were contained in the BWI anomalies. The reasonable quality of the retrieved soil moisture in the LMB and the high-temporal acquisition capability of the European C-band scatterometers operating in all-weather conditions make the SSM product attractive for monitoring soil moisture dynamics in the LMB which is potentially valuable for numerous applications in hydrological and natural environmental processes such as climate studies, weather forecasting, runoff forecasting, soil erosion prediction, early flood warning, drought monitoring, irrigation planning, and yield monitoring.
Masking scatterometer-derived SSM during flood period 2.1.9
As it described in section 2.1.5, soil moisture retrieval using microwaves fails in presence of water on the surface depending on the size of inundated area compared to the sensor footprint and SSM maps show incorrectly extreme dry conditions. Figure 20 shows examples of the ASCAT SSM during dry and wet seasons. During the wet season, SSM data falsely indicate dry condition in the Delta and Tonle Sap catchments as well as along the coastal boundaries. The backscatter measurements in such conditions (especially during the flooded
Figure 19 Comparison of the monthly BWI anomalies with Multivariate Enso Index (MEI): correlation coefficients are obtained by: (a) considering all measurements; and (b) considering only the measurements in May, during the periods of 1991–2000 and 2007–2011; (c) Comparison of the BWI and MEI measurements in May in Nam Chi sub-catchment, Thailand.
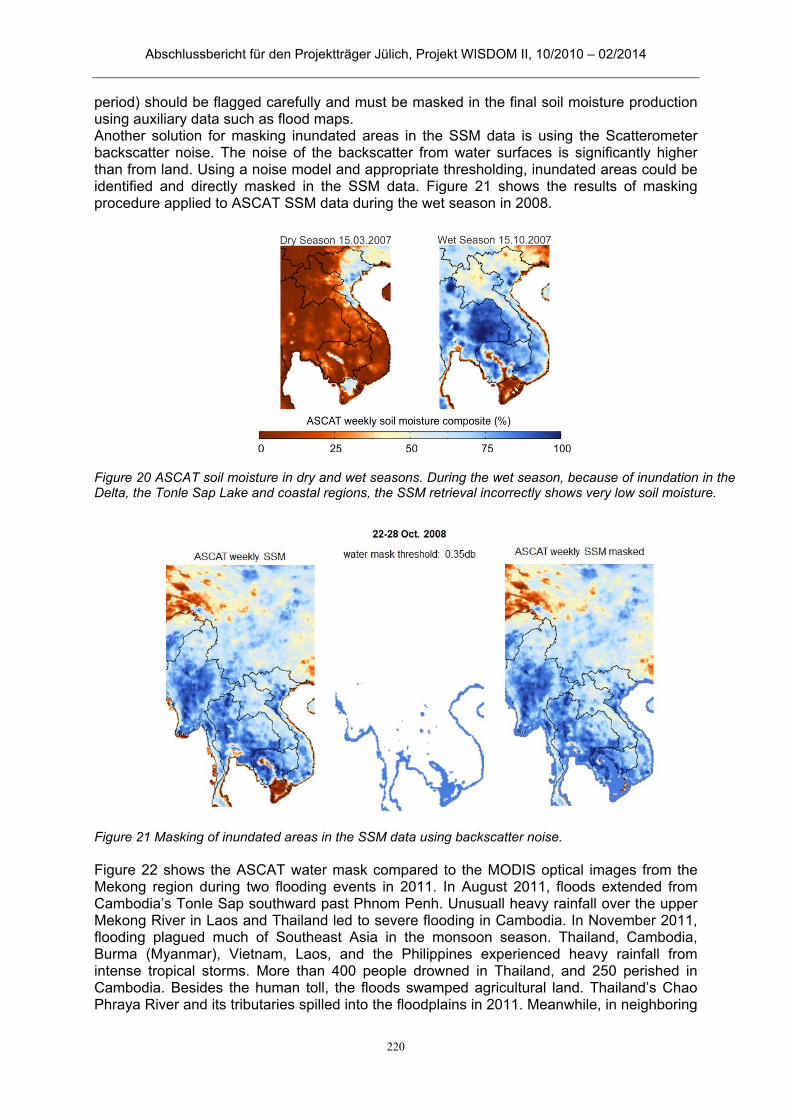
Abschlussbericht für den Projektträger Jülich, Projekt WISDOM II, 10/2010 – 02/2014
220
period) should be flagged carefully and must be masked in the final soil moisture production using auxiliary data such as flood maps. Another solution for masking inundated areas in the SSM data is using the Scatterometer backscatter noise. The noise of the backscatter from water surfaces is significantly higher than from land. Using a noise model and appropriate thresholding, inundated areas could be identified and directly masked in the SSM data. Figure 21 shows the results of masking procedure applied to ASCAT SSM data during the wet season in 2008.
Figure 22 shows the ASCAT water mask compared to the MODIS optical images from the Mekong region during two flooding events in 2011. In August 2011, floods extended from Cambodia’s Tonle Sap southward past Phnom Penh. Unusuall heavy rainfall over the upper Mekong River in Laos and Thailand led to severe flooding in Cambodia. In November 2011, flooding plagued much of Southeast Asia in the monsoon season. Thailand, Cambodia, Burma (Myanmar), Vietnam, Laos, and the Philippines experienced heavy rainfall from intense tropical storms. More than 400 people drowned in Thailand, and 250 perished in Cambodia. Besides the human toll, the floods swamped agricultural land. Thailand’s Chao Phraya River and its tributaries spilled into the floodplains in 2011. Meanwhile, in neighboring
Figure 20 ASCAT soil moisture in dry and wet seasons. During the wet season, because of inundation in the Delta, the Tonle Sap Lake and coastal regions, the SSM retrieval incorrectly shows very low soil moisture.
Figure 21 Masking of inundated areas in the SSM data using backscatter noise.
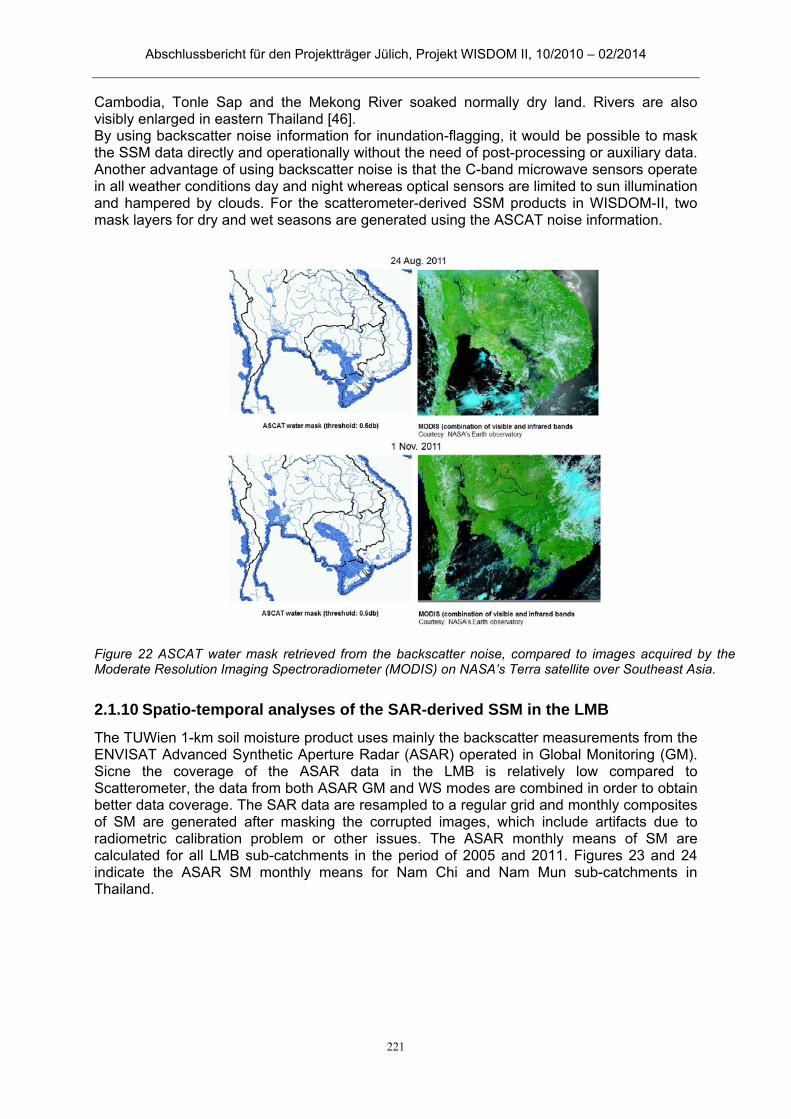
Abschlussbericht für den Projektträger Jülich, Projekt WISDOM II, 10/2010 – 02/2014
221
Cambodia, Tonle Sap and the Mekong River soaked normally dry land. Rivers are also visibly enlarged in eastern Thailand [46]. By using backscatter noise information for inundation-flagging, it would be possible to mask the SSM data directly and operationally without the need of post-processing or auxiliary data. Another advantage of using backscatter noise is that the C-band microwave sensors operate in all weather conditions day and night whereas optical sensors are limited to sun illumination and hampered by clouds. For the scatterometer-derived SSM products in WISDOM-II, two mask layers for dry and wet seasons are generated using the ASCAT noise information.
Spatio-temporal analyses of the SAR-derived SSM in the LMB 2.1.10
The TUWien 1-km soil moisture product uses mainly the backscatter measurements from the ENVISAT Advanced Synthetic Aperture Radar (ASAR) operated in Global Monitoring (GM). Sicne the coverage of the ASAR data in the LMB is relatively low compared to Scatterometer, the data from both ASAR GM and WS modes are combined in order to obtain better data coverage. The SAR data are resampled to a regular grid and monthly composites of SM are generated after masking the corrupted images, which include artifacts due to radiometric calibration problem or other issues. The ASAR monthly means of SM are calculated for all LMB sub-catchments in the period of 2005 and 2011. Figures 23 and 24 indicate the ASAR SM monthly means for Nam Chi and Nam Mun sub-catchments in Thailand.
Figure 22 ASCAT water mask retrieved from the backscatter noise, compared to images acquired by the Moderate Resolution Imaging Spectroradiometer (MODIS) on NASA’s Terra satellite over Southeast Asia.
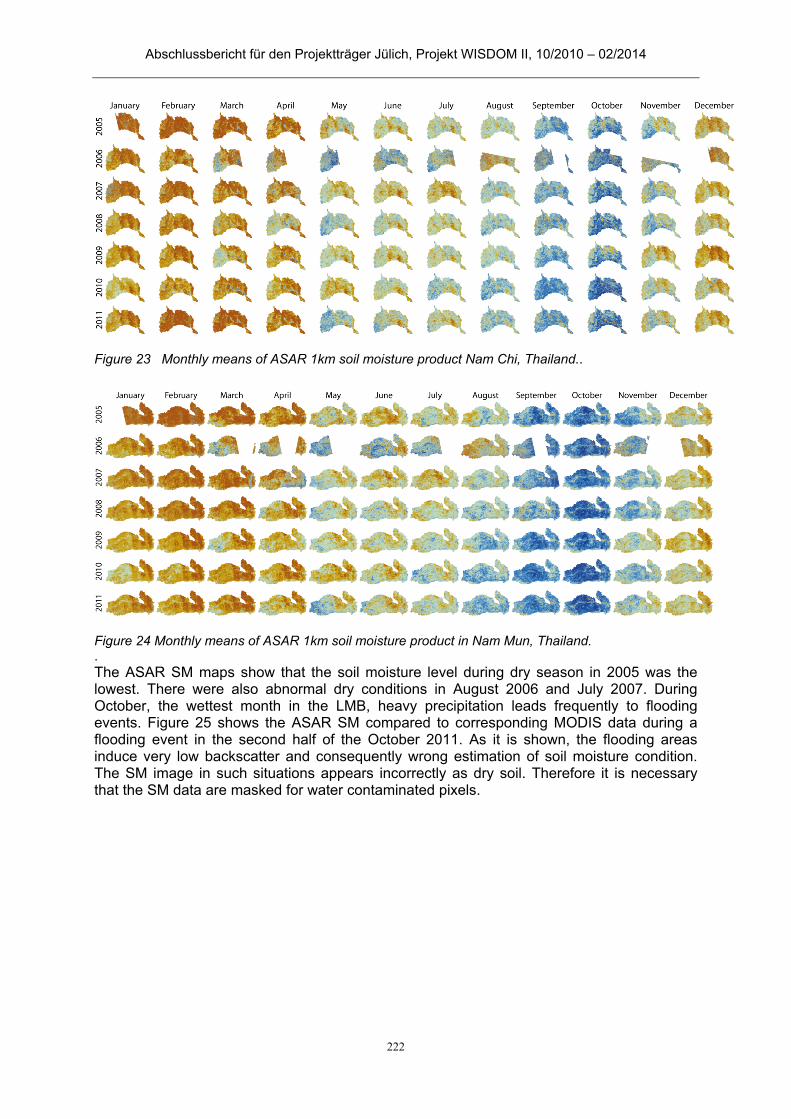
Abschlussbericht für den Projektträger Jülich, Projekt WISDOM II, 10/2010 – 02/2014
222
The ASAR SM maps show that the soil moisture level during dry season in 2005 was the lowest. There were also abnormal dry conditions in August 2006 and July 2007. During October, the wettest month in the LMB, heavy precipitation leads frequently to flooding events. Figure 25 shows the ASAR SM compared to corresponding MODIS data during a flooding event in the second half of the October 2011. As it is shown, the flooding areas induce very low backscatter and consequently wrong estimation of soil moisture condition. The SM image in such situations appears incorrectly as dry soil. Therefore it is necessary that the SM data are masked for water contaminated pixels.
Figure 23 Monthly means of ASAR 1km soil moisture product Nam Chi, Thailand..
Figure 24 Monthly means of ASAR 1km soil moisture product in Nam Mun, Thailand. .
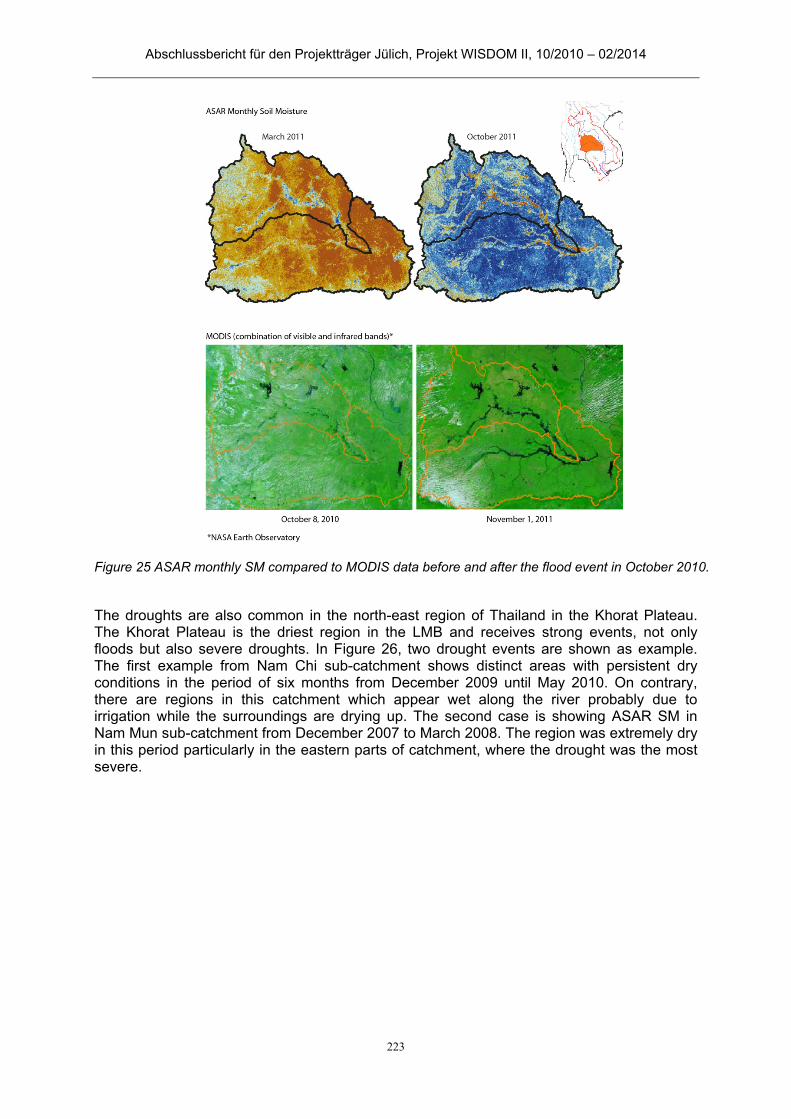
Abschlussbericht für den Projektträger Jülich, Projekt WISDOM II, 10/2010 – 02/2014
223
The droughts are also common in the north-east region of Thailand in the Khorat Plateau. The Khorat Plateau is the driest region in the LMB and receives strong events, not only floods but also severe droughts. In Figure 26, two drought events are shown as example. The first example from Nam Chi sub-catchment shows distinct areas with persistent dry conditions in the period of six months from December 2009 until May 2010. On contrary, there are regions in this catchment which appear wet along the river probably due to irrigation while the surroundings are drying up. The second case is showing ASAR SM in Nam Mun sub-catchment from December 2007 to March 2008. The region was extremely dry in this period particularly in the eastern parts of catchment, where the drought was the most severe.
Figure 25 ASAR monthly SM compared to MODIS data before and after the flood event in October 2010.
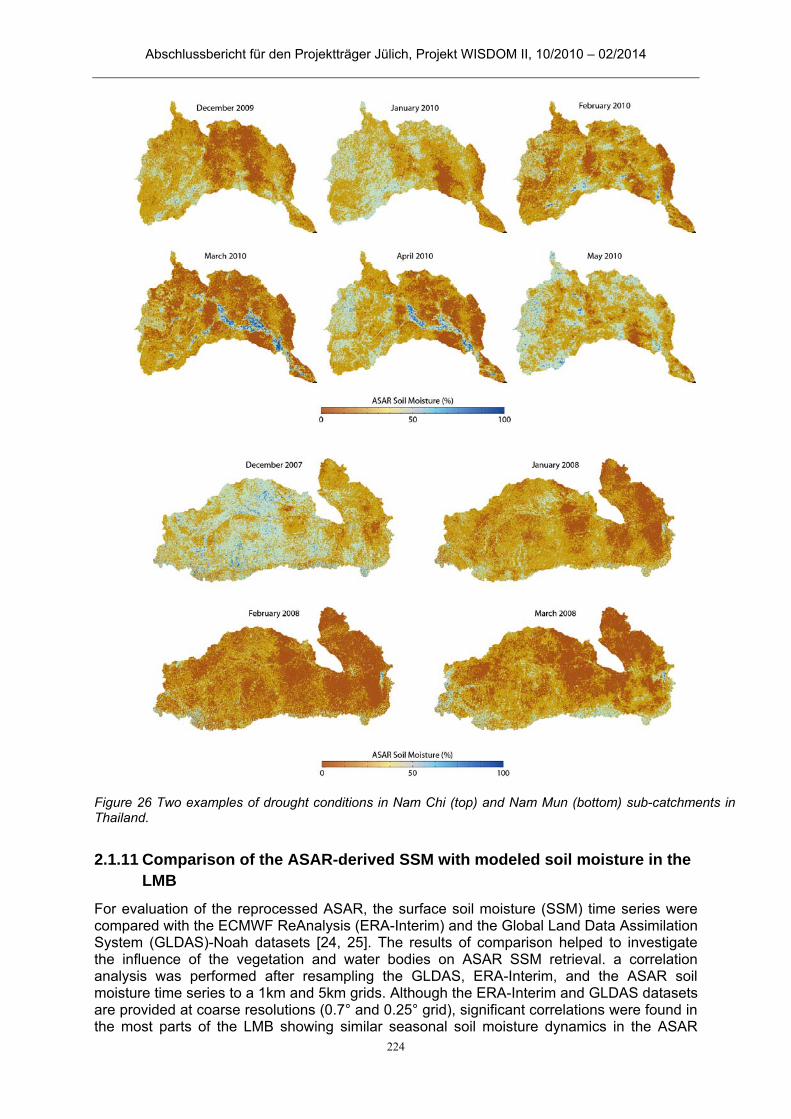
Abschlussbericht für den Projektträger Jülich, Projekt WISDOM II, 10/2010 – 02/2014
224
Comparison of the ASAR-derived SSM with modeled soil moisture in the 2.1.11LMB
For evaluation of the reprocessed ASAR, the surface soil moisture (SSM) time series were compared with the ECMWF ReAnalysis (ERA-Interim) and the Global Land Data Assimilation System (GLDAS)-Noah datasets [24, 25]. The results of comparison helped to investigate the influence of the vegetation and water bodies on ASAR SSM retrieval. a correlation analysis was performed after resampling the GLDAS, ERA-Interim, and the ASAR soil moisture time series to a 1km and 5km grids. Although the ERA-Interim and GLDAS datasets are provided at coarse resolutions (0.7° and 0.25° grid), significant correlations were found in the most parts of the LMB showing similar seasonal soil moisture dynamics in the ASAR
Figure 26 Two examples of drought conditions in Nam Chi (top) and Nam Mun (bottom) sub-catchments in Thailand.

Abschlussbericht für den Projektträger Jülich, Projekt WISDOM II, 10/2010 – 02/2014
225
SSM and modeled data. Figure 27 shows an example of the time series comparison between ASAR and GLDAS soil moisture data for a selected pixel located at 105.39°E, 16.51N°. Figure 28 illustrates maps of correlation coefficients between ASAR and two modeled SSM datasets in the LMB.
The correlation analysis of the ASAR SSM with ERA-Interim and GLDAS show similar results. The lowest correlation was mainly found in flood plains within the delta region and the Tonle Sap catchment. The area with low correlation values mainly includes large flood plains. Soil moisture retrieval from backscatter data basically fails in presence of surface water. The microwaves exhibit nearly specular reflection in case of smooth water surfaces. Such specular reflection results in a large portion of the incident radiation being directed away from the radar, with a resulting low backscatter measurements. The highest correlation coefficients were obtained in the Khorat plateau, and the East/East-south sub-catchments of the LMB which mostly consist of agricultural areas (cropland/shrubland). Moderate correlation coefficients were observed in the Northern Highlands and areas characterized by
Figure 27 A comparison example of the ASAR SSM GM time series with corresponding GLDAS soil moisture data resampled to 5km grid (pixel location: 105.39°E, 16.51N°).
Figure 28 Correlation maps of the ASAR SSM with ERA-Interim (left) and GLDAS-NOAH (right) modeled soil moisture data.
01Jan08
04Mar08
07May08
09Jul08
11Sep08
13Nov08
16Jan09
20Mar09
23May09
25Jul09
27Sep09
29Nov09
01Feb10
05Apr10
08Jun10
10Aug10
13Oct10
15Dec10
17Feb11
21Apr11
24Jun11
26Aug11
29Oct11
31Dec11
0
20
40
60
80
100
AS
AR
Soi
l Moi
stu
re (
%)
0.0
0.1
0.2
0.3
0.4
0.5
GL
DA
S S
oil M
ois
ture
(m
³/m
³)

Abschlussbericht für den Projektträger Jülich, Projekt WISDOM II, 10/2010 – 02/2014
226
densely vegetated/forest. In these regions, soil moisture retrieval would not be possible due to limited microwave penetration depth at C-band and strong volume scattering. In order to provide reliable estimates of soil moisture and related value added analysis, it is necessary to permanent water bodies as well as temporary inundated areas such as floods, for which the backscatter signal is a result of the roughness of the water surface and not of the underlying soil surface. Permanent water bodies as a static variable can be identified directly from the backscatter data using an appropriate thresholding method or by using land cover maps but detecting flooded areas are more challenging as a dynamic detection approach is needed. In principle, backscatter from calm water surfaces is very low because of specular reflection of the incident microwaves. An example of the influence of flooded pixels on the 1 km SSM product is shown in Figure 29. The low backscatter from the flooded region resembles that of very dry soil, which is why the extent of the flood can be seen in dark brown color in the soil moisture map from August 5 2007. This exceptional flood event struck the Đắk Lắk Province in the Central Highlands of Vietnam, about 25 km south of the city of Buôn Ma Thuột in the beginning of August 2007. The flood covered about 10 km2 of agricultural land. During the event, 23 persons lost their lives and approximately 10000 properties were inundated [47]
Prior to the mentioned flood even, the soil was saturated. Figure 30 shows time series of the 1-km SSM inside the flooded region. Prior to the flood, soil moisture values ranges between about 80-100%. Right after the flood, marked by the yellow dotted line, the data should be masked out since they do not represent soil moisture. After soil saturation, any additional water from precipitation will not infiltrate into the soil and would therefore result in surface runoff. According to the meteorological observations between August 2 and 5, very strong storms with rainfalls of 300-400 mm associated to a Typhoon hit the region. As a result a series of flash floods took place during those days causing an accumulation of surface water which stayed for several weeks.
23 July 2007
5 August 2007
Figure 29 1-km SSM from 23 July and 5 August 2007 covering the Srê Pôk catchment during a flood event
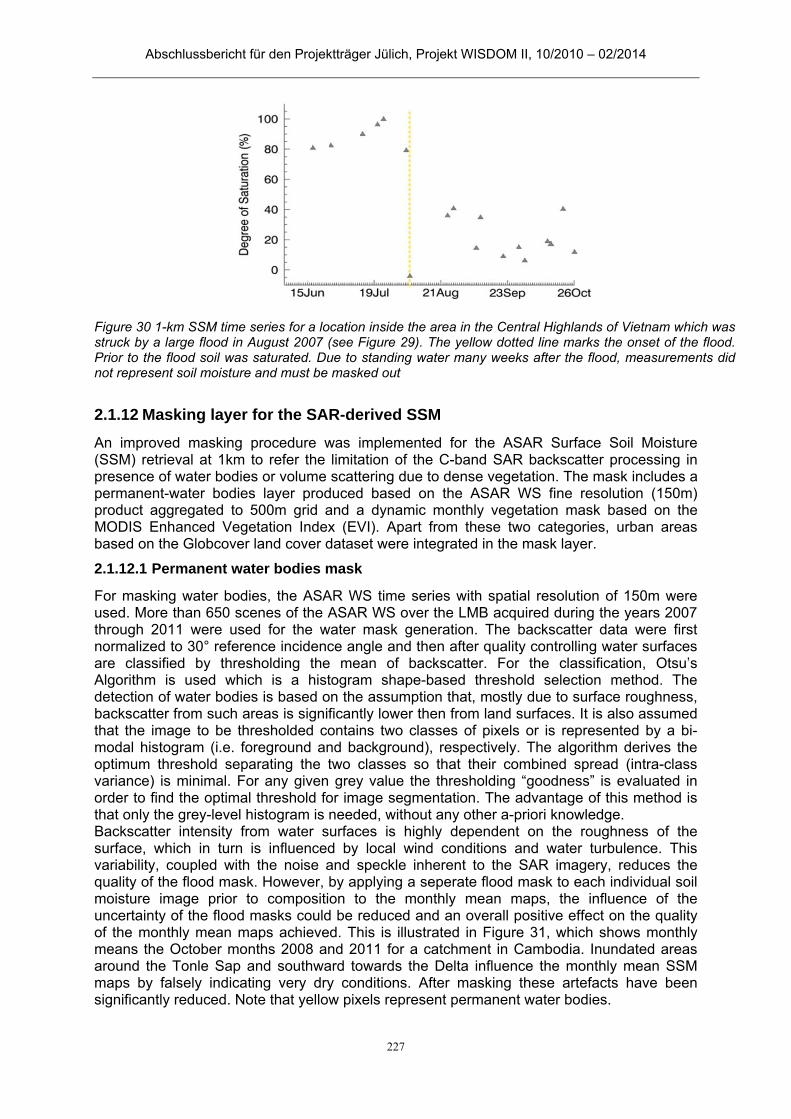
Abschlussbericht für den Projektträger Jülich, Projekt WISDOM II, 10/2010 – 02/2014
227
Masking layer for the SAR-derived SSM 2.1.12
An improved masking procedure was implemented for the ASAR Surface Soil Moisture (SSM) retrieval at 1km to refer the limitation of the C-band SAR backscatter processing in presence of water bodies or volume scattering due to dense vegetation. The mask includes a permanent-water bodies layer produced based on the ASAR WS fine resolution (150m) product aggregated to 500m grid and a dynamic monthly vegetation mask based on the MODIS Enhanced Vegetation Index (EVI). Apart from these two categories, urban areas based on the Globcover land cover dataset were integrated in the mask layer.
2.1.12.1 Permanent water bodies mask
For masking water bodies, the ASAR WS time series with spatial resolution of 150m were used. More than 650 scenes of the ASAR WS over the LMB acquired during the years 2007 through 2011 were used for the water mask generation. The backscatter data were first normalized to 30° reference incidence angle and then after quality controlling water surfaces are classified by thresholding the mean of backscatter. For the classification, Otsu’s Algorithm is used which is a histogram shape-based threshold selection method. The detection of water bodies is based on the assumption that, mostly due to surface roughness, backscatter from such areas is significantly lower then from land surfaces. It is also assumed that the image to be thresholded contains two classes of pixels or is represented by a bi-modal histogram (i.e. foreground and background), respectively. The algorithm derives the optimum threshold separating the two classes so that their combined spread (intra-class variance) is minimal. For any given grey value the thresholding “goodness” is evaluated in order to find the optimal threshold for image segmentation. The advantage of this method is that only the grey-level histogram is needed, without any other a-priori knowledge. Backscatter intensity from water surfaces is highly dependent on the roughness of the surface, which in turn is influenced by local wind conditions and water turbulence. This variability, coupled with the noise and speckle inherent to the SAR imagery, reduces the quality of the flood mask. However, by applying a seperate flood mask to each individual soil moisture image prior to composition to the monthly mean maps, the influence of the uncertainty of the flood masks could be reduced and an overall positive effect on the quality of the monthly mean maps achieved. This is illustrated in Figure 31, which shows monthly means the October months 2008 and 2011 for a catchment in Cambodia. Inundated areas around the Tonle Sap and southward towards the Delta influence the monthly mean SSM maps by falsely indicating very dry conditions. After masking these artefacts have been significantly reduced. Note that yellow pixels represent permanent water bodies.
Figure 30 1-km SSM time series for a location inside the area in the Central Highlands of Vietnam which was struck by a large flood in August 2007 (see Figure 29). The yellow dotted line marks the onset of the flood. Prior to the flood soil was saturated. Due to standing water many weeks after the flood, measurements did not represent soil moisture and must be masked out

Abschlussbericht für den Projektträger Jülich, Projekt WISDOM II, 10/2010 – 02/2014
228
The final mask was aggregated to the ASAR SSM grid (500m pixel spacing) using a hamming window (Figure 32). The mapping of permanent water bodies benefits from the use of time series data, whereby uncertainties related to dynamic local conditions such as wind and rain can be reduced through temporal filtering. The averaging also reduces random fluctuations stemming from thermal noise and speckle. The resulted mask compares well with the 300 m resolution Globcover dataset while providing additional spatial detail due to the 150 m resolution. The permanent water bodies product generated for the entire LMB is illustrated in Figure 33. Permanent water bodies mask can be also used as a standalone product. Information on the distribution of permanent water bodies such as lakes, wetlands, reservoirs and rivers is essential to the assessment of current and future water resources (and for climate modeling).
October 2008, initial version
October 2008, improved version
October 2011, initial version
October 2011, improved version
Figure 31 1-km monthly mean soil moisture maps before (left column) and after (right column) masking flooded pixels in the individual soil moisture images. The map in the top-left shows the location of the catchment in Cambodia. Yellow pixels represent permanent water bodies.

Abschlussbericht für den Projektträger Jülich, Projekt WISDOM II, 10/2010 – 02/2014
229
Figure 32 Mean of the normalized backscatter calculated from multi-year ASAR WS mode data overlaid with the permanent water bodies mask
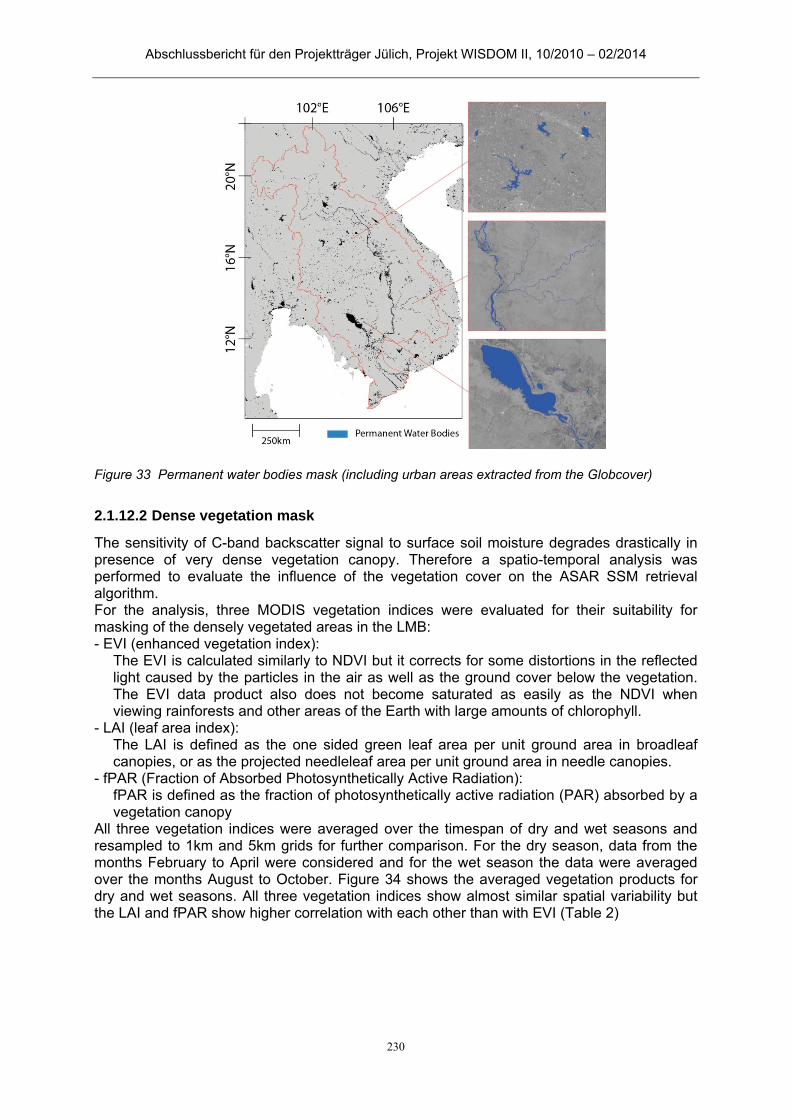
Abschlussbericht für den Projektträger Jülich, Projekt WISDOM II, 10/2010 – 02/2014
230
2.1.12.2 Dense vegetation mask
The sensitivity of C-band backscatter signal to surface soil moisture degrades drastically in presence of very dense vegetation canopy. Therefore a spatio-temporal analysis was performed to evaluate the influence of the vegetation cover on the ASAR SSM retrieval algorithm. For the analysis, three MODIS vegetation indices were evaluated for their suitability for masking of the densely vegetated areas in the LMB: - EVI (enhanced vegetation index):
The EVI is calculated similarly to NDVI but it corrects for some distortions in the reflected light caused by the particles in the air as well as the ground cover below the vegetation. The EVI data product also does not become saturated as easily as the NDVI when viewing rainforests and other areas of the Earth with large amounts of chlorophyll.
- LAI (leaf area index): The LAI is defined as the one sided green leaf area per unit ground area in broadleaf canopies, or as the projected needleleaf area per unit ground area in needle canopies.
- fPAR (Fraction of Absorbed Photosynthetically Active Radiation): fPAR is defined as the fraction of photosynthetically active radiation (PAR) absorbed by a vegetation canopy
All three vegetation indices were averaged over the timespan of dry and wet seasons and resampled to 1km and 5km grids for further comparison. For the dry season, data from the months February to April were considered and for the wet season the data were averaged over the months August to October. Figure 34 shows the averaged vegetation products for dry and wet seasons. All three vegetation indices show almost similar spatial variability but the LAI and fPAR show higher correlation with each other than with EVI (Table 2)
Figure 33 Permanent water bodies mask (including urban areas extracted from the Globcover)
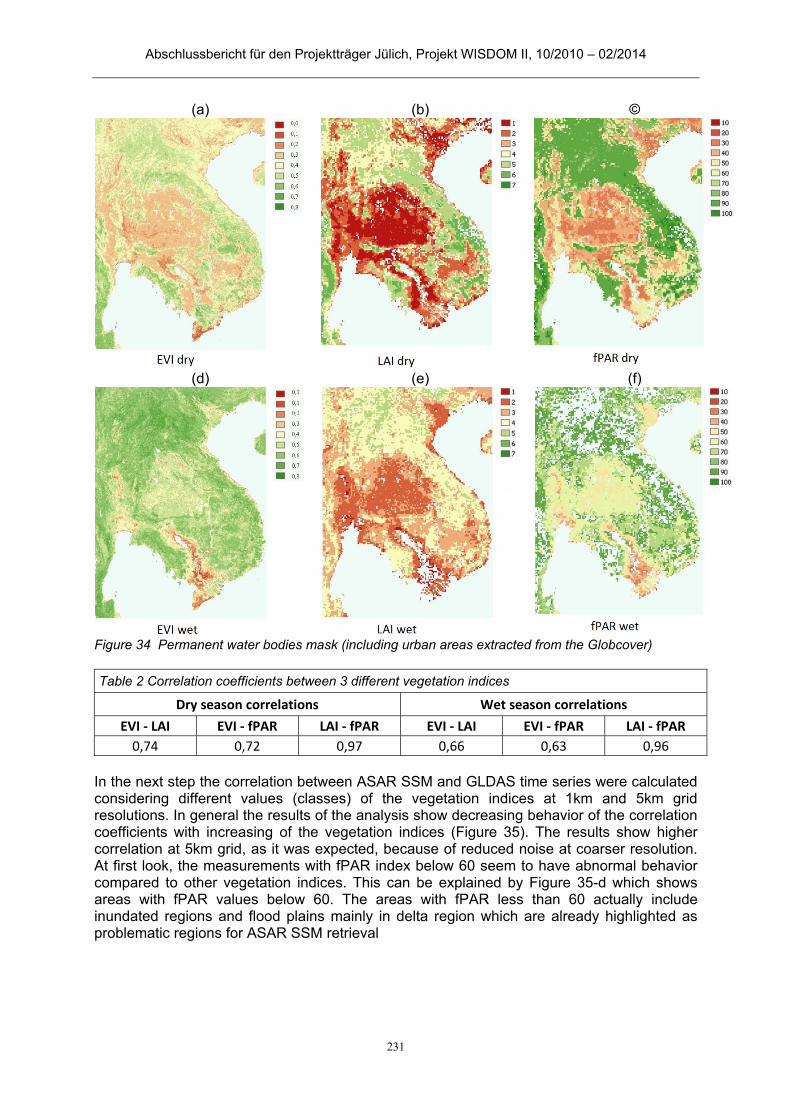
Abschlussbericht für den Projektträger Jülich, Projekt WISDOM II, 10/2010 – 02/2014
231
Table 2 Correlation coefficients between 3 different vegetation indices
Dry season correlations Wet season correlations
EVI ‐ LAI EVI ‐ fPAR LAI ‐ fPAR EVI ‐ LAI EVI ‐ fPAR LAI ‐ fPAR
0,74 0,72 0,97 0,66 0,63 0,96
In the next step the correlation between ASAR SSM and GLDAS time series were calculated considering different values (classes) of the vegetation indices at 1km and 5km grid resolutions. In general the results of the analysis show decreasing behavior of the correlation coefficients with increasing of the vegetation indices (Figure 35). The results show higher correlation at 5km grid, as it was expected, because of reduced noise at coarser resolution. At first look, the measurements with fPAR index below 60 seem to have abnormal behavior compared to other vegetation indices. This can be explained by Figure 35-d which shows areas with fPAR values below 60. The areas with fPAR less than 60 actually include inundated regions and flood plains mainly in delta region which are already highlighted as problematic regions for ASAR SSM retrieval
(a)
(b) ©
(d)
(e) (f)
Figure 34 Permanent water bodies mask (including urban areas extracted from the Globcover)
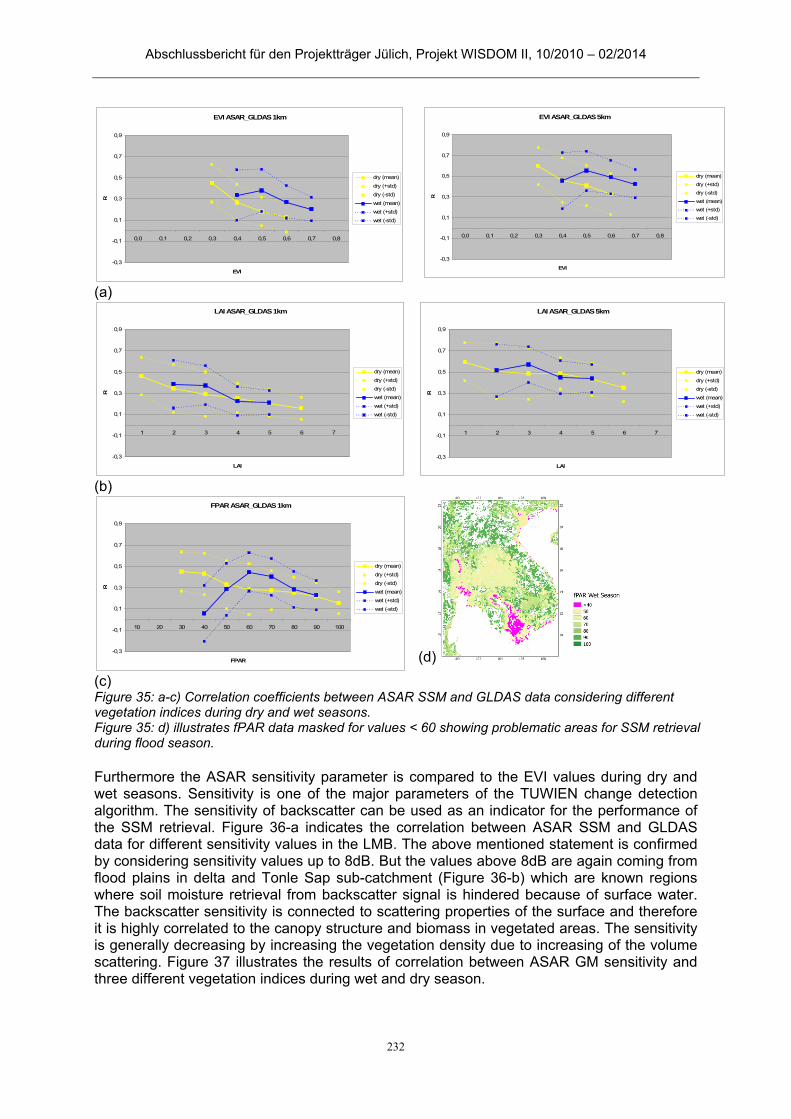
Abschlussbericht für den Projektträger Jülich, Projekt WISDOM II, 10/2010 – 02/2014
232
Furthermore the ASAR sensitivity parameter is compared to the EVI values during dry and wet seasons. Sensitivity is one of the major parameters of the TUWIEN change detection algorithm. The sensitivity of backscatter can be used as an indicator for the performance of the SSM retrieval. Figure 36-a indicates the correlation between ASAR SSM and GLDAS data for different sensitivity values in the LMB. The above mentioned statement is confirmed by considering sensitivity values up to 8dB. But the values above 8dB are again coming from flood plains in delta and Tonle Sap sub-catchment (Figure 36-b) which are known regions where soil moisture retrieval from backscatter signal is hindered because of surface water. The backscatter sensitivity is connected to scattering properties of the surface and therefore it is highly correlated to the canopy structure and biomass in vegetated areas. The sensitivity is generally decreasing by increasing the vegetation density due to increasing of the volume scattering. Figure 37 illustrates the results of correlation between ASAR GM sensitivity and three different vegetation indices during wet and dry season.
(a)
(b)
(c)
(d)
Figure 35: a-c) Correlation coefficients between ASAR SSM and GLDAS data considering different vegetation indices during dry and wet seasons. Figure 35: d) illustrates fPAR data masked for values < 60 showing problematic areas for SSM retrieval during flood season.
EVI ASAR_GLDAS 1km
-0,3
-0,1
0,1
0,3
0,5
0,7
0,9
0,0 0,1 0,2 0,3 0,4 0,5 0,6 0,7 0,8
EVI
R
dry (mean)
dry (+std)
dry (-std)
wet (mean)
wet (+std)
wet (-std)
EVI ASAR_GLDAS 5km
-0,3
-0,1
0,1
0,3
0,5
0,7
0,9
0,0 0,1 0,2 0,3 0,4 0,5 0,6 0,7 0,8
EVI
R
dry (mean)
dry (+std)
dry (-std)
wet (mean)
wet (+std)
wet (-std)
LAI ASAR_GLDAS 1km
-0,3
-0,1
0,1
0,3
0,5
0,7
0,9
1 2 3 4 5 6 7
LAI
R
dry (mean)
dry (+std)
dry (-std)
wet (mean)
wet (+std)
wet (-std)
LAI ASAR_GLDAS 5km
-0,3
-0,1
0,1
0,3
0,5
0,7
0,9
1 2 3 4 5 6 7
LAI
R
dry (mean)
dry (+std)
dry (-std)
wet (mean)
wet (+std)
wet (-std)
FPAR ASAR_GLDAS 1km
-0,3
-0,1
0,1
0,3
0,5
0,7
0,9
10 20 30 40 50 60 70 80 90 100
FPAR
R
dry (mean)
dry (+std)
dry (-std)
wet (mean)
wet (+std)
wet (-std)
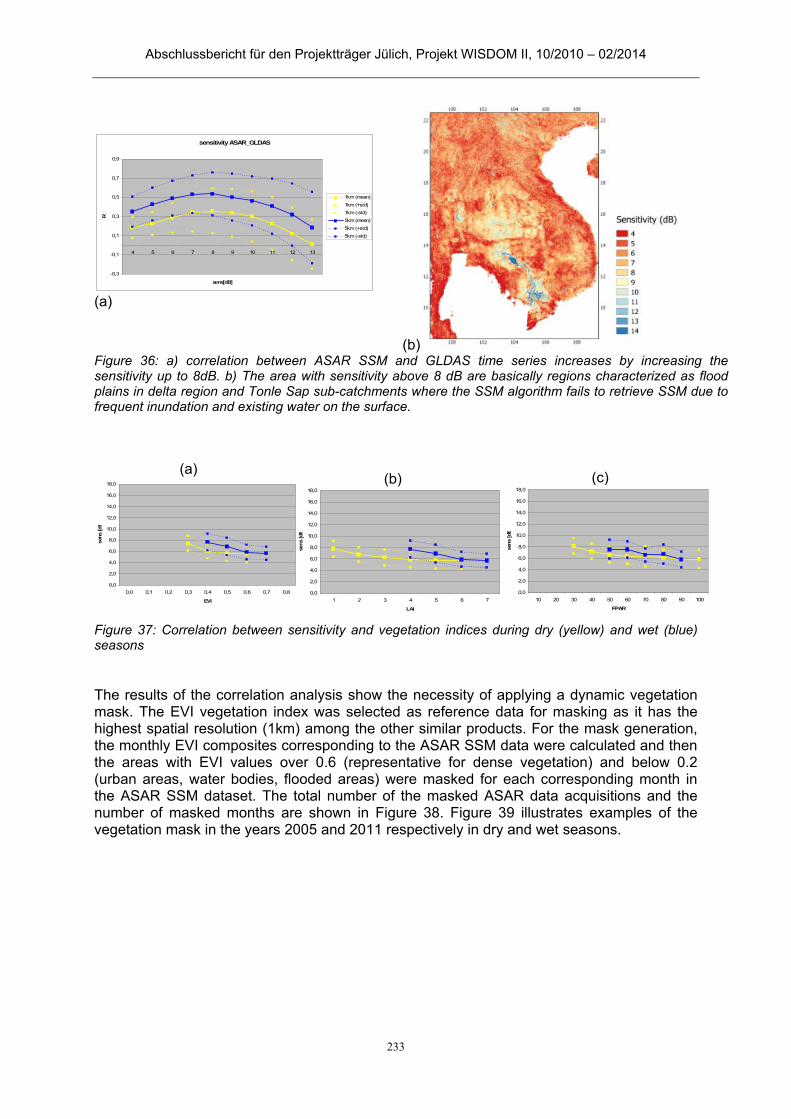
Abschlussbericht für den Projektträger Jülich, Projekt WISDOM II, 10/2010 – 02/2014
233
The results of the correlation analysis show the necessity of applying a dynamic vegetation mask. The EVI vegetation index was selected as reference data for masking as it has the highest spatial resolution (1km) among the other similar products. For the mask generation, the monthly EVI composites corresponding to the ASAR SSM data were calculated and then the areas with EVI values over 0.6 (representative for dense vegetation) and below 0.2 (urban areas, water bodies, flooded areas) were masked for each corresponding month in the ASAR SSM dataset. The total number of the masked ASAR data acquisitions and the number of masked months are shown in Figure 38. Figure 39 illustrates examples of the vegetation mask in the years 2005 and 2011 respectively in dry and wet seasons.
(a)
(b) Figure 36: a) correlation between ASAR SSM and GLDAS time series increases by increasing the sensitivity up to 8dB. b) The area with sensitivity above 8 dB are basically regions characterized as flood plains in delta region and Tonle Sap sub-catchments where the SSM algorithm fails to retrieve SSM due to frequent inundation and existing water on the surface.
(a)
(b) (c)
Figure 37: Correlation between sensitivity and vegetation indices during dry (yellow) and wet (blue) seasons
sensitivity ASAR_GLDAS
-0,3
-0,1
0,1
0,3
0,5
0,7
0,9
4 5 6 7 8 9 10 11 12 13
sens[dB]
R
1km (mean)
1km (+std)
1km (-std)
5km (mean)
5km (+std)
5km (-std)
0,0
2,0
4,0
6,0
8,0
10,0
12,0
14,0
16,0
18,0
0,0 0,1 0,2 0,3 0,4 0,5 0,6 0,7 0,8
EVI
sens
[dB
0,0
2,0
4,0
6,0
8,0
10,0
12,0
14,0
16,0
18,0
1 2 3 4 5 6 7
LAI
sens
[dB
0,0
2,0
4,0
6,0
8,0
10,0
12,0
14,0
16,0
18,0
10 20 30 40 50 60 70 80 90 100
FPAR
sens
[dB

Abschlussbericht für den Projektträger Jülich, Projekt WISDOM II, 10/2010 – 02/2014
234
Figure 38: Left) the number of masked ASAR data acquisitions, right) the number of masked months out of total 89 months based on the MODIS EVI vegetation index and the permanent water bodies product
Figure 39: Examples of the dynamic vegetation mask (blue color) overlaid on the respective EVI monthly composites.
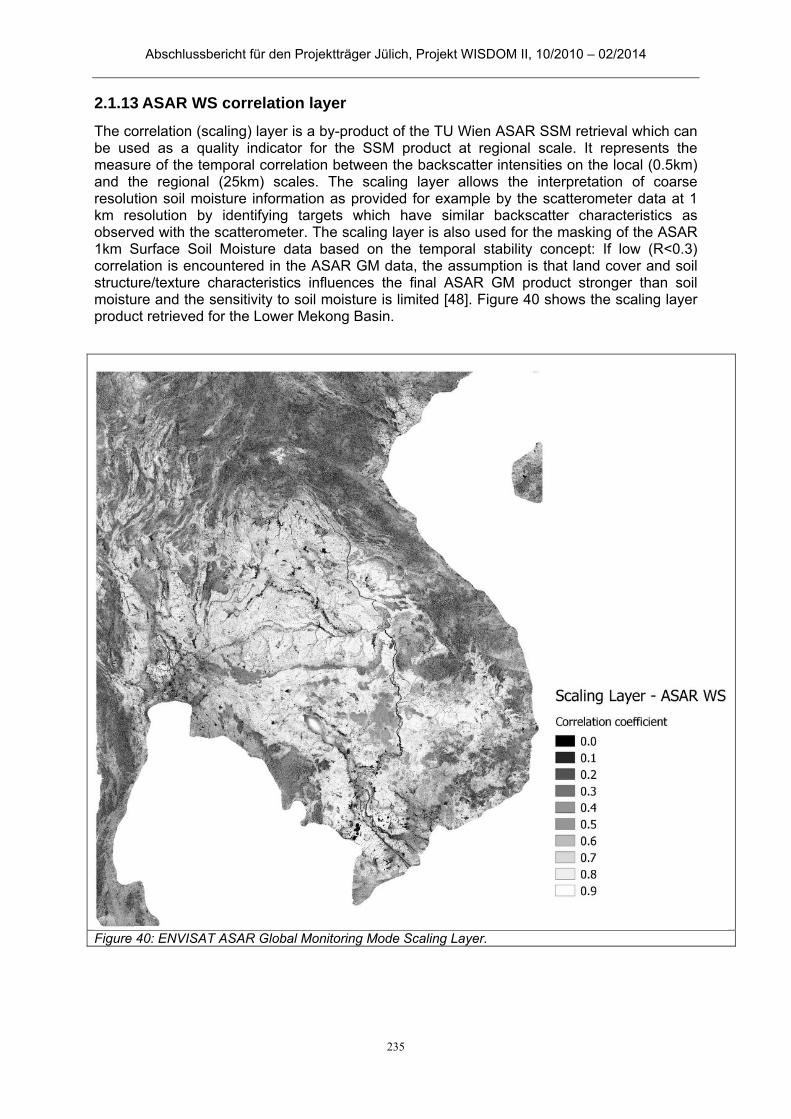
Abschlussbericht für den Projektträger Jülich, Projekt WISDOM II, 10/2010 – 02/2014
235
ASAR WS correlation layer 2.1.13
The correlation (scaling) layer is a by-product of the TU Wien ASAR SSM retrieval which can be used as a quality indicator for the SSM product at regional scale. It represents the measure of the temporal correlation between the backscatter intensities on the local (0.5km) and the regional (25km) scales. The scaling layer allows the interpretation of coarse resolution soil moisture information as provided for example by the scatterometer data at 1 km resolution by identifying targets which have similar backscatter characteristics as observed with the scatterometer. The scaling layer is also used for the masking of the ASAR 1km Surface Soil Moisture data based on the temporal stability concept: If low (R<0.3) correlation is encountered in the ASAR GM data, the assumption is that land cover and soil structure/texture characteristics influences the final ASAR GM product stronger than soil moisture and the sensitivity to soil moisture is limited [48]. Figure 40 shows the scaling layer product retrieved for the Lower Mekong Basin.
Figure 40: ENVISAT ASAR Global Monitoring Mode Scaling Layer.
Abschlussbericht für den Projektträger Jülich, Projekt WISDOM II, 10/2010 – 02/2014
236
References 2.1.14
[1] Mekong River Commission (MRC). Annual Flood Report 2009; MRC: Phnom Penh, Cambodia, 2009; p. 80. [2] Grayson, R.B.; Western, A.W.; Chiew, F.H.S.; Blöschl, G. Preferred states in spatial soil moisture patterns: Local and nonlocal controls. Water Resour. Res. 1997, 33, 2897–2908. [3] CEOS. The Earth Observation Handbook; Climate Change Special Edition: Noordwijk, The Netherlands, 2008. [4] Delworth, T.L.; Manabe, S. The influence of potential evaporation on the variabilities of simulated soil wetness and climate. J. Clim. 1988, 1, 523–547. [5] Robock, A.; Vinnikov, K.Y.; Srinivasan, G.; Entin, J.K.; Hollinger, S.E.; Speranskaya, N.A.; Liu, S.X.; Namkhai, A. The global soil moisture data bank. Bull. Am. Meteorol. Soc. 2000, 81, 1281–1299. [6] Ulaby, F.T.; Fung, A.K.; Moore, R.K. Microwave Remote Sensing: Active and Passive; Addison-Wesley: Norwood, NJ, USA, 1982. [7] Mekong River Commission (MRC). State of the Basin Report: 2003. Executive Summary (p. 50). Phnom Penh, Cambodia, 2003. [8] Mekong River Commission (MRC). State of the Basin Report: 2010; MRC: Vientiane, Lao PDR, 2010; p. 232. [9] Adamson, P.T.; Rutherfurd, I.D.; Peel, M.C.; Conlan, I.A. Chapter 4-The Hydrology of the Mekong River. In The Mekong; Ian, C.C., Ed.; Academic Press: San Diego, CA, USA, 2009; pp. 53–76. [10] Attema, E.P.W. The active microwave instrument on-board the ERS-1 satellite. Proc. IEEE 1991, 79, 791–799. [11] Figa-Saldana, J.; Wilson, J.J.W.; Attema, E.; Gelsthorpe, R.; Drinkwater, M.R.; Stoffelen, A. The Advanced Scatterometer (ASCAT) on the meteorological operational (MetOp) platform: A follow on for European wind scatterometers. Can. J. Remote Sens. 2002, 28, 404–412. [12] Wagner, W.; Lemoine, G.; Rott, H. A method for estimating soil moisture from ERS scatterometer and soil data. Remote Sens. Environ. 1999, 70, 191–207. [13] Naeimi, V.; Scipal, K.; Bartalis, Z.; Hasenauer, S.; Wagner, W. An Improved soil moisture retrieval algorithm for ERS and METOP scatterometer observations. IEEE Trans. Geosci. Remote Sens. 2009, 47, 1999–2013. [14] Wagner, W.; Bartalis, Z.; Naeimi, V.; Park, S.E.; Figa-Saldana, J.; Bonekamp, H. Status of the Metop ASCAT Soil Moisture Product. In Proceedings of the IEEE International Geosciences and Remote Sensing Symposium, Honolulu, HI, USA, 25–30 July 2010; pp. 276–279. [15] Naeimi, V.; Bartalis, Z.; Wagner, W. ASCAT soil moisture: An assessment of the data quality and consistency with the ERS scatterometer heritage. J. Hydrometeorol. 2009, 10, 555–563. [16] Mekong River commission (MRC). Lower Mekong Basin Hydro Meteorology Database; 2012. Available at http://portal.mrcmekong.org/mastercatalogue/search?giai=9506000003818_E0200hvv (accessed on February 2012). [17] Bartholome, E.; Belward, A.S. GLC2000: A new approach to global land cover mapping from Earth observation data. Int. J. Remote Sens. 2005, 26, 1959–1977. [18] U.S. Geological Survey, GTOPO30 Digital elevation model. 1997. Available online: http://eros.usgs.gov/#/Find_Data/Products_and_Data_Available/gtopo30_info (accessed on February 2007). [19] M. C. Peel, B. L. Finlayson, and T. A. McMahon (2007), "Updated world map of the Köppen–Geiger climate classification". Hydrol. Earth Syst. Sci. 11: 1633–1644. 2007. [20] MODIS/Terra+Aqua Leaf Area Index/FPAR 8-Day L4 Global 1km SIN Grid, Land Processes Distributed Active Archive Center (LP DAAC), Sioux Falls, South Dakota, USA, U.S. Geological Survey, V005, https://lpdaac.usgs.gov/ [21] MODIS/Aqua Vegetation Indices Monthly L3 Global 1km SIN Grid, Land Processes Distributed Active Archive Center (LP DAAC),
Abschlussbericht für den Projektträger Jülich, Projekt WISDOM II, 10/2010 – 02/2014
237
Sioux Falls, South Dakota, USA, U.S. Geological Survey, V004, V005, http://lpdaac.usgs.gov [22] Schneider, U.; Becker, A.; Finger, P.; Meyer-Christoffer, A.; Ziese, M.; Rudolf, B.; GPCC's new land surface precipitation climatology based on quality-controlled in situ data and its role in quantifying the global water cycle. Theoretical and Applied Climatology, 2013, pp. 1-26, Article in Press. [23] Schneider, U.; Becker, A.; Finger, P.; Meyer-Christoffer, A.; Rudolf, B.; Ziese, M. GPCC Full Data Reanalysis Version 6.0 at 0.5°: Monthly Land-Surface Precipitation from Rain-Gauges built on GTS-based and Historic Data. DOI: 10.5676/DWD_GPCC/FD_M_V6_050, 2011. [24] D. P. Dee, S. M. Uppala, A. J. Simmons, P. Berrisford, P. Poli, S. Kobayashi, U. Andrae, M. A. Balmaseda, G. Balsamo, P. Bauer, P. Bechtold, A. C. M. Beljaars, L. van de Berg, J. Bidlot, N. Bormann, C. Delsol, R. Dragani, M. Fuentes, A. J. Geer, L. Haimberger, S. B. Healy, H. Hersbach, E. V. Hólm, L. Isaksen, P. Kållberg, M. Köhler, M. Matricardi, A. P. McNally, B. M. Monge-Sanz, J. J. Morcrette, B. K. Park, C. Peubey, P. de Rosnay, C. Tavolato, J. N. Thépaut, and F. Vitart, “The ERA-interim reanalysis: Configuration and performance of the data assimilation system,” Q. J. R. Meteorol. Soc., vol. 137, no. 656, pp. 553–597, Apr. 2011. [25] M. Rodell, P. R. Houser, U. Jambor, J. Gottschalck, K. Mitchell, C. J. Meng, K. Arsenault, B. Cosgrove, J. Radakovich, M. Bosilovich, J. K. Entin, J. P. Walker, D. Lohmann, and D. Toll, “The global land data assimilation system,” Bull. Amer. Meteorol. Soc., vol. 85, no. 3, pp. 381– 394, Mar. 2004. [26] Wolter, K.; Timlin, M.S. Monitoring ENSO in COADS with a Seasonally Adjusted Principal Component Index. In Proceedings of the 17th Climate Diagnostics Workshop, Norman, OK, USA, 1–5 November 1993; pp. 52–57. [27] Wolter, K.; Timlin, M.S. Measuring the strength of ENSO events: How does 1997/98 rank? Weather 1998, 53, 315–324. [28] Kennett, R.G.; Li, F.K. Seasat over-land scatterometer data–II: Selection of extended area land-target sites for the calibration of spaceborne scatterometers. IEEE Trans. Geosci. Remote Sens. 1989, 27, 779–788. [29] Frison, P.-L.; Mougin, E. Use of ERS-1 wind scatterometer data over land surfaces. IEEE Trans. Geosci. Remote Sens. 1996, 34, 550–560. [30] Wagner, W.; Lemoine, G.; Borgeaud, M.; Rott, H. A study of vegetation cover effects on ers scatterometer data. IEEE Trans. Geosci. Remote Sens. 1999, 37, 938–948. [31] Macelloni, G.; Paloscia, S.; Pampaloni, P.; Santi, E. Global scale monitoring of soil and vegetation using SSM/I and ERS wind scatterometer. Int. J. Remote Sens. 2003, 24, 2409–2425. [32] Wang, A.; Zeng, X.; Shen, S.S.P.; Zeng, Q.-C.; Dickinson, R.E. Time scales of land surface hydrology. J. Hydrometeorol. 2006, 7, 868–879. [33] Naeimi, V.; Paulik, C.; Bartsch, A.; Wagner, W.; Kidd, R.; Park, S.E.; Elger, K.; Boike, J. ASCAT Surface State Flag (SSF): Extracting information on surface freeze/thaw conditions from backscatter data using an empirical threshold-analysis algorithm. IEEE Trans. Geosci. Remote Sens. 2012, 50, 2566–2582. [34] Mekong River commission (MRC). Overview of the Hydrology of the Mekong Basin; Publisher:MRC Vientiane, Lao PDR, 2005; p. 73. [35] Lamberts, D. Little Impact, much Damage: The Consequences of Mekong River Flow Alterations for the Tonle Sap Ecosystem. In Modern Myths of the Mekong: A Critical Review of Water and Development Concepts, Principles and Policies; Kummu, M., Keskinen, M., Varis, O., Eds.; Helsinki University of Technology:Leuven, Belgium, 2008; pp. 3–18. [36] Nikula, J. Is Harm and Destructions all that Floods Bring? In Modern Myths of the Mekong: A Critical Review of Water and Development Concepts, Principles and Policies; Kummu, M., Keskinen, M., Varis, O., Eds.; Helsinki University of Technology: Helsinki, Finland, 2008; pp. 27–38. [37] Mekong River commission (MRC). Annual Flood Report 2010; Publisher: MRC Phnom Penh, Cambodia, 2010; p. 76 [38] Delworth, T.L.; Manabe, S. The influence of potential evaporation on the variabilities of simulated soil wetness and climate. J. Clim. 1988, 1, 523–547. [39] Dirmeyer, P.A.; Schlosser, C.A.; Brubaker, K.L. Precipitation, recycling, and land memory: An integrated analysis. J. Hydrometeorol. 2009, 10, 278–288. [40] Hillel, D. Introduction to Environmental Soil Physics; Academic Press: Waltham, MA, USA, 2003.
Abschlussbericht für den Projektträger Jülich, Projekt WISDOM II, 10/2010 – 02/2014
238
[41] Ju, J.; Slingo, J. The Asian summer monsoon and ENSO. Q. J. R. Meteorol. Soc. 1995, 121, 1133–1168. [42] Wang, B.; Wu, R.; Fu, X. Pacific–East Asian teleconnection: How does ENSO affect East Asian climate? J. Clim. 2000, 13, 1517–1536. [43] Buckley, B.M.; Palakit, K.; Duangsathaporn, K.; Sanguantham, P.; Prasomsin, P. Decadal scale droughts over northwestern Thailand over the past 448 years: Links to the tropical Pacific and Indian Ocean sectors. Clim. Dyn. 2007, 29, 63–71 [44] Kuenzer, C.; Zhao, D.; Scipal, K.; Sabel, D.; Naeimi, V.; Bartalis, Z.; Hasenauer, S.; Mehl, H.; Dech, S.; Wagner, W. El Niño southern oscillation influences represented in ERS scatterometer-derived soil moisture data. Appl. Geogr. 2009, 29, 463–477 [45] Delgado, J.M.; Merz, B.; Apel, H. A climate-flood link for the lower Mekong River. Hydrol. Earth Syst. Sci. 2012, 16, 1533–1541 [46] NASA‘s Earth Observatory. “Flooding in Southeast Asia”, URL:http://earthobservatory.nasa. gov/ (accessed January 6 2013) [47] Mekong River Commission. “Annual Mekong Flood Report 2007” (2008). [48] ENVISAT ASAR Global Monitoring Mode Scaling Layer, UUID: 98a2808e-d550-5bdb-9cc5-edcaf16f4f97, Vienna University of Technology, Department of Geodesy and Geoinformation, http://rs.geo.tuwien.ac.at/products/98a2808e-d550-5bdb-9cc5-edcaf16f4f97/2595/

Abschlussbericht für den Projektträger Jülich, Projekt WISDOM II, 10/2010 – 02/2014
239
2.2 Wichtigste Positionen des zahlenmäßigen Nachweises
Die Ausgaben umfassten die Personalkosten von insgesamt 33 Personen-Monate einer PhD Stelle und 10 Personen-Monate einer Post-Doc stelle plus Overhead und zirka %1.1 des Budget für die Teilnahme an Projektreffen in Deutschland und am Mekong Symposium in Saigon, Vietnam.
2.3 Notwendigkeit und Angemessenheit der geleisteten Arbeit
Der Verlauf der Arbeit im Projekt folgte der im Projektantrag formulierten Planung. Es waren zusätzliche Ressourcen für die Durchführung nötig, wie zum Beispiel erweiterte Qualitätskontrolle der SAR Eingangsdaten oder zusätzliche Wasserflächen-Maskierung der fertiggestellten Produkte in Hochwasserperioden. Zu Projektende wurden die gesamten geforderten Arbeitspakete vollständig fertiggestellt. Die geleistete Arbeit war den Zielstellungen des Projektes angemessen und die Zielsetzungen des Projektes wurden gemäß Zeitplanung eingehalten.
2.4 Nutzen und Verwertbarkeit der Ergebnisse
Die Forschungsergebnisse sowie die erstellten Datenprodukte der Datenverarbeitung zur Bodenfeuchteanalyse sind für die wissenschaftliche Nutzung frei verfügbar. Die wissenschaftlich-technischen Ergebnisse während des Projektes und auch nach Projektende sind für einen großen Nutzerkreis sehr wertvoll. Folgende potentielle Nutzergruppen sind hierbei zu nennen: Planer/Manager aus den Bereichen Landwirtschaft/Erntemodellierung, Bewässerungsmanagement, Gefährdungsmonitoring (Hochwasser, Dürren) etc. Bereits während des Projektes wurden die WISDOM Partner in die Nutzung der Daten einbezogen. Die wissenschaftliche Anschlussfähigkeit ist mit einer möglichen Weiterentwicklung der vorliegenden Datenprozessierungsalgorithmen, -umgebungen und Datenprodukten auf Grundlage der Zielsetzung einer potentiellen Projektfortführung gegeben.
2.5 Während der Durchführung bekannt gewordener Fortschritt bei anderen Stellen
Von dritter Seite sind im Berichtszeitraum keine relevanten Ergebnisse bekannt geworden.
2.6 Erfolgte und geplante Veröffentlichungen
Naeimi, Vahid, Leinenkugel, P., Sabel, D., Wagner, W., Apel, H., & Kuenzer, C. (2013). Evaluation of Soil Moisture Retrieval from the ERS and Metop Scatterometers in the Lower Mekong Basin. Remote Sensing, 5(4), 1603–1623. doi:10.3390/rs5041603. Sabel, Daniel., Naeimi, V., and Greifenede, F., Multi-temporal radar remote sensing for hydrological characterisation in the Lower Mekong Basin, book chapter in “Remote Sensing Time Series revealing Land Surface Dynamics”. submitted.