Sustainable Agricultural Productivity Growth and ... - Fao.org
Upload
khangminh22Category
view
0download
0
Engineering sustainable growth
Annual Report 2018
Spirax-S
arco Engineering plc A
nnual Report 2018
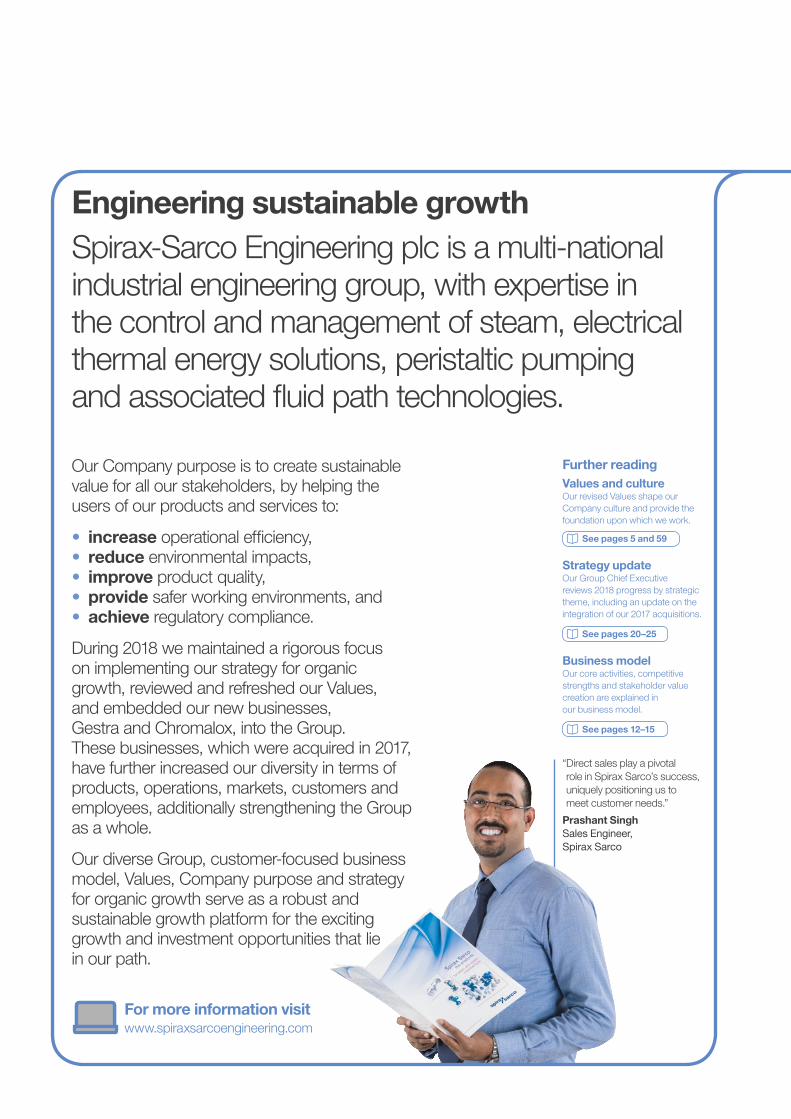
Engineering sustainable growthSpirax-Sarco Engineering plc is a multi-national industrial engineering group, with expertise in the control and management of steam, electrical thermal energy solutions, peristaltic pumping and associated fluid path technologies.
Our Company purpose is to create sustainable value for all our stakeholders, by helping the users of our products and services to:
• increase operational efficiency,• reduce environmental impacts,• improve product quality,• provide safer working environments, and• achieve regulatory compliance.
During 2018 we maintained a rigorous focus on implementing our strategy for organic growth, reviewed and refreshed our Values, and embedded our new businesses, Gestra and Chromalox, into the Group. These businesses, which were acquired in 2017, have further increased our diversity in terms of products, operations, markets, customers and employees, additionally strengthening the Group as a whole.
Our diverse Group, customer-focused business model, Values, Company purpose and strategy for organic growth serve as a robust and sustainable growth platform for the exciting growth and investment opportunities that lie in our path.
Further readingValues and cultureOur revised Values shape our Company culture and provide the foundation upon which we work.
See pages 5 and 59
Strategy updateOur Group Chief Executive reviews 2018 progress by strategic theme, including an update on the integration of our 2017 acquisitions.
See pages 20–25
Business modelOur core activities, competitive strengths and stakeholder value creation are explained in our business model.
See pages 12–15
For more information visitwww.spiraxsarcoengineering.com
“ Direct sales play a pivotal role in Spirax Sarco’s success, uniquely positioning us to meet customer needs.”
Prashant SinghSales Engineer, Spirax Sarco

Contents
A snapshot of 2018for the year ended 31st December 2018
• Revenue growth of 15%, organic sales growth of 7%• Adjusted operating margin of 23.0%, down 60 bps;
organic margin up 120 bps to 25.2%• Strong organic sales growth in Steam Specialties and Watson-Marlow• Gestra and Chromalox performing well• Net debt of £235.8 million as at 31st December 2018, 0.8x EBITDA• Full Year dividend increased by 14%
Strategic ReportSummary of results 1Chair’s Statement 2Our Group at a glance 4The industries we serve 6Investment case 8Group Chief Executive’s 10 Statement Our business model 12Realising our purpose 16Our strategy 20Key Performance Indicators 26Risk management 28Group Chief Executive’s Review 34 of Operations Our performance at a glance 36 Steam Specialties 38Steam Specialties: EMEA 40Steam Specialties: Asia Pacific 42Steam Specialties: Americas 44Chromalox 46Watson-Marlow 48Financial Review 50Sustainability Report 55
Governance ReportOur governance 66Chair’s introduction 68Board leadership and 70 Company purposeBoard of Directors 72Division of responsibilities 74Composition, succession 78 and evaluation Audit, risk and internal control 82Remuneration 90Regulatory disclosures 120Statement of Directors’ 123 Responsibilities
Financial StatementsIndependent Auditors’ Report 125Consolidated Statement of 132 Financial PositionConsolidated Income Statement 133Consolidated Statement of 134 Comprehensive Income Consolidated Statement 134 of Changes in Equity Consolidated Statement of 136 Cash Flows Notes to the Consolidated 137 Financial Statements Company Statement of 179 Financial Position Company Statement of 180 Changes in Equity Notes to the Company 181 Financial Statements
Corporate InformationConsolidated financial summary 188 Our global operations 189Officers and advisers 194
2018 key figures
Adjusted* 2018 2017 Reported Organic†
Revenue £1,153.3m £998.7m +15% +7%Adjusted operating profit* £264.9m £235.5m +12% +12%Adjusted operating profit margin* 23.0% 23.6% -60 bps +120 bpsAdjusted profit before taxation* £254.6m £229.1m +11%Adjusted basic earnings per share* 250.0p 220.5p +13%Dividend per share 100.0p 87.5p +14%Cash conversion** 91% 86%
Statutory 2018 2017 Reported
Revenue £1,153.3m £998.7m +15%Operating profit £299.1m £198.9m +50%Operating profit margin 25.9% 19.9% +600 bpsProfit before taxation £288.8m £192.5m +50%Basic earnings per share 303.1p 214.4p +41%
* All profit measures exclude certain items which totalled £34.2 million for the year ended 31st December 2018, as set out and explained in the Financial Review and in Note 2.
** Cash conversion measures the percentage of adjusted cash from operations to adjusted operating profit as explained in the Financial Review and in Note 2.
† Organic percentage growth measures are at constant currency and exclude contributions from acquisitions and disposals.
KPI
1,153.3 7
6
4
2
4
998.7
757.4
667.2
678.3
Organicgrowth %
Revenue £m
2018
2017
2016
2015
2014
KPI
264.9 23.0
23.6
23.8
22.8
22.5
235.5
180.6
152.4
153.0
Margin %
Adjusted operating profit £m
2018
2017
2016
2015
2014
KPI
3.5
3.0
3.4
3.3
5.4
H&S accidents with over 7 days of lost time per 1,000 employees
2018
2017
2016
2015
2014
KPI
54.9
52.9
47.9
44.1
44.3
Return on capital employed %
2018
2017
2016
2015
2014
1Spirax-Sarco Engineering plc Annual Report 2018
Str
ateg
ic R
epo
rt
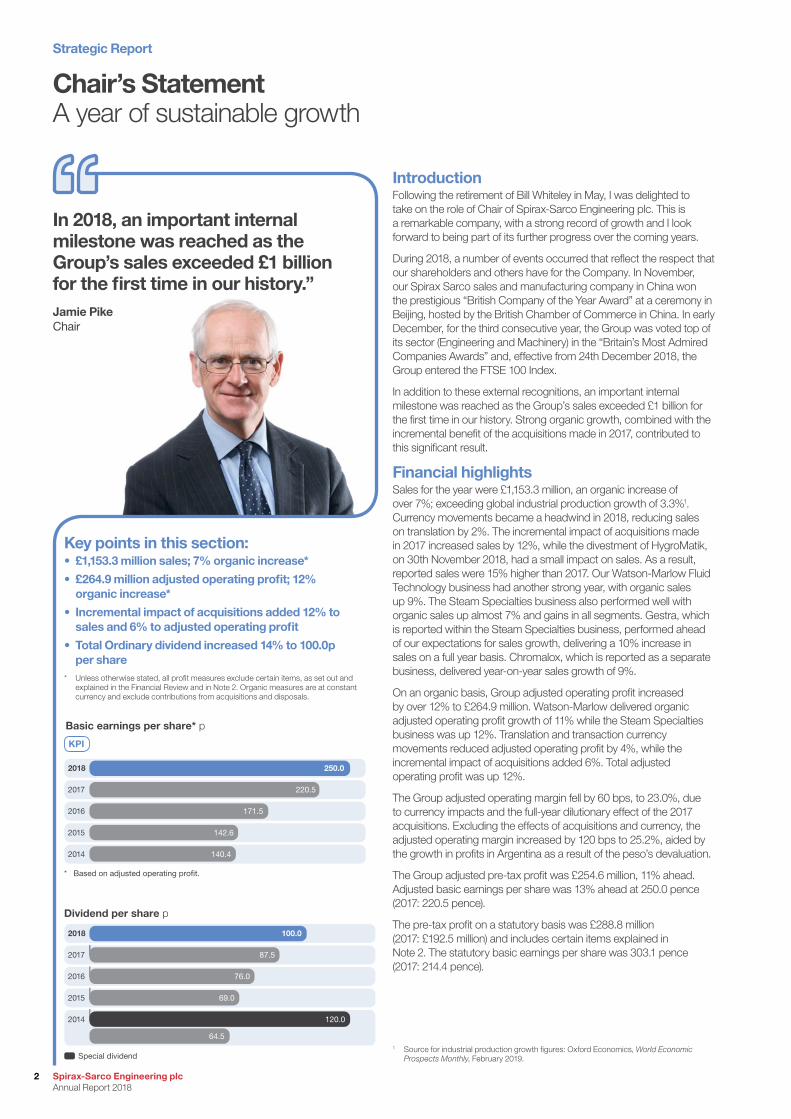
Chair’s StatementA year of sustainable growth
IntroductionFollowing the retirement of Bill Whiteley in May, I was delighted to take on the role of Chair of Spirax-Sarco Engineering plc. This is a remarkable company, with a strong record of growth and I look forward to being part of its further progress over the coming years.
During 2018, a number of events occurred that reflect the respect that our shareholders and others have for the Company. In November, our Spirax Sarco sales and manufacturing company in China won the prestigious “British Company of the Year Award” at a ceremony in Beijing, hosted by the British Chamber of Commerce in China. In early December, for the third consecutive year, the Group was voted top of its sector (Engineering and Machinery) in the “Britain’s Most Admired Companies Awards” and, effective from 24th December 2018, the Group entered the FTSE 100 Index.
In addition to these external recognitions, an important internal milestone was reached as the Group’s sales exceeded £1 billion for the first time in our history. Strong organic growth, combined with the incremental benefit of the acquisitions made in 2017, contributed to this significant result.
Financial highlightsSales for the year were £1,153.3 million, an organic increase of over 7%; exceeding global industrial production growth of 3.3%1. Currency movements became a headwind in 2018, reducing sales on translation by 2%. The incremental impact of acquisitions made in 2017 increased sales by 12%, while the divestment of HygroMatik, on 30th November 2018, had a small impact on sales. As a result, reported sales were 15% higher than 2017. Our Watson-Marlow Fluid Technology business had another strong year, with organic sales up 9%. The Steam Specialties business also performed well with organic sales up almost 7% and gains in all segments. Gestra, which is reported within the Steam Specialties business, performed ahead of our expectations for sales growth, delivering a 10% increase in sales on a full year basis. Chromalox, which is reported as a separate business, delivered year-on-year sales growth of 9%.
On an organic basis, Group adjusted operating profit increased by over 12% to £264.9 million. Watson-Marlow delivered organic adjusted operating profit growth of 11% while the Steam Specialties business was up 12%. Translation and transaction currency movements reduced adjusted operating profit by 4%, while the incremental impact of acquisitions added 6%. Total adjusted operating profit was up 12%.
The Group adjusted operating margin fell by 60 bps, to 23.0%, due to currency impacts and the full-year dilutionary effect of the 2017 acquisitions. Excluding the effects of acquisitions and currency, the adjusted operating margin increased by 120 bps to 25.2%, aided by the growth in profits in Argentina as a result of the peso’s devaluation.
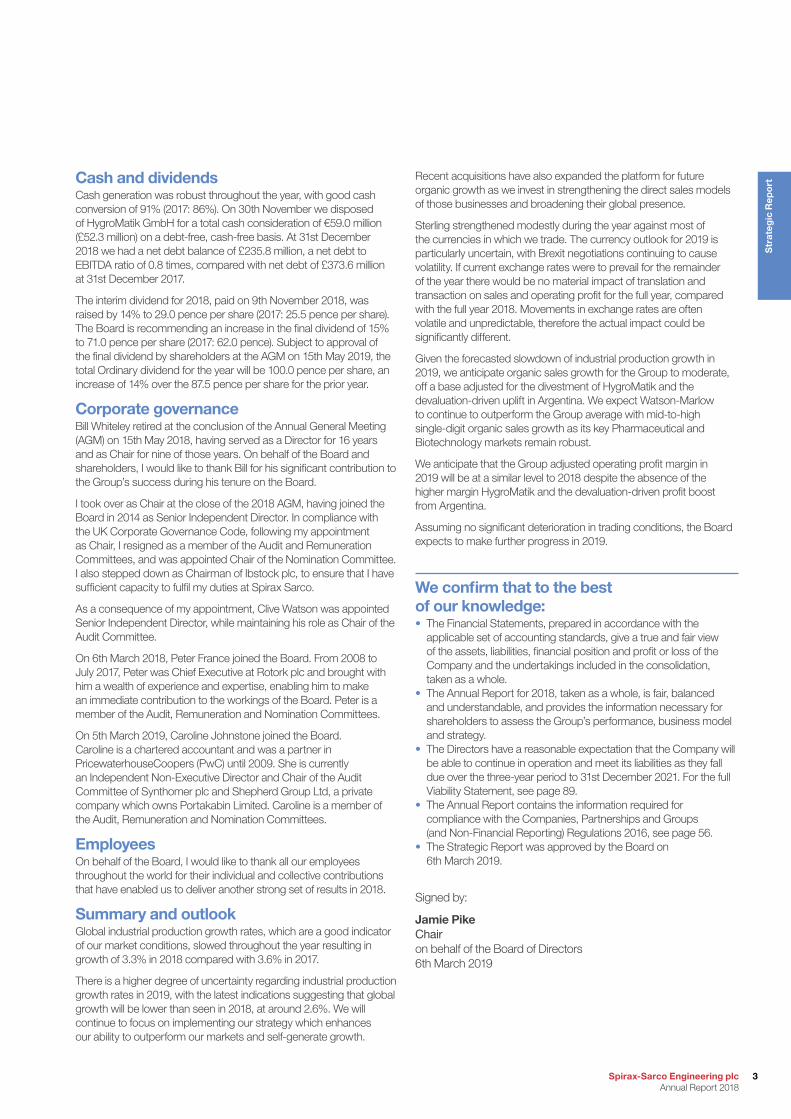
The Group adjusted pre-tax profit was £254.6 million, 11% ahead. Adjusted basic earnings per share was 13% ahead at 250.0 pence (2017: 220.5 pence).
The pre-tax profit on a statutory basis was £288.8 million (2017: £192.5 million) and includes certain items explained in Note 2. The statutory basic earnings per share was 303.1 pence (2017: 214.4 pence).
In 2018, an important internal milestone was reached as the Group’s sales exceeded £1 billion for the first time in our history.” Jamie PikeChair
Key points in this section:• £1,153.3 million sales; 7% organic increase*
• £264.9 million adjusted operating profit; 12% organic increase*
• Incremental impact of acquisitions added 12% to sales and 6% to adjusted operating profit
• Total Ordinary dividend increased 14% to 100.0p per share
* Unless otherwise stated, all profit measures exclude certain items, as set out and explained in the Financial Review and in Note 2. Organic measures are at constant currency and exclude contributions from acquisitions and disposals.
100.0
87.5
76.0
69.0
120.0
64.5
Dividend per share p
2018
2017
2016
2015
2014
Special dividend
250.0
220.5
171.5
142.6
140.4
2018
2017
2016
2015
2014
* Based on adjusted operating pro�t.
KPI
Basic earnings per share* p
1 Source for industrial production growth figures: Oxford Economics, World Economic Prospects Monthly, February 2019.
Strategic Report
Spirax-Sarco Engineering plc Annual Report 2018
2
Cash and dividendsCash generation was robust throughout the year, with good cash conversion of 91% (2017: 86%). On 30th November we disposed of HygroMatik GmbH for a total cash consideration of €59.0 million (£52.3 million) on a debt-free, cash-free basis. At 31st December 2018 we had a net debt balance of £235.8 million, a net debt to EBITDA ratio of 0.8 times, compared with net debt of £373.6 million at 31st December 2017.
The interim dividend for 2018, paid on 9th November 2018, was raised by 14% to 29.0 pence per share (2017: 25.5 pence per share). The Board is recommending an increase in the final dividend of 15% to 71.0 pence per share (2017: 62.0 pence). Subject to approval of the final dividend by shareholders at the AGM on 15th May 2019, the total Ordinary dividend for the year will be 100.0 pence per share, an increase of 14% over the 87.5 pence per share for the prior year.
Corporate governanceBill Whiteley retired at the conclusion of the Annual General Meeting (AGM) on 15th May 2018, having served as a Director for 16 years and as Chair for nine of those years. On behalf of the Board and shareholders, I would like to thank Bill for his significant contribution to the Group’s success during his tenure on the Board.
I took over as Chair at the close of the 2018 AGM, having joined the Board in 2014 as Senior Independent Director. In compliance with the UK Corporate Governance Code, following my appointment as Chair, I resigned as a member of the Audit and Remuneration Committees, and was appointed Chair of the Nomination Committee. I also stepped down as Chairman of Ibstock plc, to ensure that I have sufficient capacity to fulfil my duties at Spirax Sarco.
As a consequence of my appointment, Clive Watson was appointed Senior Independent Director, while maintaining his role as Chair of the Audit Committee.
On 6th March 2018, Peter France joined the Board. From 2008 to July 2017, Peter was Chief Executive at Rotork plc and brought with him a wealth of experience and expertise, enabling him to make an immediate contribution to the workings of the Board. Peter is a member of the Audit, Remuneration and Nomination Committees.
On 5th March 2019, Caroline Johnstone joined the Board. Caroline is a chartered accountant and was a partner in PricewaterhouseCoopers (PwC) until 2009. She is currently an Independent Non-Executive Director and Chair of the Audit Committee of Synthomer plc and Shepherd Group Ltd, a private company which owns Portakabin Limited. Caroline is a member of the Audit, Remuneration and Nomination Committees.
EmployeesOn behalf of the Board, I would like to thank all our employees throughout the world for their individual and collective contributions that have enabled us to deliver another strong set of results in 2018.
Summary and outlookGlobal industrial production growth rates, which are a good indicator of our market conditions, slowed throughout the year resulting in growth of 3.3% in 2018 compared with 3.6% in 2017.
There is a higher degree of uncertainty regarding industrial production growth rates in 2019, with the latest indications suggesting that global growth will be lower than seen in 2018, at around 2.6%. We will continue to focus on implementing our strategy which enhances our ability to outperform our markets and self-generate growth.
Recent acquisitions have also expanded the platform for future organic growth as we invest in strengthening the direct sales models of those businesses and broadening their global presence.
Sterling strengthened modestly during the year against most of the currencies in which we trade. The currency outlook for 2019 is particularly uncertain, with Brexit negotiations continuing to cause volatility. If current exchange rates were to prevail for the remainder of the year there would be no material impact of translation and transaction on sales and operating profit for the full year, compared with the full year 2018. Movements in exchange rates are often volatile and unpredictable, therefore the actual impact could be significantly different.
Given the forecasted slowdown of industrial production growth in 2019, we anticipate organic sales growth for the Group to moderate, off a base adjusted for the divestment of HygroMatik and the devaluation-driven uplift in Argentina. We expect Watson-Marlow to continue to outperform the Group average with mid-to-high single-digit organic sales growth as its key Pharmaceutical and Biotechnology markets remain robust.
We anticipate that the Group adjusted operating profit margin in 2019 will be at a similar level to 2018 despite the absence of the higher margin HygroMatik and the devaluation-driven profit boost from Argentina.
Assuming no significant deterioration in trading conditions, the Board expects to make further progress in 2019.
We confirm that to the best of our knowledge:• The Financial Statements, prepared in accordance with the
applicable set of accounting standards, give a true and fair view of the assets, liabilities, financial position and profit or loss of the Company and the undertakings included in the consolidation, taken as a whole.
• The Annual Report for 2018, taken as a whole, is fair, balanced and understandable, and provides the information necessary for shareholders to assess the Group’s performance, business model and strategy.
• The Directors have a reasonable expectation that the Company will be able to continue in operation and meet its liabilities as they fall due over the three-year period to 31st December 2021. For the full Viability Statement, see page 89.
• The Annual Report contains the information required for compliance with the Companies, Partnerships and Groups (and Non-Financial Reporting) Regulations 2016, see page 56.
• The Strategic Report was approved by the Board on 6th March 2019.
Signed by:
Jamie PikeChairon behalf of the Board of Directors 6th March 2019
3Spirax-Sarco Engineering plc Annual Report 2018
Str
ateg
ic R
epo
rt
Electrical process heating and temperature management solutions
See pages 46-47
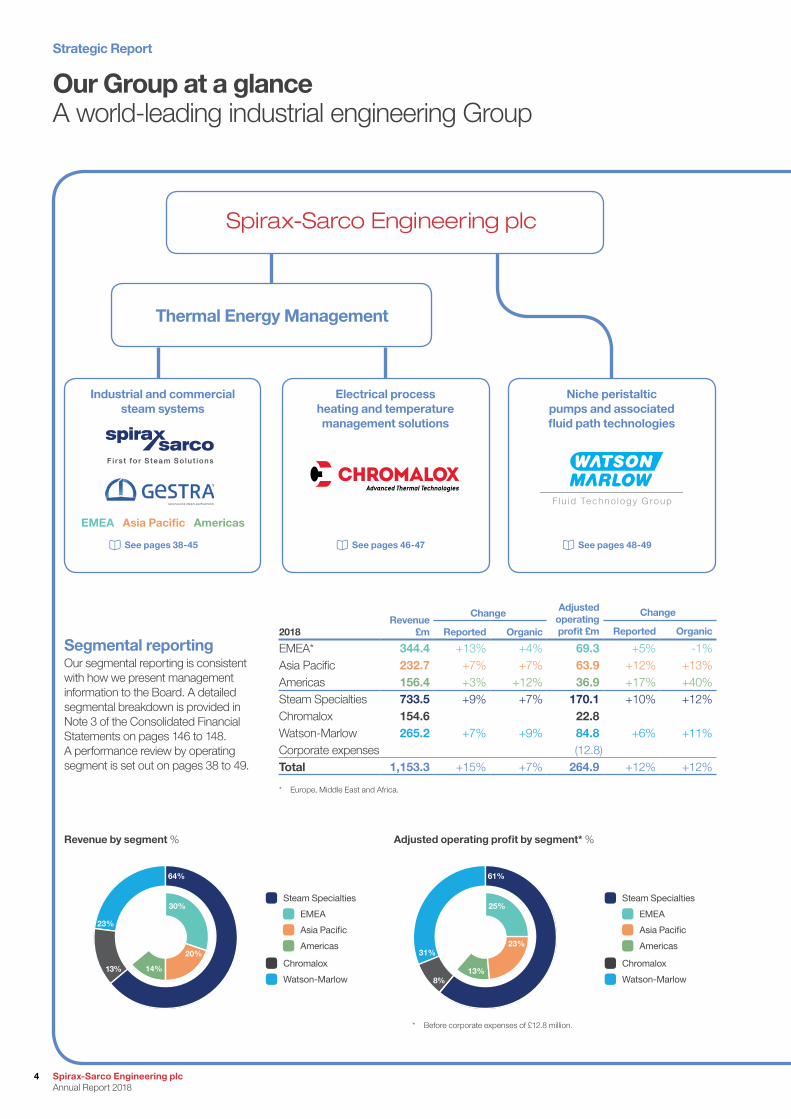
Our Group at a glanceA world-leading industrial engineering Group
Industrial and commercial steam systems
Thermal Energy Management
EMEA Asia Pacific Americas
Fi r s t fo r S team So lu t ions
See pages 38-45
Niche peristaltic pumps and associated fluid path technologies
F lu id Techno logy G roup
See pages 48-49
Segmental reportingOur segmental reporting is consistent with how we present management information to the Board. A detailed segmental breakdown is provided in Note 3 of the Consolidated Financial Statements on pages 146 to 148. A performance review by operating segment is set out on pages 38 to 49.
2018Revenue
£m
Change Adjustedoperatingprofit £m
Change
Reported Organic Reported Organic
EMEA* 344.4 +13% +4% 69.3 +5% -1%Asia Pacific 232.7 +7% +7% 63.9 +12% +13%Americas 156.4 +3% +12% 36.9 +17% +40%Steam Specialties 733.5 +9% +7% 170.1 +10% +12%Chromalox 154.6 22.8Watson-Marlow 265.2 +7% +9% 84.8 +6% +11%Corporate expenses (12.8)Total 1,153.3 +15% +7% 264.9 +12% +12%
* Europe, Middle East and Africa.
Revenue by segment %
Steam Specialties
Watson-Marlow
Chromalox
Americas
Asia Pacific
Adjusted operating profit by segment* %
Steam Specialties
Watson-Marlow
Chromalox
Americas
Asia Pacific
64%
30%
20%
14%13%
23%
61%
25%
23%
13%8%
31%
EMEA EMEA
* Before corporate expenses of £12.8 million.
Strategic Report
Spirax-Sarco Engineering plc Annual Report 2018
4
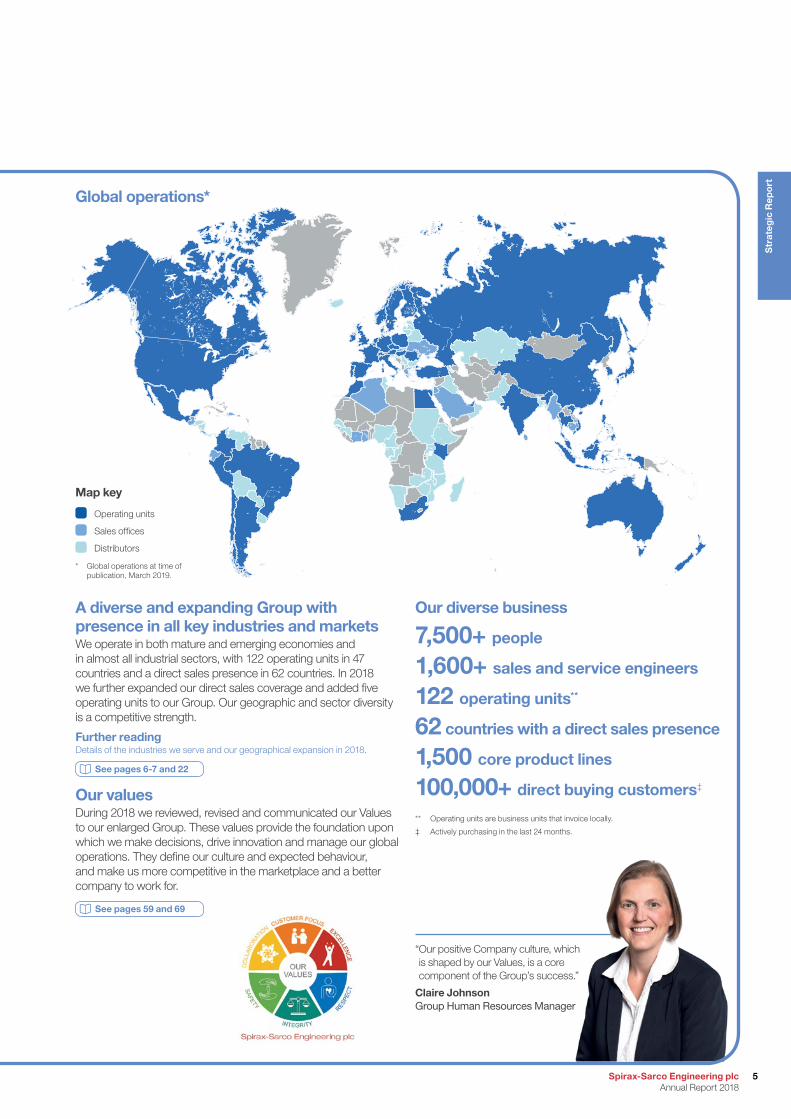
A diverse and expanding Group with presence in all key industries and marketsWe operate in both mature and emerging economies and in almost all industrial sectors, with 122 operating units in 47 countries and a direct sales presence in 62 countries. In 2018 we further expanded our direct sales coverage and added five operating units to our Group. Our geographic and sector diversity is a competitive strength.
Further readingDetails of the industries we serve and our geographical expansion in 2018.
See pages 6-7 and 22
Our valuesDuring 2018 we reviewed, revised and communicated our Values to our enlarged Group. These values provide the foundation upon which we make decisions, drive innovation and manage our global operations. They define our culture and expected behaviour, and make us more competitive in the marketplace and a better company to work for.
See pages 59 and 69
* Global operations at time of publication, March 2019.
Global operations*
Map key
Operating units
Sales offices
Distributors
“ Our positive Company culture, which is shaped by our Values, is a core component of the Group’s success.”
Claire JohnsonGroup Human Resources Manager
Our diverse business
7,500+ people
1,600+ sales and service engineers
122 operating units**
62 countries with a direct sales presence
1,500 core product lines
100,000+ direct buying customers‡
** Operating units are business units that invoice locally.
‡ Actively purchasing in the last 24 months.
5Spirax-Sarco Engineering plc Annual Report 2018
Str
ateg
ic R
epo
rt
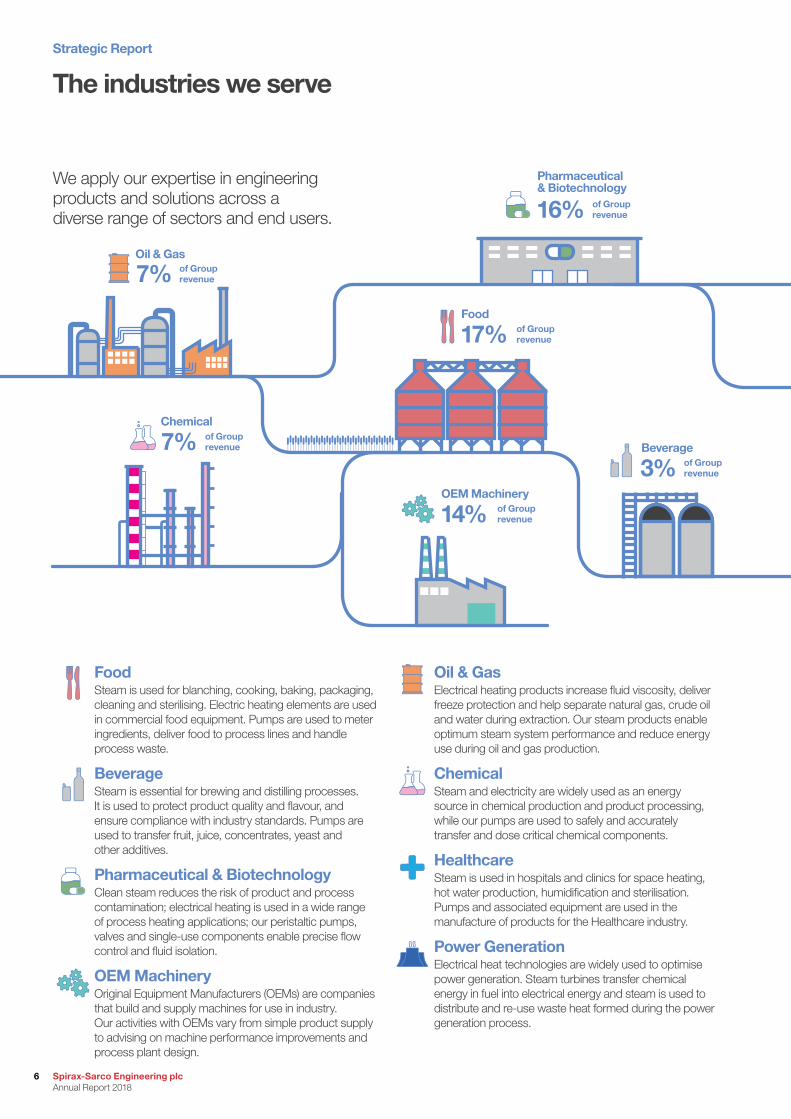
FoodSteam is used for blanching, cooking, baking, packaging, cleaning and sterilising. Electric heating elements are used in commercial food equipment. Pumps are used to meter ingredients, deliver food to process lines and handle process waste.
BeverageSteam is essential for brewing and distilling processes. It is used to protect product quality and flavour, and ensure compliance with industry standards. Pumps are used to transfer fruit, juice, concentrates, yeast and other additives.
Pharmaceutical & BiotechnologyClean steam reduces the risk of product and process contamination; electrical heating is used in a wide range of process heating applications; our peristaltic pumps, valves and single-use components enable precise flow control and fluid isolation.
OEM MachineryOriginal Equipment Manufacturers (OEMs) are companies that build and supply machines for use in industry. Our activities with OEMs vary from simple product supply to advising on machine performance improvements and process plant design.
Oil & GasElectrical heating products increase fluid viscosity, deliver freeze protection and help separate natural gas, crude oil and water during extraction. Our steam products enable optimum steam system performance and reduce energy use during oil and gas production.
ChemicalSteam and electricity are widely used as an energy source in chemical production and product processing, while our pumps are used to safely and accurately transfer and dose critical chemical components.
HealthcareSteam is used in hospitals and clinics for space heating, hot water production, humidification and sterilisation. Pumps and associated equipment are used in the manufacture of products for the Healthcare industry.
Power GenerationElectrical heat technologies are widely used to optimise power generation. Steam turbines transfer chemical energy in fuel into electrical energy and steam is used to distribute and re-use waste heat formed during the power generation process.
The industries we serve
We apply our expertise in engineering products and solutions across a diverse range of sectors and end users.
3%Beverage
17%
14%
16%
Food
OEM Machinery
7%Chemical
7%Oil & Gas
Pharmaceutical & Biotechnology
of Group revenue
of Group revenue
of Group revenue
of Group revenue
of Group revenue
of Group revenue
Strategic Report
Spirax-Sarco Engineering plc Annual Report 2018
6
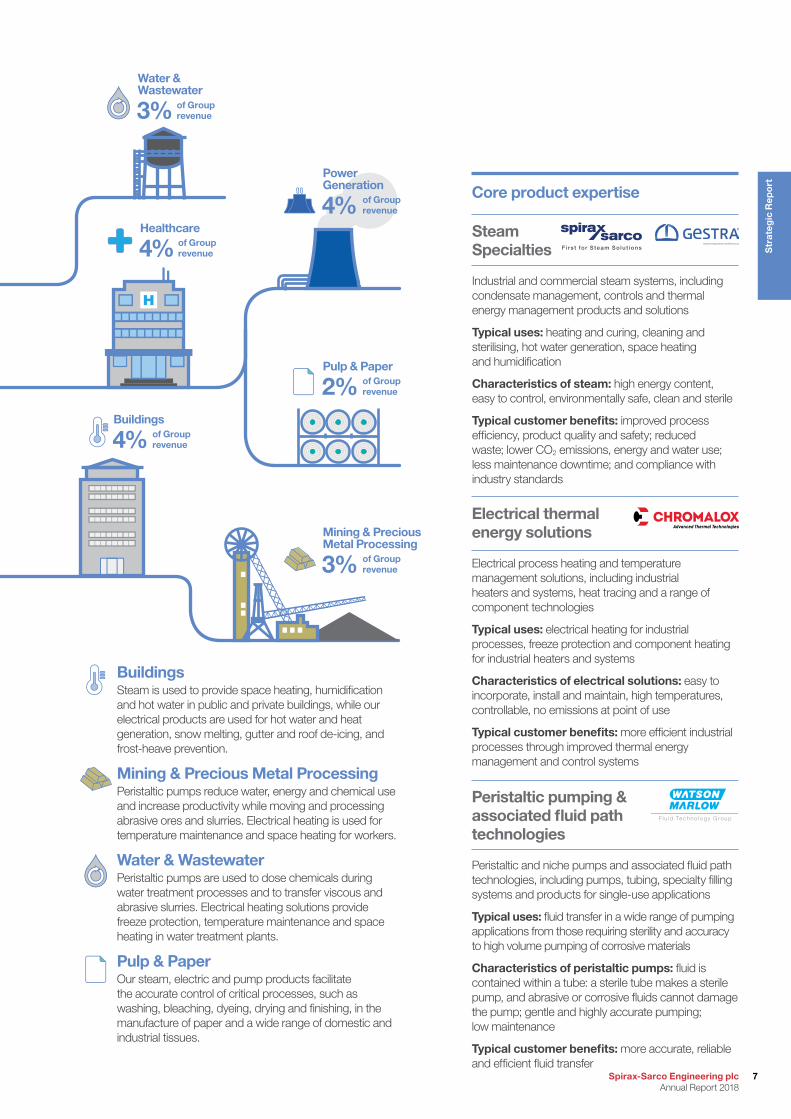
BuildingsSteam is used to provide space heating, humidification and hot water in public and private buildings, while our electrical products are used for hot water and heat generation, snow melting, gutter and roof de-icing, and frost-heave prevention.
Mining & Precious Metal ProcessingPeristaltic pumps reduce water, energy and chemical use and increase productivity while moving and processing abrasive ores and slurries. Electrical heating is used for temperature maintenance and space heating for workers.
Water & WastewaterPeristaltic pumps are used to dose chemicals during water treatment processes and to transfer viscous and abrasive slurries. Electrical heating solutions provide freeze protection, temperature maintenance and space heating in water treatment plants.
Pulp & PaperOur steam, electric and pump products facilitate the accurate control of critical processes, such as washing, bleaching, dyeing, drying and finishing, in the manufacture of paper and a wide range of domestic and industrial tissues.
Core product expertise
4%
4%
Buildings
Healthcare
3%
2%
Water & Wastewater
Pulp & Paper
3%
4%
Power Generation
Mining & Precious Metal Processing
Electrical thermal energy solutions
Electrical process heating and temperature management solutions, including industrial heaters and systems, heat tracing and a range of component technologies
Typical uses: electrical heating for industrial processes, freeze protection and component heating for industrial heaters and systems
Characteristics of electrical solutions: easy to incorporate, install and maintain, high temperatures, controllable, no emissions at point of use
Typical customer benefits: more efficient industrial processes through improved thermal energy management and control systems
Steam Specialties
Industrial and commercial steam systems, including condensate management, controls and thermal energy management products and solutions
Typical uses: heating and curing, cleaning and sterilising, hot water generation, space heating and humidification
Characteristics of steam: high energy content, easy to control, environmentally safe, clean and sterile
Typical customer benefits: improved process efficiency, product quality and safety; reduced waste; lower CO2 emissions, energy and water use; less maintenance downtime; and compliance with industry standards
Fi r s t fo r S team So lu t ions
Peristaltic pumping & associated fluid path technologies
Peristaltic and niche pumps and associated fluid path technologies, including pumps, tubing, specialty filling systems and products for single-use applications
Typical uses: fluid transfer in a wide range of pumping applications from those requiring sterility and accuracy to high volume pumping of corrosive materials
Characteristics of peristaltic pumps: fluid is contained within a tube: a sterile tube makes a sterile pump, and abrasive or corrosive fluids cannot damage the pump; gentle and highly accurate pumping; low maintenance
Typical customer benefits: more accurate, reliable and efficient fluid transfer
F lu id Techno logy G roup
of Group revenue
of Group revenue
of Group revenue
of Group revenue
of Group revenue
of Group revenue
7Spirax-Sarco Engineering plc Annual Report 2018
Str
ateg
ic R
epo
rt
Investment case
Why is this important?By focusing on self-generated growth we unearth problems and design solutions that deliver significant operational benefits for customers. Typically, these bespoke, engineered projects have higher margins and relatively quick sign-off timeframes as they are funded by maintenance and operational budgets at plant level. As we deliver engineered solutions we reinforce our customers’ trust in our engineering expertise and forge sustainable partnerships.
Further readingOur direct sales approach is our greatest competitive advantage and is covered in more detail in our business model and customer case studies.
See pages 12-19
Targeting self-generated growth
35%* of revenue is derived from self-generated opportunities. This reflects our overall strategic objective to deliver self-generated growth to outperform our markets. We achieve this by staying close to our customers – through our direct sales approach – understanding their system requirements and providing them with innovative products and solutions to solve their process challenges.
3
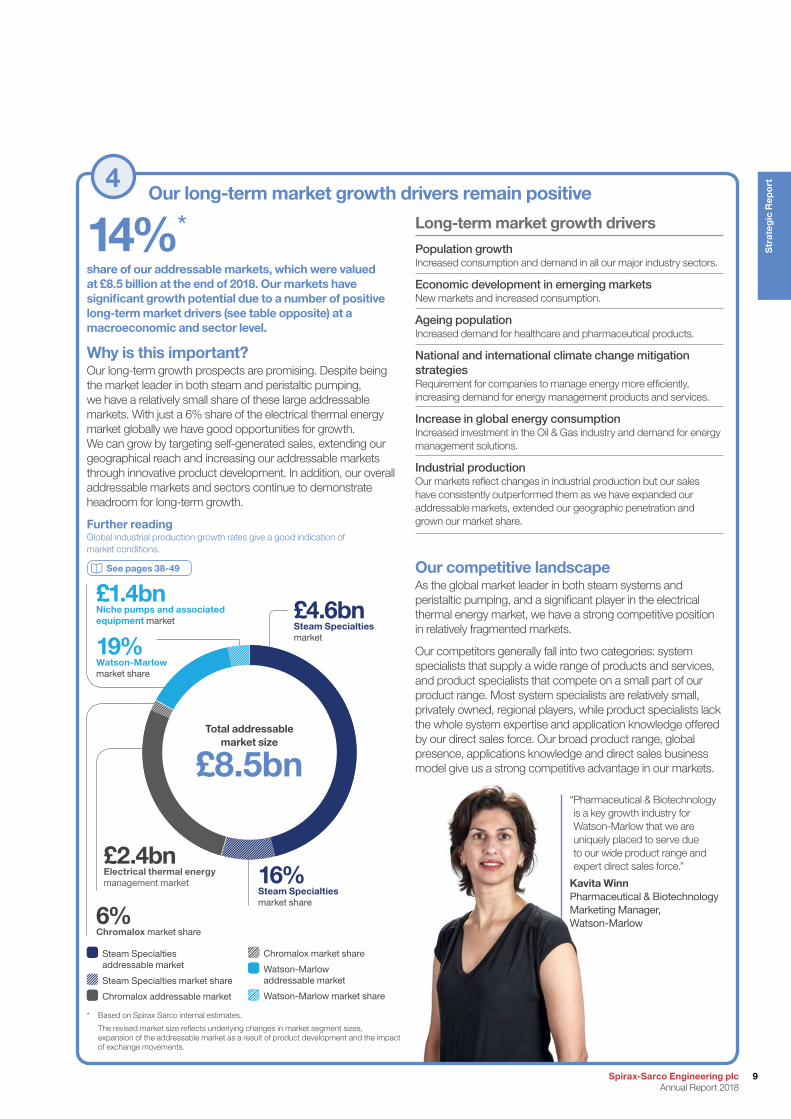
Serving less cyclical industries
50%* of Group revenue is derived from defensive, less cyclical end markets, including: Food & Beverage, Pharmaceutical & Biotechnology, Healthcare and Water & Wastewater.
Why is this important?Not only do we derive revenue from a diverse range of industry sectors, we also have an excellent balance between higher-growth end markets and those that are more defensive and resilient.
Food
Beverage
Pharmaceutical & Biotechnology
OEM Machinery
Oil & Gas
Chemical
Healthcare
Power Generation
Buildings
Mining & Precious Metal Processing
Water & Wastewater
Pulp & Paper
Rubber & Plastic
Textiles
Other
1%2%
1%17%
3%
16%
14%
7%7%
4%
4%
4%
3%
3%
14%
2
Significant income from maintenance and operations expenditure
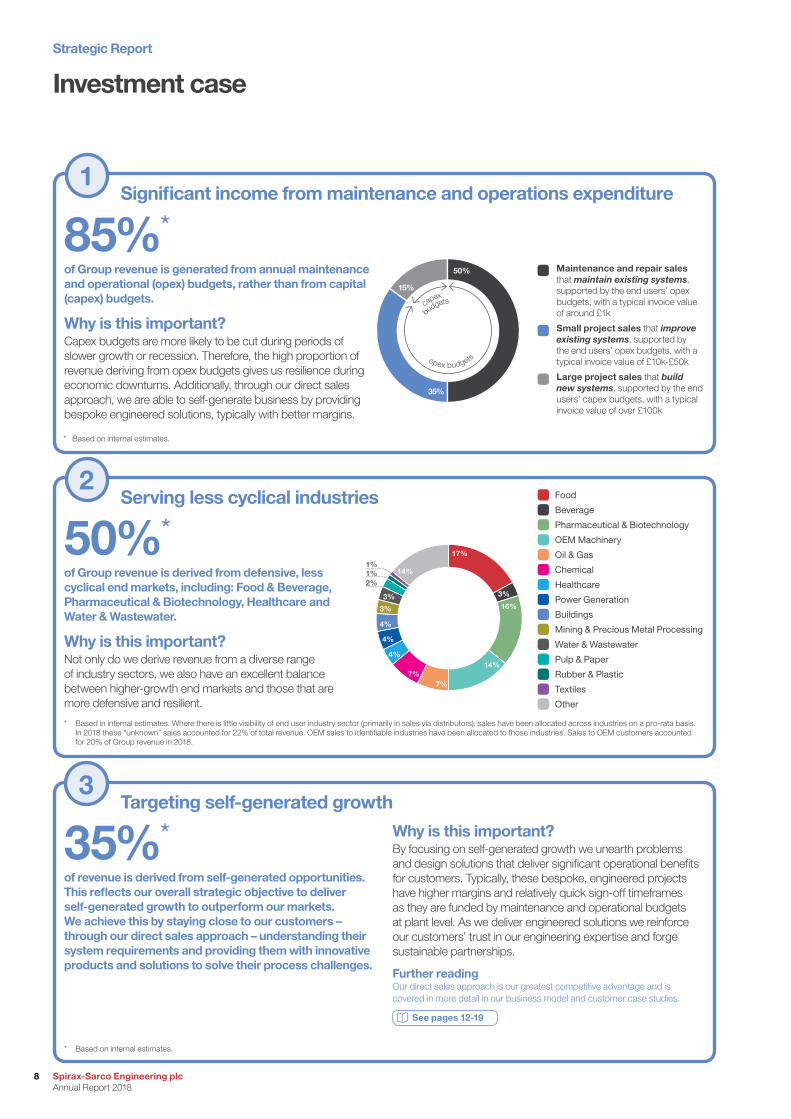
85%* of Group revenue is generated from annual maintenance and operational (opex) budgets, rather than from capital (capex) budgets.
Why is this important?Capex budgets are more likely to be cut during periods of slower growth or recession. Therefore, the high proportion of revenue deriving from opex budgets gives us resilience during economic downturns. Additionally, through our direct sales approach, we are able to self-generate business by providing bespoke engineered solutions, typically with better margins.
Maintenance and repair sales that maintain existing systems, supported by the end users’ opex budgets, with a typical invoice value of around £1k
Small project sales that improve existing systems, supported by the end users’ opex budgets, with a typical invoice value of £10k-£50k
Large project sales that build new systems, supported by the end users’ capex budgets, with a typical invoice value of over £100k
1
50%
35%
15%
capex
budgets
opex budgets
* Based on internal estimates.
* Based on internal estimates.
* Based in internal estimates. Where there is little visibility of end user industry sector (primarily in sales via distributors), sales have been allocated across industries on a pro-rata basis. In 2018 these “unknown” sales accounted for 22% of total revenue. OEM sales to identifiable industries have been allocated to those industries. Sales to OEM customers accounted for 20% of Group revenue in 2018.
Strategic Report
Spirax-Sarco Engineering plc Annual Report 2018
8
Our long-term market growth drivers remain positive
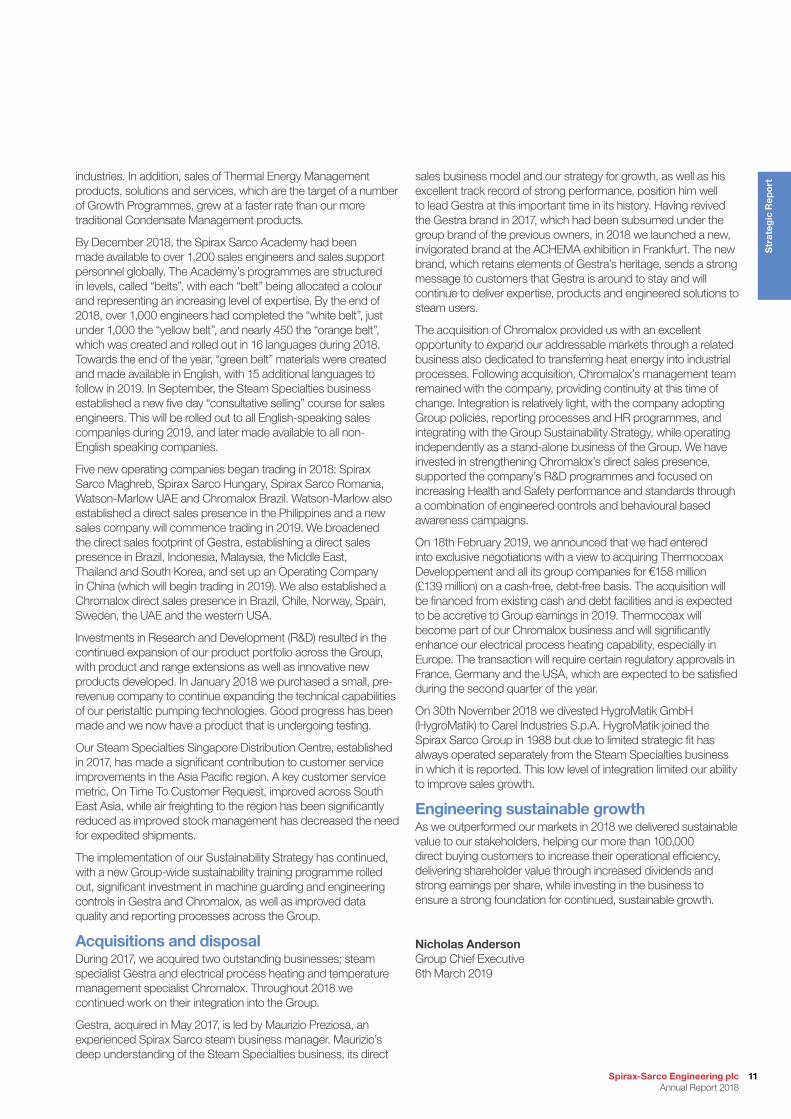
14%*share of our addressable markets, which were valued at £8.5 billion at the end of 2018. Our markets have significant growth potential due to a number of positive long-term market drivers (see table opposite) at a macroeconomic and sector level.
Why is this important?Our long-term growth prospects are promising. Despite being the market leader in both steam and peristaltic pumping, we have a relatively small share of these large addressable markets. With just a 6% share of the electrical thermal energy market globally we have good opportunities for growth. We can grow by targeting self-generated sales, extending our geographical reach and increasing our addressable markets through innovative product development. In addition, our overall addressable markets and sectors continue to demonstrate headroom for long-term growth.
Further readingGlobal industrial production growth rates give a good indication of market conditions.
See pages 38-49
Long-term market growth drivers
Population growthIncreased consumption and demand in all our major industry sectors.
Economic development in emerging marketsNew markets and increased consumption.
Ageing populationIncreased demand for healthcare and pharmaceutical products.
National and international climate change mitigation strategiesRequirement for companies to manage energy more efficiently, increasing demand for energy management products and services.
Increase in global energy consumptionIncreased investment in the Oil & Gas industry and demand for energy management solutions.
Industrial productionOur markets reflect changes in industrial production but our sales have consistently outperformed them as we have expanded our addressable markets, extended our geographic penetration and grown our market share.
Our competitive landscapeAs the global market leader in both steam systems and peristaltic pumping, and a significant player in the electrical thermal energy market, we have a strong competitive position in relatively fragmented markets.
Our competitors generally fall into two categories: system specialists that supply a wide range of products and services, and product specialists that compete on a small part of our product range. Most system specialists are relatively small, privately owned, regional players, while product specialists lack the whole system expertise and application knowledge offered by our direct sales force. Our broad product range, global presence, applications knowledge and direct sales business model give us a strong competitive advantage in our markets.
£4.6bn Steam Specialties market
16%Steam Specialties market share
£2.4bnElectrical thermal energy management market
6% Chromalox market share
£1.4bnNiche pumps and associated equipment market
19%Watson-Marlow market share
Steam Specialties addressable market
Steam Specialties market share
Chromalox addressable market
Chromalox market share
Watson-Marlow addressable market
Watson-Marlow market share
* Based on Spirax Sarco internal estimates.
The revised market size reflects underlying changes in market segment sizes, expansion of the addressable market as a result of product development and the impact of exchange movements.
4
Total addressable market size
£8.5bn“ Pharmaceutical & Biotechnology is a key growth industry for Watson-Marlow that we are uniquely placed to serve due to our wide product range and expert direct sales force.”
Kavita WinnPharmaceutical & Biotechnology Marketing Manager, Watson-Marlow
9Spirax-Sarco Engineering plc Annual Report 2018
Str
ateg
ic R
epo
rt
Our direct sales business model is highly effective at uncovering opportunities to improve customers’ steam systems, electrical heating and temperature management systems, or fluid path processes. As they walk our customers’ facilities, our specialist engineers are able to identify unrecognised needs. The engineered solutions required to meet these needs generally have a relatively short payback period of around 24 months or less and, crucially, are typically paid for out of our customers’ operational budgets. Purchasing decisions are therefore made at operational level from budgets which are less likely to be cut in times of recession. This “self-generated growth” element of our business, combined with the high proportion of sales that derive from end users’ maintenance and operating budgets, and the wide diversity of the markets we serve, both geographically and by industry sector, makes our business highly resilient, although not immune, to economic downturns.
Strategy for growth2018 marked five years since we undertook an extensive strategic review and developed our strategy, the aim of which is to deliver self-generated growth that outperforms our markets. We identified six Group strategic themes which help us to do better what we already do well:
• increase direct sales effectiveness through market sector focus;• develop the knowledge and skills of our expert sales and
service teams;• broaden our global presence;• leverage R&D investments;• optimise supply chain effectiveness; and• operate sustainably and help improve our customers’
sustainability.
The strategy remains relevant and appropriate to our enlarged Group and, as we continue to focus on its rigorous implementation, we are seeing year-on-year benefits as we outperform our markets and achieve above industry growth rates in our target industries.
Strategic implementationDuring 2018, progress continued on the implementation of our strategic priorities, which was a significant contributing factor to the strong financial results and good organic growth achieved during the year. Some examples of progress are outlined below.
We have continued to increase alignment between our direct sales force and our target industries, with Growth Programmes designed to increase sales in priority sectors. Within the Food & Beverage industry, for example, a Growth Programme is focusing on steam quality audits to raise customer awareness of, and develop growth opportunities for, our clean steam products. Within the Steam Specialties business Spirax Sarco and Gestra operate independently in the marketplace through a dual brand strategy with sectorisation enabling each brand to play to its strengths in core industries – for example, the Power Generation and Chemical industries for Gestra – while still offering customers the choice between the two brands.
Growth in all of our priority sectors in 2018 surpassed market growth rates. For example, within the Steam Specialties business, we achieved 9% growth in the Food & Beverage industry and we understand that the industry itself grew at around 4% globally. It is also important to note that growth in our priority sectors was not achieved at the expense of growth in other, non-focus,
Key points in this section:• Good progress in the implementation of our
strategic priorities
• Growth in all of our priority sectors surpassed market growth rates
• Further development of Spirax Sarco Academy programmes; roll out in 16 languages
• Geographical expansion in all Group businesses
• 2017 acquisitions integrating well
We delivered shareholder value through increased dividends and strong earnings per share, while investing in the business to ensure a strong foundation for continued, sustainable growth.”Nicholas AndersonGroup Chief Executive
Group Chief Executive’s StatementEngineering sustainable growth
IntroductionOur Company’s purpose is to create sustainable value for all our stakeholders, by helping the users of our products and services to increase operational efficiency, reduce environmental impacts, improve product quality, provide safer working environments and achieve regulatory compliance. We do this through a direct sales business model, which utilises an extensive global network of over 1,600 sales and service engineers. Unique in number and expertise amongst our competitors, these engineers understand our customers’ operational and process challenges and have the applications knowledge to design bespoke engineered solutions to resolve them, while utilising our broad product range.
Strategic Report
Spirax-Sarco Engineering plc Annual Report 2018
10
industries. In addition, sales of Thermal Energy Management products, solutions and services, which are the target of a number of Growth Programmes, grew at a faster rate than our more traditional Condensate Management products.
By December 2018, the Spirax Sarco Academy had been made available to over 1,200 sales engineers and sales support personnel globally. The Academy’s programmes are structured in levels, called “belts”, with each “belt” being allocated a colour and representing an increasing level of expertise. By the end of 2018, over 1,000 engineers had completed the “white belt”, just under 1,000 the “yellow belt”, and nearly 450 the “orange belt”, which was created and rolled out in 16 languages during 2018. Towards the end of the year, “green belt” materials were created and made available in English, with 15 additional languages to follow in 2019. In September, the Steam Specialties business established a new five day “consultative selling” course for sales engineers. This will be rolled out to all English-speaking sales companies during 2019, and later made available to all non-English speaking companies.
Five new operating companies began trading in 2018: Spirax Sarco Maghreb, Spirax Sarco Hungary, Spirax Sarco Romania, Watson-Marlow UAE and Chromalox Brazil. Watson-Marlow also established a direct sales presence in the Philippines and a new sales company will commence trading in 2019. We broadened the direct sales footprint of Gestra, establishing a direct sales presence in Brazil, Indonesia, Malaysia, the Middle East, Thailand and South Korea, and set up an Operating Company in China (which will begin trading in 2019). We also established a Chromalox direct sales presence in Brazil, Chile, Norway, Spain, Sweden, the UAE and the western USA.
Investments in Research and Development (R&D) resulted in the continued expansion of our product portfolio across the Group, with product and range extensions as well as innovative new products developed. In January 2018 we purchased a small, pre-revenue company to continue expanding the technical capabilities of our peristaltic pumping technologies. Good progress has been made and we now have a product that is undergoing testing.
Our Steam Specialties Singapore Distribution Centre, established in 2017, has made a significant contribution to customer service improvements in the Asia Pacific region. A key customer service metric, On Time To Customer Request, improved across South East Asia, while air freighting to the region has been significantly reduced as improved stock management has decreased the need for expedited shipments.
The implementation of our Sustainability Strategy has continued, with a new Group-wide sustainability training programme rolled out, significant investment in machine guarding and engineering controls in Gestra and Chromalox, as well as improved data quality and reporting processes across the Group.
Acquisitions and disposalDuring 2017, we acquired two outstanding businesses; steam specialist Gestra and electrical process heating and temperature management specialist Chromalox. Throughout 2018 we continued work on their integration into the Group.
Gestra, acquired in May 2017, is led by Maurizio Preziosa, an experienced Spirax Sarco steam business manager. Maurizio’s deep understanding of the Steam Specialties business, its direct
sales business model and our strategy for growth, as well as his excellent track record of strong performance, position him well to lead Gestra at this important time in its history. Having revived the Gestra brand in 2017, which had been subsumed under the group brand of the previous owners, in 2018 we launched a new, invigorated brand at the ACHEMA exhibition in Frankfurt. The new brand, which retains elements of Gestra’s heritage, sends a strong message to customers that Gestra is around to stay and will continue to deliver expertise, products and engineered solutions to steam users.
The acquisition of Chromalox provided us with an excellent opportunity to expand our addressable markets through a related business also dedicated to transferring heat energy into industrial processes. Following acquisition, Chromalox’s management team remained with the company, providing continuity at this time of change. Integration is relatively light, with the company adopting Group policies, reporting processes and HR programmes, and integrating with the Group Sustainability Strategy, while operating independently as a stand-alone business of the Group. We have invested in strengthening Chromalox’s direct sales presence, supported the company’s R&D programmes and focused on increasing Health and Safety performance and standards through a combination of engineered controls and behavioural based awareness campaigns.
On 18th February 2019, we announced that we had entered into exclusive negotiations with a view to acquiring Thermocoax Developpement and all its group companies for €158 million (£139 million) on a cash-free, debt-free basis. The acquisition will be financed from existing cash and debt facilities and is expected to be accretive to Group earnings in 2019. Thermocoax will become part of our Chromalox business and will significantly enhance our electrical process heating capability, especially in Europe. The transaction will require certain regulatory approvals in France, Germany and the USA, which are expected to be satisfied during the second quarter of the year.
On 30th November 2018 we divested HygroMatik GmbH (HygroMatik) to Carel Industries S.p.A. HygroMatik joined the Spirax Sarco Group in 1988 but due to limited strategic fit has always operated separately from the Steam Specialties business in which it is reported. This low level of integration limited our ability to improve sales growth.
Engineering sustainable growthAs we outperformed our markets in 2018 we delivered sustainable value to our stakeholders, helping our more than 100,000 direct buying customers to increase their operational efficiency, delivering shareholder value through increased dividends and strong earnings per share, while investing in the business to ensure a strong foundation for continued, sustainable growth.
Nicholas Anderson Group Chief Executive 6th March 2019
11Spirax-Sarco Engineering plc Annual Report 2018
Str
ateg
ic R
epo
rt
Our business modelCreating value through meeting customer needs
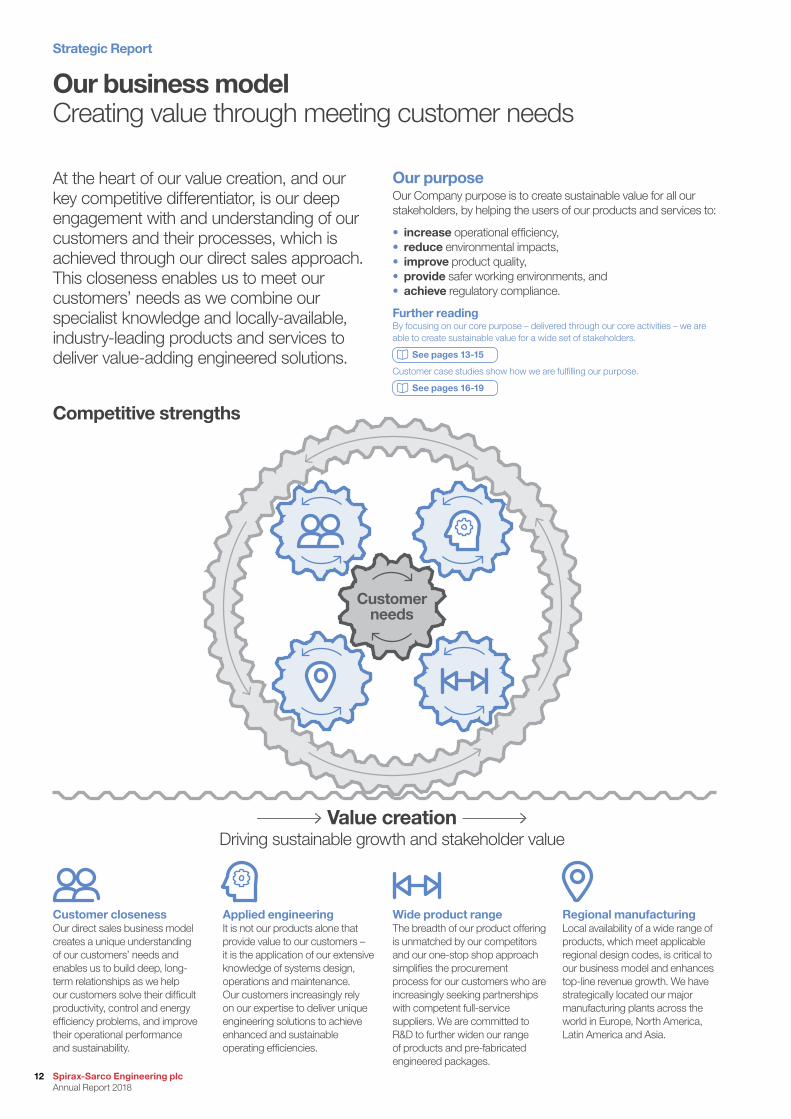
At the heart of our value creation, and our key competitive differentiator, is our deep engagement with and understanding of our customers and their processes, which is achieved through our direct sales approach. This closeness enables us to meet our customers’ needs as we combine our specialist knowledge and locally-available, industry-leading products and services to deliver value-adding engineered solutions.
Our purposeOur Company purpose is to create sustainable value for all our stakeholders, by helping the users of our products and services to:
• increase operational efficiency,• reduce environmental impacts,• improve product quality,• provide safer working environments, and• achieve regulatory compliance.
Further readingBy focusing on our core purpose – delivered through our core activities – we are able to create sustainable value for a wide set of stakeholders.
See pages 13-15
Customer case studies show how we are fulfilling our purpose.
See pages 16-19
Competitive strengths
Value creationDriving sustainable growth and stakeholder value
Customer needs
Applied engineeringIt is not our products alone that provide value to our customers – it is the application of our extensive knowledge of systems design, operations and maintenance. Our customers increasingly rely on our expertise to deliver unique engineering solutions to achieve enhanced and sustainable operating efficiencies.
Wide product rangeThe breadth of our product offering is unmatched by our competitors and our one-stop shop approach simplifies the procurement process for our customers who are increasingly seeking partnerships with competent full-service suppliers. We are committed to R&D to further widen our range of products and pre-fabricated engineered packages.
Regional manufacturingLocal availability of a wide range of products, which meet applicable regional design codes, is critical to our business model and enhances top-line revenue growth. We have strategically located our major manufacturing plants across the world in Europe, North America, Latin America and Asia.
Customer closeness Our direct sales business model creates a unique understanding of our customers’ needs and enables us to build deep, long-term relationships as we help our customers solve their difficult productivity, control and energy efficiency problems, and improve their operational performance and sustainability.
Strategic Report
Spirax-Sarco Engineering plc Annual Report 2018
12
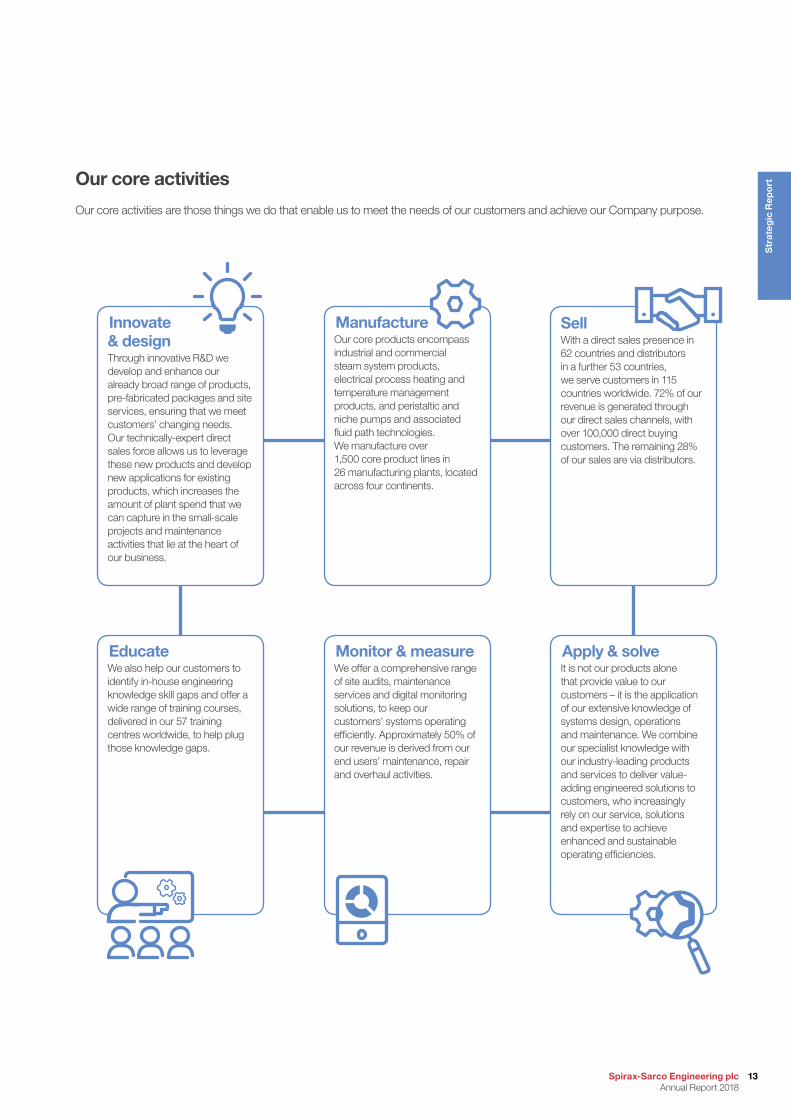
Innovate & designThrough innovative R&D we develop and enhance our already broad range of products, pre-fabricated packages and site services, ensuring that we meet customers’ changing needs. Our technically-expert direct sales force allows us to leverage these new products and develop new applications for existing products, which increases the amount of plant spend that we can capture in the small-scale projects and maintenance activities that lie at the heart of our business.
ManufactureOur core products encompass industrial and commercial steam system products, electrical process heating and temperature management products, and peristaltic and niche pumps and associated fluid path technologies. We manufacture over 1,500 core product lines in 26 manufacturing plants, located across four continents.
Monitor & measureWe offer a comprehensive range of site audits, maintenance services and digital monitoring solutions, to keep our customers’ systems operating efficiently. Approximately 50% of our revenue is derived from our end users’ maintenance, repair and overhaul activities.
Our core activities
Our core activities are those things we do that enable us to meet the needs of our customers and achieve our Company purpose.
SellWith a direct sales presence in 62 countries and distributors in a further 53 countries, we serve customers in 115 countries worldwide. 72% of our revenue is generated through our direct sales channels, with over 100,000 direct buying customers. The remaining 28% of our sales are via distributors.
EducateWe also help our customers to identify in-house engineering knowledge skill gaps and offer a wide range of training courses, delivered in our 57 training centres worldwide, to help plug those knowledge gaps.
Apply & solveIt is not our products alone that provide value to our customers – it is the application of our extensive knowledge of systems design, operations and maintenance. We combine our specialist knowledge with our industry-leading products and services to deliver value-adding engineered solutions to customers, who increasingly rely on our service, solutions and expertise to achieve enhanced and sustainable operating efficiencies.
13Spirax-Sarco Engineering plc Annual Report 2018
Str
ateg
ic R
epo
rt
Our business modelcontinued
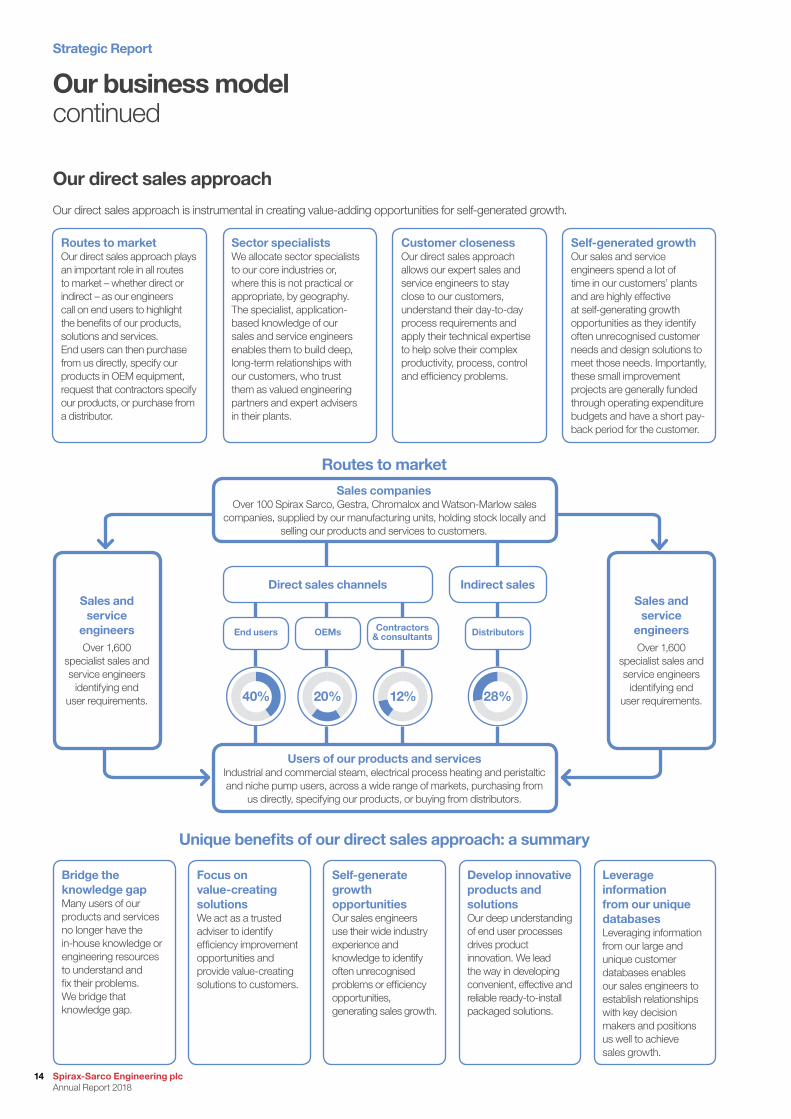
Our direct sales approach is instrumental in creating value-adding opportunities for self-generated growth.
Our direct sales approach
Routes to marketOur direct sales approach plays an important role in all routes to market – whether direct or indirect – as our engineers call on end users to highlight the benefits of our products, solutions and services. End users can then purchase from us directly, specify our products in OEM equipment, request that contractors specify our products, or purchase from a distributor.
Bridge the knowledge gapMany users of our products and services no longer have the in-house knowledge or engineering resources to understand and fix their problems. We bridge that knowledge gap.
Sector specialistsWe allocate sector specialists to our core industries or, where this is not practical or appropriate, by geography. The specialist, application-based knowledge of our sales and service engineers enables them to build deep, long-term relationships with our customers, who trust them as valued engineering partners and expert advisers in their plants.
Focus on value-creating solutions We act as a trusted adviser to identify efficiency improvement opportunities and provide value-creating solutions to customers.
Customer closenessOur direct sales approach allows our expert sales and service engineers to stay close to our customers, understand their day-to-day process requirements and apply their technical expertise to help solve their complex productivity, process, control and efficiency problems.
Self-generate growth opportunities Our sales engineers use their wide industry experience and knowledge to identify often unrecognised problems or efficiency opportunities, generating sales growth.
Self-generated growthOur sales and service engineers spend a lot of time in our customers’ plants and are highly effective at self-generating growth opportunities as they identify often unrecognised customer needs and design solutions to meet those needs. Importantly, these small improvement projects are generally funded through operating expenditure budgets and have a short pay-back period for the customer.
Develop innovative products and solutionsOur deep understanding of end user processes drives product innovation. We lead the way in developing convenient, effective and reliable ready-to-install packaged solutions.
Leverage information from our unique databases Leveraging information from our large and unique customer databases enables our sales engineers to establish relationships with key decision makers and positions us well to achieve sales growth.
Unique benefits of our direct sales approach: a summary
Routes to market
Sales and service
engineersOver 1,600
specialist sales and service engineers
identifying end user requirements.
Sales and service
engineersOver 1,600
specialist sales and service engineers
identifying end user requirements.
Sales companiesOver 100 Spirax Sarco, Gestra, Chromalox and Watson-Marlow sales
companies, supplied by our manufacturing units, holding stock locally and selling our products and services to customers.
Users of our products and servicesIndustrial and commercial steam, electrical process heating and peristaltic and niche pump users, across a wide range of markets, purchasing from
us directly, specifying our products, or buying from distributors.
Direct sales channels
End users OEMs Contractors & consultants Distributors
Indirect sales
40% 20% 12% 28%
Strategic Report
Spirax-Sarco Engineering plc Annual Report 2018
14
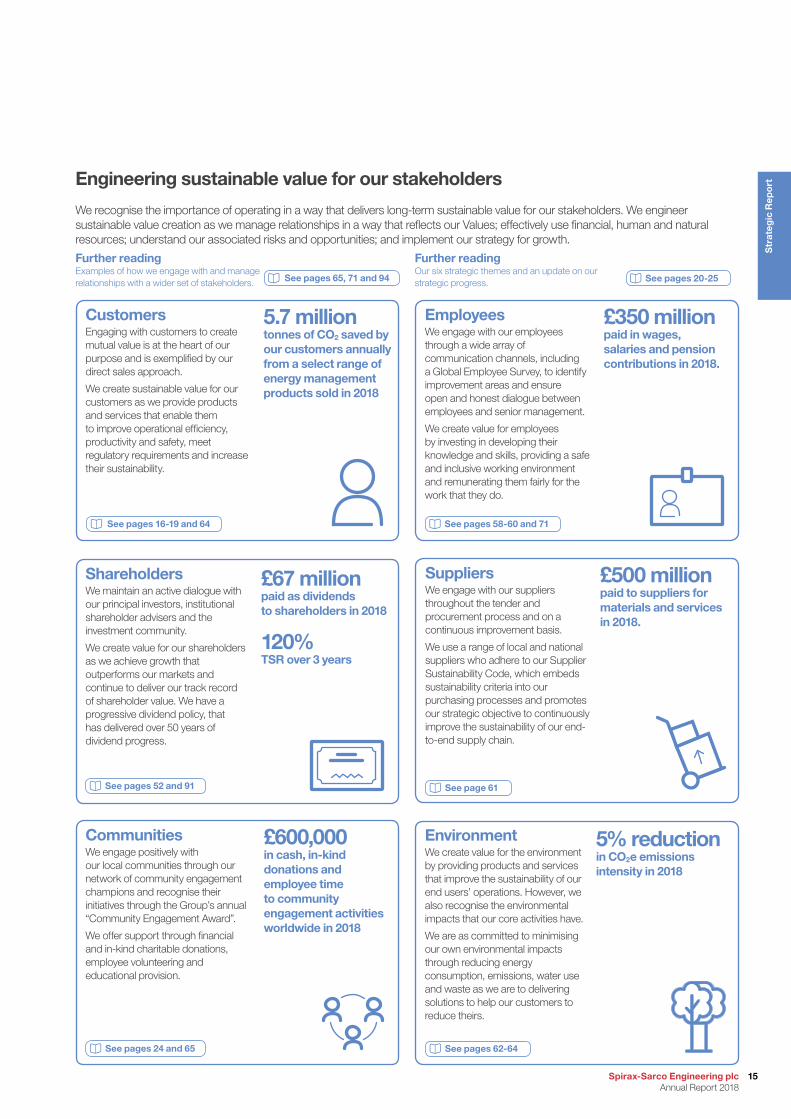
SuppliersWe engage with our suppliers throughout the tender and procurement process and on a continuous improvement basis.
We use a range of local and national suppliers who adhere to our Supplier Sustainability Code, which embeds sustainability criteria into our purchasing processes and promotes our strategic objective to continuously improve the sustainability of our end-to-end supply chain.
£500 millionpaid to suppliers for materials and services in 2018.
Engineering sustainable value for our stakeholders
We recognise the importance of operating in a way that delivers long-term sustainable value for our stakeholders. We engineer sustainable value creation as we manage relationships in a way that reflects our Values; effectively use financial, human and natural resources; understand our associated risks and opportunities; and implement our strategy for growth.
See page 61
Environment We create value for the environment by providing products and services that improve the sustainability of our end users’ operations. However, we also recognise the environmental impacts that our core activities have.
We are as committed to minimising our own environmental impacts through reducing energy consumption, emissions, water use and waste as we are to delivering solutions to help our customers to reduce theirs.
5% reductionin CO2e emissions intensity in 2018
See pages 62-64
See pages 58-60 and 71
EmployeesWe engage with our employees through a wide array of communication channels, including a Global Employee Survey, to identify improvement areas and ensure open and honest dialogue between employees and senior management.
We create value for employees by investing in developing their knowledge and skills, providing a safe and inclusive working environment and remunerating them fairly for the work that they do.
£350 millionpaid in wages, salaries and pension contributions in 2018.
Shareholders We maintain an active dialogue with our principal investors, institutional shareholder advisers and the investment community.
We create value for our shareholders as we achieve growth that outperforms our markets and continue to deliver our track record of shareholder value. We have a progressive dividend policy, that has delivered over 50 years of dividend progress.
See pages 52 and 91
£67 millionpaid as dividends to shareholders in 2018
120% TSR over 3 years
See pages 24 and 65
CommunitiesWe engage positively with our local communities through our network of community engagement champions and recognise their initiatives through the Group’s annual “Community Engagement Award”.
We offer support through financial and in-kind charitable donations, employee volunteering and educational provision.
£600,000in cash, in-kind donations and employee time to community engagement activities worldwide in 2018
See pages 16-19 and 64
CustomersEngaging with customers to create mutual value is at the heart of our purpose and is exemplified by our direct sales approach.
We create sustainable value for our customers as we provide products and services that enable them to improve operational efficiency, productivity and safety, meet regulatory requirements and increase their sustainability.
5.7 milliontonnes of CO2 saved by our customers annually from a select range of energy management products sold in 2018
Further readingExamples of how we engage with and manage relationships with a wider set of stakeholders. See pages 20-25
Further readingOur six strategic themes and an update on our strategic progress. See pages 65, 71 and 94
15Spirax-Sarco Engineering plc Annual Report 2018
Str
ateg
ic R
epo
rt
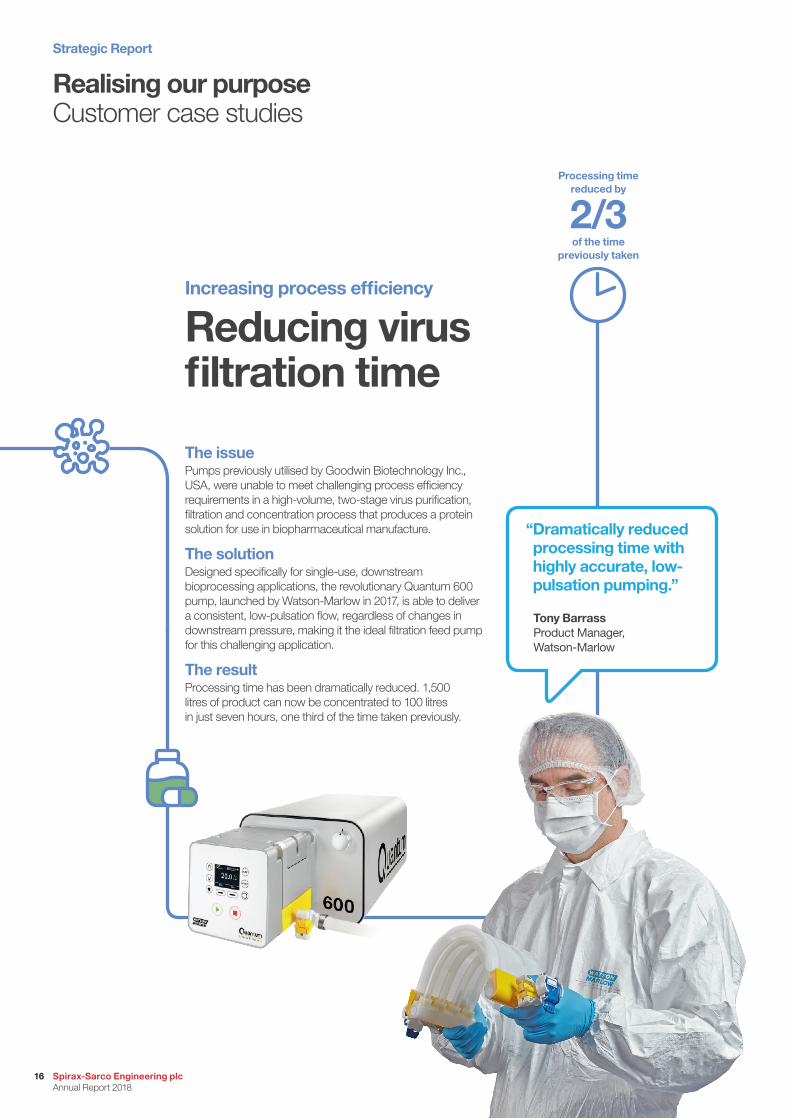
2/3of the time
previously taken
Processing time reduced by
Realising our purpose Customer case studies
Increasing process efficiency
Reducing virus filtration time
The issuePumps previously utilised by Goodwin Biotechnology Inc., USA, were unable to meet challenging process efficiency requirements in a high-volume, two-stage virus purification, filtration and concentration process that produces a protein solution for use in biopharmaceutical manufacture.
The solutionDesigned specifically for single-use, downstream bioprocessing applications, the revolutionary Quantum 600 pump, launched by Watson-Marlow in 2017, is able to deliver a consistent, low-pulsation flow, regardless of changes in downstream pressure, making it the ideal filtration feed pump for this challenging application.
The resultProcessing time has been dramatically reduced. 1,500 litres of product can now be concentrated to 100 litres in just seven hours, one third of the time taken previously.
“ Dramatically reduced processing time with highly accurate, low-pulsation pumping.”
Tony Barrass Product Manager, Watson-Marlow
Strategic Report
Spirax-Sarco Engineering plc Annual Report 2018
16
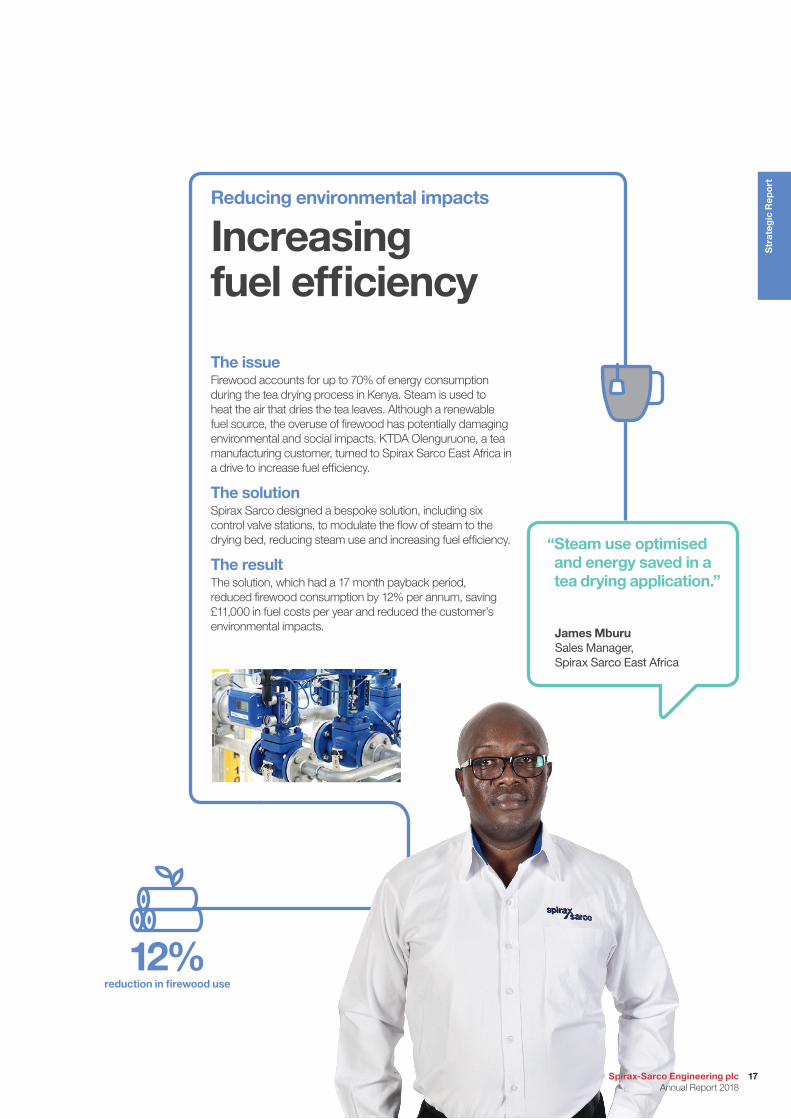
Reducing environmental impacts
Increasing fuel efficiency
The issueFirewood accounts for up to 70% of energy consumption during the tea drying process in Kenya. Steam is used to heat the air that dries the tea leaves. Although a renewable fuel source, the overuse of firewood has potentially damaging environmental and social impacts. KTDA Olenguruone, a tea manufacturing customer, turned to Spirax Sarco East Africa in a drive to increase fuel efficiency.
The solutionSpirax Sarco designed a bespoke solution, including six control valve stations, to modulate the flow of steam to the drying bed, reducing steam use and increasing fuel efficiency.
The resultThe solution, which had a 17 month payback period, reduced firewood consumption by 12% per annum, saving £11,000 in fuel costs per year and reduced the customer’s environmental impacts.
12%reduction in firewood use
“ Steam use optimised and energy saved in a tea drying application.”
James Mburu Sales Manager, Spirax Sarco East Africa
17
Str
ateg
ic R
epo
rt
Spirax-Sarco Engineering plc Annual Report 2018
Realising our purpose continued
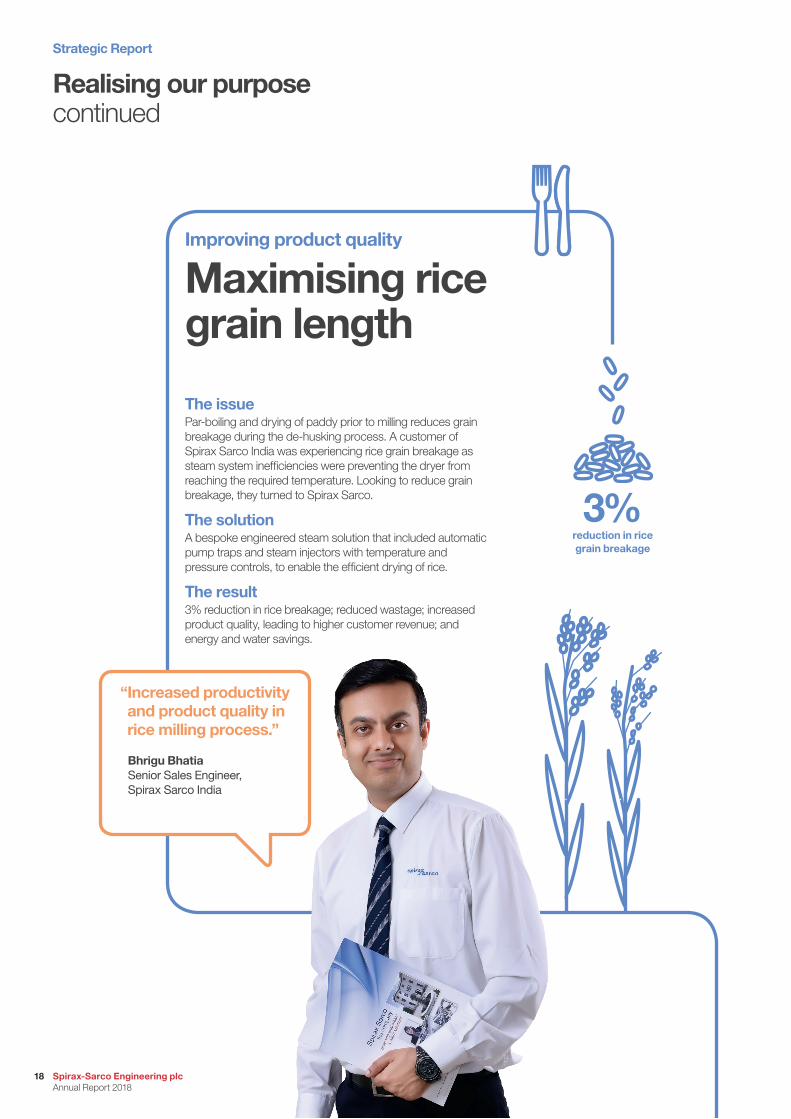
Improving product quality
Maximising rice grain length
The issuePar-boiling and drying of paddy prior to milling reduces grain breakage during the de-husking process. A customer of Spirax Sarco India was experiencing rice grain breakage as steam system inefficiencies were preventing the dryer from reaching the required temperature. Looking to reduce grain breakage, they turned to Spirax Sarco.
The solutionA bespoke engineered steam solution that included automatic pump traps and steam injectors with temperature and pressure controls, to enable the efficient drying of rice.
The result3% reduction in rice breakage; reduced wastage; increased product quality, leading to higher customer revenue; and energy and water savings.
“ Increased productivity and product quality in rice milling process.”
Bhrigu Bhatia Senior Sales Engineer, Spirax Sarco India
3%reduction in rice grain breakage
Strategic Report
Spirax-Sarco Engineering plc Annual Report 2018
18
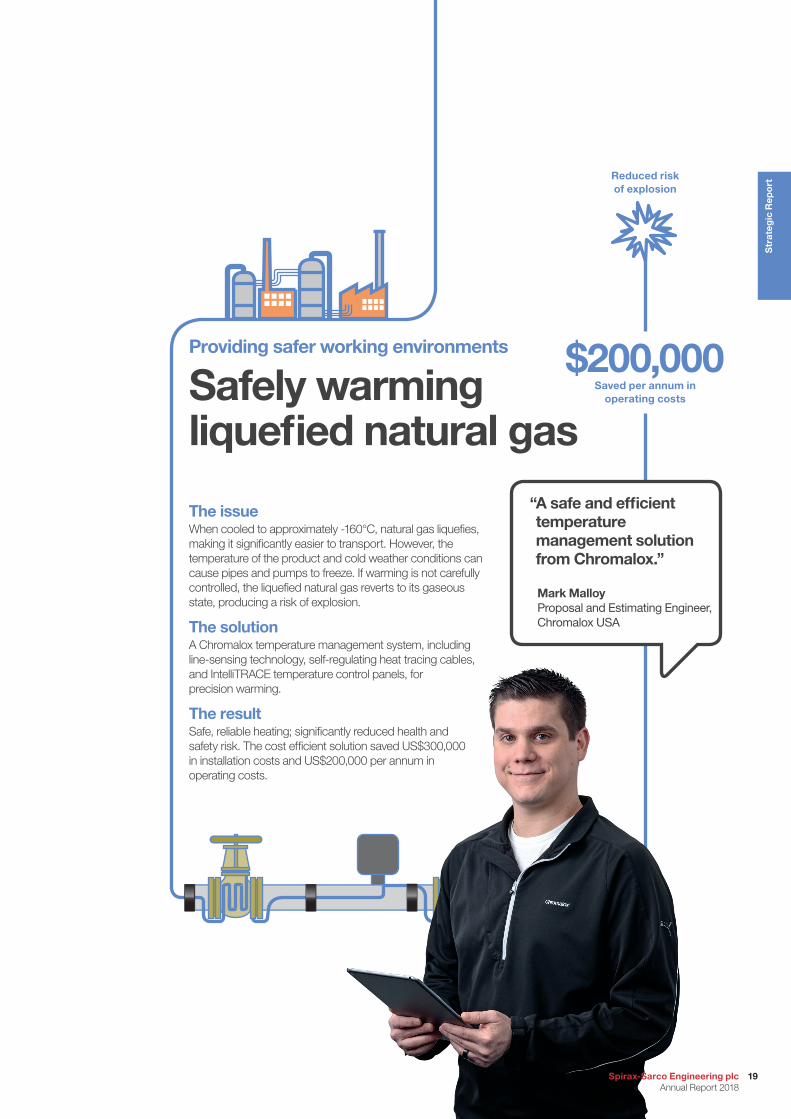
Providing safer working environments
Safely warming liquefied natural gas
The issueWhen cooled to approximately -160°C, natural gas liquefies, making it significantly easier to transport. However, the temperature of the product and cold weather conditions can cause pipes and pumps to freeze. If warming is not carefully controlled, the liquefied natural gas reverts to its gaseous state, producing a risk of explosion.
The solutionA Chromalox temperature management system, including line-sensing technology, self-regulating heat tracing cables, and IntelliTRACE temperature control panels, for precision warming.
The resultSafe, reliable heating; significantly reduced health and safety risk. The cost efficient solution saved US$300,000 in installation costs and US$200,000 per annum in operating costs.
$200,000Saved per annum in
operating costs
Reduced risk of explosion
“ A safe and efficient temperature management solution from Chromalox.”
Mark Malloy Proposal and Estimating Engineer, Chromalox USA
19Spirax-Sarco Engineering plc Annual Report 2018
Str
ateg
ic R
epo
rt
Our strategy
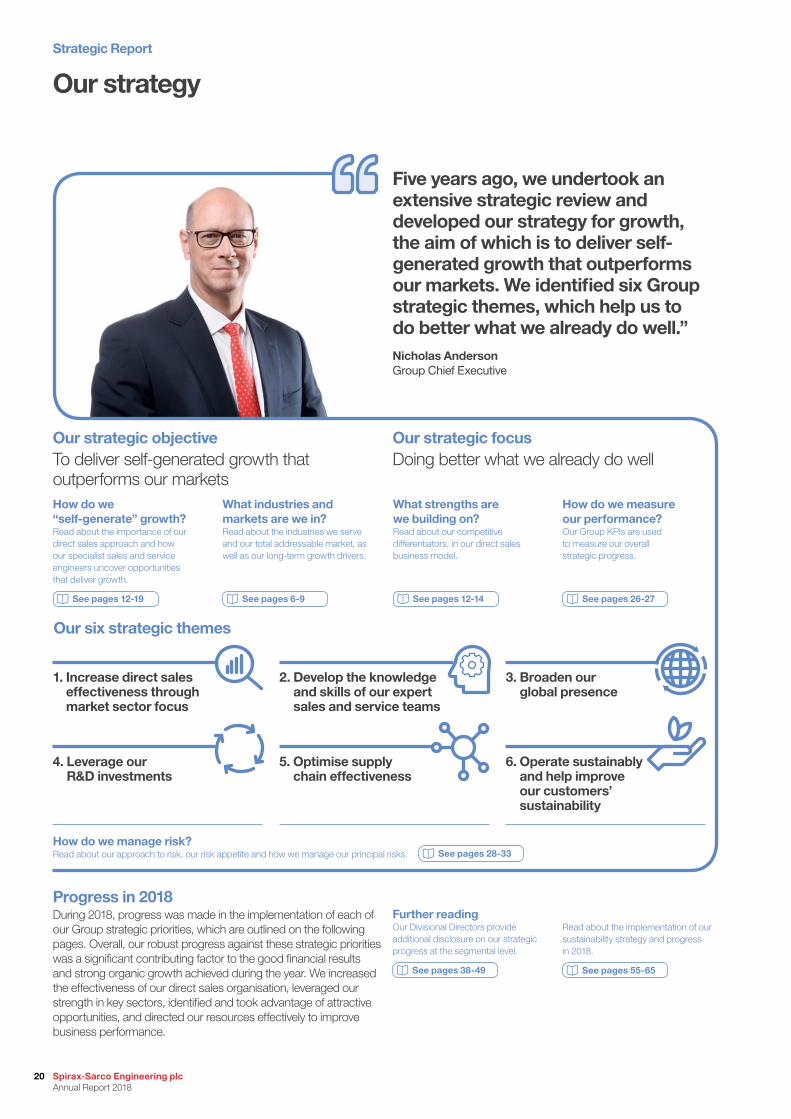
Five years ago, we undertook an extensive strategic review and developed our strategy for growth, the aim of which is to deliver self-generated growth that outperforms our markets. We identified six Group strategic themes, which help us to do better what we already do well.”Nicholas AndersonGroup Chief Executive
Progress in 2018During 2018, progress was made in the implementation of each of our Group strategic priorities, which are outlined on the following pages. Overall, our robust progress against these strategic priorities was a significant contributing factor to the good financial results and strong organic growth achieved during the year. We increased the effectiveness of our direct sales organisation, leveraged our strength in key sectors, identified and took advantage of attractive opportunities, and directed our resources effectively to improve business performance.
Our strategic objectiveTo deliver self-generated growth that outperforms our markets
Our strategic focusDoing better what we already do well
Further readingOur Divisional Directors provide additional disclosure on our strategic progress at the segmental level.
See pages 38-49
How do we “self-generate” growth?Read about the importance of our direct sales approach and how our specialist sales and service engineers uncover opportunities that deliver growth.
See pages 12-19
How do we manage risk?Read about our approach to risk, our risk appetite and how we manage our principal risks. See pages 28-33
Read about the implementation of our sustainability strategy and progress in 2018.
See pages 55-65
What industries and markets are we in?Read about the industries we serve and our total addressable market, as well as our long-term growth drivers.
See pages 6-9
How do we measure our performance?Our Group KPIs are used to measure our overall strategic progress.
See pages 26-27
What strengths are we building on?Read about our competitive differentiators, in our direct sales business model.
See pages 12-14
1. Increase direct sales effectiveness through market sector focus
4. Leverage our R&D investments
2. Develop the knowledge and skills of our expert sales and service teams
5. Optimise supply chain effectiveness
3. Broaden our global presence
6. Operate sustainably and help improve our customers’ sustainability
Our six strategic themes
Strategic Report
Spirax-Sarco Engineering plc Annual Report 2018
20

As we sectorise our sales and service engineers around key industries, and align our products and services in support of this, we increase our ability to self-generate growth and provide value to customers.
Progress in 2018Sectorisation is a core component of Gestra’s integration plan, with Gestra and Spirax Sarco focusing on those industries that best suit their respective strengths and expertise. Gestra, for example, has a strategic focus on boiler OEMs, Power Generation and the Chemical industry, while Spirax Sarco’s strategic focus is directed towards industries such as Food & Beverage and Healthcare. Throughout the year, our operating units have continued to sectorise their sales teams – balanced against geographical coverage requirements. We have continued to focus on market development, with industry managers setting strategic direction in their respective industries and creating communities of practice across the organisation. New product development has been aligned with our sector focus and we have continued to raise the efficacy of our marketing efforts through campaigns clearly targeted at specific industries.
Focus for 2019• Developing industry and application-focused products and
engineered solutions to align our offering with the needs of customers in our target industries
• Continuing sectorisation of sales and service engineers globally, as appropriate
The knowledge of our sales and service engineers is a key differentiator. We invest extensively in the professional development of our people, building a level of expertise that is unrivalled by our competitors.
Progress in 2018We continued to develop the programmes of the Spirax Sarco Academy in 2018, with “orange belt” programmes rolled out in 16 languages to over 1,200 people. The “green belt” learning materials have been created and rolled out in English, with 15 additional languages to follow in 2019. In April, Watson-Marlow delivered a training event in the USA, attended by nearly 200 international sales engineers from across the organisation, focused on the Food & Beverage, Industrial and Environmental sectors. Online training materials about the products of recent acquisition, Aflex Hose, were developed and have been rolled out across the Watson-Marlow organisation in Europe and the Middle East as part of the conversion from distributor to direct sales for Aflex. Watson-Marlow also launched a new skill assessment tool to enable better analysis of individual development and training needs.
Focus for 2019• Continuing development and roll out of the programmes of the
Spirax Sarco Academy• Increasing sectorisation of Watson-Marlow’s training materials• Watson-Marlow Biotechnology and OEM conferences for
sales engineers
Combining products designed to meet specific industry requirements with the application knowledge of our sectorised sales engineers, increases direct sales effectiveness. To this end, and in response to a customer request, within 18 months Spirax Sarco developed the innovative STAPS ISA100 Wireless Steam Trap Monitoring device, specifically designed for use in the Oil & Gas industry, to drive down energy and water wastage. Due to the large trap population on many Oil & Gas facilities, failed traps can go unnoticed for an extended period of time. Wireless monitoring enables customers to identify and quickly address failed traps, reducing costs and environmental impacts. STAPS ISA100 is certified as safe to operate in areas where there is a risk of explosion or restrictions due to flammable atmospheres.
Lukas Grech joined Spirax Sarco’s graduate programme in Cheltenham, in 2013. Following several placements around the business he took a permanent role in Spirax Sarco Australia as a sales engineer and is now Sales Manager for the state of Victoria. The Spirax Sarco Academy has played a key role in Lukas’ progression in the company. He used it to develop his own product and applications knowledge and now uses it to measure and meet his team’s development needs. “The Academy benefits my team” said Lukas, “by placing 100+ years of Spirax knowledge at their fingertips. My team is young and the Academy allows them to fast track their knowledge intake, which in turn ensures that they can provide the advice and quality of service that customers expect from Spirax Sarco.”
Strategy in action Strategy in action
1. Increase direct sales effectiveness through market sector focus
2. Develop the knowledge and skills of our expert sales and service teams
21Spirax-Sarco Engineering plc Annual Report 2018
Str
ateg
ic R
epo
rt
Our strategycontinued
Our strong global infrastructure enables us to rapidly branch into neighbouring markets or leverage our existing infrastructure to pioneer the introduction of our businesses and technologies into new markets.
Progress in 2018New Spirax Sarco operating units began trading in the Maghreb, Hungary and Romania, a direct sales presence was established in Ghana. A new Watson-Marlow operating unit beginning trading in the United Arab Emirates (UAE) and a direct sales presence was established in the Philippines. We have accelerated a programme of international expansion for Gestra and Chromalox, leveraging Spirax Sarco’s global presence to facilitate ease of entry into new markets. During the year, Chromalox established an operating unit in Brazil and a direct sales presence in Chile, Spain, Sweden, Norway and the UAE, countries previously served by distributors. Gestra established a direct sales presence in Brazil, the Middle East, Korea, Indonesia, Thailand and Malaysia, and set up its first new operating unit post-acquisition in China.
Focus for 2019• Continued geographical expansion and strengthening of Gestra
and Chromalox’s direct sales presence internationally• Strengthening Watson-Marlow’s direct sales presence in Asia
and Latin America• Strengthening Spirax Sarco’s direct sales presence in
developing markets
We leverage R&D investments to meet changing customer requirements, improve our offering, respond to market trends, expand our addressable market and maintain our market-leading position in each of our business niches.
Progress in 2018Within the Spirax Sarco Steam Specialties business our applied research model enables us to feed the product development and solutions pipeline, developing new technologies in support of our strategy for growth. Such research, in 2018, included a world first thermal energy to electricity transformation cycle. During 2018, Gestra developed a range of new market-leading boiler controls, ready for launch in 2019, while Chromalox developed an extensive range of new products including a new line of electric steam boilers (see below). Within the Watson-Marlow Fluid Technology Group, Bredel launched two hose range extensions that incorporate new hose materials, the first is designed for use in water treatment and chemical pumping applications, the second has the benefit of reducing maintenance frequency. Watson-Marlow also extended the Qdos pump range, launched a new range of ASEPCO valve actuators and developed a new Flexicon fully automated filling system, ready for launch in January 2019.
Focus for 2019• Sector-aligned new product development• Core product range extensions, broadening their application
scope and meeting a wider range of customer needs
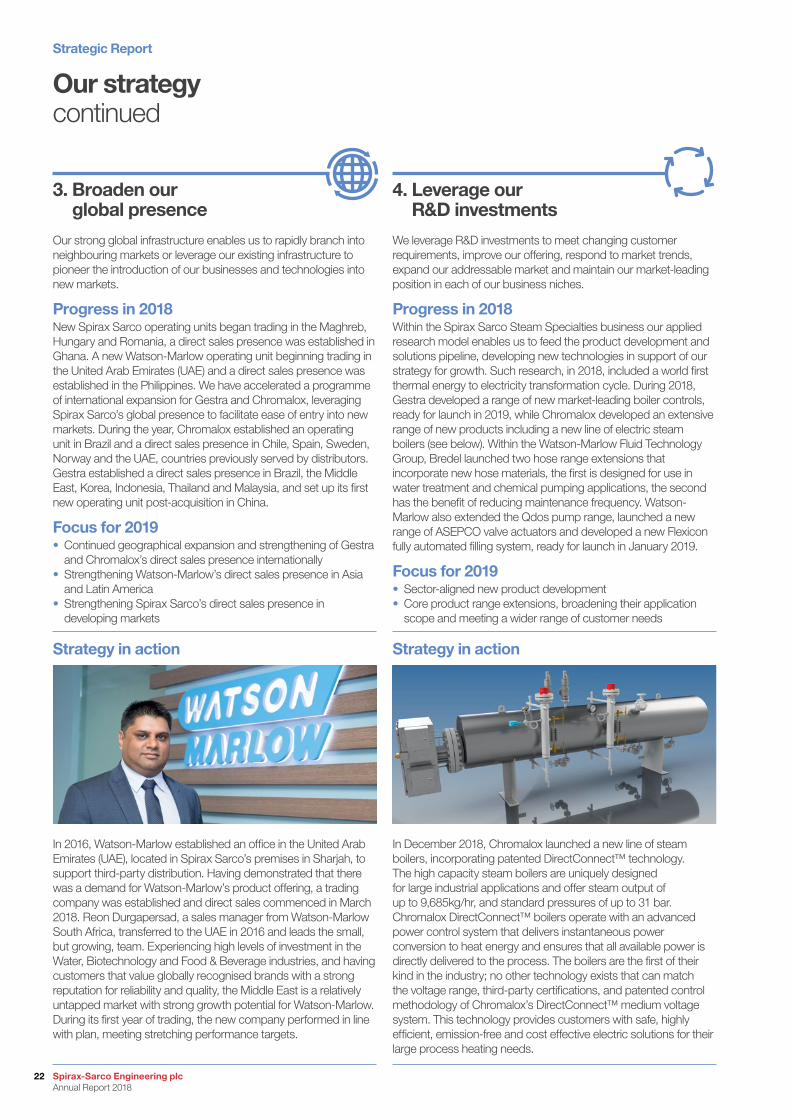
In 2016, Watson-Marlow established an office in the United Arab Emirates (UAE), located in Spirax Sarco’s premises in Sharjah, to support third-party distribution. Having demonstrated that there was a demand for Watson-Marlow’s product offering, a trading company was established and direct sales commenced in March 2018. Reon Durgapersad, a sales manager from Watson-Marlow South Africa, transferred to the UAE in 2016 and leads the small, but growing, team. Experiencing high levels of investment in the Water, Biotechnology and Food & Beverage industries, and having customers that value globally recognised brands with a strong reputation for reliability and quality, the Middle East is a relatively untapped market with strong growth potential for Watson-Marlow. During its first year of trading, the new company performed in line with plan, meeting stretching performance targets.
In December 2018, Chromalox launched a new line of steam boilers, incorporating patented DirectConnect™ technology. The high capacity steam boilers are uniquely designed for large industrial applications and offer steam output of up to 9,685kg/hr, and standard pressures of up to 31 bar. Chromalox DirectConnect™ boilers operate with an advanced power control system that delivers instantaneous power conversion to heat energy and ensures that all available power is directly delivered to the process. The boilers are the first of their kind in the industry; no other technology exists that can match the voltage range, third-party certifications, and patented control methodology of Chromalox’s DirectConnect™ medium voltage system. This technology provides customers with safe, highly efficient, emission-free and cost effective electric solutions for their large process heating needs.
Strategy in action Strategy in action
3. Broaden our global presence
4. Leverage our R&D investments
Strategic Report
Spirax-Sarco Engineering plc Annual Report 2018
22
Acquisition integration case study
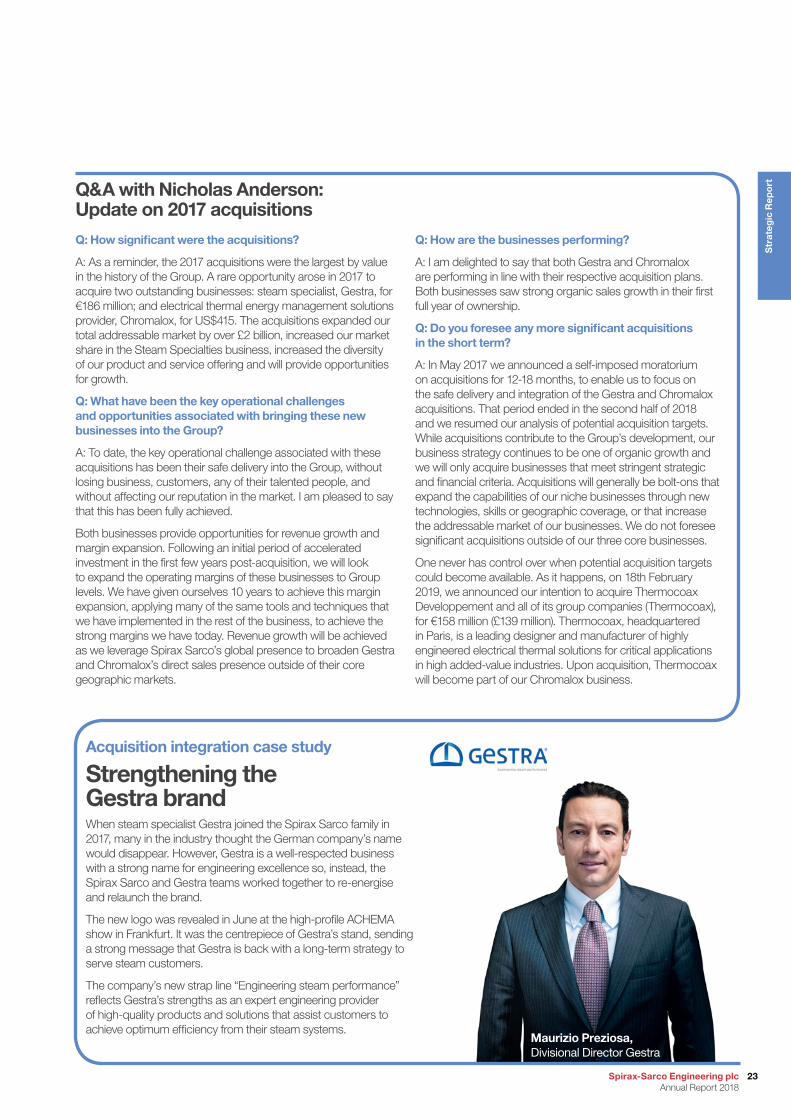
Strengthening theGestra brandWhen steam specialist Gestra joined the Spirax Sarco family in 2017, many in the industry thought the German company’s name would disappear. However, Gestra is a well-respected business with a strong name for engineering excellence so, instead, the Spirax Sarco and Gestra teams worked together to re-energise and relaunch the brand.
The new logo was revealed in June at the high-profile ACHEMA show in Frankfurt. It was the centrepiece of Gestra’s stand, sending a strong message that Gestra is back with a long-term strategy to serve steam customers.
The company’s new strap line “Engineering steam performance” reflects Gestra’s strengths as an expert engineering provider of high-quality products and solutions that assist customers to achieve optimum efficiency from their steam systems.
Q: How significant were the acquisitions?
A: As a reminder, the 2017 acquisitions were the largest by value in the history of the Group. A rare opportunity arose in 2017 to acquire two outstanding businesses: steam specialist, Gestra, for €186 million; and electrical thermal energy management solutions provider, Chromalox, for US$415. The acquisitions expanded our total addressable market by over £2 billion, increased our market share in the Steam Specialties business, increased the diversity of our product and service offering and will provide opportunities for growth.
Q: What have been the key operational challenges and opportunities associated with bringing these new businesses into the Group?
A: To date, the key operational challenge associated with these acquisitions has been their safe delivery into the Group, without losing business, customers, any of their talented people, and without affecting our reputation in the market. I am pleased to say that this has been fully achieved.
Both businesses provide opportunities for revenue growth and margin expansion. Following an initial period of accelerated investment in the first few years post-acquisition, we will look to expand the operating margins of these businesses to Group levels. We have given ourselves 10 years to achieve this margin expansion, applying many of the same tools and techniques that we have implemented in the rest of the business, to achieve the strong margins we have today. Revenue growth will be achieved as we leverage Spirax Sarco’s global presence to broaden Gestra and Chromalox’s direct sales presence outside of their core geographic markets.
Q&A with Nicholas Anderson: Update on 2017 acquisitions
Q: How are the businesses performing?
A: I am delighted to say that both Gestra and Chromalox are performing in line with their respective acquisition plans. Both businesses saw strong organic sales growth in their first full year of ownership.
Q: Do you foresee any more significant acquisitions in the short term?
A: In May 2017 we announced a self-imposed moratorium on acquisitions for 12-18 months, to enable us to focus on the safe delivery and integration of the Gestra and Chromalox acquisitions. That period ended in the second half of 2018 and we resumed our analysis of potential acquisition targets. While acquisitions contribute to the Group’s development, our business strategy continues to be one of organic growth and we will only acquire businesses that meet stringent strategic and financial criteria. Acquisitions will generally be bolt-ons that expand the capabilities of our niche businesses through new technologies, skills or geographic coverage, or that increase the addressable market of our businesses. We do not foresee significant acquisitions outside of our three core businesses.
One never has control over when potential acquisition targets could become available. As it happens, on 18th February 2019, we announced our intention to acquire Thermocoax Developpement and all of its group companies (Thermocoax), for €158 million (£139 million). Thermocoax, headquartered in Paris, is a leading designer and manufacturer of highly engineered electrical thermal solutions for critical applications in high added-value industries. Upon acquisition, Thermocoax will become part of our Chromalox business.
Maurizio Preziosa, Divisional Director Gestra
23Spirax-Sarco Engineering plc Annual Report 2018
Str
ateg
ic R
epo
rt
We operate a regional manufacturing strategy and focus on increasing supply chain agility and compressing lead times to enable greater responsiveness, reduce costs and improve customer service.
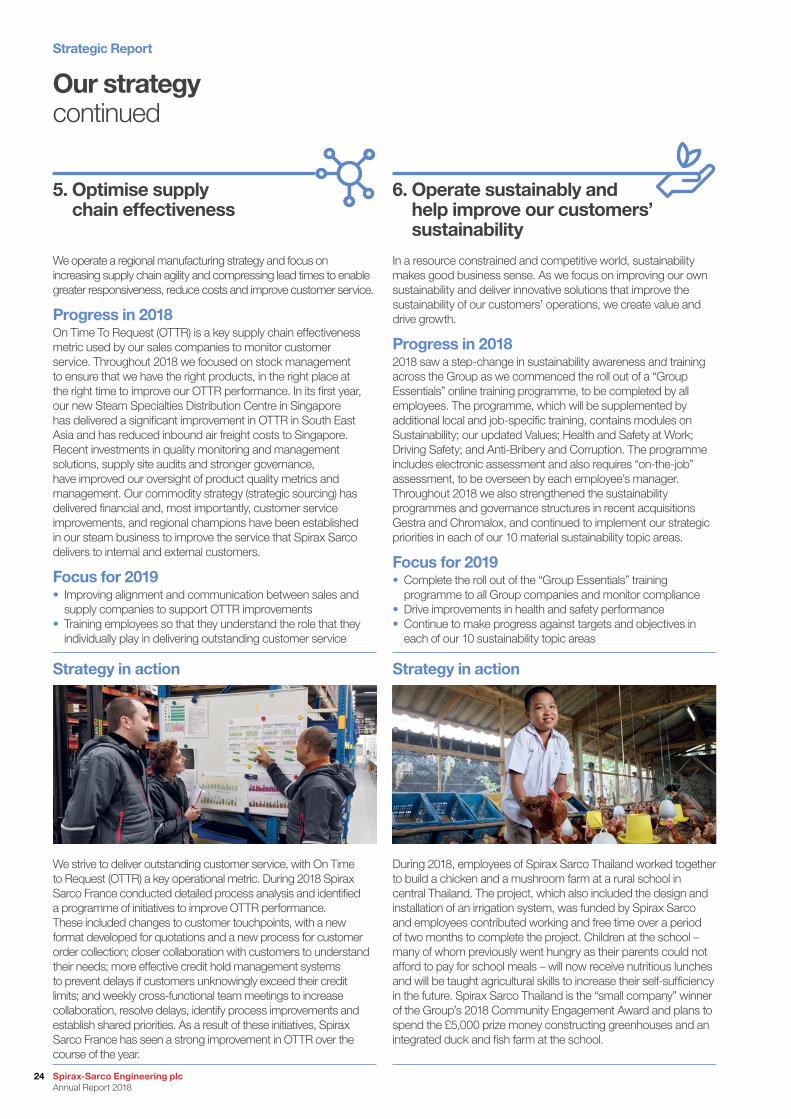
Progress in 2018On Time To Request (OTTR) is a key supply chain effectiveness metric used by our sales companies to monitor customer service. Throughout 2018 we focused on stock management to ensure that we have the right products, in the right place at the right time to improve our OTTR performance. In its first year, our new Steam Specialties Distribution Centre in Singapore has delivered a significant improvement in OTTR in South East Asia and has reduced inbound air freight costs to Singapore. Recent investments in quality monitoring and management solutions, supply site audits and stronger governance, have improved our oversight of product quality metrics and management. Our commodity strategy (strategic sourcing) has delivered financial and, most importantly, customer service improvements, and regional champions have been established in our steam business to improve the service that Spirax Sarco delivers to internal and external customers.
Focus for 2019• Improving alignment and communication between sales and
supply companies to support OTTR improvements• Training employees so that they understand the role that they
individually play in delivering outstanding customer service
In a resource constrained and competitive world, sustainability makes good business sense. As we focus on improving our own sustainability and deliver innovative solutions that improve the sustainability of our customers’ operations, we create value and drive growth.
Progress in 20182018 saw a step-change in sustainability awareness and training across the Group as we commenced the roll out of a “Group Essentials” online training programme, to be completed by all employees. The programme, which will be supplemented by additional local and job-specific training, contains modules on Sustainability; our updated Values; Health and Safety at Work; Driving Safety; and Anti-Bribery and Corruption. The programme includes electronic assessment and also requires “on-the-job” assessment, to be overseen by each employee’s manager. Throughout 2018 we also strengthened the sustainability programmes and governance structures in recent acquisitions Gestra and Chromalox, and continued to implement our strategic priorities in each of our 10 material sustainability topic areas.
Focus for 2019• Complete the roll out of the “Group Essentials” training
programme to all Group companies and monitor compliance• Drive improvements in health and safety performance• Continue to make progress against targets and objectives in
each of our 10 sustainability topic areas
We strive to deliver outstanding customer service, with On Time to Request (OTTR) a key operational metric. During 2018 Spirax Sarco France conducted detailed process analysis and identified a programme of initiatives to improve OTTR performance. These included changes to customer touchpoints, with a new format developed for quotations and a new process for customer order collection; closer collaboration with customers to understand their needs; more effective credit hold management systems to prevent delays if customers unknowingly exceed their credit limits; and weekly cross-functional team meetings to increase collaboration, resolve delays, identify process improvements and establish shared priorities. As a result of these initiatives, Spirax Sarco France has seen a strong improvement in OTTR over the course of the year.
During 2018, employees of Spirax Sarco Thailand worked together to build a chicken and a mushroom farm at a rural school in central Thailand. The project, which also included the design and installation of an irrigation system, was funded by Spirax Sarco and employees contributed working and free time over a period of two months to complete the project. Children at the school – many of whom previously went hungry as their parents could not afford to pay for school meals – will now receive nutritious lunches and will be taught agricultural skills to increase their self-sufficiency in the future. Spirax Sarco Thailand is the “small company” winner of the Group’s 2018 Community Engagement Award and plans to spend the £5,000 prize money constructing greenhouses and an integrated duck and fish farm at the school.
Strategy in action Strategy in action
5. Optimise supply chain effectiveness
6. Operate sustainably and help improve our customers’ sustainability
Our strategycontinued
Strategic Report
Spirax-Sarco Engineering plc Annual Report 2018
24
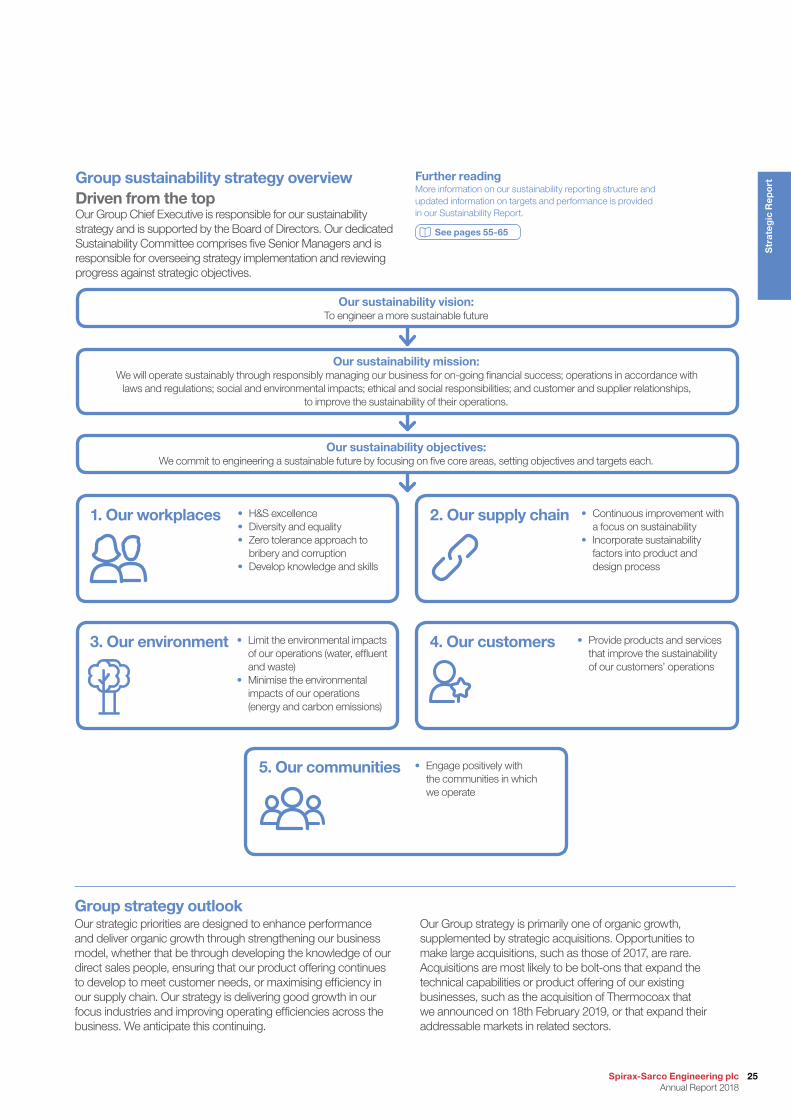
Our sustainability vision:To engineer a more sustainable future
Our sustainability mission:We will operate sustainably through responsibly managing our business for on-going financial success; operations in accordance with
laws and regulations; social and environmental impacts; ethical and social responsibilities; and customer and supplier relationships, to improve the sustainability of their operations.
Our sustainability objectives:We commit to engineering a sustainable future by focusing on five core areas, setting objectives and targets each.
Group sustainability strategy overviewDriven from the topOur Group Chief Executive is responsible for our sustainability strategy and is supported by the Board of Directors. Our dedicated Sustainability Committee comprises five Senior Managers and is responsible for overseeing strategy implementation and reviewing progress against strategic objectives.
Group strategy outlookOur strategic priorities are designed to enhance performance and deliver organic growth through strengthening our business model, whether that be through developing the knowledge of our direct sales people, ensuring that our product offering continues to develop to meet customer needs, or maximising efficiency in our supply chain. Our strategy is delivering good growth in our focus industries and improving operating efficiencies across the business. We anticipate this continuing.
Our Group strategy is primarily one of organic growth, supplemented by strategic acquisitions. Opportunities to make large acquisitions, such as those of 2017, are rare. Acquisitions are most likely to be bolt-ons that expand the technical capabilities or product offering of our existing businesses, such as the acquisition of Thermocoax that we announced on 18th February 2019, or that expand their addressable markets in related sectors.
Further readingMore information on our sustainability reporting structure and updated information on targets and performance is provided in our Sustainability Report.
See pages 55-65
1. Our workplaces
3. Our environment
2. Our supply chain
4. Our customers
5. Our communities
• H&S excellence• Diversity and equality• Zero tolerance approach to
bribery and corruption• Develop knowledge and skills
• Continuous improvement with a focus on sustainability
• Incorporate sustainability factors into product and design process
• Limit the environmental impacts of our operations (water, effluent and waste)
• Minimise the environmental impacts of our operations (energy and carbon emissions)
• Provide products and services that improve the sustainability of our customers’ operations
• Engage positively with the communities in which we operate
25Spirax-Sarco Engineering plc Annual Report 2018
Str
ateg
ic R
epo
rt
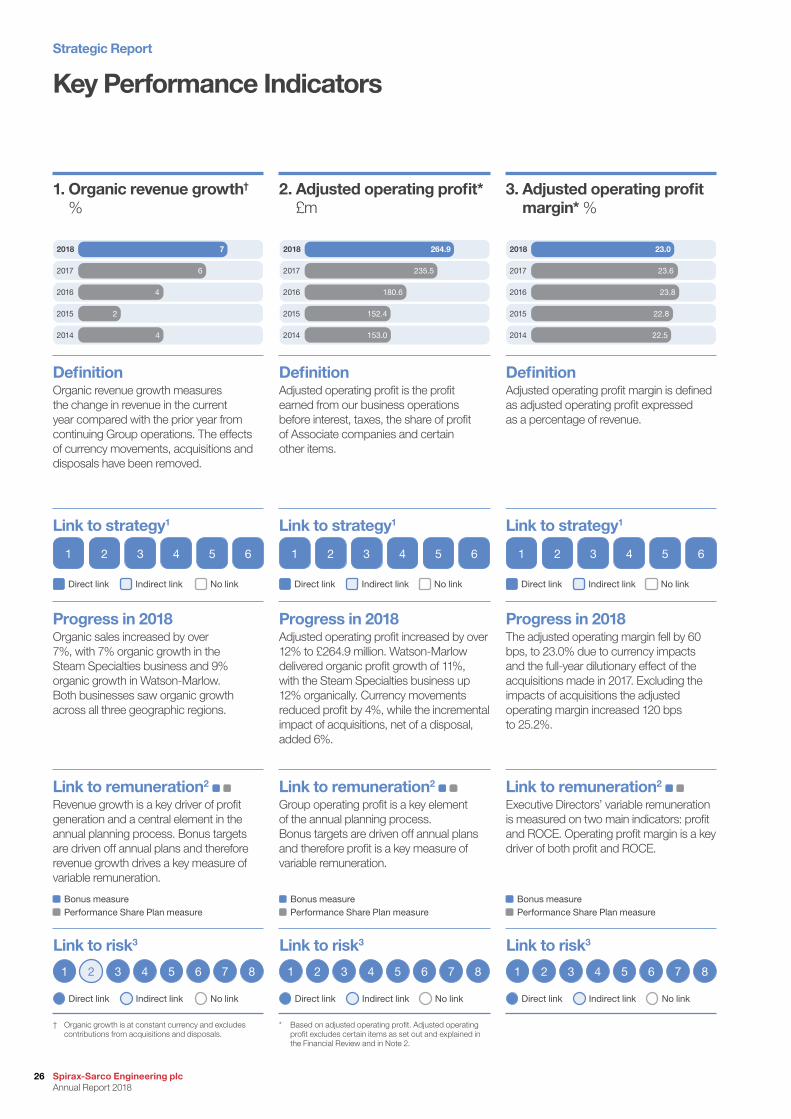
Key Performance Indicators
Link to remuneration2 Revenue growth is a key driver of profit generation and a central element in the annual planning process. Bonus targets are driven off annual plans and therefore revenue growth drives a key measure of variable remuneration.
Link to remuneration2 Group operating profit is a key element of the annual planning process. Bonus targets are driven off annual plans and therefore profit is a key measure of variable remuneration.
Link to remuneration2 Executive Directors’ variable remuneration is measured on two main indicators: profit and ROCE. Operating profit margin is a key driver of both profit and ROCE.
1. Organic revenue growth† %
2. Adjusted operating profit* £m
3. Adjusted operating profit margin* %
Bonus measurePerformance Share Plan measure
Bonus measurePerformance Share Plan measure
Bonus measurePerformance Share Plan measure
Link to risk3 Link to risk3 Link to risk3
1 1 12 2 23 3 34 4 45 5 56 6 68 8 87 7 7
No linkDirect link Indirect link No linkDirect link Indirect link No linkDirect link Indirect link
DefinitionOrganic revenue growth measures the change in revenue in the current year compared with the prior year from continuing Group operations. The effects of currency movements, acquisitions and disposals have been removed.
DefinitionAdjusted operating profit is the profit earned from our business operations before interest, taxes, the share of profit of Associate companies and certain other items.
DefinitionAdjusted operating profit margin is defined as adjusted operating profit expressed as a percentage of revenue.
Progress in 2018Organic sales increased by over 7%, with 7% organic growth in the Steam Specialties business and 9% organic growth in Watson-Marlow. Both businesses saw organic growth across all three geographic regions.
Progress in 2018Adjusted operating profit increased by over 12% to £264.9 million. Watson-Marlow delivered organic profit growth of 11%, with the Steam Specialties business up 12% organically. Currency movements reduced profit by 4%, while the incremental impact of acquisitions, net of a disposal, added 6%.
Progress in 2018The adjusted operating margin fell by 60 bps, to 23.0% due to currency impacts and the full-year dilutionary effect of the acquisitions made in 2017. Excluding the impacts of acquisitions the adjusted operating margin increased 120 bps to 25.2%.
Link to strategy1
1 2 3 4 5 6
Direct link Indirect link No link No link No link
Link to strategy1
1 2 3 4 5 6
Direct link Indirect link
Link to strategy1
1 2 3 4 5 6
Direct link Indirect link
† Organic growth is at constant currency and excludes contributions from acquisitions and disposals.
* Based on adjusted operating profit. Adjusted operating profit excludes certain items as set out and explained in the Financial Review and in Note 2.
KPI
23.0
23.6
23.8
22.8
22.5
Operating profit margin* %
2018
2017
2016
2015
2014
KPI
264.9
235.5
180.6
152.4
153.0
Adjusted operating profit £m
2018
2017
2016
2015
2014
KPI
7
6
4
2
4
Organic revenue growth %
2018
2017
2016
2015
2014
Strategic Report
Spirax-Sarco Engineering plc Annual Report 2018
26

Link to remuneration2 EPS measured over three-year periods is one of the two components of the Performance Share Plan.
Link to remuneration2 ROCE is a key measure in Executive Directors’ annual bonus arrangements.
Link to remuneration2 The safety of our employees is central to the sustainability of our business and has an impact on the financial success and profitability of the Group, creating an indirect link with Executive Directors’ variable remuneration.
5. Basic earnings per share (EPS)* p
4. Return on capital employed (ROCE)* %
Bonus measurePerformance Share Plan measure
Bonus measurePerformance Share Plan measure
Bonus measurePerformance Share Plan measure
Link to risk3Link to risk3 Link to risk3
11 122 233 344 455 566 688 877 7
No linkDirect link Indirect linkNo linkDirect link Indirect link No linkDirect link Indirect link
DefinitionEarnings per share is a measure of the profit performance of the Group, taking into account the equity structure. EPS is defined as the adjusted after-tax profit attributable to equity shareholders divided by the weighted average number of shares in issue.
DefinitionReturn on Capital Employed is a pre-tax measure of the efficiency with which the Group generates operating profits from its capital. ROCE is calculated as adjusted operating profit divided by average capital employed.
DefinitionThe number of work-related accidents that resulted in over seven days of absence per 1,000 employees. For an accident to be considered “work-related” the machinery, plant, substances, or equipment being used; the way the work was carried out; or the condition of the site, must have played a significant role.
Progress in 2018Adjusted basic earnings per share increased by 13% to 250.0 pence as organic growth and the incremental impact of recent acquisitions, partially offset by exchange headwinds, contributed to an increase in earnings.
Progress in 2018ROCE was 54.9%, an increase of 200 bps due to the high growth in adjusted operating profit and our close control of the various components of capital employed. At constant currency, excluding acquisitions and disposals ROCE increased by 470 bps.
Progress in 2018Our over seven day lost-time accident rate increased to 3.5 accidents per 1,000 employees. A small increase in the accident rate in our more mature businesses was compounded by a higher accident rate in a number of our recently acquired companies, which have less mature H&S programmes.
No linkNo link No link
Link to strategy1
1 2 3 4 5 6
Direct link Indirect link
Link to strategy1
1 2 3 4 5 6
Direct link Indirect link
Link to strategy1
1 2 3 4 5 6
Direct link Indirect link
Further reading1 More information about our strategy.
See pages 20-25
2 More information about our remuneration measures.
See pages 90-119
3 More information about our principal risks.
See pages 28-33
KPI
250.0
220.5
171.5
142.6
140.4
Basic earning per share* p
2018
2017
2016
2015
2014
KPI
54.9
52.9
47.9
44.1
44.3
Return on capital employed %
2018
2017
2016
2015
2014
KPI
3.5
3.0
3.4
3.3
5.4
H&S accidents with over 7 days of lost time per 1,000 employees
2018
2017
2016
2015
2014
6. H&S accidents with over seven days of lost time per 1,000 employees
27Spirax-Sarco Engineering plc Annual Report 2018
Str
ateg
ic R
epo
rt
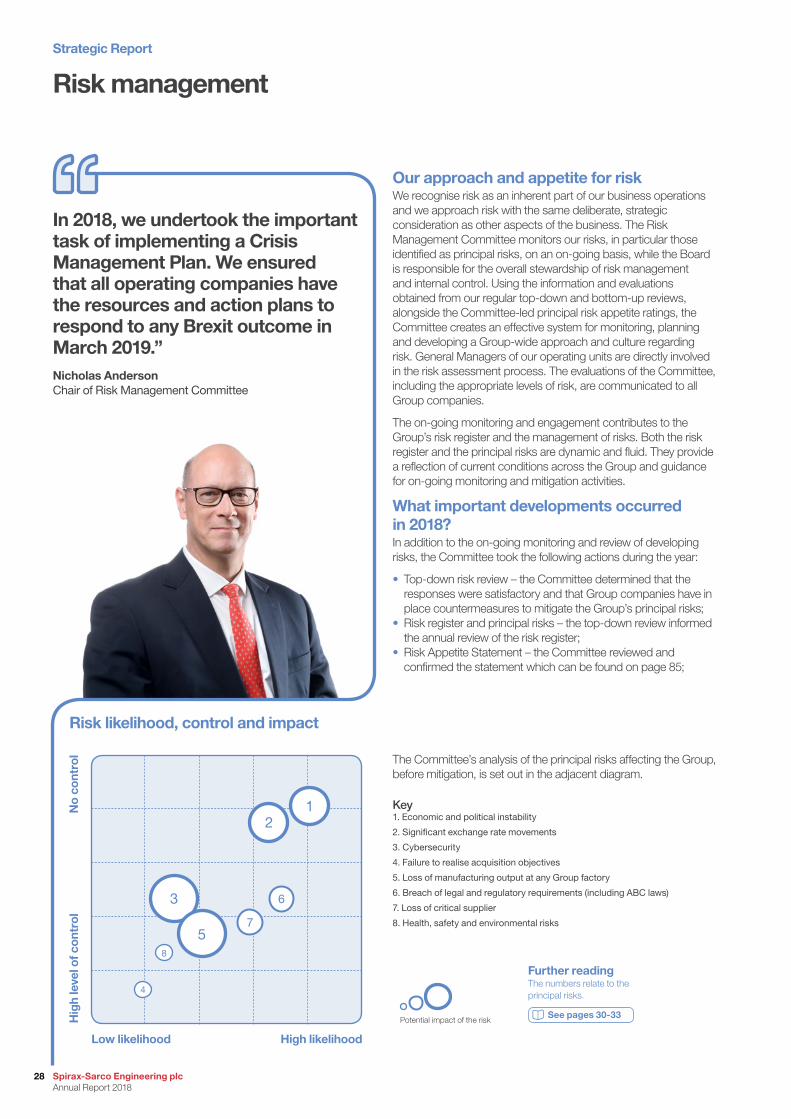
Risk management
Our approach and appetite for riskWe recognise risk as an inherent part of our business operations and we approach risk with the same deliberate, strategic consideration as other aspects of the business. The Risk Management Committee monitors our risks, in particular those identified as principal risks, on an on-going basis, while the Board is responsible for the overall stewardship of risk management and internal control. Using the information and evaluations obtained from our regular top-down and bottom-up reviews, alongside the Committee-led principal risk appetite ratings, the Committee creates an effective system for monitoring, planning and developing a Group-wide approach and culture regarding risk. General Managers of our operating units are directly involved in the risk assessment process. The evaluations of the Committee, including the appropriate levels of risk, are communicated to all Group companies.
The on-going monitoring and engagement contributes to the Group’s risk register and the management of risks. Both the risk register and the principal risks are dynamic and fluid. They provide a reflection of current conditions across the Group and guidance for on-going monitoring and mitigation activities.
What important developments occurred in 2018?In addition to the on-going monitoring and review of developing risks, the Committee took the following actions during the year:
• Top-down risk review – the Committee determined that the responses were satisfactory and that Group companies have in place countermeasures to mitigate the Group’s principal risks;
• Risk register and principal risks – the top-down review informed the annual review of the risk register;
• Risk Appetite Statement – the Committee reviewed and confirmed the statement which can be found on page 85;
The Committee’s analysis of the principal risks affecting the Group, before mitigation, is set out in the adjacent diagram.
No
cont
rol
Hig
h le
vel o
f co
ntro
l
Low likelihood High likelihood
2
3
7
4
5
6
1
In 2018, we undertook the important task of implementing a Crisis Management Plan. We ensured that all operating companies have the resources and action plans to respond to any Brexit outcome in March 2019.”Nicholas AndersonChair of Risk Management Committee
Key1. Economic and political instability
2. Significant exchange rate movements
3. Cybersecurity
4. Failure to realise acquisition objectives
5. Loss of manufacturing output at any Group factory
6. Breach of legal and regulatory requirements (including ABC laws)
7. Loss of critical supplier
8. Health, safety and environmental risks
Potential impact of the risk
Further readingThe numbers relate to the principal risks.
See pages 30-33
Risk likelihood, control and impact
8
Strategic Report
Spirax-Sarco Engineering plc Annual Report 2018
28
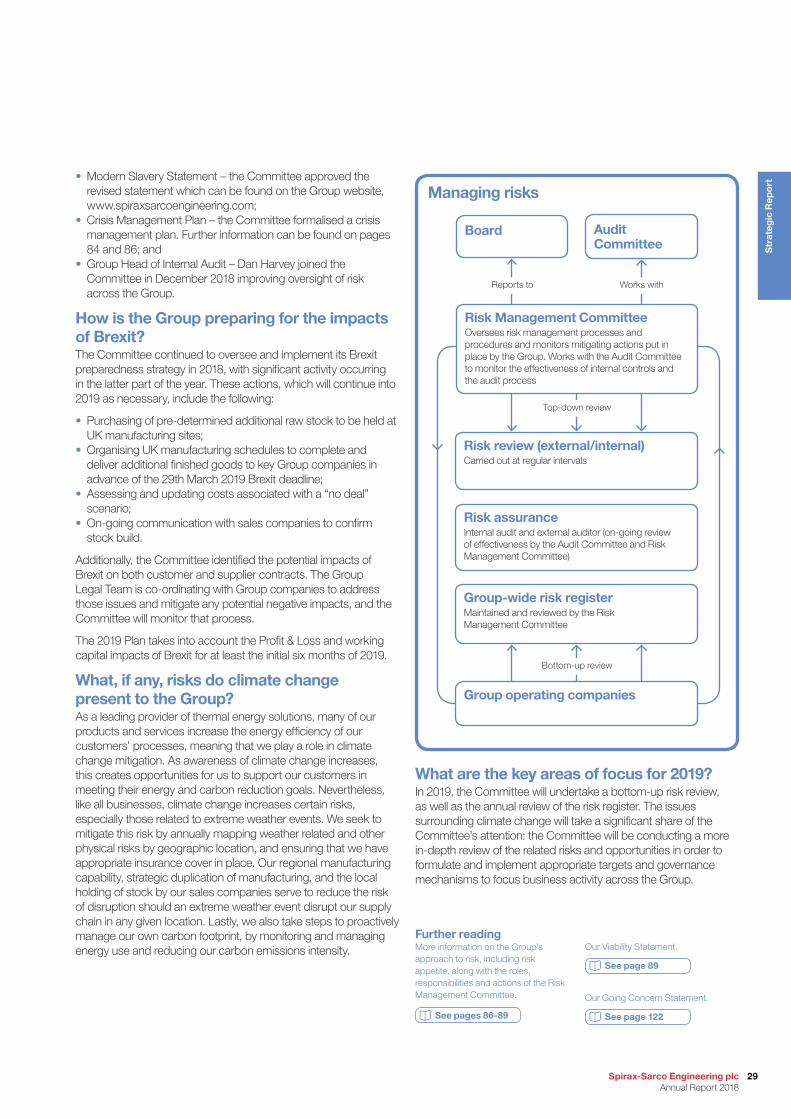
Managing risks• Modern Slavery Statement – the Committee approved the
revised statement which can be found on the Group website, www.spiraxsarcoengineering.com;
• Crisis Management Plan – the Committee formalised a crisis management plan. Further information can be found on pages 84 and 86; and
• Group Head of Internal Audit – Dan Harvey joined the Committee in December 2018 improving oversight of risk across the Group.
How is the Group preparing for the impacts of Brexit?The Committee continued to oversee and implement its Brexit preparedness strategy in 2018, with significant activity occurring in the latter part of the year. These actions, which will continue into 2019 as necessary, include the following:
• Purchasing of pre-determined additional raw stock to be held at UK manufacturing sites;
• Organising UK manufacturing schedules to complete and deliver additional finished goods to key Group companies in advance of the 29th March 2019 Brexit deadline;
• Assessing and updating costs associated with a “no deal” scenario;
• On-going communication with sales companies to confirm stock build.
Additionally, the Committee identified the potential impacts of Brexit on both customer and supplier contracts. The Group Legal Team is co-ordinating with Group companies to address those issues and mitigate any potential negative impacts, and the Committee will monitor that process.
The 2019 Plan takes into account the Profit & Loss and working capital impacts of Brexit for at least the initial six months of 2019.
What, if any, risks do climate change present to the Group?As a leading provider of thermal energy solutions, many of our products and services increase the energy efficiency of our customers’ processes, meaning that we play a role in climate change mitigation. As awareness of climate change increases, this creates opportunities for us to support our customers in meeting their energy and carbon reduction goals. Nevertheless, like all businesses, climate change increases certain risks, especially those related to extreme weather events. We seek to mitigate this risk by annually mapping weather related and other physical risks by geographic location, and ensuring that we have appropriate insurance cover in place. Our regional manufacturing capability, strategic duplication of manufacturing, and the local holding of stock by our sales companies serve to reduce the risk of disruption should an extreme weather event disrupt our supply chain in any given location. Lastly, we also take steps to proactively manage our own carbon footprint, by monitoring and managing energy use and reducing our carbon emissions intensity.
What are the key areas of focus for 2019?In 2019, the Committee will undertake a bottom-up risk review, as well as the annual review of the risk register. The issues surrounding climate change will take a significant share of the Committee’s attention: the Committee will be conducting a more in-depth review of the related risks and opportunities in order to formulate and implement appropriate targets and governance mechanisms to focus business activity across the Group.
Group operating companies
Audit Committee
Board
Group-wide risk registerMaintained and reviewed by the Risk Management Committee
Risk assuranceInternal audit and external auditor (on-going review of effectiveness by the Audit Committee and Risk Management Committee)
Risk review (external/internal)Carried out at regular intervals
Reports to
Top-down review
Bottom-up review
Works with
Risk Management CommitteeOversees risk management processes and procedures and monitors mitigating actions put in place by the Group. Works with the Audit Committee to monitor the effectiveness of internal controls and the audit process
Further readingMore information on the Group’s approach to risk, including risk appetite, along with the roles, responsibilities and actions of the Risk Management Committee.
See pages 86-89
Our Viability Statement.
See page 89
Our Going Concern Statement.
See page 122
29Spirax-Sarco Engineering plc Annual Report 2018
Str
ateg
ic R
epo
rt
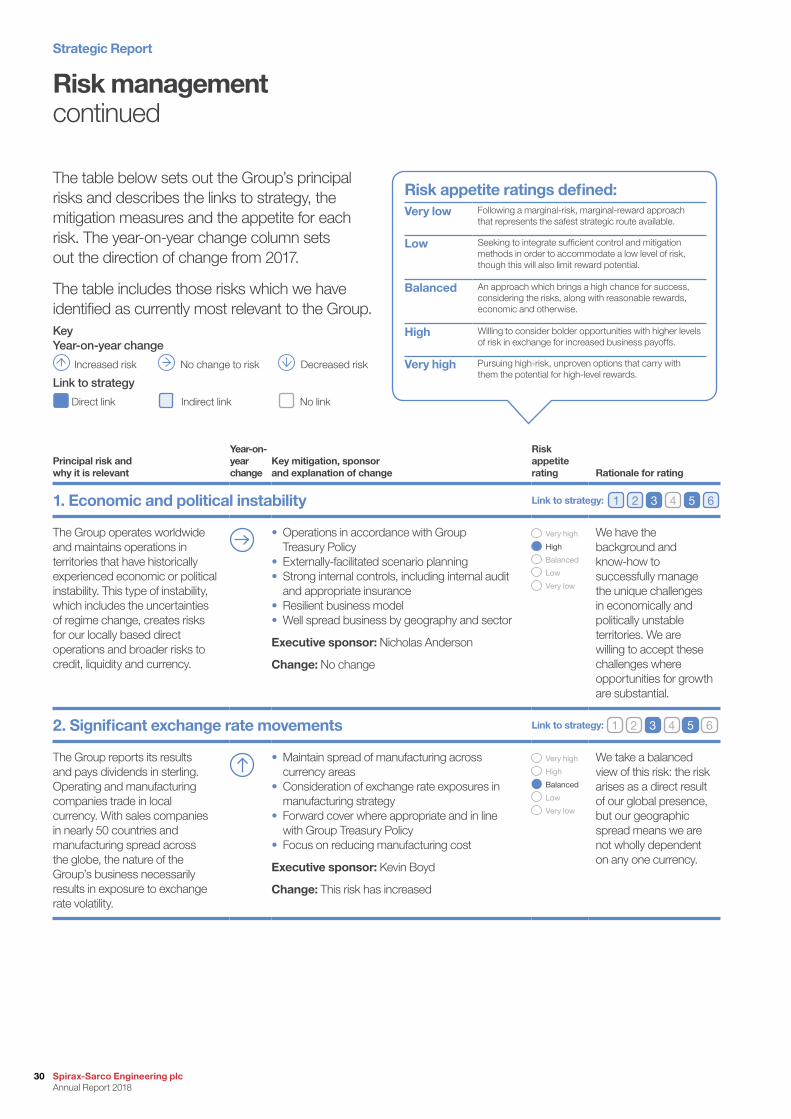
Risk appetite ratings defined:Very low Following a marginal-risk, marginal-reward approach
that represents the safest strategic route available.
Low Seeking to integrate sufficient control and mitigation methods in order to accommodate a low level of risk, though this will also limit reward potential.
Balanced An approach which brings a high chance for success, considering the risks, along with reasonable rewards, economic and otherwise.
High Willing to consider bolder opportunities with higher levels of risk in exchange for increased business payoffs.
Very high Pursuing high-risk, unproven options that carry with them the potential for high-level rewards.
Risk managementcontinued
The table below sets out the Group’s principal risks and describes the links to strategy, the mitigation measures and the appetite for each risk. The year-on-year change column sets out the direction of change from 2017.
The table includes those risks which we have identified as currently most relevant to the Group.
Principal risk and why it is relevant
Year-on- year change
Key mitigation, sponsor and explanation of change
Risk appetite rating Rationale for rating
1. Economic and political instability 1 2 3 4 5 6Link to strategy:
The Group operates worldwide and maintains operations in territories that have historically experienced economic or political instability. This type of instability, which includes the uncertainties of regime change, creates risks for our locally based direct operations and broader risks to credit, liquidity and currency.
• Operations in accordance with Group Treasury Policy
• Externally-facilitated scenario planning• Strong internal controls, including internal audit
and appropriate insurance• Resilient business model• Well spread business by geography and sector
Executive sponsor: Nicholas Anderson
Change: No change
Very high
High
Balanced
Low
Very low
We have the background and know-how to successfully manage the unique challenges in economically and politically unstable territories. We are willing to accept these challenges where opportunities for growth are substantial.
2. Significant exchange rate movements 1 2 3 4 5 6Link to strategy:
The Group reports its results and pays dividends in sterling. Operating and manufacturing companies trade in local currency. With sales companies in nearly 50 countries and manufacturing spread across the globe, the nature of the Group’s business necessarily results in exposure to exchange rate volatility.
• Maintain spread of manufacturing across currency areas
• Consideration of exchange rate exposures in manufacturing strategy
• Forward cover where appropriate and in line with Group Treasury Policy
• Focus on reducing manufacturing cost
Executive sponsor: Kevin Boyd
Change: This risk has increased
Very high
High
Balanced
Low
Very low
We take a balanced view of this risk: the risk arises as a direct result of our global presence, but our geographic spread means we are not wholly dependent on any one currency.
KeyYear-on-year change
Increased risk No change to risk Decreased risk
Link to strategy
Direct link Indirect link No link
Strategic Report
Spirax-Sarco Engineering plc Annual Report 2018
30

Principal risk and why it is relevant
Year-on- year change
Key mitigation, sponsor and explanation of change
Risk appetite rating Rationale for rating
3. Cybersecurity 1 2 3 4 5 6Link to strategy:
Cybersecurity risks include risks from malware, accident, statutory and legislative requirements, malicious actions and other unauthorised access by third parties.
• Global assessment of IT environment against UK cyber essentials framework and prioritising actions for improvement
• Deploying security tools to limit impact and spread of ransomware
• Initiating new centrally managed Firewall environment
• Further strengthening of security for centrally managed systems for heightened protection and consistency
Executive sponsor: Shaun Mundy
Change: No change
Very high
High
Balanced
Low
Very low
Concerns of potential impact on the business, in addition to the important considerations surrounding protection of personal data, reinforce our commitment to implement and maintain robust security measures across the Group.
4. Failure to realise acquisition objectives 1 2 3 4 5 6Link to strategy:
Whilst the Group mitigates this risk in various ways, including through comprehensive due diligence, professional advisers and contractual protections, amongst others, there are some variables that are uncontrollable or difficult to control, such as economic conditions, culture clashes and employee movement. Therefore, these could impact acquisition objectives.
• Regular review of acquisition criteria in line with strategic plan
• Board approval of integration plans for major acquisitions
• Scrutiny of targets and implementation plans by external advisers and internal key players
• Use of retainer/escrow to provide protection against warranty claims
• Use of insurance as protection against seller breach and non-disclosure
• Ensuring valuation models show healthy return on investment
• Regular monitoring of performance by the Board against the approved investment case
Executive sponsor: Kevin Boyd
Change: At the end of 2018 this risk had decreased as a result of progress with our robust integration plans for Gestra and Chromalox
Very high
High
Balanced Low
Very low
Thorough planning and proper due diligence can mitigate many of the potentially risky aspects of an acquisition. Implementation plans must be well-developed and carefully pursued to achieve the full strategic and financial benefits.
5. Loss of manufacturing output at any Group factory 1 2 3 4 5 6Link to strategy:
The risk includes loss of output as a result of natural disasters, industrial action and accidents. Loss of manufacturing output at any important plant risks serious disruption to sales operations.
• Investing in modern flexible machining• Capacity planning and holding stock in
sales companies• Conducting audits/inspections• Annual Risk Assessments and business
continuity planning• Reviewing and maintaining appropriate
insurance cover• Continuing commitment to employee policies,
ensuring satisfactory benefits and regular communication with all employees
Executive sponsors: Jay Whalen, Mike Sutter and Ian Farnworth
Change: No change
Very high
High
Balanced Low
Very low
Whilst we have mitigated this risk through a geographic spread of factories, calculated replication of capacity and management of stock, the potential negative consequences to the Group and its customers warrants a low appetite for this risk.
31Spirax-Sarco Engineering plc Annual Report 2018
Str
ateg
ic R
epo
rt
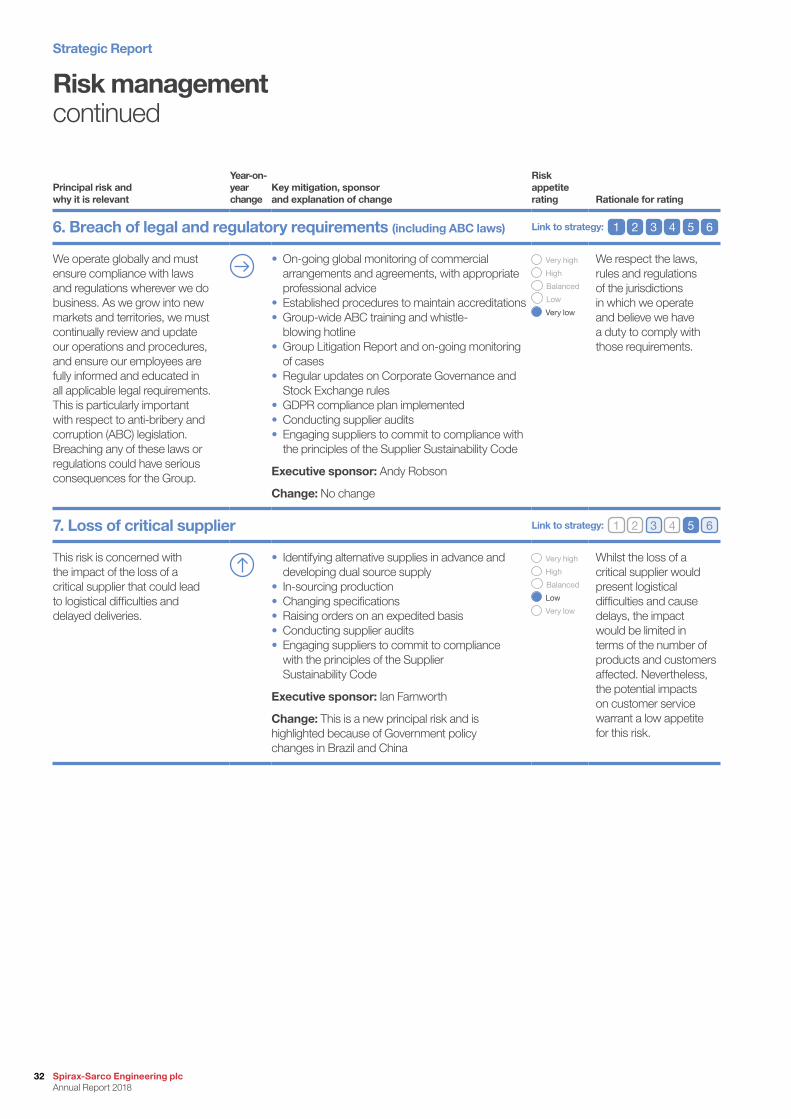
Risk managementcontinued
Principal risk and why it is relevant
Year-on- year change
Key mitigation, sponsor and explanation of change
Risk appetite rating Rationale for rating
6. Breach of legal and regulatory requirements (including ABC laws) 1 2 3 4 5 6Link to strategy:
We operate globally and must ensure compliance with laws and regulations wherever we do business. As we grow into new markets and territories, we must continually review and update our operations and procedures, and ensure our employees are fully informed and educated in all applicable legal requirements. This is particularly important with respect to anti-bribery and corruption (ABC) legislation. Breaching any of these laws or regulations could have serious consequences for the Group.
• On-going global monitoring of commercial arrangements and agreements, with appropriate professional advice
• Established procedures to maintain accreditations• Group-wide ABC training and whistle-
blowing hotline• Group Litigation Report and on-going monitoring
of cases• Regular updates on Corporate Governance and
Stock Exchange rules• GDPR compliance plan implemented• Conducting supplier audits• Engaging suppliers to commit to compliance with
the principles of the Supplier Sustainability Code
Executive sponsor: Andy Robson
Change: No change
Very high
High
Balanced Low
Very low
We respect the laws, rules and regulations of the jurisdictions in which we operate and believe we have a duty to comply with those requirements.
7. Loss of critical supplier 1 2 3 4 5 6Link to strategy:
This risk is concerned with the impact of the loss of a critical supplier that could lead to logistical difficulties and delayed deliveries.
• Identifying alternative supplies in advance and developing dual source supply
• In-sourcing production• Changing specifications• Raising orders on an expedited basis• Conducting supplier audits• Engaging suppliers to commit to compliance
with the principles of the Supplier Sustainability Code
Executive sponsor: Ian Farnworth
Change: This is a new principal risk and is highlighted because of Government policy changes in Brazil and China
Very high
High
Balanced
Low
Very low
Whilst the loss of a critical supplier would present logistical difficulties and cause delays, the impact would be limited in terms of the number of products and customers affected. Nevertheless, the potential impacts on customer service warrant a low appetite for this risk.
Strategic Report
Spirax-Sarco Engineering plc Annual Report 2018
32
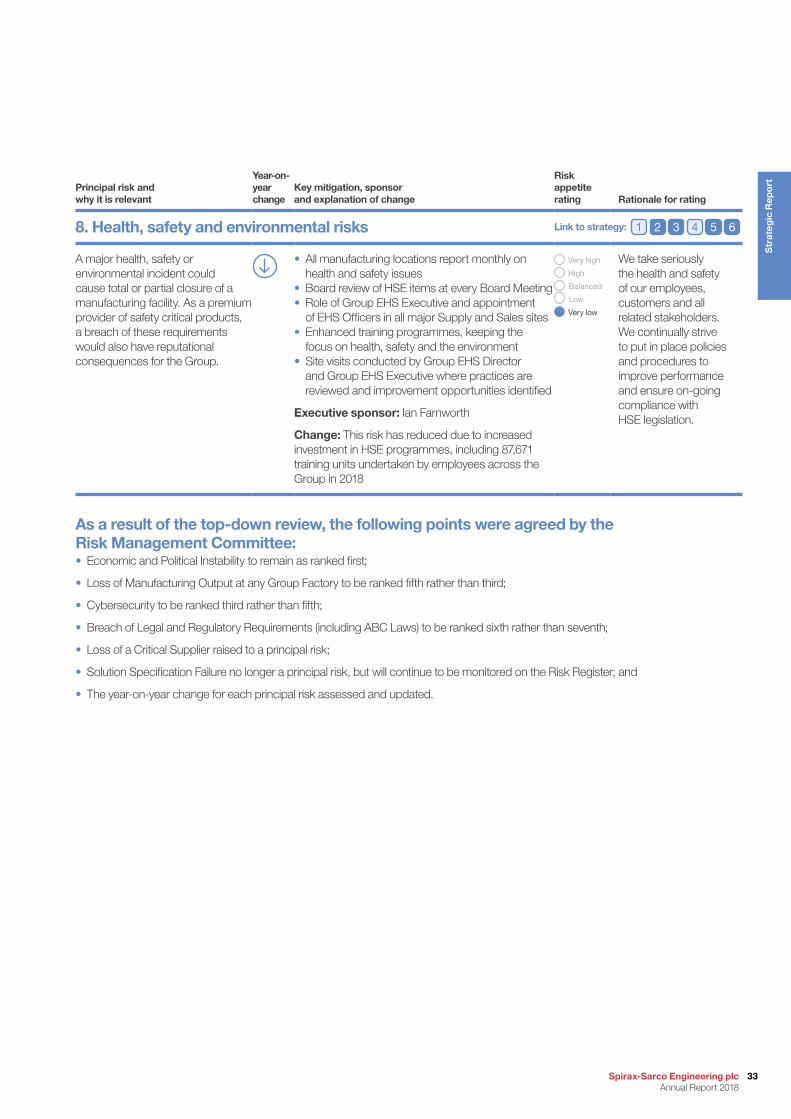
Principal risk and why it is relevant
Year-on- year change
Key mitigation, sponsor and explanation of change
Risk appetite rating Rationale for rating
8. Health, safety and environmental risks 1 2 3 4 5 6Link to strategy:
A major health, safety or environmental incident could cause total or partial closure of a manufacturing facility. As a premium provider of safety critical products, a breach of these requirements would also have reputational consequences for the Group.
• All manufacturing locations report monthly on health and safety issues
• Board review of HSE items at every Board Meeting• Role of Group EHS Executive and appointment
of EHS Officers in all major Supply and Sales sites• Enhanced training programmes, keeping the
focus on health, safety and the environment• Site visits conducted by Group EHS Director
and Group EHS Executive where practices are reviewed and improvement opportunities identified
Executive sponsor: Ian Farnworth
Change: This risk has reduced due to increased investment in HSE programmes, including 87,671 training units undertaken by employees across the Group in 2018
Very high
High
Balanced Low
Very low
We take seriously the health and safety of our employees, customers and all related stakeholders. We continually strive to put in place policies and procedures to improve performance and ensure on-going compliance with HSE legislation.
As a result of the top-down review, the following points were agreed by the Risk Management Committee:• Economic and Political Instability to remain as ranked first;
• Loss of Manufacturing Output at any Group Factory to be ranked fifth rather than third;
• Cybersecurity to be ranked third rather than fifth;
• Breach of Legal and Regulatory Requirements (including ABC Laws) to be ranked sixth rather than seventh;
• Loss of a Critical Supplier raised to a principal risk;
• Solution Specification Failure no longer a principal risk, but will continue to be monitored on the Risk Register; and
• The year-on-year change for each principal risk assessed and updated.
33Spirax-Sarco Engineering plc Annual Report 2018
Str
ateg
ic R
epo
rt
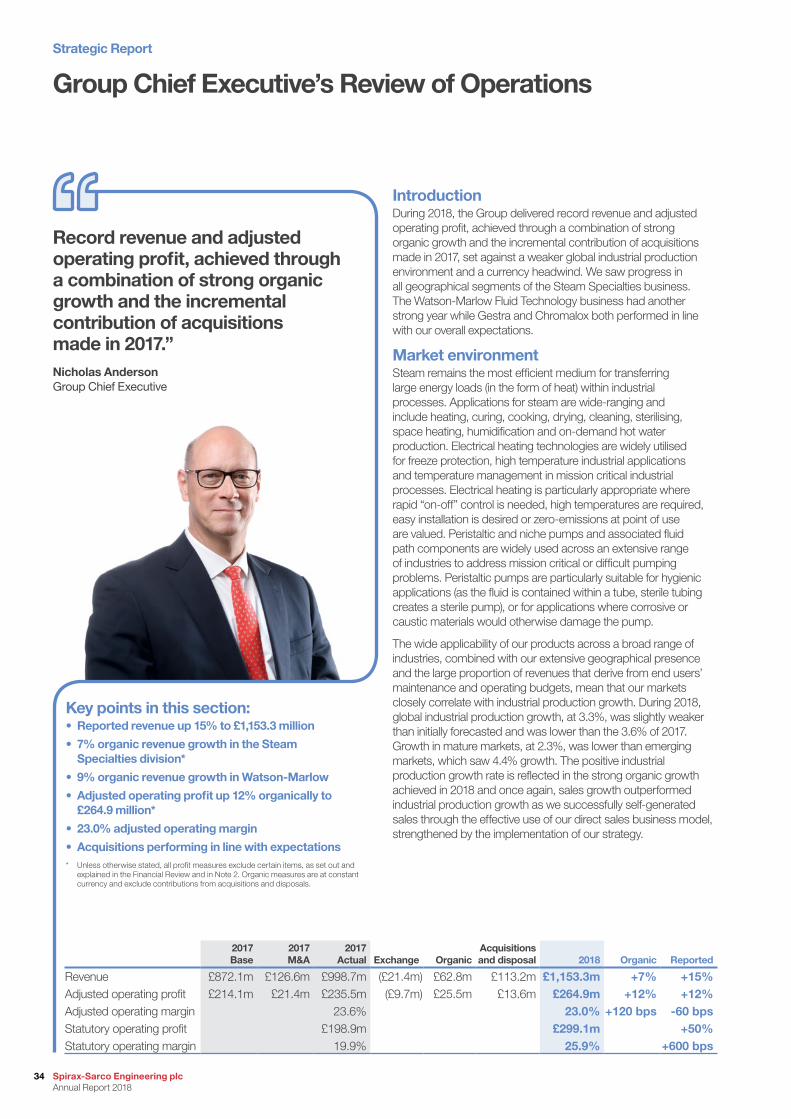
IntroductionDuring 2018, the Group delivered record revenue and adjusted operating profit, achieved through a combination of strong organic growth and the incremental contribution of acquisitions made in 2017, set against a weaker global industrial production environment and a currency headwind. We saw progress in all geographical segments of the Steam Specialties business. The Watson-Marlow Fluid Technology business had another strong year while Gestra and Chromalox both performed in line with our overall expectations.
Market environmentSteam remains the most efficient medium for transferring large energy loads (in the form of heat) within industrial processes. Applications for steam are wide-ranging and include heating, curing, cooking, drying, cleaning, sterilising, space heating, humidification and on-demand hot water production. Electrical heating technologies are widely utilised for freeze protection, high temperature industrial applications and temperature management in mission critical industrial processes. Electrical heating is particularly appropriate where rapid “on-off” control is needed, high temperatures are required, easy installation is desired or zero-emissions at point of use are valued. Peristaltic and niche pumps and associated fluid path components are widely used across an extensive range of industries to address mission critical or difficult pumping problems. Peristaltic pumps are particularly suitable for hygienic applications (as the fluid is contained within a tube, sterile tubing creates a sterile pump), or for applications where corrosive or caustic materials would otherwise damage the pump.
The wide applicability of our products across a broad range of industries, combined with our extensive geographical presence and the large proportion of revenues that derive from end users’ maintenance and operating budgets, mean that our markets closely correlate with industrial production growth. During 2018, global industrial production growth, at 3.3%, was slightly weaker than initially forecasted and was lower than the 3.6% of 2017. Growth in mature markets, at 2.3%, was lower than emerging markets, which saw 4.4% growth. The positive industrial production growth rate is reflected in the strong organic growth achieved in 2018 and once again, sales growth outperformed industrial production growth as we successfully self-generated sales through the effective use of our direct sales business model, strengthened by the implementation of our strategy.
Key points in this section:• Reported revenue up 15% to £1,153.3 million
• 7% organic revenue growth in the Steam Specialties division*
• 9% organic revenue growth in Watson-Marlow
• Adjusted operating profit up 12% organically to £264.9 million*
• 23.0% adjusted operating margin
• Acquisitions performing in line with expectations* Unless otherwise stated, all profit measures exclude certain items, as set out and
explained in the Financial Review and in Note 2. Organic measures are at constant currency and exclude contributions from acquisitions and disposals.
Record revenue and adjusted operating profit, achieved through a combination of strong organic growth and the incremental contribution of acquisitions made in 2017.”Nicholas AndersonGroup Chief Executive
2017 Base
2017 M&A
2017 Actual Exchange Organic
Acquisitions and disposal 2018 Organic Reported
Revenue £872.1m £126.6m £998.7m (£21.4m) £62.8m £113.2m £1,153.3m +7% +15%Adjusted operating profit £214.1m £21.4m £235.5m (£9.7m) £25.5m £13.6m £264.9m +12% +12%Adjusted operating margin 23.6% 23.0% +120 bps -60 bpsStatutory operating profit £198.9m £299.1m +50%Statutory operating margin 19.9% 25.9% +600 bps
Group Chief Executive’s Review of OperationsStrategic Report
Spirax-Sarco Engineering plc Annual Report 2018
34
As 93% of our sales and profits are made outside the UK, Brexit uncertainty had a limited impact on us and our customers in 2018. During the year, we completed a Brexit contingency planning exercise and have put plans in place to manage the situation, as it continues to unfold. Further information on our Brexit contingency plans can be found in the Financial Review on page 52.
Global industrial production growth is currently expected to remain positive in 2019, although at a lower level than seen in 2018.
Progress in 2018SalesOverall the Group achieved organic sales growth of over 7%, with 7% organic growth in the Steam Specialties business and 9% organic growth in Watson-Marlow. Gestra saw year-on-year sales growth of 10% and Chromalox 9%. These acquisitions contributed £114.3 million incremental sales in 2018. HygroMatik was divested on 30th November 2018 and as a result contributed £1.1 million less sales than in 2017.
At £1,153.3 million, Group sales were up over 15% (2017: £998.7 million). Sterling was stronger on average across the year, than in 2017, and acted as a currency headwind, reducing sales on translation by 2%.
Geographically, the Steam Specialties business, which accounted for 64% of Group revenue in 2018, saw growth in all regions. Sales of £733.5 million, were up 9% and up 7% organically. Gestra added an incremental £33.1 million to revenue in 2018.
Chromalox, which accounted for 13% of Group revenue in 2018, saw strong year-on-year sales growth of 9%, benefiting from stronger market conditions in the USA, as well as initial contributions from our increased investments to strengthen direct sales activities across the world.
Watson-Marlow accounted for 23% of Group revenue in 2018 and saw organic growth of 9%, partially offset by negative currency movements. Growth was achieved across all geographic regions.
Adjusted operating profitGroup adjusted operating profit was more than 12% ahead of the prior year on an organic basis and, at £264.9 million, was up 12% at reported exchange rates. The strong growth reflects the increase in revenue, a net 6% positive impact from the full year effect of acquisitions and a disposal, and a boost from the Argentine currency devaluation in the Americas, partially offset by a 4% negative translational and transactional exchange impact, due to the stronger sterling. Excluding the boost from Argentina, we saw organic adjusted operating profit growth of 10%.
Within the Steam Specialties business, adjusted operating profit was 12% higher than the prior year on an organic basis, with the Americas and Asia Pacific delivering strong organic adjusted operating profit growth and a marginal decline in EMEA. All geographic segments benefited from the inclusion of Gestra which contributed 3% growth to the Steam Specialties business. For reference, on a constant currency, like-for-like basis, Gestra’s sales rose 10% and adjusted operating profit was up 12%, despite significant investments in the business. HygroMatik was divested on 30th November 2018 and as a result contributed £0.3 million less adjusted operating profit than in 2017.
Chromalox added an incremental £9.4 million to adjusted operating profit and continues to perform in line with our overall expectations. For reference, on a constant currency, like-for-like basis, Chromalox’s sales rose 9%, however adjusted operating profit reduced by 10% as we stepped up our investments for future growth and responded to manufacturing inefficiencies and bottlenecks exposed by the very strong sales growth.
Watson-Marlow’s organic adjusted operating profit grew by 11%, despite increased levels of investment.
Statutory operating profit increased from £198.9 million to £299.1 million, with £47.4 million of the increase coming from the sale of HygroMatik, which was a constituent of the EMEA division within Steam Specialties.
Adjusted operating profit marginAt 23.0% the Group adjusted operating profit margin was 60 bps lower than the prior year, as the dilutionary impacts of 2017 acquisitions combined with an exchange headwind. Excluding the impact of acquisitions, the adjusted operating margin expanded by 120 bps to 25.2% at constant currency, despite increased investments for growth and an increase in material prices. Excluding HygroMatik and the devaluation-driven profit boost from Argentina, the adjusted operating profit margin was 22.5%. Within the Steam Specialties business, the operating margin increased by 30 bps to 23.2% with the dilutionary impact of Gestra and foreign currency being offset by the impact of devaluation in Argentina. Despite the increased investment and manufacturing inefficiencies described above, Chromalox maintained its first half margin of 14.7%. As expected, Watson-Marlow’s operating margin was lower, although still very strong, at 32.0%, due to exchange impacts.
35Spirax-Sarco Engineering plc Annual Report 2018
Str
ateg
ic R
epo
rt
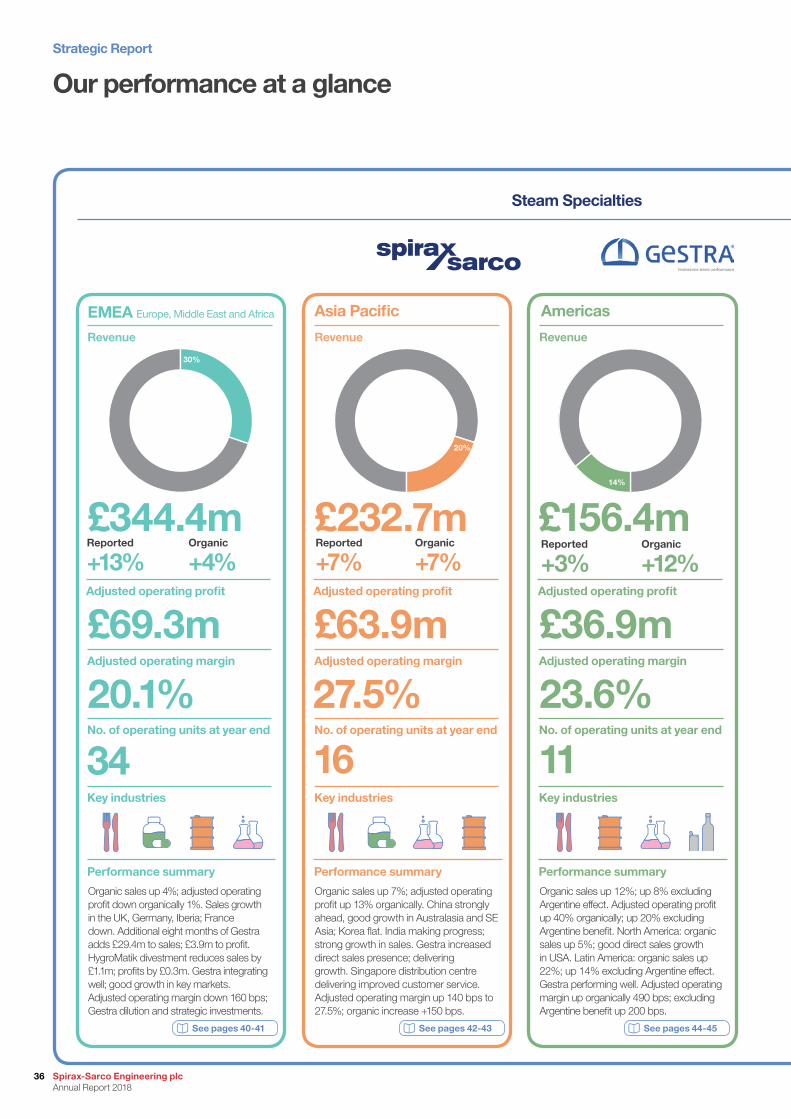
Our performance at a glance
Steam Specialties
Revenue
Adjusted operating profit Adjusted operating profit
Adjusted operating margin Adjusted operating margin
No. of operating units at year end No. of operating units at year end
Key industries Key industries
Performance summary Performance summary
£63.9m
27.5%
Organic sales up 7%; adjusted operating profit up 13% organically. China strongly ahead, good growth in Australasia and SE Asia; Korea flat. India making progress; strong growth in sales. Gestra increased direct sales presence; delivering growth. Singapore distribution centre delivering improved customer service. Adjusted operating margin up 140 bps to 27.5%; organic increase +150 bps.
Organic sales up 12%; up 8% excluding Argentine effect. Adjusted operating profit up 40% organically; up 20% excluding Argentine benefit. North America: organic sales up 5%; good direct sales growth in USA. Latin America: organic sales up 22%; up 14% excluding Argentine effect. Gestra performing well. Adjusted operating margin up organically 490 bps; excluding Argentine benefit up 200 bps.
Asia Pacific
16
£232.7m
£36.9m
23.6%
Americas
Reported
+3%Organic
+12%
£156.4m
See pages 42-43 See pages 44-45
Reported
+7%Organic
+7%
11
20%
14%
RevenueRevenue
Adjusted operating profit
Adjusted operating margin
No. of operating units at year end
Key industries
Performance summary
£69.3m
20.1%
Organic sales up 4%; adjusted operating profit down organically 1%. Sales growth in the UK, Germany, Iberia; France down. Additional eight months of Gestra adds £29.4m to sales; £3.9m to profit. HygroMatik divestment reduces sales by £1.1m; profits by £0.3m. Gestra integrating well; good growth in key markets. Adjusted operating margin down 160 bps; Gestra dilution and strategic investments.
EMEA Europe, Middle East and Africa
Reported
+13%
34
Organic
+4%
£344.4m
See pages 40-41
30%
Strategic Report
Spirax-Sarco Engineering plc Annual Report 2018
36
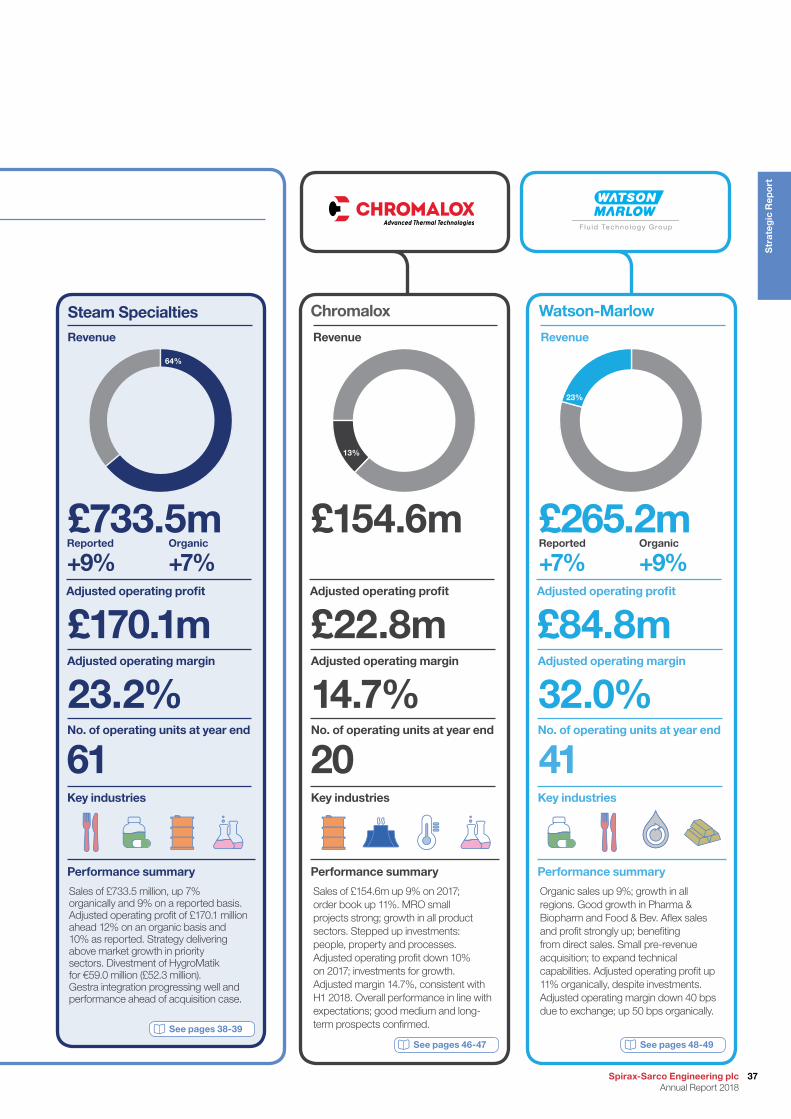
Steam Specialties
Adjusted operating profit Adjusted operating profit
Adjusted operating margin Adjusted operating margin
No. of operating units at year end No. of operating units at year end
Key industries Key industries
Performance summary Performance summary
Sales of £154.6m up 9% on 2017; order book up 11%. MRO small projects strong; growth in all product sectors. Stepped up investments: people, property and processes. Adjusted operating profit down 10% on 2017; investments for growth. Adjusted margin 14.7%, consistent with H1 2018. Overall performance in line with expectations; good medium and long-term prospects confirmed.
Organic sales up 9%; growth in all regions. Good growth in Pharma & Biopharm and Food & Bev. Aflex sales and profit strongly up; benefiting from direct sales. Small pre-revenue acquisition; to expand technical capabilities. Adjusted operating profit up 11% organically, despite investments. Adjusted operating margin down 40 bps due to exchange; up 50 bps organically.
£22.8m £84.8m
14.7% 32.0%
Chromalox Watson-Marlow
F lu id Te chno logy G roup
Reported
+7%Organic
+9%
£154.6m £265.2m
See pages 46-47 See pages 48-49
20 41
25%
13%
23%
Revenue RevenueRevenue
Adjusted operating profit
Adjusted operating margin
No. of operating units at year end
Key industries
Performance summary
£170.1m
23.2%
Sales of £733.5 million, up 7% organically and 9% on a reported basis. Adjusted operating profit of £170.1 million ahead 12% on an organic basis and 10% as reported. Strategy delivering above market growth in priority sectors. Divestment of HygroMatik for €59.0 million (£52.3 million). Gestra integration progressing well and performance ahead of acquisition case.
Steam Specialties
Reported
+9%
61
Organic
+7%
£733.5m
See pages 38-39
64%
37Spirax-Sarco Engineering plc Annual Report 2018
Str
ateg
ic R
epo
rt
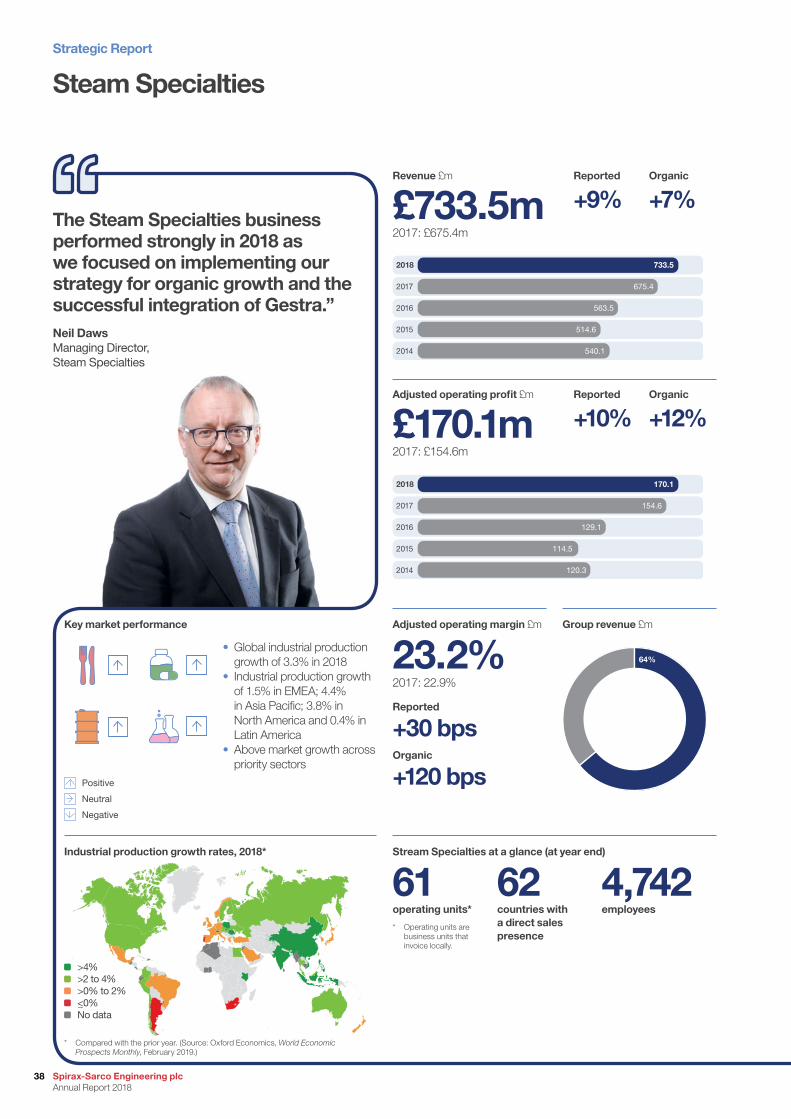
Steam Specialties
The Steam Specialties business performed strongly in 2018 as we focused on implementing our strategy for organic growth and the successful integration of Gestra.” Neil DawsManaging Director, Steam Specialties
Revenue £m Reported Organic
£733.5m +9% +7%2017: £675.4m
Adjusted operating profit £m Reported Organic
£170.1m +10% +12%2017: £154.6m
Reported
+30 bpsOrganic
+120 bps
23.2%2017: 22.9%
Adjusted operating margin £m Key market performance
Positive
Neutral
Negative
Group revenue £m
61operating units*
62countries with a direct sales presence
4,742 employees
Stream Specialties at a glance (at year end)
* Operating units are business units that invoice locally.
Industrial production growth rates, 2018*
* Compared with the prior year. (Source: Oxford Economics, World Economic Prospects Monthly, February 2019.)
64%
733.5
675.4
563.5
514.6
540.1
2018
2017
2016
2015
2014
170.1
154.6
129.1
114.5
120.3
2018
2017
2016
2015
2014
• Global industrial production growth of 3.3% in 2018
• Industrial production growth of 1.5% in EMEA; 4.4% in Asia Pacific; 3.8% in North America and 0.4% in Latin America
• Above market growth across priority sectors
>4% >2 to 4% >0% to 2% <_0% No data
Strategic Report
Spirax-Sarco Engineering plc Annual Report 2018
38
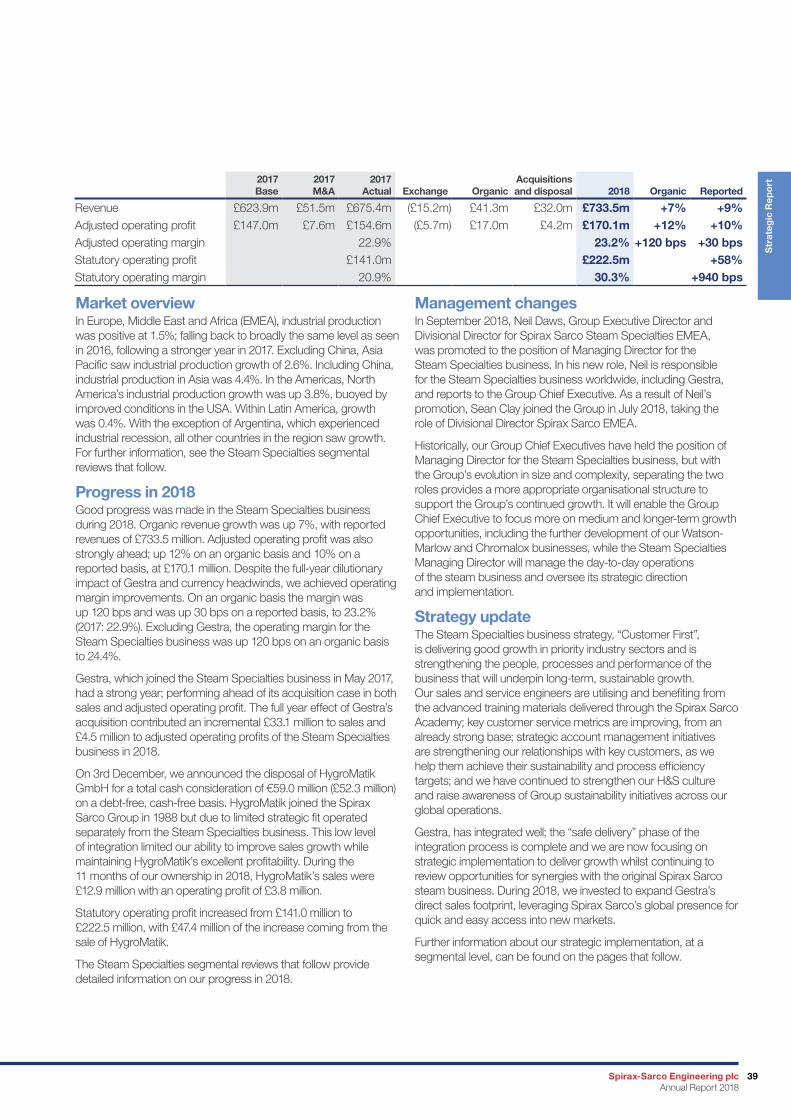
Market overviewIn Europe, Middle East and Africa (EMEA), industrial production was positive at 1.5%; falling back to broadly the same level as seen in 2016, following a stronger year in 2017. Excluding China, Asia Pacific saw industrial production growth of 2.6%. Including China, industrial production in Asia was 4.4%. In the Americas, North America’s industrial production growth was up 3.8%, buoyed by improved conditions in the USA. Within Latin America, growth was 0.4%. With the exception of Argentina, which experienced industrial recession, all other countries in the region saw growth. For further information, see the Steam Specialties segmental reviews that follow.
Progress in 2018Good progress was made in the Steam Specialties business during 2018. Organic revenue growth was up 7%, with reported revenues of £733.5 million. Adjusted operating profit was also strongly ahead; up 12% on an organic basis and 10% on a reported basis, at £170.1 million. Despite the full-year dilutionary impact of Gestra and currency headwinds, we achieved operating margin improvements. On an organic basis the margin was up 120 bps and was up 30 bps on a reported basis, to 23.2% (2017: 22.9%). Excluding Gestra, the operating margin for the Steam Specialties business was up 120 bps on an organic basis to 24.4%.
Gestra, which joined the Steam Specialties business in May 2017, had a strong year; performing ahead of its acquisition case in both sales and adjusted operating profit. The full year effect of Gestra’s acquisition contributed an incremental £33.1 million to sales and £4.5 million to adjusted operating profits of the Steam Specialties business in 2018.
On 3rd December, we announced the disposal of HygroMatik GmbH for a total cash consideration of €59.0 million (£52.3 million) on a debt-free, cash-free basis. HygroMatik joined the Spirax Sarco Group in 1988 but due to limited strategic fit operated separately from the Steam Specialties business. This low level of integration limited our ability to improve sales growth while maintaining HygroMatik’s excellent profitability. During the 11 months of our ownership in 2018, HygroMatik’s sales were £12.9 million with an operating profit of £3.8 million.
Statutory operating profit increased from £141.0 million to £222.5 million, with £47.4 million of the increase coming from the sale of HygroMatik.
The Steam Specialties segmental reviews that follow provide detailed information on our progress in 2018.
Management changesIn September 2018, Neil Daws, Group Executive Director and Divisional Director for Spirax Sarco Steam Specialties EMEA, was promoted to the position of Managing Director for the Steam Specialties business. In his new role, Neil is responsible for the Steam Specialties business worldwide, including Gestra, and reports to the Group Chief Executive. As a result of Neil’s promotion, Sean Clay joined the Group in July 2018, taking the role of Divisional Director Spirax Sarco EMEA.
Historically, our Group Chief Executives have held the position of Managing Director for the Steam Specialties business, but with the Group’s evolution in size and complexity, separating the two roles provides a more appropriate organisational structure to support the Group’s continued growth. It will enable the Group Chief Executive to focus more on medium and longer-term growth opportunities, including the further development of our Watson-Marlow and Chromalox businesses, while the Steam Specialties Managing Director will manage the day-to-day operations of the steam business and oversee its strategic direction and implementation.
Strategy updateThe Steam Specialties business strategy, “Customer First”, is delivering good growth in priority industry sectors and is strengthening the people, processes and performance of the business that will underpin long-term, sustainable growth. Our sales and service engineers are utilising and benefiting from the advanced training materials delivered through the Spirax Sarco Academy; key customer service metrics are improving, from an already strong base; strategic account management initiatives are strengthening our relationships with key customers, as we help them achieve their sustainability and process efficiency targets; and we have continued to strengthen our H&S culture and raise awareness of Group sustainability initiatives across our global operations.
Gestra, has integrated well; the “safe delivery” phase of the integration process is complete and we are now focusing on strategic implementation to deliver growth whilst continuing to review opportunities for synergies with the original Spirax Sarco steam business. During 2018, we invested to expand Gestra’s direct sales footprint, leveraging Spirax Sarco’s global presence for quick and easy access into new markets.
Further information about our strategic implementation, at a segmental level, can be found on the pages that follow.
2017 Base
2017 M&A
2017 Actual Exchange Organic
Acquisitions and disposal 2018 Organic Reported
Revenue £623.9m £51.5m £675.4m (£15.2m) £41.3m £32.0m £733.5m +7% +9%Adjusted operating profit £147.0m £7.6m £154.6m (£5.7m) £17.0m £4.2m £170.1m +12% +10%Adjusted operating margin 22.9% 23.2% +120 bps +30 bpsStatutory operating profit £141.0m £222.5m +58%Statutory operating margin 20.9% 30.3% +940 bps
39Spirax-Sarco Engineering plc Annual Report 2018
Str
ateg
ic R
epo
rt
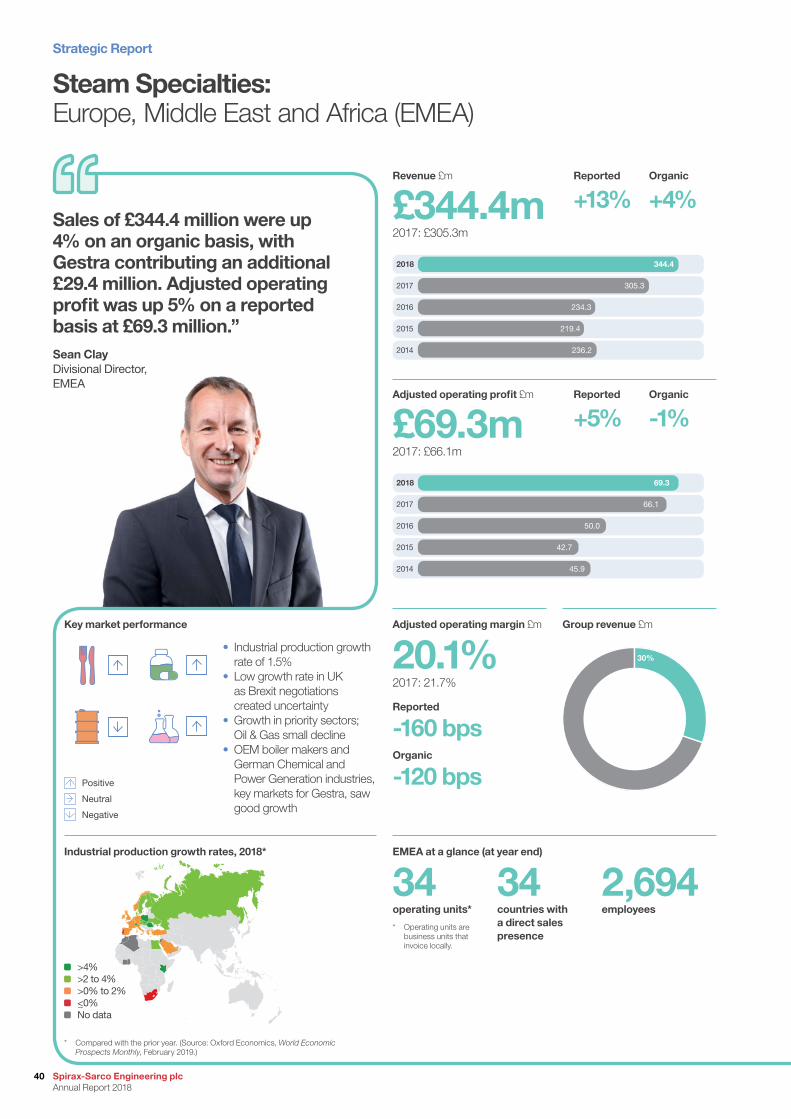
Steam Specialties:Europe, Middle East and Africa (EMEA)
Sales of £344.4 million were up 4% on an organic basis, with Gestra contributing an additional £29.4 million. Adjusted operating profit was up 5% on a reported basis at £69.3 million.”Sean ClayDivisional Director, EMEA
Revenue £m Reported Organic
£344.4m +13% +4%2017: £305.3m
Adjusted operating profit £m Reported Organic
£69.3m +5% -1%2017: £66.1m
Reported
-160 bpsOrganic
-120 bps
20.1%2017: 21.7%
Adjusted operating margin £m Key market performance Group revenue £m
34operating units*
34countries with a direct sales presence
2,694 employees
EMEA at a glance (at year end)
* Operating units are business units that invoice locally.
Industrial production growth rates, 2018*
* Compared with the prior year. (Source: Oxford Economics, World Economic Prospects Monthly, February 2019.)
30%
344.4
305.3
234.3
219.4
236.2
2018
2017
2016
2015
2014
69.3
66.1
50.0
42.7
45.9
2018
2017
2016
2015
2014
• Industrial production growth rate of 1.5%
• Low growth rate in UK as Brexit negotiations created uncertainty
• Growth in priority sectors; Oil & Gas small decline
• OEM boiler makers and German Chemical and Power Generation industries, key markets for Gestra, saw good growth
>4% >2 to 4% >0% to 2% <_0% No data
Positive
Neutral
Negative
Strategic Report
Spirax-Sarco Engineering plc Annual Report 2018
40
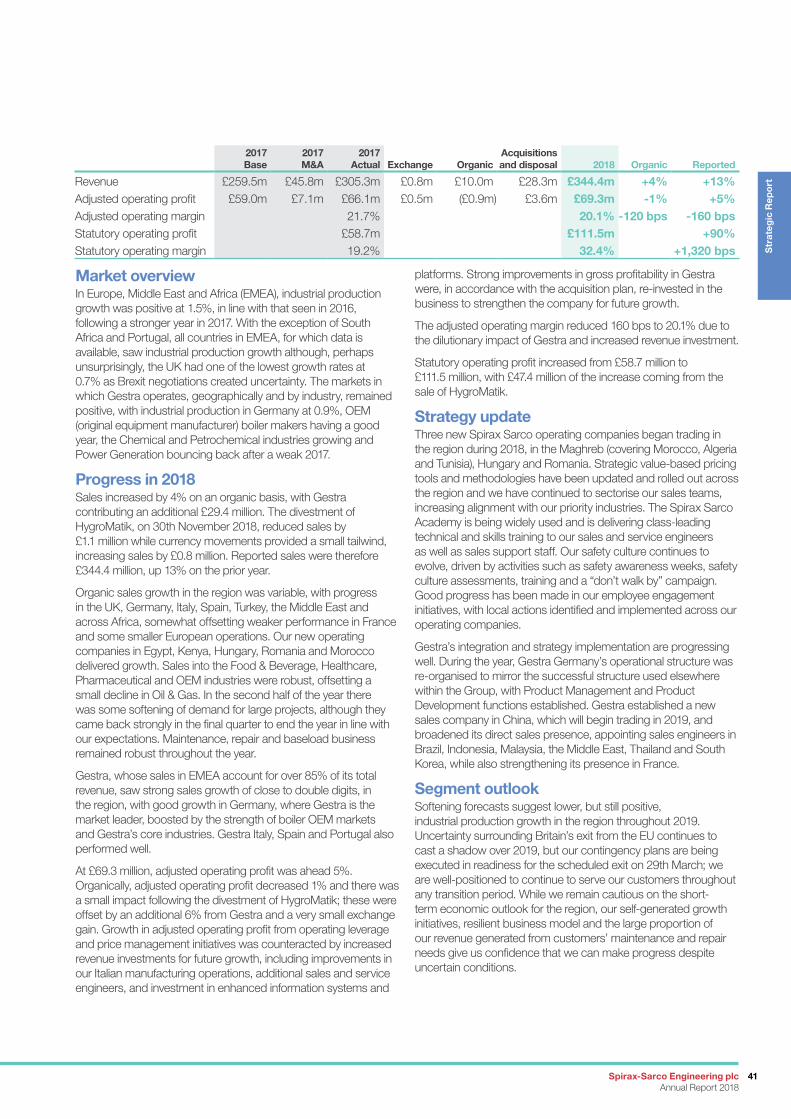
Market overviewIn Europe, Middle East and Africa (EMEA), industrial production growth was positive at 1.5%, in line with that seen in 2016, following a stronger year in 2017. With the exception of South Africa and Portugal, all countries in EMEA, for which data is available, saw industrial production growth although, perhaps unsurprisingly, the UK had one of the lowest growth rates at 0.7% as Brexit negotiations created uncertainty. The markets in which Gestra operates, geographically and by industry, remained positive, with industrial production in Germany at 0.9%, OEM (original equipment manufacturer) boiler makers having a good year, the Chemical and Petrochemical industries growing and Power Generation bouncing back after a weak 2017.
Progress in 2018Sales increased by 4% on an organic basis, with Gestra contributing an additional £29.4 million. The divestment of HygroMatik, on 30th November 2018, reduced sales by £1.1 million while currency movements provided a small tailwind, increasing sales by £0.8 million. Reported sales were therefore £344.4 million, up 13% on the prior year.
Organic sales growth in the region was variable, with progress in the UK, Germany, Italy, Spain, Turkey, the Middle East and across Africa, somewhat offsetting weaker performance in France and some smaller European operations. Our new operating companies in Egypt, Kenya, Hungary, Romania and Morocco delivered growth. Sales into the Food & Beverage, Healthcare, Pharmaceutical and OEM industries were robust, offsetting a small decline in Oil & Gas. In the second half of the year there was some softening of demand for large projects, although they came back strongly in the final quarter to end the year in line with our expectations. Maintenance, repair and baseload business remained robust throughout the year.
Gestra, whose sales in EMEA account for over 85% of its total revenue, saw strong sales growth of close to double digits, in the region, with good growth in Germany, where Gestra is the market leader, boosted by the strength of boiler OEM markets and Gestra’s core industries. Gestra Italy, Spain and Portugal also performed well.
At £69.3 million, adjusted operating profit was ahead 5%. Organically, adjusted operating profit decreased 1% and there was a small impact following the divestment of HygroMatik; these were offset by an additional 6% from Gestra and a very small exchange gain. Growth in adjusted operating profit from operating leverage and price management initiatives was counteracted by increased revenue investments for future growth, including improvements in our Italian manufacturing operations, additional sales and service engineers, and investment in enhanced information systems and
platforms. Strong improvements in gross profitability in Gestra were, in accordance with the acquisition plan, re-invested in the business to strengthen the company for future growth.
The adjusted operating margin reduced 160 bps to 20.1% due to the dilutionary impact of Gestra and increased revenue investment.
Statutory operating profit increased from £58.7 million to £111.5 million, with £47.4 million of the increase coming from the sale of HygroMatik.
Strategy updateThree new Spirax Sarco operating companies began trading in the region during 2018, in the Maghreb (covering Morocco, Algeria and Tunisia), Hungary and Romania. Strategic value-based pricing tools and methodologies have been updated and rolled out across the region and we have continued to sectorise our sales teams, increasing alignment with our priority industries. The Spirax Sarco Academy is being widely used and is delivering class-leading technical and skills training to our sales and service engineers as well as sales support staff. Our safety culture continues to evolve, driven by activities such as safety awareness weeks, safety culture assessments, training and a “don’t walk by” campaign. Good progress has been made in our employee engagement initiatives, with local actions identified and implemented across our operating companies.
Gestra’s integration and strategy implementation are progressing well. During the year, Gestra Germany’s operational structure was re-organised to mirror the successful structure used elsewhere within the Group, with Product Management and Product Development functions established. Gestra established a new sales company in China, which will begin trading in 2019, and broadened its direct sales presence, appointing sales engineers in Brazil, Indonesia, Malaysia, the Middle East, Thailand and South Korea, while also strengthening its presence in France.
Segment outlookSoftening forecasts suggest lower, but still positive, industrial production growth in the region throughout 2019. Uncertainty surrounding Britain’s exit from the EU continues to cast a shadow over 2019, but our contingency plans are being executed in readiness for the scheduled exit on 29th March; we are well-positioned to continue to serve our customers throughout any transition period. While we remain cautious on the short-term economic outlook for the region, our self-generated growth initiatives, resilient business model and the large proportion of our revenue generated from customers’ maintenance and repair needs give us confidence that we can make progress despite uncertain conditions.
2017 Base
2017 M&A
2017 Actual Exchange Organic
Acquisitions and disposal 2018 Organic Reported
Revenue £259.5m £45.8m £305.3m £0.8m £10.0m £28.3m £344.4m +4% +13%Adjusted operating profit £59.0m £7.1m £66.1m £0.5m (£0.9m) £3.6m £69.3m -1% +5%Adjusted operating margin 21.7% 20.1% -120 bps -160 bpsStatutory operating profit £58.7m £111.5m +90%Statutory operating margin 19.2% 32.4% +1,320 bps
41Spirax-Sarco Engineering plc Annual Report 2018
Str
ateg
ic R
epo
rt
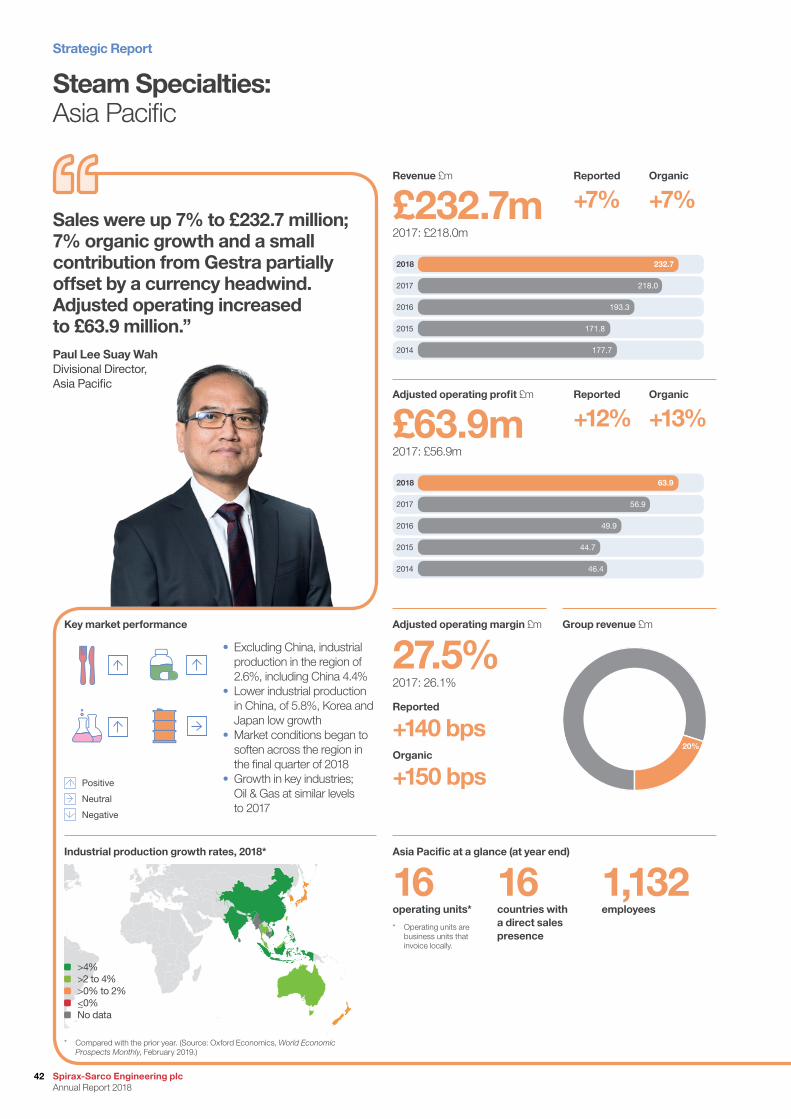
Steam Specialties:Asia Pacific
Sales were up 7% to £232.7 million; 7% organic growth and a small contribution from Gestra partially offset by a currency headwind. Adjusted operating increased to £63.9 million.” Paul Lee Suay WahDivisional Director, Asia Pacific
Revenue £m Reported Organic
£232.7m +7% +7%2017: £218.0m
Adjusted operating profit £m Reported Organic
£63.9m +12% +13%2017: £56.9m
Reported
+140 bpsOrganic
+150 bps
27.5%2017: 26.1%
Adjusted operating margin £m
• Excluding China, industrial production in the region of 2.6%, including China 4.4%
• Lower industrial production in China, of 5.8%, Korea and Japan low growth
• Market conditions began to soften across the region in the final quarter of 2018
• Growth in key industries; Oil & Gas at similar levels to 2017
Key market performance Group revenue £m
16operating units*
16countries with a direct sales presence
1,132 employees
Asia Pacific at a glance (at year end)
* Operating units are business units that invoice locally.
Industrial production growth rates, 2018*
20%
232.7
218.0
193.3
171.8
177.7
2018
2017
2016
2015
2014
63.9
56.9
49.9
44.7
46.4
2018
2017
2016
2015
2014
* Compared with the prior year. (Source: Oxford Economics, World Economic Prospects Monthly, February 2019.)
>4% >2 to 4% >0% to 2% <_0% No data
Positive
Neutral
Negative
Strategic Report
Spirax-Sarco Engineering plc Annual Report 2018
42
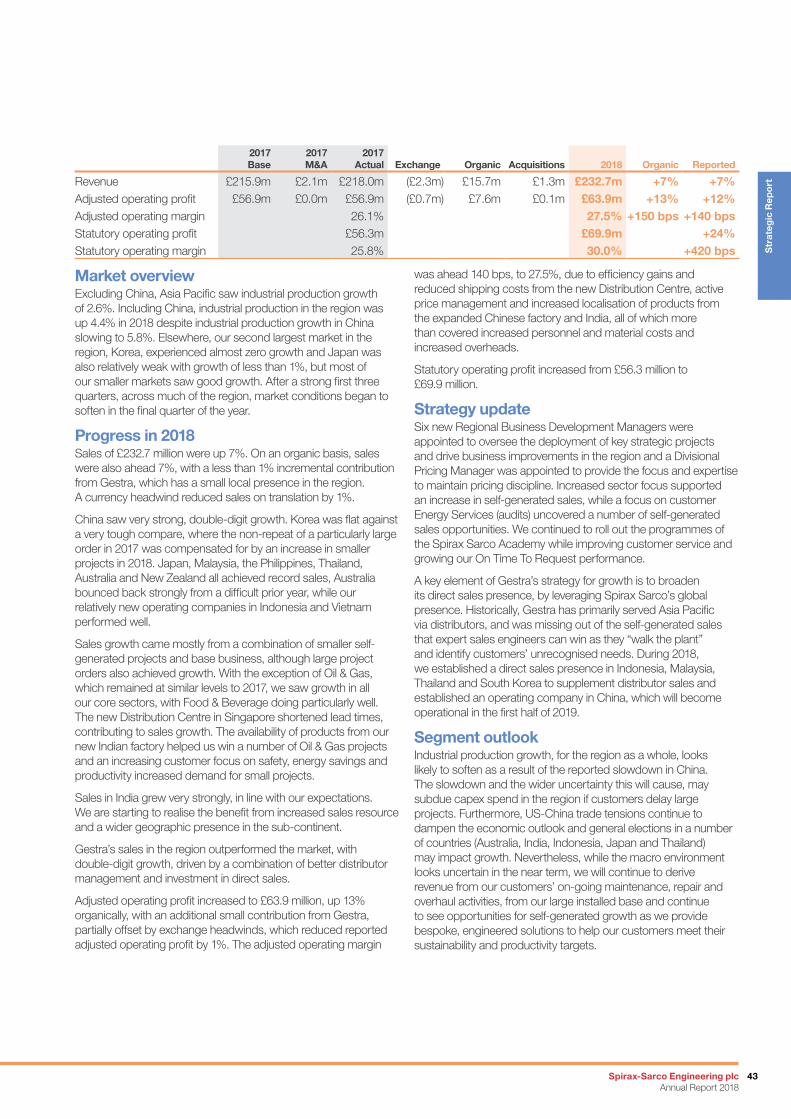
Market overviewExcluding China, Asia Pacific saw industrial production growth of 2.6%. Including China, industrial production in the region was up 4.4% in 2018 despite industrial production growth in China slowing to 5.8%. Elsewhere, our second largest market in the region, Korea, experienced almost zero growth and Japan was also relatively weak with growth of less than 1%, but most of our smaller markets saw good growth. After a strong first three quarters, across much of the region, market conditions began to soften in the final quarter of the year.
Progress in 2018Sales of £232.7 million were up 7%. On an organic basis, sales were also ahead 7%, with a less than 1% incremental contribution from Gestra, which has a small local presence in the region. A currency headwind reduced sales on translation by 1%.
China saw very strong, double-digit growth. Korea was flat against a very tough compare, where the non-repeat of a particularly large order in 2017 was compensated for by an increase in smaller projects in 2018. Japan, Malaysia, the Philippines, Thailand, Australia and New Zealand all achieved record sales, Australia bounced back strongly from a difficult prior year, while our relatively new operating companies in Indonesia and Vietnam performed well.
Sales growth came mostly from a combination of smaller self-generated projects and base business, although large project orders also achieved growth. With the exception of Oil & Gas, which remained at similar levels to 2017, we saw growth in all our core sectors, with Food & Beverage doing particularly well. The new Distribution Centre in Singapore shortened lead times, contributing to sales growth. The availability of products from our new Indian factory helped us win a number of Oil & Gas projects and an increasing customer focus on safety, energy savings and productivity increased demand for small projects.
Sales in India grew very strongly, in line with our expectations. We are starting to realise the benefit from increased sales resource and a wider geographic presence in the sub-continent.
Gestra’s sales in the region outperformed the market, with double-digit growth, driven by a combination of better distributor management and investment in direct sales.
Adjusted operating profit increased to £63.9 million, up 13% organically, with an additional small contribution from Gestra, partially offset by exchange headwinds, which reduced reported adjusted operating profit by 1%. The adjusted operating margin
was ahead 140 bps, to 27.5%, due to efficiency gains and reduced shipping costs from the new Distribution Centre, active price management and increased localisation of products from the expanded Chinese factory and India, all of which more than covered increased personnel and material costs and increased overheads.
Statutory operating profit increased from £56.3 million to £69.9 million.
Strategy updateSix new Regional Business Development Managers were appointed to oversee the deployment of key strategic projects and drive business improvements in the region and a Divisional Pricing Manager was appointed to provide the focus and expertise to maintain pricing discipline. Increased sector focus supported an increase in self-generated sales, while a focus on customer Energy Services (audits) uncovered a number of self-generated sales opportunities. We continued to roll out the programmes of the Spirax Sarco Academy while improving customer service and growing our On Time To Request performance.
A key element of Gestra’s strategy for growth is to broaden its direct sales presence, by leveraging Spirax Sarco’s global presence. Historically, Gestra has primarily served Asia Pacific via distributors, and was missing out of the self-generated sales that expert sales engineers can win as they “walk the plant” and identify customers’ unrecognised needs. During 2018, we established a direct sales presence in Indonesia, Malaysia, Thailand and South Korea to supplement distributor sales and established an operating company in China, which will become operational in the first half of 2019.
Segment outlookIndustrial production growth, for the region as a whole, looks likely to soften as a result of the reported slowdown in China. The slowdown and the wider uncertainty this will cause, may subdue capex spend in the region if customers delay large projects. Furthermore, US-China trade tensions continue to dampen the economic outlook and general elections in a number of countries (Australia, India, Indonesia, Japan and Thailand) may impact growth. Nevertheless, while the macro environment looks uncertain in the near term, we will continue to derive revenue from our customers’ on-going maintenance, repair and overhaul activities, from our large installed base and continue to see opportunities for self-generated growth as we provide bespoke, engineered solutions to help our customers meet their sustainability and productivity targets.
2017 Base
2017 M&A
2017 Actual Exchange Organic Acquisitions 2018 Organic Reported
Revenue £215.9m £2.1m £218.0m (£2.3m) £15.7m £1.3m £232.7m +7% +7%Adjusted operating profit £56.9m £0.0m £56.9m (£0.7m) £7.6m £0.1m £63.9m +13% +12%Adjusted operating margin 26.1% 27.5% +150 bps +140 bpsStatutory operating profit £56.3m £69.9m +24%Statutory operating margin 25.8% 30.0% +420 bps
43Spirax-Sarco Engineering plc Annual Report 2018
Str
ateg
ic R
epo
rt
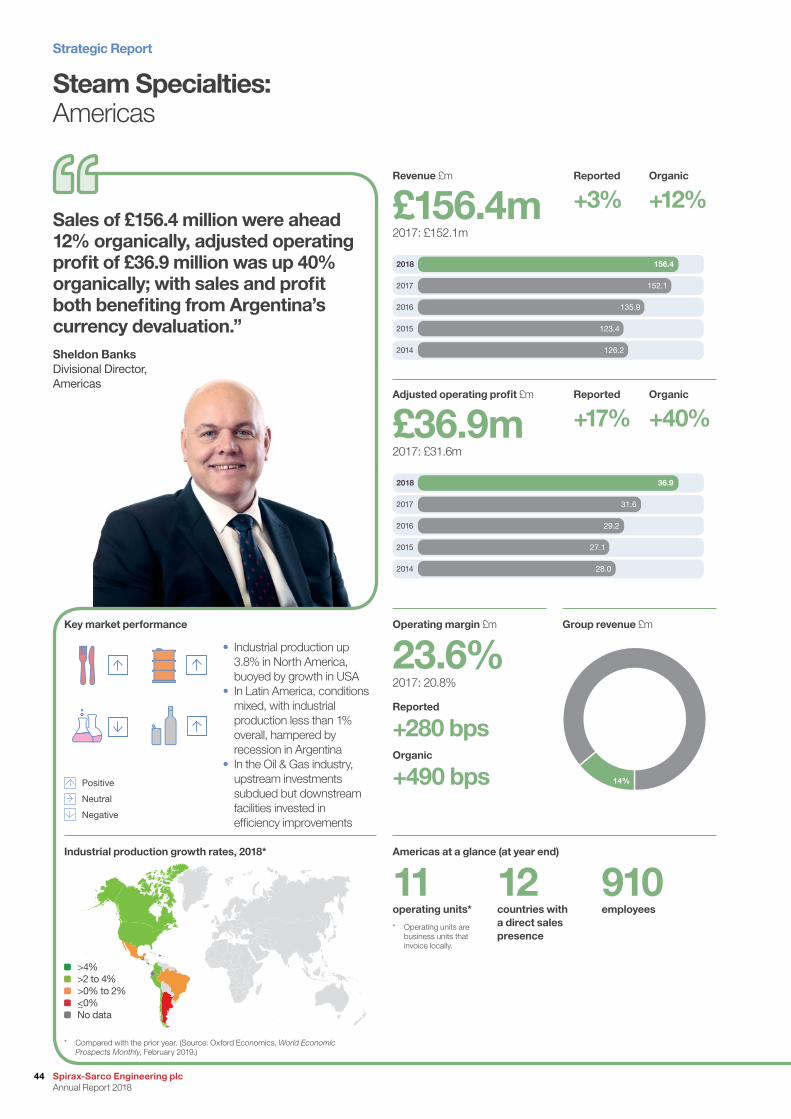
Steam Specialties:Americas
Sales of £156.4 million were ahead 12% organically, adjusted operating profit of £36.9 million was up 40% organically; with sales and profit both benefiting from Argentina’s currency devaluation.” Sheldon BanksDivisional Director, Americas
Revenue £m Reported Organic
£156.4m +3% +12%2017: £152.1m
Adjusted operating profit £m Reported Organic
£36.9m +17% +40%2017: £31.6m
Reported
+280 bpsOrganic
+490 bps
23.6%2017: 20.8%
Operating margin £m Key market performance Group revenue £m
11operating units*
12countries with a direct sales presence
910 employees
Americas at a glance (at year end)
* Operating units are business units that invoice locally.
Industrial production growth rates, 2018*
14%
156.4
152.1
135.9
123.4
126.2
2018
2017
2016
2015
2014
36.9
31.6
29.2
27.1
28.0
2018
2017
2016
2015
2014
• Industrial production up 3.8% in North America, buoyed by growth in USA
• In Latin America, conditions mixed, with industrial production less than 1% overall, hampered by recession in Argentina
• In the Oil & Gas industry, upstream investments subdued but downstream facilities invested in efficiency improvements
* Compared with the prior year. (Source: Oxford Economics, World Economic Prospects Monthly, February 2019.)
>4% >2 to 4% >0% to 2% <_0% No data
Positive
Neutral
Negative
Strategic Report
Spirax-Sarco Engineering plc Annual Report 2018
44
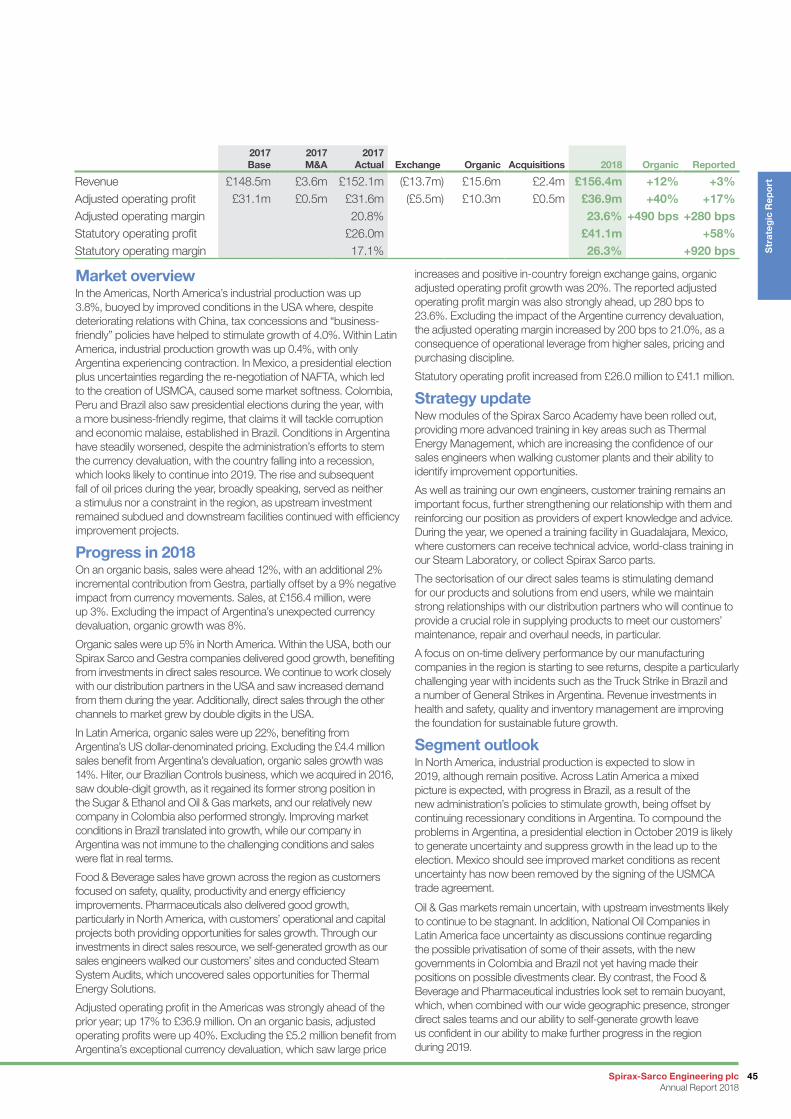
Market overviewIn the Americas, North America’s industrial production was up 3.8%, buoyed by improved conditions in the USA where, despite deteriorating relations with China, tax concessions and “business-friendly” policies have helped to stimulate growth of 4.0%. Within Latin America, industrial production growth was up 0.4%, with only Argentina experiencing contraction. In Mexico, a presidential election plus uncertainties regarding the re-negotiation of NAFTA, which led to the creation of USMCA, caused some market softness. Colombia, Peru and Brazil also saw presidential elections during the year, with a more business-friendly regime, that claims it will tackle corruption and economic malaise, established in Brazil. Conditions in Argentina have steadily worsened, despite the administration’s efforts to stem the currency devaluation, with the country falling into a recession, which looks likely to continue into 2019. The rise and subsequent fall of oil prices during the year, broadly speaking, served as neither a stimulus nor a constraint in the region, as upstream investment remained subdued and downstream facilities continued with efficiency improvement projects.
Progress in 2018On an organic basis, sales were ahead 12%, with an additional 2% incremental contribution from Gestra, partially offset by a 9% negative impact from currency movements. Sales, at £156.4 million, were up 3%. Excluding the impact of Argentina’s unexpected currency devaluation, organic growth was 8%.
Organic sales were up 5% in North America. Within the USA, both our Spirax Sarco and Gestra companies delivered good growth, benefiting from investments in direct sales resource. We continue to work closely with our distribution partners in the USA and saw increased demand from them during the year. Additionally, direct sales through the other channels to market grew by double digits in the USA.
In Latin America, organic sales were up 22%, benefiting from Argentina’s US dollar-denominated pricing. Excluding the £4.4 million sales benefit from Argentina’s devaluation, organic sales growth was 14%. Hiter, our Brazilian Controls business, which we acquired in 2016, saw double-digit growth, as it regained its former strong position in the Sugar & Ethanol and Oil & Gas markets, and our relatively new company in Colombia also performed strongly. Improving market conditions in Brazil translated into growth, while our company in Argentina was not immune to the challenging conditions and sales were flat in real terms.
Food & Beverage sales have grown across the region as customers focused on safety, quality, productivity and energy efficiency improvements. Pharmaceuticals also delivered good growth, particularly in North America, with customers’ operational and capital projects both providing opportunities for sales growth. Through our investments in direct sales resource, we self-generated growth as our sales engineers walked our customers’ sites and conducted Steam System Audits, which uncovered sales opportunities for Thermal Energy Solutions.
Adjusted operating profit in the Americas was strongly ahead of the prior year; up 17% to £36.9 million. On an organic basis, adjusted operating profits were up 40%. Excluding the £5.2 million benefit from Argentina’s exceptional currency devaluation, which saw large price
increases and positive in-country foreign exchange gains, organic adjusted operating profit growth was 20%. The reported adjusted operating profit margin was also strongly ahead, up 280 bps to 23.6%. Excluding the impact of the Argentine currency devaluation, the adjusted operating margin increased by 200 bps to 21.0%, as a consequence of operational leverage from higher sales, pricing and purchasing discipline.
Statutory operating profit increased from £26.0 million to £41.1 million.
Strategy updateNew modules of the Spirax Sarco Academy have been rolled out, providing more advanced training in key areas such as Thermal Energy Management, which are increasing the confidence of our sales engineers when walking customer plants and their ability to identify improvement opportunities.
As well as training our own engineers, customer training remains an important focus, further strengthening our relationship with them and reinforcing our position as providers of expert knowledge and advice. During the year, we opened a training facility in Guadalajara, Mexico, where customers can receive technical advice, world-class training in our Steam Laboratory, or collect Spirax Sarco parts.
The sectorisation of our direct sales teams is stimulating demand for our products and solutions from end users, while we maintain strong relationships with our distribution partners who will continue to provide a crucial role in supplying products to meet our customers’ maintenance, repair and overhaul needs, in particular.
A focus on on-time delivery performance by our manufacturing companies in the region is starting to see returns, despite a particularly challenging year with incidents such as the Truck Strike in Brazil and a number of General Strikes in Argentina. Revenue investments in health and safety, quality and inventory management are improving the foundation for sustainable future growth.
Segment outlookIn North America, industrial production is expected to slow in 2019, although remain positive. Across Latin America a mixed picture is expected, with progress in Brazil, as a result of the new administration’s policies to stimulate growth, being offset by continuing recessionary conditions in Argentina. To compound the problems in Argentina, a presidential election in October 2019 is likely to generate uncertainty and suppress growth in the lead up to the election. Mexico should see improved market conditions as recent uncertainty has now been removed by the signing of the USMCA trade agreement.
Oil & Gas markets remain uncertain, with upstream investments likely to continue to be stagnant. In addition, National Oil Companies in Latin America face uncertainty as discussions continue regarding the possible privatisation of some of their assets, with the new governments in Colombia and Brazil not yet having made their positions on possible divestments clear. By contrast, the Food & Beverage and Pharmaceutical industries look set to remain buoyant, which, when combined with our wide geographic presence, stronger direct sales teams and our ability to self-generate growth leave us confident in our ability to make further progress in the region during 2019.
2017 Base
2017 M&A
2017 Actual Exchange Organic Acquisitions 2018 Organic Reported
Revenue £148.5m £3.6m £152.1m (£13.7m) £15.6m £2.4m £156.4m +12% +3%Adjusted operating profit £31.1m £0.5m £31.6m (£5.5m) £10.3m £0.5m £36.9m +40% +17%Adjusted operating margin 20.8% 23.6% +490 bps +280 bpsStatutory operating profit £26.0m £41.1m +58%Statutory operating margin 17.1% 26.3% +920 bps
45Spirax-Sarco Engineering plc Annual Report 2018
Str
ateg
ic R
epo
rt
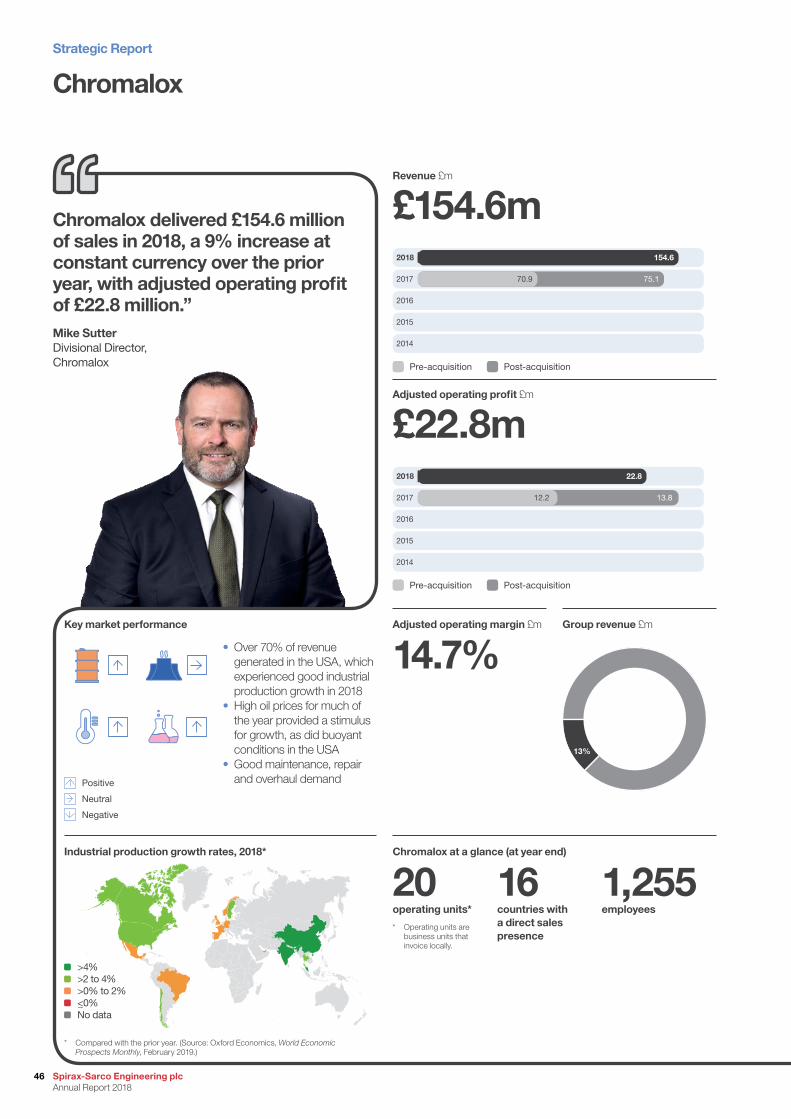
Chromalox
Chromalox delivered £154.6 million of sales in 2018, a 9% increase at constant currency over the prior year, with adjusted operating profit of £22.8 million.” Mike SutterDivisional Director, Chromalox
Revenue £m
£154.6m
Adjusted operating profit £m
£22.8m
14.7%Adjusted operating margin £m Key market performance Group revenue £m
20operating units*
16countries with a direct sales presence
1,255 employees
Chromalox at a glance (at year end)
* Operating units are business units that invoice locally.
Industrial production growth rates, 2018*
13%
154.6
75.170.9
2018
2017
2016
2015
2014
22.8
13.812.2
2018
2017
2016
2015
2014
• Over 70% of revenue generated in the USA, which experienced good industrial production growth in 2018
• High oil prices for much of the year provided a stimulus for growth, as did buoyant conditions in the USA
• Good maintenance, repair and overhaul demand
Pre-acquisition Post-acquisition
Pre-acquisition Post-acquisition
* Compared with the prior year. (Source: Oxford Economics, World Economic Prospects Monthly, February 2019.)
>4% >2 to 4% >0% to 2% <_0% No data
Positive
Neutral
Negative
Strategic Report
Spirax-Sarco Engineering plc Annual Report 2018
46
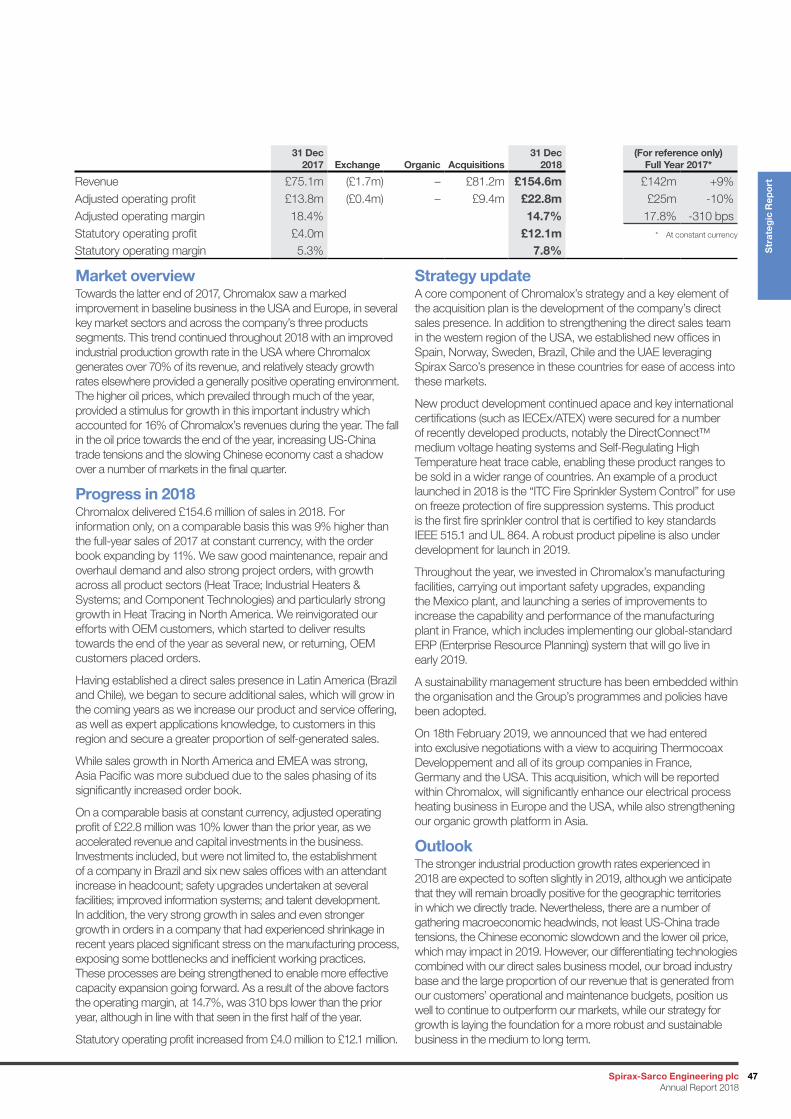
Market overviewTowards the latter end of 2017, Chromalox saw a marked improvement in baseline business in the USA and Europe, in several key market sectors and across the company’s three products segments. This trend continued throughout 2018 with an improved industrial production growth rate in the USA where Chromalox generates over 70% of its revenue, and relatively steady growth rates elsewhere provided a generally positive operating environment. The higher oil prices, which prevailed through much of the year, provided a stimulus for growth in this important industry which accounted for 16% of Chromalox’s revenues during the year. The fall in the oil price towards the end of the year, increasing US-China trade tensions and the slowing Chinese economy cast a shadow over a number of markets in the final quarter.
Progress in 2018Chromalox delivered £154.6 million of sales in 2018. For information only, on a comparable basis this was 9% higher than the full-year sales of 2017 at constant currency, with the order book expanding by 11%. We saw good maintenance, repair and overhaul demand and also strong project orders, with growth across all product sectors (Heat Trace; Industrial Heaters & Systems; and Component Technologies) and particularly strong growth in Heat Tracing in North America. We reinvigorated our efforts with OEM customers, which started to deliver results towards the end of the year as several new, or returning, OEM customers placed orders.
Having established a direct sales presence in Latin America (Brazil and Chile), we began to secure additional sales, which will grow in the coming years as we increase our product and service offering, as well as expert applications knowledge, to customers in this region and secure a greater proportion of self-generated sales.
While sales growth in North America and EMEA was strong, Asia Pacific was more subdued due to the sales phasing of its significantly increased order book.
On a comparable basis at constant currency, adjusted operating profit of £22.8 million was 10% lower than the prior year, as we accelerated revenue and capital investments in the business. Investments included, but were not limited to, the establishment of a company in Brazil and six new sales offices with an attendant increase in headcount; safety upgrades undertaken at several facilities; improved information systems; and talent development. In addition, the very strong growth in sales and even stronger growth in orders in a company that had experienced shrinkage in recent years placed significant stress on the manufacturing process, exposing some bottlenecks and inefficient working practices. These processes are being strengthened to enable more effective capacity expansion going forward. As a result of the above factors the operating margin, at 14.7%, was 310 bps lower than the prior year, although in line with that seen in the first half of the year.
Statutory operating profit increased from £4.0 million to £12.1 million.
Strategy updateA core component of Chromalox’s strategy and a key element of the acquisition plan is the development of the company’s direct sales presence. In addition to strengthening the direct sales team in the western region of the USA, we established new offices in Spain, Norway, Sweden, Brazil, Chile and the UAE leveraging Spirax Sarco’s presence in these countries for ease of access into these markets.
New product development continued apace and key international certifications (such as IECEx/ATEX) were secured for a number of recently developed products, notably the DirectConnect™ medium voltage heating systems and Self-Regulating High Temperature heat trace cable, enabling these product ranges to be sold in a wider range of countries. An example of a product launched in 2018 is the “ITC Fire Sprinkler System Control” for use on freeze protection of fire suppression systems. This product is the first fire sprinkler control that is certified to key standards IEEE 515.1 and UL 864. A robust product pipeline is also under development for launch in 2019.
Throughout the year, we invested in Chromalox’s manufacturing facilities, carrying out important safety upgrades, expanding the Mexico plant, and launching a series of improvements to increase the capability and performance of the manufacturing plant in France, which includes implementing our global-standard ERP (Enterprise Resource Planning) system that will go live in early 2019.
A sustainability management structure has been embedded within the organisation and the Group’s programmes and policies have been adopted.
On 18th February 2019, we announced that we had entered into exclusive negotiations with a view to acquiring Thermocoax Developpement and all of its group companies in France, Germany and the USA. This acquisition, which will be reported within Chromalox, will significantly enhance our electrical process heating business in Europe and the USA, while also strengthening our organic growth platform in Asia.
OutlookThe stronger industrial production growth rates experienced in 2018 are expected to soften slightly in 2019, although we anticipate that they will remain broadly positive for the geographic territories in which we directly trade. Nevertheless, there are a number of gathering macroeconomic headwinds, not least US-China trade tensions, the Chinese economic slowdown and the lower oil price, which may impact in 2019. However, our differentiating technologies combined with our direct sales business model, our broad industry base and the large proportion of our revenue that is generated from our customers’ operational and maintenance budgets, position us well to continue to outperform our markets, while our strategy for growth is laying the foundation for a more robust and sustainable business in the medium to long term.
31 Dec2017 Exchange Organic Acquisitions
31 Dec2018
(For reference only) Full Year 2017*
Revenue £75.1m (£1.7m) – £81.2m £154.6m £142m +9%Adjusted operating profit £13.8m (£0.4m) – £9.4m £22.8m £25m -10%Adjusted operating margin 18.4% 14.7% 17.8% -310 bpsStatutory operating profit £4.0m £12.1m * At constant currency
Statutory operating margin 5.3% 7.8%
47Spirax-Sarco Engineering plc Annual Report 2018
Str
ateg
ic R
epo
rt
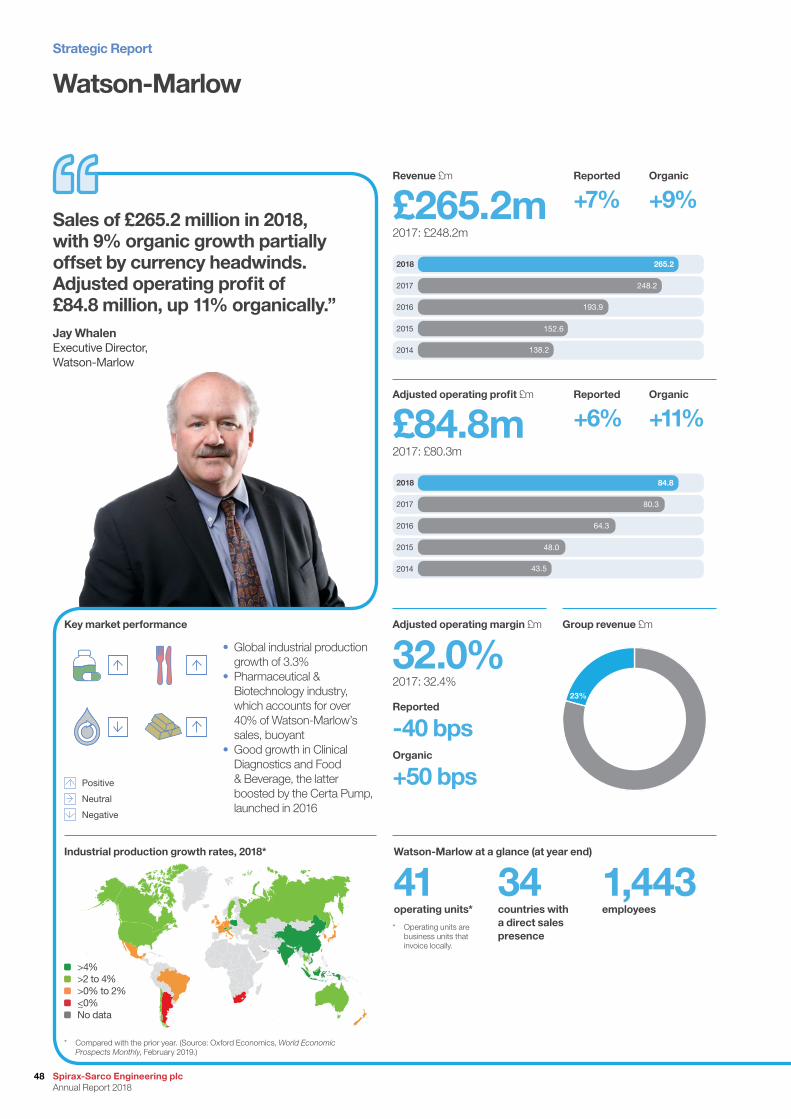
Watson-Marlow
Sales of £265.2 million in 2018, with 9% organic growth partially offset by currency headwinds. Adjusted operating profit of £84.8 million, up 11% organically.” Jay WhalenExecutive Director, Watson-Marlow
Revenue £m Reported Organic
£265.2m +7% +9%2017: £248.2m
Adjusted operating profit £m Reported Organic
£84.8m +6% +11%2017: £80.3m
Reported
-40 bpsOrganic
+50 bps
32.0%2017: 32.4%
Adjusted operating margin £m Key market performance Group revenue £m
41operating units*
34countries with a direct sales presence
1,443 employees
Watson-Marlow at a glance (at year end)
* Operating units are business units that invoice locally.
Industrial production growth rates, 2018*
23%
265.2
248.2
193.9
152.6
138.2
2018
2017
2016
2015
2014
84.8
80.3
64.3
48.0
43.5
2018
2017
2016
2015
2014
• Global industrial production growth of 3.3%
• Pharmaceutical & Biotechnology industry, which accounts for over 40% of Watson-Marlow’s sales, buoyant
• Good growth in Clinical Diagnostics and Food & Beverage, the latter boosted by the Certa Pump, launched in 2016
* Compared with the prior year. (Source: Oxford Economics, World Economic Prospects Monthly, February 2019.)
>4% >2 to 4% >0% to 2% <_0% No data
Positive
Neutral
Negative
Strategic Report
Spirax-Sarco Engineering plc Annual Report 2018
48
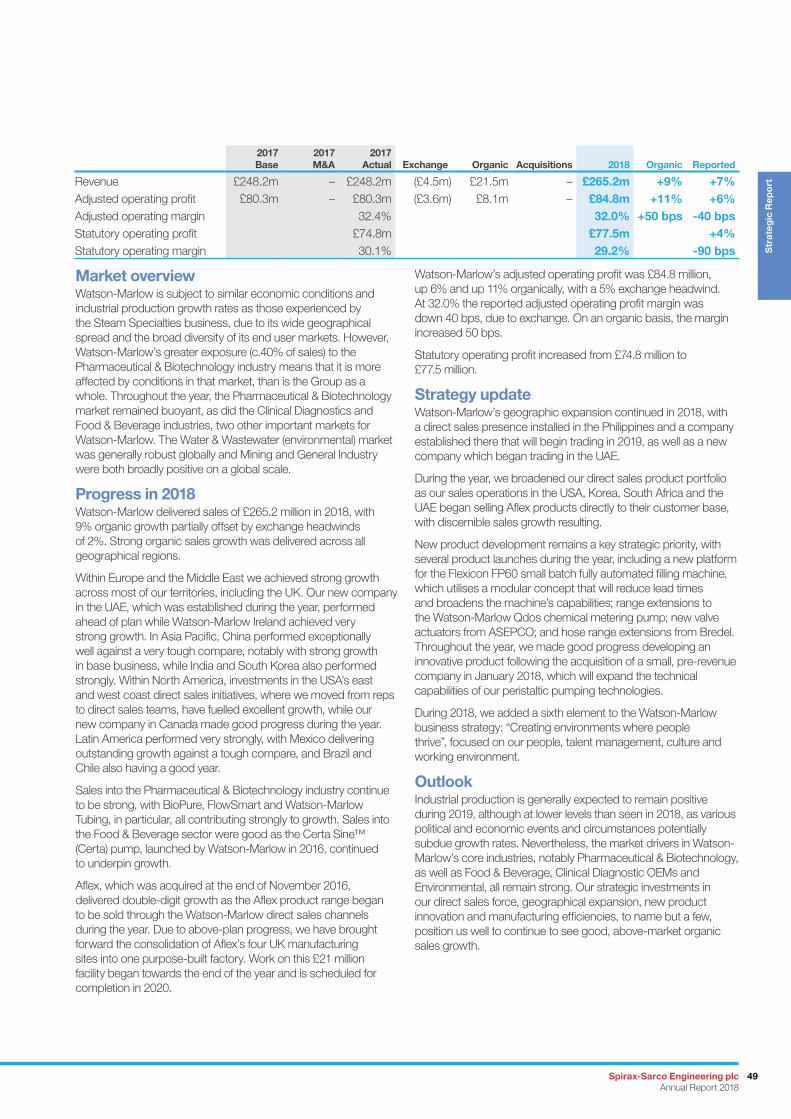
Market overviewWatson-Marlow is subject to similar economic conditions and industrial production growth rates as those experienced by the Steam Specialties business, due to its wide geographical spread and the broad diversity of its end user markets. However, Watson-Marlow’s greater exposure (c.40% of sales) to the Pharmaceutical & Biotechnology industry means that it is more affected by conditions in that market, than is the Group as a whole. Throughout the year, the Pharmaceutical & Biotechnology market remained buoyant, as did the Clinical Diagnostics and Food & Beverage industries, two other important markets for Watson-Marlow. The Water & Wastewater (environmental) market was generally robust globally and Mining and General Industry were both broadly positive on a global scale.
Progress in 2018Watson-Marlow delivered sales of £265.2 million in 2018, with 9% organic growth partially offset by exchange headwinds of 2%. Strong organic sales growth was delivered across all geographical regions.
Within Europe and the Middle East we achieved strong growth across most of our territories, including the UK. Our new company in the UAE, which was established during the year, performed ahead of plan while Watson-Marlow Ireland achieved very strong growth. In Asia Pacific, China performed exceptionally well against a very tough compare, notably with strong growth in base business, while India and South Korea also performed strongly. Within North America, investments in the USA’s east and west coast direct sales initiatives, where we moved from reps to direct sales teams, have fuelled excellent growth, while our new company in Canada made good progress during the year. Latin America performed very strongly, with Mexico delivering outstanding growth against a tough compare, and Brazil and Chile also having a good year.
Sales into the Pharmaceutical & Biotechnology industry continue to be strong, with BioPure, FlowSmart and Watson-Marlow Tubing, in particular, all contributing strongly to growth. Sales into the Food & Beverage sector were good as the Certa Sine™ (Certa) pump, launched by Watson-Marlow in 2016, continued to underpin growth.
Aflex, which was acquired at the end of November 2016, delivered double-digit growth as the Aflex product range began to be sold through the Watson-Marlow direct sales channels during the year. Due to above-plan progress, we have brought forward the consolidation of Aflex’s four UK manufacturing sites into one purpose-built factory. Work on this £21 million facility began towards the end of the year and is scheduled for completion in 2020.
Watson-Marlow’s adjusted operating profit was £84.8 million, up 6% and up 11% organically, with a 5% exchange headwind. At 32.0% the reported adjusted operating profit margin was down 40 bps, due to exchange. On an organic basis, the margin increased 50 bps.
Statutory operating profit increased from £74.8 million to £77.5 million.
Strategy updateWatson-Marlow’s geographic expansion continued in 2018, with a direct sales presence installed in the Philippines and a company established there that will begin trading in 2019, as well as a new company which began trading in the UAE.
During the year, we broadened our direct sales product portfolio as our sales operations in the USA, Korea, South Africa and the UAE began selling Aflex products directly to their customer base, with discernible sales growth resulting.
New product development remains a key strategic priority, with several product launches during the year, including a new platform for the Flexicon FP60 small batch fully automated filling machine, which utilises a modular concept that will reduce lead times and broadens the machine’s capabilities; range extensions to the Watson-Marlow Qdos chemical metering pump; new valve actuators from ASEPCO; and hose range extensions from Bredel. Throughout the year, we made good progress developing an innovative product following the acquisition of a small, pre-revenue company in January 2018, which will expand the technical capabilities of our peristaltic pumping technologies.
During 2018, we added a sixth element to the Watson-Marlow business strategy: “Creating environments where people thrive”, focused on our people, talent management, culture and working environment.
OutlookIndustrial production is generally expected to remain positive during 2019, although at lower levels than seen in 2018, as various political and economic events and circumstances potentially subdue growth rates. Nevertheless, the market drivers in Watson-Marlow’s core industries, notably Pharmaceutical & Biotechnology, as well as Food & Beverage, Clinical Diagnostic OEMs and Environmental, all remain strong. Our strategic investments in our direct sales force, geographical expansion, new product innovation and manufacturing efficiencies, to name but a few, position us well to continue to see good, above-market organic sales growth.
2017 Base
2017 M&A
2017 Actual Exchange Organic Acquisitions 2018 Organic Reported
Revenue £248.2m – £248.2m (£4.5m) £21.5m – £265.2m +9% +7%Adjusted operating profit £80.3m – £80.3m (£3.6m) £8.1m – £84.8m +11% +6%Adjusted operating margin 32.4% 32.0% +50 bps -40 bpsStatutory operating profit £74.8m £77.5m +4%Statutory operating margin 30.1% 29.2% -90 bps
49Spirax-Sarco Engineering plc Annual Report 2018
Str
ateg
ic R
epo
rt
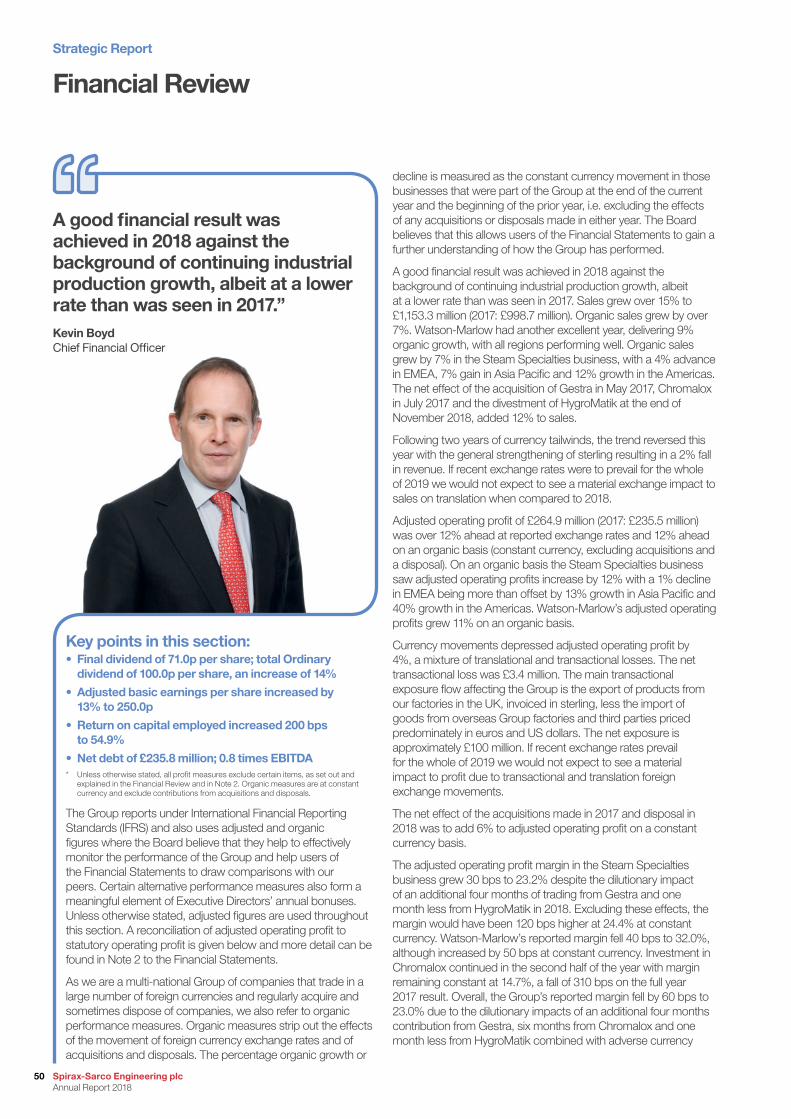
Financial Review
decline is measured as the constant currency movement in those businesses that were part of the Group at the end of the current year and the beginning of the prior year, i.e. excluding the effects of any acquisitions or disposals made in either year. The Board believes that this allows users of the Financial Statements to gain a further understanding of how the Group has performed.
A good financial result was achieved in 2018 against the background of continuing industrial production growth, albeit at a lower rate than was seen in 2017. Sales grew over 15% to £1,153.3 million (2017: £998.7 million). Organic sales grew by over 7%. Watson-Marlow had another excellent year, delivering 9% organic growth, with all regions performing well. Organic sales grew by 7% in the Steam Specialties business, with a 4% advance in EMEA, 7% gain in Asia Pacific and 12% growth in the Americas. The net effect of the acquisition of Gestra in May 2017, Chromalox in July 2017 and the divestment of HygroMatik at the end of November 2018, added 12% to sales.
Following two years of currency tailwinds, the trend reversed this year with the general strengthening of sterling resulting in a 2% fall in revenue. If recent exchange rates were to prevail for the whole of 2019 we would not expect to see a material exchange impact to sales on translation when compared to 2018.
Adjusted operating profit of £264.9 million (2017: £235.5 million) was over 12% ahead at reported exchange rates and 12% ahead on an organic basis (constant currency, excluding acquisitions and a disposal). On an organic basis the Steam Specialties business saw adjusted operating profits increase by 12% with a 1% decline in EMEA being more than offset by 13% growth in Asia Pacific and 40% growth in the Americas. Watson-Marlow’s adjusted operating profits grew 11% on an organic basis.
Currency movements depressed adjusted operating profit by 4%, a mixture of translational and transactional losses. The net transactional loss was £3.4 million. The main transactional exposure flow affecting the Group is the export of products from our factories in the UK, invoiced in sterling, less the import of goods from overseas Group factories and third parties priced predominately in euros and US dollars. The net exposure is approximately £100 million. If recent exchange rates prevail for the whole of 2019 we would not expect to see a material impact to profit due to transactional and translation foreign exchange movements.
The net effect of the acquisitions made in 2017 and disposal in 2018 was to add 6% to adjusted operating profit on a constant currency basis.
The adjusted operating profit margin in the Steam Specialties business grew 30 bps to 23.2% despite the dilutionary impact of an additional four months of trading from Gestra and one month less from HygroMatik in 2018. Excluding these effects, the margin would have been 120 bps higher at 24.4% at constant currency. Watson-Marlow’s reported margin fell 40 bps to 32.0%, although increased by 50 bps at constant currency. Investment in Chromalox continued in the second half of the year with margin remaining constant at 14.7%, a fall of 310 bps on the full year 2017 result. Overall, the Group’s reported margin fell by 60 bps to 23.0% due to the dilutionary impacts of an additional four months contribution from Gestra, six months from Chromalox and one month less from HygroMatik combined with adverse currency
Key points in this section:• Final dividend of 71.0p per share; total Ordinary
dividend of 100.0p per share, an increase of 14%
• Adjusted basic earnings per share increased by 13% to 250.0p
• Return on capital employed increased 200 bps to 54.9%
• Net debt of £235.8 million; 0.8 times EBITDA* Unless otherwise stated, all profit measures exclude certain items, as set out and
explained in the Financial Review and in Note 2. Organic measures are at constant currency and exclude contributions from acquisitions and disposals.
A good financial result was achieved in 2018 against the background of continuing industrial production growth, albeit at a lower rate than was seen in 2017.”Kevin BoydChief Financial Officer
The Group reports under International Financial Reporting Standards (IFRS) and also uses adjusted and organic figures where the Board believe that they help to effectively monitor the performance of the Group and help users of the Financial Statements to draw comparisons with our peers. Certain alternative performance measures also form a meaningful element of Executive Directors’ annual bonuses. Unless otherwise stated, adjusted figures are used throughout this section. A reconciliation of adjusted operating profit to statutory operating profit is given below and more detail can be found in Note 2 to the Financial Statements.
As we are a multi-national Group of companies that trade in a large number of foreign currencies and regularly acquire and sometimes dispose of companies, we also refer to organic performance measures. Organic measures strip out the effects of the movement of foreign currency exchange rates and of acquisitions and disposals. The percentage organic growth or
Strategic Report
Spirax-Sarco Engineering plc Annual Report 2018
50
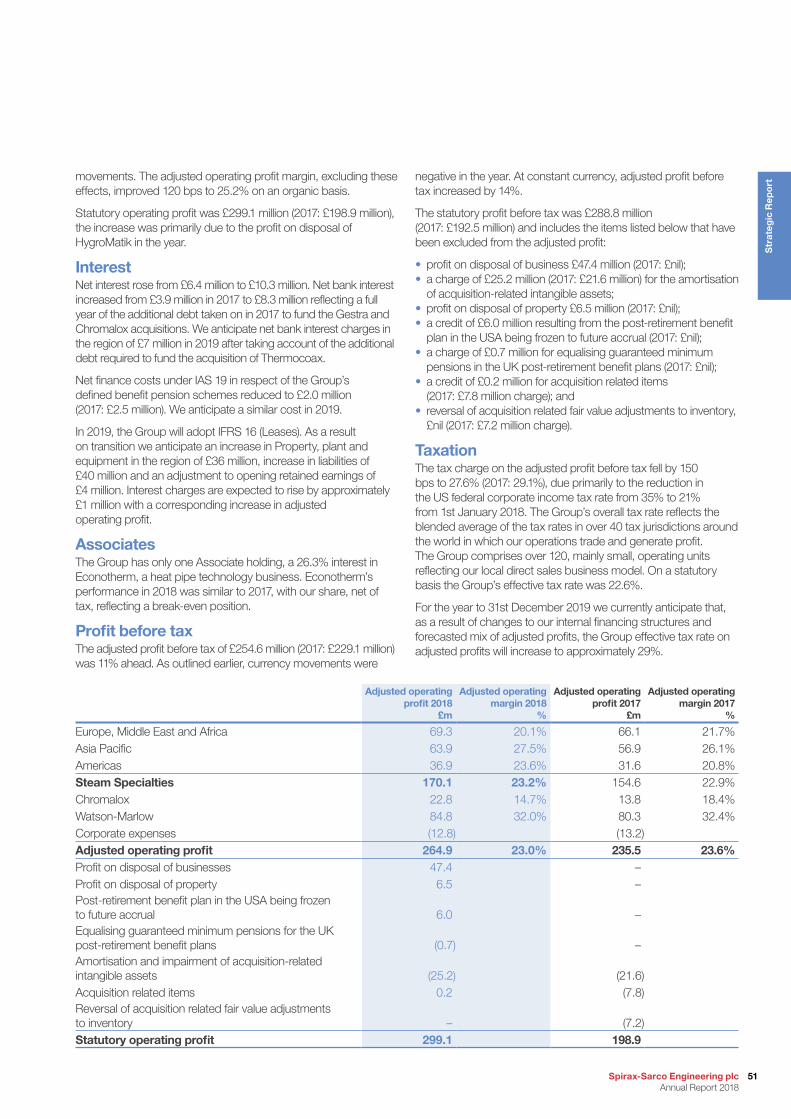
movements. The adjusted operating profit margin, excluding these effects, improved 120 bps to 25.2% on an organic basis.
Statutory operating profit was £299.1 million (2017: £198.9 million), the increase was primarily due to the profit on disposal of HygroMatik in the year.
InterestNet interest rose from £6.4 million to £10.3 million. Net bank interest increased from £3.9 million in 2017 to £8.3 million reflecting a full year of the additional debt taken on in 2017 to fund the Gestra and Chromalox acquisitions. We anticipate net bank interest charges in the region of £7 million in 2019 after taking account of the additional debt required to fund the acquisition of Thermocoax.
Net finance costs under IAS 19 in respect of the Group’s defined benefit pension schemes reduced to £2.0 million (2017: £2.5 million). We anticipate a similar cost in 2019.
In 2019, the Group will adopt IFRS 16 (Leases). As a result on transition we anticipate an increase in Property, plant and equipment in the region of £36 million, increase in liabilities of £40 million and an adjustment to opening retained earnings of £4 million. Interest charges are expected to rise by approximately £1 million with a corresponding increase in adjusted operating profit.
AssociatesThe Group has only one Associate holding, a 26.3% interest in Econotherm, a heat pipe technology business. Econotherm’s performance in 2018 was similar to 2017, with our share, net of tax, reflecting a break-even position.
Profit before taxThe adjusted profit before tax of £254.6 million (2017: £229.1 million) was 11% ahead. As outlined earlier, currency movements were
negative in the year. At constant currency, adjusted profit before tax increased by 14%.
The statutory profit before tax was £288.8 million (2017: £192.5 million) and includes the items listed below that have been excluded from the adjusted profit:
• profit on disposal of business £47.4 million (2017: £nil);• a charge of £25.2 million (2017: £21.6 million) for the amortisation
of acquisition-related intangible assets;• profit on disposal of property £6.5 million (2017: £nil);• a credit of £6.0 million resulting from the post-retirement benefit
plan in the USA being frozen to future accrual (2017: £nil);• a charge of £0.7 million for equalising guaranteed minimum
pensions in the UK post-retirement benefit plans (2017: £nil);• a credit of £0.2 million for acquisition related items
(2017: £7.8 million charge); and• reversal of acquisition related fair value adjustments to inventory,
£nil (2017: £7.2 million charge).
TaxationThe tax charge on the adjusted profit before tax fell by 150 bps to 27.6% (2017: 29.1%), due primarily to the reduction in the US federal corporate income tax rate from 35% to 21% from 1st January 2018. The Group’s overall tax rate reflects the blended average of the tax rates in over 40 tax jurisdictions around the world in which our operations trade and generate profit. The Group comprises over 120, mainly small, operating units reflecting our local direct sales business model. On a statutory basis the Group’s effective tax rate was 22.6%.
For the year to 31st December 2019 we currently anticipate that, as a result of changes to our internal financing structures and forecasted mix of adjusted profits, the Group effective tax rate on adjusted profits will increase to approximately 29%.
Adjusted operating profit 2018
£m
Adjusted operating margin 2018
%
Adjusted operating profit 2017
£m
Adjusted operating margin 2017
%
Europe, Middle East and Africa 69.3 20.1% 66.1 21.7%Asia Pacific 63.9 27.5% 56.9 26.1%Americas 36.9 23.6% 31.6 20.8%Steam Specialties 170.1 23.2% 154.6 22.9%Chromalox 22.8 14.7% 13.8 18.4%Watson-Marlow 84.8 32.0% 80.3 32.4%Corporate expenses (12.8) (13.2) Adjusted operating profit 264.9 23.0% 235.5 23.6%Profit on disposal of businesses 47.4 –Profit on disposal of property 6.5 –Post-retirement benefit plan in the USA being frozen to future accrual 6.0 –Equalising guaranteed minimum pensions for the UK post-retirement benefit plans (0.7) –Amortisation and impairment of acquisition-related intangible assets (25.2) (21.6)Acquisition related items 0.2 (7.8) Reversal of acquisition related fair value adjustments to inventory – (7.2)Statutory operating profit 299.1 198.9
51Spirax-Sarco Engineering plc Annual Report 2018
Str
ateg
ic R
epo
rt
Financial Reviewcontinued
Earnings per shareAdjusted basic earnings per share increased by 13% to 250.0 pence (2017: 220.5 pence). Statutory earnings per share was 303.1 pence (2017: 214.4 pence). The fully diluted earnings per share was not materially different in either year.
Dividends The Group has a progressive dividend policy where dividend payments follow underlying earnings per share growth while maintaining prudent levels of dividend cover. The aim is to provide sustainable, affordable dividend growth, building on our 51 year record of dividend progress, with a compound annual increase of 11.0% over that period; in line with the 12% per annum increase over the last 10 years. The Board is proposing a final dividend of 71.0 pence per share for 2018 (2017: 62.0 pence) payable on 24th May 2019 to shareholders on the register at 26th April 2019. Together with the interim dividend of 29.0 pence per share (2017: 25.5 pence), the total Ordinary dividend is therefore 100.0 pence per share, which is an increase of 14% on the Ordinary dividend of 87.5 pence per share in 2017.
The total amount paid in dividends during the year was £67.3 million, 16% above the £58.4 million paid in 2017.
Acquisitions and disposalAcquisitions are an important complement to our strategy for organic growth. In 2017 we made two relatively large acquisitions, Gestra and Chromalox. When we announced the acquisition of Chromalox in May 2017 we declared a self-imposed moratorium on significant acquisitions for 12-18 months so as to maintain management’s focus on the integration and safe delivery of the new companies. As a result, the only acquisition in 2018 was a small pre-revenue company for the Watson-Marlow business in January for consideration on a cash-free, debt-free basis of €3.0 million with up to a further €6.5 million to be paid if the company achieves certain technical specifications.
Dedicated resource remains focused on identifying opportunities to add attractive businesses that closely match our strategic, industrial and commercial requirements. Our three broad acquisition criteria are:
• geographic expansion, typically through the acquisition of a distributor in a developing market;
• products that can be integrated into our existing businesses; and• related acquisitions that fit alongside our existing Steam
Specialties, Watson-Marlow or Chromalox businesses.
The two acquisitions that were made in 2017, Gestra and Chromalox, have been integrated successfully into the Group and are performing in line with expectations in their first full year in our Group.
On 30th November 2018, we divested HygroMatik GmbH (HygroMatik) to Carel Industries S.p.A. for a total cash consideration of €59.0 million (£52.3 million) on a debt-free, cash-free basis and including working capital adjustments, represents a trailing EBITDA multiple of 12.5.
HygroMatik joined the Spirax Sarco Group in 1988 but due to limited strategic fit has always operated separately from the Steam Specialties business in which it was reported. This low level of integration limited our ability to improve sales growth while maintaining HygroMatik’s excellent profitability.
The profit on disposal of £47.4 million, after relevant fees, has been excluded from adjusted operating profit but included in statutory operating profit. In the year ended 31st December 2017, HygroMatik’s sales were £13.0 million and operating profit was £3.9 million all translated at the 2017 average euro exchange rate of 1.15 euro to the pound.
On 18th February 2019, we announced that we had entered into exclusive negotiations with a view to acquiring Thermocoax Developpement (Thermocoax), based in France, for a cash-free, debt-free consideration of €158 million (£139 million).
Thermocoax is a leading designer and manufacturer of highly engineered electrical thermal solutions for critical applications in high added value industries.
We anticipate that Thermocoax will become part of our Chromalox business and will significantly enhance our electrical process heating business, especially in Europe. Thermocoax enables us to address critical high value applications where product cost is a secondary concern to reliability and performance and allows for cross-selling opportunities for both businesses, strengthening Thermocoax’s presence in North America and Chromalox’s presence in Europe.
In the year ended 31st December 2018, Thermocoax recorded revenues of €49.8 million (£43.9 million), EBITDA of €12.9 million (£11.4 million) and adjusted operating profit of €12.1 million (£10.7 million). In 2018, 54% of the company’s revenues were in EMEA with 32% in the Americas and 14% in Asia Pacific. At 31st December 2018, Thermocoax’s gross assets were €94.6 million (£83.0 million).
The purchase will be financed from existing cash and debt facilities and is expected to be accretive to Group earnings in 2019.
Upon completion of the exclusive negotiations, the transaction will require certain regulatory approvals in France, Germany and the USA. These regulatory approvals are expected to be satisfied during the second quarter of 2019.
Brexit93% of the Group’s sales and operating profit are made outside the UK, reducing the risk to the Group from the United Kingdom’s decision to leave the European Union. That said, we are net exporters from the UK, importing approximately £50 million raw materials and components and exporting in the region of £150 million of finished goods to our sales companies around the world. To mitigate the risk of delays at ports we have made the decision to build a month’s buffer stock of raw materials and components in the UK and finished goods outside the UK equating to an additional two weeks usage. Assuming an orderly Brexit we would expect inventory levels to return to normal levels by the end of the year. The additional cost of building and maintaining these inventories is expected to be in the region of £0.8 million in 2019.
We have modelled potential tariff impacts and believe that these would be more than compensated for by a devaluation in sterling following a “no deal” Brexit.
We are well prepared and well placed to take on the challenges and identify the opportunities resulting from a UK exit from the EU. We have navigated periods of economic and political uncertainty in many different places around the world and have a long and successful history of doing so.
Strategic Report
Spirax-Sarco Engineering plc Annual Report 2018
52
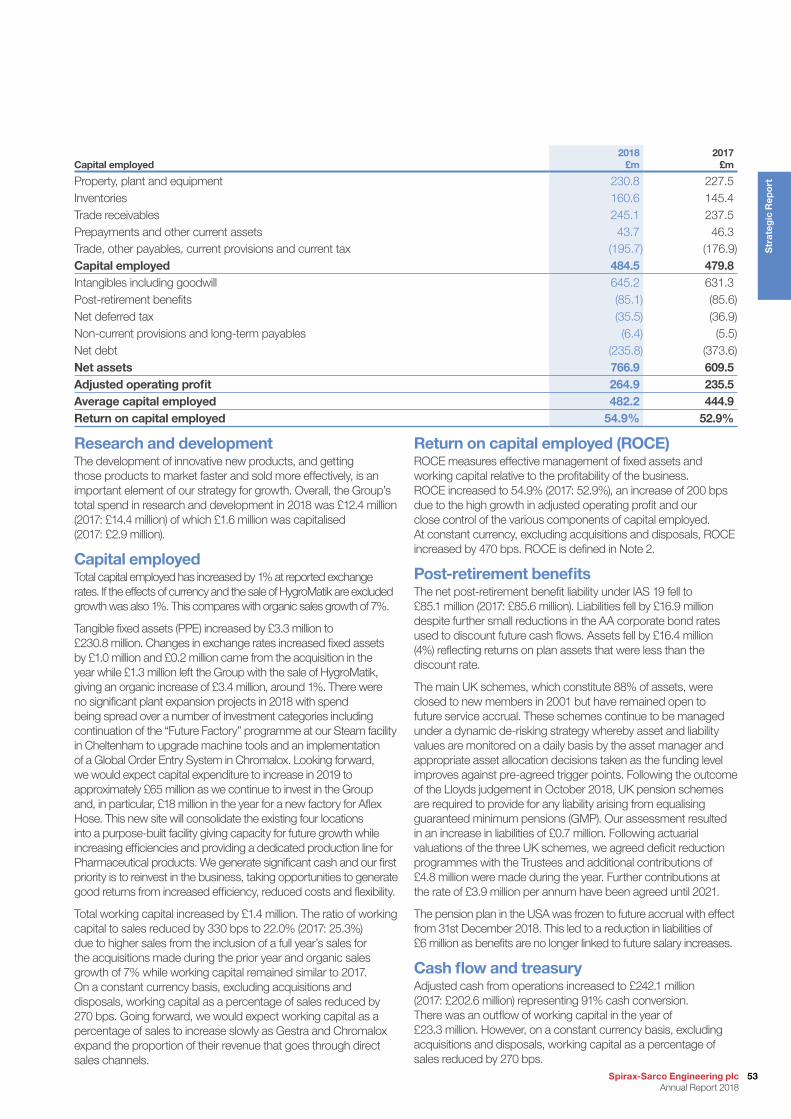
Capital employed2018
£m2017
£m
Property, plant and equipment 230.8 227.5Inventories 160.6 145.4Trade receivables 245.1 237.5Prepayments and other current assets 43.7 46.3Trade, other payables, current provisions and current tax (195.7) (176.9)Capital employed 484.5 479.8Intangibles including goodwill 645.2 631.3Post-retirement benefits (85.1) (85.6)Net deferred tax (35.5) (36.9)Non-current provisions and long-term payables (6.4) (5.5)Net debt (235.8) (373.6)Net assets 766.9 609.5Adjusted operating profit 264.9 235.5Average capital employed 482.2 444.9Return on capital employed 54.9% 52.9%
Research and developmentThe development of innovative new products, and getting those products to market faster and sold more effectively, is an important element of our strategy for growth. Overall, the Group’s total spend in research and development in 2018 was £12.4 million (2017: £14.4 million) of which £1.6 million was capitalised (2017: £2.9 million).
Capital employedTotal capital employed has increased by 1% at reported exchange rates. If the effects of currency and the sale of HygroMatik are excluded growth was also 1%. This compares with organic sales growth of 7%.
Tangible fixed assets (PPE) increased by £3.3 million to £230.8 million. Changes in exchange rates increased fixed assets by £1.0 million and £0.2 million came from the acquisition in the year while £1.3 million left the Group with the sale of HygroMatik, giving an organic increase of £3.4 million, around 1%. There were no significant plant expansion projects in 2018 with spend being spread over a number of investment categories including continuation of the “Future Factory” programme at our Steam facility in Cheltenham to upgrade machine tools and an implementation of a Global Order Entry System in Chromalox. Looking forward, we would expect capital expenditure to increase in 2019 to approximately £65 million as we continue to invest in the Group and, in particular, £18 million in the year for a new factory for Aflex Hose. This new site will consolidate the existing four locations into a purpose-built facility giving capacity for future growth while increasing efficiencies and providing a dedicated production line for Pharmaceutical products. We generate significant cash and our first priority is to reinvest in the business, taking opportunities to generate good returns from increased efficiency, reduced costs and flexibility.
Total working capital increased by £1.4 million. The ratio of working capital to sales reduced by 330 bps to 22.0% (2017: 25.3%) due to higher sales from the inclusion of a full year’s sales for the acquisitions made during the prior year and organic sales growth of 7% while working capital remained similar to 2017. On a constant currency basis, excluding acquisitions and disposals, working capital as a percentage of sales reduced by 270 bps. Going forward, we would expect working capital as a percentage of sales to increase slowly as Gestra and Chromalox expand the proportion of their revenue that goes through direct sales channels.
Return on capital employed (ROCE)ROCE measures effective management of fixed assets and working capital relative to the profitability of the business. ROCE increased to 54.9% (2017: 52.9%), an increase of 200 bps due to the high growth in adjusted operating profit and our close control of the various components of capital employed. At constant currency, excluding acquisitions and disposals, ROCE increased by 470 bps. ROCE is defined in Note 2.
Post-retirement benefitsThe net post-retirement benefit liability under IAS 19 fell to £85.1 million (2017: £85.6 million). Liabilities fell by £16.9 million despite further small reductions in the AA corporate bond rates used to discount future cash flows. Assets fell by £16.4 million (4%) reflecting returns on plan assets that were less than the discount rate.
The main UK schemes, which constitute 88% of assets, were closed to new members in 2001 but have remained open to future service accrual. These schemes continue to be managed under a dynamic de-risking strategy whereby asset and liability values are monitored on a daily basis by the asset manager and appropriate asset allocation decisions taken as the funding level improves against pre-agreed trigger points. Following the outcome of the Lloyds judgement in October 2018, UK pension schemes are required to provide for any liability arising from equalising guaranteed minimum pensions (GMP). Our assessment resulted in an increase in liabilities of £0.7 million. Following actuarial valuations of the three UK schemes, we agreed deficit reduction programmes with the Trustees and additional contributions of £4.8 million were made during the year. Further contributions at the rate of £3.9 million per annum have been agreed until 2021.
The pension plan in the USA was frozen to future accrual with effect from 31st December 2018. This led to a reduction in liabilities of £6 million as benefits are no longer linked to future salary increases.
Cash flow and treasury Adjusted cash from operations increased to £242.1 million (2017: £202.6 million) representing 91% cash conversion. There was an outflow of working capital in the year of £23.3 million. However, on a constant currency basis, excluding acquisitions and disposals, working capital as a percentage of sales reduced by 270 bps.
53Spirax-Sarco Engineering plc Annual Report 2018
Str
ateg
ic R
epo
rt
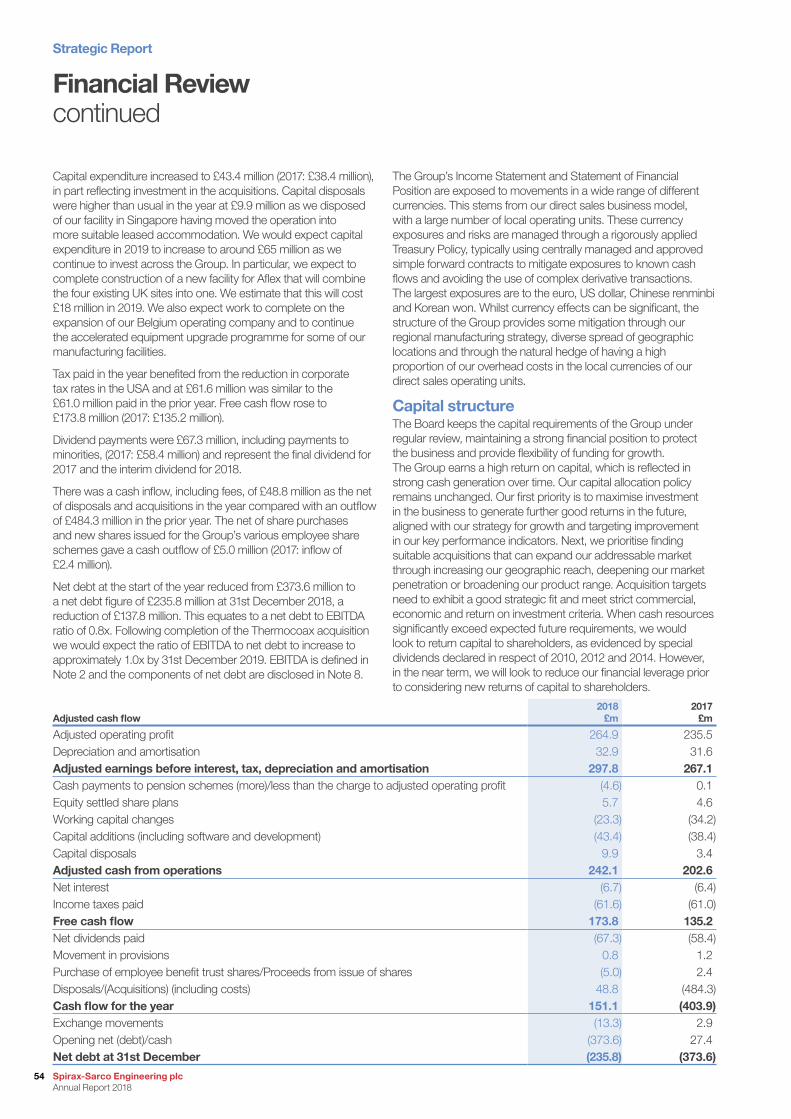
Capital expenditure increased to £43.4 million (2017: £38.4 million), in part reflecting investment in the acquisitions. Capital disposals were higher than usual in the year at £9.9 million as we disposed of our facility in Singapore having moved the operation into more suitable leased accommodation. We would expect capital expenditure in 2019 to increase to around £65 million as we continue to invest across the Group. In particular, we expect to complete construction of a new facility for Aflex that will combine the four existing UK sites into one. We estimate that this will cost £18 million in 2019. We also expect work to complete on the expansion of our Belgium operating company and to continue the accelerated equipment upgrade programme for some of our manufacturing facilities.
Tax paid in the year benefited from the reduction in corporate tax rates in the USA and at £61.6 million was similar to the £61.0 million paid in the prior year. Free cash flow rose to £173.8 million (2017: £135.2 million).
Dividend payments were £67.3 million, including payments to minorities, (2017: £58.4 million) and represent the final dividend for 2017 and the interim dividend for 2018.
There was a cash inflow, including fees, of £48.8 million as the net of disposals and acquisitions in the year compared with an outflow of £484.3 million in the prior year. The net of share purchases and new shares issued for the Group’s various employee share schemes gave a cash outflow of £5.0 million (2017: inflow of £2.4 million).
Net debt at the start of the year reduced from £373.6 million to a net debt figure of £235.8 million at 31st December 2018, a reduction of £137.8 million. This equates to a net debt to EBITDA ratio of 0.8x. Following completion of the Thermocoax acquisition we would expect the ratio of EBITDA to net debt to increase to approximately 1.0x by 31st December 2019. EBITDA is defined in Note 2 and the components of net debt are disclosed in Note 8.
The Group’s Income Statement and Statement of Financial Position are exposed to movements in a wide range of different currencies. This stems from our direct sales business model, with a large number of local operating units. These currency exposures and risks are managed through a rigorously applied Treasury Policy, typically using centrally managed and approved simple forward contracts to mitigate exposures to known cash flows and avoiding the use of complex derivative transactions. The largest exposures are to the euro, US dollar, Chinese renminbi and Korean won. Whilst currency effects can be significant, the structure of the Group provides some mitigation through our regional manufacturing strategy, diverse spread of geographic locations and through the natural hedge of having a high proportion of our overhead costs in the local currencies of our direct sales operating units.
Capital structureThe Board keeps the capital requirements of the Group under regular review, maintaining a strong financial position to protect the business and provide flexibility of funding for growth. The Group earns a high return on capital, which is reflected in strong cash generation over time. Our capital allocation policy remains unchanged. Our first priority is to maximise investment in the business to generate further good returns in the future, aligned with our strategy for growth and targeting improvement in our key performance indicators. Next, we prioritise finding suitable acquisitions that can expand our addressable market through increasing our geographic reach, deepening our market penetration or broadening our product range. Acquisition targets need to exhibit a good strategic fit and meet strict commercial, economic and return on investment criteria. When cash resources significantly exceed expected future requirements, we would look to return capital to shareholders, as evidenced by special dividends declared in respect of 2010, 2012 and 2014. However, in the near term, we will look to reduce our financial leverage prior to considering new returns of capital to shareholders.
Financial Reviewcontinued
Adjusted cash flow2018
£m2017
£m
Adjusted operating profit 264.9 235.5Depreciation and amortisation 32.9 31.6Adjusted earnings before interest, tax, depreciation and amortisation 297.8 267.1Cash payments to pension schemes (more)/less than the charge to adjusted operating profit (4.6) 0.1Equity settled share plans 5.7 4.6Working capital changes (23.3) (34.2)Capital additions (including software and development) (43.4) (38.4)Capital disposals 9.9 3.4Adjusted cash from operations 242.1 202.6Net interest (6.7) (6.4)Income taxes paid (61.6) (61.0)Free cash flow 173.8 135.2Net dividends paid (67.3) (58.4)Movement in provisions 0.8 1.2Purchase of employee benefit trust shares/Proceeds from issue of shares (5.0) 2.4Disposals/(Acquisitions) (including costs) 48.8 (484.3)Cash flow for the year 151.1 (403.9)Exchange movements (13.3) 2.9Opening net (debt)/cash (373.6) 27.4Net debt at 31st December (235.8) (373.6)
Strategic Report
Spirax-Sarco Engineering plc Annual Report 2018
54
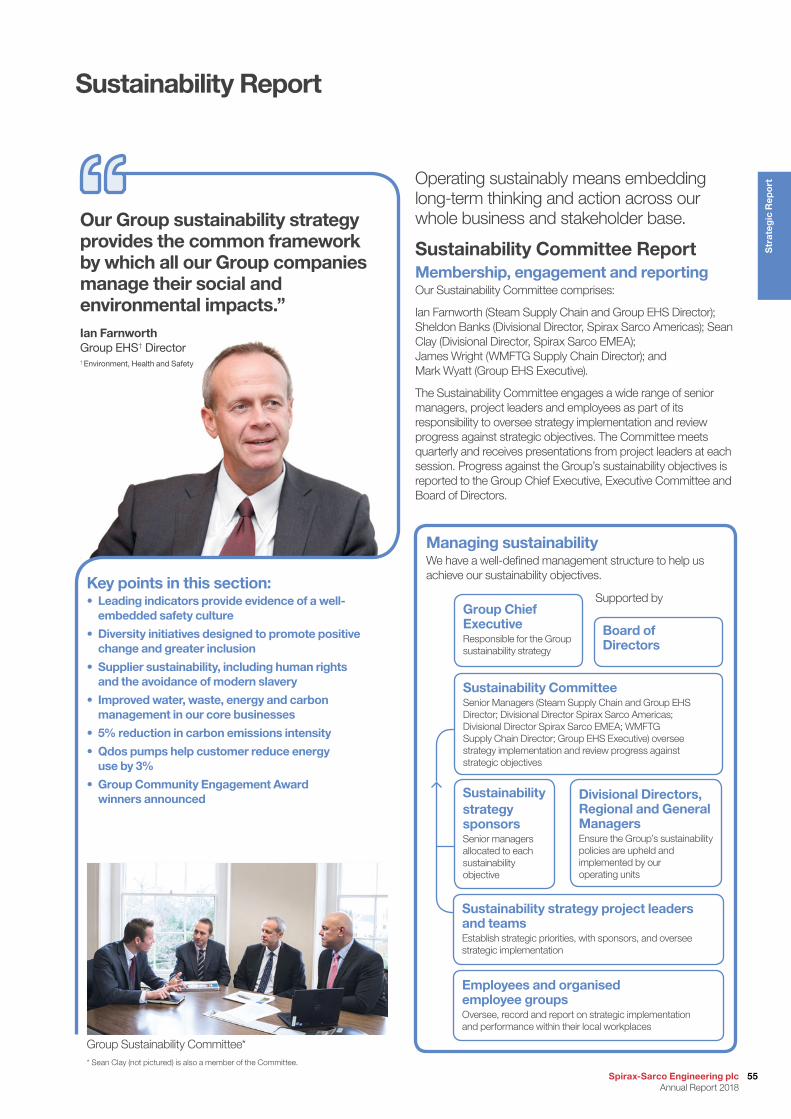
Managing sustainabilityWe have a well-defined management structure to help us achieve our sustainability objectives.
Sustainability Report
Operating sustainably means embedding long-term thinking and action across our whole business and stakeholder base.
Sustainability Committee ReportMembership, engagement and reportingOur Sustainability Committee comprises:
Ian Farnworth (Steam Supply Chain and Group EHS Director); Sheldon Banks (Divisional Director, Spirax Sarco Americas); Sean Clay (Divisional Director, Spirax Sarco EMEA); James Wright (WMFTG Supply Chain Director); and Mark Wyatt (Group EHS Executive).
The Sustainability Committee engages a wide range of senior managers, project leaders and employees as part of its responsibility to oversee strategy implementation and review progress against strategic objectives. The Committee meets quarterly and receives presentations from project leaders at each session. Progress against the Group’s sustainability objectives is reported to the Group Chief Executive, Executive Committee and Board of Directors.
Employees and organised employee groupsOversee, record and report on strategic implementation and performance within their local workplaces
Sustainability strategy sponsorsSenior managers allocated to each sustainability objective
Divisional Directors, Regional and General Managers Ensure the Group’s sustainability policies are upheld and implemented by our operating units
Supported by
Board of Directors
Group Chief ExecutiveResponsible for the Group sustainability strategy
Sustainability strategy project leaders and teamsEstablish strategic priorities, with sponsors, and oversee strategic implementation
Sustainability CommitteeSenior Managers (Steam Supply Chain and Group EHS Director; Divisional Director Spirax Sarco Americas; Divisional Director Spirax Sarco EMEA; WMFTG Supply Chain Director; Group EHS Executive) oversee strategy implementation and review progress against strategic objectives
Key points in this section:• Leading indicators provide evidence of a well-
embedded safety culture
• Diversity initiatives designed to promote positive change and greater inclusion
• Supplier sustainability, including human rights and the avoidance of modern slavery
• Improved water, waste, energy and carbon management in our core businesses
• 5% reduction in carbon emissions intensity
• Qdos pumps help customer reduce energy use by 3%
• Group Community Engagement Award winners announced
Our Group sustainability strategy provides the common framework by which all our Group companies manage their social and environmental impacts.”Ian FarnworthGroup EHS† Director† Environment, Health and Safety
Group Sustainability Committee** Sean Clay (not pictured) is also a member of the Committee.
55Spirax-Sarco Engineering plc Annual Report 2018
Str
ateg
ic R
epo
rt
Sustainability Reportcontinued
Further readingOperating sustainably is one of the Group’s strategic themes. Our overall sustainability vision and mission is set out in the Group strategy update.
See page 25
Spirax-Sarco Engineering plc is a constituent of the FTSE4Good UK Index
Progress in 2018As stated in last year’s Annual Report, our key priorities as a Group in 2018 were:
• to increase the number of employees completing sustainability training;
• to raise awareness in Gestra and Chromalox of our sustainability strategy; and
• to involve Gestra and Chromalox more actively in our sustainability strategy implementation.
We are pleased to report that we made progress in the above priorities during 2018. Towards the end of the year, we commenced the roll out of a new “Group essentials” training programme, which will be available across the Group in 16 languages. The programme entails e-learning modules on topics such as Sustainability, our Values, Health and Safety at Work, Driving Safety, and Anti-Bribery and Corruption. The programme utilises a combination of in-built and on-the-job assessments to review understanding and compliance. Completion of the programme will be a compulsory requirement for all employees.
During the year, Chromalox appointed Amy Broadie as Environmental, Health, Safety & Sustainability Director. Jens Höft, Gestra’s Human Resources Director, was allocated responsibility for the implementation of the sustainability strategy in Gestra.
Both businesses reported progress against Group and company-specific sustainability objectives and targets on a quarterly basis to the Sustainability Committee.
Focus for 2019During the year, the Sustainability Committee agreed to focus on the following key priorities for the Group in 2019:
• increase employees’ knowledge and understanding of sustainability across the Group, through the roll out of the “Group essentials” training programme;
• continued adoption and integration of Gestra and Chromalox into the Group’s sustainability programmes; and
• progress against the Group’s sustainability targets.
Non-financial information statementThis Annual Report contains the information required to comply with the Companies, Partnerships and Groups (and Non-Financial Reporting) Regulations 2016, as contained in sections 414CA and 414CB of the Companies Act 2006. The table below provides key references to information that, taken together, comprises the Non-Financial Information Statement for 2018.
Reporting requirement Group Policies that guide our approachInformation and risk management, with page references
Environmental matters – Group Environmental, Health, Safety, Energy and Sustainability Policy
– Group Management Code– Supplier Sustainability Code
Sustainability Report, pages 57, 62-64Realising our purpose, page 17Our business model, page 15Principal risks, page 33
Employees – Group Diversity and Inclusion Policy– Group Management Code– Group Human Rights Policy– Group Environmental, Health, Safety, Energy and
Sustainability Policy
Sustainability Report, pages 57, 58-60Our business model, page 15Principal risks, page 32-33
Social matters – Group Human Rights Policy– Group Charitable Donations Policy– Supplier Sustainability Code
Sustainability Report, pages 57, 61, 65Our business model, page 15Our strategy, page 24
Respect for human rights
– Group Human Rights Policy– Group Sanctions, Embargoes and Restrictions Policy– Supplier Sustainability Code
Sustainability Report, pages 57, 59, 61
Anti-corruption and anti-bribery matters
– Group Anti-Bribery and Corruption Policy– Group Gifts, Entertainment and Hospitality Policy– Group Competition Law Compliance Policy– Group Sanctions, Embargoes and Restrictions Policy– Group Whistle-Blowing Policy– Supplier Sustainability Code
Sustainability Report, pages 57, 60, 61Principal risks, page 32Risk Management Committee Report, page 87
Description of the business model Our business model, pages 12-15Description of the principal risks in relation to the above matters, including business relationships, products and services likely to affect those areas of risk, and how the company manages the risks
Risk management and principal risks, pages 28-33Risk Management Committee Report, pages 86-89
Non-financial key performance indicators Sustainability Report, pages 57-65Key Performance Indicators, page 27
Strategic Report
Spirax-Sarco Engineering plc Annual Report 2018
56
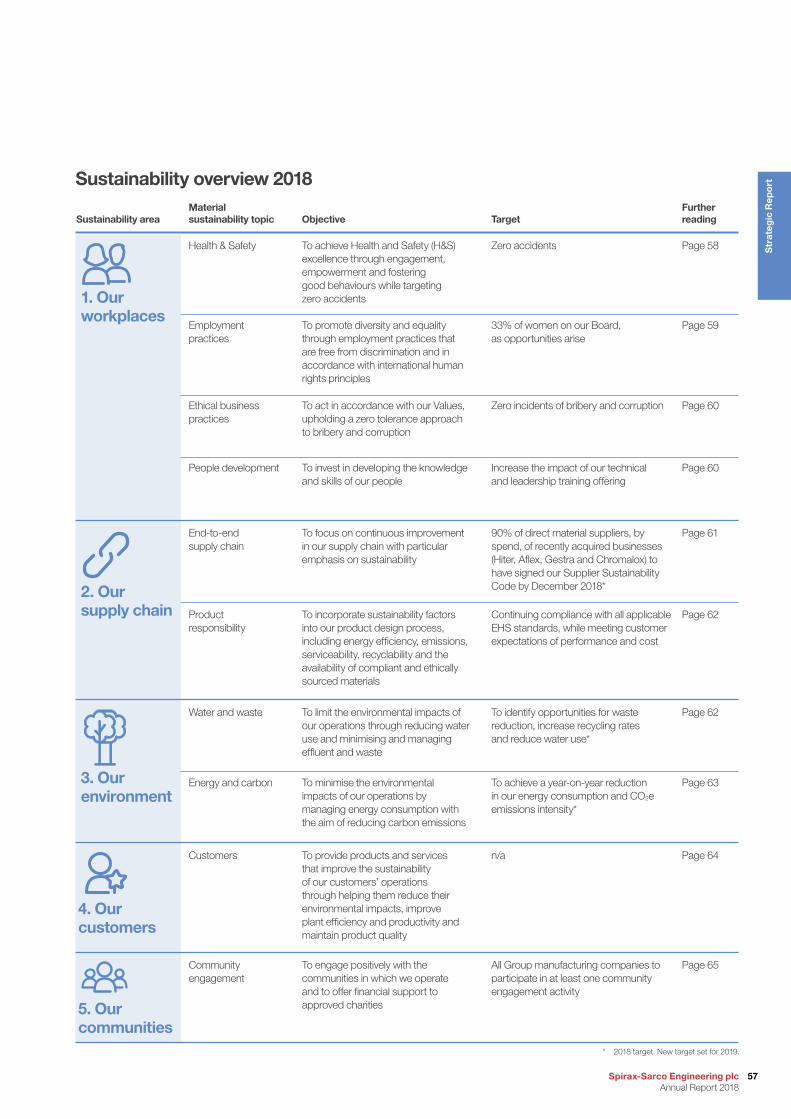
Sustainability overview 2018
Sustainability areaMaterial sustainability topic Objective Target
Further reading
1. Our workplaces
2. Our supply chain
Health & Safety To achieve Health and Safety (H&S) excellence through engagement, empowerment and fostering good behaviours while targeting zero accidents
Zero accidents Page 58
Employment practices
To promote diversity and equality through employment practices that are free from discrimination and in accordance with international human rights principles
33% of women on our Board, as opportunities arise
Page 59
Ethical business practices
To act in accordance with our Values, upholding a zero tolerance approach to bribery and corruption
Zero incidents of bribery and corruption Page 60
People development To invest in developing the knowledge and skills of our people
Increase the impact of our technical and leadership training offering
Page 60
End-to-end supply chain
To focus on continuous improvement in our supply chain with particular emphasis on sustainability
90% of direct material suppliers, by spend, of recently acquired businesses (Hiter, Aflex, Gestra and Chromalox) to have signed our Supplier Sustainability Code by December 2018*
Page 61
Product responsibility
To incorporate sustainability factors into our product design process, including energy efficiency, emissions, serviceability, recyclability and the availability of compliant and ethically sourced materials
Continuing compliance with all applicable EHS standards, while meeting customer expectations of performance and cost
Page 62
3. Our environment
Water and waste To limit the environmental impacts of our operations through reducing water use and minimising and managing effluent and waste
To identify opportunities for waste reduction, increase recycling rates and reduce water use*
Page 62
Energy and carbon To minimise the environmental impacts of our operations by managing energy consumption with the aim of reducing carbon emissions
To achieve a year-on-year reduction in our energy consumption and CO2e emissions intensity*
Page 63
4. Our customers
Customers To provide products and services that improve the sustainability of our customers’ operations through helping them reduce their environmental impacts, improve plant efficiency and productivity and maintain product quality
n/a Page 64
5. Our communities
Community engagement
To engage positively with the communities in which we operate and to offer financial support to approved charities
All Group manufacturing companies to participate in at least one community engagement activity
Page 65
* 2018 target. New target set for 2019.
57Spirax-Sarco Engineering plc Annual Report 2018
Str
ateg
ic R
epo
rt
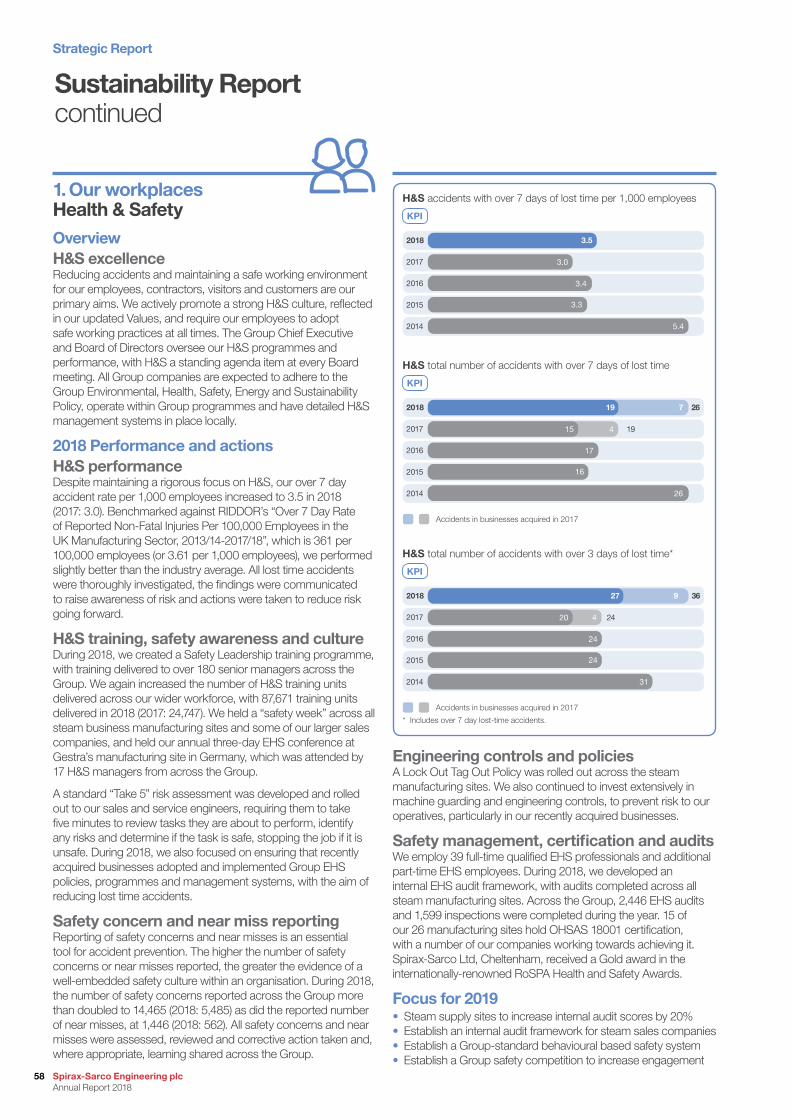
Sustainability Reportcontinued
OverviewH&S excellenceReducing accidents and maintaining a safe working environment for our employees, contractors, visitors and customers are our primary aims. We actively promote a strong H&S culture, reflected in our updated Values, and require our employees to adopt safe working practices at all times. The Group Chief Executive and Board of Directors oversee our H&S programmes and performance, with H&S a standing agenda item at every Board meeting. All Group companies are expected to adhere to the Group Environmental, Health, Safety, Energy and Sustainability Policy, operate within Group programmes and have detailed H&S management systems in place locally.
2018 Performance and actionsH&S performanceDespite maintaining a rigorous focus on H&S, our over 7 day accident rate per 1,000 employees increased to 3.5 in 2018 (2017: 3.0). Benchmarked against RIDDOR’s “Over 7 Day Rate of Reported Non-Fatal Injuries Per 100,000 Employees in the UK Manufacturing Sector, 2013/14-2017/18”, which is 361 per 100,000 employees (or 3.61 per 1,000 employees), we performed slightly better than the industry average. All lost time accidents were thoroughly investigated, the findings were communicated to raise awareness of risk and actions were taken to reduce risk going forward.
H&S training, safety awareness and cultureDuring 2018, we created a Safety Leadership training programme, with training delivered to over 180 senior managers across the Group. We again increased the number of H&S training units delivered across our wider workforce, with 87,671 training units delivered in 2018 (2017: 24,747). We held a “safety week” across all steam business manufacturing sites and some of our larger sales companies, and held our annual three-day EHS conference at Gestra’s manufacturing site in Germany, which was attended by 17 H&S managers from across the Group.
A standard “Take 5” risk assessment was developed and rolled out to our sales and service engineers, requiring them to take five minutes to review tasks they are about to perform, identify any risks and determine if the task is safe, stopping the job if it is unsafe. During 2018, we also focused on ensuring that recently acquired businesses adopted and implemented Group EHS policies, programmes and management systems, with the aim of reducing lost time accidents.
Safety concern and near miss reportingReporting of safety concerns and near misses is an essential tool for accident prevention. The higher the number of safety concerns or near misses reported, the greater the evidence of a well-embedded safety culture within an organisation. During 2018, the number of safety concerns reported across the Group more than doubled to 14,465 (2018: 5,485) as did the reported number of near misses, at 1,446 (2018: 562). All safety concerns and near misses were assessed, reviewed and corrective action taken and, where appropriate, learning shared across the Group.
1. Our workplaces Health & Safety
Engineering controls and policies A Lock Out Tag Out Policy was rolled out across the steam manufacturing sites. We also continued to invest extensively in machine guarding and engineering controls, to prevent risk to our operatives, particularly in our recently acquired businesses.
Safety management, certification and auditsWe employ 39 full-time qualified EHS professionals and additional part-time EHS employees. During 2018, we developed an internal EHS audit framework, with audits completed across all steam manufacturing sites. Across the Group, 2,446 EHS audits and 1,599 inspections were completed during the year. 15 of our 26 manufacturing sites hold OHSAS 18001 certification, with a number of our companies working towards achieving it. Spirax-Sarco Ltd, Cheltenham, received a Gold award in the internationally-renowned RoSPA Health and Safety Awards.
Focus for 2019• Steam supply sites to increase internal audit scores by 20%• Establish an internal audit framework for steam sales companies• Establish a Group-standard behavioural based safety system • Establish a Group safety competition to increase engagement
3.5
3.0
3.4
3.3
5.4
2018
2017
2016
2015
2014
KPI
H&S accidents with over 7 days of lost time per 1,000 employees
19 7
15 4 19
26
17
16
26
2018
2017
2016
2015
2014
Accidents in businesses acquired in 2017
KPI
H&S total number of accidents with over 7 days of lost time
27 9
20 4 24
36
24
24
31
2018
2017
2016
2015
2014
* Includes over 7 day lost-time accidents.
KPI
H&S total number of accidents with over 3 days of lost time*
Accidents in businesses acquired in 2017
Strategic Report
Spirax-Sarco Engineering plc Annual Report 2018
58
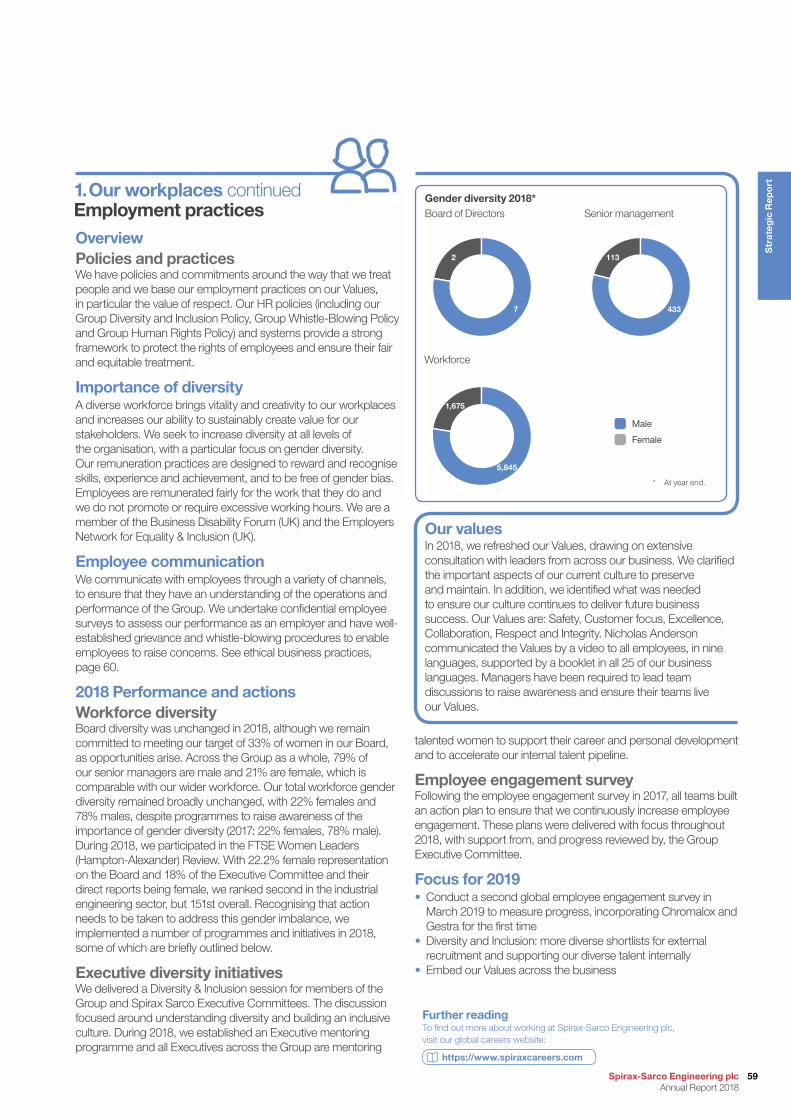
In 2018, we refreshed our Values, drawing on extensive consultation with leaders from across our business. We clarified the important aspects of our current culture to preserve and maintain. In addition, we identified what was needed to ensure our culture continues to deliver future business success. Our Values are: Safety, Customer focus, Excellence, Collaboration, Respect and Integrity. Nicholas Anderson communicated the Values by a video to all employees, in nine languages, supported by a booklet in all 25 of our business languages. Managers have been required to lead team discussions to raise awareness and ensure their teams live our Values.
OverviewPolicies and practicesWe have policies and commitments around the way that we treat people and we base our employment practices on our Values, in particular the value of respect. Our HR policies (including our Group Diversity and Inclusion Policy, Group Whistle-Blowing Policy and Group Human Rights Policy) and systems provide a strong framework to protect the rights of employees and ensure their fair and equitable treatment.
Importance of diversityA diverse workforce brings vitality and creativity to our workplaces and increases our ability to sustainably create value for our stakeholders. We seek to increase diversity at all levels of the organisation, with a particular focus on gender diversity. Our remuneration practices are designed to reward and recognise skills, experience and achievement, and to be free of gender bias. Employees are remunerated fairly for the work that they do and we do not promote or require excessive working hours. We are a member of the Business Disability Forum (UK) and the Employers Network for Equality & Inclusion (UK).
Employee communicationWe communicate with employees through a variety of channels, to ensure that they have an understanding of the operations and performance of the Group. We undertake confidential employee surveys to assess our performance as an employer and have well- established grievance and whistle-blowing procedures to enable employees to raise concerns. See ethical business practices, page 60.
2018 Performance and actionsWorkforce diversityBoard diversity was unchanged in 2018, although we remain committed to meeting our target of 33% of women in our Board, as opportunities arise. Across the Group as a whole, 79% of our senior managers are male and 21% are female, which is comparable with our wider workforce. Our total workforce gender diversity remained broadly unchanged, with 22% females and 78% males, despite programmes to raise awareness of the importance of gender diversity (2017: 22% females, 78% male). During 2018, we participated in the FTSE Women Leaders (Hampton-Alexander) Review. With 22.2% female representation on the Board and 18% of the Executive Committee and their direct reports being female, we ranked second in the industrial engineering sector, but 151st overall. Recognising that action needs to be taken to address this gender imbalance, we implemented a number of programmes and initiatives in 2018, some of which are briefly outlined below.
Executive diversity initiativesWe delivered a Diversity & Inclusion session for members of the Group and Spirax Sarco Executive Committees. The discussion focused around understanding diversity and building an inclusive culture. During 2018, we established an Executive mentoring programme and all Executives across the Group are mentoring
1. Our workplaces continued Employment practices
talented women to support their career and personal development and to accelerate our internal talent pipeline.
Employee engagement surveyFollowing the employee engagement survey in 2017, all teams built an action plan to ensure that we continuously increase employee engagement. These plans were delivered with focus throughout 2018, with support from, and progress reviewed by, the Group Executive Committee.
Focus for 2019• Conduct a second global employee engagement survey in
March 2019 to measure progress, incorporating Chromalox and Gestra for the first time
• Diversity and Inclusion: more diverse shortlists for external recruitment and supporting our diverse talent internally
• Embed our Values across the business
Gender diversity 2018* Board of Directors Senior management
Workforce
Our values
Male
Female
Further readingTo find out more about working at Spirax-Sarco Engineering plc, visit our global careers website:
https://www.spiraxcareers.com
7
2
5,845
1,675
433
113
* At year end.
59Spirax-Sarco Engineering plc Annual Report 2018
Str
ateg
ic R
epo
rt
Sustainability Reportcontinued
OverviewZero tolerance approachAs our Group expands in number of people, geographic reach and revenue, so does our commitment to ensuring that we have a strong culture of ethical behaviour across all our global operations.
2018 Performance and actionsRenewed Group ValuesOur Values serve as guiding principles across the Group to underpin decision-making, guide our conduct and define our culture. In 2018, we refreshed and communicated these Values across the Group to ensure that all employees globally understand their responsibilities for maintaining these Values, laying the foundation on which we will continue to build a successful, sustainable business.
Expanded and updated ABC trainingDuring 2018, we updated our anti-bribery and corruption (ABC) training, clearly communicating our expectations of the highest ethical standards and a zero tolerance approach to breaches of our ABC standards. The online training is part of our Group Essentials programme and is hosted on our internal Academy platform. It is available to all employees with an email address, increasing accessibility across the Group. ABC training has been made an annual requirement, increasing the frequency with which employees engage with the ABC message. In 2018, the updated ABC training was translated into five key languages, with an additional 11 languages to follow in 2019.
Over 1,300 employees completed ABC training using the new platform and nearly 500 employees completed either the original or refresher training. The new platform has enabled the Group to double the number of employees who have access to ABC training, compared with 2017. Compliance with the training, by Group company, is monitored via our internal audit function.
Whistle-blowingThe Group continues to make an independent, third-party whistle-blowing hotline, Safecall, available to all employees. Safecall provides local hotlines in all countries in which our Group companies are located, and each Group company posts information about Safecall in public areas on the premises. In 2018, Chromalox moved from its historic whistle-blowing hotline provider to Safecall and is now fully integrated into the Group whistle-blowing programme. In 2018, Safecall was contacted five times, with each report thoroughly investigated by a relevant management team member and, as appropriate, follow-up actions implemented. The Audit Committee reviewed post-action reports to ensure the management response was satisfactory.
Focus for 2019• Complete translations of the ABC course into 11
additional languages• Provide updated whistle-blowing materials to all
Group companies
OverviewSkills for sustainable growthDeveloping the knowledge and skills of our people is central to our strategy for growth and for the long-term sustainability of our business. All employees are actively encouraged to pursue professional development opportunities. As they strengthen their knowledge and skills we are better able to deliver value to our customers and generate shareholder value.
2018 Performance and actionsGraduate developmentHaving established our two-year Group Global Graduate Development Programme in 2017, we increased the number of graduates in 2018, adding a further 21 people (2017: 16). We now have graduates from Argentina, Canada, China, France, Germany, Italy, Mexico, Spain, the UK and USA. Recently acquired businesses, Gestra and Chromalox, engaged with the programme for the first time in 2018, ensuring that this is a Group-wide offering. Our graduates experience a wide diversity of development opportunities and help to replenish our global talent pipeline.
Leadership developmentDuring 2018, we enhanced our leadership development offering as we partnered with a specialist consultancy to design an innovative programme for talented leaders from across the Group. The year-long programme, “LEAP”, which includes two residential courses, on-going professional mentoring and regular webinars, is designed to accelerate the development of our current and future leaders, challenging them to drive change within their areas of responsibility. 38 managers, across two cohorts, joined the programme in 2018. In 2017, Watson-Marlow launched a global leadership programme called “ASPIRE”, which is focused on strengthening the deployment of strategy through effective leadership. 27 people attended the programme in 2018.
Senior management development16 senior managers attended external executive education programmes in 2018. Eight attended a two-week Advanced Management Programme, run by the Ashridge Business School, while others attended courses run by the London Business School, the Darden School of Business, the Centre for Creative Leadership and the Stanford Graduate School of Business, covering topics such as executing strategy and leading for organisational impact.
Technical developmentSee page 21 for information on technical training and an update on the Spirax Sarco Academy in 2018.
Focus for 2019• Expand our Graduate development efforts, focusing on career
development post-programme• Continue to expand our Leadership Development initiatives• Assess and develop our sales management capability
1. Our workplaces continued Ethical business practices
1. Our workplaces continued People development
Strategic Report
Spirax-Sarco Engineering plc Annual Report 2018
60
Further readingRead the Modern Slavery Statement in full or view our Supplier Sustainability Code on our website:
www.spiraxsarcoengineering.com/Sustainability/Pages/our- supply-chain.aspx
OverviewEnd-to-end sustainabilityImproving the sustainability of our end-to-end supply chain, which encompasses all the activities that transport and transform raw materials and components into finished products and delivers them to customers, is a key strategic objective for the Group.
Regional manufacturing strategyWe have 26 manufacturing sites globally. By manufacturing close to the point of sale we shorten lead times and deliver good customer service, ensure that products meet local specifications, reduce transportation requirements for finished goods and provide local employment in the regions in which we operate.
Supplier Sustainability Code of ConductOur Supplier Sustainability Code (Code) outlines the expectations that we have for suppliers and enables us to embed sustainability criteria into our purchasing processes. Amongst other requirements, suppliers must not use forced, bonded or non-voluntary labour; should establish recognised employment relationships, including non-discriminatory employment practices, maximum working hours, the freedom of association and clarity in relation to wages. Their facilities must be constructed and maintained to an acceptable standard and their activities safe for the health of their employees, contractors, the local community and users of their products. Suppliers must have a H&S policy and management system, and seek to prevent work-related injuries and illnesses through effective risk mitigation.
Suppliers must operate in accordance with law, conduct business free from bribery or corruption, and adhere to the UN Guiding Principles on Business and Human Rights and the Core Conventions of the International Labour Organisation. They must not use child labour, should take steps to mitigate environmental impacts, deliver a high quality of product and source responsibly.
2018 Performance and actionsCode roll out performanceIn 2016, we commenced the Phase 1 roll out of the Code to direct material suppliers of our Spirax Sarco and Watson-Marlow manufacturing companies, and in 2017 our Phase 2 roll out extended this to direct suppliers of our sales companies. By the end of 2018, 97% of Phase 1 and Phase 2 suppliers combined had signed the Code. During 2018, we exited eight suppliers that would not sign the Code or failed to meet our standards, and were not prepared to work with us to improve.
In 2018, we commenced the Phase 3 roll out of the Code to the manufacturing and sales company suppliers of recently acquired businesses Hiter, Aflex, Gestra and Chromalox. By the end of the year, a little over 50% of these suppliers had signed the Code. All Group businesses have adopted the requirement for the Code and are aligned with the Group supply chain sustainability agenda. Our 2019 target is for 84% of Phase 3 suppliers to have signed the Code.
There were no identified breaches of Human Rights or incidents of modern slavery in our supply chain in 2018.
2. Our supply chain End-to-end supply chain
Supply chain managementDuring 2018, we strengthened supply chain management, appointing a supplier development engineer in Spirax Sarco India and another in Spirax Sarco Mexico, with plans approved to expand our supplier auditing capabilities in Gestra.
We are utilising our Product Lifecycle Management (PLM) system to more effectively monitor supplier quality, enabling us to proactively work with suppliers to conduct root cause analysis of any quality issues and rectify problems quickly. Supplier quality has a key impact on the sustainability of our supply chain, with sub-standard castings either being rejected and returned to the supplier or requiring additional working on our sites, both of which contribute to additional energy use, as well as reducing manufacturing efficiency. Therefore, by improving supplier quality management, we are increasing supply chain sustainability.
Focus for 2019• Supplier Sustainability Code adoption by suppliers of recently
acquired businesses Aflex, Hiter, Gestra and Chromalox• Improve supplier quality performance
Modern Slavery StatementSpirax-Sarco Engineering plc prides itself on setting high standards for sustainable and ethical business practices in its operations worldwide. Included in those high standards is a commitment to respecting and protecting the human rights of all individuals and combating all forms of modern slavery or human trafficking in all parts of our business organisation, including our supply chain. We are continuously developing and improving our business practices and policies in line with that commitment. We support a strong, collective stand to identify, prevent and raise awareness of modern slavery and human trafficking practices in all parts of the world.
Supplier development case studyFollowing an audit, supplier development engineers from Spirax Sarco UK have been working with supplier Amtech Investment Castings (Amtech), based in India, on a continuous improvement basis. During 2018, Spirax Sarco and Amtech decided to work together in a joint Community Engagement project to support the Mother Teresa Ashram, located in Rajkot, Gujarat. The Ashram is home to 240 permanent residents: 60 children, many with severe physical or mental disabilities, and 180 elderly women. The Ashram also provides food and schooling to 40 children who live in a nearby slum. Employees from both companies visited the Ashram and identified the following urgent needs: bunk beds for the children’s dormitory, roof repairs in the women’s dormitory, repairs and painting of outside walls, repairs to the door and rain cover in the canteen. Spirax Sarco India agreed to purchase and supply the bunk beds, while Amtech provided paints, materials and labour for the repairs.
61Spirax-Sarco Engineering plc Annual Report 2018
Str
ateg
ic R
epo
rt
Sustainability Reportcontinued
OverviewManaging resources and wasteFresh water is a scarce resource in many parts of the world. Therefore, we aim to monitor and use water efficiently, control leakage, reduce effluent and help our customers to do the same. We also proactively manage and seek to reduce waste, utilising specialist contractors to responsibly handle and recycle waste, in line with safe Duty of Care best practice.
Our target is to reduce waste intensity by 10% and water intensity by 5% over the next three years.
2018 Performance and actionsWater useWe have increased water monitoring across our manufacturing sites, invested in additional water metering and deployed internet based water monitoring in the UK. Our Indian manufacturing site introduced flow controllers to limit supply and reduce waste water. Spirax Sarco USA undertook water reduction programmes, including the installation of drip irrigation, watering only on an “as needed” basis and improved landscaping. As a result, irrigation water was reduced by 80% in 2018, while maintaining an aesthetically pleasing landscape.
In 2018, our global operations used 211,540m3 of water (2017: 167,000m3). The increase is due to the inclusion of 2017 acquisitions, Gestra and Chromalox, and new operations established in 2017, which were included for the first time in 2018. On a like-for-like basis, water use in our Spirax Sarco Steam Specialties and Watson-Marlow businesses fell by 13% in 2018 as we focused on better monitoring and management of this important resource. On an intensity basis (m3 of water used per £m of inflation adjusted sales at constant currency), water use fell by 4% in 2018.
WasteDuring 2018, we increased office recycling facilities across the UK steam business and improved management of wood waste, reducing waste transport collections. Our Latin American companies focused on sourcing better waste contractors to improve measuring, reporting and recycling of waste. All sites have focused on improving the weighing and monitoring of waste, and improving waste management and recycling processes. As a result, we are able to report on our global waste generation for the first time. Globally, we generated 7.8 tonnes of waste per £m of sales in 2018.
Improving data qualityWe increased the number of third-party assurance reviews of our environmental data, conducting on-site data quality audits of waste and water across three additional sales and manufacturing sites in India and the UK, covering the Spirax Sarco Steam Specialties and Watson-Marlow businesses.
Focus for 2019• External data assurance audits at Gestra and Chromalox sites • Progress towards our 2021 water and waste reduction targets
OverviewProduct safety and integrityApplication and continuous improvement of our robust product development process enables us to maintain best practice in the areas of design for manufacture and reliability, eco-design, legislative compliance and validation. This ensures that our products are safe to use, contain ethically sourced materials, avoid hazardous substances and are environmentally sound throughout the lifecycle.
Our analysis, test and validation capability is second to none in providing the evidence to support all regulatory standards and compliance requirements, and provide our customers with safe, reliable and environmentally friendly products driven by our central policy and governance.
2018 Performance and actionsSupplier Sustainability Code linkagePro-active linking of Supplier Sustainability Code compliance to our Eco-Design Policy enables us to work closely with our suppliers during the design phase to prevent the use of hazardous substances, utilise ethically sourced materials and ensure that our new products are environmentally sound during all phases of design, manufacture, service and end of life recovery.
Eco-design standardisationCross collaboration within our Steam Specialties business on Research & Development functional best practice has enabled us to share and benefit from eco-design principles globally, as we work towards establishing a common approach to the application of eco-design methods during new product development.
Monitoring product qualityEnhanced global quality data, via improved data management systems, has increased the immediacy of feedback to the design process for field and production quality monitoring and provides direct insight into the stability, performance and lifecycle impact of our new designs in an environmental and sustainability context. Improved sustainable design maximises production efficiency and service life with minimum intervention, to lower energy costs and material waste throughout the product lifecycle.
REACH and RoHS management systemsDuring 2018, Chromalox implemented an advanced management system for REACH (Registration, Evaluation, Authorisation and Restriction of Chemical) and RoHS (Restriction of Hazardous Substances) compliance, increasing efficiency and improving the ease by which Chromalox can demonstrate compliance with these important product safety directives.
Focus for 2019• Consolidate our best-practice approach to product eco-design
methods and compliance across Group companies• Continue to monitor future legislation and standards via our
structured compliance processes to ensure we remain at the leading edge of product sustainability philosophy
3. Our environment Water and waste
2. Our supply chain continued Product responsibility
Strategic Report
Spirax-Sarco Engineering plc Annual Report 2018
62
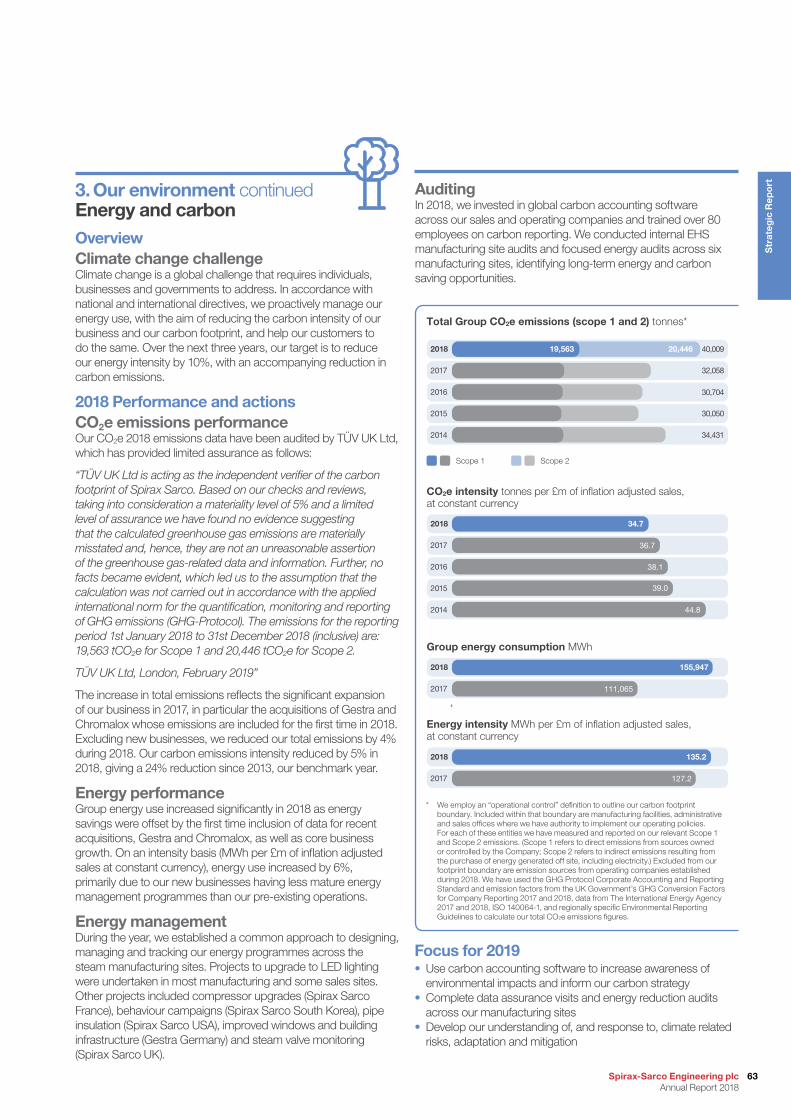
OverviewClimate change challengeClimate change is a global challenge that requires individuals, businesses and governments to address. In accordance with national and international directives, we proactively manage our energy use, with the aim of reducing the carbon intensity of our business and our carbon footprint, and help our customers to do the same. Over the next three years, our target is to reduce our energy intensity by 10%, with an accompanying reduction in carbon emissions.
2018 Performance and actionsCO2e emissions performanceOur CO2e 2018 emissions data have been audited by TÜV UK Ltd, which has provided limited assurance as follows:
“TÜV UK Ltd is acting as the independent verifier of the carbon footprint of Spirax Sarco. Based on our checks and reviews, taking into consideration a materiality level of 5% and a limited level of assurance we have found no evidence suggesting that the calculated greenhouse gas emissions are materially misstated and, hence, they are not an unreasonable assertion of the greenhouse gas-related data and information. Further, no facts became evident, which led us to the assumption that the calculation was not carried out in accordance with the applied international norm for the quantification, monitoring and reporting of GHG emissions (GHG-Protocol). The emissions for the reporting period 1st January 2018 to 31st December 2018 (inclusive) are: 19,563 tCO2e for Scope 1 and 20,446 tCO2e for Scope 2.
TÜV UK Ltd, London, February 2019”
The increase in total emissions reflects the significant expansion of our business in 2017, in particular the acquisitions of Gestra and Chromalox whose emissions are included for the first time in 2018. Excluding new businesses, we reduced our total emissions by 4% during 2018. Our carbon emissions intensity reduced by 5% in 2018, giving a 24% reduction since 2013, our benchmark year.
Energy performanceGroup energy use increased significantly in 2018 as energy savings were offset by the first time inclusion of data for recent acquisitions, Gestra and Chromalox, as well as core business growth. On an intensity basis (MWh per £m of inflation adjusted sales at constant currency), energy use increased by 6%, primarily due to our new businesses having less mature energy management programmes than our pre-existing operations.
Energy managementDuring the year, we established a common approach to designing, managing and tracking our energy programmes across the steam manufacturing sites. Projects to upgrade to LED lighting were undertaken in most manufacturing and some sales sites. Other projects included compressor upgrades (Spirax Sarco France), behaviour campaigns (Spirax Sarco South Korea), pipe insulation (Spirax Sarco USA), improved windows and building infrastructure (Gestra Germany) and steam valve monitoring (Spirax Sarco UK).
AuditingIn 2018, we invested in global carbon accounting software across our sales and operating companies and trained over 80 employees on carbon reporting. We conducted internal EHS manufacturing site audits and focused energy audits across six manufacturing sites, identifying long-term energy and carbon saving opportunities.
19,563 20,446 40,009
32,058
30,704
30,050
34,431
2018
2017
2016
2015
2014
Scope 1
Total Group CO2e emissions (scope 1 and 2) tonnes*
Scope 2
34.7
36.7
38.1
39.0
44.8
2018
2017
2016
2015
2014
CO2e intensity tonnes per £m of inflation adjusted sales, at constant currency
155,947
111,065
2018
2017
Group energy consumption MWh
135.2
127.2
2018
2017
Energy intensity MWh per £m of inflation adjusted sales, at constant currency
* We employ an “operational control” definition to outline our carbon footprint boundary. Included within that boundary are manufacturing facilities, administrative and sales offices where we have authority to implement our operating policies. For each of these entities we have measured and reported on our relevant Scope 1 and Scope 2 emissions. (Scope 1 refers to direct emissions from sources owned or controlled by the Company; Scope 2 refers to indirect emissions resulting from the purchase of energy generated off site, including electricity.) Excluded from our footprint boundary are emission sources from operating companies established during 2018. We have used the GHG Protocol Corporate Accounting and Reporting Standard and emission factors from the UK Government’s GHG Conversion Factors for Company Reporting 2017 and 2018, data from The International Energy Agency 2017 and 2018, ISO 140064-1, and regionally specific Environmental Reporting Guidelines to calculate our total CO2e emissions figures.
3. Our environment continued Energy and carbon
Focus for 2019• Use carbon accounting software to increase awareness of
environmental impacts and inform our carbon strategy• Complete data assurance visits and energy reduction audits
across our manufacturing sites• Develop our understanding of, and response to, climate related
risks, adaptation and mitigation
63Spirax-Sarco Engineering plc Annual Report 2018
Str
ateg
ic R
epo
rt
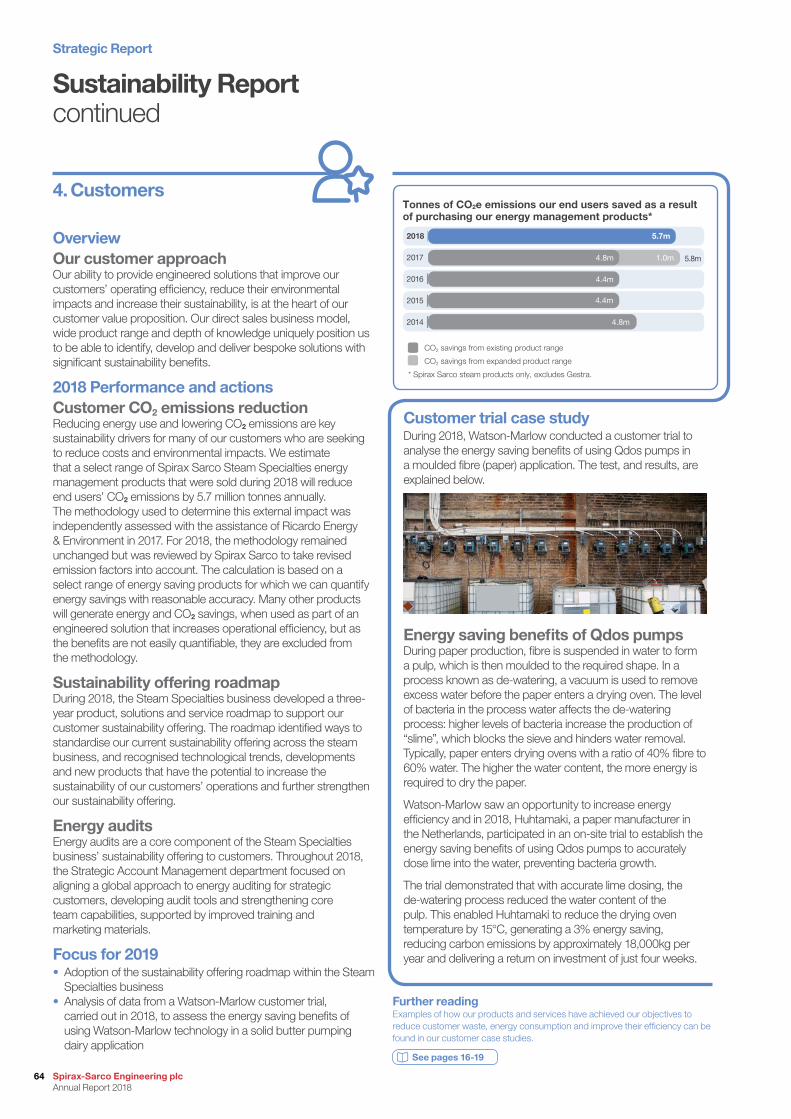
Sustainability Reportcontinued
5.7m
4.8m 1.0m 5.8m
4.4m
4.4m
4.8m
2018
2017
2016
2015
2014
CO2 savings from existing product range
CO2 savings from expanded product range
* Spirax Sarco steam products only, excludes Gestra.
Tonnes of CO2e emissions our end users saved as a result of purchasing our energy management products*
OverviewOur customer approachOur ability to provide engineered solutions that improve our customers’ operating efficiency, reduce their environmental impacts and increase their sustainability, is at the heart of our customer value proposition. Our direct sales business model, wide product range and depth of knowledge uniquely position us to be able to identify, develop and deliver bespoke solutions with significant sustainability benefits.
2018 Performance and actionsCustomer CO2 emissions reductionReducing energy use and lowering CO2 emissions are key sustainability drivers for many of our customers who are seeking to reduce costs and environmental impacts. We estimate that a select range of Spirax Sarco Steam Specialties energy management products that were sold during 2018 will reduce end users’ CO2 emissions by 5.7 million tonnes annually. The methodology used to determine this external impact was independently assessed with the assistance of Ricardo Energy & Environment in 2017. For 2018, the methodology remained unchanged but was reviewed by Spirax Sarco to take revised emission factors into account. The calculation is based on a select range of energy saving products for which we can quantify energy savings with reasonable accuracy. Many other products will generate energy and CO2 savings, when used as part of an engineered solution that increases operational efficiency, but as the benefits are not easily quantifiable, they are excluded from the methodology.
Sustainability offering roadmapDuring 2018, the Steam Specialties business developed a three-year product, solutions and service roadmap to support our customer sustainability offering. The roadmap identified ways to standardise our current sustainability offering across the steam business, and recognised technological trends, developments and new products that have the potential to increase the sustainability of our customers’ operations and further strengthen our sustainability offering.
Energy auditsEnergy audits are a core component of the Steam Specialties business’ sustainability offering to customers. Throughout 2018, the Strategic Account Management department focused on aligning a global approach to energy auditing for strategic customers, developing audit tools and strengthening core team capabilities, supported by improved training and marketing materials.
Focus for 2019• Adoption of the sustainability offering roadmap within the Steam
Specialties business• Analysis of data from a Watson-Marlow customer trial,
carried out in 2018, to assess the energy saving benefits of using Watson-Marlow technology in a solid butter pumping dairy application
4. Customers
Further readingExamples of how our products and services have achieved our objectives to reduce customer waste, energy consumption and improve their efficiency can be found in our customer case studies.
See pages 16-19
Customer trial case studyDuring 2018, Watson-Marlow conducted a customer trial to analyse the energy saving benefits of using Qdos pumps in a moulded fibre (paper) application. The test, and results, are explained below.
Energy saving benefits of Qdos pumpsDuring paper production, fibre is suspended in water to form a pulp, which is then moulded to the required shape. In a process known as de-watering, a vacuum is used to remove excess water before the paper enters a drying oven. The level of bacteria in the process water affects the de-watering process: higher levels of bacteria increase the production of “slime”, which blocks the sieve and hinders water removal. Typically, paper enters drying ovens with a ratio of 40% fibre to 60% water. The higher the water content, the more energy is required to dry the paper.
Watson-Marlow saw an opportunity to increase energy efficiency and in 2018, Huhtamaki, a paper manufacturer in the Netherlands, participated in an on-site trial to establish the energy saving benefits of using Qdos pumps to accurately dose lime into the water, preventing bacteria growth.
The trial demonstrated that with accurate lime dosing, the de-watering process reduced the water content of the pulp. This enabled Huhtamaki to reduce the drying oven temperature by 15°C, generating a 3% energy saving, reducing carbon emissions by approximately 18,000kg per year and delivering a return on investment of just four weeks.
Strategic Report
Spirax-Sarco Engineering plc Annual Report 2018
64
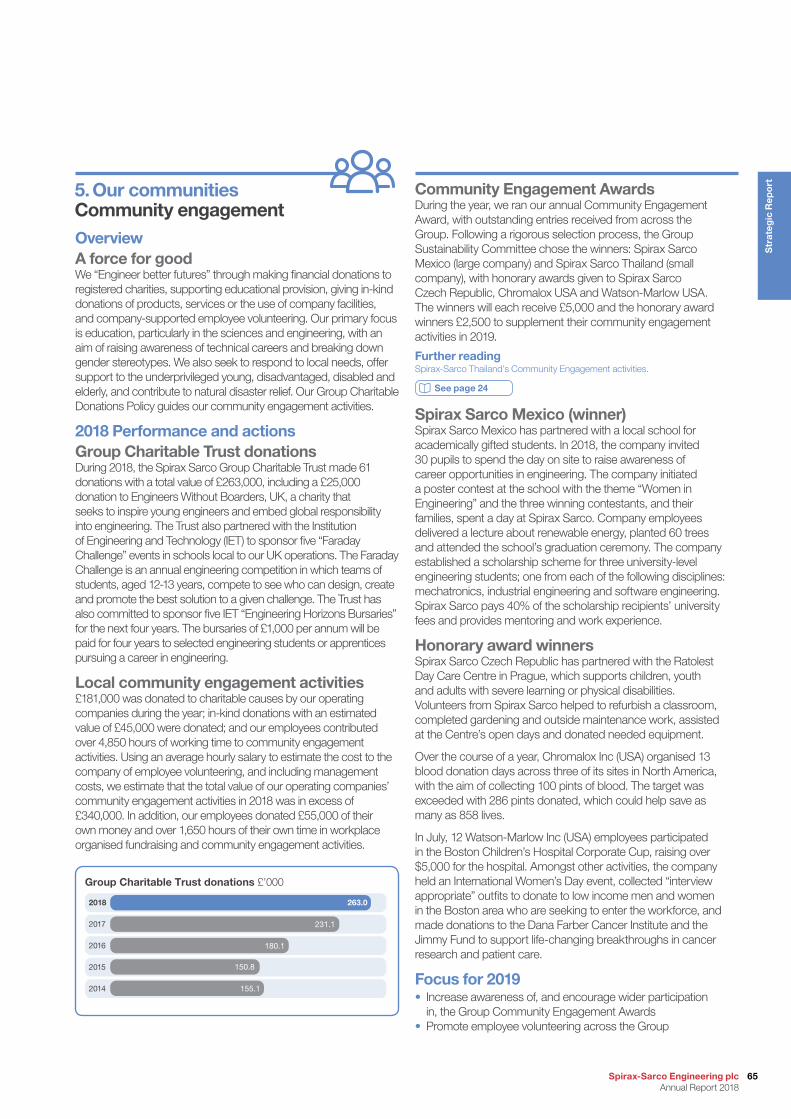
OverviewA force for goodWe “Engineer better futures” through making financial donations to registered charities, supporting educational provision, giving in-kind donations of products, services or the use of company facilities, and company-supported employee volunteering. Our primary focus is education, particularly in the sciences and engineering, with an aim of raising awareness of technical careers and breaking down gender stereotypes. We also seek to respond to local needs, offer support to the underprivileged young, disadvantaged, disabled and elderly, and contribute to natural disaster relief. Our Group Charitable Donations Policy guides our community engagement activities.
2018 Performance and actionsGroup Charitable Trust donationsDuring 2018, the Spirax Sarco Group Charitable Trust made 61 donations with a total value of £263,000, including a £25,000 donation to Engineers Without Boarders, UK, a charity that seeks to inspire young engineers and embed global responsibility into engineering. The Trust also partnered with the Institution of Engineering and Technology (IET) to sponsor five “Faraday Challenge” events in schools local to our UK operations. The Faraday Challenge is an annual engineering competition in which teams of students, aged 12-13 years, compete to see who can design, create and promote the best solution to a given challenge. The Trust has also committed to sponsor five IET “Engineering Horizons Bursaries” for the next four years. The bursaries of £1,000 per annum will be paid for four years to selected engineering students or apprentices pursuing a career in engineering.
Local community engagement activities£181,000 was donated to charitable causes by our operating companies during the year; in-kind donations with an estimated value of £45,000 were donated; and our employees contributed over 4,850 hours of working time to community engagement activities. Using an average hourly salary to estimate the cost to the company of employee volunteering, and including management costs, we estimate that the total value of our operating companies’ community engagement activities in 2018 was in excess of £340,000. In addition, our employees donated £55,000 of their own money and over 1,650 hours of their own time in workplace organised fundraising and community engagement activities.
5. Our communities Community engagement
263.0
231.1
180.1
150.8
155.1
2018
2017
2016
2015
2014
Group Charitable Trust donations £’000
Community Engagement AwardsDuring the year, we ran our annual Community Engagement Award, with outstanding entries received from across the Group. Following a rigorous selection process, the Group Sustainability Committee chose the winners: Spirax Sarco Mexico (large company) and Spirax Sarco Thailand (small company), with honorary awards given to Spirax Sarco Czech Republic, Chromalox USA and Watson-Marlow USA. The winners will each receive £5,000 and the honorary award winners £2,500 to supplement their community engagement activities in 2019.
Further readingSpirax-Sarco Thailand’s Community Engagement activities.
See page 24
Spirax Sarco Mexico (winner)Spirax Sarco Mexico has partnered with a local school for academically gifted students. In 2018, the company invited 30 pupils to spend the day on site to raise awareness of career opportunities in engineering. The company initiated a poster contest at the school with the theme “Women in Engineering” and the three winning contestants, and their families, spent a day at Spirax Sarco. Company employees delivered a lecture about renewable energy, planted 60 trees and attended the school’s graduation ceremony. The company established a scholarship scheme for three university-level engineering students; one from each of the following disciplines: mechatronics, industrial engineering and software engineering. Spirax Sarco pays 40% of the scholarship recipients’ university fees and provides mentoring and work experience.
Honorary award winnersSpirax Sarco Czech Republic has partnered with the Ratolest Day Care Centre in Prague, which supports children, youth and adults with severe learning or physical disabilities. Volunteers from Spirax Sarco helped to refurbish a classroom, completed gardening and outside maintenance work, assisted at the Centre’s open days and donated needed equipment.
Over the course of a year, Chromalox Inc (USA) organised 13 blood donation days across three of its sites in North America, with the aim of collecting 100 pints of blood. The target was exceeded with 286 pints donated, which could help save as many as 858 lives.
In July, 12 Watson-Marlow Inc (USA) employees participated in the Boston Children’s Hospital Corporate Cup, raising over $5,000 for the hospital. Amongst other activities, the company held an International Women’s Day event, collected “interview appropriate” outfits to donate to low income men and women in the Boston area who are seeking to enter the workforce, and made donations to the Dana Farber Cancer Institute and the Jimmy Fund to support life-changing breakthroughs in cancer research and patient care.
Focus for 2019• Increase awareness of, and encourage wider participation
in, the Group Community Engagement Awards• Promote employee volunteering across the Group
65Spirax-Sarco Engineering plc Annual Report 2018
Str
ateg
ic R
epo
rt
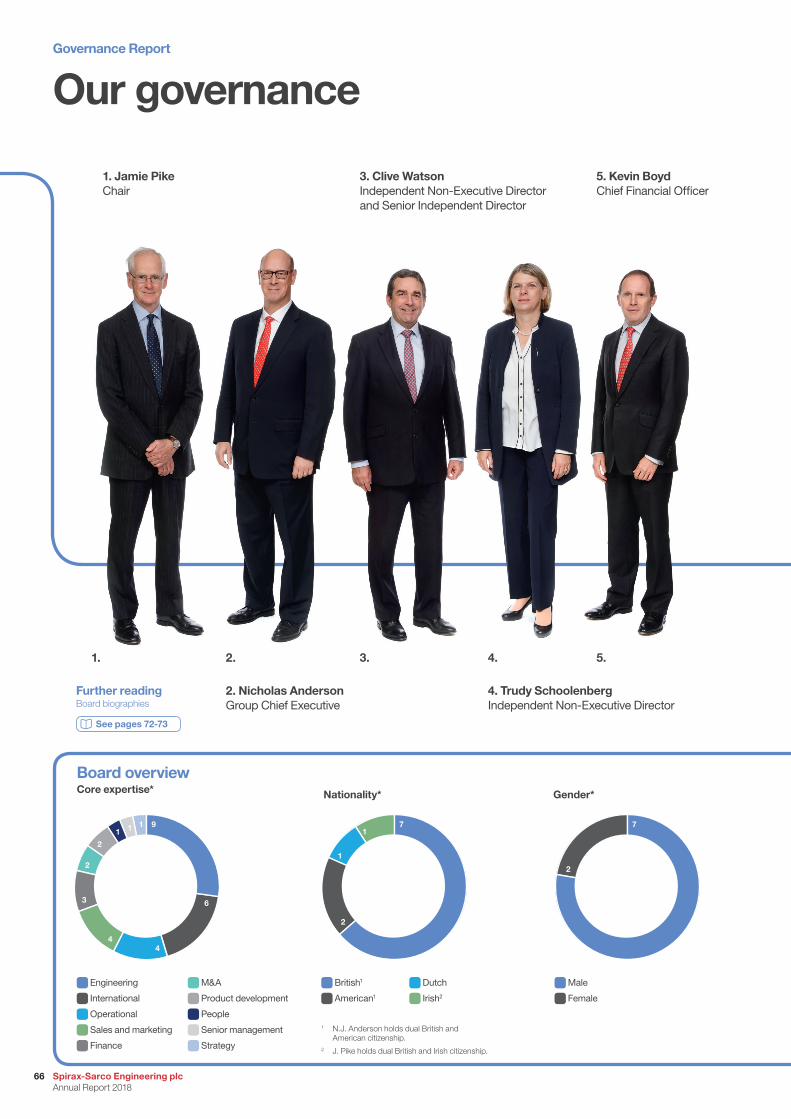
Core expertise* Nationality* Gender*
Our governance
1 N.J. Anderson holds dual British and American citizenship.
2 J. Pike holds dual British and Irish citizenship.
9
6
2
2
44
3
111 7
2
1
17
2
2. Nicholas AndersonGroup Chief Executive
2.
4. Trudy SchoolenbergIndependent Non-Executive Director
4.
1. Jamie PikeChair
1.
5. Kevin BoydChief Financial Officer
5.
3. Clive WatsonIndependent Non-Executive Director and Senior Independent Director
3.
Further readingBoard biographies
See pages 72-73
Board overview
Engineering
International
Operational
Sales and marketing
Finance
M&A
Product development
People
Senior management
Strategy
British1
American1
Dutch
Irish2
Male
Female
Governance Report
Spirax-Sarco Engineering plc Annual Report 2018
66
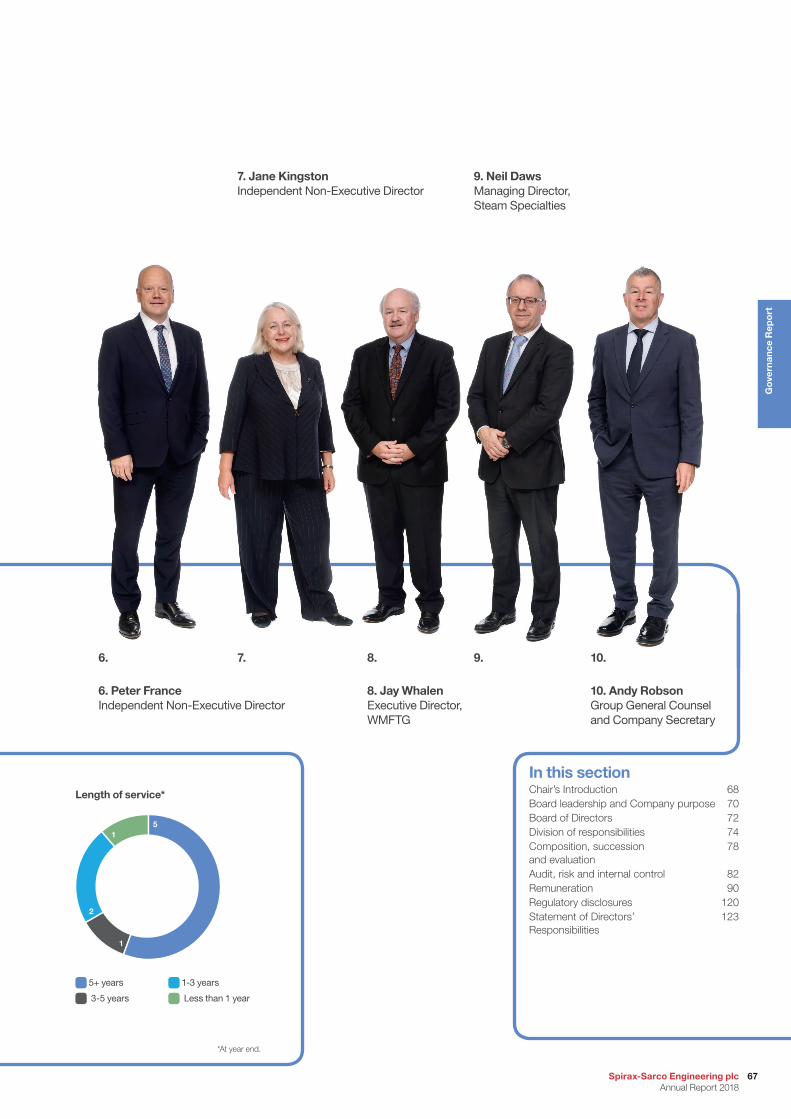
In this sectionChair’s Introduction 68Board leadership and Company purpose 70Board of Directors 72Division of responsibilities 74Composition, succession 78 and evaluation Audit, risk and internal control 82Remuneration 90Regulatory disclosures 120Statement of Directors’ 123 Responsibilities
10. Andy RobsonGroup General Counsel and Company Secretary
10.
7. Jane KingstonIndependent Non-Executive Director
7.
9. Neil DawsManaging Director, Steam Specialties
9.
8. Jay WhalenExecutive Director, WMFTG
8.
6. Peter FranceIndependent Non-Executive Director
6.
Length of service*
5
1
2
1
5+ years
3-5 years 1-3 years
Less than 1 year
*At year end.
67Spirax-Sarco Engineering plc Annual Report 2018
Go
vern
ance
Rep
ort

2016 Code complianceIn running our business in 2018, we were fully compliant with the UK Corporate Governance Code 2016 (Code) and we detail our compliance, on a Code provision-by-provision basis, in the Governance section on our website: www.spiraxsarcoengineering.com.
Section 172The Directors have performed their duty under section 172 of the Companies Act 2006 (duty to promote the success of the Company). The information that fulfils the requirements of the Strategic Report can be found on pages 1 to 65. Details of the Group’s goals, strategy and business model are on pages 12 to 25. The information that fulfils the requirements of the Governance Report can be found on pages 66 to 123.
Fair, balanced and understandableIn accordance with the Code, the Directors confirm that they consider the Annual Report, taken as a whole, is fair, balanced and understandable and provides the information necessary for shareholders to assess the Group’s performance, business model and strategy.
Chair’s IntroductionA collective responsibility for preserving long-term value
An updated BoardFollowing the announcement of Bill Whiteley’s intention to retire as Chair in May 2018, the Board’s succession plan moved into action. In March 2018, we welcomed Peter France as a new Independent Non-Executive Director, I was appointed Chair from the close of the AGM in May 2018 and Clive Watson became our Senior Independent Director. On 1st March 2019, we announced the appointment of Caroline Johnstone as an Independent Non-Executive Director. Caroline’s financial, people and advisory skills, together with her international business experience across a range of different industries, will be of benefit to the further development of the Group. Clive will retire at the 2019 AGM, as this is the AGM following his ninth year as a Director, and a separate announcement will be made regarding the new Senior Independent Director and the new Chair of the Audit Committee.
Board biographies can be found on pages 72 to 73.
An updated CodeIn July 2018, the UK Corporate Governance Code 2018 (2018 Code) was released which puts the relationships between companies, shareholders and stakeholders at the heart of long-term sustainable growth in the UK economy. We fully support the shorter, sharper 2018 Code and we have embraced its changes in the following ways:
• workforce and stakeholders: we are currently exploring the most effective methods to achieve greater Board engagement with the workforce to understand their views;
• culture: we have reviewed our values to create a culture which aligns Company Values with strategy and to ensure that our Board has the right mix of skills and experience, constructive challenge and to promote diversity; we have emphasised these elements in our Board refreshment and succession planning; and
• remuneration: the 2018 Code emphasises that the Remuneration Committee should take into account workforce remuneration and related policies when setting Director remuneration, which we already address and will strengthen throughout 2019.
An enlarged FTSE 100 companyOur business has continued to grow organically and increase in size with the acquisitions of Gestra and Chromalox in 2017. We have successfully integrated and driven performance improvement in our acquisitions. We are pleased to have entered the FTSE 100 in December 2018, as this symbolises a recognition by investors of the significant value creation delivered by the hard work of the entire organisation.
An opportunity to reflectRecent Board changes and the publication of the 2018 Code provided the opportunity to reaffirm our individual and collective responsibilities as a Board and to test our understanding of what good governance means to us and why it is important.
Further readingAll governance-related policies and procedures are available to view and download:
www.spiraxsarcoengineering.com/Governance/Pages/policies-procedures.aspx
We welcome the publication of the 2018 Corporate Governance Code, which reinforces the importance of diversity, long-term thinking and stakeholder engagement. In preparation to report fully against the new Code next year, we have structured this year’s Governance Report against the new Principles, while remaining in compliance with the prevailing Code.”Jamie PikeChair
Governance Report
Spirax-Sarco Engineering plc Annual Report 2018
68
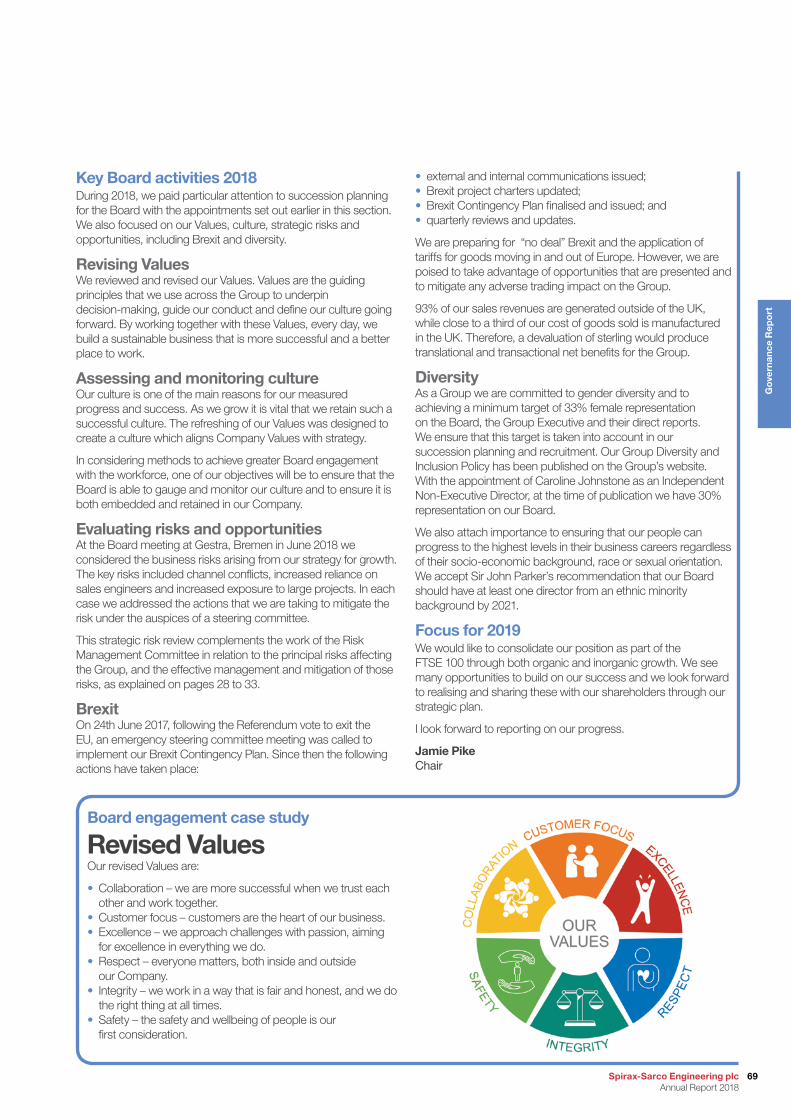
Key Board activities 2018 During 2018, we paid particular attention to succession planning for the Board with the appointments set out earlier in this section. We also focused on our Values, culture, strategic risks and opportunities, including Brexit and diversity.
Revising ValuesWe reviewed and revised our Values. Values are the guiding principles that we use across the Group to underpin decision-making, guide our conduct and define our culture going forward. By working together with these Values, every day, we build a sustainable business that is more successful and a better place to work.
Assessing and monitoring cultureOur culture is one of the main reasons for our measured progress and success. As we grow it is vital that we retain such a successful culture. The refreshing of our Values was designed to create a culture which aligns Company Values with strategy.
In considering methods to achieve greater Board engagement with the workforce, one of our objectives will be to ensure that the Board is able to gauge and monitor our culture and to ensure it is both embedded and retained in our Company.
Evaluating risks and opportunitiesAt the Board meeting at Gestra, Bremen in June 2018 we considered the business risks arising from our strategy for growth. The key risks included channel conflicts, increased reliance on sales engineers and increased exposure to large projects. In each case we addressed the actions that we are taking to mitigate the risk under the auspices of a steering committee.
This strategic risk review complements the work of the Risk Management Committee in relation to the principal risks affecting the Group, and the effective management and mitigation of those risks, as explained on pages 28 to 33.
BrexitOn 24th June 2017, following the Referendum vote to exit the EU, an emergency steering committee meeting was called to implement our Brexit Contingency Plan. Since then the following actions have taken place:
• external and internal communications issued;• Brexit project charters updated;• Brexit Contingency Plan finalised and issued; and• quarterly reviews and updates.
We are preparing for “no deal” Brexit and the application of tariffs for goods moving in and out of Europe. However, we are poised to take advantage of opportunities that are presented and to mitigate any adverse trading impact on the Group.
93% of our sales revenues are generated outside of the UK, while close to a third of our cost of goods sold is manufactured in the UK. Therefore, a devaluation of sterling would produce translational and transactional net benefits for the Group.
DiversityAs a Group we are committed to gender diversity and to achieving a minimum target of 33% female representation on the Board, the Group Executive and their direct reports. We ensure that this target is taken into account in our succession planning and recruitment. Our Group Diversity and Inclusion Policy has been published on the Group’s website. With the appointment of Caroline Johnstone as an Independent Non-Executive Director, at the time of publication we have 30% representation on our Board.
We also attach importance to ensuring that our people can progress to the highest levels in their business careers regardless of their socio-economic background, race or sexual orientation. We accept Sir John Parker’s recommendation that our Board should have at least one director from an ethnic minority background by 2021.
Focus for 2019We would like to consolidate our position as part of the FTSE 100 through both organic and inorganic growth. We see many opportunities to build on our success and we look forward to realising and sharing these with our shareholders through our strategic plan.
I look forward to reporting on our progress.
Jamie PikeChair
Our revised Values are:
• Collaboration – we are more successful when we trust each other and work together.
• Customer focus – customers are the heart of our business. • Excellence – we approach challenges with passion, aiming
for excellence in everything we do. • Respect – everyone matters, both inside and outside
our Company.• Integrity – we work in a way that is fair and honest, and we do
the right thing at all times.• Safety – the safety and wellbeing of people is our
first consideration.
Board engagement case study
Revised Values
69Spirax-Sarco Engineering plc Annual Report 2018
Go
vern
ance
Rep
ort
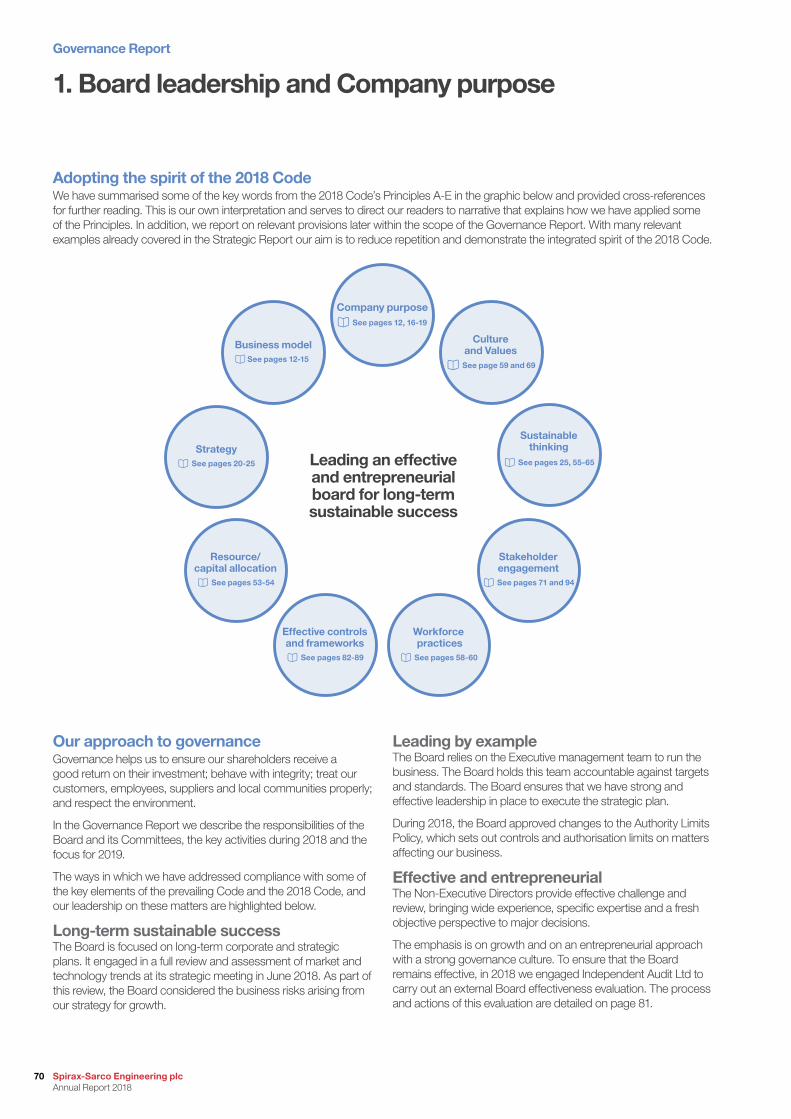
1. Board leadership and Company purpose
Our approach to governanceGovernance helps us to ensure our shareholders receive a good return on their investment; behave with integrity; treat our customers, employees, suppliers and local communities properly; and respect the environment.
In the Governance Report we describe the responsibilities of the Board and its Committees, the key activities during 2018 and the focus for 2019.
The ways in which we have addressed compliance with some of the key elements of the prevailing Code and the 2018 Code, and our leadership on these matters are highlighted below.
Long-term sustainable successThe Board is focused on long-term corporate and strategic plans. It engaged in a full review and assessment of market and technology trends at its strategic meeting in June 2018. As part of this review, the Board considered the business risks arising from our strategy for growth.
Leading by exampleThe Board relies on the Executive management team to run the business. The Board holds this team accountable against targets and standards. The Board ensures that we have strong and effective leadership in place to execute the strategic plan.
During 2018, the Board approved changes to the Authority Limits Policy, which sets out controls and authorisation limits on matters affecting our business.
Effective and entrepreneurialThe Non-Executive Directors provide effective challenge and review, bringing wide experience, specific expertise and a fresh objective perspective to major decisions.
The emphasis is on growth and on an entrepreneurial approach with a strong governance culture. To ensure that the Board remains effective, in 2018 we engaged Independent Audit Ltd to carry out an external Board effectiveness evaluation. The process and actions of this evaluation are detailed on page 81.
Leading an effective and entrepreneurial board for long-term sustainable success
Workforce practices
Business model See pages 12-15
Effective controls and frameworks
See pages 82-89 See pages 58-60
Culture and Values
Company purpose
See pages 12, 16-19
See page 59 and 69
Strategy See pages 20-25
Resource/ capital allocation
See pages 53-54
Sustainable thinking
See pages 25, 55-65
Stakeholder engagement
See pages 71 and 94
Adopting the spirit of the 2018 CodeWe have summarised some of the key words from the 2018 Code’s Principles A-E in the graphic below and provided cross-references for further reading. This is our own interpretation and serves to direct our readers to narrative that explains how we have applied some of the Principles. In addition, we report on relevant provisions later within the scope of the Governance Report. With many relevant examples already covered in the Strategic Report our aim is to reduce repetition and demonstrate the integrated spirit of the 2018 Code.
Governance Report
Spirax-Sarco Engineering plc Annual Report 2018
70

Using stakeholder views to shape decision-makingIn 2018, the Remuneration Committee, under the leadership of Jane Kingston, engaged in a shareholder consultation with 17 of our top shareholders representing over 50% of our total shareholding. This was a comprehensive exercise which resulted in helpful and constructive advice from our shareholders and proxy advisers (ISS, The Investment Association and Glass Lewis) to help shape both our 2019 Executive remuneration proposals, explained in Jane Kingston’s Statement on pages 91 to 92, and our new Remuneration Policy for 2020.
A clear understanding of shareholder viewsOur Chair ensures that the Board, as a whole, has a clear understanding of our shareholder views. He achieves this by seeking regular engagement with major shareholders outside formal general meetings to discuss their views on governance and our performance against strategy. We also encourage Committee Chairs to talk to shareholders on significant matters related to their areas of expertise.
Employee whistle-blowingThe Group is committed to promoting a safe and effective culture in which employees can raise genuine concerns without fear of reprisals. To this end, and as a matter of best practice, in 2014 the Group adopted a Whistle-blowing Policy. Linked to this was the implementation of a multi-lingual whistle-blowing helpline, facilitated by Safecall, to ensure that employees can freely access an independent third party. The whistle-blowing helpline continues to be made available throughout the Group and in 2018, five calls were received from individuals. Each matter was thoroughly investigated by a relevant management team member and follow-up actions implemented, where required.
During 2018, management’s response and handling of reported cases continues to be considered appropriate and satisfactory.
Both the Board and the Audit Committee are involved in the regular review of whistle-blowing cases.
Identifying and managing conflicts of interestOur Board has a Conflicts of Interest Policy and has put in place procedures for the disclosure and review of any potential or actual conflicts. During 2018, no conflicts of interest were raised either in relation to shareholders or in dealings with external consultants, suppliers, etc.
Further readingDetails on how we engage with our shareholders, specifically in relation to remuneration.
See page 94
Engaging with employees
In 2017, we introduced a global employee engagement survey to capture feedback from employees to ensure we have an open dialogue about their experience of working for the Group. Employees gave detailed feedback on their engagement with the business, views of senior leadership and manager capability. As a direct result of this engagement process, we have implemented action plans across all Group companies. Survey results and action plans were shared with the Group Executive Committee and the Board on a six-monthly basis to track and monitor progress.
In 2019, the survey will be expanded to include Chromalox and Gestra. We have built on the process to encourage greater participation of all employees and enhance our Values and culture. The results will be reviewed by the Board in June 2019 and will provide a basis for conversations with teams across the Group to improve engagement and involve employees in creating a better place to work.
The Board has also been closely involved in the development of a Diversity and Inclusion Policy, which includes the mentoring of talented women to encourage recruitment and retention of women at an executive level in the Group. The Board was also involved in the evolution of our Values. The Policy and our updated Values have been communicated to all employees.
As illustrated by the Board’s visit in June 2018 to Gestra in Bremen (see page 77) the Board visits our Group companies across the world and Directors take time to meet employees and hear their views. The Board are actively engaged in assessing further opportunities to increase employee participation across a complex, global company in line with the UK Corporate Governance Code.
In addition to the engagement survey and direct face-to-face meetings between Board Directors and employees, during 2019 we will also comply with the Code requirements by introducing more forums for employee participation with the Board, which reflect our global diversity.
Further readingSustainability Report.
See page 59
71Spirax-Sarco Engineering plc Annual Report 2018
Go
vern
ance
Rep
ort
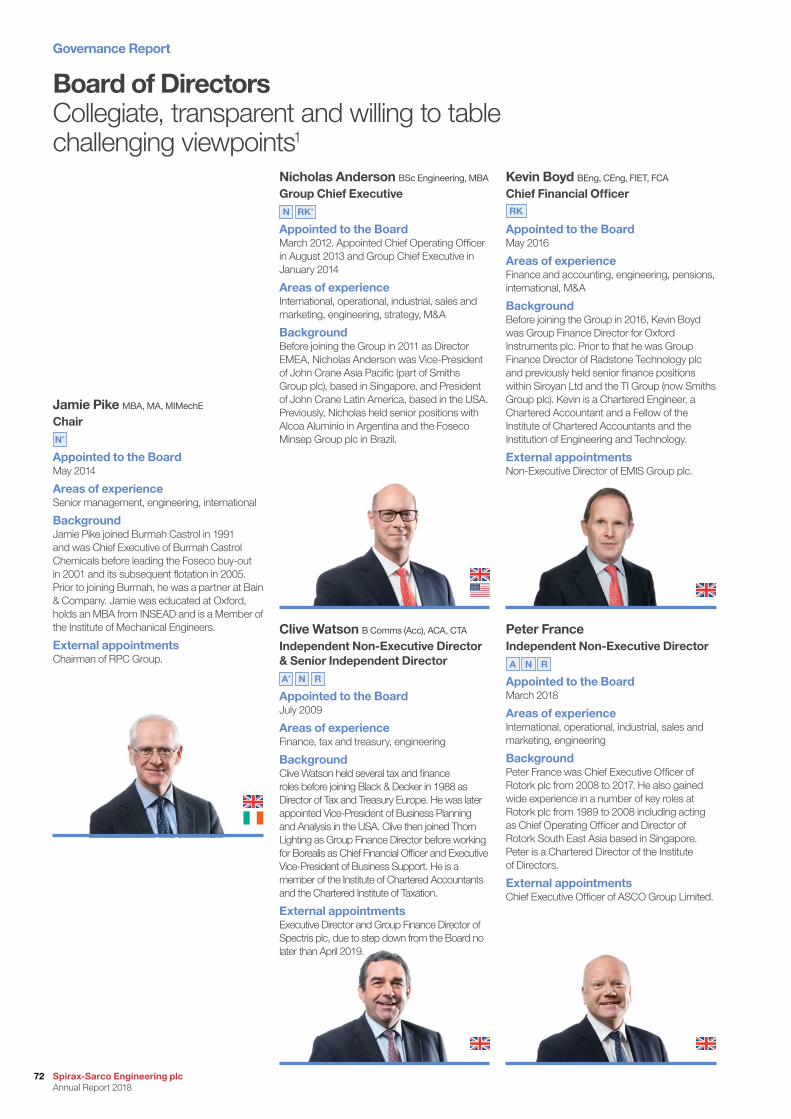
Peter FranceIndependent Non-Executive DirectorA N R
Appointed to the Board March 2018
Areas of experience International, operational, industrial, sales and marketing, engineering
Background Peter France was Chief Executive Officer of Rotork plc from 2008 to 2017. He also gained wide experience in a number of key roles at Rotork plc from 1989 to 2008 including acting as Chief Operating Officer and Director of Rotork South East Asia based in Singapore. Peter is a Chartered Director of the Institute of Directors.
External appointments Chief Executive Officer of ASCO Group Limited.
Kevin Boyd BEng, CEng, FIET, FCA
Chief Financial OfficerRK
Appointed to the Board May 2016
Areas of experience Finance and accounting, engineering, pensions, international, M&A
Background Before joining the Group in 2016, Kevin Boyd was Group Finance Director for Oxford Instruments plc. Prior to that he was Group Finance Director of Radstone Technology plc and previously held senior finance positions within Siroyan Ltd and the TI Group (now Smiths Group plc). Kevin is a Chartered Engineer, a Chartered Accountant and a Fellow of the Institute of Chartered Accountants and the Institution of Engineering and Technology.
External appointments Non-Executive Director of EMIS Group plc.
Jamie Pike MBA, MA, MIMechE
ChairN*
Appointed to the Board May 2014
Areas of experience Senior management, engineering, international
Background Jamie Pike joined Burmah Castrol in 1991 and was Chief Executive of Burmah Castrol Chemicals before leading the Foseco buy-out in 2001 and its subsequent flotation in 2005. Prior to joining Burmah, he was a partner at Bain & Company. Jamie was educated at Oxford, holds an MBA from INSEAD and is a Member of the Institute of Mechanical Engineers.
External appointments Chairman of RPC Group .
Board of DirectorsCollegiate, transparent and willing to table challenging viewpoints1
Clive Watson B Comms (Acc), ACA, CTA
Independent Non-Executive Director & Senior Independent DirectorA* N R
Appointed to the Board July 2009
Areas of experience Finance, tax and treasury, engineering
Background Clive Watson held several tax and finance roles before joining Black & Decker in 1988 as Director of Tax and Treasury Europe. He was later appointed Vice-President of Business Planning and Analysis in the USA. Clive then joined Thorn Lighting as Group Finance Director before working for Borealis as Chief Financial Officer and Executive Vice-President of Business Support. He is a member of the Institute of Chartered Accountants and the Chartered Institute of Taxation.
External appointments Executive Director and Group Finance Director of Spectris plc, due to step down from the Board no later than April 2019.
Nicholas Anderson BSc Engineering, MBA
Group Chief ExecutiveN RK*
Appointed to the Board March 2012. Appointed Chief Operating Officer in August 2013 and Group Chief Executive in January 2014
Areas of experience International, operational, industrial, sales and marketing, engineering, strategy, M&A
Background Before joining the Group in 2011 as Director EMEA, Nicholas Anderson was Vice-President of John Crane Asia Pacific (part of Smiths Group plc), based in Singapore, and President of John Crane Latin America, based in the USA. Previously, Nicholas held senior positions with Alcoa Aluminio in Argentina and the Foseco Minsep Group plc in Brazil.
Governance Report
Spirax-Sarco Engineering plc Annual Report 2018
72
Andy Robson LLB Law Barrister
Group General Counsel and Company Secretary
Appointed as Group General Counsel and Company Secretary June 2012
Areas of experience International law, corporate governance, international business development including mergers and acquisitions, business restructuring, information technology, contract negotiation
Background Before joining the Group in 2012, Andy Robson was General Counsel and Company Secretary of RM Plc, a role he held for 14 years. Prior to this, Andy was European General Counsel with Cendant Corporation headquartered in Baltimore, USA.
Neil Daws CEng, FIMechE
Managing Director, Steam SpecialtiesRK
Appointed to the Board June 2003
Areas of experience Manufacturing, engineering, product development, sales and marketing, broad operational experience
Background Neil Daws joined the Group in 1978 and held positions in production and design engineering prior to being named as UK Supply Director. Following this, Neil has held responsibility for Asia Pacific, Latin America, the Group’s Supply operations, including the Group’s health, safety and environmental matters and, more recently, EMEA.
Jane Kingston BA
Independent Non-Executive DirectorA N R*
Appointed to the Board September 2016
Areas of experience Human Resources, remuneration, international, engineering
Background From 2006 until her retirement in December 2015, Jane Kingston served as Group Human Resources Director for Compass Group PLC. Prior to this, she served as Group Human Resources Director for BPB plc. Jane has worked in a variety of sectors, including roles with Blue Circle Industries plc, Enodis plc and Coats Viyella plc and has significant international experience.
External appointments Non-Executive Director of National Express Group plc and Inchcape plc.
Jay Whalen BA, MBA
Executive Director Watson-Marlow Fluid Technology GroupRK
Appointed to the Board March 2012
Areas of experience Sales and marketing, engineering, product development, operational, international business development
Background Jay Whalen joined the Group in 1991 as President of Watson-Marlow Inc. in the USA. He was named Sales and Marketing Director of the global Watson-Marlow business in 2002 and in 2010 was appointed to his current Group position of President, Watson-Marlow Fluid Technology Group. Prior to joining Watson-Marlow, Jay was Vice-President Operations for Harvard Bioscience, Inc.
Trudy Schoolenberg PhD
Independent Non-Executive DirectorA N R
Appointed to the Board August 2012
Areas of experience Engineering, product development, oil and petrochemical
Background Prior to her most recent position at AkzoNobel, Trudy Schoolenberg served as Vice-President of Global Research & Development at Wärtsilä Oy. Trudy previously held senior management positions with Royal Dutch Shell plc and was Head of Strategy for Shell Chemicals. Until October 2016, Trudy served as Director of Integrated Supply Chain and Research, Development and Innovation, Decorative Paints Division of AkzoNobel.
External appointments Non-Executive Director of COVA and Low & Bonar PLC. Non-Executive Director and Senior Independent Director of Accsys Technologies plc.
Further readingRead about our Board diversity, composition, succession and evaluation.
See pages 78-81
1 Quote from 2018 external Board evaluation. For more information see page 81.
A Audit Committee
N Nomination Committee
R Remuneration Committee
RK Risk Management Committee
* Denotes Committee Chairman
Flag denotes country of citizenship
As previously announced, Caroline Johnstone was appointed as an Independent Non-Executive Director with effect from 5th March 2019.
73Spirax-Sarco Engineering plc Annual Report 2018
Go
vern
ance
Rep
ort
2. Division of responsibilities
The ChairIndependenceJamie Pike was appointed to lead the Board as Chair at the AGM on 15th May 2018, following the retirement of Bill Whiteley that same day. Jamie has been a member of our Board, and our Senior Independent Director, since May 2014. Having served over four years on the Board, we consider him to have retained his independent status.
As part of his commitment to meeting his Chair responsibilities, Jamie resigned as Chair and Director of Ibstock plc in May 2018.
ResponsibilityJamie’s responsibilities are outlined in the table overleaf. In his tenure to date we consider him to have upheld the responsibility of the Chair as described in the Principle of the 2018 Code, such as his independence, ability to work well with others and leadership skills.
A balanced BoardOur Board comprises four Executive and four (five, with effect from 5th March 2019) Non-Executive Directors (excluding the Chair), which ensures that no one person or group of individuals dominates the Board’s decision-making. All of our Non-Executive Directors are considered independent.
PerformanceThe Chair confirms that, following a formal performance evaluation, each Director’s performance continues to be effective and each Director demonstrates commitment to the role.
Non-Executive DirectorsOur Non-Executive Directors provide independent challenge and review, bringing wide experience, specific expertise and a fresh objective perspective. The Board is confident that the Non-Executive Directors have sufficient time to meet their Board responsibilities. External appointments held by our Non-Executive Directors and full-time Executive Directors are set out on pages 72 to 73 and a summary is provided in the table that follows.
In September 2018, we announced that Peter France had been appointed Chief Executive Officer of ASCO. This appointment was discussed and approved by the Board in advance, taking into consideration an indication of the time expected to be taken as part of this external appointment. As this is Peter’s only external appointment, this was approved by the Board.
At year end
No. of otherNon-Executive
roles
No. of other Executive
roles
Independent Non-Executive Directors
Jamie Pike (Chair) 1 –
Peter France – 1
Jane Kingston 2 –
Trudy Schoolenberg 3 –
Clive Watson – 1
Full-time Executive Directors
Nicholas Anderson – –
Kevin Boyd 1 –
Neil Daws – –
Jay Whalen – –
Senior Independent DirectorFollowing Jamie Pike’s appointment to the Chair, Clive Watson became Senior Independent Director, effective 15th May 2018. With expertise in finance, tax and treasury and engineering, the Board is satisfied that Clive has the necessary qualities and financial expertise for this role.
Non-Executive Director meetingsAs per best practice, our Non-Executive Directors met with the auditor and Willis Towers Watson, independent remuneration consultants, separately from our Executive Directors.
Division of responsibilitiesAn overview of the division of responsibilities as set out in the 2018 Code is provided in the table opposite and we comply with all Principles and provisions.
The responsibilities of the Chair, Group Chief Executive, Senior Independent Director, Board and Committees are set out in writing and agreed by the Board. A clear division is made between the leadership of the Board and Executive leadership.
Group General Counsel and Company SecretaryThe Group General Counsel and Company Secretary supports the Chair and the Committee Chairs in making sure members are equipped for informed decision-making and that they appropriately allocate their time to subjects. All Directors have access to the advice of the Group General Counsel, who is responsible for advising the Board on all governance matters. Both the appointment and removal of the Group General Counsel is a matter for the whole Board.
Governance Report
Spirax-Sarco Engineering plc Annual Report 2018
74
Division of responsibilities (based on 2018 Code’s Principles F–I)
Governance structure
Chair
Board (key matters)
Senior Independent Director
Non-Executive Directors
Group General Counsel and Company Secretary
Executive leadership
• Leads the Board• Responsible for overall effectiveness in directing the Company• Demonstrates objective judgement• Promotes a culture of openness and debate• Facilitates constructive Board relations• Facilitates effective contribution of all Non-Executive Directors• Ensures Directors receive accurate, timely, information• Holds meetings with Non-Executive Directors, without Executive Directors present
• The approval of corporate and strategic business plans • The approval of the annual and interim results • Trading updates • Integrated risk management framework • Major acquisitions/disposals • Major capital expenditure • Director appointments • Material litigation • Governance structure
• Provides a sounding board to the Chair• Serves as an intermediary for the other Directors and shareholders• Leads annual meeting of Non-Executive Directors to appraise Chair’s performance
• Provide constructive challenge, strategic guidance and offer specialist advice• Hold a prime role in appointing and removing Executive Directors• Scrutinise and hold to account the performance of management and individual Executive
Directors against agreed performance objectives
• Advises the Board on all governance matters• Supports the Board to ensure that it has the policies, processes, information, time and resources
it needs for the Board to function effectively and efficiently• Advises the Board on important legal and regulatory matters
There is a clear division of responsibilities between the leadership of the Board and our Executive leadership. Our Group Chief Executive’s roles and responsibilities include: management of the Group’s short, medium and long-term performance; stewardship of capital, technical and human resources; corporate and business strategy; internal risk management controls; and organisational structure.
Further reading Board Committees overviewThe Terms of Reference for all Board Committees are set out in detail on the Group’s website, www.spiraxsarcoengineering.com, on the Policies and procedures page, within the Governance section. These terms are subject to regular review.
www.spiraxsarcoengineering.com
Group Board See pages 72-73
Remuneration Committee
See pages 90-119
Risk Management Committee
See pages 86-89
Audit Committee
See pages 82-85
Nomination Committee
See pages 78-79
75Spirax-Sarco Engineering plc Annual Report 2018
Go
vern
ance
Rep
ort
2. Division of responsibilitiescontinued
The Board of DirectorsThe Board relies on Executive management to run the business and monitor management activities, and holds them accountable against targets and standards. The Board also approves long-term corporate and strategic plans after a full review and assessment of market and technology trends, business drivers and risks. Having a senior management team that is capable of executing the strategic plans is a key focus for the Board.
The formal schedule of matters reserved for the Board’s decision is available on the Group’s website, www.spiraxsarcoengineering.com, under Governance. The Board also has an Authority Limits Policy that sets out clearly the primary responsibilities, controls and authorisation limits on matters affecting the Group’s business.
Board meetingsThe Board meets as often as is necessary to discharge its duties. In 2018, the Board met seven times. All Directors are expected to attend all Board meetings and relevant Committee meetings unless prevented by prior commitments, illness or a conflict of interest. Directors unable to attend specific Board or Committee meetings are sent the relevant papers and asked to provide comments in advance of the meeting to the Chair of the Board or Committee. In addition, all Board and Committee members receive the minutes of meetings as a matter of course.
Board attendance 2018*
Board activity 2018 The Board ensures good governance practices are embedded throughout the Group as they are an integral part of running a successful business. In the chart on page 77 we have set out how the Board spent its time during 2018.
The Board agendas are carefully planned to ensure focus on the Group’s strategic priorities and key monitoring activities, as well as reviews of significant issues. During 2018, the Board devoted considerable time to ensuring that the post-acquisition plans relating to the Gestra and Chromalox businesses were implemented. This was supported by the Board’s visit to Gestra’s operation in Bremen in June preceded by the ACHEMA trade exhibition in Frankfurt, where we were able to see our businesses in action with our customers against the backcloth of their industry competitors.
We also updated the strategic plan and strategic risks in June. One outcome from this update was identifying that HygroMatik did not fit with the plan and that the timing was right to maximise the sale price, which was realised with the completion of the sale of this business in December for £52.3 million.
We monitored the significant investment we are making in Aflex Hose where we are consolidating our four sites into a purpose-built facility that will streamline our processes and prepares us for the growth we are anticipating in this business.
We looked at a number of important finance matters during 2018 including the renewal and extension of our revolving credit facilities provided by Barclays Bank plc and HSBC plc.
Health & Safety is of fundamental importance to the business and is considered at each Board meeting. It is also considered in detail at each Group Executive Committee meeting.
The Board also concentrated its attention on formulating a proactive Brexit strategy, looking at both the challenges and opportunities for the Group posed by a UK exit from the EU.
The Board continued to engage with shareholders on governance, remuneration and trading during the period.
Board focus for 2019We will continue to support the Executive Committees with their growth plans across all of our businesses. Key management presentations and discussions are planned for WMFTG in the USA and UK and Chromalox and Spirax Sarco in the USA. Time will be devoted to the Steam Specialties business new product development function.
We would like to consolidate our position as part of the FTSE 100 through both organic and inorganic growth.
We see many opportunities to build on our success and we look forward to realising and sharing these with our shareholders as we effect them through our strategic plan.
Board meetings Attendance
J. Pike 100%
N.J. Anderson 100%
K.J. Boyd1 86%
N.H. Daws 100%
P. France2 100%
J.S. Kingston 100%
J.L. Whalen 100%
G.E. Schoolenberg 100%
C.G. Watson 100%
* W.H. Whiteley attended three meetings prior to his retirement on 15th May 2018.1 K.J. Boyd absence due to illness.2 P. France appointed to the Board 6th March 2018.
How the Board spent its time
20%
20%
15%15%
15%
5%
10%
Strategy
Acquisitions
Operations and risk
Governance and shareholders
People and succession
Finance
New product development
Governance Report
Spirax-Sarco Engineering plc Annual Report 2018
76
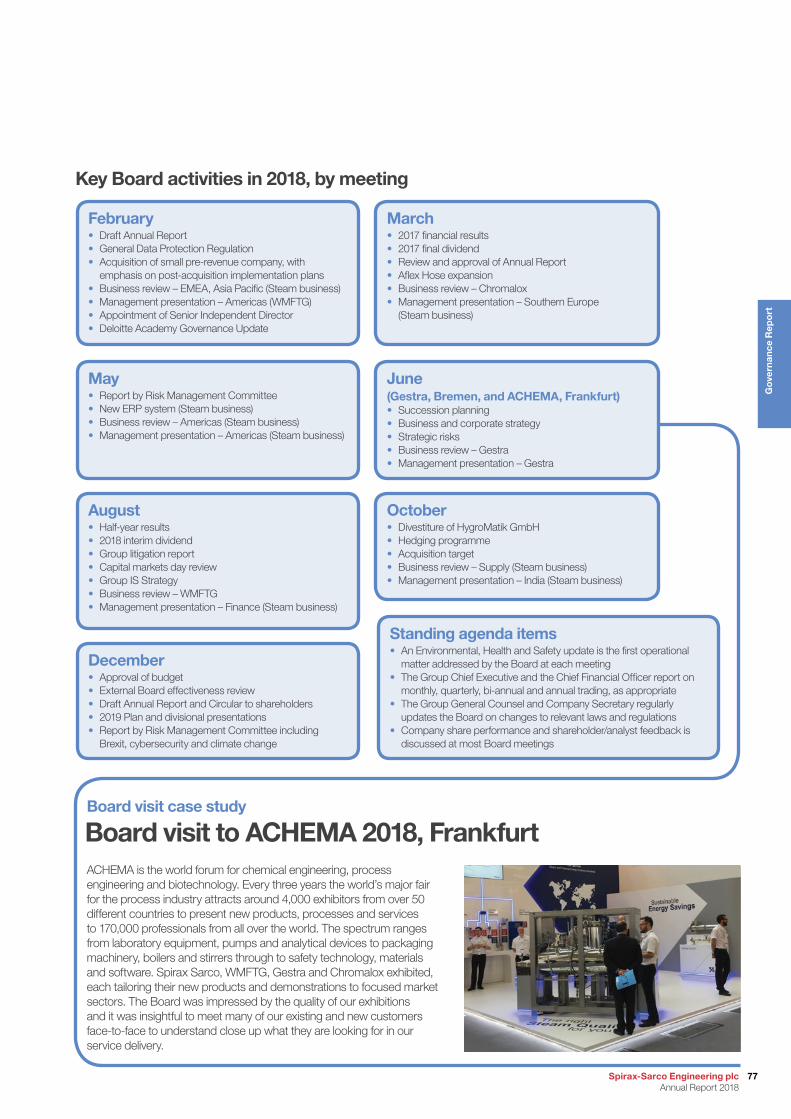
Key Board activities in 2018, by meeting
February • Draft Annual Report• General Data Protection Regulation• Acquisition of small pre-revenue company, with
emphasis on post-acquisition implementation plans• Business review – EMEA, Asia Pacific (Steam business)• Management presentation – Americas (WMFTG)• Appointment of Senior Independent Director• Deloitte Academy Governance Update
March• 2017 financial results• 2017 final dividend• Review and approval of Annual Report• Aflex Hose expansion• Business review – Chromalox• Management presentation – Southern Europe
(Steam business)
May• Report by Risk Management Committee• New ERP system (Steam business)• Business review – Americas (Steam business)• Management presentation – Americas (Steam business)
June (Gestra, Bremen, and ACHEMA, Frankfurt)• Succession planning• Business and corporate strategy• Strategic risks• Business review – Gestra• Management presentation – Gestra
August• Half-year results• 2018 interim dividend• Group litigation report• Capital markets day review• Group IS Strategy• Business review – WMFTG• Management presentation – Finance (Steam business)
October• Divestiture of HygroMatik GmbH• Hedging programme• Acquisition target• Business review – Supply (Steam business)• Management presentation – India (Steam business)
December• Approval of budget• External Board effectiveness review• Draft Annual Report and Circular to shareholders• 2019 Plan and divisional presentations• Report by Risk Management Committee including
Brexit, cybersecurity and climate change
Standing agenda items • An Environmental, Health and Safety update is the first operational
matter addressed by the Board at each meeting• The Group Chief Executive and the Chief Financial Officer report on
monthly, quarterly, bi-annual and annual trading, as appropriate• The Group General Counsel and Company Secretary regularly
updates the Board on changes to relevant laws and regulations• Company share performance and shareholder/analyst feedback is
discussed at most Board meetings
ACHEMA is the world forum for chemical engineering, process engineering and biotechnology. Every three years the world’s major fair for the process industry attracts around 4,000 exhibitors from over 50 different countries to present new products, processes and services to 170,000 professionals from all over the world. The spectrum ranges from laboratory equipment, pumps and analytical devices to packaging machinery, boilers and stirrers through to safety technology, materials and software. Spirax Sarco, WMFTG, Gestra and Chromalox exhibited, each tailoring their new products and demonstrations to focused market sectors. The Board was impressed by the quality of our exhibitions and it was insightful to meet many of our existing and new customers face-to-face to understand close up what they are looking for in our service delivery.
Board visit case study
Board visit to ACHEMA 2018, Frankfurt
77Spirax-Sarco Engineering plc Annual Report 2018
Go
vern
ance
Rep
ort
3. Composition, succession and evaluation
Committee role and responsibilitiesThe main role of the Nomination Committee is to recommend changes to the Board and consider succession planning for the future. The Committee:
• makes appropriate recommendations to the Board for the appointment, re-appointment or replacement of Directors;
• reviews the structure and composition of the Board with regard to the overall balance of skills, knowledge and experience against current and perceived future requirements of the Group;
• recommends any proposed changes to the Board; and• considers succession planning arrangements for the Directors
and, more generally, senior executives.
MeetingsThe Nomination Committee met four times in the year to address the following matters:
• Executive Director succession planning;• re-appointment of Non-Executive Directors; and• Audit Committee Chair succession.
Key Nomination Committee activities 2018
February • Appointment of Senior Independent Director
June• Executive Director succession planning• Re-appointment of Non-Executive Directors
October• Audit Committee Chair succession – process and schedule
December• Audit Committee Chair succession update
Nomination CommitteeJamie PikeChair of Nomination Committee
Executive succession
Non-Executive succession
Diversity
40%
40%
20%
Further readingOur Diversity and Inclusion Policy can be found on our website.
www.spiraxsarcoengineering.com/Governance/Pages/policies-procedures.aspx
MembersOur Nomination Committee comprises:
No. of meetings attended/ total no. meetings held*
Attendance %
Jamie Pike1 (Chair) 4/4 100%
Nicholas Anderson 4/4 100%
Peter France 3/3 100%
Jane Kingston 4/4 100%
Trudy Schoolenberg 4/4 100%
Clive Watson 4/4 100%* W.H. Whiteley attended one meeting prior to his retirement on 15th May 2018.1 Appointed Committee Chair 15th May 2018.
How the Committee spent its time
Governance Report
Spirax-Sarco Engineering plc Annual Report 2018
78
Chair’s review of 2018Board changesIn March 2018, we welcomed Peter France to the Board and in May 2018 I took over as Chair. Our rigorous process for managing both appointments was described on page 76 of the 2017 Annual Report. Peter France undertook an extensive induction and shares his thoughts on page 80. Following my appointment as Chair, Clive Watson took over as Senior Independent Director.
Once again, Korn Ferry was appointed in relation to the specification, search and evaluation of the new appointments detailed below. In our latest Non-Executive Director search we instructed Korn Ferry to include candidates that advanced both our gender and ethnicity representation. Korn Ferry is an independent search and recruitment agency and provides no other services to the Group.
I am delighted that Caroline Johnstone joined the Board as an Independent Non-Executive Director on 5th March 2019. Caroline’s financial, people and advisory skills, together with her international business experience across a range of different industries, will benefit the further development of the Group. With Caroline’s appointment, female representation on our Board increases to 30%.
A new Chair of the Audit Committee is being appointed. The timing of this appointment will allow for a handover of responsibilities from Clive Watson, the outgoing Chair, following the conclusion of his nine-year tenure as a Director. An announcement will be made in due course regarding this position and the new Senior Independent Director. Clive shares his reflections on his time with the Company on page 80.
Managing a diverse pipeline for successionWe strive for greater diversity on our Board and across the Group and in our succession planning take the following into account:
Diversity and Inclusion PolicyWe believe that the Board’s perspective and approach is greatly enhanced by gender, age and cultural diversity and it is our policy to consider overall Board balance and diversity when appointing new Directors. As shown on page 66, the range of nationalities and experience of our Board is particularly relevant given the broad international reach of the Group and we will seek to increase the diversity of our international footprint with future appointments to the Board.
Diversity and inclusion are key elements in our Group strategic sustainability project where we undertook the following:
• engaged the wider Executive team on how to increase diversity and promote inclusion across our organisation by way of a thought-provoking and stimulating session delivered by John Uzoma Amaechi, OBE, psychologist and consultant;
• published our new Diversity and Inclusion Policy on our website (www.spiraxsarcoengineering.com, under Governance) and shared across the Group;
• reviewed external talent pools to increase the number of female candidates;
• established an Executive mentoring programme for female talent with male and female mentors; and
• completed an equal pay audit for all UK employees.
Gender reportingDuring 2018, Board gender diversity remained unchanged with seven males and two females. During 2018, we participated in the FTSE Women Leaders (Hampton-Alexander) Review. With 22.2% female representation on our Board and 18% of the combined Executive Committees and their direct reports being female, we were ranked 151st in the FTSE 250 for senior management gender diversity. We recognise that further actions need to be taken to increase the representation of women.
As a Group we are committed to gender diversity and to achieving a minimum target of 33% female representation on the Board, the Group Executive Committee and their direct reports. We ensure that this target is taken into account in our succession planning and recruitment and, as previously mentioned, following the appointment of Caroline Johnstone, at time of publication we have 30% female representation on our Board.
More detailed figures on gender diversity can be found on page 59 in our Sustainability Report.
Committee Focus for 2019In 2019, we will focus on the implementation of the Board evaluation actions and diversity at the Board and Executive levels of the Group.
Jamie PikeChair of Nomination Committee
79Spirax-Sarco Engineering plc Annual Report 2018
Go
vern
ance
Rep
ort
Spirax Sarco is an exciting business with strong customer focus, and I am enjoying every minute.”Peter FranceIndependent Non-Executive Director
Spirax Sarco has a culture and set of Values reinforcing the highest integrity in everything it does.”Clive WatsonIndependent Non-Executive DirectorSenior Independent Director
3. Composition, succession and evaluationcontinued
Peter France inductionI have enjoyed working with the Spirax-Sarco Engineering plc Board and other colleagues during the past year, and have been impressed by the teamwork and strong governance in evidence across the Group, which I have experienced first-hand as a member of the Audit Committee. I would like to extend my thanks to Jamie Pike and my fellow Directors who have made me extremely welcome in my first year and encouraged me to bring my experience to bear and to learn from their experience in equal measure.
Since joining the Board in March 2018, I have had the opportunity to visit a number of Group companies, from Watson-Marlow’s operations in Falmouth, UK, to Gestra in Bremen, Germany, and visited customers with field-based engineers. In all of these meetings I have felt welcomed by my new colleagues and came away impressed by the strong customer focus demonstrated across the business.
As a Board, during 2018, we focused extensively on organic growth opportunities and also embedding the recent acquisitions, Gestra and Chromalox. We are committed to taking the Group forward based on a well-founded and excellently executed strategic plan. Forward thinking is evident in the workings of the Nomination Committee where I have seen thoughtful and thorough succession planning undertaken to ensure long-term business continuity both for the Board and senior management.
The Group is at an exciting phase of its development and I look forward to playing a part in its continued success.
Clive Watson reflectionsLooking back over my nine years as a Non-Executive Director of Spirax Sarco, it has been an honour and a pleasure to serve as the Audit Committee Chair and, more recently, as the Senior Independent Director, overseeing the strengthening of, and commitment to, a robust internal control framework developed in response to a successful and profitable growth strategy. The Group has embraced all good governance practices and, in many cases, been an early adopter in order to mitigate current and potential risks. Risk management is now firmly embedded in day-to-day decision making.
Throughout, the Company has not hesitated to invest in appropriate resources to maintain the highest standards including, recently, the appointment of a Head of Internal Audit. In closing, I would like to emphasise that Spirax Sarco has a culture and set of Values reinforcing the highest integrity in everything it does. I wish the Company the very best for the future and extend my great appreciation for the support provided by my colleagues on the Board, the Audit Committee and the legal and finance functions.
Governance Report
Spirax-Sarco Engineering plc Annual Report 2018
80
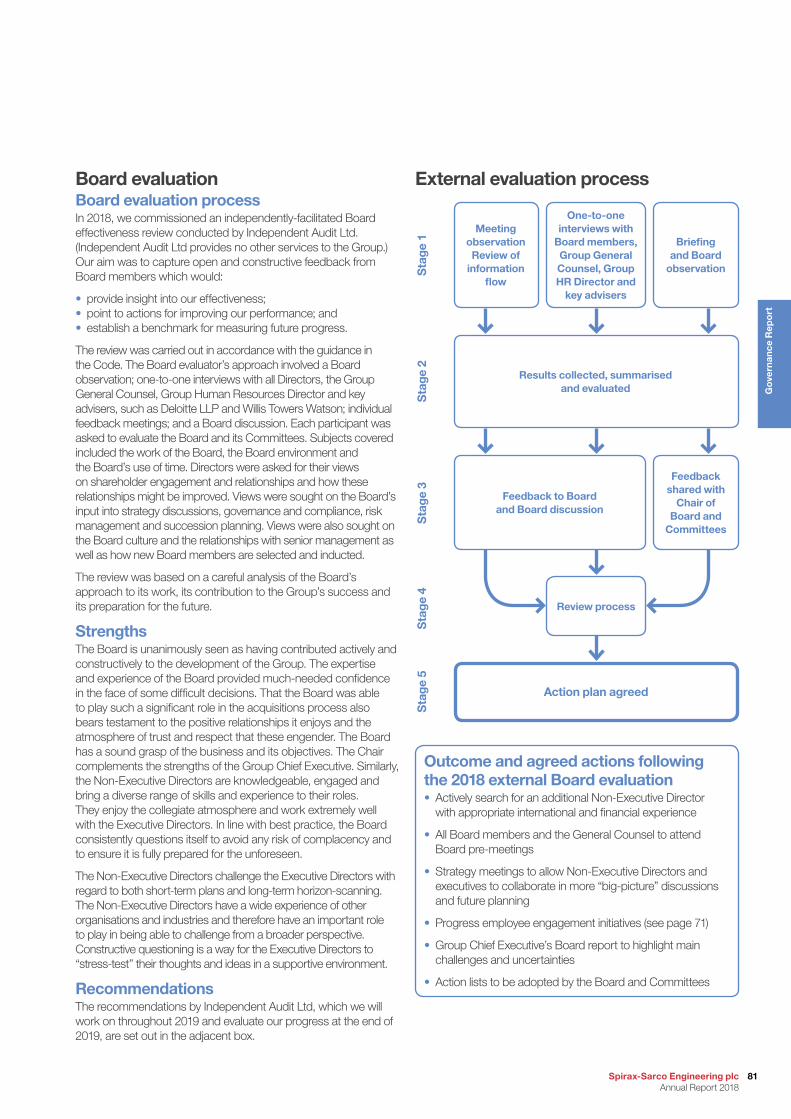
Board evaluationBoard evaluation processIn 2018, we commissioned an independently-facilitated Board effectiveness review conducted by Independent Audit Ltd. (Independent Audit Ltd provides no other services to the Group.) Our aim was to capture open and constructive feedback from Board members which would:
• provide insight into our effectiveness;• point to actions for improving our performance; and• establish a benchmark for measuring future progress.
The review was carried out in accordance with the guidance in the Code. The Board evaluator’s approach involved a Board observation; one-to-one interviews with all Directors, the Group General Counsel, Group Human Resources Director and key advisers, such as Deloitte LLP and Willis Towers Watson; individual feedback meetings; and a Board discussion. Each participant was asked to evaluate the Board and its Committees. Subjects covered included the work of the Board, the Board environment and the Board’s use of time. Directors were asked for their views on shareholder engagement and relationships and how these relationships might be improved. Views were sought on the Board’s input into strategy discussions, governance and compliance, risk management and succession planning. Views were also sought on the Board culture and the relationships with senior management as well as how new Board members are selected and inducted.
The review was based on a careful analysis of the Board’s approach to its work, its contribution to the Group’s success and its preparation for the future.
StrengthsThe Board is unanimously seen as having contributed actively and constructively to the development of the Group. The expertise and experience of the Board provided much-needed confidence in the face of some difficult decisions. That the Board was able to play such a significant role in the acquisitions process also bears testament to the positive relationships it enjoys and the atmosphere of trust and respect that these engender. The Board has a sound grasp of the business and its objectives. The Chair complements the strengths of the Group Chief Executive. Similarly, the Non-Executive Directors are knowledgeable, engaged and bring a diverse range of skills and experience to their roles. They enjoy the collegiate atmosphere and work extremely well with the Executive Directors. In line with best practice, the Board consistently questions itself to avoid any risk of complacency and to ensure it is fully prepared for the unforeseen.
The Non-Executive Directors challenge the Executive Directors with regard to both short-term plans and long-term horizon-scanning. The Non-Executive Directors have a wide experience of other organisations and industries and therefore have an important role to play in being able to challenge from a broader perspective. Constructive questioning is a way for the Executive Directors to “stress-test” their thoughts and ideas in a supportive environment.
RecommendationsThe recommendations by Independent Audit Ltd, which we will work on throughout 2019 and evaluate our progress at the end of 2019, are set out in the adjacent box.
Outcome and agreed actions following the 2018 external Board evaluation• Actively search for an additional Non-Executive Director
with appropriate international and financial experience
• All Board members and the General Counsel to attend Board pre-meetings
• Strategy meetings to allow Non-Executive Directors and executives to collaborate in more “big-picture” discussions and future planning
• Progress employee engagement initiatives (see page 71)
• Group Chief Executive’s Board report to highlight main challenges and uncertainties
• Action lists to be adopted by the Board and Committees
Action plan agreed
Review process
Sta
ge
4S
tag
e 5
External evaluation process
Feedback shared with
Chair of Board and
Committees
Feedback to Board and Board discussion
Results collected, summarised and evaluated
Briefing and Board
observation
One-to-one interviews with
Board members, Group General Counsel, Group HR Director and
key advisers
Meeting observationReview of
information flow
Sta
ge
2S
tag
e 3
Sta
ge
1
81Spirax-Sarco Engineering plc Annual Report 2018
Go
vern
ance
Rep
ort
4. Audit, risk and internal control
Committee role and responsibilitiesThe main roles and responsibilities of the Audit Committee include:
• monitoring the integrity of the Financial Statements of the Company and any formal announcements relating to the Company’s financial performance, and reviewing significant financial reporting judgements contained in them;
• providing advice (where requested by the Board) on whether the Annual Report, taken as a whole, is fair, balanced and understandable, and provides the information necessary for shareholders to assess the Company’s position and performance, business model and strategy;
• in conjunction with the Risk Management Committee and the Board, reviewing the Company’s internal financial controls and internal control and risk management systems;
• monitoring and reviewing the effectiveness of the Company’s internal audit function and making recommendations to the Board;
• conducting the tender process and making recommendations to the Board about the appointment, re-appointment and removal of the external auditor, and approving the remuneration and terms of engagement of the external auditor;
• reviewing and monitoring the external auditor’s independence and objectivity;
• reviewing the effectiveness of the external audit process, taking into consideration relevant UK professional and regulatory requirements;
• developing and implementing policy on the engagement of the external auditor to supply non-audit services, ensuring there is prior approval of non-audit services, considering the impact this may have on independence, taking into account the relevant regulations and ethical guidance in this regard, and reporting to the Board on any improvement or action required; and
• reporting to the Board on how it has discharged its responsibilities.
MeetingsThe Committee met three times during 2018. Relevant members of the Group’s senior management, including the Head of Internal Audit, the Chief Financial Officer and the Group Financial Controller, were also in attendance at these meetings. In line with recommended practice, the Group Chief Executive attended one meeting of the Committee (March).
During 2018, the Committee received reports from external and internal auditors on the major findings of their work and the progress of management follow-up by way of management reports. As a safeguard, the Committee holds separate meetings with the external and internal auditors without management present to discuss their respective areas and any issues arising from their audits.
Clive WatsonChair of Audit Committee
Audit Committee
MembersOur Audit Committee comprises:
No. of meetings attended/ total no. meetings held
Attendance %
Clive Watson (Chair) 3/3 100%
Peter France 3/3 100%
Jane Kingston 3/3 100%
Jamie Pike1 1/1 100%
Trudy Schoolenberg 3/3 100%1 Resigned from the Committee on 15th May 2018 on appointment as Chair of the Board.
How the Committee spent its time
Finance and tax reviews
Corporate governance
External audit
Internal audit
Risk management and controls
Results review
Whistle-blowing
30%
15%
15%
10%
15%
10%
5%
Governance Report
Spirax-Sarco Engineering plc Annual Report 2018
82
Key Committee activities in 2018
October• External audit planning (including review and approval of
audit scope)• Tax update (reviewed Tax Policy and Tax Strategy) • Reviewed internal audit process• Reviewed and approved new Crisis Management Plan
August• Reviewed the half-year results• Reviewed the auditor interim report • Reviewed and approved the auditor engagement policy• On-going review of risk areas such as cybersecurity, GDPR and
whistle-blowing • Consideration of Audit Committee performance
March • Reviewed the Annual Report including:
– Viability Statement – Going Concern basis – that it is fair, balanced and understandable
• Agreed the Internal Audit Strategy and Charter for 2018• Monitored the Group preparedness for the implementation
of GDPR• Reviewed the effectiveness of internal controls
Committee competenceThe Terms of Reference for the Committee, which can be found on the Group’s website, www.spiraxsarcoengineering.com, under Governance, set out the membership and experience requirements of the Committee. Collectively, the Committee is considered by the Board to possess an appropriate level of independence (it is comprised solely of Non-Executive Directors) and experience; the Chair has recent and relevant financial experience and the required competence in accounting and its members have a depth of financial and commercial experience in various industries, as well as the industrial engineering sector in which the Group operates. A more detailed summary of the qualifications, skills and experience of each Committee member can be found on pages 72 to 73.
Chair’s review of 20182018 saw some changes in the Committee’s membership, with Peter France joining the Committee on his appointment to the Board as an Independent Non-Executive Director in March 2018, and Jamie Pike stepping down as a member of the Committee following his appointment as Chair of the Board in May 2018.
In addition to its on-going core responsibilities of monitoring the integrity of the Group’s Financial Statements and the effectiveness of its controls, in 2018 the Committee was focused on ensuring the Group was prepared for the implementation of the General Data Protection Regulation (GDPR), through reviews of the Group’s cybersecurity regime and data governance policies and processes. The first anniversary of the Gestra and Chromalox acquisitions arrived in May and July respectively
and the Committee continued to monitor their integration and performance to ensure they were proceeding in accordance with management’s plans and that the financial judgements made by the Group in applying accounting policies in relation to these acquisitions remained accurate.
The following matters were of particular note:
Finance team appointmentsFollowing the Group’s appointments of its first Head of Internal Audit and also Tax Manager in 2017, the Committee noted that in 2018 the Group had further strengthened its Finance team and the control environment by the appointment of an additional Internal Audit Manager and another Tax Manager. The Group confirmed its intention to appoint a third internal auditor in 2019, with the aim (based on the current size of the Group) being to ultimately have four internal auditors to cover all of the internal audit activity of the Group.
Cybersecurity and GDPR preparednessWith GDPR becoming effective in May 2018, the Committee increased its focus on the Group’s policies and processes covering the related issues of cybersecurity and data governance. In particular, the Committee reviewed updates from management on the work being undertaken by the GDPR project team and external advisers to ensure compliance with GDPR within the relevant milestones. All critical elements of the compliance plan (identified following a gap analysis undertaken by Ernst & Young LLP during 2018) were completed by the relevant Group companies ahead of the May 2018 deadline and all employees have been provided with GDPR awareness training. The Committee will continue to monitor compliance.
The Committee was pleased to note that the Group had carried on taking steps to mitigate the risk posed to businesses by online attacks. Digital security had been greatly increased across the Group generally and, in addition to new encryption and anti-virus software being utilised by the Group, cybersecurity training had been rolled out to the vast majority of employees.
TaxationThe Group Taxation Strategy, which can be found on the Group’s website, www.spiraxsarcoengineering.com, under Governance, was published in 2018. The Taxation Strategy sets out the Group’s approach to tax risk management and governance, tax planning and relationship with the relevant tax authorities.
The Committee noted that due to the increased size of the Group, it is now subject to HMRC Senior Accounting Officer review and in June 2018, a clean certificate was issued by the Senior Accounting Officer for the year ended 31st December 2017.
Review of effectiveness of internal controlsIn its review of the Group’s internal controls, the Committee considers the effectiveness of all material controls, including financial, operational and compliance controls and risk management systems. The Committee continues to consider the Group to have a strong and effective control environment in place. Further detail on monitoring effectiveness of internal controls can be found on pages 87 to 88.
83Spirax-Sarco Engineering plc Annual Report 2018
Go
vern
ance
Rep
ort
4. Audit, risk and internal controlcontinued
Audit Committee continued Crisis managementA new Crisis Management Plan was established by the Group in 2018. The Plan was reviewed and approved by the Committee and supplements the Group’s existing Serious Incident Management Policy and local incident management procedures. The Plan sets out the responsibilities and actions of the Board and senior management in the event of an incident that is sufficiently serious in nature that it is highly likely to attract detrimental publicity, affect the reputation of the Group or affect its share price.
Whistle-blowingThe Committee was pleased to note that the Whistle-blowing Policy implemented in 2014 had been successfully rolled out to the newest members of the Group (Gestra and Chromalox). This roll out included the Group’s Safecall facility being the confidential employee whistle-blowing hotline. The Committee received updates on the use of Safecall at each meeting and noted that, on the whole, this hotline continued to be used for its intended purpose by employees. The Committee assessed management’s responses to the reported cases (of which there were five in 2018) and considered them to be appropriate and satisfactory.
Significant issues During 2018, the Committee considered and addressed the following significant issues in relation to the Group’s Financial Statements and disclosures:
(i) Revenue recognitionIn view of the profile of revenue and profit recognition in the final quarter of the year, the need to focus on any new contracts and revenue cut-off for certain businesses was highlighted to ensure the appropriate recognition of revenue for the year ended 31st December 2018.
How this was addressedThe Committee received regular updates on the assessment of the impact of IFRS 15 (Revenue from Contracts with Customers) during 2018.
(ii) PensionsThere are judgements and estimates made in selecting appropriate assumptions in valuing the Group’s defined benefit pension obligations, including discount ratios, mortality, inflation and salary increases.
How this was addressedThe Committee considered reports by the Group, including those from independent external advisers, and is comfortable that the key assumptions are reasonable.
(iii) Management override of controlsInternal controls are the safeguards put in place by the Group to protect its financial resources from fraud and abuse by employees. Management is responsible for ensuring the internal controls are followed by employees. As such, intervention by management in the handling of financial information and making decisions contrary to the internal control policy is a significant, if unlikely, risk.
How this was addressedRegular cycles of internal and external audits by independent parties (including the Committee) have been put in place to review financial information. These audits are objective reviews on compliance with the Group’s accounting policies. The Group continues to provide additional resource to its internal audit function with the recent appointment of a further Internal Audit Manager (see page 83). The new internal audit plan and budget, which sets the objectives of visiting every business in the Group over a five-year period and to audit acquisitions within six months of completion, was approved by the Committee in 2018.
Significant areas of judgement in the Financial StatementsAfter reviewing the presentations and reports from management and consulting with the auditor, the Committee is satisfied that the Financial Statements appropriately address the critical judgements and key estimates, both in respect of the amounts reported and the disclosures. The Committee is also satisfied that the significant assumptions used for determining the value of assets and liabilities have been appropriately scrutinised, challenged and are sufficiently robust.
How these were addressedThe Committee reviewed the 2018 Going Concern and Viability Statements and were satisfied that these represented accurate assessments of the Company’s position as at the date of the Statements.
External audit processThis is the fifth financial year in which the Annual Report and Financial Statements have been audited by Deloitte LLP, following their appointment as the Company’s external auditor as of 20th May 2014. This appointment is subject to on-going monitoring and will run for a maximum of 10 years before being tendered. One of the primary responsibilities of the Committee is to assess the robustness of the external audit process and make recommendations to the Board in relation to the appointment, re-appointment or removal of the external auditor. The Committee took a number of factors into account when evaluating the effectiveness of the external audit including: the quality and scope of the planning of the audit (in October 2018, Deloitte LLP presented their plan for the 2018 audit to the Committee); and feedback from all audited operating units, the Group Finance team, senior management and Directors on the audit process and the quality and experience of the audit partners engaged in the audit.
As this was their fifth year as auditor, in accordance with the requirements to rotate the audit partner at least every five years, the Committee were informed by Deloitte LLP that Mark Mullins would be stepping down after the close of the 2018 audit and Andrew Bond will take over responsibility for the audits from March 2019.
The Group has complied with the provisions of the Competition and Market Authority (CMA) Order, issued by the CMA in September 2014, for “The Statutory Audit Services for Large Companies Market Investigation (Mandatory Use of Competitive Tender Processes and Audit Committee Responsibilities)”.
Governance Report
Spirax-Sarco Engineering plc Annual Report 2018
84
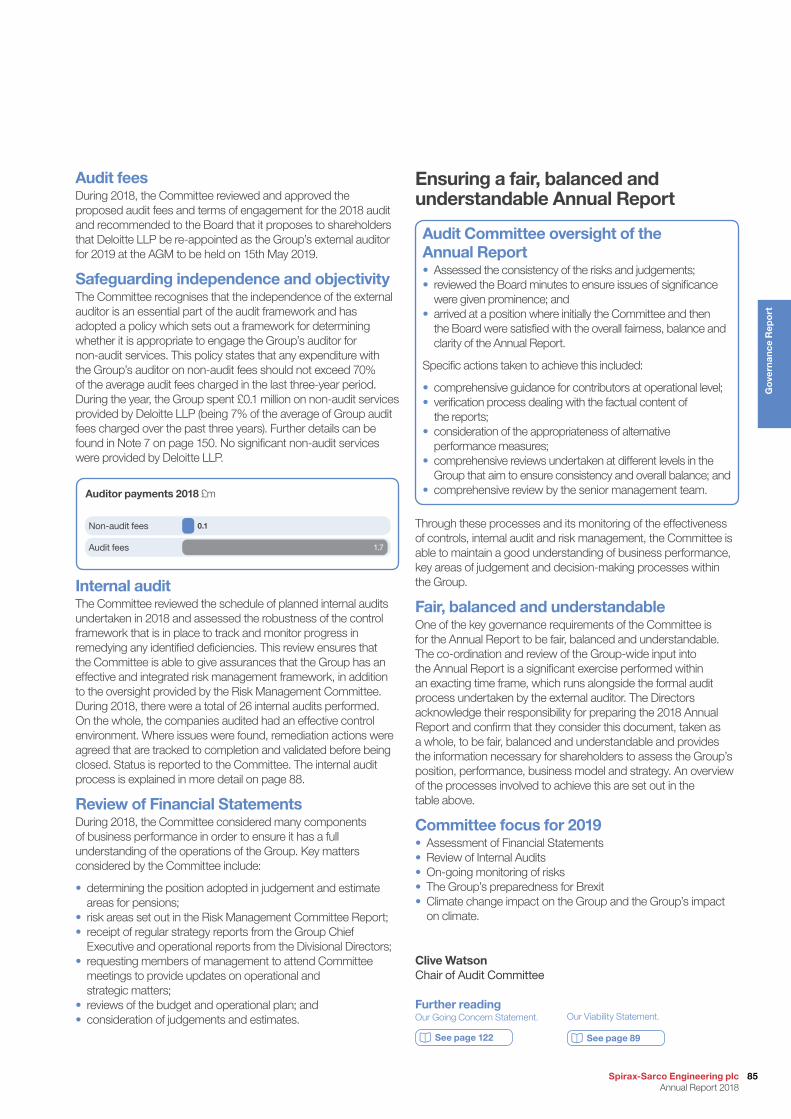
Audit feesDuring 2018, the Committee reviewed and approved the proposed audit fees and terms of engagement for the 2018 audit and recommended to the Board that it proposes to shareholders that Deloitte LLP be re-appointed as the Group’s external auditor for 2019 at the AGM to be held on 15th May 2019.
Safeguarding independence and objectivity The Committee recognises that the independence of the external auditor is an essential part of the audit framework and has adopted a policy which sets out a framework for determining whether it is appropriate to engage the Group’s auditor for non-audit services. This policy states that any expenditure with the Group’s auditor on non-audit fees should not exceed 70% of the average audit fees charged in the last three-year period. During the year, the Group spent £0.1 million on non-audit services provided by Deloitte LLP (being 7% of the average of Group audit fees charged over the past three years). Further details can be found in Note 7 on page 150. No significant non-audit services were provided by Deloitte LLP.
Auditor payments 2018 £m
Non-audit fees
Audit fees
0.1
1.7
Internal auditThe Committee reviewed the schedule of planned internal audits undertaken in 2018 and assessed the robustness of the control framework that is in place to track and monitor progress in remedying any identified deficiencies. This review ensures that the Committee is able to give assurances that the Group has an effective and integrated risk management framework, in addition to the oversight provided by the Risk Management Committee. During 2018, there were a total of 26 internal audits performed. On the whole, the companies audited had an effective control environment. Where issues were found, remediation actions were agreed that are tracked to completion and validated before being closed. Status is reported to the Committee. The internal audit process is explained in more detail on page 88.
Review of Financial StatementsDuring 2018, the Committee considered many components of business performance in order to ensure it has a full understanding of the operations of the Group. Key matters considered by the Committee include:
• determining the position adopted in judgement and estimate areas for pensions;
• risk areas set out in the Risk Management Committee Report;• receipt of regular strategy reports from the Group Chief
Executive and operational reports from the Divisional Directors; • requesting members of management to attend Committee
meetings to provide updates on operational and strategic matters;
• reviews of the budget and operational plan; and• consideration of judgements and estimates.
Ensuring a fair, balanced and understandable Annual Report
Audit Committee oversight of the Annual Report• Assessed the consistency of the risks and judgements;• reviewed the Board minutes to ensure issues of significance
were given prominence; and• arrived at a position where initially the Committee and then
the Board were satisfied with the overall fairness, balance and clarity of the Annual Report.
Specific actions taken to achieve this included:
• comprehensive guidance for contributors at operational level;• verification process dealing with the factual content of
the reports;• consideration of the appropriateness of alternative
performance measures;• comprehensive reviews undertaken at different levels in the
Group that aim to ensure consistency and overall balance; and• comprehensive review by the senior management team.
Through these processes and its monitoring of the effectiveness of controls, internal audit and risk management, the Committee is able to maintain a good understanding of business performance, key areas of judgement and decision-making processes within the Group.
Fair, balanced and understandableOne of the key governance requirements of the Committee is for the Annual Report to be fair, balanced and understandable. The co-ordination and review of the Group-wide input into the Annual Report is a significant exercise performed within an exacting time frame, which runs alongside the formal audit process undertaken by the external auditor. The Directors acknowledge their responsibility for preparing the 2018 Annual Report and confirm that they consider this document, taken as a whole, to be fair, balanced and understandable and provides the information necessary for shareholders to assess the Group’s position, performance, business model and strategy. An overview of the processes involved to achieve this are set out in the table above.
Committee focus for 2019• Assessment of Financial Statements• Review of Internal Audits• On-going monitoring of risks• The Group’s preparedness for Brexit• Climate change impact on the Group and the Group’s impact
on climate.
Clive WatsonChair of Audit Committee
Further readingOur Going Concern Statement.
See page 122
Our Viability Statement.
See page 89
85Spirax-Sarco Engineering plc Annual Report 2018
Go
vern
ance
Rep
ort

4. Audit, risk and internal controlcontinued
Committee role and responsibilitiesThe Committee oversees the management and control of significant risks affecting the Group. The Committee ensures that the Group has risk management policies and procedures, including those covering project governance, sanctions and embargoes, crisis management, human rights, business continuity and business management.
The Committee’s responsibilities include:
• using top-down and bottom-up reviews, understanding the risks facing the Group;
• determining our appetite for risk;• accepting and managing within the businesses those
risks which our employees have the skills and expertise to understand and leverage; and
• identifying appropriate risk mitigation techniques and countermeasures.
MeetingsThe Committee met three times in 2018. A summary of the Committee’s activities throughout the year is below.
Key Risk Management Committee activities 2018
April • Reviewed proposed Crisis Management Plan• Agreed to key actions related to crisis management
August• Reviewed the top-down risk summary• Confirmed risk countermeasures in place at Group
operating companies
December• Updated and approved the risk register, based on the
top-down review• Updated the principal risks• Approved recommendations for Brexit preparedness• Approved the appointment of the Head of Internal Audit as
a Committee member
Risk Management CommitteeNicholas AndersonChair of Risk Management Committee
MembersOur Risk Management Committee comprises:
No. of meetings attended/ total no. meetings held
Attendance %
Nicholas Anderson (Chair) 3/3 100%
Kevin Boyd 3/3 100%
Neil Daws 3/3 100%
Jay Whalen 3/3 100%
Jim Devine 3/3 100%
Mike Sutter 3/3 100%
Andy Robson 3/3 100%
Dan Harvey1 1/1 100%1 Joined the Committee on 1st December 2018
How the Committee spent its time
Internal controls
Review of principal risks
Risk management framework (including top-down review)
Anti-bribery
Crisis Management Plan
Internal audit and tax compliance
20%
20%
20%
15%
15%
10%
Governance Report
Spirax-Sarco Engineering plc Annual Report 2018
86
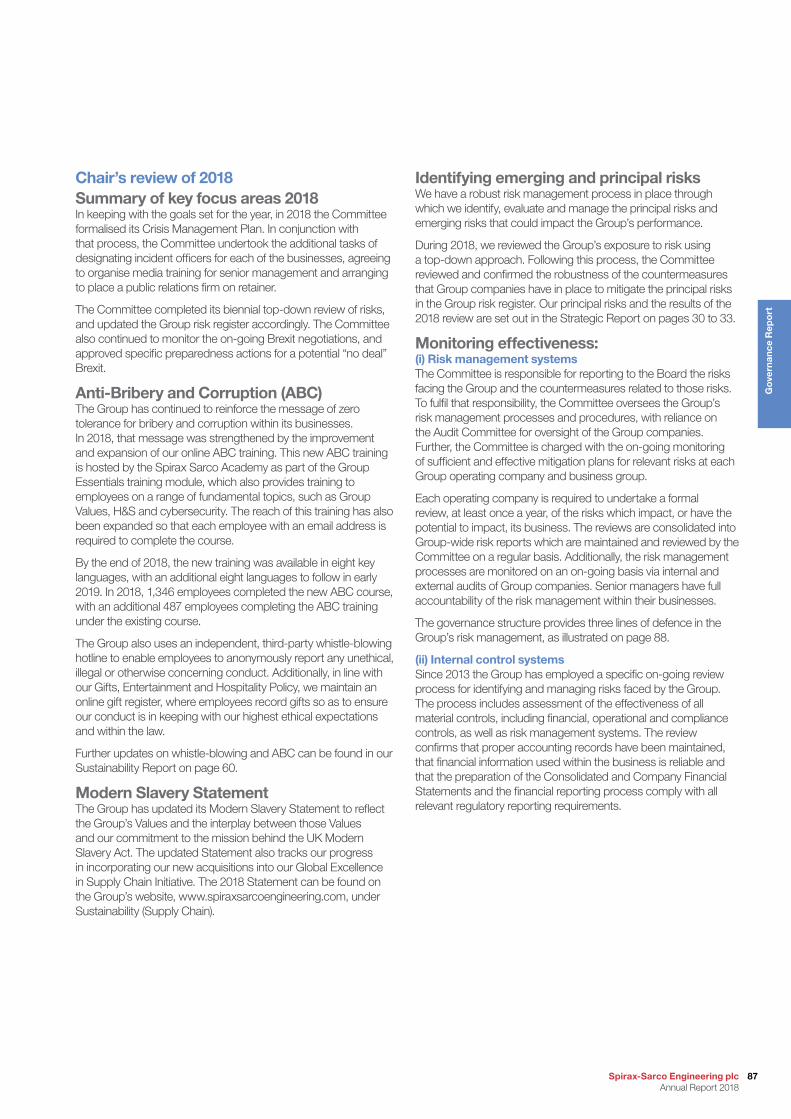
Chair’s review of 2018Summary of key focus areas 2018In keeping with the goals set for the year, in 2018 the Committee formalised its Crisis Management Plan. In conjunction with that process, the Committee undertook the additional tasks of designating incident officers for each of the businesses, agreeing to organise media training for senior management and arranging to place a public relations firm on retainer.
The Committee completed its biennial top-down review of risks, and updated the Group risk register accordingly. The Committee also continued to monitor the on-going Brexit negotiations, and approved specific preparedness actions for a potential “no deal” Brexit.
Anti-Bribery and Corruption (ABC)The Group has continued to reinforce the message of zero tolerance for bribery and corruption within its businesses. In 2018, that message was strengthened by the improvement and expansion of our online ABC training. This new ABC training is hosted by the Spirax Sarco Academy as part of the Group Essentials training module, which also provides training to employees on a range of fundamental topics, such as Group Values, H&S and cybersecurity. The reach of this training has also been expanded so that each employee with an email address is required to complete the course.
By the end of 2018, the new training was available in eight key languages, with an additional eight languages to follow in early 2019. In 2018, 1,346 employees completed the new ABC course, with an additional 487 employees completing the ABC training under the existing course.
The Group also uses an independent, third-party whistle-blowing hotline to enable employees to anonymously report any unethical, illegal or otherwise concerning conduct. Additionally, in line with our Gifts, Entertainment and Hospitality Policy, we maintain an online gift register, where employees record gifts so as to ensure our conduct is in keeping with our highest ethical expectations and within the law.
Further updates on whistle-blowing and ABC can be found in our Sustainability Report on page 60.
Modern Slavery StatementThe Group has updated its Modern Slavery Statement to reflect the Group’s Values and the interplay between those Values and our commitment to the mission behind the UK Modern Slavery Act. The updated Statement also tracks our progress in incorporating our new acquisitions into our Global Excellence in Supply Chain Initiative. The 2018 Statement can be found on the Group’s website, www.spiraxsarcoengineering.com, under Sustainability (Supply Chain).
Identifying emerging and principal risksWe have a robust risk management process in place through which we identify, evaluate and manage the principal risks and emerging risks that could impact the Group’s performance.
During 2018, we reviewed the Group’s exposure to risk using a top-down approach. Following this process, the Committee reviewed and confirmed the robustness of the countermeasures that Group companies have in place to mitigate the principal risks in the Group risk register. Our principal risks and the results of the 2018 review are set out in the Strategic Report on pages 30 to 33.
Monitoring effectiveness: (i) Risk management systemsThe Committee is responsible for reporting to the Board the risks facing the Group and the countermeasures related to those risks. To fulfil that responsibility, the Committee oversees the Group’s risk management processes and procedures, with reliance on the Audit Committee for oversight of the Group companies. Further, the Committee is charged with the on-going monitoring of sufficient and effective mitigation plans for relevant risks at each Group operating company and business group.
Each operating company is required to undertake a formal review, at least once a year, of the risks which impact, or have the potential to impact, its business. The reviews are consolidated into Group-wide risk reports which are maintained and reviewed by the Committee on a regular basis. Additionally, the risk management processes are monitored on an on-going basis via internal and external audits of Group companies. Senior managers have full accountability of the risk management within their businesses.
The governance structure provides three lines of defence in the Group’s risk management, as illustrated on page 88.
(ii) Internal control systemsSince 2013 the Group has employed a specific on-going review process for identifying and managing risks faced by the Group. The process includes assessment of the effectiveness of all material controls, including financial, operational and compliance controls, as well as risk management systems. The review confirms that proper accounting records have been maintained, that financial information used within the business is reliable and that the preparation of the Consolidated and Company Financial Statements and the financial reporting process comply with all relevant regulatory reporting requirements.
87Spirax-Sarco Engineering plc Annual Report 2018
Go
vern
ance
Rep
ort
4. Audit, risk and internal controlcontinued
Risk Management Committee continuedEvery year, via a self-certification questionnaire, General Managers and Finance Managers of every Group company are required to self-certify compliance with the policies, procedures and minimum requirements for an effective system of internal controls. The Committee uses this information, as well as information from the top-down and bottom-up risk review processes, to have meaningful and on-going oversight of risks across the business.
Whilst internal controls are not an absolute assurance against material misstatement or loss, the Board believes the regular cycle of review paired with internal monitoring provides a commercially sound approach to protect the Group from the risks that are a necessary part of its operations. As required by the UK Listing Authority, throughout the year and up to the date of the publication of the Annual Report, the Group has complied with the Code provisions on internal controls.
(iii) Internal auditThe Group’s standard policy regarding internal auditing is that each operating company is audited once every five years (most more frequently). Operating companies located in higher risk territories are audited more frequently, and businesses acquired by the Group are subject to internal audit within six months of completion.
The internal audit system is a crucial part of the risk management process. These internal audits are conducted by experienced, qualified accounting staff from principal operating companies and a professional auditing firm, BDO International. Additionally, in 2018 the Head of Internal Audit recruited a full-time team member to support the function.
Audit reports are made to the Audit Committee and the Board as a whole. The Committee has ensured compliance with centrally documented control procedures on such matters as capital expenditure, information and technology security and legal and regulatory compliance.
Risk Appetite Statement Risk is an inherent part of business and, in order to achieve our business aims, we must accept certain risks. We seek to implement a balanced approach to risk, ensuring that our resources are protected while still pursuing opportunities to accelerate and deliver growth.
The decision to take opportunity-based risks should, to the greatest extent possible, be deliberate and calculated.
We aim to confirm that the level of risk is commensurate with the strategic and economic benefits the risk might bring; we evaluate our ability to control the risk or mitigate its effects, should that risk materialise; and we always assess the potential ethical considerations arising from knowingly accepting some level of risk.
An informed and well-considered process is crucial to any decision to accept risk. The Committee has undertaken a thorough evaluation process to determine an appropriate risk appetite rating for each principal risk. These are set out on in detail on pages 30 to 33.
In summary, the Group has a very low appetite for risks that could lead to violations of health, safety and environmental legislation, or to breaches of legal and regulatory requirements.
In contrast, the Group has a high risk appetite in relation to economic and political instability; with decades of experience in successfully managing operations in volatile markets, we have the control procedures in place to handle the challenges that come with those risks and we appreciate that without taking risks in new, albeit sometimes unstable, territories we would miss out on valuable opportunities for growth.
As an organisation we are risk aware, but not risk averse. We continually monitor and assess the risks facing the Group and evaluate our ability to control them and mitigate their effects. Focusing on our strategic objectives, we evaluate our risk appetite and decisions to accept risk in a way that will ensure the on-going financial health of the Group.
First line of defence• The business is responsible for the identification, control
and management of its own risks
Second line of defence• The Risk Management Committee, with the Audit
Committee, ensures that the risk and compliance framework is effective so as to facilitate the monitoring of risk management with on-going challenge and review of the risk profile in the business
Third line of defence• Internal audits provide independent testing and verification of
compliance with policies and procedures and monitoring of follow-up actions where required.
Three lines of defence
Governance Report
Spirax-Sarco Engineering plc Annual Report 2018
88
Viability Statement The Directors have assessed the viability of the Group over a three-year period, taking into account the Group’s current financial position, business strategy, the Board’s risk appetite and the potential impacts of the principal risks, outlined on pages 30 to 33 of the Strategic Report, and the Risk Appetite Statement on page 88. Based on this assessment, the Directors confirm that they have a reasonable expectation that the Company will be able to continue in operation and meet its liabilities as they fall due over the three-year period to 31st December 2021.
The Board believes that a three-year viability assessment period is appropriate as the timeframe is covered by the Group’s rolling financial forecasts; takes into account the nature of the Group’s principal risks, a number of which are external and have the potential to impact over short time periods. While the Board has no reason to believe that the Group will not be viable over a longer period, given the inherent uncertainty involved, the Board believes that a three-year period presents readers of the Annual Report with a reasonable degree of confidence while still providing a longer-term perspective.
In making their assessment, the Directors completed a robust assessment of the principal risks facing the Group, as set out pages 30 to 33 of the Strategic Report, including those that could threaten its business model, future performance, solvency or liquidity, and undertook sensitivity and stress testing to determine the potential impacts of the occurrence of one or more of the principal risks on sales, profit, margin and cash.
In addition to completing an impact assessment of the principal risks, the Directors considered the probability of occurrence of the principal risks, the Company’s ability to control them and the effectiveness of mitigating actions.
The Group’s resilient business model has proven strong and defensive in the long term and has enabled the business to prosper, even in challenging market conditions. The diversity of our end user markets and customers, broad product range, wide geographic spread, high replacement revenue streams and large base of installed equipment worldwide, together with our effective direct sales business model, enhances the viability of the Group in the face of adverse economic conditions and/or political uncertainty, as does our ability to self-generate business through identifying solutions to our customers’ difficult process challenges and our ability to adjust our cost base.
Whilst no Board can ever fully foresee all possible risks facing the business in the future, the Directors are of the view that a robust assessment was undertaken of the severe but plausible scenarios that may feasibly impact upon the business over the next three years. We have also assumed that our various finance facilities will continue to be available. Furthermore, the Board remains confident in the Group’s risk management process and the risk mitigation actions taken to address identified risks.
A number of scenarios were developed from the Group’s principal risks, and the impact on future viability of the two most severe but plausible scenarios happening simultaneously, was assessed. The scenarios being major economic/political instability and a significant breach of legal and regulatory requirements. This analysis demonstrated that even in these extreme circumstances, the Group maintains its viability. In addition to this impact assessment, the Directors also considered the probability of occurrence of the principal risks, the Company’s ability to control them and the effectiveness of mitigating actions. No viability issues resulted.
Brexit is a focus of the Committee and an update on activity and actions taken to mitigate the impacts of Brexit on the Group are detailed in the Strategic Report on page 29. Further disclosure on actions taken relating to Brexit are included in the Governance Report on page 69. The risks arising from a “no deal” Brexit were considered as part of the viability assessment, but the impact on future viability was not considered as significant.
Whilst the viability of the Group has been assessed over a three-year period, the Directors have also assessed the prospects of the Group over the longer term. Disclosures relating to the longer term are set out on the inside cover of the Annual Report: Engineering sustainable growth, and in Our business model on pages 12 to 15.
Committee focus for 2019• Continue to monitor and update preparedness plan for Brexit• Full assessment of the impact of climate change• Bottom-up risk review
Nicholas AndersonChair of Risk Management Committee
89Spirax-Sarco Engineering plc Annual Report 2018
Go
vern
ance
Rep
ort
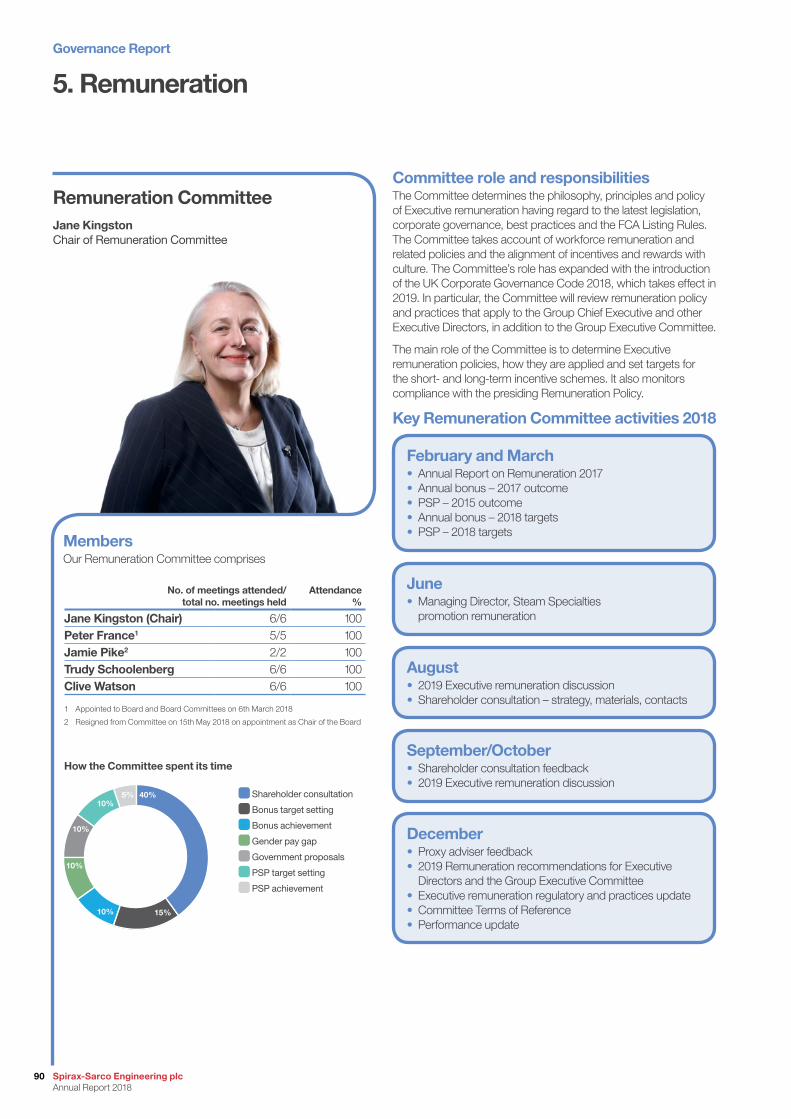
5. Remuneration
Committee role and responsibilitiesThe Committee determines the philosophy, principles and policy of Executive remuneration having regard to the latest legislation, corporate governance, best practices and the FCA Listing Rules. The Committee takes account of workforce remuneration and related policies and the alignment of incentives and rewards with culture. The Committee’s role has expanded with the introduction of the UK Corporate Governance Code 2018, which takes effect in 2019. In particular, the Committee will review remuneration policy and practices that apply to the Group Chief Executive and other Executive Directors, in addition to the Group Executive Committee.
The main role of the Committee is to determine Executive remuneration policies, how they are applied and set targets for the short- and long-term incentive schemes. It also monitors compliance with the presiding Remuneration Policy.
Key Remuneration Committee activities 2018
February and March• Annual Report on Remuneration 2017• Annual bonus – 2017 outcome • PSP – 2015 outcome • Annual bonus – 2018 targets• PSP – 2018 targets
August• 2019 Executive remuneration discussion• Shareholder consultation – strategy, materials, contacts
June• Managing Director, Steam Specialties
promotion remuneration
September/October• Shareholder consultation feedback• 2019 Executive remuneration discussion
December• Proxy adviser feedback • 2019 Remuneration recommendations for Executive
Directors and the Group Executive Committee• Executive remuneration regulatory and practices update• Committee Terms of Reference• Performance update
Jane KingstonChair of Remuneration Committee
Remuneration Committee
How the Committee spent its time
MembersOur Remuneration Committee comprises
No. of meetings attended/ total no. meetings held
Attendance %
Jane Kingston (Chair) 6/6 100Peter France1 5/5 100Jamie Pike2 2/2 100Trudy Schoolenberg 6/6 100Clive Watson 6/6 100
1 Appointed to Board and Board Committees on 6th March 2018
2 Resigned from Committee on 15th May 2018 on appointment as Chair of the Board
Shareholder consultation
Bonus target setting
Bonus achievement
Gender pay gap
Government proposals
PSP target setting
PSP achievement
40%
15%
10%
10%
10%
10%5%
Governance Report
Spirax-Sarco Engineering plc Annual Report 2018
90
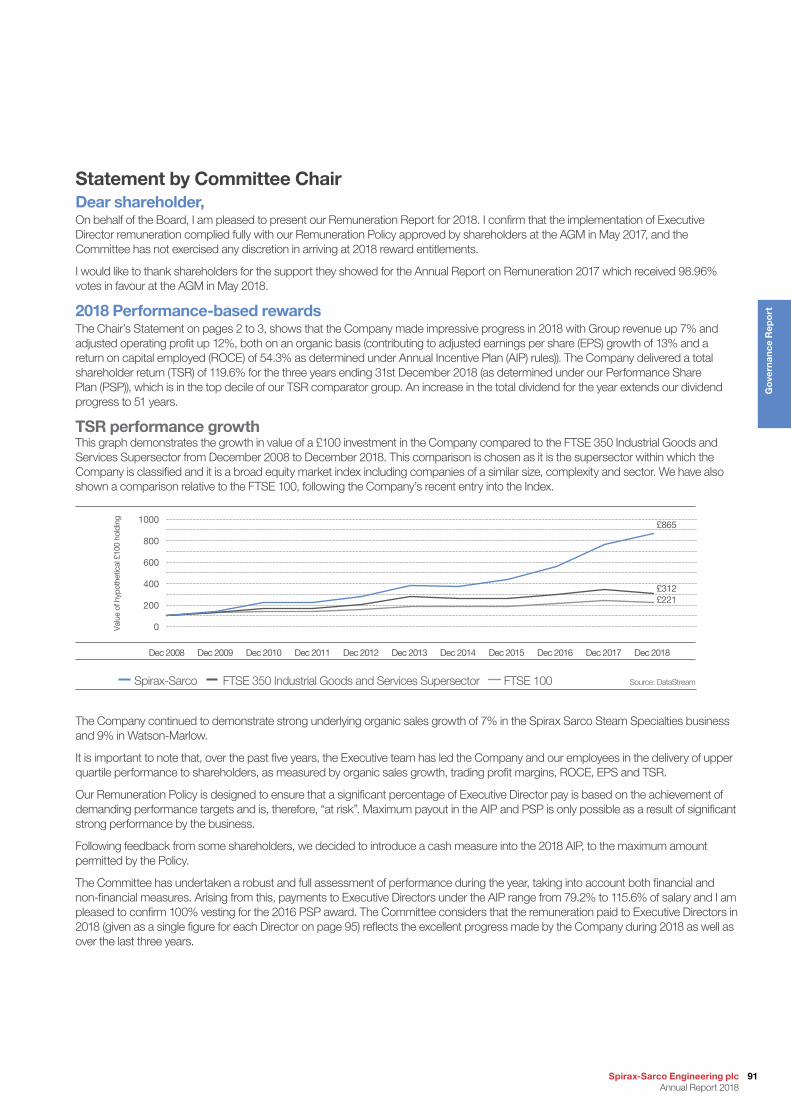
Statement by Committee ChairDear shareholder, On behalf of the Board, I am pleased to present our Remuneration Report for 2018. I confirm that the implementation of Executive Director remuneration complied fully with our Remuneration Policy approved by shareholders at the AGM in May 2017, and the Committee has not exercised any discretion in arriving at 2018 reward entitlements.
I would like to thank shareholders for the support they showed for the Annual Report on Remuneration 2017 which received 98.96% votes in favour at the AGM in May 2018.
2018 Performance-based rewardsThe Chair’s Statement on pages 2 to 3, shows that the Company made impressive progress in 2018 with Group revenue up 7% and adjusted operating profit up 12%, both on an organic basis (contributing to adjusted earnings per share (EPS) growth of 13% and a return on capital employed (ROCE) of 54.3% as determined under Annual Incentive Plan (AIP) rules)). The Company delivered a total shareholder return (TSR) of 119.6% for the three years ending 31st December 2018 (as determined under our Performance Share Plan (PSP)), which is in the top decile of our TSR comparator group. An increase in the total dividend for the year extends our dividend progress to 51 years.
TSR performance growthThis graph demonstrates the growth in value of a £100 investment in the Company compared to the FTSE 350 Industrial Goods and Services Supersector from December 2008 to December 2018. This comparison is chosen as it is the supersector within which the Company is classified and it is a broad equity market index including companies of a similar size, complexity and sector. We have also shown a comparison relative to the FTSE 100, following the Company’s recent entry into the Index.
0
200
400
600
800
1000
Dec 2008 Dec 2009 Dec 2010 Dec 2011 Dec 2012 Dec 2013 Dec 2014 Dec 2016 Dec 2018Dec 2017Dec 2015
Spirax-Sarco FTSE 350 Industrial Goods and Services Supersector Source: DataStream
Valu
e of
hyp
othe
tical
£10
0 ho
ldin
g
FTSE 100
£865
£312£221
The Company continued to demonstrate strong underlying organic sales growth of 7% in the Spirax Sarco Steam Specialties business and 9% in Watson-Marlow.
It is important to note that, over the past five years, the Executive team has led the Company and our employees in the delivery of upper quartile performance to shareholders, as measured by organic sales growth, trading profit margins, ROCE, EPS and TSR.
Our Remuneration Policy is designed to ensure that a significant percentage of Executive Director pay is based on the achievement of demanding performance targets and is, therefore, “at risk”. Maximum payout in the AIP and PSP is only possible as a result of significant strong performance by the business.
Following feedback from some shareholders, we decided to introduce a cash measure into the 2018 AIP, to the maximum amount permitted by the Policy.
The Committee has undertaken a robust and full assessment of performance during the year, taking into account both financial and non-financial measures. Arising from this, payments to Executive Directors under the AIP range from 79.2% to 115.6% of salary and I am pleased to confirm 100% vesting for the 2016 PSP award. The Committee considers that the remuneration paid to Executive Directors in 2018 (given as a single figure for each Director on page 95) reflects the excellent progress made by the Company during 2018 as well as over the last three years.
91Spirax-Sarco Engineering plc Annual Report 2018
Go
vern
ance
Rep
ort

Navigating our remuneration informationStatement by Committee Chair A summary of our key activities and decisions in the year
in the context of our strategic performancePage 91-92
Remuneration at a glance An overview of our key remuneration elements Page 93
Company engagement How we engage with shareholders on remuneration and outcomes
Page 94
Annual Report on Remuneration 2018 Directors’ remuneration, pensions, shareholdings and service agreements
Page 95-109
Remuneration Policy Report 2017 The current Policy approved at the AGM in May 2017 Page 110-119
2019 Executive remuneration review The Executive remuneration review and the accompanying shareholder consultation were the most important matters addressed by the Committee in 2018. In undertaking this review we are seeking to address a historic difficulty caused by (i) very conservative pay practices and (ii) internal promotions, now compounded by increased business complexity and scale. As a result, all four of our Executive Directors were positioned below the lower quartile for on-target pay (whether looking at (i) base, (ii) base plus target bonus, or (iii) base, target bonus and target PSP award), as compared to a set of 15 UK engineering companies we use regularly for benchmarking and from which we recruit, along with other cross-industry size-appropriate groups (e.g. FTSE 70 to 150).
The business has continued to grow organically, increase in complexity with the acquisitions of Gestra and Chromalox, and recently entered the FTSE 100 index, all while continuing to deliver strong and consistent performance.
The Board is concerned that a failure to address the situation could present a business continuity risk at a crucial time (integration of acquisitions, challenge of managing a more complex business with new technology) as well as adversely affecting the Company’s ability to attract high-calibre executives in the future.
Shareholder consultationIn arriving at our final recommendation we consulted with 17 of our top shareholders, outlining our challenge and discussing possible solutions. In aggregate they represented over 50% of our total shares outstanding, and gave us helpful and constructive advice. There was extensive support for the need to address the situation, with almost all of our shareholders preferring a one-off reset as opposed to a string of changes over time. Additionally, we met with ISS, The Investment Association and Glass Lewis, in recognition of their influence on voting outcomes and given many of our shareholders engage their services.
The Committee reviewed and discussed all of the advice and feedback received during the consultation. Following these discussions, we concluded a one-off reset to remuneration within the confines of our 2017 Remuneration Policy was right for our shareholders, the Company, our employees, our customers as well as fair for our Executive Directors.
The final outcome approved by the Committee, details of which are set out on pages 107 to 109, and our commitments for the 2020 Remuneration Policy on page 109, incorporate many additional features based on the feedback received during the consultation.
Although we recognise that this is a very difficult time and environment in which to undertake such change, we nevertheless believe it is necessary before the gap to market grows ever more severe. We trust that we can count on your support for the final position (summarised in the table on page 108), which is within the scope of our current Remuneration Policy and is reasonable as it aligns our Executives’ remuneration with the lower quartile of the peer group, despite this Executive team leading the Company in the delivery of upper quartile performance over the past five years.
Wider workforce environment I am encouraged by management’s commitment to invest in employees at all levels. The Committee already receives some information on regional pay norms and we will continue to develop this reporting in 2019, taking into account broader information on workforce pay, policies, practices and diversity to contextualise the decisions of the Committee under its broader 2019 remit.
UK Corporate Governance Code 2018The UK Corporate Governance Code 2018 (2018 Code) will change the scope for the Committee. Going forward, we will determine the remuneration policy and practices for the businesses’ Executive Committees, in addition to the Executive Directors. In setting Executive remuneration, we will look at workforce remuneration and the alignment of rewards with culture. We have revised our Terms of Reference to align with the Committee’s change of scope under the 2018 Code.
Committee focus 2019• Implement the changes following the Executive
remuneration review• Develop a new Remuneration Policy for 2020• Increase the remit to cover the Group Executive Committee
I hope that this provides a useful overview of the activities and decisions the Committee has taken during 2018.
Jane KingstonChair of Remuneration Committee6th March 2019
5. Remunerationcontinued
Governance Report
Spirax-Sarco Engineering plc Annual Report 2018
92
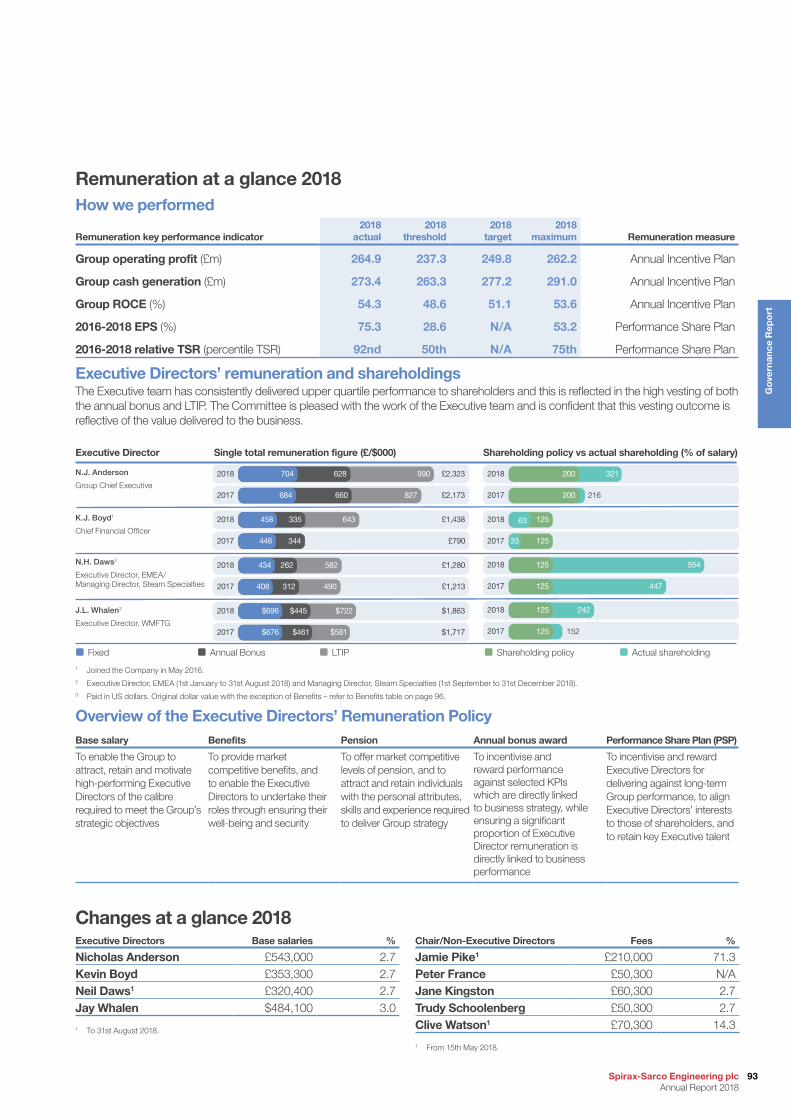
Remuneration at a glance 2018How we performed
Remuneration key performance indicator 2018
actual2018
threshold2018
target2018
maximum Remuneration measure
Group operating profit (£m) 264.9 237.3 249.8 262.2 Annual Incentive Plan
Group cash generation (£m) 273.4 263.3 277.2 291.0 Annual Incentive Plan
Group ROCE (%) 54.3 48.6 51.1 53.6 Annual Incentive Plan
2016-2018 EPS (%) 75.3 28.6 N/A 53.2 Performance Share Plan
2016-2018 relative TSR (percentile TSR) 92nd 50th N/A 75th Performance Share Plan
Executive Directors’ remuneration and shareholdingsThe Executive team has consistently delivered upper quartile performance to shareholders and this is reflected in the high vesting of both the annual bonus and LTIP. The Committee is pleased with the work of the Executive team and is confident that this vesting outcome is reflective of the value delivered to the business.
Executive Director Single total remuneration figure (£/$000) Shareholding policy vs actual shareholding (% of salary)
Fixed Annual Bonus LTIP Shareholding policy Actual shareholding
1 Joined the Company in May 2016. 2 Executive Director, EMEA (1st January to 31st August 2018) and Managing Director, Steam Specialties (1st September to 31st December 2018).3 Paid in US dollars. Original dollar value with the exception of Benefits – refer to Benefits table on page 96.
Overview of the Executive Directors’ Remuneration PolicyBase salary Benefits Pension Annual bonus award Performance Share Plan (PSP)
To enable the Group to attract, retain and motivate high-performing Executive Directors of the calibre required to meet the Group’s strategic objectives
To provide market competitive benefits, and to enable the Executive Directors to undertake their roles through ensuring their well-being and security
To offer market competitive levels of pension, and to attract and retain individuals with the personal attributes, skills and experience required to deliver Group strategy
To incentivise and reward performance against selected KPIs which are directly linked to business strategy, while ensuring a significant proportion of Executive Director remuneration is directly linked to business performance
To incentivise and reward Executive Directors for delivering against long-term Group performance, to align Executive Directors’ interests to those of shareholders, and to retain key Executive talent
Changes at a glance 2018Executive Directors Base salaries %
Nicholas Anderson £543,000 2.7Kevin Boyd £353,300 2.7Neil Daws1 £320,400 2.7Jay Whalen $484,100 3.0
1 To 31st August 2018.
Chair/Non-Executive Directors Fees %
Jamie Pike1 £210,000 71.3Peter France £50,300 N/AJane Kingston £60,300 2.7Trudy Schoolenberg £50,300 2.7Clive Watson1 £70,300 14.3
1 From 15th May 2018.
N.J. Anderson
Group Chief Executive2018
2017
704 628 990 £2,323
£2,173684 660 827
2018
2017
200 321
200 216
K.J. Boyd1
Chief Financial Officer2018
2017
63 125
33 125
2018
2017
458 335 643 £1,438
£790446 344
N.H. Daws2
Executive Director, EMEA/ Managing Director, Steam Specialties
2018
2017
125 554
125 447
2018
2017
434 262 582 £1,280
£1,213408 312 490
J.L. Whalen3
Executive Director, WMFTG
2018
2017
125 242
125 152
2018
2017
$696 $445 $722 $1,863
$1,717$676 $461 $581
93Spirax-Sarco Engineering plc Annual Report 2018
Go
vern
ance
Rep
ort
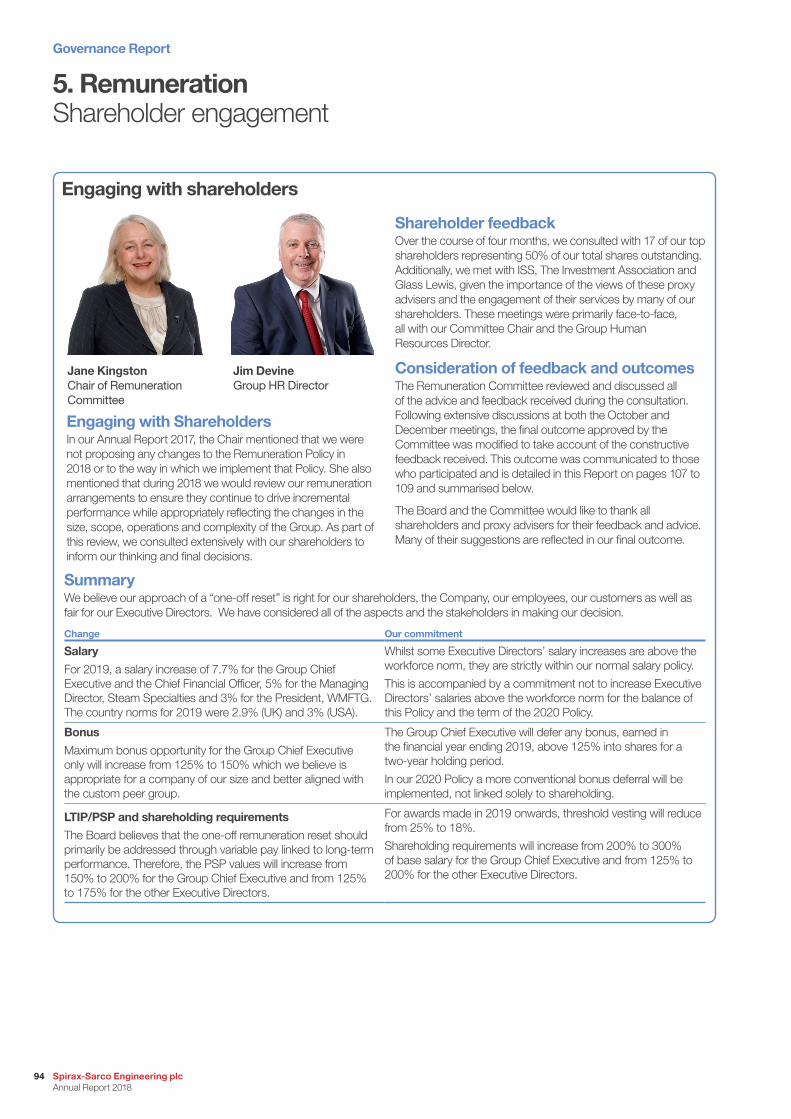
Engaging with shareholders
Jane KingstonChair of Remuneration Committee
Jim DevineGroup HR Director
5. Remuneration Shareholder engagement
Engaging with ShareholdersIn our Annual Report 2017, the Chair mentioned that we were not proposing any changes to the Remuneration Policy in 2018 or to the way in which we implement that Policy. She also mentioned that during 2018 we would review our remuneration arrangements to ensure they continue to drive incremental performance while appropriately reflecting the changes in the size, scope, operations and complexity of the Group. As part of this review, we consulted extensively with our shareholders to inform our thinking and final decisions.
Shareholder feedbackOver the course of four months, we consulted with 17 of our top shareholders representing 50% of our total shares outstanding. Additionally, we met with ISS, The Investment Association and Glass Lewis, given the importance of the views of these proxy advisers and the engagement of their services by many of our shareholders. These meetings were primarily face‑to‑face, all with our Committee Chair and the Group Human Resources Director.
Consideration of feedback and outcomes The Remuneration Committee reviewed and discussed all of the advice and feedback received during the consultation. Following extensive discussions at both the October and December meetings, the final outcome approved by the Committee was modified to take account of the constructive feedback received. This outcome was communicated to those who participated and is detailed in this Report on pages 107 to 109 and summarised below.
The Board and the Committee would like to thank all shareholders and proxy advisers for their feedback and advice. Many of their suggestions are reflected in our final outcome.
SummaryWe believe our approach of a “one‑off reset” is right for our shareholders, the Company, our employees, our customers as well as fair for our Executive Directors. We have considered all of the aspects and the stakeholders in making our decision.
Change Our commitment
Salary
For 2019, a salary increase of 7.7% for the Group Chief Executive and the Chief Financial Officer, 5% for the Managing Director, Steam Specialties and 3% for the President, WMFTG. The country norms for 2019 were 2.9% (UK) and 3% (USA).
Whilst some Executive Directors’ salary increases are above the workforce norm, they are strictly within our normal salary policy.
This is accompanied by a commitment not to increase Executive Directors’ salaries above the workforce norm for the balance of this Policy and the term of the 2020 Policy.
Bonus
Maximum bonus opportunity for the Group Chief Executive only will increase from 125% to 150% which we believe is appropriate for a company of our size and better aligned with the custom peer group.
The Group Chief Executive will defer any bonus, earned in the financial year ending 2019, above 125% into shares for a two‑year holding period.
In our 2020 Policy a more conventional bonus deferral will be implemented, not linked solely to shareholding.
LTIP/PSP and shareholding requirements
The Board believes that the one‑off remuneration reset should primarily be addressed through variable pay linked to long‑term performance. Therefore, the PSP values will increase from 150% to 200% for the Group Chief Executive and from 125% to 175% for the other Executive Directors.
For awards made in 2019 onwards, threshold vesting will reduce from 25% to 18%.
Shareholding requirements will increase from 200% to 300% of base salary for the Group Chief Executive and from 125% to 200% for the other Executive Directors.
Governance Report
Spirax-Sarco Engineering plc Annual Report 2018
94
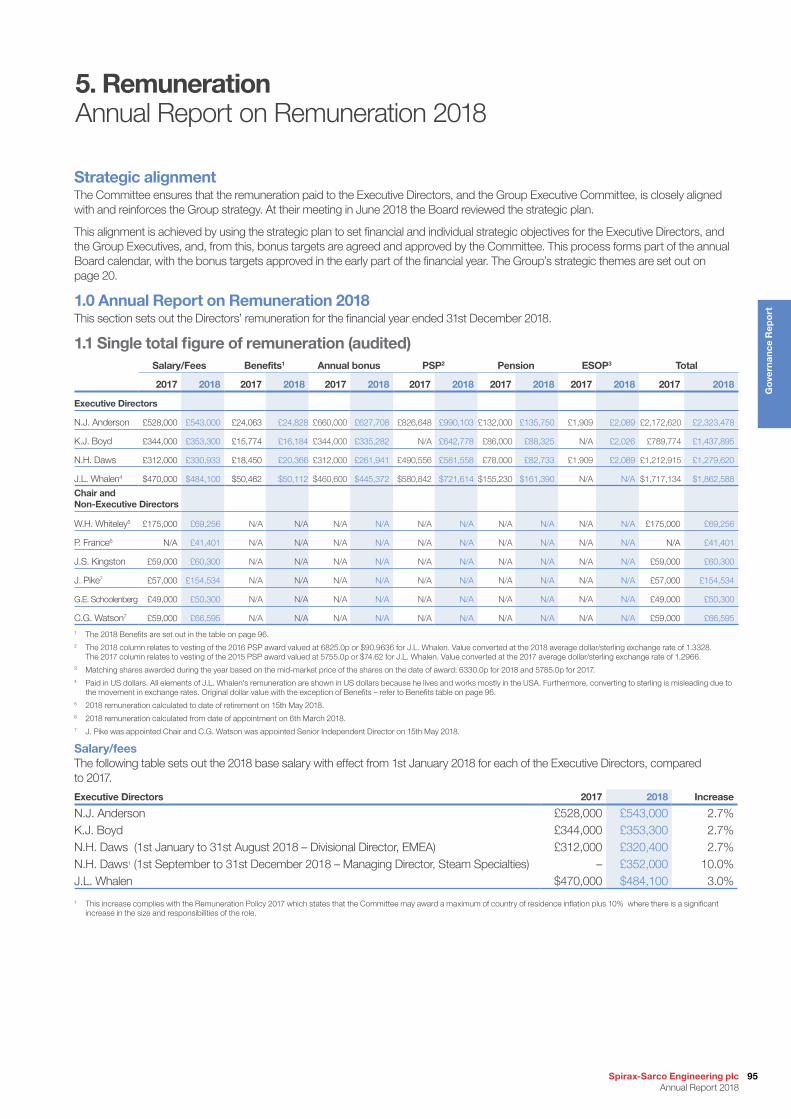
5. RemunerationAnnual Report on Remuneration 2018
Strategic alignmentThe Committee ensures that the remuneration paid to the Executive Directors, and the Group Executive Committee, is closely aligned with and reinforces the Group strategy. At their meeting in June 2018 the Board reviewed the strategic plan.
This alignment is achieved by using the strategic plan to set financial and individual strategic objectives for the Executive Directors, and the Group Executives, and, from this, bonus targets are agreed and approved by the Committee. This process forms part of the annual Board calendar, with the bonus targets approved in the early part of the financial year. The Group’s strategic themes are set out on page 20.
1.0 Annual Report on Remuneration 2018This section sets out the Directors’ remuneration for the financial year ended 31st December 2018.
1.1 Single total figure of remuneration (audited) Salary/Fees Benefits1 Annual bonus PSP2 Pension ESOP3 Total
2017 2018 2017 2018 2017 2018 2017 2018 2017 2018 2017 2018 2017 2018
Executive Directors
N.J. Anderson £528,000 £543,000 £24,063 £24,828 £660,000 £627,708 £826,648 £990,103 £132,000 £135,750 £1,909 £2,089 £2,172,620 £2,323,478
K.J. Boyd £344,000 £353,300 £15,774 £16,184 £344,000 £335,282 N/A £642,778 £86,000 £88,325 N/A £2,026 £789,774 £1,437,895
N.H. Daws £312,000 £330,933 £18,450 £20,366 £312,000 £261,941 £490,556 £581,558 £78,000 £82,733 £1,909 £2,089 £1,212,915 £1,279,620
J.L. Whalen4 $470,000 $484,100 $50,462 $50,112 $460,600 $445,372 $580,842 $721,614 $155,230 $161,390 N/A N/A $1,717,134 $1,862,588
Chair and Non-Executive Directors
W.H. Whiteley5 £175,000 £69,256 N/A N/A N/A N/A N/A N/A N/A N/A N/A N/A £175,000 £69,256
P. France6 N/A £41,401 N/A N/A N/A N/A N/A N/A N/A N/A N/A N/A N/A £41,401
J.S. Kingston £59,000 £60,300 N/A N/A N/A N/A N/A N/A N/A N/A N/A N/A £59,000 £60,300
J. Pike7 £57,000 £154,534 N/A N/A N/A N/A N/A N/A N/A N/A N/A N/A £57,000 £154,534
G.E. Schoolenberg £49,000 £50,300 N/A N/A N/A N/A N/A N/A N/A N/A N/A N/A £49,000 £50,300
C.G. Watson7 £59,000 £66,595 N/A N/A N/A N/A N/A N/A N/A N/A N/A N/A £59,000 £66,595
1 The 2018 Benefits are set out in the table on page 96. 2 The 2018 column relates to vesting of the 2016 PSP award valued at 6825.0p or $90.9636 for J.L. Whalen. Value converted at the 2018 average dollar/sterling exchange rate of 1.3328.
The 2017 column relates to vesting of the 2015 PSP award valued at 5755.0p or $74.62 for J.L. Whalen. Value converted at the 2017 average dollar/sterling exchange rate of 1.2966.3 Matching shares awarded during the year based on the mid-market price of the shares on the date of award: 6330.0p for 2018 and 5785.0p for 2017. 4 Paid in US dollars. All elements of J.L. Whalen’s remuneration are shown in US dollars because he lives and works mostly in the USA. Furthermore, converting to sterling is misleading due to
the movement in exchange rates. Original dollar value with the exception of Benefits – refer to Benefits table on page 96. 5 2018 remuneration calculated to date of retirement on 15th May 2018. 6 2018 remuneration calculated from date of appointment on 6th March 2018. 7 J. Pike was appointed Chair and C.G. Watson was appointed Senior Independent Director on 15th May 2018.
Salary/feesThe following table sets out the 2018 base salary with effect from 1st January 2018 for each of the Executive Directors, compared to 2017.
Executive Directors 2017 2018 Increase
N.J. Anderson £528,000 £543,000 2.7%K.J. Boyd £344,000 £353,300 2.7%N.H. Daws (1st January to 31st August 2018 – Divisional Director, EMEA) £312,000 £320,400 2.7%N.H. Daws1 (1st September to 31st December 2018 – Managing Director, Steam Specialties) – £352,000 10.0%J.L. Whalen $470,000 $484,100 3.0%
1 This increase complies with the Remuneration Policy 2017 which states that the Committee may award a maximum of country of residence inflation plus 10% where there is a significant increase in the size and responsibilities of the role.
95Spirax-Sarco Engineering plc Annual Report 2018
Go
vern
ance
Rep
ort
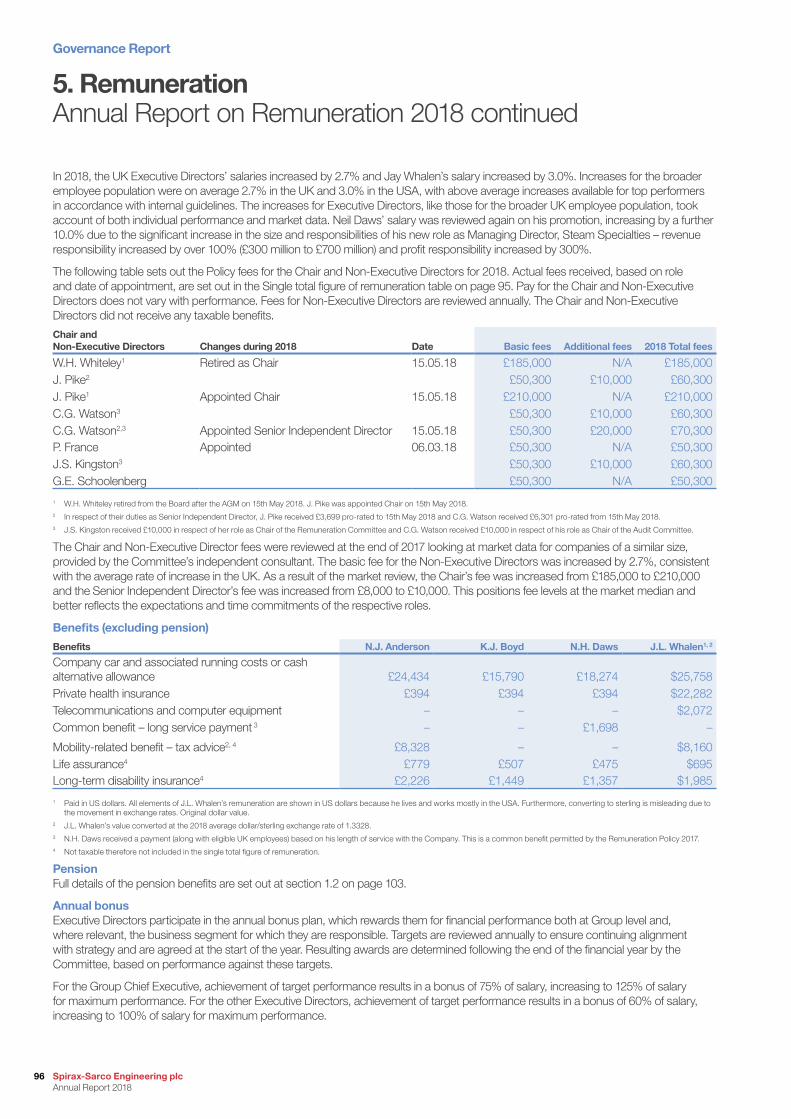
In 2018, the UK Executive Directors’ salaries increased by 2.7% and Jay Whalen’s salary increased by 3.0%. Increases for the broader employee population were on average 2.7% in the UK and 3.0% in the USA, with above average increases available for top performers in accordance with internal guidelines. The increases for Executive Directors, like those for the broader UK employee population, took account of both individual performance and market data. Neil Daws’ salary was reviewed again on his promotion, increasing by a further 10.0% due to the significant increase in the size and responsibilities of his new role as Managing Director, Steam Specialties – revenue responsibility increased by over 100% (£300 million to £700 million) and profit responsibility increased by 300%.
The following table sets out the Policy fees for the Chair and Non-Executive Directors for 2018. Actual fees received, based on role and date of appointment, are set out in the Single total figure of remuneration table on page 95. Pay for the Chair and Non-Executive Directors does not vary with performance. Fees for Non-Executive Directors are reviewed annually. The Chair and Non-Executive Directors did not receive any taxable benefits.
Chair and Non-Executive Directors Changes during 2018 Date Basic fees Additional fees 2018 Total fees
W.H. Whiteley1 Retired as Chair 15.05.18 £185,000 N/A £185,000J. Pike2 £50,300 £10,000 £60,300J. Pike1 Appointed Chair 15.05.18 £210,000 N/A £210,000C.G. Watson3 £50,300 £10,000 £60,300C.G. Watson2,3 Appointed Senior Independent Director 15.05.18 £50,300 £20,000 £70,300P. France Appointed 06.03.18 £50,300 N/A £50,300J.S. Kingston3 £50,300 £10,000 £60,300G.E. Schoolenberg £50,300 N/A £50,300
1 W.H. Whiteley retired from the Board after the AGM on 15th May 2018. J. Pike was appointed Chair on 15th May 2018. 2 In respect of their duties as Senior Independent Director, J. Pike received £3,699 pro-rated to 15th May 2018 and C.G. Watson received £6,301 pro-rated from 15th May 2018.3 J.S. Kingston received £10,000 in respect of her role as Chair of the Remuneration Committee and C.G. Watson received £10,000 in respect of his role as Chair of the Audit Committee.
The Chair and Non-Executive Director fees were reviewed at the end of 2017 looking at market data for companies of a similar size, provided by the Committee’s independent consultant. The basic fee for the Non-Executive Directors was increased by 2.7%, consistent with the average rate of increase in the UK. As a result of the market review, the Chair’s fee was increased from £185,000 to £210,000 and the Senior Independent Director’s fee was increased from £8,000 to £10,000. This positions fee levels at the market median and better reflects the expectations and time commitments of the respective roles.
Benefits (excluding pension)
Benefits N.J. Anderson K.J. Boyd N.H. Daws J.L. Whalen1, 2
Company car and associated running costs or cash alternative allowance £24,434 £15,790 £18,274 $25,758Private health insurance £394 £394 £394 $22,282Telecommunications and computer equipment – – – $2,072Common benefit – long service payment 3 – – £1,698 –
Mobility-related benefit – tax advice2, 4 £8,328 – – $8,160Life assurance4 £779 £507 £475 $695Long-term disability insurance4 £2,226 £1,449 £1,357 $1,985
1 Paid in US dollars. All elements of J.L. Whalen’s remuneration are shown in US dollars because he lives and works mostly in the USA. Furthermore, converting to sterling is misleading due to the movement in exchange rates. Original dollar value.
2 J.L. Whalen’s value converted at the 2018 average dollar/sterling exchange rate of 1.3328.3 N.H. Daws received a payment (along with eligible UK employees) based on his length of service with the Company. This is a common benefit permitted by the Remuneration Policy 2017.4 Not taxable therefore not included in the single total figure of remuneration.
PensionFull details of the pension benefits are set out at section 1.2 on page 103.
Annual bonusExecutive Directors participate in the annual bonus plan, which rewards them for financial performance both at Group level and, where relevant, the business segment for which they are responsible. Targets are reviewed annually to ensure continuing alignment with strategy and are agreed at the start of the year. Resulting awards are determined following the end of the financial year by the Committee, based on performance against these targets.
For the Group Chief Executive, achievement of target performance results in a bonus of 75% of salary, increasing to 125% of salary for maximum performance. For the other Executive Directors, achievement of target performance results in a bonus of 60% of salary, increasing to 100% of salary for maximum performance.
5. RemunerationAnnual Report on Remuneration 2018 continued
Governance Report
Spirax-Sarco Engineering plc Annual Report 2018
96
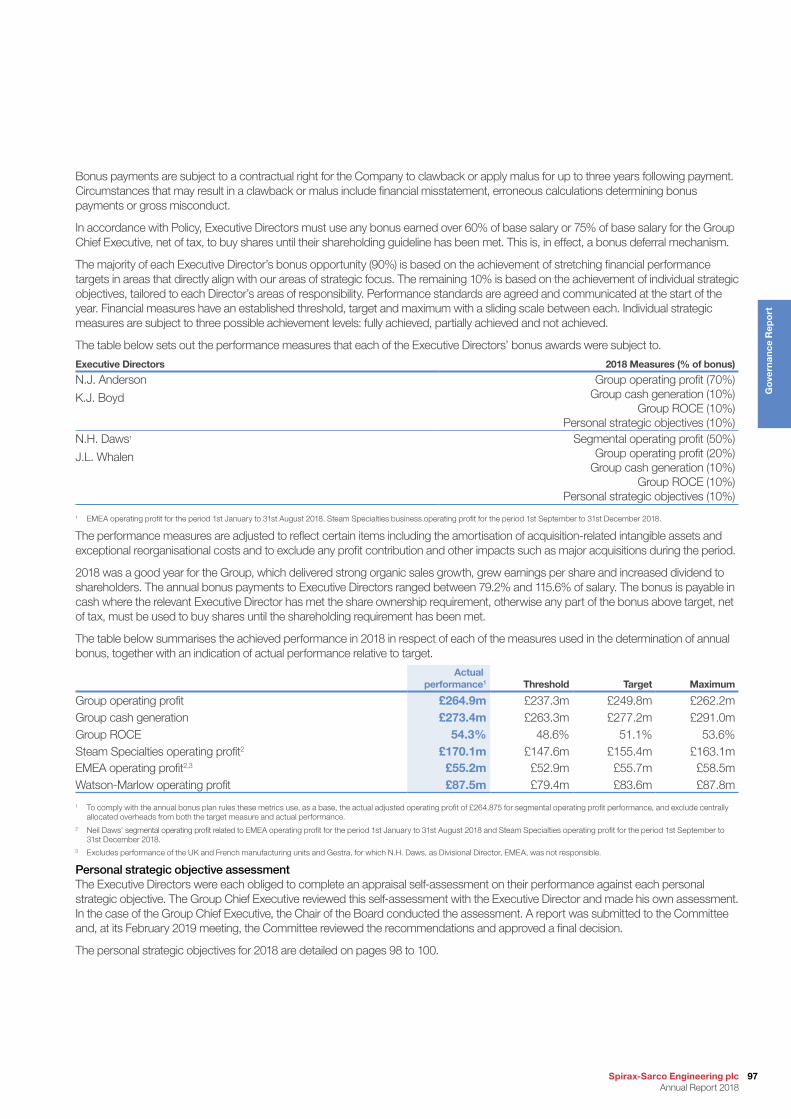
Bonus payments are subject to a contractual right for the Company to clawback or apply malus for up to three years following payment. Circumstances that may result in a clawback or malus include financial misstatement, erroneous calculations determining bonus payments or gross misconduct.
In accordance with Policy, Executive Directors must use any bonus earned over 60% of base salary or 75% of base salary for the Group Chief Executive, net of tax, to buy shares until their shareholding guideline has been met. This is, in effect, a bonus deferral mechanism.
The majority of each Executive Director’s bonus opportunity (90%) is based on the achievement of stretching financial performance targets in areas that directly align with our areas of strategic focus. The remaining 10% is based on the achievement of individual strategic objectives, tailored to each Director’s areas of responsibility. Performance standards are agreed and communicated at the start of the year. Financial measures have an established threshold, target and maximum with a sliding scale between each. Individual strategic measures are subject to three possible achievement levels: fully achieved, partially achieved and not achieved.
The table below sets out the performance measures that each of the Executive Directors’ bonus awards were subject to.
Executive Directors 2018 Measures (% of bonus)
N.J. Anderson
K.J. Boyd
Group operating profit (70%) Group cash generation (10%)
Group ROCE (10%) Personal strategic objectives (10%)
N.H. Daws1
J.L. Whalen
Segmental operating profit (50%) Group operating profit (20%)
Group cash generation (10%) Group ROCE (10%)
Personal strategic objectives (10%)
1 EMEA operating profit for the period 1st January to 31st August 2018. Steam Specialties business operating profit for the period 1st September to 31st December 2018.
The performance measures are adjusted to reflect certain items including the amortisation of acquisition-related intangible assets and exceptional reorganisational costs and to exclude any profit contribution and other impacts such as major acquisitions during the period.
2018 was a good year for the Group, which delivered strong organic sales growth, grew earnings per share and increased dividend to shareholders. The annual bonus payments to Executive Directors ranged between 79.2% and 115.6% of salary. The bonus is payable in cash where the relevant Executive Director has met the share ownership requirement, otherwise any part of the bonus above target, net of tax, must be used to buy shares until the shareholding requirement has been met.
The table below summarises the achieved performance in 2018 in respect of each of the measures used in the determination of annual bonus, together with an indication of actual performance relative to target.
Actualperformance1 Threshold Target Maximum
Group operating profit £264.9m £237.3m £249.8m £262.2mGroup cash generation £273.4m £263.3m £277.2m £291.0mGroup ROCE 54.3% 48.6% 51.1% 53.6%Steam Specialties operating profit2 £170.1m £147.6m £155.4m £163.1mEMEA operating profit2,3 £55.2m £52.9m £55.7m £58.5mWatson-Marlow operating profit £87.5m £79.4m £83.6m £87.8m
1 To comply with the annual bonus plan rules these metrics use, as a base, the actual adjusted operating profit of £264,875 for segmental operating profit performance, and exclude centrally allocated overheads from both the target measure and actual performance.
2 Neil Daws’ segmental operating profit related to EMEA operating profit for the period 1st January to 31st August 2018 and Steam Specialties operating profit for the period 1st September to 31st December 2018.
3 Excludes performance of the UK and French manufacturing units and Gestra, for which N.H. Daws, as Divisional Director, EMEA, was not responsible.
Personal strategic objective assessmentThe Executive Directors were each obliged to complete an appraisal self-assessment on their performance against each personal strategic objective. The Group Chief Executive reviewed this self-assessment with the Executive Director and made his own assessment. In the case of the Group Chief Executive, the Chair of the Board conducted the assessment. A report was submitted to the Committee and, at its February 2019 meeting, the Committee reviewed the recommendations and approved a final decision.
The personal strategic objectives for 2018 are detailed on pages 98 to 100.
97Spirax-Sarco Engineering plc Annual Report 2018
Go
vern
ance
Rep
ort

Personal strategic objective 2018 Description Achievement
Nicholas Anderson
Health, Safety and Sustainability (HS&S)
Accelerate and embed a step change in the HS&S performance of the Group, significantly improving the HS&S awareness and culture. Fast-track the Group’s Sustainability programme.
The actual number of accidents across the Group in 2018 was greater than in 2017, including “+three day lost time accidents”. However, there was a steady reduction during 2018 as a result of significant improvements in training. Gestra and Chromalox were integrated into the Sustainability programme; Group companies’ involvement in community projects increased; a Diversity and Inclusion Policy was rolled out, including a female mentoring programme; and the Group Carbon Disclosure Project climate change score improved from C to B.
Strategy implementation
Further and materially progress the Customer First strategy, including the Spirax Sarco Academy and the Product Lifecycle Management project in the Steam Specialties business.
All elements of our business strategy are progressing well, with all strategy metrics ahead of or on Plan in 2018. This is evidenced by above-average organic sales growth rates in all priority industry sectors, channels to market and product families. During 2018 Watson-Marlow completed the purchase of a small pre-revenue company and the Steam Specialties business completed the divestiture of HygroMatik GmbH.
Gestra integration
Ensure successful implementation of the acquisition integration plans across the Steam Specialties business.
Gestra achieved its overall integration objectives in 2018, ending the year with a strong positive momentum. To date, 10 of the 22 acquisition integration projects have been successfully completed, with the remaining progressing as planned. Noteworthy achievements include: structural re-organisation into sales and supply operating companies with strengthened management teams; new visual identity launched at ACHEMA in June 2018; the development of a next-generation boiler house controls product; and five-year geographic expansion roadmap, including setting-up an operating company in China to start trading in April 2019. In 2018, Gestra exceeded its acquisition plan orders, sales and profit.
Chromalox integration
Ensure successful implementation of the acquisition integration plans, with particular emphasis on the sales growth plans.
Chromalox achieved most of its integration objectives in 2018 and carries a strong sales growth momentum into 2019. Noteworthy integration achievements include: re-organisation into sales and supply operating companies in line with the Group’s operating model; development of new product ranges for sale outside the USA; setting-up a new operating company in Brazil, at least three new sales offices and, in EMEA, two quick response centres; and a cross-selling strategy jointly defined with the Steam Specialties business. Chromalox orders and sales exceeded the acquisition plan delivering full-year orders and sales growth over 2017.
Corporate governance Implement a new enhanced organisational structure by Q3 2018, separating the roles of Group Chief Executive and Managing Director, Steam Specialties, embedding the Group and the businesses’ Executive Committees and strengthening our talent management and succession programmes.
During 2018 the roles of Group Chief Executive and Managing Director, Steam Specialties were separated, with the promotion of Neil Daws to Managing Director, Steam Specialties and the appointment of Sean Clay as Divisional Director, EMEA, as announced in July 2018. New Executive governance procedures were defined. New levels of authority were established.
5. RemunerationAnnual Report on Remuneration 2018 continued
Governance Report
Spirax-Sarco Engineering plc Annual Report 2018
98
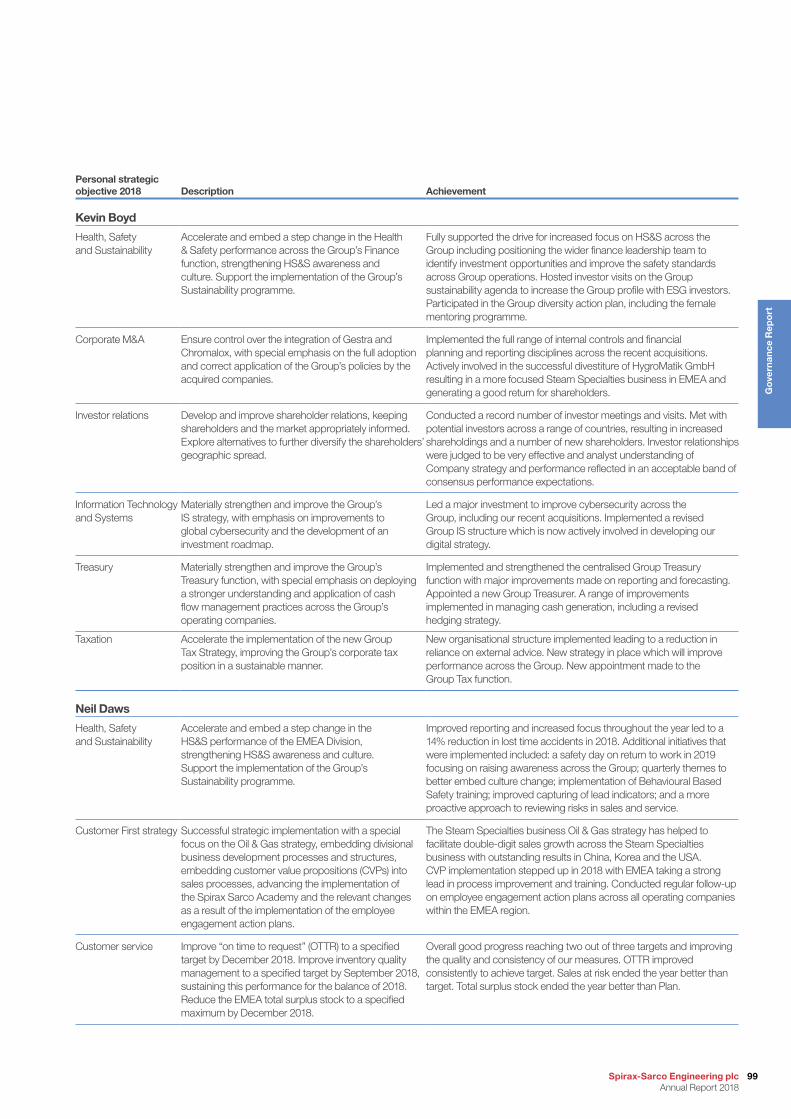
Personal strategic objective 2018 Description Achievement
Kevin Boyd
Health, Safety and Sustainability
Accelerate and embed a step change in the Health & Safety performance across the Group’s Finance function, strengthening HS&S awareness and culture. Support the implementation of the Group’s Sustainability programme.
Fully supported the drive for increased focus on HS&S across the Group including positioning the wider finance leadership team to identify investment opportunities and improve the safety standards across Group operations. Hosted investor visits on the Group sustainability agenda to increase the Group profile with ESG investors. Participated in the Group diversity action plan, including the female mentoring programme.
Corporate M&A Ensure control over the integration of Gestra and Chromalox, with special emphasis on the full adoption and correct application of the Group’s policies by the acquired companies.
Implemented the full range of internal controls and financial planning and reporting disciplines across the recent acquisitions. Actively involved in the successful divestiture of HygroMatik GmbH resulting in a more focused Steam Specialties business in EMEA and generating a good return for shareholders.
Investor relations Develop and improve shareholder relations, keeping shareholders and the market appropriately informed. Explore alternatives to further diversify the shareholders’ geographic spread.
Conducted a record number of investor meetings and visits. Met with potential investors across a range of countries, resulting in increased shareholdings and a number of new shareholders. Investor relationships were judged to be very effective and analyst understanding of Company strategy and performance reflected in an acceptable band of consensus performance expectations.
Information Technology and Systems
Materially strengthen and improve the Group’s IS strategy, with emphasis on improvements to global cybersecurity and the development of an investment roadmap.
Led a major investment to improve cybersecurity across the Group, including our recent acquisitions. Implemented a revised Group IS structure which is now actively involved in developing our digital strategy.
Treasury Materially strengthen and improve the Group’s Treasury function, with special emphasis on deploying a stronger understanding and application of cash flow management practices across the Group’s operating companies.
Implemented and strengthened the centralised Group Treasury function with major improvements made on reporting and forecasting. Appointed a new Group Treasurer. A range of improvements implemented in managing cash generation, including a revised hedging strategy.
Taxation Accelerate the implementation of the new Group Tax Strategy, improving the Group’s corporate tax position in a sustainable manner.
New organisational structure implemented leading to a reduction in reliance on external advice. New strategy in place which will improve performance across the Group. New appointment made to the Group Tax function.
Neil Daws
Health, Safety and Sustainability
Accelerate and embed a step change in the HS&S performance of the EMEA Division, strengthening HS&S awareness and culture. Support the implementation of the Group’s Sustainability programme.
Improved reporting and increased focus throughout the year led to a 14% reduction in lost time accidents in 2018. Additional initiatives that were implemented included: a safety day on return to work in 2019 focusing on raising awareness across the Group; quarterly themes to better embed culture change; implementation of Behavioural Based Safety training; improved capturing of lead indicators; and a more proactive approach to reviewing risks in sales and service.
Customer First strategy Successful strategic implementation with a special focus on the Oil & Gas strategy, embedding divisional business development processes and structures, embedding customer value propositions (CVPs) into sales processes, advancing the implementation of the Spirax Sarco Academy and the relevant changes as a result of the implementation of the employee engagement action plans.
The Steam Specialties business Oil & Gas strategy has helped to facilitate double-digit sales growth across the Steam Specialties business with outstanding results in China, Korea and the USA. CVP implementation stepped up in 2018 with EMEA taking a strong lead in process improvement and training. Conducted regular follow-up on employee engagement action plans across all operating companies within the EMEA region.
Customer service Improve “on time to request” (OTTR) to a specified target by December 2018. Improve inventory quality management to a specified target by September 2018, sustaining this performance for the balance of 2018. Reduce the EMEA total surplus stock to a specified maximum by December 2018.
Overall good progress reaching two out of three targets and improving the quality and consistency of our measures. OTTR improved consistently to achieve target. Sales at risk ended the year better than target. Total surplus stock ended the year better than Plan.
99Spirax-Sarco Engineering plc Annual Report 2018
Go
vern
ance
Rep
ort

Personal strategic objective 2018 Description Achievement
Neil Daws continuedGestra integration Ensure full support for the successful implementation
of the integration plans, with special emphasis on successful market intelligence co-ordination.
Provided support during the implementation of Gestra’s sectorised market expansion, which has been well-received by internal and external stakeholders. Segmental Oil & Gas sales team working alongside Gestra promoting both brands in the market, leading on whichever best meets customer needs. Structure implemented at operating company level to extend market intelligence committee reviews into longer term strategy sharing, aimed at accelerating sectorisation. Successfully led the establishment of a new Gestra operating company in China.
Oil & Gas synergies In conjunction with the President of Chromalox, by December 2018, develop an approved project charter for a heat tracing synergy strategy, leveraging the Group’s combined capabilities from a projects and maintenance, repair and operations perspective.
Good progress evolving the strategy to define and deliver business synergies by combining our Steam Specialties and Chromalox approach. Led a project to size the value of the USA contractor market.
Enterprise resource planning system
Ensure approval and subsequent implementation of this new step change project, successfully completing all necessary activities to ensure a first roll out in Q1 2019.
A new customer relationship management system was successfully piloted in Egypt. Some minor delays are being experienced with the project.
Jay WhalenHealth, Safety and Sustainability
Accelerate and embed a step change in the Health & Safety performance across WMFTG, strengthening HS&S awareness and culture. Support the implementation of the Group’s Sustainability programme.
Significant expansion of HS&S awareness and engagement across all operating companies; WMFTG’s intranet sustainability site was further developed to enable full reporting and better performance management; additional investment in six regional HS&S manager roles; WMFTG’s HS&S strategy framework and structure developed; and safety leadership training delivered.
Aflex Hose Single site consolidation plans submitted for approval by March 2018 and to be executed as planned by December 2018. Convert sales to WMFTG direct sales teams in certain stated countries.
Local authority approval gained for the new greenfield Aflex Hose site. Construction commenced in January 2019. Sales operations converted from distribution to direct in France, the United Arab Emirates (UAE), Korea, Singapore, South Africa and New England, USA.
New product introduction
Ensure successful and timely launch of specific innovative, new products.
New Flexicon PF7 pump and filler and the Flexicon FPC60 filling line launched. High capacity Qdos research phase completed with new product designs in progress and a project mandate approved in December.
Acquisitions Complete acquisition in Q1 2018, oversee the development of, and approve the new product range.
Successfully completed the purchase of a small pre-revenue company providing the Group with future technologies that will improve current customer offerings.
Territorial expansion Ensure successful start-up of a new sales company in the UAE in Q1 2018. Convert representative to direct sales force in certain stated countries.
New sales company in the UAE established in Q1; completion of conversion from existing third party sales organisation to direct sales force in California, USA; and expansion of a direct sales organisation in Ireland for WMFTG and the BioPure product range.
The personal strategic objective achievement levels are set out below.
Performance targetsFully achieved Partly achieved Not achieved % of bonus
N.J. Anderson 3 2 0 9.5%K.J. Boyd 6 0 0 10.0%N.H. Daws 5 1 0 9.3%J.L. Whalen 3 2 0 8.4%
As a result of this performance in 2018, the following bonuses were achieved:
Executive Directors Bonus achievedBonus
(% of salary)
N.J. Anderson £627,708 115.6%K.J. Boyd £335,282 94.9%N.H. Daws £261,941 79.2%J.L. Whalen1 $445,372 92.0%
1 Paid in US dollars. All elements of J.L. Whalen’s remuneration are shown in US dollars because he lives and works mostly in the USA. Furthermore, converting to sterling is misleading due to the movement in exchange rates. Original dollar value.
5. RemunerationAnnual Report on Remuneration 2018 continued
Governance Report
Spirax-Sarco Engineering plc Annual Report 2018
100
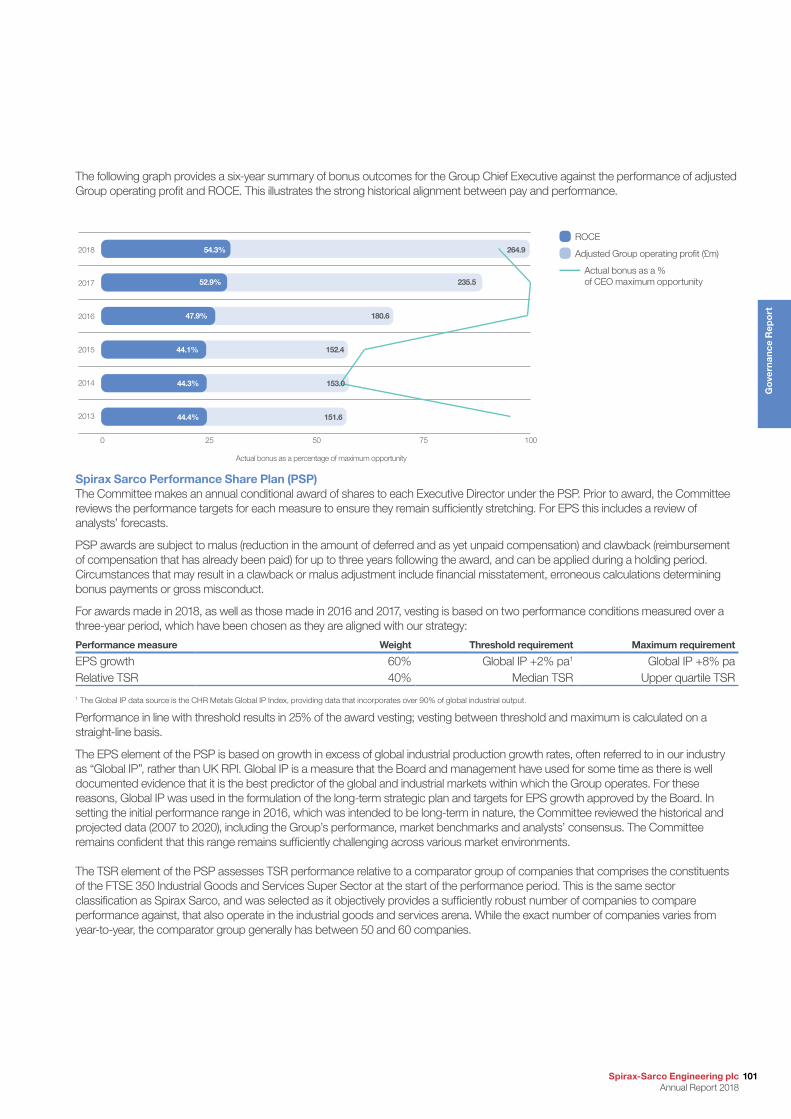
The following graph provides a six-year summary of bonus outcomes for the Group Chief Executive against the performance of adjusted Group operating profit and ROCE. This illustrates the strong historical alignment between pay and performance.
2016
2017
2018
52.9%
54.3%
2015
2014
2013
44.1%
44.3%
47.9%
44.4%
152.4
153.0
235.5
264.9
180.6
151.6
Actual bonus as a percentage of maximum opportunity
0 25 50 75 100
Spirax Sarco Performance Share Plan (PSP)The Committee makes an annual conditional award of shares to each Executive Director under the PSP. Prior to award, the Committee reviews the performance targets for each measure to ensure they remain sufficiently stretching. For EPS this includes a review of analysts’ forecasts.
PSP awards are subject to malus (reduction in the amount of deferred and as yet unpaid compensation) and clawback (reimbursement of compensation that has already been paid) for up to three years following the award, and can be applied during a holding period. Circumstances that may result in a clawback or malus adjustment include financial misstatement, erroneous calculations determining bonus payments or gross misconduct.
For awards made in 2018, as well as those made in 2016 and 2017, vesting is based on two performance conditions measured over a three-year period, which have been chosen as they are aligned with our strategy:
Performance measure Weight Threshold requirement Maximum requirement
EPS growth 60% Global IP +2% pa1 Global IP +8% paRelative TSR 40% Median TSR Upper quartile TSR
1 The Global IP data source is the CHR Metals Global IP Index, providing data that incorporates over 90% of global industrial output.
Performance in line with threshold results in 25% of the award vesting; vesting between threshold and maximum is calculated on a straight-line basis.
The EPS element of the PSP is based on growth in excess of global industrial production growth rates, often referred to in our industry as “Global IP”, rather than UK RPI. Global IP is a measure that the Board and management have used for some time as there is well documented evidence that it is the best predictor of the global and industrial markets within which the Group operates. For these reasons, Global IP was used in the formulation of the long-term strategic plan and targets for EPS growth approved by the Board. In setting the initial performance range in 2016, which was intended to be long-term in nature, the Committee reviewed the historical and projected data (2007 to 2020), including the Group’s performance, market benchmarks and analysts’ consensus. The Committee remains confident that this range remains sufficiently challenging across various market environments.
The TSR element of the PSP assesses TSR performance relative to a comparator group of companies that comprises the constituents of the FTSE 350 Industrial Goods and Services Super Sector at the start of the performance period. This is the same sector classification as Spirax Sarco, and was selected as it objectively provides a sufficiently robust number of companies to compare performance against, that also operate in the industrial goods and services arena. While the exact number of companies varies from year-to-year, the comparator group generally has between 50 and 60 companies.
ROCE
Adjusted Group operating profit (£m)
Actual bonus as a % of CEO maximum opportunity
101Spirax-Sarco Engineering plc Annual Report 2018
Go
vern
ance
Rep
ort
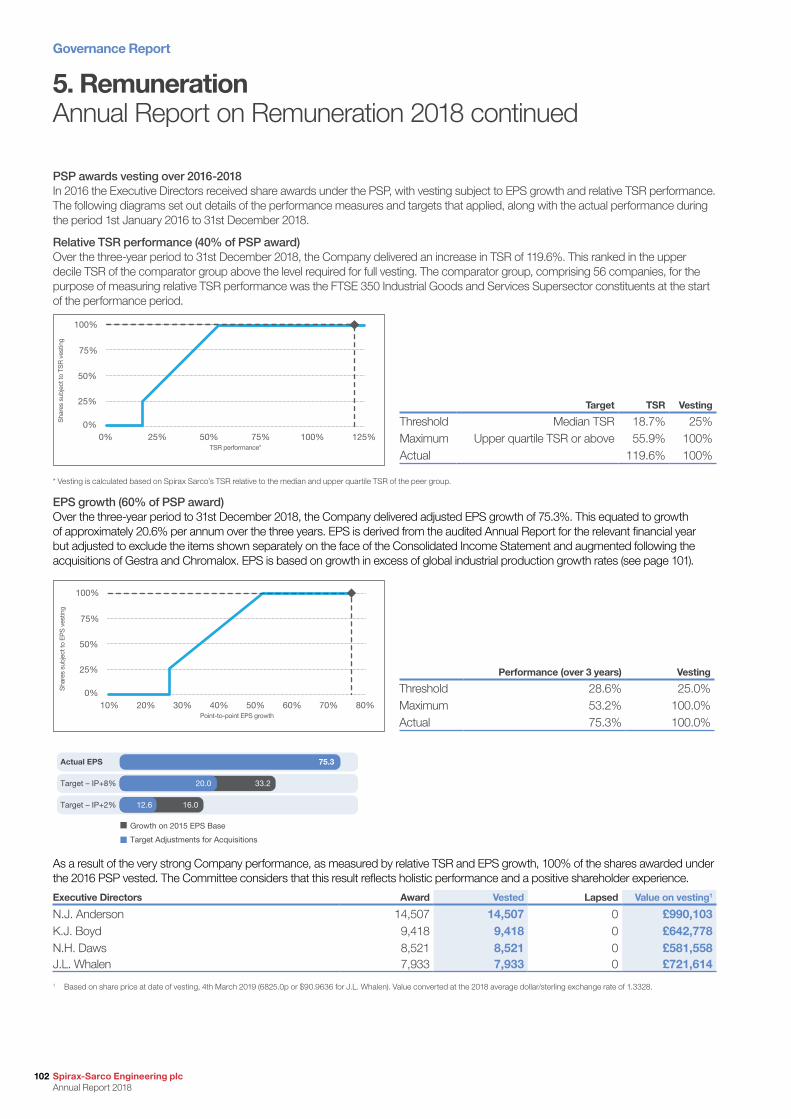
PSP awards vesting over 2016-2018In 2016 the Executive Directors received share awards under the PSP, with vesting subject to EPS growth and relative TSR performance. The following diagrams set out details of the performance measures and targets that applied, along with the actual performance during the period 1st January 2016 to 31st December 2018.
Relative TSR performance (40% of PSP award)Over the three-year period to 31st December 2018, the Company delivered an increase in TSR of 119.6%. This ranked in the upper decile TSR of the comparator group above the level required for full vesting. The comparator group, comprising 56 companies, for the purpose of measuring relative TSR performance was the FTSE 350 Industrial Goods and Services Supersector constituents at the start of the performance period.
Target TSR Vesting
Threshold Median TSR 18.7% 25%Maximum Upper quartile TSR or above 55.9% 100%Actual 119.6% 100%
Sha
res
subj
ect t
o TS
R v
estin
g
TSR performance*
100%
75%
50%
25%
0%0% 25% 50% 75% 100% 125%
* Vesting is calculated based on Spirax Sarco’s TSR relative to the median and upper quartile TSR of the peer group.
EPS growth (60% of PSP award)Over the three-year period to 31st December 2018, the Company delivered adjusted EPS growth of 75.3%. This equated to growth of approximately 20.6% per annum over the three years. EPS is derived from the audited Annual Report for the relevant financial year but adjusted to exclude the items shown separately on the face of the Consolidated Income Statement and augmented following the acquisitions of Gestra and Chromalox. EPS is based on growth in excess of global industrial production growth rates (see page 101).
Sha
res
subj
ect t
o EP
S v
estin
g
Point-to-point EPS growth
100%
75%
50%
25%
0%10% 20% 30% 40% 50% 60% 70% 80%
Performance (over 3 years) Vesting
Threshold 28.6% 25.0%Maximum 53.2% 100.0%Actual 75.3% 100.0%
75.3
33.220.0
16.012.6
Actual EPS
Target – IP+8%
Target – IP+2%
Growth on 2015 EPS Base
Target Adjustments for Acquisitions
As a result of the very strong Company performance, as measured by relative TSR and EPS growth, 100% of the shares awarded under the 2016 PSP vested. The Committee considers that this result reflects holistic performance and a positive shareholder experience.
Executive Directors Award Vested Lapsed Value on vesting1
N.J. Anderson 14,507 14,507 0 £990,103K.J. Boyd 9,418 9,418 0 £642,778N.H. Daws 8,521 8,521 0 £581,558J.L. Whalen 7,933 7,933 0 £721,614
1 Based on share price at date of vesting, 4th March 2019 (6825.0p or $90.9636 for J.L. Whalen). Value converted at the 2018 average dollar/sterling exchange rate of 1.3328.
5. RemunerationAnnual Report on Remuneration 2018 continued
Governance Report
Spirax-Sarco Engineering plc Annual Report 2018
102

1.2 Pension (audited) In lieu of pension benefits, Nicholas Anderson and Kevin Boyd receive 25% of their basic salary in cash which, in the year ended 31st December 2018, amounted to £135,750 and £88,325 respectively.
Neil Daws became a deferred member of an HMRC registered, contributory defined benefit scheme, the Spirax-Sarco Executives’ Retirement Benefits Scheme, with effect from 31st December 2012, and is, therefore, no longer accruing any pension benefits within the defined benefit scheme. His defined benefit rights in the Scheme at 31st December 2018 were £4,622,000 and his normal retirement date is 1st January 2025 (age 62½). In lieu of pension benefits, he received 25% of his basic salary in cash which, in the year ended 31st December 2018, amounted to £82,733.
Jay Whalen is a member of the Spirax Sarco Inc. defined benefit plan. The benefit paid under normal retirement from the US defined benefit plan is a single life annuity equal to the number of years of service multiplied by the sum of 1.0% of pensionable salary up to social security covered compensation, plus 1.45% of pensionable salary in excess of social security covered compensation. Final average salary is the average of the highest pensionable pay for any five consecutive years prior to retirement up to a ceiling. Jay Whalen’s final average salary is higher than the salary ceiling as at 31st December 2018. The plan was frozen effective 31st December 2018 for all future service and accruals.
Jay Whalen’s defined benefit plan arrangements are as follows:
Executive DirectorAge attained at
31.12.18Accrued pension
at 31.12.17Accrued pension
at 31.12.18
Change in accrued pension
during the year
Change inaccrued pension
during the year1
Change in thevalue2 of accruedpension over the
year net of inflation1
and Director’s owncontributions3
J.L. Whalen 62 $90,849 $95,830 $4,980 $2,912 $58,240
1 Net of inflation, limited to 0% ie at a rate of 2.28% per annum.2 The value of pension has been calculated based on a factor of 20 in line with that required under the disclosure regulations.3 This is a non-contributory plan so J.L. Whalen did not contribute to the defined benefit plan during 2018.
The following additional information is provided:
• Upon death in service: a spouse’s pension equal to one-half of the member’s pension, based on pensionable service to the date of death, is payable. After payment of the pension commences the accrued pension shown has no attaching spouse’s pension. However, at retirement there is an option to reduce the member’s pension to provide for a spouse’s pension after death.
• Early retirement rights: after leaving the service of the Company, Jay Whalen has the right to draw his accrued pension at any time after his 65th birthday with no reduction. In addition, he has the right to commence his pension earlier if he meets the age and service requirements, with the pension being reduced. The annual reductions for early retirement are 3% for each year from age 65 to age 60.
• Pension increases: the pension has no guaranteed increases. Spirax Sarco Inc. has the discretion to provide increases.• Other discretionary benefits: additionally, Jay Whalen benefited from Company contributions to a personal plan (choice of a personal
US defined contribution pension plan or cash in lieu of pension benefits) and to a 401k plan. The total amount contributed by the Group was $103,150.
1.3 Scheme interests awarded during the financial year (audited)Spirax Sarco Performance Share Plan (PSP)All awards were granted under the PSP as a contingent right to receive shares, with the face value calculated as a percentage (150% for the Group Chief Executive and 125% for the Executive Directors) of base salary, using the share price at date of award (5560.0p). Awards were made on 4th April 2018.
Executive Director PSP award Face value
Last day of the performance
period
Vesting at threshold
performance
N.J. Anderson 14,649 shares £814,484 31.12.20 25%K.J. Boyd 7,942 shares £441,575 31.12.20 25%N.H. Daws 7,203 shares £400,487 31.12.20 25%J.L. Whalen1 7,203 shares $533,769 31.12.20 25%
1 Value converted at the 2018 average dollar/sterling exchange rate of 1.3328.
For awards made in 2018, vesting is based on two performance conditions measured over a three-year period, which have been chosen as they are aligned with our strategy. In addition to the three-year vesting period, a two-year holding period applies. These performance conditions are explained further on page 101.
103Spirax-Sarco Engineering plc Annual Report 2018
Go
vern
ance
Rep
ort
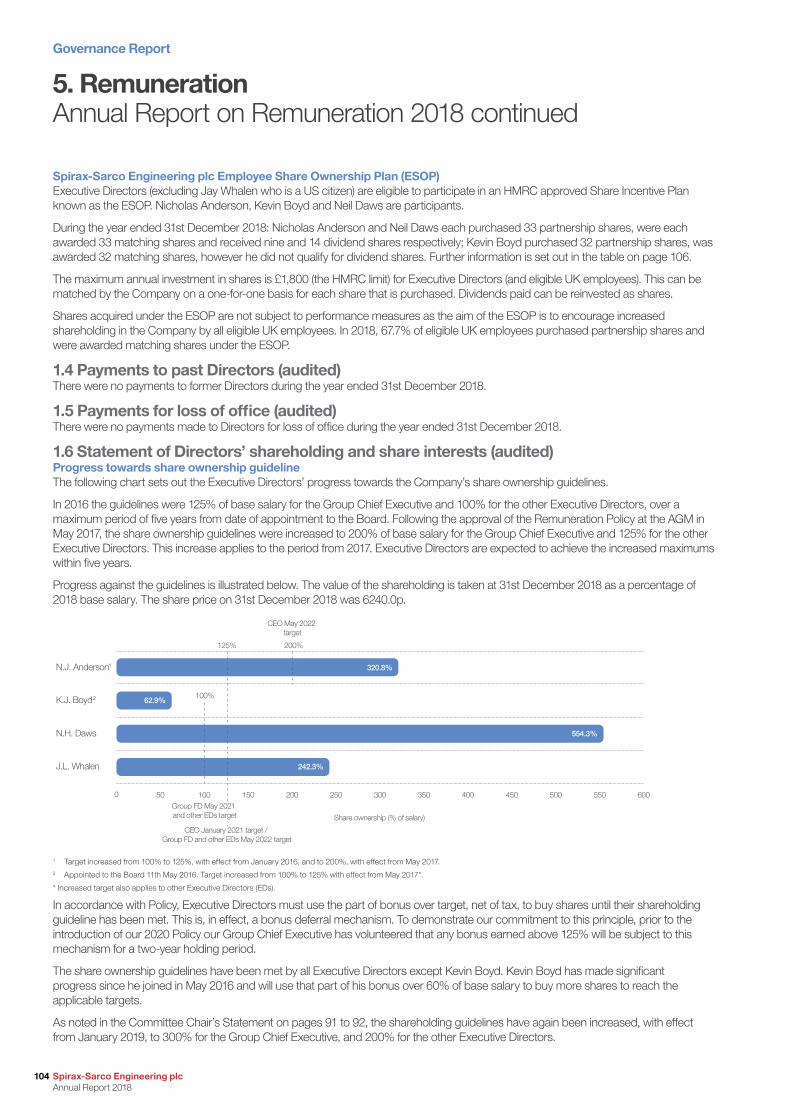
Spirax-Sarco Engineering plc Employee Share Ownership Plan (ESOP)Executive Directors (excluding Jay Whalen who is a US citizen) are eligible to participate in an HMRC approved Share Incentive Plan known as the ESOP. Nicholas Anderson, Kevin Boyd and Neil Daws are participants.
During the year ended 31st December 2018: Nicholas Anderson and Neil Daws each purchased 33 partnership shares, were each awarded 33 matching shares and received nine and 14 dividend shares respectively; Kevin Boyd purchased 32 partnership shares, was awarded 32 matching shares, however he did not qualify for dividend shares. Further information is set out in the table on page 106.
The maximum annual investment in shares is £1,800 (the HMRC limit) for Executive Directors (and eligible UK employees). This can be matched by the Company on a one-for-one basis for each share that is purchased. Dividends paid can be reinvested as shares.
Shares acquired under the ESOP are not subject to performance measures as the aim of the ESOP is to encourage increased shareholding in the Company by all eligible UK employees. In 2018, 67.7% of eligible UK employees purchased partnership shares and were awarded matching shares under the ESOP.
1.4 Payments to past Directors (audited)There were no payments to former Directors during the year ended 31st December 2018.
1.5 Payments for loss of office (audited)There were no payments made to Directors for loss of office during the year ended 31st December 2018.
1.6 Statement of Directors’ shareholding and share interests (audited)Progress towards share ownership guidelineThe following chart sets out the Executive Directors’ progress towards the Company’s share ownership guidelines.
In 2016 the guidelines were 125% of base salary for the Group Chief Executive and 100% for the other Executive Directors, over a maximum period of five years from date of appointment to the Board. Following the approval of the Remuneration Policy at the AGM in May 2017, the share ownership guidelines were increased to 200% of base salary for the Group Chief Executive and 125% for the other Executive Directors. This increase applies to the period from 2017. Executive Directors are expected to achieve the increased maximums within five years.
Progress against the guidelines is illustrated below. The value of the shareholding is taken at 31st December 2018 as a percentage of 2018 base salary. The share price on 31st December 2018 was 6240.0p.
N.J. Anderson1
K.J. Boyd2
N.H. Daws
J.L. Whalen
0 50 100 150 200 250 300 350 400 450 500 550 600
62.9%
125% 200%
100%
CEO January 2021 target / Group FD and other EDs May 2022 target
CEO May 2022 target
554.3%
242.3%
320.8%
Group FD May 2021 and other EDs targetGroup FD May 2021 and other EDs target Share ownership (% of salary)
1 Target increased from 100% to 125%, with effect from January 2016, and to 200%, with effect from May 2017.2 Appointed to the Board 11th May 2016. Target increased from 100% to 125% with effect from May 2017*.
* Increased target also applies to other Executive Directors (EDs).
In accordance with Policy, Executive Directors must use the part of bonus over target, net of tax, to buy shares until their shareholding guideline has been met. This is, in effect, a bonus deferral mechanism. To demonstrate our commitment to this principle, prior to the introduction of our 2020 Policy our Group Chief Executive has volunteered that any bonus earned above 125% will be subject to this mechanism for a two-year holding period.
The share ownership guidelines have been met by all Executive Directors except Kevin Boyd. Kevin Boyd has made significant progress since he joined in May 2016 and will use that part of his bonus over 60% of base salary to buy more shares to reach the applicable targets.
As noted in the Committee Chair’s Statement on pages 91 to 92, the shareholding guidelines have again been increased, with effect from January 2019, to 300% for the Group Chief Executive, and 200% for the other Executive Directors.
5. RemunerationAnnual Report on Remuneration 2018 continued
Governance Report
Spirax-Sarco Engineering plc Annual Report 2018
104
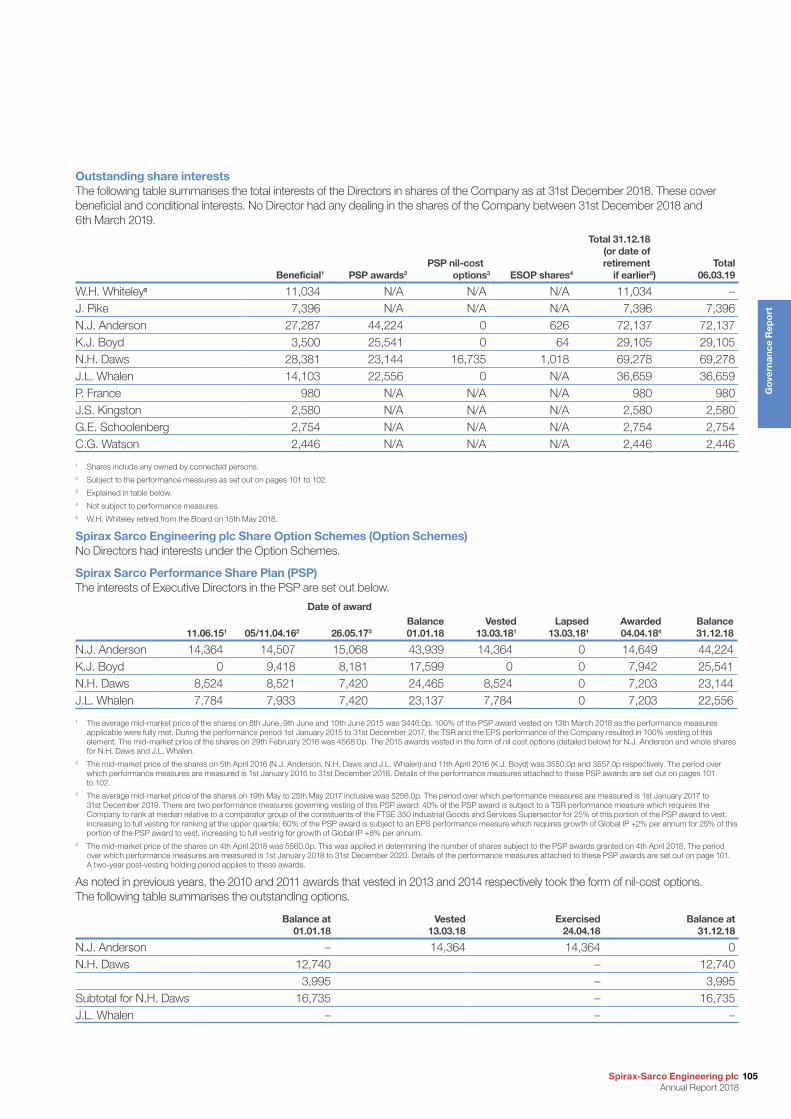
Outstanding share interestsThe following table summarises the total interests of the Directors in shares of the Company as at 31st December 2018. These cover beneficial and conditional interests. No Director had any dealing in the shares of the Company between 31st December 2018 and 6th March 2019.
Beneficial1 PSP awards2PSP nil-cost
options3 ESOP shares4
Total 31.12.18 (or date of retirement
if earlier5)Total
06.03.19
W.H. Whiteley5 11,034 N/A N/A N/A 11,034 –J. Pike 7,396 N/A N/A N/A 7,396 7,396N.J. Anderson 27,287 44,224 0 626 72,137 72,137K.J. Boyd 3,500 25,541 0 64 29,105 29,105N.H. Daws 28,381 23,144 16,735 1,018 69,278 69,278J.L. Whalen 14,103 22,556 0 N/A 36,659 36,659P. France 980 N/A N/A N/A 980 980J.S. Kingston 2,580 N/A N/A N/A 2,580 2,580G.E. Schoolenberg 2,754 N/A N/A N/A 2,754 2,754C.G. Watson 2,446 N/A N/A N/A 2,446 2,446
1 Shares include any owned by connected persons.2 Subject to the performance measures as set out on pages 101 to 102.3 Explained in table below.4 Not subject to performance measures.5 W.H. Whiteley retired from the Board on 15th May 2018.
Spirax Sarco Engineering plc Share Option Schemes (Option Schemes)No Directors had interests under the Option Schemes.
Spirax Sarco Performance Share Plan (PSP)The interests of Executive Directors in the PSP are set out below.
Date of award
11.06.151 05/11.04.162 26.05.173Balance01.01.18
Vested13.03.181
Lapsed13.03.181
Awarded 04.04.184
Balance31.12.18
N.J. Anderson 14,364 14,507 15,068 43,939 14,364 0 14,649 44,224K.J. Boyd 0 9,418 8,181 17,599 0 0 7,942 25,541N.H. Daws 8,524 8,521 7,420 24,465 8,524 0 7,203 23,144J.L. Whalen 7,784 7,933 7,420 23,137 7,784 0 7,203 22,556
1 The average mid-market price of the shares on 8th June, 9th June and 10th June 2015 was 3446.0p. 100% of the PSP award vested on 13th March 2018 as the performance measures applicable were fully met. During the performance period 1st January 2015 to 31st December 2017, the TSR and the EPS performance of the Company resulted in 100% vesting of this element. The mid-market price of the shares on 29th February 2016 was 4568.0p. The 2015 awards vested in the form of nil cost options (detailed below) for N.J. Anderson and whole shares for N.H. Daws and J.L. Whalen.
2 The mid-market price of the shares on 5th April 2016 (N.J. Anderson, N.H. Daws and J.L. Whalen) and 11th April 2016 (K.J. Boyd) was 3550.0p and 3557.0p respectively. The period over which performance measures are measured is 1st January 2016 to 31st December 2018. Details of the performance measures attached to these PSP awards are set out on pages 101 to 102.
3 The average mid-market price of the shares on 19th May to 25th May 2017 inclusive was 5256.0p. The period over which performance measures are measured is 1st January 2017 to 31st December 2019. There are two performance measures governing vesting of this PSP award: 40% of the PSP award is subject to a TSR performance measure which requires the Company to rank at median relative to a comparator group of the constituents of the FTSE 350 Industrial Goods and Services Supersector for 25% of this portion of the PSP award to vest, increasing to full vesting for ranking at the upper quartile; 60% of the PSP award is subject to an EPS performance measure which requires growth of Global IP +2% per annum for 25% of this portion of the PSP award to vest, increasing to full vesting for growth of Global IP +8% per annum.
4 The mid-market price of the shares on 4th April 2018 was 5560.0p. This was applied in determining the number of shares subject to the PSP awards granted on 4th April 2018. The period over which performance measures are measured is 1st January 2018 to 31st December 2020. Details of the performance measures attached to these PSP awards are set out on page 101. A two-year post-vesting holding period applies to these awards.
As noted in previous years, the 2010 and 2011 awards that vested in 2013 and 2014 respectively took the form of nil-cost options. The following table summarises the outstanding options.
Balance at01.01.18
Vested 13.03.18
Exercised24.04.18
Balance at31.12.18
N.J. Anderson – 14,364 14,364 0N.H. Daws 12,740 – 12,740
3,995 – 3,995Subtotal for N.H. Daws 16,735 – 16,735J.L. Whalen – – –
105Spirax-Sarco Engineering plc Annual Report 2018
Go
vern
ance
Rep
ort
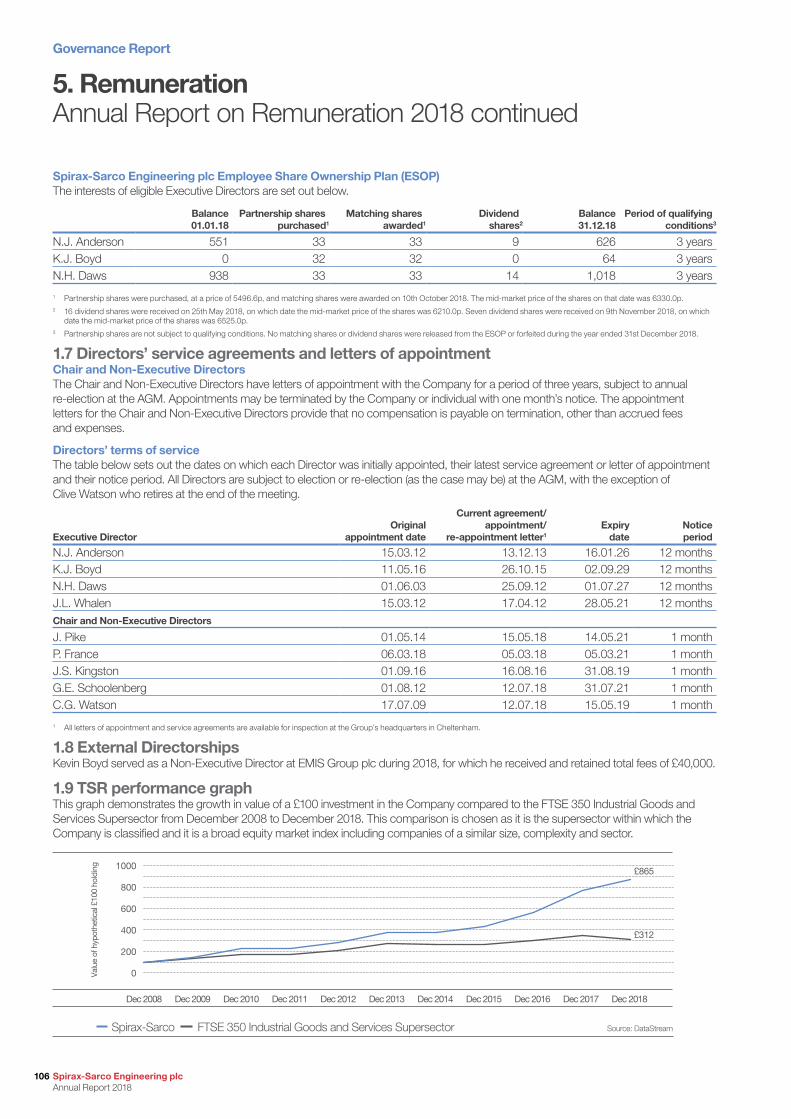
Spirax-Sarco Engineering plc Employee Share Ownership Plan (ESOP)The interests of eligible Executive Directors are set out below.
Balance01.01.18
Partnership sharespurchased1
Matching sharesawarded1
Dividendshares2
Balance31.12.18
Period of qualifyingconditions3
N.J. Anderson 551 33 33 9 626 3 yearsK.J. Boyd 0 32 32 0 64 3 yearsN.H. Daws 938 33 33 14 1,018 3 years
1 Partnership shares were purchased, at a price of 5496.6p, and matching shares were awarded on 10th October 2018. The mid-market price of the shares on that date was 6330.0p.2 16 dividend shares were received on 25th May 2018, on which date the mid-market price of the shares was 6210.0p. Seven dividend shares were received on 9th November 2018, on which
date the mid-market price of the shares was 6525.0p.3 Partnership shares are not subject to qualifying conditions. No matching shares or dividend shares were released from the ESOP or forfeited during the year ended 31st December 2018.
1.7 Directors’ service agreements and letters of appointmentChair and Non-Executive DirectorsThe Chair and Non-Executive Directors have letters of appointment with the Company for a period of three years, subject to annual re-election at the AGM. Appointments may be terminated by the Company or individual with one month’s notice. The appointment letters for the Chair and Non-Executive Directors provide that no compensation is payable on termination, other than accrued fees and expenses.
Directors’ terms of serviceThe table below sets out the dates on which each Director was initially appointed, their latest service agreement or letter of appointment and their notice period. All Directors are subject to election or re-election (as the case may be) at the AGM, with the exception of Clive Watson who retires at the end of the meeting.
Executive DirectorOriginal
appointment date
Current agreement/appointment/
re-appointment letter1Expiry
dateNotice period
N.J. Anderson 15.03.12 13.12.13 16.01.26 12 monthsK.J. Boyd 11.05.16 26.10.15 02.09.29 12 monthsN.H. Daws 01.06.03 25.09.12 01.07.27 12 monthsJ.L. Whalen 15.03.12 17.04.12 28.05.21 12 monthsChair and Non-Executive Directors
J. Pike 01.05.14 15.05.18 14.05.21 1 monthP. France 06.03.18 05.03.18 05.03.21 1 monthJ.S. Kingston 01.09.16 16.08.16 31.08.19 1 monthG.E. Schoolenberg 01.08.12 12.07.18 31.07.21 1 monthC.G. Watson 17.07.09 12.07.18 15.05.19 1 month
1 All letters of appointment and service agreements are available for inspection at the Group’s headquarters in Cheltenham.
1.8 External DirectorshipsKevin Boyd served as a Non-Executive Director at EMIS Group plc during 2018, for which he received and retained total fees of £40,000.
1.9 TSR performance graphThis graph demonstrates the growth in value of a £100 investment in the Company compared to the FTSE 350 Industrial Goods and Services Supersector from December 2008 to December 2018. This comparison is chosen as it is the supersector within which the Company is classified and it is a broad equity market index including companies of a similar size, complexity and sector.
0
200
400
600
800
1000
Dec 2008 Dec 2009 Dec 2010 Dec 2011 Dec 2012 Dec 2013 Dec 2014 Dec 2016 Dec 2018Dec 2017Dec 2015
Spirax-Sarco FTSE 350 Industrial Goods and Services Supersector Source: DataStream
Valu
e of
hyp
othe
tical
£10
0 ho
ldin
g
£865
£312
5. RemunerationAnnual Report on Remuneration 2018 continued
Governance Report
Spirax-Sarco Engineering plc Annual Report 2018
106
The graph in the Committee Chair’s Statement on page 91 also includes a comparison to the FTSE 100, given the Company’s recent inclusion to the Index, and shows a similar level of out-performance.
The table below shows the historic levels of the Group Chief Executive’s pay (single figure of total remuneration) and annual variable and PSP awards as a percentage of maximum.
Single figure of annual
remuneration
Annual variable pay as a percentage of
maximum
Value of vested PSP awards as a
percentage of maximum
2018 £2,323,478 92.48% 100.00%2017 £2,172,620 100.00% 100.00%2016 £1,610,891 99.20% 40.00%2015 £1,191,137 61.39% 80.33%20141 £1,000,115 55.76% 33.06%2013 £1,593,150 95.24% 29.93%2012 £1,402,668 31.69% 74.60%2011 £1,516,798 80.08% 100.00%2010 £1,720,765 100.00% 100.00%2009 £1,092,229 37.00% 100.00%
1 N.J. Anderson appointed Group Chief Executive in January 2014.
1.10 Percentage change in remuneration of the Group Chief Executive The following table provides a summary of the 2018 increase in base salary, benefits and bonus for the Group Chief Executive compared to the average increase for the general UK employee population across the Group in the same period.
2018 change 2017 change
Salary Group Chief Executive 2.7% 2.5%General employee population 2.7% 2.5%
Benefits Group Chief Executive 3.2% 1.8%General employee population 2.7% 2.5%
Bonus Group Chief Executive -4.9% 3.4%General employee population 2.4% 2.4%
1.11 Relative importance of spend on payThe table below demonstrates the relative importance of total pay spend relative to total employee numbers, profit before tax (selected as the best measure of efficiency) and dividends payable in respect of the year.
2018 2017 Change
Total pay spend £404m £351m 15.1%Group average headcount 7,403 6,316 17.2%Profit before tax £289m £193m 49.7%Dividends payable £74m £64m 15.6%
1.12 Changes for 2019Rationale for changes to Executive Director pay in 2019In 2019, the Committee has undertaken to adjust Executive Director pay to reflect concerns about historically low levels of pay and the increasing size and complexity of the Group, generated by both our organic growth over recent years and the acquisition of Gestra and Chromalox. Over the last five years, the Group has grown rapidly from mid FTSE 250 to FTSE 100, outperforming the FTSE 100 and our engineering peers, and has increased EPS by 80%. During that same period, our pay levels have fallen behind market due largely to our historically conservative pay practices and a number of internal promotions.
In order to retain our strong incumbent team, the Committee believes it is important to make a meaningful one-time change, within our shareholder approved Remuneration Policy. This change helps to ensure that total pay reflects the skills and responsibilities required to fill the Executive Director roles, and that business continuity is maintained as we work to integrate and drive performance in our acquisitions and manage a more complex business with new technology.
Shareholder consultation in relation to 2019 implementationIn the second half of 2018, concluding in January 2019, we undertook an extensive consultation process in which we met with 17 of our top shareholders, representing over 50% of our total shares outstanding. We are grateful for the helpful and constructive advice we received.
107Spirax-Sarco Engineering plc Annual Report 2018
Go
vern
ance
Rep
ort
Overview of Executive Director Policy implementation in 2019The changes approved by the Committee result in situating on target remuneration (base, target bonus, target PSP vesting, and the combination of each of these elements) approaching median for the Group Chief Executive and at, or below, the lower quartile for the other Executive Directors. For the purpose of assessing pay levels relative to market, the Committee primarily considered practices in 15 peer companies (Bodycote, Cobham, Halma, IMI, Meggitt, Morgan Advanced Materials, QinetiQ Group, Renishaw, Rotork, RPC Group, Senior, Smiths Group, Spectris, Ultra Electronics Holdings, and Weir Group). Against this group of UK-listed industrial engineering peers, Spirax Sarco’s revenue is positioned at median, and above the upper quartile with respect to market capitalisation and one- and three-year TSR. Accordingly, the Committee determined that a position of approaching median for the Group Chief Executive and lower quartile for the other Executive Directors was reasonable and appropriate in the context of the market median positioning that we target for our broader workforce.
The changes are detailed below and are all within our current Policy.
Base salary Annual bonus (AIP) LTIP (PSP)Shareholding requirement
Executive DirectorPolicy
maximumCountry
norm ProposedPolicy
max 2018 2019Policy
max 2018 2019 2018 20191
Group Chief ExecutiveInflation +5% or, in exceptional circumstances, inflation +10%
2.9% 7.7% 150% 125% 150% 200% 150% 200% 200% 300%
Chief Financial Officer 2.9% 7.7% 150% 100% 100% 200% 125% 175% 125% 200%Managing Director, Steam Specialties 2.9% 5.0% 150% 100% 100% 200% 125% 175% 125% 200%
President, WMFTG 3.0% 3.0% 150% 100% 100% 200% 125% 175% 125% 200%1 As a matter of practice, this change is with immediate effect and will be formally adopted in our 2020 Policy.
The following points relate to 2019 remuneration:
2019 Annual BonusThe same performance measures and weights apply in 2019 as was the case in 2018, as they continue to align with our strategic focus to deliver self-generated growth that outperforms our markets, by improving on what we already do well. As in previous years, the specific targets associated with each measure that were approved in February 2019 are not disclosed in this Report as they are considered by the Board to be commercially sensitive. The targets will be retrospectively reported in the Annual Report next year.
Executive Directors 2019 Measures (% of bonus)
N.J. Anderson
K.J. Boyd
Group operating profit (70%) Group cash generation (10%)
Group ROCE (10%) Personal strategic objectives (10%)
N.H. Daws
J.L. Whalen
Segmental operating profit (50%) Group operating profit (20%)
Group cash generation (10%) Group ROCE (10%)
Personal strategic objectives (10%)
2019 Performance Share Plan AwardsThe same performance measures and weights apply in 2019 as was the case in 2018. In light of the increased award levels, the Committee has reduced the value that can be earned for threshold performance from 25% of the award to 18%. This has the effect of delivering the same absolute value for threshold performance. In February 2019, the Committee approved the three-year EPS targets, which remain unchanged at Global IP +2% per annum to Global IP +8% per annum. Having reviewed our own forecasts, analysts’ expectations and performance expectations of our peers, we remain satisfied that to achieve growth of Global IP +2% per annum to Global IP +8% per annum over the coming three years remains appropriately challenging and exceeds market consensus.
Performance measure Weight Threshold requirement Maximum requirementVesting at threshold
(% of award)
EPS growth 60% Global IP +2% pa Global IP +8% pa18%
Relative TSR 40% Median TSR Upper quartile TSR
Remuneration Policy in 2020The Committee is mindful of shareholder feedback around consecutive years of quantum increases and the link between Executive Director pay and long-term Company performance. Therefore, the Committee has committed to make a number of changes to the Remuneration Policy in 2020 to further align our Policy with emerging best practices and the expectations of our shareholders.
5. RemunerationAnnual Report on Remuneration 2018 continued
Governance Report
Spirax-Sarco Engineering plc Annual Report 2018
108
We commit to:
• no salary increases for our Executive Directors above the UK or USA (as appropriate) workforce norm during the term of the 2020 Policy (save for a transformational and significant change in the scale of the Group);
• enhance our bonus deferral policy to reflect more conventional market practices as part of the 2020 Policy. Prior to the introduction of our 2020 Policy, our Group Chief Executive has volunteered, with immediate effect, to defer into shares, for a two-year holding period, any bonus earned above his current maximum opportunity of 125%;
• formally adopt the increase in shareholding requirements from 200% to 300% of salary for the Group Chief Executive, and from 125% to 200% of salary for the other Executive Directors. As is the case under our Policy, the Executive Directors will have five years, to May 2025, in which to achieve the increased ownership guideline;
• adopt a post-employment requirement in relation to the level of Company shareholdings that must be maintained by Executive Directors for a defined period of time; and
• set any new Executive Director pension in line with wider UK workforce opportunity.
Implementation of Non-Executive Director fee policy in 2019Effective from 1st January 2019, the Non-Executive Director basic fee was increased by 2.9%, which is in line with the average UK employee salary increase of 2.9%. The Committee Chair and Senior Independent Director’s fees were unchanged.
1.13 Consideration by the Directors of matters relating to Directors’ remunerationOperation of the Remuneration Committee in 2018Membership and attendanceEach Committee member is an Independent Non-Executive Director and thus brings independence to all aspects of Board remuneration and the application of professional advice to matters relating to remuneration.
During 2018, the Committee was chaired by Jane Kingston and the members comprised: Trudy Schoolenberg, Clive Watson, Jamie Pike (up to his appointment as Chair of the Board on 15th May 2018) and Peter France (with effect from his appointment to the Board on 6th March 2018).
In 2018, the Committee met six times and all members attended each meeting relative to their Committee membership, with Peter France attending five meetings (from his appointment on 6th March 2018). On his appointment to Chair of the Board, Jamie Pike ceased being a formal member of the Committee, but continued to attend meetings at the invitation of the Committee Chair. The Chair of the Board was independent on appointment and did not formally vote on matters approved by the Committee.
Advisers to the CommitteeDuring 2018, the Committee sought advice and information from Bill Whiteley, the Chair up to 15th May 2018, and Jamie Pike, the Chair with effect from 15th May 2018; Nicholas Anderson, the Group Chief Executive; and Jim Devine, the Group Human Resources Director. None of the invitees participated in any discussions regarding their own remuneration or fees. The General Counsel and Company Secretary acts as Secretary to the Committee.
In addition, the Committee received external advice from Willis Towers Watson, who was appointed by the Committee and provided material advice to the Committee on various matters such as Executive remuneration levels and structure, performance updates in respect of the PSP, the Remuneration Report and attendance at Committee meetings. Willis Towers Watson’s fees in respect of these services totalled £89,100 in 2018. In addition, Willis Towers Watson work with management on other matters relating to remuneration with the approval of the Committee. A separate advisory team within Willis Towers Watson provides support and advice to management on pensions and other employee benefit-related matters. The Committee is of the opinion that the advice received is objective and independent, given that Willis Towers Watson are a signatory to the Remuneration Consultants Group Code of Conduct, the manner in which advice is delivered and the separate teams that advise management more generally.
In 2018, Baker & McKenzie LLP provided legal advice to the Company (which was available to the Committee). Legal fees relate to advice provided to the Company and not the Committee, and are charged on a time-cost basis.
1.14 Statement of voting at general meeting At the AGM in 2017, shareholders approved the Remuneration Policy 2017 (mandatory) and at the AGM in 2018, shareholders approved the Annual Report on Remuneration 2017 (advisory). The table below shows the results which required a simple majority (i.e. 50%) of the votes cast to be in favour for the resolutions to be passed.
Votes for % Votes against % Votes withheld
Remuneration Policy 2017 (2017 AGM) 57,778,590 95.06 3,005,646 4.9 278,674Annual Report on Remuneration 2017 (2018 AGM) 59,612,816 98.96 627,896 0.3 379,802
This Annual Report on Remuneration 2018 has been approved by the Board of Directors of Spirax-Sarco Engineering plc and signed on its behalf by:
Jane KingstonChair of Remuneration Committee6th March 2019
109Spirax-Sarco Engineering plc Annual Report 2018
Go
vern
ance
Rep
ort
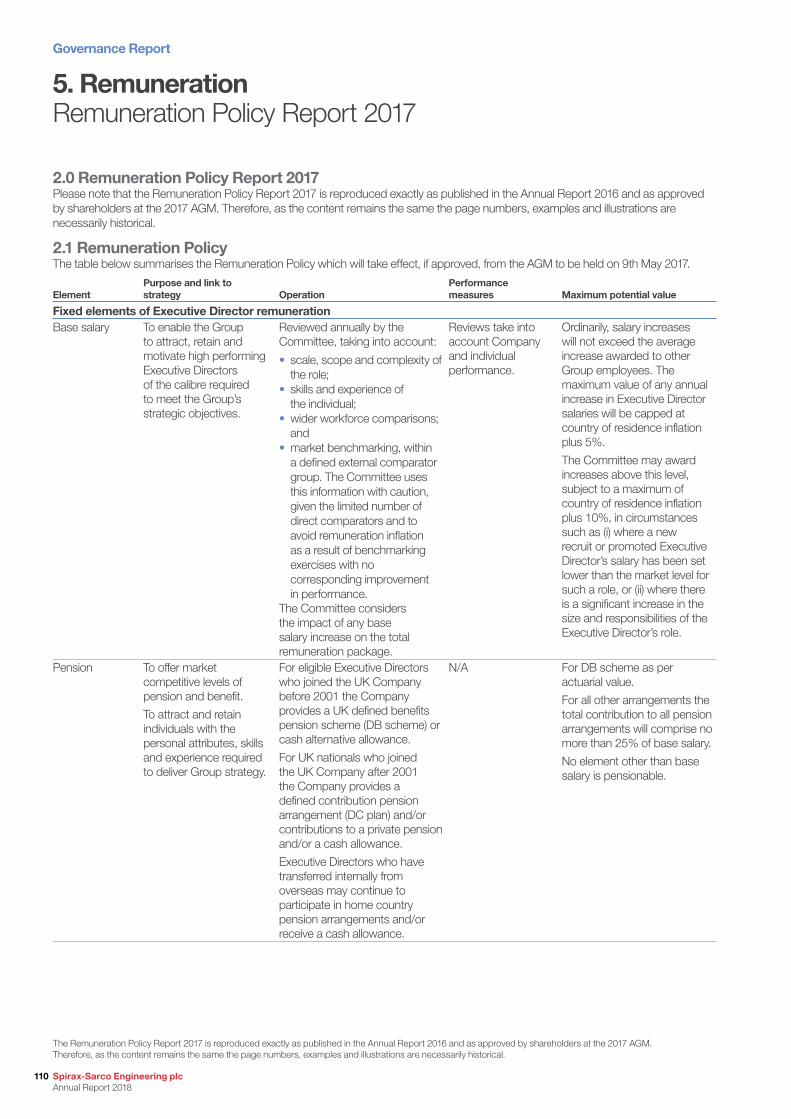
5. RemunerationRemuneration Policy Report 2017
2.0 Remuneration Policy Report 2017Please note that the Remuneration Policy Report 2017 is reproduced exactly as published in the Annual Report 2016 and as approved by shareholders at the 2017 AGM. Therefore, as the content remains the same the page numbers, examples and illustrations are necessarily historical.
2.1 Remuneration PolicyThe table below summarises the Remuneration Policy which will take effect, if approved, from the AGM to be held on 9th May 2017.
ElementPurpose and link to strategy Operation
Performance measures Maximum potential value
Fixed elements of Executive Director remunerationBase salary To enable the Group
to attract, retain and motivate high performing Executive Directors of the calibre required to meet the Group’s strategic objectives.
Reviewed annually by the Committee, taking into account:
• scale, scope and complexity of the role;
• skills and experience of the individual;
• wider workforce comparisons; and
• market benchmarking, within a defined external comparator group. The Committee uses this information with caution, given the limited number of direct comparators and to avoid remuneration inflation as a result of benchmarking exercises with no corresponding improvement in performance.
The Committee considers the impact of any base salary increase on the total remuneration package.
Reviews take into account Company and individual performance.
Ordinarily, salary increases will not exceed the average increase awarded to other Group employees. The maximum value of any annual increase in Executive Director salaries will be capped at country of residence inflation plus 5%.
The Committee may award increases above this level, subject to a maximum of country of residence inflation plus 10%, in circumstances such as (i) where a new recruit or promoted Executive Director’s salary has been set lower than the market level for such a role, or (ii) where there is a significant increase in the size and responsibilities of the Executive Director’s role.
Pension To offer market competitive levels of pension and benefit.
To attract and retain individuals with the personal attributes, skills and experience required to deliver Group strategy.
For eligible Executive Directors who joined the UK Company before 2001 the Company provides a UK defined benefits pension scheme (DB scheme) or cash alternative allowance.
For UK nationals who joined the UK Company after 2001 the Company provides a defined contribution pension arrangement (DC plan) and/or contributions to a private pension and/or a cash allowance.
Executive Directors who have transferred internally from overseas may continue to participate in home country pension arrangements and/or receive a cash allowance.
N/A For DB scheme as per actuarial value.
For all other arrangements the total contribution to all pension arrangements will comprise no more than 25% of base salary.
No element other than base salary is pensionable.
The Remuneration Policy Report 2017 is reproduced exactly as published in the Annual Report 2016 and as approved by shareholders at the 2017 AGM. Therefore, as the content remains the same the page numbers, examples and illustrations are necessarily historical.
Governance Report
Spirax-Sarco Engineering plc Annual Report 2018
110
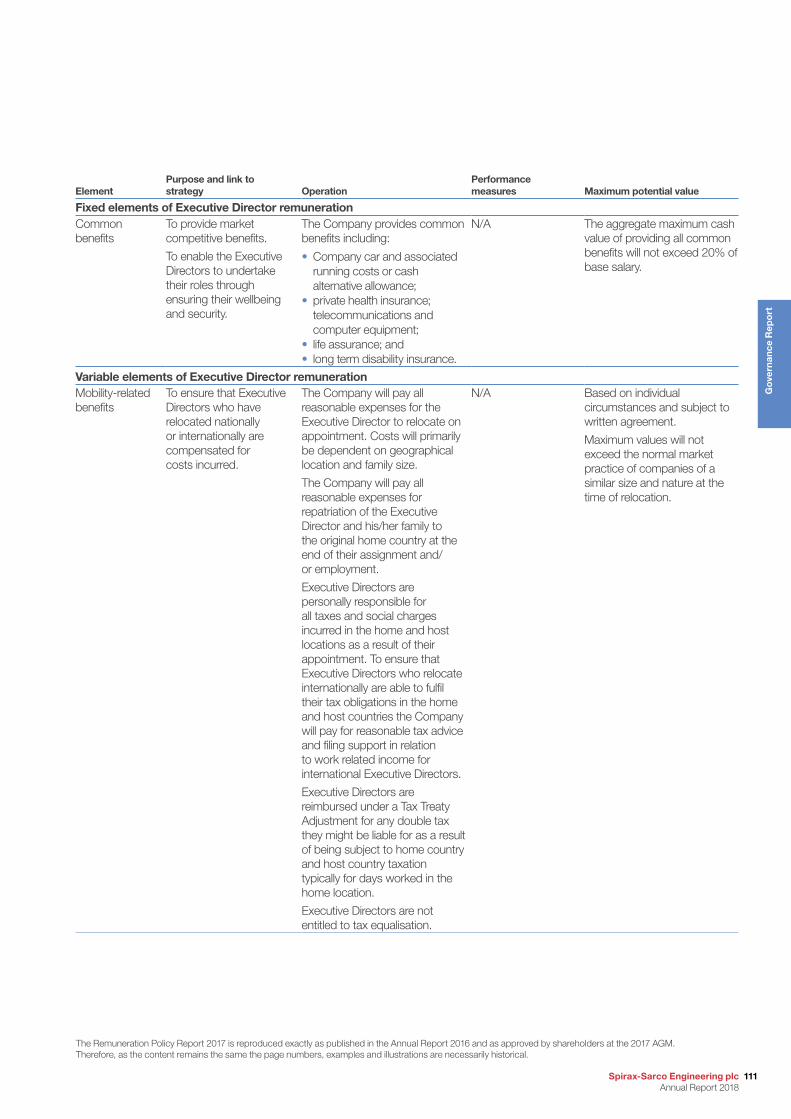
ElementPurpose and link to strategy Operation
Performance measures Maximum potential value
Fixed elements of Executive Director remunerationCommon benefits
To provide market competitive benefits.
To enable the Executive Directors to undertake their roles through ensuring their wellbeing and security.
The Company provides common benefits including:
• Company car and associated running costs or cash alternative allowance;
• private health insurance; telecommunications and computer equipment;
• life assurance; and• long term disability insurance.
N/A The aggregate maximum cash value of providing all common benefits will not exceed 20% of base salary.
Variable elements of Executive Director remunerationMobility-related benefits
To ensure that Executive Directors who have relocated nationally or internationally are compensated for costs incurred.
The Company will pay all reasonable expenses for the Executive Director to relocate on appointment. Costs will primarily be dependent on geographical location and family size.
The Company will pay all reasonable expenses for repatriation of the Executive Director and his/her family to the original home country at the end of their assignment and/or employment.
Executive Directors are personally responsible for all taxes and social charges incurred in the home and host locations as a result of their appointment. To ensure that Executive Directors who relocate internationally are able to fulfil their tax obligations in the home and host countries the Company will pay for reasonable tax advice and filing support in relation to work related income for international Executive Directors.
Executive Directors are reimbursed under a Tax Treaty Adjustment for any double tax they might be liable for as a result of being subject to home country and host country taxation typically for days worked in the home location.
Executive Directors are not entitled to tax equalisation.
N/A Based on individual circumstances and subject to written agreement.
Maximum values will not exceed the normal market practice of companies of a similar size and nature at the time of relocation.
The Remuneration Policy Report 2017 is reproduced exactly as published in the Annual Report 2016 and as approved by shareholders at the 2017 AGM. Therefore, as the content remains the same the page numbers, examples and illustrations are necessarily historical.
111Spirax-Sarco Engineering plc Annual Report 2018
Go
vern
ance
Rep
ort

ElementPurpose and link to strategy Operation
Performance measures Maximum potential value
Variable elements of Executive Director remunerationAnnual bonus To incentivise and reward
performance against selected KPIs which are directly linked to business strategy.
To recognise performance through variable remuneration and enable the Company to flexibly control its cost base and react to events and market circumstances.
To ensure a significant proportion of Executive Director remuneration is directly linked to business performance.
Measures, targets and their relative weightings are reviewed regularly by the Committee to ensure continuing alignment with strategic objectives and will be detailed in the relevant Annual Report on Remuneration.
Bonus is based largely or entirely on the achievement of challenging financial performance measures, which have been selected to ensure the Company is focused on its strategic objectives.
Bonus is delivered in cash. Executive Directors must use that part of the bonus over target (net of tax) to buy shares until the shareholding guidelines have been met. Purchase to be made within 12 months of bonus receipt.
Bonus is subject to clawback or malus for up to three years following payment. Circumstances include financial misstatement, erroneous calculations determining bonus payments or gross misconduct.
The Committee can adjust some performance targets to reflect certain non-operating items such as the amortisation of acquisition related intangible assets and exceptional reorganisational costs, and to reflect the inclusion of Associate companies. These adjustments are mechanical rather than discretionary.
Subject to the Committee’s judgement, performance measures and their respective targets are set at a Group or divisional level depending on the Executive Director’s role.
Any measure can be incorporated at the Committee’s discretion provided it is clearly aligned to the Group’s strategic objectives, subject to a maximum of 10% of bonus opportunity.
The weighting of each component will be chosen specifically to reflect the Executive Director’s role.
150% of salary.
The Remuneration Policy Report 2017 is reproduced exactly as published in the Annual Report 2016 and as approved by shareholders at the 2017 AGM. Therefore, as the content remains the same the page numbers, examples and illustrations are necessarily historical.
5. RemunerationRemuneration Policy Report 2017 continued
Governance Report
Spirax-Sarco Engineering plc Annual Report 2018
112
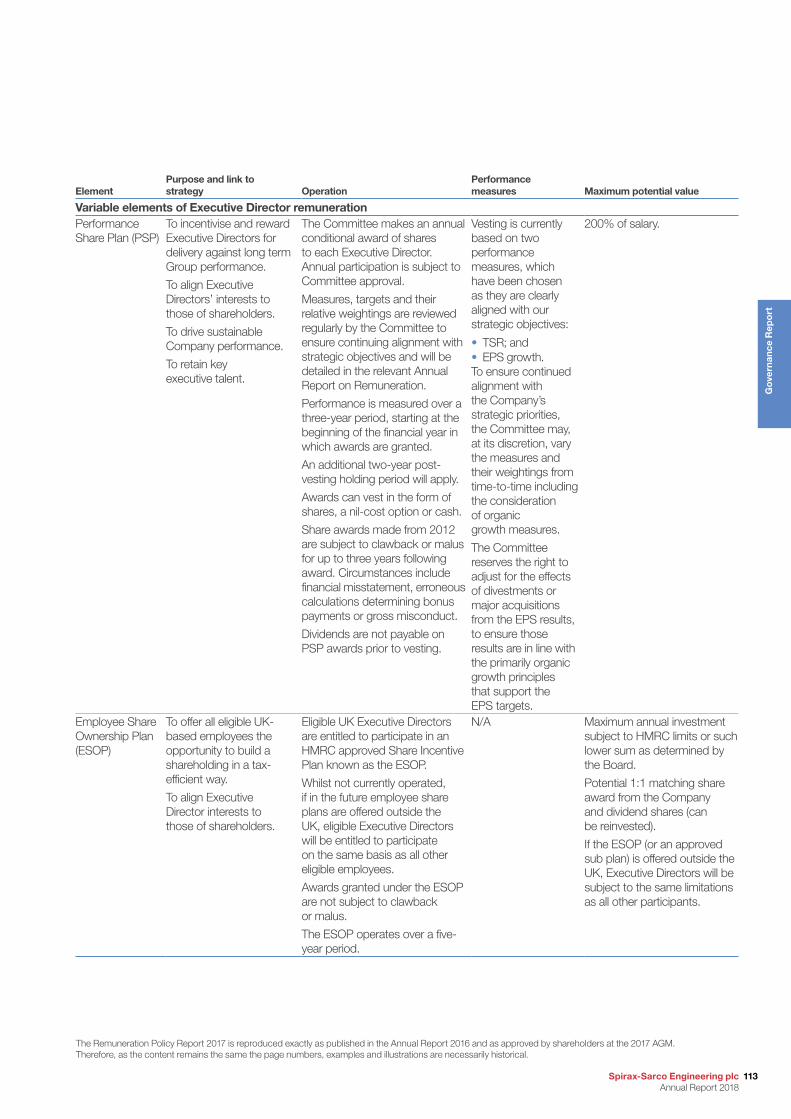
ElementPurpose and link to strategy Operation
Performance measures Maximum potential value
Variable elements of Executive Director remunerationPerformance Share Plan (PSP)
To incentivise and reward Executive Directors for delivery against long term Group performance.
To align Executive Directors’ interests to those of shareholders.
To drive sustainable Company performance.
To retain key executive talent.
The Committee makes an annual conditional award of shares to each Executive Director. Annual participation is subject to Committee approval.
Measures, targets and their relative weightings are reviewed regularly by the Committee to ensure continuing alignment with strategic objectives and will be detailed in the relevant Annual Report on Remuneration.
Performance is measured over a three-year period, starting at the beginning of the financial year in which awards are granted.
An additional two-year post-vesting holding period will apply.
Awards can vest in the form of shares, a nil-cost option or cash.
Share awards made from 2012 are subject to clawback or malus for up to three years following award. Circumstances include financial misstatement, erroneous calculations determining bonus payments or gross misconduct.
Dividends are not payable on PSP awards prior to vesting.
Vesting is currently based on two performance measures, which have been chosen as they are clearly aligned with our strategic objectives:
• TSR; and• EPS growth.To ensure continued alignment with the Company’s strategic priorities, the Committee may, at its discretion, vary the measures and their weightings from time-to-time including the consideration of organic growth measures.
The Committee reserves the right to adjust for the effects of divestments or major acquisitions from the EPS results, to ensure those results are in line with the primarily organic growth principles that support the EPS targets.
200% of salary.
Employee Share Ownership Plan (ESOP)
To offer all eligible UK-based employees the opportunity to build a shareholding in a tax-efficient way.
To align Executive Director interests to those of shareholders.
Eligible UK Executive Directors are entitled to participate in an HMRC approved Share Incentive Plan known as the ESOP.
Whilst not currently operated, if in the future employee share plans are offered outside the UK, eligible Executive Directors will be entitled to participate on the same basis as all other eligible employees.
Awards granted under the ESOP are not subject to clawback or malus.
The ESOP operates over a five-year period.
N/A Maximum annual investment subject to HMRC limits or such lower sum as determined by the Board.
Potential 1:1 matching share award from the Company and dividend shares (can be reinvested).
If the ESOP (or an approved sub plan) is offered outside the UK, Executive Directors will be subject to the same limitations as all other participants.
The Remuneration Policy Report 2017 is reproduced exactly as published in the Annual Report 2016 and as approved by shareholders at the 2017 AGM. Therefore, as the content remains the same the page numbers, examples and illustrations are necessarily historical.
113Spirax-Sarco Engineering plc Annual Report 2018
Go
vern
ance
Rep
ort
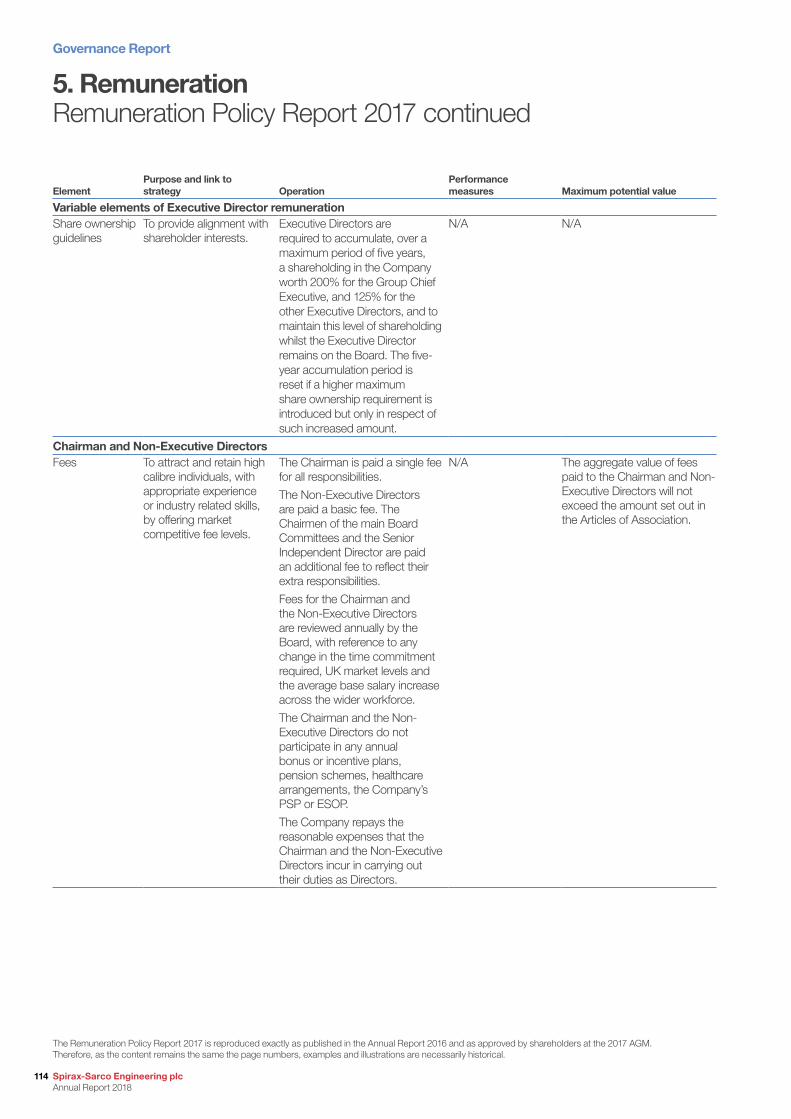
ElementPurpose and link to strategy Operation
Performance measures Maximum potential value
Variable elements of Executive Director remunerationShare ownership guidelines
To provide alignment with shareholder interests.
Executive Directors are required to accumulate, over a maximum period of five years, a shareholding in the Company worth 200% for the Group Chief Executive, and 125% for the other Executive Directors, and to maintain this level of shareholding whilst the Executive Director remains on the Board. The five-year accumulation period is reset if a higher maximum share ownership requirement is introduced but only in respect of such increased amount.
N/A N/A
Chairman and Non-Executive DirectorsFees To attract and retain high
calibre individuals, with appropriate experience or industry related skills, by offering market competitive fee levels.
The Chairman is paid a single fee for all responsibilities.
The Non-Executive Directors are paid a basic fee. The Chairmen of the main Board Committees and the Senior Independent Director are paid an additional fee to reflect their extra responsibilities.
Fees for the Chairman and the Non-Executive Directors are reviewed annually by the Board, with reference to any change in the time commitment required, UK market levels and the average base salary increase across the wider workforce.
The Chairman and the Non-Executive Directors do not participate in any annual bonus or incentive plans, pension schemes, healthcare arrangements, the Company’s PSP or ESOP.
The Company repays the reasonable expenses that the Chairman and the Non-Executive Directors incur in carrying out their duties as Directors.
N/A The aggregate value of fees paid to the Chairman and Non-Executive Directors will not exceed the amount set out in the Articles of Association.
The Remuneration Policy Report 2017 is reproduced exactly as published in the Annual Report 2016 and as approved by shareholders at the 2017 AGM. Therefore, as the content remains the same the page numbers, examples and illustrations are necessarily historical.
5. RemunerationRemuneration Policy Report 2017 continued
Governance Report
Spirax-Sarco Engineering plc Annual Report 2018
114

2.2 Notes to the Policy tableChanges to the Remuneration PolicyThe proposed changes to the Remuneration Policy are as follows:
• AIP award: increase potential maximum award from 125% to 150% of salary;• PSP award: increase potential maximum award from 100%-150% of salary to 200% of salary;• PSP holding period: introduce a two-year post-vesting holding period (currently there is no holding period);• share ownership requirements: increase share ownership requirements from at least 125% of salary for the Group Chief Executive and
at least 100% of salary for the other Executive Directors to 200% of salary for the Group Chief Executive and 125% of salary for the other Executive Directors;
• remove the Committee’s discretion to grant one-off awards for recruitment or retention in exceptional circumstances; and• reserve the Committee’s right to adjust for the effects of divestments or major acquisitions from the EPS results, to ensure those
results are in line with the primarily organic growth principles that support the EPS targets.
Additional details and an explanation of the changes can be found in the Statement by the Chairman of the Committee on pages 85 and 86.
Outstanding incentive awardsDetails of outstanding incentive awards granted to Executive Directors prior to the Policy coming into force, including awards granted in 2016, and details of the performance targets are set out on pages 89 to 92 of the Annual Report on Remuneration 2016.
All incentive awards granted prior to this Policy coming into force will continue on their existing terms including the exercise of discretion to amend such awards.
Remuneration policy for other employeesThe Company’s approach to annual salary reviews is consistent across the Group, with consideration given to the scope of the role, level of experience, responsibility, individual performance and market pay levels. The most senior managers in the business (approximately 80 people globally) participate in bonus arrangements with similar targets, measures and relative weightings to the Executive Directors. Target and maximum potential values are lower and determined by the grade of the manager’s role. Performance targets are based on an appropriate combination of Group, divisional and local operating company financial measures. Contractual terms and benefits for the wider workforce are subject to local employment legislation and best practice.
Measure selection and the target setting processMeasures are selected taking into account the key strategic priorities of the Company, shareholder expectations and factors that sit within an individual’s span of control.
Targets are set with reference to internal and external forecasts to ensure that they are realistic, yet sufficiently stretching. An appropriate mix of long- and short-term targets will be used, informed by the nature of the measure.
2.3 External directorshipsDirectors are permitted to hold external directorships in order to broaden their experience, to the benefit of the Company. Such appointments are subject to approval by the Board and the Director may retain any fees paid in respect of such directorships. The Board ensures compliance by Directors with Code provision B.3.
2.4 Approach to recruitment and promotion remunerationWhen appointing external hires, promoting executives, or an Executive Director internally, the Committee will continue to act in the best interests of shareholders when determining remuneration, in line with the stated policy. The main elements of the Remuneration Policy for Executive Director appointments are:
• Base salary will be set on appointment taking into account the factors set out in the Policy table, but also the individual’s experience. Depending on an individual’s prior experience, the Committee may set salary below market norms, with the intention that it is realigned over time, typically two to three years, subject to performance in the role. In this situation, the Committee is permitted to exceed the “normal” rate of annual salary increase set out in the Policy table.
• On-going annual incentive pay opportunity will not exceed 350% of salary, in line with the maximums stated in the Policy table (up to 150% of salary for annual bonus and an award of up to 200% of salary under the PSP). In the year of appointment an off-cycle award under the PSP may be made by the Committee to ensure an immediate alignment of individual interests.
• In addition to the standard elements of remuneration, on the appointment of an external candidate, the Committee reserves the right to buy-out incentive awards that the individual has foregone by accepting the appointment, if appropriate. The terms of such awards would be informed by the amounts being forfeited and the associated terms (for example the extent to which the outstanding awards were subject to performance, the vehicles and the associated time horizons). Awards would be made either through the existing share plans or in accordance with the relevant provisions contained within the Listing Rules.
The Remuneration Policy Report 2017 is reproduced exactly as published in the Annual Report 2016 and as approved by shareholders at the 2017 AGM. Therefore, as the content remains the same the page numbers, examples and illustrations are necessarily historical.
115Spirax-Sarco Engineering plc Annual Report 2018
Go
vern
ance
Rep
ort
• When an internal appointment to the Board is made, any pre-existing obligations may be honoured by the Committee and payment will be permitted under this Remuneration Policy.
• For internal promotions, salary will be capped at that of the incumbent Group Chief Executive.Details of the remuneration for any new Chairman or Executive Director appointed to the Board will be disclosed on the Group’s website, www.spiraxsarcoengineering.com.
2.5 Service agreements and termination policyThe Company’s policy on service agreements and termination arrangements for Executive Directors is set out below. Service agreements are designed to reflect the interests of the Company, as well as the individual concerned. Executive Directors’ service agreements are kept at the Company’s headquarters in Cheltenham.
In accordance with the Code and guidelines issued by institutional investors, Executive Directors have service agreements that are terminable by either the Company or the Executive Director on 12 months’ notice. In the event of termination or resignation, and subject to business reasons, the Company would not necessarily hold the Executive Director to his or her full notice period. All Directors are subject to election (if newly appointed in the year) or re-election at the AGM.
Service agreements set out restrictions on the ability of the Executive Director to participate in businesses competing with those of the Group or to entice or solicit away from the Group any senior employees or to solicit/deal with clients of the Group or interfere with supply, in the 12 months following the cessation of employment.
Salary, pension and benefits are included in the agreements and are treated as described in the policy table on pages 100 to 103. There is no contractual entitlement to payment of an annual bonus or granting of an award under the PSP, until individual participation, level of award, measures and targets have been set for a particular year.
The Chairman and Non-Executive Directors do not have service agreements but serve the Company under letters of appointment, for an initial period of three years, subject to annual re-election at the AGM. Appointments may be terminated by the Company or individual with one month’s notice.
Group Chief Executive and new appointments from 1st January 2013The details of the service agreements of the Group Chief Executive and for new appointments to the Board are outlined below and comply with best practice. In the event of a material change in role, function or responsibilities, Executive Directors’ agreements will be reviewed and will be expected to be updated to meet the requirements outlined below.
Notice period 12 months by the Executive Director and 12 months by the Company
Termination No payment if Executive Director commits a repudiatory breach of the service agreement or for gross misconduct or in certain circumstances.
No additional termination payment if notice worked.
If notice only part worked/part on garden leave, payment in respect of unexpired period of notice, otherwise 12 months’ base salary only.
Company discretion to pay in lieu of notice in lump sum or monthly except within 12 months of a change of control, when a lump sum will be paid.
If paid monthly, payment will be reduced by the value of any salary, fees and benefits, excluding long-term incentives, earned in new paid employment in that period.
No automatic entitlement to payments under the annual bonus or PSP. See page 106.
Garden leave clause.
Robust post-termination restrictions on confidentiality, non-compete, non-solicitation and non-interference with customers or suppliers.
Service agreements may be terminated without notice and without payment of compensation on the occurrence of certain events, such as gross misconduct or financial misstatement.
Clawback or malus
Bonus payments and PSP awards are subject to clawback or malus for up to three years following award.
Circumstances include financial misstatement, erroneous calculations determining bonus payments or gross misconduct.
The Remuneration Policy Report 2017 is reproduced exactly as published in the Annual Report 2016 and as approved by shareholders at the 2017 AGM. Therefore, as the content remains the same the page numbers, examples and illustrations are necessarily historical.
5. RemunerationRemuneration Policy Report 2017 continued
Governance Report
Spirax-Sarco Engineering plc Annual Report 2018
116

Executive Directors’ legacy agreementsWithin the legacy agreements of Executive Directors, termination of agreements is subject to a 12 month notice period. Where payment is made in lieu of notice on termination, the payment of a sum in respect of lost future bonus opportunity (based on an average of the preceding three years’ bonus payments) is subject to the Committee’s discretion. The Committee has the power to reduce the amount to reflect performance on the part of the Executive Director that is considered by the Committee to be unsatisfactory. On termination of such an Executive Director’s service agreement, the Committee will take into account the departing Executive Director’s need to mitigate his or her loss when determining the amount of bonus. Payment will only be made at the discretion of the Committee after taking into account individual performance in order to ensure that there will be no “payments for failure”. In any event, payments will be subject to clawback or malus provisions.
Executive Directors’ service agreements may be terminated without notice and without payment of compensation on the occurrence of certain events, such as termination for gross misconduct or financial misstatement.
While the Executive Directors’ service agreements include a provision to deal with termination on a change of control, in the event of an offer being made, shareholders have discretion to accept the offer or not. The decision to recommend acceptance, or not, is a matter for the Board, and the Committee is of the clear view that the change of control provision within the Executive Directors’ service agreements would have no influence on the voting pattern of those Executive Directors. Executive Directors’ legacy agreements are summarised in the table below.
Notice period 12 months by the Executive Director and 12 months by the Company
Termination No payment if Executive Director commits a repudiatory breach of the service agreement or for gross misconduct or in certain circumstances.
No additional termination payment if notice worked.
If notice only part worked/part on garden leave, payment in respect of unexpired period of notice.
Otherwise 12 months’ base salary, the value of other benefits, plus the cost of pension credits or contributions for the period plus the average of the prior three years’ annual bonus payments, with Committee discretion to reduce the amount of the bonus that would otherwise be calculated, to reflect performance on the part of the Executive Director that is considered by the Committee to be below the required standards, provided that termination by the Company does not occur within 12 months of a change of control.
Committee discretion to pay in lump sum or monthly except within 12 months of a change of control when a lump sum will be paid.
If paid monthly, payment will be reduced by the value of any salary, fees and benefits excluding long-term incentives, earned in new paid employment in that period.
No automatic entitlement to payments under the current annual bonus or PSP. See page 106.
Garden leave clause.
Robust post-termination restrictions on confidentiality, non-compete, non-solicitation and non-interference with customers or suppliers.
Clawback or malus
Bonus payments and PSP awards are subject to clawback or malus for up to three years following award.
Circumstances include financial misstatement, erroneous calculations determining bonus payments or gross misconduct.
Treatment of leavers under the incentive plansWhilst it is not an entitlement, it is expected that where an Executive Director is a “good leaver” (ie where the cessation of employment is due to death, disability, redundancy, retirement or the company business in which he/she works being disposed of or where the ending of employment is instigated by the Company and is not for cause), payments will be made under the annual bonus plan if performance targets are met subject to, and in accordance with, the plan rules. If the Executive Director is not a “good leaver” it is expected that no bonus will be paid.
The treatment of leavers under the PSP is determined in accordance with the shareholder approved PSP rules. Any awards granted within six months prior to termination (or the giving or receiving of notice) will lapse. Any awards granted six months or longer prior to termination of employment (but prior to the end of the performance period) will lapse unless the Executive Director is considered to be a “good leaver”.
In the case of a “good leaver” the award will vest on the termination date, or the normal vesting date, at the Committee’s discretion. This is subject to the satisfaction of the performance targets at that date and a pro-rata reduction in the number of shares to take account of the shortening of the performance period.
For awards granted on or after 1st March 2012, if the Executive Director is a “good leaver” where the ending of employment is not for cause, the number of shares vested may be reduced (including to zero) by the Committee in its absolute discretion.
The Remuneration Policy Report 2017 is reproduced exactly as published in the Annual Report 2016 and as approved by shareholders at the 2017 AGM. Therefore, as the content remains the same the page numbers, examples and illustrations are necessarily historical.
117Spirax-Sarco Engineering plc Annual Report 2018
Go
vern
ance
Rep
ort
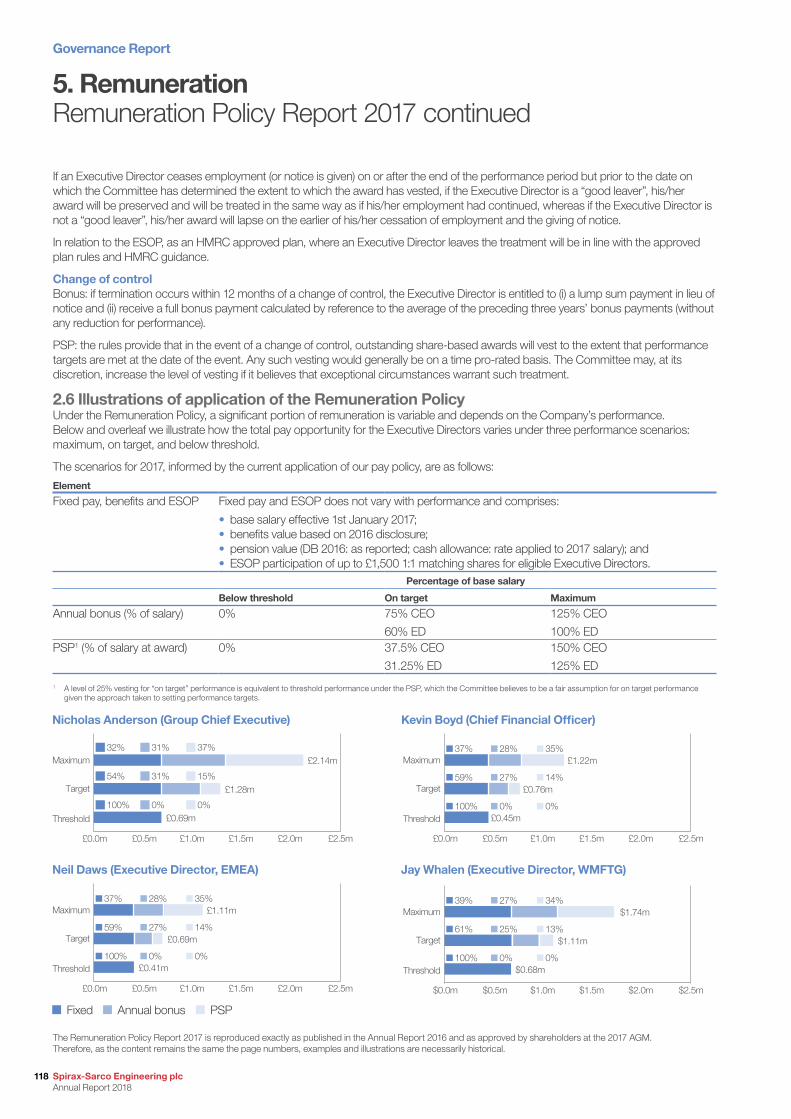
If an Executive Director ceases employment (or notice is given) on or after the end of the performance period but prior to the date on which the Committee has determined the extent to which the award has vested, if the Executive Director is a “good leaver”, his/her award will be preserved and will be treated in the same way as if his/her employment had continued, whereas if the Executive Director is not a “good leaver”, his/her award will lapse on the earlier of his/her cessation of employment and the giving of notice.
In relation to the ESOP, as an HMRC approved plan, where an Executive Director leaves the treatment will be in line with the approved plan rules and HMRC guidance.
Change of controlBonus: if termination occurs within 12 months of a change of control, the Executive Director is entitled to (i) a lump sum payment in lieu of notice and (ii) receive a full bonus payment calculated by reference to the average of the preceding three years’ bonus payments (without any reduction for performance).
PSP: the rules provide that in the event of a change of control, outstanding share-based awards will vest to the extent that performance targets are met at the date of the event. Any such vesting would generally be on a time pro-rated basis. The Committee may, at its discretion, increase the level of vesting if it believes that exceptional circumstances warrant such treatment.
2.6 Illustrations of application of the Remuneration PolicyUnder the Remuneration Policy, a significant portion of remuneration is variable and depends on the Company’s performance. Below and overleaf we illustrate how the total pay opportunity for the Executive Directors varies under three performance scenarios: maximum, on target, and below threshold.
The scenarios for 2017, informed by the current application of our pay policy, are as follows:
Element
Fixed pay, benefits and ESOP Fixed pay and ESOP does not vary with performance and comprises:
• base salary effective 1st January 2017;• benefits value based on 2016 disclosure;• pension value (DB 2016: as reported; cash allowance: rate applied to 2017 salary); and• ESOP participation of up to £1,500 1:1 matching shares for eligible Executive Directors.
Percentage of base salary
Below threshold On target Maximum
Annual bonus (% of salary) 0% 75% CEO
60% ED
125% CEO
100% EDPSP1 (% of salary at award) 0% 37.5% CEO
31.25% ED
150% CEO
125% ED
1 A level of 25% vesting for “on target” performance is equivalent to threshold performance under the PSP, which the Committee believes to be a fair assumption for on target performance given the approach taken to setting performance targets.
Maximum
Target
Threshold
£0.0m £1.0m£0.5m £2.5m£2.0m£1.5m
100% 0% 0%
59%
37% 28% 35%
£0.69m
£1.11m
£0.41m
14%27%
Neil Daws (Executive Director, EMEA)
Maximum
Target
Threshold
£0.0m £1.0m£0.5m £2.5m£2.0m£1.5m
100% 0% 0%
59% 27%
37% 28% 35%
£0.76m
£1.22m
£0.45m
14%
Kevin Boyd (Chief Financial Officer)
Maximum
Target
Threshold
$0.0m $1.0m$0.5m $2.5m$2.0m$1.5m
100% 0% 0%
61% 25%
39% 27% 34%
$1.11m
$1.74m
$0.68m
13%
Jay Whalen (Executive Director, WMFTG)
Maximum
Target
Threshold
£0.0m £1.0m£0.5m £2.5m£2.0m£1.5m
100% 0% 0%
54% 31%
32% 31% 37%
£1.28m
£2.14m
£0.69m
15%
Nicholas Anderson (Group Chief Executive)
Fixed Annual bonus PSP
5. RemunerationRemuneration Policy Report 2017 continued
The Remuneration Policy Report 2017 is reproduced exactly as published in the Annual Report 2016 and as approved by shareholders at the 2017 AGM. Therefore, as the content remains the same the page numbers, examples and illustrations are necessarily historical.
Governance Report
Spirax-Sarco Engineering plc Annual Report 2018
118
2.7 Statement of consideration of employment conditions elsewhere in the GroupWhen determining the remuneration of Executive Directors, the Committee considers the pay of employees across the Group. When conducting the annual salary review, the average base salary increase awarded to the UK workforce and senior managers across the Group provides a key reference point when determining levels of increase for Executive Director remuneration. The Remuneration Policy was drawn up by the Committee without the need for any consultation with employees.
The Committee also determines the principles and policy of remuneration which shall apply to the Group’s senior managers. The responsibility for determining precise compensation packages that meet local practice and performance targets lies with the Group Chief Executive and the responsible Executive Director.
To ensure consistency in Remuneration Policy across the Group and to encourage a performance culture, senior managers participate in the PSP. The Board believes that share ownership is an effective way of aligning the interests of managers and shareholders and to strengthen the development of the business.
2.8 Statement of consideration of shareholder viewsIn developing and reviewing the Company’s Remuneration Policy for Executive Directors and other senior executives, the Committee seeks and takes into account the range of views of shareholders and institutional shareholder advisers. The Committee Chairman actively engages with major shareholders and institutional shareholder advisers when appropriate and takes into account their views when reviewing and implementing the Company’s Remuneration Policy.
The Committee considers shareholder feedback received in relation to the AGM each year and guidance from institutional shareholder advisers more generally. This feedback, plus any additional feedback received during the year at meetings with shareholders, is considered as part of the Company’s annual Remuneration Policy review. At the AGM in 2016, the advisory vote on the 2015 Annual Report on Remuneration received 97.2% in favour. At the AGM in 2014 the Remuneration Policy received 98.5% in favour.
In finalising the 2017 Remuneration Policy the views of shareholders and institutional shareholder advisers have shaped the:
• introduction of an additional two-year post-vesting holding period for PSP grants;• rebalance of long-term and short-term compensation opportunities by way of the Director’s PSP opportunity now being more
substantive than the AIP; • agreement to disclose AIP targets retrospectively; • increase in share ownership requirements; • removal of the Committee’s discretion to grant one-off awards for recruitment or retention in exceptional circumstances; • keeping of the PSP performance metrics under review, including the consideration of organic growth measures; and• reserving of the Committee’s right to adjust for the effects of divestments or major acquisitions from the EPS results, to ensure those
results are in line with the primarily organic growth principles that support the EPS targets.
The Remuneration Policy Report 2017 is reproduced exactly as published in the Annual Report 2016 and as approved by shareholders at the 2017 AGM. Therefore, as the content remains the same the page numbers, examples and illustrations are necessarily historical.
119Spirax-Sarco Engineering plc Annual Report 2018
Go
vern
ance
Rep
ort
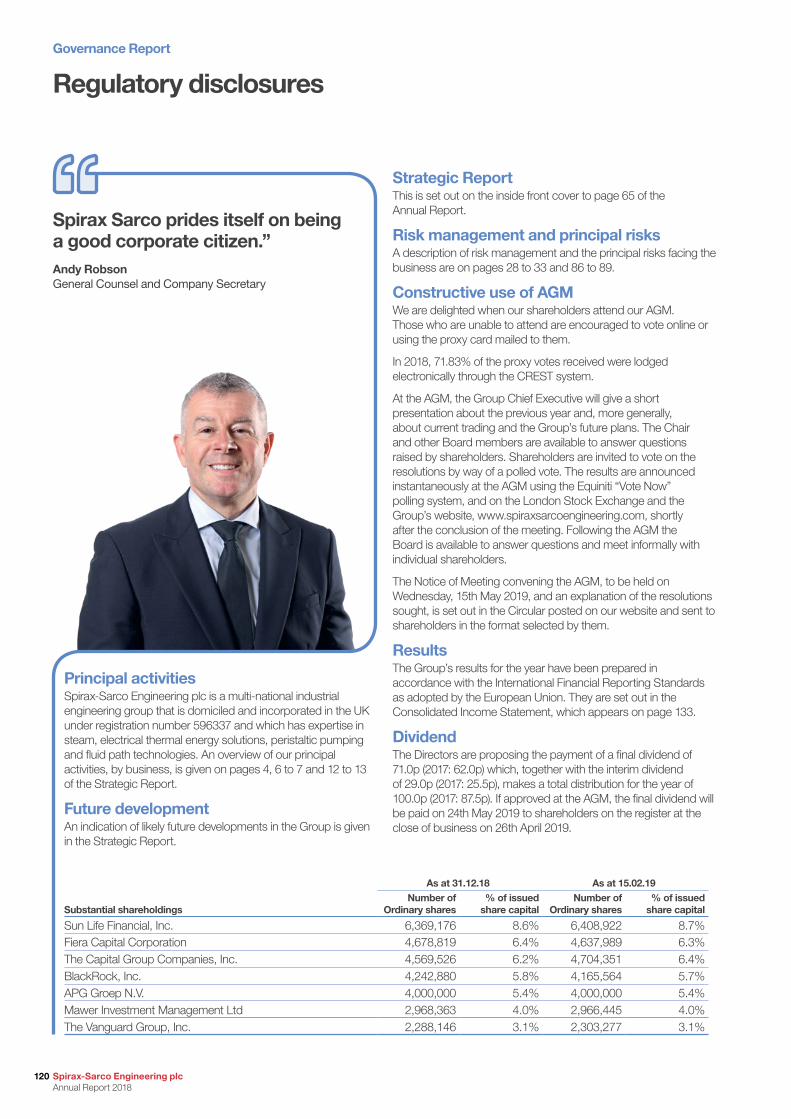
Regulatory disclosures
Strategic ReportThis is set out on the inside front cover to page 65 of the Annual Report.
Risk management and principal risksA description of risk management and the principal risks facing the business are on pages 28 to 33 and 86 to 89.
Constructive use of AGMWe are delighted when our shareholders attend our AGM. Those who are unable to attend are encouraged to vote online or using the proxy card mailed to them.
In 2018, 71.83% of the proxy votes received were lodged electronically through the CREST system.
At the AGM, the Group Chief Executive will give a short presentation about the previous year and, more generally, about current trading and the Group’s future plans. The Chair and other Board members are available to answer questions raised by shareholders. Shareholders are invited to vote on the resolutions by way of a polled vote. The results are announced instantaneously at the AGM using the Equiniti “Vote Now” polling system, and on the London Stock Exchange and the Group’s website, www.spiraxsarcoengineering.com, shortly after the conclusion of the meeting. Following the AGM the Board is available to answer questions and meet informally with individual shareholders.
The Notice of Meeting convening the AGM, to be held on Wednesday, 15th May 2019, and an explanation of the resolutions sought, is set out in the Circular posted on our website and sent to shareholders in the format selected by them.
ResultsThe Group’s results for the year have been prepared in accordance with the International Financial Reporting Standards as adopted by the European Union. They are set out in the Consolidated Income Statement, which appears on page 133.
DividendThe Directors are proposing the payment of a final dividend of 71.0p (2017: 62.0p) which, together with the interim dividend of 29.0p (2017: 25.5p), makes a total distribution for the year of 100.0p (2017: 87.5p). If approved at the AGM, the final dividend will be paid on 24th May 2019 to shareholders on the register at the close of business on 26th April 2019.
Principal activitiesSpirax-Sarco Engineering plc is a multi-national industrial engineering group that is domiciled and incorporated in the UK under registration number 596337 and which has expertise in steam, electrical thermal energy solutions, peristaltic pumping and fluid path technologies. An overview of our principal activities, by business, is given on pages 4, 6 to 7 and 12 to 13 of the Strategic Report.
Future developmentAn indication of likely future developments in the Group is given in the Strategic Report.
Spirax Sarco prides itself on being a good corporate citizen.”Andy RobsonGeneral Counsel and Company Secretary
As at 31.12.18 As at 15.02.19
Substantial shareholdingsNumber of
Ordinary shares% of issued
share capitalNumber of
Ordinary shares% of issued
share capital
Sun Life Financial, Inc. 6,369,176 8.6% 6,408,922 8.7%Fiera Capital Corporation 4,678,819 6.4% 4,637,989 6.3%The Capital Group Companies, Inc. 4,569,526 6.2% 4,704,351 6.4%BlackRock, Inc. 4,242,880 5.8% 4,165,564 5.7%APG Groep N.V. 4,000,000 5.4% 4,000,000 5.4%Mawer Investment Management Ltd 2,968,363 4.0% 2,966,445 4.0%The Vanguard Group, Inc. 2,288,146 3.1% 2,303,277 3.1%
Governance Report
Spirax-Sarco Engineering plc Annual Report 2018
120
Directors’ interestsThe interests of the Directors in the share capital of Spirax-Sarco Engineering plc as at 31st December 2018 are set out on page 105.
Substantial shareholdingsThe voting rights in the table, on page 120, have been determined in accordance with the requirements of the UK Listing Authority’s Disclosure and Transparency Rules DTR 5, and represent 3% or more of the voting rights attached to issued shares in the Company as at 15th February 2019 and 31st December 2018. There are no Controlling Founder Shareholders.
Directors’ and Officers’ InsuranceThe Company provides Directors’ and Officers’ Insurance for Board members, Directors of the Group’s operating companies and senior officers.
The Company has also provided each Director with an indemnity to the extent permitted by law in respect of the liabilities incurred as a result of their holding office as a Director of the Company.
Appointment and replacement of DirectorsThe appointment and replacement of Directors is governed by the Company’s Articles of Association, the Code, the Companies Act 2006 and related legislation.
All Directors will seek election or re-election (as the case may be) at the AGM, with the exception of Clive Watson who retires at the end of the meeting.
The Directors stand for election or re-election on an annual basis at each AGM, in accordance with the Code. The Board considers that all Directors standing for election or re-election continue to perform effectively and demonstrate commitment to their roles. In addition, the Board considers that all Directors have the necessary skills and experience, as set out in their biographies on pages 72 to 73.
Conflicts of interestUnder the Companies Act 2006 and the provisions of the Company’s Articles of Association, the Board is required to consider potential conflicts of interest. The Company has established formal procedures for the disclosure and review of any conflicts, or potential conflicts, of interest which the Directors may have and for the authorisation of such matters of conflict by the Board. To this end the Board considers and, if appropriate, authorises any conflicts, or potential conflicts, of interest as they arise and reviews any such authorisation annually.
New Directors are required to declare any conflicts, or potential conflicts, of interest to the Board at the first Board meeting after his or her appointment. The Board believes that the procedures established to deal with conflicts of interest are operating effectively.
Articles of AssociationThe Company’s Articles of Association are available from Companies House in the UK or by writing to the General Counsel and Company Secretary at the Group’s registered office in Cheltenham. Amendments to the Articles of Association can only be made by means of a special resolution at a general meeting of the shareholders of the Company.
Share capitalAs at 28th February 2019 there were no treasury shares held by the Company. Details of shares issued during the year are set out in Note 21 on page 160.
As at 31st December 2018 the Company’s share capital was made up of Ordinary shares which each carry one vote at general meetings of the Company. Except as set out in the Articles of Association or in applicable legislation, there are no restrictions on the transfer of shares in the Company and there are no restrictions on the voting rights in the Company’s shares.
The Company is not aware of any agreements entered into between any shareholders in the Company which restrict the transfer of shares or the exercise of any voting rights attached to the shares.
Powers of the Directors and purchase of own sharesSubject to the provisions of the Articles of Association, the Directors may exercise all the powers of the Company. A shareholder’s authority for the purchase by the Company of a maximum of 10% of its own shares was in existence during the year. However, the Company did not purchase any of its shares during that time. This authority expires at the forthcoming AGM and it is proposed that a similar authority be approved. The total number of shares in issue as at 31st December 2018 was 73,666,646.
PSP and Employee Benefit Trust (EBT)The number of shares held in the EBT at 31st December 2018 was 46,249 for the purpose of satisfying the vesting of awards and options granted to employees under the various Company schemes. Dividends on shares in the EBT are waived.
Significant contractsThe Company is not a party to any significant agreements that take effect, alter or terminate upon a change of control of the Company following a takeover bid.
There are provisions in the Executive Directors’ service agreements which state that following a takeover or change of control, if the Executive Director’s employment is terminated then both salary/benefits and a sum in respect of lost future bonus opportunity become payable as a lump sum.
The Strategic Report contains all the information required to comply with Section 414(c) of the Companies Act 2006 and there are no contractual arrangements that need to be disclosed which are essential to the business of the Group.
Disclosure of information to the auditorAs at the date of the approval of this Annual Report, as far as each Director is aware, there is no relevant audit information of which the Company’s auditor is unaware. Each Director has taken all such steps as he or she ought to have taken as a Director in order to make himself/herself aware of any relevant audit information and to establish that the Company’s auditor is aware of that information.
This confirmation is given and should be interpreted in accordance with the provisions of Section 418 of the Companies Act 2006.
121Spirax-Sarco Engineering plc Annual Report 2018
Go
vern
ance
Rep
ort
AuditorThe Company’s auditor throughout the period of this Annual Report was Deloitte LLP, who was appointed on 20th May 2014.
Deloitte LLP has expressed its willingness to continue in office as auditor and a resolution to re-appoint Deloitte LLP will be proposed at the forthcoming AGM.
Research and developmentThe Group continues to devote significant resources to the research and development and the updating and expansion of its range of products in order to remain at the forefront of its world markets. The R&D functions in Cheltenham (Spirax Sarco Steam Specialties), Falmouth (WMFTG), Bremen (Gestra) and the Product Development function in Pittsburgh and Utah (Chromalox) are tasked with improving the Group’s pipeline of new products, decreasing the time to launch, expanding the Group’s addressable market and realising additional sales. Further information on the expenditure on R&D is contained in Note 1 on page 140. The amount of R&D expenditure capitalised, and the amount amortised, in the year, are given in Note 14 on page 154.
Treasury and foreign exchangeThe Group has in place appropriate treasury policies and procedures, which are approved by the Board. The treasury function manages interest rates for both borrowings and cash deposits for the Group and is also responsible for ensuring there is sufficient headroom against any banking covenants contained within its credit facilities, and for ensuring there are appropriate facilities available to meet the Group’s strategic plans.
In order to mitigate and manage exchange rate risk, the Group routinely enters into forward contracts and continues to monitor exchange rate risk in respect of foreign currency exposures.
All these treasury policies and procedures are regularly monitored and reviewed. It is the Group’s policy not to undertake speculative transactions which create additional exposures over and above those arising from normal trading activity.
Political donationsThe Group has a policy of not making political donations and no political donations were made during the year (2017: nil).
Greenhouse gas emissionsDetails of our greenhouse gas emissions can be found on page 63.
Going concernThe Group’s business activities, together with the main trends and factors likely to affect its future development, performance and position, and the financial position of the Group, its cash flows, liquidity position and borrowing facilities, are set out in the Financial Review on pages 50 to 54. In addition, Note 29 on page 170 includes the Group’s objectives, policies and processes for managing its capital, its financial risk management objectives, its financial instruments and hedging activities, its exposures to credit risk and liquidity risk.
The Group has considerable financial resources together with contracts with a diverse range of customers and suppliers across different geographic areas and industries. No one customer accounts for more than 1% of Group turnover.
As a consequence, the Directors believe that the Group is well placed to manage its business risks successfully.
The Directors, having made appropriate enquiries, consider that the Company and the Group have adequate resources to continue in operational existence and that the Directors intend to do so, for at least one year from the date the Financial Statements were signed, and that it is appropriate to adopt the going concern basis in preparing the Annual Report.
Scope of the reporting in this Annual ReportThe Board has prepared a Strategic Report (including the Chair’s Statement, the Group Chief Executive’s Report and the Group Chief Executive’s Review of Operations) which provides an overview of the development and performance of the Group’s business in the year ended 31st December 2018 and its position at the end of that year, and which covers likely future developments in the business of the Company and the Group.
For the purposes of compliance with DTR 4.1.5 R(2) and DTR 4.1.8 R, the required content of the management report can be found in the Strategic Report and these Regulatory disclosures, including the sections of the Annual Report incorporated by reference.
The Strategic Report and the Directors’ Report were approved by the Board on 6th March 2019. Pages 120 to 122 form the Directors’ Report for the purposes of the Companies Act 2006.
The Annual Report contains the information required for compliance with the Companies, Partnerships and Groups (and Non-Financial Reporting) Regulations 2016.
For the purposes of LR 9.8.4C R, the information required to be disclosed by LR 9.8.4 R is set out in the following table.
Section Topic Location(1) Interest capitalised Not applicable
(2) Publication of unaudited financial information Not applicable
(4) Details of long-term incentive schemes Remuneration Report, pages 101-102
(5) Waiver of emoluments by a Director Not applicable
(6) Waiver of future emoluments by a Director Not applicable
(7) Non pre-emptive issues of equity for cash Not applicable
(8) Item (7) in relation to major subsidiary undertakings Not applicable
(9) Parent participation in a placing by a listed subsidiary Not applicable
(10) Contracts of significance Regulatory Disclosures, page 121
(11) Provision of services by a controlling shareholder Not applicable
(12) Shareholder waivers of dividends Regulatory Disclosures, page 121
(13) Shareholder waivers of future dividends Not applicable
(14) Agreements with controlling shareholders Not applicable
Andy RobsonGeneral Counsel and Company Secretary6th March 2019
Spirax-Sarco Engineering plc Registered no. 596337
Regulatory disclosures continued
Governance Report
Spirax-Sarco Engineering plc Annual Report 2018
122
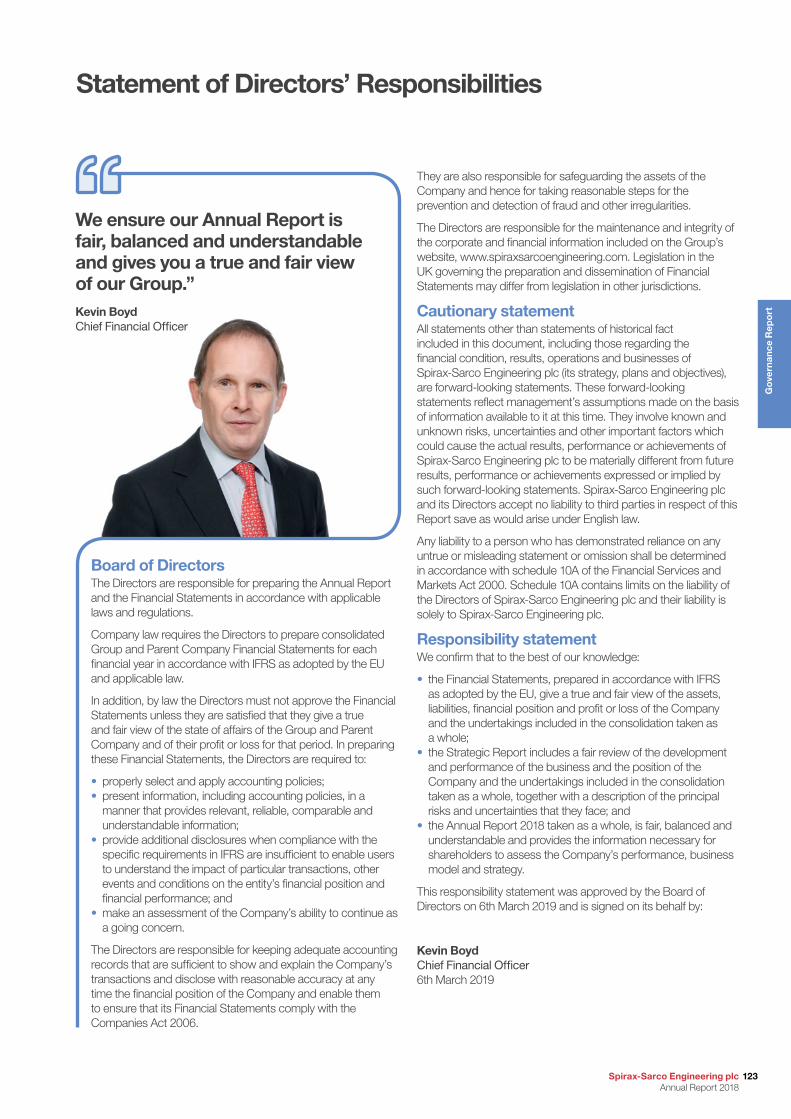
Board of Directors The Directors are responsible for preparing the Annual Report and the Financial Statements in accordance with applicable laws and regulations.
Company law requires the Directors to prepare consolidated Group and Parent Company Financial Statements for each financial year in accordance with IFRS as adopted by the EU and applicable law.
In addition, by law the Directors must not approve the Financial Statements unless they are satisfied that they give a true and fair view of the state of affairs of the Group and Parent Company and of their profit or loss for that period. In preparing these Financial Statements, the Directors are required to:
• properly select and apply accounting policies;• present information, including accounting policies, in a
manner that provides relevant, reliable, comparable and understandable information;
• provide additional disclosures when compliance with the specific requirements in IFRS are insufficient to enable users to understand the impact of particular transactions, other events and conditions on the entity’s financial position and financial performance; and
• make an assessment of the Company’s ability to continue as a going concern.
The Directors are responsible for keeping adequate accounting records that are sufficient to show and explain the Company’s transactions and disclose with reasonable accuracy at any time the financial position of the Company and enable them to ensure that its Financial Statements comply with the Companies Act 2006.
Statement of Directors’ Responsibilities
They are also responsible for safeguarding the assets of the Company and hence for taking reasonable steps for the prevention and detection of fraud and other irregularities.
The Directors are responsible for the maintenance and integrity of the corporate and financial information included on the Group’s website, www.spiraxsarcoengineering.com. Legislation in the UK governing the preparation and dissemination of Financial Statements may differ from legislation in other jurisdictions.
Cautionary statementAll statements other than statements of historical fact included in this document, including those regarding the financial condition, results, operations and businesses of Spirax-Sarco Engineering plc (its strategy, plans and objectives), are forward-looking statements. These forward-looking statements reflect management’s assumptions made on the basis of information available to it at this time. They involve known and unknown risks, uncertainties and other important factors which could cause the actual results, performance or achievements of Spirax-Sarco Engineering plc to be materially different from future results, performance or achievements expressed or implied by such forward-looking statements. Spirax-Sarco Engineering plc and its Directors accept no liability to third parties in respect of this Report save as would arise under English law.
Any liability to a person who has demonstrated reliance on any untrue or misleading statement or omission shall be determined in accordance with schedule 10A of the Financial Services and Markets Act 2000. Schedule 10A contains limits on the liability of the Directors of Spirax-Sarco Engineering plc and their liability is solely to Spirax-Sarco Engineering plc.
Responsibility statementWe confirm that to the best of our knowledge:
• the Financial Statements, prepared in accordance with IFRS as adopted by the EU, give a true and fair view of the assets, liabilities, financial position and profit or loss of the Company and the undertakings included in the consolidation taken as a whole;
• the Strategic Report includes a fair review of the development and performance of the business and the position of the Company and the undertakings included in the consolidation taken as a whole, together with a description of the principal risks and uncertainties that they face; and
• the Annual Report 2018 taken as a whole, is fair, balanced and understandable and provides the information necessary for shareholders to assess the Company’s performance, business model and strategy.
This responsibility statement was approved by the Board of Directors on 6th March 2019 and is signed on its behalf by:
Kevin BoydChief Financial Officer6th March 2019
We ensure our Annual Report is fair, balanced and understandable and gives you a true and fair view of our Group.”Kevin BoydChief Financial Officer
123Spirax-Sarco Engineering plc Annual Report 2018
Go
vern
ance
Rep
ort
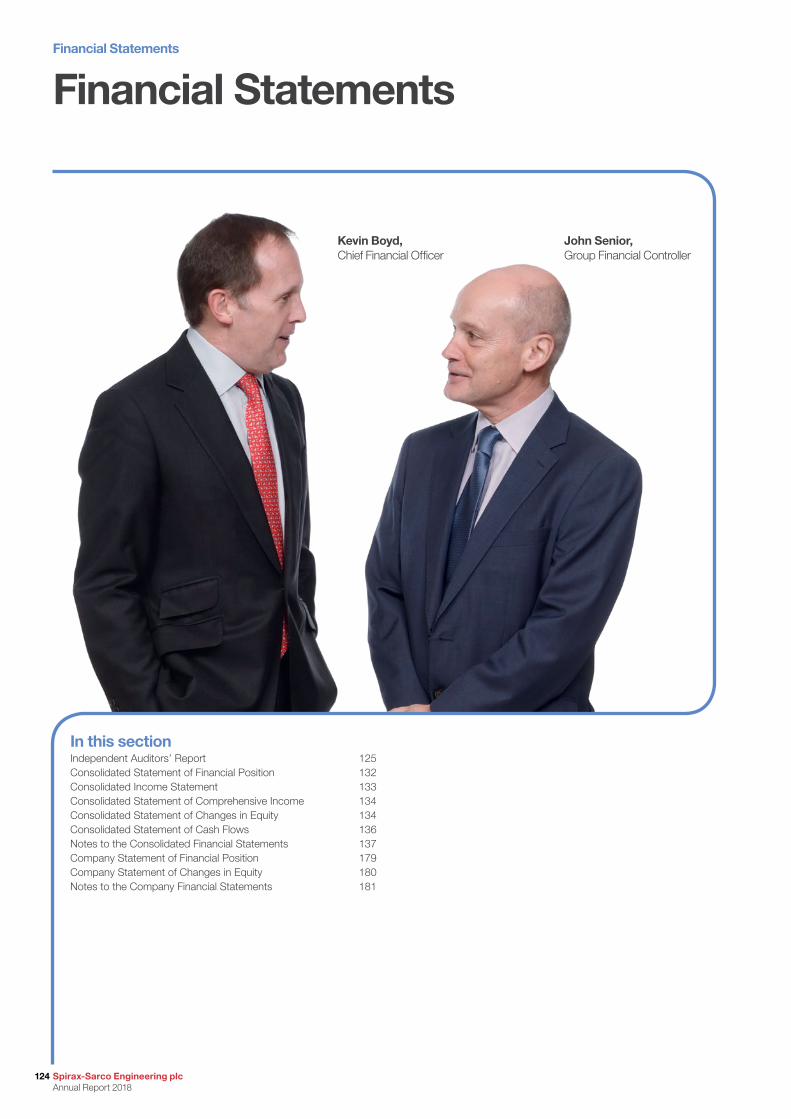
In this sectionIndependent Auditors’ Report 125Consolidated Statement of Financial Position 132Consolidated Income Statement 133Consolidated Statement of Comprehensive Income 134Consolidated Statement of Changes in Equity 134Consolidated Statement of Cash Flows 136Notes to the Consolidated Financial Statements 137Company Statement of Financial Position 179Company Statement of Changes in Equity 180Notes to the Company Financial Statements 181
Financial Statements
Kevin Boyd, Chief Financial Officer
John Senior, Group Financial Controller
Financial Statements
124 Spirax-Sarco Engineering plc Annual Report 2018

Report on the audit of the Financial Statements OpinionIn our opinion:
• the Financial Statements of Spirax-Sarco Engineering plc (the Parent Company) and its subsidiaries (the Group) give a true and fair view of the state of the Group’s and of the Parent Company’s affairs as at 31st December 2018 and of the Group’s profit for the year then ended;
• the Group Financial Statements have been properly prepared in accordance with International Financial Reporting Standards (IFRSs) as adopted by the European Union;
• the Parent Company Financial Statements have been properly prepared in accordance with United Kingdom Generally Accepted Accounting Practice, including Financial Reporting Standard 101 “Reduced Disclosure Framework”; and
• the Financial Statements have been prepared in accordance with the requirements of the Companies Act 2006 and, as regards the Group Financial Statements, Article 4 of the IAS Regulation.
We have audited the Financial Statements which comprise:
• the Consolidated Income Statement;• the Consolidated Statement of Comprehensive Income;• the Consolidated and Parent Company Statements of Financial Position;• the Consolidated Statement of Cash Flows;• the Consolidated and Parent Company Statements of Changes in Equity; and• the related Notes 1 to 30 to the Consolidated Financial Statements and 1 to 11 for the Parent Company Financial Statements.
The financial reporting framework that has been applied in the preparation of the Group Financial Statements is applicable law and IFRSs as adopted by the European Union. The financial reporting framework that has been applied in the preparation of the Parent Company Financial Statements is applicable law and United Kingdom Accounting Standards, including FRS 101 (Reduced Disclosure Framework), (United Kingdom Generally Accepted Accounting Practice).
Basis for opinionWe conducted our audit in accordance with International Standards on Auditing (UK) (ISAs (UK)) and applicable law. Our responsibilities under those standards are further described in the auditor’s responsibilities for the audit of the Financial Statements section of our report.
We are independent of the Group and the Parent Company in accordance with the ethical requirements that are relevant to our audit of the Financial Statements in the UK, including the Financial Reporting Council’s (the FRC’s) Ethical Standard as applied to listed public interest entities, and we have fulfilled our other ethical responsibilities in accordance with these requirements. We confirm that the non-audit services prohibited by the FRC’s Ethical Standard were not provided to the Group or the Parent Company.
We believe that the audit evidence we have obtained is sufficient and appropriate to provide a basis for our opinion.
Summary of our audit approach
Key audit matters The key audit matters that we identified in the current year were:
• Revenue recognition in relation to cut off for certain components and revenue recognition on any significant new and/or one-off contracts.
• Defined benefit pension liability valuation focusing on the judgements and assumptions made by management.
Within this report, any new key audit matters are identified with and any key audit matters which are the same as the prior year are identified with .
Materiality The materiality that we used for the Group Financial Statements was £11.4m (2017: £9.6m) which was determined on the basis of 5% of profit before tax adjusted for certain one off gains in the year including £47.4m gain on disposal of subsidiary, £6.5m gain on disposal of property and £6.0m past service cost credit from freezing of the pension scheme benefits in the US scheme (2017: 5% of statutory profit before tax).
Scoping We focused our Group audit scope primarily on the audit work at 28 components. These components represent the principal business units and account for 93% of the Group’s net assets, 73% of the Group’s revenue and 80% of the Group’s profit before tax.
Significant changes in our approach
Last year our report included an acquisition accounting key audit matter focussing on the valuation of intangible assets arising for two acquisitions made in 2017. As there were no material acquisitions in 2018, this matter is not included in our report. There have been no material adjustments made to the 2017 acquisition accounting and it is not considered to be a key audit matter for the Group Financial Statements.
Spirax-Sarco Engineering plc Annual Report 2018
125
Fin
anci
al S
tate
men
ts
Independent Auditor’s Report to the members of Spirax-Sarco Engineering plc
Conclusions relating to going concern, principal risks and viability statement
Going concernWe have reviewed the Directors’ statement on page 122 of the Governance Report about whether they considered it appropriate to adopt the going concern basis of accounting in preparing them and their identification of any material uncertainties to the Group’s and Company’s ability to continue to do so over a period of at least twelve months from the date of approval of the Financial Statements.
We considered as part of our risk assessment the nature of the Group, its business model and related risks including where relevant the impact of Brexit, the requirements of the applicable financial reporting framework and the system of internal control. We evaluated the Directors’ assessment of the Group’s ability to continue as a going concern, including challenging the underlying data and key assumptions used to make the assessment, and evaluated the Directors’ plans for future actions in relation to their going concern assessment.
We are required to state whether we have anything material to add or draw attention to in relation to that statement required by Listing Rule 9.8.6R(3) and report if the statement is materially inconsistent with our knowledge obtained in the audit.
We confirm that we have nothing material to report, add or draw attention to in respect of these matters.
Principal risks and viability statementBased solely on reading the Directors’ statements and considering whether they were consistent with the knowledge we obtained in the course of the audit, including the knowledge obtained in the evaluation of the Directors’ assessment of the Group’s and the Company’s ability to continue as a going concern, we are required to state whether we have anything material to add or draw attention to in relation to:
• the disclosures on pages 28 to 33 that describe the principal risks and explain how they are being managed or mitigated;
• the Directors’ confirmation on page 89 that they have carried out a robust assessment of the principal risks facing the Group, including those that would threaten its business model, future performance, solvency or liquidity; or
• the Directors’ explanation on page 89 as to how they have assessed the prospects of the Group, over what period they have done so and why they consider that period to be appropriate, and their statement as to whether they have a reasonable expectation that the Group will be able to continue in operation and meet its liabilities as they fall due over the period of their assessment, including any related disclosures drawing attention to any necessary qualifications or assumptions.
We confirm that we have nothing material to report, add or draw attention to in respect of these matters.
We are also required to report whether the Directors’ statement relating to the prospects of the Group required by Listing Rule 9.8.6R(3) is materially inconsistent with our knowledge obtained in the audit.
Key audit mattersKey audit matters are those matters that, in our professional judgement, were of most significance in our audit of the Financial Statements of the current period and include the most significant assessed risks of material misstatement (whether or not due to fraud) that we identified. These matters included those which had the greatest effect on: the overall audit strategy, the allocation of resources in the audit; and directing the efforts of the engagement team.
These matters were addressed in the context of our audit of the Financial Statements as a whole, and in forming our opinion thereon, and we do not provide a separate opinion on these matters.
Revenue recognition
Key audit matter description
The Group generates revenue primarily from the sale of goods with revenue being recognised on delivery or despatch. There is a significant risk due to the potential for fraud through possible manipulation of revenue.
We have identified two key areas of focus in relation to cut off for revenue recognition. These areas of focus are:
• Potential overstatement of revenue within certain components where a significantly higher proportion of annual revenue is recognised in December 2018 compared to the rest of the year. The key audit matter for these components focuses on the recognition of revenue by reference to the contracted shipping terms and the transfer of control for product despatches and deliveries spanning year end.
• There is a focus on any significant new and/or one-off contracts spanning the year end to determine whether any specific alternative revenue recognition policies are required to ensure revenue has been recorded within the appropriate period.
Refer to Note 1 for the Group’s revenue recognition policy and the significant issues section of the Audit Committee Report on page 84.
Independent Auditor’s Report continued
Financial Statements
126 Spirax-Sarco Engineering plc Annual Report 2018
How the scope of our audit responded to the key audit matter
In response to the key audit matter described above, we performed a risk assessment across the Group to identify specific areas of risk, focussing our testing accordingly. Our audit response consisted of several procedures including those summarised below.
We performed walkthroughs to understand the adequacy of the design and implementation of the controls relating to the revenue cycle. At significant components, we mapped the end-to-end controls and processes in place.
We reviewed the product despatch cycle and revenue recognition profile across the year end period and sampled a selection of items confirming the date of transfer of control was in line with the revenue recognition date in accordance with the terms of trade with customers. We focused our procedures on those components with a higher than average volume of trade in December 2018.
We audited a sample of contracts spanning the year end, challenging the performance obligation and the associated revenue recognition.
Key observations
From the work performed above we are satisfied that there are no material cut-off errors and revenue recognition for significant new contracts is appropriate.
Defined benefit pension liability valuation
Key audit matter description
At 31st December 2018 the gross retirement benefit liability recognised in the Consolidated Statement of Financial Position was £526.1m (2017: £543.0m). There is a risk of material misstatement relating to the judgements made by management in valuing the defined benefit pension liabilities including the use of key model input assumptions specifically the discount rate, mortality assumption and inflation rate. These variables can have a material impact in calculating the quantum of the retirement benefit liability.
Refer to Note 1 for the Group’s policy on defined benefit plans, Note 24 for the financial disclosure including the key estimates and assumptions used in the defined benefit pension plan valuation and the significant issues section of the Audit Committee Report on page 84.
How the scope of our audit responded to the key audit matter
We used our internal actuarial specialists to assess the key assumptions applied in determining the pension obligations for the five main pension schemes (three in the UK, one in Germany and one in the USA), and determined whether the key assumptions are reasonable. Testing covered 96.9% (2017: 97.1%) of defined benefit pension liabilities. For each of the five schemes, we challenged management’s key assumptions by reference to illustrative benchmark rates, sensitising any difference between management’s rates and the illustrative benchmark rates. Additionally we benchmarked the key assumptions against other listed companies to check for any outliers in the data used.
Key observations
From the work performed above we are satisfied that the key assumptions applied in respect of the valuation of the schemes’ liabilities are appropriate.
Spirax-Sarco Engineering plc Annual Report 2018
127
Fin
anci
al S
tate
men
ts
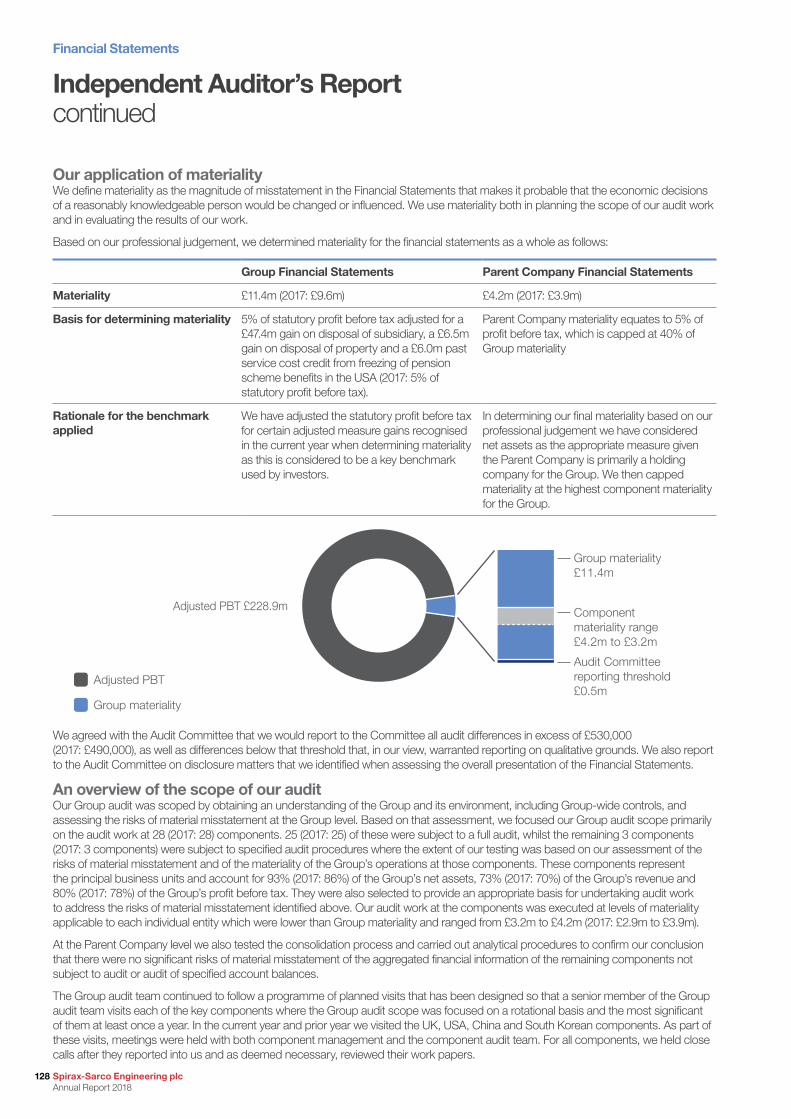
Our application of materialityWe define materiality as the magnitude of misstatement in the Financial Statements that makes it probable that the economic decisions of a reasonably knowledgeable person would be changed or influenced. We use materiality both in planning the scope of our audit work and in evaluating the results of our work.
Based on our professional judgement, we determined materiality for the financial statements as a whole as follows:
Group Financial Statements Parent Company Financial Statements
Materiality £11.4m (2017: £9.6m) £4.2m (2017: £3.9m)
Basis for determining materiality 5% of statutory profit before tax adjusted for a £47.4m gain on disposal of subsidiary, a £6.5m gain on disposal of property and a £6.0m past service cost credit from freezing of pension scheme benefits in the USA (2017: 5% of statutory profit before tax).
Parent Company materiality equates to 5% of profit before tax, which is capped at 40% of Group materiality
Rationale for the benchmark applied
We have adjusted the statutory profit before tax for certain adjusted measure gains recognised in the current year when determining materiality as this is considered to be a key benchmark used by investors.
In determining our final materiality based on our professional judgement we have considered net assets as the appropriate measure given the Parent Company is primarily a holding company for the Group. We then capped materiality at the highest component materiality for the Group.
Group materiality£11.4m
Adjusted PBT £228.9m Component materiality range£4.2m to £3.2m
Audit Committee reporting threshold£0.5m
Adjusted PBT
Group materiality
We agreed with the Audit Committee that we would report to the Committee all audit differences in excess of £530,000 (2017: £490,000), as well as differences below that threshold that, in our view, warranted reporting on qualitative grounds. We also report to the Audit Committee on disclosure matters that we identified when assessing the overall presentation of the Financial Statements.
An overview of the scope of our auditOur Group audit was scoped by obtaining an understanding of the Group and its environment, including Group-wide controls, and assessing the risks of material misstatement at the Group level. Based on that assessment, we focused our Group audit scope primarily on the audit work at 28 (2017: 28) components. 25 (2017: 25) of these were subject to a full audit, whilst the remaining 3 components (2017: 3 components) were subject to specified audit procedures where the extent of our testing was based on our assessment of the risks of material misstatement and of the materiality of the Group’s operations at those components. These components represent the principal business units and account for 93% (2017: 86%) of the Group’s net assets, 73% (2017: 70%) of the Group’s revenue and 80% (2017: 78%) of the Group’s profit before tax. They were also selected to provide an appropriate basis for undertaking audit work to address the risks of material misstatement identified above. Our audit work at the components was executed at levels of materiality applicable to each individual entity which were lower than Group materiality and ranged from £3.2m to £4.2m (2017: £2.9m to £3.9m).
At the Parent Company level we also tested the consolidation process and carried out analytical procedures to confirm our conclusion that there were no significant risks of material misstatement of the aggregated financial information of the remaining components not subject to audit or audit of specified account balances.
The Group audit team continued to follow a programme of planned visits that has been designed so that a senior member of the Group audit team visits each of the key components where the Group audit scope was focused on a rotational basis and the most significant of them at least once a year. In the current year and prior year we visited the UK, USA, China and South Korean components. As part of these visits, meetings were held with both component management and the component audit team. For all components, we held close calls after they reported into us and as deemed necessary, reviewed their work papers.
Independent Auditor’s Report continued
Financial Statements
128 Spirax-Sarco Engineering plc Annual Report 2018
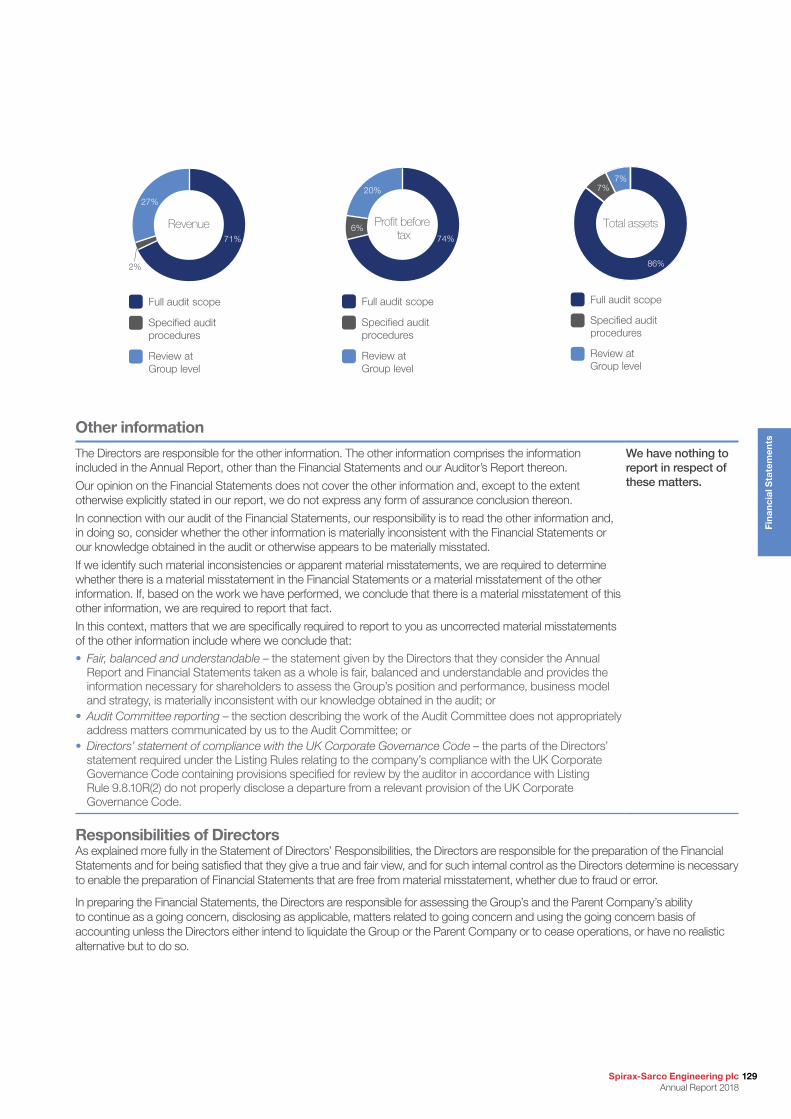
Revenue71%
27%
2%
Full audit scope
Specified audit procedures
Review at Group level
Profit before tax 74%
20%
6%
Full audit scope
Specified audit procedures
Review at Group level
Total assets
86%
7%7%
Full audit scope
Specified audit procedures
Review at Group level
Other information
The Directors are responsible for the other information. The other information comprises the information included in the Annual Report, other than the Financial Statements and our Auditor’s Report thereon.
Our opinion on the Financial Statements does not cover the other information and, except to the extent otherwise explicitly stated in our report, we do not express any form of assurance conclusion thereon.
In connection with our audit of the Financial Statements, our responsibility is to read the other information and, in doing so, consider whether the other information is materially inconsistent with the Financial Statements or our knowledge obtained in the audit or otherwise appears to be materially misstated.
If we identify such material inconsistencies or apparent material misstatements, we are required to determine whether there is a material misstatement in the Financial Statements or a material misstatement of the other information. If, based on the work we have performed, we conclude that there is a material misstatement of this other information, we are required to report that fact.
In this context, matters that we are specifically required to report to you as uncorrected material misstatements of the other information include where we conclude that:
• Fair, balanced and understandable – the statement given by the Directors that they consider the Annual Report and Financial Statements taken as a whole is fair, balanced and understandable and provides the information necessary for shareholders to assess the Group’s position and performance, business model and strategy, is materially inconsistent with our knowledge obtained in the audit; or
• Audit Committee reporting – the section describing the work of the Audit Committee does not appropriately address matters communicated by us to the Audit Committee; or
• Directors’ statement of compliance with the UK Corporate Governance Code – the parts of the Directors’ statement required under the Listing Rules relating to the company’s compliance with the UK Corporate Governance Code containing provisions specified for review by the auditor in accordance with Listing Rule 9.8.10R(2) do not properly disclose a departure from a relevant provision of the UK Corporate Governance Code.
We have nothing to report in respect of these matters.
Responsibilities of DirectorsAs explained more fully in the Statement of Directors’ Responsibilities, the Directors are responsible for the preparation of the Financial Statements and for being satisfied that they give a true and fair view, and for such internal control as the Directors determine is necessary to enable the preparation of Financial Statements that are free from material misstatement, whether due to fraud or error.
In preparing the Financial Statements, the Directors are responsible for assessing the Group’s and the Parent Company’s ability to continue as a going concern, disclosing as applicable, matters related to going concern and using the going concern basis of accounting unless the Directors either intend to liquidate the Group or the Parent Company or to cease operations, or have no realistic alternative but to do so.
Spirax-Sarco Engineering plc Annual Report 2018
129
Fin
anci
al S
tate
men
ts
Auditor’s responsibilities for the audit of the Financial StatementsOur objectives are to obtain reasonable assurance about whether the Financial Statements as a whole are free from material misstatement, whether due to fraud or error, and to issue an Auditor’s Report that includes our opinion. Reasonable assurance is a high level of assurance, but is not a guarantee that an audit conducted in accordance with ISAs (UK) will always detect a material misstatement when it exists. Misstatements can arise from fraud or error and are considered material if, individually or in the aggregate, they could reasonably be expected to influence the economic decisions of users taken on the basis of these Financial Statements.
Details of the extent to which the audit was considered capable of detecting irregularities, including fraud are set out below.
A further description of our responsibilities for the audit of the Financial Statements is located on the FRC’s website at: www.frc.org.uk/auditorsresponsibilities. This description forms part of our Auditor’s Report.
Extent to which the audit was considered capable of detecting irregularities, including fraud
We identify and assess the risks of material misstatement of the Financial Statements, whether due to fraud or error, and then design and perform audit procedures responsive to those risks, including obtaining audit evidence that is sufficient and appropriate to provide a basis for our opinion.
Identifying and assessing potential risks related to irregularitiesIn identifying and assessing risks of material misstatement in respect of irregularities, including fraud and non-compliance with laws and regulations, our procedures included the following:
• enquiring of management, internal audit and the Audit Committee, including obtaining and reviewing supporting documentation, concerning the Group’s policies and procedures relating to:
o identifying, evaluating and complying with laws and regulations and whether they were aware of any instances of non-compliance;
o detecting and responding to the risks of fraud and whether they have knowledge of any actual, suspected or alleged fraud; and
o the internal controls established to mitigate risks related to fraud or non-compliance with laws and regulations;
• discussing among the engagement team, including significant and material component audit teams in UK, USA, China and South Korea, and involving relevant internal specialists, including tax, pensions and IT regarding how and where fraud might occur in the Financial Statements and any potential indicators of fraud. As part of this discussion, we identified potential for fraud in the following areas:
o manipulation of assumptions used to value defined benefit pension liabilities (identified as a key audit matter);
o manipulation of revenue recognition to improve performance (identified as a key audit matter);
• obtaining an understanding of the legal and regulatory framework that the Group operates in, focusing on those laws and regulations that had a direct effect on the Financial Statements or that had a fundamental effect on the operations of the Group. The key laws and regulations we considered in this context included the UK Companies Act, Listing Rules, pensions legislation and tax legislation.
Audit response to risks identifiedAs a result of performing the above, we identified the following as key audit matters:
• cut off for revenue recognition in certain components and accounting for contracts spanning year end; and • valuation of defined benefits pension liability focussing on management judgements and assumptions used in valuation.
The key audit matters section of our report explains the matters in more detail and also describes the specific procedures we performed in response to those key audit matters.
In addition to the above, our procedures to respond to risks identified included the following:
• reviewing the Financial Statement disclosures and testing to supporting documentation to assess compliance with relevant laws and regulations discussed above;
• enquiring of management, the Audit Committee and in-house legal counsel concerning actual and potential litigation and claims;• performing analytical procedures to identify any unusual or unexpected relationships that may indicate risks of material
misstatement due to fraud;• reading minutes of meetings of those charged with governance, reviewing internal audit reports and reviewing correspondence
with HMRC; and• in addressing the risk of fraud through management override of controls, testing the appropriateness of journal entries and other
adjustments; assessing whether the judgements made in making accounting estimates are indicative of a potential bias; and evaluating the business rationale of any significant transactions that are unusual or outside the normal course of business.
We also communicated relevant identified laws and regulations and potential fraud risks to all engagement team members including internal specialists and significant component audit teams in UK, USA, China and South Korea, and remained alert to any indications of fraud or non-compliance with laws and regulations throughout the audit.
Independent Auditor’s Report continued
Financial Statements
130 Spirax-Sarco Engineering plc Annual Report 2018
Report on other legal and regulatory requirementsOpinions on other matters prescribed by the Companies Act 2006In our opinion the part of the Directors’ Remuneration Report to be audited has been properly prepared in accordance with the Companies Act 2006.
In our opinion, based on the work undertaken in the course of the audit:
• the information given in the Strategic Report and the Directors’ Report for the financial year for which the Financial Statements are prepared is consistent with the Financial Statements; and
• the Strategic Report and the Directors’ Report have been prepared in accordance with applicable legal requirements.
In the light of the knowledge and understanding of the Group and of the Parent Company and their environment obtained in the course of the audit, we have not identified any material misstatements in the Strategic Report or the Directors’ Report.
Matters on which we are required to report by exception
Adequacy of explanations received and accounting records
Under the Companies Act 2006 we are required to report to you if, in our opinion:
• we have not received all the information and explanations we require for our audit; or• adequate accounting records have not been kept by the Parent Company, or returns adequate for our
audit have not been received from branches not visited by us; or• the Parent Company Financial Statements are not in agreement with the accounting records and returns.
We have nothing to report in respect of these matters.
Directors’ remuneration
Under the Companies Act 2006 we are also required to report if in our opinion certain disclosures of Directors’ remuneration have not been made or the part of the Directors’ Remuneration Report to be audited is not in agreement with the accounting records and returns.
We have nothing to report in respect of these matters.
Other mattersAuditor tenure Following the recommendation of the Audit Committee, we were appointed by the Directors and subsequently at the Annual General Meeting on 11th May 2014 to audit the Financial Statements for the year ending 31st December 2014 and subsequent financial periods. The period of total uninterrupted engagement including previous renewals and reappointments of the firm is five years, covering the years ending 31st December 2014 to 31st December 2018.
Consistency of the Audit Report with the additional report to the Audit CommitteeOur audit opinion is consistent with the additional report to the Audit Committee we are required to provide in accordance with ISAs (UK).
Use of our reportThis report is made solely to the Company’s members, as a body, in accordance with Chapter 3 of Part 16 of the Companies Act 2006. Our audit work has been undertaken so that we might state to the Company’s members those matters we are required to state to them in an Auditor’s Report and for no other purpose. To the fullest extent permitted by law, we do not accept or assume responsibility to anyone other than the Company and the Company’s members as a body, for our audit work, for this report, or for the opinions we have formed.
Mark Mullins FCASenior Statutory Auditorfor and on behalf of Deloitte LLP Statutory Auditor
London
6th March 2019
Spirax-Sarco Engineering plc Annual Report 2018
131
Fin
anci
al S
tate
men
ts
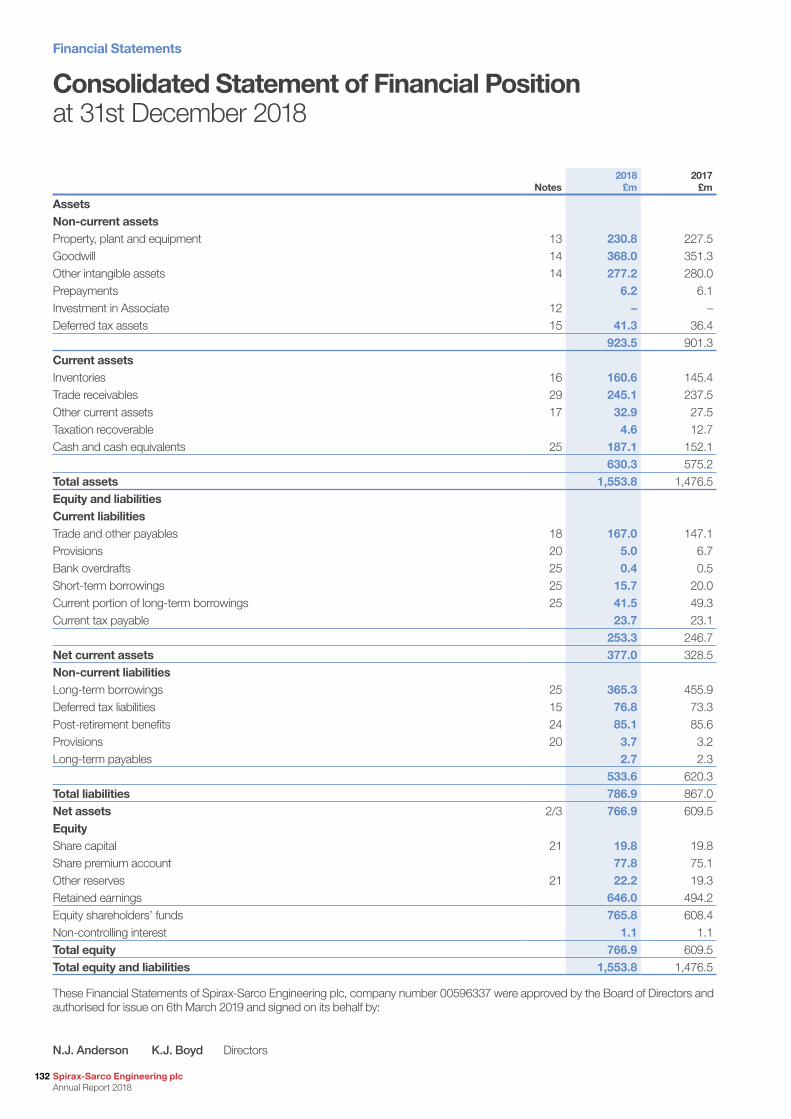
Financial Statements
132 Spirax-Sarco Engineering plc Annual Report 2018
Notes2018
£m2017
£m
AssetsNon-current assetsProperty, plant and equipment 13 230.8 227.5Goodwill 14 368.0 351.3Other intangible assets 14 277.2 280.0Prepayments 6.2 6.1Investment in Associate 12 – –Deferred tax assets 15 41.3 36.4
923.5 901.3Current assetsInventories 16 160.6 145.4Trade receivables 29 245.1 237.5Other current assets 17 32.9 27.5Taxation recoverable 4.6 12.7Cash and cash equivalents 25 187.1 152.1
630.3 575.2Total assets 1,553.8 1,476.5Equity and liabilitiesCurrent liabilitiesTrade and other payables 18 167.0 147.1Provisions 20 5.0 6.7Bank overdrafts 25 0.4 0.5Short-term borrowings 25 15.7 20.0Current portion of long-term borrowings 25 41.5 49.3Current tax payable 23.7 23.1
253.3 246.7Net current assets 377.0 328.5Non-current liabilitiesLong-term borrowings 25 365.3 455.9Deferred tax liabilities 15 76.8 73.3Post-retirement benefits 24 85.1 85.6Provisions 20 3.7 3.2Long-term payables 2.7 2.3
533.6 620.3Total liabilities 786.9 867.0Net assets 2/3 766.9 609.5EquityShare capital 21 19.8 19.8Share premium account 77.8 75.1Other reserves 21 22.2 19.3Retained earnings 646.0 494.2Equity shareholders’ funds 765.8 608.4Non-controlling interest 1.1 1.1Total equity 766.9 609.5Total equity and liabilities 1,553.8 1,476.5
These Financial Statements of Spirax-Sarco Engineering plc, company number 00596337 were approved by the Board of Directors and authorised for issue on 6th March 2019 and signed on its behalf by:
N.J. Anderson K.J. Boyd Directors
Consolidated Statement of Financial Position at 31st December 2018
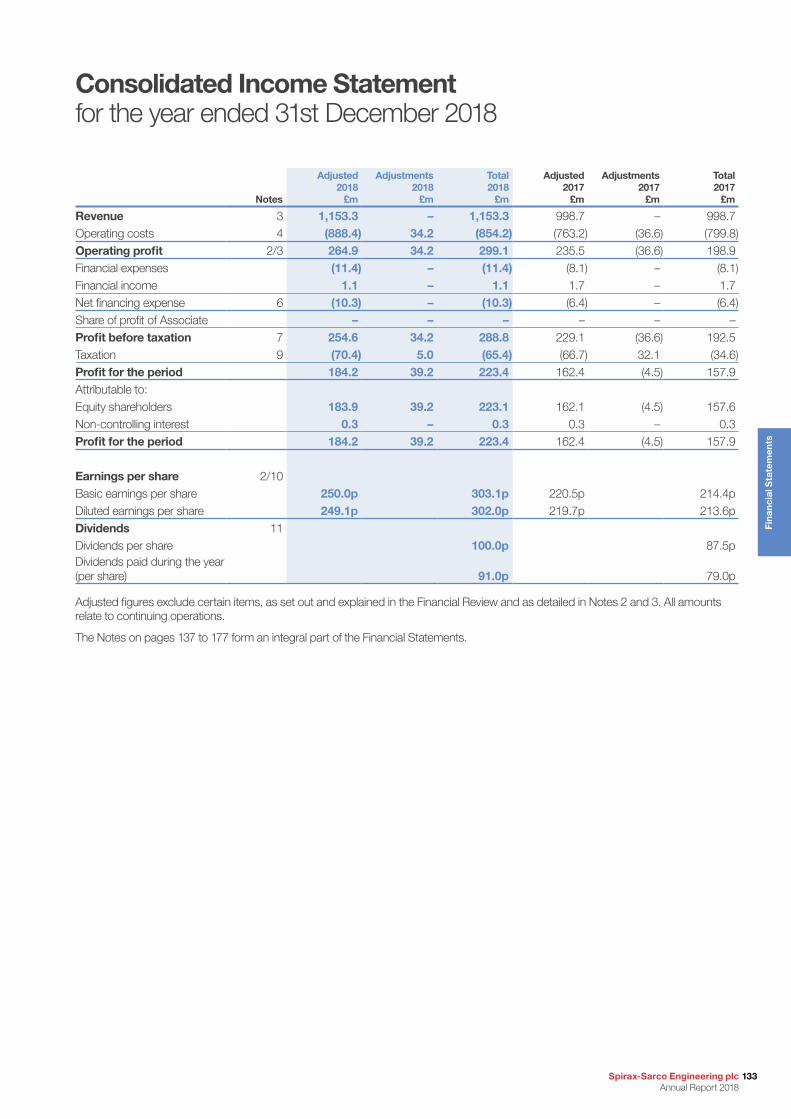
Spirax-Sarco Engineering plc Annual Report 2018
133
Fin
anci
al S
tate
men
ts
Notes
Adjusted 2018
£m
Adjustments 2018
£m
Total 2018
£m
Adjusted 2017
£m
Adjustments 2017
£m
Total 2017
£m
Revenue 3 1,153.3 – 1,153.3 998.7 – 998.7Operating costs 4 (888.4) 34.2 (854.2) (763.2) (36.6) (799.8)Operating profit 2/3 264.9 34.2 299.1 235.5 (36.6) 198.9Financial expenses (11.4) – (11.4) (8.1) – (8.1)Financial income 1.1 – 1.1 1.7 – 1.7Net financing expense 6 (10.3) – (10.3) (6.4) – (6.4)Share of profit of Associate – – – – – –Profit before taxation 7 254.6 34.2 288.8 229.1 (36.6) 192.5Taxation 9 (70.4) 5.0 (65.4) (66.7) 32.1 (34.6)Profit for the period 184.2 39.2 223.4 162.4 (4.5) 157.9Attributable to:Equity shareholders 183.9 39.2 223.1 162.1 (4.5) 157.6Non-controlling interest 0.3 – 0.3 0.3 – 0.3Profit for the period 184.2 39.2 223.4 162.4 (4.5) 157.9
Earnings per share 2/10Basic earnings per share 250.0p 303.1p 220.5p 214.4pDiluted earnings per share 249.1p 302.0p 219.7p 213.6pDividends 11Dividends per share 100.0p 87.5pDividends paid during the year (per share) 91.0p 79.0p
Adjusted figures exclude certain items, as set out and explained in the Financial Review and as detailed in Notes 2 and 3. All amounts relate to continuing operations.
The Notes on pages 137 to 177 form an integral part of the Financial Statements.
Consolidated Income Statementfor the year ended 31st December 2018
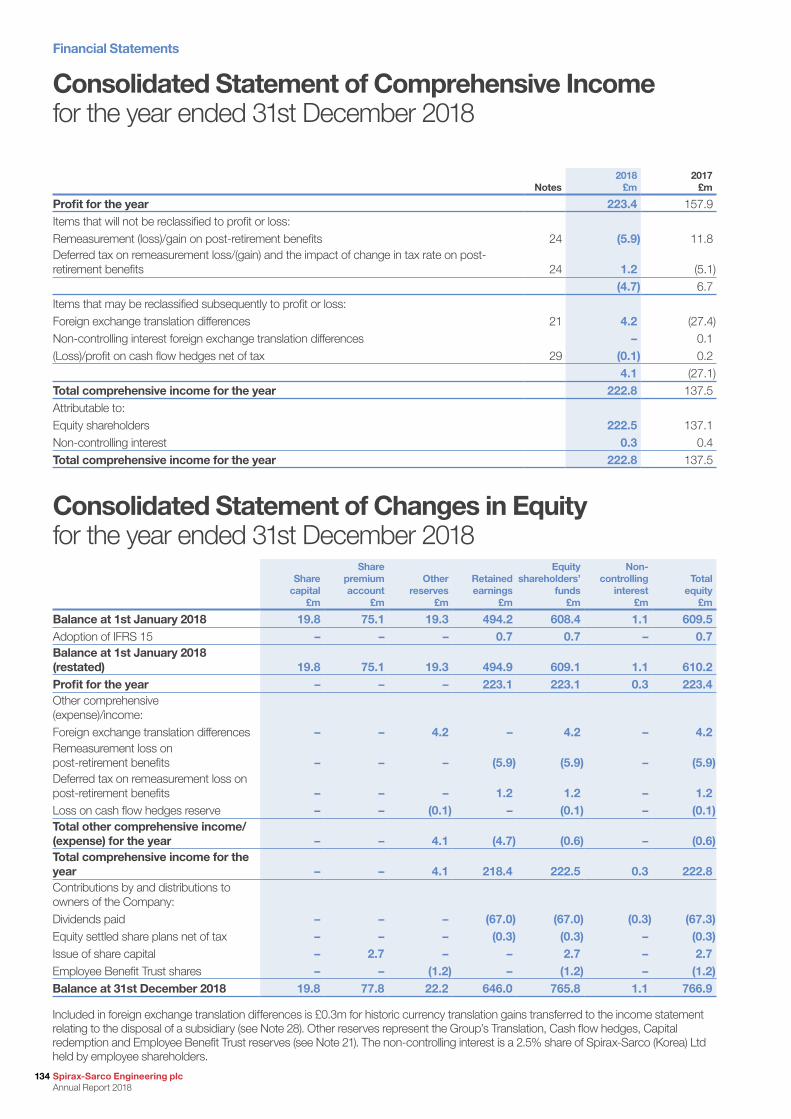
Financial Statements
134 Spirax-Sarco Engineering plc Annual Report 2018
Consolidated Statement of Comprehensive Incomefor the year ended 31st December 2018
Consolidated Statement of Changes in Equityfor the year ended 31st December 2018
Notes2018
£m2017
£m
Profit for the year 223.4 157.9Items that will not be reclassified to profit or loss:Remeasurement (loss)/gain on post-retirement benefits 24 (5.9) 11.8Deferred tax on remeasurement loss/(gain) and the impact of change in tax rate on post-retirement benefits 24 1.2 (5.1)
(4.7) 6.7Items that may be reclassified subsequently to profit or loss:Foreign exchange translation differences 21 4.2 (27.4)Non-controlling interest foreign exchange translation differences – 0.1(Loss)/profit on cash flow hedges net of tax 29 (0.1) 0.2
4.1 (27.1)Total comprehensive income for the year 222.8 137.5Attributable to:Equity shareholders 222.5 137.1Non-controlling interest 0.3 0.4Total comprehensive income for the year 222.8 137.5
Sharecapital
£m
Sharepremiumaccount
£m
Otherreserves
£m
Retainedearnings
£m
Equityshareholders’
funds£m
Non-controlling
interest£m
Totalequity
£m
Balance at 1st January 2018 19.8 75.1 19.3 494.2 608.4 1.1 609.5Adoption of IFRS 15 – – – 0.7 0.7 – 0.7Balance at 1st January 2018 (restated) 19.8 75.1 19.3 494.9 609.1 1.1 610.2Profit for the year – – – 223.1 223.1 0.3 223.4Other comprehensive (expense)/income:Foreign exchange translation differences – – 4.2 – 4.2 – 4.2Remeasurement loss on post-retirement benefits – – – (5.9) (5.9) – (5.9)Deferred tax on remeasurement loss on post-retirement benefits – – – 1.2 1.2 – 1.2Loss on cash flow hedges reserve – – (0.1) – (0.1) – (0.1)Total other comprehensive income/(expense) for the year – – 4.1 (4.7) (0.6) – (0.6)Total comprehensive income for the year – – 4.1 218.4 222.5 0.3 222.8Contributions by and distributions to owners of the Company:Dividends paid – – – (67.0) (67.0) (0.3) (67.3)Equity settled share plans net of tax – – – (0.3) (0.3) – (0.3)Issue of share capital – 2.7 – – 2.7 – 2.7Employee Benefit Trust shares – – (1.2) – (1.2) – (1.2)Balance at 31st December 2018 19.8 77.8 22.2 646.0 765.8 1.1 766.9
Included in foreign exchange translation differences is £0.3m for historic currency translation gains transferred to the income statement relating to the disposal of a subsidiary (see Note 28). Other reserves represent the Group’s Translation, Cash flow hedges, Capital redemption and Employee Benefit Trust reserves (see Note 21). The non-controlling interest is a 2.5% share of Spirax-Sarco (Korea) Ltd held by employee shareholders.
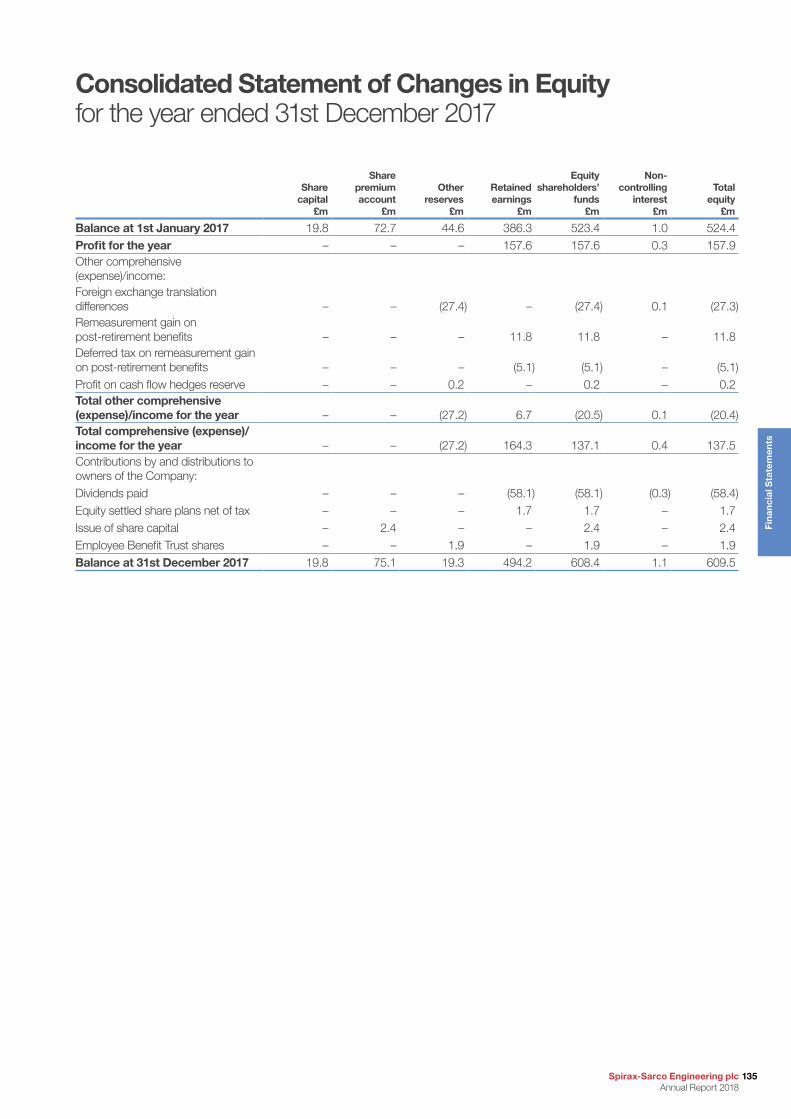
Spirax-Sarco Engineering plc Annual Report 2018
135
Fin
anci
al S
tate
men
ts
Consolidated Statement of Changes in Equityfor the year ended 31st December 2017
Sharecapital
£m
Sharepremiumaccount
£m
Otherreserves
£m
Retainedearnings
£m
Equityshareholders’
funds£m
Non-controlling
interest£m
Totalequity
£m
Balance at 1st January 2017 19.8 72.7 44.6 386.3 523.4 1.0 524.4Profit for the year – – – 157.6 157.6 0.3 157.9Other comprehensive (expense)/income:Foreign exchange translation differences – – (27.4) – (27.4) 0.1 (27.3)Remeasurement gain on post-retirement benefits – – – 11.8 11.8 – 11.8Deferred tax on remeasurement gain on post-retirement benefits – – – (5.1) (5.1) – (5.1)Profit on cash flow hedges reserve – – 0.2 – 0.2 – 0.2Total other comprehensive (expense)/income for the year – – (27.2) 6.7 (20.5) 0.1 (20.4)Total comprehensive (expense)/ income for the year – – (27.2) 164.3 137.1 0.4 137.5Contributions by and distributions to owners of the Company:Dividends paid – – – (58.1) (58.1) (0.3) (58.4)Equity settled share plans net of tax – – – 1.7 1.7 – 1.7Issue of share capital – 2.4 – – 2.4 – 2.4Employee Benefit Trust shares – – 1.9 – 1.9 – 1.9Balance at 31st December 2017 19.8 75.1 19.3 494.2 608.4 1.1 609.5
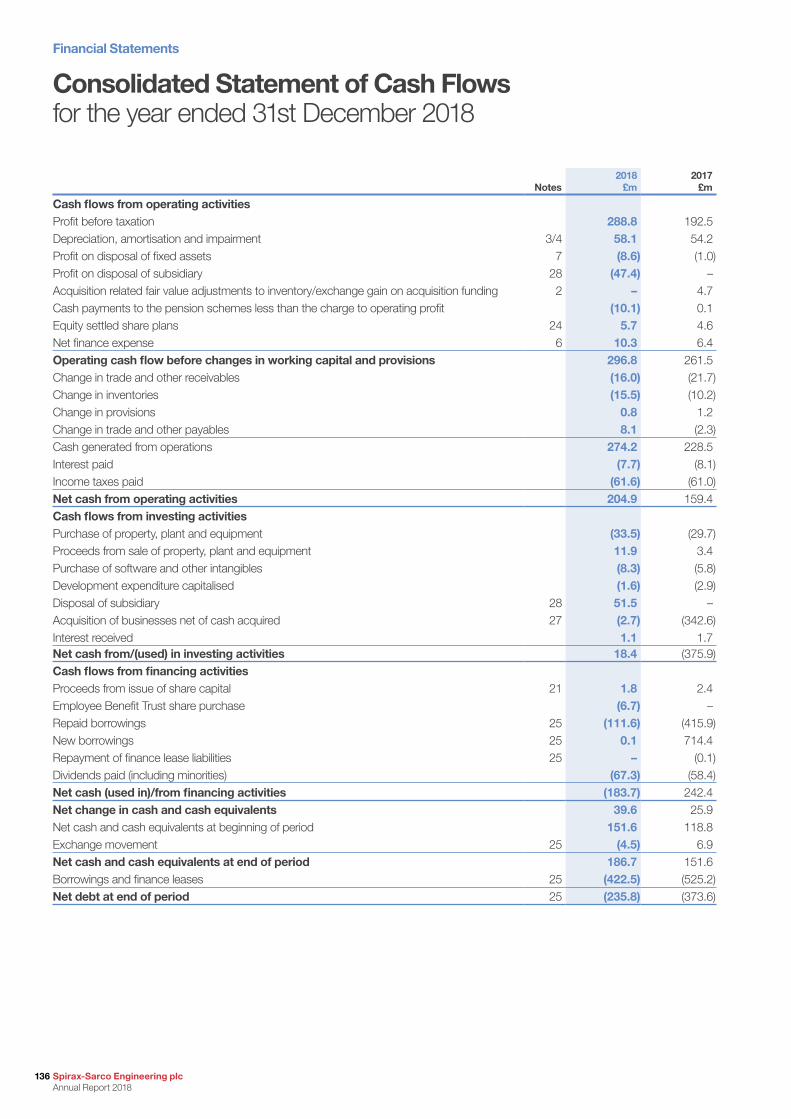
Financial Statements
136 Spirax-Sarco Engineering plc Annual Report 2018
Consolidated Statement of Cash Flowsfor the year ended 31st December 2018
Notes2018
£m2017
£m
Cash flows from operating activitiesProfit before taxation 288.8 192.5Depreciation, amortisation and impairment 3/4 58.1 54.2Profit on disposal of fixed assets 7 (8.6) (1.0)Profit on disposal of subsidiary 28 (47.4) –Acquisition related fair value adjustments to inventory/exchange gain on acquisition funding 2 – 4.7Cash payments to the pension schemes less than the charge to operating profit (10.1) 0.1Equity settled share plans 24 5.7 4.6Net finance expense 6 10.3 6.4Operating cash flow before changes in working capital and provisions 296.8 261.5Change in trade and other receivables (16.0) (21.7)Change in inventories (15.5) (10.2)Change in provisions 0.8 1.2Change in trade and other payables 8.1 (2.3)Cash generated from operations 274.2 228.5Interest paid (7.7) (8.1)Income taxes paid (61.6) (61.0)Net cash from operating activities 204.9 159.4Cash flows from investing activitiesPurchase of property, plant and equipment (33.5) (29.7)Proceeds from sale of property, plant and equipment 11.9 3.4Purchase of software and other intangibles (8.3) (5.8)Development expenditure capitalised (1.6) (2.9)Disposal of subsidiary 28 51.5 –Acquisition of businesses net of cash acquired 27 (2.7) (342.6)Interest received 1.1 1.7Net cash from/(used) in investing activities 18.4 (375.9)Cash flows from financing activitiesProceeds from issue of share capital 21 1.8 2.4Employee Benefit Trust share purchase (6.7) –Repaid borrowings 25 (111.6) (415.9)New borrowings 25 0.1 714.4Repayment of finance lease liabilities 25 – (0.1)Dividends paid (including minorities) (67.3) (58.4)Net cash (used in)/from financing activities (183.7) 242.4Net change in cash and cash equivalents 39.6 25.9Net cash and cash equivalents at beginning of period 151.6 118.8Exchange movement 25 (4.5) 6.9Net cash and cash equivalents at end of period 186.7 151.6Borrowings and finance leases 25 (422.5) (525.2)Net debt at end of period 25 (235.8) (373.6)
Spirax-Sarco Engineering plc Annual Report 2018
137
Fin
anci
al S
tate
men
ts
Notes to the Consolidated Financial Statements
1 Accounting policiesBasis of preparationThe Financial Statements have been prepared in accordance with International Financial Reporting Standards (IFRS) issued by the International Accounting Standards Board (IASB) that have been adopted by the European Union (EU).
The preparation of Financial Statements in conformity with IFRS requires the Directors to apply IAS 1 and make judgements, estimates and assumptions about the carrying amounts of assets and liabilities that are not apparent from other sources. The estimates and associated assumptions are based on historical experiences and other factors that are considered to be relevant. Actual results may differ from these estimates.
The estimates and underlying assumptions are reviewed on an on-going basis. Revisions to accounting estimates are recognised in the period in which the estimate is revised if the revision affects only that period, or in the period of the revision and future periods if the revision affects both current and future periods.
Critical judgements in applying the Group’s accounting policies The Directors have concluded that no critical judgements, apart from those involving estimations (which are dealt with separately below) have been made in the process of applying the Group’s accounting policies.
Key sources of estimation uncertaintyThe key assumptions concerning the future, and other key sources of estimation uncertainty at the reporting period that may have a significant risk of causing a material adjustment to the carrying amounts of assets and liabilities within the next financial year, are outlined below.
(i) Post-retirement benefits The Group’s defined benefit obligation is assessed by
selecting key assumptions. The selection of mortality rates, inflation and pay increases are key sources of estimation uncertainty which could lead to material adjustment in the defined benefit obligation within the next financial year. These assumptions are set with close reference to market conditions.
The Group’s defined benefit obligation is discounted at a rate set by reference to market yields at the end of the reporting period on high quality corporate bonds. The most significant criteria considered for the selection of bonds include the issue size of the corporate bonds, quality of the bonds and the identification of outliers which are excluded.
The assumptions selected and associated sensitivity analysis are disclosed in Note 24.
The possibility of a “no deal” Brexit has created economic uncertainties for business. The Group’s Risk Management Committee has taken action to mitigate these uncertainties as outlined on page 29. The group has prepared for the application of tariffs for goods moving in and out of Europe as disclosed in the Governance Report on page 69. However we are also poised to take advantage of opportunities that are presented and to mitigate any adverse trading impact on the Group. The Group’s view is that this doesn’t represent a material estimation uncertainty.
The Group has considerable financial resources together with a diverse range of products and customers across wide geographic areas and industries. As a consequence, the Directors believe that the Group is well placed to manage its business risks successfully.
Further information on the Group’s business activities, performance and position, together with the financial position of the Group, its capital structure and cash flow are included in the Strategic Report from the inside front cover to page 65. In addition, Note 29 to the Financial Statements discloses details of the Group’s financial risk management and credit facilities.
The Consolidated Financial Statements are presented in pounds sterling, which is the Company’s functional currency, rounded to the nearest one hundred thousand.
The Group’s Income Statement includes an adjustment column where certain items are included. Details of the items included and the reasons why they are included are disclosed in Note 2.
New standards adopted in the current yearThe Group adopted IFRS 15 (Revenue from Contracts with Customers) using the modified retrospective approach on 1st January 2018. Comparative information has not been restated. IFRS 15 establishes a single five-step model for recognising revenue from contracts with customers and supersedes IAS 18 (Revenue) and IAS 11 (Construction Contracts).
IFRS 15 introduces principles to allocate the transaction price to performance obligations and recognise revenue as those performance obligations are satisfied and control of the goods or services are transferred to the customer.
The impact of adoption of IFRS 15 on these Financial Statements is:
• At 1st January 2018 an increase in opening retained earnings of £0.7m;
• For the 12 months ending 31st December 2018 an increase in revenue of £0.9m, increase in operating costs of £0.4m, increase in profit before tax of £0.5m, increase in taxation of £0.1m and increase in profit after tax for the period of £0.4m; and
• At 31st December 2018 an increase in contract assets of £3.3m, reduction in inventories of £2.1m and an increase in current tax payable of £0.1m.
IFRS 9 (Financial Instruments) was adopted on 1st January 2018, replacing IAS 39 (Financial Instruments: Recognition and Measurement). IFRS 9 includes requirements for the classification and measurement of financial instruments, impairment of financial assets and hedge accounting.
An assessment was performed and the adoption of IFRS 9 has not had a material impact on the financial results of the Group. The assessment included an analysis of the Group’s hedge accounting policy and existing hedge accounting relationships, and it was determined that those relationships designated under IAS 39 are still effective under IFRS 9. The Group has adopted the simplified approach to recognise lifetime expected credit losses for trade receivables and contract assets as permitted by IFRS 9. The change in approach has not had a material impact on the trade receivables provision.

Financial Statements
138 Spirax-Sarco Engineering plc Annual Report 2018
1 Accounting policies continuedIn addition to IFRS 15 and IFRS 9 during the current year the Group has applied a number of amendments to IFRS issued by the International Accounting Standards Board (IASB). Their adoption has not had a material impact on the disclosures or on the amounts reported in these Financial Statements. The following amendments were applied:
• IFRS 2 (amendments): Classification and Measurement of Share-based Payment Transactions;
• IAS 40 (amendments): Transfers of Investment Property • Annual improvements to IFRS 2014-2016 Cycle;
• IAS 28 (amendments): Investments in Associate and Joint Ventures; and
• IFRIC 22: Foreign Currency Transactions and Advance Consideration.
Otherwise the accounting policies set out below have been applied consistently to both years presented in these Consolidated Financial Statements.
New standards and interpretations not yet adoptedAt the date of authorisation of these Financial Statements, the Group has not applied the following new and revised IFRS that have been issued but are not yet effective (and in some cases had not yet been adopted by the EU):
• IFRS 16: Leases;• IFRS 17: Insurance Contracts;• IFRS 9 (amendments): Prepayment Features with
Negative Compensation;• IAS 28 (amendments): Long-term Interests in Associates and
Joint Ventures;• IAS 19 (amendments): Plan Amendment, Curtailment
or Settlement;• IFRS 10 and IAS 28 (amendments): Sale or Contribution of
Assets between an Investor and its Associate or Joint Venture• Annual Improvements: Amendments to IFRS 3 Business
Combinations, IFRS 11 Joint Arrangements, IAS 12 Income Taxes and IAS 23 Borrowing Costs; and
• IFRIC 23: Uncertainty Over Income Tax Treatments.
The Directors do not expect that the adoption of the Standards listed above will have a material impact on the Financial Statements of the Group in future periods, except as noted below in relation to IFRS 16.
IFRS 16 introduces new requirements for lessee and lessor accounting, with the distinction between operating lease and finance lease no longer applying for lessees. Under IFRS 16, a lessee is required to recognise assets and liabilities for all leases with a term of more than 12 months, unless the underlying asset is of a low value when new. The new standard also requires depreciation of the asset to be recognised separately from the interest expense on the lease liability. As at 31st December 2018, the Group had total operating lease obligations of £39.8m and an operating lease charge of £11.2m for the year ended 31st December 2018. The date of initial application of IFRS 16 for the Group is 1st January 2019.
The Group expects to apply the modified retrospective approach for transition and, therefore, comparative information will not be restated. As a result, the difference between the asset and liability recognised on 1st January 2019 will be shown as an adjustment to opening retained earnings.
As a result of using the modified retrospective approach for transition, the Group plan to elect to use the following transition practical expedients:
a) The definition of a lease in accordance with IAS 17 and IFRIC 4 will continue to be applied to leases entered or changed before 1st January 2019, and as a result we will not reassess whether a contract is or contains a lease on transition.
b) Leases with a determined lease term of less than 12 months remaining from 1st January 2019 will be treated as short term.
c) Initial direct costs will be excluded from the measurement of the right-of-use asset for all leases entered into or changed before 1st January 2019.
Furthermore, the Group also plans to elect to make use of the following exemptions provided by IFRS 16:
a) Leases with a determined lease term of 12 months of less from the commencement of the lease will be treated as short term and therefore not included in the right-of-use asset or lease liability. Instead, lease costs will be recognised on a straight line basis across the life of the lease.
b) Leases for which the underlying asset is of low value when new will be exempt from the requirements to value a right-of-use asset and lease liability. Instead, lease costs will be recognised on a straight line basis across the life of the lease. To apply this exemption, a threshold of £5,000 has been utilised to define “low value”.
c) Lease and non-lease components will not be separated, and therefore each lease component and any associated non-lease component will be accounted for as a single component.
d) Where applicable, IFRS 16 will be applied to a portfolio of leases with similar characteristics.
An assessment of the impact of transitioning to IFRS 16 on 1st January 2019 has been completed. The estimated impact on the Financial Statements on transitioning is as follows:
Statement of Financial Position:
a) Right-of-use assets will be capitalised, totalling approximately £36m. The majority of this value (£28m) results from leased property where the Group leases a number of office and warehouse sites in a number of geographical locations. The remaining £8m is largely made up of leased motor vehicles, where the Group makes use of leasing cars for sales and service engineers at a number of operating company locations.
b) Lease liabilities will be recognised totalling approximately £40m, split between £10m relating to amounts due within 12 months from 1st January 2019 and £30m relating to amounts due after 1st January 2020.
Notes to the Consolidated Financial Statements continued
Spirax-Sarco Engineering plc Annual Report 2018
139
Fin
anci
al S
tate
men
ts
1 Accounting policies continuedc) As a result of the Group using the modified-retrospective
approach, all property lease assets were valued as if IFRS 16 had always applied since the commencement of those leases. This led to a difference between the right-of-use asset capitalised and the corresponding lease liability. The difference between these values of approximately £4m will be recognised as an adjustment to opening retained earnings.
Income Statement:
a) The impacts on the Income Statement are expected to result in an increase in operating profit of approximately £1m compared to the operating profit had IAS 17 continued to apply. This is made up of a reduction in operating lease rentals of approximately £11m offset by a depreciation charge of approximately £10m. Once taking into account an additional £1m of expected lease liability interest, the overall impact on profit before tax in 2019 is expected to be nil.
b) The total expense relating to exempt leases (being short term, low value or variable lease payments not included in the lease liability) is expected to be approximately £2m.
Statement of Cash Flows:
a) Net cash inflow from operating activities is expected to increase by approximately £10m as a result of the principal payments made on lease liabilities being reclassified from cash generated from operations to financing activities
b) Net cash outflow from financing activities is expected to increase by approximately £10m as a result of the above
c) There is no impact on the net change in cash and cash equivalents as a result of IFRS 16
Basis of accounting(i) Subsidiaries The Group Consolidated Financial Statements include the
results of the Company and all its subsidiary undertakings. Subsidiaries are entities controlled by the Group. Control exists when the Group has the power, directly or indirectly, to govern the financial and operating policies of an entity so as to obtain benefits from its activities. In assessing control, potential voting rights that presently are exercisable or convertible are taken into account. The Financial Statements of subsidiaries are included in the Consolidated Financial Statements from the date that control commences until the date that control ceases.
(ii) Associates Associates are those entities for which the Group has
significant influence, but not control, over the financial and operating policies. The Financial Statements include the Group’s share of the total recognised income and expense of Associates on an equity accounted basis, from the date that significant influence commenced until the date that significant influence ceases.
(iii) Transactions eliminated on consolidation Intra Group balances, and any unrealised gains and losses or
income and expenses arising from intra Group transactions, are eliminated in preparing the Group Consolidated Financial Statements. Unrealised gains arising from transactions with Associates are eliminated to the extent of the Group’s interest in the entity.
Foreign currency(i) On consolidation The assets and liabilities of foreign operations are translated
into sterling at exchange rates ruling at the date of the Consolidated Statement of Financial Position (closing rate). The revenues, expenses and cash flows of foreign operations are translated into sterling at average rates of exchange ruling during the year. Where the Notes to the Group Consolidated Financial Statements include tables reconciling movements between opening and closing balances, opening and closing assets and liabilities are translated at closing rates and revenue, expenses and all other movements translated at average rates, with the exchange differences arising being disclosed separately.
Exchange differences arising from the translation of the assets and liabilities of foreign operations are taken to a separate translation reserve within equity. They are recycled and recognised in the Income Statement upon disposal of the operation. In respect of all foreign operations, any differences that have arisen before 1st January 2004, the date of transition to IFRS, are not presented as a separate component of equity.
(ii) Foreign currency transactions Transactions in foreign currencies are translated to the
respective currencies of the Group entities at the foreign exchange rate at the date of the transaction. Monetary assets and liabilities at the date of the Statement of Financial Position denominated in a currency other than the functional currency of the entity are translated at the foreign exchange rate ruling at that date. Foreign exchange differences arising on translation are recognised in the Income Statement. Non-monetary assets and liabilities that are measured in terms of historical cost in a foreign currency are translated using the exchange rate at the date of the transaction. Non-monetary assets and liabilities denominated in foreign currencies that are stated at fair value are translated at foreign exchange rates ruling at the dates fair value was determined.
Cash flow hedgesWhere a derivative financial instrument is designated as a hedge of the variability in cash flows of a highly probable forecasted transaction, the effective part of any gain or loss on the derivative financial instrument is recognised in other comprehensive income and presented in the cash flow hedges reserve. The associated gain or loss is removed from equity and recognised in the Income Statement in the period in which the transaction to which it relates occurs.
Net investment hedge accountingThe Group uses foreign currency denominated borrowings as a hedge against translation exposure on the Group’s net investment in overseas companies. Where the hedge is fully effective at hedging, the variability in the net assets of such companies caused by changes in exchange rates and the changes in value of the borrowings are recognised in the Consolidated Statement of Comprehensive Income and accumulated in the translation reserve. The ineffective part of any changes in value caused by changes in exchange rates is recognised in the Consolidated Income Statement.
Financial Statements
140 Spirax-Sarco Engineering plc Annual Report 2018
1 Accounting policies continuedOther financial liabilitiesOther financial liabilities, including borrowings, are initially measured at fair value, net of transaction costs. Other financial liabilities are subsequently measured at amortised cost using the effective interest method, with interest expense recognised on an effective yield basis. The effective interest method is a method of calculating the amortised cost of the financial liability and of allocating interest expense over the relevant period. The effective interest rate is the rate that exactly discounts estimated future cash payments through the expected life of the financial liability, or, where appropriate, a shorter period, to the net carrying amount on initial recognition.
Property, plant and equipmentItems of property, plant and equipment are stated at cost or deemed cost, less accumulated depreciation.
Certain items of property, plant and equipment that had been revalued to fair value prior to 1st January 2004, the date of transition to IFRS, are measured on the basis of deemed cost, being the revalued amount at the date of that revaluation.
Depreciation is charged to the Income Statement on a straight-line basis at rates which write down the value of assets to their residual values over their estimated useful lives. Land is not depreciated.
The principal rates are as follows:
Freehold buildings 1.5-3.3%Plant and machinery 10-12.5%Office furniture and fittings 10%Office equipment 12.5-33.3%Motor vehicles 20%Tooling and patterns 10%The depreciation rates are reassessed annually.
Business Combinations Acquisitions of subsidiaries and businesses are accounted for using the acquisition method of accounting. Identified assets acquired and liabilities assumed are measured at their respective acquisition date fair values. The excess of the fair value of the consideration given over the fair value of the identifiable net assets acquired is recorded as goodwill. Acquisition related costs are expensed as incurred. The operating results of the acquired business are reflected in the Group’s Consolidated Financial Statements after the date of acquisition.
Intangible assets(i) Goodwill Goodwill represents the difference between the cost of the
acquisition and the fair value of the net identifiable assets acquired. Goodwill is stated at cost less any accumulated impairment losses. Goodwill is allocated to cash-generating units and is not amortised but is tested annually for impairment (see Note 14 for more detail). In respect of acquisitions prior to 1st January 2004, goodwill is included on the basis of its deemed cost, which represents the amount recorded under previous UK Generally Accepted Accounting Practice (GAAP).
(ii) Research and development Expenditure on R&D is charged to the Income Statement in
the period in which it is incurred except that development expenditure is capitalised where the development costs relate to new or substantially improved products that are subsequently to be released for sale and will generate future economic benefits. The expenditure capitalised includes staff costs and related expenses. Capitalised development expenditure is stated at cost less accumulated amortisation (see below) and any impairment losses.
(iii) Other intangible assets Intangible assets other than goodwill that are acquired by the
Group are stated at cost less accumulated amortisation (see below) and any impairment losses. Annual impairment tests are performed on acquired intangible assets by comparing the carrying value with the recoverable amount, being the higher of the fair value less cost to sell and value in use, discounted at an appropriate discount rate, of future cash flows in respect of intangible assets for the relevant cash generating unit. More detail is given in Note 14.
(iv) Amortisation Amortisation is charged to the Income Statement on a
straight-line basis over the estimated useful lives of intangible assets, other than goodwill, from the date they are available for use. Goodwill is tested for impairment annually. The principal amortisation rates are as follows:
Capitalised development costs 20%ERP systems and software 12-20%Brand names and trademarks 5-33%Manufacturing designs and core technology 6-50%Non-compete undertakings 20-50%Customer relationships 6-33%
InventoriesInventories are measured at the lower of cost and net realisable value. The cost of inventories includes expenditure incurred in acquiring the inventories, production or conversion costs and other costs in bringing them to their existing location and condition. In the case of manufactured inventories and work in progress, cost includes an appropriate share of production overheads based on normal operating capacity. Cost also includes transfers from equity of any gain or loss on qualifying cash flow hedges of foreign currency purchases of inventories.
Cash and cash equivalentsCash and cash equivalents comprise cash balances and call deposits with an original maturity usually of three months or less. Bank overdrafts that are repayable on demand and form an integral part of the Group’s cash management are included as a component of cash and cash equivalents for the purpose of the Statement of Cash Flows.
Going concernThe statement on the going concern assumption is included within the Governance Report on page 122.
Notes to the Consolidated Financial Statements continued
Spirax-Sarco Engineering plc Annual Report 2018
141
Fin
anci
al S
tate
men
ts
1 Accounting policies continuedAlternative performance measuresThe Group reports under International Financial Reporting Standards (IFRS) and also uses alternative performance measures where the Board believe that they help to effectively monitor the performance of the Group, users of the Financial Statements might find them informative and an aid to comparison with our peers. Certain alternative performance measures also form a meaningful element of Executive Directors’ annual bonuses. A definition of the alternative performance measures included in the Annual Report and a reconciliation to the closest IFRS equivalent are disclosed in Note 2.
Employee benefits(i) Defined contribution plans Obligations for contributions to defined contribution pension
plans are recognised as an expense in the Income Statement as incurred.
(ii) Defined benefit plans The costs of providing pensions under defined benefit
schemes are calculated in accordance with the advice of qualified actuaries and spread over the period during which benefit is expected to be derived from the employees’ services. The Group’s net obligation or surplus in respect of defined benefit pensions is calculated separately for each plan by estimating the amount of future benefit that employees have earned in return for their service in the current and prior periods. Past service costs are recognised straight away.
That benefit is discounted at rates reflecting the yields on AA credit rated corporate bonds that have maturity dates approximating the terms of the Group’s obligations to determine its present value. Pension scheme assets are measured at fair value at the Statement of Financial Position date. Actuarial gains and losses, differences between the expected and actual returns, and the effect of changes in actuarial assumptions are recognised in the Statement of Comprehensive Income in the year they arise. Any scheme surplus (to the extent it is considered recoverable under the provisions of IFRIC 14) or deficit is recognised in full in the Statement of Financial Position.
The cost of other post-employment liabilities are calculated in a similar way to defined benefit pension schemes and spread over the period which benefit is expected to be derived from the employees’ services, in accordance with the advice of qualified actuaries.
(iii) Employee share plans Incentives in the form of shares are provided to employees
under share option and share award schemes. The fair value of these options and awards at their date of grant is charged to the Income Statement over the relevant vesting periods with a corresponding increase in equity. The value of the charge is adjusted to reflect expected and actual levels of options and share awards vesting.
(iv) Long-term share incentive plans The fair value of awards is measured at the date of grant
and the cost spread over the vesting period. The amount recognised as an expense is not adjusted to reflect market based performance conditions, but is adjusted for non-market based performance conditions.
RevenueRevenue recognised from the 1st January 2018 is recognised under IFRS 15 (Revenue from Contracts with Customers). Revenue is recognised when control of the goods or services transfers to the customer.
The Group applies the following five step framework when recognising revenue.
Step 1: Identify the contracts with customers
Step 2: Identify the performance obligations in the contract
Step 3: Determine the transaction price
Step 4: Allocate the transaction price to the performance obligations in the contract
Step 5: Recognise revenue when (or as) the entity satisfies a performance obligation.
The criteria the Group uses to identify the performance obligations within a contract are:
• the customer must be able to benefit from the goods or services either on its own or in combination with other resources available to the customer; and
• the entity’s promise to transfer the good or service to the customer is separable from other promises in the contract.
The transaction price is the value that the Group expects to be entitled to from the customer and includes discounts, rebates, credits, price concessions, incentives, performance bonuses, penalties and liquidated damages, but is not reduced for bad debts. It is net of any Value Added Tax (VAT) and other sales-related taxes. Variable consideration that is dependent on certain events is included in the transaction price when it is “highly probable” that the variable consideration will occur.
Revenue is recognised over time as the product is being manufactured or a service being provided if any of the following criteria are met:
1) The Group is creating a bespoke item which doesn’t have an alternative use to the Group (i.e. we would incur a significant loss to re-work and/or sell to another customer) and the entity has a right to payment for work completed to date including a reasonable profit.
2) The customer controls the asset that is being created or enhanced during the manufacturing process i.e. the customer has the right to significantly modify and dictate how the product is built during construction.
3) Services provided where the customer simultaneously receives and consumes the benefits provided by the Group’s performance as the Group performs.
Financial Statements
142 Spirax-Sarco Engineering plc Annual Report 2018
1 Accounting policies continuedJudgement is made when determining if a product is bespoke and the value of revenue to recognise over time as products are being manufactured. However due to the low value of orders for bespoke items in progress at the 31st December 2018 where we have a right to payment of costs plus a reasonable profit this is not considered a significant judgement.
The value of revenue to be recognised over time for goods being manufactured is calculated using a cost based input approach. This is considered a faithful depiction of the transfer of the goods as the costs incurred, total costs expected to be incurred and order value are known.
The value of revenue to be recognised over time for services being provided is calculated based on the value to the customer transferred to date as a proportion of the total value of the service being provided.
If the criteria to recognise revenue over time is not met then revenue is recognised at a point in time when the customer obtains control of the asset and the performance obligation is satisfied. The customer obtains control of the asset when the customer can direct the use of the asset and obtain the benefits from the asset.
Factors the Group considers when determining the point in time when control of the asset has passed to the customer and revenue recognised include:
1. The Group has a right to payment;
2. Legal title is transferred to the customer;
3. Physical possession of the asset has been transferred to the customer;
4. The customer has the significant risks and rewards of ownership; and
5. The customer has accepted the asset.
Control normally passes and revenue recognised when the goods are either despatched or delivered to the customer (in accordance with the terms and conditions of the sale) or the installation and testing is completed.
A large proportion of the Group’s revenue qualifies for recognition on despatch or delivery of the goods to the customer as this is when the performance obligation is satisfied. This is normally the trigger point for raising an invoice per the terms and conditions of the order. Therefore invoicing for a large proportion of the Group’s revenue occurs at the same time as when the performance obligation is satisfied. Contract assets at 31st December 2018 were £4.9m (0.4% of total revenue).
All revenue recognised by the Group is generated through contracts with customers.
When the unavoidable costs of fulfilling the contract exceed the revenue to be recognised the contract is loss making and the expected loss is recognised in the Consolidated Income Statement immediately.
Warranties that give assurance that a product meets agreed-upon specifications are accounted for as a cost provision and do not impact the timing and value of revenue. The Group does not have any material warranties that promises more than just providing assurance that a product meets agreed-upon specifications.
Costs of obtaining a contract, that are only incurred because the contract was obtained, are capitalised and expensed at a later date. At 31st December 2018 no costs of obtaining a contract were capitalised. All other assets recognised to fulfil a contract are within the scope of other accounting standards and policies.
Leases(i) Operating leases Payments made under operating leases are charged to the
Income Statement on a straight-line basis over the term of the lease.
(ii) Finance leases Leases where the Group assumes substantially all of the risks
and rewards of ownership are classified as finance leases as if the asset had been purchased outright. Assets acquired under finance leases are recognised as assets of the Group and the capital and interest elements of the leasing commitments are shown as obligations in creditors. Depreciation is charged on a consistent basis with similar owned assets or over the lease term if shorter. The interest element of the lease payment is charged to the Income Statement on a basis which produces a consistent rate of charge over the period of the liability.
TaxationThe tax charge comprises current and deferred tax. Income tax expense is recognised in the Income Statement unless it relates to items recognised directly in equity or in other comprehensive income, when it is also recognised in equity or other comprehensive income respectively. Current tax is the expected tax payable on the profit for the year and any adjustments in respect of previous years using tax rates enacted or substantively enacted at the reporting date. Tax positions are reviewed to assess whether a provision should be made on prevailing circumstances. Tax provisions are included within Current taxation payable. Deferred tax is provided on temporary differences arising between the tax base of assets and liabilities, and their carrying amounts in the Financial Statements. Deferred tax assets are recognised to the extent that it is probable that future taxable profits will be available against which the asset can be utilised. Deferred tax is provided using rates of tax that have been enacted or substantively enacted at the date of the Statement of Financial Position or the date that the temporary differences are expected to reverse. Deferred tax assets are reviewed at each reporting date and are reduced to the extent that it is no longer probable that the related tax benefit will be realised.
Share capital and repurchased sharesWhen share capital recognised as equity is repurchased, the amount of the consideration paid, including directly attributable costs, is recognised as a deduction from equity. Repurchased shares are classified as treasury shares or placed in an Employee Benefit Trust and are presented as a deduction from total equity.
Share-based benefits granted to subsidiary employeesThe Company grants share-based benefits over its own Ordinary shares directly to employees of subsidiary companies. These employees provide services to the subsidiary companies. The cost of these shares is not recharged and therefore the fair value of the share options granted is recognised as a capital contribution to the subsidiary companies. This is accounted for as an increase in investments with a corresponding increase in a non-distributable component of equity.
Notes to the Consolidated Financial Statements continued
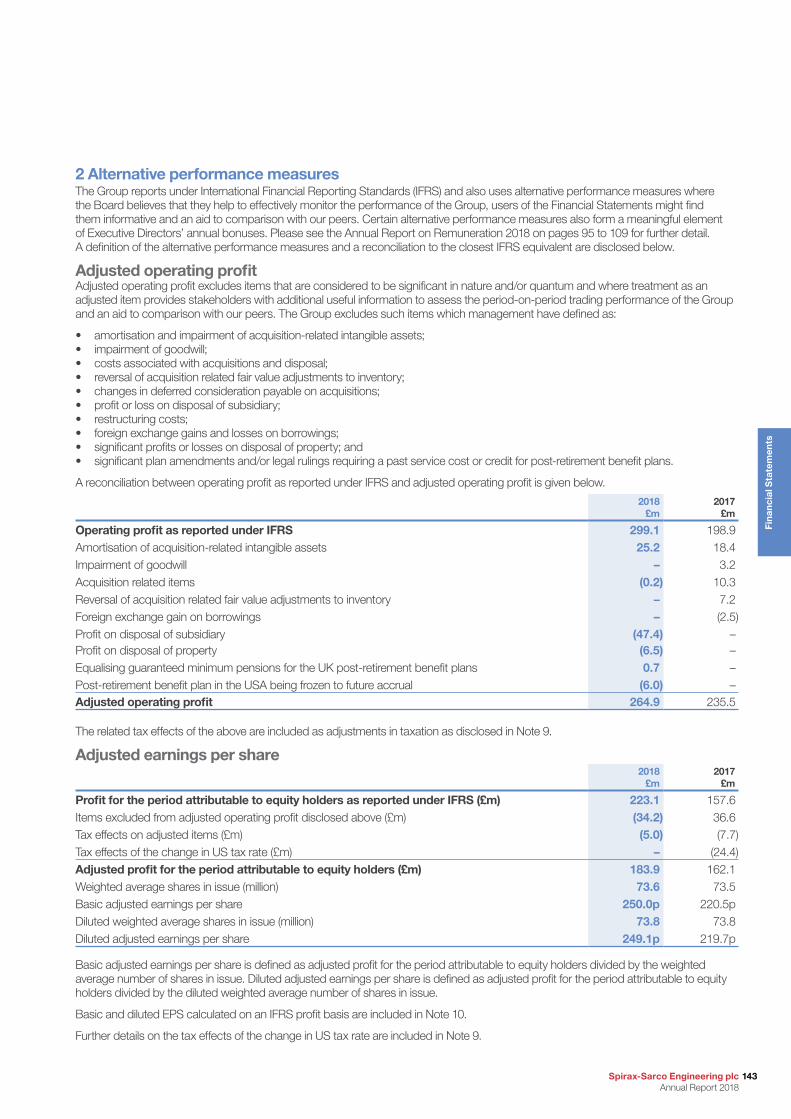
Spirax-Sarco Engineering plc Annual Report 2018
143
Fin
anci
al S
tate
men
ts
2 Alternative performance measuresThe Group reports under International Financial Reporting Standards (IFRS) and also uses alternative performance measures where the Board believes that they help to effectively monitor the performance of the Group, users of the Financial Statements might find them informative and an aid to comparison with our peers. Certain alternative performance measures also form a meaningful element of Executive Directors’ annual bonuses. Please see the Annual Report on Remuneration 2018 on pages 95 to 109 for further detail. A definition of the alternative performance measures and a reconciliation to the closest IFRS equivalent are disclosed below.
Adjusted operating profit Adjusted operating profit excludes items that are considered to be significant in nature and/or quantum and where treatment as an adjusted item provides stakeholders with additional useful information to assess the period-on-period trading performance of the Group and an aid to comparison with our peers. The Group excludes such items which management have defined as:
• amortisation and impairment of acquisition-related intangible assets; • impairment of goodwill; • costs associated with acquisitions and disposal; • reversal of acquisition related fair value adjustments to inventory; • changes in deferred consideration payable on acquisitions; • profit or loss on disposal of subsidiary; • restructuring costs; • foreign exchange gains and losses on borrowings; • significant profits or losses on disposal of property; and • significant plan amendments and/or legal rulings requiring a past service cost or credit for post-retirement benefit plans.
A reconciliation between operating profit as reported under IFRS and adjusted operating profit is given below.
2018£m
2017£m
Operating profit as reported under IFRS 299.1 198.9Amortisation of acquisition-related intangible assets 25.2 18.4Impairment of goodwill – 3.2Acquisition related items (0.2) 10.3Reversal of acquisition related fair value adjustments to inventory – 7.2Foreign exchange gain on borrowings – (2.5)Profit on disposal of subsidiary (47.4) –Profit on disposal of property (6.5) –Equalising guaranteed minimum pensions for the UK post-retirement benefit plans 0.7 –Post-retirement benefit plan in the USA being frozen to future accrual (6.0) –Adjusted operating profit 264.9 235.5
The related tax effects of the above are included as adjustments in taxation as disclosed in Note 9.
Adjusted earnings per share2018
£m2017
£m
Profit for the period attributable to equity holders as reported under IFRS (£m) 223.1 157.6Items excluded from adjusted operating profit disclosed above (£m) (34.2) 36.6Tax effects on adjusted items (£m) (5.0) (7.7)Tax effects of the change in US tax rate (£m) – (24.4)Adjusted profit for the period attributable to equity holders (£m) 183.9 162.1Weighted average shares in issue (million) 73.6 73.5Basic adjusted earnings per share 250.0p 220.5pDiluted weighted average shares in issue (million) 73.8 73.8Diluted adjusted earnings per share 249.1p 219.7p
Basic adjusted earnings per share is defined as adjusted profit for the period attributable to equity holders divided by the weighted average number of shares in issue. Diluted adjusted earnings per share is defined as adjusted profit for the period attributable to equity holders divided by the diluted weighted average number of shares in issue.
Basic and diluted EPS calculated on an IFRS profit basis are included in Note 10.
Further details on the tax effects of the change in US tax rate are included in Note 9.
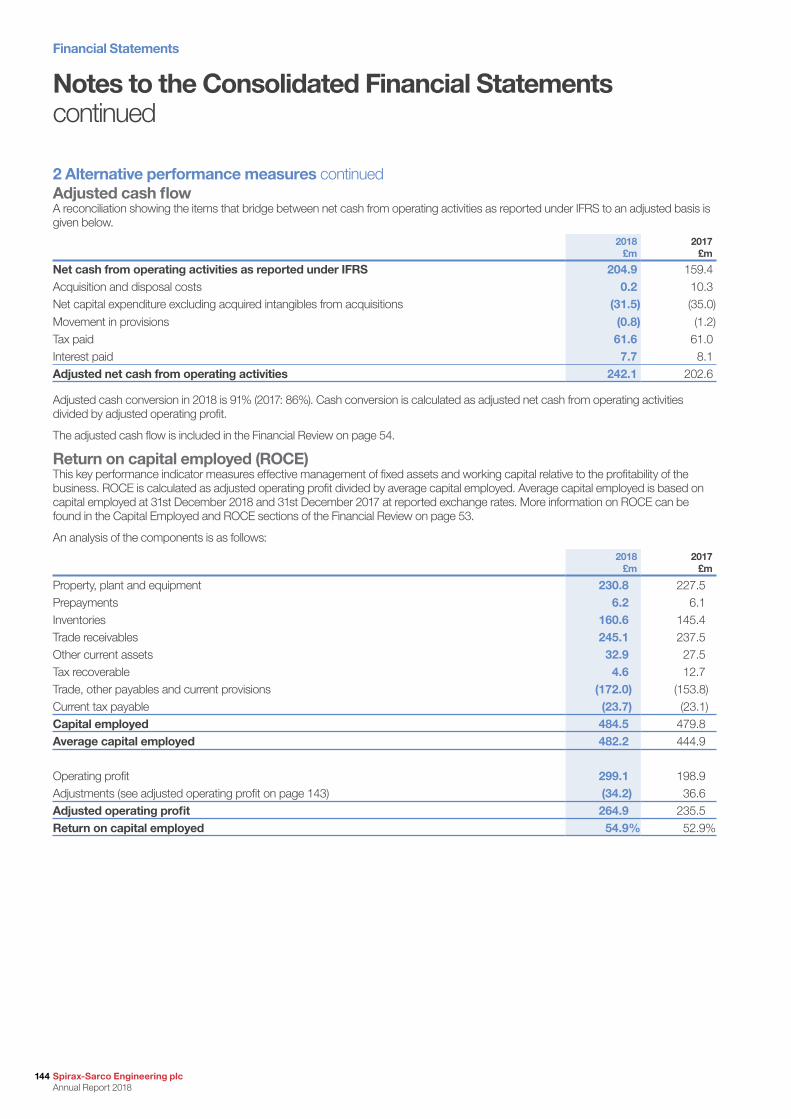
Financial Statements
144 Spirax-Sarco Engineering plc Annual Report 2018
Notes to the Consolidated Financial Statements continued
2 Alternative performance measures continuedAdjusted cash flowA reconciliation showing the items that bridge between net cash from operating activities as reported under IFRS to an adjusted basis is given below.
2018£m
2017£m
Net cash from operating activities as reported under IFRS 204.9 159.4Acquisition and disposal costs 0.2 10.3Net capital expenditure excluding acquired intangibles from acquisitions (31.5) (35.0)
Movement in provisions (0.8) (1.2)Tax paid 61.6 61.0Interest paid 7.7 8.1Adjusted net cash from operating activities 242.1 202.6
Adjusted cash conversion in 2018 is 91% (2017: 86%). Cash conversion is calculated as adjusted net cash from operating activities divided by adjusted operating profit.
The adjusted cash flow is included in the Financial Review on page 54.
Return on capital employed (ROCE)This key performance indicator measures effective management of fixed assets and working capital relative to the profitability of the business. ROCE is calculated as adjusted operating profit divided by average capital employed. Average capital employed is based on capital employed at 31st December 2018 and 31st December 2017 at reported exchange rates. More information on ROCE can be found in the Capital Employed and ROCE sections of the Financial Review on page 53.
An analysis of the components is as follows:
2018£m
2017£m
Property, plant and equipment 230.8 227.5Prepayments 6.2 6.1Inventories 160.6 145.4Trade receivables 245.1 237.5Other current assets 32.9 27.5Tax recoverable 4.6 12.7Trade, other payables and current provisions (172.0) (153.8)Current tax payable (23.7) (23.1)Capital employed 484.5 479.8Average capital employed 482.2 444.9
Operating profit 299.1 198.9Adjustments (see adjusted operating profit on page 143) (34.2) 36.6Adjusted operating profit 264.9 235.5Return on capital employed 54.9% 52.9%
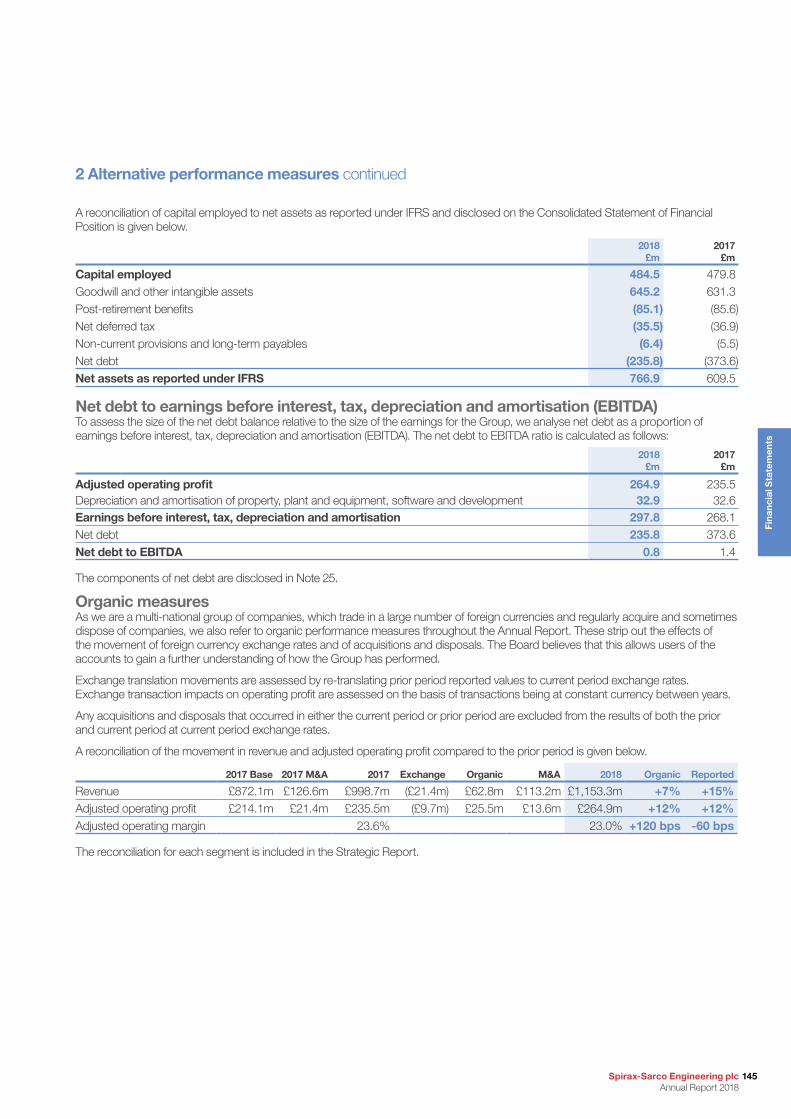
Spirax-Sarco Engineering plc Annual Report 2018
145
Fin
anci
al S
tate
men
ts
2 Alternative performance measures continued
A reconciliation of capital employed to net assets as reported under IFRS and disclosed on the Consolidated Statement of Financial Position is given below.
2018£m
2017£m
Capital employed 484.5 479.8Goodwill and other intangible assets 645.2 631.3Post-retirement benefits (85.1) (85.6)Net deferred tax (35.5) (36.9)Non-current provisions and long-term payables (6.4) (5.5)Net debt (235.8) (373.6)Net assets as reported under IFRS 766.9 609.5
Net debt to earnings before interest, tax, depreciation and amortisation (EBITDA)To assess the size of the net debt balance relative to the size of the earnings for the Group, we analyse net debt as a proportion of earnings before interest, tax, depreciation and amortisation (EBITDA). The net debt to EBITDA ratio is calculated as follows:
2018£m
2017£m
Adjusted operating profit 264.9 235.5Depreciation and amortisation of property, plant and equipment, software and development 32.9 32.6Earnings before interest, tax, depreciation and amortisation 297.8 268.1Net debt 235.8 373.6Net debt to EBITDA 0.8 1.4
The components of net debt are disclosed in Note 25.
Organic measuresAs we are a multi-national group of companies, which trade in a large number of foreign currencies and regularly acquire and sometimes dispose of companies, we also refer to organic performance measures throughout the Annual Report. These strip out the effects of the movement of foreign currency exchange rates and of acquisitions and disposals. The Board believes that this allows users of the accounts to gain a further understanding of how the Group has performed.
Exchange translation movements are assessed by re-translating prior period reported values to current period exchange rates. Exchange transaction impacts on operating profit are assessed on the basis of transactions being at constant currency between years.
Any acquisitions and disposals that occurred in either the current period or prior period are excluded from the results of both the prior and current period at current period exchange rates.
A reconciliation of the movement in revenue and adjusted operating profit compared to the prior period is given below.
2017 Base 2017 M&A 2017 Exchange Organic M&A 2018 Organic Reported
Revenue £872.1m £126.6m £998.7m (£21.4m) £62.8m £113.2m £1,153.3m +7% +15%Adjusted operating profit £214.1m £21.4m £235.5m (£9.7m) £25.5m £13.6m £264.9m +12% +12%Adjusted operating margin 23.6% 23.0% +120 bps -60 bps
The reconciliation for each segment is included in the Strategic Report.
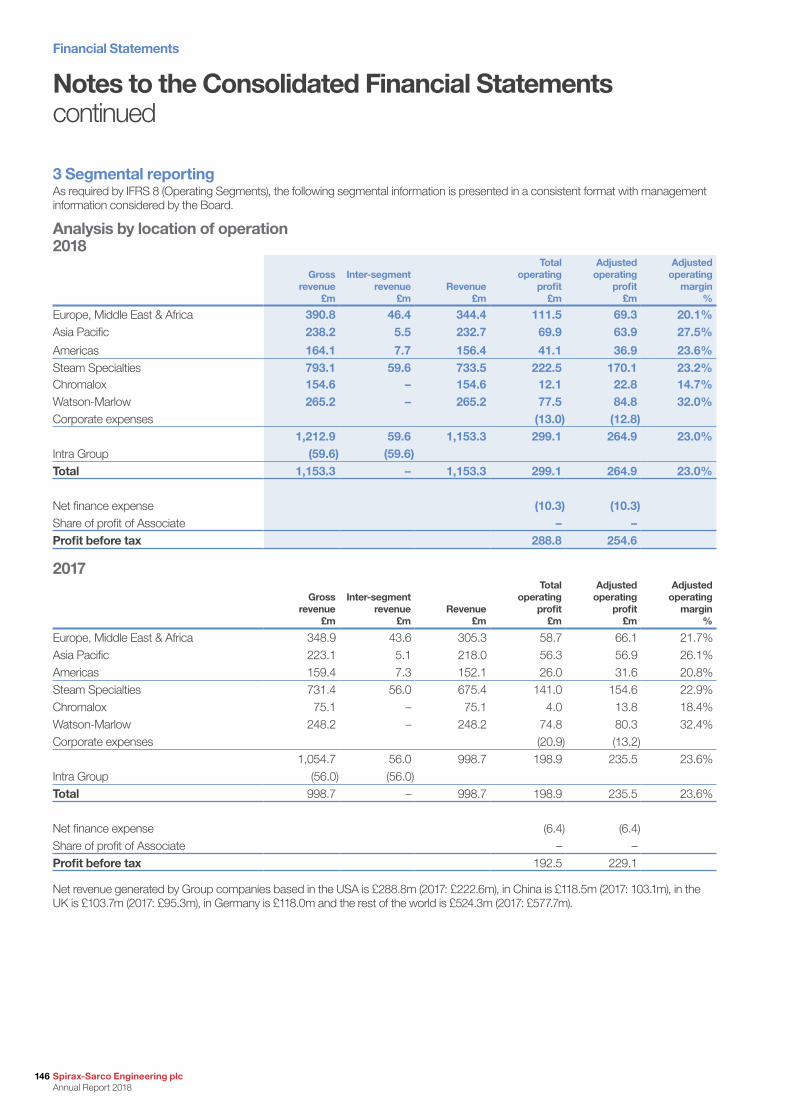
Financial Statements
146 Spirax-Sarco Engineering plc Annual Report 2018
Notes to the Consolidated Financial Statements continued
3 Segmental reportingAs required by IFRS 8 (Operating Segments), the following segmental information is presented in a consistent format with management information considered by the Board.
Analysis by location of operation 2018
Gross revenue
£m
Inter-segment revenue
£mRevenue
£m
Total operating
profit £m
Adjusted operating
profit £m
Adjusted operating
margin %
Europe, Middle East & Africa 390.8 46.4 344.4 111.5 69.3 20.1%Asia Pacific 238.2 5.5 232.7 69.9 63.9 27.5%
Americas 164.1 7.7 156.4 41.1 36.9 23.6%Steam Specialties 793.1 59.6 733.5 222.5 170.1 23.2%Chromalox 154.6 – 154.6 12.1 22.8 14.7%Watson-Marlow 265.2 – 265.2 77.5 84.8 32.0%Corporate expenses (13.0) (12.8)
1,212.9 59.6 1,153.3 299.1 264.9 23.0%Intra Group (59.6) (59.6)Total 1,153.3 – 1,153.3 299.1 264.9 23.0%
Net finance expense (10.3) (10.3)Share of profit of Associate – –Profit before tax 288.8 254.6
2017
Gross revenue
£m
Inter-segment revenue
£mRevenue
£m
Total operating
profit £m
Adjusted operating
profit £m
Adjusted operating
margin %
Europe, Middle East & Africa 348.9 43.6 305.3 58.7 66.1 21.7%Asia Pacific 223.1 5.1 218.0 56.3 56.9 26.1%Americas 159.4 7.3 152.1 26.0 31.6 20.8%Steam Specialties 731.4 56.0 675.4 141.0 154.6 22.9%Chromalox 75.1 – 75.1 4.0 13.8 18.4%Watson-Marlow 248.2 – 248.2 74.8 80.3 32.4%Corporate expenses (20.9) (13.2)
1,054.7 56.0 998.7 198.9 235.5 23.6%Intra Group (56.0) (56.0)Total 998.7 – 998.7 198.9 235.5 23.6%
Net finance expense (6.4) (6.4)Share of profit of Associate – –Profit before tax 192.5 229.1
Net revenue generated by Group companies based in the USA is £288.8m (2017: £222.6m), in China is £118.5m (2017: 103.1m), in the UK is £103.7m (2017: £95.3m), in Germany is £118.0m and the rest of the world is £524.3m (2017: £577.7m).
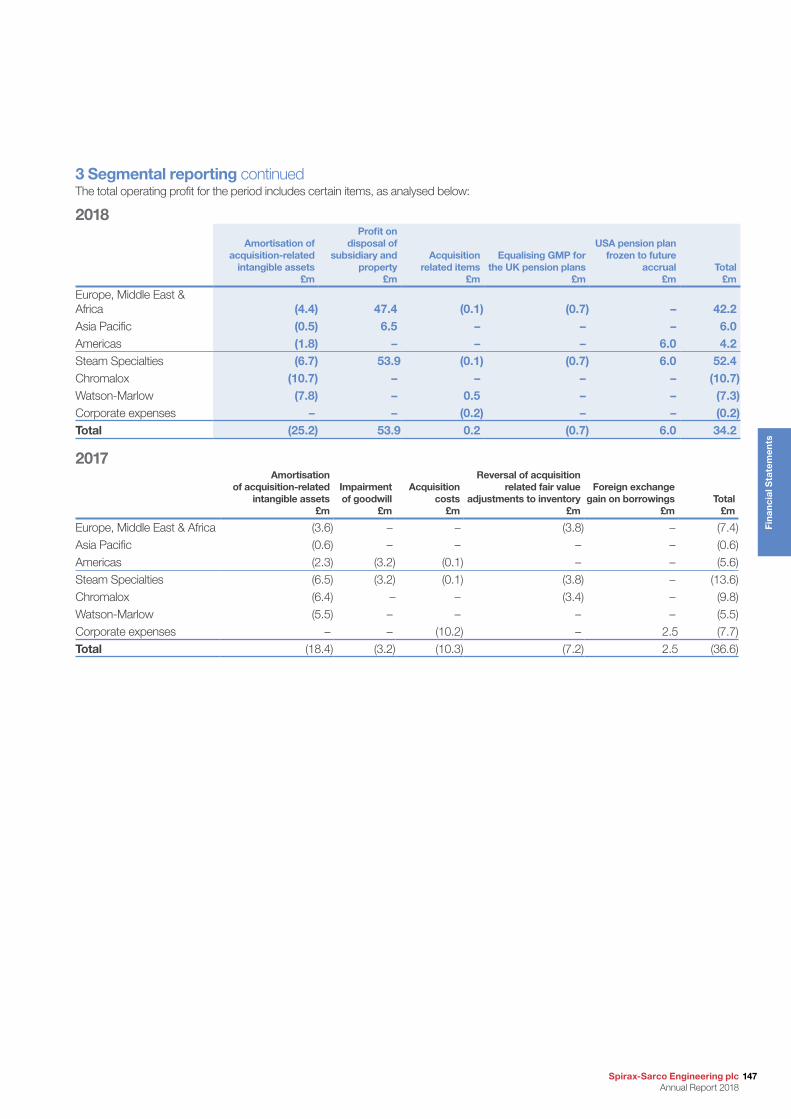
Spirax-Sarco Engineering plc Annual Report 2018
147
Fin
anci
al S
tate
men
ts
3 Segmental reporting continuedThe total operating profit for the period includes certain items, as analysed below:
2018
Amortisation of acquisition-related
intangible assets £m
Profit on disposal of
subsidiary and property
£m
Acquisition related items
£m
Equalising GMP for the UK pension plans
£m
USA pension plan frozen to future
accrual £m
Total £m
Europe, Middle East & Africa (4.4) 47.4 (0.1) (0.7) – 42.2Asia Pacific (0.5) 6.5 – – – 6.0Americas (1.8) – – – 6.0 4.2Steam Specialties (6.7) 53.9 (0.1) (0.7) 6.0 52.4Chromalox (10.7) – – – – (10.7)Watson-Marlow (7.8) – 0.5 – – (7.3)Corporate expenses – – (0.2) – – (0.2)Total (25.2) 53.9 0.2 (0.7) 6.0 34.2
2017Amortisation
of acquisition-related intangible assets
£m
Impairment of goodwill
£m
Acquisition costs
£m
Reversal of acquisition related fair value
adjustments to inventory £m
Foreign exchange gain on borrowings
£mTotal
£m
Europe, Middle East & Africa (3.6) – – (3.8) – (7.4)Asia Pacific (0.6) – – – – (0.6)Americas (2.3) (3.2) (0.1) – – (5.6)Steam Specialties (6.5) (3.2) (0.1) (3.8) – (13.6)Chromalox (6.4) – – (3.4) – (9.8)Watson-Marlow (5.5) – – – – (5.5)Corporate expenses – – (10.2) – 2.5 (7.7)Total (18.4) (3.2) (10.3) (7.2) 2.5 (36.6)
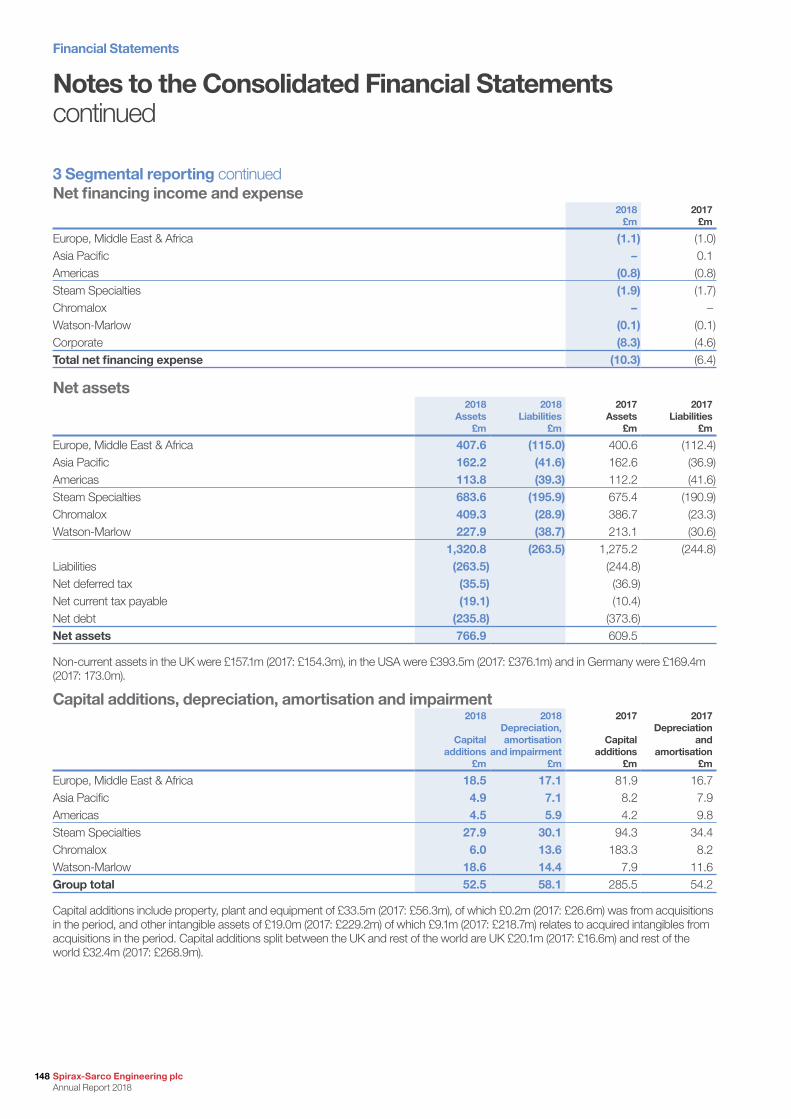
Financial Statements
148 Spirax-Sarco Engineering plc Annual Report 2018
Notes to the Consolidated Financial Statements continued
3 Segmental reporting continuedNet financing income and expense
2018 £m
2017 £m
Europe, Middle East & Africa (1.1) (1.0)Asia Pacific – 0.1Americas (0.8) (0.8)Steam Specialties (1.9) (1.7)Chromalox – –Watson-Marlow (0.1) (0.1)Corporate (8.3) (4.6)Total net financing expense (10.3) (6.4)
Net assets2018
Assets £m
2018 Liabilities
£m
2017 Assets
£m
2017 Liabilities
£m
Europe, Middle East & Africa 407.6 (115.0) 400.6 (112.4)Asia Pacific 162.2 (41.6) 162.6 (36.9)Americas 113.8 (39.3) 112.2 (41.6)Steam Specialties 683.6 (195.9) 675.4 (190.9)Chromalox 409.3 (28.9) 386.7 (23.3)Watson-Marlow 227.9 (38.7) 213.1 (30.6)
1,320.8 (263.5) 1,275.2 (244.8)Liabilities (263.5) (244.8)Net deferred tax (35.5) (36.9)Net current tax payable (19.1) (10.4)Net debt (235.8) (373.6)Net assets 766.9 609.5
Non-current assets in the UK were £157.1m (2017: £154.3m), in the USA were £393.5m (2017: £376.1m) and in Germany were £169.4m (2017: 173.0m).
Capital additions, depreciation, amortisation and impairment2018
Capital
additions £m
2018 Depreciation, amortisation
and impairment £m
2017
Capital additions
£m
2017 Depreciation
and amortisation
£m
Europe, Middle East & Africa 18.5 17.1 81.9 16.7Asia Pacific 4.9 7.1 8.2 7.9Americas 4.5 5.9 4.2 9.8Steam Specialties 27.9 30.1 94.3 34.4Chromalox 6.0 13.6 183.3 8.2Watson-Marlow 18.6 14.4 7.9 11.6Group total 52.5 58.1 285.5 54.2
Capital additions include property, plant and equipment of £33.5m (2017: £56.3m), of which £0.2m (2017: £26.6m) was from acquisitions in the period, and other intangible assets of £19.0m (2017: £229.2m) of which £9.1m (2017: £218.7m) relates to acquired intangibles from acquisitions in the period. Capital additions split between the UK and rest of the world are UK £20.1m (2017: £16.6m) and rest of the world £32.4m (2017: £268.9m).
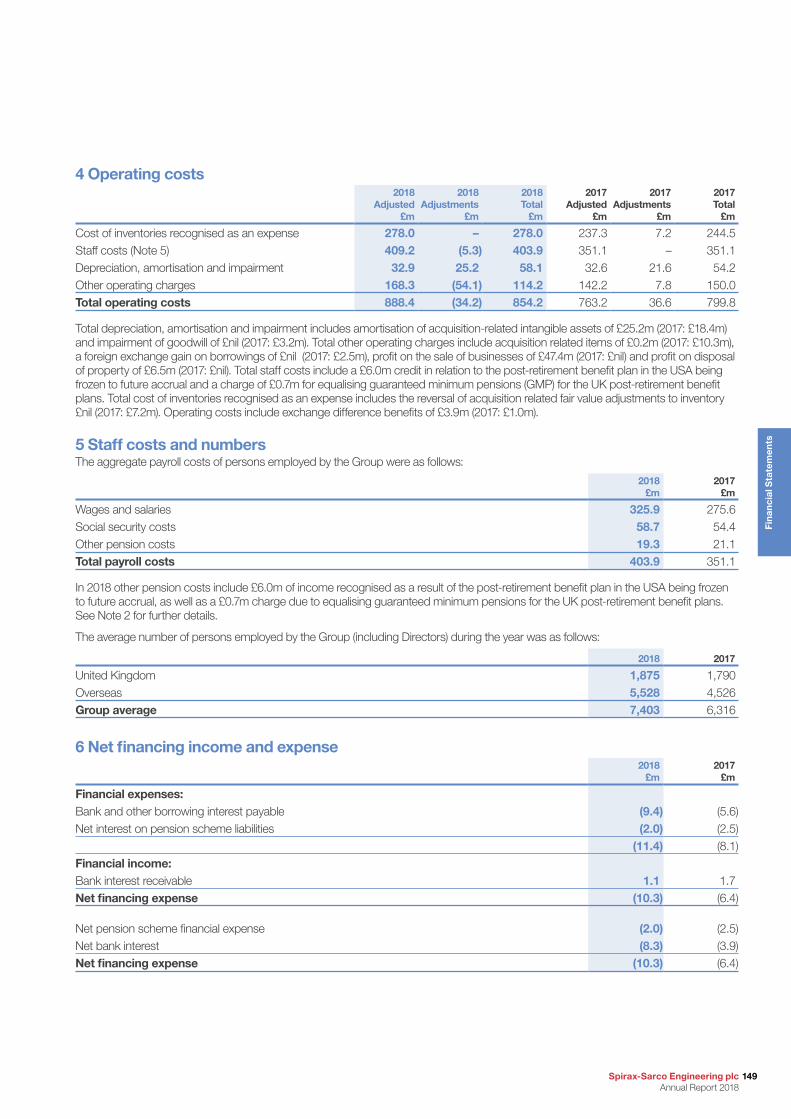
Spirax-Sarco Engineering plc Annual Report 2018
149
Fin
anci
al S
tate
men
ts
4 Operating costs2018
Adjusted £m
2018 Adjustments
£m
2018 Total
£m
2017 Adjusted
£m
2017 Adjustments
£m
2017 Total
£m
Cost of inventories recognised as an expense 278.0 – 278.0 237.3 7.2 244.5Staff costs (Note 5) 409.2 (5.3) 403.9 351.1 – 351.1Depreciation, amortisation and impairment 32.9 25.2 58.1 32.6 21.6 54.2Other operating charges 168.3 (54.1) 114.2 142.2 7.8 150.0Total operating costs 888.4 (34.2) 854.2 763.2 36.6 799.8
Total depreciation, amortisation and impairment includes amortisation of acquisition-related intangible assets of £25.2m (2017: £18.4m) and impairment of goodwill of £nil (2017: £3.2m). Total other operating charges include acquisition related items of £0.2m (2017: £10.3m), a foreign exchange gain on borrowings of £nil (2017: £2.5m), profit on the sale of businesses of £47.4m (2017: £nil) and profit on disposal of property of £6.5m (2017: £nil). Total staff costs include a £6.0m credit in relation to the post-retirement benefit plan in the USA being frozen to future accrual and a charge of £0.7m for equalising guaranteed minimum pensions (GMP) for the UK post-retirement benefit plans. Total cost of inventories recognised as an expense includes the reversal of acquisition related fair value adjustments to inventory £nil (2017: £7.2m). Operating costs include exchange difference benefits of £3.9m (2017: £1.0m).
5 Staff costs and numbersThe aggregate payroll costs of persons employed by the Group were as follows:
2018 £m
2017 £m
Wages and salaries 325.9 275.6Social security costs 58.7 54.4Other pension costs 19.3 21.1Total payroll costs 403.9 351.1
In 2018 other pension costs include £6.0m of income recognised as a result of the post-retirement benefit plan in the USA being frozen to future accrual, as well as a £0.7m charge due to equalising guaranteed minimum pensions for the UK post-retirement benefit plans. See Note 2 for further details.
The average number of persons employed by the Group (including Directors) during the year was as follows:
2018 2017
United Kingdom 1,875 1,790Overseas 5,528 4,526Group average 7,403 6,316
6 Net financing income and expense2018
£m2017
£m
Financial expenses:Bank and other borrowing interest payable (9.4) (5.6)Net interest on pension scheme liabilities (2.0) (2.5)
(11.4) (8.1)Financial income:Bank interest receivable 1.1 1.7Net financing expense (10.3) (6.4) Net pension scheme financial expense (2.0) (2.5)Net bank interest (8.3) (3.9)Net financing expense (10.3) (6.4)
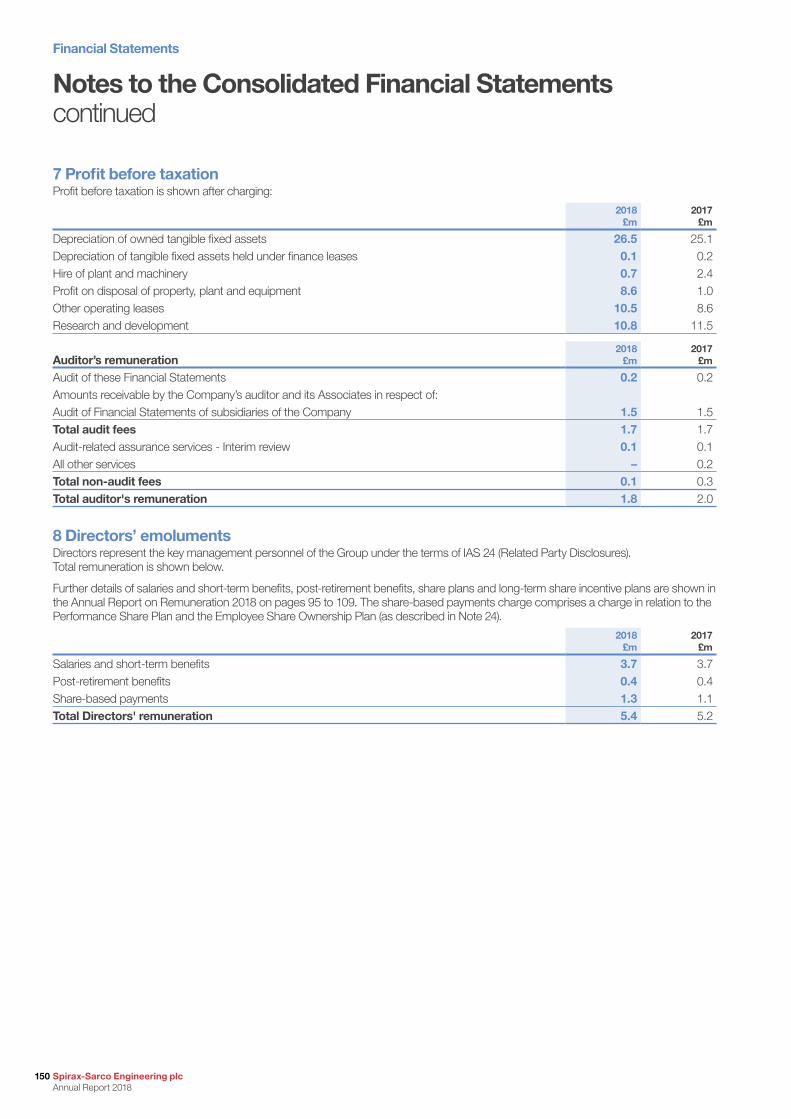
Financial Statements
150 Spirax-Sarco Engineering plc Annual Report 2018
Notes to the Consolidated Financial Statements continued
7 Profit before taxationProfit before taxation is shown after charging:
2018 £m
2017 £m
Depreciation of owned tangible fixed assets 26.5 25.1Depreciation of tangible fixed assets held under finance leases 0.1 0.2Hire of plant and machinery 0.7 2.4Profit on disposal of property, plant and equipment 8.6 1.0Other operating leases 10.5 8.6Research and development 10.8 11.5
Auditor’s remuneration2018
£m2017
£m
Audit of these Financial Statements 0.2 0.2Amounts receivable by the Company’s auditor and its Associates in respect of:Audit of Financial Statements of subsidiaries of the Company 1.5 1.5Total audit fees 1.7 1.7Audit-related assurance services - Interim review 0.1 0.1All other services – 0.2Total non-audit fees 0.1 0.3Total auditor's remuneration 1.8 2.0
8 Directors’ emolumentsDirectors represent the key management personnel of the Group under the terms of IAS 24 (Related Party Disclosures). Total remuneration is shown below.
Further details of salaries and short-term benefits, post-retirement benefits, share plans and long-term share incentive plans are shown in the Annual Report on Remuneration 2018 on pages 95 to 109. The share-based payments charge comprises a charge in relation to the Performance Share Plan and the Employee Share Ownership Plan (as described in Note 24).
2018 £m
2017 £m
Salaries and short-term benefits 3.7 3.7Post-retirement benefits 0.4 0.4Share-based payments 1.3 1.1Total Directors' remuneration 5.4 5.2
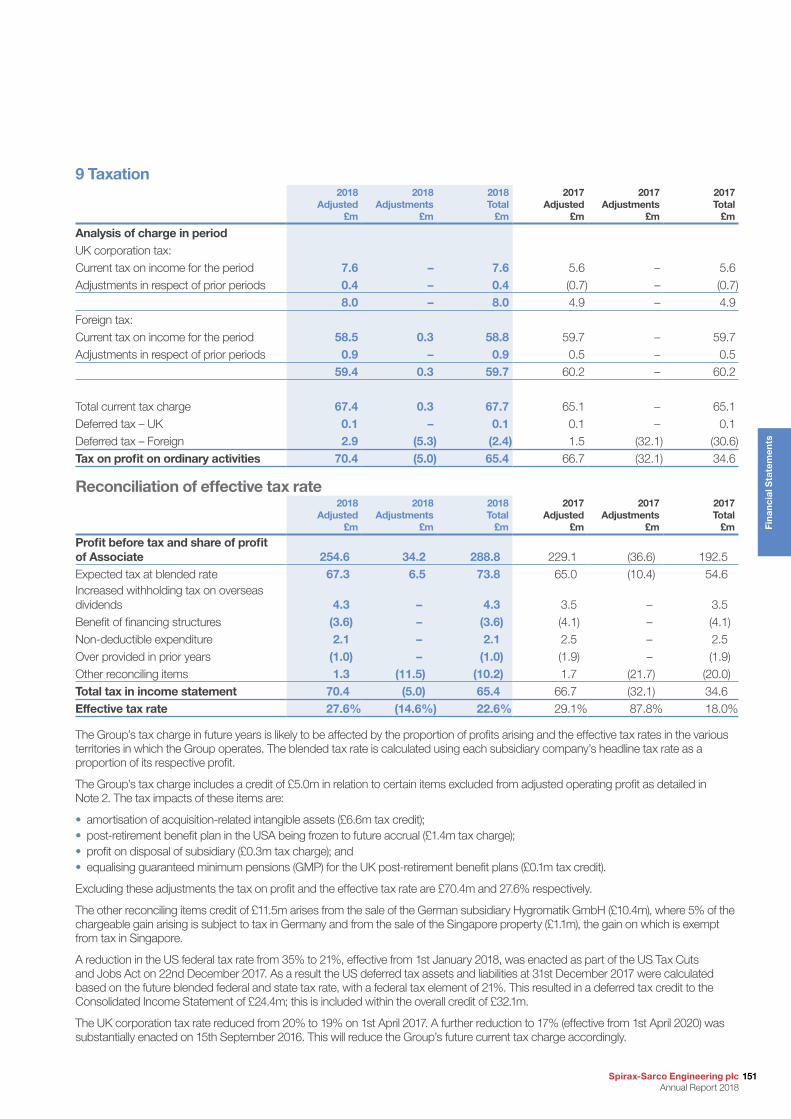
Spirax-Sarco Engineering plc Annual Report 2018
151
Fin
anci
al S
tate
men
ts
9 Taxation2018
Adjusted £m
2018Adjustments
£m
2018Total
£m
2017Adjusted
£m
2017Adjustments
£m
2017Total
£m
Analysis of charge in periodUK corporation tax:Current tax on income for the period 7.6 – 7.6 5.6 – 5.6Adjustments in respect of prior periods 0.4 – 0.4 (0.7) – (0.7)
8.0 – 8.0 4.9 – 4.9Foreign tax:Current tax on income for the period 58.5 0.3 58.8 59.7 – 59.7Adjustments in respect of prior periods 0.9 – 0.9 0.5 – 0.5
59.4 0.3 59.7 60.2 – 60.2
Total current tax charge 67.4 0.3 67.7 65.1 – 65.1Deferred tax – UK 0.1 – 0.1 0.1 – 0.1Deferred tax – Foreign 2.9 (5.3) (2.4) 1.5 (32.1) (30.6)Tax on profit on ordinary activities 70.4 (5.0) 65.4 66.7 (32.1) 34.6
Reconciliation of effective tax rate2018
Adjusted £m
2018Adjustments
£m
2018Total
£m
2017Adjusted
£m
2017Adjustments
£m
2017Total
£m
Profit before tax and share of profit of Associate 254.6 34.2 288.8 229.1 (36.6) 192.5Expected tax at blended rate 67.3 6.5 73.8 65.0 (10.4) 54.6Increased withholding tax on overseas dividends 4.3 – 4.3 3.5 – 3.5Benefit of financing structures (3.6) – (3.6) (4.1) – (4.1)Non-deductible expenditure 2.1 – 2.1 2.5 – 2.5Over provided in prior years (1.0) – (1.0) (1.9) – (1.9)Other reconciling items 1.3 (11.5) (10.2) 1.7 (21.7) (20.0)Total tax in income statement 70.4 (5.0) 65.4 66.7 (32.1) 34.6Effective tax rate 27.6% (14.6%) 22.6% 29.1% 87.8% 18.0%
The Group’s tax charge in future years is likely to be affected by the proportion of profits arising and the effective tax rates in the various territories in which the Group operates. The blended tax rate is calculated using each subsidiary company’s headline tax rate as a proportion of its respective profit.
The Group’s tax charge includes a credit of £5.0m in relation to certain items excluded from adjusted operating profit as detailed in Note 2. The tax impacts of these items are:
• amortisation of acquisition-related intangible assets (£6.6m tax credit);• post-retirement benefit plan in the USA being frozen to future accrual (£1.4m tax charge);• profit on disposal of subsidiary (£0.3m tax charge); and• equalising guaranteed minimum pensions (GMP) for the UK post-retirement benefit plans (£0.1m tax credit).
Excluding these adjustments the tax on profit and the effective tax rate are £70.4m and 27.6% respectively.
The other reconciling items credit of £11.5m arises from the sale of the German subsidiary Hygromatik GmbH (£10.4m), where 5% of the chargeable gain arising is subject to tax in Germany and from the sale of the Singapore property (£1.1m), the gain on which is exempt from tax in Singapore.
A reduction in the US federal tax rate from 35% to 21%, effective from 1st January 2018, was enacted as part of the US Tax Cuts and Jobs Act on 22nd December 2017. As a result the US deferred tax assets and liabilities at 31st December 2017 were calculated based on the future blended federal and state tax rate, with a federal tax element of 21%. This resulted in a deferred tax credit to the Consolidated Income Statement of £24.4m; this is included within the overall credit of £32.1m.
The UK corporation tax rate reduced from 20% to 19% on 1st April 2017. A further reduction to 17% (effective from 1st April 2020) was substantially enacted on 15th September 2016. This will reduce the Group’s future current tax charge accordingly.
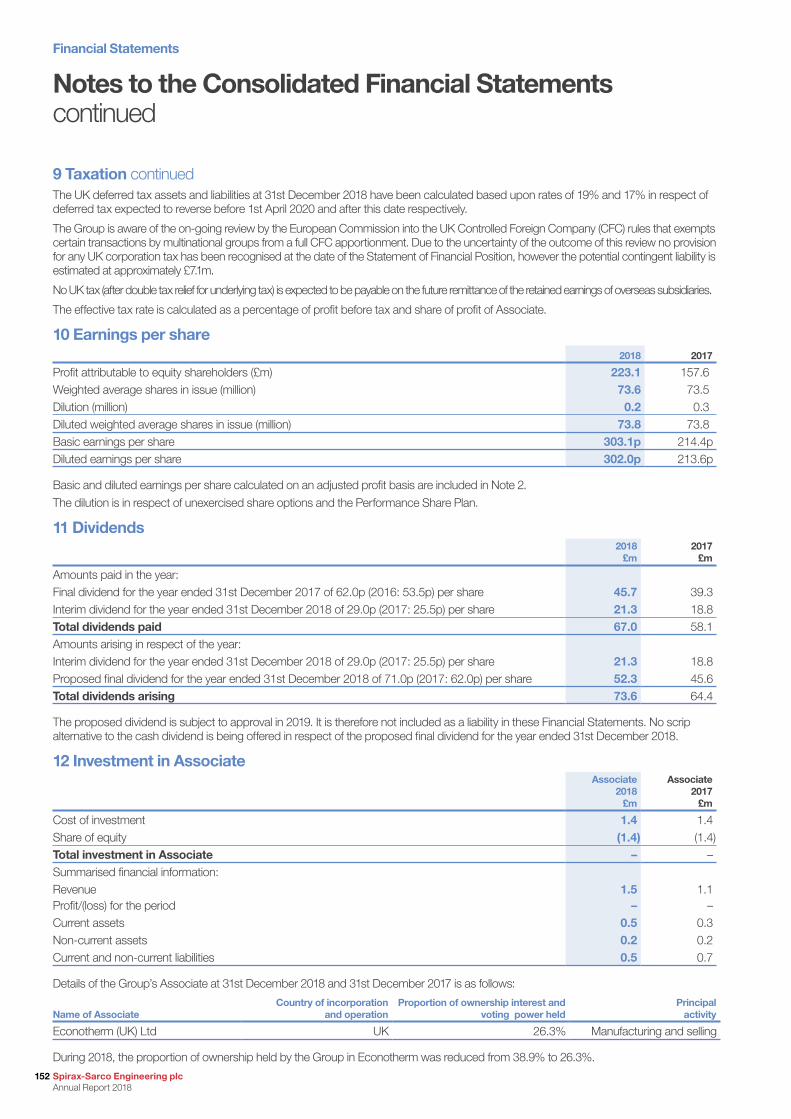
Financial Statements
152 Spirax-Sarco Engineering plc Annual Report 2018
Notes to the Consolidated Financial Statements continued
9 Taxation continuedThe UK deferred tax assets and liabilities at 31st December 2018 have been calculated based upon rates of 19% and 17% in respect of deferred tax expected to reverse before 1st April 2020 and after this date respectively.
The Group is aware of the on-going review by the European Commission into the UK Controlled Foreign Company (CFC) rules that exempts certain transactions by multinational groups from a full CFC apportionment. Due to the uncertainty of the outcome of this review no provision for any UK corporation tax has been recognised at the date of the Statement of Financial Position, however the potential contingent liability is estimated at approximately £7.1m.
No UK tax (after double tax relief for underlying tax) is expected to be payable on the future remittance of the retained earnings of overseas subsidiaries.
The effective tax rate is calculated as a percentage of profit before tax and share of profit of Associate.
10 Earnings per share2018 2017
Profit attributable to equity shareholders (£m) 223.1 157.6Weighted average shares in issue (million) 73.6 73.5Dilution (million) 0.2 0.3Diluted weighted average shares in issue (million) 73.8 73.8Basic earnings per share 303.1p 214.4pDiluted earnings per share 302.0p 213.6p
Basic and diluted earnings per share calculated on an adjusted profit basis are included in Note 2.
The dilution is in respect of unexercised share options and the Performance Share Plan.
11 Dividends2018
£m2017
£m
Amounts paid in the year:Final dividend for the year ended 31st December 2017 of 62.0p (2016: 53.5p) per share 45.7 39.3Interim dividend for the year ended 31st December 2018 of 29.0p (2017: 25.5p) per share 21.3 18.8Total dividends paid 67.0 58.1Amounts arising in respect of the year:Interim dividend for the year ended 31st December 2018 of 29.0p (2017: 25.5p) per share 21.3 18.8Proposed final dividend for the year ended 31st December 2018 of 71.0p (2017: 62.0p) per share 52.3 45.6Total dividends arising 73.6 64.4
The proposed dividend is subject to approval in 2019. It is therefore not included as a liability in these Financial Statements. No scrip alternative to the cash dividend is being offered in respect of the proposed final dividend for the year ended 31st December 2018.
12 Investment in AssociateAssociate
2018 £m
Associate2017
£m
Cost of investment 1.4 1.4Share of equity (1.4) (1.4)Total investment in Associate – –Summarised financial information:Revenue 1.5 1.1Profit/(loss) for the period – –Current assets 0.5 0.3Non-current assets 0.2 0.2Current and non-current liabilities 0.5 0.7
Details of the Group’s Associate at 31st December 2018 and 31st December 2017 is as follows:
Name of AssociateCountry of incorporation
and operationProportion of ownership interest and
voting power heldPrincipal
activity
Econotherm (UK) Ltd UK 26.3% Manufacturing and selling
During 2018, the proportion of ownership held by the Group in Econotherm was reduced from 38.9% to 26.3%.

Spirax-Sarco Engineering plc Annual Report 2018
153
Fin
anci
al S
tate
men
ts
13 Property, plant and equipment
2018
Freehold land and buildings
£m
Leasehold land and buildings
£m
Plant and machinery
£m
Fixtures, fittings,
tools and equipment
£mTotal
£m
Cost:At 1st January 2018 138.8 37.7 164.9 73.4 414.8Exchange adjustments 1.1 0.1 0.5 (0.3) 1.4
139.9 37.8 165.4 73.1 416.2
Additions 4.5 1.4 18.6 9.0 33.5Transfers (5.3) – 3.8 0.3 (1.2)Disposals (3.0) (0.2) (8.6) (2.2) (14.0)Disposal of subsidiary (2.0) – (0.7) (1.4) (4.1)At 31st December 2018 134.1 39.0 178.5 78.8 430.4Depreciation:At 1st January 2018 29.8 5.7 103.0 48.8 187.3Exchange adjustments 0.3 – 0.2 (0.1) 0.4
30.1 5.7 103.2 48.7 187.7Charged in year 2.9 1.4 14.4 7.9 26.6Transfers (0.6) – 0.4 (1.0) (1.2)Disposals (1.3) (0.2) (7.5) (1.7) (10.7)Disposal of subsidiary (1.2) – (0.5) (1.1) (2.8)At 31st December 2018 29.9 6.9 110.0 52.8 199.6Net book value:At 31st December 2018 104.2 32.1 68.5 26.0 230.8
The total amount of transfers relates to property, plant and equipment transferred to other intangible assets (see Note 14).
2017
Freehold land and buildings
£m
Leasehold land and buildings
£m
Plant and machinery
£m
Fixtures, fittings,
tools and equipment
£mTotal
£m
Cost:At 1st January 2017 122.4 36.8 150.1 64.9 374.2Exchange adjustments (0.7) (1.0) (3.0) (1.0) (5.7)
121.7 35.8 147.1 63.9 368.5Acquisitions 14.2 0.4 8.4 3.6 26.6Additions 2.9 2.9 14.4 9.5 29.7Disposals – (1.4) (5.0) (3.6) (10.0)At 31st December 2017 138.8 37.7 164.9 73.4 414.8Depreciation:At 1st January 2017 27.4 4.9 94.8 45.3 172.4Exchange adjustments (0.2) (0.1) (1.2) (0.5) (2.0)
27.2 4.8 93.6 44.8 170.4Charged in year 2.6 1.5 13.7 7.5 25.3Disposals – (0.6) (4.3) (3.5) (8.4)At 31st December 2017 29.8 5.7 103.0 48.8 187.3Net book value:At 31st December 2017 109.0 32.0 61.9 24.6 227.5
Included in the above are finance leases with a net book value of £0.3m (2017: £0.3m) and assets under construction of £8.1m (2017: £6.2m). In 2018 additions from acquisitions were £0.2m and are shown within additions.
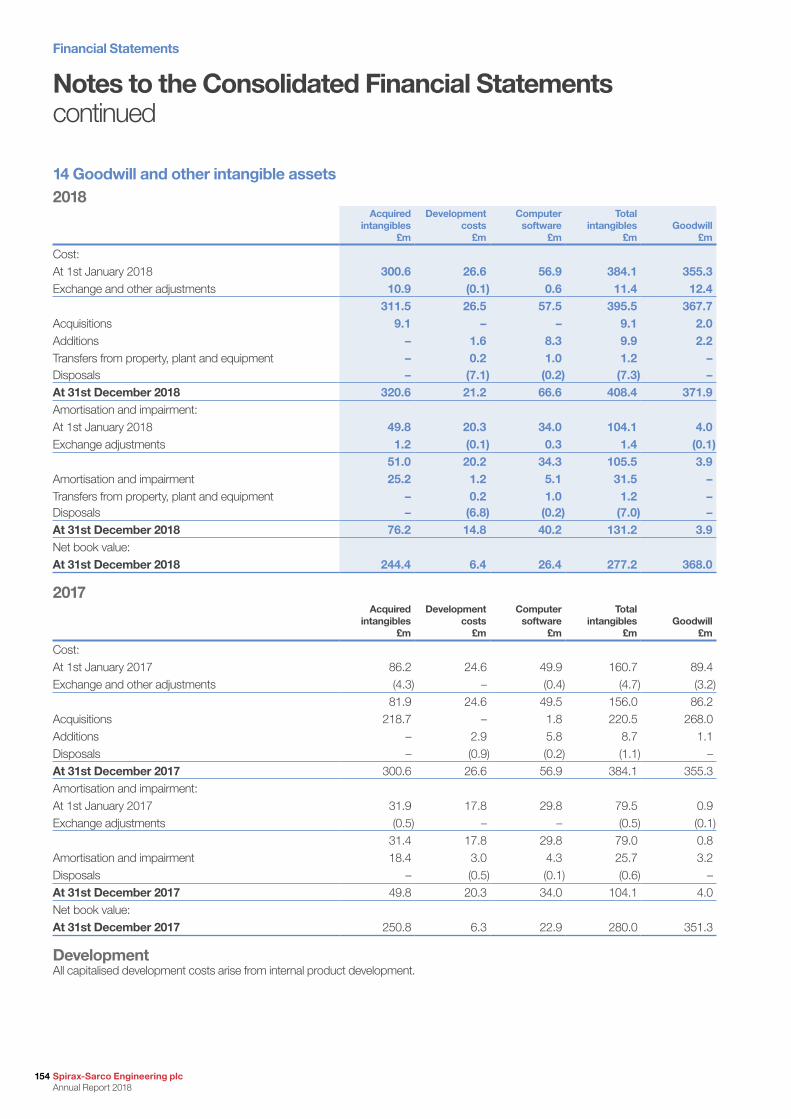
Financial Statements
154 Spirax-Sarco Engineering plc Annual Report 2018
Notes to the Consolidated Financial Statements continued
14 Goodwill and other intangible assets2018
Acquired intangibles
£m
Development costs
£m
Computer software
£m
Total intangibles
£mGoodwill
£m
Cost:At 1st January 2018 300.6 26.6 56.9 384.1 355.3Exchange and other adjustments 10.9 (0.1) 0.6 11.4 12.4
311.5 26.5 57.5 395.5 367.7Acquisitions 9.1 – – 9.1 2.0Additions – 1.6 8.3 9.9 2.2Transfers from property, plant and equipment – 0.2 1.0 1.2 –Disposals – (7.1) (0.2) (7.3) –At 31st December 2018 320.6 21.2 66.6 408.4 371.9Amortisation and impairment:At 1st January 2018 49.8 20.3 34.0 104.1 4.0Exchange adjustments 1.2 (0.1) 0.3 1.4 (0.1)
51.0 20.2 34.3 105.5 3.9Amortisation and impairment 25.2 1.2 5.1 31.5 –Transfers from property, plant and equipment – 0.2 1.0 1.2 –Disposals – (6.8) (0.2) (7.0) –At 31st December 2018 76.2 14.8 40.2 131.2 3.9Net book value:At 31st December 2018 244.4 6.4 26.4 277.2 368.0
2017Acquired
intangibles £m
Development costs
£m
Computer software
£m
Total intangibles
£mGoodwill
£m
Cost:At 1st January 2017 86.2 24.6 49.9 160.7 89.4Exchange and other adjustments (4.3) – (0.4) (4.7) (3.2)
81.9 24.6 49.5 156.0 86.2Acquisitions 218.7 – 1.8 220.5 268.0Additions – 2.9 5.8 8.7 1.1Disposals – (0.9) (0.2) (1.1) –At 31st December 2017 300.6 26.6 56.9 384.1 355.3Amortisation and impairment:At 1st January 2017 31.9 17.8 29.8 79.5 0.9Exchange adjustments (0.5) – – (0.5) (0.1)
31.4 17.8 29.8 79.0 0.8Amortisation and impairment 18.4 3.0 4.3 25.7 3.2Disposals – (0.5) (0.1) (0.6) –At 31st December 2017 49.8 20.3 34.0 104.1 4.0Net book value:At 31st December 2017 250.8 6.3 22.9 280.0 351.3
DevelopmentAll capitalised development costs arise from internal product development.
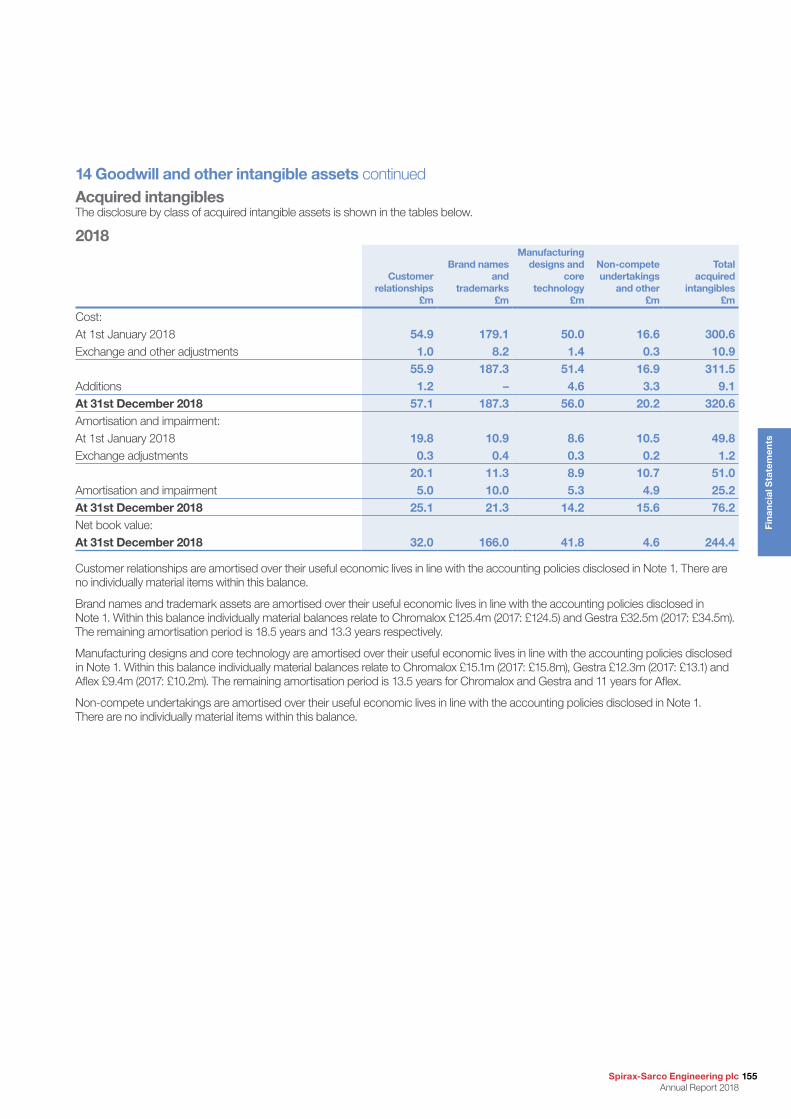
Spirax-Sarco Engineering plc Annual Report 2018
155
Fin
anci
al S
tate
men
ts
14 Goodwill and other intangible assets continuedAcquired intangiblesThe disclosure by class of acquired intangible assets is shown in the tables below.
2018
Customer relationships
£m
Brand names and
trademarks £m
Manufacturing designs and
core technology
£m
Non-compete undertakings
and other £m
Total acquired
intangibles £m
Cost:At 1st January 2018 54.9 179.1 50.0 16.6 300.6Exchange and other adjustments 1.0 8.2 1.4 0.3 10.9
55.9 187.3 51.4 16.9 311.5Additions 1.2 – 4.6 3.3 9.1At 31st December 2018 57.1 187.3 56.0 20.2 320.6Amortisation and impairment:At 1st January 2018 19.8 10.9 8.6 10.5 49.8Exchange adjustments 0.3 0.4 0.3 0.2 1.2
20.1 11.3 8.9 10.7 51.0Amortisation and impairment 5.0 10.0 5.3 4.9 25.2At 31st December 2018 25.1 21.3 14.2 15.6 76.2Net book value:At 31st December 2018 32.0 166.0 41.8 4.6 244.4
Customer relationships are amortised over their useful economic lives in line with the accounting policies disclosed in Note 1. There are no individually material items within this balance.
Brand names and trademark assets are amortised over their useful economic lives in line with the accounting policies disclosed in Note 1. Within this balance individually material balances relate to Chromalox £125.4m (2017: £124.5) and Gestra £32.5m (2017: £34.5m). The remaining amortisation period is 18.5 years and 13.3 years respectively.
Manufacturing designs and core technology are amortised over their useful economic lives in line with the accounting policies disclosed in Note 1. Within this balance individually material balances relate to Chromalox £15.1m (2017: £15.8m), Gestra £12.3m (2017: £13.1) and Aflex £9.4m (2017: £10.2m). The remaining amortisation period is 13.5 years for Chromalox and Gestra and 11 years for Aflex.
Non-compete undertakings are amortised over their useful economic lives in line with the accounting policies disclosed in Note 1. There are no individually material items within this balance.
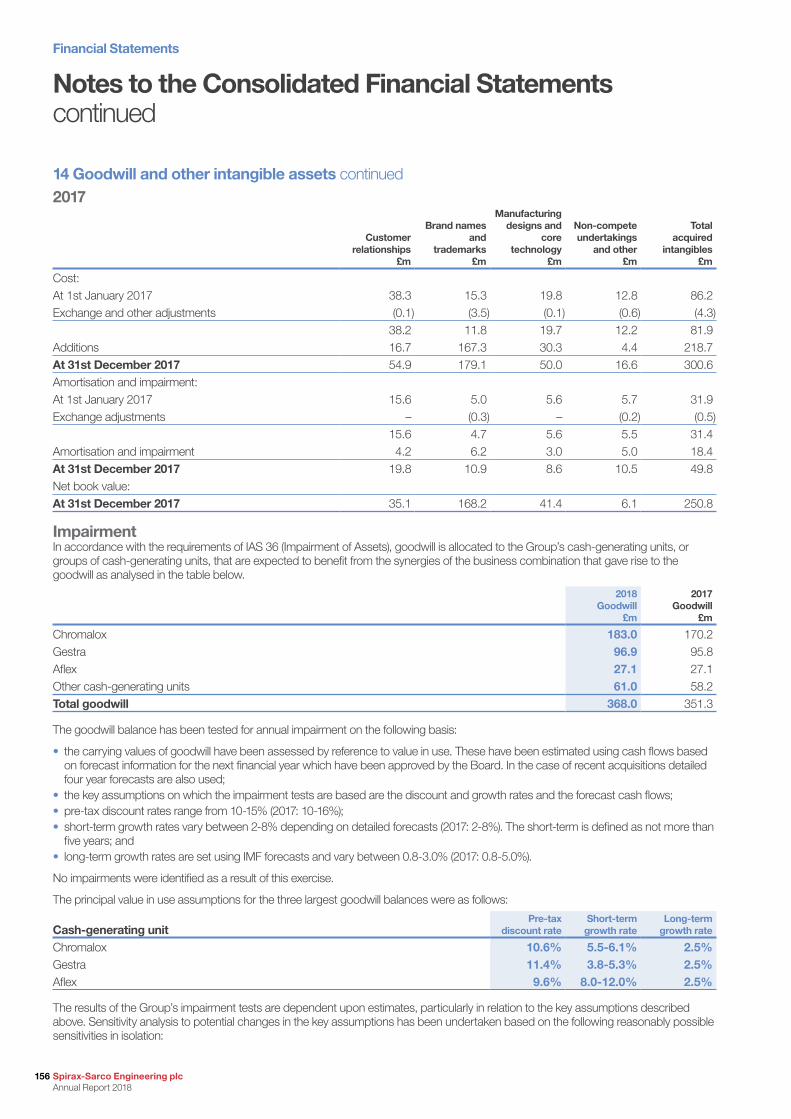
Financial Statements
156 Spirax-Sarco Engineering plc Annual Report 2018
Notes to the Consolidated Financial Statements continued
14 Goodwill and other intangible assets continued2017
Customer relationships
£m
Brand names and
trademarks £m
Manufacturing designs and
core technology
£m
Non-compete undertakings
and other £m
Total acquired
intangibles £m
Cost:At 1st January 2017 38.3 15.3 19.8 12.8 86.2Exchange and other adjustments (0.1) (3.5) (0.1) (0.6) (4.3)
38.2 11.8 19.7 12.2 81.9Additions 16.7 167.3 30.3 4.4 218.7At 31st December 2017 54.9 179.1 50.0 16.6 300.6Amortisation and impairment:At 1st January 2017 15.6 5.0 5.6 5.7 31.9Exchange adjustments – (0.3) – (0.2) (0.5)
15.6 4.7 5.6 5.5 31.4Amortisation and impairment 4.2 6.2 3.0 5.0 18.4At 31st December 2017 19.8 10.9 8.6 10.5 49.8Net book value:At 31st December 2017 35.1 168.2 41.4 6.1 250.8
ImpairmentIn accordance with the requirements of IAS 36 (Impairment of Assets), goodwill is allocated to the Group’s cash-generating units, or groups of cash-generating units, that are expected to benefit from the synergies of the business combination that gave rise to the goodwill as analysed in the table below.
2018 Goodwill
£m
2017 Goodwill
£m
Chromalox 183.0 170.2Gestra 96.9 95.8Aflex 27.1 27.1Other cash-generating units 61.0 58.2Total goodwill 368.0 351.3
The goodwill balance has been tested for annual impairment on the following basis:
• the carrying values of goodwill have been assessed by reference to value in use. These have been estimated using cash flows based on forecast information for the next financial year which have been approved by the Board. In the case of recent acquisitions detailed four year forecasts are also used;
• the key assumptions on which the impairment tests are based are the discount and growth rates and the forecast cash flows;• pre-tax discount rates range from 10-15% (2017: 10-16%);• short-term growth rates vary between 2-8% depending on detailed forecasts (2017: 2-8%). The short-term is defined as not more than
five years; and• long-term growth rates are set using IMF forecasts and vary between 0.8-3.0% (2017: 0.8-5.0%).
No impairments were identified as a result of this exercise.
The principal value in use assumptions for the three largest goodwill balances were as follows:
Cash-generating unitPre-tax
discount rateShort-term growth rate
Long-term growth rate
Chromalox 10.6% 5.5-6.1% 2.5%Gestra 11.4% 3.8-5.3% 2.5%Aflex 9.6% 8.0-12.0% 2.5%
The results of the Group’s impairment tests are dependent upon estimates, particularly in relation to the key assumptions described above. Sensitivity analysis to potential changes in the key assumptions has been undertaken based on the following reasonably possible sensitivities in isolation:
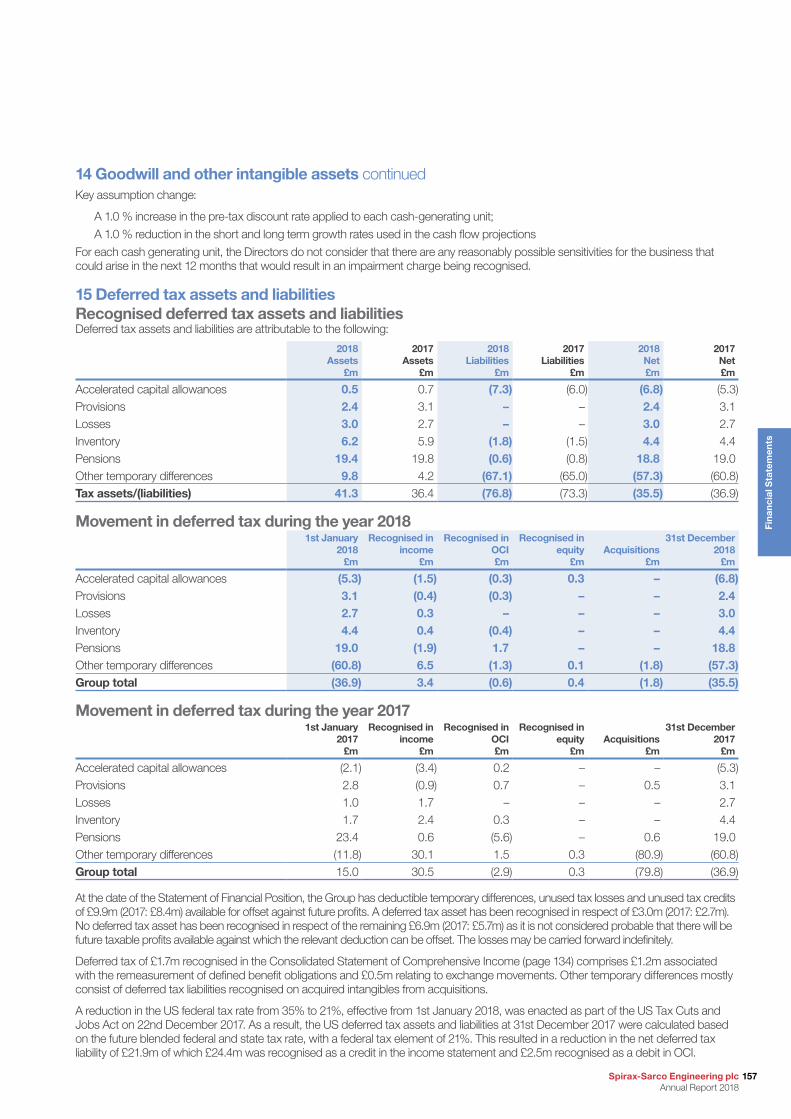
Spirax-Sarco Engineering plc Annual Report 2018
157
Fin
anci
al S
tate
men
ts
14 Goodwill and other intangible assets continuedKey assumption change:
A 1.0 % increase in the pre-tax discount rate applied to each cash-generating unit;
A 1.0 % reduction in the short and long term growth rates used in the cash flow projections
For each cash generating unit, the Directors do not consider that there are any reasonably possible sensitivities for the business that could arise in the next 12 months that would result in an impairment charge being recognised.
15 Deferred tax assets and liabilitiesRecognised deferred tax assets and liabilitiesDeferred tax assets and liabilities are attributable to the following:
2018 Assets
£m
2017 Assets
£m
2018 Liabilities
£m
2017 Liabilities
£m
2018 Net £m
2017 Net £m
Accelerated capital allowances 0.5 0.7 (7.3) (6.0) (6.8) (5.3)Provisions 2.4 3.1 – – 2.4 3.1Losses 3.0 2.7 – – 3.0 2.7Inventory 6.2 5.9 (1.8) (1.5) 4.4 4.4Pensions 19.4 19.8 (0.6) (0.8) 18.8 19.0Other temporary differences 9.8 4.2 (67.1) (65.0) (57.3) (60.8)Tax assets/(liabilities) 41.3 36.4 (76.8) (73.3) (35.5) (36.9)
Movement in deferred tax during the year 20181st January
2018 £m
Recognised in income
£m
Recognised in OCI £m
Recognised in equity
£mAcquisitions
£m
31st December 2018
£m
Accelerated capital allowances (5.3) (1.5) (0.3) 0.3 – (6.8)Provisions 3.1 (0.4) (0.3) – – 2.4Losses 2.7 0.3 – – – 3.0Inventory 4.4 0.4 (0.4) – – 4.4Pensions 19.0 (1.9) 1.7 – – 18.8Other temporary differences (60.8) 6.5 (1.3) 0.1 (1.8) (57.3)Group total (36.9) 3.4 (0.6) 0.4 (1.8) (35.5)
Movement in deferred tax during the year 20171st January
2017 £m
Recognised in income
£m
Recognised in OCI £m
Recognised in equity
£mAcquisitions
£m
31st December 2017
£m
Accelerated capital allowances (2.1) (3.4) 0.2 – – (5.3)Provisions 2.8 (0.9) 0.7 – 0.5 3.1Losses 1.0 1.7 – – – 2.7Inventory 1.7 2.4 0.3 – – 4.4Pensions 23.4 0.6 (5.6) – 0.6 19.0Other temporary differences (11.8) 30.1 1.5 0.3 (80.9) (60.8)Group total 15.0 30.5 (2.9) 0.3 (79.8) (36.9)
At the date of the Statement of Financial Position, the Group has deductible temporary differences, unused tax losses and unused tax credits of £9.9m (2017: £8.4m) available for offset against future profits. A deferred tax asset has been recognised in respect of £3.0m (2017: £2.7m). No deferred tax asset has been recognised in respect of the remaining £6.9m (2017: £5.7m) as it is not considered probable that there will be future taxable profits available against which the relevant deduction can be offset. The losses may be carried forward indefinitely.
Deferred tax of £1.7m recognised in the Consolidated Statement of Comprehensive Income (page 134) comprises £1.2m associated with the remeasurement of defined benefit obligations and £0.5m relating to exchange movements. Other temporary differences mostly consist of deferred tax liabilities recognised on acquired intangibles from acquisitions.
A reduction in the US federal tax rate from 35% to 21%, effective from 1st January 2018, was enacted as part of the US Tax Cuts and Jobs Act on 22nd December 2017. As a result, the US deferred tax assets and liabilities at 31st December 2017 were calculated based on the future blended federal and state tax rate, with a federal tax element of 21%. This resulted in a reduction in the net deferred tax liability of £21.9m of which £24.4m was recognised as a credit in the income statement and £2.5m recognised as a debit in OCI.
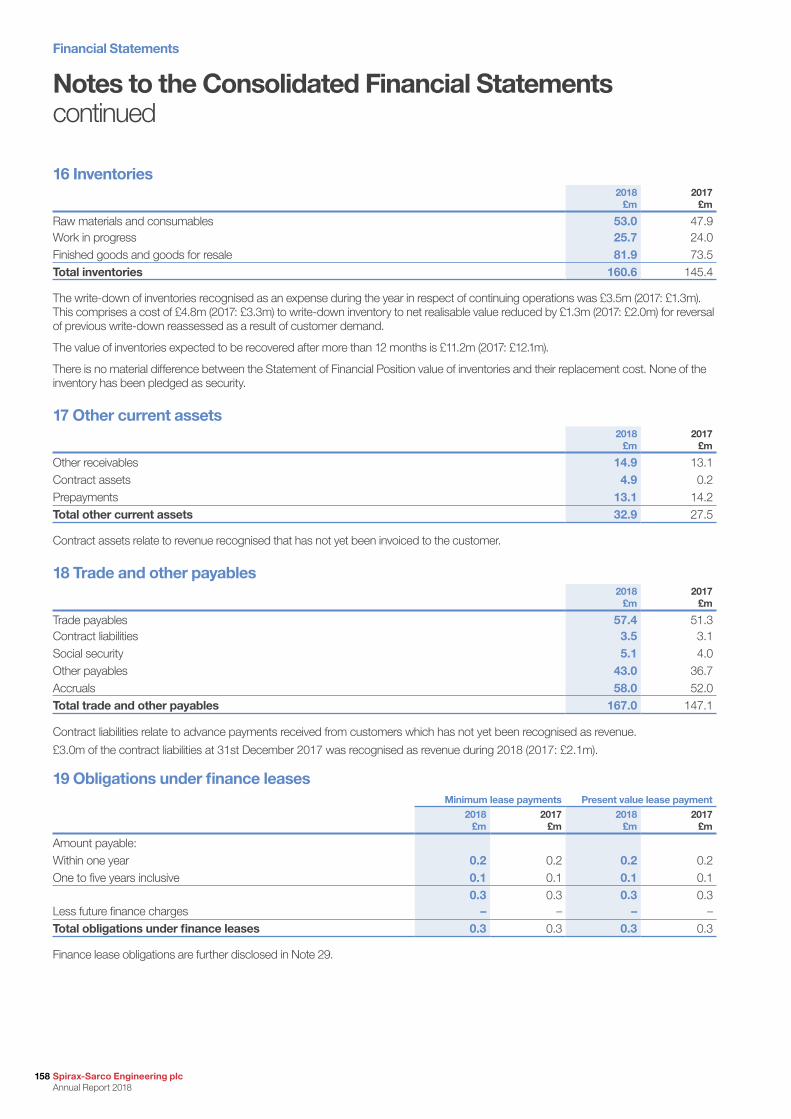
Financial Statements
158 Spirax-Sarco Engineering plc Annual Report 2018
16 Inventories2018
£m2017
£m
Raw materials and consumables 53.0 47.9Work in progress 25.7 24.0Finished goods and goods for resale 81.9 73.5Total inventories 160.6 145.4
The write-down of inventories recognised as an expense during the year in respect of continuing operations was £3.5m (2017: £1.3m). This comprises a cost of £4.8m (2017: £3.3m) to write-down inventory to net realisable value reduced by £1.3m (2017: £2.0m) for reversal of previous write-down reassessed as a result of customer demand.
The value of inventories expected to be recovered after more than 12 months is £11.2m (2017: £12.1m).
There is no material difference between the Statement of Financial Position value of inventories and their replacement cost. None of the inventory has been pledged as security.
17 Other current assets 2018
£m2017
£m
Other receivables 14.9 13.1Contract assets 4.9 0.2Prepayments 13.1 14.2Total other current assets 32.9 27.5
Contract assets relate to revenue recognised that has not yet been invoiced to the customer.
18 Trade and other payables2018
£m2017
£m
Trade payables 57.4 51.3Contract liabilities 3.5 3.1Social security 5.1 4.0Other payables 43.0 36.7Accruals 58.0 52.0Total trade and other payables 167.0 147.1
Contract liabilities relate to advance payments received from customers which has not yet been recognised as revenue.
£3.0m of the contract liabilities at 31st December 2017 was recognised as revenue during 2018 (2017: £2.1m).
19 Obligations under finance leasesMinimum lease payments Present value lease payment
2018 £m
2017 £m
2018 £m
2017 £m
Amount payable:Within one year 0.2 0.2 0.2 0.2One to five years inclusive 0.1 0.1 0.1 0.1
0.3 0.3 0.3 0.3Less future finance charges – – – –Total obligations under finance leases 0.3 0.3 0.3 0.3
Finance lease obligations are further disclosed in Note 29.
Notes to the Consolidated Financial Statements continued
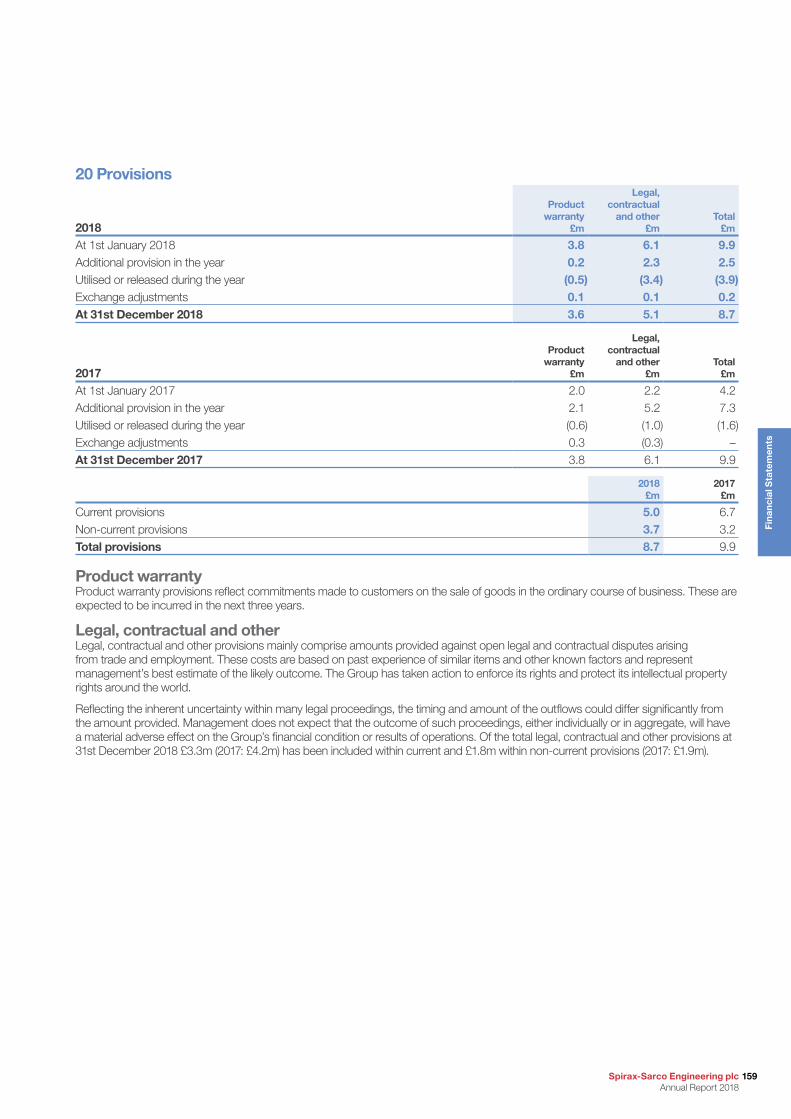
Spirax-Sarco Engineering plc Annual Report 2018
159
Fin
anci
al S
tate
men
ts
20 Provisions
2018
Product warranty
£m
Legal, contractual
and other£m
Total£m
At 1st January 2018 3.8 6.1 9.9Additional provision in the year 0.2 2.3 2.5Utilised or released during the year (0.5) (3.4) (3.9)Exchange adjustments 0.1 0.1 0.2At 31st December 2018 3.6 5.1 8.7
2017
Product warranty
£m
Legal, contractual
and other£m
Total£m
At 1st January 2017 2.0 2.2 4.2Additional provision in the year 2.1 5.2 7.3Utilised or released during the year (0.6) (1.0) (1.6)Exchange adjustments 0.3 (0.3) –At 31st December 2017 3.8 6.1 9.9
2018 £m
2017 £m
Current provisions 5.0 6.7Non-current provisions 3.7 3.2Total provisions 8.7 9.9
Product warrantyProduct warranty provisions reflect commitments made to customers on the sale of goods in the ordinary course of business. These are expected to be incurred in the next three years.
Legal, contractual and otherLegal, contractual and other provisions mainly comprise amounts provided against open legal and contractual disputes arising from trade and employment. These costs are based on past experience of similar items and other known factors and represent management’s best estimate of the likely outcome. The Group has taken action to enforce its rights and protect its intellectual property rights around the world.
Reflecting the inherent uncertainty within many legal proceedings, the timing and amount of the outflows could differ significantly from the amount provided. Management does not expect that the outcome of such proceedings, either individually or in aggregate, will have a material adverse effect on the Group’s financial condition or results of operations. Of the total legal, contractual and other provisions at 31st December 2018 £3.3m (2017: £4.2m) has been included within current and £1.8m within non-current provisions (2017: £1.9m).
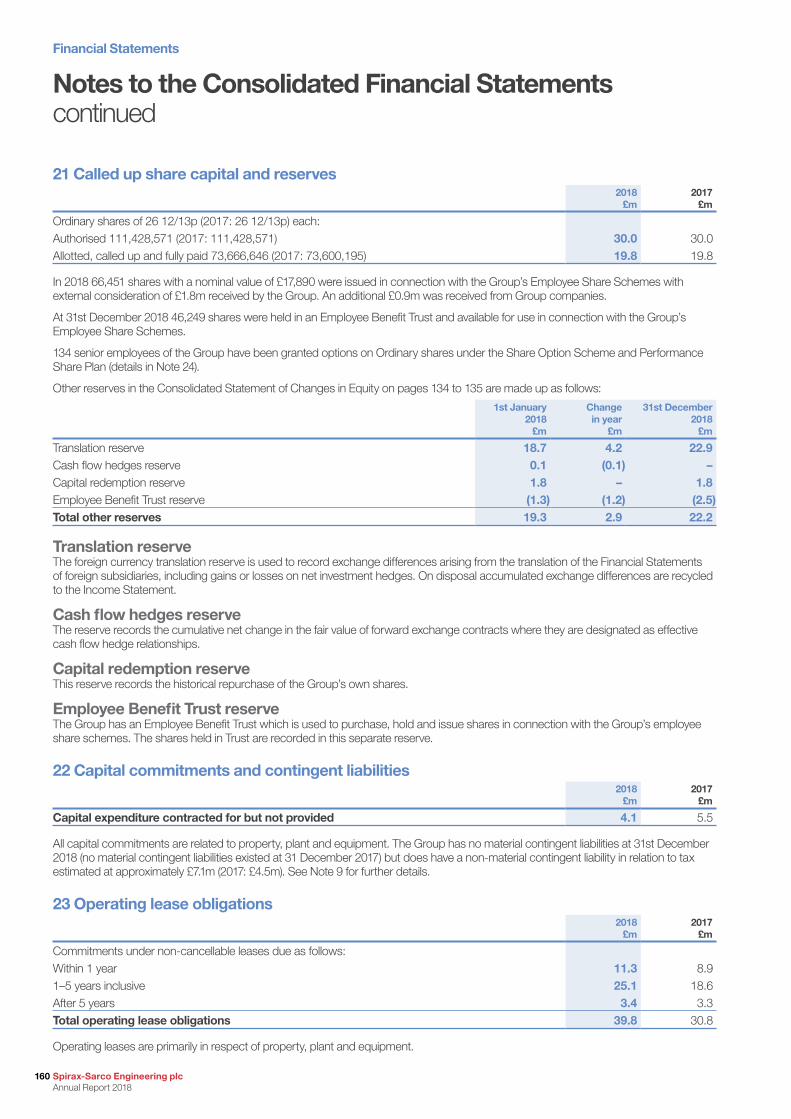
Financial Statements
160 Spirax-Sarco Engineering plc Annual Report 2018
Notes to the Consolidated Financial Statements continued
21 Called up share capital and reserves2018
£m2017
£m
Ordinary shares of 26 12/13p (2017: 26 12/13p) each:Authorised 111,428,571 (2017: 111,428,571) 30.0 30.0Allotted, called up and fully paid 73,666,646 (2017: 73,600,195) 19.8 19.8
In 2018 66,451 shares with a nominal value of £17,890 were issued in connection with the Group’s Employee Share Schemes with external consideration of £1.8m received by the Group. An additional £0.9m was received from Group companies.
At 31st December 2018 46,249 shares were held in an Employee Benefit Trust and available for use in connection with the Group’s Employee Share Schemes.
134 senior employees of the Group have been granted options on Ordinary shares under the Share Option Scheme and Performance Share Plan (details in Note 24).
Other reserves in the Consolidated Statement of Changes in Equity on pages 134 to 135 are made up as follows:
1st January 2018
£m
Change in year
£m
31st December 2018
£m
Translation reserve 18.7 4.2 22.9Cash flow hedges reserve 0.1 (0.1) –Capital redemption reserve 1.8 – 1.8Employee Benefit Trust reserve (1.3) (1.2) (2.5)Total other reserves 19.3 2.9 22.2
Translation reserveThe foreign currency translation reserve is used to record exchange differences arising from the translation of the Financial Statements of foreign subsidiaries, including gains or losses on net investment hedges. On disposal accumulated exchange differences are recycled to the Income Statement.
Cash flow hedges reserveThe reserve records the cumulative net change in the fair value of forward exchange contracts where they are designated as effective cash flow hedge relationships.
Capital redemption reserveThis reserve records the historical repurchase of the Group’s own shares.
Employee Benefit Trust reserveThe Group has an Employee Benefit Trust which is used to purchase, hold and issue shares in connection with the Group’s employee share schemes. The shares held in Trust are recorded in this separate reserve.
22 Capital commitments and contingent liabilities2018
£m2017
£m
Capital expenditure contracted for but not provided 4.1 5.5
All capital commitments are related to property, plant and equipment. The Group has no material contingent liabilities at 31st December 2018 (no material contingent liabilities existed at 31 December 2017) but does have a non-material contingent liability in relation to tax estimated at approximately £7.1m (2017: £4.5m). See Note 9 for further details.
23 Operating lease obligations2018
£m2017
£m
Commitments under non-cancellable leases due as follows:Within 1 year 11.3 8.91–5 years inclusive 25.1 18.6After 5 years 3.4 3.3Total operating lease obligations 39.8 30.8
Operating leases are primarily in respect of property, plant and equipment.
Spirax-Sarco Engineering plc Annual Report 2018
161
Fin
anci
al S
tate
men
ts
24 Employee benefitsRetirement benefit obligations The Group operates a wide range of retirement benefit arrangements, which are established in accordance with local conditions and practices within the countries concerned. These include funded defined contribution and funded and unfunded defined benefit schemes.
Defined contribution arrangementsThe majority of the retirement benefit arrangements operated by the Group are of a defined contribution structure, where the employer contribution and resulting Income Statement charge is fixed at a set level or is a set percentage of employee’s pay. Contributions made to defined contribution schemes and charged to the Income Statement totalled £14.3m (2017: £10.9m). In the UK, following the closure of the defined benefit schemes to new entrants, the main scheme for new employees is a defined contribution scheme.
Defined benefit arrangementsThe Group operates several funded defined benefit retirement schemes where the benefits are based on employees’ length of service. Whilst the Group’s primary schemes are in the UK, it also operates other material benefit schemes in the USA as well as less material schemes elsewhere. In funded arrangements, the assets of defined benefit schemes are held in separate trustee-administered funds or similar structures in the countries concerned.
UK defined benefit arrangementsThe defined benefit schemes in the UK account for approximately half of the Group’s net liability for defined retirement benefit schemes. Spirax-Sarco operates three UK schemes: the Spirax-Sarco Employees Pension Fund, the Spirax-Sarco Executives’ Retirement Benefits Scheme and the Watson-Marlow Pension Fund. These are all final salary pension schemes. The UK schemes are closed to new members but are open to future accrual. There is a mix of different inflation-dependent pension increases (in payment and deferment) which vary from member to member according to their membership history and which scheme they are a member of. All three schemes have been set up under UK law and are governed by a Trustee committee, which is responsible for the scheme’s investments, administration and management. A funding valuation is carried out for the Trustees of each scheme every three years by an independent firm of actuaries. Depending on the outcome of that valuation a schedule of future contributions is negotiated with Spirax Sarco. Further information on the contribution commitments is shown in the Financial Review on page 53.
During 2018 an assessment of the estimated impact of equalising for the effects of unequal Guaranteed Minimum Pensions (GMP) was performed resulting in a past service cost of £0.7m recognised in the Consolidated Income Statement.
US defined benefit schemesThe Group operates a pension scheme in the USA, which is closed to new entrants. During 2018 the pension scheme was frozen to future accrual, which led to a reduction in the Defined Benefit Obligation as benefits are no longer linked to salary increases. This plan amendment was recognised as a past service credit, of £6.0m, in the Consolidated Income Statement during 2018. The pension scheme defines the pension in terms of the highest average pensionable pay for any five consecutive years prior to retirement. No pension increases (in payment and deferment) are offered by this scheme. It also operates a post-retirement medical plan in the USA, which is unfunded, as is typical for these plans.
Principal risksThe pension schemes create a number of risk exposures. Annual increase in benefits are, to a varying extent from scheme to scheme, dependent on inflation so the main uncertainties affecting the level of benefits payable are future inflation levels (including the impact of inflation on future salary increases) and the actual longevity of the membership. Benefits payable will also be influenced by a range of other factors including member decisions on matters such as when to retire and the possibility to draw benefits in different forms. A key risk is that additional contributions are required if the investment returns fall short of those anticipated when setting the contributions to the pension schemes. All pension schemes are regulated by the relevant jurisdictions. These include extensive legislation and regulatory mechanisms that are subject to change and may impact on the Group’s pension schemes. The IAS 19 liability measurement known as Defined Benefit Obligation (DBO) and the Service Cost are sensitive to the actuarial assumptions made on a range of demographic and financial matters that are used to project the expected benefit payments, the most important of these assumptions being the future inflation and salary growth levels and the assumptions made about life expectation. The DBO and Service Cost are also very sensitive to the IAS 19 discount rate, which determines the discounted value of the projected benefit payments. The discount rate depends on market yields on high-quality corporate bonds. Investment strategies are set with funding rather than IAS 19 considerations in mind and do not seek to provide a specific hedge against the IAS 19 measurement of DBO. As a result the difference between the market value of the assets and the IAS 19 DBO may be volatile. Further information on the investment strategy for the UK schemes can be found in the Financial Review on page 53.
Sensitivity analysis to changes in discount rate and inflation are included on page 165.
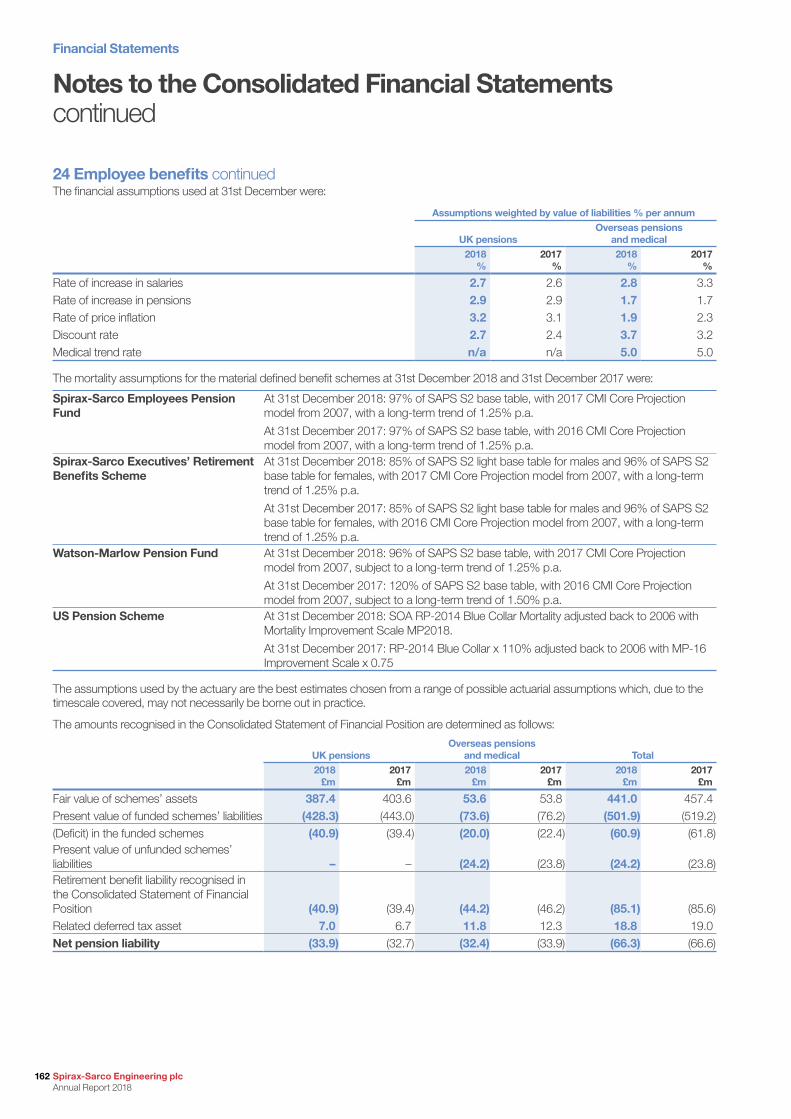
Financial Statements
162 Spirax-Sarco Engineering plc Annual Report 2018
Notes to the Consolidated Financial Statements continued
24 Employee benefits continuedThe financial assumptions used at 31st December were:
Assumptions weighted by value of liabilities % per annum
UK pensionsOverseas pensions
and medical2018
%2017
%2018
%2017
%
Rate of increase in salaries 2.7 2.6 2.8 3.3Rate of increase in pensions 2.9 2.9 1.7 1.7Rate of price inflation 3.2 3.1 1.9 2.3Discount rate 2.7 2.4 3.7 3.2Medical trend rate n/a n/a 5.0 5.0
The mortality assumptions for the material defined benefit schemes at 31st December 2018 and 31st December 2017 were:
Spirax-Sarco Employees Pension Fund
At 31st December 2018: 97% of SAPS S2 base table, with 2017 CMI Core Projection model from 2007, with a long-term trend of 1.25% p.a.
At 31st December 2017: 97% of SAPS S2 base table, with 2016 CMI Core Projection model from 2007, with a long-term trend of 1.25% p.a.
Spirax-Sarco Executives’ Retirement Benefits Scheme
At 31st December 2018: 85% of SAPS S2 light base table for males and 96% of SAPS S2 base table for females, with 2017 CMI Core Projection model from 2007, with a long-term trend of 1.25% p.a.
At 31st December 2017: 85% of SAPS S2 light base table for males and 96% of SAPS S2 base table for females, with 2016 CMI Core Projection model from 2007, with a long-term trend of 1.25% p.a.
Watson-Marlow Pension Fund At 31st December 2018: 96% of SAPS S2 base table, with 2017 CMI Core Projection model from 2007, subject to a long-term trend of 1.25% p.a.
At 31st December 2017: 120% of SAPS S2 base table, with 2016 CMI Core Projection model from 2007, subject to a long-term trend of 1.50% p.a.
US Pension Scheme At 31st December 2018: SOA RP-2014 Blue Collar Mortality adjusted back to 2006 with Mortality Improvement Scale MP2018.
At 31st December 2017: RP-2014 Blue Collar x 110% adjusted back to 2006 with MP-16 Improvement Scale x 0.75
The assumptions used by the actuary are the best estimates chosen from a range of possible actuarial assumptions which, due to the timescale covered, may not necessarily be borne out in practice.
The amounts recognised in the Consolidated Statement of Financial Position are determined as follows:
UK pensionsOverseas pensions
and medical Total2018
£m2017
£m2018
£m2017
£m2018
£m2017
£m
Fair value of schemes’ assets 387.4 403.6 53.6 53.8 441.0 457.4Present value of funded schemes’ liabilities (428.3) (443.0) (73.6) (76.2) (501.9) (519.2)(Deficit) in the funded schemes (40.9) (39.4) (20.0) (22.4) (60.9) (61.8)Present value of unfunded schemes’ liabilities – – (24.2) (23.8) (24.2) (23.8)Retirement benefit liability recognised in the Consolidated Statement of Financial Position (40.9) (39.4) (44.2) (46.2) (85.1) (85.6)Related deferred tax asset 7.0 6.7 11.8 12.3 18.8 19.0Net pension liability (33.9) (32.7) (32.4) (33.9) (66.3) (66.6)
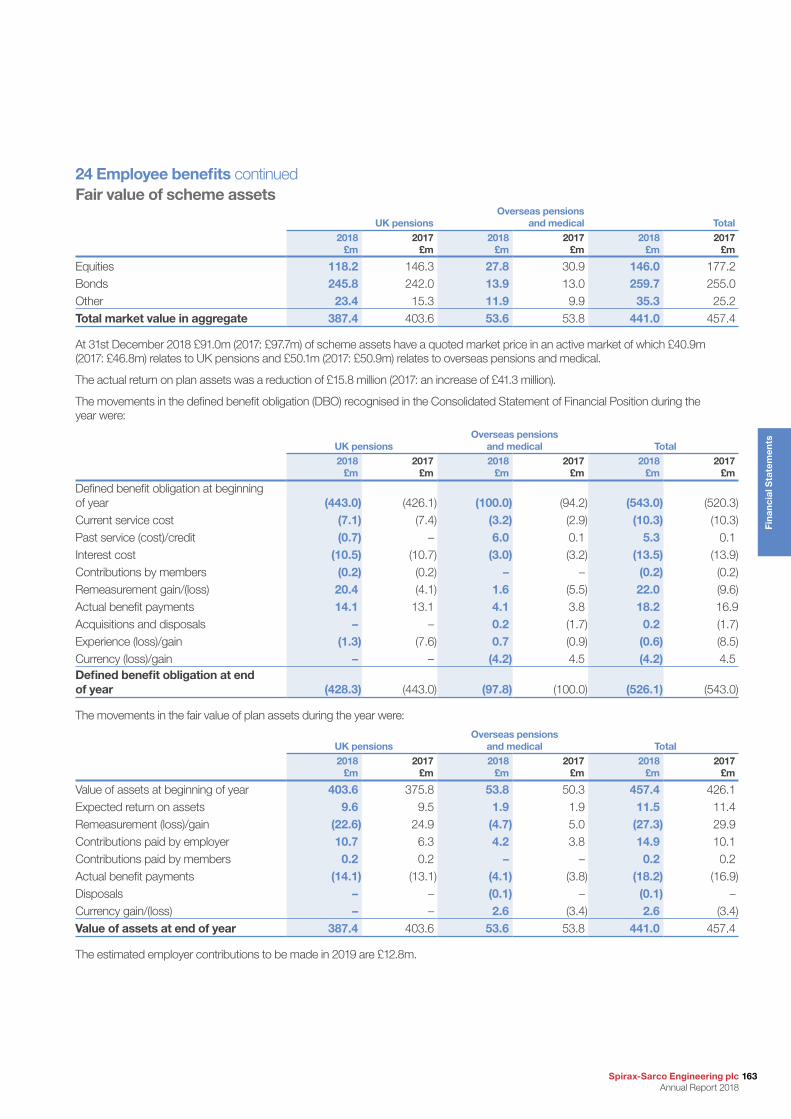
Spirax-Sarco Engineering plc Annual Report 2018
163
Fin
anci
al S
tate
men
ts
24 Employee benefits continuedFair value of scheme assets
UK pensionsOverseas pensions
and medical Total2018
£m2017
£m2018
£m2017
£m2018
£m2017
£m
Equities 118.2 146.3 27.8 30.9 146.0 177.2Bonds 245.8 242.0 13.9 13.0 259.7 255.0Other 23.4 15.3 11.9 9.9 35.3 25.2Total market value in aggregate 387.4 403.6 53.6 53.8 441.0 457.4
At 31st December 2018 £91.0m (2017: £97.7m) of scheme assets have a quoted market price in an active market of which £40.9m (2017: £46.8m) relates to UK pensions and £50.1m (2017: £50.9m) relates to overseas pensions and medical.
The actual return on plan assets was a reduction of £15.8 million (2017: an increase of £41.3 million).
The movements in the defined benefit obligation (DBO) recognised in the Consolidated Statement of Financial Position during the year were:
UK pensionsOverseas pensions
and medical Total2018
£m2017
£m2018
£m2017
£m2018
£m2017
£m
Defined benefit obligation at beginning of year (443.0) (426.1) (100.0) (94.2) (543.0) (520.3)Current service cost (7.1) (7.4) (3.2) (2.9) (10.3) (10.3)Past service (cost)/credit (0.7) – 6.0 0.1 5.3 0.1Interest cost (10.5) (10.7) (3.0) (3.2) (13.5) (13.9)Contributions by members (0.2) (0.2) – – (0.2) (0.2)Remeasurement gain/(loss) 20.4 (4.1) 1.6 (5.5) 22.0 (9.6)Actual benefit payments 14.1 13.1 4.1 3.8 18.2 16.9Acquisitions and disposals – – 0.2 (1.7) 0.2 (1.7)Experience (loss)/gain (1.3) (7.6) 0.7 (0.9) (0.6) (8.5)Currency (loss)/gain – – (4.2) 4.5 (4.2) 4.5Defined benefit obligation at end of year (428.3) (443.0) (97.8) (100.0) (526.1) (543.0)
The movements in the fair value of plan assets during the year were:
UK pensionsOverseas pensions
and medical Total2018
£m2017
£m2018
£m2017
£m2018
£m2017
£m
Value of assets at beginning of year 403.6 375.8 53.8 50.3 457.4 426.1Expected return on assets 9.6 9.5 1.9 1.9 11.5 11.4Remeasurement (loss)/gain (22.6) 24.9 (4.7) 5.0 (27.3) 29.9Contributions paid by employer 10.7 6.3 4.2 3.8 14.9 10.1Contributions paid by members 0.2 0.2 – – 0.2 0.2Actual benefit payments (14.1) (13.1) (4.1) (3.8) (18.2) (16.9)Disposals – – (0.1) – (0.1) –Currency gain/(loss) – – 2.6 (3.4) 2.6 (3.4)Value of assets at end of year 387.4 403.6 53.6 53.8 441.0 457.4
The estimated employer contributions to be made in 2019 are £12.8m.
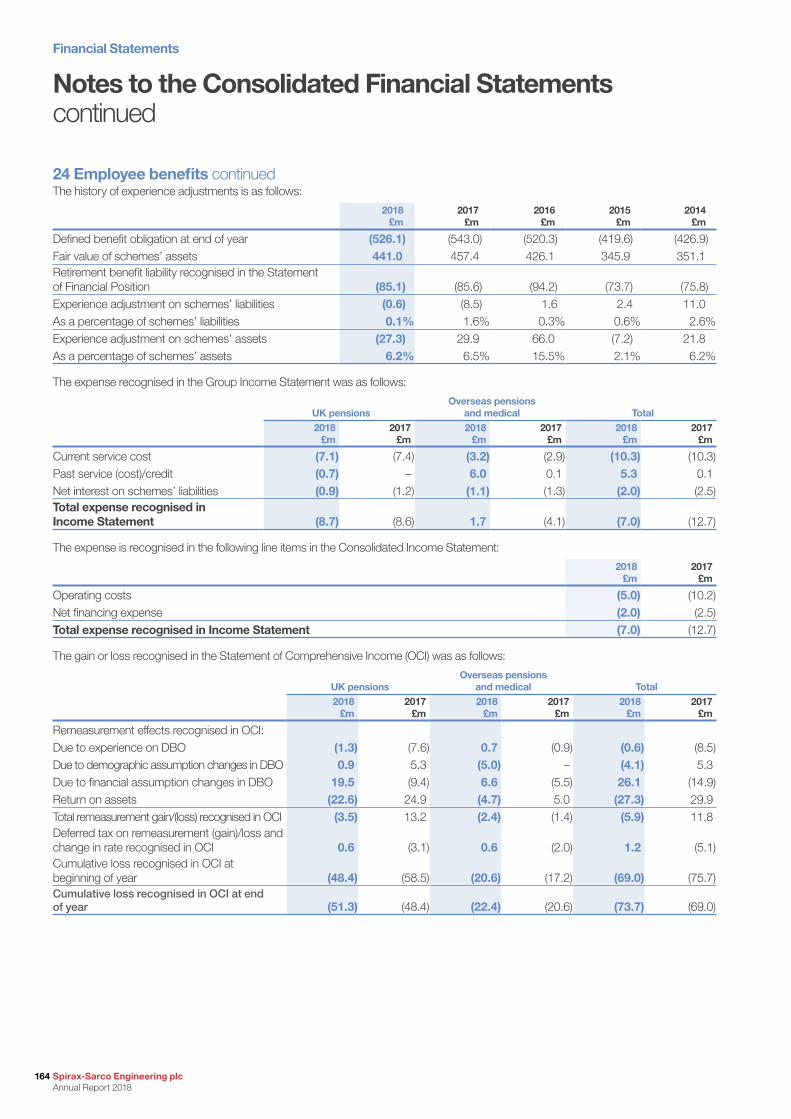
Financial Statements
164 Spirax-Sarco Engineering plc Annual Report 2018
Notes to the Consolidated Financial Statements continued
24 Employee benefits continuedThe history of experience adjustments is as follows:
2018 £m
2017 £m
2016 £m
2015 £m
2014 £m
Defined benefit obligation at end of year (526.1) (543.0) (520.3) (419.6) (426.9)Fair value of schemes’ assets 441.0 457.4 426.1 345.9 351.1Retirement benefit liability recognised in the Statement of Financial Position (85.1) (85.6) (94.2) (73.7) (75.8)Experience adjustment on schemes’ liabilities (0.6) (8.5) 1.6 2.4 11.0As a percentage of schemes’ liabilities 0.1% 1.6% 0.3% 0.6% 2.6%Experience adjustment on schemes’ assets (27.3) 29.9 66.0 (7.2) 21.8As a percentage of schemes’ assets 6.2% 6.5% 15.5% 2.1% 6.2%
The expense recognised in the Group Income Statement was as follows:
UK pensionsOverseas pensions
and medical Total2018
£m2017
£m2018
£m2017
£m2018
£m2017
£m
Current service cost (7.1) (7.4) (3.2) (2.9) (10.3) (10.3)Past service (cost)/credit (0.7) – 6.0 0.1 5.3 0.1Net interest on schemes’ liabilities (0.9) (1.2) (1.1) (1.3) (2.0) (2.5)Total expense recognised in Income Statement (8.7) (8.6) 1.7 (4.1) (7.0) (12.7)
The expense is recognised in the following line items in the Consolidated Income Statement:
2018 £m
2017 £m
Operating costs (5.0) (10.2)Net financing expense (2.0) (2.5)Total expense recognised in Income Statement (7.0) (12.7)
The gain or loss recognised in the Statement of Comprehensive Income (OCI) was as follows:
UK pensionsOverseas pensions
and medical Total2018
£m2017
£m2018
£m2017
£m2018
£m2017
£m
Remeasurement effects recognised in OCI:Due to experience on DBO (1.3) (7.6) 0.7 (0.9) (0.6) (8.5)Due to demographic assumption changes in DBO 0.9 5.3 (5.0) – (4.1) 5.3Due to financial assumption changes in DBO 19.5 (9.4) 6.6 (5.5) 26.1 (14.9)Return on assets (22.6) 24.9 (4.7) 5.0 (27.3) 29.9Total remeasurement gain/(loss) recognised in OCI (3.5) 13.2 (2.4) (1.4) (5.9) 11.8Deferred tax on remeasurement (gain)/loss and change in rate recognised in OCI 0.6 (3.1) 0.6 (2.0) 1.2 (5.1)Cumulative loss recognised in OCI at beginning of year (48.4) (58.5) (20.6) (17.2) (69.0) (75.7)Cumulative loss recognised in OCI at end of year (51.3) (48.4) (22.4) (20.6) (73.7) (69.0)
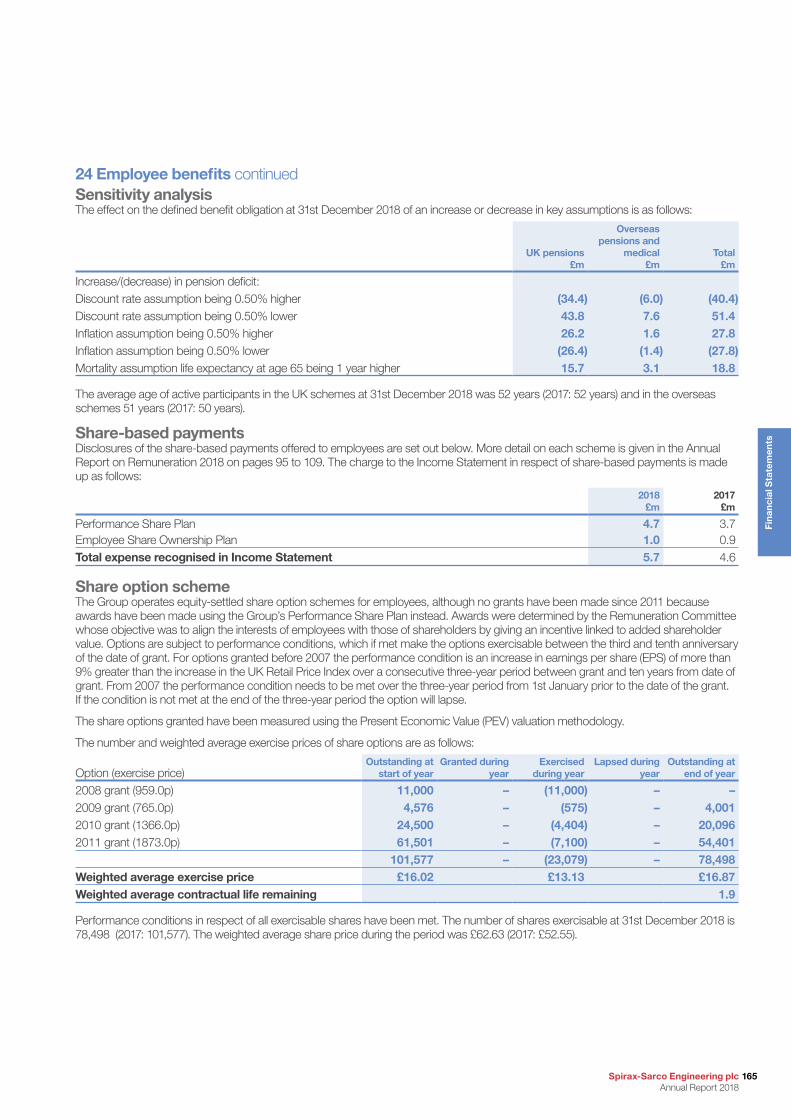
Spirax-Sarco Engineering plc Annual Report 2018
165
Fin
anci
al S
tate
men
ts
24 Employee benefits continuedSensitivity analysisThe effect on the defined benefit obligation at 31st December 2018 of an increase or decrease in key assumptions is as follows:
UK pensions £m
Overseas pensions and
medical £m
Total £m
Increase/(decrease) in pension deficit:Discount rate assumption being 0.50% higher (34.4) (6.0) (40.4)Discount rate assumption being 0.50% lower 43.8 7.6 51.4Inflation assumption being 0.50% higher 26.2 1.6 27.8Inflation assumption being 0.50% lower (26.4) (1.4) (27.8)Mortality assumption life expectancy at age 65 being 1 year higher 15.7 3.1 18.8
The average age of active participants in the UK schemes at 31st December 2018 was 52 years (2017: 52 years) and in the overseas schemes 51 years (2017: 50 years).
Share-based payments Disclosures of the share-based payments offered to employees are set out below. More detail on each scheme is given in the Annual Report on Remuneration 2018 on pages 95 to 109. The charge to the Income Statement in respect of share-based payments is made up as follows:
2018 £m
2017 £m
Performance Share Plan 4.7 3.7Employee Share Ownership Plan 1.0 0.9Total expense recognised in Income Statement 5.7 4.6
Share option schemeThe Group operates equity-settled share option schemes for employees, although no grants have been made since 2011 because awards have been made using the Group’s Performance Share Plan instead. Awards were determined by the Remuneration Committee whose objective was to align the interests of employees with those of shareholders by giving an incentive linked to added shareholder value. Options are subject to performance conditions, which if met make the options exercisable between the third and tenth anniversary of the date of grant. For options granted before 2007 the performance condition is an increase in earnings per share (EPS) of more than 9% greater than the increase in the UK Retail Price Index over a consecutive three-year period between grant and ten years from date of grant. From 2007 the performance condition needs to be met over the three-year period from 1st January prior to the date of the grant. If the condition is not met at the end of the three-year period the option will lapse.
The share options granted have been measured using the Present Economic Value (PEV) valuation methodology.
The number and weighted average exercise prices of share options are as follows:
Option (exercise price) Outstanding at
start of yearGranted during
yearExercised
during yearLapsed during
yearOutstanding at
end of year
2008 grant (959.0p) 11,000 – (11,000) – –2009 grant (765.0p) 4,576 – (575) – 4,0012010 grant (1366.0p) 24,500 – (4,404) – 20,0962011 grant (1873.0p) 61,501 – (7,100) – 54,401
101,577 – (23,079) – 78,498Weighted average exercise price £16.02 £13.13 £16.87Weighted average contractual life remaining 1.9
Performance conditions in respect of all exercisable shares have been met. The number of shares exercisable at 31st December 2018 is 78,498 (2017: 101,577). The weighted average share price during the period was £62.63 (2017: £52.55).
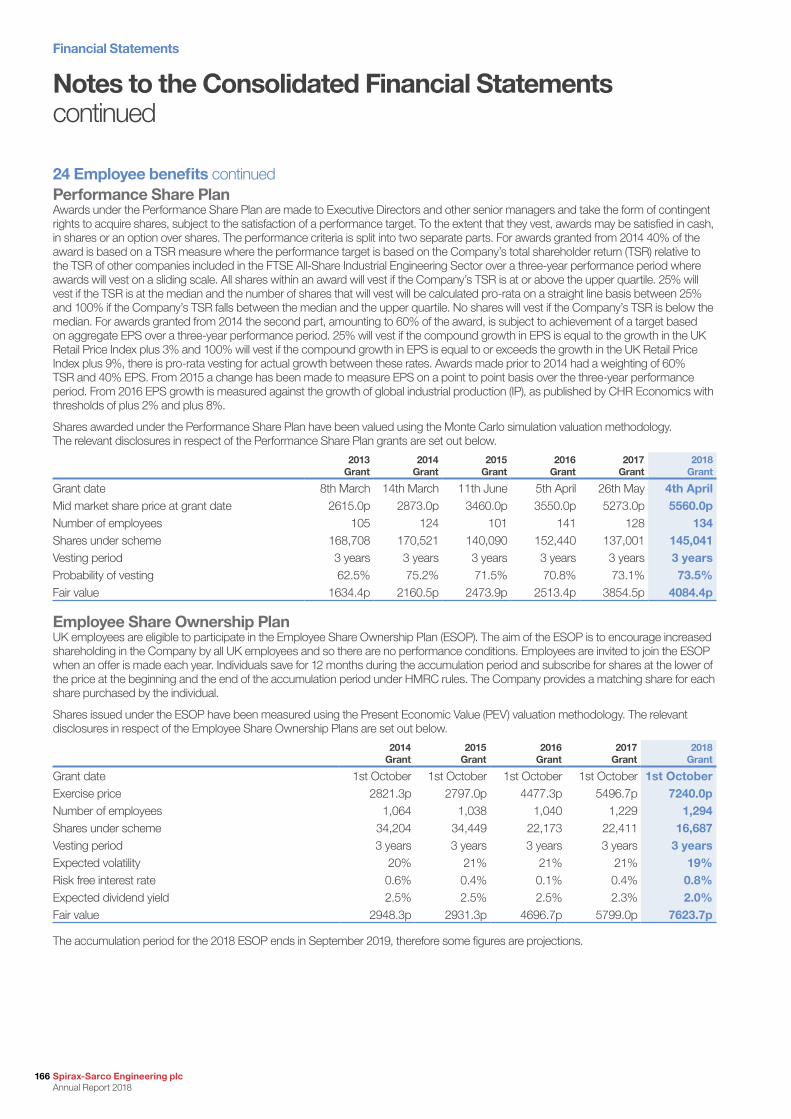
Financial Statements
166 Spirax-Sarco Engineering plc Annual Report 2018
Notes to the Consolidated Financial Statements continued
24 Employee benefits continuedPerformance Share PlanAwards under the Performance Share Plan are made to Executive Directors and other senior managers and take the form of contingent rights to acquire shares, subject to the satisfaction of a performance target. To the extent that they vest, awards may be satisfied in cash, in shares or an option over shares. The performance criteria is split into two separate parts. For awards granted from 2014 40% of the award is based on a TSR measure where the performance target is based on the Company’s total shareholder return (TSR) relative to the TSR of other companies included in the FTSE All-Share Industrial Engineering Sector over a three-year performance period where awards will vest on a sliding scale. All shares within an award will vest if the Company’s TSR is at or above the upper quartile. 25% will vest if the TSR is at the median and the number of shares that will vest will be calculated pro-rata on a straight line basis between 25% and 100% if the Company’s TSR falls between the median and the upper quartile. No shares will vest if the Company’s TSR is below the median. For awards granted from 2014 the second part, amounting to 60% of the award, is subject to achievement of a target based on aggregate EPS over a three-year performance period. 25% will vest if the compound growth in EPS is equal to the growth in the UK Retail Price Index plus 3% and 100% will vest if the compound growth in EPS is equal to or exceeds the growth in the UK Retail Price Index plus 9%, there is pro-rata vesting for actual growth between these rates. Awards made prior to 2014 had a weighting of 60% TSR and 40% EPS. From 2015 a change has been made to measure EPS on a point to point basis over the three-year performance period. From 2016 EPS growth is measured against the growth of global industrial production (IP), as published by CHR Economics with thresholds of plus 2% and plus 8%.
Shares awarded under the Performance Share Plan have been valued using the Monte Carlo simulation valuation methodology. The relevant disclosures in respect of the Performance Share Plan grants are set out below.
2013 Grant
2014 Grant
2015 Grant
2016 Grant
2017 Grant
2018 Grant
Grant date 8th March 14th March 11th June 5th April 26th May 4th AprilMid market share price at grant date 2615.0p 2873.0p 3460.0p 3550.0p 5273.0p 5560.0pNumber of employees 105 124 101 141 128 134Shares under scheme 168,708 170,521 140,090 152,440 137,001 145,041Vesting period 3 years 3 years 3 years 3 years 3 years 3 yearsProbability of vesting 62.5% 75.2% 71.5% 70.8% 73.1% 73.5%Fair value 1634.4p 2160.5p 2473.9p 2513.4p 3854.5p 4084.4p
Employee Share Ownership PlanUK employees are eligible to participate in the Employee Share Ownership Plan (ESOP). The aim of the ESOP is to encourage increased shareholding in the Company by all UK employees and so there are no performance conditions. Employees are invited to join the ESOP when an offer is made each year. Individuals save for 12 months during the accumulation period and subscribe for shares at the lower of the price at the beginning and the end of the accumulation period under HMRC rules. The Company provides a matching share for each share purchased by the individual.
Shares issued under the ESOP have been measured using the Present Economic Value (PEV) valuation methodology. The relevant disclosures in respect of the Employee Share Ownership Plans are set out below.
2014 Grant
2015 Grant
2016 Grant
2017 Grant
2018 Grant
Grant date 1st October 1st October 1st October 1st October 1st OctoberExercise price 2821.3p 2797.0p 4477.3p 5496.7p 7240.0pNumber of employees 1,064 1,038 1,040 1,229 1,294Shares under scheme 34,204 34,449 22,173 22,411 16,687Vesting period 3 years 3 years 3 years 3 years 3 yearsExpected volatility 20% 21% 21% 21% 19%Risk free interest rate 0.6% 0.4% 0.1% 0.4% 0.8%Expected dividend yield 2.5% 2.5% 2.5% 2.3% 2.0%Fair value 2948.3p 2931.3p 4696.7p 5799.0p 7623.7p
The accumulation period for the 2018 ESOP ends in September 2019, therefore some figures are projections.
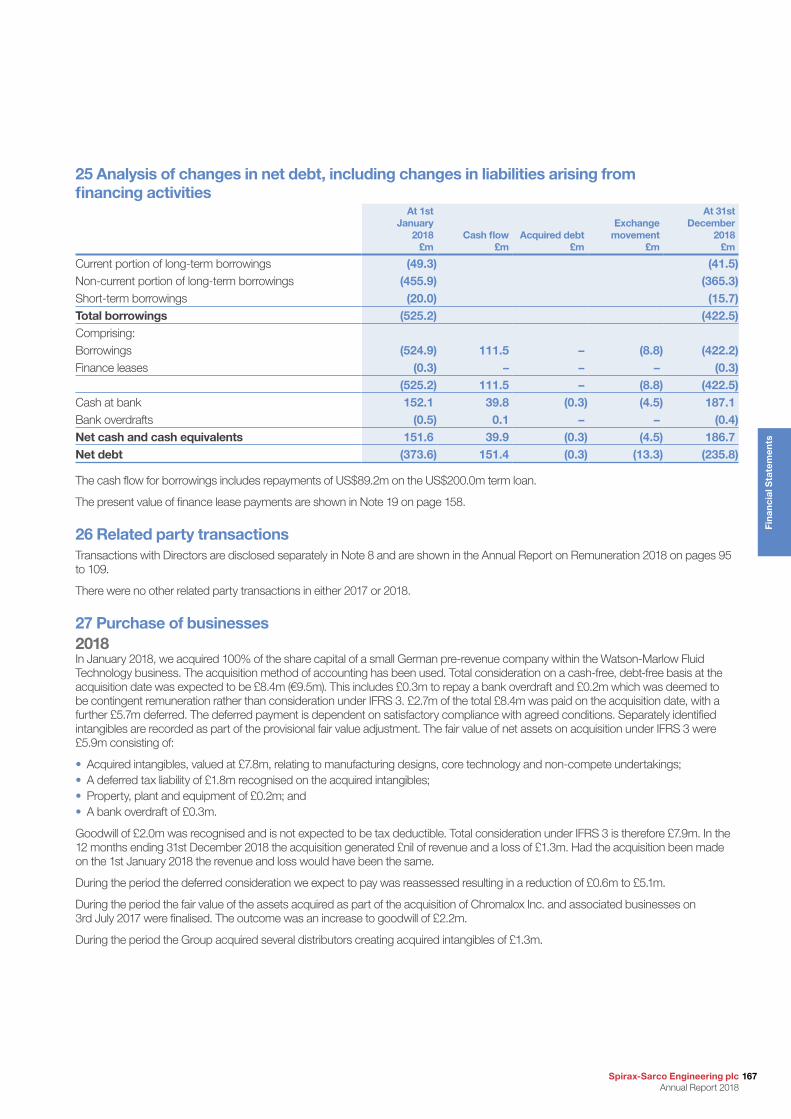
Spirax-Sarco Engineering plc Annual Report 2018
167
Fin
anci
al S
tate
men
ts
25 Analysis of changes in net debt, including changes in liabilities arising from financing activities
At 1st January
2018 £m
Cash flow £m
Acquired debt£m
Exchange movement
£m
At 31st December
2018 £m
Current portion of long-term borrowings (49.3) (41.5)Non-current portion of long-term borrowings (455.9) (365.3)Short-term borrowings (20.0) (15.7)Total borrowings (525.2) (422.5)Comprising:Borrowings (524.9) 111.5 – (8.8) (422.2)Finance leases (0.3) – – – (0.3)
(525.2) 111.5 – (8.8) (422.5)Cash at bank 152.1 39.8 (0.3) (4.5) 187.1Bank overdrafts (0.5) 0.1 – – (0.4)Net cash and cash equivalents 151.6 39.9 (0.3) (4.5) 186.7Net debt (373.6) 151.4 (0.3) (13.3) (235.8)
The cash flow for borrowings includes repayments of US$89.2m on the US$200.0m term loan.
The present value of finance lease payments are shown in Note 19 on page 158.
26 Related party transactionsTransactions with Directors are disclosed separately in Note 8 and are shown in the Annual Report on Remuneration 2018 on pages 95 to 109.
There were no other related party transactions in either 2017 or 2018.
27 Purchase of businesses2018In January 2018, we acquired 100% of the share capital of a small German pre-revenue company within the Watson-Marlow Fluid Technology business. The acquisition method of accounting has been used. Total consideration on a cash-free, debt-free basis at the acquisition date was expected to be £8.4m (€9.5m). This includes £0.3m to repay a bank overdraft and £0.2m which was deemed to be contingent remuneration rather than consideration under IFRS 3. £2.7m of the total £8.4m was paid on the acquisition date, with a further £5.7m deferred. The deferred payment is dependent on satisfactory compliance with agreed conditions. Separately identified intangibles are recorded as part of the provisional fair value adjustment. The fair value of net assets on acquisition under IFRS 3 were £5.9m consisting of:
• Acquired intangibles, valued at £7.8m, relating to manufacturing designs, core technology and non-compete undertakings;• A deferred tax liability of £1.8m recognised on the acquired intangibles;• Property, plant and equipment of £0.2m; and• A bank overdraft of £0.3m.
Goodwill of £2.0m was recognised and is not expected to be tax deductible. Total consideration under IFRS 3 is therefore £7.9m. In the 12 months ending 31st December 2018 the acquisition generated £nil of revenue and a loss of £1.3m. Had the acquisition been made on the 1st January 2018 the revenue and loss would have been the same.
During the period the deferred consideration we expect to pay was reassessed resulting in a reduction of £0.6m to £5.1m.
During the period the fair value of the assets acquired as part of the acquisition of Chromalox Inc. and associated businesses on 3rd July 2017 were finalised. The outcome was an increase to goodwill of £2.2m.
During the period the Group acquired several distributors creating acquired intangibles of £1.3m.
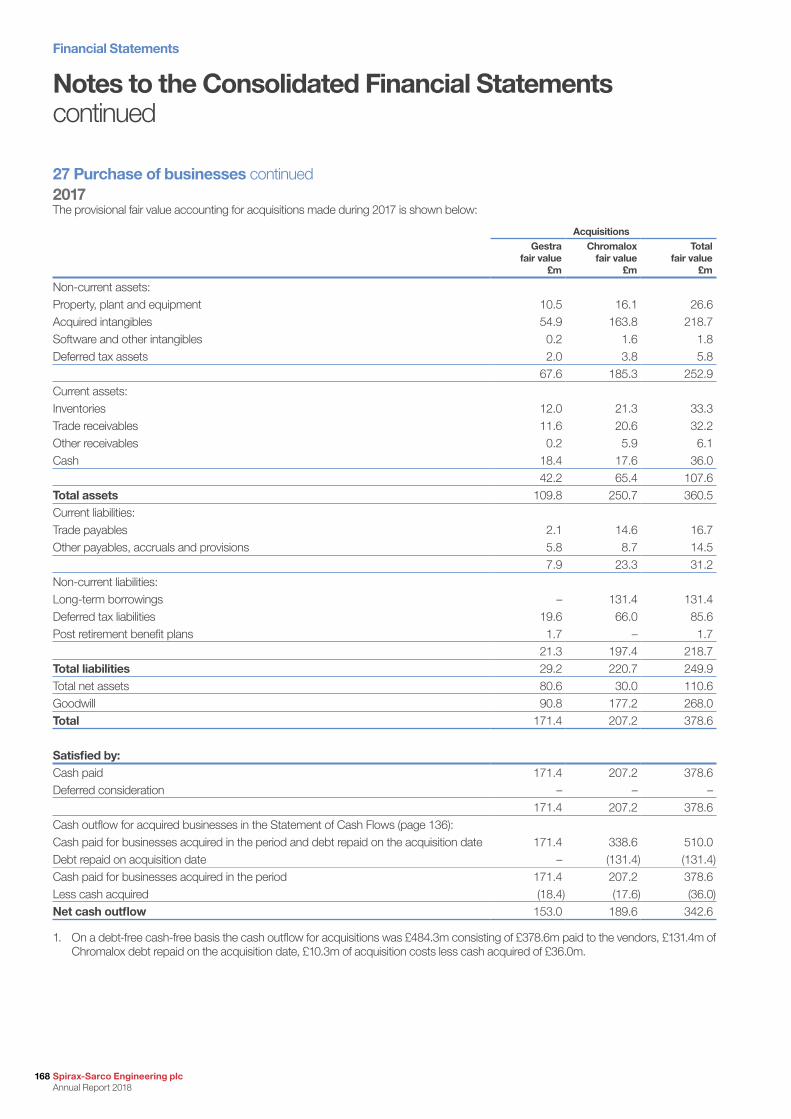
Financial Statements
168 Spirax-Sarco Engineering plc Annual Report 2018
Notes to the Consolidated Financial Statements continued
27 Purchase of businesses continued2017The provisional fair value accounting for acquisitions made during 2017 is shown below:
AcquisitionsGestra
fair value £m
Chromaloxfair value
£m
Total fair value
£m
Non-current assets:Property, plant and equipment 10.5 16.1 26.6Acquired intangibles 54.9 163.8 218.7Software and other intangibles 0.2 1.6 1.8Deferred tax assets 2.0 3.8 5.8
67.6 185.3 252.9Current assets:Inventories 12.0 21.3 33.3Trade receivables 11.6 20.6 32.2Other receivables 0.2 5.9 6.1Cash 18.4 17.6 36.0
42.2 65.4 107.6Total assets 109.8 250.7 360.5Current liabilities:Trade payables 2.1 14.6 16.7Other payables, accruals and provisions 5.8 8.7 14.5
7.9 23.3 31.2Non-current liabilities:Long-term borrowings – 131.4 131.4Deferred tax liabilities 19.6 66.0 85.6Post retirement benefit plans 1.7 – 1.7
21.3 197.4 218.7Total liabilities 29.2 220.7 249.9Total net assets 80.6 30.0 110.6Goodwill 90.8 177.2 268.0Total 171.4 207.2 378.6
Satisfied by:Cash paid 171.4 207.2 378.6Deferred consideration – – –
171.4 207.2 378.6Cash outflow for acquired businesses in the Statement of Cash Flows (page 136):Cash paid for businesses acquired in the period and debt repaid on the acquisition date 171.4 338.6 510.0Debt repaid on acquisition date – (131.4) (131.4)Cash paid for businesses acquired in the period 171.4 207.2 378.6Less cash acquired (18.4) (17.6) (36.0)Net cash outflow 153.0 189.6 342.6
1. On a debt-free cash-free basis the cash outflow for acquisitions was £484.3m consisting of £378.6m paid to the vendors, £131.4m of Chromalox debt repaid on the acquisition date, £10.3m of acquisition costs less cash acquired of £36.0m.
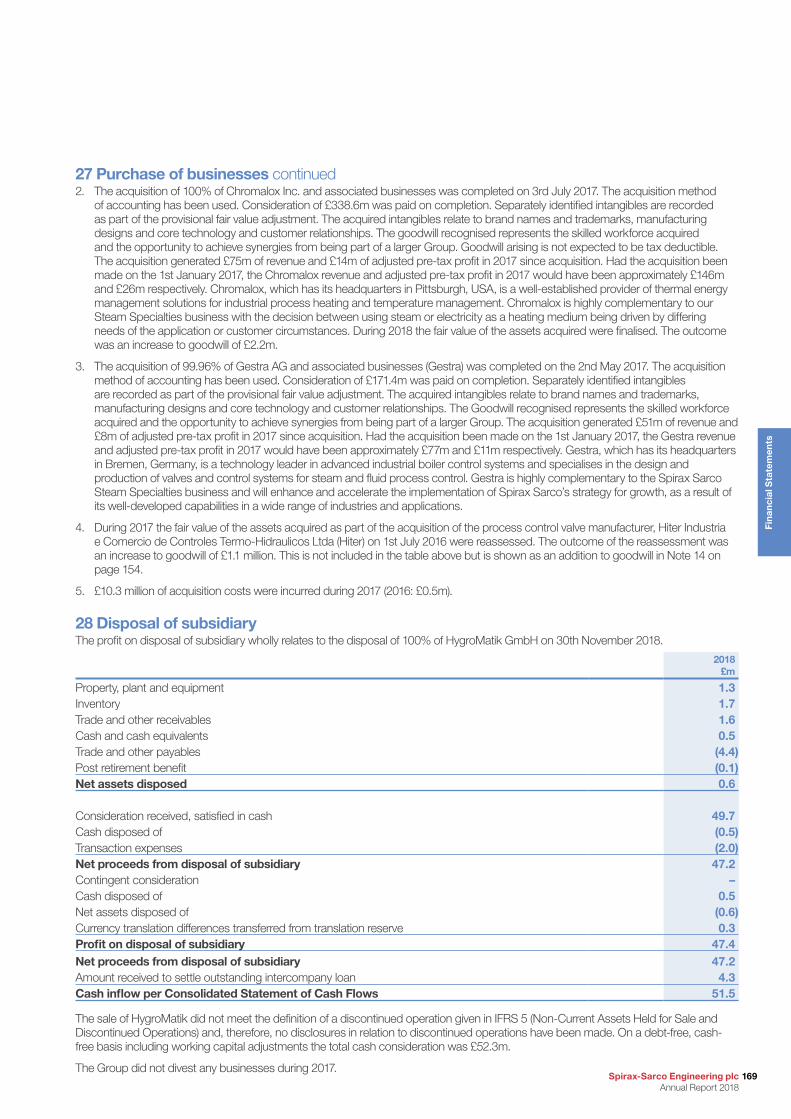
Spirax-Sarco Engineering plc Annual Report 2018
169
Fin
anci
al S
tate
men
ts
27 Purchase of businesses continued2. The acquisition of 100% of Chromalox Inc. and associated businesses was completed on 3rd July 2017. The acquisition method
of accounting has been used. Consideration of £338.6m was paid on completion. Separately identified intangibles are recorded as part of the provisional fair value adjustment. The acquired intangibles relate to brand names and trademarks, manufacturing designs and core technology and customer relationships. The goodwill recognised represents the skilled workforce acquired and the opportunity to achieve synergies from being part of a larger Group. Goodwill arising is not expected to be tax deductible. The acquisition generated £75m of revenue and £14m of adjusted pre-tax profit in 2017 since acquisition. Had the acquisition been made on the 1st January 2017, the Chromalox revenue and adjusted pre-tax profit in 2017 would have been approximately £146m and £26m respectively. Chromalox, which has its headquarters in Pittsburgh, USA, is a well-established provider of thermal energy management solutions for industrial process heating and temperature management. Chromalox is highly complementary to our Steam Specialties business with the decision between using steam or electricity as a heating medium being driven by differing needs of the application or customer circumstances. During 2018 the fair value of the assets acquired were finalised. The outcome was an increase to goodwill of £2.2m.
3. The acquisition of 99.96% of Gestra AG and associated businesses (Gestra) was completed on the 2nd May 2017. The acquisition method of accounting has been used. Consideration of £171.4m was paid on completion. Separately identified intangibles are recorded as part of the provisional fair value adjustment. The acquired intangibles relate to brand names and trademarks, manufacturing designs and core technology and customer relationships. The Goodwill recognised represents the skilled workforce acquired and the opportunity to achieve synergies from being part of a larger Group. The acquisition generated £51m of revenue and £8m of adjusted pre-tax profit in 2017 since acquisition. Had the acquisition been made on the 1st January 2017, the Gestra revenue and adjusted pre-tax profit in 2017 would have been approximately £77m and £11m respectively. Gestra, which has its headquarters in Bremen, Germany, is a technology leader in advanced industrial boiler control systems and specialises in the design and production of valves and control systems for steam and fluid process control. Gestra is highly complementary to the Spirax Sarco Steam Specialties business and will enhance and accelerate the implementation of Spirax Sarco’s strategy for growth, as a result of its well-developed capabilities in a wide range of industries and applications.
4. During 2017 the fair value of the assets acquired as part of the acquisition of the process control valve manufacturer, Hiter Industria e Comercio de Controles Termo-Hidraulicos Ltda (Hiter) on 1st July 2016 were reassessed. The outcome of the reassessment was an increase to goodwill of £1.1 million. This is not included in the table above but is shown as an addition to goodwill in Note 14 on page 154.
5. £10.3 million of acquisition costs were incurred during 2017 (2016: £0.5m).
28 Disposal of subsidiaryThe profit on disposal of subsidiary wholly relates to the disposal of 100% of HygroMatik GmbH on 30th November 2018.
2018 £m
Property, plant and equipment 1.3Inventory 1.7Trade and other receivables 1.6Cash and cash equivalents 0.5Trade and other payables (4.4)Post retirement benefit (0.1)Net assets disposed 0.6
Consideration received, satisfied in cash 49.7Cash disposed of (0.5)Transaction expenses (2.0)Net proceeds from disposal of subsidiary 47.2Contingent consideration –Cash disposed of 0.5Net assets disposed of (0.6)Currency translation differences transferred from translation reserve 0.3Profit on disposal of subsidiary 47.4Net proceeds from disposal of subsidiary 47.2Amount received to settle outstanding intercompany loan 4.3Cash inflow per Consolidated Statement of Cash Flows 51.5
The sale of HygroMatik did not meet the definition of a discontinued operation given in IFRS 5 (Non-Current Assets Held for Sale and Discontinued Operations) and, therefore, no disclosures in relation to discontinued operations have been made. On a debt-free, cash-free basis including working capital adjustments the total cash consideration was £52.3m.
The Group did not divest any businesses during 2017.

Financial Statements
170 Spirax-Sarco Engineering plc Annual Report 2018
Notes to the Consolidated Financial Statements continued
29 Derivatives and other financial instrumentsThe Group does not enter into significant derivative transactions. The Group’s principal financial instruments comprise loans, cash and short-term deposits. The main purpose of these financial instruments is to raise finance for the Group’s operations. The Group has various other financial instruments such as trade debtors and trade creditors, which arise directly from its operations. It is, and has been throughout the period under review, the Group’s policy that no trading in financial instruments shall be undertaken.
The main risks arising from the Group’s financial instruments are credit risk, interest rate risk, liquidity risk and foreign currency risk. The Board reviews and agrees policies for managing each of these risks and they are summarised below.
Credit riskThe Group sells products and services to customers around the world and its customer base is extremely varied in size and industry sector. The Group operates credit control policies to assess customers’ credit ratings and provides for any debt that is identified as non-collectable.
Interest rate riskThe Group borrows in desired currencies at both fixed and floating rates of interest as appropriate to the purposes of the borrowing.
Liquidity riskThe Group’s objective is to maintain a balance between continuity of funding and flexibility through the use of overdrafts, loans, facilities and finance leases as appropriate.
Foreign currency riskThe Group has operations around the world and therefore its Consolidated Statement of Financial Position can be affected significantly by movements in the rate of exchange between sterling and various other currencies particularly the US dollar and euro. The Group seeks to mitigate the effect of this structural currency exposure by borrowing in these currencies where appropriate while maintaining a low cost of debt.
The Group also has transactional currency exposures principally as a result of trading between Group companies. Such exposures arise from sales or purchases by an operating unit in currencies other than the unit’s functional currency. Net cash flows between any two currencies of less than £1.0 million per annum would not usually be considered sufficiently material to warrant forward cover. Forward cover is not taken out more than 24 months in advance or for more than 90% of the next 12 months and 60% of the following 12 months’ forecast exposure.
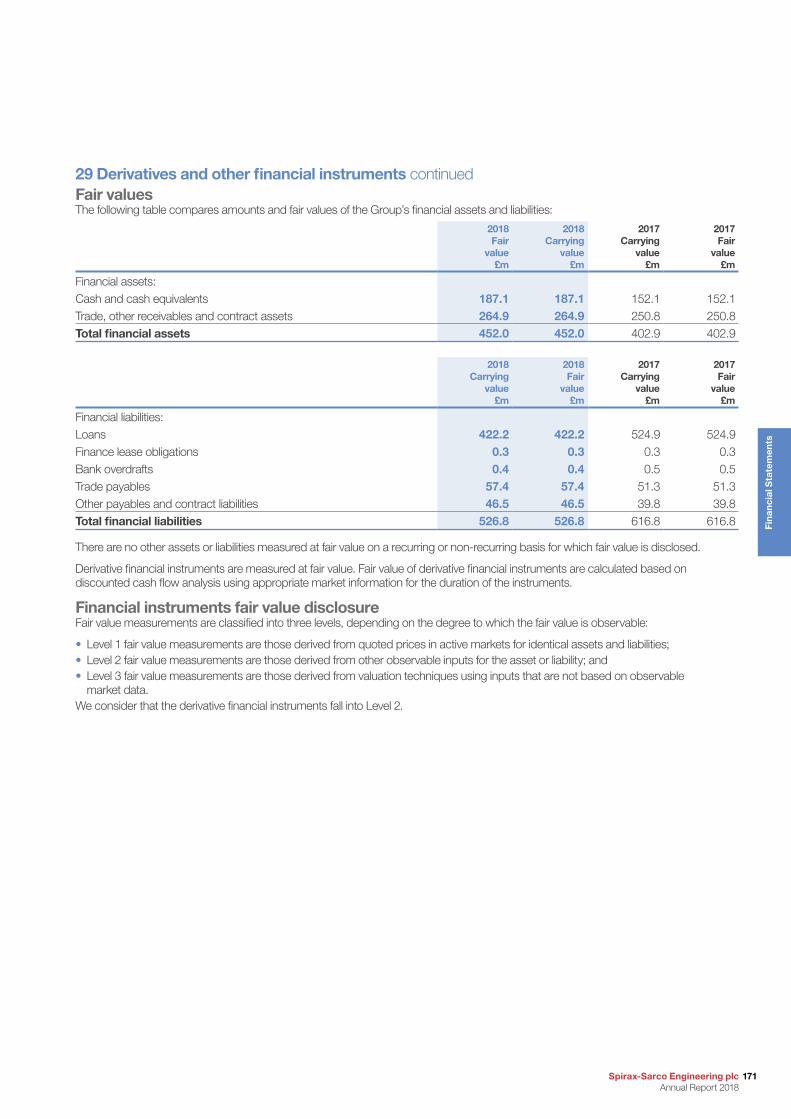
Spirax-Sarco Engineering plc Annual Report 2018
171
Fin
anci
al S
tate
men
ts
29 Derivatives and other financial instruments continuedFair valuesThe following table compares amounts and fair values of the Group’s financial assets and liabilities:
2018 Fair
value £m
2018 Carrying
value £m
2017 Carrying
value £m
2017 Fair
value £m
Financial assets:Cash and cash equivalents 187.1 187.1 152.1 152.1Trade, other receivables and contract assets 264.9 264.9 250.8 250.8Total financial assets 452.0 452.0 402.9 402.9
2018 Carrying
value £m
2018 Fair
value £m
2017 Carrying
value £m
2017 Fair
value £m
Financial liabilities:Loans 422.2 422.2 524.9 524.9Finance lease obligations 0.3 0.3 0.3 0.3Bank overdrafts 0.4 0.4 0.5 0.5Trade payables 57.4 57.4 51.3 51.3Other payables and contract liabilities 46.5 46.5 39.8 39.8Total financial liabilities 526.8 526.8 616.8 616.8
There are no other assets or liabilities measured at fair value on a recurring or non-recurring basis for which fair value is disclosed.
Derivative financial instruments are measured at fair value. Fair value of derivative financial instruments are calculated based on discounted cash flow analysis using appropriate market information for the duration of the instruments.
Financial instruments fair value disclosureFair value measurements are classified into three levels, depending on the degree to which the fair value is observable:
• Level 1 fair value measurements are those derived from quoted prices in active markets for identical assets and liabilities;• Level 2 fair value measurements are those derived from other observable inputs for the asset or liability; and• Level 3 fair value measurements are those derived from valuation techniques using inputs that are not based on observable
market data.We consider that the derivative financial instruments fall into Level 2.
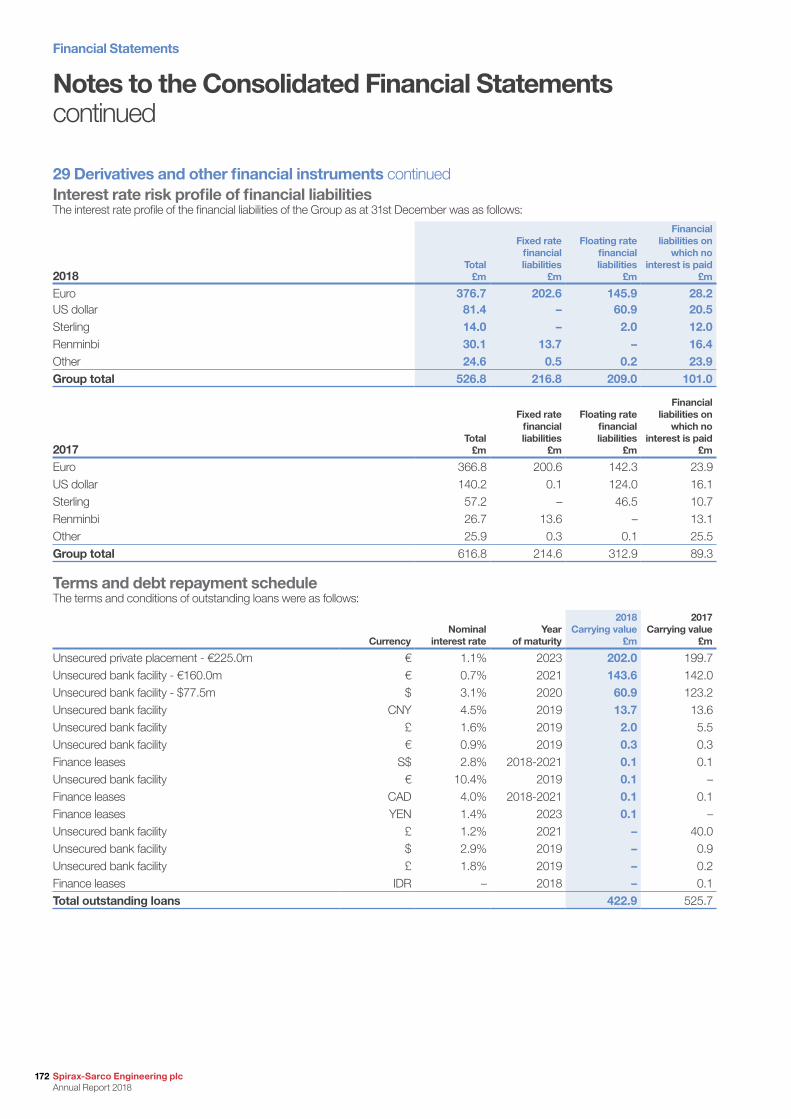
Financial Statements
172 Spirax-Sarco Engineering plc Annual Report 2018
Notes to the Consolidated Financial Statements continued
29 Derivatives and other financial instruments continuedInterest rate risk profile of financial liabilitiesThe interest rate profile of the financial liabilities of the Group as at 31st December was as follows:
2018Total
£m
Fixed rate financial liabilities
£m
Floating rate financial liabilities
£m
Financial liabilities on
which no interest is paid
£m
Euro 376.7 202.6 145.9 28.2US dollar 81.4 – 60.9 20.5Sterling 14.0 – 2.0 12.0Renminbi 30.1 13.7 – 16.4Other 24.6 0.5 0.2 23.9Group total 526.8 216.8 209.0 101.0
2017Total
£m
Fixed rate financial liabilities
£m
Floating rate financial liabilities
£m
Financial liabilities on
which no interest is paid
£m
Euro 366.8 200.6 142.3 23.9US dollar 140.2 0.1 124.0 16.1Sterling 57.2 – 46.5 10.7Renminbi 26.7 13.6 – 13.1Other 25.9 0.3 0.1 25.5Group total 616.8 214.6 312.9 89.3
Terms and debt repayment scheduleThe terms and conditions of outstanding loans were as follows:
CurrencyNominal
interest rateYear
of maturity
2018 Carrying value
£m
2017 Carrying value
£m
Unsecured private placement - €225.0m € 1.1% 2023 202.0 199.7Unsecured bank facility - €160.0m € 0.7% 2021 143.6 142.0Unsecured bank facility - $77.5m $ 3.1% 2020 60.9 123.2Unsecured bank facility CNY 4.5% 2019 13.7 13.6Unsecured bank facility £ 1.6% 2019 2.0 5.5Unsecured bank facility € 0.9% 2019 0.3 0.3Finance leases S$ 2.8% 2018-2021 0.1 0.1Unsecured bank facility € 10.4% 2019 0.1 –Finance leases CAD 4.0% 2018-2021 0.1 0.1Finance leases YEN 1.4% 2023 0.1 –Unsecured bank facility £ 1.2% 2021 – 40.0Unsecured bank facility $ 2.9% 2019 – 0.9Unsecured bank facility £ 1.8% 2019 – 0.2Finance leases IDR – 2018 – 0.1Total outstanding loans 422.9 525.7
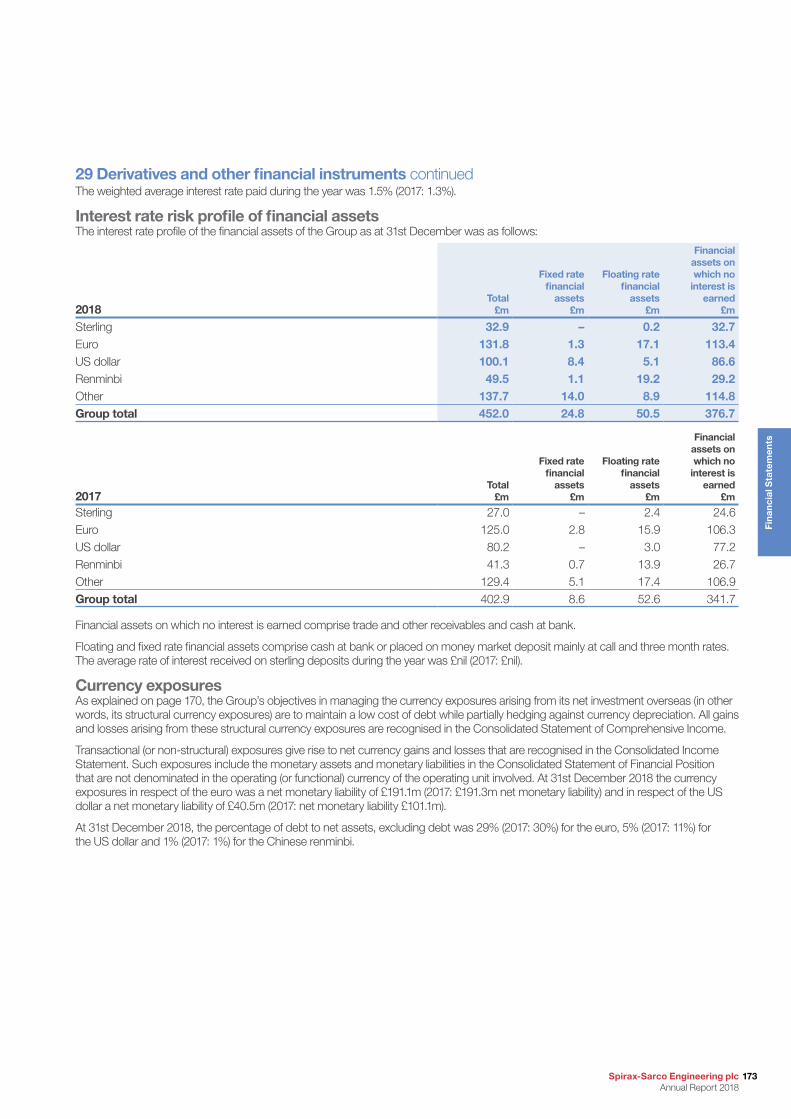
Spirax-Sarco Engineering plc Annual Report 2018
173
Fin
anci
al S
tate
men
ts
29 Derivatives and other financial instruments continuedThe weighted average interest rate paid during the year was 1.5% (2017: 1.3%).
Interest rate risk profile of financial assetsThe interest rate profile of the financial assets of the Group as at 31st December was as follows:
2018Total
£m
Fixed rate financial
assets £m
Floating rate financial
assets £m
Financial assets on which no
interest is earned
£m
Sterling 32.9 – 0.2 32.7Euro 131.8 1.3 17.1 113.4US dollar 100.1 8.4 5.1 86.6Renminbi 49.5 1.1 19.2 29.2Other 137.7 14.0 8.9 114.8Group total 452.0 24.8 50.5 376.7
2017Total
£m
Fixed rate financial
assets £m
Floating rate financial
assets £m
Financial assets on which no
interest is earned
£m
Sterling 27.0 – 2.4 24.6Euro 125.0 2.8 15.9 106.3US dollar 80.2 – 3.0 77.2Renminbi 41.3 0.7 13.9 26.7Other 129.4 5.1 17.4 106.9Group total 402.9 8.6 52.6 341.7
Financial assets on which no interest is earned comprise trade and other receivables and cash at bank.
Floating and fixed rate financial assets comprise cash at bank or placed on money market deposit mainly at call and three month rates. The average rate of interest received on sterling deposits during the year was £nil (2017: £nil).
Currency exposuresAs explained on page 170, the Group’s objectives in managing the currency exposures arising from its net investment overseas (in other words, its structural currency exposures) are to maintain a low cost of debt while partially hedging against currency depreciation. All gains and losses arising from these structural currency exposures are recognised in the Consolidated Statement of Comprehensive Income.
Transactional (or non-structural) exposures give rise to net currency gains and losses that are recognised in the Consolidated Income Statement. Such exposures include the monetary assets and monetary liabilities in the Consolidated Statement of Financial Position that are not denominated in the operating (or functional) currency of the operating unit involved. At 31st December 2018 the currency exposures in respect of the euro was a net monetary liability of £191.1m (2017: £191.3m net monetary liability) and in respect of the US dollar a net monetary liability of £40.5m (2017: net monetary liability £101.1m).
At 31st December 2018, the percentage of debt to net assets, excluding debt was 29% (2017: 30%) for the euro, 5% (2017: 11%) for the US dollar and 1% (2017: 1%) for the Chinese renminbi.
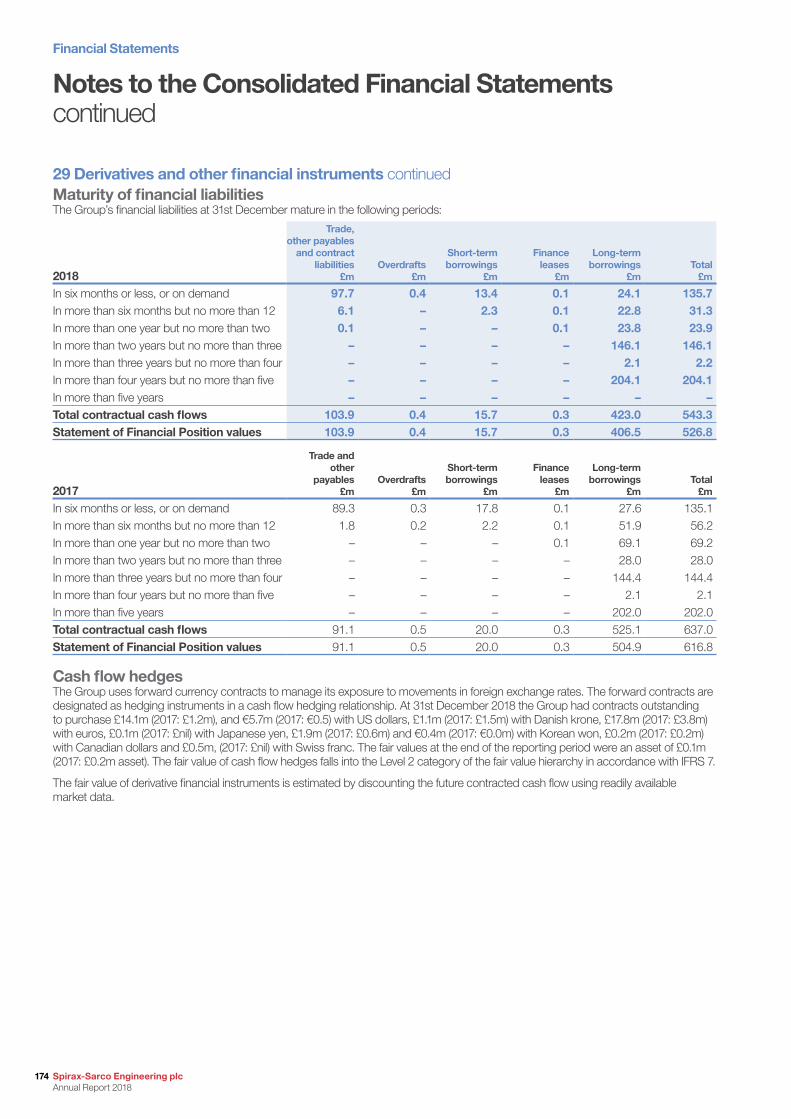
Financial Statements
174 Spirax-Sarco Engineering plc Annual Report 2018
29 Derivatives and other financial instruments continuedMaturity of financial liabilitiesThe Group’s financial liabilities at 31st December mature in the following periods:
2018
Trade, other payables
and contract liabilities
£mOverdrafts
£m
Short-term borrowings
£m
Finance leases
£m
Long-term borrowings
£mTotal
£m
In six months or less, or on demand 97.7 0.4 13.4 0.1 24.1 135.7In more than six months but no more than 12 6.1 – 2.3 0.1 22.8 31.3In more than one year but no more than two 0.1 – – 0.1 23.8 23.9In more than two years but no more than three – – – – 146.1 146.1In more than three years but no more than four – – – – 2.1 2.2In more than four years but no more than five – – – – 204.1 204.1In more than five years – – – – – –Total contractual cash flows 103.9 0.4 15.7 0.3 423.0 543.3Statement of Financial Position values 103.9 0.4 15.7 0.3 406.5 526.8
2017
Trade and other
payables £m
Overdrafts £m
Short-term borrowings
£m
Finance leases
£m
Long-term borrowings
£mTotal
£m
In six months or less, or on demand 89.3 0.3 17.8 0.1 27.6 135.1In more than six months but no more than 12 1.8 0.2 2.2 0.1 51.9 56.2In more than one year but no more than two – – – 0.1 69.1 69.2In more than two years but no more than three – – – – 28.0 28.0In more than three years but no more than four – – – – 144.4 144.4In more than four years but no more than five – – – – 2.1 2.1In more than five years – – – – 202.0 202.0Total contractual cash flows 91.1 0.5 20.0 0.3 525.1 637.0Statement of Financial Position values 91.1 0.5 20.0 0.3 504.9 616.8
Cash flow hedgesThe Group uses forward currency contracts to manage its exposure to movements in foreign exchange rates. The forward contracts are designated as hedging instruments in a cash flow hedging relationship. At 31st December 2018 the Group had contracts outstanding to purchase £14.1m (2017: £1.2m), and €5.7m (2017: €0.5) with US dollars, £1.1m (2017: £1.5m) with Danish krone, £17.8m (2017: £3.8m) with euros, £0.1m (2017: £nil) with Japanese yen, £1.9m (2017: £0.6m) and €0.4m (2017: €0.0m) with Korean won, £0.2m (2017: £0.2m) with Canadian dollars and £0.5m, (2017: £nil) with Swiss franc. The fair values at the end of the reporting period were an asset of £0.1m (2017: £0.2m asset). The fair value of cash flow hedges falls into the Level 2 category of the fair value hierarchy in accordance with IFRS 7.
The fair value of derivative financial instruments is estimated by discounting the future contracted cash flow using readily available market data.
Notes to the Consolidated Financial Statements continued
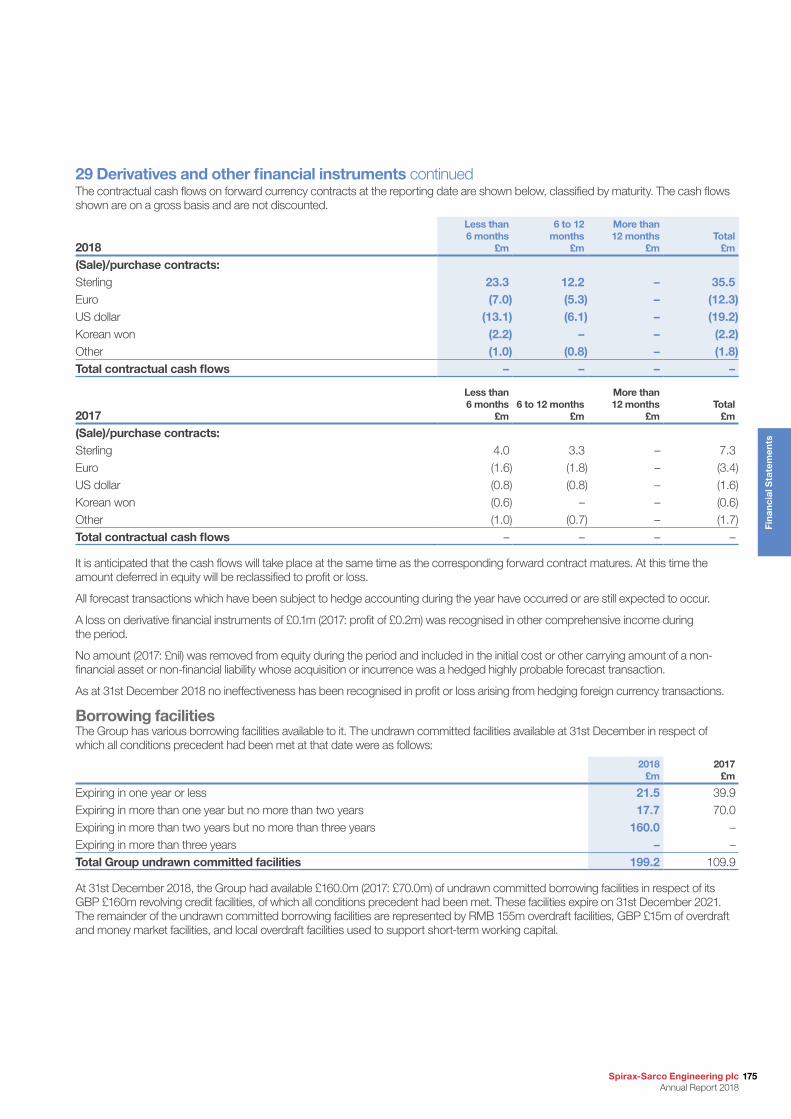
Spirax-Sarco Engineering plc Annual Report 2018
175
Fin
anci
al S
tate
men
ts
29 Derivatives and other financial instruments continuedThe contractual cash flows on forward currency contracts at the reporting date are shown below, classified by maturity. The cash flows shown are on a gross basis and are not discounted.
2018
Less than 6 months
£m
6 to 12 months
£m
More than 12 months
£mTotal
£m
(Sale)/purchase contracts: Sterling 23.3 12.2 – 35.5Euro (7.0) (5.3) – (12.3)US dollar (13.1) (6.1) – (19.2)Korean won (2.2) – – (2.2)Other (1.0) (0.8) – (1.8)Total contractual cash flows – – – –
2017
Less than 6 months
£m6 to 12 months
£m
More than 12 months
£mTotal
£m
(Sale)/purchase contracts: Sterling 4.0 3.3 – 7.3Euro (1.6) (1.8) – (3.4)US dollar (0.8) (0.8) – (1.6)Korean won (0.6) – – (0.6)Other (1.0) (0.7) – (1.7)Total contractual cash flows – – – –
It is anticipated that the cash flows will take place at the same time as the corresponding forward contract matures. At this time the amount deferred in equity will be reclassified to profit or loss.
All forecast transactions which have been subject to hedge accounting during the year have occurred or are still expected to occur.
A loss on derivative financial instruments of £0.1m (2017: profit of £0.2m) was recognised in other comprehensive income during the period.
No amount (2017: £nil) was removed from equity during the period and included in the initial cost or other carrying amount of a non-financial asset or non-financial liability whose acquisition or incurrence was a hedged highly probable forecast transaction.
As at 31st December 2018 no ineffectiveness has been recognised in profit or loss arising from hedging foreign currency transactions.
Borrowing facilitiesThe Group has various borrowing facilities available to it. The undrawn committed facilities available at 31st December in respect of which all conditions precedent had been met at that date were as follows:
2018 £m
2017 £m
Expiring in one year or less 21.5 39.9Expiring in more than one year but no more than two years 17.7 70.0Expiring in more than two years but no more than three years 160.0 –Expiring in more than three years – –Total Group undrawn committed facilities 199.2 109.9
At 31st December 2018, the Group had available £160.0m (2017: £70.0m) of undrawn committed borrowing facilities in respect of its GBP £160m revolving credit facilities, of which all conditions precedent had been met. These facilities expire on 31st December 2021. The remainder of the undrawn committed borrowing facilities are represented by RMB 155m overdraft facilities, GBP £15m of overdraft and money market facilities, and local overdraft facilities used to support short-term working capital.
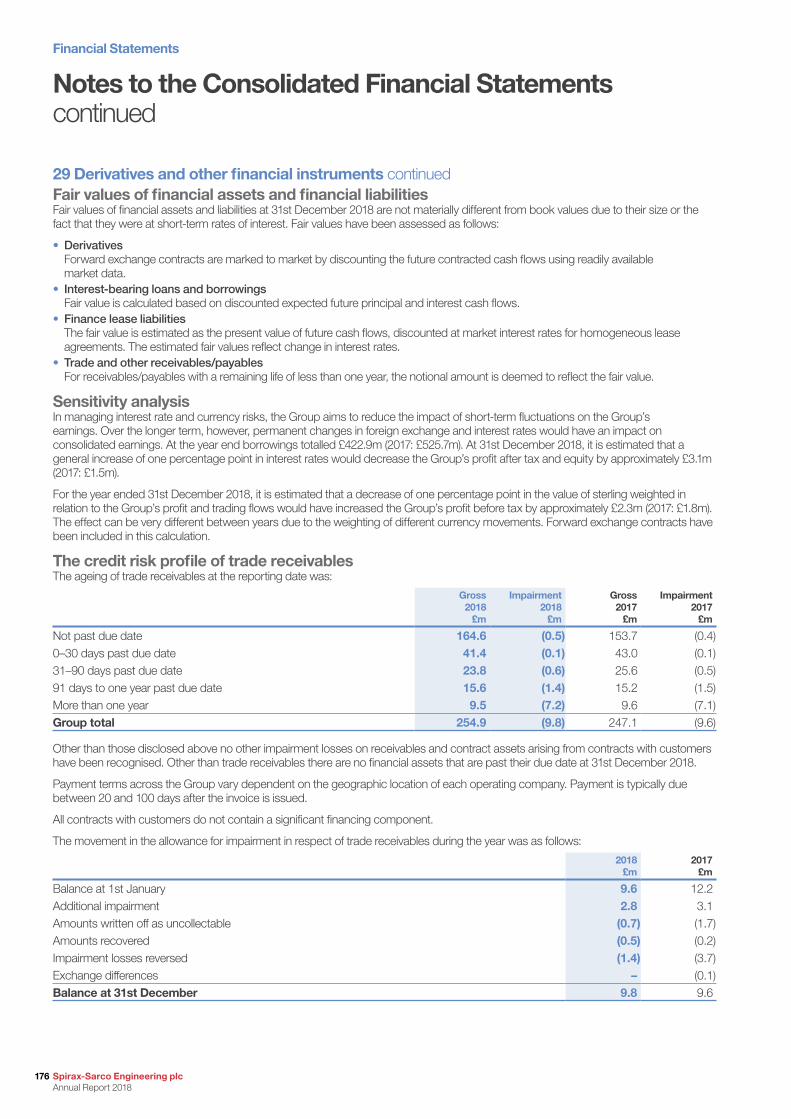
Financial Statements
176 Spirax-Sarco Engineering plc Annual Report 2018
29 Derivatives and other financial instruments continuedFair values of financial assets and financial liabilitiesFair values of financial assets and liabilities at 31st December 2018 are not materially different from book values due to their size or the fact that they were at short-term rates of interest. Fair values have been assessed as follows:
• Derivatives Forward exchange contracts are marked to market by discounting the future contracted cash flows using readily available market data.
• Interest-bearing loans and borrowings Fair value is calculated based on discounted expected future principal and interest cash flows.
• Finance lease liabilities The fair value is estimated as the present value of future cash flows, discounted at market interest rates for homogeneous lease agreements. The estimated fair values reflect change in interest rates.
• Trade and other receivables/payables For receivables/payables with a remaining life of less than one year, the notional amount is deemed to reflect the fair value.
Sensitivity analysisIn managing interest rate and currency risks, the Group aims to reduce the impact of short-term fluctuations on the Group’s earnings. Over the longer term, however, permanent changes in foreign exchange and interest rates would have an impact on consolidated earnings. At the year end borrowings totalled £422.9m (2017: £525.7m). At 31st December 2018, it is estimated that a general increase of one percentage point in interest rates would decrease the Group’s profit after tax and equity by approximately £3.1m (2017: £1.5m).
For the year ended 31st December 2018, it is estimated that a decrease of one percentage point in the value of sterling weighted in relation to the Group’s profit and trading flows would have increased the Group’s profit before tax by approximately £2.3m (2017: £1.8m). The effect can be very different between years due to the weighting of different currency movements. Forward exchange contracts have been included in this calculation.
The credit risk profile of trade receivablesThe ageing of trade receivables at the reporting date was:
Gross 2018
£m
Impairment 2018
£m
Gross 2017
£m
Impairment 2017
£m
Not past due date 164.6 (0.5) 153.7 (0.4)0–30 days past due date 41.4 (0.1) 43.0 (0.1)31–90 days past due date 23.8 (0.6) 25.6 (0.5)91 days to one year past due date 15.6 (1.4) 15.2 (1.5)More than one year 9.5 (7.2) 9.6 (7.1)Group total 254.9 (9.8) 247.1 (9.6)
Other than those disclosed above no other impairment losses on receivables and contract assets arising from contracts with customers have been recognised. Other than trade receivables there are no financial assets that are past their due date at 31st December 2018.
Payment terms across the Group vary dependent on the geographic location of each operating company. Payment is typically due between 20 and 100 days after the invoice is issued.
All contracts with customers do not contain a significant financing component.
The movement in the allowance for impairment in respect of trade receivables during the year was as follows:
2018 £m
2017 £m
Balance at 1st January 9.6 12.2Additional impairment 2.8 3.1Amounts written off as uncollectable (0.7) (1.7)Amounts recovered (0.5) (0.2)Impairment losses reversed (1.4) (3.7)Exchange differences – (0.1)Balance at 31st December 9.8 9.6
Notes to the Consolidated Financial Statements continued
Spirax-Sarco Engineering plc Annual Report 2018
177
Fin
anci
al S
tate
men
ts
30 Events after the balance sheet date On 18th February 2019 we announced that we had entered into exclusive negotiations with a view to acquiring 100% of the share capital of Thermocoax Developpement (Thermocoax), based in France, for a debt-free, cash-free consideration of €158m (£139m).
Thermocoax is a leading designer and manufacturer of highly engineered electrical thermal solutions for critical applications in high added value industries.
We anticipate that Thermocoax will become part of our Chromalox business and will significantly enhance our electrical process heating business, especially in Europe. Thermocoax enables us to address critical high value applications where product cost is a secondary concern to reliability and performance and allows for cross-selling opportunities for both businesses, strengthening Thermocoax’s presence in North America and Chromalox’s presence in Europe.
In the year ended 31st December 2018, Thermocoax recorded revenues of €49.8m (£43.9m), EBITDA of €12.9m (£11.4m) and adjusted operating profit of €12.1m (£10.7m). In 2018, 54% of the company’s revenues were in EMEA with 32% in the Americas and 14% in Asia Pacific. At 31st December 2018, Thermocoax’s gross assets were €94.6m (£83.0m).
The purchase will be financed from existing cash and debt facilities and is expected to be accretive to Group earnings in 2019.
Upon completion of the exclusive negotiations, the transaction will require certain regulatory approvals in France, Germany and the USA. These regulatory approvals are expected to be satisfied during the second quarter of 2019.

Financial Statements
178 Spirax-Sarco Engineering plc Annual Report 2018
In this sectionCompany Statement of Financial Position 179Company Statement of Changes in Equity 180Notes to the Company Financial Statements 181
Company Financial Statements
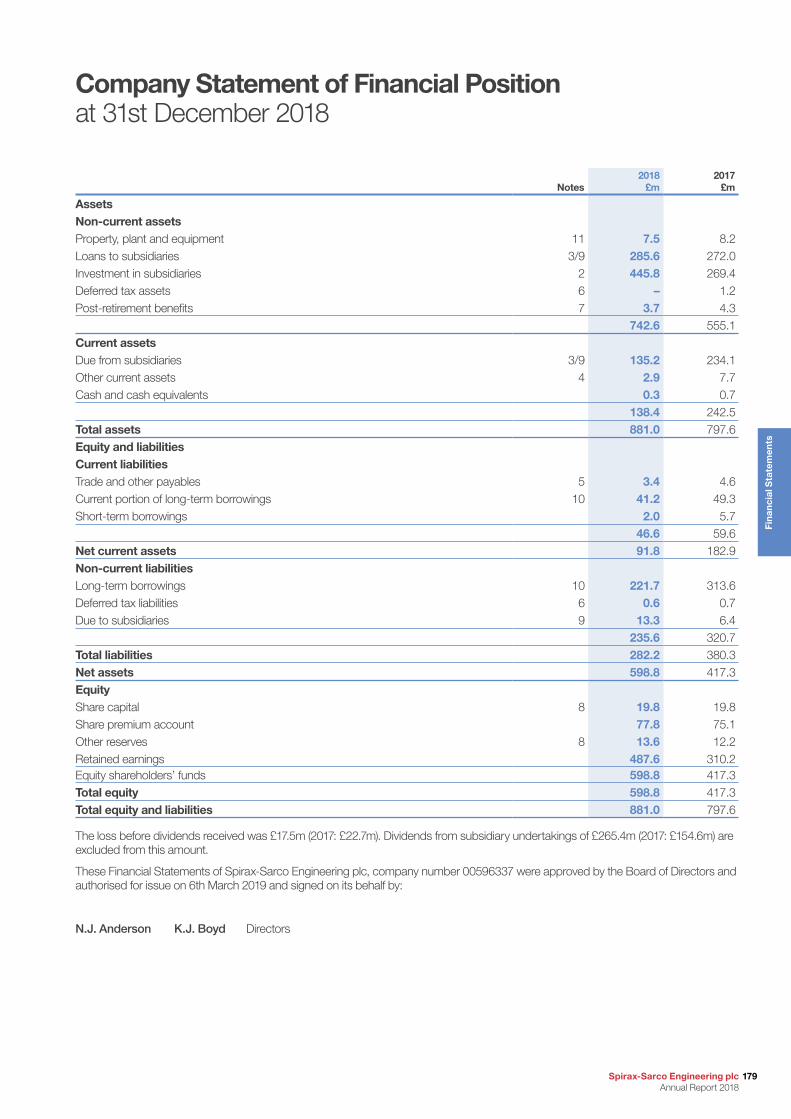
Spirax-Sarco Engineering plc Annual Report 2018
179
Fin
anci
al S
tate
men
ts
Notes2018
£m2017
£m
AssetsNon-current assetsProperty, plant and equipment 11 7.5 8.2Loans to subsidiaries 3/9 285.6 272.0Investment in subsidiaries 2 445.8 269.4Deferred tax assets 6 – 1.2Post-retirement benefits 7 3.7 4.3
742.6 555.1Current assetsDue from subsidiaries 3/9 135.2 234.1Other current assets 4 2.9 7.7Cash and cash equivalents 0.3 0.7
138.4 242.5Total assets 881.0 797.6Equity and liabilitiesCurrent liabilitiesTrade and other payables 5 3.4 4.6Current portion of long-term borrowings 10 41.2 49.3Short-term borrowings 2.0 5.7
46.6 59.6Net current assets 91.8 182.9Non-current liabilitiesLong-term borrowings 10 221.7 313.6Deferred tax liabilities 6 0.6 0.7Due to subsidiaries 9 13.3 6.4
235.6 320.7Total liabilities 282.2 380.3Net assets 598.8 417.3EquityShare capital 8 19.8 19.8Share premium account 77.8 75.1Other reserves 8 13.6 12.2Retained earnings 487.6 310.2Equity shareholders’ funds 598.8 417.3Total equity 598.8 417.3Total equity and liabilities 881.0 797.6
The loss before dividends received was £17.5m (2017: £22.7m). Dividends from subsidiary undertakings of £265.4m (2017: £154.6m) are excluded from this amount.
These Financial Statements of Spirax-Sarco Engineering plc, company number 00596337 were approved by the Board of Directors and authorised for issue on 6th March 2019 and signed on its behalf by:
N.J. Anderson K.J. Boyd Directors
Company Statement of Financial Position at 31st December 2018
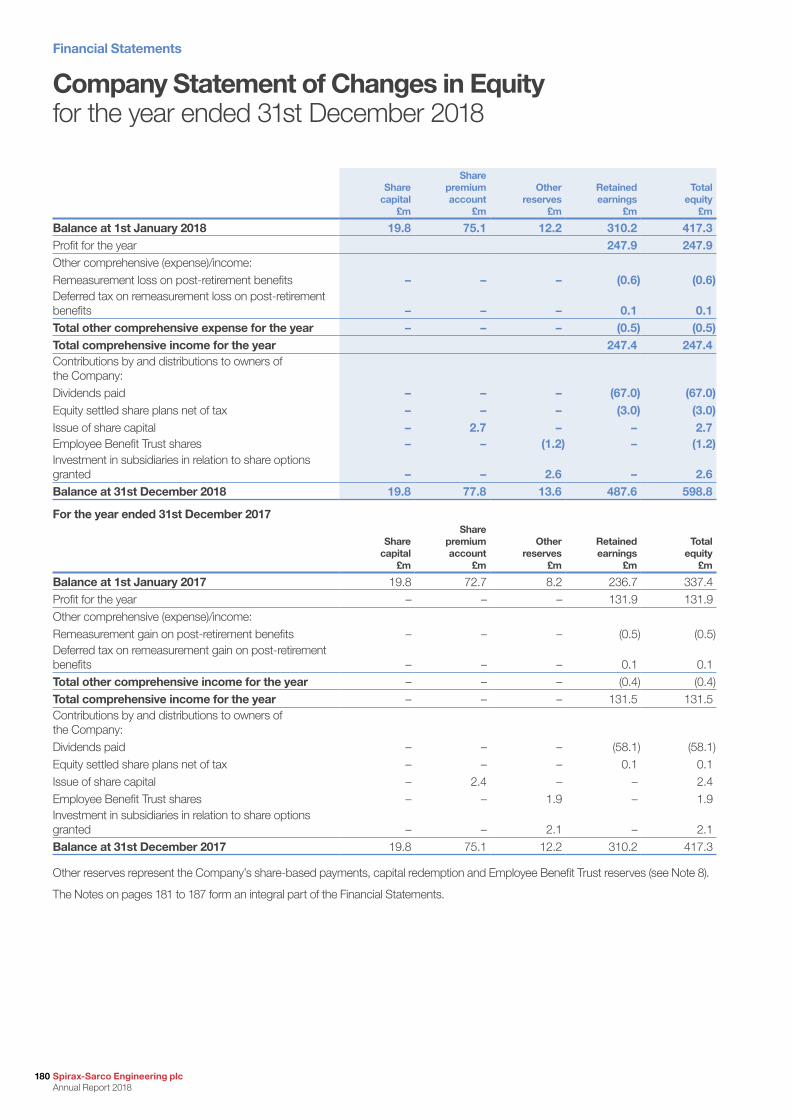
Financial Statements
180 Spirax-Sarco Engineering plc Annual Report 2018
Sharecapital
£m
Sharepremiumaccount
£m
Otherreserves
£m
Retainedearnings
£m
Totalequity
£m
Balance at 1st January 2018 19.8 75.1 12.2 310.2 417.3Profit for the year 247.9 247.9Other comprehensive (expense)/income:Remeasurement loss on post-retirement benefits – – – (0.6) (0.6)Deferred tax on remeasurement loss on post-retirement benefits – – – 0.1 0.1Total other comprehensive expense for the year – – – (0.5) (0.5)Total comprehensive income for the year 247.4 247.4Contributions by and distributions to owners of the Company:Dividends paid – – – (67.0) (67.0)Equity settled share plans net of tax – – – (3.0) (3.0)Issue of share capital – 2.7 – – 2.7Employee Benefit Trust shares – – (1.2) – (1.2)Investment in subsidiaries in relation to share options granted – – 2.6 – 2.6Balance at 31st December 2018 19.8 77.8 13.6 487.6 598.8
For the year ended 31st December 2017
Sharecapital
£m
Sharepremiumaccount
£m
Otherreserves
£m
Retainedearnings
£m
Totalequity
£m
Balance at 1st January 2017 19.8 72.7 8.2 236.7 337.4Profit for the year – – – 131.9 131.9Other comprehensive (expense)/income:Remeasurement gain on post-retirement benefits – – – (0.5) (0.5)Deferred tax on remeasurement gain on post-retirement benefits – – – 0.1 0.1Total other comprehensive income for the year – – – (0.4) (0.4)Total comprehensive income for the year – – – 131.5 131.5Contributions by and distributions to owners of the Company:Dividends paid – – – (58.1) (58.1)Equity settled share plans net of tax – – – 0.1 0.1Issue of share capital – 2.4 – – 2.4Employee Benefit Trust shares – – 1.9 – 1.9Investment in subsidiaries in relation to share options granted – – 2.1 – 2.1Balance at 31st December 2017 19.8 75.1 12.2 310.2 417.3
Other reserves represent the Company’s share-based payments, capital redemption and Employee Benefit Trust reserves (see Note 8).
The Notes on pages 181 to 187 form an integral part of the Financial Statements.
Company Statement of Changes in Equityfor the year ended 31st December 2018
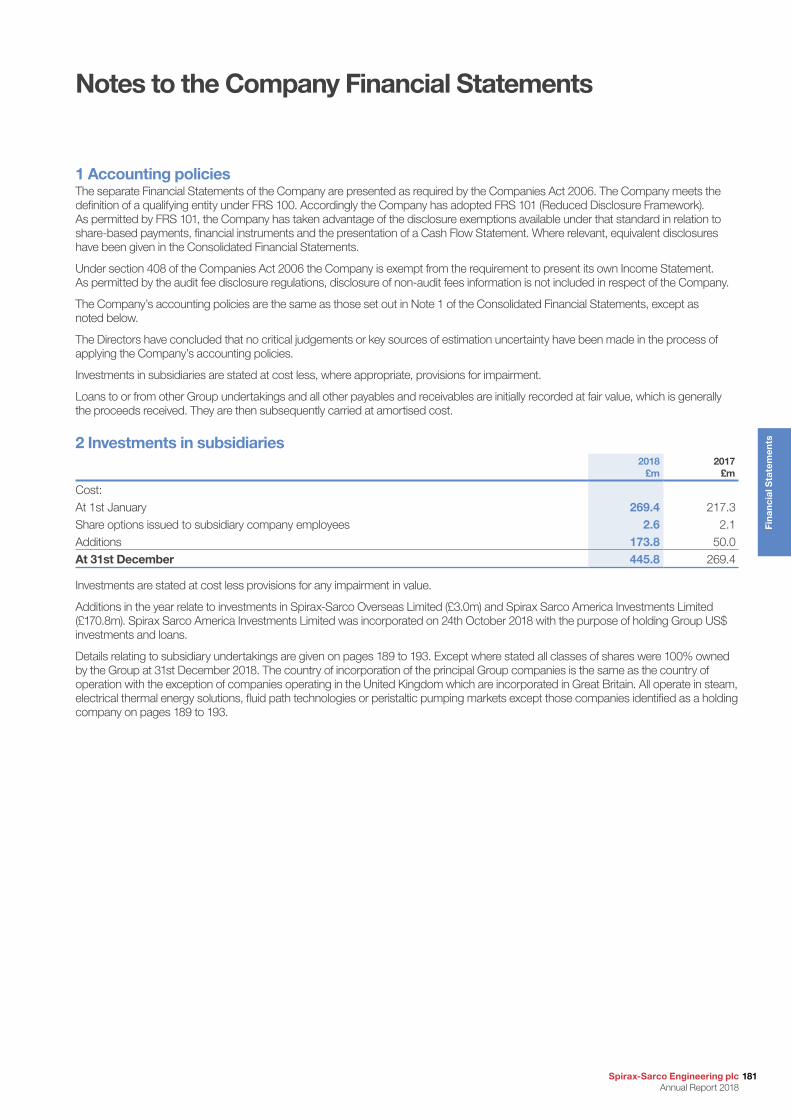
Spirax-Sarco Engineering plc Annual Report 2018
181
Fin
anci
al S
tate
men
ts
1 Accounting policiesThe separate Financial Statements of the Company are presented as required by the Companies Act 2006. The Company meets the definition of a qualifying entity under FRS 100. Accordingly the Company has adopted FRS 101 (Reduced Disclosure Framework). As permitted by FRS 101, the Company has taken advantage of the disclosure exemptions available under that standard in relation to share-based payments, financial instruments and the presentation of a Cash Flow Statement. Where relevant, equivalent disclosures have been given in the Consolidated Financial Statements.
Under section 408 of the Companies Act 2006 the Company is exempt from the requirement to present its own Income Statement. As permitted by the audit fee disclosure regulations, disclosure of non-audit fees information is not included in respect of the Company.
The Company’s accounting policies are the same as those set out in Note 1 of the Consolidated Financial Statements, except as noted below.
The Directors have concluded that no critical judgements or key sources of estimation uncertainty have been made in the process of applying the Company’s accounting policies.
Investments in subsidiaries are stated at cost less, where appropriate, provisions for impairment.
Loans to or from other Group undertakings and all other payables and receivables are initially recorded at fair value, which is generally the proceeds received. They are then subsequently carried at amortised cost.
2 Investments in subsidiaries2018
£m2017
£m
Cost:At 1st January 269.4 217.3Share options issued to subsidiary company employees 2.6 2.1Additions 173.8 50.0At 31st December 445.8 269.4
Investments are stated at cost less provisions for any impairment in value.
Additions in the year relate to investments in Spirax-Sarco Overseas Limited (£3.0m) and Spirax Sarco America Investments Limited (£170.8m). Spirax Sarco America Investments Limited was incorporated on 24th October 2018 with the purpose of holding Group US$ investments and loans.
Details relating to subsidiary undertakings are given on pages 189 to 193. Except where stated all classes of shares were 100% owned by the Group at 31st December 2018. The country of incorporation of the principal Group companies is the same as the country of operation with the exception of companies operating in the United Kingdom which are incorporated in Great Britain. All operate in steam, electrical thermal energy solutions, fluid path technologies or peristaltic pumping markets except those companies identified as a holding company on pages 189 to 193.
Notes to the Company Financial Statements
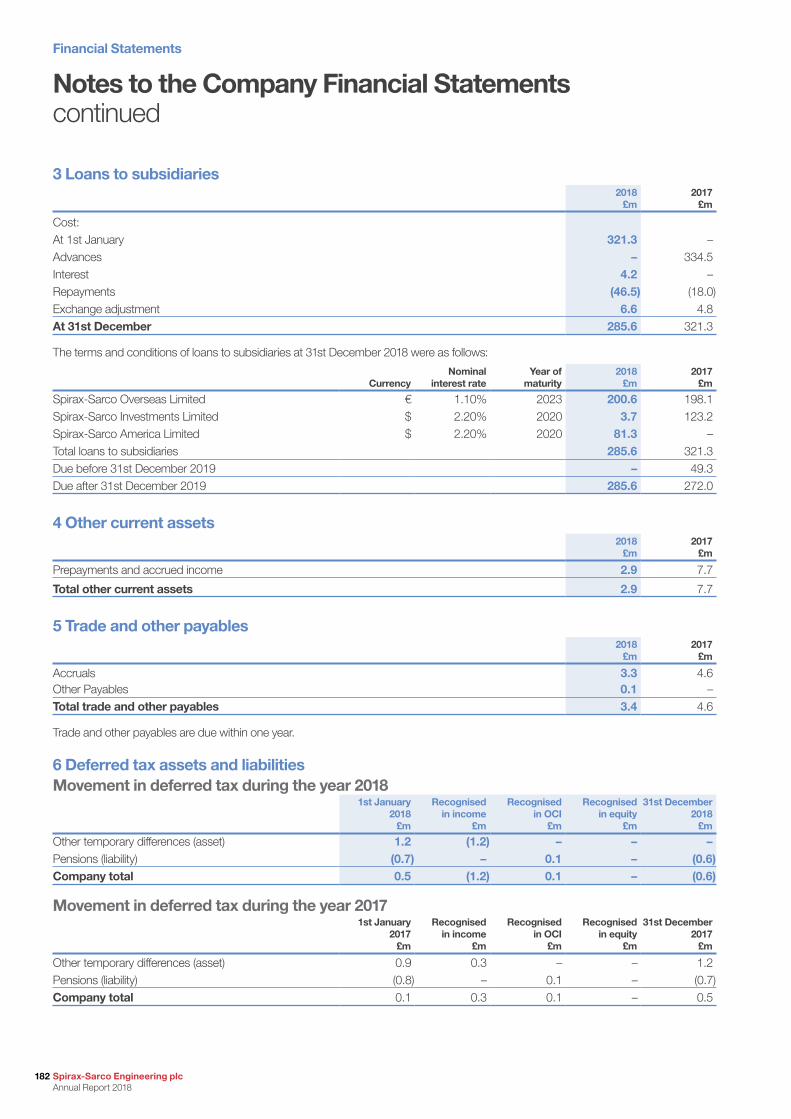
Financial Statements
182 Spirax-Sarco Engineering plc Annual Report 2018
3 Loans to subsidiaries2018
£m2017
£m
Cost:At 1st January 321.3 –Advances – 334.5Interest 4.2 –Repayments (46.5) (18.0)Exchange adjustment 6.6 4.8At 31st December 285.6 321.3
The terms and conditions of loans to subsidiaries at 31st December 2018 were as follows:
CurrencyNominal
interest rateYear of
maturity 2018
£m2017
£m
Spirax-Sarco Overseas Limited € 1.10% 2023 200.6 198.1Spirax-Sarco Investments Limited $ 2.20% 2020 3.7 123.2Spirax-Sarco America Limited $ 2.20% 2020 81.3 –Total loans to subsidiaries 285.6 321.3Due before 31st December 2019 – 49.3Due after 31st December 2019 285.6 272.0
4 Other current assets2018
£m2017
£m
Prepayments and accrued income 2.9 7.7
Total other current assets 2.9 7.7
5 Trade and other payables2018
£m2017
£m
Accruals 3.3 4.6Other Payables 0.1 –Total trade and other payables 3.4 4.6
Trade and other payables are due within one year.
6 Deferred tax assets and liabilitiesMovement in deferred tax during the year 2018
1st January 2018
£m
Recognised in income
£m
Recognised in OCI
£m
Recognised in equity
£m
31st December 2018
£m
Other temporary differences (asset) 1.2 (1.2) – – –Pensions (liability) (0.7) – 0.1 – (0.6)Company total 0.5 (1.2) 0.1 – (0.6)
Movement in deferred tax during the year 20171st January
2017 £m
Recognised in income
£m
Recognised in OCI
£m
Recognised in equity
£m
31st December 2017
£m
Other temporary differences (asset) 0.9 0.3 – – 1.2Pensions (liability) (0.8) – 0.1 – (0.7)Company total 0.1 0.3 0.1 – 0.5
Notes to the Company Financial Statementscontinued
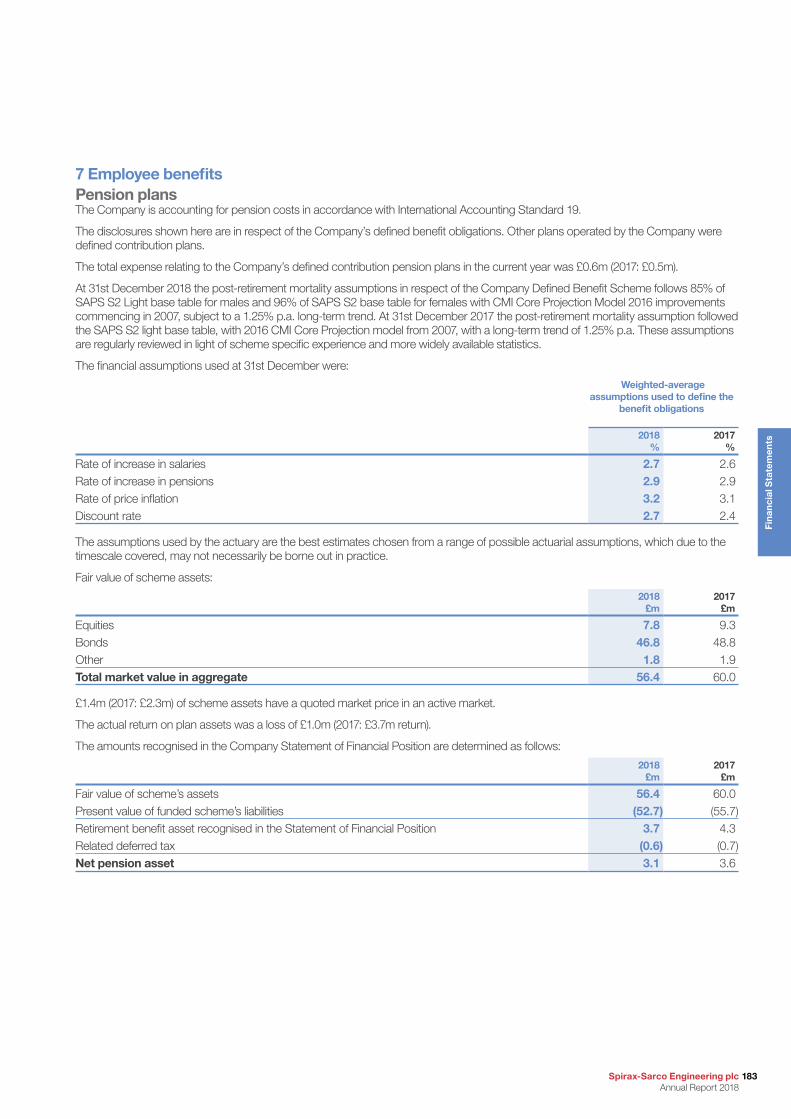
Spirax-Sarco Engineering plc Annual Report 2018
183
Fin
anci
al S
tate
men
ts
7 Employee benefitsPension plansThe Company is accounting for pension costs in accordance with International Accounting Standard 19.
The disclosures shown here are in respect of the Company’s defined benefit obligations. Other plans operated by the Company were defined contribution plans.
The total expense relating to the Company’s defined contribution pension plans in the current year was £0.6m (2017: £0.5m).
At 31st December 2018 the post-retirement mortality assumptions in respect of the Company Defined Benefit Scheme follows 85% of SAPS S2 Light base table for males and 96% of SAPS S2 base table for females with CMI Core Projection Model 2016 improvements commencing in 2007, subject to a 1.25% p.a. long-term trend. At 31st December 2017 the post-retirement mortality assumption followed the SAPS S2 light base table, with 2016 CMI Core Projection model from 2007, with a long-term trend of 1.25% p.a. These assumptions are regularly reviewed in light of scheme specific experience and more widely available statistics.
The financial assumptions used at 31st December were:
Weighted-average assumptions used to define the
benefit obligations
2018 %
2017 %
Rate of increase in salaries 2.7 2.6Rate of increase in pensions 2.9 2.9Rate of price inflation 3.2 3.1Discount rate 2.7 2.4
The assumptions used by the actuary are the best estimates chosen from a range of possible actuarial assumptions, which due to the timescale covered, may not necessarily be borne out in practice.
Fair value of scheme assets:
2018 £m
2017 £m
Equities 7.8 9.3Bonds 46.8 48.8Other 1.8 1.9Total market value in aggregate 56.4 60.0
£1.4m (2017: £2.3m) of scheme assets have a quoted market price in an active market.
The actual return on plan assets was a loss of £1.0m (2017: £3.7m return).
The amounts recognised in the Company Statement of Financial Position are determined as follows:
2018 £m
2017 £m
Fair value of scheme’s assets 56.4 60.0Present value of funded scheme’s liabilities (52.7) (55.7)Retirement benefit asset recognised in the Statement of Financial Position 3.7 4.3Related deferred tax (0.6) (0.7)Net pension asset 3.1 3.6
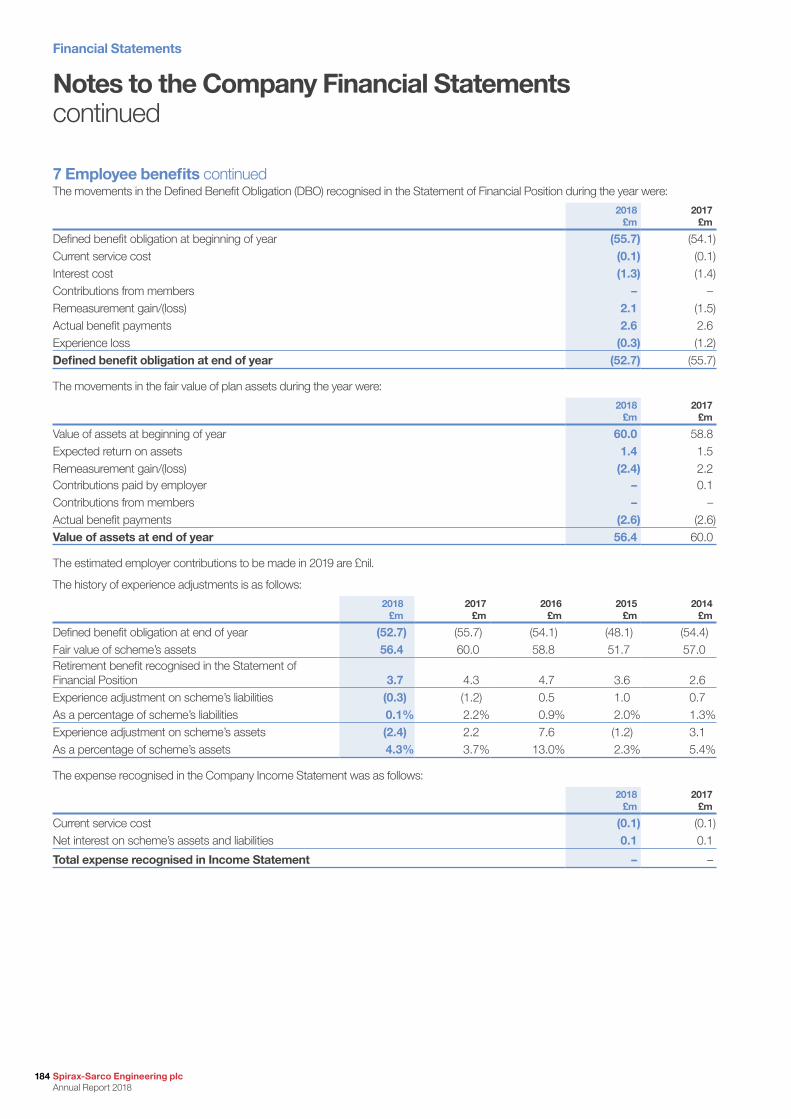
Financial Statements
184 Spirax-Sarco Engineering plc Annual Report 2018
7 Employee benefits continuedThe movements in the Defined Benefit Obligation (DBO) recognised in the Statement of Financial Position during the year were:
2018 £m
2017 £m
Defined benefit obligation at beginning of year (55.7) (54.1)Current service cost (0.1) (0.1)Interest cost (1.3) (1.4)Contributions from members – –Remeasurement gain/(loss) 2.1 (1.5)Actual benefit payments 2.6 2.6Experience loss (0.3) (1.2)Defined benefit obligation at end of year (52.7) (55.7)
The movements in the fair value of plan assets during the year were:
2018 £m
2017 £m
Value of assets at beginning of year 60.0 58.8Expected return on assets 1.4 1.5Remeasurement gain/(loss) (2.4) 2.2Contributions paid by employer – 0.1Contributions from members – –Actual benefit payments (2.6) (2.6)Value of assets at end of year 56.4 60.0
The estimated employer contributions to be made in 2019 are £nil.
The history of experience adjustments is as follows:
2018 £m
2017 £m
2016 £m
2015 £m
2014 £m
Defined benefit obligation at end of year (52.7) (55.7) (54.1) (48.1) (54.4)Fair value of scheme’s assets 56.4 60.0 58.8 51.7 57.0Retirement benefit recognised in the Statement of Financial Position 3.7 4.3 4.7 3.6 2.6Experience adjustment on scheme’s liabilities (0.3) (1.2) 0.5 1.0 0.7As a percentage of scheme’s liabilities 0.1% 2.2% 0.9% 2.0% 1.3%Experience adjustment on scheme’s assets (2.4) 2.2 7.6 (1.2) 3.1As a percentage of scheme’s assets 4.3% 3.7% 13.0% 2.3% 5.4%
The expense recognised in the Company Income Statement was as follows:
2018 £m
2017 £m
Current service cost (0.1) (0.1)Net interest on scheme’s assets and liabilities 0.1 0.1
Total expense recognised in Income Statement – –
Notes to the Company Financial Statementscontinued
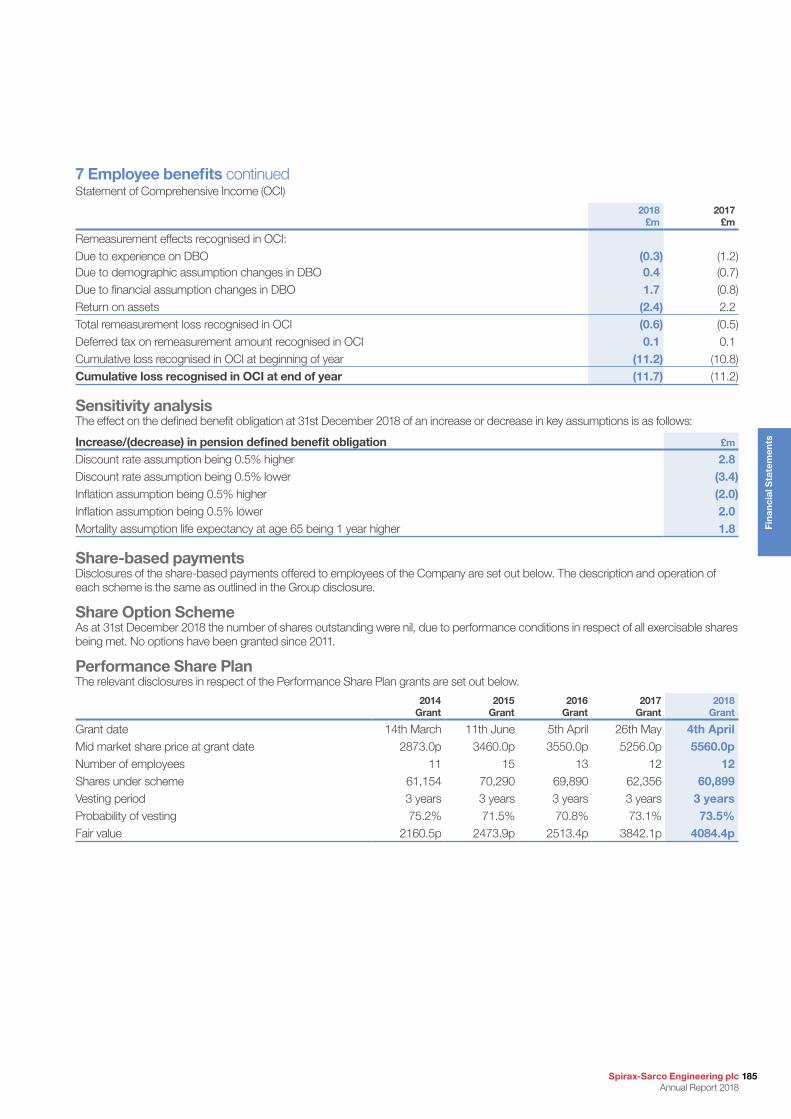
Spirax-Sarco Engineering plc Annual Report 2018
185
Fin
anci
al S
tate
men
ts
7 Employee benefits continuedStatement of Comprehensive Income (OCI)
2018 £m
2017 £m
Remeasurement effects recognised in OCI:Due to experience on DBO (0.3) (1.2)Due to demographic assumption changes in DBO 0.4 (0.7)Due to financial assumption changes in DBO 1.7 (0.8)Return on assets (2.4) 2.2Total remeasurement loss recognised in OCI (0.6) (0.5)Deferred tax on remeasurement amount recognised in OCI 0.1 0.1Cumulative loss recognised in OCI at beginning of year (11.2) (10.8)Cumulative loss recognised in OCI at end of year (11.7) (11.2)
Sensitivity analysisThe effect on the defined benefit obligation at 31st December 2018 of an increase or decrease in key assumptions is as follows:
Increase/(decrease) in pension defined benefit obligation £m
Discount rate assumption being 0.5% higher 2.8Discount rate assumption being 0.5% lower (3.4)Inflation assumption being 0.5% higher (2.0)Inflation assumption being 0.5% lower 2.0Mortality assumption life expectancy at age 65 being 1 year higher 1.8
Share-based paymentsDisclosures of the share-based payments offered to employees of the Company are set out below. The description and operation of each scheme is the same as outlined in the Group disclosure.
Share Option SchemeAs at 31st December 2018 the number of shares outstanding were nil, due to performance conditions in respect of all exercisable shares being met. No options have been granted since 2011.
Performance Share PlanThe relevant disclosures in respect of the Performance Share Plan grants are set out below.
2014 Grant
2015 Grant
2016 Grant
2017 Grant
2018 Grant
Grant date 14th March 11th June 5th April 26th May 4th AprilMid market share price at grant date 2873.0p 3460.0p 3550.0p 5256.0p 5560.0pNumber of employees 11 15 13 12 12Shares under scheme 61,154 70,290 69,890 62,356 60,899Vesting period 3 years 3 years 3 years 3 years 3 yearsProbability of vesting 75.2% 71.5% 70.8% 73.1% 73.5%Fair value 2160.5p 2473.9p 2513.4p 3842.1p 4084.4p
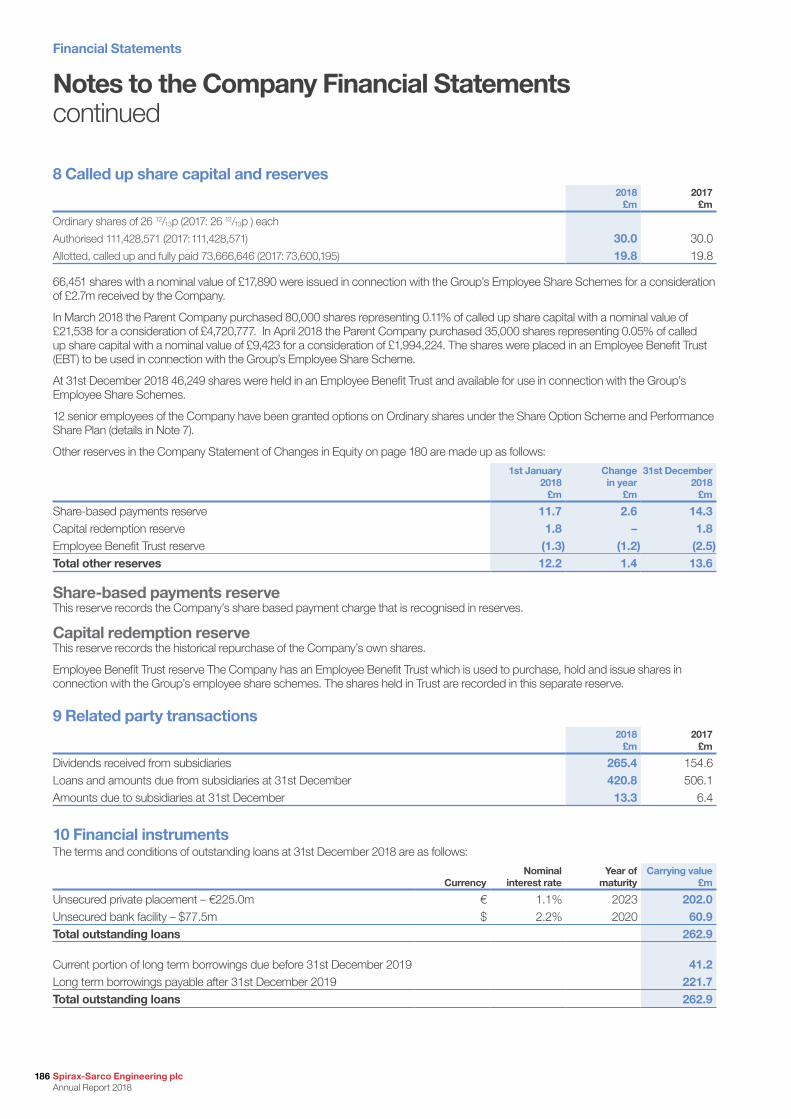
Financial Statements
186 Spirax-Sarco Engineering plc Annual Report 2018
8 Called up share capital and reserves2018
£m2017
£m
Ordinary shares of 26 12/13p (2017: 26 12/13p ) each
Authorised 111,428,571 (2017: 111,428,571) 30.0 30.0Allotted, called up and fully paid 73,666,646 (2017: 73,600,195) 19.8 19.8
66,451 shares with a nominal value of £17,890 were issued in connection with the Group’s Employee Share Schemes for a consideration of £2.7m received by the Company.
In March 2018 the Parent Company purchased 80,000 shares representing 0.11% of called up share capital with a nominal value of £21,538 for a consideration of £4,720,777. In April 2018 the Parent Company purchased 35,000 shares representing 0.05% of called up share capital with a nominal value of £9,423 for a consideration of £1,994,224. The shares were placed in an Employee Benefit Trust (EBT) to be used in connection with the Group’s Employee Share Scheme.
At 31st December 2018 46,249 shares were held in an Employee Benefit Trust and available for use in connection with the Group’s Employee Share Schemes.
12 senior employees of the Company have been granted options on Ordinary shares under the Share Option Scheme and Performance Share Plan (details in Note 7).
Other reserves in the Company Statement of Changes in Equity on page 180 are made up as follows:
1st January 2018
£m
Change in year
£m
31st December 2018
£m
Share-based payments reserve 11.7 2.6 14.3Capital redemption reserve 1.8 – 1.8Employee Benefit Trust reserve (1.3) (1.2) (2.5)Total other reserves 12.2 1.4 13.6
Share-based payments reserveThis reserve records the Company’s share based payment charge that is recognised in reserves.
Capital redemption reserveThis reserve records the historical repurchase of the Company’s own shares.
Employee Benefit Trust reserve The Company has an Employee Benefit Trust which is used to purchase, hold and issue shares in connection with the Group’s employee share schemes. The shares held in Trust are recorded in this separate reserve.
9 Related party transactions2018
£m2017
£m
Dividends received from subsidiaries 265.4 154.6Loans and amounts due from subsidiaries at 31st December 420.8 506.1Amounts due to subsidiaries at 31st December 13.3 6.4
10 Financial instrumentsThe terms and conditions of outstanding loans at 31st December 2018 are as follows:
CurrencyNominal
interest rateYear of
maturity Carrying value
£m
Unsecured private placement – €225.0m € 1.1% 2023 202.0Unsecured bank facility – $77.5m $ 2.2% 2020 60.9Total outstanding loans 262.9
Current portion of long term borrowings due before 31st December 2019 41.2Long term borrowings payable after 31st December 2019 221.7Total outstanding loans 262.9
Notes to the Company Financial Statementscontinued

Spirax-Sarco Engineering plc Annual Report 2018
187
Fin
anci
al S
tate
men
ts
11 Other information Dividends Dividends paid by the Company are disclosed in Note 11 of the Consolidated Financial Statements.
Property, plant and equipmentThe Company holds freehold property with a cost of £9.3m (2017: £9.3m), accumulated depreciation of £1.8m (2017: £1.1m) and a net book value of £7.5m (2017: £8.2m).
EmployeesThe total number of employees of the Company at 31st December 2018 was 85 (2017: 64).
Directors’ remuneration The remuneration of the Directors of the Company is shown in the Annual Report on Remuneration 2018 on pages 95 to 109.
Auditor’s remuneration Auditor’s remuneration in respect of the Company’s annual audit has been disclosed on a consolidated basis in the Company’s Consolidated Financial Statements as required by Section 494(4)(a) of the Companies Act 2006.
Contingent liabilities and capital commitmentsThe Company has no contingent liabilities or capital commitments at 31st December 2018 (2017: £nil).
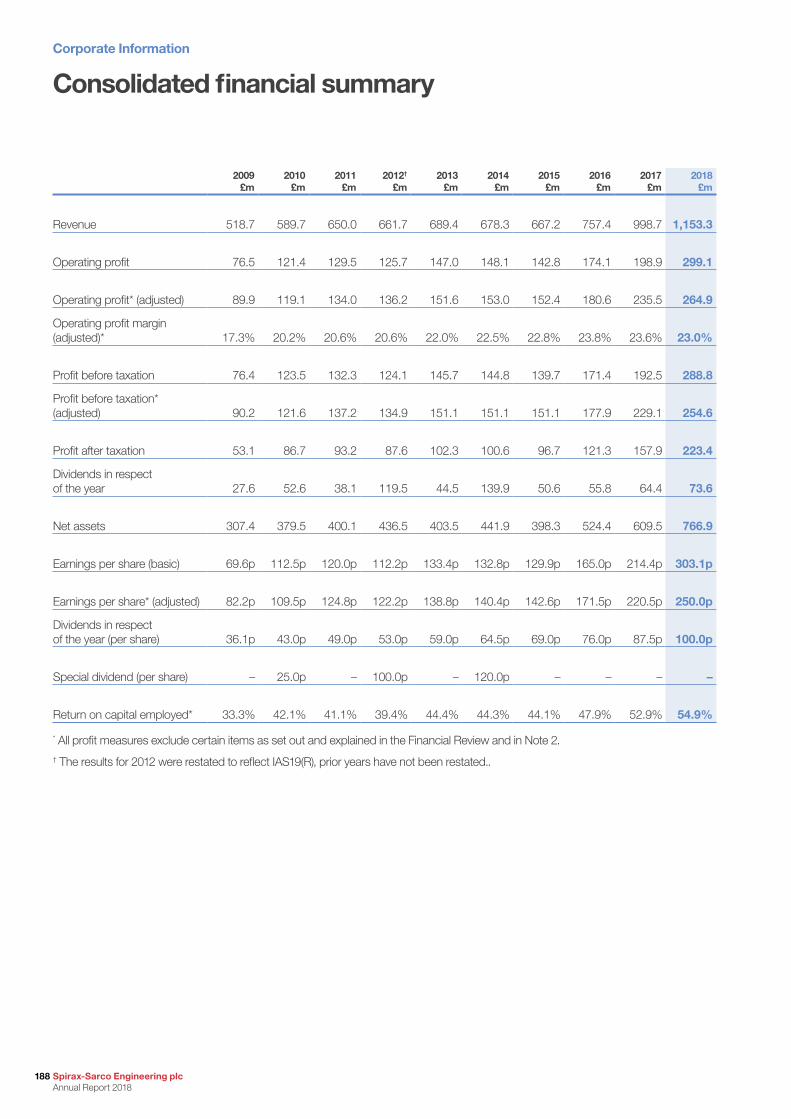
Corporate Information
188 Spirax-Sarco Engineering plc Annual Report 2018
2009 £m
2010 £m
2011 £m
2012† £m
2013 £m
2014 £m
2015 £m
2016 £m
2017 £m
2018£m
Revenue 518.7 589.7 650.0 661.7 689.4 678.3 667.2 757.4 998.7 1,153.3
Operating profit 76.5 121.4 129.5 125.7 147.0 148.1 142.8 174.1 198.9 299.1
Operating profit* (adjusted) 89.9 119.1 134.0 136.2 151.6 153.0 152.4 180.6 235.5 264.9
Operating profit margin (adjusted)* 17.3% 20.2% 20.6% 20.6% 22.0% 22.5% 22.8% 23.8% 23.6% 23.0%
Profit before taxation 76.4 123.5 132.3 124.1 145.7 144.8 139.7 171.4 192.5 288.8
Profit before taxation* (adjusted) 90.2 121.6 137.2 134.9 151.1 151.1 151.1 177.9 229.1 254.6
Profit after taxation 53.1 86.7 93.2 87.6 102.3 100.6 96.7 121.3 157.9 223.4
Dividends in respect of the year 27.6 52.6 38.1 119.5 44.5 139.9 50.6 55.8 64.4 73.6
Net assets 307.4 379.5 400.1 436.5 403.5 441.9 398.3 524.4 609.5 766.9
Earnings per share (basic) 69.6p 112.5p 120.0p 112.2p 133.4p 132.8p 129.9p 165.0p 214.4p 303.1p
Earnings per share* (adjusted) 82.2p 109.5p 124.8p 122.2p 138.8p 140.4p 142.6p 171.5p 220.5p 250.0p
Dividends in respect of the year (per share) 36.1p 43.0p 49.0p 53.0p 59.0p 64.5p 69.0p 76.0p 87.5p 100.0p
Special dividend (per share) – 25.0p – 100.0p – 120.0p – – – –
Return on capital employed* 33.3% 42.1% 41.1% 39.4% 44.4% 44.3% 44.1% 47.9% 52.9% 54.9%
* All profit measures exclude certain items as set out and explained in the Financial Review and in Note 2.† The results for 2012 were restated to reflect IAS19(R), prior years have not been restated..
Consolidated financial summary
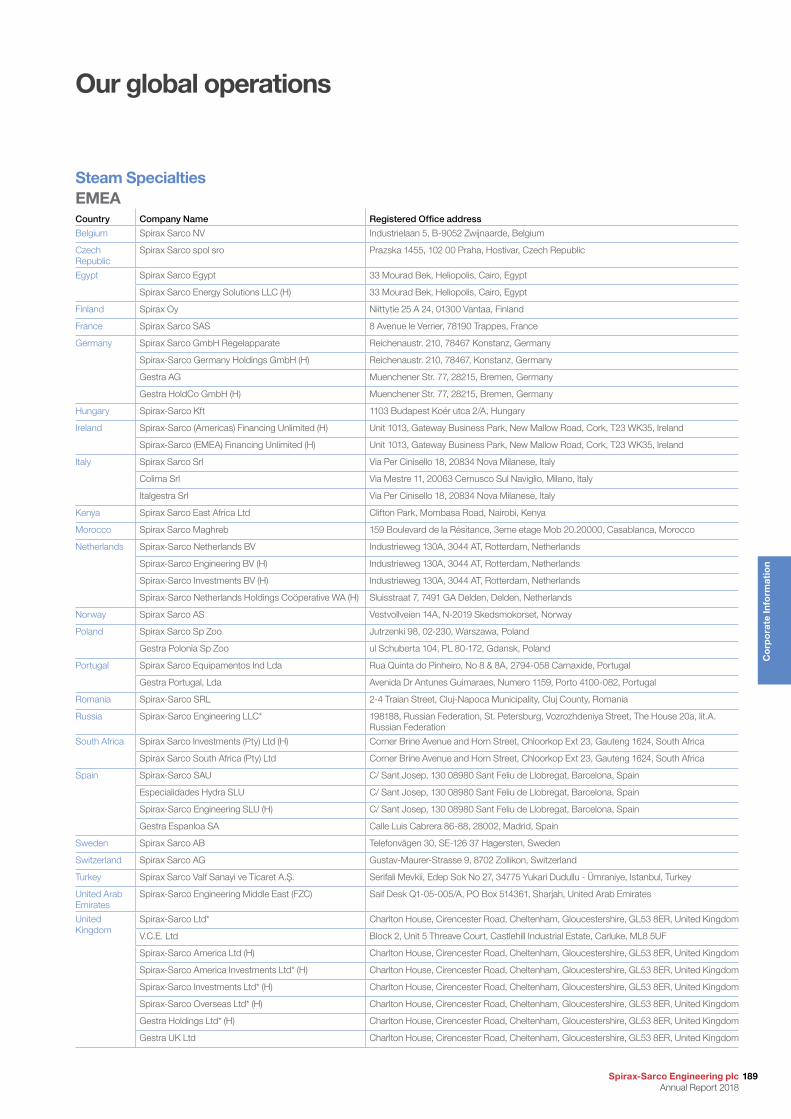
Steam SpecialtiesEMEACountry Company Name Registered Office address
Belgium Spirax Sarco NV Industrielaan 5, B-9052 Zwijnaarde, Belgium
Czech Republic
Spirax Sarco spol sro Prazska 1455, 102 00 Praha, Hostivar, Czech Republic
Egypt Spirax Sarco Egypt 33 Mourad Bek, Heliopolis, Cairo, Egypt
Spirax Sarco Energy Solutions LLC (H) 33 Mourad Bek, Heliopolis, Cairo, Egypt
Finland Spirax Oy Niittytie 25 A 24, 01300 Vantaa, Finland
France Spirax Sarco SAS 8 Avenue le Verrier, 78190 Trappes, France
Germany Spirax Sarco GmbH Regelapparate Reichenaustr. 210, 78467 Konstanz, Germany
Spirax-Sarco Germany Holdings GmbH (H) Reichenaustr. 210, 78467, Konstanz, Germany
Gestra AG Muenchener Str. 77, 28215, Bremen, Germany
Gestra HoldCo GmbH (H) Muenchener Str. 77, 28215, Bremen, Germany
Hungary Spirax-Sarco Kft 1103 Budapest Koér utca 2/A, Hungary
Ireland Spirax-Sarco (Americas) Financing Unlimited (H) Unit 1013, Gateway Business Park, New Mallow Road, Cork, T23 WK35, Ireland
Spirax-Sarco (EMEA) Financing Unlimited (H) Unit 1013, Gateway Business Park, New Mallow Road, Cork, T23 WK35, Ireland
Italy Spirax Sarco Srl Via Per Cinisello 18, 20834 Nova Milanese, Italy
Colima Srl Via Mestre 11, 20063 Cernusco Sul Naviglio, Milano, Italy
Italgestra Srl Via Per Cinisello 18, 20834 Nova Milanese, Italy
Kenya Spirax Sarco East Africa Ltd Clifton Park, Mombasa Road, Nairobi, Kenya
Morocco Spirax Sarco Maghreb 159 Boulevard de la Résitance, 3eme etage Mob 20.20000, Casablanca, Morocco
Netherlands Spirax-Sarco Netherlands BV Industrieweg 130A, 3044 AT, Rotterdam, Netherlands
Spirax-Sarco Engineering BV (H) Industrieweg 130A, 3044 AT, Rotterdam, Netherlands
Spirax-Sarco Investments BV (H) Industrieweg 130A, 3044 AT, Rotterdam, Netherlands
Spirax-Sarco Netherlands Holdings Coöperative WA (H) Sluisstraat 7, 7491 GA Delden, Delden, Netherlands
Norway Spirax Sarco AS Vestvollveien 14A, N-2019 Skedsmokorset, Norway
Poland Spirax Sarco Sp Zoo Jutrzenki 98, 02-230, Warszawa, Poland
Gestra Polonia Sp Zoo ul Schuberta 104, PL 80-172, Gdansk, Poland
Portugal Spirax Sarco Equipamentos Ind Lda Rua Quinta do Pinheiro, No 8 & 8A, 2794-058 Carnaxide, Portugal
Gestra Portugal, Lda Avenida Dr Antunes Guimaraes, Numero 1159, Porto 4100-082, Portugal
Romania Spirax-Sarco SRL 2-4 Traian Street, Cluj-Napoca Municipality, Cluj County, Romania
Russia Spirax-Sarco Engineering LLC* 198188, Russian Federation, St. Petersburg, Vozrozhdeniya Street, The House 20a, lit.A. Russian Federation
South Africa Spirax Sarco Investments (Pty) Ltd (H) Corner Brine Avenue and Horn Street, Chloorkop Ext 23, Gauteng 1624, South Africa
Spirax Sarco South Africa (Pty) Ltd Corner Brine Avenue and Horn Street, Chloorkop Ext 23, Gauteng 1624, South Africa
Spain Spirax-Sarco SAU C/ Sant Josep, 130 08980 Sant Feliu de Llobregat, Barcelona, Spain
Especialidades Hydra SLU C/ Sant Josep, 130 08980 Sant Feliu de Llobregat, Barcelona, Spain
Spirax-Sarco Engineering SLU (H) C/ Sant Josep, 130 08980 Sant Feliu de Llobregat, Barcelona, Spain
Gestra Espanloa SA Calle Luis Cabrera 86-88, 28002, Madrid, Spain
Sweden Spirax Sarco AB Telefonvägen 30, SE-126 37 Hagersten, Sweden
Switzerland Spirax Sarco AG Gustav-Maurer-Strasse 9, 8702 Zollikon, Switzerland
Turkey Spirax Sarco Valf Sanayi ve Ticaret A.Ş. Serifali Mevkii, Edep Sok No 27, 34775 Yukari Dudullu - Ümraniye, Istanbul, Turkey
United Arab Emirates
Spirax-Sarco Engineering Middle East (FZC) Saif Desk Q1-05-005/A, PO Box 514361, Sharjah, United Arab Emirates
United Kingdom
Spirax-Sarco Ltd* Charlton House, Cirencester Road, Cheltenham, Gloucestershire, GL53 8ER, United Kingdom
V.C.E. Ltd Block 2, Unit 5 Threave Court, Castlehill Industrial Estate, Carluke, ML8 5UF
Spirax-Sarco America Ltd (H) Charlton House, Cirencester Road, Cheltenham, Gloucestershire, GL53 8ER, United Kingdom
Spirax-Sarco America Investments Ltd* (H) Charlton House, Cirencester Road, Cheltenham, Gloucestershire, GL53 8ER, United Kingdom
Spirax-Sarco Investments Ltd* (H) Charlton House, Cirencester Road, Cheltenham, Gloucestershire, GL53 8ER, United Kingdom
Spirax-Sarco Overseas Ltd* (H) Charlton House, Cirencester Road, Cheltenham, Gloucestershire, GL53 8ER, United Kingdom
Gestra Holdings Ltd* (H) Charlton House, Cirencester Road, Cheltenham, Gloucestershire, GL53 8ER, United Kingdom
Gestra UK Ltd Charlton House, Cirencester Road, Cheltenham, Gloucestershire, GL53 8ER, United Kingdom
Our global operations
189Spirax-Sarco Engineering plc Annual Report 2018
Co
rpo
rate
Info
rmat
ion
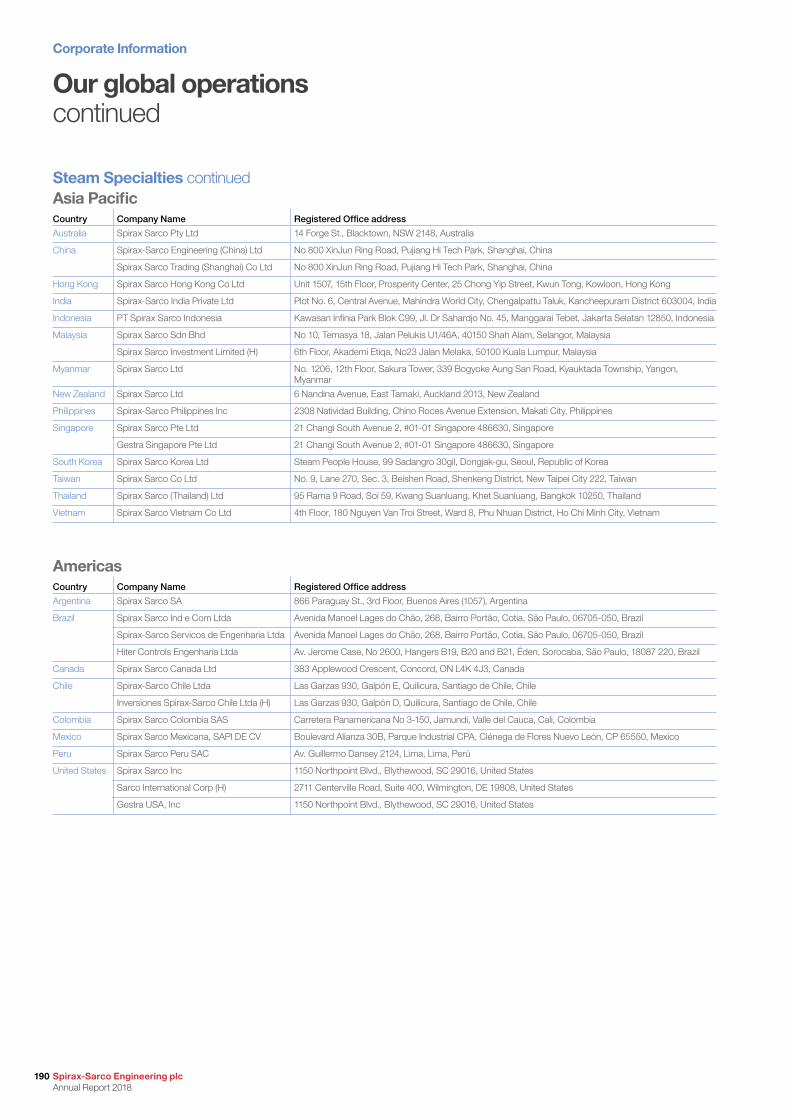
Our global operationscontinued
AmericasCountry Company Name Registered Office address
Argentina Spirax Sarco SA 866 Paraguay St., 3rd Floor, Buenos Aires (1057), Argentina
Brazil Spirax Sarco Ind e Com Ltda Avenida Manoel Lages do Chão, 268, Bairro Portão, Cotia, São Paulo, 06705-050, Brazil
Spirax-Sarco Servicos de Engenharia Ltda Avenida Manoel Lages do Chão, 268, Bairro Portão, Cotia, São Paulo, 06705-050, Brazil
Hiter Controls Engenharia Ltda Av. Jerome Case, No 2600, Hangers B19, B20 and B21, Éden, Sorocaba, São Paulo, 18087 220, Brazil
Canada Spirax Sarco Canada Ltd 383 Applewood Crescent, Concord, ON L4K 4J3, Canada
Chile Spirax-Sarco Chile Ltda Las Garzas 930, Galpón E, Quilicura, Santiago de Chile, Chile
Inversiones Spirax-Sarco Chile Ltda (H) Las Garzas 930, Galpón D, Quilicura, Santiago de Chile, Chile
Colombia Spirax Sarco Colombia SAS Carretera Panamericana No 3-150, Jamundi, Valle del Cauca, Cali, Colombia
Mexico Spirax Sarco Mexicana, SAPI DE CV Boulevard Alianza 30B, Parque Industrial CPA, Ciénega de Flores Nuevo León, CP 65550, Mexico
Peru Spirax Sarco Peru SAC Av. Guillermo Dansey 2124, Lima, Lima, Perú
United States Spirax Sarco Inc 1150 Northpoint Blvd., Blythewood, SC 29016, United States
Sarco International Corp (H) 2711 Centerville Road, Suite 400, Wilmington, DE 19808, United States
Gestra USA, Inc 1150 Northpoint Blvd., Blythewood, SC 29016, United States
Steam Specialties continuedAsia PacificCountry Company Name Registered Office address
Australia Spirax Sarco Pty Ltd 14 Forge St., Blacktown, NSW 2148, Australia
China Spirax-Sarco Engineering (China) Ltd No 800 XinJun Ring Road, Pujiang Hi Tech Park, Shanghai, China
Spirax Sarco Trading (Shanghai) Co Ltd No 800 XinJun Ring Road, Pujiang Hi Tech Park, Shanghai, China
Hong Kong Spirax Sarco Hong Kong Co Ltd Unit 1507, 15th Floor, Prosperity Center, 25 Chong Yip Street, Kwun Tong, Kowloon, Hong Kong
India Spirax-Sarco India Private Ltd Plot No. 6, Central Avenue, Mahindra World City, Chengalpattu Taluk, Kancheepuram District 603004, India
Indonesia PT Spirax Sarco Indonesia Kawasan Infinia Park Blok C99, Jl. Dr Sahardjo No. 45, Manggarai Tebet, Jakarta Selatan 12850, Indonesia
Malaysia Spirax Sarco Sdn Bhd No 10, Temasya 18, Jalan Pelukis U1/46A, 40150 Shah Alam, Selangor, Malaysia
Spirax Sarco Investment Limited (H) 6th Floor, Akademi Etiqa, No23 Jalan Melaka, 50100 Kuala Lumpur, Malaysia
Myanmar Spirax Sarco Ltd No. 1206, 12th Floor, Sakura Tower, 339 Bogyoke Aung San Road, Kyauktada Township, Yangon, Myanmar
New Zealand Spirax Sarco Ltd 6 Nandina Avenue, East Tamaki, Auckland 2013, New Zealand
Philippines Spirax-Sarco Philippines Inc 2308 Natividad Building, Chino Roces Avenue Extension, Makati City, Philippines
Singapore Spirax Sarco Pte Ltd 21 Changi South Avenue 2, #01-01 Singapore 486630, Singapore
Gestra Singapore Pte Ltd 21 Changi South Avenue 2, #01-01 Singapore 486630, Singapore
South Korea Spirax Sarco Korea Ltd Steam People House, 99 Sadangro 30gil, Dongjak-gu, Seoul, Republic of Korea
Taiwan Spirax Sarco Co Ltd No. 9, Lane 270, Sec. 3, Beishen Road, Shenkeng District, New Taipei City 222, Taiwan
Thailand Spirax Sarco (Thailand) Ltd 95 Rama 9 Road, Soi 59, Kwang Suanluang, Khet Suanluang, Bangkok 10250, Thailand
Vietnam Spirax Sarco Vietnam Co Ltd 4th Floor, 180 Nguyen Van Troi Street, Ward 8, Phu Nhuan District, Ho Chi Minh City, Vietnam
Corporate Information
Spirax-Sarco Engineering plc Annual Report 2018
190

Chromalox
Country Company Name Registered Office address
Brazil Chromalox Engenharia Ltda Avenida Manoel Lages do Chão, 268, Bairro Portão, Cotia, São Paulo, 06705-050, Brazil
Canada Canadian Heat Acquisition Corp (H) 7051 68th Ave NW, Edmonton, Alberta, T6B 3E3, Canada
ProTrace Engineering, Inc Suite 205, 6204-6A Street SE, Calgary, Alberta, T2H 2B7, Canada
China Chromalox Precision Heat Control (Shanghai) Co Ltd
88 Taigu Road, Suite A2, 4th Floor - Fenggu Building, Shanghai, 200131, China
Chromalox Precision Heat Control (Suzhou) Co Ltd
T02, No 1801, Pangjin Road, Pangjin Industrial Park, Wujiang, Suzhou, 215200, China
France Etirex SAS 23 Route de Chauteau Thierry, Noyant-et-Aconin, Soissons, Cedex, F-02203, France
Germany Chromalox Germany GmbH Im Defdahl 10 C, Dortmund, 44141, Germany
Hong Kong Chromalox Hong Kong Holdings Ltd (H) 33/F, Shui On Centre, Nos 6-8 Harbour Road, Wanchai, Hong Kong
India Chromalox India Precision Heat & Control Private Limited
1st Floor, 6 Unicom House, A-3 Commercial Complex, New Delhi, Janakpuri, 110058, India
Mexico ELW Industrial S. de R. L. de C.V. Carretera Nacional, K.M. 8.5, Modulo Industrial de America, Lote #5, Nuevo Laredo, Tamaulipas, 88277, Mexico
Singapore Chromalox Precision Heat and Control (Singapore) Pte Ltd
No 11 Woodlands Close, #05-34, Singapore, 737854, Singapore
Thailand Chromalox (Asia Pacific) Ltd 383/2, The Village Business Centre, Unit D16-A, Moo 12, Sukhumvit Road, Nongprue, Banglamung, Chon Buri, 20151, Thailand
United Arab Emirates
Chromalox Gulf DWC, LLC PO Box 390012, Office No: E-2-0226, Business Park, Dubai Aviation City, United Arab Emirates
United Kingdom
Chromalox (UK) Ltd AMP House, 2nd Floor, Dingwall Road, Croydon, Surrey, CR0 2LX, United Kingdom
United States Chromalox, Inc. 2711 Centerville Rd., Suite 400, Wilmington, DE 19808, United States
Heat Acquisition Corp (H) 2711 Centerville Rd., Suite 400, Wilmington, DE 19808, United States
191Spirax-Sarco Engineering plc Annual Report 2018
Co
rpo
rate
Info
rmat
ion
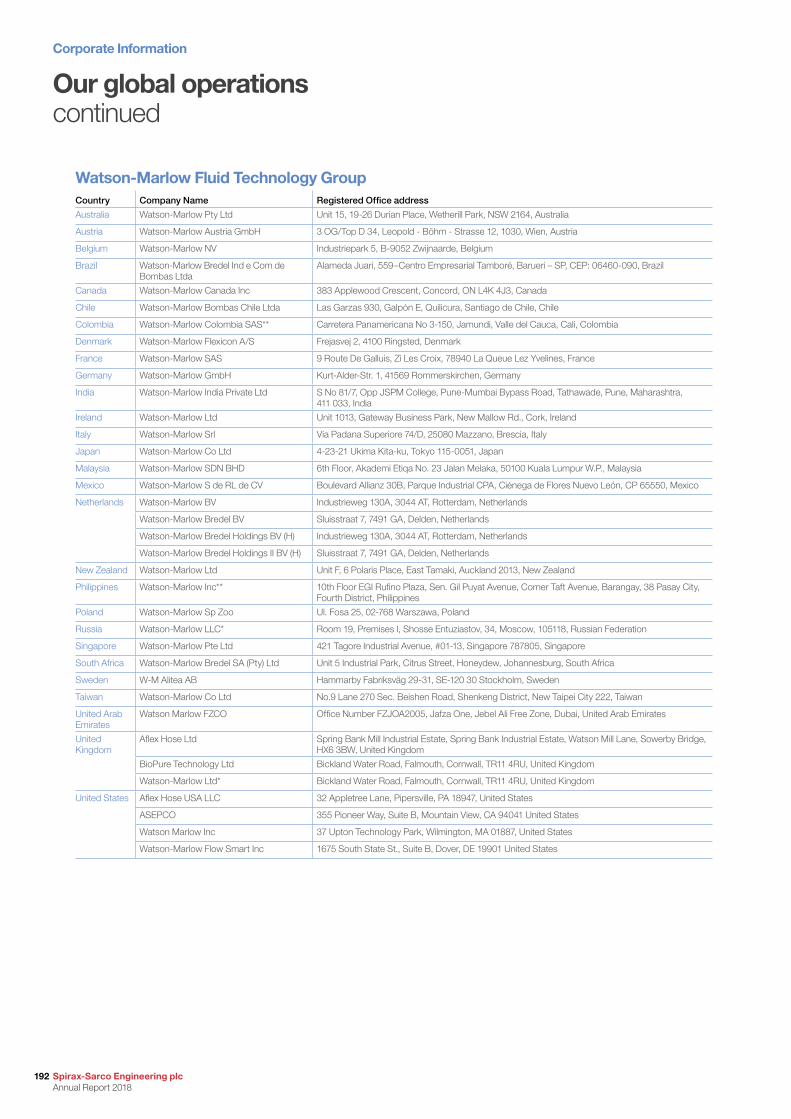
Our global operationscontinued
Watson-Marlow Fluid Technology GroupCountry Company Name Registered Office address
Australia Watson-Marlow Pty Ltd Unit 15, 19-26 Durian Place, Wetherill Park, NSW 2164, Australia
Austria Watson-Marlow Austria GmbH 3 OG/Top D 34, Leopold - Böhm - Strasse 12, 1030, Wien, Austria
Belgium Watson-Marlow NV Industriepark 5, B-9052 Zwijnaarde, Belgium
Brazil Watson-Marlow Bredel Ind e Com de Bombas Ltda
Alameda Juari, 559–Centro Empresarial Tamboré, Barueri – SP, CEP: 06460-090, Brazil
Canada Watson-Marlow Canada Inc 383 Applewood Crescent, Concord, ON L4K 4J3, Canada
Chile Watson-Marlow Bombas Chile Ltda Las Garzas 930, Galpón E, Quilicura, Santiago de Chile, Chile
Colombia Watson-Marlow Colombia SAS** Carretera Panamericana No 3-150, Jamundi, Valle del Cauca, Cali, Colombia
Denmark Watson-Marlow Flexicon A/S Frejasvej 2, 4100 Ringsted, Denmark
France Watson-Marlow SAS 9 Route De Galluis, Zi Les Croix, 78940 La Queue Lez Yvelines, France
Germany Watson-Marlow GmbH Kurt-Alder-Str. 1, 41569 Rommerskirchen, Germany
India Watson-Marlow India Private Ltd S No 81/7, Opp JSPM College, Pune-Mumbai Bypass Road, Tathawade, Pune, Maharashtra, 411 033, India
Ireland Watson-Marlow Ltd Unit 1013, Gateway Business Park, New Mallow Rd., Cork, Ireland
Italy Watson-Marlow Srl Via Padana Superiore 74/D, 25080 Mazzano, Brescia, Italy
Japan Watson-Marlow Co Ltd 4-23-21 Ukima Kita-ku, Tokyo 115-0051, Japan
Malaysia Watson-Marlow SDN BHD 6th Floor, Akademi Etiqa No. 23 Jalan Melaka, 50100 Kuala Lumpur W.P., Malaysia
Mexico Watson-Marlow S de RL de CV Boulevard Allianz 30B, Parque Industrial CPA, Ciénega de Flores Nuevo León, CP 65550, Mexico
Netherlands Watson-Marlow BV Industrieweg 130A, 3044 AT, Rotterdam, Netherlands
Watson-Marlow Bredel BV Sluisstraat 7, 7491 GA, Delden, Netherlands
Watson-Marlow Bredel Holdings BV (H) Industrieweg 130A, 3044 AT, Rotterdam, Netherlands
Watson-Marlow Bredel Holdings II BV (H) Sluisstraat 7, 7491 GA, Delden, Netherlands
New Zealand Watson-Marlow Ltd Unit F, 6 Polaris Place, East Tamaki, Auckland 2013, New Zealand
Philippines Watson-Marlow Inc** 10th Floor EGI Rufino Plaza, Sen. Gil Puyat Avenue, Corner Taft Avenue, Barangay, 38 Pasay City, Fourth District, Philippines
Poland Watson-Marlow Sp Zoo Ul. Fosa 25, 02-768 Warszawa, Poland
Russia Watson-Marlow LLC* Room 19, Premises I, Shosse Entuziastov, 34, Moscow, 105118, Russian Federation
Singapore Watson-Marlow Pte Ltd 421 Tagore Industrial Avenue, #01-13, Singapore 787805, Singapore
South Africa Watson-Marlow Bredel SA (Pty) Ltd Unit 5 Industrial Park, Citrus Street, Honeydew, Johannesburg, South Africa
Sweden W-M Alitea AB Hammarby Fabriksväg 29-31, SE-120 30 Stockholm, Sweden
Taiwan Watson-Marlow Co Ltd No.9 Lane 270 Sec. Beishen Road, Shenkeng District, New Taipei City 222, Taiwan
United Arab Emirates
Watson Marlow FZCO Office Number FZJOA2005, Jafza One, Jebel Ali Free Zone, Dubai, United Arab Emirates
United Kingdom
Aflex Hose Ltd Spring Bank Mill Industrial Estate, Spring Bank Industrial Estate, Watson Mill Lane, Sowerby Bridge, HX6 3BW, United Kingdom
BioPure Technology Ltd Bickland Water Road, Falmouth, Cornwall, TR11 4RU, United Kingdom
Watson-Marlow Ltd* Bickland Water Road, Falmouth, Cornwall, TR11 4RU, United Kingdom
United States Aflex Hose USA LLC 32 Appletree Lane, Pipersville, PA 18947, United States
ASEPCO 355 Pioneer Way, Suite B, Mountain View, CA 94041 United States
Watson Marlow Inc 37 Upton Technology Park, Wilmington, MA 01887, United States
Watson-Marlow Flow Smart Inc 1675 South State St., Suite B, Dover, DE 19901 United States
Corporate Information
Spirax-Sarco Engineering plc Annual Report 2018
192
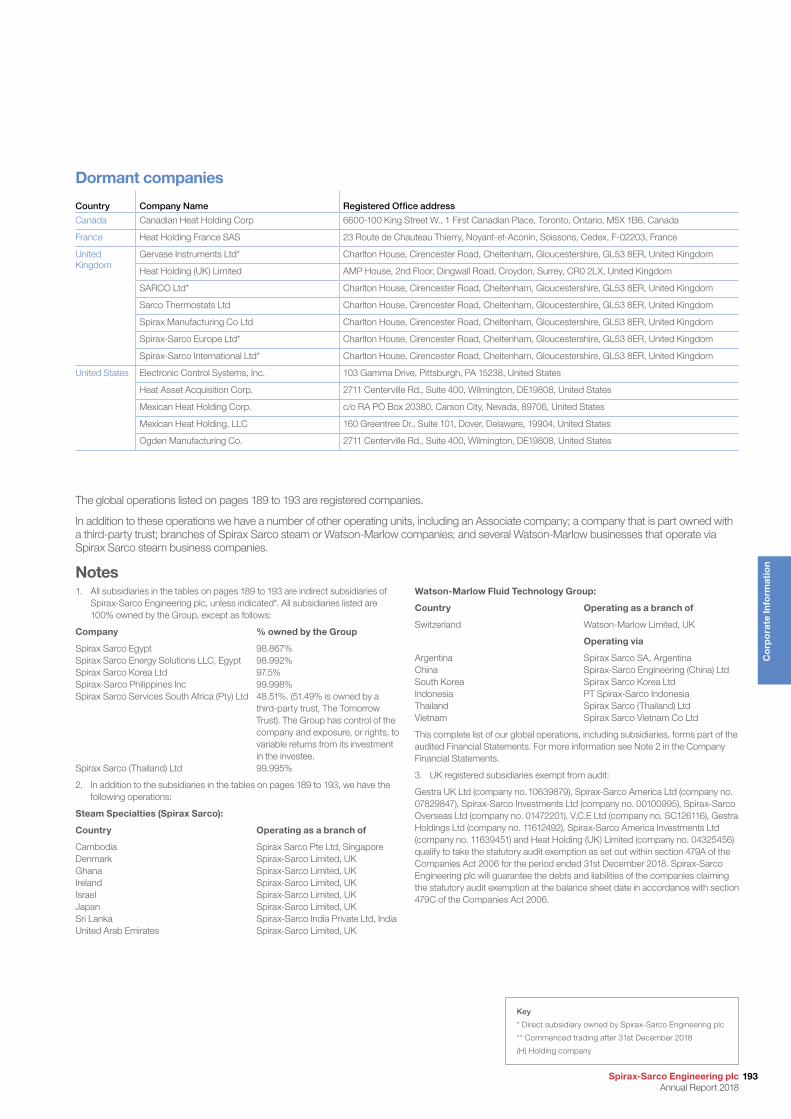
Dormant companies
Country Company Name Registered Office address
Canada Canadian Heat Holding Corp 6600-100 King Street W., 1 First Canadian Place, Toronto, Ontario, M5X 1B6, Canada
France Heat Holding France SAS 23 Route de Chauteau Thierry, Noyant-et-Aconin, Soissons, Cedex, F-02203, France
United Kingdom
Gervase Instruments Ltd* Charlton House, Cirencester Road, Cheltenham, Gloucestershire, GL53 8ER, United Kingdom
Heat Holding (UK) Limited AMP House, 2nd Floor, Dingwall Road, Croydon, Surrey, CR0 2LX, United Kingdom
SARCO Ltd* Charlton House, Cirencester Road, Cheltenham, Gloucestershire, GL53 8ER, United Kingdom
Sarco Thermostats Ltd Charlton House, Cirencester Road, Cheltenham, Gloucestershire, GL53 8ER, United Kingdom
Spirax Manufacturing Co Ltd Charlton House, Cirencester Road, Cheltenham, Gloucestershire, GL53 8ER, United Kingdom
Spirax-Sarco Europe Ltd* Charlton House, Cirencester Road, Cheltenham, Gloucestershire, GL53 8ER, United Kingdom
Spirax-Sarco International Ltd* Charlton House, Cirencester Road, Cheltenham, Gloucestershire, GL53 8ER, United Kingdom
United States Electronic Control Systems, Inc. 103 Gamma Drive, Pittsburgh, PA 15238, United States
Heat Asset Acquisition Corp. 2711 Centerville Rd., Suite 400, Wilmington, DE19808, United States
Mexican Heat Holding Corp. c/o RA PO Box 20380, Carson City, Nevada, 89706, United States
Mexican Heat Holding, LLC 160 Greentree Dr., Suite 101, Dover, Delaware, 19904, United States
Ogden Manufacturing Co. 2711 Centerville Rd., Suite 400, Wilmington, DE19808, United States
Key
* Direct subsidiary owned by Spirax-Sarco Engineering plc
** Commenced trading after 31st December 2018
(H) Holding company
The global operations listed on pages 189 to 193 are registered companies.
In addition to these operations we have a number of other operating units, including an Associate company; a company that is part owned with a third-party trust; branches of Spirax Sarco steam or Watson-Marlow companies; and several Watson-Marlow businesses that operate via Spirax Sarco steam business companies.
Notes1. All subsidiaries in the tables on pages 189 to 193 are indirect subsidiaries of
Spirax-Sarco Engineering plc, unless indicated*. All subsidiaries listed are 100% owned by the Group, except as follows:
Company % owned by the Group
Spirax Sarco Egypt 98.867% Spirax Sarco Energy Solutions LLC, Egypt 98.992% Spirax Sarco Korea Ltd 97.5% Spirax-Sarco Philippines Inc 99.998% Spirax Sarco Services South Africa (Pty) Ltd 48.51%. (51.49% is owned by a
third-party trust, The Tomorrow Trust). The Group has control of the company and exposure, or rights, to variable returns from its investment in the investee.
Spirax Sarco (Thailand) Ltd 99.995%
2. In addition to the subsidiaries in the tables on pages 189 to 193, we have the following operations:
Steam Specialties (Spirax Sarco):
Country Operating as a branch of
Cambodia Spirax Sarco Pte Ltd, Singapore Denmark Spirax-Sarco Limited, UK Ghana Spirax-Sarco Limited, UK Ireland Spirax-Sarco Limited, UK Israel Spirax-Sarco Limited, UK Japan Spirax-Sarco Limited, UK Sri Lanka Spirax-Sarco India Private Ltd, India United Arab Emirates Spirax-Sarco Limited, UK
Watson-Marlow Fluid Technology Group:
Country Operating as a branch of
Switzerland Watson-Marlow Limited, UK
Operating via
Argentina Spirax Sarco SA, Argentina China Spirax-Sarco Engineering (China) Ltd South Korea Spirax Sarco Korea Ltd Indonesia PT Spirax-Sarco Indonesia Thailand Spirax Sarco (Thailand) Ltd Vietnam Spirax Sarco Vietnam Co Ltd
This complete list of our global operations, including subsidiaries, forms part of the audited Financial Statements. For more information see Note 2 in the Company Financial Statements.
3. UK registered subsidiaries exempt from audit:
Gestra UK Ltd (company no. 10639879), Spirax-Sarco America Ltd (company no. 07829847), Spirax-Sarco Investments Ltd (company no. 00100995), Spirax-Sarco Overseas Ltd (company no. 01472201), V.C.E Ltd (company no. SC126116), Gestra Holdings Ltd (company no. 11612492), Spirax-Sarco America Investments Ltd (company no. 11639451) and Heat Holding (UK) Limited (company no. 04325456) qualify to take the statutory audit exemption as set out within section 479A of the Companies Act 2006 for the period ended 31st December 2018. Spirax-Sarco Engineering plc will guarantee the debts and liabilities of the companies claiming the statutory audit exemption at the balance sheet date in accordance with section 479C of the Companies Act 2006.
193Spirax-Sarco Engineering plc Annual Report 2018
Co
rpo
rate
Info
rmat
ion
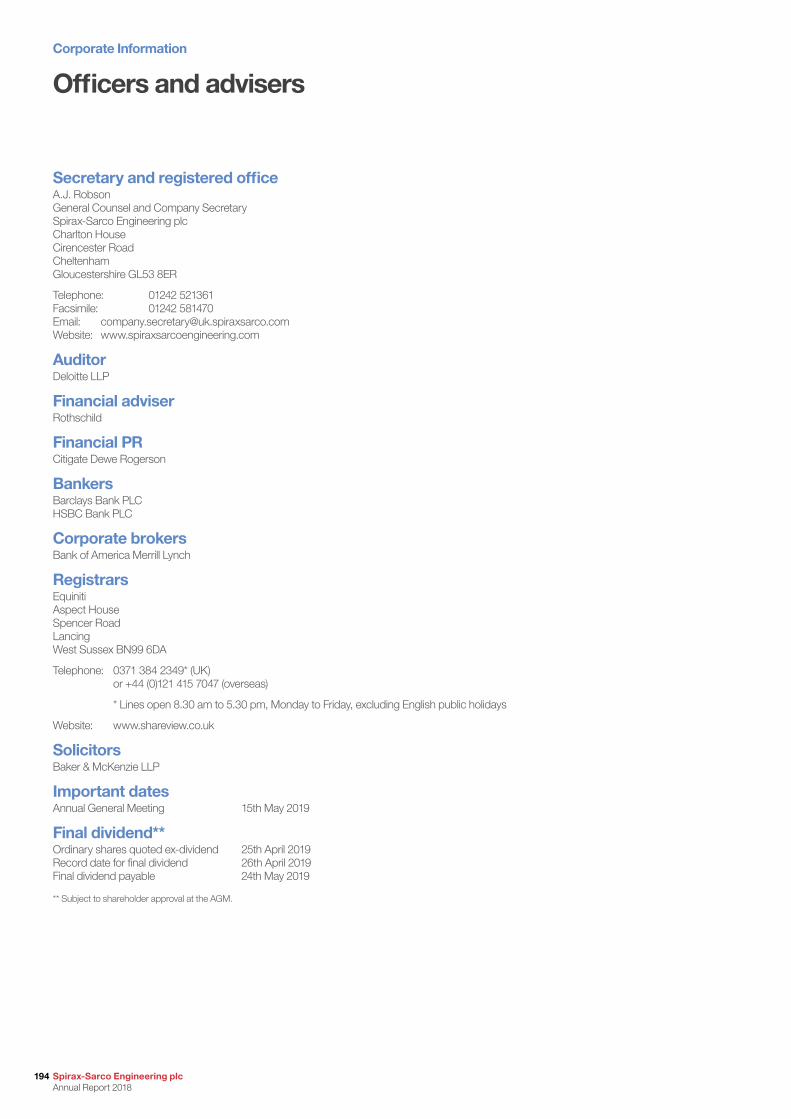
Officers and advisers
Secretary and registered officeA.J. Robson General Counsel and Company Secretary Spirax-Sarco Engineering plc Charlton House Cirencester Road Cheltenham Gloucestershire GL53 8ER
Telephone: 01242 521361 Facsimile: 01242 581470 Email: [email protected] Website: www.spiraxsarcoengineering.com
AuditorDeloitte LLP
Financial adviserRothschild
Financial PRCitigate Dewe Rogerson
BankersBarclays Bank PLC HSBC Bank PLC
Corporate brokersBank of America Merrill Lynch
RegistrarsEquiniti Aspect House Spencer Road Lancing West Sussex BN99 6DA
Telephone: 0371 384 2349* (UK) or +44 (0)121 415 7047 (overseas)
* Lines open 8.30 am to 5.30 pm, Monday to Friday, excluding English public holidays
Website: www.shareview.co.uk
SolicitorsBaker & McKenzie LLP
Important datesAnnual General Meeting 15th May 2019
Final dividend**Ordinary shares quoted ex-dividend 25th April 2019 Record date for final dividend 26th April 2019 Final dividend payable 24th May 2019
** Subject to shareholder approval at the AGM.
Corporate Information
Spirax-Sarco Engineering plc Annual Report 2018
194

Designed and produced by Radley Yeldar www.ry.com
This annual report is printed on Revive 100 which is 100% recycled. The manufacturers of Revive 100 hold ISO 9001 & ISO 14001 certifications and are also FSC & PEFC certified. This report is printed by Pureprint a CarbonNeutral® company. Both manufacturing mill and the printer are registered to the Environmental Management System ISO14001 and are Forest Stewardship Council® (FSC) chain-of-custody certified. If you have finished reading the Report and no longer wish to retain it, please pass it on to other interested readers or dispose of it in your recycled paper waste.

Charlton HouseCirencester RoadCheltenhamGloucestershireGL53 8ER UK
www.spiraxsarcoengineering.com
Copyright © 2022 FDOKUMEN