Conceptual maps: measuring learning processes of engineering students concerning sustainable...
11
European Journal of Engineering Education Vol. 33, No. 3, June 2008, 297–306 Conceptual maps: measuring learning processes of engineering students concerning sustainable development J. Segalàs a *, D. Ferrer-Balas b and K.F. Mulder c a UNESCO Chair of Sustainability, Technical University of Catalonia, Barcelona, Spain; b Cities, Centre for sustainability. Technical University of Catalonia, Barcelona, Spain; c Technology Dynamics and Sustainable Development, Delft University of Technology, Delft, The Netherlands (Received 21 December 2007; in final form 27 March 2008 ) In the 1990s, courses on sustainable development (SD) were introduced in technological universities. After some years of practice, there is increased interest in the evaluation of the most effective ways for teaching SD. This paper introduces the use of conceptual maps as a tool to measure the knowledge acquired by students when taking a Sustainability course. Pilot measurements have been made to evaluate the concepts and their interrelations in order to evaluate the students’ learning. These measurements were carried out using a sample of more than 700 European students. To measure the learning outcomes of courses, the evaluation is done twice. Before the course starts, the students’ previous knowledge on sustainability is measured; once the students have completed the course they are evaluated again. By comparing conceptual maps drawn by each student, the improvement of the students’knowledge is evaluated. This paper shows the measuring process, and points out the suitability of using conceptual maps for research in education. Moreover, the correlation between the learning outcomes the pedagogical techniques used in each course may indicate the effectiveness of the pedagogical strategies in education for sustainable development. Keywords: conceptual maps, learning, sustainable development, measuring, pedagogy 1. Introduction Sustainable development (SD) is recognised to be the path to amend the un-sustainabilities of our society.To follow the SD paradigm we need a fundamental, transformative shift in thinking, values and action by all society’s leaders, professionals and the general population. To quote Albert Einstein, ‘The significant problems we face cannot be solved at the same level of thinking we were at when we created them’. In this context higher education institutions have the responsibility to educate graduates that have achieved the moral vision and the necessary technical knowledge to assure the quality of life for the future generations. This implies that SD will be the framework in which higher education has to focus its mission (Corcoran et al. 2002). *Corresponding author: Email: [email protected] ISSN 0304-3797 print/ISSN 1469-5898 online © 2008 SEFI DOI: 10.1080/03043790802088616 http://www.informaworld.com
-
Upload
thehagueuniversity -
Category
Documents
-
view
3 -
download
0
Transcript of Conceptual maps: measuring learning processes of engineering students concerning sustainable...
European Journal of Engineering EducationVol. 33, No. 3, June 2008, 297–306
Conceptual maps: measuring learning processes of engineeringstudents concerning sustainable development
J. Segalàsa*, D. Ferrer-Balasb and K.F. Mulderc
aUNESCO Chair of Sustainability, Technical University of Catalonia, Barcelona, Spain; bCities, Centrefor sustainability. Technical University of Catalonia, Barcelona, Spain; cTechnology Dynamics and
Sustainable Development, Delft University of Technology, Delft, The Netherlands
(Received 21 December 2007; in final form 27 March 2008 )
In the 1990s, courses on sustainable development (SD) were introduced in technological universities. Aftersome years of practice, there is increased interest in the evaluation of the most effective ways for teachingSD. This paper introduces the use of conceptual maps as a tool to measure the knowledge acquired bystudents when taking a Sustainability course. Pilot measurements have been made to evaluate the conceptsand their interrelations in order to evaluate the students’ learning. These measurements were carried outusing a sample of more than 700 European students. To measure the learning outcomes of courses, theevaluation is done twice. Before the course starts, the students’ previous knowledge on sustainability ismeasured; once the students have completed the course they are evaluated again. By comparing conceptualmaps drawn by each student, the improvement of the students’ knowledge is evaluated. This paper showsthe measuring process, and points out the suitability of using conceptual maps for research in education.Moreover, the correlation between the learning outcomes the pedagogical techniques used in each coursemay indicate the effectiveness of the pedagogical strategies in education for sustainable development.
Keywords: conceptual maps, learning, sustainable development, measuring, pedagogy
1. Introduction
Sustainable development (SD) is recognised to be the path to amend the un-sustainabilities ofour society. To follow the SD paradigm we need a fundamental, transformative shift in thinking,values and action by all society’s leaders, professionals and the general population. To quoteAlbert Einstein, ‘The significant problems we face cannot be solved at the same level of thinkingwe were at when we created them’.
In this context higher education institutions have the responsibility to educate graduates thathave achieved the moral vision and the necessary technical knowledge to assure the quality of lifefor the future generations. This implies that SD will be the framework in which higher educationhas to focus its mission (Corcoran et al. 2002).
*Corresponding author: Email: [email protected]
ISSN 0304-3797 print/ISSN 1469-5898 online© 2008 SEFIDOI: 10.1080/03043790802088616http://www.informaworld.com
298 J. Segalàs et al.
Many international conferences and meetings have drawn attention to the importance of educa-tion for sustainability in higher education. From these events a great number of declarations andagreements have been signed: Stockholm declaration, Tbilisi declaration, Talloires Declaration,Halifax Declaration, Chapter 36 of the agenda 21 in Rio Declaration, Swansea declaration, KyotoDeclaration, CRE-Copernicus Charter, Declaration of Barbados, The Earth Charter, ThessalonikiDeclaration, Lüneburg Declaration, Declaration UBUNTU, United Nations Decade of Educa-tion for Sustainable Development (2005–2014) and, more specific, the Barcelona Declaration onengineering education in sustainable development.
Following the guidelines established by these declarations, there have been different approachesto introduce sustainability into the engineering curriculum of universities. From specific courseson SD, through specialisations on SD, to embedding SD in all ‘conventional’ engineering courses(Mulder et al. 2005).
Specific courses are needed to give the basic understanding of the challenges associated withSD; to deliver tools and models for dealing with dynamic and complex systems; and to attain afeeling of how things are interconnected. However the specific SD courses delivered at universitiestoday have mainly an environmental focus (Holmberg and Samuelsson 2006).
This work explores the learning processes in specific courses on SD that are being taught in someEuropean technological universities. Nevertheless teaching SD is rather challenging, because it’snot merely transmitting knowledge, but also learning on critical thinking, complexity, valuesand ethics. When measuring learning processes induced by teaching SD courses, some questionsarise:
• Which is the starting level of knowledge and assumptions on SD of students?• Which is the optimal way of teaching SD to engineering students?
In particular, this paper analyses the SD understanding of students when enrolling to an SD courseand evaluates the improvement they achieve during the course. Moreover, by comparing differentpedagogical strategies used in the courses, it highlights the most effective way to teach SD in thiskind of specific learning courses.
2. Conceptual maps as an educational research tool
Concept maps (Cmap) were initially developed as a data analysis tool in 1972. Cmap are graphicaltools for organising and representing knowledge. They include concepts, usually enclosed incircles or boxes of some type, and relationships between concepts indicated by a connecting linelinking two concepts. Words on the line referred to as linking words or linking phrases, specifythe relationship between the two concepts (Novak and Cañas, 2006). In recent years conceptmapping has become a powerful tool which is frequently applied in different contexts in scienceeducation. Teachers ask their students to describe their knowledge by means of specific terms andexplain connections between them. Researchers ask students to construct concept maps to gaininformation about students’ conceptions of various topics in science (Iuli and Helldén 2004).
Concept mapping stimulates learners to articulate and externalise the actual state of their knowl-edge. Novak and Gowin (1984) noted that concept mapping is a creative activity, in which thelearner must exert effort to clarify concept meanings in a specific domain knowledge, by iden-tifying important concepts, establishing the concepts relationships, and denoting their structure(Gouli et al. 2004). Cmaps are shown to be excellent in assessing students’ prior knowledge,which is of great importance since prior knowledge is a determining factor in subsequent learning(Gouveia and Valdares 2004).
European Journal of Engineering Education 299
In this work concept mapping is applied to evaluate the knowledge acquired on SD byengineering students that take specific courses on sustainability. The study analysed over 700engineering students from European Technological Universities, who took specific courses onSD. The results obtained allow, on one hand, to evaluate the students initial knowledge on SD andidentify their misunderstandings and gaps – very useful information to improve the courses – andon the other hand, to evaluate the changes produced by the courses in the students understandingof sustainability.
3. Methodology
Using conceptual maps to evaluate knowledge on SD has already been applied by other authorsin higher education (Legrand 2000, Lourdel et al. 2007, Jaen and De Pro 2006, Ahlberg 2004,Gregorio and Freire 2006).This work introduces a new perspective because its aim is to validatepedagogical strategies used in SD courses.
Students are asked to draw a conceptual map about concepts that are relevant to sustainabilitytwice: before taking the course and after taking it. This study has been carried out among studentsof different engineering specialities from three universities (Kiev Polytechnic Institute [KPI],Delft University of Technology [TUD] and Technical University of Catalonia [UPC]) of threecountries (Ukraine, The Netherlands and Spain). In order to make a comparable analysis the sameprocedure was followed.
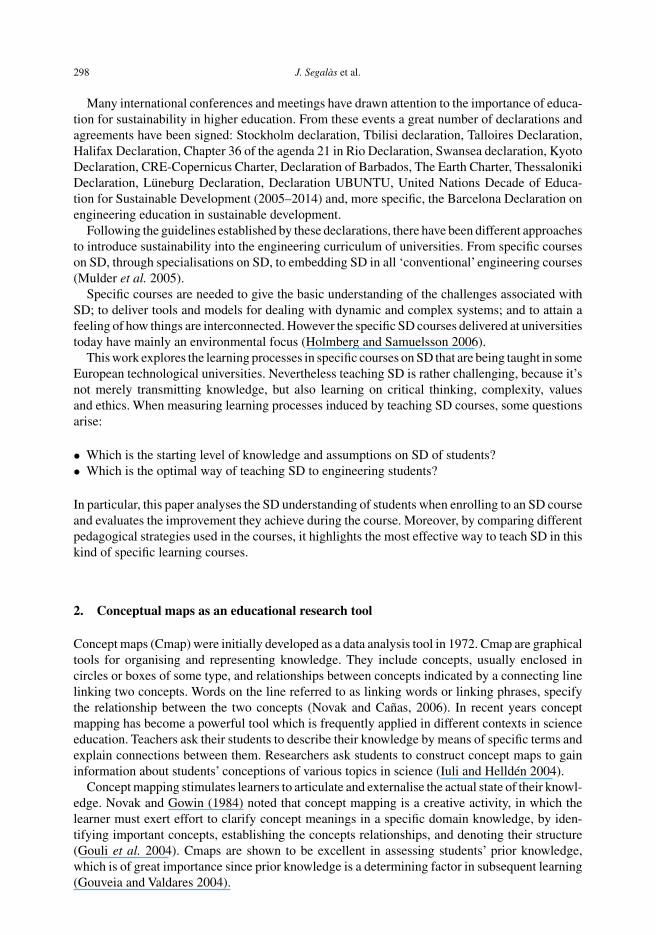
Table 1 Shows the characteristics of the courses analysed: university, Number of ECTS creditpoints; when the study was carried out; speciality of the students and the pedagogy used in thecourse.
On each course students are asked to draw a Cmap, which describes the concepts related tosustainability and the relationship between them. No concepts are given except the initial conceptof sustainability, so students are free to use all the concepts they think are relevant to it. Studentshave 15 min to draw the Cmap. Students draw a Cmap before taking the course; this allows teachers
Table 1. Courses analysed characteristics.
StudentsElective/ engineering Pedagogy
Course University ECTS Year Compulsory speciality used
SustainableTechnology
KPI 3 2007 Elective Various(Master + PhD)
LecturingRole playStudy cases PBL
Energy III project TUD 8.5 (0.7 on SD) 2006 Compulsory Mechanicalengineering(Bachelor)
Part of ProjectBased Learningplus 2lectures/workshops
Sustainability &Technology (1)
UPC 5 2005 Elective Various(Bachelor +Master)
Distance course
Sustainability &Technology (2)
UPC 5 2005 Elective Various(Bachelor +Master)
Distance course
Sustainability &Technology (3)
UPC 5 2005 Elective Various(Bachelor)
Distance course
Technology &Environment
UPC 5 2006 Elective Various(Bachelor)
CooperativelearningRole playPresentations
300 J. Segalàs et al.
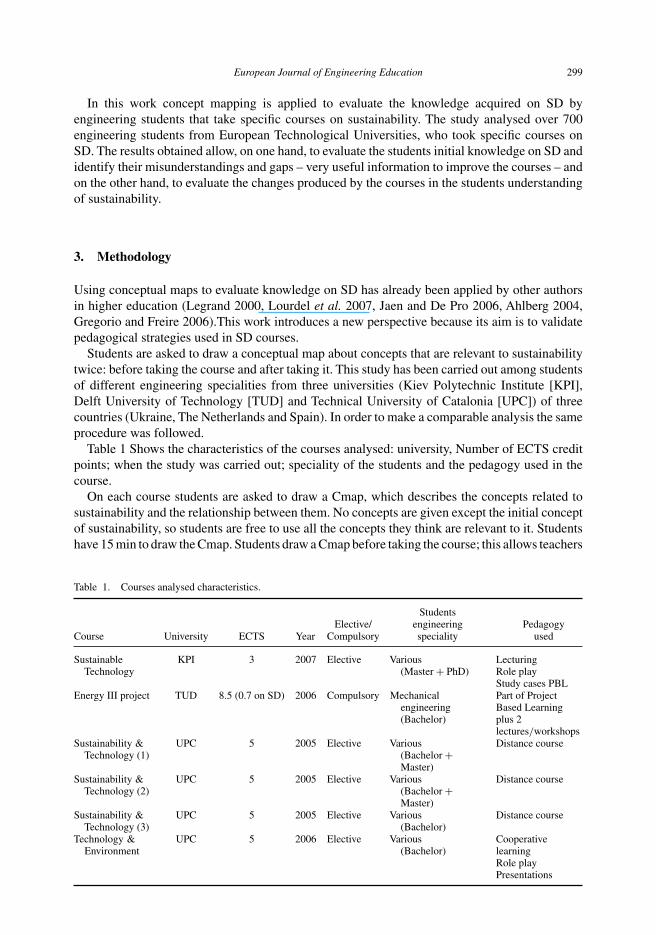
Table 2. Taxonomy of SDcategories used in the analysis.
Categories
UNESCO Chair UPC Lourdel (2004) Segalas, Mulder, Ferrer-Balas
1. Environmental 1. Environmental 1. Environmental2. Resources scarcity
2. Social 2. Social Cultural 3. Social impact4. Values
3. Multidimensional approaches 5. Future generations (Temporal)6. Unbalances (Spatial)
3. Economic 4. Economic, Scientific, Technological 7. Technology8. Economy
4. Institutional 5. Procedural and political approaches 9. Education10. Actors and stakeholders
6. Actors and stakeholders
to assess the students’ previous knowledge of sustainability. Once the students have completedthe course they are asked to draw another Cmap, so the teacher can evaluate the improvement instudents’ knowledge.
When evaluating Cmaps some aspects should be framed (Ruiz-Primo 2004). On the one hand,in order to evaluate the width understanding of the concept sustainability, the concepts drawn bythe students are clustered in categories. On the other hand, to weigh up the complexity associatedto sustainability the interrelations between the categories are analysed.
The first practical question that appears: how to group the concepts? Under what categories?There are different taxonomies of categories for SD. The aim of our study is to find out the best wayto teach sustainability, so we expand the taxonomy developed by previous authors (Lourdel 2004,Carrera 2007) in order to be more precise when analysing the courses and keep the possibilityof a higher disaggregated analysis. Table 2 shows the different categories’ taxonomy and theirrelation.
As seen in Table 2, the categories used in our analysis are:
- Category 1. Environmental aspects (Pollution, degradation, conservation, biodiversity, ecolog-ical footprint)
- Category 2. Resources scarcity (un-renewable resources, run out of materials, . . .)- Category 3. Social impact (quality of life, health, . . .)- Category 4. Cultural & Values aspects (related to ethics, consciousness, . . .)- Category 5. Future generations (the temporal dimension)- Category 6. Unbalances (the equity dimension)- Category 7. Technology (BAT, Industry, efficiency, clean-technologies, energy. . .)- Category 8, Economical aspects (role of economy, fair trade, consumption, . . .)- Category 9. Education aspects (role of education, rise of awareness, . . .)- Category 10. Actors and stakeholders (role of governments, NGOs rules, laws, international
agreements, . . .)
The analysis of conceptual maps can be quantitative or qualitative (Ruiz-Primo 2004, Lourdel2004). In our study we use the quantitative analysis (number of concepts per category and num-ber of links between categories). Two dimensions are evaluated: the categories defined, and theconnectivity between them.
The category relevance (CR) provides information about what one course group of studentsthink sustainability is more related to. It evaluates the distribution of concepts among categories.This information is essential in order to identify the misunderstanding of students and allows the
European Journal of Engineering Education 301
teachers to redefine the structure and focus of the course. CR is calculated as the average of thepercentages of items for each category of all the students of one course
The complexity indicator (CO), evaluates how rich and connected students see the conceptsthey relate to sustainability. To obtain this value two factors are multiplied:
CO = NC ∗ LCa,
where:NC is the average number of concepts per student in the group, and LCa is a relative measure ofthe connections between different categories. It is normalised by the number of categories andthe number of students, and therefore calculated as follows:
LCa = NLint-ca/(NCa ∗ NS),
where:NLint-ca is the total number of links inter-category of one group (the sum of all the links countedin each Cmap), NCa is the number of categories, and NS is the number of students of the group.
This two indicators are evaluated before and after the students took the courses, and as canbe seen it has to be noticed that are values that refer to an entire group average conception, notindividually.
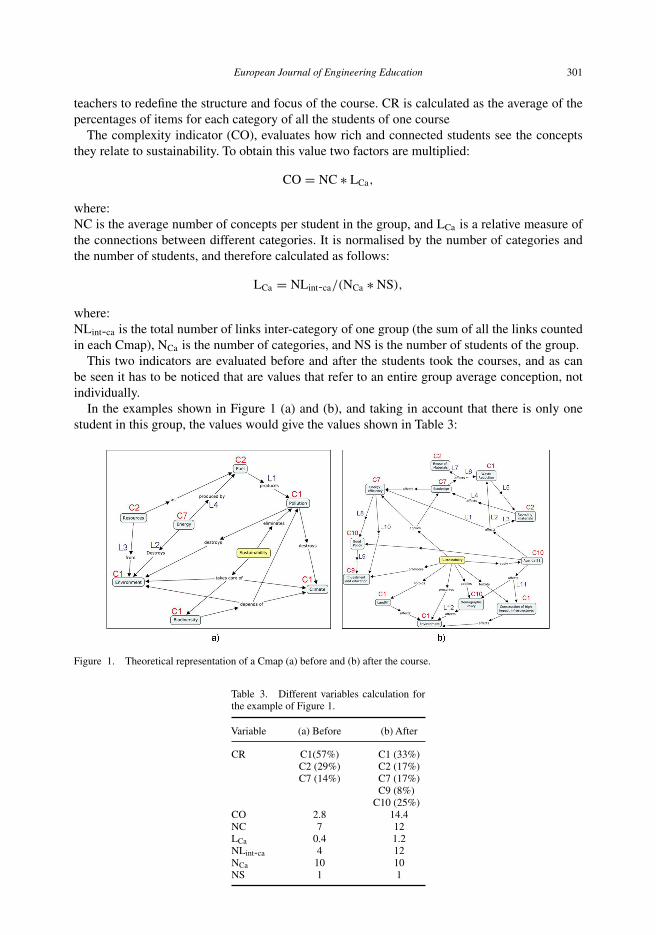
In the examples shown in Figure 1 (a) and (b), and taking in account that there is only onestudent in this group, the values would give the values shown in Table 3:
Figure 1. Theoretical representation of a Cmap (a) before and (b) after the course.
Table 3. Different variables calculation forthe example of Figure 1.
Variable (a) Before (b) After
CR C1(57%) C1 (33%)C2 (29%) C2 (17%)C7 (14%) C7 (17%)
C9 (8%)C10 (25%)
CO 2.8 14.4NC 7 12LCa 0.4 1.2NLint-ca 4 12NCa 10 10NS 1 1
302 J. Segalàs et al.
4. Results and discussion
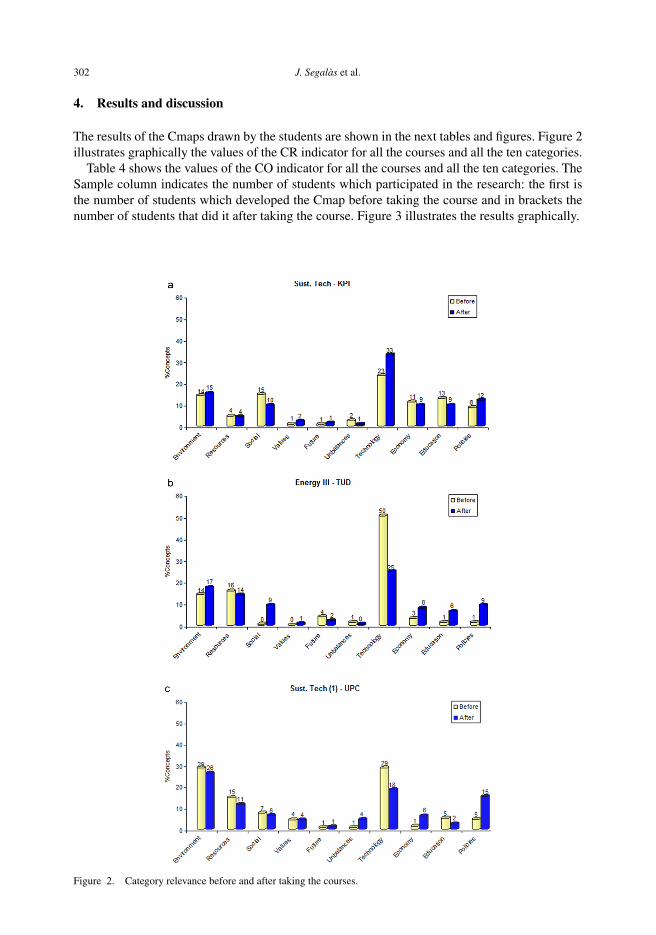
The results of the Cmaps drawn by the students are shown in the next tables and figures. Figure 2illustrates graphically the values of the CR indicator for all the courses and all the ten categories.
Table 4 shows the values of the CO indicator for all the courses and all the ten categories. TheSample column indicates the number of students which participated in the research: the first isthe number of students which developed the Cmap before taking the course and in brackets thenumber of students that did it after taking the course. Figure 3 illustrates the results graphically.
Figure 2. Category relevance before and after taking the courses.
European Journal of Engineering Education 303
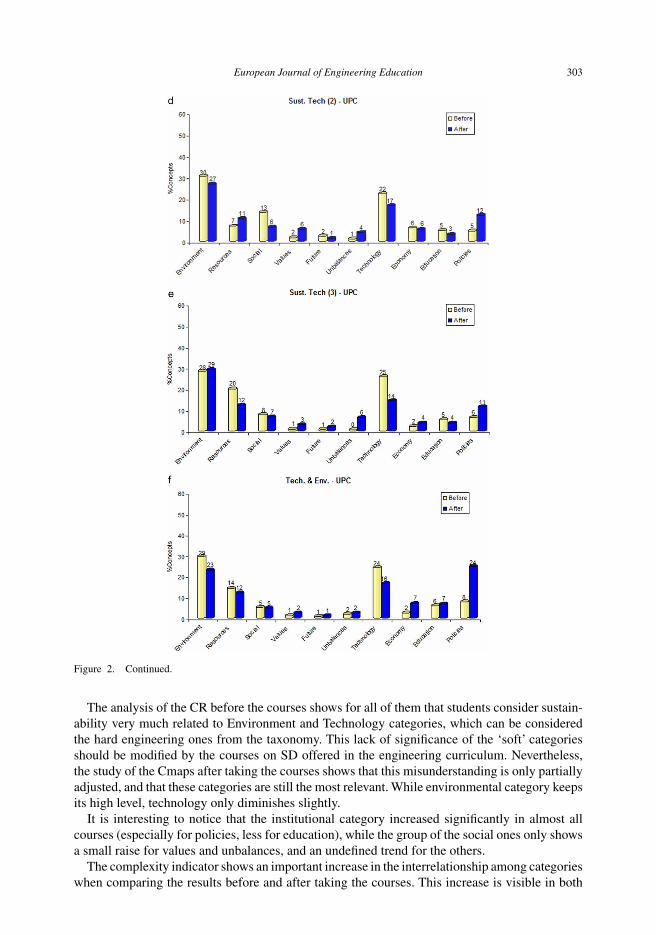
Figure 2. Continued.
The analysis of the CR before the courses shows for all of them that students consider sustain-ability very much related to Environment and Technology categories, which can be consideredthe hard engineering ones from the taxonomy. This lack of significance of the ‘soft’ categoriesshould be modified by the courses on SD offered in the engineering curriculum. Nevertheless,the study of the Cmaps after taking the courses shows that this misunderstanding is only partiallyadjusted, and that these categories are still the most relevant. While environmental category keepsits high level, technology only diminishes slightly.
It is interesting to notice that the institutional category increased significantly in almost allcourses (especially for policies, less for education), while the group of the social ones only showsa small raise for values and unbalances, and an undefined trend for the others.
The complexity indicator shows an important increase in the interrelationship among categorieswhen comparing the results before and after taking the courses. This increase is visible in both
304 J. Segalàs et al.
Table 4. Complexity indicator for all the courses.
Before AfterSample
Course before (after) NC Lca CO NC Lca CO
Sustainable Technology 38 (28) 8,4 0,35 2,9 15,8 1,21 19,1Energy III 32 (26) 6,7 0,04 0,3 8,9 0,31 2,8Sustainability & Technology (1) 224 (227) 6,3 0,13 0,8 22,7 0,45 10,1Sustainability & Technology (2) 208 (36) 7,2 0,24 1,7 18,8 0,48 9,0Sustainability & Technology (3) 35 (43) 8,4 0,34 2,9 23,9 0,51 12,2Technology & Environment 30 (31) 13,2 0,27 3,6 27,7 0,7 19,4
Figure 3. Evolution of the complexity indicator for each group before and after the courses.
indexes: the average number of concepts per students more than doubled (it increased from 9.4 to19.6) while the relative number of links inter-category (Lca) increased by a factor of 3. Overall,the complexity factor increases by a factor of 6, which shows a clear shift on the conceptualisationof sustainability by the students.
Comparing the results obtained from the different courses, it is difficult to see any direct trendin function of the type of course. More research is being conducted in order to identify anyrelationship between the teaching method and the results obtained. In any case, it is interestingto underline the important increase seen in the course S&T(1) and in course Energy III, whichneeds to be explored.
The results show that the distance courses present a lower increase of complexity, reflectingthat this aspect may be more easily skilled in the face-to-face courses.
5. Conclusions
The main result of the study is that the complexity of the students’ sustainability image increasessubstantially, thus showing that the main learning outcomes of the current SD courses is thecapacity to connect concepts in a systems’ perspective more than to identify these concepts in amore balanced way.
The analysis of the results shows that when teaching SD to engineering students an importantneed to emphasise social and institutional aspects, as well as the ‘soft’ knowledge related tosustainability. Indeed, the students’ a priori conception is that sustainability is mainly linked toEnvironment and Technological aspects, and the courses seemed not to succeed in highlighting

European Journal of Engineering Education 305
the importance of the social side. Especially the Ethical, Unbalances and Future generationscategories keep at very low rates.An additional result is that a redefinition of the role of technologyon sustainability is needed, from a source of environmental problems to a challenge to avoid andsolve them.
These two requirements have been taken into account in two new learning projects at UPC: anew course on SD and the ‘European Project Semester’ programme (Segalas et al. 2007). Thesetwo new programs are aimed to improve the learning of SD among engineering students. Nextstep of our research will focus on following the concept maps of the students that will participateon them, in particular to be able to compare the results between clearly different learning methods.
The analysis shows that the more active the learning process is, the more change we observe inboth indicators: category relevance distribution and complexity. Although the present work doesnot show a direct correlation, the hypothesis of the authors is that such types of learning stronglyfavour education for SD. Nevertheless this is a subject for further study.
Acknowledgements
The authors would like to acknowledge the UNESCO Chair of Sustainability and Delft University of Technology academicswho have helped us to pass the Cmap questionnaire to their students. We also would like to thank the Kiev Polytechnicinstitute for participating in the study. We are also grateful to all the students who have taken part in the survey.
References
Ahlberg, M., 2004. Concept mapping for sustainable development. Concept Maps: Theory, Methodology, Technology.Proceedings of the First International Conference on Concept Mapping, Pamplona, Spain.
Carrera, E., 2007. Portal Sostenibilitat: o com convertir la necessitat en virtud. Proceedings I Congres UPC Sostenible2015, UPC, Barcelona.
Corcoran, P.B., Calder, W. and Clagston, R.M. 2002. Introduction: higher education for sustainable development. HigherEducation Policy, 15(2), 99–103.
Engineering Education in Sustainable Development (EESD), 2004. The Declaration of Barcelona. SecondInternational Conference on Engineering Education in Sustainable Development [online]. Availablefrom: http://www.upc.edu/eesd-observatory/documents/BCN%20Declaration%20EESD_english.pdf [Accessed 20December 2007].
Gouli, E., Gogoulou, A., Paanikolaou, K. and Grigoriadou, M., 2004. Compass: an adaptive web-based concept mapassessment tool. Concept Maps: Theory, Methodology, Technology. Proceedings of the First International Conferenceon Concept Mapping, Pamplona, Spain.
Gouveia, V. and Valadares, J., 2004. Concept maps and the didactic role of assessment. Concept Maps: Theory,Methodology, Technology. Proceedings of the First International Conference on Concept Mapping, Pamplona,Spain.
Gregorio, R. and Freire,A., 2006. Reading and environmental education. Concept maps:Theory, methodology,Technology.Proceedings of the Second International Conference on Concept Mapping, San Jose, Costa Rica.
Holmberg, J. and Samuelsson, B.E., 2006. Drivers and barriers for implementing Sustainable Development in Higher Edu-cation. Education for Sustainable Development in Action. Technical Paper, 3. UNESCO Education Sector [online].Available from: http://unesdoc.unesco.org/images/ 0014/001484/148466E.pdf [Accessed 20 December 2007].
Iuli, R.J. and Helldén, G., 2004. Using concept maps as a research tool in science education research. Concept Maps: The-ory, Methodology, Technology. Proceedings of the First International Conference on Concept Mapping, Pamplona,Spain.
Jaen, M. and De Pro, A., 2006. Análisis de las percepciones que tienen los estudiantes de educación ambiental sobreproblemas sociales globales a través de los mapas de conceptos. Concept maps: Theory, methodology, Technology.Proceedings of the Second International Conference on Concept Mapping, San Jose, Costa Rica.
Legrand, E. 2000. Utilisation pragmatique de cartes Mentales comme outil dévaluation en éducation relative áénvironnement, 74–95.
Lourdel, N., Grondran, N., Laforest, V., Debray, B. and Brodhag, C., 2007. Sustainable Development cognitive map: anew method of evaluating student understanding. International Journal of Sustainability in Higher Education, 8 (2),170–182.
Lourdel, N., 2004. Methodes pedagogiques et represéntation dela compréhension du development durable: Applicationála formation des éléves ingenieurs. Projetde Thése.
Mulder, K., Segalas, J. and Cruz, Y., 2005. Training Engineers for Sustainable Development, Teaching Experiencesfrom Three engineering Institutions. SEFI 2005 Proceedings, Ankara: Middle East Technical University, Faculty ofEngineering. pp. 416–423.
306 J. Segalàs et al.
Novak, J.D. and Cañas,A.J., 2006. The Theory Underlying Concept Maps and How to Construct Them. Institute for Humanand Machine cognition, IHMC [online]. Available from: http://cmap.ihmc.us/Publications/ResearchPapers/TheoryUnderlyingConceptMaps.pdf(20/12/2007) [Accessed 20 December 2007].
Novak, J. and Gowin, D., 1984. Learning how to learn. New York: Cambridge University Press.Ruiz-Primo, M.A., 2004. Examining concept maps as an assessment tool. Concept Maps: Theory, Methodology,
Technology. Proceedings of the First International Conference on Concept Mapping, Pamplona, Spain.Segalas, J., Esbri, M.E. and Trullols, E., 2007. EPS2EVG’ European Project Semester a l’EPSEVG. Introducció de
competències transversals en sostenibilitat als títols de Grau. I Congres UPC Sostenible 2015, Barcelona [online].Available from: http://hdl.handle.net/2099/3460 [Accessed 20 December 2007].
UNITED NATIONS, 1992. Earth Summit. Agenda 21. United Nations Programme of Action from Rio. United NationsPublications.
About the authors
Jordi Segalàs (1967) works as a senior lecturer at the School of Engineering of Vilanova i la Geltrú of the TechnicalUniversity of Catalonia (UPC). He received his engineering degree from Technical University of Catalonia. Since 2000he has been working in curriculum greening policies and actions plans at the Technical University of Catalonia. He isleading the Education for Sustainable Development research group at the UNESCO chair for Sustainability. Since 2005he has been working in TEMPUS (trans-European cooperation scheme for higher education) projects in relation to highereducation for sustainable development. He is the director of the Catalan Research Network of Education for SustainableDevelopment and the Vice-Dean for International Relations and Sustainability at the School of Engineering of Vilanovai la Geltrú. ([email protected])
Didac Ferrer-Balas (Barcelona, 1974) graduated as an industrial and materials engineer in 1997. He obtained a doctoratein materials science in 2001 from the Technical University of Catalonia (UPC). In year 2000, he was appointed as theCoordinator of the Environment Plan of UPC. Since 2005, he is the technical director of the Center for Sustainability,with 16 people, and a wide number of projects in curriculum development, sustainable education, management, researchand communication. In 2004, he was in charge of the organisation of the second Engineering Education in SustainableDevelopment (EESD) conference, and also participated in the committee of the following EESD conferences in Lyon(2006) and Graz (2008). He has coordinated various publications and published several articles on the experiences ofUPC. He is very interested in sharing experiences and cooperating with other universities around the world and thereforeis active in EMSU, RCE, AGS and EESD networks among other. ([email protected])
Karel F. Mulder (1956) works as associate professor at the department of Technology, Policy & Management of DelftUniversity of Technology, in the group Technology Dynamics and Sustainable Development. He received an engineeringdegree from Twente University, and a doctorate in Business Administration from Groningen University in 1992. He wasin charge of a project to include Sustainable Development in all engineering curricula at Delft University of Technologyfrom 1997–2005 and initiated the European Engineering Education in Sustainable Development network. He wroteSustainable Development for Engineers, A handbook and Resource Guide, Sheffield: Greenleaf, ISBN-10: 1-874719-19-5.([email protected])


![Some Critics on Maps Concerning on Studies of the Red Seal Ship Trade and the Japanese Quarters in Vietnam [In Japanese]](https://static.fdokumen.com/doc/165x107/63295c196442da5b350b1026/some-critics-on-maps-concerning-on-studies-of-the-red-seal-ship-trade-and-the-japanese.jpg)