MAPS I: BASIC FOUNDATIONS
59
A m ap isagraphicrepresentation developed to convey (com m unicate)spatial relationshipstypically extracted from physical, cultural , or societal dim ensions. The International C artographic Association definesa m ap as: "a representation, nom inally to scale and on a flat m edium , ofaselection ofm aterial orabstractfeatureson, orin relation to, the surface ofthe Earth." The Map
-
Upload
independent -
Category
Documents
-
view
0 -
download
0
Transcript of MAPS I: BASIC FOUNDATIONS
A map is a graphic representation developed to convey (comm unicate) spatial relationships typically extracted from physical, cultural, or societal dim ensions. The International Cartographic Association defines a m ap as: "a representation, nominally to scale and on a flat m edium , of a selection of m aterial or abstract features on, or in relation to, the surface of the Earth."
The Map
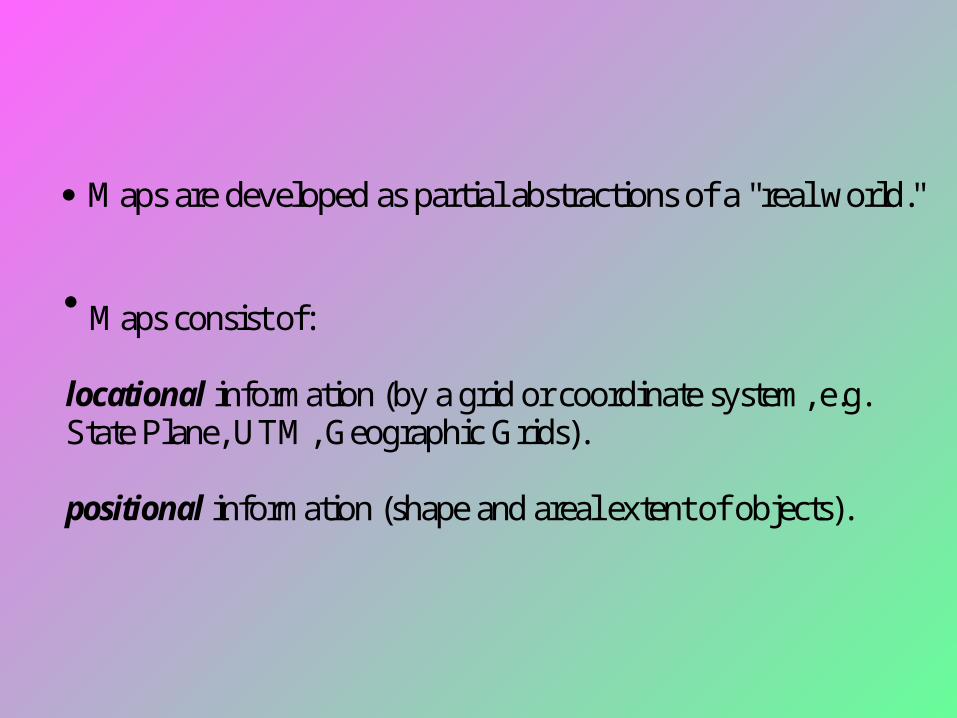
M aps are developed as partial abstractions of a "real world."
M aps consist of:
locational information (by a grid or coordinate system, e.g.State Plane, UTM , Geographic Grids).
positional information (shape and areal extent of objects).
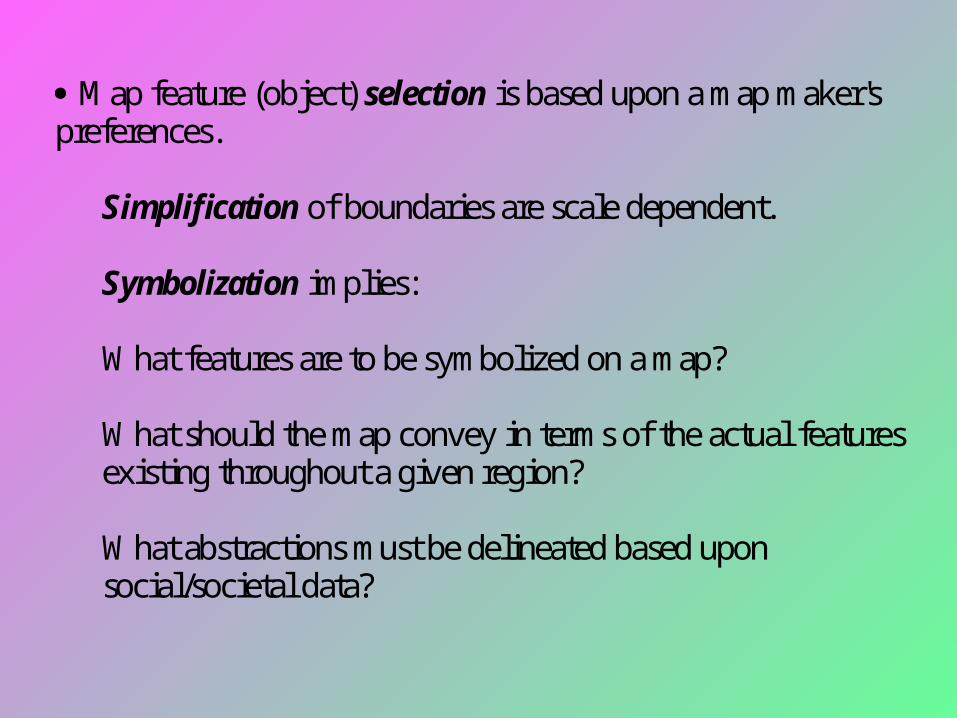
M ap feature (object) selection is based upon a map maker's preferences. Simplification of boundaries are scale dependent.
Symbolization implies: W hat features are to be symbolized on a map? W hat should the map convey in terms of the actual features existing throughout a given region? W hat abstractions must be delineated based upon social/societal data?
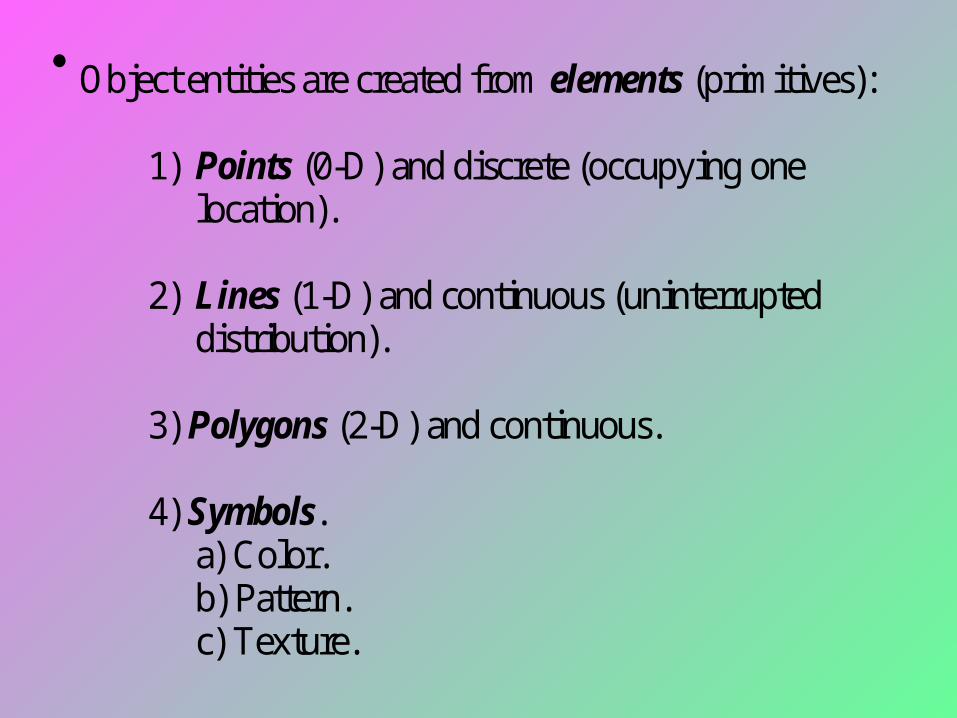
Object entities are created from elements (primitives):
1) Points (0-D) and discrete (occupying onelocation).
2) Lines (1-D) and continuous (uninterrupteddistribution).
3) Polygons (2-D) and continuous.
4) Symbols.a) Color.b) Pattern.c) Texture.
Defining a Location in Space
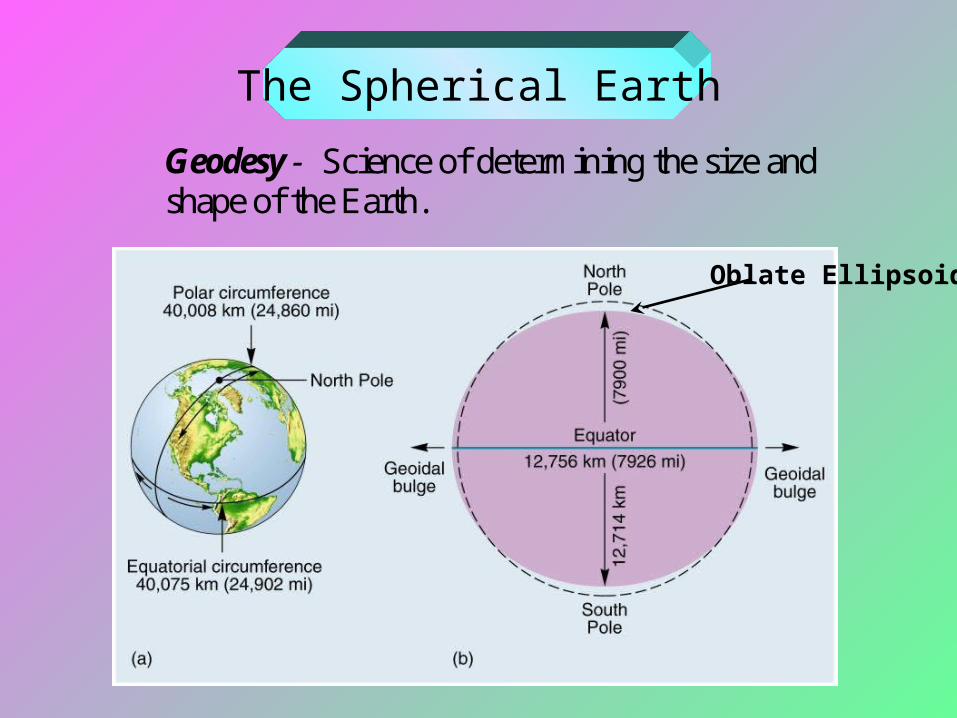
The Spherical EarthGeodesy - Science of determining the size andshape of the Earth.
Oblate Ellipsoid
Datum – defines the position of the ellipsoid. A local datum aligns a ellipsoid to optimally fit the surface of the Earth. An origin point on the surface of the ellipsoid is aligned with a point on the Earth’s surface. All other coordinates are determined from the origin point. Local datums (NAD27, NAD83) are offset from the center of the earth.
NAD27 Datum
Uses the Clark 1866 spheroid. Origin is M eades Ranch, KS. Control points from ground surveys of the 1800’s. Calculations for many control points are inconsistent.
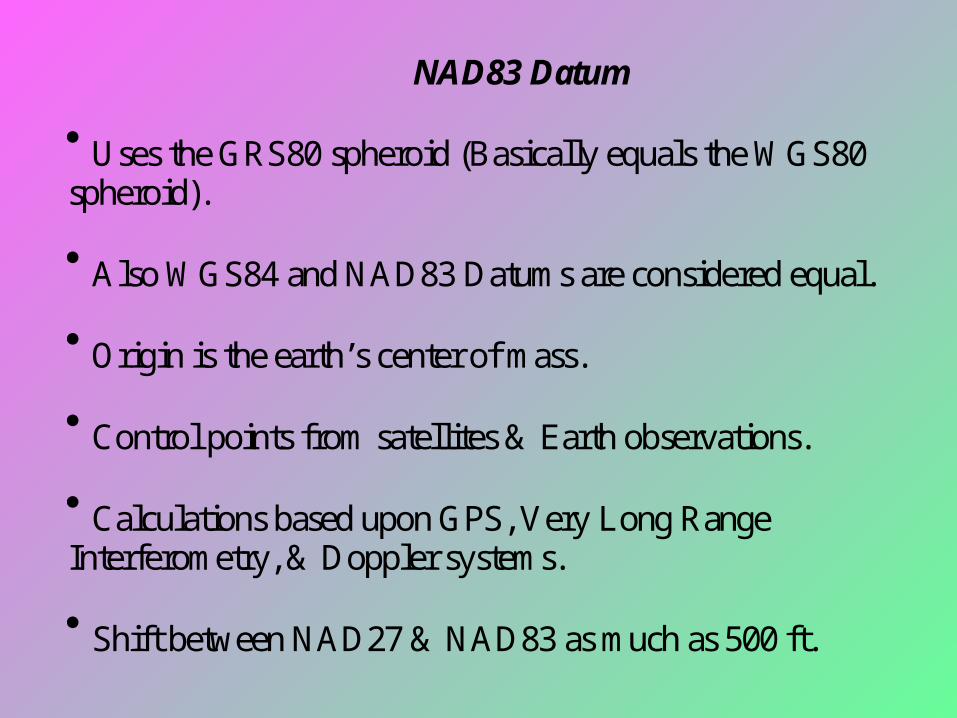
NAD83 Datum
Uses the GRS80 spheroid (Basically equals the W GS80spheroid). Also W GS84 and NAD83 Datums are considered equal. Origin is the earth’s center of mass. Control points from satellites & Earth observations. Calculations based upon GPS, Very Long RangeInterferometry, & Doppler systems. Shift between NAD27 & NAD83 as much as 500 ft.
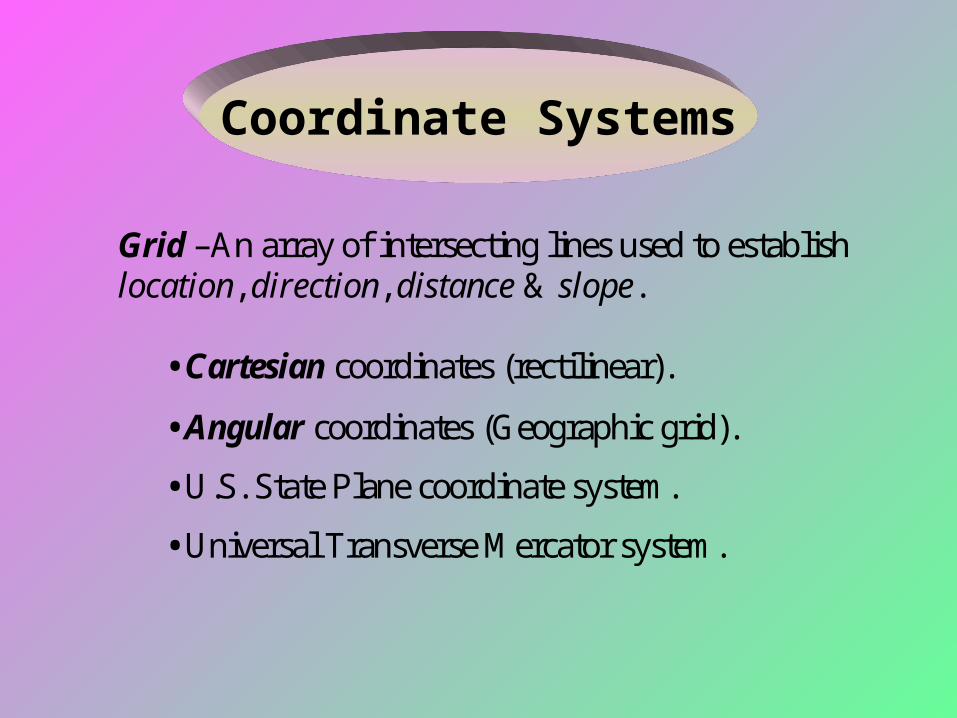
Grid –An array of intersecting lines used to establish location, direction, distance & slope. • Cartesian coordinates (rectilinear).
• Angular coordinates (Geographic grid). • U.S. State Plane coordinate system. • Universal Transverse M ercator system.
Coordinate Systems
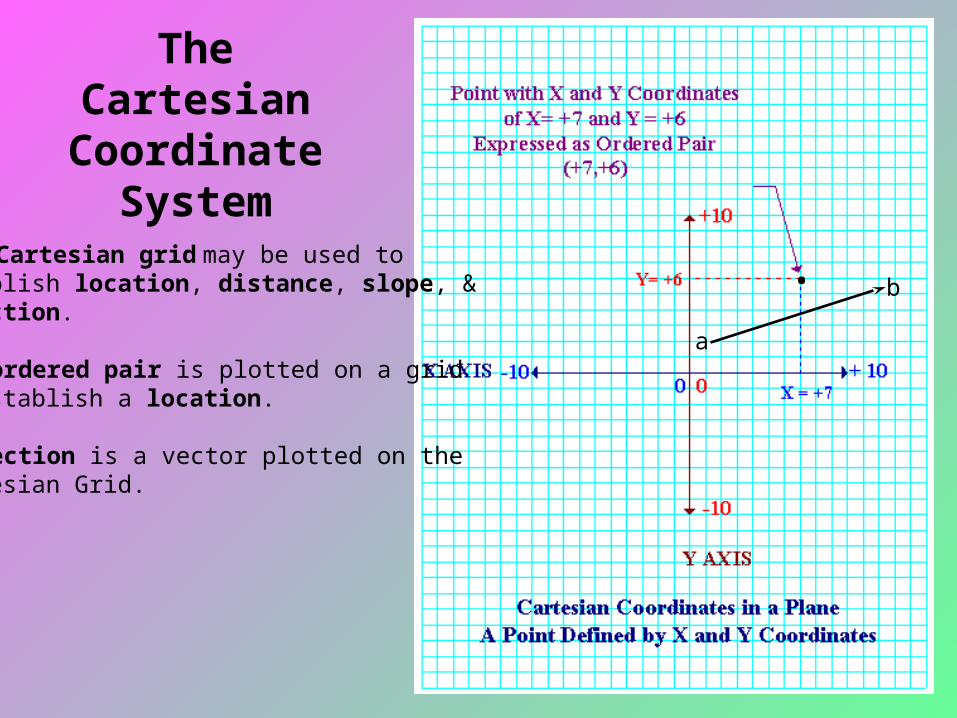
The CartesianCoordinate
System
a
b• The Cartesian grid may be used to establish location, distance, slope, & direction.
• An ordered pair is plotted on a grid to establish a location.
• Direction is a vector plotted on the Cartesian Grid.
•
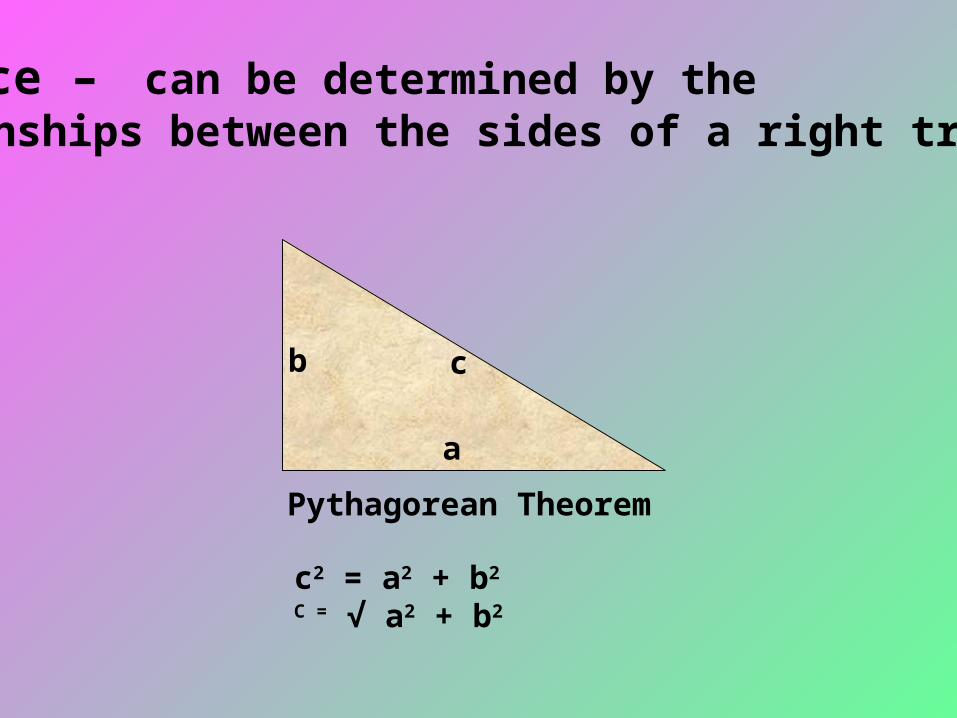
c2 = a2 + b2
C = √ a2 + b2
a
b c
Pythagorean Theorem
Distance – can be determined by the relationships between the sides of a right triangle.
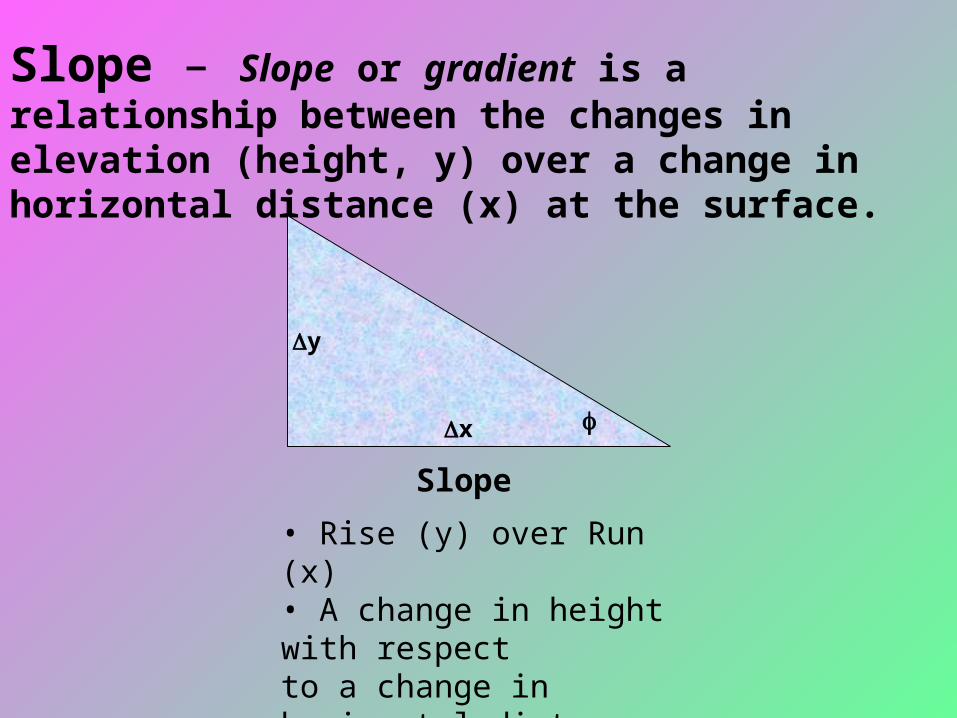
Slope – Slope or gradient is a relationship between the changes in elevation (height, y) over a change in horizontal distance (x) at the surface.
• Rise (y) over Run (x)• A change in height with respect to a change in horizontal distance.• y/x or Tan
Slopex
y
Geographic Coordinate System
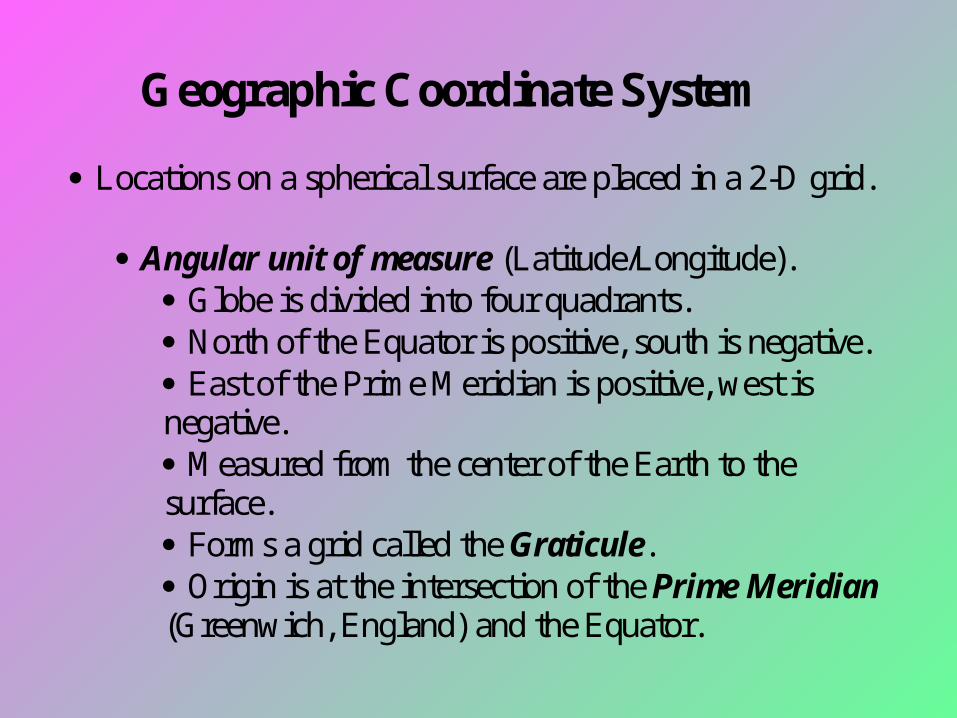
Locations on a spherical surface are placed in a 2-D grid.
Angular unit of measure (Latitude/Longitude). Globe is divided into four quadrants.
North of the Equator is positive, south is negative. East of the Prime M eridian is positive, west is negative. M easured from the center of the Earth to the surface.
Forms a grid called the Graticule. Origin is at the intersection of the Prime Meridian (Greenwich, England) and the Equator.
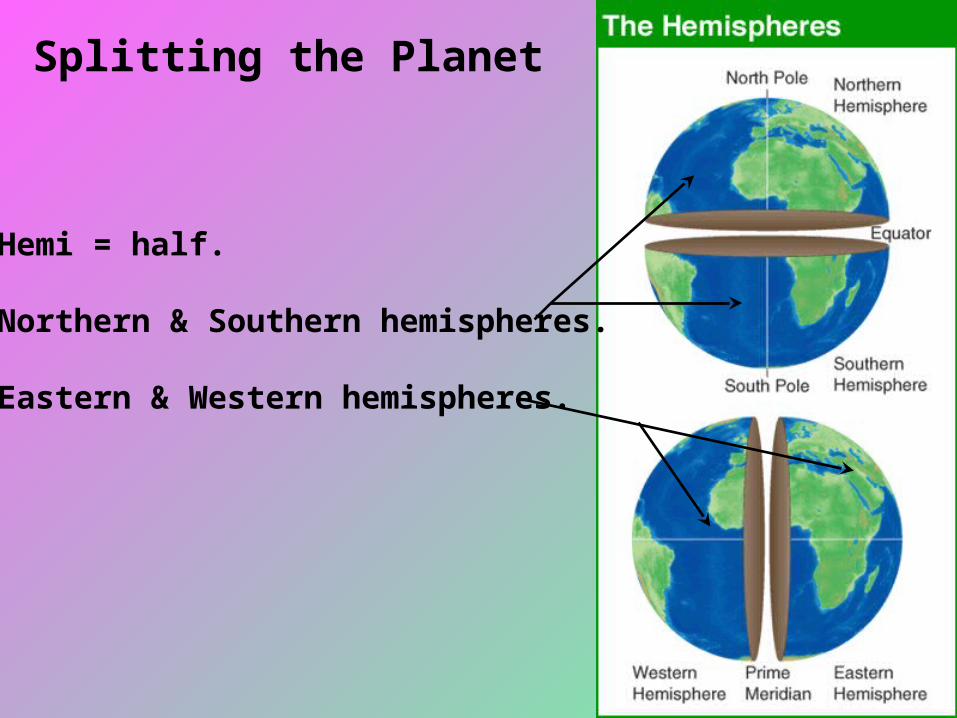
• Hemi = half.
• Northern & Southern hemispheres.
• Eastern & Western hemispheres.
Splitting the Planet
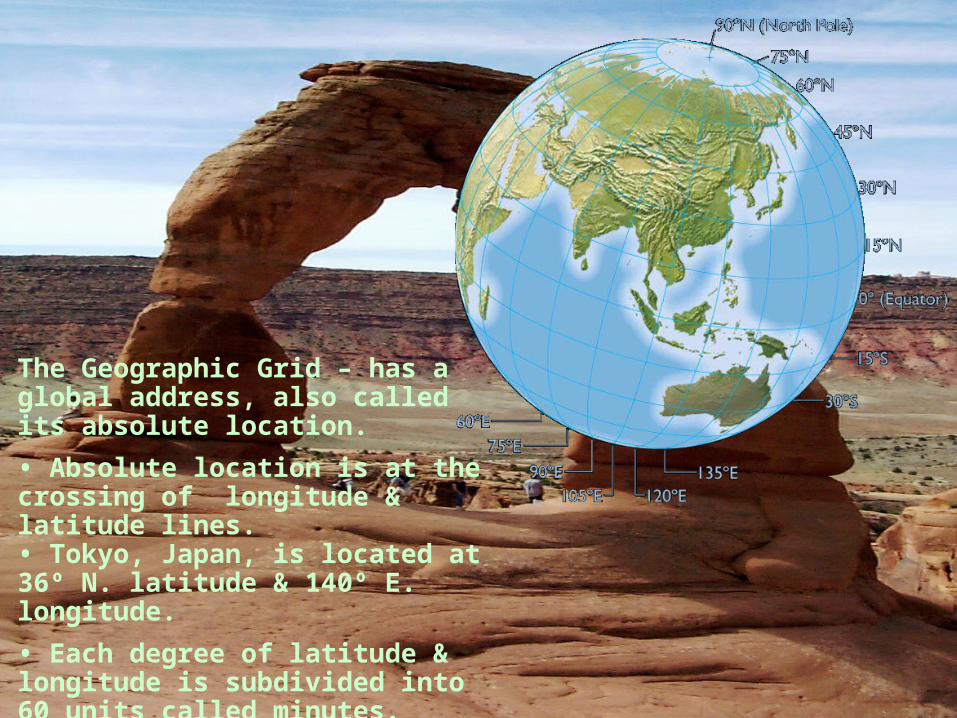
The Geographic Grid – has a global address, also called its absolute location. • Absolute location is at the crossing of longitude & latitude lines. • Tokyo, Japan, is located at 36º N. latitude & 140º E. longitude. • Each degree of latitude & longitude is subdivided into 60 units called minutes.• Each minute is divided into 60 seconds.
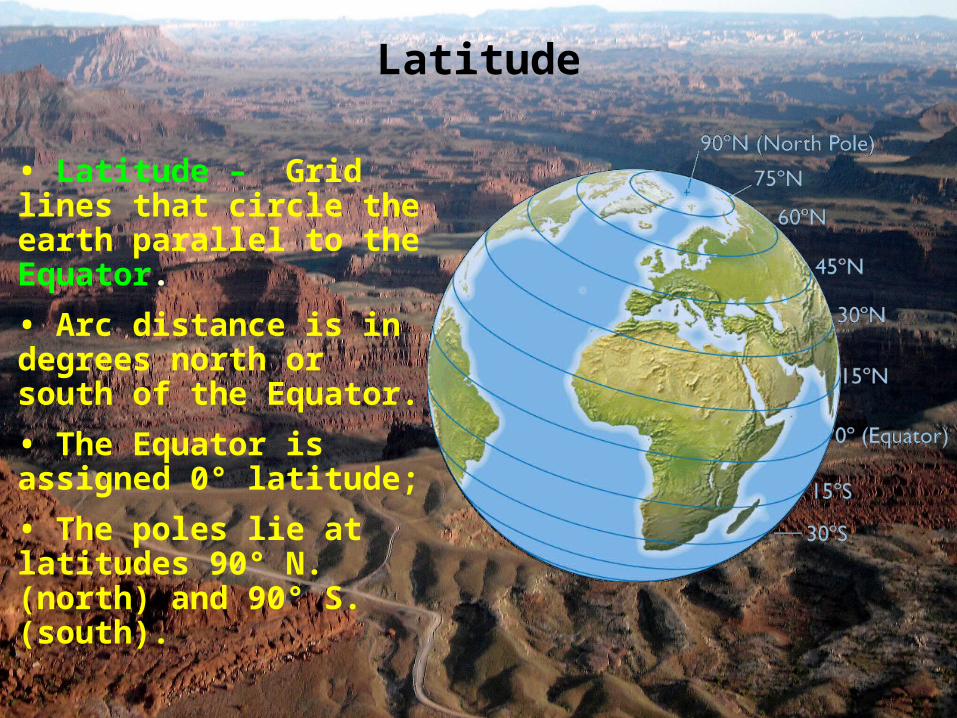
• Latitude – Grid lines that circle the earth parallel to the Equator. • Arc distance is in degrees north or south of the Equator.• The Equator is assigned 0° latitude;• The poles lie at latitudes 90° N. (north) and 90° S. (south).
Latitude
Latitude
Latitude
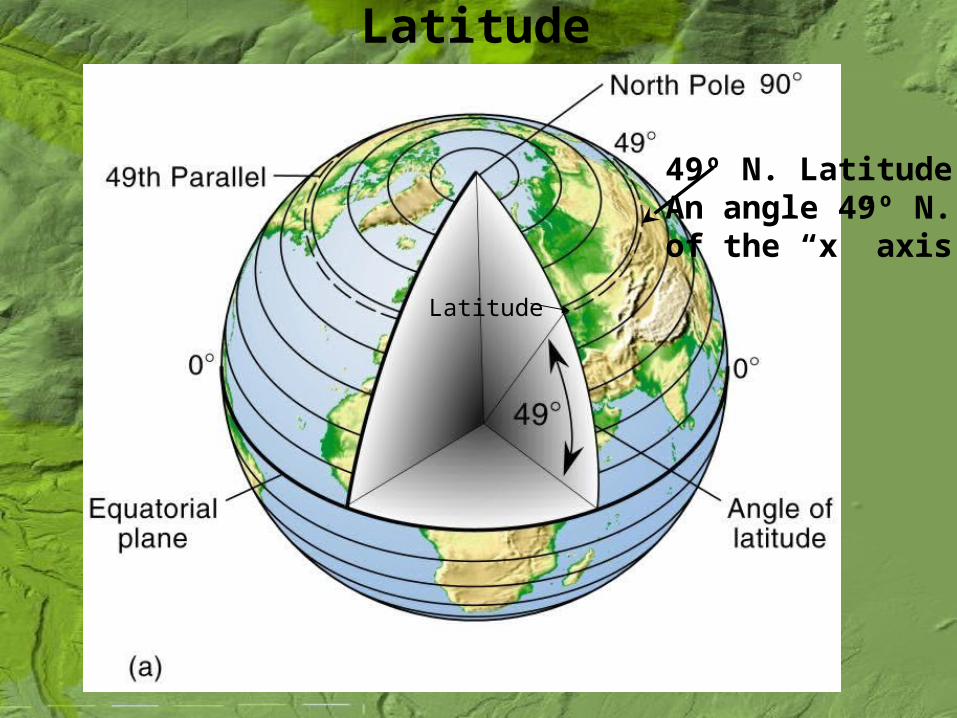
49º N. LatitudeAn angle 49º N.of the “x” axis.
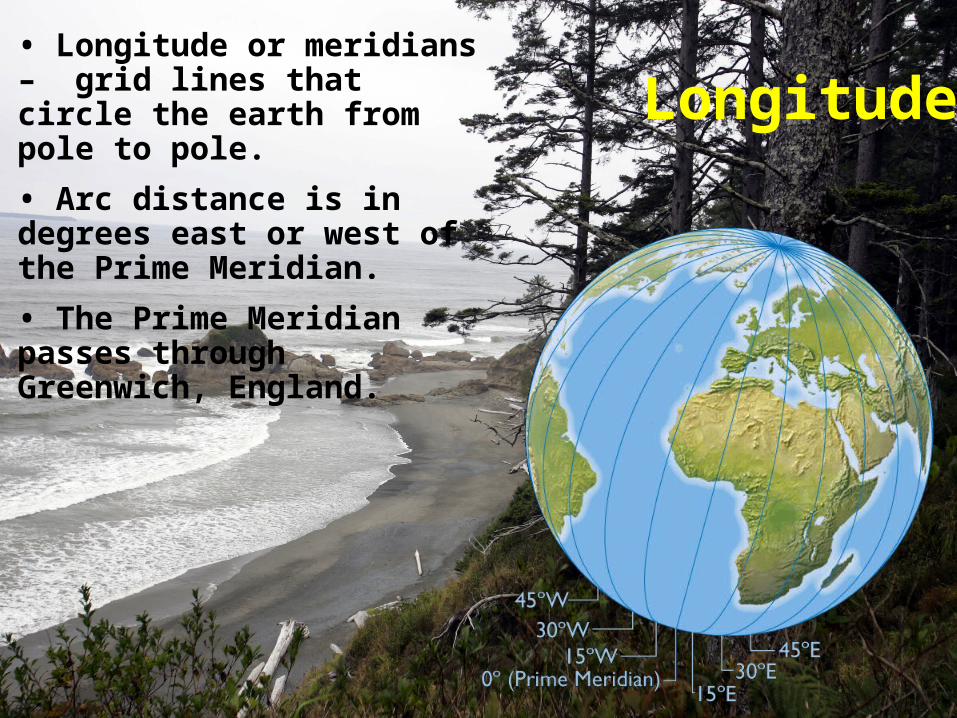
• Longitude or meridians – grid lines that circle the earth from pole to pole. • Arc distance is in degrees east or west of the Prime Meridian.• The Prime Meridian passes through Greenwich, England.
Longitude
Longitude
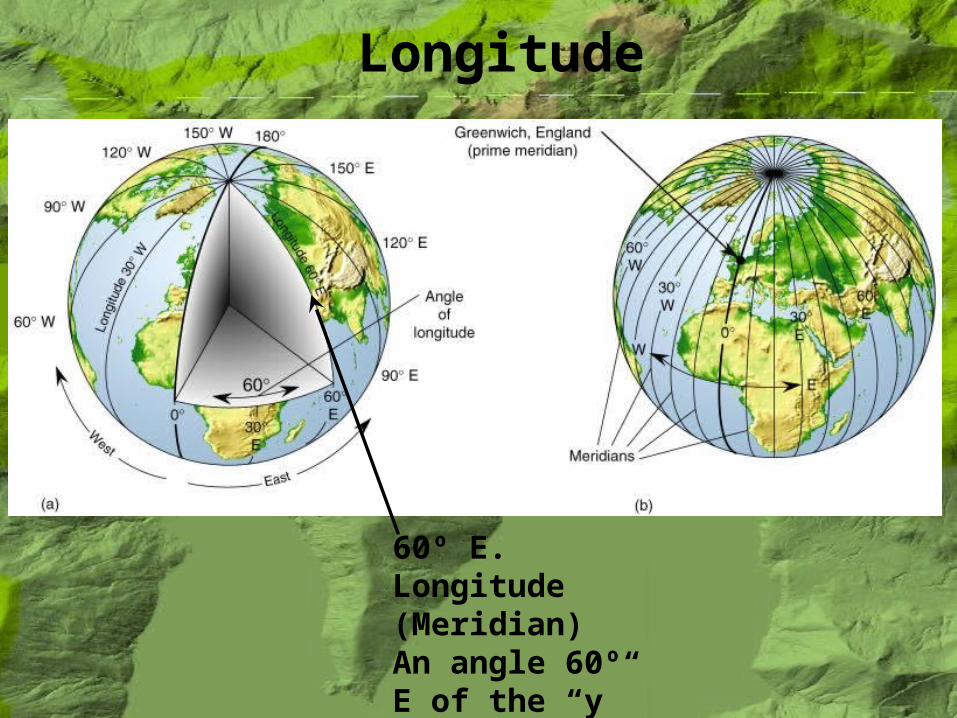
60º E. Longitude (Meridian)An angle 60º E of the “y” axis.
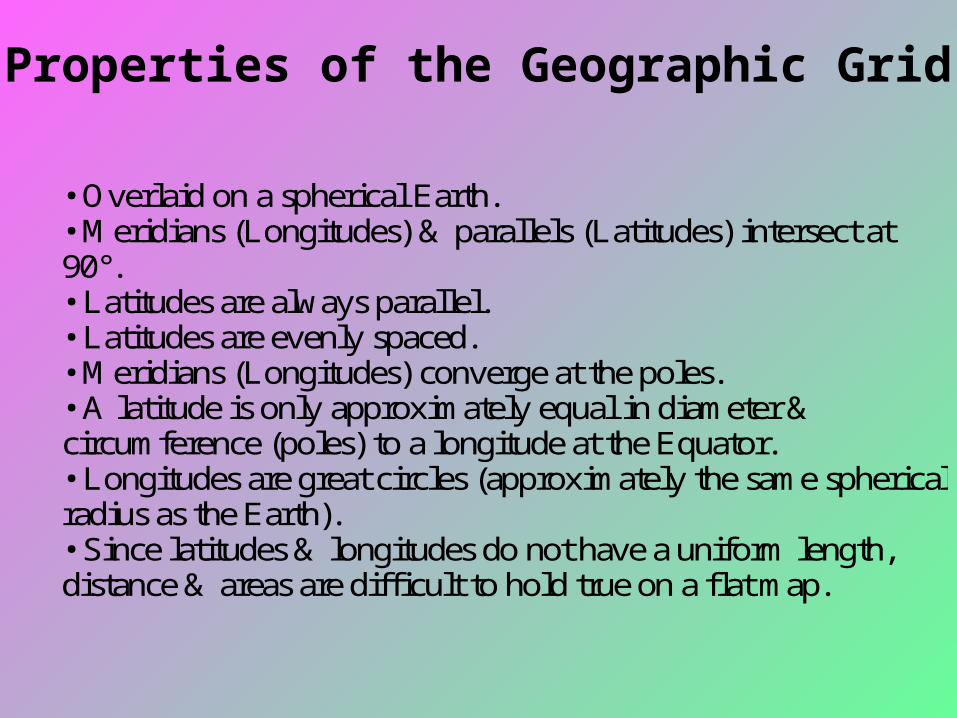
• Overlaid on a spherical Earth. • M eridians (Longitudes) & parallels (Latitudes) intersect at 90°. • Latitudes are always parallel. • Latitudes are evenly spaced. • M eridians (Longitudes) converge at the poles. • A latitude is only approximately equal in diameter & circumference (poles) to a longitude at the Equator. • Longitudes are great circles (approximately the same spherical radius as the Earth). • Since latitudes & longitudes do not have a uniform length, distance & areas are difficult to hold true on a flat map.
Properties of the Geographic Grid
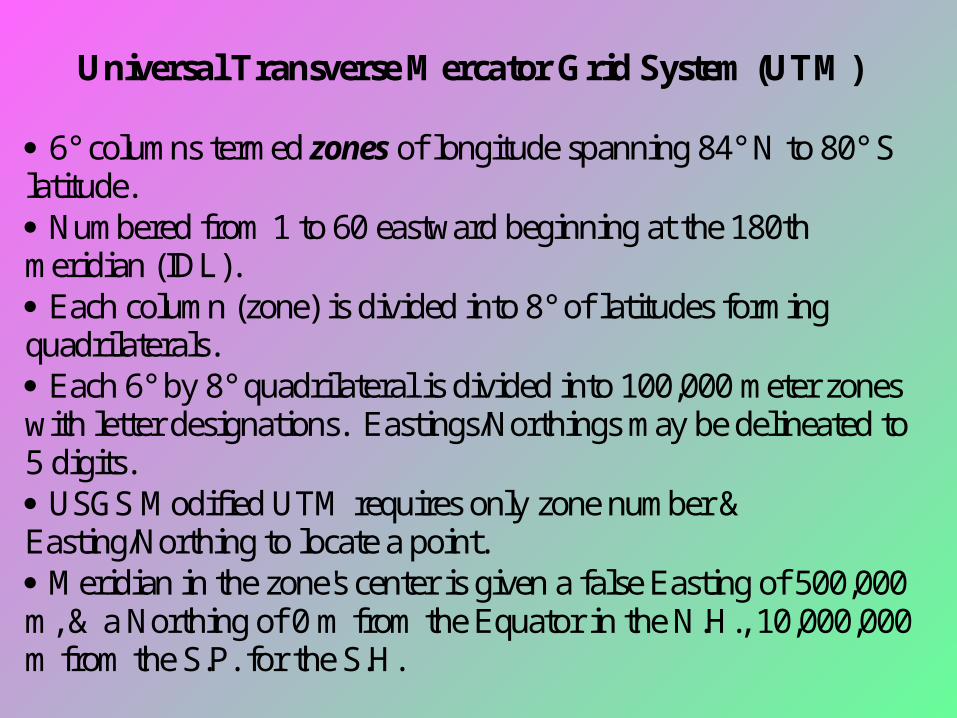
Universal Transverse M ercator G rid System (UTM ) 6° columns termed zones of longitude spanning 84° N to 80° S latitude. Numbered from 1 to 60 eastward beginning at the 180th meridian (IDL). Each column (zone) is divided into 8° of latitudes forming quadrilaterals. Each 6° by 8° quadrilateral is divided into 100,000 meter zones with letter designations. Eastings/Northings may be delineated to 5 digits. USGS M odified UTM requires only zone number & Easting/Northing to locate a point. M eridian in the zone's center is given a false Easting of 500,000 m, & a Northing of 0 m from the Equator in the N.H., 10,000,000 m from the S.P. for the S.H.
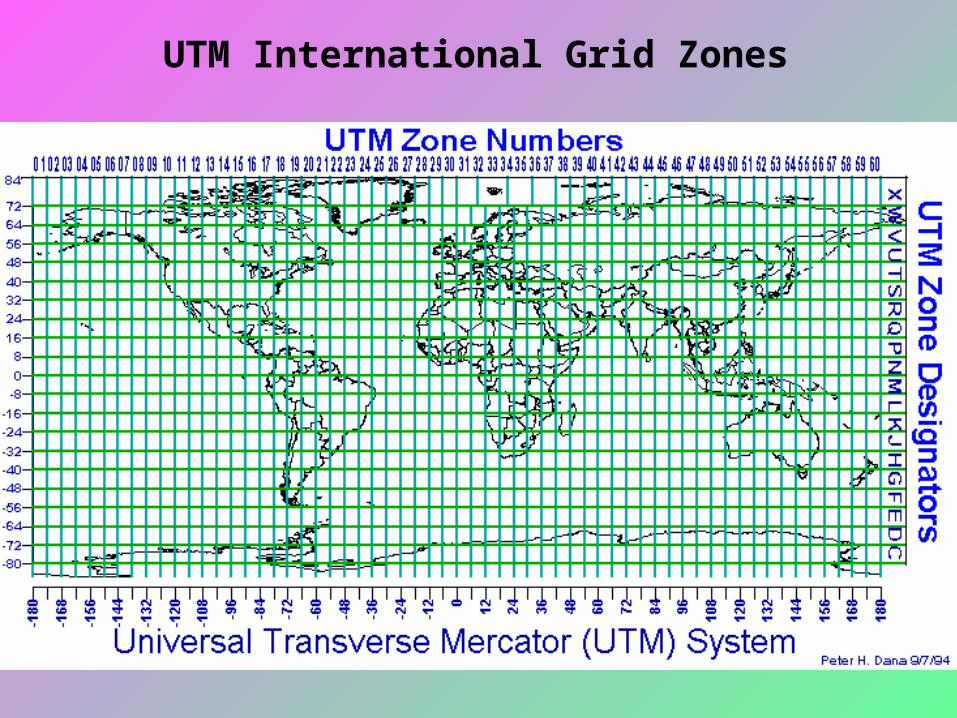
UTM International Grid Zones
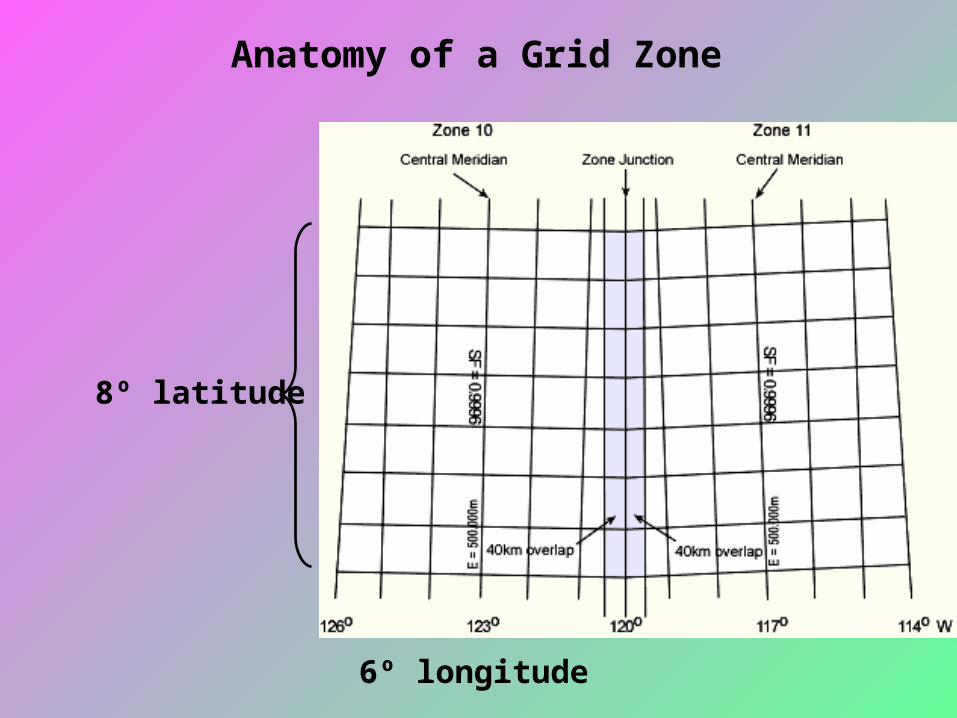
8º latitude
6º longitude
Anatomy of a Grid Zone
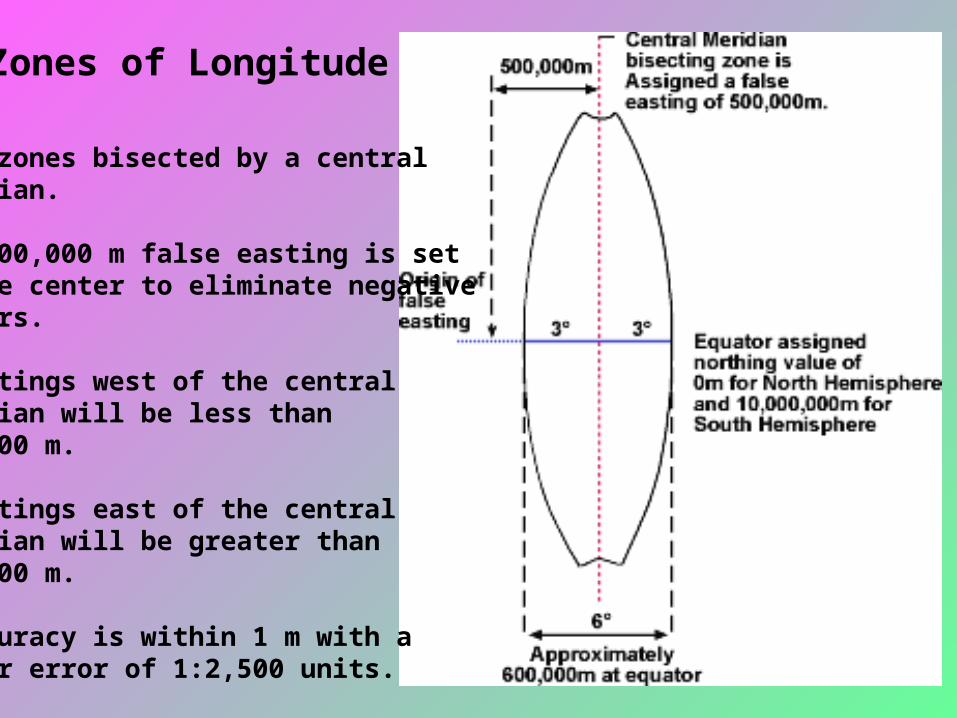
• 6º zones bisected by a centralmeridian.
• A 500,000 m false easting is set at the center to eliminate negative numbers.
• Eastings west of the centralmeridian will be less than 500,000 m.
• Eastings east of the central meridian will be greater than 500,000 m.
• Accuracy is within 1 m with a linear error of 1:2,500 units.
Zones of Longitude
State Plane Coordinate System • Developed by US Coast & Geodetic Survey (1930's) for each state. • Based on the Transverse Mercator projection or Lambert's Conformal Conic. • In 10,000 ft tics (Eastings/Northings), although recent maps have meter equivalents. • On the Transverse Mercator, scale is constant north/south along a meridian, & varies east/west. • On a Lambert's Conformal Conic, scale is constant east/west, & varies north/south. • Four times more accurate that the UTM (smaller zones). • M aximun linear error of 1:10,000 units.
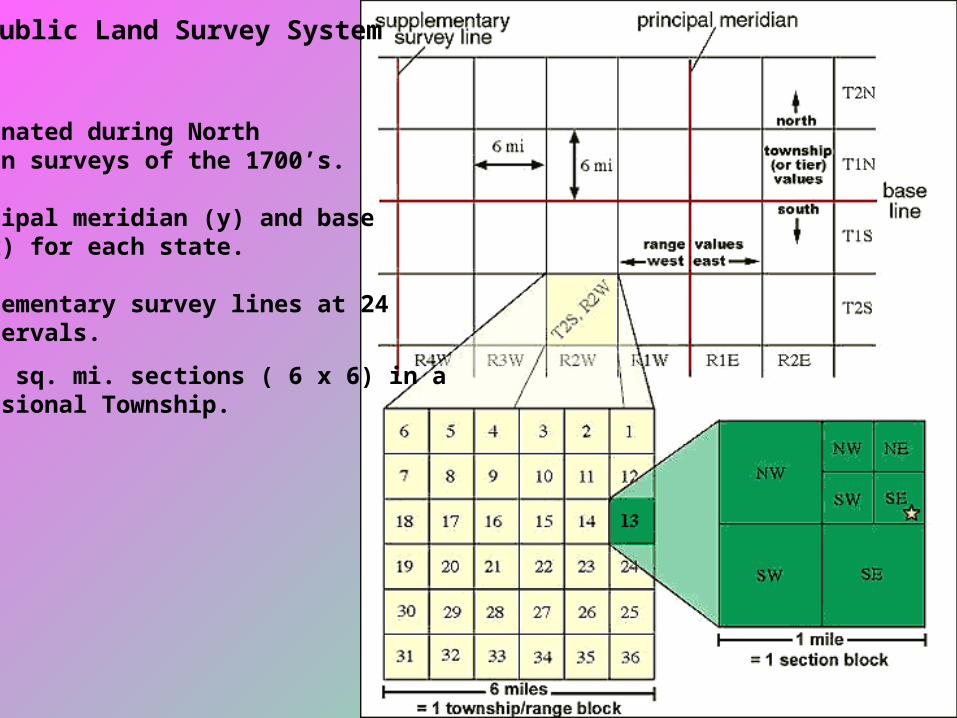
Public Land Survey System
• Originated during North American surveys of the 1700’s.
• Principal meridian (y) and baseline (x) for each state.
• Supplementary survey lines at 24mi. intervals.• 36, 1 sq. mi. sections ( 6 x 6) in a Congressional Township.
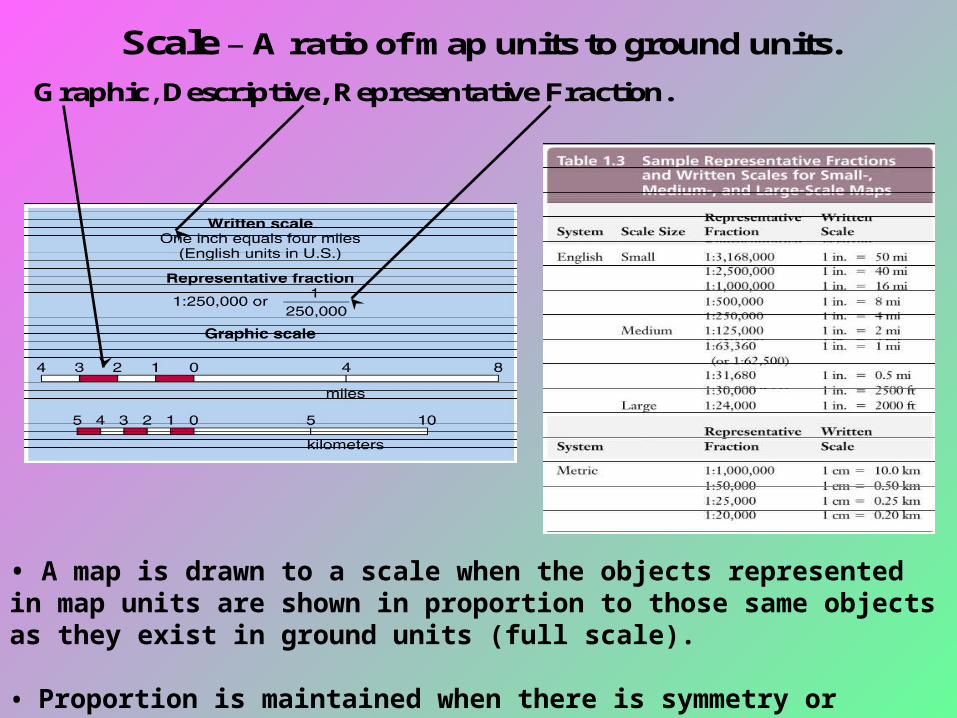
Scale–A ratio of m ap units to ground units.Graphic, Descriptive,Representative Fraction.
• A map is drawn to a scale when the objects represented in map units are shown in proportion to those same objects as they exist in ground units (full scale).
• Proportion is maintained when there is symmetry or balance between the size, shape, and magnitude of objects at full scale compared to its reduced model.
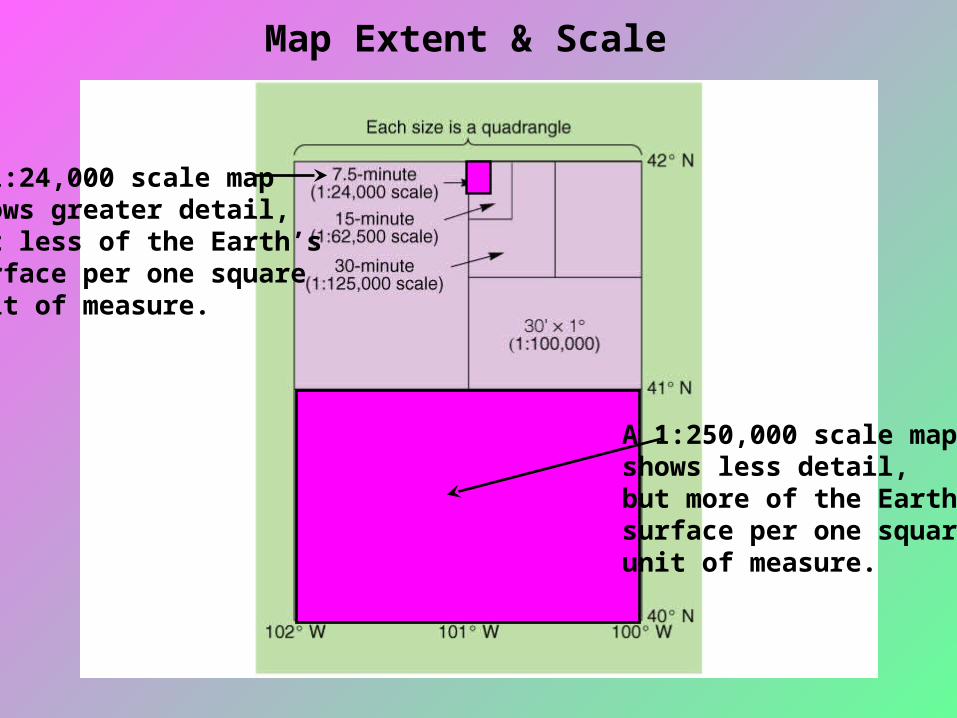
Map Extent & Scale
A 1:24,000 scale map shows greater detail,but less of the Earth’ssurface per one squareunit of measure.
A 1:250,000 scale map shows less detail,but more of the Earth’ssurface per one squareunit of measure.
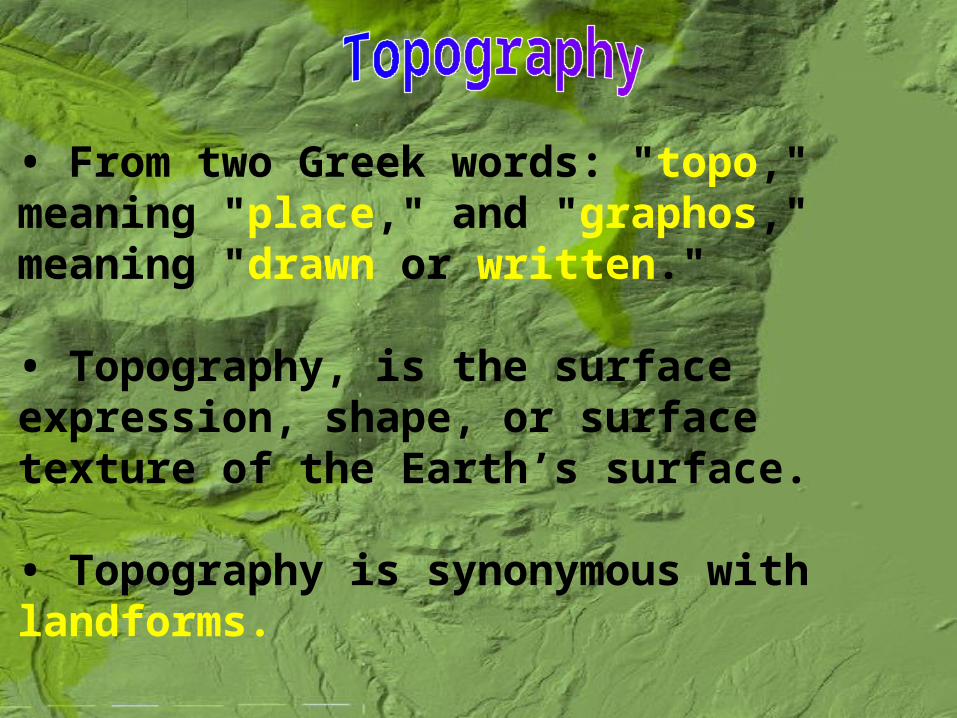
• From two Greek words: "topo," meaning "place," and "graphos," meaning "drawn or written."
• Topography, is the surface expression, shape, or surface texture of the Earth’s surface.
• Topography is synonymous with landforms.
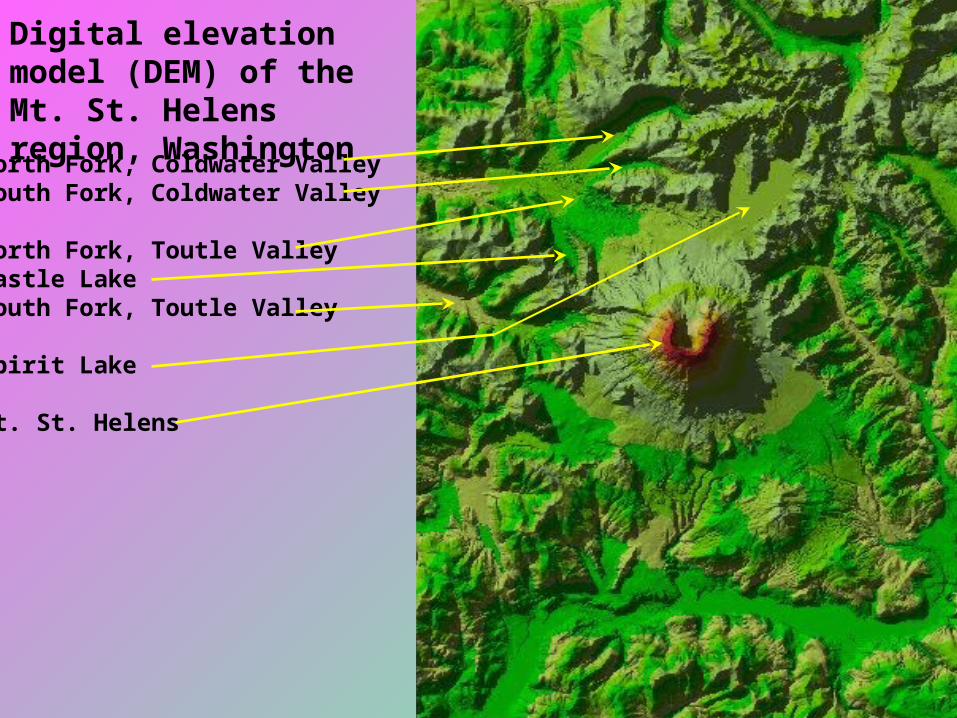
Digital elevation model (DEM) of the Mt. St. Helens region, WashingtonNorth Fork, Coldwater Valley
South Fork, Coldwater Valley
North Fork, Toutle ValleyCastle LakeSouth Fork, Toutle Valley
Spirit Lake
Mt. St. Helens
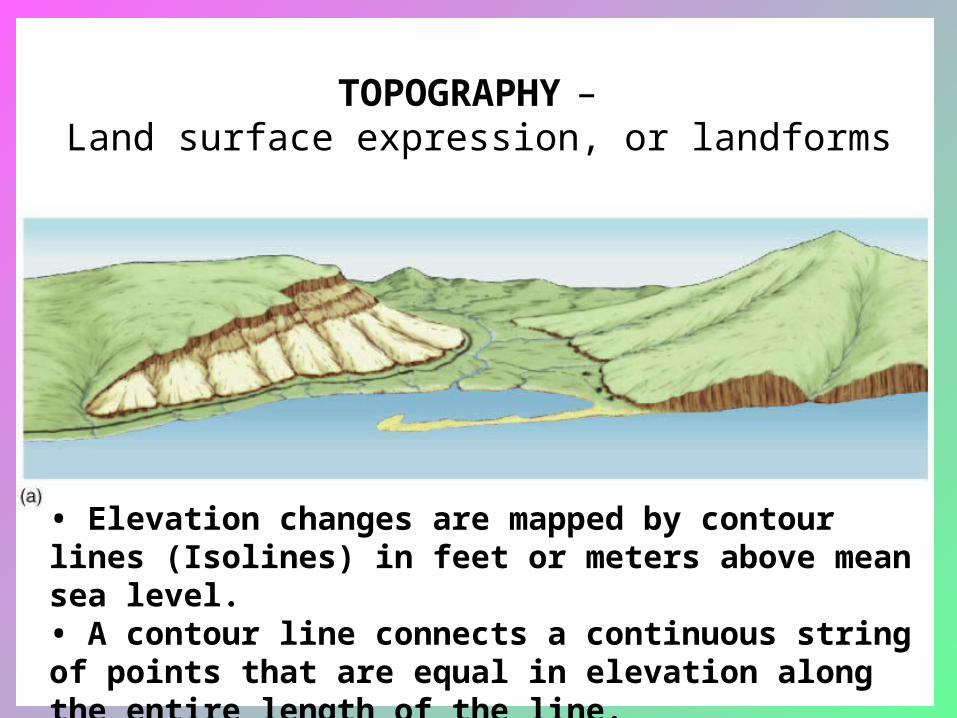
TOPOGRAPHY – Land surface expression, or landforms
• Elevation changes are mapped by contour lines (Isolines) in feet or meters above mean sea level. • A contour line connects a continuous string of points that are equal in elevation along the entire length of the line.
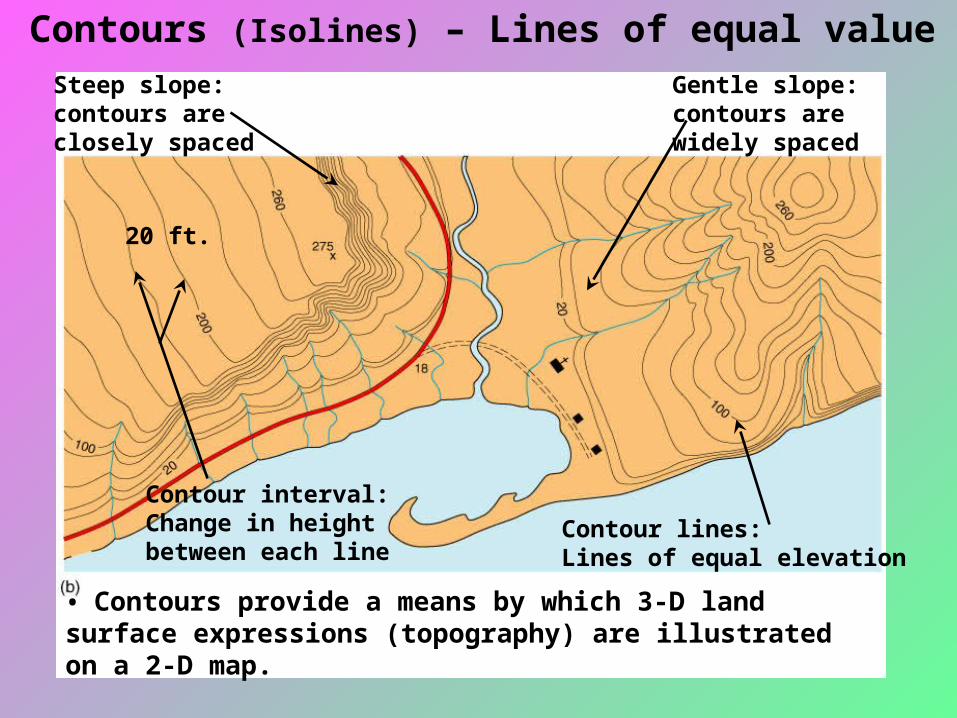
Contours (Isolines) – Lines of equal value
Contour interval: Change in height between each line
20 ft.
Contour lines: Lines of equal elevation
Steep slope:contours are closely spaced
Gentle slope:contours are widely spaced
• Contours provide a means by which 3-D land surface expressions (topography) are illustrated on a 2-D map.
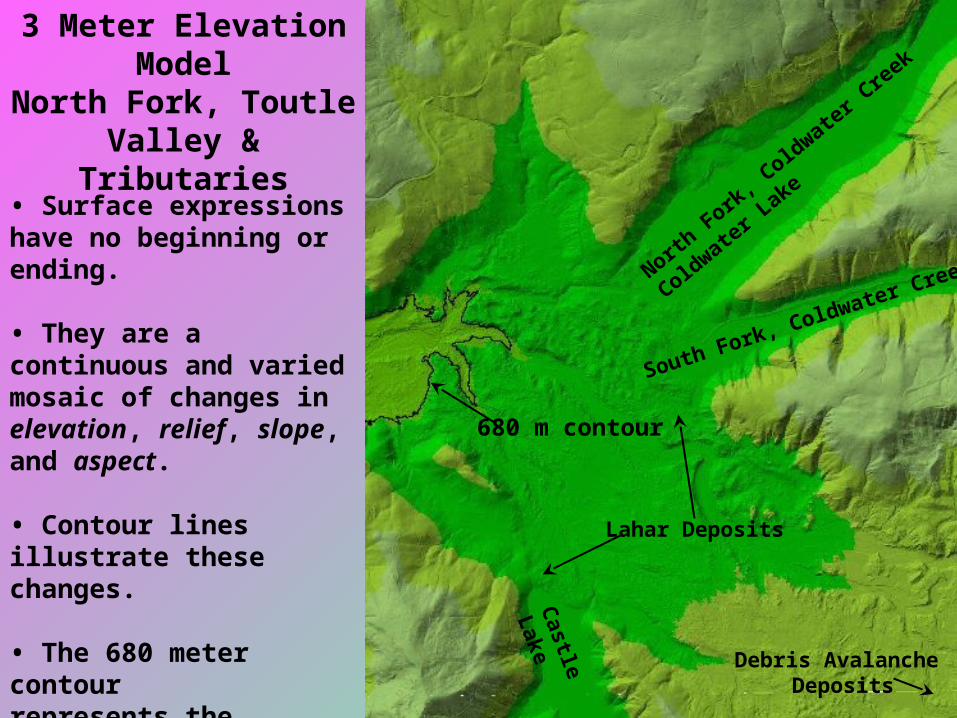
• Surface expressions have no beginning or ending.
• They are a continuous and varied mosaic of changes in elevation, relief, slope, and aspect.
• Contour lines illustrate these changes.
• The 680 meter contour represents the perimeter of a surface above mean sea level.
680 m contour
North
Fork,
Coldwa
ter Cr
eek
Coldwa
ter La
ke
Castle
Lake
South Fork
, Coldwate
r Creek
Lahar Deposits
Debris Avalanche Deposits
3 Meter Elevation Model
North Fork, Toutle Valley &
Tributaries
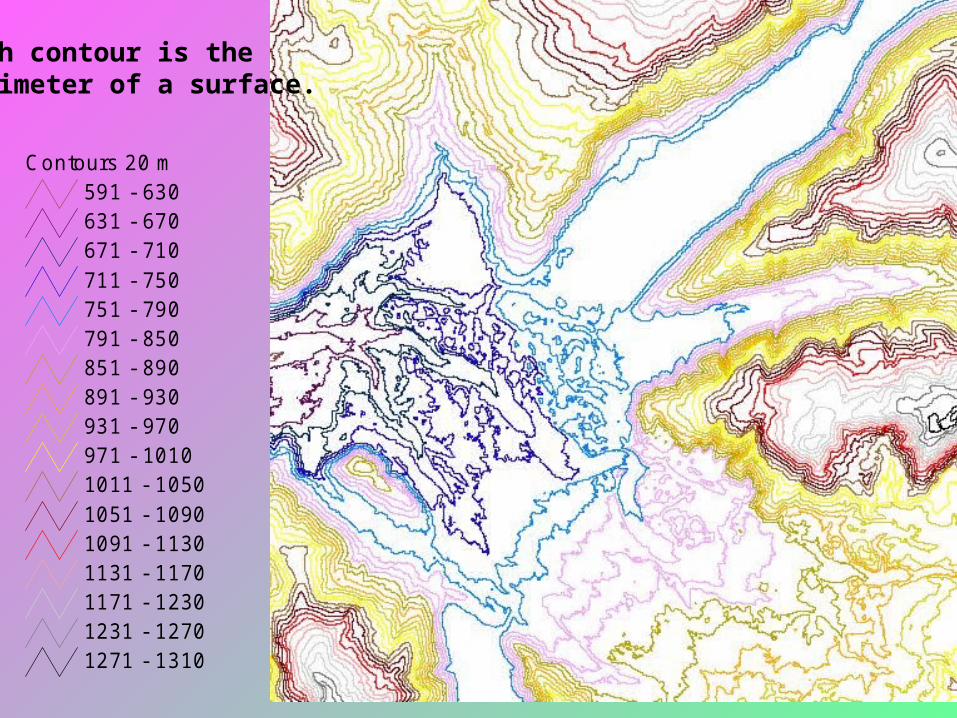
C ontours 20 m591 - 630631 - 670671 - 710711 - 750751 - 790791 - 850851 - 890891 - 930931 - 970971 - 10101011 - 10501051 - 10901091 - 11301131 - 11701171 - 12301231 - 12701271 - 1310
Each contour is theperimeter of a surface.
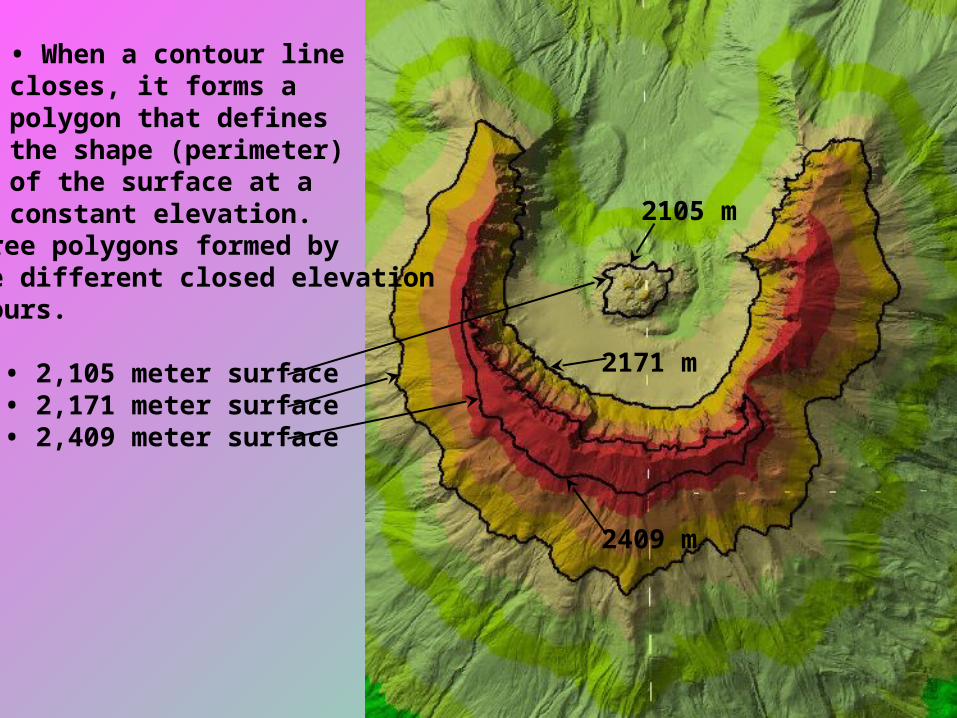
2105 m
2171 m
2409 m
• When a contour line closes, it forms a polygon that defines the shape (perimeter) of the surface at a constant elevation.
• Three polygons formed by three different closed elevation contours.
• 2,105 meter surface • 2,171 meter surface • 2,409 meter surface
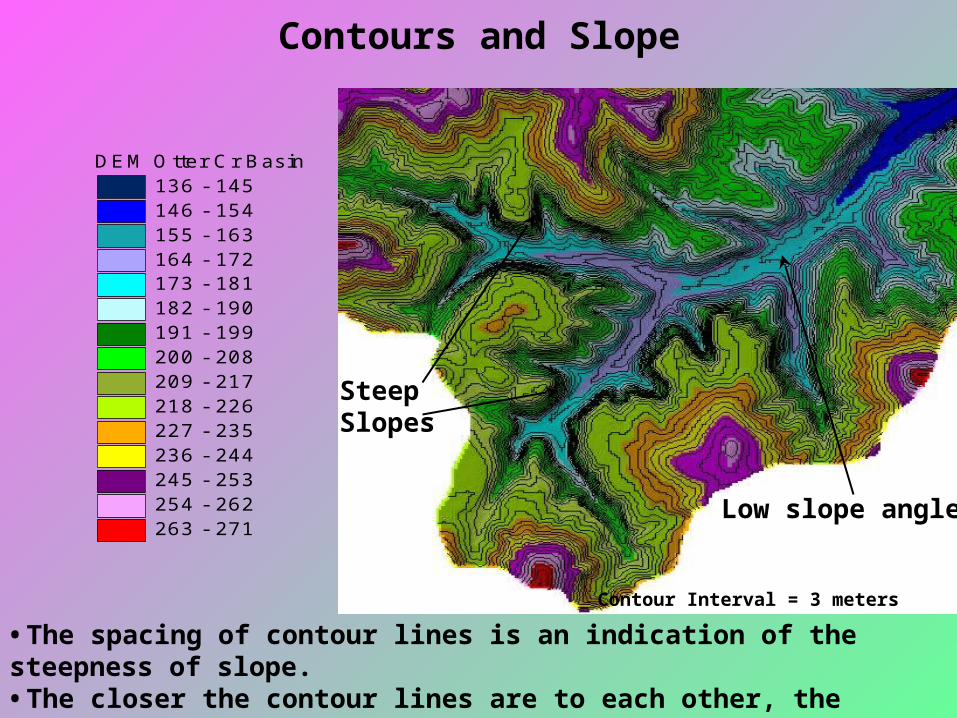
D E M O tter C r B asin136 - 145146 - 154155 - 163164 - 172173 - 181182 - 190191 - 199200 - 208209 - 217218 - 226227 - 235236 - 244245 - 253254 - 262263 - 271
• The spacing of contour lines is an indication of the steepness of slope. • The closer the contour lines are to each other, the steeper the slope between them.
Contours and Slope
Contour Interval = 3 meters
SteepSlopes
Low slope angle
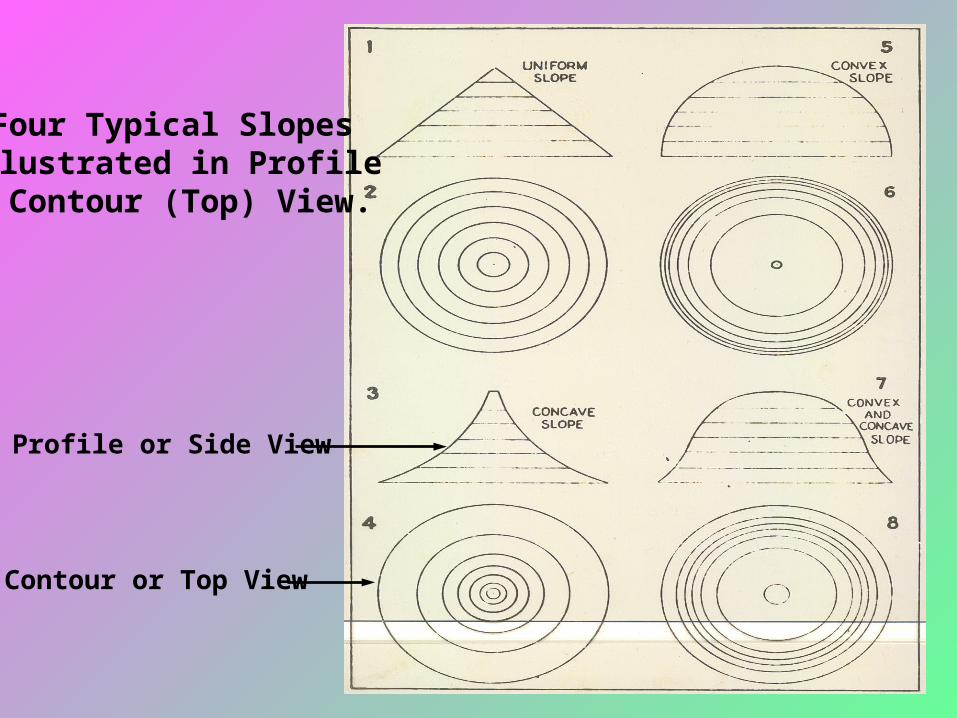
Profile or Side View
Contour or Top View
Four Typical SlopesIllustrated in Profile& Contour (Top) View.
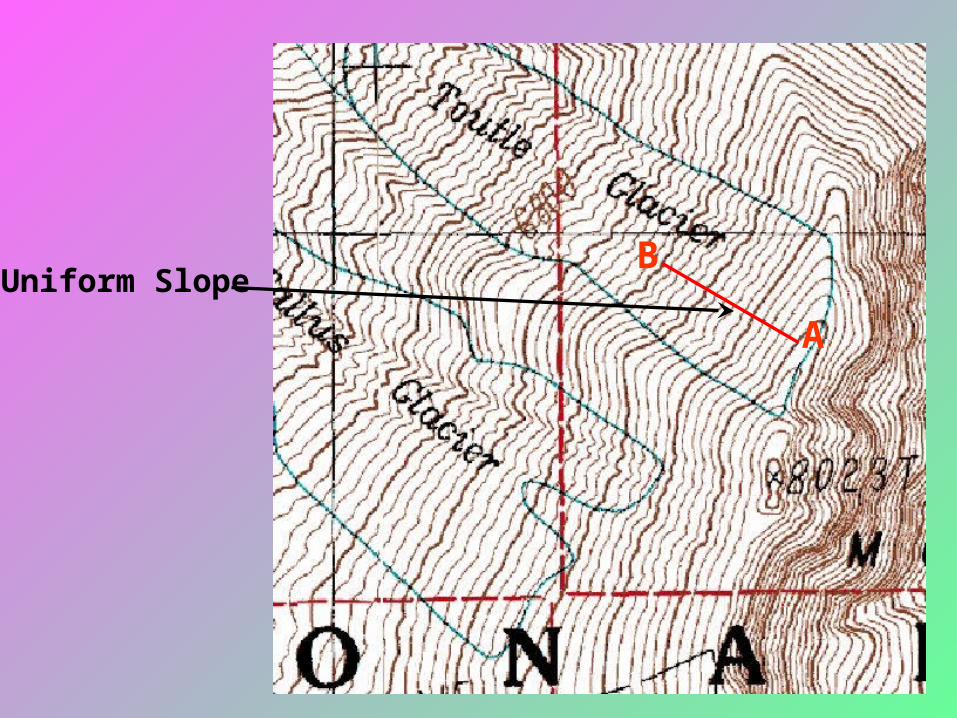
Uniform SlopeA
B
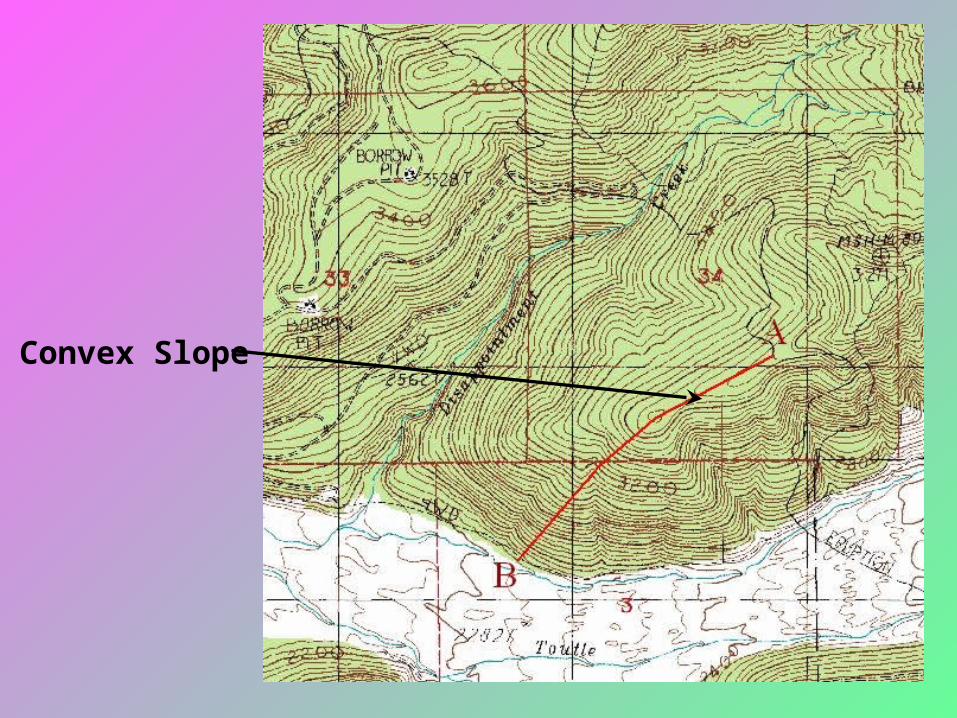
Convex Slope
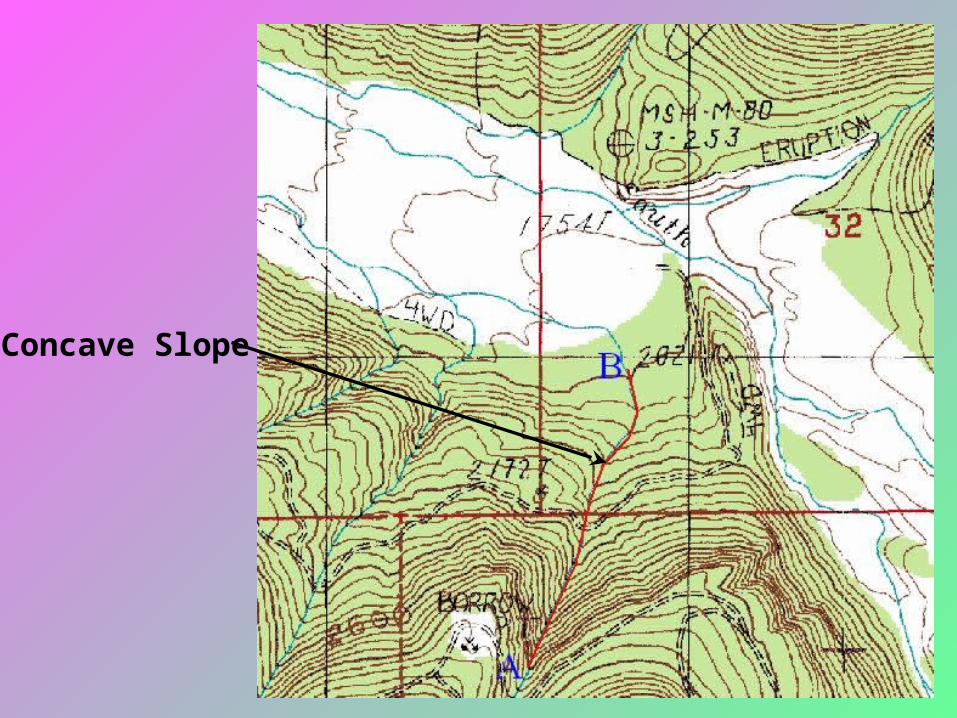
Concave Slope
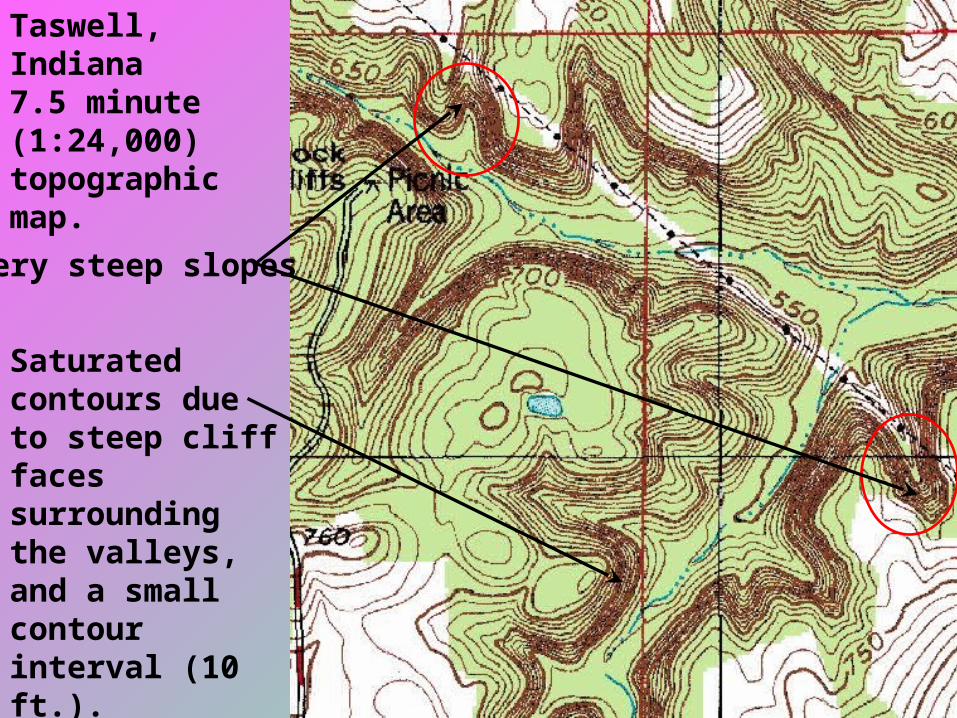
Very steep slopes
Taswell, Indiana7.5 minute (1:24,000)topographic map.
Saturated contours due to steep cliff faces surrounding the valleys, and a small contour interval (10 ft.).
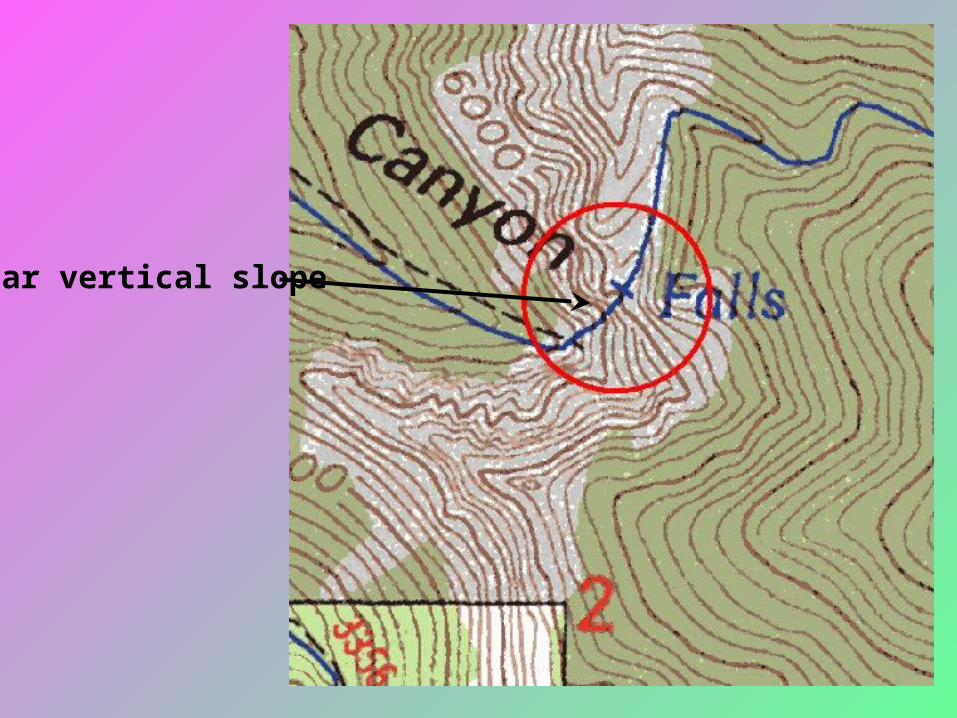
Near vertical slope
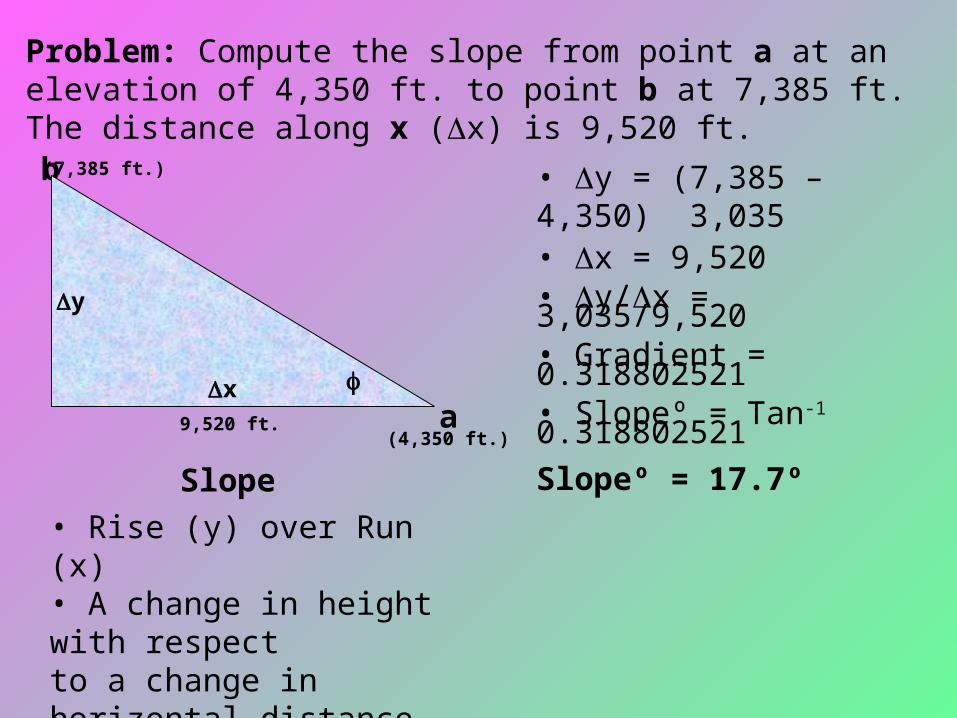
Problem: Compute the slope from point a at an elevation of 4,350 ft. to point b at 7,385 ft. The distance along x (x) is 9,520 ft.
• y = (7,385 – 4,350) 3,035• x = 9,520• y/x = 3,035/9,520• Gradient = 0.318802521• Slopeº = Tan-1 0.318802521Slopeº = 17.7º
• Rise (y) over Run (x)• A change in height with respect to a change in horizontal distance.• y/x or Tan
Slope
b
ax
y
(7,385 ft.)
(4,350 ft.)9,520 ft.
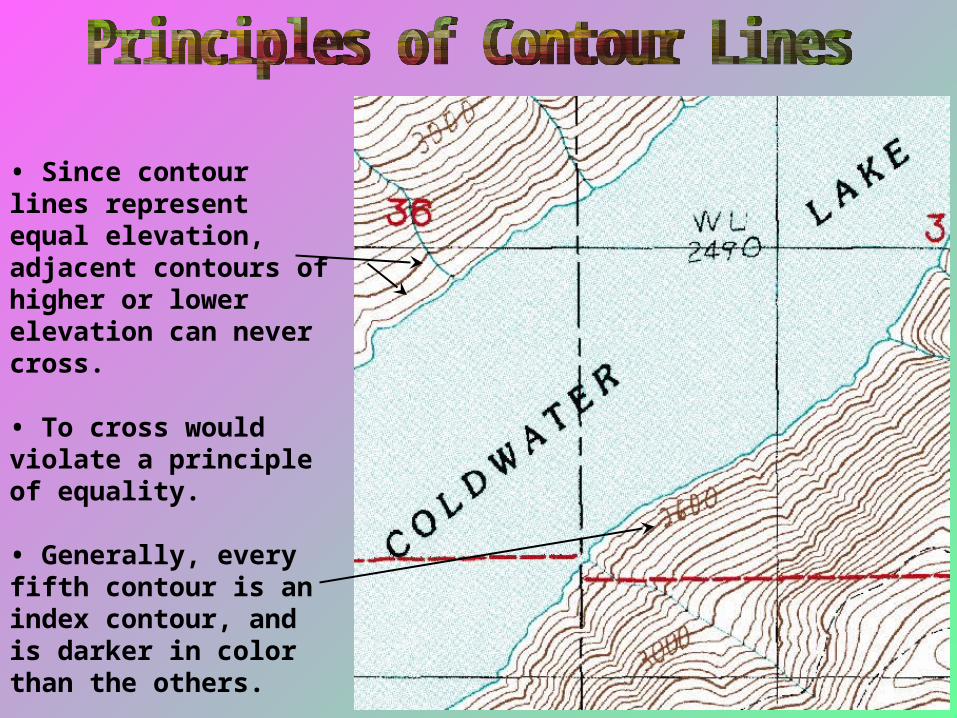
• Since contour lines represent equal elevation, adjacent contours of higher or lower elevation can never cross.
• To cross would violate a principle of equality.
• Generally, every fifth contour is an index contour, and is darker in color than the others.
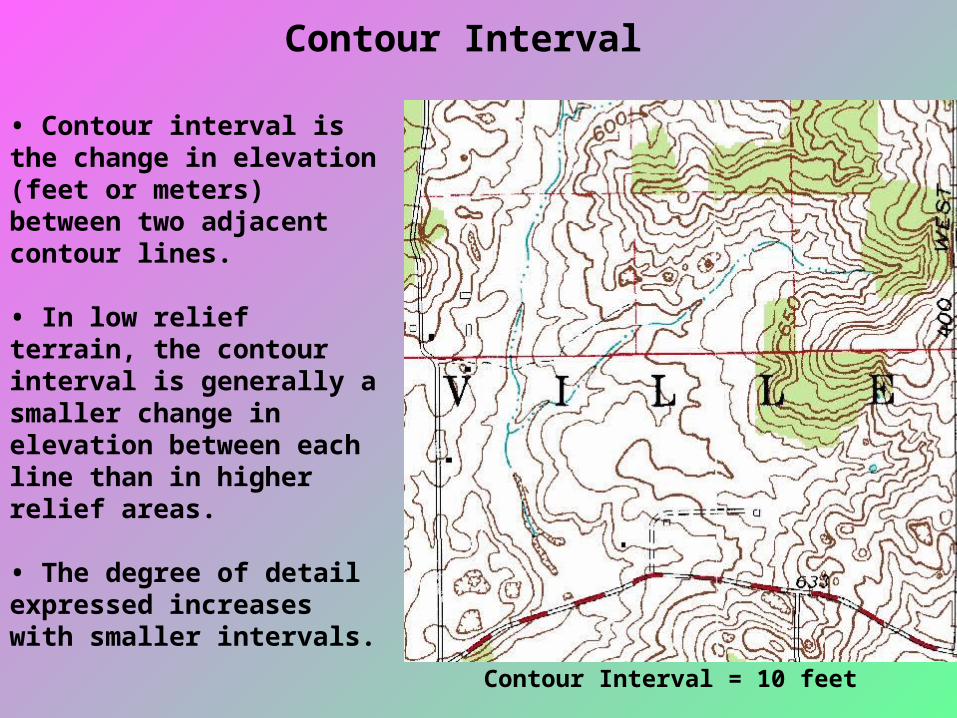
• Contour interval is the change in elevation (feet or meters) between two adjacent contour lines.
• In low relief terrain, the contour interval is generally a smaller change in elevation between each line than in higher relief areas.
• The degree of detail expressed increases with smaller intervals.
Contour Interval = 10 feet
Contour Interval
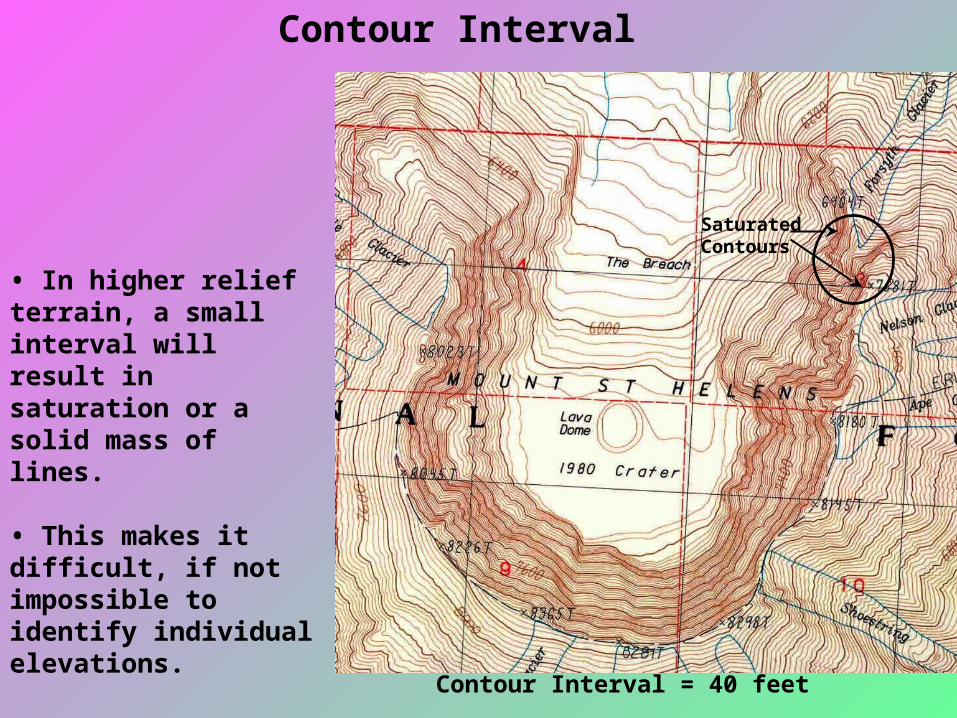
Contour Interval = 40 feet
• In higher relief terrain, a small interval will result in saturation or a solid mass of lines.
• This makes it difficult, if not impossible to identify individual elevations.
Contour Interval
SaturatedContours
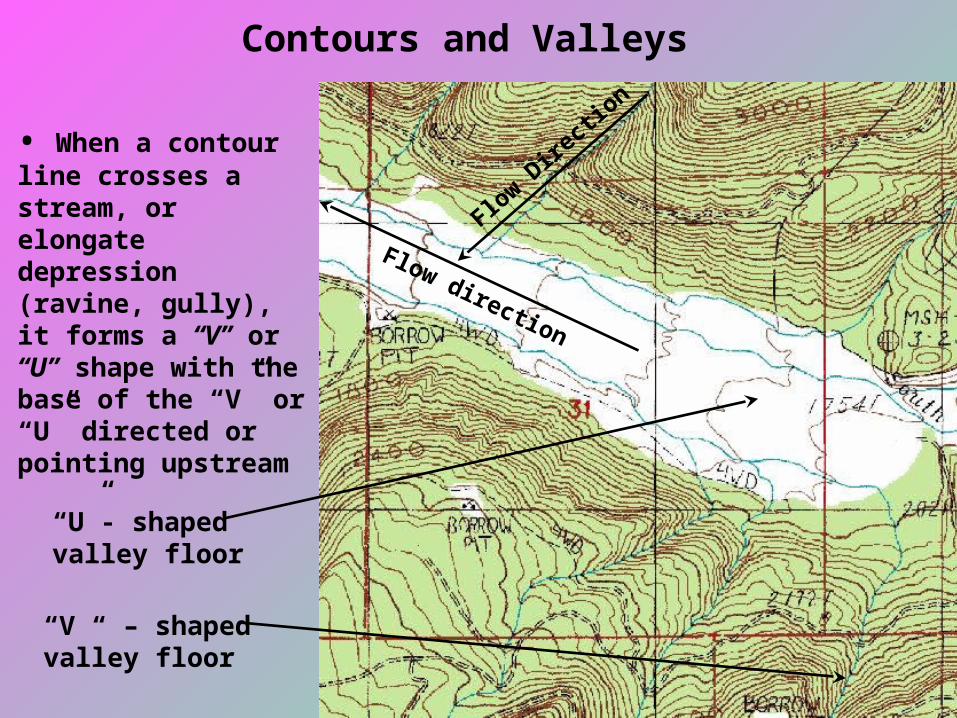
“U”- shaped valley floor
“V “ – shaped valley floor
Flow direction
• When a contour line crosses a stream, or elongate depression (ravine, gully), it forms a “V” or “U” shape with the base of the “V” or “U” directed or pointing upstream
Flow D
irecti
on
Contours and Valleys
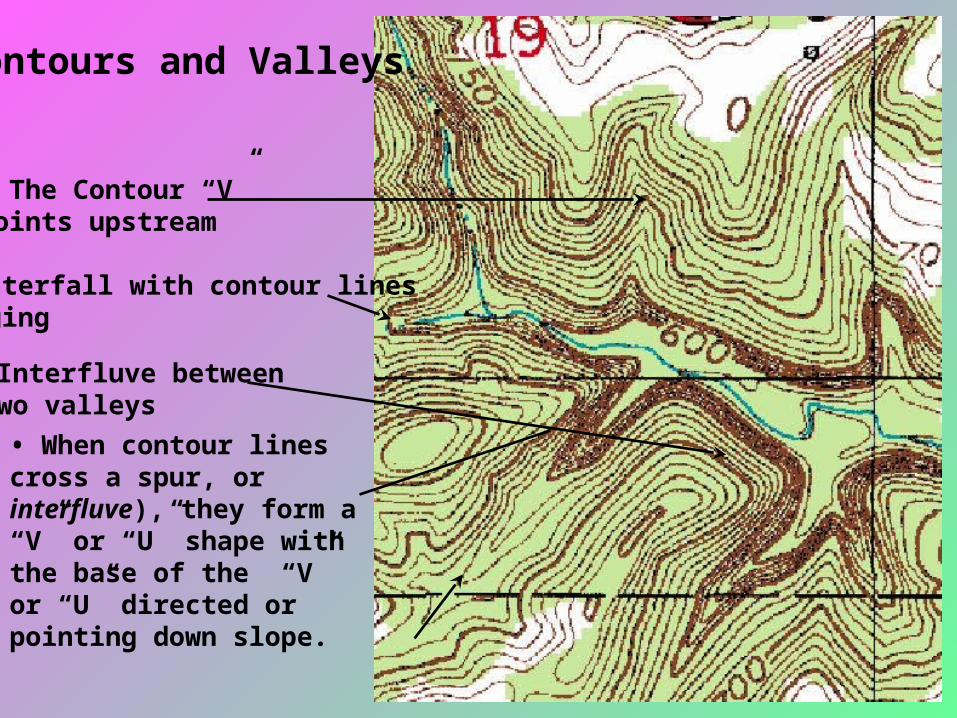
• The Contour “V” points upstream
• Interfluve between two valleys
• Waterfall with contour linesmerging
• When contour lines cross a spur, or interfluve), they form a “V” or “U” shape with the base of the “V” or “U” directed or pointing down slope.
Contours and Valleys
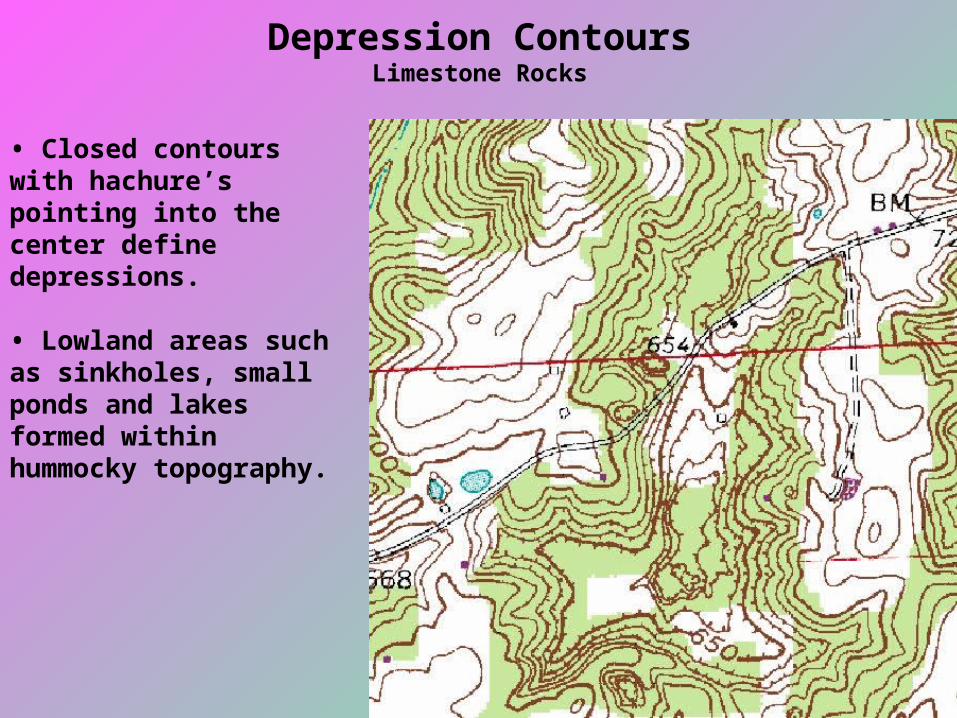
• Closed contours with hachure’s pointing into the center define depressions.
• Lowland areas such as sinkholes, small ponds and lakes formed within hummocky topography.
Depression ContoursLimestone Rocks
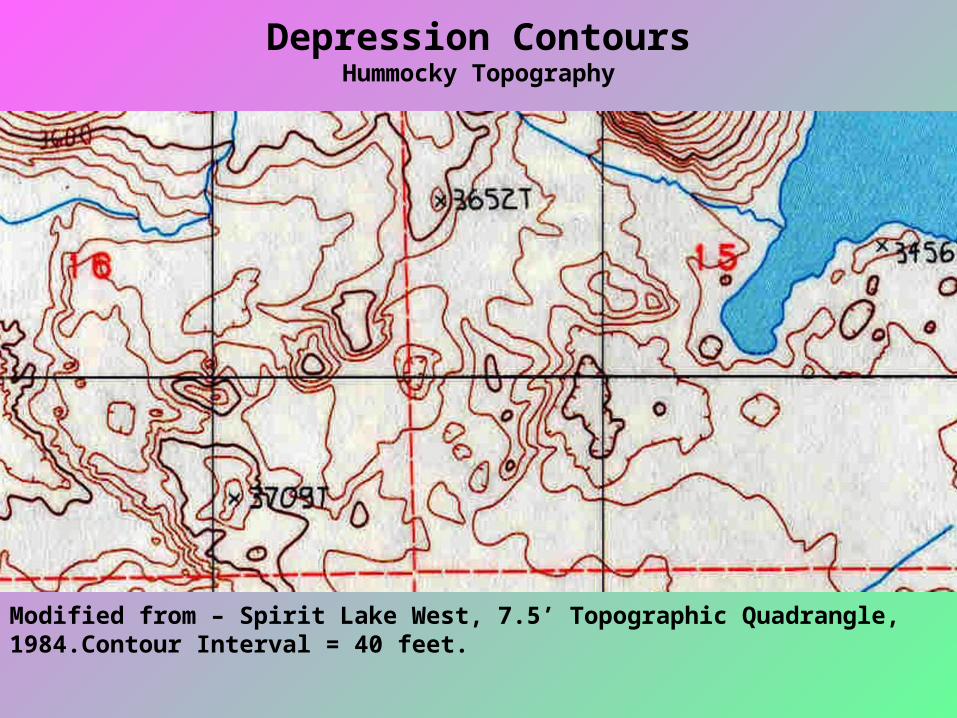
Depression ContoursHummocky Topography
Modified from – Spirit Lake West, 7.5’ Topographic Quadrangle, 1984.Contour Interval = 40 feet.
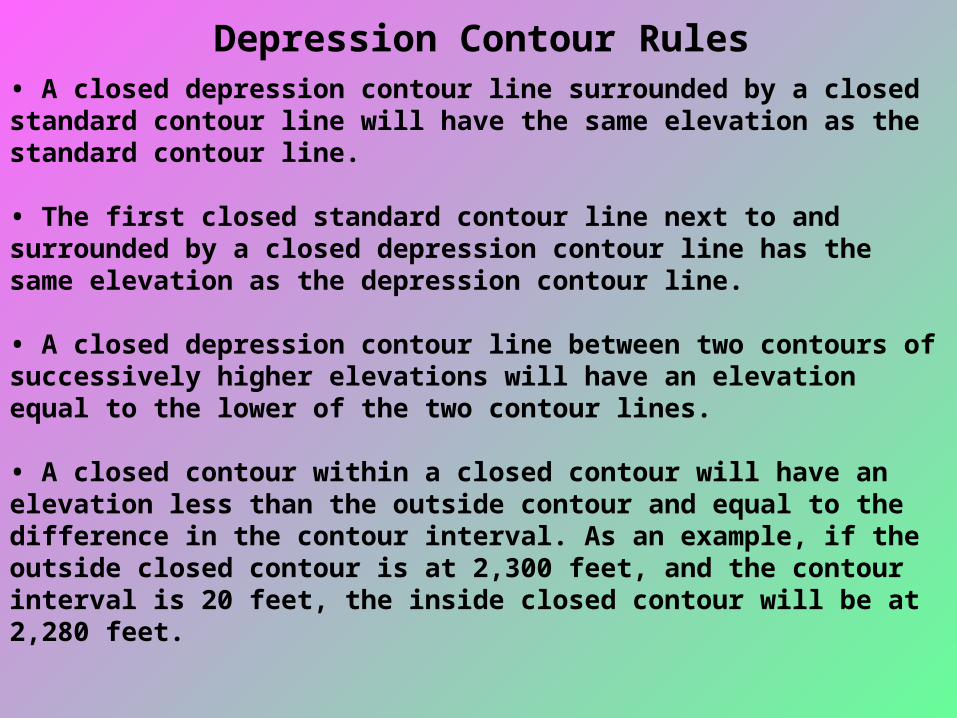
• A closed depression contour line surrounded by a closed standard contour line will have the same elevation as the standard contour line.
• The first closed standard contour line next to and surrounded by a closed depression contour line has the same elevation as the depression contour line.
• A closed depression contour line between two contours of successively higher elevations will have an elevation equal to the lower of the two contour lines.
• A closed contour within a closed contour will have an elevation less than the outside contour and equal to the difference in the contour interval. As an example, if the outside closed contour is at 2,300 feet, and the contour interval is 20 feet, the inside closed contour will be at 2,280 feet.
Depression Contour Rules
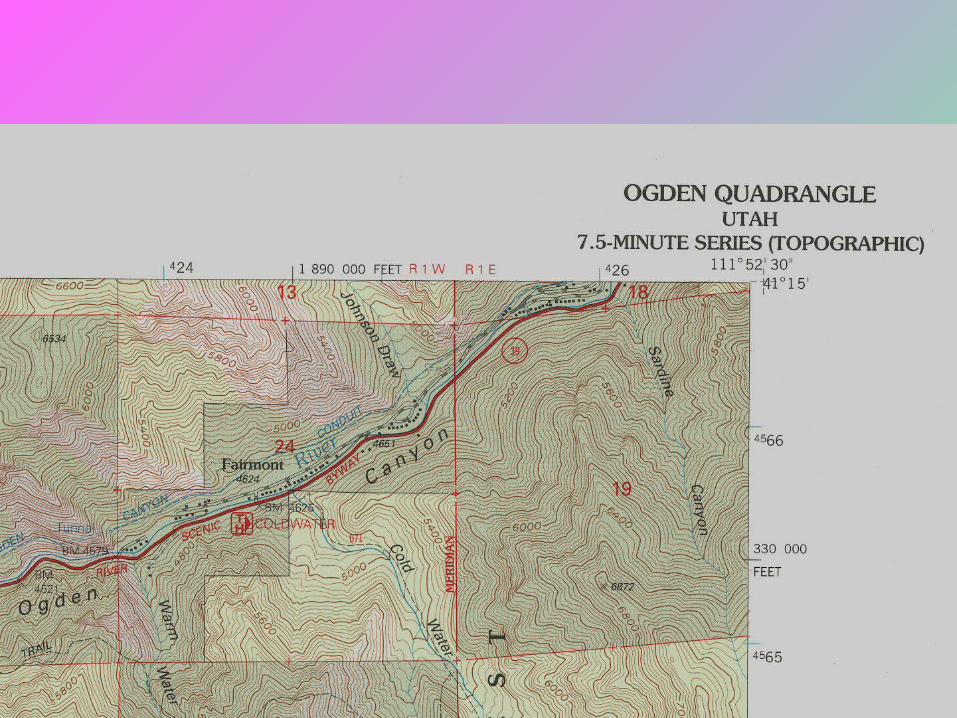
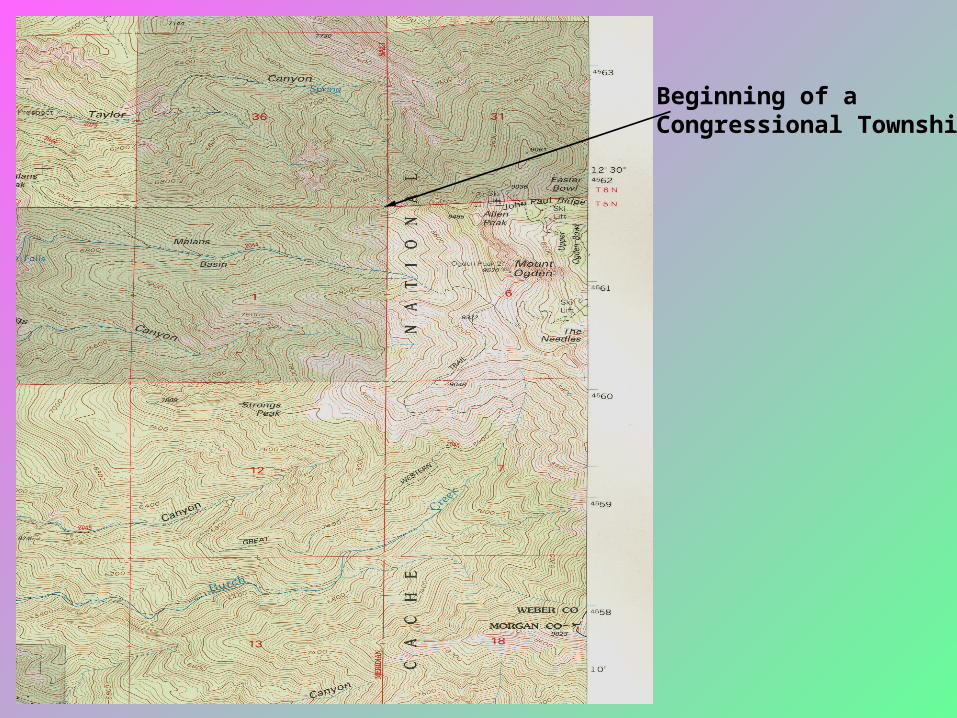
Beginning of a Congressional Township