RIVER INCISION IN RELATION TO POSTGLACIAL EVENTS IN THE HUMBER RIVER BASIN, ONTARIO
Upload
independentCategory
view
5download
0
1
DEVELOPMENT OF A RIVER BASIN INFORMATION SYSTEM FOR A SUSTAINABLE
DEVELOPMENT IN THE UPPER BRAHMAPUTRA RIVER BASIN
BRAHMATWINN - Twinning European and South Asian River Basins to enhance capacity and implement adaptive management approaches
www.brahmatwinn.uni-jena.de
JÖRG PECHSTÄDT1, ANITA BARTOSCH1, FRANZISKA ZANDER1, HANNES MÜLLER
SCHMIED2, WOLFGANG-ALBERT FLÜGEL1
1 Friedrich-Schiller-University Jena; 2 Goethe-University Frankfurt
Keywords: sustainable development, Integrated Water Resources Management (IWRM), BRAHMATWINN, River Basin Information System
ABSTRACT
Sustainability is the main focus of an Integrated Water Resources Management (IWRM). Sustainable development will secure the availability of resources for further generations. The BRAHMATWINN project is working on a harmonized and sustainable water resources management in the Upper Brahmaputra River Basin. The project consortium has collected Hydro-Meteorological (point source) and Geographical information (e.g. DEM, land use) as well as related documents on Water Resources Management to establish a comprehensive IWRM database. A modular organized River Basin Information System (RBIS) based on the ISO 19115 Geo Information Metadata standard was developed. In future RBIS will act as a tool which provides all decision makers with available data as well as decision supporting tools. This article will present the system structure and the current status of the development.
INTRODUCTION
Sustainability and sustainable development are important key words for all planning and decision making authorities, organizations and persons. Sustainable practice is one of the main topics for actual decision makers to keep the natural environment in a good status for further generations.
Within the twinning project “BRAHMATWINN”, a consortium of 17 active partners is working on the development of an Integrated Water Resources Management System which can be used for decision supporting to enhance capacity in the Brahmaputra basin in terms of a harmonized and sustainable water management.
SUSTAINABLE DEVELOPMENT AND IWRM
Definitions
Sustainable development
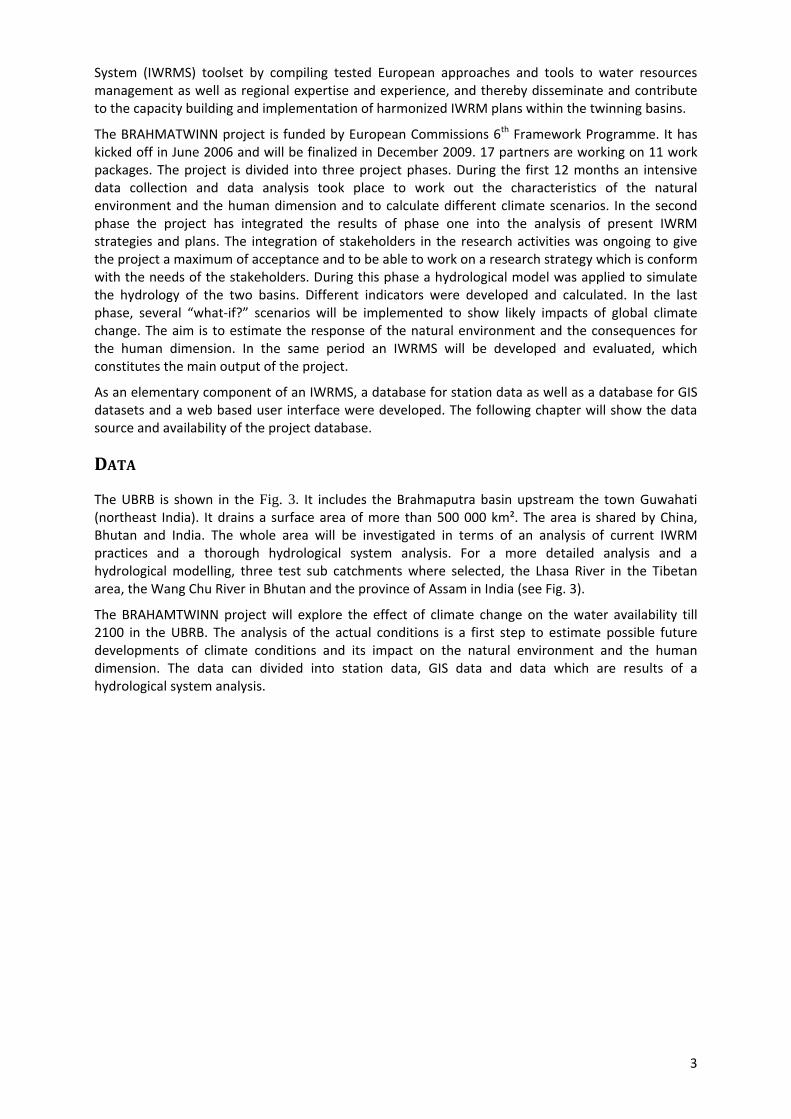
Fig. 1: IWRM key dimensions –
Environmental Sustainability is one of the UN-Millennium Development Goals of the Millennium Assembly in New York from 6 to 8 September 2000. In the frame of the assembly an agreement was defined that all future developments have to consider the three dimensions of sustainability (see Fig. 1). Transferred to water resources management, sustainable development implies the securing of fresh water in sufficient quantity and quality to satisfy the needs of actual and future

2
IWRM
Integrated Water Resources Management (IWRM) is an international accepted approach. IWRM is a balancing multi-sectoral process to make decisions for water resources management and related issues. IWRM is a flexible tool to manage the water resources sustainable to ensure water availability and to shelter the ecological function of water bodies (DEUTSCHE GESELLSCHAFT FÜR DIE VEREINTEN NATIONEN e.V., 2007). The main topic of IWRM is to manage the water resources in a way first to secure water availability in sufficient quantity and quality for the population and secondly to avoid hazards like floods and droughts. IWRM is characterized by a sustainable management of the resource water.
IWRM has to consider all three pillars of a sustainable development which are the natural and the social environment as well as the economic dimension (see Fig. 1).
History of sustainable development and IWRM
Since the 1970’s many conferences with the focus on water and water management took place. Figure 2 shows four important international conferences. In the early stages the water management and its main problems were defined on a national level. With the Dublin Principles and the Agenda
21 in 1992 integrated water management has become very important on international level and the concept of sustainable develop-ment was fixed in international papers.
With the 8 Millennium Development Goals in 2000 all nations have agreed to follow these aims till 2015 to achieve the overarching goal: end the poverty. In the Millennium Goals the dimension natural environment of sustainability is explained in goal number 7 “Ensure environmental sustainability” with the targets:
7a: Integrate the principles of sustainable development into country policies and programmes; reverse loss of environmental resources, 7b: Reduce biodiversity loss, achieving, by 2010, a significant reduction in the rate of loss, 7c: Reduce by half the proportion of people without sustainable access to safe drinking water and basic sanitation, 7d: Achieve significant improvement in lives of at least 100 million slum dwellers, by 2020 (UNITED NATIONS, 2000).
THE BRAHMATWINN PROJECT
The overall objective of BRAHMATWINN is to enhance and improve capacity to carry out a harmonized Integrated Water Resources Management (IWRM) approach as addressed by the European Water Initiative in headwater river systems of alpine mountain massifs in respect to impacts from likely climate change, and to transfer professional IWRM expertise, approaches and tools based on case studies carried out in twinning European and Asian river basins.
It will be realized by holistic case studies carried out in two twinning macro-scale basins: the Upper Danube River Basin (UDRB) in Europe, and the Upper Brahmaputra River Basin (UBRB) in South Asia. These studies comprise research and development activities that address such impacts for water-soil resources management in the two macro-scale trans-boundary basins having significant water storage in snow and glacier covered alpine mountain headwaters. The project develops and applies integrated assessment approaches and establishes an Integrated Water Resources Management
dimensions of a sustainable development Source: DEUTSCHE GESELLSCHAFT FÜR DIE VEREINTEN NATIONEN e.V., 2007
generations and to preserve the ecological function (UNITED NATIONS, 2000).
Fig. 2: Important conferences for Sustainable Development and IWRM and Sustainable Development
3
System (IWRMS) toolset by compiling tested European approaches and tools to water resources management as well as regional expertise and experience, and thereby disseminate and contribute to the capacity building and implementation of harmonized IWRM plans within the twinning basins.
The BRAHMATWINN project is funded by European Commissions 6th Framework Programme. It has kicked off in June 2006 and will be finalized in December 2009. 17 partners are working on 11 work packages. The project is divided into three project phases. During the first 12 months an intensive data collection and data analysis took place to work out the characteristics of the natural environment and the human dimension and to calculate different climate scenarios. In the second phase the project has integrated the results of phase one into the analysis of present IWRM strategies and plans. The integration of stakeholders in the research activities was ongoing to give the project a maximum of acceptance and to be able to work on a research strategy which is conform with the needs of the stakeholders. During this phase a hydrological model was applied to simulate the hydrology of the two basins. Different indicators were developed and calculated. In the last phase, several “what-if?” scenarios will be implemented to show likely impacts of global climate change. The aim is to estimate the response of the natural environment and the consequences for the human dimension. In the same period an IWRMS will be developed and evaluated, which constitutes the main output of the project.
As an elementary component of an IWRMS, a database for station data as well as a database for GIS datasets and a web based user interface were developed. The following chapter will show the data source and availability of the project database.
DATA
The UBRB is shown in the Fig. 3. It includes the Brahmaputra basin upstream the town Guwahati (northeast India). It drains a surface area of more than 500 000 km². The area is shared by China, Bhutan and India. The whole area will be investigated in terms of an analysis of current IWRM practices and a thorough hydrological system analysis. For a more detailed analysis and a hydrological modelling, three test sub catchments where selected, the Lhasa River in the Tibetan area, the Wang Chu River in Bhutan and the province of Assam in India (see Fig. 3).
The BRAHAMTWINN project will explore the effect of climate change on the water availability till 2100 in the UBRB. The analysis of the actual conditions is a first step to estimate possible future developments of climate conditions and its impact on the natural environment and the human dimension. The data can divided into station data, GIS data and data which are results of a hydrological system analysis.

4
Hydro-meteorological data
Fig. 3: Station distribution
Fig. 3 shows the location of the different climate stations and their provider. The BRAHMATWINN project is using stations managed by different sources. The WMO stations can be freely downloaded from the internet. The Chinese stations are provided by our Chinese partners the “Institute of Tibetan Plateau Research” (ITP) and the “Center for Agriculture Resources Research” (CARR). The data of Bhutanese stations made available by the team of “International Centre for Integrated Mountain Development” (ICIMOD) and the “Royal University of Bhutan”. The “Indian Institute of Technology Roorkee” provides the project with information about precipitation in the Indian area.
Geographical data
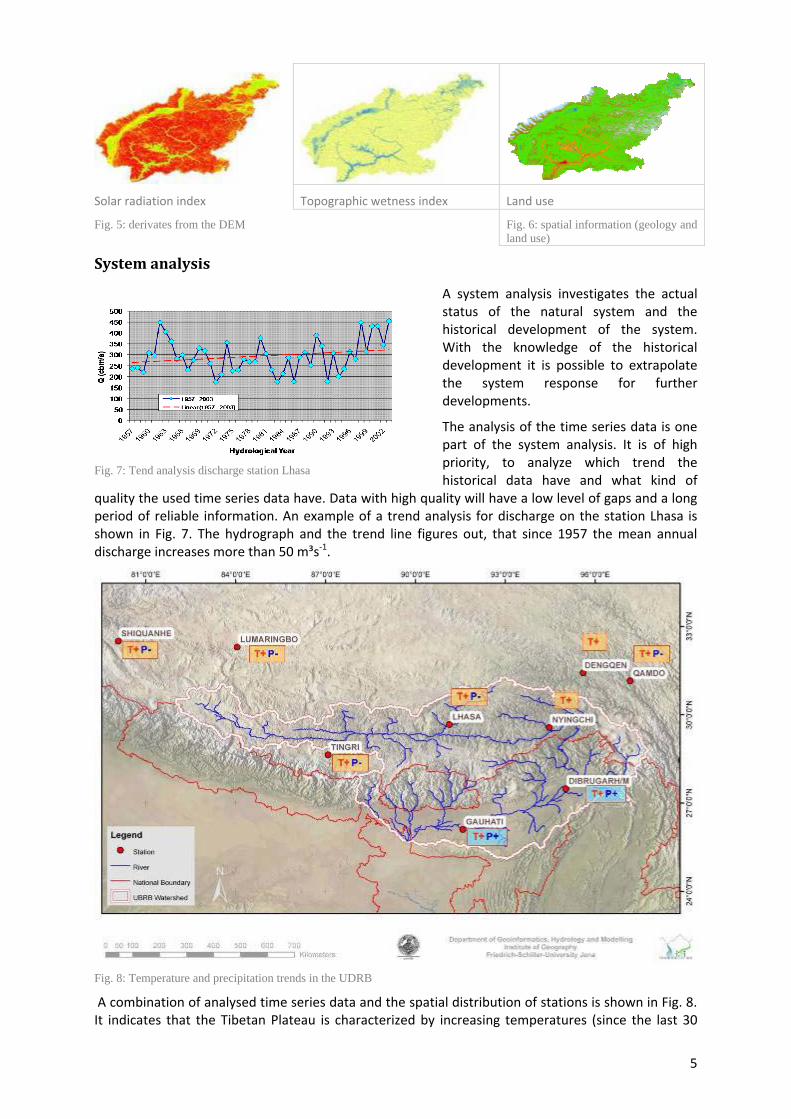
The digital elevation model (DEM) is an essential GIS dataset for most of the analysis. The SRTM (Shuttle Radar Topography Mission) is a free available DEM with approx. 90 meter resolution and was applied in the project (see Fig. 4). Using ArcGIS, the slope, aspect, topographic wetness index as well as the solar radiation index were derived from the DEM (see Fig. 5).
For a hydrological system analysis and hydrological modeling, further geographical information like the land use, the soils and the geology are necessary. The land use information was derived from MODIS data with 17 classes
(see Fig. 6). The geological conditions are based on the dataset from the United States Geological Survey (USGS) and the soil information is given in the Digital Soil Map of the world from the FAO.
Fig. 4: DEM of the Lhasa River catchment
Slope Aspect Geology
5
System analysis
A system analysis investigates the actual status of the natural system and the historical development of the system. With the knowledge of the historical development it is possible to extrapolate the system response for further developments.
The analysis of the time series data is one part of the system analysis. It is of high priority, to analyze which trend the historical data have and what kind of
quality the used time series data have. Data with high quality will have a low level of gaps and a long period of reliable information. An example of a trend analysis for discharge on the station Lhasa is shown in Fig. 7. The hydrograph and the trend line figures out, that since 1957 the mean annual discharge increases more than 50 m³s-1.
Fig. 8: Temperature and precipitation trends in the UDRB
A combination of analysed time series data and the spatial distribution of stations is shown in Fig. 8. It indicates that the Tibetan Plateau is characterized by increasing temperatures (since the last 30
Solar radiation index Topographic wetness index Land use
Fig. 5: derivates from the DEM Fig. 6: spatial information (geology and land use)
Fig. 7: Tend analysis discharge station Lhasa
6
years) and decreasing of precipitation. In contrast at the stations in the eastern part of the investigated area, an increase of both, temperature and precipitation is observed. The precipitation trends are not significant.
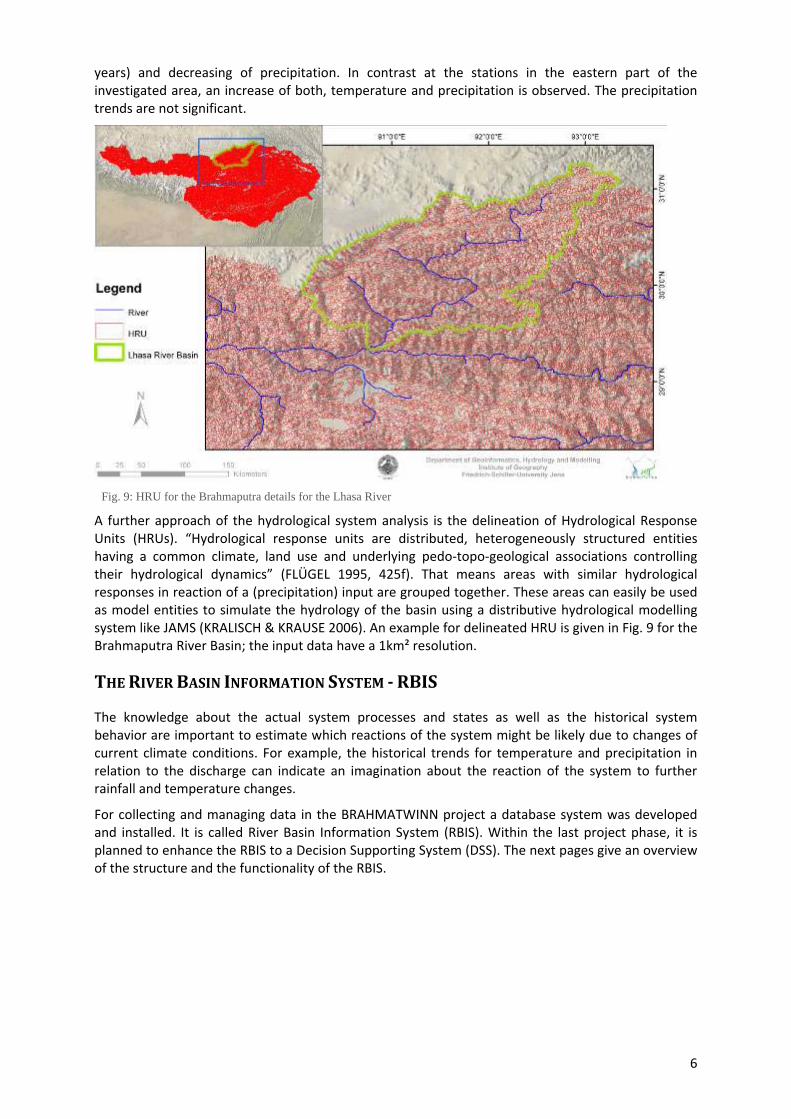
Fig. 9: HRU for the Brahmaputra details for the Lhasa River
A further approach of the hydrological system analysis is the delineation of Hydrological Response Units (HRUs). “Hydrological response units are distributed, heterogeneously structured entities having a common climate, land use and underlying pedo-topo-geological associations controlling their hydrological dynamics” (FLÜGEL 1995, 425f). That means areas with similar hydrological responses in reaction of a (precipitation) input are grouped together. These areas can easily be used as model entities to simulate the hydrology of the basin using a distributive hydrological modelling system like JAMS (KRALISCH & KRAUSE 2006). An example for delineated HRU is given in Fig. 9 for the Brahmaputra River Basin; the input data have a 1km² resolution.
THE RIVER BASIN INFORMATION SYSTEM - RBIS
The knowledge about the actual system processes and states as well as the historical system behavior are important to estimate which reactions of the system might be likely due to changes of current climate conditions. For example, the historical trends for temperature and precipitation in relation to the discharge can indicate an imagination about the reaction of the system to further rainfall and temperature changes.
For collecting and managing data in the BRAHMATWINN project a database system was developed and installed. It is called River Basin Information System (RBIS). Within the last project phase, it is planned to enhance the RBIS to a Decision Supporting System (DSS). The next pages give an overview of the structure and the functionality of the RBIS.

7
Structure
The structure of the web application RBIS consists of several components (see Fig. 10). One component is responsible for application administration tasks (RBISapp), e.g. the access management. Another component was constructed as a variable number of application modules plus a shared management tool for metadata (RBISmeta), following the ISO 19115 standard, including specific extensions for each application module (INTERNATIONAL ORGANIZATION
FOR STANDARDS 2003). Available modules are RBISts for the management of time series data, RBISdoc for the management of documents and RBISmap for the management and visualisation of map data. It is planned to develop further RBIS modules and integrate them into the given structure.
RBIS has been implemented to be used on the operation system Linux, the Apache web server, the database management system PostgreSQL with the spatial extension PostGIS, the template engine Smarty and the scripting language PHP. RBISmap additionally uses the UMN (University of Minnesota) MapServer for building spatially-enabled internet applications and the JavaScript library OpenLayers for displaying map data in the web browser.
RBIS uses exclusively open source software e.g. to minimize acquisition cost and cost of operation.
Database
RBIS uses the database management system PostgreSQL with the spatial extension PostGIS to store and manage the data. Currently there are three separate databases. Each one is associated with a RBIS module. One for the common component RBISmeta, one for RBISmap to store the application data and map data associated with this module and the last one is used by RBISts to store the time series data. The differentiation into separate databases eases the administration and opens the opportunity of deploying the databases on server best fitting the given requirements at any time.
Security – Data integrity
RBIS is accessible via internet and is protected against access of unauthorized persons by checking access rights and user authentication. To use RBIS it is necessary to log on with a user name and password. RBIS manages access rights by using different access groups to minimize the effort for user management. Each user has to be a member of an access group. The group access rights allow read, write or delete actions on the different data views. It is possible to define groups with very detailed access rights. For example it is allowed to “view and edit and forbidden to delete” metadata datasets. At an optional second security level the owner rights for datasets can be checked. If this feature is activated and the access right is given by the assigned access group, only the owner can edit or download his own datasets.
There are several mechanisms to ensure data integrity. All input values are checked for their expected data type. RBIS additionally logs all actions with current time, user name and IP address, if an action changes any data in the database. This is useful to review the history of a metadata dataset or to find the responsible person changing or deleting data.
Modules and Functions
RBISmeta
RBISmeta is the shared component of RBIS for metadata management. In this context, metadata are all data to describe the stored data, e.g. geographic data, documents or time series data. To manage metadata it is necessary to have a generally accepted database schema and an adaptable application for inserting, editing and searching the stored data.
Fig. 10: Organization of the RBIS

8
The database schema for the metadata is based on a complete implementation of the ISO 19115 standard for metadata of geographic information with some extensions.
The ISO 19115 standard was developed to push a homogeneous acquisition of metadata for geographic information, to provide an easy data exchange. There are some core metadata elements which are mandatory. They describe: What (title and description of the data), when (when the dataset was created), who (dataset originator or creator and supplier), where (the geographical extent of the data set based on coordinates, geographical names or administrative areas) and how (how to obtain more information about the dataset, how to order the dataset, available formats, access constraints etc.). For each dataset in RBIS core metadata elements must be provided according to ISO 19115.
Extensions were done mainly to manage time series and station metadata. They share parts of ISO 19115 like the management of responsible persons and organisations.
Most of the application logic of RBISmeta is based on the interaction between xml files and PHP code. These xml files are used to define and describe the content of every data view. Generally it is possible to access the complete database schema of RBIS with the description in the xml files. The information in an xml file is used to dynamically create all data manipulation statements. It is also used to generate the data presentation in the web browser dynamically. Finally the information in an xml file is used to generate different types of input fields for inserting or editing the metadata. Based on the fact of using xml files, the application is very flexible and adaptive. It is very easy to change the file and all changes will take effect immediately in all the different use cases. Data views can be extended with any PHP code to allow hyperlinks between the data views. This provides a user-friendly navigation between different contents.
RBISmap
RBISmap provides several functions for the management and visualisation of map data. Map data of different types (shapes, raster, points, lines …) can be imported and complemented with important information like the spatial reference identifier (SRID). RBISmap provides a user-friendly tool to edit the map file for the MapServer. A map file defines relationships between objects and contains information on where map data is located and how it is visualized. The visualisation of the map data in the web browser is implemented by using the JavaScript library OpenLayers.
A special feature of RBISmap is the ability to support multiple languages. Every user can choose his preferred language. Furthermore the module RBISmap is independent from RBIS and can be installed on another server or/and without all other RBIS modules.
All imported map data is accessible as a layer. Layers can be grouped in maps. Maps can be shown with the OpenLayers frontend, which offers some GIS functionalities and hyperlinks to RBISmeta. To display imported map data it is necessary to activate it. Activation of a layer means to specify metadata. After activation it can be decided how the layer should be drawn e.g. line width and colour. The last step is to group different layer in one map according to the needs.
RBISmap can automatically generate parts of the required metadata during the activation of an imported shape file or raster dataset, for example the extent of a shape file, spatial reference system and dataset name. After completing and saving the metadata in RBISmeta, the original data is associated as a document to the new metadata dataset. Furthermore two hyperlinks are created one to access the data of all maps which contain the layer and another for returning to the metadata view.
It is also possible to create single objects in a layer by predefined rules in RBISmeta, for example a layer with all precipitation stations. The geometry of the object is created by using the given metadata in a station dataset (latitude, longitude and spatial reference system). Changes in metadata will immediately take effect in corresponding layers. Objects created like this can be accessed directly from RBISmeta by hyperlink.

9
RBISdoc
The module RBISdoc provides the possibility to store different kinds of files as separate documents with associated metadata, or as file in association to a main metadata dataset (A). For example the project description, encoded as a separate pdf document with metadata, a picture associated to a station dataset, or the original map data associated to a map data metadata dataset (A).
RBISts
RBISts has a lot of functions to manage time series, which can be divided into: import, data analysis, manipulation and export.
The module RBISts provides two different ways to import data. One is the classical way to import data. Users have to create all necessary metadata with all available information. This includes metadata of the station of the time series and the metadata of the time series itself. For a spatial reference, coordinates and a spatial reference system have to be specified with station metadata. The second step is to upload the file with the time series data. This file has to be formatted in a certain way. In the first column the time followed by one or more data columns. To generate useful metadata the parameter of each column has to be specified. It is also necessary to specify the used value for missing data like -9999 and the time step, e.g. daily. During the import process the data is analysed regarding to data gaps and general parameters, like begin and end of a time series. The produced information is stored as metadata in the database.
There is also a second way to import a huge amount of data. This mass-import function offers a way to create metadata and upload the data automatically by using predefined templates. For special use cases it is possible to add a pre-processing module to rewrite the time series data file.
For a visual analysis the stored time series data can be displayed in a diagram. For spatial analysis the distance to other stations can be calculated. It is also possible to show data gaps and find time series data, which could fit in the gap.
To close data gaps RBISts provides functions to interpolate time series data. There are several interpolation methods implemented, which can be adjusted by editing the specific initialisation parameter.
The data can be exported with the original time step or as aggregated values (hourly, daily, monthly, yearly and hydrological year) expanded by the minimum and maximum value of each aggregated time interval. In addition the start and end data time of the time series can be set individually.
Frontend - RBISapp
The user interface was designed to give the user two options to work with the RBIS. On the metadata information the user can start a query for special information, e.g. all stations with the parameter precipitation in Bhutan. On the other hand a map with special information can be the point of entry, where the data are direct linked to (see Fig. 11). The Fig. 11 shows a possibility to view data in the RBISmap; it visualizes the data of the Wang Chu catchment (Bhutan) together with the geology of Bhutan, the land use of the catchment and the rivers.

10
Fig. 11: RBIS map - Sub basin Wang Chu (Bhutan)
CONCLUSION AND OUTLOOK
The BRAHMATWINN project focuses on the development of an adaptive IWRM in the Brahmaputra catchment. IWRM is defined due to a sustainable handling of the resource water. To make decisions it is fundamental to have a data basis with high quality. To describe this data, the ISO standard 19115 serves as an important tool. By the RBIS, the BRAHMATWINN project has developed a comfortable system for storage of geographical data (e.g. time series, GIS-layers). For example, it is possible to fill the data gaps of time series within the RBIS and to visualize the spatial information. The major benefit of the system is the access via internet due to its web based manner.
Within the first project phase, many datasets with different formats were collected. A first step of unification of the data format was finished. At the moment, the import of all these data into the database and the description with metadata is in progress. One final project outcome will be a database with data in a standardized format with a high level of data description.
The next milestones of the project will be the combination of the database with a hydrological model and the development of an interface with the NetSyMoD (Network Analysis - Creative System Modelling - Decision Support) and its modelling decision support system (mDSS). Subsequently “What if” scenarios will be integrated to have a complete decision support system. Thus an integrated toolset for decision makers will be provided in order to achieve a sustainable development based on integrated water management in the two macro scale catchments. The modular toolset can be easily adapted to other catchments.
REFERENCES
ADAMS, W.M. (2006): The Future of Sustainability. Report of the IUCN Renowned Thinkers Meeting, Zurich, 2006.
DEUTSCHE GESELLSCHAFT FÜR DIE VEREINTEN NATIONEN E.V. (2007): Hashimoto-Aktionsplan, BLAUE REIHE Nr. 98, Berlin.
FLÜGEL, W.-A. (1995): Delineating Hydrological Response Units (HRU's) by GIS analysis for regional hydrological modelling using PRMS/MMS in the drainage basin of the River Bröl, Germany. - Hydrological Processes, Vol. 9, 423-436.
INTERNATIONAL ORGANIZATION FOR STANDARDS (2003): International Standard ISO 19115 Geographic information – Metadata. Reference Number ISO19115:2003(E).
S.KRALISCH & P.KRAUSE (2006): JAMS - A Framework for Natural Resource Model Development and Application. In A. Voinov, A. Jakeman, and A.E. Rizzoli, editors, Proceedings of the iEMSs Third Biannual Meeting "Summit on Environmental Modelling and Software", Burlington, USA, July 2006. International Environmental Modelling and Software Society.
11
UNITED NATIONS (2000): General Assembly – United Nations Millennium Declaration. New York, 2000.
Copyright © 2022 FDOKUMEN