Spatio-temporal variation of heavy metals in Cauvery River basin
17
Proceedings of the International Academy of Ecology and Environmental Sciences, 2013, 3(1): 59-75 IAEES www.iaees.org Article Spatio-temporal variation of heavy metals in Cauvery River basin K. Venkatesha Raju, R. K. Somashekar, K. L. Prakash Dept. of Environmental Science, Bangalore University, Bangalore -560 056, India E-mail: [email protected] Received 22 September 2012; Accepted 25 October 2012; Published online 1 March 2013 IAEES Abstract In the present study water, sediment and soil samples of Cauvery basin was undertaken to evaluate the spatio- temporal variations in heavy metal concentrations between 2007 and 2009. The Line diagrams for individual heavy metals of the seasonal samples with standard deviation at p=0.05 were plotted to comprehend the seasonal and spatial fluxes and variations. The seasonal heavy metal concentration in river water was maximum for Fe, Zn, Mn, Cu, Co and Cd during pre-monsoon and Pb, Ni and Cr during post-monsoon season whereas, in the sediment samples higher concentration of Ni, Cr, Mn, Cu, Co and Cd was found during pre-monsoon and Fe Pb and Zn in post-monsoon. In the case of soil samples maximum concentrations of Fe, Pb, Zn, Cr and Co noticed during pre-monsoon, while Ni, Mn, Cu and Cd during post-monsoon. An exponential increasing trend from water to soil and to sediment was evident throughout the river stretch. The mean concentration for all the heavy metals in water was within the limits of BIS and WHO standards. In sediment samples heavy metal concentrations were below the limit of sediment quality guidelines except Ni and Cd. Correlation analysis revealed higher degree of inter-metallic and intra-metallic association among water, sediment and soil samples indicating identical behavior of metals during its transport into the river environment. The spatial trends of heavy metal enrichment in river sediments reflected the sources/activities of the corresponding catchments in the study area. As such the downstream stations of Cauvery are enriched with heavy metals due to the influx of pollutants. Keywords spatio-temporal; correlation; enrichment; Cauvery; heavy metals. 1 Introduction Heavy metals in the hydrosphere interact with water and sediment/soil samples of geological origin, and subsequently influence biological processes (Sayadi and Sayyed, 2011; Prajapati, 2012). In water, heavy metals are in dissolved or suspended form, depending on the chemical nature of the water. Heavy metals do not exist in dissolved form for a long time in water. They are present mainly as suspended colloids or fixed by organic and mineral substances. Thus their concentration in bottom sediments or in aquatic fauna and flora is an adequate indication of water pollution by them. The accumulation of heavy metals in the bottom sediments of river bodies and their remobilization are two of the most important mechanisms in the regulation of pollutant concentrations (Linnik and Zubenko, 2000). In the past however, water quality studies focused mainly on the detection of contaminants in the water column and sediments and ignored the fact that it represents one of the large and ultimate sinks or reservoirs for metals discharged into environment (Hollert et al., 2003; Audry et al., 2004; Beg and Ali, 2008; Li et al., 2008; Abbas et al., 2009)
Transcript of Spatio-temporal variation of heavy metals in Cauvery River basin
Proceedings of the International Academy of Ecology and Environmental Sciences, 2013, 3(1): 59-75
IAEES www.iaees.org
Article
Spatio-temporal variation of heavy metals in Cauvery River basin K. Venkatesha Raju, R. K. Somashekar, K. L. Prakash Dept. of Environmental Science, Bangalore University, Bangalore -560 056, India
E-mail: [email protected]
Received 22 September 2012; Accepted 25 October 2012; Published online 1 March 2013
IAEES
Abstract
In the present study water, sediment and soil samples of Cauvery basin was undertaken to evaluate the spatio-
temporal variations in heavy metal concentrations between 2007 and 2009. The Line diagrams for individual
heavy metals of the seasonal samples with standard deviation at p=0.05 were plotted to comprehend the
seasonal and spatial fluxes and variations. The seasonal heavy metal concentration in river water was
maximum for Fe, Zn, Mn, Cu, Co and Cd during pre-monsoon and Pb, Ni and Cr during post-monsoon
season whereas, in the sediment samples higher concentration of Ni, Cr, Mn, Cu, Co and Cd was found
during pre-monsoon and Fe Pb and Zn in post-monsoon. In the case of soil samples maximum concentrations
of Fe, Pb, Zn, Cr and Co noticed during pre-monsoon, while Ni, Mn, Cu and Cd during post-monsoon. An
exponential increasing trend from water to soil and to sediment was evident throughout the river stretch. The
mean concentration for all the heavy metals in water was within the limits of BIS and WHO standards. In
sediment samples heavy metal concentrations were below the limit of sediment quality guidelines except Ni
and Cd. Correlation analysis revealed higher degree of inter-metallic and intra-metallic association among
water, sediment and soil samples indicating identical behavior of metals during its transport into the river
environment. The spatial trends of heavy metal enrichment in river sediments reflected the sources/activities
of the corresponding catchments in the study area. As such the downstream stations of Cauvery are enriched
with heavy metals due to the influx of pollutants.
Keywords spatio-temporal; correlation; enrichment; Cauvery; heavy metals.
1 Introduction
Heavy metals in the hydrosphere interact with water and sediment/soil samples of geological origin, and
subsequently influence biological processes (Sayadi and Sayyed, 2011; Prajapati, 2012). In water, heavy
metals are in dissolved or suspended form, depending on the chemical nature of the water. Heavy metals do
not exist in dissolved form for a long time in water. They are present mainly as suspended colloids or fixed
by organic and mineral substances. Thus their concentration in bottom sediments or in aquatic fauna and flora
is an adequate indication of water pollution by them.
The accumulation of heavy metals in the bottom sediments of river bodies and their remobilization are
two of the most important mechanisms in the regulation of pollutant concentrations (Linnik and Zubenko,
2000). In the past however, water quality studies focused mainly on the detection of contaminants in the
water column and sediments and ignored the fact that it represents one of the large and ultimate sinks or
reservoirs for metals discharged into environment (Hollert et al., 2003; Audry et al., 2004; Beg and Ali, 2008;
Li et al., 2008; Abbas et al., 2009)
Proceedings of the International Academy of Ecology and Environmental Sciences, 2013, 3(1): 59-75
IAEES www.iaees.org
The heavy metal content of soil governs the composition of these elements in plants and animals.
Therefore the environmental pollution of soils directly influences the human and animal health. Heavy metal
exists in the soil in immobile (Sulphides, Phosphates, Silicates etc.) and mobile forms. The mobile forms
occur with the exchange processes in the soil and with the changing composition, pH, organic matter etc of
soil. Determination of mobile forms of heavy metals is significant and intricate for understanding their
migration patterns in the soil and their uptake by plants (Nomeda et al., 2004).
Heavy metals in Cauvery River are chemically in the form of exchangeable, bound to carbonates or
organic matter or Fe-Mn Oxides and or residual forms (Vaithiyanathan et al., 1992). By analyzing water and
sediment, it is possible to determine the extent, distribution and possible hazards of contamination.
Cauvery basin is one of the significant areas of rice and sugarcane production in Southern India. The
large scale utilization of the river basin for irrigation and drinking purposes, the lack of inapt water
management has extensively deteriorated the water quality due to increased anthropogenic activities. A
stretch of river Cauvery in Karnataka, receives mainly an agricultural run-off followed by domestic and
industrial effluents. Besides recreation, rituals, sand mining and hydro-electric power generation plants do
exert intensive pressure on fauna and flora. Along the steady stretch of river Cauvery in Karnataka, eight
major tributaries merge and contribute to water flow and water quality fluctuations. The aim of this study is
to portray the Spatio-temporal variation in metal concentration, inter and intra-metallic association and spatial
enrichment of metals in the Cauvery basin.
2 Materials and Methods
2.1 Study area
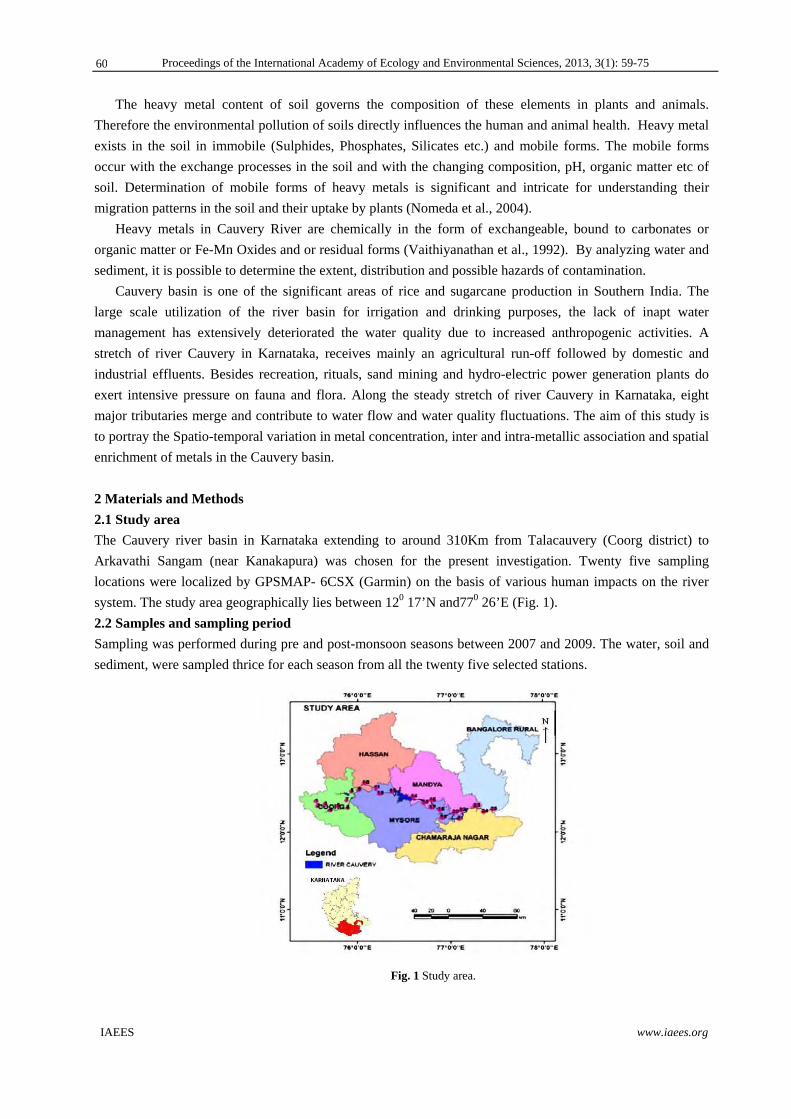
The Cauvery river basin in Karnataka extending to around 310Km from Talacauvery (Coorg district) to
Arkavathi Sangam (near Kanakapura) was chosen for the present investigation. Twenty five sampling
locations were localized by GPSMAP- 6CSX (Garmin) on the basis of various human impacts on the river
system. The study area geographically lies between 120 17’N and770 26’E (Fig. 1).
2.2 Samples and sampling period
Sampling was performed during pre and post-monsoon seasons between 2007 and 2009. The water, soil and
sediment, were sampled thrice for each season from all the twenty five selected stations.
Fig. 1 Study area.
60
Proceedings of the International Academy of Ecology and Environmental Sciences, 2013, 3(1): 59-75
IAEES www.iaees.org
2.3 Sampling, preservation and preparation
Water: Surface water samples for heavy metal analysis were collected in 100ml polythene bottles, pre-
cleaned with metal free soap water, rinsed with distilled water and finally soaked in 10% nitric acid for 24 h,
and rinsed with deionised water in the end. The collected samples were preserved by adding 2ml of nitric
acid. and stored in insulated cooler containing ice and brought on the same day to the laboratory and
maintained at 4°C ±2°C until processing and analysis was over as suggested in APHA (2005).
Sediment: Sediment Samples were collected along the river stretch using sediment dredger. It was washed
and dried before the next sample was collected and care was taken to ensure contamination of sample. The
samples were stored in polythene plastic bags and brought to laboratory at 40C±2°C to maintain the initial
conditions (Lokeshwari and Chandrappa, 2006) and, the same condition was maintained until digestion of the
samples. Special care was exercised while the surface of sediment is sampled. Samples were air dried at room
temperature, ground to a fine powder using mortar and pestle and sifted under 1mm nylon mesh and stored in
polythene bags (Singh, et al., 2005).
Soil: Soil samples of about 1kg were collected at a depth of 10-25Cm using spade and stored in polythene
covers. Agricultural/irrigated land and shady areas were avoided during sampling. The root parts and small
pebbles were removed from the sample and air dried at room temperature, ground to a fine powder using
mortar and pestle and sifted under 1mm nylon mesh. The samples were stored in a polythene bags ready for
digestion and analysis.
2.4 Microwave digestion
Ethos D microwave digestion unit was used to digest water, soil and sediment. The microwave digestion unit
mainly consists of tefflon vessels (6nos), carousel, programmer, microwave chamber and fume outlet. A
closed vessel microwave assisted acid digestion technique under high temperature and pressure has now
become routine (CCME, 1999).
Water: 10ml of water samples were added to Teflon tubes/ reference vessel fallowed by 1ml of Conc. HNO3,
the vessel was closed with valve and tightened. They were inserted into a single safety shield carousel and,
into the microwave chamber. The system was pre-programmed using the Ethos D control terminal (equipped
with software) for 5 min of microwave digestion at 250 W power and left for automatic ventilation for 2 min.
The digested solution was cooled and made up to 100 mL with Milli-Q distilled water and stored in special
containers for analysis
Sediment/Soil: Grounded solid sample of 0.25 g was poured into the reference vessels and 2.5 ml of Conc.
HNO3 and 2.5 ml of HF acid were added. It was inserted into a carousel and into the microwave unit for
digestion. The system was pre-programmed using the Ethos D control terminal (equipped with software) for
6 min of microwave digestion at 300 W power and another 5 min at 500 W power fallowed by automatic
ventilation for 10 min. The digested solution was cooled, filtered using Whatman filter paper 40, and final
volume was made up to 100 mL with Milli-Q distilled water.
2.5 Heavy metal analysis
Atomic Absorption Spectrophotometer (AAS-6300, Shimatzu) with two types of atomizers viz., flame and
graphite furnaces and Wizard software was used to estimate the heavy metals. The sample concentration
when below the detection limit in flame furnace was subjected to graphite furnace analysis.
3 Results and Discussion
The basic statistics of the data set pertaining to the metals in Cauvery river water with drinking standards;
sediments and their quality guidelines; bank soil with mean shale concentration are presented in Table 1.
61
Proceedings of the International Academy of Ecology and Environmental Sciences, 2013, 3(1): 59-75
IAEES www.iaees.org
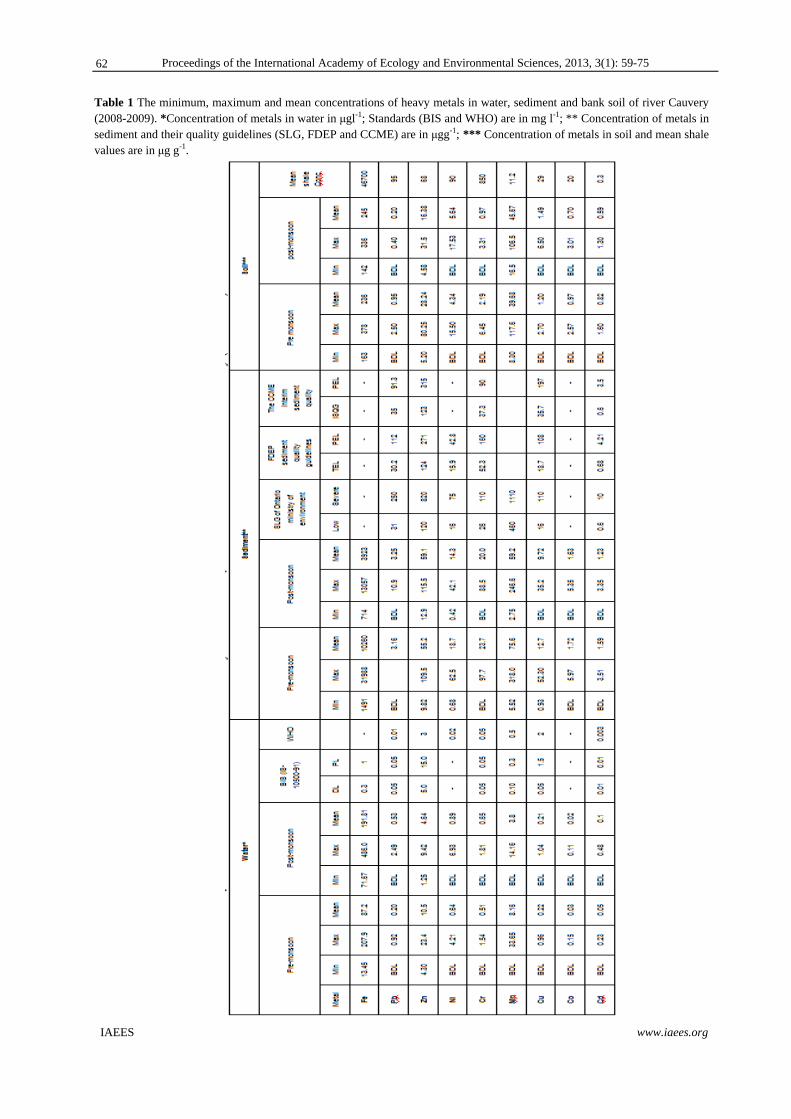
Table 1 The minimum, maximum and mean concentrations of heavy metals in water, sediment and bank soil of river Cauvery (2008-2009). *Concentration of metals in water in μgl-1; Standards (BIS and WHO) are in mg l-1; ** Concentration of metals in sediment and their quality guidelines (SLG, FDEP and CCME) are in μgg-1; *** Concentration of metals in soil and mean shale values are in μg g-1.
62
Proceedings of the International Academy of Ecology and Environmental Sciences, 2013, 3(1): 59-75
IAEES www.iaees.org
3.1 Concentration of heavy metals in river water
In the present study Fe is the major metal component in the river water. The metals concentration during the
pre-monsoon, is in the sequence of Fe >Zn> Mn> Ni> Cr> Cu> Pb> Cd> Co whereas, in the post-monsoon
Fe >Zn> Mn> Ni> Cr> Pb> Cu> Cd> Co. The pre-monsoon concentrations ranged from 13.5 to 207.9μg l-1
with a mean concentration of 87.2μgl-1 (Table 1). In contrast, the post-monsoon recorded elevated
concentrations, varied from 71.7 to 486.0μg l-1 with a mean value of 191.8μg l-1. In comparison with BIS
(1991), stations K19, K21, K24 and K25 of the downstream stretch exceeded the desirable limit (0.3 mg l-1).
In the pre-monsoon samples the Pb level varied between BDL and 0.92μg l-1 with a mean value of 0.20μg l-1.
However the post-monsoon exhibited augmented concentration, ranging from BDL to 2.49μg l-1 and mean
value of 0.53μg l-1. All the concentrations however are within the BIS (0.05mg l-1) and WHO (0.01mg l-1)
limits (Table 1).
Zn during the pre-monsoon showed considerable increase, compared to post-monsoon with values
ranging from 4.3 to 23.4μg l-1 and 1.25 to 9.42μg l-1 respectively. All the values are well within the standard
limits of BIS (5.0mg l-1) and WHO (3.0 mg l-1). Slightly decreased Ni concentration was observed during
pre-monsoon in contrast to post-monsoon with a mean value of 0.64μg l-1 and 0.89μg l-1, respectively. The
values of both the seasons were not crossed the WHO prescribed standard limit (0.02mg l-1) (Table 1).
Cr exhibited lower concentrations during pre-monsoon than post-monsoon. The values of pre-monsoon
ranged between BDL and 1.5μg l-1 with the mean value of 0.5 μgl-1 whereas, post-monsoon values varied
between BDL and 1.8 μgl-1 with a mean of 0.7 μgl-1. The standard limit for Cr in drinking water is 0.05 mg l-
1 (BIS and WHO).
The concentration of Mn during pre-monsoon varied from BDL to 33.7μg l-1 and an average of 8.2μg l-1 ,
while insignificantly reduced concentrations ranged from BDL to 14.6μg l-1 and a mean of 3.8μg l-1 was
observed during post-monsoon. The values of both the seasons are well below the standard limit of BIS
(0.10mg l-1) and WHO (0.5mg l-1). The average concentration of Cu during pre-monsoon is negligibly higher
(0.22μg l-1) than post-monsoon (0.21μg l-1) and is within the standard limits of BIS (1.5mg l-1) and WHO
(2.0mg l-1). Co recorded lowest concentration in both the seasons with negligible temporal variation. The
values ranged from BDL to 0.13 μg l-1 and BDL to 0.11μg l-1 during pre-monsoon and post-monsoon
respectively with trivial decreased mean concentrations. As a trace metal there is no guideline laid for Co at
national and international levels. In the pre-monsoon period, Cd recorded a lowest mean value of (0.05μg l-1)
than post-monsoon (0.10μg l-1).
3.2 Concentration of heavy metals in the sediment
In the present investigation sediment samples of both the pre and post-monsoon seasons depicted a similar
sequence of metal concentrations as Fe>Mn>Zn>Cr>Ni>Cu>Pb>Co>Cd. During pre-monsoon the
concentration of Fe varied from 1491 to 31988μg g-1 with a mean of 10260μg g-1 while, the post-monsoon
values varied between 714 and 13057μg g-1 with a mean of 3923μg g-1 (Table 1). The Pre-monsoon
concentration of Pb ranged between BDL and 9.25μg g-1 and the mean value of 3.16μg g-1 whereas, the
values during post-monsoon varied from BDL to 10.98μg g-1 with an average of 3.25μg g-1. In comparison
with sediment quality guidelines, the mean values of both the seasons did not exceed the lower limits of SLG
(31μg g-1), FDEP (30.2μg g-1) and CCME (35μg g-1) (Table 1).
The concentration of Zn during the pre and post-monsoon ranged from 9.82 to 109.50μg g-1 and 12.95 to
115.50μg g-1 respectively. The mean concentrations were within the stipulated sediment quality guidelines.
During pre-monsoon Ni concentration varied from 0.68 to 62.50μg g-1, with a mean value of 18.67μg g-1. In
contrast, the post-monsoon exhibited decreased concentrations, varying from 0.42 to 42.10μg g-1 with a mean
63
Proceedings of the International Academy of Ecology and Environmental Sciences, 2013, 3(1): 59-75
IAEES www.iaees.org
value of 14.34μg g-1. According to sediment quality guidelines, the maximum concentration for pre-monsoon
season was crossed the lower limit (16μg g-1) of SLG and ISQG (Table 1).
Cr concentration ranged between BDL and 97.97μg g-1, with a mean of 23.78μg g-1 during pre-monsoon
whereas, post-monsoon exhibited slightly lower concentrations ranged from BDL to 88.55μg g-1 with an
average of 20.01μg g-1. The mean Cr value was slightly below the lower limit of SLG (26μg g-1), of FDEP
(52.3) and SLQG (37.3μg g-1) of CCME. The concentration of Mn varied between 5.52 and 318μg g-1 and
2.75 to 246.6μg g-1 with a mean of 75.7 and 59.2μg g-1 during pre and post-monsoon respectively. The
concentration throughout the stretch in the study period is within the lower limit (460μg g-1) of SLG.
During pre-monsoon period, Cu varied from 0.93 to 52.3μg g-1 with a mean of 12.7μg g-1. The post-
monsoon concentrations ranged between BDL to 35.2μg g-1 and the mean is 9.7μg g-1. Maximum
concentrations of both pre and post-monsoon crossed the lower limits (SLG), TEL (FDEP) and ISQG
(CCME) (Table 1). Negligible seasonal variation in Co was observed with values ranging from BDL and 5.97
and BDL to 5.35μg g-1 respectively. The general acceptable range for sediments is 4–20μg g-1. The
concentration of Cd varied from BDL to 3.5μg g-1 for pre-monsoon and BDL to 3.3μg g-1 for post-monsoon.
Insignificant decreasing trend was exhibited during pre to post-monsoon with a mean value of 1.7 and 1.6μg
g-1 respectively. Virtually all the stations excluding station K1 crossed the desirable ranges of sediment
quality guidelines (Table 1).
3.3 Concentration of heavy metals in river bank soil
In soil the metal concentrations during pre and post-monsoon are in the order of Fe> Mn> Zn> Ni> Cr> Cu>
Co> Pb> Cd and Fe> Mn> Zn> Ni> Cu> Cr> Co> Pb> Cd respectively.
Fe concentration, during pre-monsoon varied from 163 to 378μg g-1 with a mean value of 236μg g-1
whereas, post-monsoon recorded 142μg g-1 of minimum and 336μg g-1 of maximum with an average of 245μg
g-1. The mean concentration of Pb is in the decreasing order from pre-monsoon (0.95μg g-1) to post-monsoon
(0.20μg g-1). The average shale value of Pb is 95μg g-1. Zn during pre-monsoon recorded highest values
(5.20 to 80.25μg g-1) than post-monsoon (4.58 to 31.50μg g-1) and all values are less than the mean shale
value of 95μg g-1.
The pre-monsoon concentration of Ni varied from BDL to 15.50μg g-1 and the mean was 4.34μg g-1. In
contrast, post-monsoon exhibited highest concentrations ranging from BDL to 17.53μg g-1 with a mean of
5.64μg g-1. The mean shale concentration is 68μg g-1. Cr during pre-monsoon is significantly higher (2.19μg
g-1) than post-monsoon mean (0.97μg g-1). The mean shale concentration of Cr in the earth crust is 95μgg-1.
the Considerable increasing trend in Mn concentration from pre-monsoon to post-monsoon with an average
of 39.68 and 45.67μg g-1 respectively. The average shale concentration is 850μg g-1.
The maximum concentration of Cu is 2.70μg g-1 during pre-monsoon and 6.50μg g-1 during post-
monsoon confirming significant seasonal fluctuation. The mean shale concentration for Cu is 11.2μg g-1.
Highest values recorded during pre-monsoon than post-monsoon for Co with negligible variation in the mean
concentrations, being 0.97 and 0.70μg g-1 respectively and the mean shale concentration is 29μg g-1. The
concentration of Cd during pre-monsoon varied between BDL and 1.6 with a mean of 0.82μg g-1. The post-
monsoon values varied from BDL to 1.3μg g-1 and the mean value was 0.59μg g-1 (Table 1).
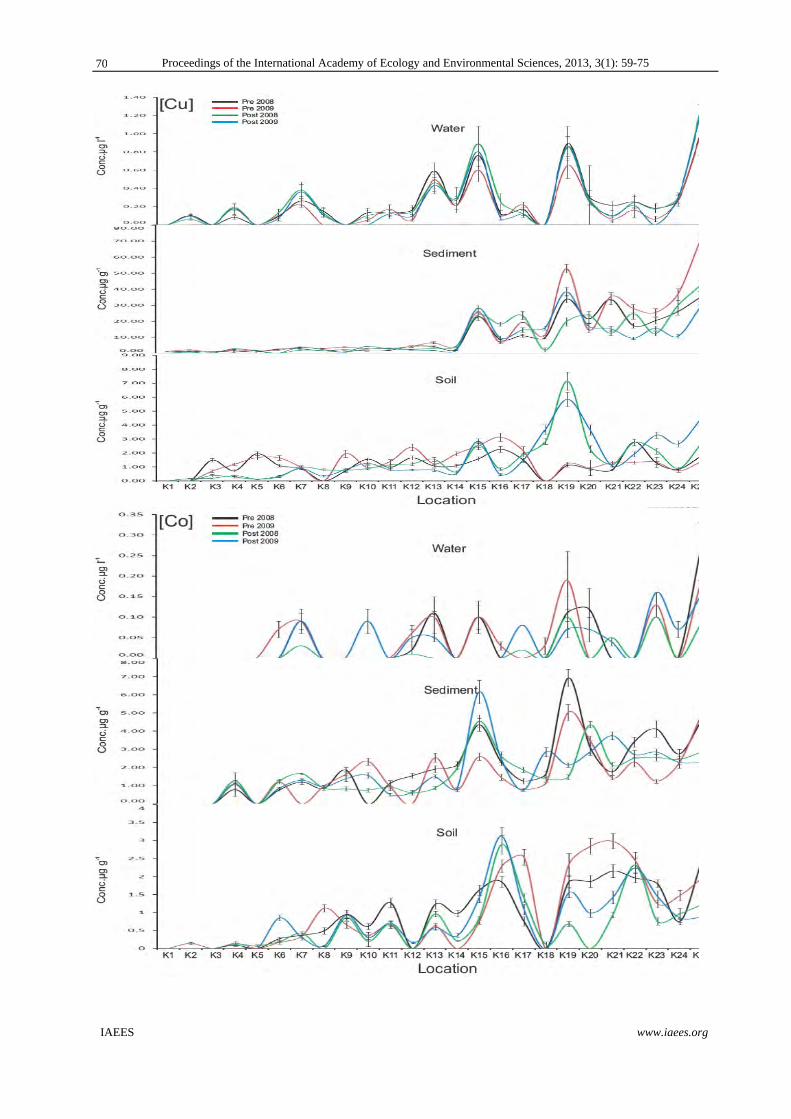
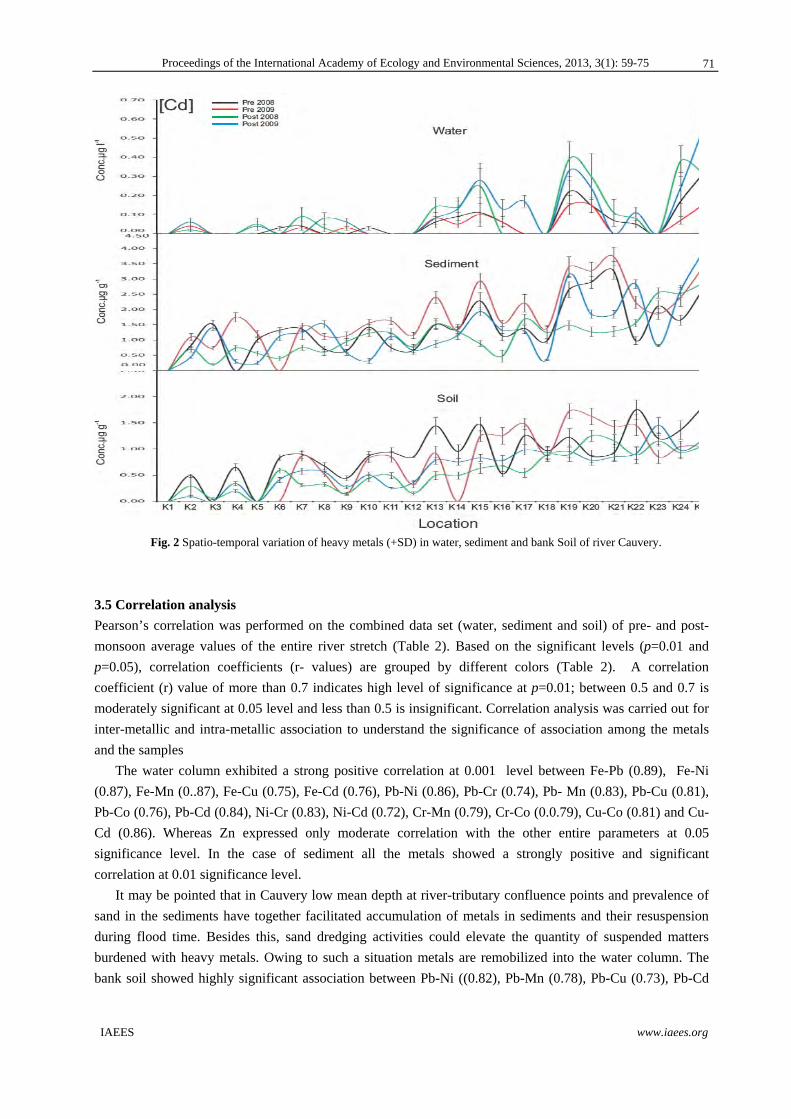
3.4 Spatio-temporal variations of heavy metals
The Line diagrams were plotted for individual metals for the different seasons with standard deviation at
p=0.05 to delineate the seasonal and spatial fluxes and variations in water, sediment and bank soil (Fig. 2).
The general trend observed is that the concentration increase exponentially from water to soil and, to
sediment throughout the river stretch.
64
Proceedings of the International Academy of Ecology and Environmental Sciences, 2013, 3(1): 59-75
IAEES www.iaees.org
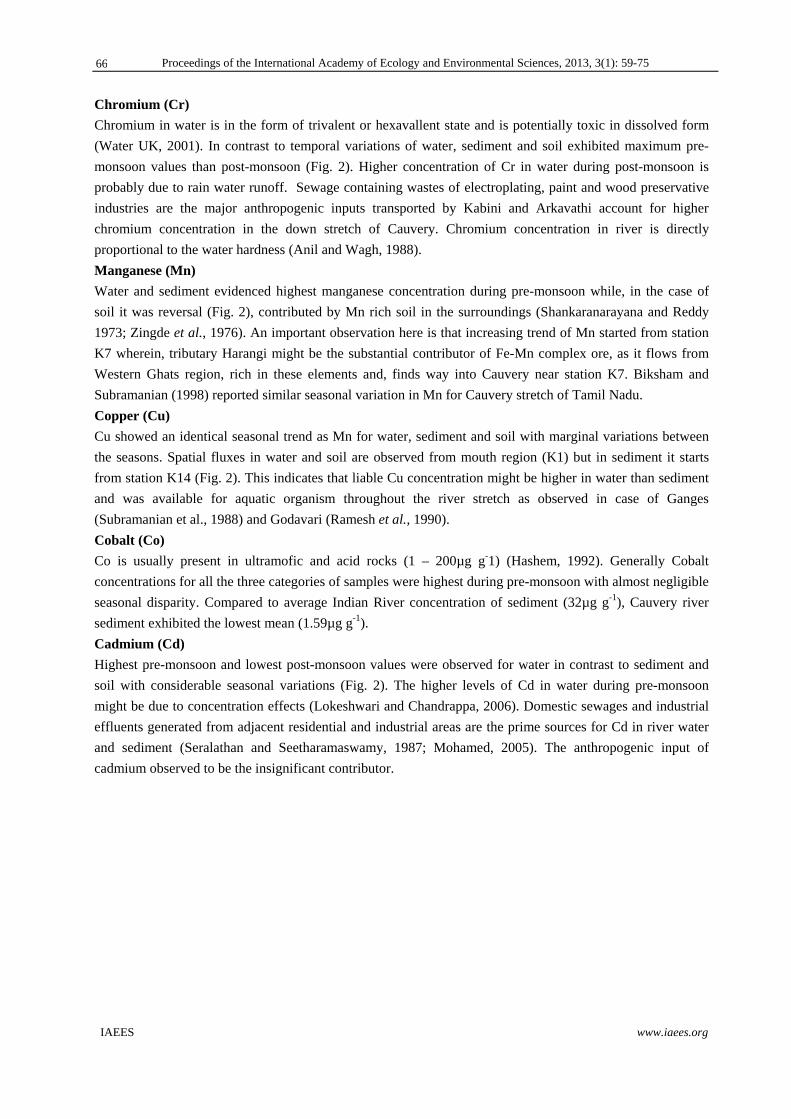
Iron (Fe)
Iron is one of the most abundant metals in the Earth’s crust. It is found in natural fresh waters at levels
ranging from 0.5 to 50mg l-1 and is an essential element in human nutrition (WHO, 2003). In the present
study water and soil showed post-monsoon maxima and pre-monsoon minima, whereas, in sediment values
appeared maximum for pre-monsoon and minimum for post-monsoon (Fig. 2). Water and sediment
evidenced a noticeable variation between the seasons. Tributaries Hemavathi and Kabini draining highly
mineralized areas appear to be the significant contributors of iron into the Cauvery River (Vaithiyanathan et
al., 1992). Draining of Sugar industry effluents rich in Iron from Mandya industrial area through the tributary
Shimsha to the down stretch of river Cauvery is another considerable source (Narayana and Somashekar
(1997).
Lead (Pb)
The Pb concentration in water significantly varied between seasons with highest post-monsoon and lowest
pre-monsoon concentrations respectively during 2008 and 2009. The sediment also exhibited a similar
seasonal trend with insignificant variation and highest concentrations during post-monsoon 2009 (Fig. 2). It
may be due to influx of storm water from nonpoint sources. In contrast, soil exhibited pre-monsoon maxima
and post-monsoon minima with maximum concentrations during pre-monsoon 2009. Stations K19 and K25
are imperative recipients of Pb, which formulate seasonal difference especially along the downstream stretch.
It is evident that tributaries Kabini and Arkavathi, passing through industrial areas are predominantly
responsible for Pb input into Cauvery, apart from the anthropogenic source. The average Pb levels in Indian
river sediments is around 14μg g-1 (Dekov et al., 1999), which is less than the world average of 150μg g-1
(Martin and Meybeck, 1979).
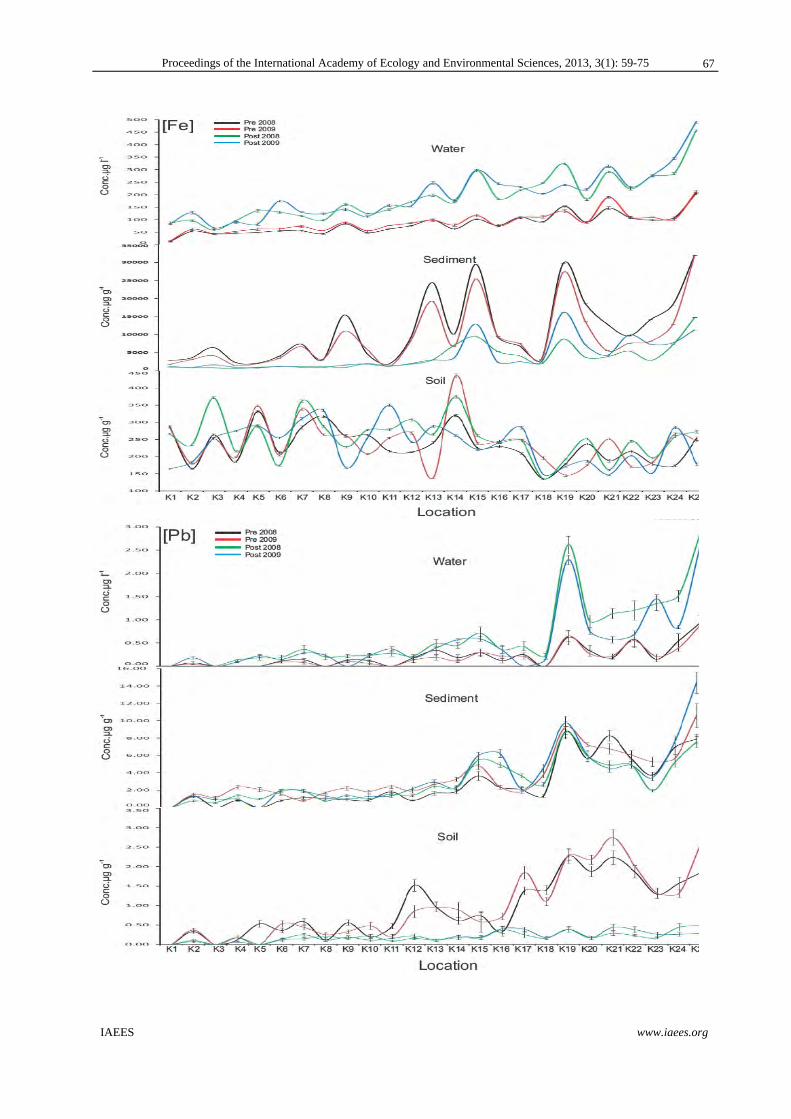
Zinc (Zn)
Zinc is an essential trace element found in river environment in the form of salts or organic complexes (WHO,
2003). Water and soil during the study period showed maximum values for pre-monsoon and minimum for
post-monsoon with momentous seasonal differences, whereas, sediment articulated vice versa through
moderate variation between the seasons (Fig. 2). Noticeable escalating trend was observed from upstream to
downstream stations. Zn can enter the aquatic environment from a number of sources including industrial
discharges, sewage and runoff (Ramanathan et al., 1993; Boxall et al., 2000). Influx of organic wastes as
domestic sewage, sugar effluent particularly at K15, K19, K21, K23 and K25 through tributaries might be the
influencing factor for elevated temporal variation of Zn in water and sediment. Algarsamy (1991) opined that
organic carbon content in aquatic system is directly proportional to the concentration of Zn in water and bed
sediments.
Nickel (Ni)
Nickel may be found in slate, sand stone, clay minerals and basalt. The main source of Ni is pentalandite. Ni
in the water occurs in the form of nickel carbonate (water soluble), nickel sulphide and nickel oxide (water
insoluble). The element accumulates in sediment and is a part of various biological cycles (lentech.com). In
the present case, water and soil showed post-monsoon maxima and pre-monsoon minima. But sediment
depicted a pre-monsoon maxima and post-monsoon minima with comparable spatial fluxes especially from
station K12 to K25 (Fig. 2). In the sediment the Pre-monsoon 2009 values remained higher. Washing kitchen
wares directly in river water is a common practice observed throughout the stretch that could lead to
disbanding of Ni-Cu alloy used as a protective coating could be the responsible factor. Also erosion of
agricultural soil from adjacent agricultural fields contains traces of nickel, wherein it as used in phosphate
fertilizers. Comparable spatial trend for Ni in Cauvery was reported by Abida et al (2009).
65
Proceedings of the International Academy of Ecology and Environmental Sciences, 2013, 3(1): 59-75
IAEES www.iaees.org
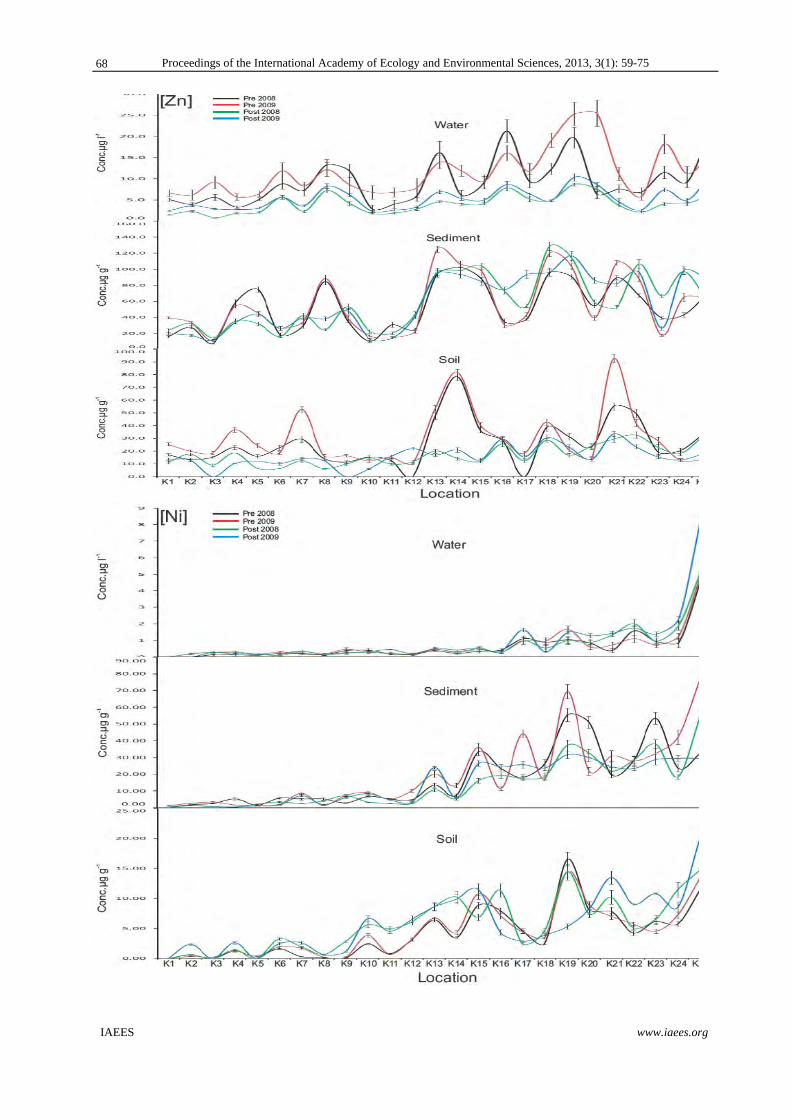
Chromium (Cr)
Chromium in water is in the form of trivalent or hexavallent state and is potentially toxic in dissolved form
(Water UK, 2001). In contrast to temporal variations of water, sediment and soil exhibited maximum pre-
monsoon values than post-monsoon (Fig. 2). Higher concentration of Cr in water during post-monsoon is
probably due to rain water runoff. Sewage containing wastes of electroplating, paint and wood preservative
industries are the major anthropogenic inputs transported by Kabini and Arkavathi account for higher
chromium concentration in the down stretch of Cauvery. Chromium concentration in river is directly
proportional to the water hardness (Anil and Wagh, 1988).
Manganese (Mn)
Water and sediment evidenced highest manganese concentration during pre-monsoon while, in the case of
soil it was reversal (Fig. 2), contributed by Mn rich soil in the surroundings (Shankaranarayana and Reddy
1973; Zingde et al., 1976). An important observation here is that increasing trend of Mn started from station
K7 wherein, tributary Harangi might be the substantial contributor of Fe-Mn complex ore, as it flows from
Western Ghats region, rich in these elements and, finds way into Cauvery near station K7. Biksham and
Subramanian (1998) reported similar seasonal variation in Mn for Cauvery stretch of Tamil Nadu.
Copper (Cu)
Cu showed an identical seasonal trend as Mn for water, sediment and soil with marginal variations between
the seasons. Spatial fluxes in water and soil are observed from mouth region (K1) but in sediment it starts
from station K14 (Fig. 2). This indicates that liable Cu concentration might be higher in water than sediment
and was available for aquatic organism throughout the river stretch as observed in case of Ganges
(Subramanian et al., 1988) and Godavari (Ramesh et al., 1990).
Cobalt (Co)
Co is usually present in ultramofic and acid rocks (1 – 200µg g-1) (Hashem, 1992). Generally Cobalt
concentrations for all the three categories of samples were highest during pre-monsoon with almost negligible
seasonal disparity. Compared to average Indian River concentration of sediment (32µg g-1), Cauvery river
sediment exhibited the lowest mean (1.59µg g-1).
Cadmium (Cd)
Highest pre-monsoon and lowest post-monsoon values were observed for water in contrast to sediment and
soil with considerable seasonal variations (Fig. 2). The higher levels of Cd in water during pre-monsoon
might be due to concentration effects (Lokeshwari and Chandrappa, 2006). Domestic sewages and industrial
effluents generated from adjacent residential and industrial areas are the prime sources for Cd in river water
and sediment (Seralathan and Seetharamaswamy, 1987; Mohamed, 2005). The anthropogenic input of
cadmium observed to be the insignificant contributor.
66
Proceedings of the International Academy of Ecology and Environmental Sciences, 2013, 3(1): 59-75
IAEES www.iaees.org
67
Proceedings of the International Academy of Ecology and Environmental Sciences, 2013, 3(1): 59-75
IAEES www.iaees.org
68
Proceedings of the International Academy of Ecology and Environmental Sciences, 2013, 3(1): 59-75
IAEES www.iaees.org
69
Proceedings of the International Academy of Ecology and Environmental Sciences, 2013, 3(1): 59-75
IAEES www.iaees.org
70
Proceedings of the International Academy of Ecology and Environmental Sciences, 2013, 3(1): 59-75
IAEES www.iaees.org
Fig. 2 Spatio-temporal variation of heavy metals (+SD) in water, sediment and bank Soil of river Cauvery.
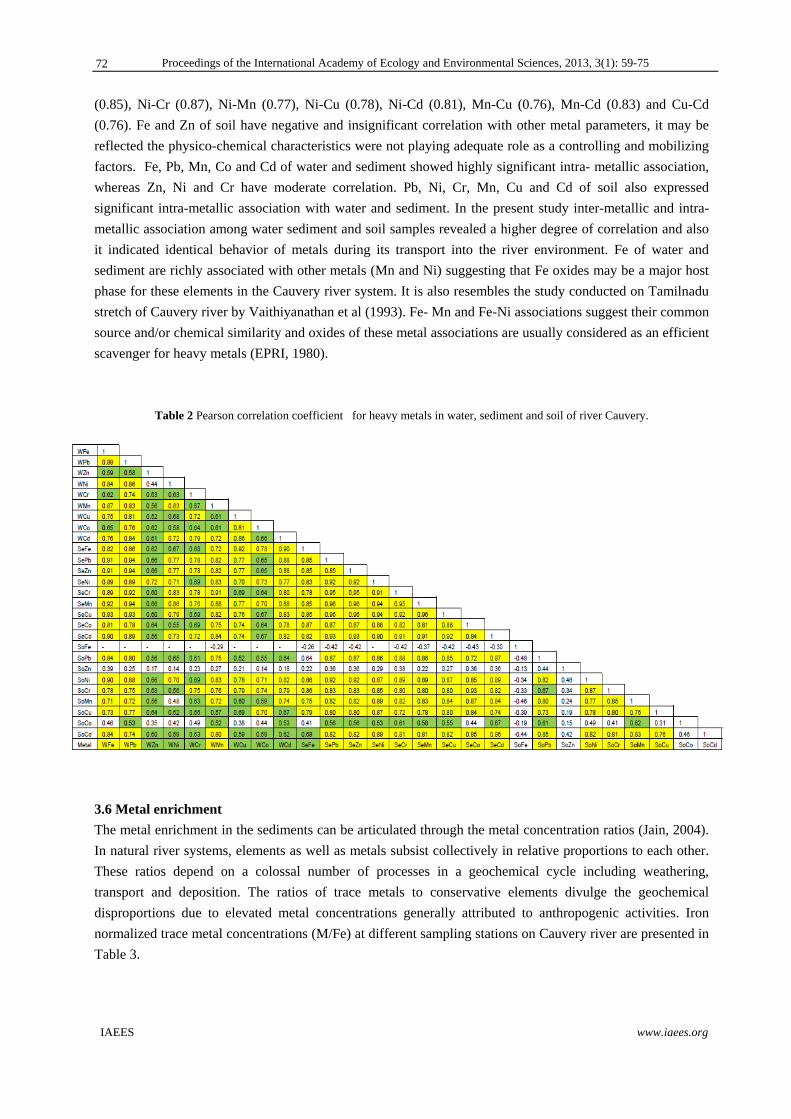
3.5 Correlation analysis
Pearson’s correlation was performed on the combined data set (water, sediment and soil) of pre- and post-
monsoon average values of the entire river stretch (Table 2). Based on the significant levels (p=0.01 and
p=0.05), correlation coefficients (r- values) are grouped by different colors (Table 2). A correlation
coefficient (r) value of more than 0.7 indicates high level of significance at p=0.01; between 0.5 and 0.7 is
moderately significant at 0.05 level and less than 0.5 is insignificant. Correlation analysis was carried out for
inter-metallic and intra-metallic association to understand the significance of association among the metals
and the samples
The water column exhibited a strong positive correlation at 0.001 level between Fe-Pb (0.89), Fe-Ni
(0.87), Fe-Mn (0..87), Fe-Cu (0.75), Fe-Cd (0.76), Pb-Ni (0.86), Pb-Cr (0.74), Pb- Mn (0.83), Pb-Cu (0.81),
Pb-Co (0.76), Pb-Cd (0.84), Ni-Cr (0.83), Ni-Cd (0.72), Cr-Mn (0.79), Cr-Co (0.0.79), Cu-Co (0.81) and Cu-
Cd (0.86). Whereas Zn expressed only moderate correlation with the other entire parameters at 0.05
significance level. In the case of sediment all the metals showed a strongly positive and significant
correlation at 0.01 significance level.
It may be pointed that in Cauvery low mean depth at river-tributary confluence points and prevalence of
sand in the sediments have together facilitated accumulation of metals in sediments and their resuspension
during flood time. Besides this, sand dredging activities could elevate the quantity of suspended matters
burdened with heavy metals. Owing to such a situation metals are remobilized into the water column. The
bank soil showed highly significant association between Pb-Ni ((0.82), Pb-Mn (0.78), Pb-Cu (0.73), Pb-Cd
71
Proceedings of the International Academy of Ecology and Environmental Sciences, 2013, 3(1): 59-75
IAEES www.iaees.org
(0.85), Ni-Cr (0.87), Ni-Mn (0.77), Ni-Cu (0.78), Ni-Cd (0.81), Mn-Cu (0.76), Mn-Cd (0.83) and Cu-Cd
(0.76). Fe and Zn of soil have negative and insignificant correlation with other metal parameters, it may be
reflected the physico-chemical characteristics were not playing adequate role as a controlling and mobilizing
factors. Fe, Pb, Mn, Co and Cd of water and sediment showed highly significant intra- metallic association,
whereas Zn, Ni and Cr have moderate correlation. Pb, Ni, Cr, Mn, Cu and Cd of soil also expressed
significant intra-metallic association with water and sediment. In the present study inter-metallic and intra-
metallic association among water sediment and soil samples revealed a higher degree of correlation and also
it indicated identical behavior of metals during its transport into the river environment. Fe of water and
sediment are richly associated with other metals (Mn and Ni) suggesting that Fe oxides may be a major host
phase for these elements in the Cauvery river system. It is also resembles the study conducted on Tamilnadu
stretch of Cauvery river by Vaithiyanathan et al (1993). Fe- Mn and Fe-Ni associations suggest their common
source and/or chemical similarity and oxides of these metal associations are usually considered as an efficient
scavenger for heavy metals (EPRI, 1980).
Table 2 Pearson correlation coefficient for heavy metals in water, sediment and soil of river Cauvery.
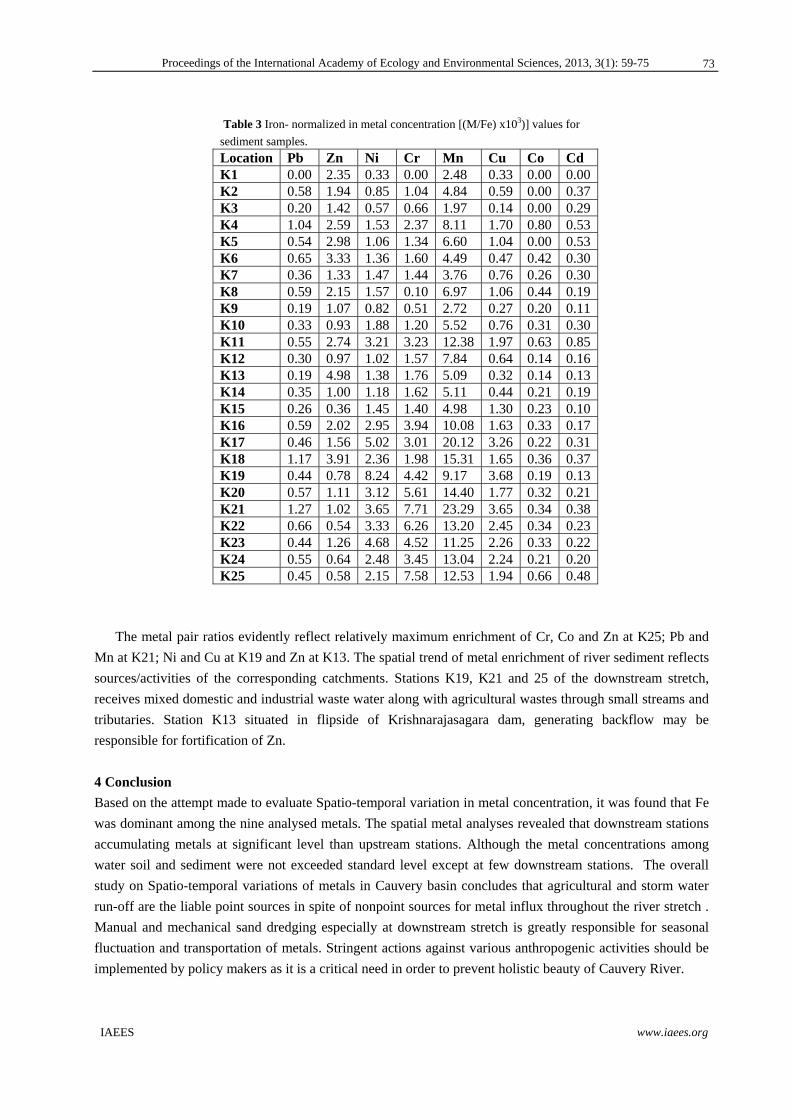
3.6 Metal enrichment
The metal enrichment in the sediments can be articulated through the metal concentration ratios (Jain, 2004).
In natural river systems, elements as well as metals subsist collectively in relative proportions to each other.
These ratios depend on a colossal number of processes in a geochemical cycle including weathering,
transport and deposition. The ratios of trace metals to conservative elements divulge the geochemical
disproportions due to elevated metal concentrations generally attributed to anthropogenic activities. Iron
normalized trace metal concentrations (M/Fe) at different sampling stations on Cauvery river are presented in
Table 3.
72
Proceedings of the International Academy of Ecology and Environmental Sciences, 2013, 3(1): 59-75
IAEES www.iaees.org
Table 3 Iron- normalized in metal concentration [(M/Fe) x103)] values for
sediment samples.
Location Pb Zn Ni Cr Mn Cu Co Cd K1 0.00 2.35 0.33 0.00 2.48 0.33 0.00 0.00 K2 0.58 1.94 0.85 1.04 4.84 0.59 0.00 0.37 K3 0.20 1.42 0.57 0.66 1.97 0.14 0.00 0.29 K4 1.04 2.59 1.53 2.37 8.11 1.70 0.80 0.53 K5 0.54 2.98 1.06 1.34 6.60 1.04 0.00 0.53 K6 0.65 3.33 1.36 1.60 4.49 0.47 0.42 0.30 K7 0.36 1.33 1.47 1.44 3.76 0.76 0.26 0.30 K8 0.59 2.15 1.57 0.10 6.97 1.06 0.44 0.19 K9 0.19 1.07 0.82 0.51 2.72 0.27 0.20 0.11 K10 0.33 0.93 1.88 1.20 5.52 0.76 0.31 0.30 K11 0.55 2.74 3.21 3.23 12.38 1.97 0.63 0.85 K12 0.30 0.97 1.02 1.57 7.84 0.64 0.14 0.16 K13 0.19 4.98 1.38 1.76 5.09 0.32 0.14 0.13 K14 0.35 1.00 1.18 1.62 5.11 0.44 0.21 0.19 K15 0.26 0.36 1.45 1.40 4.98 1.30 0.23 0.10 K16 0.59 2.02 2.95 3.94 10.08 1.63 0.33 0.17 K17 0.46 1.56 5.02 3.01 20.12 3.26 0.22 0.31 K18 1.17 3.91 2.36 1.98 15.31 1.65 0.36 0.37 K19 0.44 0.78 8.24 4.42 9.17 3.68 0.19 0.13 K20 0.57 1.11 3.12 5.61 14.40 1.77 0.32 0.21 K21 1.27 1.02 3.65 7.71 23.29 3.65 0.34 0.38 K22 0.66 0.54 3.33 6.26 13.20 2.45 0.34 0.23 K23 0.44 1.26 4.68 4.52 11.25 2.26 0.33 0.22 K24 0.55 0.64 2.48 3.45 13.04 2.24 0.21 0.20 K25 0.45 0.58 2.15 7.58 12.53 1.94 0.66 0.48
The metal pair ratios evidently reflect relatively maximum enrichment of Cr, Co and Zn at K25; Pb and
Mn at K21; Ni and Cu at K19 and Zn at K13. The spatial trend of metal enrichment of river sediment reflects
sources/activities of the corresponding catchments. Stations K19, K21 and 25 of the downstream stretch,
receives mixed domestic and industrial waste water along with agricultural wastes through small streams and
tributaries. Station K13 situated in flipside of Krishnarajasagara dam, generating backflow may be
responsible for fortification of Zn.
4 Conclusion
Based on the attempt made to evaluate Spatio-temporal variation in metal concentration, it was found that Fe
was dominant among the nine analysed metals. The spatial metal analyses revealed that downstream stations
accumulating metals at significant level than upstream stations. Although the metal concentrations among
water soil and sediment were not exceeded standard level except at few downstream stations. The overall
study on Spatio-temporal variations of metals in Cauvery basin concludes that agricultural and storm water
run-off are the liable point sources in spite of nonpoint sources for metal influx throughout the river stretch .
Manual and mechanical sand dredging especially at downstream stretch is greatly responsible for seasonal
fluctuation and transportation of metals. Stringent actions against various anthropogenic activities should be
implemented by policy makers as it is a critical need in order to prevent holistic beauty of Cauvery River.
73
Proceedings of the International Academy of Ecology and Environmental Sciences, 2013, 3(1): 59-75
IAEES www.iaees.org
Acknowledgements The authors would like to thanks NRCD, The funding agency, Ministry of Environment
and Forest, New Delhi for providing invaluable financial support to conduct investigation on water quality of
river Cauvery.
References
Abbas FMA, Ismail N, Ahmed A, et al. 2009. Analysis of heavy metal concentrations in sediments of
selected estuaries of Malaysia – a statistical assessment. Environmental Monitoring and Assessment, 153:
179-185
Abida, B. 2009. Concurrent removal and accumulation of Fe2+, Cd2+ and Cu2+ from waste water using aquatic
macrophytes. Der pharma chemical, 1(1): 219-224
Anil AC, Wagh AB. 1988. Accumulation of copper and zinc by Balanus amphitrite in a Tropical Estuary.
Marine Pollution Bulletin, 19: 177-180
APHA (American Public Health Association). 2005. Standard Methods for the Examination of Water and
Waste Water. American Public Health Association, Washington, USA
Audry S, Schafer J, Blanc G, et al. 2004. Fifty-year sedimentary record of heavy metal pollution (Cd, Zn, Cu,
Pb) in the Lot River reservoirs (France). Environmental Pollution, 132: 413-426
Beg KR, Ali S. 2008. Chemical Contaminants and Toxicity of Ganga River Sediment from Up and Down
Stream Area at Kanpur. American Journal of Environmental Sciences, 4 (4): 362-366
Biksham G, Subramanian V. 1988. Elemental composition of Godavari sediments (Central and Southern
Indian Subcontinent). Chemical Geology, 70: 275-286
Boxall ABA, Comber SD, Conrad AU, et al. 2000. Inputs, monitoring and fate modelling of antifouling
biocides in UK estuaries. Marine Pollution Bulletin, 40: 898-905
Bureau of Indian Standard (BIS): 10500. 1991: Specification for drinking water, Indian Standard Institution.
New Delhi, India, 1-4
Canadian Councils of Ministers of the Environment (CCME). 1999. Canadian water quality guidelines for the
protection of aquatic life. Canadian Water Quality Index 1.0. Technical Report, Winnipeg, Canada, 29-36
Dekov VM, Subramanian V, Van GR. 1999. Chemical composition of riverine suspended matter and
sediments from the Indian sub-continent. Mitt. Geol.-Paläont. Inst. Univ. Hamburg, 82: 99-109
EPRI CS-1513, 1980. Adsorption/Coprecipitation of Trace Elements from Water (Final Report). The
Program, USA
Hollert H, Keiter S, Konig N, et al. 2003. A new sediment contact assay to assess particular-bound pollutants
using zebrafish (Danio rerio) embryos. Journal of Soils and Sediments, 3: 197-207
Jain CK. 2004. Metal fractionation study on bed sediments of river Yamuna, India. Water Research, 38: 569-
578
Linnik PM, Zubenko IB. 2000. Role of bottom sediments in the secondary pollution of aquatic environments
by heavy-metal compounds. Lakes Reservoirs Research Management, 5: 11-21
Lokeshwari H, Chandrappa GT. 2006. Impact of heavy metal contamination of Bellandur Lake on soil and
cultivated vegetation. Current Science, 91: 622-627
Martin JM, Meybeck M. 1979. Elemental mass-balance of material carried by world major rivers. Marine
Chemistry, 7: 173-206
Mohamed HAH, Mohamed RF. 2005. Accumulation of trace metals in some benthic invertebrate and fish
species relevant to their concentration in water and sediment of Lake Qarun, Egypt. Egyptian Journal of
Aquatic Research, 31(1): 1110-0354
74
Proceedings of the International Academy of Ecology and Environmental Sciences, 2013, 3(1): 59-75
IAEES www.iaees.org
Narayana J, Somashekar RK. 1997. Heavy metal composition in the sediment and plants of River Cauvery.
Journal of Environmental Pollution, 4(4): 325-328
Nomeda S, Dalia MB. 2004. Determination of heavy metal mobile forms by different extraction methods.
Ekologija, 1: 36-41
Prajapati SK. 2012. Biomonitoring and speciation of road dust for heavy metals using Calotropis procera and
Delbergia sissoo. Environmental Skeptics and Critics, 1(4): 61-64
Ramanathan AL, Vaithiyanathan P, Subramanian V, et al. 1993. Geochemistry of the Cauvery Estuary, East
Coast of India. Estuaries, 16(3): 459-474
Ramesh R, Subramanian V, Van GR. 1990. Heavy metal distribution in sediments of Krishna river basin,
India. Environmental Geology Water Science, 15: 207-216
Sayadi MH, Sayyed MRG. 2011. Variations in the heavy metal accumulations within the surface soils from
the Chitgar industrial area of Tehran. Proceedings of the International Academy of Ecology and
Environmental Sciences, 1(1): 36-46
Seralathan P, Seetharamasamy A. 1987. Geochemistry of modern deltaic sediments of the Cauvery River,
east coast of India. Indian Journal of Marine Sciences, 16: 31-38
Singh KP, Malik A, Sinha S. 2005. Water quality assessment and apportionment of pollution sources of
Gomti River (India) using Multivariate Statistical Techniques—a case study. Analytica Chimica Acta, 538:
355-374
Subramanian V, Jha PK, Van GR. 1988. Heavy metals in the Ganges estuary. Marine Pollution Bulletin, 19:
290-293
Vaithiyanathan P, Ramanathan AL, Subramanian V. 1992. Sediment transport in the Cauvery River basin :
sediment characteristics and controlling factors. Journal of Hydrology, 139: 197-210
Vaithiyanathan P, Ramanathan AL, Subramanian V. 1993. The Transport and Distribution of heavy metals in
river Cauvery. Water, Air and Soil Pollution, 71: 13-28
WHO, 2003. Drinking Water Quality (3rd edition). Geneva, Switzerland
WHO. 1991. Drinking Water Quality Control in Small Community Supplies – Guidelines for Drinking Water
Quality. CBS Publisher, New Delhi, India
Zingde MD, Singbal SYS, Moraes CF, et al. 1976. Arsenic, Copper, Zinc and Manganese in the marine flora
and fauna of coastal and estuarine waters around Goa. Indian Journal of Marine Sciences, 5: 212-217
75