advanced metals initiative - SAIMM
108
V VOLUME 116 NO. 10 OCTOBER 2016 19–21 October 2016 advanced metals initiative our future through science
-
Upload
khangminh22 -
Category
Documents
-
view
0 -
download
0
Transcript of advanced metals initiative - SAIMM

VVOLUME 116 NO. 10 OCTOBER 2016
19–21 October 2016
our future through science
advanced metals initiative
our future through science

Lighter,functional alloymaterials for theautomotive and
aerospaceindustries.
Beneficiation fornuclear
materials usedin nuclearreactors.
Beneficiation ofresources and
materialssolutions for thetransportation,
energy andpetrochemical
industries.
LMDN NMDN FMDN
Value-addedPGM products(Autocatalysts,PGM coatings,
etc.).
PMDN
Enabling Platform of Projects and Partnerships
advanced metals initiative
ADVANCED METALS INITIATIVE
The Advanced Metals Initiative (AMI) wasestablished by the Department of Scienceand Technology to facilitate research,development and innovation across theadvanced metals value chain.
GOAL
To target significant export income and newindustries for South Africa by 2020 throughthe country becoming a world leader insustainable metals production and manu-facturing via technological competence andoptimal, sustainable local manufacturing ofvalue-added products, while reducingenvironmental impact.
STRATEGY
The AMI takes an integrated approachacross the entire value chain from resourcedevelopment to metal production and themanufacture of end-products, to achieve itsgoal, through:
• Reducing the energy required toproduce metals by 30%;
• Increasing asset productivity by 30%;
• Developing technologies that canenable new industries for South Africa;and,
• Reducing the full life cycleenvironmental impact of metalsproducts by 50%.
TECHNOLOGY NETWORKS
The AMI’s technology networks include:
• the Light Metals Development Network(LMDN) for titanium and aluminium co-ordinated by the Council for Scientificand Industrial Research (CSIR);
• the Precious Metals DevelopmentNetwork (PMDN) for gold and theplatinum group metals (PGMs), co-ordinated by Mintek;
• the Nuclear Materials DevelopmentNetwork (NMDN) for hafnium,zirconium and monazite co-ordinatedby The South African Nuclear EnergyCorporation of SOC Ltd. (Necsa).
• the Ferrous Metals DevelopmentNetwork (FMDN) for ferrous and basemetals, co-ordinated by Mintek.
To lead a global revolution in advancedMetals generating significant exportincome and new industries for South Africawhile reducing environmental impact.
The AMI promotes collaborative researchbetween the science councils, highereducation institutions and industry.
Human resource development is critical forthe networks to:
- expand the country’s technicalcapacity;
- develop the use of metals in newapplications and more diverseindustries; and
- develop industrial localisation.
LIGHT METALS DEVELOPMENTNETWORK
• Global demand for ultralight,ultrastrong, recyclable metals isgrowing as the world switches to low-emission vehicles, energy-savingdevices and sustainable products.
• Aluminium demand is forecast toincrease by 30% in the near future,while for the emerging industrial lightmetal, titanium, the sky is the limit.
• For its part, South Africa has a maturealuminium industry, which is among thecountry’s top exporters, and one of theworld’s richest titanium resources onwhich to build a new industry.
The LMDN sees South Africa becoming aworld leader in light metals.
The LMDN conducts scientific researchactivities along the entire value chain, fromresource development to primary metalproduction, fabrication, casting, joiningtechnologies and manufactured products.
The aim is to create a globally competitiveintegrated light metals industry, to developsuperior cost-effective technologies andmanufacturing systems, and to reduceenergy use, greenhouse emissions andenvironmental impact.

advanced metals initiative
NUCLEAR MATERIALSDEVELOPMENT NETWORK• The global upsurge in energy demand has
led to a renewed focus on nuclear energyand related nuclear materials likezirconium and hafnium.
• Zirconium is used as cladding in nuclearreactors and zirconium carbide hasapplications in future nuclear reactors.
• South Africa has a vast resource of zirconand supplies 30% of the world market.
The NMDN seeks to beneficiate zirconiumand hafnium across the value chain throughthe preparation and purification ofintermediate metal salts, metalmanufacturing and optimum zirconium-alloys.The NMDN targets alternative, novel,economic and environmentally friendlymanufacturing processes for the metal pairzirconium/hafnium via existing plasma andfluorochemical expertise.
PRECIOUS METALS DEVELOPMENTNETWORK
Precious metals are characterised by theirhigh density and cost, which make themless attractive for use in bulk componentsand more viable in coating/depositiontechnologies (chemical and physical) forvarious applications in which the uniqueproperties of these high-value metals arebeneficial.The PMDN assists South Africa in retainingthe precious metals value matrix through theidentification, research and promotion ofnew technologies and applications tosupport the long-term development of themining industry.
FERROUS METALS DEVELOPMENTNETWORKThe FMDN presents a unique opportunity tosimultaneously add value to severalminerals that South Africa possess in largequantities such as iron, chromium,manganese, vanadium, etc. whileaddressing key material challengesexperienced by strategic sectors of theeconomy such as the transportation, energyand petrochemical industries. The FMDNR&D programmes are done within atripartite collaborative framework involvingindustry, academia and science councils.The broad objectives of the FMDN can thusbe summarised as follows:
• Beneficiation of South Africa’s ferrousresources to stages 3 and 4 undefined.
• Improvement of the country’s capability toproduce high-end ferrous products,especially those that are needed by othercritical sectors of the economy, such aspetrochemical, energy generation,transportation, etc.
• Generation of local know-how (innovation).
• Human Capital Development which willalleviate the shortage in scientific andtechnological qualifications and skills inthese sectors and thereby ensuring thesustainablity and the competitiveness ofthe local industry. This will also improveSA’s attractiveness as an investmentdestination.
• Promotion of local and internationalcollaboration in the field of ferrousmetallurgy.
our future through science
CONTACT DETAILSLlanley Simpson
Tel: +27 12 843 6436Fax: +27 86 681 0242Cell: +27 83 408 6910
Email: [email protected]
The key focus is on:
• creating new industries;
• supporting existing industries;
• localisation of technology.
supported by

�
ii
Mike TekePresident, Chamber of Mines of South Africa
Mosebenzi ZwaneMinister of Mineral Resources, South Africa
Rob DaviesMinister of Trade and Industry, South Africa
Naledi PandorMinister of Science and Technology, South Africa
C. Musingwini
S. Ndlovu
A.S. Macfarlane
M. Mthenjane
R.T. Jones
J. Porter
Z. Botha
V.G. Duke A.G. SmithI.J. Geldenhuys M.H. SolomonM.F. Handley M.R. TlalaW.C. Joughin D. TudorM. Motuku D.J. van NiekerkD.D. Munro A.T. van ZylG. Njowa
N.A. Barcza S.J. RamokgopaR.D. Beck M.H. RogersJ.R. Dixon D.A.J. Ross-WattM. Dworzanowski G.L. SmithH.E. James W.H. van NiekerkG.V.R. Landman R.P.H. WillisJ.C. Ngoma
Botswana L.E. DimbunguDRC S. MalebaJohannesburg J.A. LuckmannNamibia N.M. NamateNorthern Cape C.A. van WykPretoria P. BredellWestern Cape C.G. SweetZambia D. MumaZimbabwe S. MatutuZululand C.W. Mienie
Australia: I.J. Corrans, R.J. Dippenaar, A. Croll, C. Workman-Davies
Austria: H. WagnerBotswana: S.D. WilliamsUnited Kingdom: J.J.L. Cilliers, N.A. BarczaUSA: J-M.M. Rendu, P.C. Pistorius
The Southern African Institute of Mining and Metallurgy
*Deceased
* W. Bettel (1894–1895)* A.F. Crosse (1895–1896)* W.R. Feldtmann (1896–1897)* C. Butters (1897–1898)* J. Loevy (1898–1899)* J.R. Williams (1899–1903)* S.H. Pearce (1903–1904)* W.A. Caldecott (1904–1905)* W. Cullen (1905–1906)* E.H. Johnson (1906–1907)* J. Yates (1907–1908)* R.G. Bevington (1908–1909)* A. McA. Johnston (1909–1910)* J. Moir (1910–1911)* C.B. Saner (1911–1912)* W.R. Dowling (1912–1913)* A. Richardson (1913–1914)* G.H. Stanley (1914–1915)* J.E. Thomas (1915–1916)* J.A. Wilkinson (1916–1917)* G. Hildick-Smith (1917–1918)* H.S. Meyer (1918–1919)* J. Gray (1919–1920)* J. Chilton (1920–1921)* F. Wartenweiler (1921–1922)* G.A. Watermeyer (1922–1923)* F.W. Watson (1923–1924)* C.J. Gray (1924–1925)* H.A. White (1925–1926)* H.R. Adam (1926–1927)* Sir Robert Kotze (1927–1928)* J.A. Woodburn (1928–1929)* H. Pirow (1929–1930)* J. Henderson (1930–1931)* A. King (1931–1932)* V. Nimmo-Dewar (1932–1933)* P.N. Lategan (1933–1934)* E.C. Ranson (1934–1935)* R.A. Flugge-De-Smidt
(1935–1936)* T.K. Prentice (1936–1937)* R.S.G. Stokes (1937–1938)* P.E. Hall (1938–1939)* E.H.A. Joseph (1939–1940)* J.H. Dobson (1940–1941)* Theo Meyer (1941–1942)* John V. Muller (1942–1943)* C. Biccard Jeppe (1943–1944)* P.J. Louis Bok (1944–1945)* J.T. McIntyre (1945–1946)* M. Falcon (1946–1947)* A. Clemens (1947–1948)* F.G. Hill (1948–1949)* O.A.E. Jackson (1949–1950)* W.E. Gooday (1950–1951)* C.J. Irving (1951–1952)* D.D. Stitt (1952–1953)* M.C.G. Meyer (1953–1954)* L.A. Bushell (1954–1955)* H. Britten (1955–1956)* Wm. Bleloch (1956–1957)
* H. Simon (1957–1958)* M. Barcza (1958–1959)* R.J. Adamson (1959–1960)* W.S. Findlay (1960–1961)
D.G. Maxwell (1961–1962)* J. de V. Lambrechts (1962–1963)* J.F. Reid (1963–1964)* D.M. Jamieson (1964–1965)* H.E. Cross (1965–1966)* D. Gordon Jones (1966–1967)* P. Lambooy (1967–1968)* R.C.J. Goode (1968–1969)* J.K.E. Douglas (1969–1970)* V.C. Robinson (1970–1971)* D.D. Howat (1971–1972)
J.P. Hugo (1972–1973)* P.W.J. van Rensburg
(1973–1974)* R.P. Plewman (1974–1975)* R.E. Robinson (1975–1976)* M.D.G. Salamon (1976–1977)* P.A. Von Wielligh (1977–1978)* M.G. Atmore (1978–1979)* D.A. Viljoen (1979–1980)* P.R. Jochens (1980–1981)
G.Y. Nisbet (1981–1982)A.N. Brown (1982–1983)
* R.P. King (1983–1984)J.D. Austin (1984–1985)H.E. James (1985–1986)H. Wagner (1986–1987)
* B.C. Alberts (1987–1988)C.E. Fivaz (1988–1989)O.K.H. Steffen (1989–1990)
* H.G. Mosenthal (1990–1991)R.D. Beck (1991–1992)
* J.P. Hoffman (1992–1993)* H. Scott-Russell (1993–1994)
J.A. Cruise (1994–1995)D.A.J. Ross-Watt (1995–1996)N.A. Barcza (1996–1997)
* R.P. Mohring (1997–1998)J.R. Dixon (1998–1999)M.H. Rogers (1999–2000)L.A. Cramer (2000–2001)
* A.A.B. Douglas (2001–2002)S.J. Ramokgopa (2002-2003)T.R. Stacey (2003–2004)F.M.G. Egerton (2004–2005)W.H. van Niekerk (2005–2006)R.P.H. Willis (2006–2007)R.G.B. Pickering (2007–2008)A.M. Garbers-Craig (2008–2009)J.C. Ngoma (2009–2010)G.V.R. Landman (2010–2011)J.N. van der Merwe (2011–2012)G.L. Smith (2012–2013)M. Dworzanowski (2013–2014)J.L. Porter (2014–2015)R.T. Jones (2015–2016)
Van Hulsteyns Attorneys
Messrs R.H. Kitching
The Southern African Institute of Mining and Metallurgy
Fifth Floor, Chamber of Mines Building
5 Hollard Street, Johannesburg 2001 • P.O. Box 61127, Marshalltown 2107
Telephone (011) 834-1273/7 • Fax (011) 838-5923 or (011) 833-8156
E-mail: [email protected]

�iii
ContentsJournal Commentby M.J. Papo. . . . . . . . . . . . . . . . . . . . . . . . . . . . . . . . . . . . . . . . . . . . . . . . . . . . . . . . . . . . . . . . . . . ivSupport from Mintekby A. Mngomezulu . . . . . . . . . . . . . . . . . . . . . . . . . . . . . . . . . . . . . . . . . . . . . . . . . . . . . . . . . . . . . vPresident’s Corner—Relevance or Extinction?by C. Musingwini . . . . . . . . . . . . . . . . . . . . . . . . . . . . . . . . . . . . . . . . . . . . . . . . . . . . . . . . . . . . . . vi–vii
Exploring differences in various Nb(V)- and Ta(V) tropolonato complexes by a solid-state structural comparison studyby R. Koen, A. Roodt and H.G. Visser . . . . . . . . . . . . . . . . . . . . . . . . . . . . . . . . . . . . . . . . . . . . . . . 895
High-temperature thermal plasma treatment of monazite followed by aqueous digestionby D. Kemp and A.C. Cilliers. . . . . . . . . . . . . . . . . . . . . . . . . . . . . . . . . . . . . . . . . . . . . . . . . . . . . . . 901
Investigation of the ‘tiger skin’ defect on indefinite chill rollsby J. Jonck, J.S. Moema, J. Jooste and P. van Tonder. . . . . . . . . . . . . . . . . . . . . . . . . . . . . . . . . . . . . 907
The separation of zirconium and hafnium from (NH4)3Zr(Hf)F7 using amine–based extractantsby E.W. Conradie, D.J. van der Westhuizen, J.T. Nel and H.M. Krieg . . . . . . . . . . . . . . . . . . . . . . . . 915
Corrosion characteristics of mild steel storage tanks in fluorine-containing acidby R. van der Merwe, L.A. Cornish and J.W. van der Merwe . . . . . . . . . . . . . . . . . . . . . . . . . . . . . . 921
Cold-spray coating of an Fe-40 at.% Al alloy with additions of rutheniumby R.A. Couperthwaite, L.A. Cornish and I.A. Mwamba . . . . . . . . . . . . . . . . . . . . . . . . . . . . . . . . . . 927
The influence of particle size distribution on the properties of metal-injection-moulded 17-4 PH stainless steelby M. Seerane, P. Ndlangamandla and R. Machaka . . . . . . . . . . . . . . . . . . . . . . . . . . . . . . . . . . . . . 935
Spheroidisation of iron powder in a microwave plasma reactorby J.H. van Laar I.J. van der Walt, H. Bissett, J.C. Barry and P.L. Crouse . . . . . . . . . . . . . . . . . . . . . 941
Effect of yield strength on wear rates of railway wheelsby V.J. Matjeke J.W. van der Merwe, M.J. Phasha, A.S. Bolokang and C. Moopanar . . . . . . . . . . . . . 947
Premature failure of re-sulphurized steel studsby E. Molobi . . . . . . . . . . . . . . . . . . . . . . . . . . . . . . . . . . . . . . . . . . . . . . . . . . . . . . . . . . . . . . . . . . . 957
Deformation behaviour of aluminium low-micron MMCs and MMNCs at warm working temperatures (0.3–0.5 Tm)by Z. Gxowa, L.H. Chown, G. Govender and U. Curle . . . . . . . . . . . . . . . . . . . . . . . . . . . . . . . . . . . . 963
Grain refinement of 25 wt% high-chromium white cast iron by addition of vanadiumby L.A. Mampuru, M.G. Maruma and J.S. Moema . . . . . . . . . . . . . . . . . . . . . . . . . . . . . . . . . . . . . . 969
X-ray computed microtomography studies of MIM and DPR partsby N.S. Muchavi, L. Bam, F.C. De Beer, S. Chikosha and R. Machaka . . . . . . . . . . . . . . . . . . . . . . . 973
Effect of niobium on the solidification structure and properties of hypoeutectic high-chromium white cast ironsby M.E. Maja, M.G. Maruma, L.A. Mampuru and S.J. Moema. . . . . . . . . . . . . . . . . . . . . . . . . . . . . . 981
R. Dimitrakopoulos, McGill University, CanadaD. Dreisinger, University of British Columbia, CanadaE. Esterhuizen, NIOSH Research Organization, USAH. Mitri, McGill University, CanadaM.J. Nicol, Murdoch University, AustraliaE. Topal, Curtin University, Australia
VVOLUME 116 NO. 10 OCTOBER 2 016
All papers featured in this edition were presented at the
Ferrous and Base Metals Development Network Conference19–21 October 2016
our future through science
advanced metals initiative
our future through science
R.D. BeckJ. Beukes
P. den HoedM. Dworzanowski
B. GencM.F. Handley
R.T. JonesW.C. Joughin
J.A. LuckmannC. Musingwini
S. NdlovuJ.H. PotgieterT.R. StaceyD.R. Vogt
D. Tudor
The Southern African Institute ofMining and MetallurgyP.O. Box 61127Marshalltown 2107Telephone (011) 834-1273/7Fax (011) 838-5923E-mail: [email protected]
Camera Press, Johannesburg
Barbara SpenceAvenue AdvertisingTelephone (011) 463-7940E-mail: [email protected]
The SecretariatThe Southern African Instituteof Mining and Metallurgy
ISSN 2225-6253 (print)ISSN 2411-9717 (online)
THE INSTITUTE, AS A BODY, ISNOT RESPONSIBLE FOR THESTATEMENTS AND OPINIONSADVANCED IN ANY OF ITSPUBLICATIONS.Copyright© 1978 by The Southern AfricanInstitute of Mining and Metallurgy. All rightsreserved. Multiple copying of the contents ofthis publication or parts thereof withoutpermission is in breach of copyright, butpermission is hereby given for the copying oftitles and abstracts of papers and names ofauthors. Permission to copy illustrations andshort extracts from the text of individualcontributions is usually given upon writtenapplication to the Institute, provided that thesource (and where appropriate, the copyright)is acknowledged. Apart from any fair dealingfor the purposes of review or criticism underThe Copyright Act no. 98, 1978, Section 12,of the Republic of South Africa, a single copy ofan article may be supplied by a library for thepurposes of research or private study. No partof this publication may be reproduced, stored ina retrieval system, or transmitted in any form orby any means without the prior permission ofthe publishers. Multiple copying of thecontents of the publication withoutpermission is always illegal.
U.S. Copyright Law applicable to users In theU.S.A.The appearance of the statement of copyrightat the bottom of the first page of an articleappearing in this journal indicates that thecopyright holder consents to the making ofcopies of the article for personal or internaluse. This consent is given on condition that thecopier pays the stated fee for each copy of apaper beyond that permitted by Section 107 or108 of the U.S. Copyright Law. The fee is to bepaid through the Copyright Clearance Center,Inc., Operations Center, P.O. Box 765,Schenectady, New York 12301, U.S.A. Thisconsent does not extend to other kinds ofcopying, such as copying for generaldistribution, for advertising or promotionalpurposes, for creating new collective works, orfor resale.
VOLUME 116 NO. 10 OCTOBER 2016

�
iv
The Advanced Metals Initiative (AMI)programme was established in 2003 by theDepartment of Science and Technology (DST)
and the Science Councils, namely, the CSIR, Mintekand NECSA. The objective of establishing thisinitiative was to research, develop and innovateacross the advanced metals value chain. In thiscontext, the advanced metals are defined as allmetals that provide opportunities for creating newproducts and utilising advanced properties throughthe application of new technologies. From theDST’s strategic consideration, the AMI’s outputsmust enable the following: the creation of newindustries, improving the competitiveness of oldand existing industries and the promotion oftechnology localisation.
In order to realise these ambitious goals, fournetworks were created at the CSIR, NECSA andMintek. The CSIR is responsible for the LightMetals Development Network (LMDN), whichcoordinates research on aluminium and its alloys,as well as hosting the Titanium Centre ofCompetence (TiCoC). NECSA was tasked with thecoordination of the Nuclear Materials DevelopmentNetwork (NMDN) with the aim of developing novel,environmentally-friendly, cost-effective processesfor the manufacturing and beneficiation ofzirconium, hafnium and monazite. Mintekcoordinates both the Precious Metals DevelopmentNetwork (PMDN), which focuses on the preciousmetals gold and the platinum group metals (PGMs),and the Ferrous and Base Metals DevelopmentNetwork (FMDN).
At the FMDN’s maiden conference in 2012, theR&D efforts in the network narrowly focused onthree strategic sectors of the economy – thetransportation, energy and petrochemicalindustries. However, as part of its evolution andgrowth since then, the R&D focus has now beenextended to include pervasive material challengesin other key industrial sectors such as automotive,medical, construction, aerospace, logistics andmining. It is our wish, therefore, that theconference will provide a forum for brainstorming
and proposing other relevant R&D areas that canbe included in an effort to further strengthen theFMDN for the future. The FMDN continues tosupport postgraduate students at various highereducation institutions (HEIs) as part of its mandatetowards human capital development (HCD).
The Ferrous 2016 Conference OrganisingCommittee takes this opportunity to welcome alldelegates to the conference and extends itsappreciation for your attendance. We are lookingforward to your technical contributions and value-adding debates that will unfold during thisconference with the ultimate goal of ensuring thatthe eventual outcomes out of this network, andother AMI networks, benefit the broader SouthAfrican community. The Committee also thanksRaymond van der Berg and his dedicated team atthe SAIMM for their excellent organisation of theconference. Finally, we thank the Department ofScience and Technology (DST) and the officialsresponsible for the AMI Programme, LlanleySimpson and Wilna du Plessis, for their expertguidance of the programme and for funding theFerrous 2016 Conference.
Thank you.
M.J. PapoConference Convener
Journal Comment

�v
Mintek is a Science Council that is establishedin terms of the Mineral Technology Act, No.30 of 1989. Its core function is to undertake
research, development and technology transfer inconnection with better utilisation of the mineralresources of the Republic of South Africa; theimprovement of technical processes and methodsfor mineral production; the promotion andexpansion of existing industries; and theestablishment of new industries in the field ofminerals and mineral products. These functions, asencapsulated in the Act, are very similar to the goalof the Department of Science and Technology’s(DST’s) Advanced Metals Initiative (AMI), which isto facilitate research, development and innovationacross the metals value chain.
As part of the implementation of the NationalSystem of Innovation (NSI), Mintek’s institutionalreview covered three broad categories, namely, thequality of output and outcomes from a scientificand technical perspective, the contribution of theoutput of Mintek to the realisation of national goalsand the quality of the management of theinstitution.
The outcomes of the review showed thatMintek’s core competencies are supported byworld-class and unique laboratory-, pilot-scale anddemonstration-scale facilities. Mintek wascommended as a centre of excellence withsignificant multidisciplinary skills, particularly inthe areas of pyrometallurgy, advanced materials,mining economics and strategy andhydrometallurgy. The review also indicated thatinternationally, Mintek has a reputation as a world-class research organisation in minerals processingand value addition. The review further found thatMintek’s initiatives in support of the nationalpriorities are aimed at addressing the triplechallenges of inequality, poverty andunemployment facing South Africa. The reviewpanel endorsed Mintek’s relationships with highereducation institutions as sound and commendedMintek on its strides on the transformation front,especially on attracting persons with disabilities.
The two Advanced Metals Initiative (AMI)networks that Mintek is currently hosting, namelythe Ferrous and Base Metals Development Network(FMDN) and the Precious Metals DevelopmentNetwork (PMDN), continue to play a vital roletowards fulfilling Mintek’s mandate as a ScienceCouncil and an implementation agency of the SouthAfrican government’s National Priorities.
On behalf of Mintek, I would like to thank allthe presenters who have contributed with papersthat support our goal of knowledge transfer. I amconfident that the knowledge you have shared withour delegates will contribute towards promotingsustainable metal production and manufacturingand sustainable local manufacturing of value-added products, while reducing environmentalimpact. I would also like to thank all delegates andexhibitors for their participation at the Ferrous2016 Conference.
A. MngomezuluPresident & CEO, Mintek
Support from Mintek

�
vi
This quote has been attributed to several sources, including Evan Esar in 1968, KirkKirkpatrick in 1973, Laurence J. Peter in 1977, and James R. Faulkner in 1983.Irrespective of the source, the key question is ‘what does it have to do with the SAIMM
and more specifically, with the President’s Corner?’ It is my view that the President’s Corner isa succinct opportunity for the SAIMM membership to obtain a bird’s-eye view of itsleadership’s vision, while the leadership is able to engage and challenge its membership andreadership on strategic and operational perspectives over a quick cup of coffee. What wouldmake you invite the President over and over again for the next 11 months for a discussionover a quick cup of coffee in the President’s Corner? I think the attraction lies in building aninterface that pops out engaging and probing questions.
I have been doing some crystal-ball gazing into the future of our Institute. Are westrategically positioned to continue being relevant, or is there a risk of us becoming extinctbecause we may cease to be relevant? Before we can answer this question, I would like us toturn to the stories and theories that have been put forward on the extinction of the dominantgroup of species during the Jurassic and Cretaceous periods – the dinosaurs.
Some palaeontologists believe that the extinction of dinosaurs was caused by changes inclimatic and geological conditions. Another storyline is that starvation was a possibility thatled to dinosaurs becoming extinct because, due to their sheer size, dinosaurs required vastamounts of food and stripped bare all the vegetation in their habitat. An alternative theory isthat dinosaurs overfed themselves and their bodies became too big to be operated by theirsmall brains, leading to terminal physiological malfunctioning. Others believe that smallmammals ate dinosaur eggs as these were very delicious, causing the dinosaur population todecline to unsustainable levels and extinction. Another theory is that about 65.5 million yearsago, there was a Cretaceous-Tertiary (K-T) extinction event when a comet struck the earth ata speed of about 70 000 km/h, releasing 2 million times more energy than the most powerfulnuclear bomb ever detonated. The comet impact caused wildfires and tsunamis that destroyedmany forms of life. The dust from the impact clouded the atmosphere, plunging the Earth intodarkness and causing temperatures to drop drastically to levels unbearable for animal andplant life. In the 1980s, father-and-son scientists Luis and Walter Alvarez discovered adistinct layer of iridium – an element found in abundance only in space – that has been datedto a time that corresponds to that when the dinosaurs died, thus corroborating the K-Textinction event. In the 1990s, scientists located a massive 10 km diameter crater in Mexico,which also dates to the same period, further corroborating this theory of dinosaur extinction.These stories and theories suggest that external and internal factors can be causes ofextinction. External factors are beyond our control, so we need strategies robust enough tocope with internal factors and prepare for unforeseen external events.
Relevance or Extinction?President’s
Corner
‘An economist is an expert who will knowtomorrow why the things he predicted yesterday
didn’t happen today.’

�vii
The parallel of the K-T extinction event for our minerals industry is the 2008 GlobalFinancial Crisis (GFC). The GFC is considered to be one of the worst economic crises since theGreat Depression of the 1930s. It threatened to cause the collapse of large financialinstitutions, which was largely prevented by the bailout of banks by national governments,but stock markets dropped worldwide. The GFC forced our minerals industry into contraction and we are still reeling from its effects, as mineral commodity prices struggle to recover.Professional associations such as the SAIMM, whose financial health is greatly influenced bythe performance of our minerals industry, have not been spared either. No one can predictBlack Swan events such as the GFC, but good strategies ensure that we can ride out the tide.Unlike the dinosaurs that overfed, we have over time developed the capability to carefullymanage our growth by stowing away for lean times. By continuing to enhance closercollaboration with sister institutes or associations, most of them much smaller than us, wecan preserve our pedigree eggs for future growth of the Institute.
At more than 120 years old, having been founded in 1894 and with a currentmembership close to 5000, the SAIMM is like a dinosaur of professional organizations in ourlocal minerals industry, but a smart one with a very efficient machinery to deliver on itsmandate to our membership. We are well-known for being one of the oldest professionalassociations in the local minerals industry, hosting the highest number of excellentconferences annually, publishing an internationally accredited technical journal every month,and having functional branches locally and in neighbouring countries. Our Office Bearers andcommittee Chairpersons meet once a year to review our strategy. Can we grow in the comingyears to possibly reach a 10 000 membership base, but without outgrowing our capacity todeliver on our mandate? Will we be able to de-risk our income through significantdiversification? Will we still be well positioned to ride out any rough tide? Instead of strippingbare our habitat, how can we grow the cake so that there is enough for everyone? I can nowshare with you a helicopter view of your leadership’s vision arising out of our strategysession this year.
Back to the quote. My ethics as a minerals engineering professional preclude me frompractising prediction like the ‘expert economist’ as indicated in the quote, as I cannot claimcompetence in that space, but I am convinced that our current long-term strategy centred onregional development, enhancing collaboration with sister institutes, diversifying our incomestream, and the Young Professionals Council (YPC) will ensure that the SAIMM remainsrelevant into the future and we can continue to be the great institute that we are – not adinosaur facing down the barrel of extinction. But, is this sufficient? Only history will be ourjudge as I cannot risk acting the ‘expert economist’. By way of this message I therefore inviteyou for the next quick cup of coffee in the next issue of the journal.
C. MusingwiniPresident, SAIMM
Relevance or Extinction? (continued)

Mintek, centre of technological excellence, with its teams of highly trained and experienced scientists, engineers,
researchers and specialists, continues to develop and provide advanced technology for the more effective extraction, utilisation
We have the most extensive data resources on minerals and mining
- One of the world’s longest-running and largest minerals technology facilities
-
-
-
-
- Comprehensive accredited analytical and mineralogical
- Extensive knowledge database of Southern African and
-
- Library subscription available to the public
- Mintek conferencing facilities
Experience. Research. Innovation.
You’ll find the experts
work at Mintek
200 Malibongwe Drive, Randburg, South Africa
Private Bag X3015, Randburg 2125, South Africa
PHONE: +27 (011) 709 4111
E-MAIL: [email protected] www.mintek.co.za

DST PROFILE
The vision of the Department of Science and Technology (DST) part of the global science project to build the world's largest
is to create a prosperous society that derives enduring and radio telescope, the Square Kilometre Array, much of which is
equitable benefits from science and technology. Its mission is being hosted in the Northern Cape. The project has attracted
to develop, coordinate and manage a national system of considerable financial investment in infrastructure and skills
innovation that will bring about maximum human capital, advancement.
sustainable economic growth and improved quality of life for
In additive manufacturing, DST-funded work is driving and all.
funding the national development and adoption of metal and
When the DST was established in 2004, it was assigned a polymer additive manufacturing technology to position South
leading role in modernising South Africa's economy. Africa as a competitor in the global market. Through the
Collaborative Programme in Additive Manufacturing and the
The 2002 National Research and Development Strategy Aeroswift Technology Platform, it is developing and improving
(NRDS) was well received in the science system, and design capabilities specifically for the additive manufacturing
substantial financial resources invested by the government, industry, as well as building a platform for the production of
partners and stakeholders have seen significant progress in the large titanium structures, with a very specific focus on the
attainment of the strategy's objectives. These include an aerospace industry.
integrated approach to human capital development, investment
in science and technology infrastructure, and improving the With science and technology critical elements in the growth
strategic management of the public science and technology and development of Africa, the DST is also playing a leading role
system to optimise its contribution to wealth creation and an in the development, integration and unification of the continent.
improved quality of life. The Department continues to strengthen its science,
technology and innovation relations through a diverse
Another important DST strategy, the Ten-Year Innovation Plan portfolio of bilateral and multilateral relations, including with
(2008-2018) was developed to help drive South Africa towards the BRICS grouping (Brazil, Russia, India, China and South
sustained economic growth and a knowledge-based economy. Africa) and the European Union.
The Plan introduces five "grand challenges" that continue to
receive priority attention from government and researchers, to South Africa is also building muscle in the areas of health
find ways of bridging the "innovation chasm" between research research, earth observation, renewable energy and the
results and socio-economic benefits. For this to be achieved, beneficiation of metals. Information and communication
government through the DST has been making important technology are being used in pilot projects to show how
investments in human capital development, knowledge technologies can benefit South Africans, especially in previously
production, and the exploitation of such knowledge for marginalised communities, in respect of education needs,
commercial purposes. among others. The DST's Technology Localisation Programme
is being used to improve the competitiveness of small and
The five "grand challenges" include strengthening the medium enterprises.
bioeconomy, growing space science and technology, assuring
energy security, responding to global change (with a focus on As required by the National Development Plan, the DST will
climate change), and contributing to a global understanding of continue its efforts to provide South Africa with enduring
shifting social dynamics in development. benefits from science, technology and innovation.
A quick look at the events and milestones of the past few years For more information contact Zama Mthethwa, Account
reveal that the country is positioning itself among global leaders Executive. [email protected] or www.dst.gov.za
in innovation, science and technology. One of the most iconic
indicators in this regard is the country's remarkable work as

Precious Metals 2017THE PRECIOUS METALS DEVELOPMENT NETWORK (PMDN)
20–24 November 2017
North West Province, South Africa
BACKGROUNDThe Precious Metals Development Network (PMDN) of the DST’sAdvanced Metals initiative (AMI) programme will host the AMI’sannual conference in 2017.This conference presents a forum where scientists andtechnologists can come together to learn and discuss the latestadvances in precious metals (platinum group metals and gold)science and technology, under the broad themes of:
� Catalysis
� Materials
� Chemistry
OBJECTIVES
� To bring together researchers, industry and governmentstakeholders to share and debate the latest trends, researchand innovtion in the precious metals field.
� To provide a forum for researchers and industry to presentprogress made over the past few years on precious metalR&D and applications.
� To promote the activities of the AMI’s PMDN.
� To network and share information.
WHO SHOULD ATTEND
� Platinum group metals and gold mining houses
� Precious metal industrial players
� Government departments
� Science Councils
� Higher Educational Institutes
� Anyone involved or interested in precious metals’ R&D
advanced metals initiative
our future throughscience
For further information contact:Head of Conferencing, Raymond van der BergSAIMM, P O Box 61127, Marshalltown 2107
Tel: +27 11 834-1273/7 ·Fax: +27 11 833-8156 or +27 11 838-5923E-mail: [email protected] · Website: http://www.saimm.co.za
Conference
Announcement
EXHIBITION/SPONSORSHIPSponsorship opportunities are available. Companies wishing tosponsor or exhibit should contact the Conference Co-ordinator.
3 ECSA
CPD points
will be allocated
to all attending
delegates

Niobium and tantalum are chemical ‘twins’ ofthe vanadium triad of the periodic table andare notoriously difficult to separate from oneanother and from their naturally occurringores, due to their near-identical physical andchemical properties (Agulyansky, 2004). Thissimilarity in behaviour has been ascribedmainly to the lanthanide contraction of theelements and also their comparable ionizationenergies (Hubert-Pfalzgraf, Postel and Reiss,1987). Although the separation methodscurrently applied on an industrial scale, suchas solvent extraction and chlorination, havebeen successful, these techniques remain verylaborious, expensive and evolve significantchemical waste (Bose and Gupta, 2001).Accordingly, there is substantial scope forimprovements in the metallurgical methods ofpurification of niobium and separation fromtantalum.
The key to the effective and simplifiedseparation of these elements could possibly befound in the differences in the chemicalproperties of two similar organic chelated
moieties of these metals. Interestingly, adetailed literature review revealed a consid-erable shortage of knowledge in relation to thechelation behaviour of tantalum and niobiumwith different organic bidentate ormultidentate ligands (Allen, 2002). In fact,only a single study by Muetteries and Wright(1965) revealed successful O,O’-bidentateligand (tropolone = tropH) coordination toTa(V) and Nb(V) metal centres using theunmodified synthons ([NbCl5]2/[TaCl5]2) inatmospheric conditions, which significantlyreduces the cost of upscaling for industrialapplication.
In Muetteries and Wright’s investigation,niobium(V) and tantalum(V) pentachlorideswere reacted with acidic aqueous solutions oftropolone to form the tetrakis-tropolonatocations [Nb(Trop)4]+ and [Ta(Trop)4]+, withnear-quantitative yields. The focus of theirinvestigation was to determine the effect of pHand temperature on the hydrolytic stabilities ofthe Ta(V)- and Nb(V)- tropolonato analogues.From the preliminary 1H-NMR kinetic investi-gation, it was found that in strongly acidicmedia both [Nb(Trop)4]+ and [Ta(Trop)4]+
species are stable. With increasing temperatureor pH, the niobium chelate undergoeshydrolysis to the neutral [NbO(Trop)3] andseparates from solution. This difference incoordinative behaviour is an ideal startingpoint for use in a potential separation strategy.
The solution-state investigation of theformation of these compounds was quitethorough, but not much attention was given tothe solid-state characteristics of thecompounds (Muetteries and Wright, 1965).With this in mind, a detailed, low-temperaturecrystallographic investigation of the coordi-
Exploring differences in various Nb(V)-and Ta(V) tropolonato complexes by asolid-state structural comparison studyby R. Koen*, A. Roodt* and H.G. Visser*
An in-depth crystallographic comparison of the crystal structures oftetrakis(tropolonato- 2O,O’)niobium(V) chloride ([Nb(Trop)4]Cl) andtetrakis(tropolonato- 2O,O’)tantalum(V) chloride ([Ta(Trop)4]Cl) wasundertaken in an attempt to relate differences in complex stabilitypreviously noted in solution with solid-state characteristics such ascoordination geometry, ligand bite angles and bond lengths. Significantdifferences of these parameters for the complexes of the two metal centrescould translate to an ideal starting point for improved separation oftantalum and niobium. It was noted that the less stable Nb(V) compound,experiences a higher average degree of strain (71.39(2)º) within thebidentate chelate rings vs. the Ta(V) analogue (72.04(2)º). Whenconsidering the higher degree of strain, the Nb(V) complex more readilyoffers up one of its tropolone ligands to yield the more stable[NbO(Trop)3]. The [Ta(Trop)4]+ cation also exhibits a more distortedsquare antiprismatic geometry than [Nb(Trop)4]+. This coordinationgeometry is quite distorted and could be a reason that [Ta(Trop)4]+ isinclined towards an energetically favourable dodecahedral geometry,contributing to a more stable conformation.
tropolone, stability, geometry, tantalum, niobium.
* Department of Chemistry, University of the FreeState, Bloemfontein, South Africa.
© The Southern African Institute of Mining andMetallurgy, 2016. ISSN 2225-6253. This paperwas first presented at the AMI Ferrous and BaseMetals Development Network Conference 201619–21 October 2016, Southern Sun ElangeniMaharani, KwaZulu-Natal, South Africa.
895VOLUME 116 �
http://dx.doi.org/10.17159/2411-9717/2016/v116n10a1

Exploring differences in various Nb(V)- and Ta(V) tropolonato complexes
nation modes and intermolecular interactions could shedeven more light on this nuance between Ta(V) and Nb(V)behaviour. Accordingly, the crystal structures of[Ta(Trop)4]Cl and [Nb(Trop)4]Cl, as obtained following theabove strategy, will be discussed in this study.
All chemicals used for the preparation of the compounds wereof a high analytical grade and were acquired from Sigma-Aldrich (South Africa).
The 1H- and 13C NMR solution-state spectra wereacquired on a Bruker AVANCE II 600 MHz (1H: 600.28 MHz;13C: 150.96 MHz) nuclear magnetic resonance spectrometerusing an appropriate deuterated solvent (acetonitrile-d3
[CD3CN = 1.94(5) ppm]), with all chemical shifts ( ) reportedin ppm. The 1H NMR spectra were referenced within thesample using residual protons from the deuteratedacetonitrile-d3. The 13C NMR spectra were similarly referencedinternally to the solvent resonance [CD3CN = 1.39(4) ppmand 118.69(8) ppm], with all reported values noted relativeto tetramethylsilane ( = 0.0 ppm).
The X-ray crystallographic data was obtained from aBruker X8 ApexII 4K -CCD area detector diffractometer,specially equipped with a graphite monochromator and aMoK fine-focus sealed tube (T = 100(2) K, = 0.71069 Å),which operates at 2.0 kW (40 mA, 50 kV). Preliminary unitcell predictions, as well as data collections, were done by theSMART (Bruker, 1998a) refinement program. The rawframeset data was integrated using a narrow-frameintegration algorithm and reduced using Bruker SAINT-Plusand XPREP (Bruker, 1999). This reduced data was correctedfor the various absorption effects using the SADABS multi-scan technique (Bruker, 1998b) and the structure solved byusing direct methods on the SIR97 package (Altomare et al.,1999). Final refinement was completed using the WinGX(Farrugia, 1999) software, incorporating the SHELXL(Sheldrick, 1997) package (anisotropic full-matrix least-squares refinement was done on F2). Aromatic protons wereplaced in geometrically idealized positions (C–H = 0.93 – 0.98Å) and crystallographically constrained to ride on the hostatoms with Uiso(H) = 1.2Ueq(C). All non-hydrogen atomswere refined with anisotropic displacement parameters.Graphics were obtained with DIAMOND (Brandenburg, 2006)(50% probability ellipsoids for non-hydrogen atoms).
A solution of [NbCl5]2 (0.270 g, 1.001 mmol) in a mixture ofdichloromethane (200 cm3) and ether (30 cm3) was added toa tropolone (0.489 g, 4.004 mmol) and dichloromethane (200 cm3) mixture to produce a light orange solution fromwhich a solid precipitated. The excess solvent was removedunder reduced pressure. Acetonitrile (400 cm3) was added tothe residual powder and heated until dissolution wascomplete. Bright orange crystals separated on cooling. Thiscompound was recrystallized from acetonitrile and vacuum-dried (120 ºC, 3 hours) (0.409 g, yield 76%). IR (ATR, cm-1):
= 723, 876, 965, 1078, 1221, 1265, 1331, 1426, 1530,1584. 1H NMR (300.13 MHz, acetonitrile-d3, ppm): = 7.11(d, 2H), 7.18 (t, 2H), 7.55 (t, 1H)). 13C NMR (300.13 MHz,acetonitrile-d3, ppm): = 87.8, 91.6, 101.3, 133.8.
A solution of [TaCl5]2 (0.3582 g, 1.000 mmol) in concen-trated hydrochloric acid (40 cm3) and methanol (40 cm3) wasadded to a mixture of tropolone (0.489 g, 4.004 mmol) inconcentrated hydrochloric acid (20 cm3) and methanol (320cm3) forming a yellow precipitate. This mixed slurry wasrefluxed (15 minutes) until a translucent yellow solution wasobserved with yellow crystalline [Ta(Trop)4]Cl forming oncooling. The compound was recrystallized from a hotmethanol-water solution and vacuum-dried (120ºC, 3 hours)(0.394 g, yield 63 %). IR (ATR, cm-1): = 721, 830, 1225,1353, 1431, 1534, 1591, 1633, 3349. 1H NMR (300.13 MHz,acetonitrile-d3, ppm): = 7.18 (d, 2H), 7.32 (t, 2H), 7.87 (t,1H)). 13C NMR (300.13 MHz, acetonitrile-d3, ppm): = 89.2,94.3, 103.6, 127.2.
A systematic comparison of the solid-state [Nb(Trop)4]Cl and[Ta(Trop)4]Cl structures is the main focal point of thisinvestigation, with specific emphasis on bond angles anddistances as well as the basic coordination geometry. Thiscould give a clue as to why the coordination of tropolone isinfluenced so significantly by pH and temperature in solution(Muetteries and Wright, 1965) Figure 1 illustrates the crystalstructures and coordination polyhedra of [Nb(Trop)4]Cl (1)and [Ta(Trop)4]Cl (2) and Table I compares selected crystal-lographic parameters of the compounds.
�
896 VOLUME 116

The Nb(V) (1) compound crystallizes in the triclinic spacegroup, P1
–, with one independent molecule in the asymmetric
unit. For this molecule, a Nb(V) metal centre is coordinated tofour independent tropolonato ligands arranged in a distortedD2-square antiprismatic geometry. This type of arrangementis extremely rare and has hardly ever been observed for 8-coordinated Nb(V) complexes (Booyens and Oglvie, 2008.
The Ta(V) (2) compound crystallizes in the monoclinicspace group, C2/c, with one full [Ta(Trop)4]+ cation (Ta1)and half of another [Ta(Trop)4]+ (Ta2) moiety in theasymmetric unit. In the case of Ta1, a metal centre issurrounded by four independent tropolonato ligandsarranged in a distorted D2-square antiprismatic geometry. Incontrast, for Ta2, the Ta2 atom is located on a specialposition and is coordinated to two tropolonato ligands withthe other half of the cation being generated through themirror plane. Ta2 also illustrates a distorted D2-squareantiprismatic coordination geometry. In spite of the twodifferent crystallization modes of the two independent Ta(V)complexes, the average bite angles stay comparable with eachother and typically 1º greater than for the Nb(V) complex.This type of arrangement has never been noted for a Ta(V)structure and only on one occasion in the structure oftetrakis(oxalato)tantalum(IV) for the Ta(IV) species (Cotton,Diebold and Roth, 1987).
A large residual electron density of 3.31 was located at adistance of 3.48 Å from C14 for compound 2 (see Table I).Although this value is very significant, it is isolated from thecoordination sphere and need not be assigned for thisinvestigation as it has minimal effect with relation coordi-nation geometry around the metal centre.
When comparing the various bond distances and angleslisted in Tables II and III, several trends are noticed. Thesetendencies are now discussed and compared systematically.
As expected, the average Nb-O (2.083(1) Å) and Ta-O(2.092(1) Å) bond distances correlate very well with eachother. Similar average metal-oxido distances have been notedon several occasions in past studies (Allen, 2002; Davies andJones, 2005; Peric, Brnicevic and Juric, 2009; Calderazzo andEnglert, 1998; Roodt, Otto and Steyl, 2003; Schutte, Roodtand Visser, 2012). This phenomenon can probably beattributed to the near-identical covalent radii of both Ta andNb. Although not much in relation to separation studies canbe derived from this, it indicates that the assumption made –that the inferior crystal quality would not significantlyinfluence coordinative crystal data – is acceptable.
Interestingly, a substantial difference (max. 1.38°) inbidentate bite angle is noted between 1 and. 2. From this itcan be concluded that the chelate ring of the Nb(V)compound is significantly more strained. This could also givea clue as to why a decrease in pH has a different effect oneach metal. As the pH of the solution increases, conditionsbecome less advantageous for tetrakis-coordination,preferring the more stable tris-coordinated oxido species (ifan oxygen-donating substance is available). The smallersteric demand of the four tropolone ligands in the Nb(V) casewill promote nucleophilic attack by OH- to the metal centre.Due to the fact that the chelate ring in the Nb(V) compound ismore strained it could more readily sacrifice one of itstropolone ligands for increased stability.
Bite distances are fairly well correlated to ligand biteangle and, as expected, the average distances for 2 (2.447(1)Å) and 1 (2.431(1) Å) differ quite significantly.
Exploring differences in various Nb(V)- and Ta(V) tropolonato complexes
897VOLUME 116 �
Table I
Empirical formula C28H20NbO8 C28H20O8Ta
Formula weight (g.mol–1) 537.80 625.55
Crystal system, space group Triclinic, P 1̅ Monoclinic, C2/c
a, b, c (Å) 10.027(3), 12.907(3), 14.750(4) 19.626(3), 20.360(3) 22.446(3)
α, β, γ (°) 68.776(4), 78.141(3), 81.860(4) 90, 96.050(3), 90
Volume (Å3), Z 1778.3(1), 2 2919.3(4), 4
Density (calculated, Mg/m3) 1.371 1.506
Crystal colour, crystal size (mm3) Orange, 0.53 × 0.13 × 0.09 Yellow, 0.25 × 0.18 × 0.10
Absorption coefficient μ (mm-1) 0.399 3.802
F(000), theta range 583, 2.45–27.70° 3828, 1.35–28.00°
Reflections collected,independent reflections, Rint 6119, 3518, 0.1556 4792, 6477, 0.1617
Completeness to 2θ (°, %) 28.00, 97.6 28.00, 100
Data, restraints, parameters 20299, 0, 370 10753, 0, 240
Goodness-of-fit on F2 1.106 1.152
Final R indices [I>2sigma(I)] R1 = 0.1995 R1 = 0.1131wR2 = 0.2956 wR2 = 0.3584
R indices (all data) R1 = 0.2586 R1 = 0.1803wR2 = 0.3470 wR2 = 0.4097
Largest diff. peak and hole (e.Å–3) 0.40, –1.04 3.31, –2.15

Exploring differences in various Nb(V)- and Ta(V) tropolonato complexes
Table III highlights the fact that the degree of distortion fromD2-square antiprismatic (D2-SAP) geometry towards dodeca-hedral geometry is much more pronounced for 2. For idealSAP geometry the ligand planes would have to lie oppositeeach other at an ideal 180° angle. When considering the‘ligand planes’ as described in Table III, it is obvious that thedistortion from ideal 180° is much more pronounced in thecase of the 2 compound, although a significant distortion isalso noted for 1. Figure 2 further illustrates this distortion byillustrating the outward bends of the various OA-OB-OC-ODplanes for both complexes. Again, this is independent of thetwo different crystallization modes of Ta1 and Ta2.
Some correlation can be drawn between the observationsby Muetteries and Wright in solution and this distortionnoted in solid state (Muetteries and Wright, (1965). Frombasic crystallography it is known that dodecahedral geometryis an energetically favourable coordination mode, affording amore stable compound. It might then seem that therobustness of 2 vs. 1 in solution could also be ascribed to themore energetically favourable coordination mode (Hutchingset al., 2014). Accordingly, an argument can be proposed thatthe 2 has dodecahedral geometry and is significantlydistorted towards the D2-SAP geometry. Although this notionis not irrefutably conclusive, it cannot be ignored.
Some interesting observations were made from thecomparison of the [Ta(Trop)4]Cl and [Nb(Trop)4]Cl solid-state crystal structures. The bite angles of both compoundsrevealed that the [Nb(Trop)4]Cl compound experiences ahigher degree of strain within the chelate ring but less stericrepulsion, thus is more prone to nucleophilic attack. Thiscould have interesting implications for complex stability.When considering the higher degree of strain (less energet-ically favourable) within the Nb(V) chelate ring, this complexcould more readily sacrifice one of its tropolone ligands forthe sake of obtaining the more stable [NbO(Trop)3] complex(average bite angle 71.39(2)º).
Secondly, the [Ta(Trop)4]+ cation exhibits a moredistorted square antiprismatic geometry compared with[Nb(Trop)4]+. In fact, the coordination geometry is sodistorted that [Ta(Trop)4]+ might favour the more energet-ically favourable dodecahedral geometry. This might furthercontribute to the Ta(V) complex stability.
These observations from this crystallographic study ofNb(V) and Ta(V) tropolonates substantiate the results notedfrom the solution-state investigation (Muetteries and Wright,1965). With this enhanced knowledge of the intricacies ofthese systems, it is possible to investigate separationmethods such as separation by ionic resins (in solution:
�
898 VOLUME 116
Table II
Nb1-O1 2.094(1) Ta1-O1 2.098(1) Ta2-O9 2.087(1)Nb1-O2 2.099(1) Ta1-O2 2.068(1) Ta2-O10 2.095(1)Nb1-O3 2.092(1) Ta1-O3 2.098(1) Ta2-O11 2.076(1)Nb1-O4 2.087(1) Ta1-O4 2.093(1) Ta2-O12 2.073(1)Nb1-O5 2.021(1) Ta1-O5 2.088(1)Nb1-O6 2.096(1) Ta1-O6 2.091(1)Nb1-O7 2.085(1) Ta1-O7 2.063(1)Nb1-O8 2.089(1) Ta1-O8 2.134(1)O1···O2 2.454(1) O1···O2 2.459(1) O9···O10 2.431(1)O3···O4 2.426(1) O3···O4 2.456(1) O11···O12 2.445(1)O5···O6 2.401(1) O5···O6 2.439(1)O7···O8 2.442(1) O7···O8 2.452(1)
Table III
O1-Nb1-O2 71.34(1) O1-Ta1-O2 72.34(2) O9-Ta2-O10 71.09(2)
O3-Nb1-O4 70.96(2) O3-Ta1-O4 71.74(1) O11-Ta2-O12 72.22(1)
O5-Nb1-O6 71.63(1) O5-Ta1-O6 72.40(2)
O7-Nb1-O8 71.60(2) O7-Ta1-O8 71.69(1)
Out-of-plane distortion 28.46(3) Out-of-plane distortion 31.01(1) Out-of-plane distortion 26.99(2)(O1-O2-O3-O4) (O1-O2-O3-O4) (O9-O10-O11-O12)
Out-of-plane distortion 27.47(2) Out-of-plane distortion 27.61(2)(O5-O6-O7-O8) (O5-O6-O7-O8)
Trop1/Trop3 174.34(2) Trop1/Trop3 171.54(1) Trop5/Trop5’ 167.06(1)
Trop2/Trop4 174.71(3) Trop2/Trop4 169.05(1) Trop6/Trop6’ 173.81(1)

neutral [NbO(Trop)3] vs. cationic [Ta(Trop)4]+ at slightlyacidic pH values), sublimation (differences in solid-statestability should cause differences of the sublimation temper-atures of these Nb(V) and Ta(V) analogues) as well asfractional crystallization, which could be upscaled forindustrial use.
Although comparison of reaction properties in solutionwith solid-state crystal structures should be done with care,this solid-state investigation has already shed some morelight as to why the properties of the Nb(V) and Ta(V)compounds differ significantly.
Financial support from the Advanced Metals Initiative (AMI)of the Department of Science and Technology (DST) of SouthAfrica, through the Nuclear Metals Development Network(NMDN) managed by the South African Nuclear EnergyCorporation SOC Ltd (Necsa) is gratefully acknowledged.Appreciation is also expressed towards the University of theFree State and PETLabs Pharmaceuticals for financialprovision of research initiative outputs. This work is basedon research supported in part by the National ResearchFoundation of South Africa (UIDs 71836 and 84913).
AGULYANSKY, A. 2004. The Chemistry of Tantalum and Niobium FluorideCompounds. Elsevier, Amsterdam.
ALLEN, F.H. 2002. The Cambridge Structural Database: a quarter of a millioncrystal structures and rising. Acta Crystallographica, B58, vol. 3. pp. 380–388.
ALTOMARE, A., BURLA, M.C., CAMALLI, M., CASCARANO, G.L., GIACOVAZZO, C.,COTTON, F.A., DIEBOLD, M.P. and ROTH, W.J. 1987. Variable stereochemistryof the eight-coordinate Tetrakis(oxalato)niobate(IV), Nb(C2O4)4
4-.Inorganic Chemistry, vol. 26. pp. 2889–2901.
ALTOMARE, A., BURLA, M.C., CAMALLI, M., CASCARANO, G.L., GIACOVAZZO, C.,GUAGLIARDI, A., MOLITERNI, A.G.G., POLIDORI, G. and SPAGNA, R. 1999. SIR97:a new tool for crystal structure determination and refinement. Journal ofApplied Crystallography, vol. 32. pp. 115–119.
BOOYENS, J.C.A. and OGLVIE, J.F. 2008. Models, Mysteries and Magic ofMolecules. Elsevier Netherlands.
BOSE, D.K. and GUPTA, C.K. 2001. Extractive metallurgy of tantalum. MineralProcessing and Extractive Metallurgy Review, vol. 22. pp. 389–412.
BRANDENBURG, K. 2006. DIAMOND, Release 3.0e. Crystal Impact GbR, Germany.
BRUKER AXS INC. 1998a. Bruker SMART-NT Version 5.050, Area-DetectorSoftware Package. Madison, WI, USA.
BRUKER AXS INC. 1998b. Bruker SADABS Version 2004/1, Area DetectorAbsorption Correction Software. Madison, WI, USA.
BRUKER AXS INC. 1999. Bruker SAINT-Plus Version 6.02 (including XPREP),Area-Detector Integration Software. Madison, WI, USA.
CALDERAZZO, F. and ENGLERT, U. 1998. Eight-coordinate chelate complexes ofZr(IV) and Nb(IV): X-ray diffractometric and EPR investigations.Inorganica Chimica Acta, vol. 270. pp. 17–7191.
DAVIES, H.O. and JONES. 2005. Synthesis and structure of a tantalum(V)Tetrakis-O,O chelate: [Ta(tmhd)4][TaCl6]. Inorganic ChemistryCommunications, vol. 8. pp. 585–592.
FARRUGIA, L.J. 1999. WinGX Suite for small-molecule single-crystal crystal-lography. Journal of Applied Crystallography, vol. 32. pp. 837–838.
HUBERT-PFALZGRAF, L.G., POSTEL, M. and REISS, J.G. (1987). ComprehensiveCoordination Chemistry. Elsevier Pergamon, Oxford, UK.
HUTCHINGS, A., HABIB, F., HOLMBERG, R.J. and KOROBKOV, I. 2014. Structuralrearrangement through lanthanide contraction in dinuclear complexes.Inorganic Chemistry, vol. 53. pp. 2102–2112.
MUETTERIES, E.L. and WRIGHT, C.M. 1965. Chelate chemistry. III. Chelates of highcoordination number. Journal of the American Chemical Society, vol. 87,no. 21. pp. 4706–4717.
PERIC, B., BRNICEVIC, N. and JURIC, M. (2009).[NH4][(CH3)2NH2]2[Ta(C2O4)4]·2H2o: the first (oxalato)tantalate(v)complex structurally characterized. Structural Chemistry, vol. 20. pp. 933–941.
ROODT, A., OTTO, S. and STEYL, G. 2003. Structure and solution behaviour ofrhodium(I) Vaska-type complexes for correlation of steric and electronicproperties of tertiary phosphine ligands. Coordination Chemistry Reviews,vol. 245. pp. 125–142.
SCHUTTE, M., ROODT, A. and VISSER, H.G. 2012. Coordinated aqua vs methanolsubstitution kinetics in fac-Re(I) tricarbonyl tropolonato complexes.Inorganic Chemistry, vol. 51. pp. 11996–12006.
SHELDRICK, G.M. 1997. SHELXL97. Program for crystal structure refinement,University of Göttingen, Germany. �
Exploring differences in various Nb(V)- and Ta(V) tropolonato complexes
VOLUME 116 899 �
Ta1: Outward bend of the top-most plane of 31.01(1)° and 27.61(2)° for the bottom planeTa2: Outward bend of the top-most plane of 26.99(2)° and 27.51(2)° for the bottom plane

SUBSCRIBEof the SAIMM Journal
TO 12 ISSUESJanuary to December 2017
ORR2025.00LOCAL
US$520.00OVERSEAS
per annum per subscription
For more information please contact: Kelly MattheeThe Journal Subscription Department
Tel: 27-11-834-1273/7 • e-mail: [email protected] or [email protected]: http://www.saimm.co.za
� Less 15% discount to agents only
� PRE-PAYMENT is required
� The Journal is printed monthly
� Surface mail postage included
� ISSN 2225-6253
� with cutting-edge research � new knowledge on old subjects � in-depth analysis

South Africa is a resource-based economy withan estimated in situ mineral wealth of US$2.5trillion. This makes South Africa one of thewealthiest mining jurisdictions in the world.However, considerable amounts of SouthAfrica’s minerals are exported as raw orpartially processed ore. South Africa hasembraced a mineral beneficiation strategy todevelop the value chain for various minerals.One such mineral is monazite (South Africa,2011) which, until now, underwent minimalindustrial beneficiation in South Africa (Kempand Cilliers, 2014).
Monazite is a chemically inert, radioactivephosphate mineral and is considered to be oneof the most important rare earth minerals inthe world (Hassan et al., 1997; Amaral andMorais, 2010; Dill et al., 2012). Monazite is acomponent of ‘black sand’ found in variousbeach deposits worldwide (Dilorio et al., 2012)in combination with varying concentrations ofilmenite, magnetite, zircon, rutile and garnet(Ashry et al., 1995; Sroor, 2003). Monazitecontains the light rare earth elements (LREE)Ce, La, Pr, Nd and Y, which are in highdemand and the radioactive elements thoriumand uranium (Kim et al., 2009). Conventional
monazite processing is a complicated,laborious and expensive process (Hurst, 2010)that utilizes highly corrosive media likeconcentrated sulphuric acid or sodiumhydroxide, at elevated temperatures forextended periods of time (Zhu et al., 2015).This process produces large volumes ofradioactive and acidic effluents (Xie et al.,2014). For these reasons, China, whichproduces 97% of the world’s rare earthelements (Hurst, 2010), has prohibited theexploitation of monazite deposits (Zhu et al.,2015). This opens the market for new andinnovative technologies for the processing ofmonazite
Zircon (ZrSiO4) is a mineral with achemically inert crystal structure, whichrequires harsh alkaline treatment to extract thezirconium metal (Biswas et al., 2010). Toovercome the chemical inertness of zirconsand, the South African Nuclear EnergyCorporation SOC Ltd (Necsa) has developed aprocess using a DC non-transferred plasma toconvert zircon into plasma-dissociated zircon(PDZ – ZrO2.SiO2). PDZ is chemically morereactive than zircon and can be processedmore efficiently (Havenga and Nel, 2012;Rendtorff et al., 2012). The high temperatures(10 000°C), good thermal conductivities andhigh heat contents of thermal plasmas makethem ideal for the processing of materials likezircon (Toumanov, 2003; Rendtorff et al.,2012). It is hypothesized that a similar processcould increase the chemical reactivity ofmonazite in order to improve downstreamprocessing efficiency. This would increase theoutput of the REE, thorium and uranium whilesimultaneously permitting the use of lessaggressive chemical processes (Toumanov,2003).
High-temperature thermal plasmatreatment of monazite followed byaqueous digestionby D. Kemp* and A.C. Cilliers*
Monazite is a chemically inert, radioactive phosphate mineral thatcontains the light rare earth metals (Ce, La, Nd, Pr and Y), thorium anduranium. A new process, which improves the extraction efficiency ofmonazite, is under development. The equilibrium mole composition, inconjunction with the Gibbs free energy, indicates that as monazite isheated in the presence of carbon to a temperature above 1400°C, itdecomposes into the rare earth oxides. These temperatures are within theoperational limits of a thermal plasma. When monazite is fed to a DCplasma it forms amorphous plasma-treated monazite (PTM), which is moresusceptible to chemical attack. This increased chemical reactivity permitsdilute mineral acids to digest the PTM, which leads to higher extractionefficiencies of the rare earth elements than when monazite is digestedusing the conventional processes. When the conventional process fordigestion of monazite is adapted to PTM, the extraction of rare earthelements, thorium and uranium is increased significantly.
monazite, rare earth elements, thermal plasma.
* North-West University, Potchefstroom Campus,Potchefstroom, South Africa.
© The Southern African Institute of Mining andMetallurgy, 2016. ISSN 2225-6253. This paperwas first presented at the AMI Ferrous and BaseMetals Development Network Conference 201619–21 October 2016, Southern Sun ElangeniMaharani, KwaZulu-Natal, South Africa.
901VOLUME 116 �
http://dx.doi.org/10.17159/2411-9717/2016/v116n10a2

High-temperature thermal plasma treatment of monazite
If plasma-treated monazite (PTM) can be processed usingless harsh chemicals, as hypothesized, it would create aunique competitive advantage for future rare earth andthorium developers. The new process reduces the environ-mental and radioactive hazards of monazite processing bytreating monazite in a high-temperature thermal plasmafollowed by low-temperature mineral acid leaching. Thispaper provides a summary of the current development of thisprocess.
Thermodynamic data from HSC version 6.1, developed byOutotec, was used to evaluate the Gibbs free energy, theequilibrium composition of the dissociation of monazite andto present alternative chemical processes that could requirefurther investigation, or need to be avoided. Monazite isrepresented as the rare earth (RE) phosphate (REPO4, withRE = Ce, La, Pr, Nd and Y).
We treated monazite in a DC direct arc plasma batchreactor with the monazite housed in a graphite crucible. Thereactor produces a high-temperature electric arc which is usedto treat the monazite and produce PTM. The PTM product washeated in a high-temperature oven at 650°C for 24 hours todrive off excess graphite formed during the plasmaprocessing.
Crushed monazite (Mzc) was produced by hand-crushing10 g of monazite for 10 minutes. Heat-treated monazite(HTM) was produced by heating 20 g of monazite in analumina crucible at 1000°C for 3 hours, then rapidly coolingthe product with water. Inductive monazite (IMz) wasproduced by heating 20 g of monazite in a graphite vessel to1800°C in an induction oven. The product was coolednaturally and removed.
Monazite and PTM were leached with various commer-cially available mineral acids (32% HCl, 65% HNO3 and 10%H2SO4) at 80°C for 1 hour; concentrated H2SO4 at 230°C for 4hours, or by alkaline leaching (60% NaOH) at 140°C for 3hours followed by mineral acid digestion (HCl or HNO3) at80°C for 1 hour. The concentrations of the individual REE inthe leachate samples were determined by ICP analysis at anexternal laboratory. These values were used to calculate theextraction efficiency of the process.
In order to evaluate whether monazite (rare earthphosphates) would dissociate in a plasma, its physicalproperties were compared to values from the literature andtheoretical simulations for a known mineral, zircon (ZrSiO4).Monazite has a physically weaker crystal lattice than zircondue to its lower chemical bond strength (Cottrell, 1958) andmelting point (Table I) (Pirkle and Podmeyer, 1988; Hikichiand Nomura, 1987). From a physical strength perspective,the monazite crystal is weaker and could be destroyed moreeasily using less energy than required for zircon. As theplasma can destroy the zircon crystal lattice, (Kock et al.,2011; Havenga and Nel, 2012) it is probable that themonazite crystal could be destroyed in a similar manner.
The temperature at which monazite dissociates withoutthe use of a reagent is unknown at present. Monazite in thepresence of excess carbon dissociates into the rare earthoxide, phosphor and carbon monoxide at a temperaturebetween 1200 and 1400°C (Equation [1]) (Peng-fei et al.,2010). According to the literature, zircon dissociates into PDZat 1673 ± 10°C. The dissociation temperature can be loweredby 250°C when excess carbon is added in the presence ofoxygen (Kaiser et al., 2008; Telle, n.d.; Yugeswaran et al.,2015).
[1]
It is anticipated that the presence of carbon in the plasmacould have a similar effect on monazite, which would lowerits dissociation temperature by a few hundred degreesCelsius. To determine the potential dissociation temperatureof monazite, the Gibbs free energy was used to estimate thetemperature at which the individual rare earth (RE = Ce, La,Nd, Pr and Y) phosphates dissociate into the rare earth oxidesand a phosphor-oxygen complex.
The dissociation temperature of zircon without excesscarbon was accurately plotted using the Gibbs free energy at1600–1700°C. Similarly, the Gibbs free energy of thedissociation of monazite in the presence of excess carbon wasplotted for a dissociation temperature between 1100 and1300°C. The Gibbs free energy of the dissociation of the rareearth phosphates (Equation [2]) indicates that CePO4
dissociates at 1700°C, as predicted. However the remainingrare earth phosphates dissociate between 2500 and 3000°C(Figure 1), which is beyond the anticipated temperaturerange compared to zircon and CePO4. This dissociation will beinvestigated further.
[2]
�
902 VOLUME 116
Table I
Melting point (°C) 2100–2300 2057
Chemical bond strength (kJ/mol) Si—O: 798 P—O: 596Zr—O: 760 RE – O: (av.) 753

The formation of the rare earth oxides from monazitewould improve the leachability of the plasma-treatedmonazite (PTM). This is because the highly inert monazitecrystal would have been destroyed enabling the rare earthoxides to be leached using a diluted mineral acid, unlike therare earth phosphates (Peelman et al., 2014).
The starting material for all plasma cycles was monazite sandobtained from an external source. The sand consisted of69.55% monazite, 17.67% zircon and 4.85% ilmenite withthe remaining 7.93% consisting of other materials.Examination of the monazite sand by optical microscopyrevealed a number of oval-shaped brown, red, white andblack particles (Figure 2). These oval-shaped particles arereminiscent of this monazite sample and may differ fromother monazite samples.
X-ray diffraction (XRD) analysis of monazite sand(Figure 3) and PTM was used to determine whether plasmatreatment induces any structural or compositional changes inmonazite. The XRD pattern of this monazite (Figure 3)shows peaks at 2 = 26.5°, 28°, 35° and 47°, along with anumber of smaller peaks. The peak at 2 = 26.5° waspositively identified as that of the rare earth phosphates,
which are components of monazite. No further analysis forthis study was completed.
We produced PTM by placing monazite sand in a graphitecrucible and treating it in a DC direct arc plasma. We removedthe PTM graphite layer after plasma treatment by heating thePTM in a conventional oven at 650°C for 24 hours, producingplasma-treated monazite heated (PTMH). We found thatwhen monazite is treated incorrectly it behaves and looks likemonazite when viewed under an optical microscope andanalysed using XRD. If monazite is heated in the plasma fortoo long it melts and forms larger, more inert monaziteparticles. When monazite is treated correctly in the plasmathen the changes to the physical structure of the particles arevisible under an optical microscope, as all of the oval-shapedparticles are destroyed (Figure 4). For this reason, it can beconcluded that the proper treatment of monazite can beverified partially through the use of an optical microscope.Elemental X-ray fluorescence analysis on all PTM samplesindicated no statistical difference in the elementalcomposition compared with the original monazite.
XRD analysis of PTMH confirmed the destruction of themonazite crystal structure. The absence of the monazitepeaks (Figure 5) indicates that a completely amorphouspowder has been produced. This indicates that the inert
High-temperature thermal plasma treatment of monazite
903VOLUME 116 �

High-temperature thermal plasma treatment of monazite
phosphate crystal matrix, which is responsible for the inertnature of monazite (El-Nadi et al., 2005), has beendestroyed. The disadvantage of the formation of theamorphous substance is that the presence of the morereactive rare earth oxides cannot be confirmed. Otherminerals, like zircon, have also been destroyed.
In order to confirm the hypothesis that the plasma treatmentof monazite delivers a more reactive product, PTM and PTMHwere digested using a variety of different lixiviants multipletimes. The results indicate the quantity of the specific elementextracted, as a percentage of the original amount of thatelement in the starting material. The standard deviation isshown as error bars. In order to obtain a proper comparisonof the reactivity, additional samples were tested, likemonazite (Mz), crushed monazite (Mzc), heat-treatedmonazite (HTM) and inductive monazite (IMz).
Digestion of PTM extracted on average 20 times more ofthe REE, 7 times more thorium and up to 11 times moreuranium compared with untreated samples. Comparison ofthe extraction efficiency from Mz, Mzc, HTM, IMz, PTM andPTMH with 32% HCl (Figure 6) shows that simply heatingthe monazite (HTM and IMz) in a graphite crucible, even to atemperature above 1800°C, does not result in a more reactiveproduct. The phosphor content remained reasonably constantthroughout and cannot be used as an accurate indicator ofthe efficiency of the extraction process.
The results demonstrate the importance of using anappropriate temperature and treatment time period in order toincrease the chemical reactivity of monazite. The plasmatreatment of monazite is the predominant reason forimproved REE and thorium extraction, as the plasmatreatment destroys the monazite crystal matrix and producesamorphous PTM (Kemp and Cilliers, 2016a). Comparing theREE extraction efficiencies between heat-treated (PTMH) andnon-heat-treated PTM reveals a small but significant increasein the extraction efficiency. The multiple experimentsconducted for this study were not optimized and the potentialadvantage gained by removing graphite from PTM requiresfurther investigation.
In order to develop the process, the digestion of monaziteand PTMH with various reagents was compared. Eachexperiment was repeated several times until a satisfactorystandard deviation was achieved. These reagent included65% HNO3 (HNO3) and 10% H2SO4 (H2SO4d) at 80°C for 1hour, 98% H2SO4 at 230°C for 4 hours (H2SO4c) and 60%NaOH at 140°C for 3 hours followed by either 32% HCl(NaOH/HCl) or 65% HNO3 (NaOH/HNO3) at 80°C. Theaverage extraction efficiencies of the various digestionprocesses over multiple experiments for monazite (Figure 7)and PTMH (Figure 8) show clearly that PTMH is more reactivethan monazite. The optimum REE extraction using aqueousdigestion from PTMH was obtained using 32% HCl, whichresulted in an average extraction efficiency of 38.44%.Alkaline digestion followed by HNO3 yielded the highest
�
904 VOLUME 116

possible extraction efficiency of 38.56% for the REE.Digestion using concentrated H2SO4 did not result in any vastimprovement on the process, but did indicate that thoriumwas not extracted. Phosphor, which is still present in thePTMH, is a contaminant that reduces the percentage ofmaterial extracted from the process (Kemp and Cilliers,2016b).
The simpler diluted mineral acid digestion deliveredhigher extraction efficiency values for the REE, thorium anduranium from PTMH – within 30% of those obtained usingthe conventional process – and has the distinct advantage ofbeing simpler, easier to work with and potentially moreeconomical. The conventional monazite digestion processes ismore efficient at extracting the REE from PTMH than thediluted mineral acids, with varying degrees of success forthorium and uranium. The extraction values obtained for Ndand Y by the conventional H2SO4 process were consistentlyhigh. No explanation can be given at this time and thisphenomenon will be investigated further.
Thorium is found in monazite worldwide and can be usedas fuel in a nuclear reactor (Greneche et al., 2007). 32% HClextracted 16.89 % of the available thorium from monazite,PTM and PTMH. The digestion of PTMH with 60% NaOHfollowed by HNO3 obtained the highest extraction efficiencyfor thorium along with the REE. This is surprising, as thethorium should have been at a minimum due to it precipi-tating out as Th(OH)4. This phenomenon will be investigatedfurther.
To produce PTM the monazite sample must be rapidlyheated to allow it to properly dissociate and cooled rapidly toprevent the monazite particles from fusing together to form
larger, more inert particles. This can be accomplished withthe use of an in-flight RF induction plasma or a DC non-transferred arc plasma, whereby the monazite would besubjected to the required rapid heating rate. After the rapidheating of the monazite particles, the design of the in-flightplasma would allow the particles to cool fast enough toprevent the formation of excessively large particles orrecombination as a rare earth phosphate (Boulos, 1985).
The objective of this study was to treat monazite in a plasmain order to extract the rare earths, thorium and uranium moreefficiently. Theoretically. when monazite, as a rare earthphosphate, is treated in a thermal plasma at 1600°C, itdecomposes into chemically more reactive rare earth oxides.XRD analysis of plasma-treated monazite (PTM) indicatedthat the monazite crystal matrix was destroyed to produce anamorphous substance. It was determined that in order for themonazite to become more reactive the temperature andduration of the plasma treatment are crucial, otherwise, therewould only be a minimal increase in chemical reactivity. PTMcan be leached using a dilute mineral acid at a lowertemperature and in less time, than in the conventionalmonazite processes, while obtaining similar extractionvalues. The overall conclusion of the study is that the plasmatreatment of monazite increases its chemical reactivity. Thisknowledge can now be used to develop a more efficient andeconomical process than the comparable conventionalchemical digestion methods currently employed to processmonazite.
High-temperature thermal plasma treatment of monazite
VOLUME 116 905 �

High-temperature thermal plasma treatment of monazite
The authors thank the South African Nuclear EnergyCorporation SOC Ltd (Necsa) and the Nuclear MaterialsDevelopment Network of the Advanced Metals Initiative ofthe Department of Science and Technology of South Africa forfinancial support.
AMARAL, J.C.B.S. and MORAIS, C.A. 2010. Thorium and uranium extraction fromrare earth elements in monazite sulfuric acid liquor through solventextraction. Minerals Engineering, vol. 23, no. 6. pp. 498–503.
ASHRY, H.A., KHAZBAK, A.E., SOLIMAN, F.A.S. and IBRAHIM, M.A. 1995.Determination of uranium and thorium content in the various stages ofmonazite upgrading. Applied Radiation and Isotopes, vol. 46, no. 8. pp. 735–739.
BISWAS, R.K., HABIB, M.A., KARMAKAR, A.K. and ISLAM, M.R. 2010. A novelmethod for processing of Bangladeshi zircon: Part I: Baking and fusionwith NaOH. Hydrometallurgy, vol. 103, no. 1–4. pp. 124–129.
BOULOS, M.I. 1985. Inductively coupled R.F. (radio frequency) plasma. Pure andApplied Chemistry, vol. 57, no. 9. pp. 1321–1352.
COTTRELL, T.L. 1958. The Strengths of Chemical Bonds. 2nd edn. Butterworth,London.
DILL, H.G., WEBER, B. and KLOSA, D. 2012. Morphology and mineral chemistryof monazite–zircon-bearing stream sediments of continental placerdeposits (SE Germany): Ore guide and provenance marker. Journal ofGeochemical Exploration, vol. 112. pp. 322–346.
DILORIO, C.L., KNIGHT, D.J. and MANCUSO, M.P. 2012. Adoption of thorium power.Project Number IQP-BJS-TP11. Worcester Polytechnic Institute, Worcester,MA.
EL-NADI, Y.A., DAOUD, J.A. and ALY, H.F. 2005. Modified leachingt andextraction of uranium from hydrous oxide cake of Egyptian monazite.International Journal of Mineral Processing, vol. 79. pp. 101–110.
GRENECHE, D., SZYMCZAK, W.J., BUCHHEIT, J.M., DELPECH, M., VASILE, A. and JOLFIER,H. 2007. Rethinking the thorium fuel cycle: an industrial point of view.Proceedings of the International Congress on Advances in Nuclear PowerPlants, Nice. Paper 7367.
GUPTA, C.K. and KRISHNAMURTHY, N. 2005. Extractive Metallurgy of Rare Earths.CRC Press, Boca Raton, FL.
HASSAN, A.M., ABDEL-WAHAB, M., NADA, A., WALLEY EL-DINE, N. and KHAZBAK,A. 1997. Determination of uranium and thorium in Egyptian monazite bygamma-ray spectrometry. Applied Radiation and Isotopes, vol. 48, no. 1.pp. 149–152.
HAVENGA, J.L. and NEL, J.T. 2012. The manufacture of plasma- dissociatedzircon (PDZ) via a non- transferred arc process utilizing three 150 kW DCplasma torches. Journal of the Southern African Institute of Mining andMetallurgy, vol. 112, no. 7. pp. 12–14.
HIKICHI, Y. and NOMURA, T. 1987. Melting temperatures of xenotime andmonazite. Jounal of the American Ceramic Society, vol. 70, no. 10. pp. C252–C253.
HURST, C. 2010. China’s rare earth elements industry: what can the West learn?Institute for the Analysis of Global Security, Potomac, MD.http://www.iags.org/rareearth0310hurst.pdf
KAISER, A., LOBERT, M. and TELLE, R. 2008. Thermal stability of zircon (ZrSiO4).Journal of the European Ceramic Society, vol. 28, no. 11. pp. 2199–2211.
KEMP, D. and CILLIERS, A.C. 2014. Fluorination of rare earth, thorium anduranium oxides and phosphates from monazite a theoretical approach,Proceeding of the 2014 AMI Light Metals Development NetworkConference, Pilanesberg, South Africa. pp. 439–445
KEMP, D. and CILLIERS, A.C. 2016a. High temperature plasma treatment ofmonazite. International Journal of Mineral Processing. [Under review].
KEMP, D. and CILLIERS, A.C. 2016b. Theoretical and experimental evaluation ofthe digestion of plasma treated monazite with diluted HCl and HNO3.International Journal of Mineral Processing. [Under Review].
KIM, W., BAE, I., CHAE, S. and SHIN, H. 2009. Mechanochemical decomposition ofmonazite to assist the extraction of rare earth elements. Journal of Alloysand Compounds, vol. 486, no. 1-2. pp. 610–614.
KOCK, L.D., LEKGOATHI, M.D.S., SNYDERS, E., WAGENER, J.B., NEL, J.T. andHAVENGA, J.L. (2011). The determination ofpercentage dissociation ofzircon (ZrSiO4) to plasma-dissociated zircon (ZrO2.SiO2) by Ramamnspectroscopy. Journal of Raman Spectroscopy, vol. 43, no. 6. pp. 769–773.
PEELMAN, S., SUN, Z.H.I., SIETSMA, J. and YANG, Y. 2014. Leaching of rare earthelements: Past and present, Proceeding of the ERE2014L 1st EuropeanRare Earth Resources Conference, Milos, Greece, 4–7 September 2014. pp. 446–456
PIRKLE, F.L. and PODMEYER, D.A. 1988. Zircon: origin and uses. Transactions ofthe Society for Mining, Metallurgy and Exploration, vol. 292. pp. 1–20.
RENDTORFF, N.M., SUÁREZ, G., CONCONI, M.S., SINGH, S.K. and AGLIETTI, E.F.(2012). Plasma dissociated zircon (PDZ) processing; influence of the Zr:Siratio in the composition, microstructure and thermal re-crystallization.Procedia Materials Science, vol. 1. pp. 337–342.
RUSSIAN FOUNDATION OF BASIC RESEARCH. 2008. Mincryst.http://database.iem.ac.ru/mincryst/s_lattice.php?ZIRCON [accessed 16Mar. 2016].
SOUTH AFRICA. 2011. A beneficiation strategy for the minerals industry of SouthAfrica June 2011. Department of Mineral Resources.
SROOR, A. 2003. Passive and active measurements of Egyptian monazitesamples. Applied Radiation and Isotopes, vol. 58, no. 2. pp. 281–285.
TELLE, R. (Not dated) Thermal stability of zircon (ZrSiO4) and its dependenceon natural impurities in the raw materials. Institut fürGesteinshüttenkunde, RWTH Aachen University.
TOUMANOV, I.N. 2003. Plasma and High Frequency Processes for Obtaining andProcessing Materials in the Nuclear Fuel Cycle. Nova Science Publishers,New York.
XIE, F., AN ZHANG, T., DREISINGER, D. and DOYLE, F. 2014. A critical review onsolvent extraction of rare earths from aqueous solutions. MineralsEngineering, vol. 56. pp. 10–28.
XING, P., ZHUANG, Y., TU, G. and GUO, J. 2010. High temperature dephospho-rization behavior of monazite concentrate with charred coal. Transactionsof Nonferrous Metals Society of China, vol. 6326, December 2009. pp. 2392–2396.
YUGESWARAN, S., ANANTHAPADMANABHAN, P.V., THIYAGARAJAN, T.K. andRAMACHANDRAN, K. 2015. Plasma dissociation of zircon with concurrent in-flight removal of silica. Ceramics International, vol. 41, no. 8. pp. 9585–9592.
ZHU, Z., PRANOLO, Y. and CHENG, C.Y. 2015. Separation of uranium and thoriumfrom rare earths for rare earth production – a review. MineralsEngineering, vol. 77. pp. 185–196. �
�
906 VOLUME 116

Hot strip mills (HSMs) are used to roll caststeel slabs from their initial size to plate orsheet, which is then used to manufacture awide variety of goods for various industrialmarkets. The working rolls that contact anddeform the strip are arguably the primaryelement of the HSM. The surface quality of therolls must be maintained during rolling asimperfections are imposed onto the strip,affecting the quality. Among these rolls areindefinite chill (IC) work rolls. The general ICroll chemistry and microstructure compareswell with traditional white cast iron, except forthe sulphur and phosphorus impurityelements, which are kept to lower levels andthe presence of some graphite in themicrostructure similar to the other cast ironssuch as gray and ductile cast iron.
Various roll producers have experiencedthe occurrence of a surface defect on IC workrolls for many years, but the root cause of thedefect has not been thoroughly investigated.
The defect has been commonly referred to as‘tiger skin’ (TS) or elephant skin (van Tonder,2012). In this research, the characteristics ofthe TS surface defect were studied in anattempt to identify and remedy the cause.
Following discussions with both HSMs and theSouth African Roll Company (SARCO) inFebruary and March 2012, the opinion wasthat while the TS defects appeared to belimited to IC work rolls, these were sourcedfrom various reputable global roll producers.The TS defects appear as minor variations inthe surface appearance of the roll, which canbe difficult to identify, as shown in Figure 1.The TS defect is transferred to the strip duringrolling and is classed as an aestheticallyundesirable defect by the steel mill. While inservice, TS is readily detected on the productby strip surface quality monitoring systems.The TS problem occurs intermittently and doesnot appear to correspond to specific periods orseasons. TS has been found in both single-stand reversing Steckel mills and multiple-stand continuous mills and at both carbonsteel and stainless steel mills (van Tonder,2012).
SARCO also indicated that the TS appearedwithin a specific layer of the shell (the outerportion of the composite roll) thickness, whichis typically at the roll surface after approxi-mately 70% of the roll’s performance life. The
Investigation of the ‘tiger skin’ defecton indefinite chill rollsby J. Jonck*, J.S. Moema*†, J. Jooste‡ and P. van Tonder§
Hot strip mills (HSMs) are used to roll steel slabs down from their initialsize to plate or sheet, which are then used to manufacture a wide varietyof goods for various industrial markets. The surface quality of the rollsthat contact and deform the strip must be maintained during rolling, asroll imperfections can be imposed onto the strip, affecting the quality. Formany years various roll producers have experienced the occurrence of asurface defect, commonly referred to as ‘tiger skin’ (TS), on indefinite chill(IC) work rolls, but the cause of the defect has not been thoroughlyinvestigated. The characteristics of the TS defects on the roll surface werestudied in an attempt to identify the cause and prevent its occurrence. Inthis paper, the characterization results of the defects are highlighted.Various techniques were utilized in the analysis: visual inspection,chemical analysis, optical microscopy, hardness testing, scanning electronmicroscopy and X-ray diffraction. The purpose of the testing was toidentify any variations in the roll microstructure that could give rise to thesurface variation. The results confirmed that the TS defects appeared as apattern that is not related to a variation in the surface profile, surfacecracking, chemical segregation, graphite characteristics, carbide character-istics, primary phase characteristics, bulk hardness, or microhardness.Further investigations are recommended.
rolling, mills, hot strip, surface defects, ‘tiger skin’.
* Mintek, Randburg, South Africa.† University of Pretoria, Pretoria, South Africa.‡ Vaal University of Technology, Vanderbijlpark,
South Africa.§ South African Roll Company Pty. Ltd.,
Vanderbijlpark, South Africa.© The Southern African Institute of Mining and
Metallurgy, 2016. ISSN 2225-6253. This paperwas first presented at the AMI Ferrous and BaseMetals Development Network Conference 201619–21 October 2016, Southern Sun ElangeniMaharani, KwaZulu-Natal, South Africa.
907VOLUME 116 �
http://dx.doi.org/10.17159/2411-9717/2016/v116n10a3

Investigation of the ‘tiger skin’ defect on indefinite chill rolls
TS appears only within the roll area that is in contact with thestrip during rolling. The surface can be ground to remove theTS, but the defect commonly reappears when the roll resumesservice. If TS is detected on a roll, a sufficient amount of shellmaterial will be removed (based on recommendations fromthe roll supplier), reducing the roll diameter. The roll will thenbe returned to service and monitored closely to detectwhether the defect reappears. If the defect has not beeneliminated, the procedure is repeated until the defect is nolonger present. The lost roll material results in loss ofproduction and operational expenses for the mill (ColumbusStainless Steel, 2009). It has been postulated that TS may berelated to a variation in graphite distribution over the rollsurface. The general assumption was that TS must be roll-related, given the characteristics of occurrence, with the milltype and conditions also contributing to the prevalence(Columbus Stainless Steel, 2009; vander Voort, 1999).
Consultation with roll producers who have experienced TSindicated that, although the source is not clear, the belief wasthat the TS phenomenon was inherent to the roll castingprocess. It has also been postulated that TS could be relatedto the direction of rotation during casting, which is either in,or opposite to, the rolling direction in service. However, thisshould not be the case in a Steckel mill where the feeddirection alternates.
Samples from various industrial IC rolls were analysed,including defective newly-manufactured rolls, rolls removedfrom service that did not show the TS defect, rolls showingthe TS defect in service and rolls that had completed theirservice life without showing the TS defect. Shavings wereremoved from the roll displaying TS at diameters of 0, 7 and15 mm (depth below the surface) of the roll, from the driveside and the free side.
The working surface was characterized by visualexamination, replication with a 0.1 m resolution of thesurfaces, optical microscopy of replicas and the cleanedsurfaces. Scanning electron microscopy (SEM) and etchingtrials were performed to identify any variation ofmicrostructural features on the working surface related to theTS appearance.
A variety of etchants were used for the etching trials,including 4% nital, 10% nital, 4% picral, alkaline sodium
picrate (ASP), Beaujard’s solution and a four-step duplexetchant (ASTM, 2003). The optical microscope stage heightwas recorded to determine the average height differencebetween the protruding carbides and the primary phase of thelight and dark TS areas.
Chemical analysis of metal shavings was done to identifyany chemical segregation or differences over the shell depth.The amounts of carbon and sulphur were determined byLECO combustion analysis. The other elements of interestwere determined by inductively coupled plasma opticalemission spectrometry (ICP-OES) analysis.
The samples were ground and polished to a 1 m surfacefinish in the transverse and radial directions at differentdepths for microscopy. The polished sections were used toevaluate the graphite volume fraction, distribution andmorphology, to identify any variations in graphite occurrencewhich could be related to TS. The samples were etched with3% nital by swabbing the surface, to reveal the generalmicrostructure. The etchant does not attack any carbides(which then remain white), enabling good contrast betweenthe carbides (primary and secondary carbides) and the darkerphases. This ensures accurate determination of the carbidevolume fraction by means of image analysis. The sampleswere then etched with a range of selective carbide etchants toidentify the carbide type, or any variation in the carbide typethat might be present (specifically related to the TS defect).The etchants considered included an ASP etchant,Murakami’s reagent, Groesbeck’s reagent, 1% CrO3 and 10%ammonium persulphate (APS) solution. The samples wereetched with Beraha’s sulfamic acid solution and a sodiummetabisulphite (SMB) tint etch in order to identify anyretained austenite (RA) within the microstructure. Beraha’stint etchant selectively colours the austenite phase blue. TheSMB etchant darkens martensite and does not etch all otherphases, including austenite (vander Voort, 1999).
Hardness testing was performed to determine if the TSpattern was related to changes in the bulk hardness ormicrohardness of individual phases within themicrostructure. The bulk hardness was measured using aRockwell C tester, while the microhardnesses of the carbidesand primary phase were individually measured using aVickers microhardness tester with a load of 200 g and aholding time of 15 seconds.
SEM analysis of the polished samples was performed toidentify any microstructural or chemical variations associatedwith the TS. The chemical analysis was performed usingenergy-dispersive X-ray spectrometry (EDX) at the centre ofthe primary phase grains, centre of the primary carbides,interface between the primary phase and the carbides and theregions isolated by the eutectic carbides.
Samples were prepared for XRD using universal sampleholders under typical metallography guidelines, followed by abrief final electropolish using chromic-acetic acid and astainless steel cathode. The samples were examined prior toXRD testing to ensure no pitting of the surface had occurred(vander Voort and Manilova, 2005; ASTM, 2003; Klimek,1975). XRD was then done to analyse the phases presentwithin the samples. The relative phase amounts (mass %)were estimated using the Rietveld method (Lowe-Ma andDonlon, 2001). The carbide morphologies and quantity data(as determined by microscopy) were used to ensure accurate
�
908 VOLUME 116

RA peak identification to avoid erroneous overestimation. Aslow scanning rate of 0.5° 2 /min was utilized as lowamounts of RA were expected for all the samples.
Visual examination showed that the TS defect could beclearly identified as a pattern of alternating lighter and darkershaded areas on the working surface. The difference insurface appearance could not be properly photographed, asnone of the macro etchants highlighted the TS defect. Opticalmicroscopy of the cleaned surfaces also showed nosignificant variation of microstructural features (carbideexposure, carbide distribution etc.) on the working surfacerelated to the TS appearance, as shown in Figure 2. Theaverage height difference between the protruding carbidesand the depressed primary phase was not consistently higheror lower when comparing the light and dark TS areas, asshown in Table I.
SEM analysis showed widespread cracking of the rollsurface which appeared to propagate through the carbidenetworks, as indicated in Figure 3. The carbides appeared tohave been crushed during rolling, as indicated by smallercracks that were limited to the carbides (Figure 4). However,the cracking did not appear to be related to TS, as thecracking was uniform across both the light and dark areas ofall the samples. Oxide was observed on the primary phase,which is expected for a roll taken from service.
There was little variation in chemical composition across theshell material, except for the silicon content at both ends ofthe roll, which showed significant variation. The silicondecreases the stability of Fe3C and increases the degree ofgraphitization of the roll, which could cause variations ingraphite content (Craig, Hornung and McCluhan, 1988).However, the variation in silicon content did not appear to bemore severe in the TS region compared to the other regions ofthe shell material and did not seem to be related to TS. Noother chemical variations were identified that could give riseto the TS defect. The detailed chemical analysis may not bereported for proprietary reasons, but the typical ICcomposition is shown in Table II.
Investigation of the ‘tiger skin’ defect on indefinite chill rolls
909VOLUME 116 �
Table I
Minimum 3.8 3.0 3.0Maximum 7.9 10.0 10.0Average 5.4 6.5 5.9Standard deviation 1.1 1.1 1.1

Investigation of the ‘tiger skin’ defect on indefinite chill rolls
The polished sections showed coarse graphite with a uniformdistribution and morphology on both the transverse andradial sections of most samples. The only exception was onone of the radial TS samples, where a variation betweenregions of predominantly fine, well-distributed graphite(Figure 5a) and coarse graphite particles (Figure 5b) wasseen. These variations could influence the lubrication effectof the graphite during rolling, leading to variations in frictioncoefficient and slippage resistance across the roll and therebycause a surface effect such as TS (Mees, 2002).Unfortunately, as the working surface had already beenground off on the as-received material, it could not beconfirmed if the variation in graphite distribution correlatedwith the TS surface pattern.
Variation in the measured graphite content was observedbetween the transverse and radial sections of all the samples.The average graphite content showed a consistent increasewith increase in depth below the surface, as shown in Figure 6. The increase in graphite content was probably dueto the slower cooling rate associated with greater depthsbelow the surface during solidification.
The general microstructures of all the samples weresimilar, consisting of free graphite and primary carbidenetworks within a martensitic primary phase. The primarycarbide was found as interdendritic and eutectic structures,with the interdendritic being the most abundant. Thearrangement of the two carbide structures did not correspondto the TS pattern. Figure 7 shows that the surface crackspropagated predominantly through the carbides, confirmingthe crushing of carbides identified during SEM analysis. Thecracks were mostly limited to a depth of 100 μm below thesurface.
The Nital-etched samples were used to determine thecarbide area fraction. The amount of carbide was slightlyhigher at a depth of 7 mm and lower at a depth of 15 mmthan at the surface (Figure 8). The carbide contents of thelight and dark areas of the TS were found to be similar.
Only two etchants from the range tested were able todistinguish the carbides. The 10% APS etchant outlined thecarbides, while the alkaline sodium picrate (ASP) etchantoutlined and coloured the carbides, as shown in Figure 9. Thecombination of the etch response confirms that the carbidesare of the M3C type (vander Voort, 1999). The samplesshowed a uniform carbide type at the three depths examined
�
910 VOLUME 116
Table II
Typical Min. 3.0 0.3 0.0 0.0 0.5 0.7 0.1 3.0 -Max. 4.0 1.6 0.2 0.2 2.0 2.5 0.8 5.0 0.5
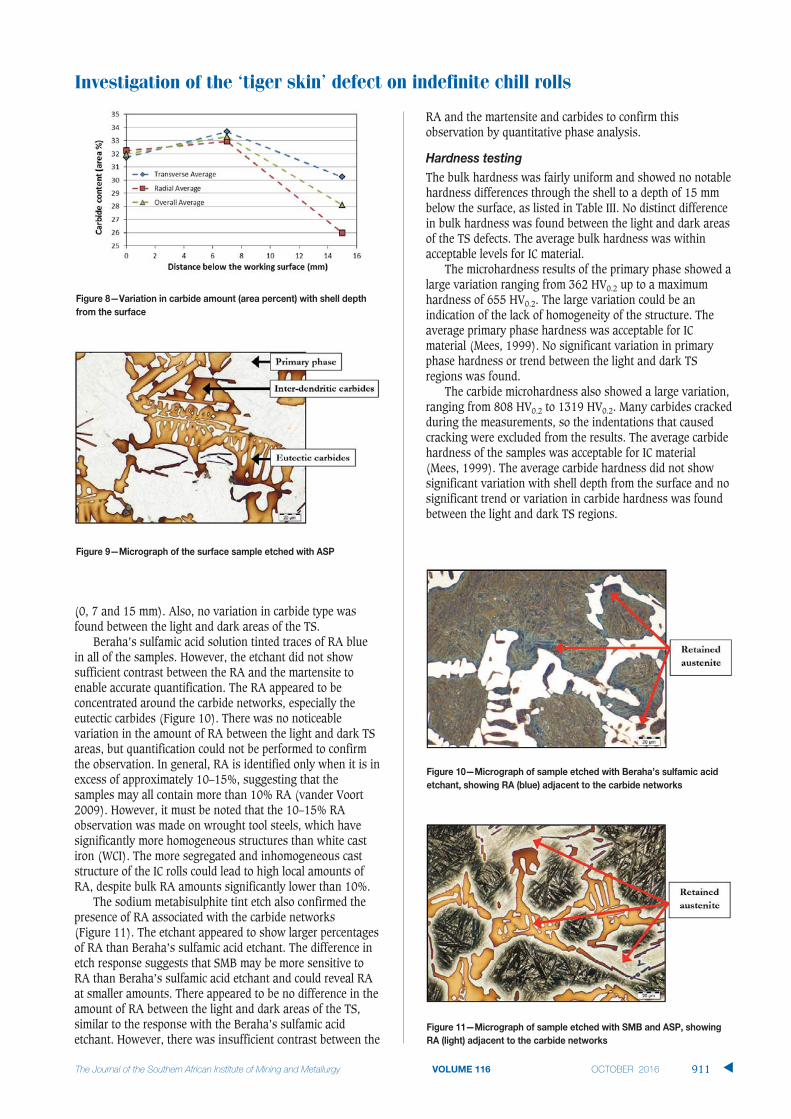
(0, 7 and 15 mm). Also, no variation in carbide type wasfound between the light and dark areas of the TS.
Beraha’s sulfamic acid solution tinted traces of RA bluein all of the samples. However, the etchant did not showsufficient contrast between the RA and the martensite toenable accurate quantification. The RA appeared to beconcentrated around the carbide networks, especially theeutectic carbides (Figure 10). There was no noticeablevariation in the amount of RA between the light and dark TSareas, but quantification could not be performed to confirmthe observation. In general, RA is identified only when it is inexcess of approximately 10–15%, suggesting that thesamples may all contain more than 10% RA (vander Voort2009). However, it must be noted that the 10–15% RAobservation was made on wrought tool steels, which havesignificantly more homogeneous structures than white castiron (WCI). The more segregated and inhomogeneous caststructure of the IC rolls could lead to high local amounts ofRA, despite bulk RA amounts significantly lower than 10%.
The sodium metabisulphite tint etch also confirmed thepresence of RA associated with the carbide networks (Figure 11). The etchant appeared to show larger percentagesof RA than Beraha’s sulfamic acid etchant. The difference inetch response suggests that SMB may be more sensitive toRA than Beraha’s sulfamic acid etchant and could reveal RAat smaller amounts. There appeared to be no difference in theamount of RA between the light and dark areas of the TS,similar to the response with the Beraha’s sulfamic acidetchant. However, there was insufficient contrast between the
RA and the martensite and carbides to confirm thisobservation by quantitative phase analysis.
The bulk hardness was fairly uniform and showed no notablehardness differences through the shell to a depth of 15 mmbelow the surface, as listed in Table III. No distinct differencein bulk hardness was found between the light and dark areasof the TS defects. The average bulk hardness was withinacceptable levels for IC material.
The microhardness results of the primary phase showed alarge variation ranging from 362 HV0.2 up to a maximumhardness of 655 HV0.2. The large variation could be anindication of the lack of homogeneity of the structure. Theaverage primary phase hardness was acceptable for ICmaterial (Mees, 1999). No significant variation in primaryphase hardness or trend between the light and dark TSregions was found.
The carbide microhardness also showed a large variation,ranging from 808 HV0.2 to 1319 HV0.2. Many carbides crackedduring the measurements, so the indentations that causedcracking were excluded from the results. The average carbidehardness of the samples was acceptable for IC material(Mees, 1999). The average carbide hardness did not showsignificant variation with shell depth from the surface and nosignificant trend or variation in carbide hardness was foundbetween the light and dark TS regions.
Investigation of the ‘tiger skin’ defect on indefinite chill rolls
VOLUME 116 911 �

Investigation of the ‘tiger skin’ defect on indefinite chill rolls
There was no marked difference in bulk hardnessbetween the coarse graphite region at an average of 54.2 HRCand the fine graphite region at an average of 53.9 HRC.Differences in the bulk hardness across the surface also didnot correspond with the areas of coarse and fine graphite.However, the primary phase hardness showed a substantialincrease of approximately 300 HV associated with the finegraphite regions. It is not clear whether the increase inprimary phase hardness was associated with TS. The highprimary phase hardness values were not found on any otherTS sample other than the specific radial sample.
The SEM backscattered electron (BSE) images showed noclear distinction between the light and dark TS regions.However, in BSE mode the primary phase regions in theeutectic which were completely isolated by the eutecticcarbides were a slightly lighter shade of grey compared to thedarker grey remainder of the primary phase, as highlighted inFigure 12. These were the same areas identified by opticalmicroscopy as being rich in austenite and this confirms theassociation of the eutectic carbides with the retainedaustenite. The shading variation suggests that there could bea slight compositional variation between these regions. Theprimary phase also showed needle-like phases, which areprobably martensite and austenite, as identified duringoptical microscopy. The variation was found on all thesamples analysed. The results from the EDS analysis showedno measurable variation in chemical composition of theprimary phase between the light and dark areas of the TS.There was no measurable variation in chemical compositionof the primary phase between the surface and 7 mm belowthe surface. There was also no measurable variation inchemical composition of the carbides or the primary phasebetween the light TS area, dark TS area, surface and 7 mmbelow the surface.
The chemical analyses also indicated that the lighterprimary phase areas in the eutectic carbide regions areenriched with nickel, silicon and molybdenum compared tothe general primary phase composition. Nickel is a strongaustenite former and stabilizer, which typically increases theamount of retained austenite after casting and reduces thehardness (Gundlach, 1988). Enrichment in these elementswill also increase the hardenability at these locations and
delay martensite formation relative to the rest of the primaryphase (Craig et al., 1988).
The XRD results showed distinct peaks that were clearlydistinguished from the background, which ensures accurateanalysis. All the samples contained four phases: ’(martensite), cementite (M3C carbide), -Fe (austenite) andgraphite. The XRD analysis for RA is strongly affected byalloying elements and carbides. Given the high level ofalloying elements in the material it should be noted that theaccuracy will be less than typically achieved by XRD (vanderVoort and Manilova, 2005; Lowe-Ma and Donlon, 2001).
XRD confirmed that the M3C carbide type was inagreement with the EDX results. The amount of retainedaustenite was consistently above 3%, which is high and wasin agreement with the microscopy observations. Higheramounts of RA will typically result in a decrease in rollperformance, due to a reduction in hardness (Breyer, 2002).The typical hardness of retained austenite and martensite inIC rolls is approximately 375 HV and 600 HV, respectively(Schleiden, 2002). However, no significant variation in thedistribution of RA was found between the different samplesshowing TS and the samples removed from deep enoughbelow the surface that should not show any TS. Thus, the TSdefect was not expected to be associated with high RAcontents. However, the TS defect could be caused and/orinfluenced by a variation in RA content over the roll surface.
�
912 VOLUME 116
Table III
Transverse Minimum 55.2 56.7 53.0 47.4 49.0 47.9Maximum 58.8 59.1 57.5 57.7 59.1 56.3Average 57.2 57.9 55.9 53.1 53.5 52.7
Standard deviation 1.2 0.8 1.5 1.4 1.7 1.4
Radial Minimum 44.3 42.2 44.8 42.9 40.8 29.0 33.9Maximum 54.2 49.9 52.7 51.3 51.5 52.6 53.4Average 49.3 47.1 48.1 47.9 47.1 44.6 44.2
Standard deviation 3.9 2.4 2.5 2.2 2.8 6.1 3.3
Typical IC hardness 45–60

There should be sufficient heterogeneity within the caststructure to facilitate variations in RA content even thoughsegregation effects could not be identified by microscopy.
It was generally found that the martensite and graphitecontent increased with depth below the surface, while thecarbide content decreased (Figures 13 and 14). There was nosignificant variation in the amount of retained austenite fromthe surface to 15 mm below the surface.
The tiger skin (TS) defect appeared as a pattern of alternatinglighter and darker shaded areas on visual inspection of an ICwork roll at low magnification. This defect did not seem to bespecifically related to variations in: the surface profile,surface cracking, chemical segregation, bulk hardness, ormicrohardness. There was also no correlation found betweenthe TS defect and phase characteristics, i.e. amount, distri-bution, size and composition of: graphite, M3C, martensiteand retained austenite.
SEM analysis showed widespread cracking of the rollsurface which appeared to propagate through the carbidenetworks. Microscopy confirmed that the carbides had beencrushed during rolling, as indicated by smaller cracks whichwere limited to the carbides.
Further investigation of the casting parameters, solidifi-cation process and solidification front is required in order torecommend remedial action to prevent the TS formation. It isalso clear that a collective effort between roll manufacturersand the mill end-user would be required in order to resolvethe occurrence of TS.
ASTM. 2003. Standard practise for X-ray determination of retained austenite in
steel with near random crystallographic orientation. ASTM E975-03.
ASTM International, Philadelphia, USA.
BREYER, J.P. 2002. The metallurgy of high chromium-molybdenum white iron
and steel rolls. Rolls for the Metalworking Industries. Lee, G.E. (ed.). Iron
and Steel Society, Warrendale, PA. pp. 29–40.
COLUMBUS STAINLESS STEEl. 2009. Tiger skin defect on SARCO roll surface.
Middelburg, South Africa. Internal report.
CRAIG, D.B., HORNUNG, M.J. and MCCLUHAN, T.K. 1988. Gray iron. ASM
Handbook: Castings. Davis, J.R., Destefani, J.D. and Zorc, T.B. (eds.).
ASM International, Materials Park, OH. pp. 1365–1409.
GUNDLACH, R.B. 1988. High-alloy white-irons. ASM Handbook: Castings. Davis,
J.R., Destefani, J.D. and Zorc, T.B. (eds.), ASM International, Materials
Park, OH. pp. 1484–1500,
KLIMEK, E.J. 1975. A metallographic method for measuring of retained
austenite. Metals Engineering Quarterly, vol. 15, no. 1. pp. 55–61.
LOWE-MA, C.K. and DONLON, W.T. 2001. Comments on determining X-ray
diffraction-based volume fractions of retained austenite in steels. Powder
Diffraction, vol. 16, no. 4. pp. 198–204.
MEES, J.B. 1999. The metallurgy of indefinite chill cast iron. Rolls for the
Metalworking Industries. Lee, G.E. (ed.), Iron and Steel Society,
Warrendale, PA. pp. 41–47.
NUNDLALL, K. 2008. Memorandum: metallurgical analysis of elephant skin
defect on Steckel mill work rolls. Report no. Met. Ref. 200807P01.
Columbus Stainless Steel, Middelburg, South Africa. Internal report.
SCHLEIDEN, R.F. 2002. The metallurgy of cast iron rolls. Rolls for the
Metalworking Industries. Lee, G.E. (ed.). Iron and Steel Society,
Warrendale, PA. pp. 20–28.
VAN TONDER, P. 2012. Personal communication, 14 February. South African Roll
Company.
VANDER VOORT, G.F. 2009. Martensite and retained austenite. Industrial
Heating, vol. 76, no. 4. pp. 51–54.
VANDER VOORT, G.F. and MANILOVA, E.P. 2005. Hints for imaging phases in
steels. Advanced Materials and Processes, vol. 163, no. 2. pp. 32–37.
VANDER VOORT, G.F. 1999. Metallography: Principles and Practices. ASM
International, Materials Park, OH. �
Investigation of the ‘tiger skin’ defect on indefinite chill rolls
VOLUME 116 913 �

Depend on OUR quality
Distribution and Product Support by:
H/Office: Tel: (011) 306-0700 Fax: (011) 918-7208
e-mail: [email protected]: www.elbequipment.com
Branches and Dealers throughout Southern Africa
Terex® MineralsProcessing SystemsNot just equipment. A complete solution.ELB Equipment, the sub-Sahara Africa distributor of a complete range of Terex® Minerals Processing Systems, understands your business and with Terex® are dedicated to offering cost-effective solutions for your needs.
In today’s competitive environment, you need high quality equipment backed by an outstanding support network locally and inter-nationally. Our sales and after-market teams are trained to provide customers with outstanding crushing and screening process knowledge and service.
As a member of the ELB Group, we have a century of experience in the mining industry that you can depend on. Customer satisfaction is our ultimate goal.
6th Sulphur andSulphuric Acid
2017 Conference
Cape Town Convention CentreCape Town, South Africa
BACKGROUNDThe production of SO2 and Sulphuric acid re-mains a pertinent topic in the Southern Africanmining, minerals and metallurgical industry.Due to significant growth in acid and SO2 pro-duction as a fatal product, as well as increasedrequirement for acid and SO2 to process Cop-per, Cobalt and Uranium, the Sub Saharan re-gion has seen a dramatic increase in thenumber of new plants. The design capacity ofeach of the new plants is in excess of 1000tons per day.
In light of the current state of the industryand the global metal commodity prices the op-timisation of sulphuric acid plants, new tech-nologies and recapture and recycle of streamsis even more of a priority and focus. The 2017Sulphuric Acid Conference will create an oppor-tunity to be exposed to industry thought leadersand peers, international suppliers, other pro-ducers and experts.
To ensure that you stay abreast of devel-opments in the industry, The Southern AfricanInstitute of Mining and Metallurgy, invites youto participate in a conference on the produc-tion, utilization and conversion of sulphur, sul-phuric acid and SO2 abatement in metallurgicaland other processes to be held in May 2017 inCape Town.
OBJECTIVES> Expose SAIMM members to issues relating
to the generation and handling of sulphur,sulphuric acid and SO2 abatement in the met-allurgical and other industries.
> Provide opportunity to producers and consumers of sulphur and sulphuric acid andrelated products to be exposed to new tech-nologies and equipment in the field.
> Enable participants to share information andexperience with application of such tech-nologies.
> Provide opportunity to role players in theindustry to discuss common problemsand their solutions.

Zirconium (Zr) and hafnium (Hf) coexist innature and have similar chemical propertiessuch as ionic radii (0.074 mm for Zr4+ and0.075 mm for Hf4+) and valence electrons inthe outer orbitals. (Xu et al., 2015; Nielsen etal., 2000). Although both elements can befound in group 4 of the periodic table, theirproperties as regards nuclear application differ,the thermal neutron capture cross-sectionbeing much higher for Hf than that for Zr.(Purohit and Devi, 1997; Yang et al., 2002) Zralso has a high corrosion resistance in acidmedia, which improves the lifetime of claddingmaterials in nuclear reactors. Hence, for Zr tobe used as fuel cladding material and water-cooled components in nuclear reactors, the Hfcontent must be reduced from the naturallyoccurring 3% to <100 ppm. (Li et al., 2011)
There are several processes that arecurrently in use for the extraction and purifi-cation of Zr and Hf, such as the methylisobutyl ketone (MIBK) process proposed by
Fischer and Chalybaeus (Overholser et al.,1960). In this process, Zr and Hf formcomplexes with thiocyanate that have differentsolubilities, resulting in Hf being preferentiallyextracted into the organic phase. Thedisadvantages of this process are the highconcentrations of ammonium and cyanides inthe waste stream. The formation of cyanidesfrom thiocyanate can occur in various ways,but in the case of the MIBK process thethiocyanate (SCN–) is converted to OCN– by theammonium and to HCN by nitric acid solutionsalso present in the mixtures (Jenny et al.,2001). The low flashpoint of the solvent isalso a disadvantage. Other processes known tothe industry are the tributyl phosphate (TBP)and Cyanex 923 processes, in which selectiveextraction is attained in a nitric acid solutionas proposed by Taghizadeh et al. (2011). In1974, Sato and Watanabe investigated theextraction of Zr in a sulphate medium usingdifferent types of amine extractants, showingthat secondary amines are superior to tertiaryamine extractants (Amaral et al., 2013). In2014, Wang and Lee reported on the prefer-ential extraction of Zr in a sulphate mediumusing Aliquat 336, Alamine 336, Alamine 300and Alamine 308 (Wang and Lee, 2015). Allof the abovementioned methods and processesuse Zr and Hf chloride salts as the startingreagent.
The South African Nuclear EnergyCorporation (Necsa) has patented a plasmaand fluoride process for the manufacturing of
The separation of zirconium andhafnium from (NH4)3Zr(Hf)F7 usingamine—based extractantsby E.W. Conradie*, D.J. van der Westhuizen*, J.T. Nel† and H.M. Krieg*
The suitability of the amine-based extractants Alamine 336, Aliquat 336and Uniquat 2280 (10 wt%) for the selective extraction of zirconium (Zr)and hafnium (Hf) from a (NH4)3Zr(Hf)F7 solution was investigated. Theextractant-containing organic phase consisted of cyclohexane and 5 v/v%1-octanol as phase modifier. The (NH4)3Zr(Hf)F7 was dissolved in eitherhydrochloride acid or sulphuric acid (0.01–8.0 mol/dm3). The followingvariables were investigated: (i) the type and concentration of the acid, (ii)the equilibrium time, (iii) the organic/aqueous phase ratio and (iv) theextractant to metal ratio. Subsequently, using the optimized extractionconditions, the stripping of extracted metals from the organic phase wasinvestigated using sodium chloride and sulphuric acid. The metal contentin the aqueous phase was determined using ICP-OES before and afterextractions.
When using sulphuric acid solutions, extractions of >80% werereached both for Zr and Hf. In all cases equilibrium was achieved in lessthan 25 minutes of contact between the organic and the aqueous phase.Stripping of metals was achieved with >40% separation and 50%extraction using a sodium chloride (0.7 mol/dm3) stripping solution.
zirconium, hafnium, amine extractants, (NH4)3Zr(Hf)F7.
* Chemical Resource Beneficiation, (CRB), North-West University of Potchefstroom Campus,Potchefstroom, South Africa.
† The South African Nuclear Energy Corporation(SOC) Ltd. (Necsa), Pretoria, South Africa.
© The Southern African Institute of Mining andMetallurgy, 2016. ISSN 2225-6253. This paperwas first presented at the AMI Ferrous and BaseMetals Development Network Conference 201619–21 October 2016, Southern Sun ElangeniMaharani, KwaZulu-Natal, South Africa.
915VOLUME 116 �
http://dx.doi.org/10.17159/2411-9717/2016/v116n10a4

The separation of zirconium and hafnium from (NH4)3Zr(Hf)F7
zirconium metal starting from the mineral zircon (ZrSiO2)(Nel et al., 2014). According to the patent, plasma-dissociated zircon is reacted with ammonium bifluoride andan (NH4)3Zr(Hf)F7 complex is formed and isolated fordownstream processing, i.e. separation of Zr and Hf. It is thepurpose of this research to determine the suitability of amineextractants (Alamine 336, Aliquat 336 and Uniquat 2280) forthe separation of Zr and Hf from (NH4)3Zr(Hf)F7 (97 ppm Zrand 3 ppm Hf) in hydrochloric and sulphuric acid solutions(0.01–8 mol/dm3). Since the extraction from this salt has notbeen published previously, limited comparison of the data toliterature data was possible. The parameters investigatedwere the type of acid and acid concentration, the type ofextractant, extractant concentration and the effect of the twometals (Zr and Hf) on one another. Subsequently, twostripping agents (sodium chloride and sulphuric acid) wereevaluated to regenerate the organic phases and to serve aspossible scrubbing liquors.
Tri-octyl/decyl amine (98% Alamine 336, CognisCorporation), tricaprylmethylammonium chloride (97%Aliquat 336, Cognis Corporation) and didecyl dimethylammonium chloride (Uniquat 2280, 80%, Lonza) werediluted with cyclohexane (98%, Labchem) to 10 wt%. Lastly,5 v/v% 1-octanol (98%, Sigma Aldrich) was added to thesolvent to prevent the formation of a third phase. Allchemicals were of analytical grade and used as received.
Fresh stock solutions of sulphuric (9% H2SO4, Labchem)or hydrochloric acid (32% HCl, LabChem) were preparedcontaining (NH4)3ZrF7 and (NH4)3HfF7 obtained from Necsa.The pure Zr and Hf salts were prepared by simulating theNecsa plasma process (Nel et al., 2014) using a single metalfeed of zirconium oxide (99.9% ZrO2, Sigma-Aldrich) andhafnium oxide 99.9% HfO2, Sigma-Aldrich). The prepared(NH4)3ZrF7 and (NH4)3HfF7 were analysed at Necsa to ensurethe correctness and purity (97%) of the compounds.Pelindaba Analytical Laboratories (PAL) performed ICPanalysis to verify the metal concentrations. Distillationmethods were used to obtain the relevant fluoride data andan ion-selective electrode was used to analyse the ammoniumcontent. Acid concentrations varied from 0.001–8 mol/dm3,while the metal concentrations were fixed for single saltextractions at 100 mg/dm3 Zr/Hf and for mixed saltsextractions at 97 mg/dm3 and 3 mg/dm3 for Zr and Hf respec-tively. Aqueous phase dilutions were made with deionizedwater (Millipore Milli-Q Plus® Q-pack CPMQ004R1).
H2SO4 and sodium chloride (98%NaCl, LabChem) werediluted with deionized water to concentrations ranging from0.001–2 mol/dm3.
The extraction and stripping experiments were done bycontacting equal volumes of the organic and aqueous phase(25 mL; A/O = 1) at 25°C for 60 minutes in a rotary shakerand incubator at 310 r/min. Although equilibrium wasreached after 25 minutes (data not shown), all samples wereshaken for 60 minute to ensure sufficient equilibrium. Afterachieving equilibrium and separating the phases in standardseparation funnels, inductively coupled plasma–optical
emission spectrometry (ICP-OES, Thermo Scientific iCAP6000 SERIES ICP + CETAC ASX- 520 Auto sampler) wasused to analyse the metal concentration in the aqueousphase. The concentration of the metal in the organic phaseswas assumed to be in accordance with the mass balance.
The initial experiments were designed to observe the effectand correlation of single- and mixed salt extractions. Bothsingle and binary systems were evaluated using HCl andH2SO4 solutions with as wide as possible concentrationrange for the initial screening (0.1–8 mol/dm3). Insubsequent experiments more data points in narrower rangeswere selected. Three different amine-based extractants wereused. Alamine 336 is a tertiary amine with three carbonchains extended from the nitrogen (C24H51N). Both Aliquat336 and Uniquat 2280 are quaternary ammonium salts witha positively charged nitrogen bonded to a methyl group andthree additional carbon chains in the case of Aliquat 336 andtwo methyl groups and two carbon chains in the case ofUniquat 2280 (Senol, 2001; Tan et al., 2007; Barnabas andTreadway, 2010)
In the single salt experiments, emulsions were observedand hence no analysis was possible when extracting withUniquat 2280 in 4–8 mol/dm3 H2SO4 as well as when usingAlamine 336 in 0.1 mol/dm3 H2SO4. Banda et al. (2012)observed similar emulsions and third phase formations whileusing Alamine 336 in HCl.
Figure 1 and Figure 2 display data on the single metalextraction of Zr and Hf from HCl and H2SO4 respectivelyusing the experimental conditions described. No significantextraction was obtained above 1 mol/dm3 acid, irrespective ofthe type of acid or extractant used. The highest extraction
�
916 VOLUME 116

values (>85%) were attained at 0.1 mol/dm3, with a slightlyhigher extraction from a HCl environment. The onlynoteworthy selectivity at high enough extraction values wasobtained using Aliquat 336 (Figure 1b), where a 27% Hfselectivity was observed at 0.1 mol/dm3. The percentageselectivity was calculated by subtracting the lesser extractedmetal from the greater extracted metal.
Using the same parameters that had been used for singlesalts, mixed salt (97 wt% Zr and 3 wt% Hf) experimentswere performed to correlate single- and mixed saltextractions, thereby determining whether the metals affectedeach other; for example, due to mutual inhabitation duringextraction. Mixed salt extractions with the three amine-basedextractants and the two acids were evaluated. HCl and H2SO4
solutions with a concentration range of 0.01–8 mol/dm3 wereused.
Similar to the discussion in the previous section, Figure 3and Figure 4 illustrate the data on the mixed metalsextractions of Zr and Hf from an HCl and H2SO4 solution,respectively. When attempting extraction from HCl, noextraction was attained when using Alamine 336 between0.1–4 mol/dm3 HCl (Figure 3a), increasing to just over 20%extraction at 6 mol/dm3 HCl. With Aliquat 336, 48%extraction was obtained at 0.1 mol/dm3 HCl with a 4% Hfselectivity (Figure 3b). Although Uniquat 2280 (Figure 3c)showed some extraction in the range of 1–8 mol/dm3 HCl, theextraction remained less than 20%. It is known that amine-based extractants can form emulsions when extracting froman HCl environment (Barnabas and Treadway, 2010); thiswas also observed in the present study when using Alamine336 combined with H2SO4 at 0.1 mol/dm3 and Uniquat 2280at 6–8 mol/dm3. Emulsions were observed in HCl solutions of8 mol/ dm3 for Alamine 336 and 0.1 mol/dm3 solution forUniquat 2280.
Due to the high extraction with Alamine 336, sevenextractions were completed with less than 1 mol/dm3 H2SO4
(0, 0.01, 0.1, 0.2, 0.4, 0.6, 0.8 mol/dm3) to obtain morecomprehensive data. When considering the extraction of themixed salts from a H2SO4 solution (Figure 4), significantextraction for Alamine 336 and Aliquat 336 was observedwhen extracting from a low acid concentration, while nosignificant extraction was observed when using Uniquat2280. Extraction with both Alamine 336 and Aliquat 336increased at high (>6 mol/dm3) and low (<2 mol/dm3) H2SO4
concentrations. For both Alamine 336 and Aliquat 336 theextractions decreased from above 80% to 20–30% between0.1 and 2 mol/dm3, remained practically constant between 2 and 4 mol/dm3 and then gradually increased again from 4–8 mol/dm3 H2SO4. The highest extractions with Alamine336 and Aliquat 336 were 91% and 78% respectively at
The separation of zirconium and hafnium from (NH4)3Zr(Hf)F7
917VOLUME 116 �

The separation of zirconium and hafnium from (NH4)3Zr(Hf)F7
0.1 mol/dm3 H2SO4. This trend has been observed in previousstudies – when increasing HCl above 6 mol/dm3 a similarincrease in extraction took place. (Banda et al., 2012; Porielet al., 2006)
When comparing the single (Figure 1 and Figure 2) and mixed salt (Figure 3 and Figure 4) extractions, bothcorrelations and differences become apparent. In HCl (Figure 1 and Figure 3), the same negligible extraction wasobserved above 1 mol/dm3 HCl. However, at 0.1 mol/dm3 theextraction with Aliquat 336 was >80% for single salts, whichis significantly higher than the 50% attained for mixed salts.No significant extraction was attained when using eitherAlamine 336 (where emulsion formation was observed above6 mol/dm3) or Uniquat 2280 when extracting mixed saltscompared to the >90% extraction achieved when using singlesalts. The differences in extractions for the variousextractants could be related to the fact that tertiary amines(Alamine 336) have a neutral charge, whereas quaternaryamines have a positive charge. The zirconium salt used forextraction ((NH4)3Zr(Hf)F7) probably has a negative chargein solution (Zr(Hf)F7
3-, or possibly Zr(Hf)F62-). In spite of
some protonation of the tertiary amine in the acidenvironment, it can be assumed that this will still be lesscharged than the quaternary amine where all extractantsremain positively charged irrespective of the acid concen-tration. Assuming the negatively charged Zr salt (ZrF6
2-
/ZrF73- anion) in solution, a higher extraction can be expected
with the quaternary amine due to its positive charge. Thisexpectation is corroborated in Figure 4 when comparing (a)(tertiary amines) and (b) (quaternary amine). While higherextraction for quaternary amine (Aliquat 336) occurred onlyabove 2 mol/dm3 H2SO4, higher extraction was observed withlower acid concentrations (>1 mol/dm3) for Alamine 336.This is preferential in view of the lower amount of acid used,which has both economic as well as environmentaladvantages
While most data correlates between the single and mixed salts, it is clear that the two salts influence eachother’s extractions, specifically at low HCl concentrations (<1 mol/dm3). While the competitive behaviour is influencedby the speciation, which due to its complexity falls beyondthe scope of this article, the changed extraction behaviour,specifically of Hf in the mixed salt, could be related to thechange in the Hf concentration from 100 ppm to 3 ppm fromthe single to the mixed salts. It was shown that Cl– at higherconcentrations in both the single and mixed salts inhibitsextraction. Hence, when the Hf concentration was decreasedfrom the single to the mixed salt experiments, the Cl to Hfratio increased, implying that at 3 ppm Hf the Cl-, even at lowHCl concentrations, was sufficiently in excess to inhibit theextraction of Hf. It remains, however, unclear why thiswould also result in such a significant decrease in the Zrextraction.
In H2SO4 (Figure 2 and Figure 4) mostly similartendencies for single and mixed salts were observedirrespective of the acid concentration (0.1–8 mol/dm3), whichagain confirms the role of the Cl- ion during extraction froman HCl environment. Some differences were observed; forexample, the Alamine 336 formed no emulsions during the
extractions with mixed salts while emulsions did occur whenusing single salts. A reason for this is not apparent. Inaddition, Aliquat 336 yielded 20% higher extraction from 1 mol/dm3 H2SO4, which increased gradually with theincrease in acid concentration with mixed salts. Uniquat2280, on the other hand, formed emulsions at 4 and 6 mol/dm3 (Figure 4c). Comparing the data with Figure 2b,where emulsions were formed only in the presence of Zr, itseems that the Zr is responsible for these emulsions (Nielsenet al., 2000).
According to the previous section, the best results for mixedsalts were attained when extracting from a low H2SO4
concentration using Alamine 336 as extractant (Figure 4).Accordingly, the influence of the extractant to metal (E/M)ratio was determined by changing the Alamine 336 concen-tration between 0.01–10 wt% at 0.01, 0.1 and 0.5 mol/dm3
H2SO4. Figure 5 illustrates the extraction behaviour of Zr and Hf
with increasing Alamine 336 concentration at three differentH2SO4 concentrations. Apart from yielding the best results inthe previous section, low concentrations of acids are alsomore cost-effective and leave a smaller chemical footprint. Itis interesting to note that the extraction curve with 0.01 and0.5 mol/dm3 H2SO4 has a near S-shape, while extraction at0.1 mol/dm3 first increases logarithmically (R2 = 0.9082)before levelling off. This might be related to the change inextraction between 0 and 1 mol/dm3 H2SO4 (shown in theinsert in Figure 4a) where the 0.01 mol/dm3 data point wasto the left of the inclining slope while the 0.5 mol/dm3 datapoint was to the right of the descending slope with 0.1mol/dm3 on the peak of the graph. This, however, onlyconfirms that there is a change in the speciation in thevicinity of 0.1 mol/dm3 H2SO4, but not what this changemight be. Irrespective of the variation in the shape of
�
918 VOLUME 116

thecurves, however, extraction increased in all cases withincreasing Alamine 336 concentration from 2 to 9 wt%.
An extraction of 92% was attained at 9 wt% Alamine 336 when extracting from 0.01 mol/dm3 H2SO4 and 87% at 10 wt% Alamine 336 when extracting from 0.1 mol/dm3
H2SO4. Extraction from 0.5 mol/dm3 H2SO4, while alsoincreasing with increasing extractant concentration, had thesmallest gradient, resulting in the lowest extraction reachinga maximum of 60% Zr and 41% Hf at 9 wt% Alamine 336. Inspite of the lower extraction, the experiment at 0.5 mol/dm3
was the only one that displayed any selectivity between thetwo metals, in this case favouring the extraction of Zr with a19% selectivity at 9 wt% Alamine 336.
In the work described in the previous sections the extractionswere optimized. In order to be able to reuse the extractantsfor subsequent extraction in a solvent extraction process, the
stripping of the metal complexes (Zr and Hf) from the loadedAlamine 336 has to be investigated. While stripping has beendemonstrated in the literature with various stripping liquors(Gefvert, 1994), in this study the best results were attainedwhen using NaCl and H2SO4 (Banda et al., 2012).
Figure 6 indicates the stripping of a loaded organic phaseattained by a 60-minute extraction from a 0.5 mol/dm3 H2SO4
solution using 9 wt% Alamine 336. The stripping liquorconcentrations were varied from 0–2 mol/dm3 for H2SO4 andNaCl. According to Figure 6, both stripping liquors achievedstripping of the Zr and Hf, with decreasing stripping withincreasing strippant concentration. However, when usingH2SO4 as stripping liquor, a 48% Hf selectivity was achievedat 2 mol/dm3. NaCl yielded favourable stripping results at 2mol/dm3 NaCl with a 46% Hf stripping and 0% Zr stripping.Although 2 mol/dm3 NaCl was not able to strip all the Hf, itdid result in a selective removal of Zr leaving pure Hf in theorganic phase, which can be stripped in a second strippingstep, for example using H2SO4.
Using the extraction and stripping data obtained in this studya possible scheme with various stages of extraction andstripping can be proposed (Figure 7), which ultimately couldlead to a process for the manufacturing of nuclear-grade Zr, if designed correctly. In the extraction step, the aqueous feed(0.5 mol/dm3 H2SO4) and the aqueous scrubbing liquor (2.0 mol/dm3 NaCl) are contacted with the organic solution(Alamine 336, 9 wt%) and the loaded organic solution.During this extraction an excess of Zr is extracted into theorganic phase. During the scrubbing of the loaded organicphase most of the remaining extracted Hf is scrubbed to theaqueous phase. Thereafter the Zr is stripped from the organicphase using 0.05 mol/dm3 H2SO4. Subsequently, the solventis regenerated, water being used to remove any residual Zr orHf from the organic phase. Finally, the depleted solvent isrecirculated to the solvent make-up where any lost extractantis replenished, completing the process.
The separation of zirconium and hafnium from (NH4)3Zr(Hf)F7
VOLUME 116 919 �

The separation of zirconium and hafnium from (NH4)3Zr(Hf)F7
A solvent extraction study was done to determine theextraction and separation of Zr and Hf as (NH4)3Zr(Hf)F7
from a HCl and H2SO4 environment (0.01–8 mol/dm3) usingthree amine-based extractants (Alamine 336, Aliquat 336and Uniquat 2280). While similar extractions were attainedfor single and mixed salts, both the Zr and Hf extractionswere significantly lower when using mixed salts at low HClconcentrations. Of the three amines tested, Alamine 336exhibited the best extraction and selectivity for the separationof Zr from Hf at both low (86%) and high (39%) H2SO4
concentrations. Varying the E/M ratio of Alamine 336 atthree low H2SO4 concentrations (0.01, 0.1 and 0.5 mol/dm3)led to a 19% selective extraction of Zr over Hf with 9 wt%Alamine 336 in 0.5 mol/dm3 H2SO4. Complete stripping of Zr and Hf from loaded Alamine 336 was achieved using 2 mol/dm3 NaCl. A proposed extraction, scrubbing andstripping scheme was presented showing the possibility forthe development of a process for the separation of Zr and Hffrom (NH4)3Zr(Hf)F7 in a H2SO4 environment using amine-based extractants such as Alamine 336. With the current datait is possible to purify Zr from 97% to 98.49%. By combiningfurther extraction, scrubbing and stripping steps, it should bepossible to reduce the Hf concentration to below 100 ppm asrequired by the nuclear industry.
This work was initiated by the Department of Science andTechnology (DST), South Africa under its Advanced MetalsInitiative (AMI). The Nuclear Energy Corporation of SouthAfrica (NECSA) (SOC) Ltd, due to existing expertise andinfrastructure, was entrusted to investigate the manufac-turing of the metals Zr and Hf, thereby establishing theNuclear Materials Development Network (NMDN) Hub of theAMI. The authors express thanks to the DST for the fundingof this project. We also would like to thank Dr S.J. Lötter fromNECSA for manufacturing the (NH4)3Zr(Hf)F7 salt used inthis study.
AMARAL, J.C., ROCHA, L.R. and MORAIS, C.A.D. 2013. Study of the separation of
zirconium and hafnium from nitric solutions by solvent extraction.
Proceedings of the International Nuclear Atlantic Conference - INAC,
Recife, Brazil, 24–29 November. Brazilian Nuclear Energy Association.
BANDA, R., LEE, H.Y. and LEE, M.S. 2012. Separation of Zr from Hf in
hydrochloric acid solution using amine-based extractants. Industrial and
Engineering Chemistry Research, vol. 51. pp. 9652–9660.
BARNABAS, F.A. and TREADWAY, J.L. 2010. Microemulsion or protomicroemulsion
cleaning composition with disrupting surfactants. US patent application
20100009888A1. January 14, 2010.
GEFVERT, D.L. 1994. Solvent extraction of precious metals with hydrox-
yquinoline and stripping with acidified thiourea. US patent application
975. 504 p.
JENNY, R., BOTZ, M.M., DIMITRIADIS, D., POLGLASE, T. and PHILLIPS, W. 2001.
Processes for the regeneration of cyanide from thiocyanate. Minerals and
Metallurgical Processing, vol. 18. pp. 126–132.
LI, H., NERSISYAN, H. H., PARK, K.-T., PARK, S.-B., KIM, J.-G., LEE, J.-M. and LEE,
J.-H. 2011. Nuclear-grade zirconium prepared by combining combustion
synthesis with molten-salt electrorefining technique. Journal of Nuclear
Materials, vol. 413. pp. 107–113.
NEL, J.T., RETIEF, W.L., HAVENGA, J.L., DU PLESSIS, W. and ROUX, J.P. 2014.
Treatment of chemical feedstocks. US patent application US
20140238195A1.
NIELSEN, R.H., SCHLEWITZ, J.H. and NIELSEN, H. 2000. Zirconium and Zirconium
Compounds. Kirk-Othmer Encyclopedia of Chemical Technology. Wiley.
OVERHOLSER, L.G., BARTON, C.J. and RAMSEY, J.W. 1960. Separation of hafnium
from zirconium. US patent application 301, 902.
PORIEL, L., FAVRE RÉGUILLON, A., PELLET ROSTAING, S. and LEMAIRE, M. 2006.
Zirconium and hafnium separation, part 1. Liquid/liquid extraction in
hydrochloric acid aqueous solution with Aliquat 336. Separation Science
and Technology, vol. 41. pp. 1927–1940.
PUROHIT, R. and DEVI, S. 1997. Determination of nanogram levels of zirconium
by chelating ion exchange and on-line preconcentration in flow injection
UV—visible spectrophotometry. Talanta, vol. 44. pp. 319–326.
SENOL, A. 2001. Extraction equilibria of nicotinic acid using Alamine 336 and
conventional solvents: effect of diluent. Chemical Engineering Journal,
vol. 83. pp. 155–163.
TAGHIZADEH, M., GHANADI, M. and ZOLFONOUN, E. 2011. Separation of zirconium
and hafnium by solvent extraction using mixture of TBP and Cyanex 923.
Journal of Nuclear Materials, vol. 412. pp. 334–337.
Tan, B., Luo, G. and Wang, J. 2007. Extractive separation of amino acid
enantiomers with co-extractants of tartaric acid derivative and Aliquat-
336. Separation and Purification Technology, vol. 53. pp. 330–336.
WANG, L.Y. and LEE, M. S. 2015. Separation of Zr and Hf from sulfuric acid
solutions with amine-based extractants by solvent extraction. Separation
and Purification Technology, vol. 142. pp. 83–89.
XU, L., XIAO, Y., VAN SANDWIJK, A., XU, Q. and YANG, Y. 2015. Production of
nuclear grade zirconium: a review. Journal of Nuclear Materials, vol. 466.
pp. 21–28.
YANG, X.J., FANE, A.G. and PIN, C. 2002. Separation of zirconium and hafnium
using hollow fibers: Part I. Supported liquid membranes. Chemical
Engineering Journal, vol. 88. pp. 37–44. �
�
920 VOLUME 116
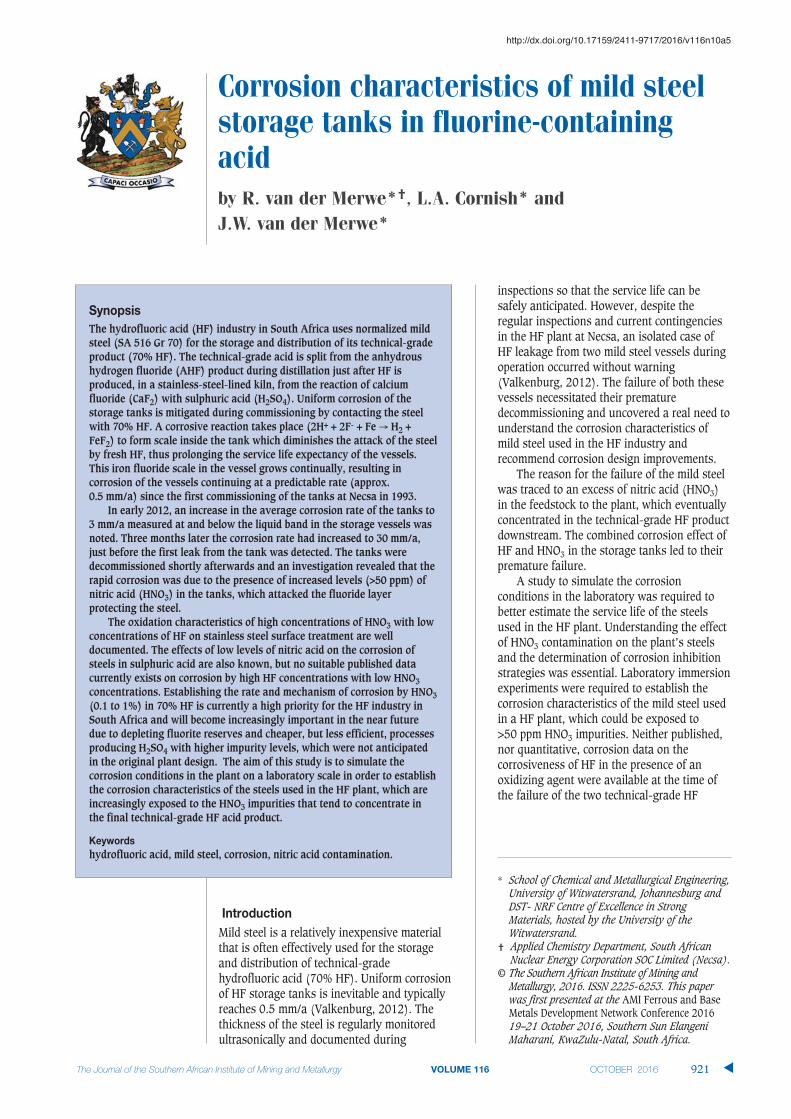
Mild steel is a relatively inexpensive materialthat is often effectively used for the storageand distribution of technical-gradehydrofluoric acid (70% HF). Uniform corrosionof HF storage tanks is inevitable and typicallyreaches 0.5 mm/a (Valkenburg, 2012). Thethickness of the steel is regularly monitoredultrasonically and documented during
inspections so that the service life can besafely anticipated. However, despite theregular inspections and current contingenciesin the HF plant at Necsa, an isolated case ofHF leakage from two mild steel vessels duringoperation occurred without warning(Valkenburg, 2012). The failure of both thesevessels necessitated their prematuredecommissioning and uncovered a real need tounderstand the corrosion characteristics ofmild steel used in the HF industry andrecommend corrosion design improvements.
The reason for the failure of the mild steelwas traced to an excess of nitric acid (HNO3)in the feedstock to the plant, which eventuallyconcentrated in the technical-grade HF productdownstream. The combined corrosion effect ofHF and HNO3 in the storage tanks led to theirpremature failure.
A study to simulate the corrosionconditions in the laboratory was required tobetter estimate the service life of the steelsused in the HF plant. Understanding the effectof HNO3 contamination on the plant’s steelsand the determination of corrosion inhibitionstrategies was essential. Laboratory immersionexperiments were required to establish thecorrosion characteristics of the mild steel usedin a HF plant, which could be exposed to >50 ppm HNO3 impurities. Neither published,nor quantitative, corrosion data on thecorrosiveness of HF in the presence of anoxidizing agent were available at the time ofthe failure of the two technical-grade HF
Corrosion characteristics of mild steelstorage tanks in fluorine-containingacidby R. van der Merwe*†, L.A. Cornish* and J.W. van der Merwe*
The hydrofluoric acid (HF) industry in South Africa uses normalized mildsteel (SA 516 Gr 70) for the storage and distribution of its technical-gradeproduct (70% HF). The technical-grade acid is split from the anhydroushydrogen fluoride (AHF) product during distillation just after HF isproduced, in a stainless-steel-lined kiln, from the reaction of calciumfluoride (CaF2) with sulphuric acid (H2SO4). Uniform corrosion of thestorage tanks is mitigated during commissioning by contacting the steelwith 70% HF. A corrosive reaction takes place (2H+ + 2F- + Fe H2 +FeF2) to form scale inside the tank which diminishes the attack of the steelby fresh HF, thus prolonging the service life expectancy of the vessels.This iron fluoride scale in the vessel grows continually, resulting incorrosion of the vessels continuing at a predictable rate (approx. 0.5 mm/a) since the first commissioning of the tanks at Necsa in 1993.
In early 2012, an increase in the average corrosion rate of the tanks to3 mm/a measured at and below the liquid band in the storage vessels wasnoted. Three months later the corrosion rate had increased to 30 mm/a,just before the first leak from the tank was detected. The tanks weredecommissioned shortly afterwards and an investigation revealed that therapid corrosion was due to the presence of increased levels (>50 ppm) ofnitric acid (HNO3) in the tanks, which attacked the fluoride layerprotecting the steel.
The oxidation characteristics of high concentrations of HNO3 with lowconcentrations of HF on stainless steel surface treatment are welldocumented. The effects of low levels of nitric acid on the corrosion ofsteels in sulphuric acid are also known, but no suitable published datacurrently exists on corrosion by high HF concentrations with low HNO3concentrations. Establishing the rate and mechanism of corrosion by HNO3(0.1 to 1%) in 70% HF is currently a high priority for the HF industry inSouth Africa and will become increasingly important in the near futuredue to depleting fluorite reserves and cheaper, but less efficient, processesproducing H2SO4 with higher impurity levels, which were not anticipatedin the original plant design. The aim of this study is to simulate thecorrosion conditions in the plant on a laboratory scale in order to establishthe corrosion characteristics of the steels used in the HF plant, which areincreasingly exposed to the HNO3 impurities that tend to concentrate inthe final technical-grade HF acid product.
hydrofluoric acid, mild steel, corrosion, nitric acid contamination.
* School of Chemical and Metallurgical Engineering,University of Witwatersrand, Johannesburg andDST- NRF Centre of Excellence in StrongMaterials, hosted by the University of theWitwatersrand.
† Applied Chemistry Department, South AfricanNuclear Energy Corporation SOC Limited (Necsa).
© The Southern African Institute of Mining andMetallurgy, 2016. ISSN 2225-6253. This paperwas first presented at the AMI Ferrous and BaseMetals Development Network Conference 201619–21 October 2016, Southern Sun ElangeniMaharani, KwaZulu-Natal, South Africa.
921VOLUME 116 �
http://dx.doi.org/10.17159/2411-9717/2016/v116n10a5

Corrosion characteristics of mild steel storage tanks in fluorine-containing acid
storage tanks at Necsa (Valkenburg, 2012). In the absence ofdata, to understand the effects of the different concentrationsand combinations of HF and HNO3, the only option was toreproduce the unique corrosive environment in a laboratory.The initial step was to develop a safe method for conductingimmersion corrosion tests using chemically pure HF. Theresults from these experiments would then be used as areference to compare the findings from future corrosion testswhere HNO3 contamination was introduced. Moreover, theselaboratory tests would serve to establish whether theapproach used was suitable for predicting the corrosion ratesof the steel tanks and components in the plant in its presentcondition.
To determine the necessary duration of typical HFcorrosion tests, planned interval corrosion tests (PICTs), as prescribed by Wachter and Treseder in ASTM Standard G31-72 (2004), needed to be conducted safely. This workhas been reported elsewhere (van der Merwe, Cornish andvan der Merwe, 2016). Since safety implications whenworking with fuming HF (>60% HF) were a concern, initiallythe PICTs were used to establish the lowest HF concentrationat which laboratory-scale tests could be conducted, whileproducing corrosion data that could be related to thecorrosive conditions experienced in industry. Next, corrosiontests using the most suitable conditions could continue inwhich the effect of HNO3 concentration would be the focus.However, the effect of HF concentration on mild steelcorrosion was also accessible from the PICT results, whichshowed that varying corrosion forms and mechanisms occurat different HF concentrations. These results differedsomewhat from published data (Craig and Anderson, 1994;Hansen and Puyear, 1996; Honeywell, 2002) and weretherefore examined further in this study.
The material was a mild steel (SA 516 Gr 70), used asconstruction material for 70% HF storage tanks. The steelwas initially hot-rolled to a thickness of 3 mm, then cut witha waterjet to produce coupons sized 25 × 25 × 3 mm. A 7 mmhole was cut in the middle of each coupon, which effectivelyproduced a surface area of 15.39 cm2. Therefore, a total offour coupons would be allowed to hang from the corrosion
rack during a 500 mL experiment, effectively exceeding theminimum ASTM target requirement of 30 mL/cm2 perimmersion experiment (Baboian, 2005). Coupons weresandblasted and washed with acetone to remove mill scaleprior to each experiment. All coupons were pre-passivated inHF for 24 hours at 25°C prior to each PICT. Pre-passivationwas done to produce the protective scale layer essential forthe use of mild steel in the HF industry (Jennings, 2007).
The HF used for the PICTs was aqueous hydrogenfluoride (70% industrial grade) collected from the PelchemSOC Ltd fluorochemical plant, situated on the site at Necsa.The 70% HF was a high-quality product (fluorosilicic acid100 ppm, sulphuric acid 200 ppm and nitric acid <5 ppm)
received in sealed 25 L bottles, which were intended forexport by Protea Chemicals (Inland). The lower concentrationHF solutions (40% and 48%) were analytical grade ([NO3
-]<5 ppm) solutions purchased from Merck (Pty) Ltd. Corrosionsolutions were analysed at Pelindaba Analytical Laboratories(PAL) using volumetric titrations and inductively coupledplasma optical emission spectrometry (ICP-OES) to determineHF and metal concentrations in corrosion solution products.
Each experiment was conducted in a 500 mL Teflon bottlewhich was placed in a water bath to maintain the acid at aconstant temperature while corrosion of the coupons tookplace (Figure 1a). The coupons were assembled into acylindrical rack (made of Teflon) which was placed upright inthe bottle (Figure 1b). The HF was then poured into the bottleuntil the cylindrical rack holding the coupons (Figure 1c) hadbeen completely covered. The bottle lid, with the 2 mmdiameter drilled hole, was then screwed on. This allowed forthe release of HF fumes in order to avoid pressure build-up inthe Teflon container. The temperature was maintained at25°C using an immersion cooler attached to thepolypropylene lid, custom-made to cover the bath and whichallowed the immersion cooler to hang freely in the waterwhile being shielded from HF fumes by a polypropylenecylinder attached to the lid (Figure 1a). The lid over the waterbath had a release valve in the open position, whichchannelled any HF fumes from the corrosion reaction to theextraction line of the fume cupboard, which led out to theKOH scrubber.
�
922 VOLUME 116

PICTs were allowed to run for periods of time experi-mentally determined by the planned interval tests of Wachterand Treseder in ASTM Standard G 31-72 (ASTM, 2009).Four coupons per bottle were introduced to a maximum of500 mL HF. Subsequently, one coupon was removed from thecorrosion rack at a specified time; this continued over theentire duration of a corrosion experiment, until all couponshad been removed. This was done to establish the metalsamples’ susceptibility to corrosion, the liquid’s corrosivenessand the rate of the corrosion reaction under the simulatedconditions. Following this standard method, the fourthcoupon (B) was placed into the HF corrosion solution at thesame time that the second coupon (At) was removed andallowed to corrode with the third coupon (At + 1) for theremaining four days. In this way, comparing the corrosionrate measured for coupons 3 and 4, a change in the liquidcorrosiveness could be compared to the criteria set out in theASTM practice. In the same way, the susceptibility of the mildsteel to the HF corrosion solution was determined bycomparing the corrosion rate determined for coupon B to thatof coupon A2 (Tables I–III). The mass loss for coupon A2 wasdetermined by subtracting the mass losses of coupons At andAt-1 and the corrosion rate determined using the averagedensity of the coupons in that batch (e.g. coupon 1–4 inTable I).
Each time a coupon was removed from the bottle, it wasrinsed with water and air-dried before storage in a desiccator.After testing, the corrosion products were removed from thecoupons by ultrasonic cleaning for 30 minutes, followed bymechanical cleaning with a steel brush to ensure completeremoval of the scale from the coupon prior to weighing. Tocalculate the corrosion rate (CR) in mm/a from metal loss thefollowing equation was used:
CR = 87.6 x (W/ At) [1]
where W = weight loss (in mg), = density (in g/cm3), A =area (in cm2) of the coupons exposed to HF over time (inhours) based on ASTM Standard G31-72 (2004). Theconvention is to measure corrosion rate in mils penetrationper year (MPY) (Jones, 1996). However, the constant (in thiscase K = 87.6) is dimensionless and changes with theconversion to the desired unit (in this case mm/a) (Davis andASM International, 2000).
In the PICTs, identical coupons were placed in the sameHF solution in the 500 mL Teflon bottle. The temperaturewas kept constant at 25ºC for the entire time (t + 1). Thesymbols A1, At, At+1 and B were used to represent thecorrosion damage experienced in each test (ASTM, 2009).Subsequently, A2 was calculated by subtracting At from At +1.
The data collected from the tests at different HF concen-trations is shown in Tables I–IV and Figures 2–3.
When HF contacts mild steel, a corrosive reaction takesplace:
2H+ + 2F– + Fe → H2 + FeF2 [2]
whereby scale forms on the surface of the steel and inhibitsfurther attack of the steel (Hansen and Puyear, 1996). Sincethis pre-passivation technique is applied in industry byallowing the storage tanks to be corroded by HF and HFfumes for 24 hours before commissioning (Jennings, 2007),the coupons in the PICT experiments were pre-passivated torepresent the starting condition of the steel used incalculating the mass loss in each case. Equation [1] was usedto calculate apparent density and the nominal density of 7.85g/cm3 for mild steel was used throughout the study.
Corrosion characteristics of mild steel storage tanks in fluorine-containing acid
923VOLUME 116 �
Table I
1) A1 0–1 5.03 152.22) At 0–4 5.63 42.63) At + 1 0–8 6.04 22.84) B 4–8 0.524 4.0Calc. A2 4–8 0.407 3.1
3.1 mm/a < 4.0 mm/a < 152.2 mm/a Liquid corrosiveness: Decreased
Therefore: A2 < B < A1 Susceptibility to corrosion: Decreased
Table II
1) A1 0–1 6.06 183.12) At 0–4 5.54 41.83) At + 1 0–8 6.12 23.14) B 4–8 1.01 7.6Calc. A2 4–8 0.58 4.4
4.4 mm/a < 7.6 mm/a < 183.1 mm/a Liquid corrosiveness: Decreased
Therefore: A2 < B < A1 Susceptibility to corrosion: Decreased

Corrosion characteristics of mild steel storage tanks in fluorine-containing acid
Honeywell Fluorine Products (Honeywell InternationalInc., 2014) is an HF supplier that documented the propertiesof HF to make technical and safety-related literature openlyavailable in order to ensure safe usage of their products.From this literature, corrosion rates for carbon steel againstHF concentration were provided and reported in MILS peryear (1 MIL = 0.0254 mm). The values for average corrosionof mild steel were converted so that apparent corrosion ratesfrom PICT tests measured after 192 hours could be compared(Figure 4).
From the corrosion tests conducted with both 40% and 48%HF, the criteria set in ASTM Standard practice G 31-72indicated that the corrosion rate for the calculated A2 value
�
924 VOLUME 116
Table IV
Visual appearance of Pitting corrosion visible. Severe attack of entire sample No visible corrosion. coupons after cleaning Excessive corrosion after 8 days. surface over entire period of test. Clean surface.
(Figure 7, coupon 3) (Figure 8, coupons 1–3) (Figure 9, coupons 1–4)
Colour of corrosion solution Dark brown Dark brown Colourless
Appearance of precipitate Light brown (FeF2) Light brown (FeF2) None
Composition of final 38.1% HF 46.7% HF 68.6% HFcorrosion solution 1.98% Fe 0.71% Fe 0.0164% Fe
Table III
1) A1 0–1 0.07 2.12) At 0–4 0.20 1.53) At + 1 0–8 0.32 1.24) B 4–8 0.20 1.5Calc. A2 4–8 0.12 0.9
0.9 mm/a < 1.5 mm/a < 2.1 mm/a Liquid corrosiveness: Decreased
Therefore: A2 < B < A1 Susceptibility to corrosion: Decreased
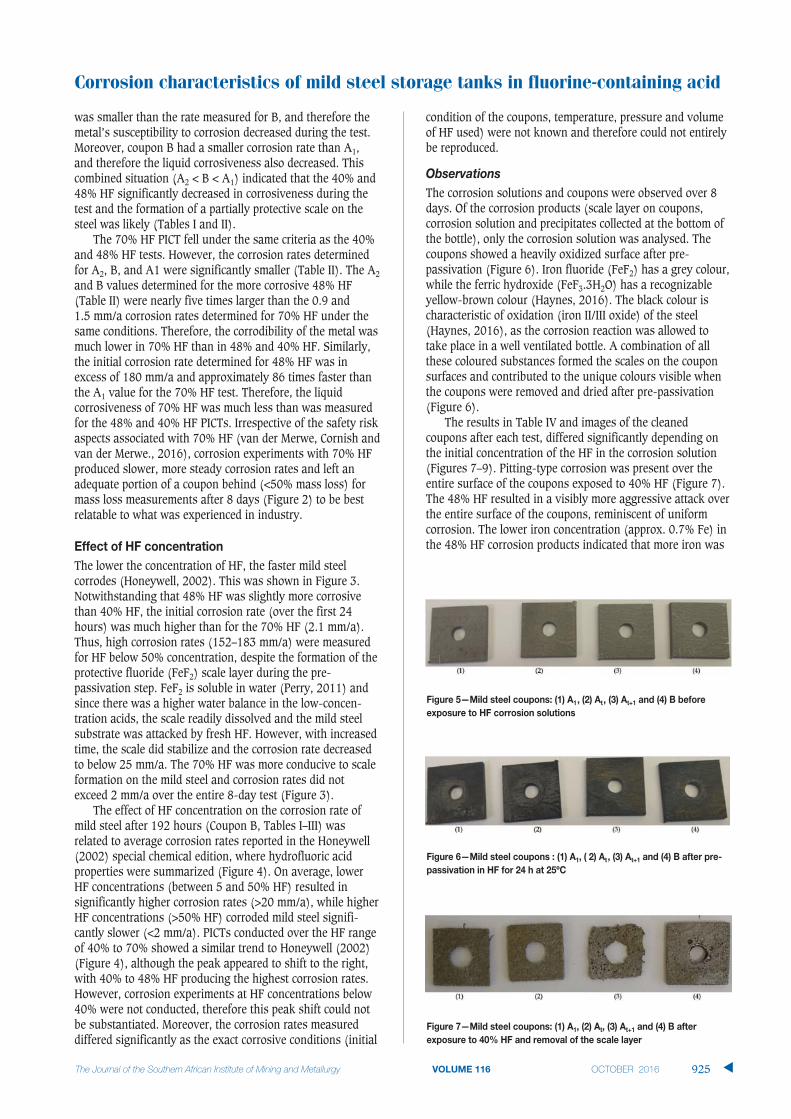
was smaller than the rate measured for B, and therefore themetal’s susceptibility to corrosion decreased during the test.Moreover, coupon B had a smaller corrosion rate than A1,and therefore the liquid corrosiveness also decreased. Thiscombined situation (A2 < B < A1) indicated that the 40% and48% HF significantly decreased in corrosiveness during thetest and the formation of a partially protective scale on thesteel was likely (Tables I and II).
The 70% HF PICT fell under the same criteria as the 40%and 48% HF tests. However, the corrosion rates determinedfor A2, B, and A1 were significantly smaller (Table II). The A2
and B values determined for the more corrosive 48% HF(Table II) were nearly five times larger than the 0.9 and 1.5 mm/a corrosion rates determined for 70% HF under thesame conditions. Therefore, the corrodibility of the metal wasmuch lower in 70% HF than in 48% and 40% HF. Similarly,the initial corrosion rate determined for 48% HF was inexcess of 180 mm/a and approximately 86 times faster thanthe A1 value for the 70% HF test. Therefore, the liquidcorrosiveness of 70% HF was much less than was measuredfor the 48% and 40% HF PICTs. Irrespective of the safety riskaspects associated with 70% HF (van der Merwe, Cornish andvan der Merwe., 2016), corrosion experiments with 70% HFproduced slower, more steady corrosion rates and left anadequate portion of a coupon behind (<50% mass loss) formass loss measurements after 8 days (Figure 2) to be bestrelatable to what was experienced in industry.
The lower the concentration of HF, the faster mild steelcorrodes (Honeywell, 2002). This was shown in Figure 3.Notwithstanding that 48% HF was slightly more corrosivethan 40% HF, the initial corrosion rate (over the first 24hours) was much higher than for the 70% HF (2.1 mm/a).Thus, high corrosion rates (152–183 mm/a) were measuredfor HF below 50% concentration, despite the formation of theprotective fluoride (FeF2) scale layer during the pre-passivation step. FeF2 is soluble in water (Perry, 2011) andsince there was a higher water balance in the low-concen-tration acids, the scale readily dissolved and the mild steelsubstrate was attacked by fresh HF. However, with increasedtime, the scale did stabilize and the corrosion rate decreasedto below 25 mm/a. The 70% HF was more conducive to scaleformation on the mild steel and corrosion rates did notexceed 2 mm/a over the entire 8-day test (Figure 3).
The effect of HF concentration on the corrosion rate ofmild steel after 192 hours (Coupon B, Tables I–III) wasrelated to average corrosion rates reported in the Honeywell(2002) special chemical edition, where hydrofluoric acidproperties were summarized (Figure 4). On average, lowerHF concentrations (between 5 and 50% HF) resulted insignificantly higher corrosion rates (>20 mm/a), while higherHF concentrations (>50% HF) corroded mild steel signifi-cantly slower (<2 mm/a). PICTs conducted over the HF rangeof 40% to 70% showed a similar trend to Honeywell (2002)(Figure 4), although the peak appeared to shift to the right,with 40% to 48% HF producing the highest corrosion rates.However, corrosion experiments at HF concentrations below40% were not conducted, therefore this peak shift could notbe substantiated. Moreover, the corrosion rates measureddiffered significantly as the exact corrosive conditions (initial
condition of the coupons, temperature, pressure and volumeof HF used) were not known and therefore could not entirelybe reproduced.
The corrosion solutions and coupons were observed over 8days. Of the corrosion products (scale layer on coupons,corrosion solution and precipitates collected at the bottom ofthe bottle), only the corrosion solution was analysed. Thecoupons showed a heavily oxidized surface after pre-passivation (Figure 6). Iron fluoride (FeF2) has a grey colour,while the ferric hydroxide (FeF3.3H2O) has a recognizableyellow-brown colour (Haynes, 2016). The black colour ischaracteristic of oxidation (iron II/III oxide) of the steel(Haynes, 2016), as the corrosion reaction was allowed totake place in a well ventilated bottle. A combination of allthese coloured substances formed the scales on the couponsurfaces and contributed to the unique colours visible whenthe coupons were removed and dried after pre-passivation(Figure 6).
The results in Table IV and images of the cleanedcoupons after each test, differed significantly depending onthe initial concentration of the HF in the corrosion solution(Figures 7–9). Pitting-type corrosion was present over theentire surface of the coupons exposed to 40% HF (Figure 7).The 48% HF resulted in a visibly more aggressive attack overthe entire surface of the coupons, reminiscent of uniformcorrosion. The lower iron concentration (approx. 0.7% Fe) inthe 48% HF corrosion products indicated that more iron was
Corrosion characteristics of mild steel storage tanks in fluorine-containing acid
VOLUME 116 925 �

Corrosion characteristics of mild steel storage tanks in fluorine-containing acid
present in the solid scale layer and precipitate compared tothe 40% test (approx. 2% Fe). Therefore, in the 48% HF test,the HF was forming more scale on the coupon surface whichbroke off and fell to the bottom of the reaction bottle,allowing HF to uniformly attack the freshly exposed steelsurface and form scale to repeat the corrosion process (Figure8). In contrast, the corrosion mechanism in the 40% HF wasa visible pitting action (Figure 7), which penetrated throughthe passivation scale and aggressively kept corroding underthe scale previously formed, resulting in the highest massloss over the entire period (Figure 3).
No scales were found at the bottom of the Teflon bottlesof the 70% HF tests and the colour of the corrosion solutionsremaining almost unchanged from the initial HF introduced(Table IV). The iron concentration analysed in the corrosionsolution was less than 0.02%, with little HF being consumedover the entire test period (<1.5% HF). Here, the scale layerformed during the pre-passivation (Figure 9) succeeded inprotecting the mild steel from further corrosion and produceda surface visibly free from corrosion, once the scale had beenbrushed off (Figure 9).
Corrosion results on SA 516 Gr 70 normalized mild steelindicated that HF concentrations below 48% were capable ofproducing corrosion rates above 180 mm/a. Conversely, thesteel coupons placed in 70% HF corroded significantly slower(<2 mm/a after 8 days) and the corrosion rates were moreclosely related to those experienced in industry.
The Department of Science and Technology and the NationalResearch Foundation are thanked for financial support. TheSouth African Nuclear Energy Corporation Ltd. is thanked fortime allowed for completing this article, as well as the NuclearMaterials (NM) and the Organic Fluorine Chemistry (OFC)sections within the Applied Chemistry (AC) department, inthe Research and Development Division at Necsa, for the useof their facilities.
ANDERSEN, T.N., VANORDEN, N. and SCHLITT, W.J. 1980. Effects of nitrogen oxides,
sulfur dioxide, and ferric ions on the corrosion of mild steel in concen-
trated sulfuric acid. Metallurgical Transactions A,vol. 11, no. 8.
pp. 1421–1428.
ASTM. 2009. G 31–72, standard practice for laboratory immersion corrosion
testing of metals. Annual Book of ASTM Standards. ASTM International,
West Conshohocken, USA.
BABOIAN, R. 2005. Corrosion tests and standards: application and interpretation.
ASTM International, West Conshohocken, USA.
NICKEL DEVELOPMENT INSTITUTE. 1988. Cleaning and descaling stainless steels.
Designers’ Handbook Series. Toronto.
CRAIG, B.D. and ANDERSON, D.S. 1994. Handbook of Corrosion Data. ASM
International, Materials Park, Ohio, USA.
DAVIS, J.R. and ASM INTERNATIONAL (eds). 2000. Corrosion: Understanding the
Basics. ASM International, Materials Park, Ohio, USA.
HANSEN, D.A. and PUYEAR, R.B. 1996. Materials Selection for Hydrocarbon and
Chemical Plants. CRC Press, New York, USA.
HAYNES, W.M. 2016. CRC Handbook of Chemistry and Physics, 94th edn. CRC
Press.
Honeywell. 2002. Hydrofluoric acid properties. http://www3.imperial.ac.uk/pls/
portallive/docs/1/7276108.PDF [accessed 10 May 2016].
HONEYWELL INTERNATIONAL INC. 2014. Honeywell hydrofluoric acid.
https://www.honeywell-hfacid.com/literature/ [accessed 3 July 2016].
JENNINGS, H. 2007. Materials for storing and handling commercial grades of
aqueous hydrofluoric acid and anhydrous hydrogen fluoride (no. 24057).
NACE International Publication 5A171 (2007 edn). Houston, TX.
JONES, D.A. 1996. Principles and Prevention of Corrosion. 2nd edn. Prentice
Hall, Upper Saddle River, NJ, USA.
PERRY, D.L. 2011. Handbook of Inorganic Compounds. 2nd edn. CRC Press,
Sound Parkway, USA.
VALKENBURG, E.G. 2012. HF ISO tanks corrosion evaluation. Confidential
internal report: Part 1: PCM-OPSA60-REP-12007. Pelchem SOC Ltd,
Pelindaba, South Africa.
VAN DER MERWE, R., CORNISH, L.A. and VAN DER MERWE, J.W. 2016. Corrosion
safety risk assessment for testing in hydrofluoric acid. [African Corrosion
Journal, in press}. �
�
926 VOLUME 116

Previous work conducted by Mintek(Couperthwaite et al., 2013, 2015)investigated the effect of precious metaladditions on the structure, oxidation andcorrosion properties of an Fe-40 at.% Al (Fe-Al) alloy. Initial work determined thatadditions of more than 0.5 at.% precious metaldid not improve the oxidation and corrosionproperties of the materials and in some caseseven decreased the resistance to corrosion.Further work identified Pt and Ru as beneficialadditions to the FeAl alloy. Four alloys werethen produced by mechanical alloying andsintering (FeAl–0.2 at.% Pd, FeAl–0.2 at.% Ru,FeAl–0.5 at.% Ag, FeAl–0.5 at.% Pt). Thesealloys were all successfully produced bymelting and casting and mechanical alloyingsintering and it was found that the non-equilibrium processing greatly decreased thegrain size of the materials compared to the as-cast materials. It was found that the additionsof Ru and Pt were still the most beneficial tothe oxidation and corrosion properties, withRu being considered the most beneficial.
This report details the results from theinitial spray testing work done with the FeAl–0.2 at.% Ru alloy powder produced bymechanical alloying. There are several optionsfor powder coating onto substrates; thermal-spray techniques, which include high-velocityoxy-fuel (HVOF) coating and plasma coating,or cold-spray (also known as supersonic-spray) techniques. Cold-spray techniques haveattracted a lot of interest lately and as a systemis available at University of the Witwatersrand,it was decided to use cold spraying in thecurrent work. This work was done todetermine the effectiveness of cold-spraycoating of these mechanically alloyed powders.
The iron-aluminium system has attracted alarge amount of research due to the fact thatFe-Al intermetallic compounds possess goodmechanical properties, along with low densityand low cost, as well as easy access to the rawmaterials (Ji et al., 2006; Montealegre et al.,2000). Arzhnikov et al. (2008) found that theFe-Al alloys are promising, due to their goodrefractoriness, oxidation and corrosionresistance and good ductility at roomtemperature. In comparison to conventionalalloys, Fe-Al alloys perform much better athigher temperatures, due to the stability of the
Cold-spray coating of an Fe-40 at.% Alalloy with additions of rutheniumby R.A. Couperthwaite*, L.A. Cornish†‡ and I.A. Mwamba*
In previous work by the authors, it was established that additions of 0.2 at.% Ru to an Fe-40 at.% Al alloy improved the corrosion andoxidation resistance of the alloy. The alloy was produced by mechanicalalloying and spark plasma sintering and the work showed that non-equilibrium processing was able to significantly refine the grain size of thematerial. The sintered material had a higher hardness than the as-castmaterial and the change in grain size did not significantly affect theoxidation and corrosion. In the present research, the mechanically alloyedpowder was coated onto a mild steel substrate using cold-spray coating ata gas pressure of 10 bar and a temperature of 500°C. The coatings werefound to be 5–10 m thick, although thicknesses of up to 30 m wereobserved. The coated materials were subjected to oxidation and corrosiontests to determine the effectiveness of the coating in increasing theoxidation and corrosion resistance of mild steel. This was done todetermine the effectiveness of cold-spray coating as a technique to coatthese mechanically alloyed powders.
Fe-Al alloy, mechanical alloying, cold-spray coating, addition, corrosionresistance.
* Advanced Materials Division, Mintek, Randburg,South Africa.
† School of Chemical and Metallurgical Engineering,University of the Witwatersrand, Johannesburg,South Africa.
‡ Centre of Excellence in Strong Materials,University of the Witwatersrand, Johannesburg,South Africa.
© The Southern African Institute of Mining andMetallurgy, 2016. ISSN 2225-6253. This paperwas first presented at the AMI Ferrous and BaseMetals Development Network Conference 201619–21 October 2016, Southern Sun ElangeniMaharani, KwaZulu-Natal, South Africa.
927VOLUME 116 �
http://dx.doi.org/10.17159/2411-9717/2016/v116n10a6

Cold-spray coating of an Fe-40 at.% Al alloy with additions of ruthenium
microstructure originating from the low diffusivity of Fe in Al(Nayak et al., 2010). However, the Fe-Al alloys are difficultto fabricate in bulk, due to their poor castability andworkability (Zhu et al., 2009); this was confirmed by Kuc etal. (2009) who found that Fe-Al alloys have an activationenergy for deformation of 484.9 kJ/mol compared to 392kJ/mol for austenitic steel. The region of interest in thecurrent study is the Fe-Al intermetallic compound at around60 at.% Fe (Figure 1), which is a single-phase bcc region(Eelman et al., 1998).
During mechanical alloying, fine particles are cold-weldedtogether to form larger particles. Once the particles becometoo large, the milling process breaks them into smallerparticles. These two processes continue until the powder hasa single uniform composition.
Several studies exist on the processing of Fe-Al alloys bymechanical alloying and mostly the conditions of the millingwere different. Nayak et al. (2010) used toluene as a processcontrol agent (PCA) and full solid solution of Fe in Al wasfound after 20 hours’ milling at 300 r/min. It was also foundthat the hardness had improved, due to the nanocrystallineFe4Al13 intermetallic compound formed, the absence of thesoft Al phase and the large number of defects induced duringmechanical alloying. Skoglund et al. (2004) produced an Fe-40 at.% Al alloy by milling with a stearic acid PCA for 4hours at 360 r/min and created an alloy containing mostlyFeAl with some Fe3Al. Song et al. (2009) worked on a nearlyequiatomic Fe-Al alloy and milled the powders for 3 to 12hours at 304 r/min with ethanol as the PCA. After milling,the powder was annealed at 1100°C in a vacuum. Theirresults indicated that FeAl had not formed by the end of the12 hours of milling, but that FeAl was formed in the powderafter annealing. Abhik et al. (2008) found that it waspossible to produce FeAl after 10 hours of milling withtoluene as a PCA. Shi et al. (2008) investigated the stages in
which the alloy forms during the mechanical alloying process.They milled the powders for a total of 50 hours and foundthat initially the powder formed a solid solution of Al in Feand as milling time increased, the phase changed to the B2FeAl phase. After 30 hours of milling the powder consisted ofonly B2 FeAl.
Another critical parameter that was varied greatly in inthese studies was the ball to powder ratio. Ratios from as lowas 4:1 (Skoglund et al., 2003) to as high as to 15:1 (Kezraneet al., 2012), 20:1 (Cheng et al., 2006), 30:1 (Ko, 2010) and50:1 (Haghighi et al., 2010) were used, although mostresearchers used a ball-to-powder ratio of 8:1 (Krasnowski etal., 2002, 2006; D’Angelo et al., 2009; Abhik et al., 2008).
Research has already been done on the production of ananocrystalline coating of the Fe-40Al alloy using spraycoating (Grosdidier, 2001), which successfully created acoating with a nanocrystalline grain structure with the millingstructure of the feed powders retained in the final coating.There was a problem with the presence of some oxides anddepletion of the aluminium content as a result of the thermalspraying. Valdrè et al. (1999) and Skoglund et al. (2003)found that there was oxygen in the final compacts aftermechanical alloying and this was attributed to oxygenpresent in the aluminium feed powder. Several researchteams have successfully created nanocrystalline FeAlmaterials through mechanical alloying, with crystallite sizesof 10 nm (Valdrè et al., 1999) and 23 nm (D’Angelo et al.,2009, Krasnowski and Kulik, 2007a, 2007b).
During oxidation testing of Fe-Al alloys a ’wrinkling’ of theoxide layer has been observed. All binary Fe-Al alloysexperience this effect when subjected to oxidation at temper-atures of 900–1100°C (Yang et al., 2005). This wrinklingeffect has been attributed to high thermal stresses duringcooling of the alloy (Montealegre et al., 2000) and it was
�
928 VOLUME 116

suggested that slow cooling retarded, or even completelyprevented, the effect. Xu et al. (2001) found that adding Y tothe Fe-Al alloys can reduce or prevent the wrinkling andspallation of the oxide layer. Xu et al. (2000) investigated thereasons for the weaker oxidation resistance of Fe-Al alloys inair compared to pure oxygen and found that at 1100°C in air,the Fe-Al alloys produced a mixed layer of Al2O3 and AlNbetween the outer Al2O3 layer and the metal
Guo et al. (2011) found that an Fe-Al coating applied to a316 stainless steel substrate formed a good bond with thesubstrate and imparted good oxidation resistance to themetal, due to the formation of a dense and adherent oxidefilm. Nowak and Kupka (2012) investigated the oxidation ofan Fe-Al alloy with additions of B, Cr and Zr and found thatthe stable -Al2O3 oxide layer started forming at around900°C. Below this temperature, unstable - and -type oxidesformed. Grabke (1999) concluded that although FeAlcontains a high percentage of aluminium, it does not have asgood an oxidation resistance as would be expected, due tothe formation of transient oxide forms at temperatures below1000°C.
However, Paldey et al. (2003) found that an FeAl coatingon 440C stainless steel reduced the mass gain duringoxidation tests at 800°C by four times and the same coatingon a 304 stainles steel reduced the mass gain by an order ofmagnitude. Airiskallio et al. (2010) and Xu et al. (2000)found that additions of Cr (Airiskallio et al., 2010) or acombination of Y and Zr (Xu et al., 2000) to the alloy helpedthe oxidation resistance, although additions of only Zrdecreased the oxidation resistance (Xu et al., 2000).
Cold-spray coating is a technique that was first developed inthe mid-1980s. This technique utilizes temperatures signifi-cantly below the melting point of the metal being coated –
typically below 1000°C (Concustell et al., 2015). In order toachieve deposition of the material it is necessary to use veryhigh impact velocities and as a result, cold-spray systemsalso use very high gas pressures (Grigoriev et al., 2015).Recently, there has been increased interest shown in cold-spray coatings and numerous materials have been used ascoatings. Some of these materials and the conditions for thecoating work are shown in Table I.
Several authors found that cold-spraying of the powdersmaintained the powder microstructure in the sprayed coating(Jan et al., 2015; Luo and Li, 2012). It was also found thatcold-spraying was able to produce coatings with lessoxidation that thermal spraying processes (Concustell et al.,2015; Aghasibeig et al., 2016). As shown in Table I, theparameters for the spray coating vary significantly, even forthe targeted Fe-Al alloys.
The milling was done on a Retsch PM100 milling machinewith a stainless steel milling pot and stainless steel balls oftwo sizes (Table II). The milling was done for the entire time
Cold-spray coating of an Fe-40 at.% Al alloy with additions of ruthenium
929VOLUME 116 �
Table I
Fe-Cr-Si-B-C 40 700–900 30–50 Concustell et al., 2015304L 23.1–27.9 550 22 Coddet, Verdy, Coddet, Debray, et al., 2015Ag-Cu 23–30 500 20 Coddet, Verdy, Coddet and Debray 2015Fe-40 at.% Al 30–40 800–1000 - Cinca et al., 2015TiO2 9 600 - Buhl et al., 2015Ni 30–50 800–1000 25 Aghasibeig et al., 2016Ti-Al 15 300 - Jan et al., 2015Ni-Al 15 300 - Jan et al., 2015Fe-Al 15 300 - Jan et al., 2015Cu 40–50 300–600 - Jakupi et al., 2015TiO2 30–40 300–900 60 Herrmann-Geppert et al., 2016Al 25–40 300–400 10-50 Henao et al., 2016NiCrAl\BN 22 650 20 Luo and Li, 2015Fe-40 at.% Al 25 550 20 Luo Li, 2012Al 30 500 - Kim et al., 2015Ni 38–40 650–750 40–50 Koivuluoto et al., 2015NiCu 38–40 650–750 40–-50 Koivuluoto et al., 2015NiCu\Al2O3 38–40 650–750 40–50 Koivuluoto et al., 2015Ti-6Al-4V 28 520 30 Li et al., 2007Ti 28 520 30 Li et al., 2007Al 28 520 30 Li et al., 2007FeAl\Al2O3 20 500 20 Wang, Li et al., 2008FeAl 20–25 350 20 Wang, Li et al., 2008FeAl 20–25 510 15 Yang et al., 2011
Table II
Ball to powder ratio 10:1 Process control 0.5agent (wt.%)
Ball mass (g) 500 g (20 mm) + Speed (r/min) 300500 g (10 mm)
Powder sample 100 Milling time (h) 24mass (g)

Cold-spray coating of an Fe-40 at.% Al alloy with additions of ruthenium
period specified, with no interval. The selected PCA wasstearic acid. Powder mixing, as well as the filling and sealingof the milling pots was done in a glovebox under an argonatmosphere to reduce oxygen entrapment.
After milling of the powders, an annealing treatment wasperformed to ensure that the powder was of a single phase.This annealing was done in a horizontal tube furnace underan argon atmosphere to prevent oxidation of the powders.Annealing conditions are shown in Table III.
Cold spraying was done on a Centreline SSTTM Series P cold-spray system using compressed air as the carrier gas. Severalruns were conducted in order to determine the optimumparameters for the coating. The conditions for the variousruns are shown in Table IV. Run 6 was a repeat of run 5 inorder to have a second sample prepared in the same way foruse in corrosion testing. The Fe-Al alloy was coated onto amild steel substrate.
After these trial runs were completed, two more sampleswere coated. These samples were coated on all sides usingthe conditions in run 6, in order to be used later forconducting oxidation testing on the coatings. The gun wasmoved over the surface of the substrate blocks to ensure aneven coating of the substrate.
Coated samples as well as an uncoated substrate sample wereweighed and then placed in a muffle furnace. The furnacewas heated at 10°C per minute to a temperature of 1000°C.The temperature was then kept constant for 48 hours, afterwhich the heating was turned off and the samples wereallowed to cool in the furnace to room temperature. Sampleswere then removed, weighed, sectioned and mounted foranalysis. The samples were wrapped with copper tape prior topreparation.
During the characterization of the coatings, it was found thatthe initial run of powder had been contaminated with nickeland as a result the coatings were a mix of FeAl, NiAl andNi3Al. This contaminated material will be referred to asFe/Ni-Al. The samples were still characterized fully and theoxidation testing was done on the material as well todetermine whether the addition of nickel to the mechanicallyalloyed material had any effect on the properties of thecoating. Figure 2 shows the cross-section of the coating fromRun 6 of the trial coating runs (two coating passes). Thecoating was quite thin, in the region of 3 m and has a slighttwo-tone contrast in it showing the different phases in thecoating material. The cross-section of the sample coatedusing five passes (run 7) is shown in Figure 3. After fivepasses the coating has not built up in any significant way, asthe thickness was still at around 3 m. The contrast in thecoating showing the different phases was still visible.
A second run of powder was produced and care wastaken to ensure that the feed powders were not contaminated.This correct alloy will be referred to as FeAl. This batch wascoated onto the substrate using only the conditions for runs 6and 7. The cross-sections of the sample coated with two and
�
930 VOLUME 116
Table IV
Temperature (°C) 400 500 500 500 500 500 500Pressure (bar) 9.65 9.65 9.65 10 10 10 10Standoff distance (mm) 10 10 10 10 10 10 10Feed rate (%) 40 40 60 40 40 40 40No. of passes 1 1 1 1 2 2 5
Table III
Value 10 550 2 200

five passes are shown in Figures 4 and 5. The coatings didnot differ significantly from the Ni-containing coatings interms of thickness. However, the different contrasts seen inthe Ni-containing coatings were not observed.
With both powder lots, the thickness of the coatingsobtained is a concern as it would have been preferable tohave coatings of at least 10 m in thickness. There are anumber of factors that could be changed to influence this,one being the spray pressure during coating. Unfortunatelythe system utilized for the spray coating had a maximumpressure limit of 10 bar. Another option would be to increasethe temperature used in the spray coating to the upper limitof around 800–1000°C. The third and final option would beto investigate the use of another coating technique such ashigh-velocity oxy-fuel (HVOF) or plasma-spray coating.
The weights of the samples before and after the oxidationtreatment as well as the percentage mass increase are shownin Table V. All samples showed an increase in mass,indicating that they were oxidized. The percentage weightgain of all the samples was not significantly different and assuch the coatings applied to the samples were not effective inpreventing the oxidation of the mild steel.
The oxidized samples were cold-mounted, carbon coatedand analysed on the SEM. As expected from the mass gain ofthe samples during the oxidation trial, all the samplesshowed significant oxide on the surface of the substrates.The oxides were too thick to be observed in a single SEMimage and so only a small portion of each oxide layer isshown in the images. EDX analysis did not reveal any Al inthe oxide layer, even at the very edge of the layer. As aresult, it could not be determined whether the coating wasstill intact on top of the oxide layer for the two coatedsamples (Figure 6–8).
The compositions of the oxide layers were analysed bySEM-EDX (Table VI). The composition was found to beconsistent with the oxidation of the mild steel substrate. The
Cold-spray coating of an Fe-40 at.% Al alloy with additions of ruthenium
VOLUME 116 931 �
Table V
Mild steel 78.534 84.501 7.6Fe/Ni-Al 127.919 138.228 8.1FeAl 122.906 131.452 7.0

Cold-spray coating of an Fe-40 at.% Al alloy with additions of ruthenium
oxide layers showed two contrasting regions, light and darkand these were analysed on the uncoated sample todetermine whether a significant difference existed. It wasfound that there was a slightly higher oxygen content in thedark regions; however, the difference was not hugelysignificant. No evidence of the coatings was found on theoxidized samples, indicating that the coatings wereineffective at protecting the substrate.
Cold-spray coating of the samples produced very thincoatings on the samples, around 3–5 m. This is significantly
thinner than expected and it would be preferable to have acoating thickness of 10 m or greater. There are a number ofoptions available for improving the deposition efficiency ofthe cold-spray process. The first and likely most effectiveoption, would be to increase the pressure used during thespraying. Alternatively, it may be necessary to change thecoating technique and rather use HVOF, or plasma-spraycoating. The oxidation trial of the coated samples confirmedthat the coating was not sufficient to protect the substratefrom oxidation, as all samples oxidized significantly duringthe trial. Considering the performance of the coating materialin oxidation trials as a bulk sintered material, it is possiblethat the coating was too thin, not uniform enough, or slightlyporous and so allowed oxygen to penetrate to the surface ofthe substrate.
Cold-spray coating was used successfully to coat the mechan-ically alloyed powders onto a substrate. However, at thepressures used in this study, the coatings applied to thesubstrates were very thin. This resulted in a coating that wasnot effective at preventing the oxidation of the mild steel
�
932 VOLUME 116
Table VI
O 42.4±0.6 49.4±0.8 44.9±0.1 44.5±0.4 45.4±0.9
Mn 1.1±0.2 0.6±0.1 0.9±0.1 1.0±0.1 1.0±0.1
Fe 56.5±0.6 48.8±2.0 54.2±0.2 54.5±0.3 53.6±0.9
Cu 1.3±2.2

substrates when exposed to high temperatures. As such, itwill be necessary to investigate whether a higher pressurecan be used in the coating process, as well as the use ofalternative coating methods.
ABHIK, N.C., VIVEK, R., UDHAYABANU, V. and MURTY, B.S. 2008. Influence of heat
of formation of B2/L12 intermetallic compounds on the milling energy for
their formation during mechanical alloying. Journal of Alloys and
Compounds, vol. 465, no. 1–2. pp. 106–112.
AGHASIBEIG, M., MONAJATIZADEH, H., BOCHER, P., DOLATABADI, A., WUTHRICH, R. and
MOREAU, C. 2016. Cold spray as a novel method for development of nickel
electrode coatings for hydrogen production. International Journal of
Hydrogen Energy, vol. 41, no. 1. pp. 227–238.
AIRISKALLIO, E., NURMI, E., HEINONEN, M.H., VÄYRYNEN, I.J., KOKKO, K., ROPO, M.
and VITOS, L. 2010. High temperature oxidation of Fe–Al and Fe–Cr–Al
alloys: The role of Cr as a chemically active element. Corrosion Science,
vol. 52, no. 10. pp. 3394–3404.
ARZHNIKOV, A.K., DOBYSHEVA, L.V. and TIMIRGAZIN, M.A. 2008. Formation and
ordering of local magnetic moments in Fe–Al alloys. Journal of Magnetism
and Magnetic Materials, vol. 320, no, 13. pp. 1904–1908.
BUHL, S., SCHMIDT, K., SAPPOK, D., MERZ, R., GODARD, C., KERSCHER, E. and
RIPPERGER, S. 2015. Surface structuring of case hardened chain pins by
cold-sprayed microparticles to modify friction and wear properties.
Particuology, vol. 21. pp. 32–40.
CHENG, X., OUYANG, Y., SHI, H., ZHONG, X., DU, Y. and TAO, X. 2006. Nano-
amorphous (FeAl)1−xZrx alloys prepared by mechanical alloying. Journal
of Alloys and Compounds, vol. 421, no. 1–2. pp. 314–318.
CINCA, N., LIST, A., GÄRTNER, F., GUILEMANY, J.M. and KLASSEN, T. 2015. Influence
of spraying parameters on cold gas spraying of iron aluminide
intermetallics. Surface and Coatings Technology, vol. 268. pp. 99–107.
CODDET, P., VERDY, C., CODDET, C. and DEBRAY, F. 2015. Effect of cold work,
second phase precipitation and heat treatments on the mechanical
properties of copper–silver alloys manufactured by cold spray. Materials
Science and Engineering: A, vol. 637. pp. 40–47.
CODDET, P., VERDY, C., CODDET, C., DEBRAY, F., and LECOUTURIER, F. 2015.
Mechanical properties of thick 304L stainless steel deposits processed by
He cold spray. Surface and Coatings Technology, vol. 277. pp. 74–80.
CONCUSTELL, A., HENAO, J., DOSTA, S., CINCA, N., CANO, I.G. and GUILEMANY, J.M.
(2015). On the formation of metallic glass coatings by means of Cold Gas
Spray technology. Journal of Alloys and Compounds, vol. 651.
pp. 764–772.
COUPERTHWAITE, R.A. and MWAMBA I.A. 2013. Effect of platinum group metal
additions on the oxidation behaviour of Fe-40at.% Al. Proceedings of the
AMI 2013 Precious Metals Conference, ISBN 978-1-920410-51-3.
pp. 307–316
COUPERTHWAITE, R.A., CORNISH, L.A., MWAMBA, I.A. and PAPO, M.J. 2015. Effect of
Processing Route on the Microstructure and Properties of an Fe-al Alloy
with Additions of Precious Metal. Materials Today: Proceedings, vol. 2,
no. 7. pp. 3932–3942.
D’ANGELO, L., D’ONOFRIO, L. and GONZALEZ, G. 2009. Nanophase intermetallic
FeAl obtained by sintering after mechanical alloying. Journal of Alloys and
Compounds, vol. 483, no. 1–2. pp. 154–158.
EELMAN, D., DAHN, J., MACKAY, G. and DUNLAP, R. 1998. An investigation of
mechanically alloyed Fe–Al. Journal of Alloys and Compounds, vol. 266,
no. 1–2. pp. 234–240.
EHTEMAM HAGHIGHI, S., JANGHORBAN, K. and IZADI, S. 2010. Order-sintering of
mechanically alloyed FeAl nanostructures. Journal of Alloys and
Compounds, vol. 503, no. 2. pp. 375–379.
GRABKE, H. 1999. Oxidation of NiAl and FeAl. Intermetallics, vol. 7, no. 10.
pp. 1153–1158.
GRIGORIEV, S., OKUNKOVA, A., SOVA, A., BERTRAND, P. and SMUROV, I. 2015. Cold
spraying: From process fundamentals towards advanced applications.
Surface and Coatings Technology, vol. 268. pp. 77–84.
GROSDIDIER, T., TIDU, A. and LIAO, H.-L. 2001. Nanocrystalline Fe-40Al coating
processed by thermal spraying of milled powder. Scripta Materialia,
vol. 44, no. 3. pp. 387–393.
GUO, P., SHAO, Y., ZENG, C., WU, M. and LI, W. 2011. Oxidation characterization
of FeAl coated 316 stainless steel interconnects by high-energy micro-arc
alloying technique for SOFC. Materials Letters, vol. 65, no. 19–20.
pp. 3180–3183.
HENAO, J., CONCUSTELL, A., G.CANO, I., DOSTA, S., CINCA, N., GUILEMANY, J.M. and
SUHONEN, T. 2016. Novel Al-based metallic glass coatings by Cold Gas
Spray. Materials & Design, vol. 94. pp. 253–261.
HERRMANN-GEPPERT, I., BOGDANOFF, P., EMMLER, T., DITTRICH, T., RADNIK, J.,
KLASSEN, T. and SCHIEDA, M. 2016. Cold gas spraying – A promising
technique for photoelectrodes. Catalysis Today, vol. 260. pp. 140–147.
JAKUPI, P., KEECH, P.G., BARKER, I., RAMAMURTHY, S., JACKLIN, R.L., SHOESMITH,
D.W. and MOSER, D.E. 2015. Characterization of commercially cold sprayed
copper coatings and determination of the effects of impacting copper
powder velocities. Journal of Nuclear Materials, vol. 466. pp. 1–11.
JAN, V., ČUPERA, J. and CIZEK, J. 2015. On the search for producing intermetallics
by diffusion reaction of cold spray bulk deposits. Surface and Coatings
Technology, vol. 268. pp. 216–223.
JI, G., GORAN, D., BERNARD, F., GROSDIDIER, T., GAFFET, E. and MUNIR, Z.A. 2006.
Structure and composition heterogeneity of a FeAl alloy prepared by one-
step synthesis and consolidation processing and their influence on grain
size characterization. Journal of Alloys and Compounds, vol. 420,
no. 1–2. pp. 158–164.
KEZRANE, M., GUITTOUM, A., BOUKHERROUB, N., LAMRANI, S., and SAHRAOUI, T.
2012. Mössbauer and X-ray diffraction studies of nanostructured
Fe70Al30 powders elaborated by mechanical alloying. Journal of Alloys
and Compounds, vol. 536. pp. S304–S307.
Cold-spray coating of an Fe-40 at.% Al alloy with additions of ruthenium
VOLUME 116 933 �

Cold-spray coating of an Fe-40 at.% Al alloy with additions of ruthenium
KIM, K., LI, W. and GUO, X. 2015. Detection of oxygen at the interface and its
effect on strain, stress, and temperature at the interface between cold
sprayed aluminum and steel substrate. Applied Surface Science, vol. 357.
pp. 1720–1726.
KO, I.-Y., JO, S.-H., DOH, J.-M., YOON, J.-K. and SHON, I.-J. 2010. Rapid consoli-
dation of nanostructured FeAl compound by high frequency induction
heating and its mechanical properties. Journal of Alloys and Compounds,
vol. 496, no. 1–2. pp. L1–L3.
KOIVULUOTO, H., BOLELLI, G., MILANTI, A., LUSVARGHI, L. and VUORISTO, P. 2015.
Microstructural analysis of high-pressure cold-sprayed Ni, NiCu and
NiCu+Al2O3 coatings. Surface and Coatings Technology, vol. 268.
pp. 224–229.
KRASNOWSKI, M., GRABIAS, A. and KULIK, T. 2006. Phase transformations during
mechanical alloying of Fe–50% Al and subsequent heating of the milling
product. Journal of Alloys and Compounds, vol. 424, no. 1–2.
pp. 119–127.
KRASNOWSKI, M. and KULIK, T. 2007a. Nanocrystalline FeAl intermetallic
produced by mechanical alloying followed by hot-pressing consolidation.
Intermetallics, vol. 15, no. 2. pp. 201–205.
KRASNOWSKI, M. and KULIK, T. 2007b. Nanocrystalline FeAl matrix composites
reinforced with TiC obtained by hot-pressing consolidation of mechan-
ically alloyed powders. Intermetallics, vol. 15, no. 10. pp. 1377–1383.
KRASNOWSKI, M., WITEK, A. and KULIK, T. 2002. The FeAl–30%TiC nanocom-
posite produced by mechanical alloying and hot-pressing consolidation.
Intermetallics, vol. 10, no. 4. pp. 371–376.
KUC, D., NIEWIELSKI, G. and BEDNARCZYK, I. 2009. Structure and plasticity in hot
deformed FeAl intermetallic phase base alloy. Materials Characterization,
vol. 60, no. 10. pp.1185–1189.
LI, W.-Y., ZHANG, C., WANG, H.-T., GUO, X.P., LIAO, H.L., LI, C.-J. and CODDET, C.
2007. Significant influences of metal reactivity and oxide films at particle
surfaces on coating microstructure in cold spraying. Applied Surface
Science, vol. 253, no. 7. pp. 3557–3562.
LUO, X.-T. and LI, C.-J. 2012. Dual-scale oxide dispersoids reinforcement of Fe–
40at.%Al intermetallic coating for both high hardness and high fracture
toughness. Materials Science and Engineering: A, vol. 555. pp. 85–92.
LUO, X.-T. and LI, C.-J. 2015. Large sized cubic BN reinforced nanocomposite
with improved abrasive wear resistance deposited by cold spray. Materials
and Design, vol. 83. pp. 249–256.
MASSALSKI, T.B. 1990. Binary Alloy Phase Diagrams, 2nd edn. vol. 1, ASM
International. pp. 148–149.
MONTEALEGRE, M.A., GONZÁLEZ-CARRASCO, J.L., MORRIS-MUÑOZ, M.A., CHAO, J. and
MORRIS, D.G. 2000. The high temperature oxidation behaviour of an ODS
FeAl alloy. Intermetallics, vol. 8, no. 4. pp. 439–446.
NAYAK, S.S., WOLLGARTEN, M., BANHART, J., PABI, S.K. and MURTY, B.S. 2010.
Nanocomposites and an extremely hard nanocrystalline intermetallic of
Al–Fe alloys prepared by mechanical alloying. Materials Science and
Engineering: A, vol. 527, no. 9. pp. 2370–2378.
PALDEY, S. and DEEVI, S.C. 2003. Cathodic arc deposited FeAl coatings:
properties and oxidation characteristics. Materials Science and
Engineering: A, vol. 355, no. 1–2. pp. 208–215.
SHI, H., GUO, D. and OUYANG, Y. 2008. Structural evolution of mechanically
alloyed nanocrystalline FeAl intermetallics. Journal of Alloys and
Compounds, vol. 455, no. 1–2. pp. 207–209.
SKOGLUND, H., KNUTSON WEDEL, M. and KARLSSON, B. 2003. The role of oxygen in
powder processing of FeAl. Intermetallics, vol. 11, no. 5. pp. 475–482.
SKOGLUND, H., WEDEL, M.K. and KARLSSON, B. 2004. Processing of fine-grained
mechanically alloyed FeAl. Intermetallics, vol. 12, no. 7–9. pp. 977–983.
SONG, H., WU, Y., TANG, C., YUAN, S., GONG, Q. and LIANG, J. 2009. Microstructure
and mechanical properties of FeAl intermetallics prepared by mechanical
alloying and hot-pressing. Tsinghua Science and Technology, vol. 14,
no. 3. pp. 300–306.
VALDRÈ, G., BOTTON, G. and BROWN, L. 1999. High spatial resolution PEELS
characterization of FeAl nanograins prepared by mechanical alloying. Acta
Materialia, vol. 47, no. 7. pp. 2303–2311.
WANG, H.-T., LI, C.-J., YANG, G.-J. and LI, C.-X. 2008a. Effect of heat treatment
on the microstructure and property of cold-sprayed nanostructured
FeAl/Al2O3 intermetallic composite coating. Vacuum, vol. 83,
no. 1. pp. 146–152.
WANG, H.-T., LI, C.-J., YANG, G.-J. and LI, C.-X. 2008b. Cold spraying of Fe/Al
powder mixture: Coating characteristics and influence of heat treatment
on the phase structure. Applied Surface Science, vol. 255, no. 5.
pp. 2538–2544.
XU, C., GAO, W. and GONG, H. 2000. Oxidation behaviour of FeAl intermetallics.
The effects of Y and/or Zr on isothermal oxidation kinetics. Intermetallics,
vol. 8, no. 7. pp. 769–779.
XU, C.-H., GAO, W. and HE, Y.-D. 2000. High temperature oxidation behaviour
of FeAl intermetallics—oxide scales formed in ambient atmosphere.
Scripta Materialia, vol. 42, no. 10. pp. 975–980.
XU, C.-H., GAO, W. and LI, S. 2001. Oxidation behaviour of FeAl intermetallics –
the effect of Y on the scale spallation resistance. Corrosion Science, vol. 43,
no. 4. pp. 671–688.
YANG, G.-J., WANG, H.-T., LI, C.-J. and LI, C.-X. 2011. Effect of annealing on the
microstructure and erosion performance of cold-sprayed FeAl intermetallic
coatings. Surface and Coatings Technology, vol. 205, no. 23-24.
pp. 5502–5509.
YANG, Z.-G. and HOU, P.Y. 2005. Wrinkling behavior of alumina scales formed
during isothermal oxidation of Fe–Al binary alloys. Materials Science and
Engineering: A, vol. 391, no. 1–2. pp. 1–9.
ZHU, X., YAO, Z., GU, X., CONG, W. and ZHANG, P. 2009. Microstructure and
corrosion resistance of Fe-Al intermetallic coating on 45 steel synthesized
by double glow plasma surface alloying technology. Transactions of
Nonferrous Metals Society of China, vol. 19, no. 1. pp. 143–148. �
�
934 VOLUME 116

Metal injection moulding (MIM) is a near-net-shape manufacturing process established as analternative to produce complex small-to-medium shaped components that werepreviously fabricated by conventional methodsat higher costs (Attia and Alcock, 2011; Toddand Sidambe, 2013).
Although recent advances in micro-manufacturing (mainly machining andelectrodeposition-based) have enabled thefabrication of complex micro-size geometriesdirectly into miniaturized parts, theseprocesses are generally neither routine noreasily accessible at present (Attia and Alcock,2011).
Typically, the MIM process consists of foursteps: mixing, injection moulding, debindingand sintering. Mixing involves blending of thedesired metal powder composition withcarefully selected multicomponent organicbinders at the right proportion. This mixture,which is called feedstock, is then injected intoa mould of a required shape to form a ‘greenpart’. Debinding is the removal of the bindersby chemical, thermal, or catalytic means whilemaintaining the shape of the part. Finally, thedebound part is sintered to a full or near-fulldensity part (Sotomayor, Varez and Levenfeld,2010). The MIM process is essentially a
combination of plastic injection moulding withconventional powder metallurgy technologies.
According to the literature (German andRose, 1997; Khakbiz, Simchi and Bagheri,2005; Seerane et al., 2013), the mechanicalproperties of the final MIM-producedcomponents are certainly influenced in thefabrication stages in the MIM processing, aswell as by the selection of the starting powderand binder materials. Therefore,understanding the powder characteristics iscritical for the success of the MIM process.
Powder particle sizes (German and Rose,1997; German, 2005) play a significant role inrealizing a dense sintered part at the minimumshrinkage (Ma et al., 2014; Sotomayor et al.,2010). Finer powder particles result in smallermoulding defects, increase melt viscosity,higher sintering rates and shrinkage andbetter surface finish. However, some of thedisadvantages encountered with the use offiner particles include agglomeration, whichadversely affects the homogeneity of thefeedstock, necessitating longer debindingtimes and higher powder procurement cost.Coarser powder particles, in contrast, givehigher packing efficiency, reduced sinteringshrinkage rates, shorter debinding times andare typically cheap and easy to handle, but theproduct quality is often inferior (Bose et al.,2008; German, 1992; Hausnerova, Kitano andSaha, 2010).
The influence of particle size distributionon mouldability of the feedstock is also acrucial factor in the chain of the MIM process(Amin, Jamaludin and Muhamad, 2009). Two
The influence of particle sizedistribution on the properties of metal-injection-moulded 17-4 PH stainlesssteelby M. Seerane*, P. Ndlangamandla† and R. Machaka*
Metal injection moulding (MIM) is a near-net-shaping powder metallurgytechnique suitable for the cost-effective mass production of small andcomplex components. In this paper, the effects of the metal powder particlesize on the final properties of 17-4 PH stainless steel are reported. Threedifferent particle sizes (d50 33.0, 7.91 and 4.04 μm) were used to preparethe injectable MIM feedstocks using a CSIR-developed wax-based bindersystem at a fixed solids loading of 60 vol.%. The distribution slopeparameter and the rheological flow index behaviour were used to predictthe flowability of the feedstocks. The effects of the particle size on MIMproducts were established. The results are discussed in terms of thesubsequent microstructural and mechanical properties of MIM 17-4 PHstainless steel against the established MPIF Standard 35.
metal injection moulding, MIM, particle size distribution, 17-4 PH stainlesssteel, densification, properties.
* Light Metals, Materials Science andManufacturing, Council for Scientific andIndustrial Research, Pretoria, South Africa.
† Department of Materials Science and MetallurgicalEngineering, University of Pretoria, South Africa.
© The Southern African Institute of Mining andMetallurgy, 2016. ISSN 2225-6253. This paperwas first presented at the AMI Ferrous and BaseMetals Development Network Conference 201619–21 October 2016, Southern Sun ElangeniMaharani, KwaZulu-Natal, South Africa.
935VOLUME 116 �
http://dx.doi.org/10.17159/2411-9717/2016/v116n10a7

The influence of particle size distribution on the properties of metal-injection
parameters that are used to predict the mouldability of thefeedstock are the distribution slope parameter (Sw) and flowbehaviour index (n). The former parameter represents themeasure of particle size range and is defined as (German andBose, 1997):
[1]
where the numerator represents the fact that d10 and d90 are2.56 standard deviations apart on a Gaussian distribution;however, powders usually follow a lognormal distributionand the logarithmic size is appropriate for obtaining Gaussianbehaviour. The average particle size, d50 and Sw are importantmeasures of a powder. The parameter Sw is the slope of thelognormal cumulative distribution and is similar to acoefficient of variation or standard deviation. A narrowparticle size distribution is implied by larger values of Sw anda wider distribution corresponds to small values of Sw.Powders that exhibit a Sw of 2 (very broad distributions) areeasier to mould, while some more difficult powders to mouldexhibit Sw values between 4 and 5. A very narrow particlesize distribution with Sw greater than 7 is the most difficult tomould.
The flow behaviour index (n value) indicates thesensitivity of the feedstock’s viscosity to shear rate variations(Ahn et al., 2009); smaller values (typically less than 1)indicating higher shear sensitivity and more pseudo-plasticityof the feedstock and hence better viscosity response to shearrate changes. For such feedstocks, mould filling is thereforeeasier, especially at higher shear rates. Amin et al. (2009)concluded that fine particles exhibit low n values and thusgreater pseudo-plastic behaviour of the feedstock. It isimportant that the n value for each feedstock is calculated inorder to predict the mouldability. The following rheologyequation is used to estimate the values of n (Huang, Liangand Qu, 2003):
[2]
where is the viscosity of the feedstock and K a constant.The slope of the log versus log
.graph is n – 1, from which
n can be deduced.There has been a limited amount of work on the effects of
particle size and particle size distribution on the mouldabilityand sinterability of MIM powders. Most work available(Bricout et al., 2013; González-Gutiérrez, Stringari and Emri,2012; Mannschatz, Muller and Moritz, 2011;Schwartzwalder, 1949) puts considerable emphasis on theinfluence of particle shape, tailored particle size distribution
and powder loading on the flowability of MIM feedstock andhence the final mechanical properties of the sintered parts.Mamen et al. ( 2015), however, studied the effect of particlesize on the sintering behaviour of tungsten parts produced byMIM, but failed to report on the mechanical properties of theirsintered parts. The present work is a study of the influence ofthe starting powder particle size on the mechanical properties(tensile strength, hardness and density and shrinkagefactors) of metal-injection-moulded 17-4 PH stainless steelparts.
The 17-4 PH stainless steel powder materials: -45 m Grade630 (Praxair Surface Technologies), -15 m and -5 m(Epson Atmix Corp., JP) were used for this study. Figure 1shows the sizes and spherical morphologies of the metalpowders as observed under the JEOL JSM–6510 scanningelectron microscope (SEM).
Table I summarizes the size distributions of the metalparticles obtained using a laser-scattering particle sizeanalyser (Microtrac Bluewave). The material codes PS-45,PS-15 and PS-5 represent the particle sizes -45 m, -15 mand -5 m respectively.
Table II shows the chemical compositions of the metalpowders obtained from the supplier’s materials data specifi-cation sheets.
�
936 VOLUME 116
Table I
PS-45 12.3 33.0 50.3PS-15 2.65 7.91 23.1PS-5 1.98 4.04 7.90
Table II
FE-276-3 1.0 4.0 16.0 3.0 0.25 Bal.17-4 PH ≤ 0.5 ≤ 0.3 3.0–5.0 15.5–17.5 3.0–5.0 0.15–0.45 Bal.
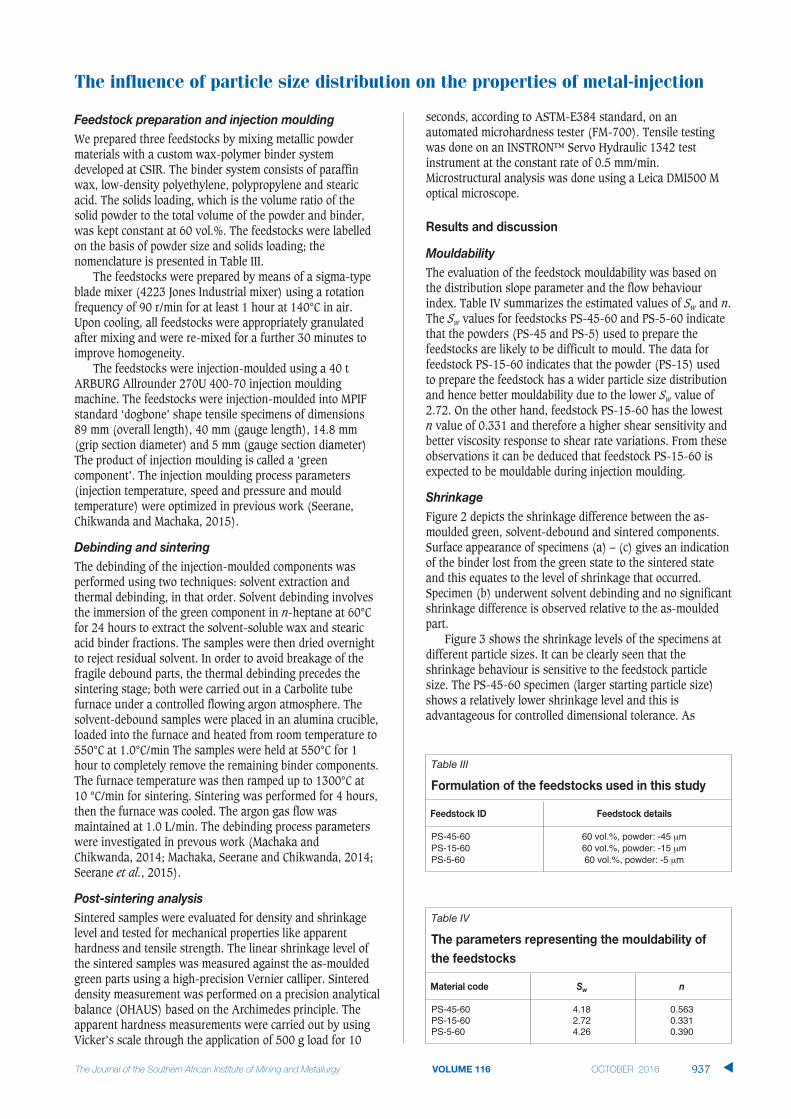
We prepared three feedstocks by mixing metallic powdermaterials with a custom wax-polymer binder systemdeveloped at CSIR. The binder system consists of paraffinwax, low-density polyethylene, polypropylene and stearicacid. The solids loading, which is the volume ratio of thesolid powder to the total volume of the powder and binder,was kept constant at 60 vol.%. The feedstocks were labelledon the basis of powder size and solids loading; thenomenclature is presented in Table III.
The feedstocks were prepared by means of a sigma-typeblade mixer (4223 Jones Industrial mixer) using a rotationfrequency of 90 r/min for at least 1 hour at 140°C in air.Upon cooling, all feedstocks were appropriately granulatedafter mixing and were re-mixed for a further 30 minutes toimprove homogeneity.
The feedstocks were injection-moulded using a 40 tARBURG Allrounder 270U 400-70 injection mouldingmachine. The feedstocks were injection-moulded into MPIFstandard ‘dogbone’ shape tensile specimens of dimensions 89 mm (overall length), 40 mm (gauge length), 14.8 mm(grip section diameter) and 5 mm (gauge section diameter)The product of injection moulding is called a ‘greencomponent’. The injection moulding process parameters(injection temperature, speed and pressure and mouldtemperature) were optimized in previous work (Seerane,Chikwanda and Machaka, 2015).
The debinding of the injection-moulded components wasperformed using two techniques: solvent extraction andthermal debinding, in that order. Solvent debinding involvesthe immersion of the green component in n-heptane at 60°Cfor 24 hours to extract the solvent-soluble wax and stearicacid binder fractions. The samples were then dried overnightto reject residual solvent. In order to avoid breakage of thefragile debound parts, the thermal debinding precedes thesintering stage; both were carried out in a Carbolite tubefurnace under a controlled flowing argon atmosphere. Thesolvent-debound samples were placed in an alumina crucible,loaded into the furnace and heated from room temperature to550°C at 1.0°C/min The samples were held at 550°C for 1hour to completely remove the remaining binder components.The furnace temperature was then ramped up to 1300°C at 10 °C/min for sintering. Sintering was performed for 4 hours,then the furnace was cooled. The argon gas flow wasmaintained at 1.0 L/min. The debinding process parameterswere investigated in prevous work (Machaka andChikwanda, 2014; Machaka, Seerane and Chikwanda, 2014;Seerane et al., 2015).
Sintered samples were evaluated for density and shrinkagelevel and tested for mechanical properties like apparenthardness and tensile strength. The linear shrinkage level ofthe sintered samples was measured against the as-mouldedgreen parts using a high-precision Vernier calliper. Sintereddensity measurement was performed on a precision analyticalbalance (OHAUS) based on the Archimedes principle. Theapparent hardness measurements were carried out by usingVicker’s scale through the application of 500 g load for 10
seconds, according to ASTM-E384 standard, on anautomated microhardness tester (FM-700). Tensile testingwas done on an INSTRON™ Servo Hydraulic 1342 testinstrument at the constant rate of 0.5 mm/min.Microstructural analysis was done using a Leica DMI500 Moptical microscope.
The evaluation of the feedstock mouldability was based onthe distribution slope parameter and the flow behaviourindex. Table IV summarizes the estimated values of Sw and n.The Sw values for feedstocks PS-45-60 and PS-5-60 indicatethat the powders (PS-45 and PS-5) used to prepare thefeedstocks are likely to be difficult to mould. The data forfeedstock PS-15-60 indicates that the powder (PS-15) usedto prepare the feedstock has a wider particle size distributionand hence better mouldability due to the lower Sw value of2.72. On the other hand, feedstock PS-15-60 has the lowestn value of 0.331 and therefore a higher shear sensitivity andbetter viscosity response to shear rate variations. From theseobservations it can be deduced that feedstock PS-15-60 isexpected to be mouldable during injection moulding.
Figure 2 depicts the shrinkage difference between the as-moulded green, solvent-debound and sintered components.Surface appearance of specimens (a) – (c) gives an indicationof the binder lost from the green state to the sintered stateand this equates to the level of shrinkage that occurred.Specimen (b) underwent solvent debinding and no significantshrinkage difference is observed relative to the as-mouldedpart.
Figure 3 shows the shrinkage levels of the specimens atdifferent particle sizes. It can be clearly seen that theshrinkage behaviour is sensitive to the feedstock particlesize. The PS-45-60 specimen (larger starting particle size)shows a relatively lower shrinkage level and this isadvantageous for controlled dimensional tolerance. As
The influence of particle size distribution on the properties of metal-injection
937VOLUME 116 �
Table III
PS-45-60 60 vol.%, powder: -45 mPS-15-60 60 vol.%, powder: -15 mPS-5-60 60 vol.%, powder: -5 m
Table IV
PS-45-60 4.18 0.563PS-15-60 2.72 0.331PS-5-60 4.26 0.390

The influence of particle size distribution on the properties of metal-injection
expected, the PS-15-60 and PS-5-60 specimens (smallerparticle size) exhibit higher shrinkage levels. The latter resultis expected, since smaller particles have a larger specificsurface area, necessitating a larger amount of binder whichtherefore increases the shrinkage level during sintering(Hartwig et al., 1998). PS-15-60 and PS-5-60 specimens donot show a significant difference in their shrinkage levels;however, the PS-5-60 specimen indicates a slightly loweraverage shrinkage level and this can be attributed to thepresence of an oxidation film on the surface of the particlesthat delays sintering rate and hence shrinkage.
Sintered MIM parts are expected to have some residualporosity and usually have densities ranging from 95–99% ofthe theoretical density (Todd and Sidambe, 2013). It isknown in powder metallurgy that finer starting powderparticles have better sinterability and therefore tend toachieve relatively higher sintered densities. However, againstexpectations, the data in Figure 4 seems to indicate that anoptimal sintered density is between 94% and 97% of thetheoretical density. Specimen PS-15-60 has the highestdensity of 97%, which conforms to the range quoted in theliterature. According to German(1992), for example, thelower density of the specimen PS-5-60 may be the result ofparticle agglomeration that leads to poor packing density andnon-homogeneous feedstock; and hence deteriorated sinter-ability. In addition, finer powder particles are more prone tosurface oxidation (Ye, Liu and Hong, 2008) and this mayhinder the sinterability of the localized particles. The highersintered density of the specimen PS-15-60 can be attributedto a combination of the best mouldability of PS-15-60feedstock (as shown in Table IV) and the finer startingpowder particles to drive sintering.
To complement the sintered density observation, Figure 5shows the microstructures of the sintered specimens. It canbe seen that the finer the starting powder particle size thefiner the observed pores are, in general. Specimen PS-45-60shows, as expected, relatively larger pores that are not partic-ularly uniformly distributed. Specimens PS-15-60 and PS-5-60, on the other hand, shows abundant and uniformly
�
938 VOLUME 116
(a) (b) (c)

distributed fine pores. However, a few large pores onspecimen PS-15-60 can be seen. It is possible that the sum ofuniformly distributed fine pores in the PS-5-60 specimencompromises sinterability.
Figure 6 summarizes the measured mechanical properties ofthe sintered parts and the respective as-sintered 17-4PHstainless steel minimum MPIF Standard 35 specifications(MPIF, 2007).
The experimentally measured properties of the PS-45-60specimen, as presented in Figure 6, are consistently inferiorto the minimum tensile property values outlined in the MPIFStandard 35. The PS-5-60 and the PS-15-60 specimens meetmost of the minimum standards for density, yield strength,ultimate tensile strength, hardness and elongation. However,the PS-15-60 specimen fails to meet the minimum standardfor elongation.
The tensile properties generally improve with adecreasing particle size. This can be attributed to theincreasing hardness as the particle size becomes finer. Acorrelation between hardness and tensile strength is inconformance with the findings in Gülsoy, Özgün and Bilketay(2016) and this relationship is also known to be common(Gaško and Rosenberg, 2011; Shen and Chawla, 2001).
It is apparent therefore that the yield strength, ultimatetensile strength and hardness generally increase as theparticle size becomes finer. The influence of particle size onhardness is consistent with the work reported by Srivatsan etal. (2002). The lower hardness values of the PS-45-60 andPS-5-60 specimens can be attributed to the considerablylarger pore volumes (Figure 5).
Feedstocks of fixed metal powder loading of 60 vol.% anddifferent metal powder particle sizes of -45, -15 and -5 mwere successfully prepared and evaluated for metal injectionmoulding.
� All the feedstocks exhibited a pseudo-plastic flowproperty, indicating their general suitability forinjection moulding. The starting powder particle sizeappears to affect the feedstock mouldability; rheologicalparameters of specimen PS-5-60 indicate mouldingdifficulty, while PS-15-60 is expected to have superiormouldablity during injection
� The effect of the starting powder particle size distri-bution on the sintered density and shrinkage levelswas investigated. A larger particle size yieldedminimum shrinkage levels and inferior final sintereddensities. Particle agglomeration, poor packingefficiency and non-homogeneous feedstock pseudo-plastic flow properties were identified as reasons forthe inferior mouldability of the PS-5-60 feedstocks
� The PS-5-60 material has generally superiormechanical properties and meets the standard in allrespects.
The contributions of NM, HKC, Ntate SP and PR are dulyrecognized. The authors are grateful to the DST and the CSIRfor financial support. The authors are also indebted to AtmixCorp. (JP) for the supply of powder materials used in thisstudy.
The influence of particle size distribution on the properties of metal-injection
VOLUME 116 939 �

The influence of particle size distribution on the properties of metal-injection
AHN, S., PARK, S.J., LEE, S., ATRE, S.V. and GERMAN, R.M. 2009. Effect of
powders and binders on material properties and molding parameters in
iron and stainless steel powder injection molding process. Powder
Technology, vol. 193, no. 2. pp. 162–169.
AMIN, S.Y.M., JAMALUDIN, K.R. and MUHAMAD, N. 2009. Rheological properties of
Ss316L Mim feedstock prepared with different particle sizes and powder
loadings. Journal of the Institution of Engineers, Malaysia, vol. 7, no. 2.
pp. 59–63.
ATTIA, U.M. and ALCOCK, J.R. 2011. A review of micro-powder injection
moulding as a microfabrication technique. Journal of Micromechanics and
Microengineering, vol. 21, no. 4. pp. 43001–43001.
BOSE, A., OTSUKA, I., YOSHIDA, T. and TOYOSHIMA, H. 2008. Faster sintering and
lower costs with ultra-fine MIM powders. Metal Powder Report, vol. 63,
no. 5. pp. 25–30.
BRICOUT, J., GELIN, J., ABLITZER, C., MATHERON, P. and BROTHIER, M. 2013.
Influence of powder characteristics on the behaviour of PIM feedstock.
Chemical Engineering Research and Design, vol. 91. pp. 2484–2490.
GAŠKO, M. and ROSENBERG, G. 2011. Correlation between hardness and tensile
properties in ultra-high strength dual phase steels. Materials Engineering,
vol. 18. pp. 155–159.
GERMAN, R.M. 1992. Prediction of sintered density for bimodal powder
mixtures. Metallurgical and Materials Transactions A, vol. 23A, May.
pp. 1455–1465.
GERMAN, R.M. 2005. Powder Metallurgy and Particulate Materials Processing.
Metal Powder Industries Federation, Princeton, NJ, USA.
GERMAN, R.M. and BOSE, A. 1997. Injection Molding of Metals and Ceramics.
Metal Powder Industries Federation, Princeton, NJ, USA.
GONZÁLEZ-GUTIÉRREZ, J., STRINGARI, G.B. and EMRI, I. 2012. Powder Injection
molding of metal and ceramic parts. Intech. pp. 65–88.
GÜLSOY, H.Ö., ÖZGÜN, Ö. and BILKETAY, S. (2016). A powder injection molding of
Stellite 6 powder : sintering , microstructural and mechanical properties.
Materials Science and Engineering A, vol. 651. pp. 914–924.
HARTWIG, T., VELTL, G., PETZOLDT, F., KUNZE, H., SCHOLL, R. and KIEBACK, B.
(1998). Powders for metal injection molding. Journal of the European
Ceramic Society, vol. 18. pp. 1211–1216.
HAUSNEROVA, B., KITANO, T. and SAHA, P. 2010. Effect of particle size distri-
bution on the flow behaviour of powder injection moulding materials.
Proceedings of the 3rd WSEAS International Conference on Engineering
Mechanics, Structures and Engineering Geology, Corfu. Martin, O. and
Zheng, X. (eds.). pp. 192–194.
HUANG, B., LIANG, S. and QU, X. 2003. The rheology of metal injection molding.
Materials Processing Technology, vol. 13. pp. 132–137.
KHAKBIZ, M., SIMCHI, A. and BAGHERI, R. 2005. Analysis of the rheological
behavior and stability of 316L stainless steel-TiC powder injection
molding feedstock. Materials Science and Engineering A, vol. 407,
no. 1–2. pp. 105–113.
MA, J., QIN, M., ZHANG, L., TIAN, L., LI, R., CHEN, P. and QU, X. 2014. Effect of
ball milling on the rheology and particle characteristics of Fe-50%Ni
powder injection molding feedstock. Journal of Alloys and Compounds,
vol. 590. pp. 41–45.
MACHAKA, R. and CHIKWANDA, H.K. 2014. Kinetics of titanium metal injection
moulding feedstock thermal debinding. Proceedings of Light Metals
Technologies 2015, Port Elizabeth. Chikwanda, H.K. and Chikosha, S.
(eds.). pp. 1–6.
MACHAKA, R., SEERANE, M. and CHIKWANDA, H.K. 2014. Binder development for
metal injection moulding: a CSIR perspective. Advances in Powder
Metallurgy and Particulate Materials - 2014, Proceedings of the 2014
World Congress on Powder Metallurgy and Particulate Materials, PM
2014. Metal Powder Industries Federation Princeton, NJ. pp. 443–458.
MAMEN, B., SONG, J., BARRIERE, T. and GELIN, J. 2015. Experimental and
numerical analysis of the particle size effect on the densi fi cation
behaviour of metal injection moulded tungsten parts during sintering.
Powder Technology, vol. 270. pp. 230–243.
MANNSCHATZ, A., MULLER, A. and MORITZ, T. (2011). Influence of powder
morphology on properties of ceramic injection moulding feedstocks.
Journal of the European Ceramic Society, vol. 31, no. 14. pp. 2551–2558.
MPIF. 2007. Materials standard for metal injection molded parts. MPIF
Standard 35, (2007 edn.) Metal Powder Industries Federation, Princeton,
NJ. pp. 19–19.
SCHWARTZWALDER, K. 1949. Injection molding of ceramic materials. Bulletin of
the American Ceramic Society, vol. 28, no. 11. pp. 459–461.
SEERANE, M., CHIKWANDA, H. and MACHAKA, R. 2015. Determination of optimum
process for thermal debinding and sintering using Taguchi method.
Materials Science Forum, vol. 829. pp. 138–144.
SEERANE, M.N., CHIKWANDA, H.K., FOCKE, W. and MACHAKA, R. 2013.
Investigating the powder loading of gas atomised Ti6Al4V powder using
an ‘in-house’ binder for MIM. Advanced Metals Initiative: Precious Metals
2013. Southern African Institute of Mining and Metallurgy, Johannesburg.
SHEN, Y. and CHAWLA, N. 2001. On the correlation between hardness and tensile
strength in particle reinforced metal matrix composites. Materials Science
and Engineering A, vol. 297. pp. 44–47.
SOTOMAYOR, M.E., VAREZ, A. and LEVENFELD, B. 2010. Influence of powder
particle size distribution on rheological properties of 316L powder
injection moulding feedstocks. Powder Technology, vol. 200, no. 1–2.
pp. 30–36.
SRIVATSAN, T.S., WOODS, R., PETRAROLI, M. and SUDARSHAN, T.S. 2002. An investi-
gation of the influence of powder particle size on microstructure and
hardness of bulk samples of tungsten carbide. Powder Technology,
vol. 122. pp. 54–60.
TODD, I. and SIDAMBE, A T. 2013. Developments in metal injection moulding
(MIM). Advances in Powder Metallurgy: Properties, Processing and
Applications. Chang, I and Zhao, Y. (eds.). Woodhead, Sheffield.
pp. 109–146.
YE, H., LIU, X.Y. and HONG, H. 2008. Sintering of 17-4PH stainless steel
feedstock for metal injection molding. Materials Letters, vol. 62, no. 19.
pp. 3334–3336. �
�
940 VOLUME 116

Particle design and functionalization hasbecome an increasingly popular aspect ofmaterials synthesis and powder-metallurgicalitem manufacturing. One such techniqueinvolves the spheroidisation and densificationof feed materials, typically in the form ofchemical powders with wide particle sizedistributions. The major benefits of powderspheroidisation include improved powderflowability, increased powder packing densityand powder purity, reductions in internal voidsand defects, as well as the ability tomanipulate the particles surface morphologies(Boulos, 2004). Thermal plasma processinghas the potential for scale-up and forproducing industrial quantities of spheroidisedpowder.
Thermal plasma technologies offer a widespectrum of material synthesis and treatmentoptions, amongst others the synthesis andspheroidisation of nano-sized ceramic andmetal particles (Kumar and Selvarajan, 2006).The spheroidisation process occurs within theplasma discharge via in-flight heating andmelting of the powder feed material, givenhigh enough plasma temperatures (Fridman,2008, p. 495). Surface tension in the moltendroplets results in spherical, or nearly
spherical, powder particles being formed uponexiting the plasma discharge where the dropletundergoes rapid cooling and freezes. Quiteoften, the bulk density of these sphericalparticles is higher than that of the startingmaterial (Boulos, Fauchais and Pfender, 2013,p. 42). The different plasma spheroidisationtechniques reported include radio frequency(RF) induction thermal plasmas (Jiang andBoulos, 2006; Károly and Szépvölgyi, 2005;Yuming, Junjie and Yanwei, 2013), non-transferred direct current (DC) thermalplasmas (Chaturvedi et al., 2014; Kumar andSelvarajan, 2008; Suresh, Selvarajan andVijay., 2008) and microwave-assisted plasmaprocessing methods (Chen, Gleiman andPhillips, 2001; Vanamu et al., 2004; Weigle etal., 2004).
In this work, a microwave plasma system,similar to that reported in an earlier paper (vanLaar et al., 2015b), was used to investigatethe potential for spheroidisation of ironpowders. Argon served as the carrier gas andthe system operated at atmospheric pressure.
The experimental set-up consisted of a quartztube placed perpendicular through a metallicwaveguide, connected to a microwavegenerator operating at 2.45 GHz. Themagnetron was powered by a 1.5 kW powersupply. The quartz tube, with internal diameter
Spheroidisation of iron powder in amicrowave plasma reactorby J.H. van Laar*† I.J. van der Walt*, H. Bissett*, J.C. Barry* and P.L. Crouse†
Plasma-assisted spheroidisation of metal powders offers several technicaladvantages with respect to both the ease of materials handling andpowder-metallurgical item manufacturing. Advantages include improvedflowability, increased powder packing density, elimination of internalcomponent cavities and fractures, changes in morphology resulting indecreased friction between particles and contamination during pneumatictransport and enhanced particle purity. In this empirical study, sphericaliron particles were produced using a microwave plasma operating atatmospheric pressure and characterized using optical microscopy and SEMtechniques. Iron powders were fed into the system at fixed operatingconditions, resulting in particles with spherical structures. The theoreticalestimate of the time required for melting to occur is 1.6 ms, an order ofmagnitude smaller than the actual residence time.
iron powder, spheroidisation, microwave plasma.
* Applied Chemistry Division, South African NuclearEnergy Corporation (NECSA) SOC Ltd., Pelindaba,North West Province, South Africa.
† Fluoro-materials Group, Department of ChemicalEngineering, Faculty of Engineering, BuiltEnvironment and Information Technology,University of Pretoria, Pretoria, South Africa.
© The Southern African Institute of Mining andMetallurgy, 2016. ISSN 2225-6253. This paperwas first presented at the AMI Ferrous and BaseMetals Development Network Conference 201619–21 October 2016, Southern Sun ElangeniMaharani, KwaZulu-Natal, South Africa.
941VOLUME 116 �
http://dx.doi.org/10.17159/2411-9717/2016/v116n10a8

Spheroidisation of iron powder in a microwave plasma reactor
of 2 cm and a length of 30 cm, served as the reaction zoneand support flanges at the top and bottom of the tube alsoserved as gas inlets. Argon flow rates were controlled usingcalibrated Aalborg rotameters. This set-up was similar to thatdescribed previously (van Laar et al., 2015a) with theaddition of a powder feeder positioned above the reactor inlet,as well as a zirconium wool filter at the bottom of the quartzreactor. A schematic representation of the experimental set-up is shown in Figure 1. A T-connection and valve assemblysubsequent to the reactor set-up allowed for easy shiftingbetween vacuum and atmospheric operating pressures.
Characterization of the particles was performed usingequipment at the South African Nuclear Energy Corporation(Necsa), as well as the University of Pretoria (UP). Scanningelectron microscopy (SEM) was performed on the particleswith a high-resolution (0.6 nm) JEOL 6000 system usingsecondary electron (SE) signals.
At the start of each experimental run, the argon plasma wasinitiated under vacuum at approximately 15 kPa (Figure 2a),using an Alcatel 2010I dual-stage rotary vane pump. Thepressure was then gradually increased by closing the outletvalves, until the pressure reached ambient atmosphericconditions. At this pressure, the plasma became highlyfilamentary (Cardoso et al., 2009) as shown in Figure 2b.The iron powder was then fed through the plasma zone.During experiments, a dark grey powder deposited on theinner walls of the quartz tubes, as well as on the zirconiumwool filter at the bottom of the reactor. After each experi-mental run, the grey powders were collected from thezirconium wool and the tubes were removed and flushedusing acetone. The acetone wash was collected andevaporated in a drying oven operating at 50°C, after whichthe powders were collected.
The spheroidisation of the iron powders was investigatedat constant conditions, given in Table I. The argon flow ratesare reported in standard cubic centimetres per minute (sccm).Four runs were completed and all results obtained were
similar. The results presented in this paper are representativeof all product powders. During these runs, the reflected powervaried between 100 W and 200 W. The reflected power isdefined as the total power reflected back towards themagnetron, rather than coupling with the gas in the reactor.
The presence of spherical particles within the iron productsamples was evident. The initial feed powder showed no
�
942 VOLUME 116
Table I
Power 1500 WAr flow 150 sccmPressure 1 atm.Feed rate 10 g/h

evidence of large spherical particles at the same magnificationsettings. After the runs, a definite increase in the amount ofspherical particles was found, as shown in Figure 3. Thedegree of conversion to large spherical morphologies appearsto be quite low from these images, implying that a largeamount of powder passed through the system withoutundergoing spheroidisation. This was undoubtedly due to thefilamentary nature of the plasma, which decreased the totalcontact area and time of the particles with the high-energyplasma filaments.
SEM images of the iron product are shown in Figure 4.Particle sizes ranged between 20 m and 100 m and thesurfaces of the particles were either smooth (Figure 4a) orhad shallow grooves on the surface (Figure 4b), despiteidentical operating conditions. The formation of an oxidelayer around the particles was also evident from theloosening flakes on the surface, as well as the large whitemark, shown in Figure 4b. The different surfacemorphologies are related to the different flow paths ofparticles moving through the plasma, resulting in differentheating and solidification histories. Li and Ishigaki (2001)hypothesize that the particles with grooved surfacesexperience relatively high cooling rates, resulting in thenucleation of polycrystalline particles.
Smaller deposits were also present on the surface of thespheres. These deposits consisted of agglomerated particlesranging between 100 nm and 200 nm. Their presence wasattributed to partial evaporation of the iron feed materialwithin the hot plasma filaments, followed by recondensation(Ishigaki et al., 1995).
The iron feed material was also analysed using SEMmicrographs and was shown to consist of much smallerspherical particles with sizes 2–6 m, seen in Figure 5a.These particles were agglomerates of nanosized particles(Figure 5b) and were much smaller than the newly-formedspherical particles in the product powders and hence notvisible on the optical images shown in Figure 3.
Other interesting structures seen on the particle surfacesinclude stacked disc-like, rippled structures, shown in Figure6(a), similar to the spherical particles reported by Che andNorimasa (2006). The cause and mechanism behind thesestructures are linked to crystal formation. A variety ofnanostructures assume icosahedral shapes at scales wherethe surface forces exceed the bulk forces. However, some
forms persist into micro-scales, such as certain face-centredcubic (Fcc) metal colloid clusters (de Nijs et al., 2015). Thecircular discs, magnified in Figure 6(c), are explainedthrough a similar mechanism, by way of body-centred cubic(bcc) cells with (111) hexagonal projections, illustrated inFigure 7, growing radially outward, resulting in the observedripples and step edges.
In addition, it is well known that crystal planeorientations of materials can be determined and interpretedas spherical representations using Kikuchi patterns, whichare obtained using electron backscatter diffraction (EBSD)techniques (Zhou and Wang, 2007, p. 41). Coincidently, thephysical symmetry of the iron particle, highlighted in Figure6b, bears a remarkable similarity to that of a ferrite sphericalKikuchi map (SKM) shown in Figure 6d (Day, 2008) with acubic lattice structure viewed along the (111) orientation.
Also present were nanosized cubic and sphericalparticles, either from the unmelted feed material orsubsequently spheroidised. Another phenomenon is shownin Figure 8, where most of the particle surface was covered
Spheroidisation of iron powder in a microwave plasma reactor
943VOLUME 116 �

Spheroidisation of iron powder in a microwave plasma reactor
with agglomerates consisting of nanosized particles, similarto the feed material. It is possible that these particles did notexperience sufficient heating time for uniform melting andsolidification to occur.
The internal structures of the particles were alsoinvestigated by embedding the particles in an organic resin,followed by grinding and polishing. The polished surface wasthen viewed using SEM in order to compare internalmorphologies. The internal structure of the feed particles isshown in Figure 9d. These particles appeared to containminor voids and were non-uniform throughout the entiresurface area and were easily damaged due to the agglom-erated nature of the particles, as indicated in Figure 5b.
The internal structures of the product particles appearedto be quite diverse, with some particles presenting uniformdensity throughout the particle (Figure 9a and b), whileothers displayed larger defects and voids (Figure 9c). Thestraight lines that appeared on some cross-sections, such asthose of Figure 9c, were likely due to the grinder pushing toohard on the surface. An alternative explanation entails adifferent formation mechanism. Regardless, micro-defectsand voids were distinguishable within the structure,especially close to the outer perimeter. It is expected thatthese internal defects were linked to the outer grooveformations in Figure 4b. Li and Ishigaki (2001) speculatedthat these internal defects are a result of a variation inlocalized cooling rates, where higher cooling rates impededthe nucleation rate for uniform solidification.
�
944 VOLUME 116

Some particles appeared to possess an outer shell with adifferent structure from that of the core. Figure 10 presentsthe cross-sections of particles consisting of a uniformly densecore surrounded by a softer shell. Further investigationrevealed the shell to consist of agglomerated structuressimilar to those of the feed material. The mechanism behindthe formation of this shell-and-core structure is unclear;however, one possibility entails the hardening of the organicresin around the particles as they settled to the bottom of thesample during sample sedimentation in the preparationphase.
The experimental results showed that a portion of the ironpowders underwent spheroidisation in the argon plasmareactor. Theoretical models (Chen and Pfender, 1982) predictthe potential for spheroidisation by first considering theheating time of the material, followed by the melting time.The total time needed is then compared to the residence timeof the particles inside the hot plasma environment. Thesemodels take into account both the melting point and thethermal conduction of the material, as well as the enthalpy of
the plasma gas. Following the model set out by Chen andPfender (1982) and applied by Li and Ishigaki (2001) fortitanium carbide, the heating time, th, is given by
[1]
where p is the density of the solid particles, rw the radius ofthe particles, Cp the heat capacity, T0 and Tm the starting andmelting temperatures respectively and S and Sw the thermalconduction potentials of the surrounding gas at plasmatemperature and the particle surface, respectively.
The thermal conduction potentials are given by
[2]
where k is the thermal conductivity of the plasma gas.Melting temperature, tm, is then determined by
[3]
Spheroidisation of iron powder in a microwave plasma reactor
VOLUME 116 945 �

Spheroidisation of iron powder in a microwave plasma reactor
where Lm is the heat of fusion of the material and Sm thethermal conductivity potential of the plasma at the meltingpoint, Tm, of the material. For an argon plasma at approxi-mately 2000°C and using the properties of iron (Chase,1998), the heating and melting times were calculated and arereported in Table II.
The residence time of the powder was assumed to be thetime for which the particles fell through the reactor under theinfluence of gravity only. It was also assumed that due to thefilamentary nature of the plasma, only half of the reactorvolume was filled with a plasma discharge. With thisassumption, the residence times were approximately 175 ms,orders of magnitude higher than those needed according tothe model described above.
A microwave-induced argon plasma was successfully usedfor the spheroidisation of iron powders. The feed material (2–6 m) underwent melting and droplet formation, followedby rapid cooling and solidification. This resulted in largerspherical particles ranging from 20 m to 100 m, often withpatterns indicative of the underlying crystallinitymechanisms. SEM confirmed the morphological changesbrought about by the process and presented various differentparticle morphologies. Theoretical models were in relativeagreement with regards to the potential for spheroidisation,which was confirmed experimentally.
The use of microwave-assisted plasma shows promise forthe spheroidisation of metal powders. However, furtherexperimental work is needed to determine the effect ofvarious operating parameters (such as carrier gascomposition and flow rates) on the conversion and spheroidi-sation ratios. Pending these results, it is recommended thatthe use of microwave plasma systems be considered forfurther spheroidisation investigations.
The authors acknowledge the South African NationalResearch Foundation for financial support and the SouthAfrican Nuclear Energy Corporation for use of theirequipment.
BOULOS, M. 2004. Plasma power can make better powders. Metal PowderReport, vol. 59. pp. 16–21.
BOULOS, M.I., FAUCHAIS, P. and PFENDER, E. 2013. Thermal Plasmas:Fundamentals and Applications. Springer, New York.
CARDOSO, R.P., BELMONTE, T., NOËL, C., KOSIOR, F. and HENRION, G. 2009.Filamentation in argon microwave plasma at atmospheric pressure.Journal of Applied Physics, vol. 105. p. 093306.
CHASE, M.W.J. 1998. NIST-JANAF Thermochemical Tables. 4th edn. Journal ofPhysical Chemistry Ref. Data, Monograph 9. http://webbook.nist.gov
CHATURVEDI, V., ANANTHAPADMANABHAN, P.V., CHAKRAVARTHY, Y., BHANDARI, S.,TIWARI, N., PRAGATHEESWARAN, A. and DAS, A.K. 2014. Thermal plasmaspheroidization of aluminum oxide and characterization of thespheroidized alumina powder. Ceramics International, vol. 40. pp. 8273–8279.
CHE, S. and NORIMASA, S. 2006. Preparation and formation mechanism ofmicrometer-sized spherical single crystal particles of perovskite oxides byflame fusion. Key Engineering Materials, vol. 320. pp. 201–204.
CHEN, C.-K., GLEIMAN, S. and PHILLIPS, J. 2001. Low–power plasma torch methodfor the production of crystalline spherical ceramic particles. Journal ofMaterials Research, vol. 16. pp. 1256–1265.
CHEN, X. and PFENDER, E. 1982. Unsteady heating and radiation effects of smallparticles in a thermal plasma. Plasma Chemistry and Plasma Processing,vol. 2. pp. 293–316.
DAY, A.P. 2008. Spherical EBSD. Journal of Microscopy, vol. 230. pp. 472–86.
DE NIJS, B., DUSSI, S., SMALLENBURG, F., MEELDIJK, J.D., GROENENDIJK, D.J., FILION, L.,IMHOF, A., VAN BLAADEREN, A. and DIJKSTRA, M. 2015. Entropy-drivenformation of large icosahedral colloidal clusters by spherical confinement.Nature Materials, vol. 14. pp. 56–60.
FRIDMAN, A. 2008. Plasma Chemistry. Cambridge University Press.
ISHIGAKI, T., JUREWICZ, J., TANAKA, J., MORIYOSHI, Y. and BOULOS, M.I. 1995.Compositional modification of titanium carbide powders by inductionplasma treatment. Journal of Materials Science, vol. 30. pp. 883–890.
JIANG, X.-L. and BOULOS, M. 2006. Induction plasma spheroidization of tungstenand molybdenum powders. Transactions of Nonferrous Metals Society ofChina, vol. 16. pp. 13–17.
KÁROLY, Z. and SZÉPVÖLGYI, J. 2005. Plasma spheroidization of ceramic particles.Chemical Engineering and Processing: Process Intensification, vol. 44. pp. 221–224.
KUMAR, S. and SELVARAJAN, V. 2006. Spheroidization of metal and ceramicpowders in thermal plasma jet. Computational Materials Science, vol. 36.pp. 451–456.
KUMAR, S. and SELVARAJAN, V. 2008. Plasma spheroidization of iron powders ina non-transferred DC thermal plasma jet. Materials Characterization, vol. 59. pp. 781–785.
LI, Y.-L. and ISHIGAKI, T. 2001. Spheroidization of titanium carbide powders byinduction thermal plasma processing. Journal of the American CeramicSociety, vol. 84. pp. 1929–1936.
SURESH, K., SELVARAJAN, V. and VIJAY, M. 2008. Synthesis of nanophasealumina, and spheroidization of alumina particles, and phase transitionstudies through DC thermal plasma processing. Vacuum, vol. 82. pp. 814–820.
VAN LAAR, J.H., SLABBER, J.F.M., MEYER, J.P., VAN DER WALT, I.J., PUTS, G.J. andCROUSE, P.L. 2015a. Microwave-plasma synthesis of nano-sized siliconcarbide at atmospheric pressure. Ceramics International, vol. 41. pp. 4326–4333.
VAN LAAR, J.H., VAN DER WALT, I.J., BISSETT, H., PUTS, G.J. and CROUSE, P.L.2015b. Synthesis and deposition of silicon carbide nanopowders in amicrowave-induced plasma operating at low to atmospheric pressures.Journal of the Southern African Institute of Mining and Metallurgy, vol. 115. pp. 949–955.
VANAMU, G., LESTER, K., DATYE, A.K., WEIGLE, J.C., CHEN, C.-K., KELLY, D. andPHILLIPS, J. 2004. Modifying irregular titania powders in a low powermicrowave plasma torch. AIChE Journal, vol. 50. pp. 2090–2100.
WEIGLE, J.C., LUHRS, C.C., CHEN, C.K., PERRY, W.L., MANG, J.T., NEMER, M.B.,LOPEZ, G.P. and PHILLIPS, J. 2004. Generation of aluminum nanoparticlesusing an atmospheric pressure plasma torch. Journal of PhysicalChemistry B, vol. 108. pp. 18601–18607.
YUMING, W., JUNJIE, H. and YANWEI, S. 2013. Spheroidization of Nd-Fe-B powdersby RF induction plasma processing. Rare Metal Materials andEngineering, vol. 42. pp. 1810–1813.
ZHOU, W. and WANG, Z.L. 2007. Scanning Microscopy for Nanotechnology:Techniques and Applications. Springer, New York. �
�
946 VOLUME 116
Table II
Fe 1.31 0.295 1.60 175

Railway wheels are used to support the wagonmass and guide the wagon along the tracks(Park, 1974). The wheels and rails must beable to tolerate the applied tangential forces inorder to effect wagon dynamic performanceand reduce material deformation (Ghidini etal., 1994; RSE_TE_SPC_0045, 2011; AARM107/M 208 Specification, 2011. Over thepast ten years, the South African coal wagonmaintenance depot has experienced excessivehollow wheel wear rates on the heavy haul linewheels. The maximum load of Jumbo wagonson the coal line is 104 t, or 26 t per axle.Although the maintenance intervention cyclefor wheelsets was two years, betweenFebruary 2011 and August 2012 some wheelsexperienced excessive hollow wear. Hollowwear is regarded as wear exceeding 2 mm onthe central portion of the wheel tread(RSE_TE_SPC_0045, 2011). This happeneddespite the fact that these wheels weremanufactured and certified according to the
requirements of AAR M107/208 standard forcarbon steel wheels (AAR M107/M 208Specification,. 2011) and the local wheelRS/ME/SP 021 standard specification (RS / ME/ SP / 021 REV 5 (2013). The AAR standardonly specifies a minimum hardness as arequired mechanical property and the localstandard specifies hardness and minimumtensile strength only. In general, an increase inhardness will improve the rolling/sliding wearresistance of steel. This relationship ofhardness and wear resistance was found to betrue only in a situation where solid and similaralloys are in contact (Singh, Khatirkar andSapate, 2015). The sliding wear resistance of amaterial is usually estimated using Archard’sequation (Liu and Li, 2001). This wearmechanism may manifest by crack initiation atthe surface and propagation until macroscopicwheel material detachment occurs (Johnson,1989). Fatigue crack initiation occurs as aresult of local plastic deformation (Johnson,1989; Ekberg, 2001). This plastic deformationand fatigue crack-related detachment formshollow wear within the wheel/rail interfaceand progresses over many rolling contactcycles. Lewis and Olofsson (2009) stated that‘severe wear results in a rough, deep tornsurface – much rougher than the originalmetallic wear debris, typical of up to 10 m’. Itwas further indicated that there is a
Effect of yield strength on wear rates ofrailway wheelsby V.J. Matjeke*† J.W. van der Merwe†‡, M.J. Phasha*, A.S. Bolokang* and C. Moopanar*
Excessive wear rates on railway wheels can result in rolling-stockderailments. If wear is detected early the possible derailments can beprevented by prematurely replacing wheelsets, although the inventory costand maintenance downtime remain a challenge. In the current study,wheels were introduced and monitored in-service for two years toinvestigate the cause of excessive wear rates. The wear rates and stresseswere calculated for the wheels suitable for a maximum load of 26 t peraxle. Microstructural and mechanical properties were analysed. Asexpected, the general microstructure of all the wheels tested was pearlitic.Although all the wheels complied with the tensile strength requirements,stress calculations confirmed material distortion on excessively wornwheels whereas trial wheels revealed yield strength exceeding the yieldcriterion. High wear rates observed on the wheels were a result of lowyield strength relative to the load per axle. The typical wear mechanismfound was due to a combination of rolling contact fatigue and abrasivebrake wear. Despite compliance of the wheels with existing requirementsregarding material and mechanical properties (hardness, ultimate tensilestrength), it is recommended that the yield strength must also be takeninto consideration as a critical parameter.
railway wheels, wear rate, yield strength, wear mechanism, rolling contactfatigue.
* Transnet Engineering, Research & Development,Kilner Park, Pretoria, South Africa.
† School of Chemical and MetallurgicalEngineering, University of the Witwatersrand,Johannesburg, South Africa.
‡ DST-NRF Centre of Excellence in StrongMaterials, School of Chemical and MetallurgicalEngineering, University of the Witwatersrand,Johannesburg, South Africa.
© The Southern African Institute of Mining andMetallurgy, 2016. ISSN 2225-6253. This paperwas first presented at the AMI Ferrous and BaseMetals Development Network Conference 201619–21 October 2016, Southern Sun ElangeniMaharani, KwaZulu-Natal, South Africa.
947VOLUME 116 �
http://dx.doi.org/10.17159/2411-9717/2016/v116n10a9

Effect of yield strength on wear rates of railway wheels
relationship between crack truncation and wear rate; if thewear rate is high, cracks will probably be worn away beforeprogressing beyond stage A in Figure 1, otherwise the crackbecomes unsafe when it reaches point C.
Heat treatment is the most important process forimproving wheel rim hardness and subsequently wearresistance (Ekberg, 2001). Residual compressive stresses areintroduced in the wheel rim by a rim quenching processduring heat treatment that refines the grain structure and asa result improves the wear resistance as well as the resistanceto crack initiation (Johnson, 1989). Excessive hollow wearcan affect the dynamic behaviour of the railway vehicle andwill lead to the increased likelihood of derailments (Lewis etal., 2003). Although the main focus of this paper is onexcessive wear rates, wheel-rail interaction is also important.When the contact area between the wheel and rail is small,there is a corresponding high contact stress. Typical contact ismade over a quasi-elliptical area with an average diameter ofapproximately 13 mm (Harris et al., 2001).
This research study was initiated to deepen theunderstanding of the wear mechanism experienced on thecoal line. This will aid efforts to identify and abate the wearrates, as well as in determining combative measures toreduce the wear of the wheels. In order to investigate this, anenhanced understanding of the current operating conditions,wheel mechanical properties, metallographic properties, wearmechanisms and wear regimes is essential.
Initially, two batches of wheels that showed high wear ratesin-service were declared unroadworthy and were removedfrom service. Three wheelsets from the two batches wereselected for further analysis. The chemistry and tensileproperties of these batches were provided by the supplier.Both batches were manufactured by Supplier A (wheel A).The degree of wear was measured using the miniprof wheelrim measurement technique. In addition, microstructuralanalysis around the excessively worn area on the wheel treadwas conducted using optical and scanning electronmicroscopy (SEM). The hardness results related to theexcessively worn wheel test batch were not available. Inaddition, no further comparative hardness testing could becarried out on the worn wheels due to their condition andprofile. However, according to Zang, Li and Zhang, (2011)and Dieter (1988) the hardness of materials often obeys thethree times empirical strength relationship of work-hardening
metals, therefore an extrapolation of material hardness wascarried out using the material yield strength.
In an effort to further understand the wear mechanism,thirty-two brand-new wheelsets were ring-fenced for trialsand monitored for a period of two years on the coal Jumbowagons. These new wheelsets were supplied by two differentcompanies. The wheels were profiled to the nominal diameterand put in service for wear monitoring. The operatingconditions were similar to the conditions that existed in2011. Sixteen of the 32 wheelsets were manufactured by‘Supplier A’ (wheel A) and the other 16 were manufacturedby ‘Supplier B’ (wheel B). Each bogie of the wagon waspaired with wheelsets made up of a combination of bothwheels A and B. Unfortunately, four wagons were removeddue to operational demand and therefore could not completethe trial; and as a result they were excluded from the study.The remaining 16 wheelsets that completed the trial weremeasured bi-annually.
In additional, a wheel from each supplier was tested todetermine the chemistry, microstructural analysis andmechanical properties.
The wear rate of the tread surface depends on loadingconditions, therefore the loading conditions were analysedaccording to compliance criteria from UIC Code 510-5 (2007)and EN 13103 standards. The applied forces were calculatedand the main goal of the two-body contact interface analysiswas to determine the magnitude of stresses anddeformations.
The three wheelsets that were removed from service wereidentified as 8JS6699/024, 8US6855/003 and 8SU6085/046.Wheelset 8JS6699/024 was in service for 9 months while8US6855/003 and 8SU6085/046 were in service for 18months.
The chemical composition of the excessively (abnormal) wornwheels from supplier A is shown in Table I. The chemicalcomposition and mechanical properties were found to be inaccordance with the requirements of AAR M107/M 208 andRS/ME/SP 021 specifications, respectively.
The tensile tests results of the quality test batch related to theexcessively worn wheels are shown in Table II. These resultswere found to be satisfactory and compliant with the localspecification. The material hardnesses that were extrapolatedwere found to be approximately 310 HV and 329 HV, (290HB and 309 HB when converted to Brinell hardness) respec-tively (Dieter, 1988).
The rim profile was measured and evaluated according to therequirements of RSE/TE/SPC/0045 (2013). The total average
�
948 VOLUME 116

wear rate was found to be 0.33 mm/month according to therim profile measurements in Table III. The wear rates werefound to be excessive considering that the wheels were inservice for a period of 9–18 months.
Figure 2 shows the excessive hollow wear on the wheelrim profiles.
The treads of the wheels that experienced excessive wearwere examined with a stereoscope and optical microscope.The treads revealed fine microscopic cracks, as shown inFigure 3 and Figure 4. The cracking mechanism is similar tothat discussed by Lewis and Olofsson (2009); where thewheel surface experiences deformations as a result of cyclicloading, leading to crack initiation which ultimately results inthe loss of particles from the surface. Lewis et al. (2003)described this phenomenon as ‘ratcheting’.
The general microstructure of the wheel was pearlitic withferrite embedded on the grain boundaries. The microstructureobserved during metallographic examination showed wheeltread plastic deformation of approximately 75 m (see Figure5). The wheel tread surface shows a breakage classified assevere wear.
Effect of yield strength on wear rates of railway wheels
949VOLUME 116 �
Table I
Wheel A1 0.68 0.78 0.39 0.01 0.01 0.02 0.13 0.13 0.04 0.16 0.01 0.04 0.01 0.03
Wheel A2 0.69 0.79 0.35 0.01 0.01 0.03 0.11 0.12 0.03 0.20 0.01 0.04 0.01 0.03
AAR M107/208 0.67–0.77 0.6–0.9 0.15–1.00 0.005–0.040 0.03* 0.06* 0.25* 0.25* 0.10* 0.35* 0.06* 0.05*Grade C Standard
Table II
Ultimate tensile strength (MPa) 1054 1119 1050 minimum0.2% yield strength (MPa) 642 660 Not specifiedYS:UTS 0.61 0.59 Not specified% Elongation 15 17 8 minimumStrain 0.158 0.171 Not applicable% Reduction area 31 39 Not specified
Table III
63655292 T/003 side A 02/2011 34.46 22.74 5.36 7.41 12.5363655292 T/003 side B 02/2011 32.81 25.57 3.20 7.81 24.2263655292 U/046 side A 02/2011 32.91 25.54 3.69 7.88 23.7963655292 U/046 side B 02/2011 32.08 25.27 3.69 8.33 12.8863655497 G/024 side A 11/2011 35.71 26.33 4.88 8.75 28.2863655497 G/024 side B 11/2011 34.90 25.12 4.77 7.90 19.27
*Maximum

Effect of yield strength on wear rates of railway wheels
Figure 6 shows a SEM micrograph detailing the fatiguemicro-cracks on the excessively worn wheel.
The metallurgical and mechanical testing results of the twowheels sampled from supplier A and B are presented below.
Chemical compositions of the trial wheels examined are givenin Table IV. The chemical compositions of both wheelsconformed to the AAR M107/208 specification. The carboncontent of wheel A was 5.5% lower than that of wheel B; thisdifference is significant given the importance of carbon as anelement that influences hardenability.
The tensile test results are shown in Table V. Results of bothwheels complied with the requirements of RS/ME/SP021. Theultimate tensile strength and yield strength of the trial wheelswere significantly better than the values for the wheels thatexperienced excessive wear.
Transverse sections of the two wheels sampled from the ring-fenced wheels were prepared for metallographic examination.The general microstructure of the two wheels was pearliticwith ferrite embedded on the grain boundaries (Figure 7).
A microslice from the rim on the wheels identified fordestructive testing was sectioned and prepared for Brinell
�
950 VOLUME 116
Table IV
Wheel A 0.69 0.78 0.33 0.01 0.01 0.02 0.15 0.18 0.04 0.09 0.01 0.04 0.01 0.03
Wheel B 0.73 0.78 0.26 0.01 0.01 0.02 0.10 0.24 0.03 0.21 0.01 0.04 0.01 0.03
AAR M107/208 0.67–0.77 0.6–0.9 0.15–1.00 0.005–0.040 0.03* 0.06* 0.25* 0.25* 0.10* 0.35* 0.06* 0.05*Grade C Standard
Table V
Ultimate tensile 1223 1185 1050 minimumstrength (MPa)
0.2% yield 924 910 Not specifiedstrength (MPa)
YS:UTS 0.76 0.77 Not specified
% Elongation 17 16 8 minimum
% Reduction area 35 33 Not applicable
*Maximum

hardness testing. The wheel rim hardness tests wereconducted at the positions indicated in Figure 8 and theresults are presented in Table VI. All wheels complied withthe minimum and maximum hardness requirements ofspecification RS/ME/SP021 grade C alloy. The hardnessmeasurements were comparable and did not show the effectof the 5.5% carbon variation.
Only 16 of the 32 ring-fenced wheelsets were analysed, asmentioned, and the results are discussed below. All thewheels used in the test were manufactured through a forgingproces.
The results listed in Table VII are the rim profilemeasurements for the last cycle measurements over a 24-month period.
Of the 16 wheelsets shown in Table VII, 14 of the left-hand side wheels on the wagons were worn more than thoseon the right-hand side. Only two of the right-hand wheelsshowed pronounced wear. The hollow wear on trial wheelswas satisfactory considering that the average wear rate was0.06 mm/month and the maximum variation was 0.42 mmper wheelset. Figures 9–12 show the wheel rim profiles perwagon. Thee wear rates of the trial wheels are significantlylower than the wear rates in Table III.
The asymmetrical hollow wear that was observed on theexcessively worn wheels, as originally detected in 2011 and2012, was indicative of a batch with inferior mechanicalproperties. The asymmetrical wear on the trial wheels wasnot as pronounced and as such was deemed normal andacceptable. The high wear rates of the excessively wornwheels also indicate that there is a possibility that the wheelmaterial was of inferior mechanical properties with referenceto the trial (ring-fenced) wheels. In general, excessive wearwas predominant on wheels identified as wheel type A in2011 and 2012.
The tread of the trial wheel shown in Figure 13 was smooth,without signs of the cracks observed on the excessively wornwheels seen in Figure 3. Furthermore, microscopicexamination of the wheel tread did not reveal any operation-related defects, except for random micro-spalling seen inFigure 13 and 14. The wear mode was characterized as mildwear. The wheel with high wear rates in Figure 6 showedlarger spall marks than the trial wheels in Figure 14 at thesame magnification.
This section focuses on wheel load and compliance criteriafrom UIC Code 510-5 (2007) and BS EN 13103 (2009)standards. The applied forces were calculated on the basis ofthe value of load Qg. Load Qg is defined in the EN 13103standard as half the vertical force per wheelset on the rail (BSEN 13103, 2009). The main goal of the two-body contactinterface analysis was to calculate the magnitude of stressesand deformations. UIC Code 510-5 recommends that fordesign purposes, three load cases must be considered,namely Load case 1: straight track, Load case 2: curve andLoad case 3: negotiation of points and crossings. However,for the purpose of investigating hollow wear only Load case 1is applicable.
This load case is for a centred wheelset on a straight track asrepresented by 1 (highlighted) in Figure 15. Equation [1]was used to calculate the loads tabulated in Table VIII.
Effect of yield strength on wear rates of railway wheels
VOLUME 116 951 �
Table VI
1 341 3442 347 3513 351 341 321–3634 333 3295 341 3366 338 321

Effect of yield strength on wear rates of railway wheels
�
952 VOLUME 116
Table VII
63634325 Wheel B 1 30.447 11.105 25.947 1.338 0.00 Left2 30.879 11.385 25.831 1.639 0.30 Right
Wheel A 3 30.148 10.815 26.153 1.274 0.00 Left4 30.166 10.881 26.008 1.282 0.01 Right
Wheel B 5 30.244 11.288 25.897 1.222 0.00 Left6 30.599 11.408 25.883 1.559 0.34 Right
Wheel A 7 30.546 11.254 25.832 1.331 0.00 Left8 30.346 10.907 25.713 1.565 0.23 Right
63634317 Wheel B 1 30.246 11.403 25.688 1.535 0.00 Left2 30.263 11.299 25.680 1.583 0.05 Right
Wheel A 3 29.705 10.075 25.794 1.087 0.00 Left4 30.569 11.169 25.877 1.390 0.30 Right
Wheel B 5 30.585 11.528 26.031 1.537 0.00 Left6 30.765 11.427 26.041 1.576 0.04 Right
Wheel A 7 29.934 10.557 26.040 1.168 0.00 Left8 31.335 12.092 25.611 1.585 0.42 Right
63634309 Wheel B 1 30.474 11.148 26.025 1.188 0.00 Left2 30.455 11.464 26.017 1.452 0.26 Right
Wheel A 3 30.418 11.198 25.777 1.251 0.00 Left4 30.069 11.119 26.180 1.357 0.11 Right
Wheel B 5 30.116 11.135 25.901 1.119 0.00 Left6 30.245 10.673 25.775 1.111 -0.01 Right
Wheel A 7 30.629 11.449 25.756 1.484 0.00 Left8 30.104 11.018 25.983 1.184 -0.30 Right
63634295 Wheel B 1 30.761 11.555 25.961 1.363 0.00 Left2 30.458 11.071 25.946 1.588 0.22 Right
Wheel A 3 30.318 11.145 26.189 1.269 0.00 Left4 30.008 11.183 26.092 1.369 0.10 Right
Wheel B 5 30.302 11.378 25.802 1.255 0.00 Left6 30.457 10.989 25.823 1.375 0.12 Right
Wheel A 7 30.604 11.359 25.981 1.293 0.00 Left8 30.366 11.146 25.869 1.557 0.26 Right

[1]
Effect of yield strength on wear rates of railway wheels
VOLUME 116 953 �
Table VIII
Q (per axle) 26 tQ (per wheel) 13 tg 9.81 m/s2
Fz1 159 413 N

Effect of yield strength on wear rates of railway wheels
Hertz (Johnson, 1985) developed a theory to calculate thecontact area and pressure between two surfaces and predictedthe resulting compression and stress induced on the objects.The principal stresses acting along the x, y, z axes at orbelow the contact area are x, y and z. The shear stressesacting along the axes at or below the contact area are zero.The current manufacturing specification does not specify theminimum yield strength; however, according to the distortionenergy theory; the yield strength is an important property.Harris et al. (2001) found that the wheel/rail interactioncontact is made over a quasi-elliptical contact patch the sizeof a small coin of about 13 mm (½ inch) diameter. Aminimum diameter of 13 mm was used to calculate theyielding criterion strength for a 26 t per axle load wagon (seeTable IX). The results for the excessively worn wheelspresented in Table IX show that the yielding criterionexceeded the uniaxial yield strength of wheel A at a contactpatch of 13 mm diameter. The elasto-plastic response shownin Figure 16 was extensively analysed by Johnson (1989).The load factor of the excessively worn wheels and the ring-fenced wheels at a maximum contact stress of 1812 MPa aresummarized in Table X. Given the interpretation of elasto-plastic behaviour of the wheels at approximately 0.3coefficient of friction, it is expected that excessively wornwheel A will distort and be more susceptible to both surfacefatigue and development of hollow wear in service than thering-fenced wheels A and B, which showed high yieldstrength values compared to the values determined by theVon Mises and Tresca criteria.
Shear flow on the excessively worn wheels and fatigue micro-cracks suggest a great amount of shear deformation ofmaterial on the tread surface. Olofsson et al. (2013) foundthat cyclic loading that leads to wheel surface deformationresults in crack nucleation and subsequently removal ofmaterial. The excessively worn wheels revealed plasticdeformation on the tread that resulted in the initiation ofcracks. The wear on the wheels most likely occurred by aform of material detachment at the intersection of cracks. Thewear observed in this research occurred by rolling contactfatigue that progressed by the shedding of small particles.The ring-fenced wheels did not exhibit any unusual wear-
�
954 VOLUME 116
Table IX
9 63 2537 3806 3806 2284 2284 152211 94 1691 2537 2537 1523 1522 101513 132 1208 1812 1812 1088 1088 72515 176 906 1359 1359 816 816 54317 226 705 1057 1057 634 634 42319 283 564 846 846 508 508 33821 346 461 692 692 415 415 27723 415 384 577 577 346 346 23025 490 325 488 488 293 293 19527 572 279 418 418 251 251 16729 660 242 362 362 218 218 14531 754 211 317 317 190 190 127
Table X
Wheel A1 1812 660 381 4.8Wheel A2 1812 642 371 4.9Wheel A 1812 924 534 3.4Wheel B 1812 910 525 3.5

related defects and since the only difference between thewheels is strength, it is therefore concluded that the wearmechanism is related to the material strength. Thetension/shear forces are complicit in the formation of fatiguecracks and material shear deformation.
The test certificate of the wheels showing initial excessivewear revealed a significantly lower yield strength comparedto the ring-fenced wheels, although only the ring-fencedwheels satisfied the minimum AAR and local specifications.However, it is worth noting that the yield strength is not arequirement for both specifications. Hardness testing of theexcessively worn wheels could not be carried out due todeformations and high wear rates; however, Dieter (1988)reported that empirically the yield strength is three time thehardness of work-hardening materials, therefore thehardnesses of the wheels were extrapolated using theempirical relationship. The converted hardness results did notconform to the minimum requirement of AAR M107/208 andlocal specification requirements. On the other hand, theArchard wear equation shows that the material surfacehardness is inversely proportional to wear resistance andtherefore, the likelihood of wear increases with lowerhardness (Liu and Li, 2001; Barwell, 1974).
Based on Hertz’s theory, the calculated contact area andpressure between wheel and rail predicts plastic deformationon the wheels that ultimately resulted in excessive wheelwear (Barwell, 1974). Stress calculations suggest that theexcessively worn wheelsets were exposed to heavy loading,i.e. high normal and tangential forces. The ring-fencedwheels’ yield strength exceeded the calculated Von Mises andTresca stresses. The high stress in this instance wasdetermined using a contact patch with an average 13 mm(long diagonal) elliptical diameter.
The ring-fenced wheels showed endurance performanceby exhibiting lower wear rates compared to the excessivelyworn wheels. The lasting performance in the ring-fencedwheels is largely related to the higher yield strength incomparison to the excessively worn wheels.
The high wear rates observed on the excessively worn wheelsfrom supplier A were as a result of low yield strength relativeto the load per axle. The typical wear mechanism found hereis a combination of rolling contact fatigue and abrasive brakewear. It is recommended that local and AAR specificationsshould consider minimum yield strength to determine axleload. Furthermore, the development of an optimized heattreatment process aimed at increasing the hardness and yieldstrength of AAR class C wheel rims will result in a consid-erable increased wheel life.
The wheel profiles used in this report were measured byGeorg Hettasch and Victor Ngobeni, who are gratefullyacknowledged by the authors.
AAR M107/M 208 specification. 2011. Wheels, carbon steel. Association of
American Railroads. pp. 1–40.
BARWELL, F. 1974. The tribology of wheel on rail. Tribology International,
vol. 7. pp. 146–50.
BS EN 13103. 2009. Railway applications — Wheelsets and bogies — Non-
powered axles — Design method.
DIETER, G.E. 1988. Mechanical Metallurgy. McGraw-Hill. 243–6, 331.
EKBERG, A. 2001. Anisotropy and rolling contact fatigue of railway wheels.
International Journal of Fatigue, vol. 23. pp. 29–43.
GHIDINI, A., BELOTTI, G., PATRIOLI, L. et al. 2004. Starting of an innovative line
for heat treatment of railways solid wheels and tyres. Proceedings of the
International Wheelset Congress, University of Illinois, Chicago.
HARRIS, W.J., TOURNAY, H., EBERSÖHN, W. and ZAKHAROV, S.D.L.J. 2001.
Guidelines to best practices for heavy haul railway operations:
management of the wheel and rail interface issues. International Heavy
Haul Association, Virginia Beach, VA. 484 pp.
JOHNSON, K.L. 1989. The strength of surfaces in rolling contact. Mechamical
Engeering Science, vol. 203, no. 33. pp. 151–163.
JOHNSON, K.L. 1985. Contact Mechanics. Cambridge University Press,
Cambridge, UK.
LEWIS, R. and OLOFSSON, U. 2009. Wheel-Rail Interface Handbook. CRC Press,
UK.
LEWIS, R. BRAGHIN, F., WARD, A., BRUNI, S., DWYER-JOYCE, R.S., BEL KNANI, K. and
BOLOGNA, P. 2003. Integrating dynamics and wear modelling to predict
railway wheel profile evolution. Proceedings of the 6th International
Conference on Contact Mechanics and Wear of Rail/Wheel Systems
(CM2003), Gothenburg, Sweden, 10–13 June. pp. 7–16.
LIU, R. and LI, D.Y. 2001. Modification of Archard’s equation by taking account
of elastic / pseudoelastic properties of materials. Wear, vol. 251.
pp. 956–64.
OLOFSSON, U., ZHU, Y., ABBASI, S., LEWIS, R. and LEWIS, S. 2013. Tribology of the
wheel–rail contact – aspects of wear, particle emission and adhesion.
Vehicle System Dynamics, vol. 51, no. 7. pp. 1091–1120.
PARK, S. 1974. The tribology of wheel on rail. Tribology International, vol. 2.
pp. 146–50.
RSE_TE_SPC_0045. 2011. Geometric requirements for new, reprofiled and in-
service wheelsets.
RS / ME / SP / 021 REV 5. 2013. Transnet freight rail specification for the
supply of wrought wheels for tractive and trailing stock.
SINGH, K., KHATIRKAR, R.K. and SAPATE, S.G. 2015. Microstructure evolution and
abrasive wear behavior of D2 steel. Wear, vol. 328. pp. 206–216.
UIC 510-5. 2007. Technical approval of monoblock wheels.
ZHANG, P., LI, S.X. and ZHANG, Z.F. 2011. General relationship between strength
and hardness. Material Science and Engineering A, vol. 529. pp. 62–73.�
Effect of yield strength on wear rates of railway wheels
VOLUME 116 955 �

3rd YOUNG PROFESSIONALS CONFERENCE9–10 MARCH 2017 | INNOVATION HUB, PRETORIA
KEYNOTE SPEAKERS AND TOPICSLeadership Innovation Professional Development
BACKGROUNDIt is recognised that we live in an era characterised by accelerated change, overwhelming complexities and tremendous competition, all of whichresult in considerable uncertainty about the future. The challenge for young professionals in this time is to create a vision for mining in Africathat will inspire confidence for the future. Young professionals must create a roadmap that describes the steps neccessary to realise the vision.In setting the strategic direction to achieve the vision, these are a few of the questions that must be answered:• What are the policies that should be developed and implemented to transform the status quo to the envisioned mining environment?
• What are the technical solutions that need to be pursued?
• What are the human capital needs that must be satisfied?
• What are the economic conditions required?
This conference will provide a platform for young professionals to interact with peers and industry thought leaders to drive the dialoguetowards unlocking the future of the African minerals industry.
WHO SHOULD ATTENDThis conference should be of value to all professionals across theentire minerals industry value chain, including:• Exploration
• Geology
• Mining
• Mineralogy
• Geotechnical engineering
• All metallurgical fields
• SHE practitioners
• Industrial relations and community involvement
EXHIBITION/SPONSORSHIPSponsorship opportunities are available. Companies wishing tosponsor or exhibit should contact the Conference Co-ordinator.
FOR FURTHER INFORMATION CONTACT: Conference Co-ordinator: Camielah Jardine E-mail: [email protected] Tel: +27 11 834 1273/7 www.saimm.co.za
HOW TO REGISTERComplete the registration form and return to [email protected] or [email protected]
Take advantage of the Early Bird registration discount. Book before 2 February 2017 to qualify.
UNLOCKING THE FUTUREOF THE AFRICAN MINERALSINDUSTRY: VISION 2040
Davis Cook, CEO, Research Institute for Innovation and Sustainability
Gary Lane, Co-founderand Group CEO, NXGN
Nosipho Siwisa-Damasane, CEO- Richards Bay Coal TerminalThabile Makgala, Vice President - Gold Fields

Two rocker arm studs used on a 16-cylinderdiesel locomotive engine failed prematurelyafter being in service for less than 5 months.The rocker arm studs had a life-cycle of 5years. The studs were manufactured from re-sulphurized steel. The paper aims to establishwhether re-sulphurized steel is applicable forthe manufacture of studs in the automotiveindustry.
Locomotives are classified as either electric orfuel-powered. Diesel locomotives are anexample of fuel-powered locomotives. Thistype of locomotive uses a diesel engine as ameans for propulsion. An engine convertschemical energy into mechanical energyrequired for traction. In an internal combustionengine a rocker arm is an oscillating lever thatconveys radial movement from the cam lobeinto linear movement to open and close poppetvalves of cylinders (Husain and Sheikh,2013). The rocker arms are secured on to thecylinder head by rocker arm studs.
During operation of the engine, stressesand vibrations are encountered leading torocker arm stud deflection (Ridgeway, 1975).The deflection of rocker arm studs causesinefficiency in engine operation and graduallyleads to metal fatigue and hence stud breakageor disengagement of the stud from the cylinderhead due to loosening (Ridgeway, 1975).However, the latest designs incorporate ahousing or adapter cover as a restrainingmeans to prevent stud deflection (Ridgeway,1975).
Incorrect torqueing of a rocker arm studcan lead to premature failure due to unevenstresses on the component (Roberts, 1997).Torqueing below the minimum requirementswould lead to deflection and vibration of thestud, thus leading to fatigue damage and over-torqueing would lead to loss of compressionand warpage of the stud (Roberts, 1997).However, the material of the stud also plays avital role in sustaining the deflection,vibrations and stresses acting on the studsduring operational service.
Re-sulphurized steel has found usage inthe production of threaded components suchas studs, bolts and screws, mainly to enhancemachinability and in applications that requirelow tensile strength material.
A stud is a relatively long rod that is threadedon both ends (Wikipedia, 2016), that isdesigned to be used in tension. Studs are usedfor joining parts to cast components. Thetensile strength of cast iron is very low andexcessive tightening of a set screw into a cast
Premature failure of re-sulphurizedsteel studsby E. Molobi*
Studs are rods threaded on both ends and are used as mechanicalfasteners for two or more components. Stud finds usage in industries suchas automotive, construction and aviation. The advantage of studs is thatthey allow for disassembly of components during maintenance. Studs arecontinuously subjected to both tensile and shear stresses, depending onthe application, therefore they should be manufactured from suitablematerials that are capable of withstanding all these external forces. Studsare sometimes manufactured from re-sulphurized steel due to its improvedmachinability; however, there is a certain limit on the amount of sulphur,above which failure may occur. Premature failure of studs has been acommon problem, but failed studs are commonly replaced with new oneswithout conducting failure investigations. The present work investigatesthe premature failure of two re-sulphurized steel studs used on a rockerarm assembly and recommends alternative materials. The investigationwas carried out by conducting visual examination, microstructuralanalysis, hardness measurements, chemical analysis and a detailedscanning electron microscopy (SEM) investigation on the fracture surface.
re-sulphurized steel, threaded fasteners, failure analysis, fatigue failure,manganese sulphide.
* Transnet Engineering, Product Development,Rotating Machines.
© The Southern African Institute of Mining andMetallurgy, 2016. ISSN 2225-6253. This paperwas first presented at the AMI Ferrous and BaseMetals Development Network Conference 201619–21 October 2016, Southern Sun ElangeniMaharani, KwaZulu-Natal, South Africa.
957VOLUME 116 �
http://dx.doi.org/10.17159/2411-9717/2016/v116n10a10

Premature failure of re-sulphurized steel studs
iron thread may cause the thread to crumble, thuspermanently damaging the casting (Jayendran, 2007). Studsare first screwed into the casting and tightening is done usingmild steel nuts. Any damage due to excessive tightening willbe to the stud or nut and not the casting. Studs are used toensure gas-tight and watertight joints in applications whereheavy pressures are encountered (Jayendran, 2007). Atypical stud connection is shown in Figure 1.
In many cases, threaded fastener joints are the weakestelements in a structure or mechanism (Toribo et al., 2010).This is because threads act as stress raisers and lead to easycrack initiation. The failure modes of threaded fasteners suchas studs are: (i) overload, (ii) lack of locking mechanism,which cause the studs to become loose, (iii) fatigue failure,(iv) improper torque, (v) improper design, (vi) impropermanufacture and (vii) corrosion failure (Roberts, 1997).Fatigue seems to be one of the most common problems andthis can be due to insufficient pre-load, loosening, inadequatedesign considerations and material problems (Toribo et al.,2010).
Threaded fasteners are generally made from low- tomedium-carbon steel, but other tough inexpensive metalsmay be substituted such as stainless steel, brass, nickelalloys, or aluminium alloy. The quality of the metal used isimportant in order to avoid cracking. Stud threads may bemachined or rolled; in cases where machining is used thematerials machinability becomes of utmost importance. Free-cutting steels are normally used in applications that requiregood machinability. Machinability of steels is dependent onhardness, chemistry, microstructure and the mechanical stateof the metal (Stephenson and Agapiou, 2006).
Sulphur, phosphorus and lead are added to steel toenhance machinability. Sulphur does not alloy with the ironin steel but combines with the manganese to form sulphideinclusions (Bramfitt and Benscoter, 2002), as sulphur cannotform a solid solution with steel and thus remains as insolubleinclusions in the matrix. Manganese sulphide behaves as asolid lubricant, by coating and lubricating the rake face of themachining tool, hence reduces friction, tool chip temperatureand tool wear (Bramfitt and Benscoter, 2002).
Although re-sulphurized steels are beneficial for machin-ability, the addition of sulphur adversely affects othermechanical properties such as corrosion resistance, ductility,toughness, formability and weldability (Stephenson andAgapiou, 2006).
The stresses acting on threaded fasteners include both atensile and a shear component (Grove, 2007). Once athreaded fastener is tightened, it is loaded in tension and thefastened parts in compression. In addition, the forces actingon the fastened parts may be acting in opposite directions,resulting in a shear stress on the threaded fastener cross-section. Figure 2 shows typical forces acting on a threadedfastener.
The fracture surfaces of studs A and B were examinedvisually. The condition of the stud threads was alsoexamined. Magnetic particle inspection was carried out byuse of a magnetic yoke and magnetic particles on a whitebackground for crack detection. Chemical analysis wascarried out by mass spectrometry. Hardness measurementswere conducted using a Brinell hardness meter under a loadof 3000 kg and with a 10 mm ball indenter. Metallographicsamples were sectioned from studs A and B and mounted in aresin for easy handling. Following mounting, the sectionedsamples were ground and polished and etched with 2% nitalfor microstructural analysis. The fractography of studs A andB was analysed by scanning electron microscopy (SEM) usingenergy dispersive X-ray (EDX) spectrometry to quantify andidentify the inclusions present.
�
958 VOLUME 116

Visual examination entailed examination of the stud threadsand fracture surface. Contact marks were observed on bothstuds A and B (Figures 3 and 4); these contact marks couldhave been formed either before or after stud fracture andcould be due to loosening or under-torqueing of the studs.Necking in the longitudinal axis of the studs was not evidentand no thread wear or thread mechanical damage was visible.Lack of necking shows that stud over-torqueing was unlikelyto be the cause of failure.
The fracture surface of stud A (Figure 5) was perpen-dicular to the stud axis. Mechanical damage and metalsmearing was observed close to the stud peripheral, hencethe failure origin could not be established. The roughness ofthe fracture surface was not uniform and the overload regiondisplayed material tearing. The change in roughness of thefracture surface is one of the indications of fatigue failure.Progression marks were not observed on the fracture surfaceand final fracture occurred in approximately the 5 o’clock to 7o’clock position. Lack of progression marks indicates that theload did not vary during the life of the crack. Cracking andmaterial tearing was also observed. The final fracturedisplayed a ductile mode of failure.
The fracture surface of stud B (Figure 6) was perpen-dicular to the stud axis. Ratchet marks were observed in the10 o’clock to 1 o’clock position (Figure 6 and 7); these are
indicative of fatigue failure. Progression marks were notevident. A shear lip was evident in the 4 o’clock to 7 o’clockposition, which is the point of final fracture and cracks werealso observed on the fracture surface. The presence of a shearlip may indicate a ductile failure mode. Mechanical damagewas also present in areas of the fracture surface, hence thedifference in surface roughness of the fracture surface couldnot be observed.
The threads of both stud A and B showed no evidence ofmechanical damage except for the thread in which failureoccurred. No progression marks were observed on eitherstud; hence it is unlikely that the failure was due to studunder-torqueing. The stress level during crack growth did notvary, which is unexpected of a loose stud. The presence ofratchet marks on stud B is evidence of multiple crack origins;however, the final fracture was less than 50% of the surfacearea of the fracture, hence it is evident that the stress at thetime of failure was low. Ratchet marks indicate the presenceof stress raisers.
Magnetic particle inspection revealed cracks on stud B(Figure 8). The crack observed on the fracture surface of studB (Figure 6) was continuous in the longitudinal direction ofthe stud.
Premature failure of re-sulphurized steel studs
959VOLUME 116 �
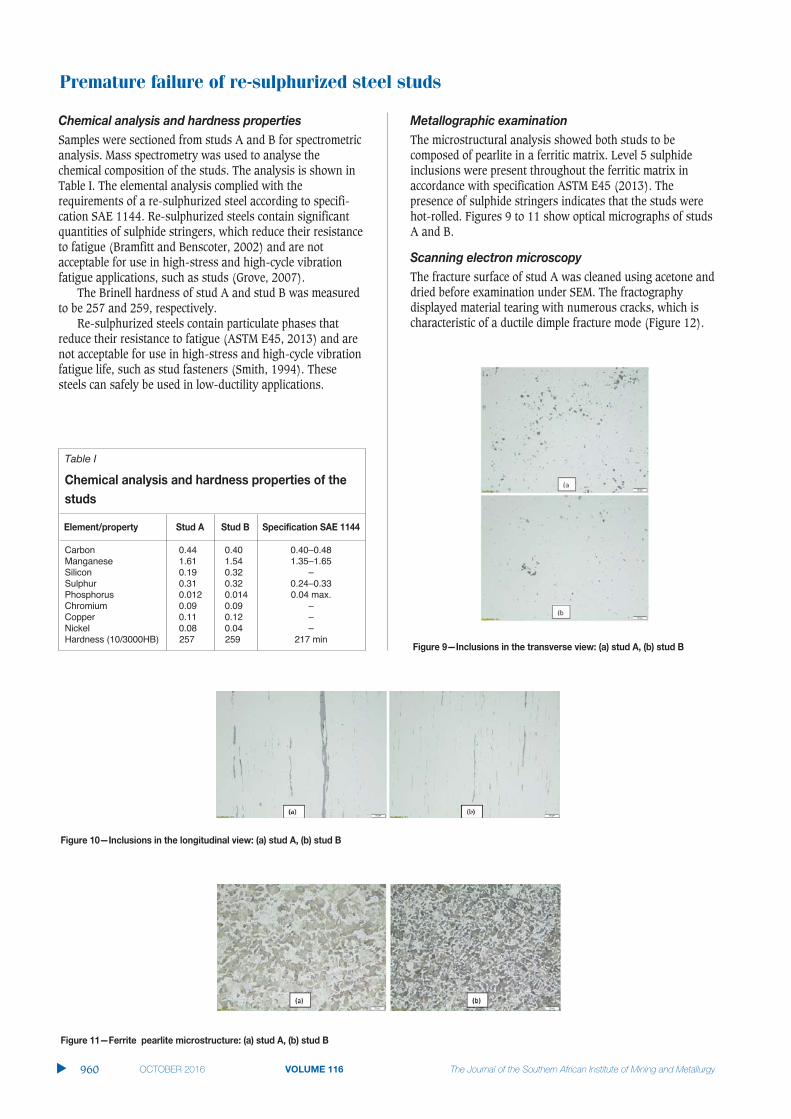
Premature failure of re-sulphurized steel studs
Samples were sectioned from studs A and B for spectrometricanalysis. Mass spectrometry was used to analyse thechemical composition of the studs. The analysis is shown inTable I. The elemental analysis complied with therequirements of a re-sulphurized steel according to specifi-cation SAE 1144. Re-sulphurized steels contain significantquantities of sulphide stringers, which reduce their resistanceto fatigue (Bramfitt and Benscoter, 2002) and are notacceptable for use in high-stress and high-cycle vibrationfatigue applications, such as studs (Grove, 2007).
The Brinell hardness of stud A and stud B was measuredto be 257 and 259, respectively.
Re-sulphurized steels contain particulate phases thatreduce their resistance to fatigue (ASTM E45, 2013) and arenot acceptable for use in high-stress and high-cycle vibrationfatigue life, such as stud fasteners (Smith, 1994). Thesesteels can safely be used in low-ductility applications.
The microstructural analysis showed both studs to becomposed of pearlite in a ferritic matrix. Level 5 sulphideinclusions were present throughout the ferritic matrix inaccordance with specification ASTM E45 (2013). Thepresence of sulphide stringers indicates that the studs werehot-rolled. Figures 9 to 11 show optical micrographs of studsA and B.
The fracture surface of stud A was cleaned using acetone anddried before examination under SEM. The fractographydisplayed material tearing with numerous cracks, which ischaracteristic of a ductile dimple fracture mode (Figure 12).
�
960 VOLUME 116
Table I
Carbon 0.44 0.40 0.40–0.48Manganese 1.61 1.54 1.35–1.65Silicon 0.19 0.32 –Sulphur 0.31 0.32 0.24–0.33Phosphorus 0.012 0.014 0.04 max.Chromium 0.09 0.09 –Copper 0.11 0.12 –Nickel 0.08 0.04 –Hardness (10/3000HB) 257 259 217 min

The cracks and tearing originated from inclusions, whichwere also present close to the stud surface (Figure 13 andFigure 14a). EDX analysis was conducted to identify andquantify the elemental composition of the inclusions; theEDX positions are shown in Figure 14b. The analysisrevealed the inclusions to be MnS (manganese sulphide);results are shown in Table II.
The crack observed on the fracture surface of stud B(Figure 6) was opened (Figure 15) and the crack fracturesurface was analysed using SEM. Elongated inclusionstringers were present in the longitudinal direction of thestud (Figure 16) and the fracture surface had a ‘woody’appearance, as shown in Figure 15. EDX analysis wasconducted on the inclusion stringers to determine andquantify the chemical composition; the EDX positions areshown in Figure 17. EDX revealed the stringers of inclusionsto be MnS (Table III). The MnS stringers were elongated inthe stud rolling direction; which indicates that the studs werehot-rolled and confirms the pearlitic structure in the ferritematrix. Sulphur is deformable at high temperatures and
becomes elongated during forming processes such as rolling(Cyril, Fatemi and Cryderman, 2008).
Stringers of MnS inclusions are known to have adverseeffects on the mechanical properties of a component,provided that the inclusions are not aligned with the loadingdirection (Cyril, Fatemi and Cryderman, 2008). Shear stress
Premature failure of re-sulphurized steel studs
VOLUME 116 961 �
Table II
Oxygen 1.07 1.03 2.31 3.44Aluminium - - 0.19 -Silicon - - 0.22 -Sulphur 34.30 30.87 14.07 22.59Manganese 57.58 61.84 22.27 33.06Iron 7.05 6.26 60.95 40.90

Premature failure of re-sulphurized steel studs
perpendicular to the stud axis is present due to thecomponents being joined. It is thus expected that the fatigueproperties in the transverse direction of the stud willdeteriorate as compared to those in the longitudinal direction.It is probable that the studs failed from fatigue loadingcaused by the transverse shear stresses, with MnS inclusionsas the initiation points, which reduced the fatigue strength ofthe studs.
� The presence of MnS (manganese sulphide) inclusionsreduces resistance to fatigue in the transverse direction
� The lack of necking proved that over-torqueing couldnot have been the cause of failure
� The lack of progression marks and mechanical damageon the rest of the threads suggests that under-torqueing is unlikely to be the cause of failure
� The most probable cause of failure is the presence oflarge MnS inclusions, which acted as initiation pointsfor fatigue failure. Both transverse shear forces andlongitudinal tensile forces could have led to failure
� Re-sulphurized steels are used for applications such asscrews, which are subjected to low loads, but are notsuitable for high-load application components such asthese studs
� It is recommended that studs be manufactured frommaterials with good strength, hardness and impactproperties regardless of anisotropy. These includechromium-nickel steels, which have increasedtoughness and strength.
ASTM E45. 2013. Standard Test Methods for Determining the Inclusion
Content of Steel. Vol. 03.01. Materials Park, OH. pp. 1–19.
BRAMFITT, B.L. and BENSCOTER, A.O. 2002. Metallographer’s Guide: Practice and
Procedures for Irons and Steel. 4th edn. ASM International, Materials
Park, OH.
CYRIL, N., FATEMI, A. and CRYDERMAN, B. 2008. Effects of sulfur level and
anisotropy of sulfide inclusions on tensile, impact and fatigue properties
of SAE 4140 steel. SAE International Journal of Materials and
Manufacturing, vol. 1, no. 1. pp. 218–227.
GROOVE, M.P. 2007. Fundamentals of Modern Manufacturing. 3rd edn. Wiley.
HUSAIN, S.M. and SHEIKH, S. 2013. Rocker arm: a review. International Journal
of Innovative Research in Science, vol. 2, no. 4. pp. 1120–1126.
JAYENDRAN, A. 2007. Joining of Metals by Mechanical Methods. 1st edn.
Springer.
RIDGEWAY, R.H. 1975. Rocker arm stud support device. US patent 3870024.
ROBERTS, C. 1997. The consequences of bolt failures. http://
www.crobers.com/bolt.htm [accessed 23 May 2016].
SCHMIDT, F.E., HINEMAN, M.A. and SCHMIDT, B.F. 2014. Improper materials
selection in motorcycle stud bolt. Microscopy and Microanalysis, vol. 20,
no. S3. pp. 1856–1857.
SMITH, E.H. 1994. Mechanical Engineer’s Reference Book. 12th edn.
Butterworth-Heinemann.
STEPHENSON, D.A. and AGAPIOU, J.S. 2006. Metal Cutting Theory and Practice.
2nd Eedn. Taylor and Francis.
TORIBO, J., GONZALEZ, B., MATOS, J.C. and AYASO, F.J. 2010. Analysis of Failure
Paths in Steel Bolted Connections. University of Salamanca. pp. 521–528.
WIKIPEDIA. 2016. Studs. https:en.wikipedia.org/wiki/threaded_rod [accessed 23
May 2016]. �
�
962 VOLUME 116
Table III
Oxygen 2.15 1.27 1.36 1.50Sulphur 27.01 31.99 22.69 30.09Manganese 49.60 53.92 41.67 49.21Iron 21.24 12.82 34.28 19.21

The automotive and aerospace industries havebeen interested in metal matrix composites(MMCs) and metal matrix nanocomposites(MMNCs) due to the growing demand forlightweight, high-performance materials(Mazen and Emara, 2004). MMCs and MMNCshave been considered as replacements forconventional metals and alloys because theyhave higher stability at elevated temperatures,good strength-to-mass ratios and superiorwear resistance, along with high stiffness andstrength (Zhou et al., 1999).
The mechanical properties of compositeproducts are influenced mainly by the distri-bution of reinforcing particles in the matrixand the strength of the interfacial bondsbetween reinforcing particles and the matrix(Liang et al., 1992). The ideal composite hasan even distribution of the reinforcementphase throughout the matrix (Ferry, 2005),but generating this is a challenge whenfabricating both MMCs and MMNCs. In MMCs,the micrometre-sized reinforcing particles tendto settle on the grain boundaries and inMMNCs the nano-sized reinforcing particlesform agglomerates (Borgonovo and Apelian,2011; Casati and Vedani, 2014).
Secondary deformation processes such asextrusion, forging, rolling and drawing may beused to improve the reinforcing particle distri-bution, thereby enhancing mechanicalproperties such as hardness and strength(Hirianiah et al., 2012). These deformationprocesses are usually carried out at hightemperatures since more deformation can beachieved due to the increased plastic flow(Saravanan and Senthilvelan, 2015).However, operating at high temperatures hasthe disadvantages of high energy costs,reduced equipment and tool life, poor surfacefinish and low dimensional accuracy (Rajput,2007). These disadvantages mean that hot-worked MMC and MMNC components areexpensive and thus are unattractive toindustry.
Deformation behaviour of aluminiumlow-micron MMCs and MMNCs at warmworking temperatures (0.3—0.5 Tm)by Z. Gxowa*†‡, L.H. Chown†‡, G. Govender* and U. Curle*
This work evaluates the deformation behaviour, at warm working temper-atures, of green particle-reinforced aluminium composites produced bypowder blending in a high-energy ball mill. The work focuses on metalmatrix composites (MMCs) based on the 2124-Al alloy, reinforced with 10or 15 vol.% SiC and metal matrix nanocomposites (MMNCs) based on the2124-Al alloy, reinforced with 5 or 10 vol.% Al2O3. Three batches for eachpowder were blended and powder properties such as particle size distri-bution (PSD) and shape were consistent after blending. It was observedthat a more uniform distribution of the reinforcement phase in thealuminium alloy matrix was achieved in 2124-Al/Al2O3 than in 2124-Al/SiC composites. The powders (unreinforced 2124-Al and blended) wereinitially over-aged at 350°C for 2 hours to reverse any natural ageing thatmay have occurred prior to use. The over-ageing was incorporated toimprove compressibility of the powders with the aim of achieving greencompacts with higher integrity. Uniaxial compression tests performed atambient temperature on a Gleeble® 3500 thermomechanical simulator wereunsuccessful as the green compacts fragmented. Engineering stress-straincurves showed that green compacts of unreinforced 2124-Al, 10%SiC MMCand 5%Al2O3 MMNC deformed in a similar manner at ambient temperatureand had the same compressive fracture stress of approximately 170 MPa.When the deformation temperature was increased from ambient to warmworking temperatures (170–280°C) it was observed that electricalresistance heating (the heating mode of the Gleeble®) of unreinforced Alalloy, MMC and MMNC green compacts did not occur. This was attributedto the high electrical conductivity of aluminium, which resulted in poorheat generation due to the low electrical resistance in the samples. It waspresumed that the small sample size (d=8 mm, h=12 mm) also causedrapid heat loss. After further experimentation, the green compacts wereheated successfully by insulating the samples to retain heat. It was foundthat at 280°C, increasing the soaking time from 6 to 20 minutes decreasedflow stress and improved plastic flow in the 2124-Al/10%SiC greencompact.
metal matrix composites, metal matrix nanocomposites, 2124-Al alloy.
* Materials Science and Manufacturing, Council forScientific and Industrial Research (CSIR).
† School of Chemical and MetallurgicalEngineering, University of the Witwatersrand,Johannesburg, South Africa.
‡ DST-NRF Centre of Excellence in StrongMaterials, hosted by University of theWitwatersrand, Johannesburg, South Africa.
© The Southern African Institute of Mining andMetallurgy, 2016. ISSN 2225-6253. This paperwas first presented at the AMI Ferrous and BaseMetals Development Network Conference 201619–21 October 2016, Southern Sun ElangeniMaharani, KwaZulu-Natal, South Africa.
963VOLUME 116 �
http://dx.doi.org/10.17159/2411-9717/2016/v116n10a11

Deformation behaviour of aluminium low-micron MMCs and MMNCs
Warm working has been shown to have some advantagesover both cold and hot working (Rao et al., 1999).Advantages of warm working over cold working include(Cavaliere, 2002):� Less strain hardening – fewer annealing operations� Increased plastic flow – lower loads are required� Higher metal ductility.
Warm working has lower processing costs than hotworking due to the lower energy requirement, longerequipment and tool life and better dimensional accuracy andsurface finish (Cavaliere, 2002). Operating at warm workingtemperatures may thus decrease processing costs while stillproducing high-quality products (Jensrud, 1998).
In this work, the deformation behaviour, at warmworking temperatures, of particle-reinforced aluminiumcomposites produced by powder blending in a high-energyball mill was evaluated through uniaxial compression testsperformed on a Gleeble® 3500 thermomechanical simulator.
A Simoloyer CM-01® 2L horizontal high-energy ball mill wasused to blend 2124 aluminium alloy (45–90 μm) powder (thematrix material) with reinforcing powders to form:� Low-micron aluminium metal matrix composites with
10 or 15 vol.% SiC (1–10 μm) as the low-micronreinforcement
� Metal matrix nanocomposites with 5 or 10 vol.% Al2O3
(40–70nm) as the nano-sized reinforcing phase. Three batches of 2124 aluminium alloy powder with
Al2O3 (MMNC) and three with SiC (MMC) powder wereblended to assess the consistency of blending. The powderswere characterized by particle size and shape analysis using aMicrotrac Bluewave® and were visually assessed by scanningelectron microscopy (SEM) on a JEOL JSM 6510®. The unrein-forced aluminium alloy powder and the blended powderswere then cold-compacted, i.e. at ambient temperature, intocylindrical green compacts with a diameter of 8 mm andheight of 12 mm in preparation for the uniaxial compressiontests.
The initial cold compaction trials of both the unreinforcedaluminium alloy powder and blended powders werechallenging as the green compacts fractured into horizontalslices. This was attributed to natural ageing of the Al alloypowder due to long-term storage. The powders (unreinforced2124-Al and blended) were then over-aged at 350°C for 2hours, which improved their compressibility and resulted ingreen compacts with better consolidation and no surfacecracks. The deformation behaviour of the unreinforced 2124aluminium alloy, MMC and MMNC green compacts wasevaluated by performing uniaxial compression tests on aGleeble 3500® thermomechanical simulator at approximately25°C and 280°C, a total strain of 0.1 and a strain rate of 0.01 s-1. The green compacts were soaked for 6 minutesbefore compression. The soaking time was then increased to20 minutes for the MMC green compact with 10 vol.% SiC toevaluate the effect of soaking time on deformation behaviour.
Three batches (referred to as batch 1, 2 and 3) of eachpowder were blended, which helped to assess if the propertiesthat were obtained after blending were consistent.
SEM micrographs of MMNC blended powders with 5 vol.%Al2O3 from three batches at 500× magnification are shown inFigure 1. From these images it can be observed that there arelighter, finer Al2O3 particles on the surface of the coarser,spherical 2124-Al alloy powder particles. The three batcheshave a relatively uniform distribution of Al2O3 particles onthe aluminium alloy particles. Figure 1a shows that some ofthe aluminium alloy particles have changed shape and somehave fractured into smaller particles. The change in particleshape can be attributed to plastic deformation that occurredduring blending.
Figure 2 shows a similarly uniform distribution of Al2O3
nano-sized particles on the 2124-Al powder particles, despitethe 5 to 10 vol.% increase in Al2O3. This finding contradictsresults found in liquid-state processing, where Borgonovoand Apelian (2011) found that the tendency of nanoparticlesto form agglomerates increased as their volume fraction inthe matrix increased. The even distribution found in thiswork (Figure 2) can be attributed to good blendingparameters, as well as the fact that any particle clusters thatmay have formed were ground as the blending processprogressed. This positive result is an indication that theproblems of agglomeration encountered in liquid-stateprocesses could be averted by using solid-state techniques.
The micrographs in Figure 3 show that all three 10% SiCbatches contained spherical 2124-Al alloy particlessurrounded by small, irregularly shaped SiC particles. As onlya small amount of the SiC particles coated the 2124-Al alloyparticles and a large amount of the SiC particles were loose, itcan be inferred that the SiC powder did not blend fully withthe aluminium alloy powder. This poor blending wasattributed to poor surface interaction between SiC and the2124-Al alloy particles.
�
964 VOLUME 116
a b c
a b c
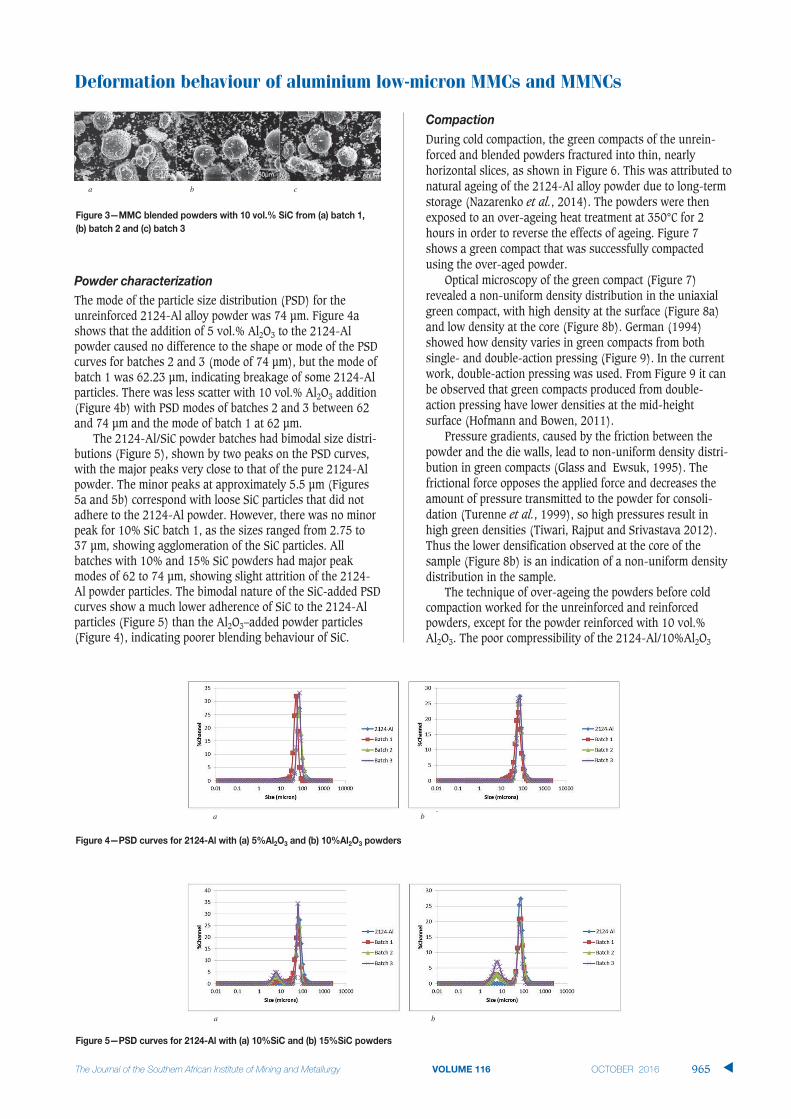
The mode of the particle size distribution (PSD) for theunreinforced 2124-Al alloy powder was 74 μm. Figure 4ashows that the addition of 5 vol.% Al2O3 to the 2124-Alpowder caused no difference to the shape or mode of the PSDcurves for batches 2 and 3 (mode of 74 μm), but the mode ofbatch 1 was 62.23 μm, indicating breakage of some 2124-Alparticles. There was less scatter with 10 vol.% Al2O3 addition(Figure 4b) with PSD modes of batches 2 and 3 between 62and 74 μm and the mode of batch 1 at 62 μm.
The 2124-Al/SiC powder batches had bimodal size distri-butions (Figure 5), shown by two peaks on the PSD curves,with the major peaks very close to that of the pure 2124-Alpowder. The minor peaks at approximately 5.5 μm (Figures5a and 5b) correspond with loose SiC particles that did notadhere to the 2124-Al powder. However, there was no minorpeak for 10% SiC batch 1, as the sizes ranged from 2.75 to 37 μm, showing agglomeration of the SiC particles. Allbatches with 10% and 15% SiC powders had major peakmodes of 62 to 74 μm, showing slight attrition of the 2124-Al powder particles. The bimodal nature of the SiC-added PSDcurves show a much lower adherence of SiC to the 2124-Alparticles (Figure 5) than the Al2O3–added powder particles(Figure 4), indicating poorer blending behaviour of SiC.
During cold compaction, the green compacts of the unrein-forced and blended powders fractured into thin, nearlyhorizontal slices, as shown in Figure 6. This was attributed tonatural ageing of the 2124-Al alloy powder due to long-termstorage (Nazarenko et al., 2014). The powders were thenexposed to an over-ageing heat treatment at 350°C for 2hours in order to reverse the effects of ageing. Figure 7shows a green compact that was successfully compactedusing the over-aged powder.
Optical microscopy of the green compact (Figure 7)revealed a non-uniform density distribution in the uniaxialgreen compact, with high density at the surface (Figure 8a)and low density at the core (Figure 8b). German (1994)showed how density varies in green compacts from bothsingle- and double-action pressing (Figure 9). In the currentwork, double-action pressing was used. From Figure 9 it canbe observed that green compacts produced from double-action pressing have lower densities at the mid-heightsurface (Hofmann and Bowen, 2011).
Pressure gradients, caused by the friction between thepowder and the die walls, lead to non-uniform density distri-bution in green compacts (Glass and Ewsuk, 1995). Thefrictional force opposes the applied force and decreases theamount of pressure transmitted to the powder for consoli-dation (Turenne et al., 1999), so high pressures result inhigh green densities (Tiwari, Rajput and Srivastava 2012).Thus the lower densification observed at the core of thesample (Figure 8b) is an indication of a non-uniform densitydistribution in the sample.
The technique of over-ageing the powders before coldcompaction worked for the unreinforced and reinforcedpowders, except for the powder reinforced with 10 vol.%Al2O3. The poor compressibility of the 2124-Al/10%Al2O3
Deformation behaviour of aluminium low-micron MMCs and MMNCs
965VOLUME 116 �
a b c
a b
a b

Deformation behaviour of aluminium low-micron MMCs and MMNCs
powder could have been due to the higher amount of Al2O3
on the surface of the 2124-Al particles, thus limiting theeffect of over-ageing and preventing plastic deformation andbonding. Al2O3 has a high heat resistance, so the Al2O3
coating could have acted as a barrier to heat transfer thuslimiting the effect of over-ageing, which meant that thehardness of the 2124-Al/10%Al2O3 powder was not changeddramatically by the over-ageing process (Pham, Maruoka andNanko, 2016). The presence of more Al2O3 particles on the
aluminium alloy particle surfaces, due to a higher vol.% Al2O3
added, could have increased the hardness of the reinforcedpowder even further, since Al2O3 has a higher hardness thanthe Al alloy (Auerkari, 1996).
Poor consolidation and very little plastic deformation orbonding occurred in the 2124-Al/10%Al2O3 composite, asshown in the polished section in Figure 10. Figure 10 showsthat there are nano-Al2O3 particles situated on the Al alloygrain boundaries. The micrograph supports the notion thatplastic deformation and bonding were limited by the presenceof Al2O3 particles on Al alloy particle surfaces.
Micrographs of the compacted 2124-Al/10%SiC powderare shown in Figures 11(a) and 11(b). These images showthat consolidation was achieved by localized deformation atgrain boundaries where there were few or no SiC particles.The same result was obtained for 2124-Al/15%SiC composite(not shown). This shows that in composite powders wherereinforcing particles have settled on grain boundaries, consol-idation is achieved by localized deformation at small contactpoints between matrix grains.
The uniaxial compression tests performed in the Gleeble3500® at ambient temperature were unsuccessful, as thegreen compacts fractured immediately under the compressiveload, as shown in Figure 12.
Engineering stress-strain curves from uniaxialcompression tests performed at ambient temperature (Figure 13) show the deformation behaviour of 2124-Alalloy, 2124-Al with 5%Al2O3 and 2124-Al with 10%SiC atambient temperature. The three materials behaved in asimilar manner during deformation since their stress-strain
�
966 VOLUME 116
a b
a b

curves follow the same trend. The compressive fracturestresses of the 2124-Al, 10% SiC MMC and 5% Al2O3 MMNCgreen compacts were similar at approximately 170 MPa. Thepeculiar shape of the stress-strain curves shows that thegreen compacts initially compressed and elastically deformedto a stress of approximately 170 MPa and then started tofracture as the plastic region was approached, leading to asharp decrease in stress.
In initial testing at a programmed temperature of 280°C,electrical resistance heating of the green compacts did notoccur, which was attributed to the high electrical conductivityand low resistance of aluminium. High electrical conductivityresulted in poor heat generation because electrical resistancein the samples was low (Ozturk et al., 2016). It waspresumed that the small sample size (d=8 mm, h=12 mm)also caused rapid heat loss .After further experimentation,the green compacts were heated successfully by using fibreoptic wool and a conductive foil wrapped around the samplesas insulation in order to retain heat.
The deformation behaviour of 2124-Al with 5% Al2O3,10% SiC and 15% SiC at 280°C is shown in Figure 14. Thepeaks of the curves represent the maximum flow stress. It isinteresting to see that the 10% SiC sample showed a higherflow stress (200 MPa) than the 15% SiC sample (170 MPa).This could be a result of improved consolidation duringcompaction of 2124-Al with 10% SiC compared with 15%SiC.
The higher temperature improved the shape of thecompression curves, removing the sudden drop in stress afterelastic deformation that was seen in the ambient temperaturetests. This indicates that the deformation was more uniform,which can be attributed to improved plastic flow due to anincrease in temperature (Osakada, 1997).
The soaking time was increased from 6 to 20 minutes forthe MMC green compact with 10 vol.% SiC to assess the effectof soaking time on deformation behaviour, as shown inFigure 15. The shape of the flow stress curve improved and itlooks more like a standard compressive stress-strain curve.The various points and regions (elastic region, plastic region,maximum flow stress and final fracture point) on the curvecan easily be identified. This shows that an increase insoaking time improved plastic flow in the material andimproved the deformation behaviour.
Increasing the soaking time from 6 to 20 minutesdecreased the maximum flow stress from 200 to approxi-mately 170 MPa. Holding the sample at an elevatedtemperature for an increased time leads to more atomsgaining energy, thus the flow of particles in the material isimproved (Arya et al., 2016). Deforming the material becameeasier and a lower load was required to deform the material.As the soaking time did have an effect on the deformationbehaviour it should be carefully selected.
The deformation behaviour, at warm working temperatures,of green particle-reinforced aluminium composites produced
Deformation behaviour of aluminium low-micron MMCs and MMNCs
VOLUME 116 967 �

Deformation behaviour of aluminium low-micron MMCs and MMNCs
by powder blending in a high-energy ball mill wasinvestigated by performing uniaxial compression tests in aGleeble 3500® thermomechanical simulator.
1. After blending, the morphology and size of the 2124-Al powder and the distribution of the SiC or Al2O3
reinforcing phase on the aluminium alloy particleswere consistent over three batches
2. A more uniform distribution of the reinforcementphase was achieved in 2124-Al composites with nano-Al2O3 than with micro-SiC
3. Long-term storage of the age-hardenable aluminiumalloy powders caused ageing, which results in achange in the powder characteristics such as hardness.Ageing was reversed by heat treatment of the unrein-forced and blended powders into the over-agedcondition
4. Electrical resistance heating of green compacts ofaluminium alloy 2124, its MMC composites with SiCand MMNC composites with Al2O3 can be improved byinsulating the samples with fibre optic wool and aconductive foil
5. The deformation of the 2124-Al alloy, 10% SiC MMCand 5% Al2O3 MMNC green compacts was poor atambient temperature and the compacts had similarcompressive fracture stresses. Improved deformationbehaviour was observed at 280°C and the MMC with10%SiC had the highest maximum flow stress(approx. 200 MPa)
6. Increasing the soaking time at 280°C from 6 to 20minutes decreased the maximum flow stress from 200 MPa to approximately 170 MPa and improved thecompressive deformation behaviour of the 2124-Al/10%SiC green compact.
ARYA, V., PADAP, A.K., KUMAR, M. and HIWARKAR, A.D. 2016. Mechanicalproperties and elcetroconductivity of aluminum alloys processed usinguniaxial compression. Proceedings of the 3rd International Conference onScience,Technology and Management (ICSTM-16), New Dehli. pp. 749–754. http://doi.org/978-81-932074-0-6
AUERKARI, P. 1996. Mechanical and physical properties of engineering aluminaceramics. Mechanical and physical properties of engineering aluminaceramics. Research Notes 1792. VTT Technical Research Centre ofFinland.
BORGONOVO, C. and APELIAN, D. 2011. Manufacture of aluminum nanocom-posites: a critical review. Materials Science Forum, vol. 678. pp. 1–22.http://doi.org/10.4028/www.scientific.net/MSF.678.1
CASATI, R. and VEDANI, M. 2014. Metal matrix composites reinforced by nano-particles—a review. Metals, vol. 4, no. 1. pp. 65–83.http://doi.org/10.3390/met4010065
CAVALIERE, P. 2002. Hot and warm forming of 2618 aluminium alloy. Journal ofLight Metals, vol. 2, no. 4. pp. 247–252. http://doi.org/10.1016/S1471-5317(03)00008-7
FERRY, M. 2005. Discontinuously reinforced metal matrix composites. TheDeformation and Processing of Structural Materials. Guo, X.Z. (ed.),Woodhead Publishing, UK. p. 203. https://books.google.co.za/books?hl=en&lr=&id=QbukAgAAQBAJ&oi=fnd&pg=PA203&dq=discontin-uously+reinforced+metal+matrix+composite&ots=LqdU3ZDaei&sig=Cseon0Y467mV9ggRLwo-v5CScyw#v=onepage&q=discontinuously reinforcedmetal matrix composite&f=false
GERMAN, R.M. 1994. Powder Metallurgy Science. (2nd edn). Metal PowderIndustries Federation, New Jersey.
GLASS, S.J. and EWSUK, K.G. 1995. Ceramic powder compaction. AmericanCeramic Society International Symposium on Manufacturing Practices andTechnology. http://doi.org/10.1557/S0883769400034709
HIRIANIAH, C.S.R.A., HARISHANAD, K.S. and NORONHA, N.P. 2012. A review on hotextrusion of metal matrix composites. RESEARCH INVENTY: InternationalJournal of Engineering and Science, vol. 1, no. 10. pp. 30–35.
HOFMANN, H. and BOWEN, P. 2011. Powder Technology. Part II: Compaction.Laboratory of Powder Technology, École Polytechnique Féderalé deLausanne.
JENSRUD, O. 1998. Warm-deformation and the age hardening response in twoaluminium alloys. Advanced Light Alloys and Composites. Springer,Dordrecht. pp. 415–420.http://doi.org/10.1007/978-94-015-9068-6_54
LIANG, X., EARTHMAN, J.C., WOLFENSTINE, J. and LAVERNIA, E.J. 1992. Acomparison of techniques for determining the volume fraction of partic-ulates in metal matrix composites. Materials Characterization, vol. 28, no. 4. pp. 173–178. http://doi.org/10.1016/1044-5803(92)90079-W
MAZEN, A.A. and EMARA, M.M. 2004. Effect of particle cracking on the strengthand ductility of Al-SiCp powder metallurgy metal matrix composites.Journal of Materials Engineering and Performance, vol. 13, no. 1. pp. 39–46. http://doi.org/10.1361/10599490417579
NAZARENKO, O.B., AMELKOVICH, Y.A. and SECHIN, A.I. 2014. Characterization ofaluminum nanopowders after long-term storage. Applied Surface Science,vol. 321. pp. 475–480. http://doi.org/10.1016/j.apsusc.2014.10.034
OSAKADA, K. 1997. Effects of strain rate and temperature in forming processesof metals. Le Journal de Physique IV, vol. 7. pp. 37–44.http://doi.org/10.1051/jp4:1997302
OZTURK, F., ECE, R.E., POLAT, N., KOKSAL, A., EVIS, Z. and SHEIKH-AHMAD, J.Y.2016. Application of electric resistance heating method on titanium hotforming at industrial scale. Arabian Journal for Science and Engineering.http://doi.org/10.1007/s13369-016-2159-6
PHAM, H.V., MARUOKA, D. and NANKO, M. 2016. Influences of Al2O3 grain size onhigh-temperature oxidation of nano-Ni/Al2O3 composites. Journal of AsianCeramic Societies, vol. 4, no. 1. pp. 120–123.http://doi.org/10.1016/j.jascer.2016.01.003
RAJPUT, R.K. 2007. Metal forming processes. A Textbook of ManufacturingTechnology: Manufacturing Processes (1st edn). Laxmi, New Dehli. pp. 142–143. https://books.google.co.za/books?id=6wFuw6wufTMC&pg=PA140&lpg=PA140&dq=journals+on+disadvantages+of+hot+working+metals&source=bl&ots=7F-q942-wt&sig=9Ioky-tAxuqmF9XBscLgJLcyRGc&hl=en&sa=X&ved=0ahUKEwiRybafuprNAhXhB8AKHZRjAOY4ChDoAQgbMAE#v=onepage&q=journal
RAO, B.K., KHADAR, M.S.A. and SRINIVASAN, K. 1999. High temperaturecompression testing and determination of warm working temperature forcommercial purity aluminium. Bulletin of Materials Science, vol. 22, no. 1.pp. 17–20. http://doi.org/10.1007/BF02745670
SARAVANAN, L. and SENTHILVELAN, T. 2015. Investigations on the hot workabilitycharacteristics and deformation mechanisms of aluminium alloy-Al2O3
nanocomposite. Materials & Design, vol. 79. pp. 6–14.http://doi.org/10.1016/j.matdes.2015.04.024
SELIG, S.G. 2012. Finite element simulation of the compaction and springbackof an aluminium powder metallurgy alloy. Dalhousie University.
TIWARI, S., RAJPUT, P. and SRIVASTAVA, S. 2012. Densification behaviour in thefabrication of Al-Fe metal matrix composite using powder metallurgyroute. ISRN Metallurgy, 2012, pp. 1–8.http://doi.org/10.5402/2012/195654
TURENNE, S., GODERE, C., THOMAS, Y. and MONGEON, P.E. 1999. Evaluation offriction conditions in powder compaction for admixed and die walllubrication. Powder Metallurgy, vol. 42, no. 3. pp. 263–268.http://doi.org/10.1179/003258999665611
ZHOU, J., DRUZDZEL, A. and DUSZCZYK, J. 1999. The effect of extrusion parameterson the fretting wear resistance of Al-based composites produced viapowder metallurgy. Journal of Materials Science, vol. 34, no. 20. pp. 5089–5097. �
�
968 VOLUME 116

Over the years it has become apparent thateven though high-chromium white cast ironsare highly efficient abrasion-resistant material,a combination of excellent wear resistance andfracture strength remains difficult to achieve.The exceptional wear resistance of high-chromium white cast iron (HCWCI) isattributed to hard chromium carbidesembedded in an austenitic/martensitic/pearliticmatrix. When the chromium contents exceed12 wt%, interconnected MC3-type carbides ofconventional cast irons are replaced by rod-shaped and isolated M7C3 carbides (Powell,1980), leading to an improvement in theimpact toughness, ductility and fatigueresistance. However, the main M7C3 carbidesin HCWCI are hard and brittle and can providean easy path for crack propagation. This limitsthe applications of HCWCI, particularly insevere impact conditions. Most operationsinvolving HCWCI are in crushing and grindingand the life of a part/liner is limited by its wearresistance. However, improving the wearresistance of HWCI comes at the cost of asignificant reduction in fracture strength.Concerns about premature failure of HCWCI
mill liners in the mining industries prompted astudy to improve the wear resistance andmechanical properties of HCWCI.
Addition of alloying elements to HCWCIcan significantly change the microstructure,which may result in adequate combinations ofwear resistance and fracture strength (Powell,1980; Filipovic et al., 2013). Most studieshave shown that eutectic carbides influencethe fracture strength of the white cast iron andby controlling the morphology of the carbidesand the matrix structure, can lead to majorimprovements in the fracture strength(Filipovic et al., 2013, 2014; Filipovic, 2013).Research and development is ongoing on theeffect of microalloying, heat treatments anddifferent casting techniques on the propertiesof HCWCI. This is aimed at widening theapplication of these alloys by extending theirservice life and minimizing the maintenancecost through addition of strong carbideformers such as vanadium, tungsten, niobiumand titanium (Liu et al., 2005; Radulovic etal., 1994; Sawamoto, Ogi and Matsuda, 1986;Anijdan et al., 2007; Chung et al., 2009; Lu,Soda and Mclean, 2003). Strong carbide-forming elements like vanadium, tungsten,niobium and titanium may also be added toimprove the mechanical properties (Filipovic,2013; Liu et al., 2005; Radulovic et al., 1994).
Addition of vanadium to HCWCI can formvanadium carbides, which are much harderthan M7C3 carbides and may lead tostrengthening of the austenitic matrix andimprove the fracture strength of the HCWCI(Liu et al., 2005). The hardness of vanadiumcarbides differs with composition; their roundmorphology reduces splitting to the matrix and
Grain refinement of 25 wt% high-chromium white cast iron by addition ofvanadiumby L.A. Mampuru*, M.G. Maruma* and J.S. Moema*
Mill liner wear is a major cost item in the mining industry and there iscontinuous research to prolong the life of the liners. Over the years it hasbecome apparent that even though high-chromium white cast irons arehighly efficient as abrasion-resistant materials, a combination of wearresistance and fracture strength remains difficult to achieve. Increasingthe hardness of the high-chrome white cast iron (HCWCI), which improvesthe resistance to abrasion wear, is often accompanied by a deterioration infracture strength. Operational conditions inside the mill require that theliner should be made of highly wear-resistant material with some fracturestrength. Vanadium additions ranging from 0.2 to 3 wt% were made toHCWCI in an attempt to refine the microstructure. It was found that anincrease in vanadium content promotes grain refinement. A content of 1.5-3 wt% gave the best results as measured by the maximum breakingstrength.
HCWCI, mill liners, grain refinement, hardness.
* Advanced Materials Division, Mintek, Randburg,South Africa.
© The Southern African Institute of Mining andMetallurgy, 2016. ISSN 2225-6253. This paperwas first presented at the AMI Ferrous and BaseMetals Development Network Conference 201619–21 October 2016, Southern Sun ElangeniMaharani, KwaZulu-Natal, South Africa.
969VOLUME 116 �
http://dx.doi.org/10.17159/2411-9717/2016/v116n10a12

Grain refinement of 25 wt% high-chromium white cast iron by addition of vanadium
improves the fracture strength due to formation of a fine-grained microstructure (Nelson, 2010; Liu et al., 2005).Dupin and Schissler (1984), as quoted by Filipovic (2013),indicated that the addition of as little as 1% vanadium doesnot produce any vanadium carbides, but refines the eutecticcarbides. This conclusion is supported by Bedolla-Jacuinde(2001), who indicated that even the addition of 2 wt.%vanadium did not form any vanadium carbides but increasedthe volume fraction of the M7C3 carbides (Filipovic,Kamberovic and Korac, 2011).
Most of the work to date has been aimed at improving thetough of HCWCI, mostly on the hypereutectic alloys. Theresearch was centred on modifying the shape of carbides butthere has been no breakthrough. The work in this currentstudy focuses on improving the fracture strength of hypoeu-tectic white cast iron by the addition of vanadium.
Melting of the HCWCI alloy was accomplished in a mediumfrequency induction furnace with a capacity of about 150 kg.The molten metal was poured into a sand mould and allowedto cool to room temperature. The chemical compositions ofthe alloys produced are given in Table I. The test materialsproduced for this project consisted of HCWCI in the form of50 × 100 × 500 mm flat rectangular test bars (i.e. thickness ×width × length) as shown in Figure 1a.
The alloys were examined for surface defects beforeproceeding with testing and there was no indication ofdefects (Figure 1b). The specimens were then polished andetched with 3% Nital. The microstructural analysis wascarried out using an Olympus PGM optical microscopeequipped with Analysis Image software and a scanningelectron microscope
Brinell hardness measurements were performed throughthe cross-sections of the as-cast test samples, using a load of750 kg. The measurements were taken from the surface tothe centre of the rectangular test sample to ascertain if therewere any hardness gradient changes within the test sample.It was found that the difference was minimal. Bending testsare intended for brittle materials when the scope of test is todetermine the strength of material. To determine the bendingstrength Qmax, the beam must be so proportioned that it willnot fail in shear or by lateral deflection before reaching itsultimate flexural strength. Hence, for a rectangular part in athree-point bending test, bending strength is the higheststress at the moment of rupture. Usually, long specimenswith higher length to depth ratio (L/h >10) arerecommended.
The microstructure of the as-cast reference alloy is shown inFigure 2a. The microstructure consists of primary austenitedendrites surrounded by a eutectic mixture of carbideparticles and austenite. In hypoeutectic cast iron, solidifi-cation proceeds with austenite, eutectic vanadium carbides(VC) and finally M7C3 carbides. It can been seen from Figure2a that the M7C3 carbides are of a rod and needle type ofmorphology and that the stress concentration factor will playa larger role when the material is exposed to an impact.Addition of vanadium to HCWCI has changed the needle-shaped M7C3 to an isotropic morphology. This change in thecarbide morphology may play a critical role in determiningthe fracture strength of the HCWCI.
The scanning electron microscope analysis of the alloy inthe as-cast condition and corresponding EDS compositionmaps are shown in Figures 3 to 5. One can see that theelement distributions are consistent with the identifiedphases in the microstructure. The microanalysis of the phasesshown in Table II reveals that V substituted Cr and Fe in M7C3
up to about 2.5 wt% V. V was also dissolved into theaustenitic matrix, reaching a maximum of about 0.3 wt%.The presence of vanadium carbide particles in M7C3, whichwould result in significant refinement of the M7C3 carbides byacting as the heterogeneous substrates of M7C3 carbides, was
�
970 VOLUME 116
Table I
Reference ASTM A 532 Class IIIAlloy 1 ASTM A 532 Class III + 0.2-0.8VAlloy 2 ASTM A 532 Class III+ 0.8-1.5VAlloy 3 ASTM A 532 Class III+1.5-3.0V

not observed. The results are in agreement with those ofDupin and Schissler (1984), who did not detect vanadiumcarbide formation in HCWCI with 1% V additions. This maybe due to the lower vanadium content as reported bySawamoto et al. and the literature has indicated thatvanadium carbide can form when the V content exceeds 5%(Sawamoto, Ogi and Matsuda, 1986). This is in contradictionto the work by Filipovic (2013), which indicated thatvanadium-rich carbides are found in Fe–Cr–C–V ironscontaining 1.19–4.73% V.
However, the grain refinement effect of M7C3 carbideswith an increase in vanadium content can be explained bytheir influence on the eutectic solidification temperature.Filipovic, Kamberovic and Korac (2011) indicated that theaddition of V decreased the liquidus temperature andincreased the eutectic temperature, thus the eutectic solidifi-cation temperature interval was decreased. It has beenpreviously reported that the carbides’ spacing increases withthe increase in the eutectic temperature range, so thedecreasing eutectic temperature interval effectively reducedthe carbides’ spacing due to the addition of V (Ogi,Matsubara and Matsuda, 1982).
Effect of vanadium on the hardness of the HCWCI is shownin Table III. The hardness of the material is directly propor-tional to the wear resistance, i.e. an increase in hardness willlead to improved wear resistance. It can be seen from TableIII that the bulk hardness increased and then decreased withincreasing vanadium addition
The variation in hardness is attributed to two factors.Firstly, vanadium dissolves in the austenite and improvesaustenite hardness by solid solution strengthening. Secondly,from the microstructural analysis using SEM, vanadiumexisted in M7C3 carbides and this may have increased thehardness of M7C3 carbides as Ma et al. (2013) indicated. Theresults in Table III indicate that addition of vanadium led toimproved wear resistance while retaining the fracturestrength.
Table IV shows the experimental results of the fracturestrength. Vanadium contributes to the improvement offracture strength of Fe–Cr–C–V alloys in the as-cast conditionas measured by the stress required to fracture the HCWCI.This increase in fracture strength indicates that the vanadiumaddition had a beneficial effect on the properties of HCWCI.Figures 3 to 5 show a clear dispersion of the vanadium in thematrix, and this might have led to matrix hardening/strengthening and hence improved the fracture strength.
Grain refinement of 25 wt% high-chromium white cast iron by addition of vanadium
971VOLUME 116 �
Table II
ASTM A 532 Class III + 0.2-0.8%V M7C3 1.2 0.6 67.7 30.5
Matrix 1.1 0.1 16.5 81.4
ASTM A 532 Class III+ 0.8-1.5%V M7C3 1.5 0.3 68.4 29.6
Matrix 0.2 0.25 19.4 79.2
ASTM A 532 Class III+1.5-3.0%V M7C3 2.6 2.5 60.3 34.1
Matrix 1.0 0.3 13.4 83.5
Table III
ASTM A 532 Class III 432ASTM A 532 Class III + 0.2-0.8%V 555ASTM A 532 Class III+ 0.8-1.5%V 485ASTM A 532 Class III+1.5-3.0%V 514Trace elements: 0.5% V (Matrix 0.9), 1% V (Matrix 0.9) (M7C3 0.2) and 2%
V (Matrix 1.8) (M7C33 0.5

Grain refinement of 25 wt% high-chromium white cast iron by addition of vanadium
Morphology of the particles also plays a role. It can beenseen from Figure 2 that in the reference HCWCI, the M7C3
carbides are of the rod and needle type and therefore thestress concentration factor will play a bigger role when thematerial is exposed to an impact. The tip of the needle typecarbides will act as a stress riser and thus lead to reduction infracture strength. The increase in fracture strength broughtabout by increasing the vanadium content is also inagreement with the results of Liu et al. (2005), whoattributed the increase in fracture strength to the finerprimary austenite dendrites. Changing the morphology fromrod to isotropic therefore leads to a significant increase infracture strength.
The main aim of this project is to improve the mechanicalproperties of high-chromium white cast iron (HCWCI) for millliners with special emphasis on improving the fracturestrength of these alloys. The influence of vanadium on thegrain refinement of HCWCI was investigated. The addition ofvanadium was found to change the morphology of eutecticcarbides from plate- and rod-like shapes to isotropic shapes.Addition of vanadium led to an increase in fracture strengthin the cast structure. This was due to the fine-grainedmicrostructure and increased matrix strength through adispersion-hardening effect of vanadium – the fine secondarycarbides can increase the mechanical support offered by theeutectic carbides.
ANIJDAN, S.H.M., BAHRAMI, A., VARAHRAM, N. and DAVAMI, P. 2007. Effects oftungsten on erosion–corrosion behaviour of high chromium white castiron. Materials Science and Engineering A, vol. 454–455. pp. 623–628.
BEDOLLA-JACUINDE, A. 2001. Microstructure of vanadium, niobium and titanium-alloyed high-chromium white cast irons. International Journal of CastMetals Research, vol. 13. pp. 343–361.
CHUNG, R.J., TANG, A., LI., D.Y., HINCKLEY, B. and DOLMAN, K. 2009. Effects oftitanium addition on microstructure and wear resistance of hypereutectichigh chromium cast iron Fe-25wt. %Cr-4wt. %C. Wear, vol. 267, no. 1–4.pp. 356–351.
DUPIN, P. and SCHISSLER, J.M. 1984. A structural study of chromium white castiron. American Foundry Society Transactions, vol. 92. pp. 355–360.
FILIPOVIC, M. 2013. Fe-Cr-C-V white cast iron - the microstructure andproperties. Faculty of Technology and Metallurgy, University of Belgrade,Belgrade, Serbia.
FILIPOVIC, M., KAMBEROVIC, Z. and KORAC, M. 2011. Solidification of high
chromium white cast iron alloyed with vanadium. Materials Transactions,
vol. 52. pp. 386–390.
FILIPOVIC, M., KAMBEROVIC, Z., KORAC, M. and GAVRILOVSKI, M. 2013. Correlation of
microstructure with the wear resistance and fracture toughness of white
cast iron alloys. Metals and Materials International, vol. 19, no. 3.
pp. 473–481.
FILIPOVIC, M., KORAC, M. and KAMBEROVI , Z. 2014. The effect of vanadium
content and heat treatment on wear resistance and fracture toughness of
Fe-Cr-C-V alloy. Metallurgical and Materials Engineering, vol. 20, no.1.
pp. 1–13.
LIU, K., WANG, F., LI, C. and SU, L. 2005. Influence of vanadium on
microstructure and properties of medium-chromium white cast iron. Iron
and Steel, vol. 10 (Supplement). pp. 207–211.
LIU, K., WANG, F., LI, C. and SU, L. (2005). Influence of vanadium on
microstructure and properties of medium-chromium white cast iron. Iron
and Steel, vol. 40 (Supplement). pp. 207–211.
LU, L., SODA, H. and MCLEAN, A. 2003. Microstructure and mechanical properties
of Fe-Cr-C eutectic composites. Materials Science and Engineering A,
vol. 347. pp. 214–222.
MA, Y., LI, X., LIU, Y., ZHOU, S. and DANG, X. 2013. Microstructure and
properties of Ti–Nb–V–Mo-alloyed high chromium cast iron. Bulletin of
Materials Science, vol. 36, no. 5. pp. 839–844.
NELSON, G.D. 2010. The influence of microstructure on the corrosion and wear
mechanisms of high chromium white irons in highly caustic solutions.
School of Mechanical Engineering, University of Adelaide, South
Australia.
OGI, K., MATSUBARA, Y. and MATSUDA, K. 1982. Eutectic solidification of high
chromium cast iron - mechanism of eutectic growth. AFS Transactions,
vol. 89. pp. 197–204.
POWELL, G.L.F. 1980. Morphology of eutectic M3C and M7C3 in white iron
castings. Materials Forum, vol. 3. pp. 37–40.
RADULOVIC, M., FISET, M., PEEV, K. and TOMOVIC, M. 1994. Influence of vanadium
on fracture toughness and abrasion resistance in high chromium white
cast iron. Journal of Material Science, vol. 29, no. 19. pp. 5085–5094.
SAWAMOTO, A., OGI, K. and MATSUDA, K. 1986. Solidification structure of Fe-C-
Cr-(V-Nb-W) alloys. AFS Transactions, vol. 72. pp. 403–416.
SAWAMOTO, A., OGI, K. and MATSUDA, K. 1986. Solidification structures of Fe–C–
Cr–(V–Nb–W) alloys. AFS Transactions, vol. 94, no. 86–72. pp. 403–416.
ZHI, X., XING, J., FU, H. and XIAO, B. 2008. Effect of niobium on the as-cast
microstructure of hypereutectic high chromium cast iron. Materials
Letters, vol. 62. pp. 857–860. �
�
972 VOLUME 116
Table IV
ASTM A 532 Class III 184 400 332ASTM A 532 Class III + 0.2-0.8%V 192 000 346ASTM A 532 Class III+ 0.8-1.5%V 212 700 383ASTM A 532 Class III+1.5-3%V 306 400 552

Metal injection moulding (MIM) is a novelprocess, which combines the advantages ofpowder metallurgy (PM) and plastic injectionmoulding. MIM has found widespreadapplications in the cost-effective production ofhigh-sintered density small parts withcomplicated shapes and mechanical propertiesequivalent to those of wrought materials(German and Bose, 1977; Machaka andChikwanda, 2015; German, 2013). There arefour basic processing steps involved in MIM,namely; feedstock preparation, injectionmoulding, debinding and sintering. Thesesteps are discussed in greater detail elsewhere(Machaka, Seerane and Chikwanda, 2014;German and Bose, 1977; Machaka andChikwanda, 2015; German, 2013).
Feedstock preparation involves mixingmetal powder with a carefully selectedcomposition of polymeric binder materials at aspecific temperature. The feedstock is thengranulated and injected into a predefinedmould die with the desired shape. The part
produced during the moulding step is referredto as a ‘green’ component. The greencomponent typically contains no porosity sincethe spaces between adjacent powder particlesare readily filled with the binder materials(German and Bose, 1977; Li, Li and Khalil,2007). Debinding is the systemic removal ofthe binder components by chemical, catalytic,or/and thermal means while maintaining theshape of the component. The part producedafter the debinding step is referred to as a‘brown’ component. Debinding is known to bethe source of porosity in brown components (Jiet al., 2001; Tsai and Cen, 1995). Finally, thebrown debound part is sintered to full or near-full density (Sotomayor, Várez and Levenfeld,2010). The sintering step and associateddensification closes up the majority of thepores. Sintered MIM parts are typically sinteredto high density (95–99%) and retain anirreducible amount of residual porosity(Barriere, Liu and Gelin, 2003; German,1990).
Direct powder rolling (DPR) of metalpowders is a fairly new process (Cantin andGibson, 2015). The DPR process consists of (i)roll compaction, sintering, mechanical workingand/or heat treatment (Ro, Toaz and Moxson,1983) or (ii) roll compaction, hot rolling,mechanical working and/or heat treatment(Cantin et al., 2011). The rolling mill consol-idates the powders into green compacts (Parket al., 2012; Chikosha, Shabalala andChikwanda, 2014; Cantin et al., 2010;Peterson, 2010). The green compacts producedvia DPR contain pores between the consol-idated powder particles. Sintering or hot rolling
X-ray computed microtomographystudies of MIM and DPR partsby N.S. Muchavi*, L. Bam‡, F.C. De Beer‡, S. Chikosha* and R. Machaka*
Parts manufactured through power metallurgy (PM) typically containpores that can be detrimental to the final mechanical properties. Thispaper explores the merits of 3D X-ray computed tomography overtraditional microscopy for the characterization of the evolution of porosityin metal injection moulding (MIM) and direct powder rolling (DPR)products. 17-4 PH stainless steel (as-moulded, as-debound and sintered)dog-bone samples produced via MIM and Ti-HDH strips (as-rolled andsintered) produced via DPR and were analysed for porosity. 3D micro-focus X-ray tomography (XCT) analysis on specimens from both processesrevealed spatial variations in densities and the existence of characteristicmoulding and roll compaction defects in agreement with traditionalmicroscopic microstructural analysis. It was concluded that micro-focusXCT scanning can be used to study MIM and DPR parts for the characteri-zation of the amount, position and distribution of porosity and otherdefects. However, the majority of the sub-micron sized pores could not beclearly resolved even at the highest possible instrument resolution.Higher-resolution scans such as nano-focus XCT could be utilized in orderto fully study the porosity in MIM and DPR parts.
X-ray tomography, metal injection moulding, direct powder rolling, 17-4 PH stainless steel, titanium.
* Light Metals, Materials Science andManufacturing, Council for Scientific andIndustrial Research, Pretoria, South Africa.
† Radiography/Tomography Section, Necsa,Radiation Science Department, Pretoria, SouthAfrica.
© The Southern African Institute of Mining andMetallurgy, 2016. ISSN 2225-6253. This paperwas first presented at the AMI Ferrous and BaseMetals Development Network Conference 201619–21 October 2016, Southern Sun ElangeniMaharani, KwaZulu-Natal, South Africa.
973VOLUME 116 �
http://dx.doi.org/10.17159/2411-9717/2016/v116n10a13

X-ray computed microtomography studies of MIM and DPR parts
followed by mechanical working and/or heat treatment isperformed to reduce the pores, resulting in a highly densifiedpart (Qian, 2010; Froes et al., 2004). The number, distri-bution and evolution of pores throughout the DPR stages arederived from the measured densities. The methods used fordensity studies of powder metallurgy parts such asdimensional measurements and the hydrostatic Archimedesmethod can be labour-intensive and time-consuming as theycan involve sectioning and infiltrating specimens (Bateni,Parvin and Ahmadi, 2011; Martin et al., 2003). As such,nondestructive material testing such as gamma radiology,ultrasonic tomography, eddy current measurements andmicro-focus X-ray computed tomography ( XCT) becomeattractive alternative ways of identifying and characterizingporosity and other flaws in a material (Bateni, Parvin andAhmadi, 2011; Kohn, 1972).
Recent developments have seen a growing interest inXCT analysis both as a characterization and quality
inspection technique in material science; it has beensuccessfully applied to many different materials (Heldele etal., 2006; Kara and Matula, 2015; O’Brien and James, 1988;Yang, Zhang and Qu, 2015a; Lunel, 2013; Mutina andKoroteev, 2012; Tammas-Williams et al., 2015; du Plessis etal., 2016; Alcica et al., 2010) to show the resolvablemicrostructural features such as second-phase particulates aswell as defects such as inclusions, pores and cracks (Maire etal., 2001). To date, the application of XCT analysis inpowder metallurgy has been explored by several groups: deChiffre et al. surveyed existing systems, scanning capabilitiesand technological advances on a variety of XCT scanningtechnologies while reviewing the state of the industrialapplications of XCT methods in general. Bateni, Parvin andAhmadi (2011) conducted in situ density measurements onporous PM compacts using XCT techniques. O'Brien andJames (1988), Yang, Zang and Qu (2015a) and Kara andMatula (2015) reviewed the application of XCT techniques toissues relating to powder compaction and compact ejection forPM components. Ma, Li and Tang (2016) applied XCTtechnique in characterizing the microstructural evolution anddensification mechanisms during the sintering of steelpowders. Aldica et al. (2010) used XCT in the characteri-zation of mechanically alloyed MgB2 superconductormaterials consolidated by spark plasma sintering. Heldele etal (2006), Weber et al. (2011), Yang, Zhang and Qu (2015b)and Fang et al. (2014) investigated various aspects of MIMparts using XCT. No literature sources currently available
report on the application of XCT techniques to study thepowder rolling process or intermediate MIM debinding stages.However, available literature shows that XCT techniqueshave found widespread quality inspection application instudying porosity formation in additive manufactured metalcomponents and the formation of porosity therein (Tammas-Williams et al., 2015; du Plessis et al., 2016).
This paper explores the merits of 3D XCT over traditionalmicroscopy and inspection techniques for the characterizationof the evolution of 3D pore distribution, concentration andsize in MIM and DPR products. This technique will offer moredetailed results than the traditional microscopy technique,which provides only 2D surface information of the specimen.
A bimodal 17-4 PH stainless steel powder material wasprepared for this work. It consisted of -15 m and -5 mpowder materials blended in a 75:25 weight ratio, respec-tively; both materials were supplied by Atmix Corp. JP. Figure 1 shows the representative powder particle sizes andspherical morphologies as observed under a JEOL JSM – 6510scanning electron microscope (SEM).
Table I summarizes the starting metal powder particlesizes measured using a laser scattering particle size analyser(Microtrac Bluewave). The material identification codes PS-15 and PS-5 represent the particle sizes -15 m and -5 m,respectively. Table II shows the typical chemical compositionsof the metal powder materials as obtained from the supplier’sdata specification sheets.
An injection-ready MIM feedstock was prepared bycompounding the bimodal 17-4 PH stainless steel powdermaterial with a proprietary wax-polymer binder systemdeveloped at the CSIR (Machaka and Chikwanda, 2015). Thebinder system consists of a major fraction of paraffin wax, a
�
974 VOLUME 116
Table I
PS-15 2.65 7.91 23.1PS-5 1.98 4.04 7.90

blend of low-density polyethylene, polypropylene and astearic acid surfactant of less than 1 wt.% of the bindersystem composition. The feedstock was prepared in a sigma-type blade mixer for at least 1 hour at 140°C in air.
Upon cooling, the feedstock was appropriately granulatedand injection-moulded into standard MPIF ‘dogbone’ tensilespecimens. The injection moulding was done at 140°C usingan ARBURG Allrounder 270U 400-70 injection mouldingmachine.
Debinding of green parts was performed in two steps. Thefirst step was solvent extraction of the low-molecular-weightsolvent-soluble binder components in n-heptane (Merck) at60°C for up to 24 hours. The sample was subsequently driedbefore being weighed to obtain the percentage weight loss ofthe binder. The second step was thermal decomposition of thebackbone binder during the pre-sintering cycle. This wasaccomplished in a Carbolite tube furnace under a controlledflowing argon atmosphere at 550°C. The mechanism of thisthermal debinding procedure has been reported elsewhere(Machaka and Chikwanda, 2015; Machaka, Seerane andChikwanda, 2014; Seerane, Chikwanda and Machaka, 2015)
The thermally debound components were sintered at1300°C for 4 hours followed by furnace cooling. The argongas flow was maintained at 1.0 L/min. The microstructure,density, microhardness and tensile properties of the sinteredcomponents were investigated accordingly.
Ti-HDH 100 mesh (-150 m) powders supplied by ChengduHuarui Industrial in China were used. The powders wererolled in a modified Schwabenthal Polymix 150T rubber millwith a roll diameter of 170 mm. The rolling speed was set at10 r/min with a roll gap of 0.3 mm. The set strip width wasvaried at 20, 50 and 100 mm.
The masses of the strips were measured using an OhausExplorer balance, the length and width were measured usinga Vernier caliper and the thickness was measured using a TAmicrometer screw gauge. Five measurements were taken foreach parameter and an average value used. The green densityof each strip was calculated using the measured mass, length,width and thickness of the compact strips.
Sintering was carried out in a Carbolite tube furnace at1300ºC for 3 hours followed by furnace cooling. Argon wasused as an inert atmosphere at 1 L/min. After sintering, thedensity of each strip was measured using an Ohaus Explorerdensity determination kit based on the Archimedes principleaccording to ASTM standard B311. The sintered compactswere sectioned into several pieces, mounted, ground andpolished according to standard metallography procedures.The microstructures of the polished samples were recordedusing a DM5000 optical microscope with Image Pro-AMS 603software for recording the micrographs.
Representative as-moulded green component, dried browncomponents and final sintered components were probed bymeans of XCT to investigate the evolution of the poresthroughout the stages of MIM processing (injectionmoulding, debinding and sintering). For the DPR process,sintered samples that were 20, 50 and 100 mm wide wereprobed to investigate the residual porosity in terms of theposition and distribution.
The X-ray computed tomography scans were conducted atthe Micro-focus X-ray Radiography/Tomography (MIXRAD)laboratory using the NIKON XTH 225ST system based at theSouth Africa Nuclear Energy Corporation (Necsa) (Hoffmanand Beer, 2012). The high-resolution system consists of atungsten target with a 3.7 m spot size with a variableenergy potential of approximately 25 to 225 kV. Themaximum resolution achievable at the detector is 200 m.Each sample was scanned at a potential of 115 kV and beamcurrent of 100 A to obtain beam penetration > 10% frombackground. During the scan the sample rotated in equalangular steps through 360° to produce 1000 radiographs ateach step angle, which were then reconstructed using the CT-Pro 3D-reconstruction software (Hoffman and Beer, 2012).The reconstruction process transforms the acquired 2Dradiographs into a virtual 3D volume that is an exact digitalcopy of the sample. This virtual 3D volume was analysedusing VGStudioMAX (ver. 2.2) rendering software, whichallows rendering of the sample in 3D. The background isrepresented by darker grey values, whereas the sample haslighter/bright grey values. This grey value difference wasused to determine porosity distribution within the samples.
Figure 2 depicts the differences between the as-mouldedgreen, solvent-debound and sintered components. Thesurface appearance of specimens (a–c) gives an indication ofthe binder lost from the green state to the sintered state andthis equates to the level of shrinkage that occurred. Specimen(b) underwent solvent debinding and no significantshrinkage difference was observed relative to the as-mouldedpart. The linear shrinkage of the sintered sample (Figure 2(c)) was calculated to be 12.5%.
The as-sintered dogbone specimens were used for tensiletests without any preparation. The mechanical properties ofunimodal 17-4 PH stainless steel feedstock specimens are
X-ray computed microtomography studies of MIM and DPR parts
975VOLUME 116 �
Table II
17-4 PH ≤ 0.5 ≤ 0.3 3.0–5.0 15.5–17.5 3.0–5.0 0.15–0.45 Bal.

X-ray computed microtomography studies of MIM and DPR parts
reported elsewhere (Seerane, Ndlangamandla and Machaka,2016). Table III summarizes the mechanical properties ofmetal-injection-moulded 17-4 PH stainless steel obtained inthis study. The values are well above minimum standardstipulated values (MPIF, 2016; ASTM International, 2005).
The densities of the sintered specimens were determinedaccording to ASTM B311 (Archimedes method). Specimenhardness was determined at room temperature using theVickers hardness testing procedure.
Unless purposely intended (Chen et al., 2016), sintered MIMparts are typically sintered to high density (95–99%); a smallamount of residual porosity may arise from (a combinationof) poorly formulated feedstock, the debinding process, gasentrapment during sintering and/or incomplete sintering ofmetal particles (German and Bose, 1977; German. 2013;Machaka, Seerane and Chikwanda, 2014).
Figure 3 to Figure 5 illustrate the XCT 3D analysis ofreconstructed green, solvent-debound and sintered MIMparts. The three steps conducted in each case involved (a)reconstructing the 3D surface from raw data, (b) histogramsegmentation and identification of the open pores and interiorpores and inclusions from the background and (c) separatingthe various individual components identified in Figure 2 forstructural properties such as relative volume, spatial distri-bution, domain size and shape distributions, specific area,interconnectedness and spatial orientation.
The reconstructed surface in Figure 3a shows the holisticsurface integrity of the green part and can also be used as aversatile inspection tool (for obvious moulding defects andresolvable surface porosity) and for dimensionalmeasurements. In Figure 3b, the 3D distribution surface andinterior pores in the green part volume are determined, whilein Figure 3c the identified defects are analysed in isolation.The results aid the visualisation of the size and spatial distri-bution of injection moulding defects. A maximum defectvolume of approximately 0.05 mm3 was identified; however,no MIM-specific standards have been developed to determineif such defect volumes are reparable in subsequent steps. It ishas been shown that some defects do occur in green partsand these defects can be avoided or controlled by adoptinggood tooling design and optimizing injection mouldingparameters (see Nor et al., 2009).
Figure 4a shows a reconstructed 3D surface image of thesolvent-debound part that shows no evidence of surfaceporosity. From Figure 3a, it is also apparent that the shapeform and dimensions of the green part are largely retained inthe brown part. The visualization of the debinding defectsand resulting surface porosity shows a two-fold increase inthe relative pore density to approximately 0.10 mm3 inFigures 4b and 4c. This observation is expected since theextraction of the soluble binder during solvent debinding isknown to be the source of porosity in the brown part (Ji et al.,2001; Tsai and Chen, 1995). Hwang, Shu and Lee (2005)have also demonstrated that pore channels develop and theaverage pore size increases as solvent debinding proceeds.
Figure 4b shows remarkable differences between thesurface regions and the interior due to varying materialdensity. This difference can be used to determine porositydistribution towards the sample surfaces arising from thedevelopment of pore channels and increasing average poresize during solvent debinding (Hwang, Shu and Lee, 2005).
Perhaps the most compelling evidence for the use oftomographical probing techniques to non-destructivelyinvestigate the 3D internal structure of MIM-prepared 17-4 PH stainless steel is shown in the analysis of thesintered part illustrated in Figure 5. Figure 5a shows areconstructed 3D surface image of a selected sintered partexhibiting only some occurrences of open pores. Figure 5band Figure 5c however reveal the existence of an uncharac-teristically large irregular subsurface feature with a maximumdefect volume of approximately 1.00 mm3.
�
976 VOLUME 116
Table III
This study 7.6 661 838 6.4 308#Standards 7.5 650 790 4.0 279
# indicates that the hardness values were converted from HRC to HV inaccordance with ASTM A370 – 03A (ASTM International, 2003)

MIM-fabricated 17-4 PH stainless steel parts are intrin-sically susceptible to porosity (Murray et al., 2011; James,2015) which arises from innumerable sources during MIMprocessing. However, after sintering, the pores are typicallynear-spherical in morphology; see Figure 6a for example. Theorigin of the ‘uncharacteristically large irregular pore’ featureis attributed to either incomplete die cavity filling during theinjection moulding stage or (most probably) a combination ofpore formation due to gas entrapment (thermal debindingevolved products) during sintering (German and Bose, 1977)and the shrinkage porosity, since it is located in the thickestsection of the part. Such features are uncommon and aretherefore seldom reported. The observed open surface poresafter sintering can be attributed to either the residual porosityfrom solvent debinding, voids remaining after thermaldebinding, or the evaporation of alloy elements (chromiumand manganese) due to their high vapour pressure duringhigh-temperature sintering (Murray et al., 2011).
A typical secondary electron SEM micrograph of the as-polished 17-4 PH sintered specimen is presented in Figure6a. The pores are evenly distributed and primarily sphericalin morphology; indicating that at 1300°C, sinteringprogressed to its final possible stages.
The pore sizes and distribution were determined byevaluating the SEM micrographs using ImageJ software(Schindelin et al., 2015). The pore size distribution
histogram obtained from comprehensive image analysis ispresented in Figure 6b. The pore sizes observed exhibit alognormal peak (distribution mode approx. 1.0 m) with thelargest pores typically less than 4.5 m in diameter. Thelargest pore sizes obtained from the image analysis are muchsmaller than those detected by the lowest resolution of 10 mthat can be achieved by the XCT machine even after havingcompromised on the size of the piece to be analysed.
Ti-HDH 100 mesh (-150 m) powders were supplied byChengdu Huarui Industrial Co., Ltd in China. The powderparticle sizes and morphology are reported elsewhere(Motsai, 2016). The powders were roll compacted. Figure 7shows photographs of rolled strips that are 20, 50 and 100 mm wide. By observation, the rolled strips demonstrate
X-ray computed microtomography studies of MIM and DPR parts
VOLUME 116 977 �

X-ray computed microtomography studies of MIM and DPR parts
good densification without exhibiting obvious signs ofwarping, cracking and alligatoring, which are typical rollingdefects (Park et al., 2012; Joo et al., 2005).
Table IV summarizes the properties of the green (rolled)and brown (sintered) Ti-HDH strips. The hardness values forthe higher density 20 mm strips were closer to the commer-cially pure Ti grade 4. The hardness values were reduced forthe lower density 50 mm and 100 mm strips. A reduction inhardness has been observed in powder metallurgycomponents and is due to the amount of pores in thecomponents (Dutta and Bose, 2012). The density resultsshow an increase after sintering. However, full density wasnot achieved by sintering for all the strips.
Sintering of the strips in Figure 7 was carried out. Results ofthe sintering studies showed that full density was notachieved at the selected sintering condition used. Thesemeasured densities do not provide any information regardingthe position and distribution of the pores within the strips.Therefore, microscopy was carried out to determine the distri-bution of porosity within the strips. The 20 mm strip was cutin half along the rolling direction, mounted and polished.Figure 8a shows a micrograph taken to include the edge ofthe strip. It can be seen that the strip had a lower density atthe edge (right side of the micrograph) which increasedtowards the centre (left side of micrograph) of the strip. Forsamples larger than 20 mm, several samples were cut fromthe edge, midway between edge and centre and centre of thestrips. Figure 9b and 9c show the micrographs of the 100 mm wide strip from the centre and the edge of the stripsrespectively. It is clear from the micrographs that the porositypattern is similar to that of the 20 mm strips was observed,with the density being higher at the centre and lower at theedge of the compact.
It was also observed that after sintering, warping of thestrips occurred. The microscopy studies showed that thesintered strips had non-uniform density across the width,which implies non-uniform density in the green strips aswell. Density variations within the green strip are known tocreate residual stresses and cause different densification ratesduring sintering, which ultimately cause the dimensionaldistortions (Khoei, 2995). It is therefore plausible that theobserved dimensional distortions (warping) of the sinteredstrips in this study are a consequence of the non-uniformdensity within the strips.
In order to understand the extent of density variations in theDPR strips, an alternative XCT scanning technique was used.
The XCT scanning technique was evaluated for use as a non-destructive test for detecting non-uniform densities, with theadditional benefit of elimination of the tedious microscopystudies required to map DPR strips that are long and wide.
By way of illustration, Figure 9 shows the visualization of3D XCT data on a section of the 20 mm wide sintered rolledstrip. Similarly to the MIM XCT results shown in Figure 3,three analysis steps were conducted in each case involving(a) reconstructing the 3D surface, (b) the identification of theopen pores, interior pores and inclusions and (c) isolating theopen pores, interior pores and inclusions identified in (b) forstructural properties and visualisation
The reconstructed surface in Figure 9a shows the surfacedefects such as chipping of the strip at the edges and thedifferent grey levels characteristic of the varying densities. Noother rolling defects are detected in the strip. Figure 9b showsthe 3D distribution of pores in the sintered volume whileFigure 9c shows the pores in isolation. The result confirmsthe presence of density variations in the sintered DPR stripsas shown by the microscopy studies. Furthermore, XCT wasable to show that the pores are concentrated at the edges ofthe strips, with some detected in the transverse direction torolling as is typical of compacts produced by non-optimalrolling conditions. Using traditional techniques to detect thesedensity changes, sections of the strips are cut up, mountedand polished to look for porosity differences in the compacts.This process is destructive and tedious. In this study the
�
978 VOLUME 116
Table IV
20 mm wide strip 3.7 4.3 26850 mm wide strip 3.2 4.0 185100 mm wide strip 3.2 4.0 180ASTM CP Grade 4 Ti 4.51 280

visualization of the density variation and edge porosity ismade clear in Figure 9b and 9c.
Results from this study show that XCT scanning issuitable for characterizing small-sized samples such as the20 mm wide strip shown in Figure 9. However, when theexamination of bigger samples such as the 50 and 100 mmwide strips was attempted, the overall instrument resolutionwas compromised, making it difficult to resolve the porestructures. Owing to the size effects, it was necessary tosection wider or longer strips to small sections, requiring alarge number of scans to map out a significant size of thecompacts. This diminished the benefit of non-destructivetesting and ability to map out the densities for wider andlonger strips.
An important advantage of the XCT method is that nospecific sample preparation is needed. Detailed quantitativeand qualitative information obtained in this study relating tothe 3D internal structure of MIM-prepared 17-4 PH stainlesssteel and DPR-prepared parts shows that XCT is a powerfulnon-invasive and non-destructive measurement techniquethat can be very useful for research purposes. Structuralparameters such as relative volume, spatial distribution, sizeand shape distributions, specific area, connectivity andorientation are resolved with the benefit of colour-codedvisualization of individual pores and inclusions according tovolume.
Analysis of MIM and DPR parts demonstrated:i. XCT scanning conducted in this study demonstrated
the capabilities by detecting the amount, position, anddistribution of the pores in MIM and DPR parts, as wellas detecting sub-surface features such as shrinkagepores as seen on the sintered MIM parts
ii. Comparative XCT and SE-SEM shows that the spatialresolution of the XCT will limit the smallestdetectable variations in the as-produced poroussamples. Features smaller than the resolution will notbe measured correctly. Based on the findings, it istherefore, concluded that a higher resolution scansuch as X-ray nano-tomography has to be used tostudy porosity evolution in these parts
iii. The examination of different pore structures in wideror longer rolled strip samples (such as the 50 and 100 mm) with XCT was not successfully achieved
with the required resolution, without the need tosection the wider or longer strips into small sections,thus requiring a large number of scans.
The contributions of Ntate Sam Papo, Mandy Seerane, HildaChikwanda and Pierre Rossouw are duly recognized. Thiswork is funded by the DST and the CSIR. NSM acknowledgesthe NRF for financial support through the DST-NRFInternship Programme. The authors are also indebted toAtmix Corp. (JP) for the supply of powder materials used inthe preparation of MIM components.
ALDICA, G., TISEANU, I., BADICA, P., CRACIUNESCU, T. and RINDFLEISCH, M. 2010. X-ray micro-tomography as a new and powerful tool for characterization ofMgB2. Superconductor. Juiz, A.M. (ed.). Sciyo.
ASTM INTERNATIONAL. 2005. ASTM B883-05, Standard Specification for MetalInjection Molding (MIM) Ferrous Materials. West Conshohocken, PA.
ASTM INTERNATIONAL. 2003. ASTM A370-03a, Standard Test Methods andDefinitions for Mechanical Testing of Steel Products. West Conshohocken,PA.
BARRIERE, T., LIU, B. and GELIN, J.C. 2003. Determination of the optimal processparameters in metal injection molding from experiments and numericalmodeling. Journal of Materials Processing Technology, vol. 143–144.pp. 636–644.
BATENI, A. PARVIN, N. and AHMADI, M. 2011. Density evaluation of powdermetallurgy compacts using in situ X-ray radiography. Powder Metallurgy,vol. 54, no. 4. pp. 533–536.
CANTIN, M.A. and GIBSON, G.M.D. 2015. Titanium sheet fabrication from powdertitanium. Powder Metallurgy. Qian, M. and Froes, F.H. (eds.). Elsevier. pp. 383–403.
CANTIN, G.M.D., KEAN, P.L., STONE, N.A., WILSON, R., GIBSON, M.A., YOUSUFF, M.,RITCHIE, D. and RAJAKUMAR, R. 2011. Innovative consolidation of titaniumand titanium alloy powders by direct rolling. Powder Metallurgy, vol. 54.pp. 188–192.
CANTIN, D., KEAN, P., STONE, N.A., WILSON, R,. GIBSON, M.A., RITCHIE, D. andRAJAKUMAR, R. 2010. Direct powder rolling of titanium. Proceedings ofTitanium 2010, Orlando, Florida, 3–6 October 2010. InternationalTitanium Association, Northglenn, CO.
CHEN, J., CHEN, L., CHANG, C.-C., ZHANG, Z., LI, W., SWAIN, M.V. and LI, Q. 2016.Micro CT based modelling for characterising injection moulded poroustitanium implants. International Journal for Numerical Methods inBiomedical Engineering. [DOI: 10.1002/cnm.2779].
CHIKOSHA, S., SHABALALA, T.C. and CHIKWANDA, H.K. 2014. Effect of particlemorphology and size on roll compaction of Ti-based powders. PowderTechnolology, vol. 264. pp. 310–319.
DE CHIFFRE, L., CARMIGNATO, S., KRUTH, J.P., SCHMITT, R. and WECKENMANN, A.(2014). Industrial applications of computed tomography. CIRP Annals -Manufacturing Technology, vol. 63, no. 2. pp. 655–667.
X-ray computed microtomography studies of MIM and DPR parts
VOLUME 116 979 �

X-ray computed microtomography studies of MIM and DPR parts
DU PLESSIS, A., LE ROUX, S.G., BOOYSEN, G. and ELS, J. 2016. Directionality ofcavities and porosity formation in powder-bed laser additive manufac-turing of metal components investigated using X-ray tomography. 3DPrinting and Additive Manufacturing, vol. 3, no. 1. pp. 48–55.
DUTTA, G. and BOSE, D. 2012. Effect of sintering temperature on density,porosity and hardness of a powder metallurgy component. InternationalJournal of Emerging Technology and Advanced Engineering, vol. 2, no. 8. pp. 121–123.
FANG, W., HE, X., ZHANG, R., YANG, S. and QU, X. 2014. The effects of fillingpatterns on the powder–binder separation in powder injection molding.Powder Technolology, vol. 256. pp. 367–376.
FROES, F.H., MASHL, S.J., HEBEISEN, J.C., MOXSON, V.S. and DUZ, V.A. 2004. Thetechnologies of titanium powder metallurgy. JOM, vol. 56. pp. 46–48.
GERMAN, R. 2013. Progress in titanium metal powder injection molding.Materials, vol. 6. pp. 3641–3662.
GERMAN, R.M. 1990. Powder injection molding. Metal Powder IndustriesFederation, Princeton, NJ.
GERMAN, R.M. and BOSE, A. 1977. Injection Molding of Metals and Ceramics.Metal Powder Industries Federation Princeton, NJ.
HELDELE, R., RATH, S., MERZ, L., BUTZBACH, R., HAGELSTEIN, M. and HAUSSELT, J.2006. X-ray tomography of powder injection moulded micro parts usingsynchrotron radiation. Nuclear Instruments and Methods in PhysicsResearch Section B: Beam Interactions with Materials and Atoms, vol. 246, no. 1. pp. 211–216.
HOFFMAN, J.W. and BEER, F.C.D.E. 2012. Characteristics of the micro-focus X-ray tomography system at the MIXRAD facility at NECSA in South Africa.Proceedings of the 18th World Conference on Nondestructive Testing,Durban, South Africa, 16–20 April 2012. South African Institute for Non-Destructive Testing. http://www.ndt.net/article/wcndt2012/papers/37_wcndtfinal00037.pdf
HWANG, P.S.K..S., SHU, G.J. and LEE, H.J. 2005. Solvent debinding behavior ofpowder injection molded components prepared from powders withdifferent particle sizes. Metallurgical and Materials Transactions,vol. 36no. 1. pp. 161–167.
JAMES, W.B. 2015. ASM Handbook, vol. 7. 922 p.
JOO, S.H., CHANG, H.J., BANG, W.H., HAN, H.N. anD OH, K.H. 2005. Analysis ofalligatoring behavior during roll pressing of DRI powder with flat rollerand indentation-type roller. Materials Science Forum, vol. 475–479. pp. 3223–3226.
KARA , Ł. and MATULA, G. 2015. Review of innovation in using X-raytomography for non-destructing analysing of the green parts. Journal ofAchievements in Materials and Manufacturing Engineering, vol. 73, no. 2. 139 p.
KHOEI, A. 2005. Computational Plasticity in Powder Forming Processes.Elsevier, Tehran.
KOHN, H.W. 1972. Non-destructive testing. Journal of General Education, vol.24. pp. 176–178.
LI, Y., LI, L. and KHALIL, K.A. 2007. Effect of powder loading on metal injectionmolding stainless steels. Journal of Materials Processing Technology, vol. 183. 432 p.
JI, C.H., LOH, N.H. KHOR, K.A. and TOR, S.B. 2001. Sintering study of 316Lstainless steel metal injection molding parts using Taguchi method: finaldensity. Materials. Science and Engineering A, vol. 311. pp. 74–82.
LUNEL, M. 2013. Structure Characterisation of catalysts using X-ray micro-computed tomography, PhD thesis, University of Birmingham, UnitedKingdom.
MA, J., LI, A. and TANG, H. 2016. Study on sintering mechanism of stainlesssteel fiber felts by X-ray computed tomography. Metals, vol. 6, no. 1. 18 p.
MACHAKA, R. and CHIKWANDA, H.K. 2015. Kinetics of titanium metal injectionmoulding feedstock thermal debinding. Proceedings of the SeventhInternational Light Metals Technology Conference, (LMT 2015), PortElizabeth, South Africa, 27–29 July 2015. Chikwanda, H.K..and Chikosha,S. (eds.). pp. 1–6.
MACHAKA, R., SEERANE, M. and CHIKWANDA, H.K. 2014. Binder development formetal injection moulding: a CSIR perspective. Advances in PowderMetallurgy and Particulate Materials - 2014. Proceedings of the 2014World Congress on Powder Metallurgy and Particulate Materials, PM2014, Orlando, Florida, 18–22 May. Metal Powder Industries Federation.pp. 43–58.
MAIRE, E., BUFFIÈRE, J.Y., SALVO, L., BLANDIN, J.J., LUDWIG, W. and LÉTANG, J.M.(2001). X-ray micro-tomography an attractive characterisation techniquein materials science. Advanced Engineering Materials, vol. 3, no. 8. pp. 539–546.
MARTIN, P., HASKINS, J., THOMAS, G. and DOLAN, K. 2003. Advanced NDEtechniques for powder metal components. Proceedings of the InternationalConference on Powder Metallurgy and Particulate Materials (PM2TEC2003), Las Vegas, Nevada, 8–12 June 2003. Metal Powder IndustriesFederation, Princeton, NJ.
MOTSAI, T.M., CHIKOSHA, S., BHERO, S. and CHIKWANDA, H.K. 2016. Investigationof pressing and sintering of Ti-HDH powder. Proceedings of Ferrous 2016,Ferrous and Base Metals Development Network (FMDN), (In Press).
MPIF. 2016. MPIF Standard 35, Materials Standards for Metal Injection MoldedParts. 2016 edn. Metal Powder Industries Federation (MPIF), Princeton,NJ.
MURRAY, K., COLEMAN, A.J., TINGSKOG, T.A. and WHYCHELL D.T. SR. 2011. Effect ofparticle size distribution on processing and properties of MIM 17-4PH.International Journal of Powder Metallurgy, vol. 47, no. 4. pp. 21–28.
MUTINA, A. and KOROTEEV, D. 2012. Using X-ray microtomography for the threedimensional mapping of minerals. Microscopy and Analysis, vol. 26, no. 2. pp. 7–12.
NOR, N.H.M., MUHAMAD, N., ISMAIL, M.H., JAMALUDIN, K.R., AHMAD, S. andIBRAHIM, M.H.I. 2009. Flow behaviour to determine the defects of greenpart in metal injection molding. International Journal of Mechanical andMaterials Engineering, vol. 4. pp. 70–75.
O’BRIEN, R.C. and JAMES, W.B. 1988. A review of nondestructive testingmethods and their applicability to powder metallurgy processing. MPIFSeminar on Prevention and Detection of Cracks in Ferrous P/M Pads,International Powder Metallurgy Conference and Exhibition. pp. 1–17.
PARK, N.K., LEE, C.H., KIM, J.H. and HONG, J.K. 2012. Characteristics of powder-rolled and sintered sheets made from HDH Ti powders. Key EngineeringMaterials, vol. 520. pp. 281–288.
PETERSON, S. 2010. Investigation of the Hot deformation of Sintered TitaniumCompacts Produced from Direct reduction Powder. Masters thesis,University of Cape Town, South Africa.
Qian, Mn. 2010. Cold compaction and sintering of titanium and its alloys fornear-net- shape or preform fabrication. International Journal of PowderMetallurgy, vol. 46, no. 5. pp. 29–44.
RO, D.H., TOAZ, M.W. and MOXSON, V.S. 1983. The direct powder-rolling processfor producing thin metal strip. JOM, vol. 35, no. 1. pp. 34–39.
SCHINDELIN, J., RUEDEN, C.T., HINER, M.C. and ELICEIRI, K.W. 2015. The ImageJecosystem: An open platform for biomedical image analysis. MolecularReproduction and Development, vol. 82, nos. 7–8. pp. 518–529.
SEERANE, M., CHIKWANDA, H. and MACHAKA, R. 2015. Determination of optimumprocess for thermal debinding and sintering using Taguchi method.Materials Science Forum, vol. 828–829. 138 pp.
SEERANE, M., NDLANGAMANDLA, P. and MACHAKA, R. 2016. The influence ofparticle size distribution on the properties of metal-injection-moulded 17-4 PH stainless steel. Proceedings of Ferrous 2016, Ferrous and BaseMetals Development Network (FMDN), (In Press).
SOTOMAYOR, M.E., VÁREZ, A. and LEVENFELD, B. 2010. Influence of powder sizedistribution on rheological properties of 316L powder injection mouldingfeedstocks. Powder Technology, vol. 200, nos. 1–2. pp. 30–36.
TAMMAS-WILLIAMS, S., ZHAO, H., LÉONARD, F., DERGUTI, F., TODD, I. and PRANGNELL,P.B. 2015. XCT analysis of the influence of melt strategies on defectpopulation in Ti–6Al–4V components manufactured by selective electronbeam melting. Materials Characterization, vol. 102. pp. 47–61.
TSAI, D.S. and CHEN, W.W. 1995. Solvent debinding kinetics of alumina greenbodies by powder injection molding. Ceramics International, vol. 21, no. 4.pp. 257–264.
WEBER, O., RACK, A., REDENBACH, C., SCHULZ, M. and WIRJADI, O. 2011.Micropowder injection molding: investigation of powder-binder separationusing synchrotron-based microtomography and 3D image analysis.Journal of Materials Science,vol. 46, no. 10. pp. 3568–3573.
YANG, S.-D., ZHANG, R.-J. and. QU, X.-H. (2015a). X-ray tomography analysis ofaluminum alloy powder compaction. Rare Metals. pp. 1–7.
YANG, S., ZHANG, R. and QU, X. 2015b. Optimization and evaluation of metalinjection molding by using X-ray tomography. MatererialsCharacterization, vol. 104. pp. 107–114. �
�
980 VOLUME 116

For the past few years Mintek has beeninvolved in a project in which a number ofalloys have been identified for grinding mediaapplications. The high-chromium white castiron (HCWCI) alloys were among the alloysresearched for this application. The knowledgeacquired from the grinding ball media researchhas now been extended to mill liners, whichhave traditionally been made of manganese-,chromium- and chrome-molybdenum steels.The replacement of worn mill liners costs themining industry a significant amount ofmoney and this has led to a need forcontinuous research to prolong the life of theliners. During milling operations, liner wearhas an adverse effect on the capacity of themill, the energy efficiency and millingefficiency and finally leads to relining, toreplace worn liners.
The mill efficiency depends on the chargemotion, which in turn is largely influenced bythe liner profiles and performance. The choiceof a liner requires a holistic approach thatexamines the compatibility with the millconditions, the mechanical performance andthe cost-effectiveness. The operatingconditions in a fine grinding mill require thatthe liner should be made of highly wear-
resistant material with some fracture strengthsuch as (HCWCI).
HCWCI contains a minimum of 2%C with achromium content ranging from 15% to 35%.The term ‘white cast iron’ refers to theappearance of a white fractured surface in thematerial after damage, due to the presence ofwhite cementite. This material has beenproven to be effective for applications inaggressive environments where wear anderosion resistance are required. The high wearresistance of HCWCI is attributed to themicrostructural constituents such as hardprimary and/or eutectic carbides of M7C3
(where M is iron, chromium and other strongcarbide formers) and a relatively ductileferrous matrix (Bedolla-Jacuinde et al., 2005,2007; Adler and Dogan, 1999; Dogan, Hawkand Laird, 1997; Stevenson and Hutchings,1995; Radzikowska, 2004). Austenitizing at atemperature above 1100°C leads to the precipi-tation M7C3 carbides while below 1100°C theprecipitation of both M7C3 and M23C6 carbides,which are rich in alloying elements, occurs(Kootsookos and Gates, 2008). The precipi-tation of secondary carbides lowers the alloycontent in the dendritic austenite and thusraises the martensite start temperature, hencethe formation of martensite upon cooling(Cetinkaya, 2006).
The hardness of M7C3 is in the range of1200 HV (Stevenson and Hutchings, 1995),which may vary with the composition and theferrous matrix binds the hard M7C3 carbidesand provides the material with certain fracturestrength that is vital for handling high impactforces (Bedolla-Jacuinde et al., 2005;
Effect of niobium on the solidificationstructure and properties ofhypoeutectic high-chromium white castironsby M.E. Maja*†, M.G. Maruma*, L.A. Mampuru* and S.J. Moema*
The most commonly used high-chromium white cast iron (HCWCI) is thehypoeutectic white cast iron that contains 2–3.5 wt.% C and 10–30% Cr.This type of material relies on hard, brittle M7C3 carbides to impart goodwear resistance. Due to its good wear resistance, this material has foundapplication in the mining industry and cement industry. However, it haslow fracture strength and this challenge led to research aimed at refiningthe microstructure. This was done by the addition of niobium in the rangebetween 0.1 and 0.6 wt.%. In the as-cast condition, the addition of niobiumwas found to increase the fracture strength due to the finer eutecticmicrostructure. The hardness was also found to have increased slightlycompared to the reference alloy with no niobium additions. Low fracturestrength after heat treatment was observed in the Nb-added HCWCI, whichis believed to have been caused by the precipitation of secondary carbidesand the transformation of the matrix from austenite to martensitic.
HCWCI, niobium, grain refinement, fracture strength.
* Advanced Materials Division, Mintek Randburg,Johannesburg, South Africa.
† Tshwane University of Technology, Pretoria,South Africa.
© The Southern African Institute of Mining andMetallurgy, 2016. ISSN 2225-6253. This paperwas first presented at the AMI Ferrous and BaseMetals Development Network Conference 201619–21 October 2016, Southern Sun ElangeniMaharani, KwaZulu-Natal, South Africa.
981VOLUME 116 �
http://dx.doi.org/10.17159/2411-9717/2016/v116n10a14

Effect of niobium on the solidification structure and properties of hypoeutectic
Cetinkaya, 2006; Lewellyn et al., 2004). Through appropriateheat treatment and alloying, different structures of the matrixcan be formed. Pearlite, martensite and austenite are amongthe typical microstructures of the matrix (Radzikowska,2004; Cetinkaya, 2006; Lewellyn et al., 2004; Correa et al.,2007; Thorpe and Chicco, 1985; Dolman, 2005). HCWCIsthus typically have high strength and hardness.
However, HCWCIs have low fracture strength. Theobjective of this project is to improve the life and mechanicalproperties of the current HCWCI alloys through grainrefinement. Grain refinement is the only strengtheningmethod that also improves the fracture strength of iron. Manyresearchers (Zhang et al., 2014; Zhi et al., 2008a, 2008b)have attempted to improve the mechanical properties ofHCWCI through grain refinement, especially in hypereutecticHCWCI. However, their work focused more on improving thewear resistance by increasing the hardness. This workfocuses more on improving the fracture strength of thematerials by the addition of niobium as a grain refiner.Increasing the fracture strength of HCWCI will open doors forother application outside of the mining industry.
Three HCWCI alloys were melted in a medium-frequencyinduction furnace with a capacity of about 150 kg. Chargematerial was prepared to give the targeted chemistry asshown in Table I.
The test materials produced for this project consisted ofHCWCI in the form of 50 mm × 100 mm × 500 mmrectangular flat test bars (thickness × width × length) asshown in Figure 1. The alloys were examined for surfacedefects before proceeding with testing. Cast iron mould boxes(0.5 m length, 0.38 m width and 0.14 m depth) were used to
accommodate both the drag (bottom) and cope (top) parts ofthe pattern.
The alloys were austenitized at 875°C for 3 hours and forceair-quenched. Force air-quenching was chosen for anincreased cooling rate to avoid the formation of a pearliticmicrostructure. The samples were then tempered at 450°C for3 hours then air-cooled to room temperature. This wasemployed to transform all the retained austenite.
Specimens were removed from the heat-treated samples,polished and etched with Murakami and 3% nital. Themicrostructural analysis was carried out using an OlympusPGM optical microscope equipped with Analysis Imagesoftware and by scanning electron microscopy.
Brinell hardness measurements were performed through thecross-sections of the as-cast and heat-treated test samples,using a load of 750 kg. The measurements were taken fromthe surface to the centre of the rectangular test pieces toevaluate whether there were any hardness changes withinthe test sample.
Bending tests are intended for brittle materials when thescope of test is to determine the strength of material.Specimens with dimensions of 50× 100 × 500 mm were used.The cast blocks were placed in the specially designed mandreland the load applied to break them without any preparationto the samples (i.e. machining). The specimen is placed ontwo supports that are 300 mm apart (L) and the force appliedin the exact middle of the two supports (L/2). To determinethe bending strength Qmax, the beam must be so proportionedthat it will not fail in shear or by lateral deflection beforereaching its ultimate flexural strength. Hence, for arectangular part in a three-point bending test, the bendingstrength is the highest stress at the moment of rupture.Usually, long specimens with higher length to depth ratio(L/h >10) are recommended.
The microstructures of the as-cast alloys, depicted in Figure 2, consist of primary austenite dendrites surroundedby a eutectic mixture of carbide particles and austenite. It canbeen seen from Figure 2 that the M7C3 carbides are rod- andneedle-like in morphology and that the stress concentrationat the tips of the needle-type carbides will play a major rolewhen the material is subjected to impact loading. Addition ofniobium to HCWCI has changed the morphology of the rod-shaped M7C3 to isotropic. This change in carbide morphologyplays a critical role determining the fracture strength of theHCWCI.
Etching with 3% nital revealed the presence of a thin darklayer surrounding the eutectic carbides. This layer was found
�
982 VOLUME 116
Table I
Alloy 1 ASTM A 532 Class IIIAlloy 2 ASTM A 532 Class III + 0.1-0.4NbAlloy 3 ASTM A 532 Class III+ 0.4-0.6Nb

to be martensite (Figure 3). According to the literature (ZumGahr and Eldis, 1980; Matsubara et al., 2001; Turenne et al.,1989; Tabrette and Sare, 1998, 1997, 2000; Tabrette et al.,1996) the formation of the eutectic carbides in contact withthe primary austenitic phase leads to excessive consumptionof carbon and chromium in the interfacial region, depletingthese elements in the interface and increasing the Ms
temperature. As a result, martensite forms at the periphery ofthe primary carbide particles.
The role of the Nb in grain refinement can be explainedas follows. The formation of the first precipitated NbC reducesthe carbon available to form primary M7C3 carbides and as aresult the volume fraction and the size of the primary M7C3
carbides decreases (Zhi et al., 2008b). The concentration ofNb in the matrix and M7C3 is very low as this element tendsto partition into NbC in the Fe-Cr-Cr (Zhi et al., 2008b;Hannes and Gates, 1997; Coelho et al., 2003; Baik and Loper,1998). This results in niobium enrichment at the grainboundaries of the carbides during solidification until NbCprecipitates due to solubility of Nb at the grain boundariesbeing exceeded. The precipitated NbC impedes the prefer-ential directional growth of the M7C3 carbides and result infiner, isotropic carbides (Fiset et al., 1993; Zhi et al., 2008b).
Figure 4 shows the microstructural analysis of the HCWCIafter heat treatment. It is evident that the morphology of themicrostructure has changed significantly from the as-castcondition. After heat treatment the microstructures revealsthe presence of primary and eutectic carbides in a martensiticmatrix. Precipitation of secondary carbides during austeni-tising resulted in the depletion of carbon in the austenite andduring quenching the austenite partially transformed tomartensite (see Figure 5). Addition of niobium resulted ingrain refinement of the HCWCI.
The presence of NbC was also evident from SEM-EDXmapping as shown by the dark spots in Figures 6 and 7.Niobium is a strong carbide-forming element and it has beenfound that NbC particles are formed before the precipitationof primary carbides when niobium is added into the melts(Fiset et al., 1993).
The effect of niobium on the hardness of HCWCI is also givenin Table II. It can be seen that the as-cast hardness firstlyincreases with the addition of Nb and then decreases with afurther increase in niobium.
Effect of niobium on the solidification structure and properties of hypoeutectic
983VOLUME 116 �

Effect of niobium on the solidification structure and properties of hypoeutectic
�
984 VOLUME 116

The decrease in hardness can be attributed to a decreasein the carbide volume fraction. The formation of the firstprecipitated carbides consumed carbon in the alloy, so thetotal volume fracture of M7C3 was reduced. The relationshipbetween total carbide volume fraction and carbon content(weight fraction) is described as follows (Zhou and Su, 1986,as quoted in Matsubara et al., 2001):
Vtotal = 12.33C + 0.55Cr – 15.2 [1]
Decreasing carbon and chromium lead to a decrease inthe total volume fraction of carbides and hence to a decreasein bulk hardness.
The effect of niobium content on the maximum stressrequired to break the HCWCI is indicated in Table III. It can beseen from the results that niobium has a more positive effecton the fracture strength than on the hardness. It should bementioned that the impact strength does not depend only onthe matrix but also on the volume fraction, distribution,morphology and size of the carbides.
The stress concentration factor plays a bigger role whenthe material is exposed to impact forces. The micro-cracks ofcarbides propagate quickly along the direction of minimumresistance. Rod- and needle-like carbides provide anenvironment for high stress concentration and an easy pathfor crack propagation, hence they have low fracture strength.Increasing the niobium content led to a finer eutecticmicrostructure, which was beneficial to the mechanicalbehaviour of the alloy. Finer, isotropic carbides weaken thestress concentration factor compared to rod-and needle-likecarbides (Ma et al., 2013). This will lead to a decrease in the
crack propagation rate and when the alloy is subjected toimpact, the stress on the carbides can be rapidly transferredto the soft austenite.
As-cast specimens show better fracture strengthcompared to the heat-treated samples. This can be attributedto the austenite matrix acting as a cushion/arrester of crackpropagation by preventing brittle cracks from propagatingdirectly from one carbide grain to another (Ma et al., 2013).Low fracture strength after heat treatment can also be due tothe precipitation of secondary carbides and the transfor-mation of the matrix from austenite to martensite. However,on the other hand the martensitic matrix is alsorecommended for greater hardness and better wear propertiesat the expense of fracture strength.
The aim of the project was to improve the mechanicalproperties of the current high-chromium white cast iron(HCWCI) mill liner material by applying grain refinement. Theaddition of niobium was found to change the morphology ofthe eutectic carbides from a plate- and rod-like shape to anisotropic shape. The change in morphology was due theprecipitation of niobium carbides (NbC) at the grainboundaries, which impedes the directional growth of theM7C3 carbides and result in finer, isotropic carbides. Initialaddition of niobium led to an increase in hardness andfurther increase in niobium lead to decrease in hardness ofthe HCWCI. This trend was attributed to the decrease incarbon content available to form chromium carbides, due toformation of NbC.
Effect of niobium on the solidification structure and properties of hypoeutectic
VOLUME 116 985 �
Table II
Reference 4320.1–0.4%Nb alloy 4850.4–0.6%Nb alloy 438Reference (HT) 4570.1–0.4%Nb alloy (HT) 3540.4–0.6% Nb alloy (HT) 426
Table III
Reference 184 400 3320.1–0.4%Nb alloy 314 450 5660.4–0.6%Nb alloy 425 400 767Reference (HT) 223 500 4020.1–0.4%Nb alloy (HT) 201 200 3620.4–0.6%Nb alloy (HT) 372 650 671

Effect of niobium on the solidification structure and properties of hypoeutectic
The addition of Nb led to a significant improvement in thefracture strength of both the as-cast and heat-treated alloys.This increase in fracture strength was due to the finer eutecticmicrostructure. There was a general decrease in the fracturestrength after heat treatment, which is attributed to theprecipitation of secondary carbides and the transformation ofthe matrix from soft austenite in as-cast condition to hardand brittle martensite after heat treatment. Austenite has ahigher intrinsic fracture strength compared to martensite, butstrain-induced martensite from impact forces may furtherenhance the fracture strength.
Industrial liners will be produced using the optimizedchemistry. This will be done to validate the laboratory resultsand for ease of comparison with what is currently in themarket.
The authors thank Mintek for financial support and forpermission to publish this article.
ADLER, T.A. and DOGAN, O.N. 1999. Erosive wear and impact damage of high-
chromium white cast irons. Wear, vol. 229. pp. 174–180.
BAIK, H.K. and LOPER, C.R. 1998. The influence of niobium on the solidification
structure of Fe-C-Cr alloys. American Foundry Society Transactions,
vol. 96. pp. 405–412
BEDOLLA-JACUINDE, A., CORREA, R.I. MEJÍAA, I., QUEZADAA, J.G. and RAINFORTH,
W.M. 2007. The effect of titanium on the wear behaviour of a 16%Cr
white cast iron under pure sliding. Wear, vol. 263. pp. 808–820.
BEDOLLA-JACUINDE, A., CORREA, R., QUEZADA, J.G. and MALDONADO, C. 2005. Effect
of titanium on the as-cast microstructure of a 16% chromium white iron.
Materials Science and Engineering A, vol. 398. pp. 297–308.
CETINKAYA, C. 2006. An investigation of the wear behaviours of white cast irons
under different compositions. Materials and Design, vol. 27. pp. 437–445.
COELHO, G.C., GOLCZEWSKI, J.A. and FISCHMEISTER, H.F. 2003. Thermodynamic
calculations for Nb-containing high-speed steels and white-cast-iron
alloys. Metallurgical and Materials Transaction A, vol. 34.
pp. 1748–1758.
CORREA, E.O., GUEDES DE ALCÂNTARA, N., TECCO, D. and KUMAR, R.V. 2007. The
relationship between the microstructure and abrasive resistance of a
hardfacing alloy in the Fe–Cr–C–Nb–V system. Metallurgical and MaterialsTransactions A, vol. 38. pp. 1671–1680.
DOGAN, O.N., HAWK, J.A. and LAIRD, G. 1997. Solidification structure and
abrasion resistance of high chromium white irons. Metallurgical andMaterials Transactions A, vol. 28. pp. 1315–1328.
DOLMAN, K.F. 2005. Metallurgy of white cast irons: effect of alloying elements
and heat treatment. Proceedings of the 36th Australian Foundry InstituteNational Conference, Sydney.
FISET, M., PEEV, K. and RADULOVIC, M. 1993. The influence of niobium on
fracture toughness and abrasion resistance in high-chromium white cast
irons. Materials Science Letters, vol. 12. pp. 615–617.
HANNES, S.K. and GATES, J.D. 1997. A transformation toughening white cast
iron. Journal of Materials Science, vol. 32. pp. 1249–1259.
KOOTSOOKOS, A. and GATES, J.D. 2008. The role of secondary carbide precipi-
tation on the fracture toughness of a reduced carbon white iron. MaterialsScience and Engineering A, vol. 490. pp. 313–318.
LLEWELLYN, R.J., YICK, S.K. and DOLMAN, K. 2004. Scouring erosion resistance of
metallic materials used in slurry pump service. Wear, 256. pp. 592–599.
MA, Y., LI, X., LIU, Y. and DANG, X. 2013. Microstructure and properties of Ti–
Nb–V–Mo-alloyed high chromium cast iron. Bulletin of Materials Science,
vol. 36, no. 5. pp. 839–844.
MATSUBARA, Y., SASAGURI, N., SHIMIZU, K., YU, S. and YU, K. 2001. Solidification
and abrasion wear of white cast irons alloyed with 20% carbide forming
elements. Wear, vol. 250. pp. 502–510.
RADZIKOWSKA, J.M. 2004. Metallography and microstructures of cast iron. ASMHandbook: Metallography and Microstructures. ASM International,
Materials Park, Ohio. pp. 565–587.
STEVENSON, A.N.J. and HUTCHINGS, I.M. 1995. Wear of hardfacing while cast irons
by solid particle erosion. Wear, vol. 186. pp. 150–158.
TABRETT, C.P. and SARE, I.R. 1997. The effect of heat treatment on the abrasion
resistance of alloy white irons. Wear, vol. 203–204. pp. 206–219.
TABRETT, C.P. and SARE, I.R. 1998. Effect of high temperature and sub-ambient
treatments on the matrix structure and abrasion resistance of a high
chromium white iron, Scripta Materialia, vol. 38, no. 12. pp. 1747–1753.
TABRETT, C.P. and SARE, I.R. 2000. Fracture toughness of high chromium white
irons: influence of cast structure. Journal of Materials Science, vol. 35.
pp. 2069–2077.
TABRETT, C.P., SARE, R. and GHOMASHCHI, M.R. 1996. Microstructure-property
relationships in high chromium white iron alloys. International MaterialsReviews, vol. 41, no. 2. pp. 52–89.
THORPE, W.R. and CHICCO, B. 1985. The Fe-rich corner of the metastable C–Cr–Fe
liquidus surface. Metallurgical Transactions A, vol. 16. pp. 1541–1549.
TURENNE, S., LAVALLÉE, F. and MASOUNAVE, J. 1989. Matrix microstructure effect
in the abrasion resistance of high chromium white cast iron. Journal ofMaterials Science, vol. 24. pp. 3021–3028.
ZHANG, Z., YANG, C., ZHANG, P. and LI, W. 2014. Microstructure and wear
resistance of high chromium cast iron containing niobium. China Foundry,
vol. 11, no. 3. pp. 179–184.
ZHI, X., XING, J., FU, H. and GAO, Y. 2008a. Effect of titanium on the as-cast
microstructure of hypereutectic high chromium cast iron. MaterialsCharacterisation, vol. 58. pp. 1221–1226.
ZHI, X., XING, J., FU, H. and XIAO, B. 2008b. Effect of niobium on the as-cast
microstructure of hypereutectic high chromium cast iron. MaterialsLetters, vol. 62. pp. 857–860.
ZHOU, Q. and SU, J. 1986. Chromium family of wear resistant cast iron. Xi'anJiaotong University Press. pp. 111–112. [In Chinese].
ZUM GAHR K.-H and ELDIS, G.T. 1980. Abrasive wear of white cast irons, Wear,vol. 64. pp. 175–194. �
�
986 VOLUME 116

�ix
201625 October 2016 — 14th Annual Student ColloquiumMintek, RandburgContact: Raymond van der BergTel: +27 11 834-1273/7Fax: +27 11 838-5923/833-8156E-mail: [email protected]: http://www.saimm.co.za
20179–10 March 2017 — 3rd Young Professionals ConferenceInnovation Hub, Pretoria, South AfricaContact: Camielah JardineTel: +27 11 834-1273/7Fax: +27 11 838-5923/833-8156 E-mail: [email protected]: http://www.saimm.co.za
9–12 May 2017 — 6th Sulphur and Sulphuric Acid 2017 ConferenceCape Town, South AfricaContact: Camielah JardineTel: +27 11 834-1273/7Fax: +27 11 838-5923/833-8156 E-mail: [email protected]: http://www.saimm.co.za
25–28 June 2017 — Emc 2017: European Metallurgical ConferenceLeipzig, GermanyContact: Paul-Ernst-StraßeTel: +49 5323 9379-0Fax: +49 5323 9379-37E-mail: [email protected]: http://emc.gdmb.de
6–7 June 2017 —Mine Planning School 2017GautengContact: Camielah JardineTel: +27 11 834-1273/7Fax: +27 11 838-5923/833-8156 E-mail: [email protected]: http://www.saimm.co.za
27–29 June 2017 —4th Mineral Project Valuation ColloquiumMine Design Lab, Chamber of Mines Building, The University of the Witwatersrand, JohannesburgContact: Raymond van der BergTel: +27 11 834-1273/7Fax: +27 11 838-5923/833-8156E-mail: [email protected]: http://www.saimm.co.za
10–11 July 2017 —Chrome School 2017GautengContact: Camielah JardineTel: +27 11 834-1273/7Fax: +27 11 838-5923/833-8156 E-mail: [email protected]: http://www.saimm.co.za
7–8 August 2017 —Rapid Underground Mine & CivilAccess 2017 ConferenceGautengContact: Camielah JardineTel: +27 11 834-1273/7Fax: +27 11 838-5923/833-8156 E-mail: [email protected]: http://www.saimm.co.za
30 August–1 September 2017 — MINESafe Conference2017Emperors Palace, Hotel Casino Convention ResortContact: Raymond van der BergTel: +27 11 834-1273/7, Fax: +27 11 838-5923/833-8156E-mail: [email protected], Website: http://www.saimm.co.za
11–13 September 2017 — Uranium 2017 InternationalConferenceSwakopmund, NamibiaContact: Raymond van der BergTel: +27 11 834-1273/7Fax: +27 11 838-5923/833-8156E-mail: [email protected]: http://www.saimm.co.za
2–7 October 2017 — AfriRock 2017: ISRM InternationalSymposium ‘Rock Mechanics for Africa’Cape Town Convention Centre, Cape TownContact: Raymond van der BergTel: +27 11 834-1273/7Fax: +27 11 838-5923/833-8156E-mail: [email protected]: http://www.saimm.co.za
20–24 November 2017 — AMI Precious Metals 2017 ‘The Precious Metals Development Network (PMDN)’North West Province, South AfricaContact: Raymond van der BergTel: +27 11 834-1273/7Fax: +27 11 838-5923/833-8156E-mail: [email protected],Website: http://www.saimm.co.za
INTERNATIONAL ACTIVITIES

�
x
Company AffiliatesThe following organizations have been admitted to the Institute as Company Affiliates
3M South Africa (Pty) Limited
AECOM SA (Pty) Ltd
AEL Mining Services Limited
Air Liquide (PTY) Ltd
AMEC Foster Wheeler
AMIRA International Africa (Pty) Ltd
ANDRITZ Delkor (Pty) Ltd
Anglo Operations (Pty) Ltd
Arcus Gibb (Pty) Ltd
Aurecon South Africa (Pty) Ltd
Aveng Engineering
Aveng Mining Shafts and Underground
Axis House Pty Ltd
Bafokeng Rasimone Platinum Mine
Barloworld Equipment -Mining
BASF Holdings SA (Pty) Ltd
BCL Limited
Becker Mining (Pty) Ltd
BedRock Mining Support Pty Ltd
Bell Equipment Limited
Blue Cube Systems (Pty) Ltd
CDM Group
CGG Services SA
Concor Mining
Concor Technicrete
Cornerstone Minerals Pty Ltd
Council for Geoscience Library
Cronimet Mining Processing SA (Pty) Ltd
CSIR Natural Resources and theEnvironment (NRE)
Data Mine SA
Department of Water Affairs and Forestry
Digby Wells and Associates
DRA Mineral Projects (Pty) Ltd
DTP Mining - Bouygues Construction
Duraset
Elbroc Mining Products (Pty) Ltd
eThekwini Municipality
Expectra 2004 (Pty) Ltd
Exxaro Coal (Pty) Ltd
Exxaro Resources Limited
Filtaquip (Pty) Ltd
FLSmidth Minerals (Pty) Ltd
Fluor Daniel SA (Pty) Ltd
Franki Africa (Pty) Ltd-JHB
Fraser Alexander Group
Geobrugg Southern Africa (Pty) Ltd
Glencore
Goba (Pty) Ltd
Hall Core Drilling (Pty) Ltd
Hatch (Pty) Ltd
Herrenknecht AG
HPE Hydro Power Equipment (Pty) Ltd
IMS Engineering (Pty) Ltd
Ivanhoe Mines SA
Joy Global Inc.(Africa)
Kudumane Manganese Resources
Leco Africa (Pty) Limited
Longyear South Africa (Pty) Ltd
Lonmin Plc
Magotteaux (Pty) Ltd
MBE Minerals SA Pty Ltd
MCC Contracts (Pty) Ltd
MD Mineral Technologies SA (Pty) Ltd
MDM Technical Africa (Pty) Ltd
Metalock Engineering RSA (Pty) Ltd
Metorex Limited
Metso Minerals (South Africa) Pty Ltd
MineRP Holding (Pty) Ltd
Mintek
MIP Process Technologies
MSA Group (Pty) Ltd
Multotec (Pty) Ltd
Murray and Roberts Cementation
Nalco Africa (Pty) Ltd
Namakwa Sands (Pty) Ltd
Ncamiso Trading (Pty) Ltd
New Concept Mining (Pty) Limited
Northam Platinum Ltd - Zondereinde
PANalytical (Pty) Ltd
Paterson and Cooke Consulting Engineers (Pty) Ltd
Polysius A Division Of ThyssenkruppIndustrial Sol
Precious Metals Refiners
Rand Refinery Limited
Redpath Mining (South Africa) (Pty) Ltd
Rocbolt Technologies
Rosond (Pty) Ltd
Royal Bafokeng Platinum
Roytec Global Pty Ltd
RungePincockMinarco Limited
Rustenburg Platinum Mines Limited
SAIMM Company Affiliates
Salene Mining (Pty) Ltd
Sandvik Mining and Construction Delmas (Pty) Ltd
Sandvik Mining and Construction RSA(Pty) Ltd
SANIRE
SENET (Pty) Ltd
Senmin International (Pty) Ltd
Smec South Africa
SMS group Technical Services South Africa (Pty) Ltd
Sound Mining Solution (Pty) Ltd
South 32
SRK Consulting SA (Pty) Ltd
Technology Innovation Agency
Time Mining and Processing (Pty) Ltd
Tomra (Pty) Ltd
Ukwazi Mining Solutions (Pty) Ltd
Umgeni Water
Webber Wentzel
Weir Minerals Africa
WorleyParsons RSA (Pty) Ltd

2016� COLLOQUIUM
14th Annual Student Colloquium25 October 2016, Mintek, Randburg
2017� CONFERENCE
3rd Young Professionals Conference9–10 March 2017, Innovation Hub, Pretoria
� CONFERENCE6th Sulphur and Sulphuric Acid 2017 Conference9–12 May 2017, Cape Town
� SCHOOLMine Planning School 20176–7 June 2017, Gauteng
� COLLOQUIUM4th Mineral Project Valuation Colloquium27–29 June 2017, Mine Design Lab, Chamber of MinesBuilding, The University of the Witwatersrand, Johannesburg
� SCHOOLChrome School 201710–11 July 2017, Gauteng
� CONFERENCERapid Underground Mine & Civil Access 20177–8 August 2017, Gauteng
� CONFERENCEMINESafe Conference 201730 August–1 September 2017, Emperors Palace, Hotel CasinoConvention Resort
� CONFERENCEUranium 2017 International Conference11–13 September 2017, Swakopmund, Namibia
� SYMPOSIUMAfriRock 2017: ISRM International Symposium ‘RockMechanics for Africa’2–7 October 2017, Cape Town Convention Centre, Cape Town
� CONFERENCEAMI Precious Metals 2017 ‘The Precious MetalsDevelopment Network (PMDN)’20–24 November 2017, North West Province, South Africa
SAIMM DIARY
For further information contact:Conferencing, SAIMM
P O Box 61127, Marshalltown 2107Tel: (011) 834-1273/7
Fax: (011) 833-8156 or (011) 838-5923E-mail: [email protected]
For the past 120 years, theSouthern African Institute ofMining and Metallurgy, has
promoted technical excellence inthe minerals industry. We strive tocontinuously stay at the cuttingedge of new developments in themining and metallurgy industry.The SAIMM acts as the corporatevoice for the mining andmetallurgy industry in the SouthAfrican economy. We activelyencourage contact andnetworking between membersand the strengthening of ties. TheSAIMM offers a variety ofconferences that are designed tobring you technical knowledgeand information of interest for thegood of the industry. Here is aglimpse of the events we havelined up for 2016. Visit our websitefor more information.
EXHIBITS/SPONSORSHIP
Companies wishing to sponsor
and/or exhibit at any of these
events should contact the
conference co-ordinator
as soon as possible

Major R&D PlatformsTechnologies and Products
CSIR Light Metals Research and Innovation
About LMDN and TiCoC