Toxicosis of Snake, Scorpion, Honeybee, Spider, and Wasp ...
Upload
washingtonCategory
view
2download
0
PNWD-4283
Snake River Basin Differential Delayed Mortality Synthesis FINAL REPORT JJ Anderson KD Ham JL Gosselin Battelle Pacific Northwest Division Richland, Washington 99352 Prepared for the U.S. Army Corps of Engineers Walla Walla District, Walla Walla, WA under a Related Services Agreement with the U.S. Department of Energy Contract DE AC05 76RL01830 March 2012

Snake River Basin Differential Delayed Mortality Synthesis
JJ Anderson1 KD Ham2 JL Gosselin1 March 2012 Prepared for the U.S. Army Corps of Engineers Walla Walla District, Walla Walla, WA under a Related Services Agreement with the U.S. Department of Energy Contract DE AC05 76RL01830 Battelle Pacific Northwest Division Richland, Washington 99352 This report is a work prepared for the United States Government by Battelle. In no event shall either the United States Government or Battelle have any responsibility or liability for any consequences of any use, misuse, inability to use, or reliance on any product, information, designs, or other data contained herein, nor does either warrant or otherwise represent in any way the utility, safety, accuracy, adequacy, efficacy, or applicability of the contents hereof.
1 Anderson Consultant – 1325 4th Avenue Suite 1820, Seattle WA 98101-2509 2 Pacific Northwest National Laboratory – PO Box 999, Richland WA 99352


iii
Abstract
This synthesis report was compiled in response to a request from regional fish managers for a summary of all pertinent information relevant to differential delayed mortality (D), and for a workshop to discuss current findings and future research needs as part of the regional process of the Studies Review Workgroup of the U.S. Army Corps of Engineers’ (USACE’s) Anadromous Fish Evaluation Program. D is the relative survival between barged and run-of-river (ROR) fish after passage through the Federal Columbia River Power System (FCRPS). This measure is a convenient way to determine the relative benefit (or disadvantage) of juvenile fish transportation on their post-hydrosystem survival relative to that of ROR fish. In this report, we provide a database of research studies related to D of spring/summer and fall Chinook salmon and steelhead and review the research to synthesize the patterns and possible causes of D. We first provide frameworks in which specific factors of D can be related. These include 1) a presentation of three main hypotheses (fish size, arrival date, and fish condition) with overarching theories that span all species and runs, 2) a comprehensive model, and 3) a culling model. It is important to note that many factors have opposing effects on D, and thus multiple factors need to be considered in the same framework. From our review and discussions at the 2011 Differential Delayed Mortality Workshop (Portland, Oregon), we identified and assessed 12 factors of D.
We found that D varies with arrival timing to, and travel time through, the FCRPS and identified factors that may contribute to this pattern. The seasonal effect of passage timing on D most likely involves temporal changes in fish length, estuary and ocean predation, and ocean conditions. The correspondence of passage timing with fish physiology and disease appears to have secondary effects on D. Time-independent (i.e., non-seasonal) factors include dam operations (spill versus transport), barging conditions (e.g., alternative barging strategy), and adult straying during upriver migration. Factors that appear to have little influence on D include lower river (Bonneville Dam to rkm 56) conditions and predation, and certain barging conditions (e.g., noise). Pre-hydrosystem conditions appeared to be of moderate, but uncertain, importance to D because they include factors that indirectly relate to other drivers of D. We hypothesize that when D < 1 in the early season, barged spring/summer Chinook salmon and steelhead at the hydrosystem exit are smaller in length, have lower levels of osmoregulatory ability, slower travel rates, and greater susceptibility to predation in the estuary relative to their ROR counterparts. In mid-season, when D > 1, barged fishes’ osmoregulatory ability and length have increased, their travel time in the lower river and estuary has decreased, while the energetic reserves of ROR migrants have decreased. These factors are hypothesized to produce higher survival in barged fish than in ROR fish during the middle of the migration season. When D < 1 at the end of the season, we hypothesize higher surface-water temperatures increase disease and energy loss in barged fish. Thus, barged fish have lower survival rates than ROR migrants at the end of the season. For fall Chinook salmon, we hypothesize that the low survival of barged fish relative to ROR migrants throughout the season is caused by high surface-water temperatures, which decrease the condition and energetic reserves of barged fall Chinook salmon and increase disease prevalence. In addition, lower D for fall Chinook could involve the length differential between barged and ROR fish.
To develop the roadmap of future research, we categorized the 12 D factors by the degree of importance to D (low, medium, high) by the extent of data gaps and key uncertainties (limited, extensive). Promising areas for future research fall into three major categories: 1) fish condition, 2) fish behavior and 3) environmental conditions. Key research topics include 1) whether low D is associated with small-sized fish within and across species, runs, and rearing types; 2) which physiological conditions and pathogen

iv
prevalence are associated with low D in the lower river and estuary; 3) whether there is a collection bias of “weaker” fish in the juvenile bypass system and why; 4) what are the effects of the proportion of water spilled and the proportion of fish transported on D across a range of flow rates; and 5) which indices of estuary and ocean conditions are associated with D. Possible approaches to investigating these topics include adventitious analyses of current data, collection of fish by a mobile Separation by Code system in the lower Columbia River and estuary, continued investigation of survival in the estuary and ocean using acoustic tags, longitudinal field studies or monitoring surveys of fish condition and health, and model simulations. Although D is complex, tools are available to minimize data gaps and key uncertainties. Better understanding of the interaction of factors affecting D could allow real-time decisions to be made about when, where, and which species of juvenile migrating salmon or steelhead to barge.

v
Executive Summary
The type of passage (barge vs. ROR) of juvenile salmon and steelhead through the Columbia River hydrosystem has a significant effect on their post-hydrosystem survivals. The effect has been viewed as a delayed mortality in that the hydrosystem passage experience affects the mortality of fish primarily in the estuary and ocean. The effect is important because the delayed mortality for barged and ROR passage types are significantly different and so when considering the benefits of each passage type, the associated delayed mortalities must also be considered. The direct survival in barging fish is on the order of 100% and after two decades of improvements to the hydrosystem, the direct survival of ROR fish within the hydrosystem is reaching an asymptote. Thus, further improvements in the overall fish survival are now focusing on reducing the delayed mortality associated with the passage types. In particular, further improvements to hydrosystem operations can be ascertained in terms of the relative delayed mortality of barged and ROR fish, which is designated differential delayed mortality. The focus of this report is to characterize the patterns and mechanisms of delayed mortality and identify potential future research that can resolve the uncertainties in the processes with the ultimate goal of reducing delayed mortality associated with both passage types.
To remove contributions of ocean survival common to fish from both passage types we focus on the differential delayed mortality (D) which is the ratio of the post-Bonneville Dam (BON) survival (S) of barged fish (B) divided by the post-BON survival of run-of-river fish (R), B RD S S= . By convention, D is calculated using information about the survival of fish from the time they pass Lower Granite Dam (LGR) as juveniles to the time they return to the hydrosystem as adults. The calculation is
B R
R B
SAR VDSAR V
=
where SARB and SARR are the smolt-to-adult return rates (SARs) from the juvenile barge-loading site to their return as adults at a point in the hydrosystem for barged and run-of-river (ROR) fish, respectively. To calculate D, the SARB and SARR are divided by the respective survival rates occurring between the barge-loading site and BON (VB and VR). D varies within a year (i.e., seasonally) and across years (i.e., inter-annually), and differs among species (Chinook salmon [Oncorhynchus tshawytscha] and steelhead [O. mykiss]), run-types (spring/summer and fall Chinook salmon), and rearing types (hatchery and wild). Understanding and identifying the elements of delayed mortality is difficult because factors interact in ways that can obscure its true mechanisms. Individual hypotheses have been proposed for why D differs from 1, but the accumulated evidence indicates there is no one factor or theory that can adequately explain patterns observed in D.
The main goals of this synthesis were to accomplish the following:
• Compile a database of research studies related to D.
• Provide a conceptual framework to consider factors affecting D.
• Review past and current research related to D, and identify data gaps and key uncertainties.
• Conduct a regional workshop to discuss recent and ongoing research studies related to D, as well as prioritization of future research topics.

vi
• Develop a roadmap of future research that would help better understand processes related to D and help determine ways of increasing the effectiveness of the Juvenile Fish Transportation Program, which transports fish downstream past most dams in barges or trucks in order to help improve salmonid adult returns.
Database of Research Studies on D
We reviewed and developed a database of over 200 research studies related to D. References to these research studies are available in Appendix A with hyperlinks to abstracts and executive summaries within this report. The database includes papers published in peer-reviewed journals, technical memos, annual reports, and reviews.
Three Major Hypotheses
A main goal of this report is to synthesize factors that affect D. We first state overarching hypotheses and then consider the detailed factors contributing to these hypotheses later in the report. The patterns of D can generally be considered in terms of three hypotheses that are not mutually exclusive. The Fish Size Hypothesis attributes the D patterns primarily to the differential in the size of barged and ROR fish; barged fish do not grow during their 2-d hydrosystem passage. The Arrival Time Hypothesis attributes the D patterns to the differential in arrival timing of barged fish and ROR fish; barged fish enter the estuary earlier than had they actively migrated and experience different environmental conditions. The Fish Condition Hypothesis attributes the pattern in D to differential conditions of barged and ROR fish.
Conceptual Framework
We developed two frameworks in which to evaluate the effects of factors on D. The first approach, designated the Multivariate Regression Model, is a proportional hazards model. The second approach, designated the Culling Model, is based on a vitality model that characterizes the probability distribution of survival capacity, i.e., vitality.
In the Multivariate Regression Model, the log of the post-hydrosystem survival is defined in terms of the additive sum of explanatory variables as 0log log ii
S S F= + ∑ where Fi is the post-hydrosystem mortality rate that is attributed to explanatory variable i. Then D, which depends on the ratio of post-hydrosystem survivals of fish from barged and ROR passage types, is defined by the passage type-specific differences in the explanatory variables giving ( )exp iD F= ∆∑ . The important point here is
that D depends on the difference of the factors between the ROR and barged fish passage through the hydrosystem, manifested as survival differences during migration after passing downstream of BON.
In the Culling Model, the distribution of survival capacity of fish entering the hydrosystem is adjusted first as they pass through the hydrosystem by barge and ROR passages and second as the fish pass through the estuary and ocean. The distribution of survival capacity (designated vitality) of fish entering the hydrosystem is equivalent for barged and ROR fish and may change over time and run composition. As fish pass through the hydrosystem, the distribution of vitality changes by two processes. First, intrinsic processes associated with growth, pathogen loading, and other forms of stress can increase or decrease the distribution of vitality during passage. Second, extrinsic challenges, principally associated with predators and the physical effects of dam passage, selectively cull the individuals with lower vitality.
vii
Thus, the distribution of vitality among fish exiting the hydrosystem depends on the intrinsic and extrinsic processes, which are different for each passage type. Post-hydrosystem survival then depends on these distributions and any additional changes in intrinsic vitality in conjunction with post-hydrosystem extrinsic challenges, which again selectively remove the weaker individuals. The rate of culling is driven by the magnitude and frequency of extrinsic challenges.
Review of Literature on D
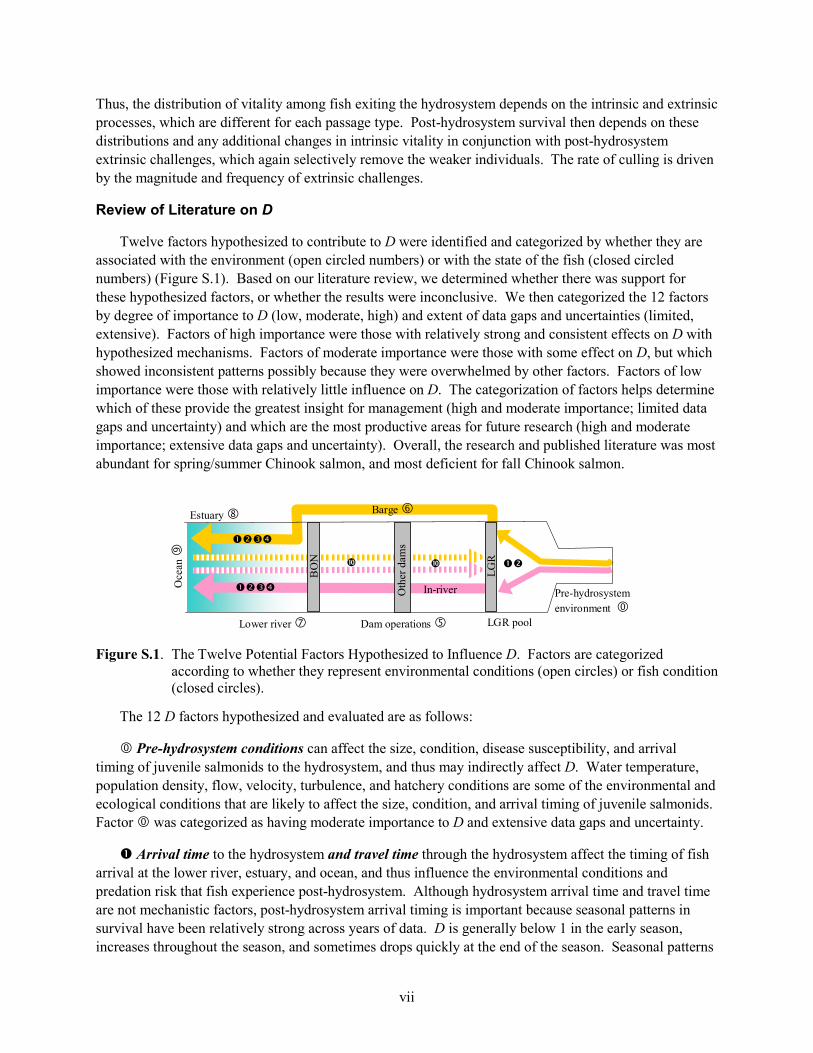
Twelve factors hypothesized to contribute to D were identified and categorized by whether they are associated with the environment (open circled numbers) or with the state of the fish (closed circled numbers) (Figure S.1). Based on our literature review, we determined whether there was support for these hypothesized factors, or whether the results were inconclusive. We then categorized the 12 factors by degree of importance to D (low, moderate, high) and extent of data gaps and uncertainties (limited, extensive). Factors of high importance were those with relatively strong and consistent effects on D with hypothesized mechanisms. Factors of moderate importance were those with some effect on D, but which showed inconsistent patterns possibly because they were overwhelmed by other factors. Factors of low importance were those with relatively little influence on D. The categorization of factors helps determine which of these provide the greatest insight for management (high and moderate importance; limited data gaps and uncertainty) and which are the most productive areas for future research (high and moderate importance; extensive data gaps and uncertainty). Overall, the research and published literature was most abundant for spring/summer Chinook salmon, and most deficient for fall Chinook salmon.
Figure S.1. The Twelve Potential Factors Hypothesized to Influence D. Factors are categorized
according to whether they represent environmental conditions (open circles) or fish condition (closed circles).
The 12 D factors hypothesized and evaluated are as follows:
Pre-hydrosystem conditions can affect the size, condition, disease susceptibility, and arrival timing of juvenile salmonids to the hydrosystem, and thus may indirectly affect D. Water temperature, population density, flow, velocity, turbulence, and hatchery conditions are some of the environmental and ecological conditions that are likely to affect the size, condition, and arrival timing of juvenile salmonids. Factor was categorized as having moderate importance to D and extensive data gaps and uncertainty.
Arrival time to the hydrosystem and travel time through the hydrosystem affect the timing of fish arrival at the lower river, estuary, and ocean, and thus influence the environmental conditions and predation risk that fish experience post-hydrosystem. Although hydrosystem arrival time and travel time are not mechanistic factors, post-hydrosystem arrival timing is important because seasonal patterns in survival have been relatively strong across years of data. D is generally below 1 in the early season, increases throughout the season, and sometimes drops quickly at the end of the season. Seasonal patterns
Estuary
LGR pool
Pre-hydrosystem environment
Oce
an
Barge
In-river
Lower river
LGR
BO
N
Oth
er d
ams
Dam operations

viii
in survival rates in the lower river and estuary (LRE) are also apparent for spring/summer and fall Chinook salmon. Further investigations of the mechanisms producing these seasonal trends in D are needed. These include fish length, physiological condition, and estuarine and ocean conditions. These factors are further considered below. Factor was considered to be of high importance to D and have limited data gaps and uncertainty.
Fish length is generally correlated with SAR, therefore factors that differentially affect the length distributions of fish, such as the lost opportunity to grow during barge transportation and differential entrainment into the bypass system, will affect D. The seasonal increase in fish size upon arriving at the hydrosystem and its resulting effect on transport collection efficiency and post-hydrosystem survival is a potentially important mechanism for the seasonal changes in D. The differences in sizes of barged and ROR fish that carry forward into the coastal ocean environment may affect survival through size-selective predation and through physiological processes (critical size hypotheses). Factor was considered to be of high importance to D and have extensive data gaps and uncertainty.
Fish physiology includes processes such as smoltification, depletion of energetic reserves, and stress that may influence migration readiness and the overall health of the fish. Lower levels of smoltification in barged fish upon arrival downstream of BON are hypothesized to increase their travel time in the LRE, and consequently increase their post-hydrosystem predation risk relative to ROR fish. However, decreased energetic reserves in ROR fish and negligible loss of energetic reserves in barged fish during passage through the hydrosystem may counteract the differential effects of smoltification. Other indices of physiological condition such as stress hormones may be detected in barged juveniles, but do not necessarily translate into reduced SARs. The diversity of responses shows that complex interactions can occur between environmental conditions, physiological responses, and survival rates. There will be a need to decipher which combinations of physiological indices can help decide when, where, and which to fish collect for an effective Juvenile Fish Transportation Program to help improve adult returns. Factor by and large was considered to be of moderate importance to D and have extensive data gaps and uncertainty.
Fish diseases may affect fish survival directly or indirectly through increased predation risk. Pathogen prevalence and load together can be indicators of the overall health of a group of fish. Contrasting patterns in the barge vs. ROR survival in disease-related experiments across several studies suggest that the pre-hydrosystem conditions of these fish are important. It is important to understand that fish constantly move back and forth along a continuum of healthy to pathogenic states depending on the environmental conditions they experience, and thus may exhibit complex patterns in pathogen prevalence and survival. Techniques, now available to sample pathogens non-lethally and assess both pathogen prevalence and pathogen load, would help in determining whether disease is a major driver of D patterns. If it is, the conditions that minimize pathogen transmission, such as those that have recently been identified for barging, can be implemented. Factor was considered to be of moderate importance to D and have extensive data gaps and uncertainty.
➄ Dam operations are hypothesized to affect D via changes in passage conditions that alter cumulative stress effects. Although compelling evidence has been found to suggest that undetected fish experience better ROR passage conditions than those detected in the bypass system and returned to the river, the exact causes are elusive. Percent spill may also affect the proportion of fish transported, the survival of ROR migrants, and hence D. Model simulations have shown that hatchery spring/summer Chinook salmon are more sensitive to spill, while steelhead are more sensitive to flow. The mixed spill-transport strategy implemented since 2006 will provide more data on how dam operations under various

ix
conditions of flow affect SARs and D. Factor ➄ was categorized as having high importance to D with extensive data gaps and uncertainty.
➅ Barging conditions that have been hypothesized in the literature to affect D include 1) cumulative stress during dam passage as suggested by increased delayed mortality in fish that migrated in the river part-way and then were barged from dams downstream of Lower Granite Dam, 2) disruption of homeostasis and auditory sensitivity by dissolved metals and noise within barges, 3) diminished fish condition from high surface-water temperatures circulating in barges, particularly in fall Chinook salmon, and 4) decreased predation risk but increased straying from the alternative barging strategy near Astoria. Subhypotheses 1 and 3 were considered to be of moderate importance and have extensive data gaps and uncertainties. Subhypotheses 2 was considered not to be of importance and subhypothesis 4 was not considered not to be important because it is not a standard barging operation.
➆ Lower Columbia River (BON to rkm 56) conditions and predation have been hypothesized to affect the differential survival between barged fish and ROR migrants. Mechanisms include size-selective predation and the seasonal pattern of fish migration rate through the lower river. The literature shows that survival through this reach is relatively high for barged and ROR spring/summer Chinook salmon and steelhead. However, differences exist between barged and ROR fall Chinook salmon. Also, seasonal declines in survival have been observed across these species and runs. Factor ➆ was deemed to be of low importance and have limited uncertainty for spring/summer Chinook salmon, but to be of moderate importance and have extensive uncertainty for fall Chinook salmon.
➇ Estuarine conditions (downstream of rkm 56) and bird predation may affect smolt survival at the freshwater-saltwater interface where susceptibility depends on the species, level of smoltification, and fish condition. The degree of smoltification, stress, and diseases in fish and the seasonal pattern of bird predation rates may contribute to the seasonal variations in D. Most of the research on avian predation is focused on run-at-large fish and few, if any, have formally tested differences in the susceptibility of barged and ROR fish. Striking and consistent patterns of decreased fish survival occur within the freshwater-seawater interfaces (rkm 0 to 32), but these were tested in run-at-large spring/summer and fall Chinook and steelhead. Factor ➇ was considered to be of high importance to D and have extensive uncertainty.
➈ Oceanic conditions can affect the seasonal and year-to-year variations in D. Mechanisms may involve the timing and intensity of upwelling, spring productivity, and the arrival of ocean predators, alternative prey, and competitors. The differential arrival timing to the estuary between barged and ROR fish together with the seasonal variations in ocean conditions appear to have a significant impact on the variations in D. Factor ➈ was deemed to be of high importance to D and have extensive uncertainty.
Straying increases with rates of barging, possibly due to the impairment of the homing ability of the fish. Differences in straying rates between barged and ROR fish are an example of a late-acting effect of barging on D, but their significance to D is likely minimal, especially in spring/summer Chinook salmon. Factor was deemed to be of low importance to D and have limited uncertainty.
The estimation of survival by tagged fish can also be influenced by passage type and hence affect estimates of D. Estimates of the transport-to-in-river ratio (T:I) can be biased high because they are based on passive integrated transponder-tagged fish that are detected only when they pass through the bypass system and consequently experience lower survival than fish that pass through the spill route. An alternative standard for T:I has been recently developed to compensate for the bias related to reduced

x
survival of bypassed fish. No estimates of an alternative D have been developed. The estimation of survival as well as tagging effects were both considered to be of low importance to D but have extensive uncertainty.
Differential Delayed Mortality Workshop
The 1.5-day workshop was held 10–11 May 2011 in Portland, Oregon, and was attended by at least 42 participants. Please see Appendix D for the agenda. On the first day, presentations generally covered the topics of fish disease, physiology, and survival including the following:
• a synopsis of this report
• a culling model based on individual heterogeneity and degree of selection
• general research approaches to investigate fish pathogens
• differential physiological indices and gene expression
• two potential issues with estimations of D
• an adjusted standard for Transport:Migrant (T:M; also T:I) ratios to reflect higher survival of never-detected fish relative to bypassed fish.
On the second day, presentations covered the lower river, estuary, and ocean, including the following:
• a comprehensive model to identify significant factors of D
• within-barge survival rates
• survival, travel time, and migration pathways in the LRE
• annual and seasonal ocean conditions
• the possibility of equivalent hydrosystem and coastal ocean survival rates.
Many of the discussions about data gaps and key uncertainties were related to fish length, health, environmental conditions, and dam operations. The effect of fish lengths, physiological condition, and pathogens on the differential survival of barged fish and ROR migrants was of general interest. Whether fish condition caused bias in their entrainment into the juvenile bypass system was also discussed. It was suggested that low D may be expressed in small-sized fish and not larger-sized fish.
Roadmap for Future Research
We discuss areas of research in relation to when to barge, how many to barge, which fish to barge, where to begin barging, and how to barge. Finally, we present the roadmap for future research, which addresses some key questions, their relevance to a juvenile fish transportation program with the goal of improving adult returns, some potential research approaches, the approximate durations of study, and potential challenges that can be addressed. The categorization of hypothesized factors by the degree of importance to D and by the extent of data gaps and uncertainty were used to determine areas of future research with the greatest potential to inform the management of the Juvenile Fish Transportation Program and help improve SARs.
xi
The proposed future research opportunities generally fall into three major categories that focus on fish condition, fish behavior and environmental conditions, with some interaction between these categories. Research topics of interest in the fish condition category relate to the effects of fish size, physiological condition, and pathogen load on D. One key research question is whether smaller fish experience lower survival than larger fish within and across species, runs, and rearing types to produce the patterns of D observed. Fish condition could also affect their swimming behavior and probability of entrainment into the bypass system, thus possibly causing selection of “weaker” fish for transportation. But much uncertainty remains. Research topics of interest in the ecological and environmental conditions category include the correlative effects of proportion of spill and proportion of fish transported on D across a range of flow rates, and determination of indices of estuary and ocean conditions associated with D. Possible approaches to investigating these topics include adventitious analyses of current data and model simulations; surveys or monitoring programs of fish conditions with fish collections by a mobile Separation by Code system in the LRE; challenge experiments of fish collected that were entering and exiting the hydrosystem by ROR and barge passage types; and continued investigation of survival in the estuary using acoustic tags.
Hypotheses related to D have been and continue to be refined. As data collection and improvements in technology continue, the region is gaining a better understanding of this complex issue that spans large spatial and temporal scales and that involves many interacting factors. As we gain a better understanding of the processes affecting D, we are working toward the possibility of a real-time monitoring program in which the indices collected and modeled with historical data help predict D and SARs. When that possibility is realized, web-based real-time monitoring and predictions could help inform transport decision-making.


xiii
Acknowledgments
Derek Fryer of the U.S. Army Corps of Engineers (USACE) Walla Walla District has been instrumental in helping pave the way for researching the complex issues related to differential delayed mortality. His strength is getting experts to move beyond the data and to speculate to form new hypotheses in a constructive environment. We are thus grateful for his support during the production of this report and his involvement at the Differential Delayed Mortality Workshop. David Trachtenbarg of the USACE Walla Walla District provided significant and excellent help in organizing the Differential Delayed Mortality Workshop, as well as feedback on draft versions of the report. We thank both of them for their input throughout the production of this report.
We enthusiastically thank Kai Eder, Robert Emmett, Ryan Harnish, Kirstin Holsman, Richard Ledgerwood, Frank Loge, Geoff McMichael, Matt Mesa, Maureen Purcell, Steven Smith, and David Welch for their time and effort in preparing presentations and sharing their expert knowledge at the Differential Delayed Mortality Workshop. We appreciate their hard work and dedication to their research in each of their respective fields, which help us better understand the multi-faceted issue of differential delayed mortality. They substantially contributed to making the workshop a success, and we are thus indebted to them. We thank Kathleen McCaw of the USACE Walla Walla District for her hard work in transcribing the discussions and select presentations at the Differential Delayed Mortality Workshop, especially with the poor acoustics of the conference room that made it an even greater challenge. We also thank Mary Arkoosh, Rebecca Buchanan, Joe Dietrich, Diane Elliott, Al Giorgi, Ritchie Graves, Russ Kiefer, Richard Ledgerwood, Maureen Purcell, Erin Rechisky, David Welch, and the many other participants at the workshop for their written and verbal input and feedback on the report.


xv
Acronyms and Abbreviations
°C degree(s) Celsius (or Centigrade) ADP adenosine diphosphate AFEP Anadromous Fish Evaluation Program AIC Akaike information criterion AT acoustic transmitter ATPase adenosine triphosphatase B:I barge-to-in-river ratio B/I bypass-to-in-river migrant ratio BKD bacterial kidney disease BON Bonneville Dam cDNA complementary DNA CF condition factor cfu colony-forming unit(s) CI confidence interval cm centimeter(s) COMPASS Comprehensive Passage CRE Columbia River Estuary CSS Comparative Survival Study CWT coded wire tag ΣDDT Σ dichlorodiphenyltrichloroethane D differential delayed mortality d day(s) DDT dichlorodiphenyltrichloroethane DNA deoxyribonucleic acid DWK Dworshak Hatchery ELISA enzyme-linked immunosorbent assay FAC fluorescent aromatic compound FCRPS Federal Columbia River Power System FDL Fish Disease Laboratory FL fork length

xvi
µg microgram(s) g gram(s) g/L gram(s) per liter gpm gallon(s) per minute h hour(s) HEWL hen egg-white lysozyme HMSC Hatfield Marine Science Center ICH Ice Harbor Dam IHNV infectious hematopoietic necrosis virus I/R in-river-to-barge ISAB Independent Scientific Advisory Board JDA John Day Dam JSATS Juvenile Salmon Acoustic Telemetry System kcfs kilo cubic feet per second kcms kilo cubic meters per second km kilometer(s) km/d kilometer(s) per day L liter(s) lb/gal pound(s) per gallon LC50 lethal concentration at 50% incidence of mortality LGR Lower Granite Dam LGS Little Goose Dam LRE lower river and estuary LMN Lower Monumental Dam m meter(s) MCN McNary Dam mg milligram(s) mL milliliter(s) mm millimeter(s) mS millisiemen(s) ng nanogram(s) ng/g nanogram(s) per gram
xvii
NOAA National Oceanic and Atmospheric Administration NPT non-PIT-tagged PAH polycyclic aromatic hydrocarbon PBDE polybrominated diphenyl ether PCB polychlorinated biphenyl PCV packed cell volume(s) PCR polymerase chain reaction PHN phenanthrene PIT passive integrated transponder PITAGIS PIT Tag Information System PNNL Pacific Northwest National Laboratory PNWD Battelle–Pacific Northwest Division rkm river kilometer(s) RM river mile(s) RM&E research, monitoring, and evaluation RNA ribonucleic acid ROR run-of-river RR Rapid River Hatchery SAR smolt-to-adult return rate SbyC Separation by Code SE standard error SS spring/summer T:I Transport:In-river; transport-to-in-river ratio (equivalent to T:M) T:M Transport:Migrant; transport-to-migrant ratio (equivalent to T:I) USACE U.S. Army Corps of Engineers


xix
Contents
Abstract ................................................................................................................................................. iii Executive Summary .............................................................................................................................. v Acknowledgments ................................................................................................................................. xiii Acronyms and Abbreviations ............................................................................................................... xv 1.0 Introduction .................................................................................................................................. 1.1 2.0 Differential Delayed Mortality ..................................................................................................... 2.1
2.1 Definition of D ..................................................................................................................... 2.1 2.2 Patterns of D ......................................................................................................................... 2.2
2.2.1 Yearly Averaged D .................................................................................................... 2.2 2.2.2 Seasonal Patterns in D ............................................................................................... 2.3 2.2.3 Patterns by Run Type ................................................................................................ 2.6 2.2.4 Arrival Time of Fish .................................................................................................. 2.6 2.2.5 Management Implications ......................................................................................... 2.6
2.3 Major Hypotheses Explaining D .......................................................................................... 2.9 2.3.1 Fish Size Hypothesis ................................................................................................. 2.9 2.3.2 Arrival Time Hypothesis ........................................................................................... 2.12 2.3.3 Fish Condition Hypothesis ........................................................................................ 2.12
3.0 Models of D .................................................................................................................................. 3.1 3.1 Multivariate Regression Model ............................................................................................ 3.1 3.2 Culling Model with Dynamic Processes in Heterogeneity Among Individuals ................... 3.4
3.2.1 Derivation .................................................................................................................. 3.4 3.2.2 Exploring Characteristics of the Culling Model ........................................................ 3.10 3.2.3 Implications of Vitality and Heterogeneity ............................................................... 3.15
4.0 Potential Factors of D ................................................................................................................... 4.1 4.1 Organizing and Prioritizing Factors ..................................................................................... 4.1
4.1.1 The Framework of Factors of D ................................................................................ 4.1 4.1.2 Categorizing Factors by Importance and Uncertainty ............................................... 4.2 4.1.3 Priorities for Future Research and Management ....................................................... 4.2
4.2 Evaluation of Factors of D ................................................................................................... 4.3 4.2.1 Pre-Hydrosystem Effects ...................................................................................... 4.3 4.2.2 Hydrosystem Arrival Time and Travel Time ....................................................... 4.5 4.2.3 Fish Length ........................................................................................................... 4.8 4.2.4 Fish Physiology .................................................................................................... 4.12 4.2.5 Disease .................................................................................................................. 4.16
4.2.6 Dam Operations ⑤ .................................................................................................... 4.19
4.2.7 Barging Conditions ⑥ .............................................................................................. 4.23

xx
4.2.8 Lower Columbia River (BON to rkm 56) Conditions and Predators ⑦ ................... 4.26
4.2.9 Estuarine Conditions (below rkm 56) and Predators ⑧ ............................................ 4.28
4.2.10 Oceanic Conditions ⑨ .............................................................................................. 4.33 4.2.11 Straying and Fallback ........................................................................................... 4.34 4.2.12 Estimation of Survival and Tagging Effects ......................................................... 4.37
4.3 Interaction of Fish Condition Versus Environmental Factors Affecting D .......................... 4.39 4.4 Seasonal (Within-year) and Inter-annual (Across-year) D Patterns ..................................... 4.41
4.4.1 Seasonal Pattern of Factors Affecting Survival of Barged and ROR Fish ................ 4.41 4.4.2 Inter-annual Variability ............................................................................................. 4.43
4.5 Summary of Importance Versus Uncertainty in D factors ................................................... 4.44 4.6 Conclusion About the Synthesis of Literature on D ............................................................. 4.46
5.0 Identifying Research Needed to Support Management ................................................................ 5.1 5.1 Addressing Key Management Questions ............................................................................. 5.1
5.1.1 When to Barge ........................................................................................................... 5.1 5.1.2 What Proportion of Fish to Barge ............................................................................. 5.3 5.1.3 Which Fish to Barge .................................................................................................. 5.3 5.1.4 Where to Begin Barging ............................................................................................ 5.4 5.1.5 How to Barge ............................................................................................................ 5.4 5.1.6 What Environmental Conditions Increase Barging Success?.................................... 5.4
5.2 Roadmap of Future Research ............................................................................................... 5.5 5.2.1 Key Research Questions ............................................................................................ 5.5 5.2.2 Towards a Real-Time Transportation Program ......................................................... 5.6
6.0 References .................................................................................................................................... 6.1 Appendix A – References, Abstracts, and Executive Summaries of Research Related to
Differential Delayed Mortality ..................................................................................................... A.1 Appendix B – Synopsis of Select USACE-Funded Research ............................................................... B.1 Appendix C – Effects of Tagging on the Behavior and Survival of Salmonids ................................... C.1 Appendix D – Workshop Agenda ......................................................................................................... D.1 Appendix E – Differential Delayed Mortality Workshop ..................................................................... E.1 Appendix F – Transcript of Workshop Meeting ................................................................................... F.1 Appendix G – Differential Delayed Mortality Survey .......................................................................... G.1 Appendix H – Comparison with the 2004 Comparative Survival Study Workshop............................. H.1

xxi
Figures
1.1 Diagram of ROR Migration and Barge Transportation of Juvenile Salmonids Across the FCRPS ......................................................................................................................................... 1.1
2.1 SAR, T:I and D of Hatchery Spring/Summer Chinook Salmon throughout the 1999 Outmigration Year ...................................................................................................................... 2.4
2.2 The T:I of Hatchery and Wild Spring/Summer Chinook Salmon and Steelhead from the 1999 Outmigration Year ............................................................................................................. 2.4
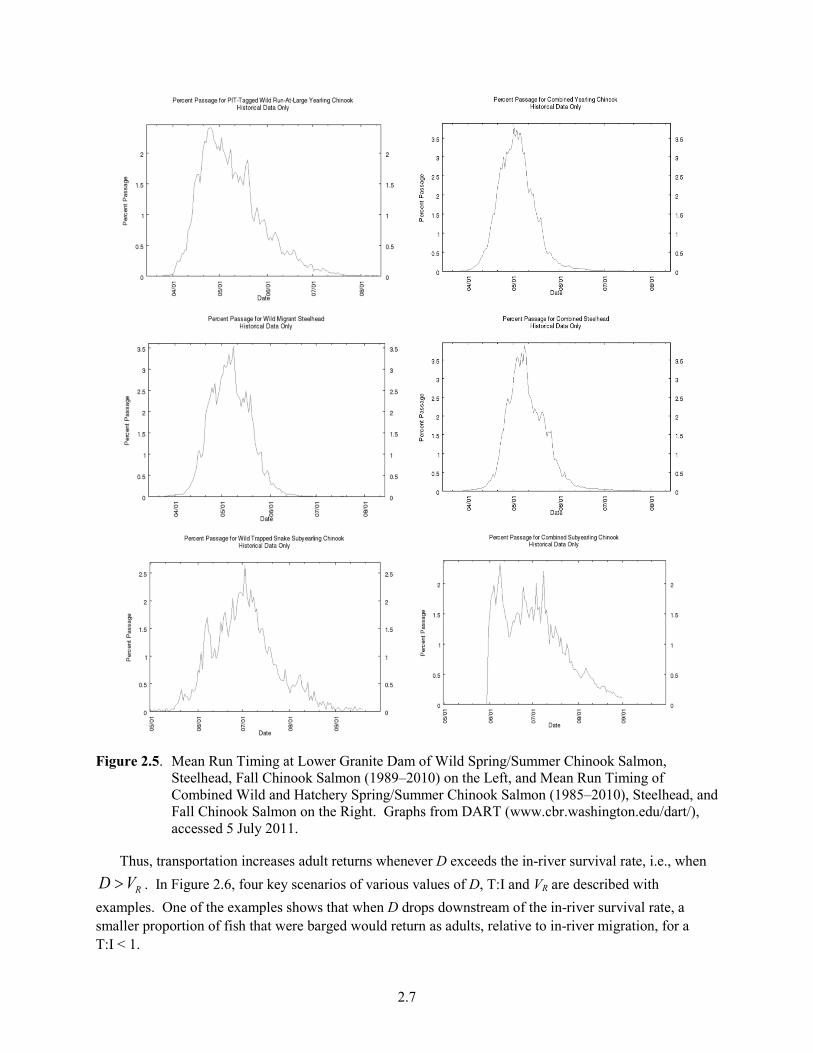
2.3 Seasonal Variation in D for Hatchery and Wild Spring/Summer Chinook ................................. 2.5 2.4 Survival, D, and Collection Distribution of Steelhead Tagged at LGR ...................................... 2.5 2.5 Mean Run Timing at Lower Granite Dam of Wild Spring/Summer Chinook Salmon,
Steelhead, Fall Chinook Salmon on the Left, and Mean Run Timing of Combined Wild and Hatchery Spring/Summer Chinook Salmon, Steelhead, and Fall Chinook Salmon on the Right ............................................................................................................................................ 2.7
2.6 Four Scenarios of Various Values of D, VR, and T:I for Fish Transported from Lower Granite Dam. VB is assumed to equal 1. ..................................................................................... 2.8
2.7 Hypothetical Relationship Between Fish Length of Each Species, Rearing Type, and Passage Type at BON and Post-BON SAR and the Corresponding Values of D Relative to Their Lengths at LGR ................................................................................................................. 2.10
2.8 Ratio of Transport to In-River SAR for Spring Chinook and Weekly D for Spring Chinook in 1999 ......................................................................................................................................... 2.11
3.1 Ratio of Transport to In-River SAR for Spring Chinook and Weekly Hatchery Spring Chinook Log D Observed vs. Predicted From Model B ............................................................. 3.3
3.2 Cumulative Frequency Distribution of Events and Survival as Functions of Vitality ................ 3.5 3.3 Post-Hydrosystem Distributions of Vitality Density Under Three Conditions ........................... 3.7 3.4 Patterns of D, Survival, and SAR in Barged and ROR Fish with Variations in ROR Fish
Mean Vitality .............................................................................................................................. 3.11 3.5 Patterns of D, Survival, and SAR in Barged and ROR Fish with Variations in the Number
of Post-Hydrosystem Events Encountered by ROR Fish ............................................................ 3.12 3.6 Patterns of D, Survival, and SAR in Barged and ROR Fish with Variations in the Strength
of Passage Events ........................................................................................................................ 3.13 3.7 Hypothetical Temporal Change in Number of Estuary Challenge Events for Barged and
ROR Fish ..................................................................................................................................... 3.13 3.8 Seasonal Patterns of D, Survival, and SAR for Barged and ROR Fish ...................................... 3.14 3.9 Seasonal Patterns of D, T:I, ROR Travel Time, Survivals of ROR and Barged Fish in the
River and Ocean, and Vitalities of Barged and ROR Fish at Hydrosystem Exit ........................ 3.15 4.1 Conceptual Model of Locations of the Principal Factors Affecting the Differential Delayed
Mortality Between Barged and ROR Fish .................................................................................. 4.2 4.2 Conceptual Model of How Pre-Hydrosystem Conditions Can Influence Arrival Time and
Travel Time, Fish Length, and Fish Physiology ......................................................................... 4.3 4.3 Factors Involved with Timing of Fish Into and Out of the Hydrosystem and Examples of
the Passage Distributions of Snake River Basin Barged and ROR Spring/Summer Chinook Salmon, Steelhead, and Fall Chinook Salmon at BON ............................................................... 4.6
xxii
4.4 Length of Wild Fish Spring/Summer Chinook Passing Bonneville Dam for ROR and Barged Fish from Muir et al. (2006) ........................................................................................... 4.8
4.5 Factors Involved With Physiological Effects on D ..................................................................... 4.12 4.6 Survival in Net Pens of Hatchery Spring/Summer Chinook Salmon Collected After ROR
Migration or and Barge Transportation and Hatchery Reference Fish that Did Not Pass Through the Hydrosystem ........................................................................................................... 4.17
4.7 Spill Operations and Turbine Efficiency Affect Fish Passage Routing and Survival ................. 4.19 4.8 Conditions Within Barges and Collection and Release Site Locations Can Affect the
Post-Barging Condition of Fish .................................................................................................. 4.23 4.9 Northern Pikeminnow is a Major Predator in the Lower River Downstream of BON and
Potential Impact on the Population Depends on Fish Length and Predator Population Density ........................................................................................................................................ 4.26
4.10 Representative Populations of Smolts in the Estuary and Proportion of Salmonids in the Diet of Caspian Terns and Double-Crested Cormorants ............................................................. 4.28
4.11 Seasonally and Interannually Varying Ocean Conditions Affect Ocean Survival of ROR and Barged Fish........................................................................................................................... 4.33
4.12 Fallback of Adults Migrating Through the Hydrosystem and Straying into Other Streams Occur at Different Rates for ROR and Barged Fish and Can Contribute to D ........................... 4.35
4.13 Survival Estimates From Only PIT-tag-detected Fish Bias D Estimates and Tagging Effects Influence D .................................................................................................................................. 4.37
4.14 Seasonal Pattern of Factors Affecting Survival of Barged and ROR Migrants .......................... 4.42 4.15 Representative Example of the Temporal Variations in SAR for Hatchery Spring Chinook
in 1999 for Barged Fish and ROR Migrants; Ratio of Transport to in-River SAR for Spring Chinook and Weekly D for Spring Chinook in 1999 .................................................................. 4.44
5.1 Flow Chart of General Management Decisions related to the Juvenile Fish Transportation Program ....................................................................................................................................... 5.2
Tables
2.1 General Estimates of D and Transport-to-In-River Ratio ........................................................... 2.3 2.2 Patterns of Fish Size, D, and Travel Time Through the FCRPS of Salmonid Runs and
Rearing Types ............................................................................................................................. 2.6 4.1 Prioritizing Factors by Their Degree of Importance in Relation to D and Extent of Data
Gaps and Uncertainty .................................................................................................................. 4.3 4.2 Interactions Between Snake River Basin Fish Condition/Behavior and Environment ............... 4.40 4.3 Factors of D Categorized by Degree of Importance to D and Extent of Data Gaps and
Uncertainty .................................................................................................................................. 4.45 5.1 Key Research Questions of Differential Delayed Mortality with Comments on Relevance to
Transportation Program and Research Approaches .................................................................... 5.7

1.1
1.0 Introduction
Barge transportation of juvenile salmonids is one of the major mitigation strategies implemented by the U.S. Army Corps of Engineers (USACE) to increase salmonid survival in the Federal Columbia River Power System (FCRPS) (Figure 1.1). Survival through the FCRPS is approximately 98% for barged yearling Chinook salmon (McMichael et al. 2010) and approximately 50% for run-of-river (ROR) migrants that pass through the dams (Williams et al. 2005). However, the post-hydrosystem survival of barged fish is often lower than that of ROR fish, and is sometimes low enough to offset the survival benefit of barging through the hydrosystem. Differential delayed mortality (D) is a convenient way to discuss differences between barged and ROR fish occurring after they pass Bonneville Dam (BON). Although the ratio of smolt-to-adult return rates (SARs) for barged versus ROR fish, also referred to as the transport to in-river ratio (T:I), is a better metric for evaluating whether transport increases adult returns, D is a useful metric for understanding how differential survival downstream from the release point (which includes a form of delayed mortality) influences the effectiveness of the Juvenile Fish Transportation Program. The term D summarizes the differences in mortality between barged and ROR that occur after hydrosystem passage in the lower river, estuary, ocean, and during upstream migration.
Figure 1.1. Diagram of ROR Migration and Barge Transportation of Juvenile Salmonids Across the
FCRPS. Only the first and last dams of the hydrosystem are shown.
Regional fish managers requested a summary of all pertinent information relevant to D and a workshop to discuss current findings and a roadmap for future research as part of the regional process of the Studies Review Workgroup of the USACE Anadromous Fish Evaluation Program. Battelle–Pacific Northwest Division (PNWD) and Anderson Consultant provided this report which includes a synthesis of research related to D for wild and hatchery spring/summer and fall Chinook salmon (Oncorhynchus tshawytscha) and steelhead (O. mykiss). We focused on research published since 2005 because earlier works were reviewed in the 2004 Comparative Survival Study (CSS) Workshop (Marmorek et al. 2004) and the white paper by the National Oceanic and Atmospheric Administration (NOAA) on the effects of the FCRPS on salmonid populations (Williams et al. 2005). However, for topics without recent research, we included older literature.
This report begins with a background on the definition of D, its relationship to other survival estimates, and species-, run-, and rear-specific patterns that occur inter- and intra-annually (Sections 2.1 and 2.2). Prior to reviewing the 12 hypothesized factors of D (Section 4.0), three major hypotheses are introduced (Section 2.3) and two models are presented (Section 3.0) to help provide an overall framework

1.2
within which the specific factors can be interpreted. In our review of the 12 D factors (Section 4.0), each factor is first considered individually with a synthesis of the literature, an assessment of its degree of importance relative to all other factors considered in this report, a categorization of the extent of data gaps and uncertainty, and a discussion of potential future research questions and study approaches. As part of this review, a database of references and abstracts/summaries of relevant literature was compiled (Appendix A), select USACE-funded research studies were synthesized and evaluated (Appendix B), and fish tagging-related studies were synthesized in a table (Appendix C). Also, a regional workshop (10–11 May 2011, Portland, Oregon) was organized to help participants learn about and discuss current research studies related to D, as well as to discuss the importance of factors to D and identify the extent of data gaps and uncertainty. The agenda of the 2011 Differential Delayed Mortality Workshop is contained in Appendix D, summaries of the presentations and discussions are included in Appendix E, a transcript of the workshop is presented in Appendix F, and survey results are included in Appendix G. Based on our review and the discussions at the workshop, we developed a roadmap for future research (Section 5.0). This section includes key management questions that are generally addressed (Section 5.1) and an extended version of the future research roadmap (Section 5.2). A brief comparison of this current synthesis report to the report summarizing the 2004 Comparative Survival Study Workshop is contained in Appendix H. References for sources cited in the main text and in the appendices (excluding the literature database in Appendix A) are listed in Section 6.0.

2.1
2.0 Differential Delayed Mortality
This section begins by defining differential delayed mortality (Section 2.1), and continues to describe some temporal patterns of D by species (i.e., Chinook salmon and steelhead), run (i.e., spring/summer and fall Chinook salmon), and rearing type (i.e., wild and hatchery) across years and within the migration season (Section 2.2). General patterns in the arrival time of fish are presented to help interpret the seasonal patterns of D within and across species and runs. Ways of interpreting D relative to survival rates within the hydropower system and to SARs are also described. We end with a presentation of three major hypotheses explaining the patterns of D (Section 2.3).
2.1 Definition of D
Differential delayed mortality, designated D, is the ratio of the post-hydrosystem survival (S) of barged fish (B) divided by the post-hydrosystem survival of ROR fish (R):
B
R
SDS
= (2.1)
The term expresses the relative post-hydrosystem of fish from the two passage types. Values of D less than 1 indicate run-of-river fish survival better in the ocean than barged fish and values of D greater than 1 indicate the barged fish survive better than run-of-river fish. By convention, the post-hydrosystem survivals, SB and SR, are defined from the point juvenile fish enter the river downstream of BON to their arrival as adults to Lower Granite Dam (LGR) at the upstream end of the FCRPS. The condition of the fish exiting the hydrosystem affects their survival until their return as adults. The condition of juvenile fish exiting the hydrosystem depends on their passage experience within the hydrosystem and their condition when they first enter the hydrosystem at LGR as juveniles. Thus, the term differential delayed mortality denotes the belief that detrimental effects (i.e., mortality) resulting from a fish’s freshwater experience may not be realized until after the fish exit the hydrosystem. However, the terminology fails to capture the possibility that differential post-hydrosystem mortality between barged and ROR migrants is influenced by the conditions of the post-hydrosystem environment. For example, the timing of ocean entry may differ for barged and ROR fish, exposing them to differing environmental conditions that would result in differential mortality even if the fitness of the groups did not differ.
By convention, D is calculated using information about the survival of fish from the time they pass LGR as smolts to the time they return to the hydrosystem as adults. The calculation of D is as follows:
B R
R B
SAR VDSAR V
= (2.2)
where SARB and SARR are the SARs from the barge-loading site (e.g., LGR) of juveniles and back as adults to a point in the hydrosystem (e.g., LGR) for barged and ROR fish, and VB and VR are the survival rates between the barge-loading site (e.g., LGR) and BON, effectively the barge release site, for the two groups.

2.2
Unfortunately, an SAR can be defined in many ways, making for different definitions of D. Buchanan et al. (2006) identified eight different measures of transportation effects that consider SARs from specific individual transport dams, across all dams, and including or excluding the effects of transport or ROR fish at lower river dams, or including versus excluding untagged fish in the estimates. Consideration of these details in the definition of SAR is beyond the scope of this report. Using a particular definition of SAR can affect the magnitude of SAR estimates, but should have little effect on general trends in D and the discussion of the factors that contribute to D. Furthermore, SAR can be defined from the transport dam to either LGR or BON, which includes or excludes the effects of juvenile hydrosystem passage differences on the upstream migration of adults. The estimates by Buchanan et al. (2006) were for across-year estimates of transport effect. Buchanan et al. (2006) pointed out that considering within-season variations further complicates the estimates of transportation effects. Muir et al. (2006) considered the within-season estimates using passive integrated transponder (PIT)-tag groups that were collected at LGR as juveniles and returned to LGR as adults. Finally, Scheuerell et al. (2009) considered SARs of Chinook salmon from BON as juveniles to their return to LGR as adults. Because D is calculated from a ratio of SAR values, it is important to ensure that the values represent the same starting and ending points within the same D estimate.
2.2 Patterns of D
Many factors are hypothesized to influence D, and the patterns that arise among species and years, and those that develop throughout the migration season can reveal which factors are important. These patterns are a valuable source of information for evaluating proposed hypotheses, and they may also reveal where management actions could be effective in altering D or improving SARs.
2.2.1 Yearly Averaged D
General averages of D across years are illustrated in Table 2.1. From 1997 to 2008, wild Chinook salmon generally had a lower geometric mean of D (0.60; 90% CI = 0.48-0.75) than hatchery Chinook salmon (Petrosky 2010; Tuomikoski et al. 2010; Wilson 2010). For hatchery spring Chinook salmon represented by Rapid River, Dworshak, and McCall hatcheries and Catherine Creek and Imnaha artificial production, D was approximately 1 (Petrosky 2010; Tuomikoski et al. 2010, Table 3.2). For wild and hatchery steelhead, geometric means of D from 1997 to 2007 were 0.99 (90% CI = 0.61-1.61) and 0.99 (90% CI = 0.68-1.46), respectively. T:I estimates were generally equivalent to or greater than 1 for wild and hatchery spring/summer Chinook and steelhead. Estimates of D and T:I for fall Chinook salmon are difficult to estimate due to small sample sizes that provide limited statistical power to establish whether or not D tends to exceed 1. For fall Chinook salmon, estimates of D are generally low, but statistically have large confidence intervals (Williams et al. 2005; Marsh et al. 2010a). It is thus unknown whether D is truly more or less than 1. The T:I for fall Chinook salmon likely falls between 0.67 and 1.5, and D falls between 0.67 and 1.5 times the in-river survival rate. Estimates of survival to the lower river and estuary (LRE) across the season show that fall Chinook salmon survival rates, especially for barged fish, are lower than those of spring/summer Chinook salmon and steelhead (Schreck et al. 2005; Clemens et al. 2009), and are suspected to be as low as 0.2 (Marmorek et al. 2004). Although data are relatively limited for fall Chinook salmon, D is generally believed to be less than 1.

2.3
Table 2.1. General Estimates of D and Transport-to-In-River Ratio (T:I) (modified from Petrosky 2010; Tuomikoski et al. 2010; Wilson 2010)
Years D T:I
Hatchery spring/summer Chinook
1997-2008 D ~ 1 D < 1 in 14/56 annual estimates D ~ 1 in 36/56 annual estimates D > 1 in 6/56 annual estimates
T:I ≥ 1 T:I < 1 in 3/56 estimates T:I ~ 1 in 22/56 estimates T:I > 1 in 31/56 estimates
Wild spring/summer Chinook
1994-2008 D ≤ 1 D < 1 in 8/15 years D ~ 1 in 7/15 years D > 1 in 0/15 years
T:I ~ 1 T:I < 1 in 2/15 years T:I ~ 1 in 11/15 years T:I > 1 in 2/15 years
Hatchery steelhead 1997-2007 D ~ 1 D < 1 in 2/11 years D ~ 1 in 6/11 years D > 1 in 3/11 years
T:I ≥ 1 T:I < 1 in 0/11 years T:I ~ 1 in 4/11 years T:I > 1 in 7/11 years
Wild steelhead 1997-2007 D ~ 1 D < 1 in 3/11 years D ~ 1 in 7/11 years D > 1 in 1/11 years
T:I ≥ 1 T:I < 1 in 0/11 years T:I ~ 1 in 6/11 years T:I > 1 in 5/11 years
Fall Chinook D < 1 ? T:I < 1 ?
2.2.2 Seasonal Patterns in D
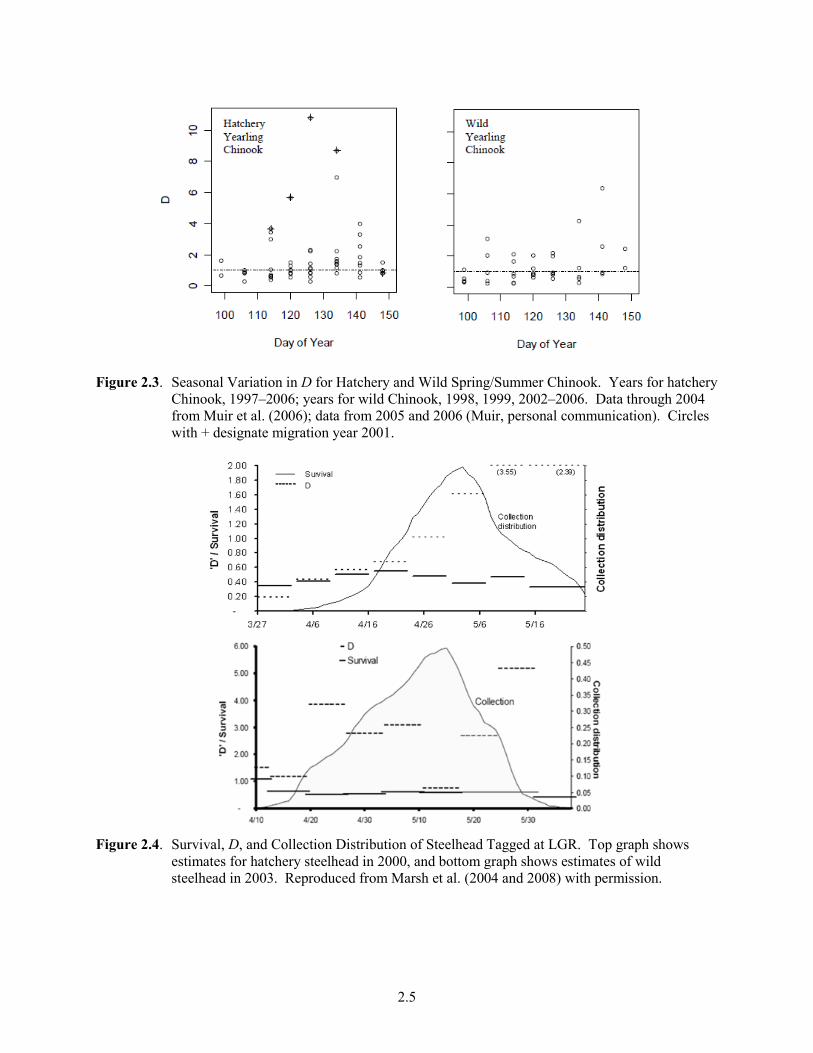
Seasonal variation occurs in D. Eq. (2.2) shows that D varies with SARs and hydrosystem system passage survival estimates. Because hydrosystem survival rates are not highly variable, the ratio of barge-to-in-river SARs (i.e., T:I) can provide an index of D within a season. Therefore, for the purposes of characterizing the seasonal variation in D, T:I provides a good illustration of the pattern. The patterns of SARs are themselves highly variable but seasonal variations in D, using T:I as an index of D, are less variable (Figure 2.1). A general pattern occurs for passage history types with an increasing SAR in barged fish over the season and a variable or decreasing SAR for ROR fish. Consequently, the ratio of the two generally increases across the season—beginning the season < 1 and increasing, as illustrated in the seasonal trends for wild and hatchery steelhead and spring/summer Chinook (Figure 2.2). Figure 2.3 illustrates weekly averaged values of D for hatchery yearling Chinook. Figure 2.4 shows the survival, D, and collection distribution of hatchery and wild steelhead tagged at LGR in 2000 and 2003, respectively (Marsh et al. 2004, 2008). It illustrates that the seasonal pattern of D can differ between hatchery (seasonal increase) and wild steelhead (no consistent pattern). No seasonal data for fall Chinook are available. Overall, the following patterns occur: 1) T:I, and presumably D, generally increases through the season; 2) steelhead have higher T:I or D values than Chinook salmon; and 3) within a species, hatchery fish have higher D values than wild fish.
Several studies define seasonal patterns in terms of early, middle, and late migrating spring/summer Chinook salmon where the divisions between the intervals are divided roughly equally between late April and late May. These divisions can capture some of the variation in D and T:I through the season given the logistical constraints of field-based research and data collection.

2.4
Figure 2.1. SAR, T:I and D of Hatchery Spring/Summer Chinook Salmon throughout the 1999
Outmigration Year. A) Seasonal variations in SAR of yearling (spring/summer) Chinook from LGR for the barged group () and ROR (- - -) migration types (redrawn from Anderson et al. 2005). B) The T:I of yearling Chinook salmon from LGR () and weekly D (•) for spring Chinook in 1999 (Muir et al. 2006).
Figure 2.2. The T:I of Hatchery and Wild Spring/Summer Chinook Salmon and Steelhead from the 1999
Outmigration Year
2.5
Figure 2.3. Seasonal Variation in D for Hatchery and Wild Spring/Summer Chinook. Years for hatchery
Chinook, 1997–2006; years for wild Chinook, 1998, 1999, 2002–2006. Data through 2004 from Muir et al. (2006); data from 2005 and 2006 (Muir, personal communication). Circles with + designate migration year 2001.
Figure 2.4. Survival, D, and Collection Distribution of Steelhead Tagged at LGR. Top graph shows
estimates for hatchery steelhead in 2000, and bottom graph shows estimates of wild steelhead in 2003. Reproduced from Marsh et al. (2004 and 2008) with permission.

2.6
2.2.3 Patterns by Run Type
From the cumulative evidence, two essential patterns emerge: 1) D often increases over the migration season for hatchery spring Chinook and steelhead, and 2) larger fish have higher D than smaller fish (Table 2.2). Table 2.2 conceptually illustrates the relationship between travel time, fish size, and D across species, runs, and rearing types.
Table 2.2. Patterns of Fish Size, D, and Travel Time Through the FCRPS of Salmonid Runs and Rearing Types (SS represents spring/summer)
Variable Pattern Across Salmonid Runs and Rearing Types Fish size in decreasing order Hatchery
steelhead > Wild
steelhead > Hatchery
SS Chinook > Wild
SS Chinook > Fall
Chinook D in decreasing order Hatchery
steelhead ~ Wild
steelhead ~ Hatchery
SS Chinook > Wild
SS Chinook > Fall
Chinook Travel time in increasing order Hatchery
steelhead ~ Wild
steelhead > Hatchery
SS Chinook ~ Wild
SS Chinook ~ Fall
Chinook
2.2.4 Arrival Time of Fish
Characteristic arrival times of fish to LGR are plotted in Figure 2.5. Because SARs and D vary widely across the season, variation in arrival times could greatly influence annual estimates of SARs and D.
2.2.5 Management Implications
D is of interest to the management and recovery of listed salmon and steelhead stocks because it contrasts the impacts of barge transportation with in-river hydrosystem passage on the survival of the fish as they continue their migration to complete their life histories. It is important to note that a relatively high D does not indicate that the rate of adult return is high. At the end of the season and in certain years, D can be very large, but overall survival rates can be low. D is a relative ratio and not an absolute measure of survival. The value of D is an indicator of differences related to management actions, but it does not capture all factors influencing the efficacy of transportation.
The value of D does not encompass all of the differences in survival among barged and ROR groups. To gain a better understanding of the overall benefits of transportation on SARs, one can compare the values of D in the context of the T:I ratio (Giorgi et al. 2002). T:I is equal to SART / SARI from the juvenile fish transport site to when adults return (generally to LGR), and where T denotes barge transported fish and I denotes in-river migrants. Because survival in the barge is nearly 100% (recently estimated as 98%, McMichael et al. 2010), the overall survival benefit of barging is lost as D approaches the in-river survival rate. Assuming that within-barge survival is 1, the relationship of D is reduced to the following:
( ):
1B R
RR
SAR VD T I VSAR
= =
2.7
Figure 2.5. Mean Run Timing at Lower Granite Dam of Wild Spring/Summer Chinook Salmon, Steelhead, Fall Chinook Salmon (1989–2010) on the Left, and Mean Run Timing of Combined Wild and Hatchery Spring/Summer Chinook Salmon (1985–2010), Steelhead, and Fall Chinook Salmon on the Right. Graphs from DART (www.cbr.washington.edu/dart/), accessed 5 July 2011.
Thus, transportation increases adult returns whenever D exceeds the in-river survival rate, i.e., when
RD V> . In Figure 2.6, four key scenarios of various values of D, T:I and VR are described with examples. One of the examples shows that when D drops downstream of the in-river survival rate, a smaller proportion of fish that were barged would return as adults, relative to in-river migration, for a T:I < 1.

2.8
D values vary within and across years, and are different among species (e.g., Chinook salmon and steelhead), run types (e.g., spring/summer and fall Chinook salmon), and rearing types (i.e., hatchery versus wild). A mixed population with temporal variations in D makes it difficult to evaluate the benefits of transportation and to manage transportation operations to ensure that T:I exceeds 1. Thus, individual factors in a conceptual framework within and across years must be considered to gain a better understanding of D patterns.
Figure 2.6. Four Scenarios of Various Values of D, VR, and T:I for Fish Transported from Lower Granite
Dam. VB is assumed to equal 1.
If D < 1 and D = VR, then T:I = 1 When D is less than 1 and also equal to VR, T:I is equal to 1. Transporting fish does not have positive or negative effects on SARB relative to SARR. e.g., Barged fish: ROR migrants: Therefore, T:I = 1 D = 0.5
If D > 1, then T:I > 1 When D is greater than 1, T:I is always greater than 1. Transporting fish has positive effects on SARB relative to SARR. e.g., Barged fish: ROR migrants: Therefore, T:I = 2.5 D = 1.25
LG
R
BO
N VB = 1
SB = 0.5
LGR
BO
N VR = 0.5
SB = 0.4
LG
R
BO
N VB = 1
SB = 0.25
LG
R
BO
N VR = 0.5
SB = 0.5
If D < 1 and D > VR, then T:I > 1 When D is less than 1, but greater than VR, then T:I is greater than 1. Transporting fish has positive effects on SARB relative to SARR. e.g., Barged fish: ROR migrants: Therefore, T:I = 1.6 D = 0.8
If D < 1 and D < VR, then T:I < 1 When D is less than 1 and also less than VR, then T:I is less than 1. Transporting fish has negative effects on SARB relative to SARR. e.g., Barged fish: ROR migrants: Therefore, T:I = 0.8 D = 0.4
LG
R
BO
N VB = 1
SB = 0.4
LG
R
BO
N VR = 0.5
SB = 0.5
LG
R
BO
N VB = 1
SB = 0.2
LG
R
BO
N VR = 0.5
SB = 0.5

2.9
2.3 Major Hypotheses Explaining D
In recasting D in a larger context we need encompassing hypotheses and theories spanning all salmonid runs and rearing types within and across the migration season. We have failed to understand D if we have one theory for steelhead and another for fall Chinook salmon. We have failed to understand the issue if we consider yearly averaged values of D and ignore the seasonal variations observed in some stocks or differences in transport locations. However, achieving an overarching theory across all species and runs is not a trivial undertaking. At its ecological basis, post-hydrosystem survival depends on the ability of smolts to feed and avoid predators. A considerable number of studies have investigated the factors by which the hydrosystem passage affects post-hydrosystem survival. However, the goal of this report is a synthesis of the factors that affect D, so our approach here is first to state overarching hypotheses that have been proposed to explain the patterns of D and then present a mathematical framework in which to evaluate these hypotheses. We then consider the detailed factors contributing to these hypotheses in Section 4.0.
The patterns of D can generally be considered in terms of three hypotheses that are not mutually exclusive. The Fish Size Hypothesis attributes the patterns primarily to the differential in the size of barged and ROR fish; barged fish do not grow during their 2-d hydrosystem passage. The Arrival Time Hypothesis attributes the patterns to the differential in arrival timing of barged fish and ROR fish; barged fish enter the estuary earlier than had they actively migrated . The Fish Condition Hypothesis attributes the patterns in D to differences in the condition (nutrition, disease, or stress levels) of barged and ROR fish.
2.3.1 Fish Size Hypothesis
Research on salmonid stocks from Alaska, British Columbia, Washington, Russia, Norway and Scotland have shown that fish size is an important factor, among others, to their marine survival (Parker et al. 1992, Friedland et al. 2000, Beamish and Mahnken 2001, Moss et al. 2005, Farley et al. 2007a, Cross et al. 2009, Duffy and Beauchamp 2011, Clairborne et al. 2011). A critical size at ocean entry (Parker 1968, Pearcy 1992) and another critical size after growth during the critical period of their first spring and summer in the marine environment (“Critical Size, Critical Period” hypothesis; Beamish and Mahnken 2001) have been hypothesized to explain marine survival of salmonids. The first critical size relates to the high mortality rates that fish experience when they enter the ocean (Parker 1968), and this mortality is partly due to size-selective predation (Pearcy 1992). The second critical size is growth- and physiologically-based, is thought to influence mortality during the fall and winter of their first ocean year, and links climate-driven processes to salmon production. Further details on the research conducted on critical sizes of salmonid species in relation to their marine survival are summarized in Section 4.2.3.5 as motivation to consider this factor of fish size in relation to D. The purpose of this section is to introduce a concept of fish size across the different species and runs of salmonids and their associations with SAR and D.
This hypothesis is based on the concept that smaller fish have lower post-hydrosystem survival than larger fish, but the effect diminishes with increasing size as is illustrated in Figure 2.7. This hypothesis fits with the general run ordering of fish size and D, with larger fish having higher D than smaller fish, as illustrated in Table 2.1 and Table 2.2. In addition, the hypothesis generates a seasonally increasing D if the fish entering the hydrosystem increase in size over the migration season, while the size of ROR fish exiting the hydrosystem remains fixed. The hypothesis is a form of the “lost growth opportunity”

2.10
hypothesis from Muir et al. (2006) and provides a possible explanation for the general pattern of D across species, runs, and rearing types. As depicted in Figure 2.7, fall Chinook salmon are the smallest fish among those considered and are assumed to have the greatest size differential effects and the lowest D, such that barged fish survive poorly compared to their ROR counterparts. At the other extreme, hatchery steelhead are the largest fish of the species and runs considered. With the hypothesized asymptotic pattern of survival relative to fish length (Figure 2.7), the survival differential between barged and ROR hatchery steelhead is the smallest. Therefore, their D values are the largest among the species and runs, and this is what is generally observed (Table 2.1). For the other migrants, wild steelhead, hatchery spring Chinook, and wild spring Chinook are ordered from larger to smaller size (Table 2.2).
Figure 2.7. Hypothetical Relationship Between Fish Length of Each Species, Rearing Type, and Passage
Type at BON and Post-BON SAR (top graph) and the Corresponding Values of D Relative to Their Lengths at LGR (bottom graph). BCh.0, BCh.1, and BSt correspond to the fish lengths of subyearling Chinook salmon, yearling Chinook salmon, and steelhead respectively at BON, and RCh.0, RCh.1, and RSt correspond to the fish lengths of these respective ROR counterparts also at BON (top graph). The greater the fish length at BON for any of the species and rearing types, the greater the survival. In the bottom graph, note that there is negligible growth experienced by barged fish from LGR to BON, as represented by the dashed gray lines between the top and bottom graphs. In contrast, the ROR fish gain length from LGR to BON. Thus, with the curved relationship in the top graph, the ratio of post-BON SARs (i.e., D) increases across subyearling Chinook, yearling Chinook, and steelhead in the bottom graph.

2.11
Furthermore, within the outmigration season of a species, run and rearing type, such as the hatchery spring/summer Chinook salmon, a size differential can also occur. This pattern appears quite consistently and we postulate that the seasonal pattern of D can be looked at in terms of three distinct periods (Figure 2.8): in Period I (early season) transport fish enter the estuary at a relatively small size; in Period II (mid-season) transport fish are larger and so survive better than their ROR counterparts; while in Period III (late season), fall Chinook migrate and are small, thus experiencing relatively high rates of mortality. Note that through this mechanism, D depends on the differential in size-related survival rates between barged and ROR fish. In this hypothesis, D never exceeds 1 because barged fish are expected to never be greater in size than ROR fish. ROR fish have greater growth opportunity than barged fish prior to ocean entrance (Muir et al. 2006) and the collection screens at dams select for smaller fish in some cases (Zabel et al. 2005). Thus, this mechanism can explain, in part, the differences in D between species and run types but it cannot account for conditions in which D is greater than 1.
Figure 2.8. Ratio of Transport to In-River SAR (T:I) for Spring Chinook () (Anderson et al. 2005) and
Weekly D (•) for Spring Chinook in 1999 (Muir et al. 2006). Arrows indicate across-year average estimates of D. Periods indicate early season (Period I) where D < 1, middle season (Period II) where D ≥ 1, and late season (Period III) where D < 1. Period patterns I and II are representative of spring/summer Chinook salmon and steelhead; Period III is representative of fall Chinook salmon.
The pattern generated under this hypothesis depends on the shape of the pattern of length versus post-hydrosystem survival of fish plus factors that determine the sizes of ROR and barged fish at the hydrosystem exit. As proposed in Muir et al. (2006), we also hypothesize that the size-frequency distribution of gape-limited predators in the lower river, estuary, and ocean shapes the curve illustrated in Figure 2.7. Other factors covarying with size may also contribute to the size-dependent survival pattern. For example, Schreck et al. (2006) proposed that the susceptibility to avian predators depends on the level of smoltification of fish entering saltwater. Because barged fish exit the hydrosystem prior to ROR fish, as well as being smaller they are expected to be less prepared to enter seawater. The combined effect could steepen the size versus survival pattern and result in smaller D for barged fish earlier in the migration season.
2.12
2.3.2 Arrival Time Hypothesis
The seasonal patterns often observed in spring/summer Chinook salmon and steelhead (Figure 2.8) suggest that arrival timing of the fish downstream of the hydropower system is an important aspect to consider. Barged fish arrive in the LRE 2 and 3 weeks earlier than ROR fish and this differential could shape the seasonal pattern of D. Support for this hypothesis comes from a study by Scheuerell et al. (2009) that found post-hydrosystem survival (BON to LGR) of PIT tagged wild ROR spring Chinook and steelhead declined over the migration season. However, the pattern of decling survival over the migration season did not correlate with patterns of costal upwelling or river temperature at Bonneville Dam. They suggested that the decline in survival might have been affected by the later season increase in numbers of predatory fish in the Columbia River plume and avian predator in the Columbia River estuary. Arrival time can be an important index to relate to SARs and D because it relates to seasonally-varying fish and environmental conditions. Many of the factors reviewed in Section 4.0 have a seasonal component. For a graphical summary of seasonally varying factors and their hypothesized effects on barged and ROR SARs, see Section 4.4.1.
2.3.3 Fish Condition Hypothesis
This hypothesis attributes changes in seasonal D principally to changes in ROR fish survival capacity over the migration season. This hypothesis assumes seasonal changes in fish condition can occur through several pathways such as differential loss of energy density, differential pathogen load, and differential stress from dam passage between the barged and ROR fish. A number of studies suggest the possibility of fish condition affecting the seasonal pattern in D. For example, fish energy density in some fish decreases over the migration season (Congleton et al. 2005). ROR migrants subjected to a challenge of increased water temperature and cessation of feeding experienced faster mortality than did barged fish, and the predicted survival capacity ratio of barged to ROR fish increased over the season and then declined at the end of the season (Gosselin 2011). Pathogen prevalence and pathogen load present a more complex picture in this hypothesis. The hypothesis requires pathogens to increase in ROR fish over the migration season. Overall, we suggest that the pathogen effects are non-linear and are of more importance later in the migration season. Also, note that a fish condition mechanism is required to explain D values greater than 1, a property that is deficient in the Fish Size Hypothesis.

3.1
3.0 Models of D
No single factor can explain all the temporal, spatial, and species-specific variation in D. Multiple factors contribute, including fish size, fish condition, and seasonally varying environmental conditions in the estuary and ocean. Studies to date have approached the problem at a population level with emphasis on fish arrival times and survivals. The few studies that have considered fish size and fish condition suggest their importance as underlying mechanisms in shaping D. Furthermore, delayed mortality by its nature is a differential process that contributes to heterogeneity within and between the groups, whether they are identified by barge versus in-river passage, species, or timing. From this perspective, D is at its basis the result of a complex culling process. Our standard survival methodology works at a population level but is inadequate for addressing the complexity of differential mortality. Sections 3.1 and 3.2 describe two mathematical approaches that synthesize these multiple factors. The first approach, designated the “Multivariate Regression Model”, relates D to covariates using a multiple linear regression technique. The second approach, designated the “Culling Model”, addresses how culling and intrinsic fish condition processes alter the heterogeneity in survival capacity of barged and ROR fish.
3.1 Multivariate Regression Model
The basis of this conceptual model of D is that the survival of juvenile salmonids after passing BON depends on the state of the environment they experience and their condition. From the perspective of the fish, both factors depend on the type of passage through the hydrosystem (ROR migration or barge transportation). Post-hydrosystem fish condition is determined by the cumulative experiences of the fish, from their hatching in tributaries and hatcheries to their migration through the rivers, reservoirs, dams, and transport systems. These cumulative experiences also affect the migration timing, and therefore the time the fish exit the hydrosystem and continue their migration down the river, through the estuary, into the ocean, and back up through the hydrosystem. Their passage experience determines the date they exit the hydrosystem and so indirectly affects the environment they experience. Thus, D integrates the differences in the multitude of factors fish experience during barge and ROR fish passage.
Multiple factors can interact in subtle and complex ways, making it extremely difficult to understand and identify the causative mechanisms of delayed mortality. Individual hypotheses have been proposed for D, but the accumulated evidence indicates there is no one factor or theory that can adequately express the patterns contributing to D.
To organize the discussion of delayed mortality, we created a comprehensive conceptual model. This model was developed as a proportional hazard model that treats the survival as a baseline survival rate and the additive sum of explanatory variables as 0log log ii
S S F= + ∑ . This is a standard approach for
characterizing the effects of stressors on survival acting concomitantly within the interval during which survival is measured.
Using a proportional hazards framework, we structured contributions to post-hydrosystem survival by first dividing the mortality factors into two categories: those factors that occur within or before hydrosystem passage and those factors that occur after hydrosystem passage and are associated with the environmental conditions in specific areas the fish pass through in their life cycle after passing through the hydrosystem. Note that the factors in Eq. (3.1) do not exactly correspond with the 12 factors identified in Section 4.0 as contributing to D in this model. The reason is that we do not have data for all

3.2
the 12 factors for this analysis. We therefore designed the analysis using variables that reasonably represent factors relating to D. The survival equation for a passage type j is then
3.1)
where j refers to either run-of-river (R) or barge (B) passage type.
In Eq.(3.1), the post-hydrosystem survival of fish passing type j, having entered the hydrosystem on day t, depends on seven factors:
• The first factor, Fyear, is a year effect that does not change over the migration season. This is essentially the catchall for things that we cannot attribute to a specific process or experience in the life cycle.
• The second factor, Fdam, characterizes the latent effect of either dam passage or transportation on delayed mortality; this factor is affected by specific passage type and determines when fish exit the hydrosystem.
• The third factor, Fcondition, characterizes the effects of the passage type on fish condition as fish exit the hydrosystem; it depends on the condition of the fish entering the hydrosystem and the effect of the hydrosystem on their condition as they exit the hydrosystem.
The remaining four factors characterize mortalities that can be attributed to specific locations along their specific migratory path from BON as juveniles to their return to LGR as adults.
• Friver designates the area from BON to the head of the estuary (rkm 56).
• Festuary designates the area of the estuary.
• Focean designates the effect of the ocean and in particular the effect of the ocean during their first few months in saltwater.
• Fhydro designates effects such as straying of adults during upstream migration through the hydrosystem.
The value of D depends on the difference in these factors between ROR fish and transported fish. We express this as follows:
( )( ) exp year dam condition river estuary ocean hydroD x F F F F F F F= ∆ + ∆ + ∆ + ∆ + ∆ + ∆ + ∆ (3.2)
where differential factors are defined as , ,year year R year BF F F∆ = − , , ,dam dam R dam BF F F∆ = − , etc. The important point here is that D depends on the difference of the factors between the ROR and barge passage types.
( ), , , , , , ,( ) expj year j dam j condition j river j estuary j ocean j hydro jS x F F F F F F F= − − − − − − −
Factors occurring before or during hydrosystem passage
Factors occurring after hydrosystem passage
Post-hydrosystem survival
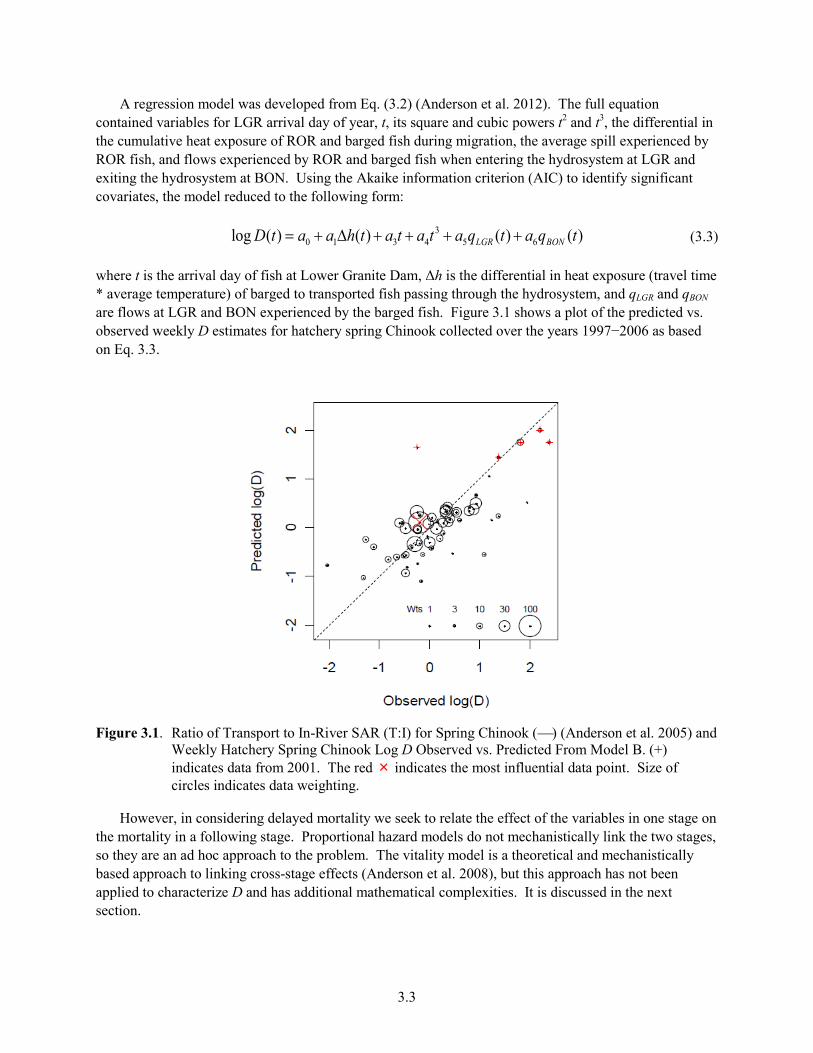
3.3
A regression model was developed from Eq. (3.2) (Anderson et al. 2012). The full equation contained variables for LGR arrival day of year, t, its square and cubic powers t2 and t3, the differential in the cumulative heat exposure of ROR and barged fish during migration, the average spill experienced by ROR fish, and flows experienced by ROR and barged fish when entering the hydrosystem at LGR and exiting the hydrosystem at BON. Using the Akaike information criterion (AIC) to identify significant covariates, the model reduced to the following form:
30 1 3 4 5 6log ( ) ( ) ( ) ( )LGR BOND t a a h t a t a t a q t a q t= + ∆ + + + + (3.3)
where t is the arrival day of fish at Lower Granite Dam, Δh is the differential in heat exposure (travel time * average temperature) of barged to transported fish passing through the hydrosystem, and qLGR and qBON are flows at LGR and BON experienced by the barged fish. Figure 3.1 shows a plot of the predicted vs. observed weekly D estimates for hatchery spring Chinook collected over the years 1997−2006 as based on Eq. 3.3.
Figure 3.1. Ratio of Transport to In-River SAR (T:I) for Spring Chinook () (Anderson et al. 2005) and
Weekly Hatchery Spring Chinook Log D Observed vs. Predicted From Model B. (+) indicates data from 2001. The red × indicates the most influential data point. Size of circles indicates data weighting.
However, in considering delayed mortality we seek to relate the effect of the variables in one stage on the mortality in a following stage. Proportional hazard models do not mechanistically link the two stages, so they are an ad hoc approach to the problem. The vitality model is a theoretical and mechanistically based approach to linking cross-stage effects (Anderson et al. 2008), but this approach has not been applied to characterize D and has additional mathematical complexities. It is discussed in the next section.

3.4
3.2 Culling Model with Dynamic Processes in Heterogeneity Among Individuals
The above discussion of factors with a potential to influence D is based on a standard hazard rate model and approximates, in a simplified manner, average contributions of some factors that are thought to affect delayed mortality. However, the hazard rate approach is inadequate for characterizing the change in the survival capacity of fish as they move through the hydrosystem and into the ocean. A better approach is to build upon the idea that fish entering the hydrosystem have a distribution of survival capacity, i.e., heterogeneity in vitality, and that passage through the hydrosystem then alters the distribution so that the survival capacity of the group exiting the hydrosystem is different from its survival capacity at hydrosystem entrance. In short, the experience of fish in hydrosystem passage affects their post-hydrosystem survival capacity. Characterizing heterogeneity in vitality and how it changes with passage is central to understanding D. The issue is somewhat complex and previous attempts to consider heterogeneity are limited. For example, in the 2004 CSS Workshop (Marmorek et al. 2004), a culling hypothesis was proposed in which weaker fish destined to die are culled during river passage, while if barged, the same weaker fish are culled when released downstream of the hydrosystem. Thus, in the CSS hypothesis, culling simply moves the location at which the weak fish die but does not affect total survival. However, it was also hypothesized that passage types differentially stress ROR and barged fish (Budy et al. 2002) independent of how many die in the particular passage type. This differential passage stress hypothesis conflicts with the CSS culling hypothesis which assumes that fish survival capacity is not affected by passage type. Hazard rate models are inadequate for distinguishing between the culling that kills weak fish without affecting the distribution of survival capacity and passage stress that weakens fish so they suffer delayed mortality. In summary, heterogeneity is inextricably linked to D, so understanding the complexities of the processes requires a framework that encompasses both heterogeneity resulting from mortality and nonlethal stress while at the same time being sufficiently simple and tractable to be applied to data.
The effect of heterogeneity on the survival capacity of fish has been considered in terms of measurable distributions of fish properties (Ginn and Loge 2007) and more abstractly by vitality (Anderson 2000; Li and Anderson 2009, Li and Anderson in press). The methods take different approaches but are similar in that they characterize a distribution of survival capacity within a population. Here we outline a framework for a new “culling model” that we believe tractably deals with the effects of heterogeneity on direct and delayed mortality.
3.2.1 Derivation
At the basis of a culling model is the effect of time and passage types on heterogeneity in fish survival capacity. We express heterogeneity among individuals in terms of vitality, which is an abstract measure of the survival capacity of an animal (Anderson 2000). We assume extrinsic mortality occurs when the strength of an external random event or challenge, Y, exceeds the vitality of a fish, v (Li and Anderson, in press). These external random events have multiple sources such as blade strike, descaling, and embolisms in dam passage; predator encounters; and infection. The rate of mortality, r, depends on the frequency and magnitude of these external events and can be defined as Pr( ) (1 ( ))r Y v vλ λ= ≥ = − Φ where λ is the frequency of the random events and Φ is the cumulative distribution of their intensities, i.e., the cumulative probability that a random event is below the vitality level (v). Assuming that most events are small and that the probability of occurrence of large events declines with their magnitude, we

3.5
represent the distribution of the strength of events by an exponential density function. Then the cumulative distribution function of event strength is /( ) 1 v kv e−Φ = − , where k is a scale parameter
expressing the shape of the distribution (Figure 3.2, Panel A) and the mortality rate is v kr eλ −= . Assuming the mortality of fish is time-dependent and follows the equation dS dt rS= − , then survival is a function of time and the representative vitality of a fish over the river segment is a constant. The survival through the segment is a function of the segment travel time (τj) and v:
( ) ( )( , ) exp expv k v kj j j j jS v e m eτ λ τ − −= − = − (3.4)
where jλ is the frequency of external events in river segment j and mj is the average number of external events that a fish encounters over river segment j (Figure 3.2, Panel A).
Figure 3.2. Cumulative Frequency Distribution of Events (A) and Survival as Functions of Vitality (B)
The average survival over river segment j is
0
( ) ( , ) ( , )j j j jS t S v f v t dvτ∞
= ∫ (3.5)
where t is the time the fish enters the hydrosystem, jτ is the hydrosystem travel time by passage type j,
and ( , )jf v t is the intrinsic vitality distribution over the passage type j through the hydrosystem. By
“intrinsic” we imply the vitality distribution prior to any culling within the river segment. Eq.(3.5) is then survival resulting from culling of the fish according to their intrinsic vitality distribution of fish passing the hydrosystem through passage type j. We represent the distribution of intrinsic vitality over passage type j with a normal distribution:
( , ) ( ( ), ( ))j j jf v t N v t tσ= (3.6)
where ( )jv t and ( )j tσ are the mean and standard deviation of the distribution. The parameters in Eq.(3.6)
represent the mean and variance in the intrinsic vitality over hydrosystem passage and is determined by the pre-hydrosystem survival capacity as well as any changes during passage from processes such as

3.6
disease loading and growth but is not affected by removal of weaker fish through hydrosystem culling. An adjustment in the distribution due to culling of weaker fish is made when calculating the post-hydrosystem vitality as expressed by Eq. (3.9). In this manner, the intrinsic vitality during passage is an average measure of the distribution of vitality over the passage type before any culling of weak individuals. This post-passage adjustment is required to obtain a closed form solution.
To characterize the vitality distribution of fish exiting the hydrosystem first define the hydrosystem exit time as
j jt t τ= + (3.7)
where jτ is the hydrosystem travel time via passage type j and can be a function of hydrosystem arrival date to account for seasonal differences in passage time of ROR fish. The vitality distribution when exiting the hydrosystem adjusted for both culling during passage and intrinsic changes in vitality due to passage through passage type j can be expressed as
* ( , )( , ) ( , )
( )j j
j jj
S vf v t f v t
S tτ
= (3.8)
where the ratio of survivals ( , ) ( )j j jS v S tτ expresses the effect of culling on the intrinsic distribution.
Assuming the distribution of intrinsic vitality when fish exit the hydrosystem is a normal distribution with a mean vitality of *( )jv t and a standard deviation of *( )j tσ , the distribution of the vitality exiting the
hydrosystem at time jt becomes
( )* * * ( , )( , ) ( ), ( )
( )j j
j j jj
S vf v t N v t t
S tτ
σ=. (3.9)
Figure 3.3 illustrates the vitality distribution of fish entering the hydrosystem and the distributions of fish exiting the hydrosystem as a result of culling alone or from both culling and stress that decrease(s) the vitality distribution.
The post-hydrosystem survival as a function of vitality for a fish entering the hydrosystem at t and passing through passage type j is
( )** * *( , ) exp ( )v kj j jS v t e tλ τ−= − (3.10)
where *jτ is the travel time through the lower river and estuary, *( )j tλ is the frequency of post-hydrosystem
external events a fish experiences after exiting the hydrosystem referenced to its hydrosystem entrance date t, *k is the intensity of external events, and j is the hydrosystem passage type. The equation allows for the frequency of events to change as a function of when fish exit the hydrosystem, but then assumes a constant frequency of events when transiting the LRE.

3.7
Figure 3.3. Post-Hydrosystem Distributions of Vitality Density Under Three Conditions: 1) Initial
Distribution (, black), 2) Exit Distribution with Culling (− −, red), and 3) Exit Distribution with Culling and Stress (⋅⋅⋅⋅, blue)
The resulting post-hydrosystem survival for passage type j becomes
( )
* * *
0
* * *
0
1( ) ( , ) ( , )( )1 ( , ) ( , ) ( ), ( )( )
j j jj
j j j j jj
S t S v t f v t dvS t
S v t S v N v t t dvS t
τ σ
∞
∞
=
=
∫
∫ (3.11)
The D is the ratio of post-hydrosystem of barged to ROR fish and is
* *B RD S S= (3.12)
which can be expressed as
( ) ( )( ) ( )
*
*
* * *
0
* * *
0
exp ( ) ( ) ( ), ( )( )( )( ) exp ( ) ( ) ( ), ( )
v k v kB B B BR
v k v kB R R R R
m t e m t e N v t t dvS tD tS t m t e m t e N v t t dv
σ
σ
∞ − −
∞ − −
− −=
− −
∫∫
(3.13)
where
( ) ( )
( ) ( )0
0
exp ( ) ( ), ( )( )( ) exp ( ) ( ), ( )
v kR R RR
v kB B B B
m t e N v t t dvS tS t m t e N v t t dv
σ
σ
∞ −
∞ −
−=
−
∫∫
(3.14)
and the number of events experienced by the groups in hydrosystem passage ( )jm and post-hydrosystem
passage * ( )jm t are defined as
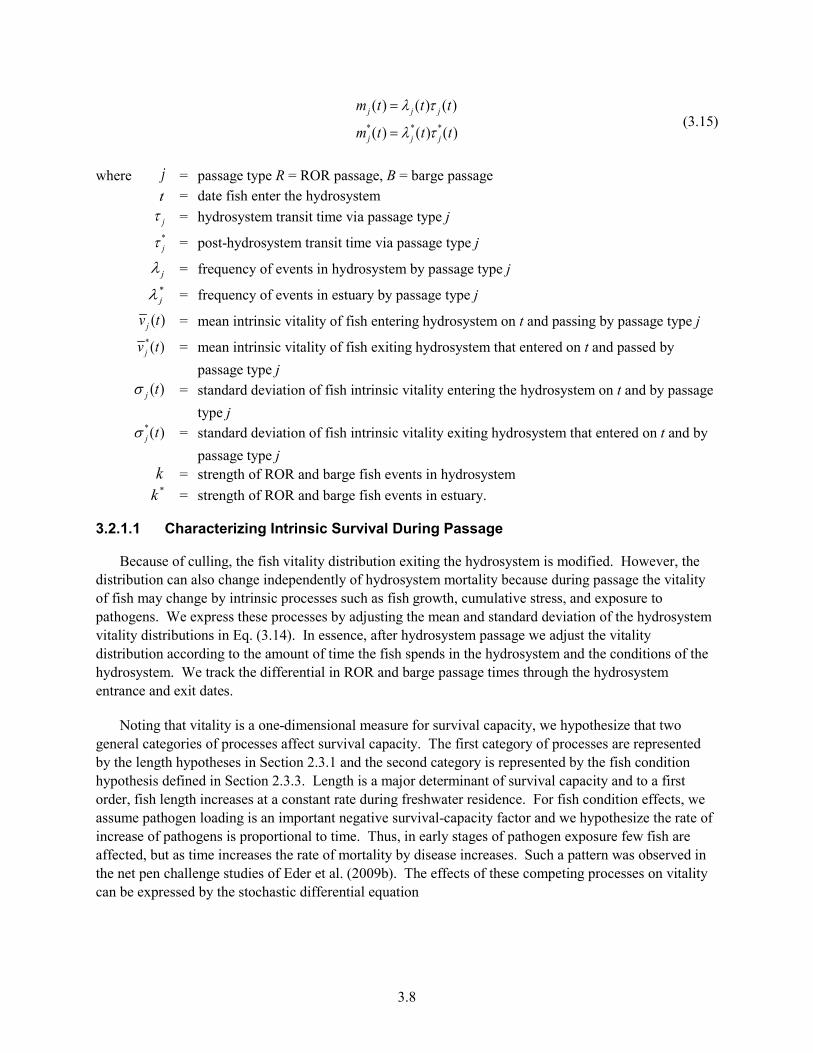
3.8
* * *
( ) ( ) ( )
( ) ( ) ( )j j j
j j j
m t t t
m t t t
λ τ
λ τ
=
= (3.15)
where j = passage type R = ROR passage, B = barge passage t = date fish enter the hydrosystem jτ = hydrosystem transit time via passage type j
*jτ = post-hydrosystem transit time via passage type j
jλ = frequency of events in hydrosystem by passage type j
*jλ = frequency of events in estuary by passage type j
( )jv t = mean intrinsic vitality of fish entering hydrosystem on t and passing by passage type j
*( )jv t = mean intrinsic vitality of fish exiting hydrosystem that entered on t and passed by
passage type j
( )j tσ = standard deviation of fish intrinsic vitality entering the hydrosystem on t and by passage
type j
*( )j tσ = standard deviation of fish intrinsic vitality exiting hydrosystem that entered on t and by
passage type j
k = strength of ROR and barge fish events in hydrosystem *k = strength of ROR and barge fish events in estuary.
3.2.1.1 Characterizing Intrinsic Survival During Passage
Because of culling, the fish vitality distribution exiting the hydrosystem is modified. However, the distribution can also change independently of hydrosystem mortality because during passage the vitality of fish may change by intrinsic processes such as fish growth, cumulative stress, and exposure to pathogens. We express these processes by adjusting the mean and standard deviation of the hydrosystem vitality distributions in Eq. (3.14). In essence, after hydrosystem passage we adjust the vitality distribution according to the amount of time the fish spends in the hydrosystem and the conditions of the hydrosystem. We track the differential in ROR and barge passage times through the hydrosystem entrance and exit dates.
Noting that vitality is a one-dimensional measure for survival capacity, we hypothesize that two general categories of processes affect survival capacity. The first category of processes are represented by the length hypotheses in Section 2.3.1 and the second category is represented by the fish condition hypothesis defined in Section 2.3.3. Length is a major determinant of survival capacity and to a first order, fish length increases at a constant rate during freshwater residence. For fish condition effects, we assume pathogen loading is an important negative survival-capacity factor and we hypothesize the rate of increase of pathogens is proportional to time. Thus, in early stages of pathogen exposure few fish are affected, but as time increases the rate of mortality by disease increases. Such a pattern was observed in the net pen challenge studies of Eder et al. (2009b). The effects of these competing processes on vitality can be expressed by the stochastic differential equation

3.9
xdv a bx cdx
ε= − + (3.16)
where x = the time in hydrosystem passage a = a rate of increase of vitality, resulting from growth during hydrosystem passage b = a time-dependent decline in vitality resulting from cumulative pathogen loading c = the intensity of the stochastic variation in vitality rate εx = is a white noise process to capture the randomness of the system.
Eq. (3.16) in effect assumes growth increases vitality in a steady linear manner, while the negative effect of pathogens is at first small but then increases over time. The solution of Eq. (3.16) is
0 0 0
2
0
( ) (0)
(0)2
x x x
x
x
x
v x v adx bxdx c dx
bv ax x c dx
ε
ε
= + − +
= + − +
∫ ∫ ∫
∫ (3.17)
The expected value of Eq. (3.17) is
2( ) 12bv x ax x= + − (3.18)
and the variance is
2 2 2( ) (0)x c xσ σ= + (3.19)
where 2 (0)σ is the standard deviation of the vitality distribution when fish enter the hydrosystem at the beginning of the migration season, e.g., 1 April. The model assumes that the mean intrinsic vitality increases linearly in time as fish length increases linearly with time, while vitality decreases as a power function of time because of the geometric growth of pathogens. The net result is that fish vitality initially increases in the early portion of the migration season, reaches a peak at critx a b= , and then declines over the remainder of the season, while the variance in the distribution increases linearly with time. Because we require positive values of v, the model is only a valid approximation for values of x that give
( ) ( ) 0.3x v xσ < . When Eq. (3.18) and (3.19) are used in Eq. (3.13) x = tB or tR. While the change in intrinsic vitality, as used here, is specific to the effects of fish passing through the hydrosystem, the model can also characterize the change in vitality of fish prior to entering the hydrosystem and while transiting the estuary.
Overall, with heterogeneity in survival capacity defined by Eq. (3.13), (3.14), (3.18), and (3.19), the model first culls ROR fish in the hydrosystem, which alters the vitality distribution of fish exiting the hydrosystem. Next, as the fish enter the LRE, the model adjusts the vitality distributions according to the total freshwater residence time. In this manner, the equation shapes the vitality distribution of fish entering the lower river by two sources—culling in the river and estuary and intrinsic processes involving growth and pathogen exposure that depend on the duration of the freshwater residence. The resulting vitality distribution, along with the frequency and intensity of challenges, determine the post-hydrosystem mortality.

3.10
3.2.1.2 Simplified Version
Eq. (3.13) has parameters defining the mortality rates as time-dependent vitality functions and vitality distributions. With this high number of parameters, variations in D can be ascribed to a variety of causes, including the differential effects of culling, changes in passage vitality, and differential effects of environmental conditions. The challenge is disentangling these factors to illuminate the essential factors contributing to the across-species and across-season variations in D. This is difficult. However, the equation’s basic properties can be explored by making the following assumptions: 1) barge fish experience no mortality (mB = 0), 2) mean barge vitality is one ( 1Bv = ), 3) no fish die during barging
( 1BS = ), and 4) the coefficient of the variation in the vitality distributions is constant at j jh vσ= . Then D reduces to eight parameters:
( ) ( )
( )
*
*
*
00
* * *
0
exp (1, )exp ( , )
1 exp ( , )
v kv kBR R R
v k v kR R R R
m e N h dvm e N v hv dvD
m e m e N v hv dv
∞∞ −−
∞ − −
−−=
− −
∫∫∫
(3.20)
The parameters in Eq. (3.20) characterize factors in the hydrosystem, lower river, estuary, and ocean that are hypothesized to affect D. The parameters k and *k set the intensities of the hydrosystem and post-hydrosystem challenge events, which presumably involve predation and dam passage in the hydrosystem and avian and piscivorous predation in the estuary and ocean. The parameter mR is the number of random challenge events ROR fish experience in the hydrosystem passage. The number of post-hydrosystem events for barge and ROR fish are *
Bm and *Rm respectively.
3.2.2 Exploring Characteristics of the Culling Model
In this section we explore the characteristics of the model to illustrate how culling can take several forms and generate a variety of post-hydrosystem survival patterns and associated patterns of D.
Five examples are explored to illustrate the properties of the model. The first three examples explore the sensitivity of D and the individual survival elements to changes in model parameters. Example I assumes that differential hydrosystem stress and culling between barged and ROR fish affects D. This example is relevant to fish condition hypotheses such as that proposed by Budy et al. (2002) that stress in ROR fish hydrosystem passage is responsible for D. Example II assumes that differential predation in the post-hydrosystem environment affects D. This example is relevant to estuary arrival time hypotheses that assume the difference in D is the result of ROR and barged fish entering the estuary at different times and predator risks. Example III assumes that the strength of hydrosystem culling of ROR fish affects D. This example is relevant to the culling hypothesis proposed in the Comparative Survival Study Workshop report (Marmorek et al. 2004), in which ROR fish are culled in the hydrosystem with resulting greater survival in the estuary and ocean. Example IV assumes seasonally varying hydrosystem and post-hydrosystem extrinsic events. This example is relevant to the arrival date hypothesis (Section 2.3.2), which assumes D is the result of differences in estuary arrival time of barged and ROR fish. In the final example, V, we illustrate how hypotheses about the effects of fish length (Section 2.3.1) and pathogen-loading hypotheses (Section 2.3.3) may interact to produce seasonal variations in D.
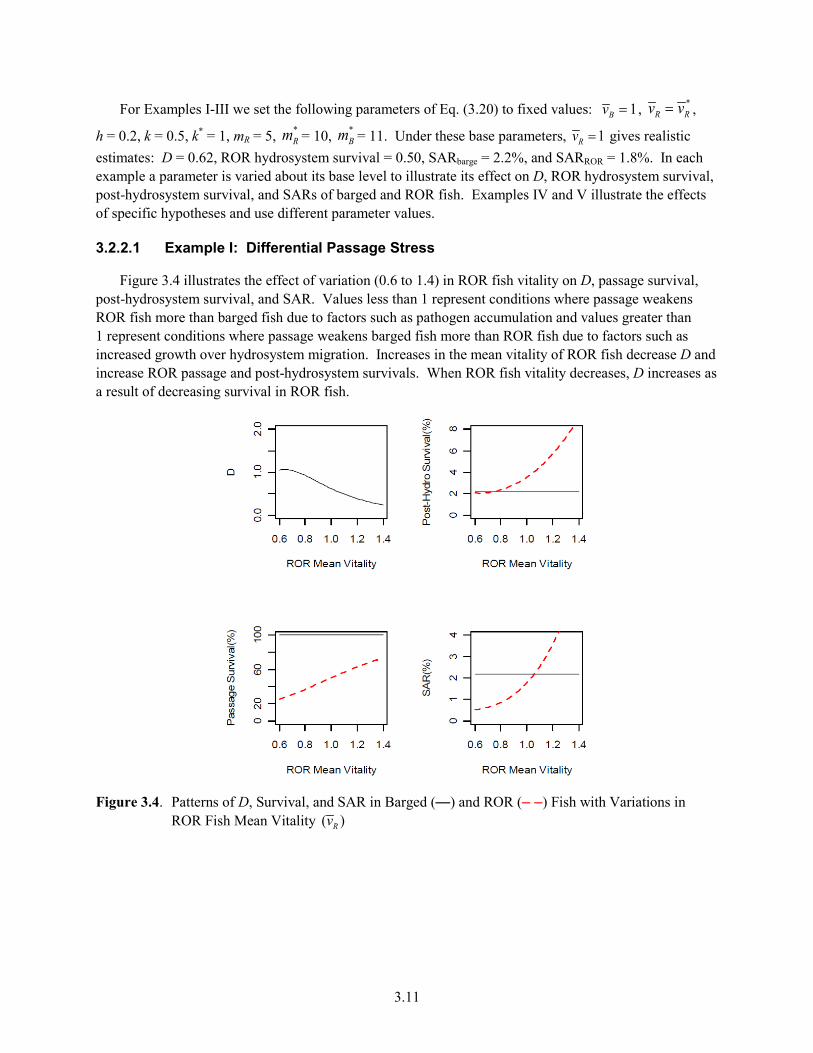
3.11
For Examples I-III we set the following parameters of Eq. (3.20) to fixed values: 1Bv = , *R Rv v= ,
h = 0.2, k = 0.5, k* = 1, mR = 5, *Rm = 10, *
Bm = 11. Under these base parameters, 1Rv = gives realistic estimates: D = 0.62, ROR hydrosystem survival = 0.50, SARbarge = 2.2%, and SARROR = 1.8%. In each example a parameter is varied about its base level to illustrate its effect on D, ROR hydrosystem survival, post-hydrosystem survival, and SARs of barged and ROR fish. Examples IV and V illustrate the effects of specific hypotheses and use different parameter values.
3.2.2.1 Example I: Differential Passage Stress
Figure 3.4 illustrates the effect of variation (0.6 to 1.4) in ROR fish vitality on D, passage survival, post-hydrosystem survival, and SAR. Values less than 1 represent conditions where passage weakens ROR fish more than barged fish due to factors such as pathogen accumulation and values greater than 1 represent conditions where passage weakens barged fish more than ROR fish due to factors such as increased growth over hydrosystem migration. Increases in the mean vitality of ROR fish decrease D and increase ROR passage and post-hydrosystem survivals. When ROR fish vitality decreases, D increases as a result of decreasing survival in ROR fish.
Figure 3.4. Patterns of D, Survival, and SAR in Barged (—) and ROR (– –) Fish with Variations in
ROR Fish Mean Vitality ( )Rv

3.12
3.2.2.2 Example II: Differential Post-Hydrosystem Conditions
The second example varies the number of post-hydrosystem events experienced by ROR fish ( *
Rm ) while holding events fixed for barged fish. The base number of barge events is 11, so lower values represent lower levels of post-hydrosystem predation challenges in ROR fish than in barged fish, while values greater than 11 represent the opposite condition. As the number of events increases, ROR fish post-hydrosystem survival rate declines and D increases (Figure 3.5). Differential numbers of predators could result from seasonal differences in estuary arrival time from the two hydrosystem passage types.
Figure 3.5. Patterns of D, Survival, and SAR in Barged (—) and ROR (– –) Fish with Variations in the
Number of Post-Hydrosystem Events Encountered by ROR Fish ( *Rm )
3.2.2.3 Example III: ROR Culling Strength
The third example involves the effect of the strength of the events within hydrosystem. From a base value of 0.5, the example varies k over the range 0.2 to 0.8 (Figure 3.6). Values of k greater than 0.5 increase culling in ROR fish with greatest effect in lower vitality fish. This example demonstrates that increases in culling strength decrease the survival of ROR fish through the hydrosystem but increases their post-hydrosystem survival. Thus, the next effect on D is relatively minor. The consequence of Example III is different from the culling hypothesis proposed by Marmorek et al. (2004), which assumed that culling of ROR fish would be offset by culling of barged fish in the estuary and ocean, which would result in no effect on total survival. This discrepancy in conclusions illustrates the importance of defining how processes act on the heterogeneity among fish.

3.13
Figure 3.6. Patterns of D, Survival, and SAR in Barged (—) and ROR (– –) Fish with Variations in the
Strength of Passage Events (k)
3.2.2.4 Example IV: Seasonal Pattern
To illustrate how the model might capture the seasonal patterns in D through the differences in arrival timing of barge and ROR fish interacting with seasonal change in the number of predators in the estuary we apply seasonal variation in *
Bm and *Rm only (Figure 3.7). The resulting effect on D and survival in the
hydrosystem, the estuary, and the ocean is illustrated in Figure 3.8 where other model parameters are * * 1R B R Bv v v v= = = = , k* = 1.2, k = 0.5, and h = 0.2. The hypothesized seasonal trends in the model
parameters fit with our qualitative assessment of the patterns in factors affecting D. The hypothesis qualitatively generates the seasonal patterns observed in survival as described in Section 4.2.3.
Figure 3.7. Hypothetical Temporal Change in Number of Estuary Challenge Events for Barged (—) and
ROR (– –) Fish
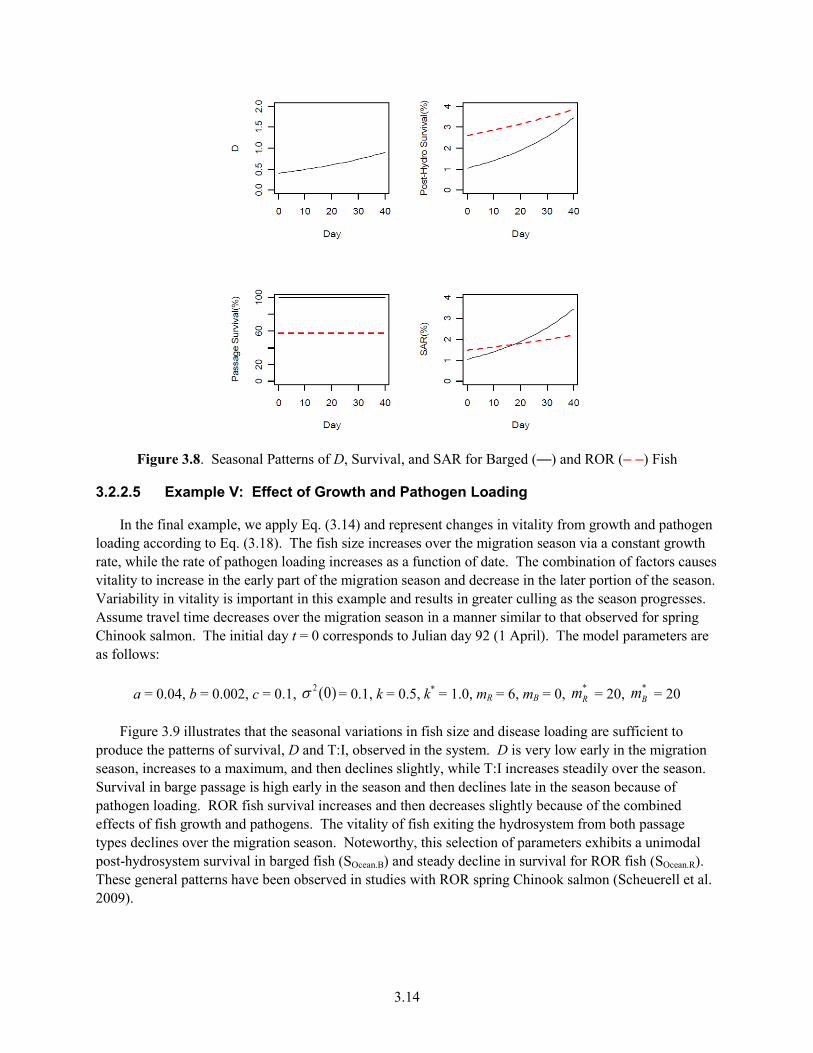
3.14
Figure 3.8. Seasonal Patterns of D, Survival, and SAR for Barged (—) and ROR (– –) Fish
3.2.2.5 Example V: Effect of Growth and Pathogen Loading
In the final example, we apply Eq. (3.14) and represent changes in vitality from growth and pathogen loading according to Eq. (3.18). The fish size increases over the migration season via a constant growth rate, while the rate of pathogen loading increases as a function of date. The combination of factors causes vitality to increase in the early part of the migration season and decrease in the later portion of the season. Variability in vitality is important in this example and results in greater culling as the season progresses. Assume travel time decreases over the migration season in a manner similar to that observed for spring Chinook salmon. The initial day t = 0 corresponds to Julian day 92 (1 April). The model parameters are as follows:
a = 0.04, b = 0.002, c = 0.1, 2 (0)σ = 0.1, k = 0.5, k* = 1.0, mR = 6, mB = 0, *Rm = 20, *
Bm = 20
Figure 3.9 illustrates that the seasonal variations in fish size and disease loading are sufficient to produce the patterns of survival, D and T:I, observed in the system. D is very low early in the migration season, increases to a maximum, and then declines slightly, while T:I increases steadily over the season. Survival in barge passage is high early in the season and then declines late in the season because of pathogen loading. ROR fish survival increases and then decreases slightly because of the combined effects of fish growth and pathogens. The vitality of fish exiting the hydrosystem from both passage types declines over the migration season. Noteworthy, this selection of parameters exhibits a unimodal post-hydrosystem survival in barged fish (SOcean.B) and steady decline in survival for ROR fish (SOcean.R). These general patterns have been observed in studies with ROR spring Chinook salmon (Scheuerell et al. 2009).

3.15
Figure 3.9. Seasonal Patterns of D, T:I, ROR Travel Time (TT), Survivals (S) of ROR (R) and Barged
(B) Fish in the River and Ocean, and Vitalities of Barged (Vital.B) and ROR (Vital.R) Fish at Hydrosystem Exit
3.2.3 Implications of Vitality and Heterogeneity
Understanding D is ultimately a problem of understanding the differential culling of fish traveling through different passage types and how the culling changes over the season. Our analysis reveals that culling depends on both intrinsic factors related directly to the seasonal distribution of vitality in the population and extrinsic factors related to the seasonal properties of the environment and in particular the

3.16
distribution of predators. Figure 3.7 and Figure 3.8 illustrate how seasonally varying intrinsic and extrinsic factors can produce a pattern of seasonally increasing D. Figure 3.9 illustrates how the seasonal pattern in D also can be produced without any change in the extrinsic factors. That is, the seasonal D can be generated with fixed distributions of predators and ocean conditions, while the intrinsic properties of barged and ROR fish change over the season. This result is somewhat surprising because it is generally thought that the differential arrival time of ROR and barged fish to the estuary is a major contributor to D being < 1; barged fish simply enter the ocean too early before the onset of spring upwelling (e.g., Hypothesis H in Figure 4.14).
The culling model illustrates that no simple explanation will suffice to explain D. In general, three factors we have stated as hypotheses in Section 2.3 interact to produce complex patterns in D across fish species and across the migration season. Two intrinsic factors have competing beneficial and detrimental effects.
• Length Hypothesis (Section 2.3.1): Growth prior to, and within, the hydrosystem increases fish size, which in turn increases fish survival capacity in the estuary and ocean.
• Conditions Hypothesis (Section 2.3.3): Accumulated stress from processes such as loss of energy density and pathogen exposure decreases survival capacity. The balance of these factors in ROR and barged fish can increase and/or decrease D over the migration season.
• Arrival Time Hypothesis (2.3.2): Extrinsic factors involving the interaction of the differential arrival timing of ROR and barged fish to the estuary and the seasonally varying conditions of predators and forage resource increase and decrease D over the migration season.
Thus, the value of a vitality-based approach to understanding D is in its ability to rigorously characterize intrinsic fish-condition factors and extrinsic environmental factors. Simply characterizing the seasonal pattern of D or SAR is important but insufficient to understand D and development management scenarios that involve the conditions of fish and the post-hydrosystem environment. Disentangling the factors that contribute to D is critical to the management of salmon stocks in the Columbia River Basin because extrinsic factors are difficult to control (e.g., removing ocean predators), while intrinsic factors involving the fish can be addressed (e.g., reducing stress, reducing disease in barging, and reduced time spent in an environment with limited resources that decreases growth).
While the model itself provides a framework within which to consider the complexities of D, unraveling the contributions requires new approaches to measuring fish and in particular the intrinsic factors of delayed mortality. Here vitality offers a way forward because it provides a framework within which challenge experiments can be conducted to quantify the differential changes in the seasonal pattern of vitality (see Anderson et al. 2008; Li and Anderson 2009; Gosselin 2011). The idea of a challenge experiment is that a relative measure of population vitality can be estimated from the shape of the mortality curve of fish exposed to a standardized stressor. Documenting the seasonal changes in survival curves of ROR and barged fish at LGR and BON should provide a clear picture of the seasonal patterns in the differential survival capacity of fish as they enter and leave the hydrosystem. This information is sufficient to infer the seasonal patterns of vitality as illustrated in Figure 3.9.

4.1
4.0 Potential Factors of D
D is manifested through a complex combination of fish condition and its interaction with environmental conditions as described previously in Sections 3.1 and 3.2. This section provides a detailed evaluation of single factors and their interactions. For each single factor, we organized it into a framework, synthesized the associated literature, prioritized it relative to the other factors considered, and then proposed future research (Section 4.2). Then, we summarize the interactions between the single factors (Section 4.3), the within-year and across-year patterns (Section 4.4), and the organization and prioritization of factors by their degree of importance and extent of uncertainty (Section 4.5).
4.1 Organizing and Prioritizing Factors
Our goal is to address each potential factor of D to understand what is already known and what needs to be known to support future management actions. The following sections describe the framework of how factors were organized, as well as how they were prioritized to identify research needs that support management of the Juvenile Fish Transportation Program to help improve adult salmon returns.
4.1.1 The Framework of Factors of D
Several factors potentially influence the delayed mortality of barged or ROR migrants:
pre-hydrosystem conditions
arrival time and travel time
fish length
fish physiology
fish disease
dam operations
barging conditions
Lower Columbia River (BON to rkm 56) conditions and predators
estuarine (downstream of rkm 56) conditions and predators
oceanic conditions
straying
survival estimation & tagging effects.
These factors are numbered in the order in which fish encounter them over their life histories, as shown in Figure 4.1. Open circled numbers designate factors that have an environmental source and closed circles designate factors related to the state of the fish. This framework facilitates discussion of the potential influences on D.

4.2
Figure 4.1. Conceptual Model of Locations of the Principal Factors Affecting the Differential Delayed
Mortality Between Barged and ROR Fish. LGR represents Lower Granite Dam and BON represents Bonneville Dam. Factor numbering is described in the text of the report. The icon of “Other dams” represents Little Goose Dam, Lower Monumental Dam, Ice Harbor Dam, McNary Dam, John Day Dam, and The Dalles Dam.
4.1.2 Categorizing Factors by Importance and Uncertainty
Much research has been conducted that directly or indirectly evaluates fish transportation and potential factors of D. That existing information helps us assess the degree of importance and the extent of uncertainty for each factor to identify where new or better information is needed to support management actions. The categorization scheme is as follows:
• Degree of importance to D:
– A factor with high importance to D has a relatively strong effect on D and provides a mechanistic theory.
– A factor with moderate importance to D shows some level of effect on the relative post-hydrosystem survival of barged and ROR migrants, but may be overwhelmed by other processes and therefore less obviously correlated with SARs or D.
– A factor with low importance to D has a minimal effect on relative post-hydrosystem survival of barged and ROR migrants.
• Level of uncertainty in the data and conclusions:
– A factor with limited data gaps and uncertainty shows a consistent and statistically significant pattern for barged fish and ROR migrants across years and research studies.
– A factor with extensive data gaps and uncertainty has yet to be studied or shows inconsistent or contradictory patterns of data across years and research studies.
4.1.3 Priorities for Future Research and Management
Areas of research that should receive high priority involve factors with a high degree of importance to D and also extensive data gaps and uncertainty (Table 4.1). Factors where the most improvement in management decisions is possible are those with a high degree of importance to D but limited data gaps and uncertainty. Other combinations of degree of importance and uncertainty, and their associated level of priority to research and management, are described in Table 4.1. This prioritization scheme is intended to focus research efforts on areas where the greatest benefits may be realized.
Estuary
LGR pool
Pre-hydrosystem environment
Oce
an
Barge
In-river
Lower river
LGR
BO
N
Oth
er d
ams
Dam operations

4.3
Table 4.1. Prioritizing Factors by Their Degree of Importance in Relation to D and Extent of Data Gaps and Uncertainty
Extent of Data Gaps and Uncertainty Limited Extensive
Deg
ree
of im
porta
nce
to D
High High implication for management
Low priority for research
Moderate implication for management
High priority for research
Moderate Moderate implication for management
Low priority for research
Moderate implication for management
Moderate priority for research
Low Very low implication for management
Very low priority for research
Low implication for management
Low priority for research
4.2 Evaluation of Factors of D
This section presents each potential factor of D in the order that fish encounter it and provides a description of the hypothesized mode of action. Factors are further categorized by their potential importance to management and the level of uncertainty that currently exists for that factor. Potential actions to support better management of each factor are suggested.
4.2.1 Pre-Hydrosystem Effects
Hypothesis – Conditions in tributaries and at the hatcheries affect the size, condition, and arrival timing of salmonids at the hydrosystem, and thus indirectly affect D. (See Figure 4.2.)
Figure 4.2. Conceptual Model of How Pre-Hydrosystem Conditions Can Influence Arrival Time and
Travel Time, Fish Length, and Fish Physiology
4.2.1.1 Spring/Summer Chinook Salmon
Many aspects of the pre-hydrosystem conditions can affect D. These include effects from fish length, population densities, water temperature, travel time to and arrival time at the hydrosystem, amount of food resources, and sources of origin. In tributaries upstream of the hydrosystem, summer temperature, population density of conspecifics, and the interaction between these two factors can affect the length of wild Chinook salmon (Crozier et al. 2010). At the lowest density, length increases with temperature, but
Pre-hydrosystem environment

4.4
at the highest density, length decreases with temperature. Significant differences in growth can also occur among sites and years (Achord et al. 2007). The consideration of growth and length is important, because larger-sized smolts generally return at higher rates (Zabel and Williams 2002). The travel time from different natal streams to LGR was on average 38 days for wild spring/summer Chinook salmon tagged from 1991 to 2003 (Achord et al. 2007). The timing of migration can be quite variable with the 10th and 90th percentiles occurring at 20 and 45 days, respectively. Environmental conditions that relate to the passage date of wild spring/summer Chinook salmon include autumn temperature, spring temperature, March river flow, and the elevation of the tagging site (Achord et al. 2007). Early-arriving smolts generally show higher SARs than late-arriving ones (Zabel and Williams 2002). There is an inherent tradeoff between earlier migration timing and fish size (i.e., growth and development), both having positive effects on survival (Zabel and Williams 2002). Furthermore, food resources may be limited prior to reaching the hydrosystem. About one-third (25%–38%) of hatchery yearling Chinook salmon passing LGR from 1987 to 1991 had empty stomachs, which lead Muir and Coley (1996) to conclude that large numbers of hatchery smolts and long residence times could cause high mortality rates. In contrast, they also found that fewer fish had empty stomachs at McNary Dam (MCN; 3%) and BON (5%) in 1991. The most recent example of how pre-hydrosystem conditions can affect survival during and after FCRPS passage was detected in a disease challenge study (Dietrich et al. 2011). Hatchery stock differences occurred in the survival of barged spring Chinook salmon from the time they were collected at BON to the conclusion of the challenge experiment with Listonella anguillarum. The authors concluded that the history of the smolts prior to entering the FCRPS can affect their health status and survival, particularly in barged fish. Only when fish are healthy does barging potentially provide a beneficial mitigation strategy by offsetting adverse health effects associated with ROR passage through the hydropower system. Other studies have determined hatchery stock differences in fish condition and SARs (Congleton et al. 2005; Mesa et al. 2008; Tuomikoski et al. 2010), but whether these differences stem from genetic effects, environmental influences, and their interactions (including phenotypic effects) is still unclear.
4.2.1.2 Fall Chinook Salmon
Pre-hydrosystem water conditions influence subyearling fall Chinook salmon migration timing. From the free-flowing river to the first dam, flow increased the rate of outmigration, while temperature had the opposite effect (Connor et al. 2003). Similarly, Smith et al. (2003) observed that survival was significantly correlated with discharge (i.e., flow), water temperature, and water transparency. They also determined that survival decreased throughout the season. Although these two studies concluded that flow affected migration rate and survival rate, Tiffan et al. (2009) determined that migration rate was correlated with water velocity but not with flow. Subyearlings were observed to decrease their migratory rate when swimming from the high-velocity and highly turbulent riverine reaches to the low-velocity and low-turbulence reservoir reaches.
4.2.1.3 Steelhead
Little information was found about the pre-hydrosystem condition of juvenile steelhead prior to entering the hydrosystem. However, a study of external condition of juvenile steelhead tagged at Rock Island found 11% in poor condition compared to 68.5% in good condition. Preliminary analysis of these data suggested steelhead in poor condition were more susceptible to avian predation (Roby et al. 2011a).
4.5
4.2.1.4 Importance to D and Level of Uncertainty
Medium importance to D and extensive data gaps and uncertainty
The general factor of pre-hydrosystem conditions was categorized as having moderate importance to D because its associated factors include temperature, population density, growth, water flow, velocity, and turbulence (Crozier and Zabel 2006; Crozier et al. 2010; Smith et al. 2003; Sykes et al. 2009; Tiffan et al. 2009), which in turn affect fish length, fish condition, disease, hydrosystem arrival time, and travel time (Table 4.3). Research in the tributaries is currently focused on parr-to-smolt survival affected by factors such as non-indigenous species, population density, and habitat degradation (Achord et al. 2003; Achord et al. 2007; Crozier and Zabel 2006; Crozier et al. 2010; Greene and Beechie 2004; Holecek et al. 2009). SARs of fish from different hatcheries also vary. Overall, pre-hydrosystem conditions likely have some indirect effects on D, but the specific relationships need to be further resolved. There are thus extensive data gaps and uncertainty.
4.2.1.5 Future Research Needs
Determining the conditions of the fish at the time of entry into the FCRPS and the causes of their condition is the main research need related to pre-hydrosystem conditions. However, first establishing which fish conditions are associated with SARs and D would help determine which pre-hydrosystem conditions to effectively study. These fish conditions are further described as factors of hydrosystem arrival time and travel time, fish length, physiology, and disease below. Note that determining these factors for wild fish may be difficult but in hatcheries many of these factors are readily controllable and measurable.
4.2.2 Hydrosystem Arrival Time and Travel Time
Hypothesis – Fish arrival timing to the hydrosystem and travel time through the system affect their arrival timing to the lower river, estuary, and ocean, and thus influence the environmental conditions and predation risk they experience post-hydrosystem. (See Figure 4.3.)
The downriver migratory run timing of fish varies; yearling spring/summer Chinook salmon generally run from mid-April to mid-June, steelhead from mid-April to late-June, and subyearling fall Chinook salmon from early June to mid-August. Clemens et al. (2009) concluded that a pattern of high-to-low survival rate through the lower Columbia River to the ocean occurred across the runs, i.e., spring/summer Chinook salmon, steelhead, and fall Chinook salmon, and followed the seasonal pattern of outmigration timing and declining river flows.

4.6
Figure 4.3. Factors Involved with Timing of Fish (Top) Into and Out of the Hydrosystem and Examples
of the Passage Distributions of Snake River Basin Barged and ROR Spring/Summer Chinook Salmon, Steelhead, and Fall Chinook Salmon at BON (Bottom)
4.2.2.1 Spring/Summer Chinook Salmon
Hydrosystem passage by ROR migrants generally takes 2 to 4 weeks with travel time being slowest early in the season and decreasing throughout the migration season (Muir et al. 2006; Tuomikoski et al. 2010; Muir and Williams in press). The travel time of ROR migrants is positively related to fish size (Congleton et al. 2005) and water travel time (Tuomikoski et al. 2010). Scheuerell et al. (2009) determined that post-hydrosystem survival for wild yearling Chinook and juvenile steelhead, migrating in mid-May was 4 to 50 times higher than those migrating in mid-June. Thus, the authors suggested that increasing the downstream migration rate would help them to arrive at the estuary earlier and increase their SARs. Models with year, day, and day2 as parameters performed better at predicting SARs than models with temperature and upwelling. But there was still a residual effect of temperature after controlling for day, particularly in Chinook salmon. There is also likely a time lag effect of upwelling, but matching these daily indices with survival over the short time scale of outmigration period was beyond the scope of the study. The authors discuss other possible environmental and endogenous factors that vary seasonally and that may affect SARs. These include photoperiod, food supply, growth, hormone concentrations, and population densities of predators, hatchery fish, and other forage fish species.
In contrast to ROR migration, barges transport fish through the FCRPS in approximately 36 hours (Muir et al. 2006). Early ROR migrants have higher survival rates than late ROR fish, but barged fish in the early season have low SARs from and back to the point of release relative to barged fish late in the season (Zabel and Williams 2002; Anderson et al. 2005). Thus, since 2007, barging has been delayed to early May for spring/summer Chinook salmon and steelhead migration.

4.7
The hydrosystem arrival time and travel time affect the seasonal timing of when barged and ROR fish arrive downstream of the hydrosystem, and as a consequence the environmental and ecological conditions they experience in the LRE and ocean. The seasonal pattern is relatively consistent across years: D begins below 1 early in the season, then increases throughout the season, and sometimes rapidly decreases to below 1 at the end of the migration season (June) for spring/summer Chinook salmon and steelhead (Anderson et al. 2005; NOAA 2010). In some years, no seasonal change is revealed in multivariate models. The specific interactions that cause the seasonal patterns of D are still unclear. Factors linked to migration timing such as fish condition, upwelling, avian predation, piscivorous fish predation, and alternative prey are discussed in sections below.
4.2.2.2 Fall Chinook Salmon
Travel time is negatively related to the length of fall Chinook salmon (Connor et al. 2004). Length particularly varies across the two juvenile life histories: subyearlings or ocean-type fall Chinook salmon that migrate to the sea within their first year, and yearling or stream-type fall Chinook salmon that residualize in the reservoirs and continue their migration the next spring (Connor et al. 2002, 2005, 2007). With few wild fall Chinook salmon (≤ 2%) exhibiting the stream-type life history (Connor et al. 2002), the greatest differences in length exist among the hatchery ones. Travel rates of yearling fall Chinook salmon are the fastest, while those for small-sized subyearlings are the slowest.
4.2.2.3 Steelhead
The travel time of ROR steelhead is highly correlated with water travel time throughout the season (Williams et al. 2005; Tuomikoski et al. 2010). The day of the year was also correlated with travel time, but to a lesser degree than flow. For a certain range of water velocities, travel rates were lower near dams than through reservoirs (Plumb et al. 2006). Estuary conditions also interact with travel time to affect D. These factors are discussed in Section 4.2.8.
4.2.2.4 Importance to D and Level of Uncertainty
High importance to D and limited data gaps and uncertainty
The relatively consistent seasonal patterns of D suggest the factor of arrival time and travel time to be of high importance to D and have limited data gaps and uncertainty relative to all the other factors considered in this synthesis report (Table 4.3). Data gaps and uncertainty remain about the underlying mechanisms altering arrival timing and travel times to generate those seasonal patterns. Those underlying mechanisms are considered as separate factors below. Also, seasonal estimates of fall Chinook D are not likely possible given that annual estimates have large amounts of uncertainty (Williams et al. 2005; Marsh et al. 2010a). This is a general issue with estimating D for fall Chinook salmon (see Section 2.2.1).
4.2.2.5 Future Research Needs
A relatively high degree of importance and a low level of uncertainty make this factor of high priority for management but of low priority for research.

4.8
4.2.3 Fish Length
Hypothesis – Large-sized fish have higher SARs, therefore factors that affect length differentially on transport and ROR fish will affect D. Combining seasonal changes in fish size and survival rates suggests a potentially important mechanism for the seasonal changes in D. (See Figure 4.4.)
Figure 4.4. Length of Wild Fish Spring/Summer Chinook Passing Bonneville Dam for ROR and Barged Fish from Muir et al. (2006). Superimposed are some observed examples of estuary arrival timing patterns of fish from ROR (- - -) and barge passage types ().
4.2.3.1 Spring/Summer Chinook Salmon
SARs of spring/summer Chinook salmon were related to the length of hatchery, wild, ROR and barged individuals released in 1995 and 1996 (Zabel and Williams 2002). Furthermore, relative length and not mean length or relative condition index was related to survival in a 5-year study across 15 wild stocks from their release at Idaho tributaries to LGR (Zabel and Achord 2004). Predictions showed a nearly 60% increase in the length-related selection of fish through to adulthood (Zabel and Achord 2004). Possible length-related mechanisms of mortality exist when ecological behaviors are considered. For example, larger fish have an advantage in competition for territories, food resources, and shelter from predators. In a later study, positive relationships between survival and length were again found, but negative relationships were also observed, depending on the release group/river segment combination observed (Zabel et al. 2005). Thus, it appears that other length-related mechanisms may affect adult return survival.
Smaller-sized hatchery Chinook salmon consistently had a greater probability of recapture and of bypass than larger fish (Zabel et al. 2005). Another field-based study also found some evidence that supports the hypothesis that smaller-sized Chinook salmon have a higher probability of being entrained into the bypass system (Congleton et al. 2005). However, a recent study by Buchanan et al. (2011) did
L
LB
LR
LR + ∆L
LB
Barge
ROR
Estuary arrival day100 110 120 130 140 150 160
100
105
110
115
Sm
olt l
engt
h (m
m)

4.9
not find evidence of consistent size-selective collection in bypass systems. Also, this relationship was not found in wild Chinook salmon (Zabel et al. 2005; Congleton et al. 2005).
Seasonal variations in fish length occur. Spring/summer Chinook salmon arrival length at LGR increased over the season, but ROR migrants at BON increased much less across the season (Figure 4.4). The ROR fish grew over the migration season (Muir et al. 2006), while barged fish arrived downstream at essentially the same size as that at capture upstream. Size-selective predation was demonstrated in a model with regression equations of selectivity among barged and in-river migrating Chinook salmon (Muir et al. 2006). However, recent measurements of fish size at LGR and BON have not shown significant growth in ROR migrants (B. Muir, NOAA, personal communication). Also, a field survey failed to find supporting evidence for size-selective predation among N. pikeminnow downstream of BON (Mesa et al. 2008).
Recent research on hatchery and wild yearling Chinook salmon PIT-tagged at Lower Granite Dam from 1998 to 2011 show a step-like function between SARs (LGR to BON) and fish lengths at LGR (Gregor Passolt, Univ. of Washington, MS Thesis in progress). Differences occurred between hatchery and wild yearling Chinook salmon, as well as between the barged and ROR counterparts. For each rearing type and passage type, few juveniles below their respective critical size threshold returned as adults, while those above their respective thresholds dominated in the returning adult populations.
4.2.3.2 Fall Chinook Salmon
The length of subyearling and yearling fall Chinook salmon is associated with their travel times and survival rates. Among three groups of different sized subyearlings and one group of yearlings, the yearlings travelled through the hydrosystem the fastest (Connor et al. 2004). They had the highest survival rates likely due to their large body sizes and short travel times during cool temperatures. The smallest of the three size groups of subyearlings travelled the slowest. Their survival rate was low because they lingered to feed, were susceptible to predators, and were exposed to low flows and high temperatures. Fish scale pattern analysis confirmed that yearlings generally exhibit higher survival rates than subyearlings (Connor et al. 2005).
4.2.3.3 Steelhead
Smaller-sized hatchery steelhead consistently had a greater probability of recapture and of bypass than larger fish (Zabel et al. 2005). Furthermore, it appears that medium-sized steelhead (190–250 mm) have greater Caspian tern predation risk than small (< 169 mm) and large (> 270 mm) as observed on Crescent Island in the McNary reservoir (Roby et al. 2008, 2011b). This relationship was not observed on Foundation Island.
4.2.3.4 Importance to D and Level of Uncertainty
High importance to D and extensive data gaps and uncertainty
The relatively strong relationships between fish size and survival make this factor of high importance to D (Table 4.3). This factor is also considered to have extensive uncertainty because how much, where and how size-selective mortality occurs is still unclear. Also, there are inconsistent patterns of size effects in relation to bypass routes in spring/summer Chinook salmon and the avian selectivity of moderately sized steelhead.
4.10
4.2.3.5 Future Research Needs
A high degree of importance and extensive uncertainty make this factor have high implications for management and high priority for research. For a summarized version of future research needs and approaches, please see Table 5.1.
As more research on critical sizes, growth, and marine survival of salmonid species are conducted (Moss et al. 2005, Farley et al. 2007a, b, c, Cross et al. 2009, Clairborne et al. 2011, Duffy and Beauchamp 2011), a better understanding of fish size and growth in relation to marine survival arises. The use of research on other salmon stocks will help us better understand the length-related processes affecting SARs of salmon stocks that pass through the FCRPS. Here, we first summarize literature related to critical sizes and marine survival, and then consider more specific research questions related to the salmon stocks that migrate through the FCRPS by barge or ROR passage type.
Size-selective mortality at ocean entrance (which includes the following few weeks to couple of months) can contribute to the heavy mortality that occurs in juvenile salmon following ocean entrance (Parker 1968, Pearcy 1992). Estimates of mortality in the first few weeks after ocean entrance have been estimated as 55% to 80% for pink salmon for Prince William Sound hatchery stocks (Parker 1968), 53% to 94% for Russian stocks (Karpenko 1998), and 75% in a more recent study for Prince William Sound stocks (Willette et al. 2001) (from Moss et al. 2005). Clairborne et al. (2011) is one of the few studies that determined that size at ocean entry can relate to marine survival in some outmigration years (2002 to 2004) and but not others (2005). By estimating fish lengths from circulus spacing on fish scales, the authors determined that Willamette River yearling Chinook salmon with fork lengths (FL) less than 150 mm at ocean entry were underrepresented in the number of returning adults. Also, Mahnken et al. (1982) conducted a field-based experimental study and found freshwater critical size effects on early marine survival in Columbia River hatchery Coho salmon. It is important to note that, as Claiborne et al. (2011) pointed out, although fish smaller than a critical size threshold are underrepresented in the returning adult population, the SARs can still vary by ten times between years because of other factors affecting marine survival. Thus, size-selective mortality can occur, but this does not necessitate a direct linear relationship between fish length and absolute values of SARs.
In addition to a critical size at ocean entrance, a second critical size after the critical period of early marine growth has been hypothesized (“critical size, critical period” hypothesis; Beamish and Mahnken 2001). The growth of salmonids during the late spring and summer in the marine environment can affect their survival in the fall and winter of their first ocean year. Recent studies examining this critical period have determined that larger and faster-growing salmonids, such as Atlantic salmon, Coho salmon, pink salmon, sockeye salmon, and Chinook salmon, experience greater first year marine survival than small and slower-growing ones (Holtby et al. 1990, Friedland et al. 2000, Beamish et al. 2004, Moss et al. 2005, Farley et al. 2007a, b, c, Cross et al. 2009, Duffy and Beauchamp 2011). In contrast to the first critical size hypothesis, this one is primarily based on the physiological effects of growth. An accumulation of energy stores such as lipids would help the juveniles survive the winter when starvation occurs (Farley et al. 2007a). Also, Farley et al. (2007c) found that size-selective mortality did not occur after their first year in the ocean. Examining whether and when these bottlenecks of survival occur help determine whether freshwater growth is needed to deter size-selective predation in the early marine environment, and whether appropriate release and arrival timings are needed for fish to experience suitable ocean conditions and improved early marine growth for overwinter survival. The two critical size hypotheses may be related in that small fish at time of ocean entry cannot compensate for their size during the critical

4.11
period (Farley et al. 2007a); as well, large fish at the time of ocean entry are better foragers than small fish. Growth-associated hormones such as insulin-like growth factor-1 (IGF-1) have been related to SARs (Beckman et al. 1999; Beamish and Mahnken 2001). Again, other factors such as ocean conditions can affect the direct relationship between size and absolute values of marine survival (Holtby et al. 1990). Three long-term research studies investigating the physical, biological and ecological mechanisms that affect early marine survival are currently in progress and results thus far are summarized in Jacobson et al. (2011).
In the context of salmon stocks travelling through the FCRPS, we suggest that the size and growth opportunity of these fishes can be controlled to some degree by the size and timing of release from hatcheries, the type of river passage (i.e., barge or ROR) and consequently the time of ocean entrance. Size at ocean entrance (Clairborne et al. 2011) and growth during the spring, and perhaps most importantly in the summer (Farley et al. 2007a, Duffy and Beauchamp 2011), both affect first year survival. Because the effects of critical sizes on marine survival have been determined across multiple species of salmonids, additional research on size-related survival differences between barged and ROR fish is warranted. Field surveys in the estuarine, plume, and coastal ocean environments would help establish whether or not size-selective predation and energetic depletion occur in these environments, but can be logistically challenging. A possible approach in testing the critical size hypothesis is conducting a data analysis of the lengths at BON or in the LRE and SARs of PIT-tagged fish. This could involve determining whether critical threshold lengths are associated with different species, runs, and rearing types of salmon throughout the season. An adventitious analysis of data already collected is expected to take only a few years. Back-calculation from scales and otoliths of barged and ROR fish and their length-related SARs is another approach. If a critical size above which higher probability of survival exists, structures and procedures could be refined to favor the collection of larger-sized fish for transportation. This would help increase D, improve the effectiveness of the transportation program, and ultimately increase SARs.
Another, more specific, research question arose during the 2011 Differential Delayed Mortality Workshop (see Appendixes D, E, and F): Is low D (i.e., D < 1) expressed only in small-sized fish and not in large-sized fish? In large fish, survival may be relatively high for both barged and ROR fish, thus causing D to equal approximately 1. Research presented at the workshop by Dr. David Welch suggests that this size may be around 130 mm in fish length for hatchery spring/summer Chinook salmon. Testing for a critical size would clarify the relationship between fish length and D, particularly if there is a biased probability of entrainment of small fish into the bypass system and collection for barge transportation. This leads to a second testable question: Is there a collection bias for smaller fish in the juvenile bypass system? Several studies have investigated this question from adventitious data, but a controlled experimental study may help reduce uncertainties. To address this second question related to size-selective collection in the bypass system, one could PIT-tag fish over a range of lengths and release them upstream of a dam. The relationship between fish characteristics and the probability of entrainment into the bypass system could be determined. Taking advantage of upcoming studies that involve acoustic transmitter (AT)-tagged fish is also possible. One challenge is to ensure that the tagged fish are representative of the whole stock being evaluated. A study of this second research question can take several years. If a size-related collection bias exists in the bypass system, a mechanism underlying the procedures of the transportation program that contribute to low D is revealed. Also, corrections in the estimates of D and/or improvements in structures and operations could be implemented.

4.12
4.2.4 Fish Physiology
Hypothesis 1 – Low levels of smoltification in barged fish increase their travel time in the LRE, and consequently their predation risk in the LRE.
Hypothesis 2 – The viability of ROR migrants is reduced due to the depletion of energetic reserves during downstream migration through the hydrosystem. In contrast, barged fish have a negligible loss of energetic reserves during their short travel time through the hydrosystem.
Hypothesis 3 – Fish barged at high densities experience greater stress than ROR fish and consequently reduced survival. This may be particularly important to Chinook salmon barged with steelhead.
See related passage types and conceptual models in Figure 4.5.
Figure 4.5. Factors Involved With Physiological Effects on D (Top). Conceptual Models of Fish Level
of Smoltification (Left) and Energetic Reserves as a Function of BON Arrival Day and Travel Time for ROR and Barged Fish (Right)
4.2.4.1 Smoltification (Hypothesis -1)
Spring/Summer Chinook Salmon
In a controlled laboratory experiment, Price and Schreck (2003) determined that stress decreases saltwater preference in fully smolted Chinook salmon. After a low level of stress (2-minute chase with dipnet), 69% of Chinook smolts and 95% of control fish preferred saltwater. After a high level of stress (dipnetted and confined in 21-L bucket for 15 minutes), 20% of Chinook smolts and 100% of control fish preferred saltwater. When chased by an avian model, Chinook smolts moved from freshwater to saltwater, and after 1 hour, 26% of them remained in saltwater. Thus, stressed fish, and especially those that have not fully smolted by the time they reach the LRE, likely have a strong preference for the freshwater near the water surface and become more susceptible to avian predation. This behavior was hypothesized by Schreck et al. (2006).
Day at BON
Trav
el ti
me
from
LG
R
Fully smolted
Barely smolted
Moderately smolted
Day at BON
Ener
getic
rese
rves
Barged fish
ROR migrants
Surface plot for Hypothesis 1: Graph for Hypothesis 2:

4.13
Hatchery spring/summer Chinook salmon have shown low gill Na+/K+–adenosine triphosphatase (ATPase) activity, an indicator of smoltification, in late April, but high gill Na+/K+–ATPase activity after early May (Congleton et al. 2000). Wild spring/summer Chinook salmon had high gill Na+/ K+–ATPase activity throughout the season. In 2008, hatchery spring/summer Chinook salmon collected in mid-May showed the highest levels of gill Na+/K+–ATPase among ROR migrants at JDA and BON, followed by ROR fish at MCN, barged fish at LGR prior to transportation, and fish collected at hatcheries (Eder et al. 2009b). As the season progressed, the ATPase activity of barged fish increased, particularly in mid-May. The ATPase activity of ROR fish also increased throughout the season (May), but dropped at the very end of the season (early June). In a different study conducted from mid-April to late-May of 2006, Na+/K+–ATPase activity was approximately 3–4 μmol P h-1 mg protein-1 at the hatcheries, and approximately 5–10 μmol P h-1 mg protein-1 in barged and ROR fish (Mesa et al. 2008). Thus, seasonal patterns of ATPase activity and the differences between barged and ROR fish can be less pronounced in some years than in others. If the level of smoltification influences where fish occur in the water column and consequently their exposure to predators, the seasonal changes in smoltification and differential between barged and ROR fish can contribute to the seasonal increase in D and seasonal averages of D of less than 1.
Fall Chinook Salmon
The percentage of fish selecting saltwater was not significantly different between barged and ROR fish in saltwater preference tests (Schreck et al. 2005). This study suggests that the level of smoltification is likely not an influencing factor of D in fall Chinook salmon. However, Yanke (2006) observed that gill Na+, K+–ATPase activity was highest at 16°C, followed by 20°C, and then 24°C. Thus, there may be temperature-related (seasonal) effects on smoltification.
Steelhead
The levels of gill Na+/K+–ATPase activity were low among barged steelhead in early May, but increased significantly by mid-May, while ROR steelhead had high levels of this indicator of osmoregulatory ability throughout the season (Schreck et al. 2005). However, barged and ROR steelhead both did not avoid saltwater during preference experiments, and they had similar osmoregulatory ability during the first 2 weeks of saltwater entry.
Gill Na+/K+–ATPase activity in hatchery and wild steelhead was low in early May, but remained high in mid-May and thereafter (Congleton et al. 2000). Hatchery steelhead sometimes had lower gill Na+/K+–ATPase activity than wild fish only early in the season (1995) and in other years throughout the season (1994 and 1996).
4.2.4.2 Depletion of Energetic Reserves (Hypothesis -2)
Spring/Summer Chinook Salmon
Lipid reserves of ROR hatchery spring/summer Chinook salmon significantly decreased throughout the season as they migrated through the hydropower system (Congleton et al. 2005). Lipid reserves of ROR fish at BON reached a low threshold. Barged fish had a negligible loss of energetic reserves. At LGR, hatchery fish had more than twice the amount of lipid reserves than wild fish, but at BON the lipid reserves of hatchery fish decreased to the levels of wild fish. After lipid depletion, protein reserves also decreased throughout the season. Growth did not compensate for loss of lipids and protein which
4.14
indicates that energy expenditure is exceeding energy intake. Times to fatigue during sprint swimming tests were generally greater for fish collected at LGR (higher lipid concentrations) than at BON (lower lipid concentrations) (Fryer 2008).
Steelhead
No estimates of energetic reserves for barged and ROR steelhead have been determined.
Fall Chinook Salmon and Steelhead
Reduced growth, plasma protein levels, plasma cholesterol, and plasma alkaline phosphatase (associated with lower food consumption or conversion rates) occurred in subyearling hatchery fall Chinook salmon after a few to several weeks in treatment conditions at 24°C compared to those at 16°C and 20°C (Yanke 2006). At high water temperatures, the subyearling fall Chinook salmon likely mobilized energetic reserves in response to sublethal thermal stress and could not replenish the reserves. Increased permeability of tissues and increased heat shock (stress) proteins were also observed and could contribute to the stress experienced by the fish. However, increased plasma cortisol was only detected at 28°C (compared to the 16°C, 20°C and 24°C treatments) after two weeks, and preceded complete mortality of these fish. Survival to 42 days was not affected in treatment groups at 24°C. Other studies have found decreased survival in subyearling fall Chinook salmon to the tailrace of Lower Granite Dam as temperatures increased from 15°C to 22°C (Connor et al. 2003, Smith et al. 2003). Subyearling fall Chinook have been hypothesized to use thermal refuge provided by summer flow augmentation in order to continue to grow (Connor et al. 2005). Local temperatures experienced by juvenile, radio-tagged fall Chinook salmon have been observed between 18°C and 22°C in the Little Goose reservoir during the summer (Tiffan et al. 2003). Thus, differences in water temperatures experienced by barged and ROR juvenile fall Chinook salmon and consequently their growth, physiological condition, and survival are possible. However, whether and how these differences affect their post-BON survival are still unclear. Differences in temperatures experienced between barged and ROR fall Chinook would first need to be ascertained.
4.2.4.3 Stress from Fish Barging Densities (Hypothesis -3)
Spring/Summer Chinook Salmon
Stress increased in barged Chinook salmon early to mid-May when loading densities were the highest throughout the season, as indicated by increased plasma cortisol and glucose concentrations and decreased plasma chloride concentrations (Congleton et al. 2000). The stress indices were at lower concentrations in the early and late season. Cortisol concentrations were higher in the wild fish than the hatchery fish. Furthermore, cortisol concentrations were relatively low in Chinook salmon during transport from LGR to BON early and late in the season, but not mid-season when steelhead densities were highest. Similarly, in later studies, higher levels of cortisol were detected in wild Chinook barged with steelhead at high densities than at medium or low densities (Congleton et al. 2001, 2003). Generally, a minimal stress response is elicited in barged wild Chinook at steelhead densities < 35 g/L (Congleton et al. 2005). Kelsey et al. (2002) observed spring/summer Chinook salmon to have higher concentrations of cortisol, move less, dart less, and be attacked 16 times more often when held with steelhead than without. However, positive correlations were determined between cortisol levels and SARs. Wagner et al. (2004), using SARs and barge-loading data for groups of Chinook salmon transported in 1995, 1998, and 1999,

4.15
failed to confirm a relationship between Chinook salmon survival and steelhead density. Thus, cortisol levels may be an indicator of acute stress, but do not necessarily indicate a stress response that is associated with survival because it is overwhelmed by other processes. Furthermore, increased concentrations of plasma cortisol may be due to the barge experience or smoltification (Congleton et al. 2003). However, a recent study with laboratory holding experiments has shown higher rates of post-hydrosystem mortality among Chinook salmon barged with steelhead than without (Sandford et al. 2012).
Furthermore, in wild Chinook salmon, increases in oxidative stress (lipid peroxidation) and decreases in the antioxidant vitamin E were observed throughout the season (Welker and Congleton 2009). These conditions may be related to seasonal temperature increases or smoltification. They were unrelated to patterns of plasma cortisol and glucose.
Fall Chinook Salmon
The effects of loading densities on post-hydrosystem survival in Fall Chinook have yet to be studied.
Steelhead
Steelhead are generally not as stressed as spring/summer Chinook salmon during barge transportation as indicated by cortisol concentrations observed in 1994 and 1995 (Congleton et al. 2000). Cortisol concentrations of steelhead were not correlated with their loading densities. Also, cortisol concentrations were lower in wild steelhead than hatchery steelhead.
4.2.4.4 Importance to D and Level of Uncertainty
Moderate importance to D with extensive data gaps and uncertainty
Although physiological measurements, such as plasma cortisol, Na+/K+-ATPase, and lipid reserves, are relatively easy to collect and useful for exploratory research, much uncertainty lies in their relationship to D. This is partly due to 1) the different time scales relevant to different types of stress, 2) the indirect nature of physiological indices, and 3) the high variability in the data. Signals may represent acute stress (e.g., barge loading; Congleton et al. 2000, 2003), chronic stress (e.g., density-dependent effects in barges), or cumulative effects from multiple acute stressors experienced during hydrosystem passage. Because of the indirect nature of these indices, determination of causal factors can be challenging. Overall, the diversity of responses shows that complex interactions can occur between environmental conditions, physiological responses, and survival rates.
4.2.4.5 Future Research Needs
A moderate degree of importance and extensive uncertainty make this factor have potentially moderate implications for management and for research. For a summarized version of future research needs and approaches, please see Table 5.1.
In general, high variability and confounding patterns among research studies and among years could be alleviated by composites of multiple indices. Wagner and Congleton (2004) analyzed the covariation of blood analytes and showed that composite variables may be more reliable for interpretation than individual variables. This would help identify whether significant patterns exist and potentially produce more convincing results. More research in the form of controlled experiments could help determine

4.16
causal factors and complement field research surveys and monitoring programs. A few examples of these are studies by Price and Schreck (2003), which established that stress decreases saltwater preference among smolts, and Dietrich et al. (2010), which identified fish densities and flow rates that produced minimal rates of disease transmission. Even given a moderate priority for stand-alone physiological studies, understanding the physiology of an animal being studied for survival and delayed mortality could be very important for understanding the physiological differences between low and high SAR cohorts. It would be beneficial to develop rapid, near real-time samples of physiological condition indices that can be analyzed as variables in survival models and help clarify patterns in D.
More specifically, continued research on the relationship between the degree of smoltification, energetic reserves, stress, physiological indices and D can help clarify patterns (particularly in the LRE) from previous studies that have covered a few years of data. Smoltification might be an important consideration for when and where to collect fish for transportation, as well as where to release them downstream. One approach is to develop a monitoring program to record the degree of smoltification at LGR, Lower Monumental Dam (LMN) or MCN, BON, and the LRE (via mobile Separation by Code [SbyC]) across the season. Fish collected at BON and in the LRE could also be tested in challenge studies that include predation, increased temperature, or disease. Together, this information would be useful to work out any discrepancies between indices of smoltification such as gill Na+/K+-ATPase levels and saltwater preference tests, as well as quantify the effects of energetic depletion on behavior and homeostasis of physiological attributes. Challenge studies in a laboratory or field setting can complement PIT-tag surveys of SARs, especially for fall Chinook salmon, which require extensive tagging to obtain reliable SARs. Research on physiology factors of D is expected to take several years to possibly decades, depending on the type of study and monitoring program.
To date, relatively little information about the relationship between fish condition and the probability of entrainment into the bypass system has been determined (Buchanan et al. 2011). A controlled study could be conducted by releasing tagged fish with a wide range of fish conditions and tracking which fish enter through the bypass system. This would help test whether fish in poor condition swim higher in the water column and have a greater probability of being entrained into the bypass system (where they can be collected for barge transportation).
Substantial variation can occur in indices of fish condition, thus making it difficult to relate to SARs and D. Again, composite variables may help alleviate this challenge (Wagner and Congleton 2004).
4.2.5 Disease
Hypothesis – Delayed mortality of barged and ROR migrants is affected by disease susceptibility, which is considered a measure of overall fish health. Mortality from some pathogens is greater in freshwater environments, so differences in LRE travel times among groups can affect D. (See Figure 4.6.)

4.17
Figure 4.6. Survival in Net Pens of Hatchery Spring/Summer Chinook Salmon Collected After ROR (In-
River) Migration or and Barge Transportation and Hatchery Reference Fish that Did Not Pass Through the Hydrosystem. Sand Island (a) is a seawater-influenced environment and Tongue Point (b) is in a freshwater environment. (Reproduced from Eder et al. 2009b.)
Spring/Summer Chinook Salmon
In challenge experiments with pathogen load (colony-forming units/mL) controlled in a laboratory, barged fish have been observed to survive better than ROR fish (Arkoosh et al. 2006). However, overall mortalities that include mortalities prior to and during challenge experiments have also been observed to show the opposite pattern (Dietrich et al. 2011). These contrasting patterns may be due to annual differences in the conditions of the fish in the pre-hydrosystem environments. In the field, approximately a dozen types of bacterial, viral, and fungal pathogens have been examined histopathologically and genetically for barged and ROR migrants (Dietrich et al. 2008; Mesa et al. 2008; Eder et al. 2009a, b; Van Gaest et al. 2011). Combinations of pathogens were often detected in single individuals, and the majority (85%) of mortalities in the net pen challenges were due to disease. Pathogen prevalence was generally greater among barged fish than ROR migrants immediately after hydrosystem passage in the pathogen prevalence surveys (Dietrich et al. 2008; Mesa et al. 2008; Eder et al. 2009b; Van Gaest et al. 2011). Mortalities during the net pen holding studies generally showed mildly greater mortalities among barged fish than ROR fish within the first 10 days, but overall greater mortalities in ROR migrants than barged fish by the conclusion of the 28-day experiments (Dietrich et al. 2008; Eder et al. 2009a, b). Across the season, mortalities of barged fish decreased while those of ROR migrants increased. Furthermore, net pen holding experiments at the estuarine site showed low mortality rates compared to the freshwater sites (Figure 4.6). The acoustically tagged, barged fish traveled from BON through the LRE at a significantly slower rate than ROR fish early in the migration season. The authors speculated that the slow travel rate of barged fish may make them more susceptible to disease and predation because they would spend more time in the freshwater environment than ROR migrants.
(a) (b)

4.18
Fish density and water-exchange rates on barges were tested to determine conditions that minimized pathogen transmission among spring/summer Chinook salmon (Dietrich et al. 2010). Low fish density (6 g/L) and high water-exchange rates (5.7 exchanges/h) were most conducive to limiting pathogen transmission. The authors found that low fish densities and high water-exchange rates minimized pathogen transmission among fish even at exposure times well beyond the few days that fish would remain in raceways and barges during transportation (Dietrich et al. 2010).
Fall Chinook Salmon and Steelhead
Information about the influence of disease on the SARs of juvenile fall Chinook salmon and steelhead during and after hydropower system passage has yet to be studied. Rates of disease are likely high among fall Chinook salmon because of warm temperatures during their outmigration.
4.2.5.2 Importance to D and Level of Uncertainty
Moderate importance to D and extensive data gaps and uncertainty
Pathogens appear to be prevalent in the system, but patterns vary across species of pathogens, locations, seasons, years, and studies. Pathogen prevalence of barged fish is generally greater than that of ROR migrants immediately post-hydrosystem (Van Gaest et al. 2011). However, laboratory challenge experiments and net pen holding experiments have shown higher (Dietrich et al. 2007, 2008, 2011; Eder et al. 2009b) and lower (Arkoosh et al. 2006; Dietrich et al. 2007, 2008, 2011; Eder et al. 2009b) mortality rates among barged fish when compared to ROR migrants. It is important to understand the experimental setting and time scale when interpreting the mortality patterns. Also, estimates of pathogen prevalence (apparent prevalence) may be biased by pathogen-associated mortality experienced by ROR migrants during hydrosystem transit. Extrapolation of net pen results to conditions experienced by fish in the river and estuary may be difficult because animal confinement dramatically alters the host-pathogen relationship and opportunities for pathogen exposure. Overall, disease appears to play a role in the patterns of D, but complex interactions between the host, pathogen, and the environment as well as the continuum of “Susceptible”-“Exposed”-“Infected”-“Recovered/Exposed” conditions of the host elicit relatively extensive data gaps and uncertainty related to this factor.
4.2.5.3 Future Research Needs
A moderate degree of importance and extensive uncertainty make this factor have potentially moderate implications for management and moderate priority for research. For a summarized version of future research needs and approaches, please see Table 5.1.
Validated tools are now available to sample pathogens non-lethally and assess both pathogen prevalence and pathogen load (Badil et al. 2011). Pathogen prevalence is not a marker of “fish health” but of pathogen exposure; measurements of pathogen load are also needed to make inferences about possible pathogen impacts on fish health. A number of additional fish health biomarkers have been reported for R. salmoninarum and infectious hematopoietic necrosis virus (IHNV) (Metzger et al. 2010 and Purcell et al. 2010), which could collectively provide a better indicator of health or disease status. Future studies using non-lethal sampling approaches may help to resolve whether pathogens are major or minor drivers of D. Additional research could reveal seasonal and annual patterns, and potentially modify the relative ranking of importance for this factor. Continued research of pathogen transmission in barges as a follow-up to the Dietrich et al. (2010) laboratory study would also be valuable.

4.19
If pathogens do differentially affect post-BON survival of barged fish and ROR migrants, procedures could be developed to minimize the collection of diseased fish and/or reduce pathogen transmission within barges. Barge conditions that minimize pathogen transmission have been determined (Dietrich et al. 2010) and could be implemented. Pathogen controls could be developed if pathogens were determined to be a major contributor to low SARs. Longitudinal field studies could be conducted to measure pathogen prevalence and pathogen load of independent but parallel groups of barged fish and their ROR counterparts at LGR, BON, and in the LRE throughout the season. This type of study could take several years to a decade, depending on the scope of the study or monitoring program. Pathogen prevalence can vary seasonally, annually, spatially, and across pathogen species, thus making it challenging to determine the effects of pathogens on SARs or D. However, tools are available for determining associations between pathogens and D (see Appendix D and Appendix Section E.1.3; Van Gaest et al. 2011).
4.2.6 Dam Operations ⑤
Hypothesis 1 – Passage through the turbine and bypass routes affect ROR fish through a form of cumulative stress and delayed mortality, and hence affect D.
Hypothesis 2 – The percent of spill affects the proportion of fish transported, the survival of ROR fish, and hence D.
See turbine and bypass routes related to cumulative stress (Hypothesis 1) and transportation passage vs. spill route (Hypothesis 2) in Figure 4.7.
Figure 4.7. Spill Operations and Turbine Efficiency Affect Fish Passage Routing and Survival
4.2.6.1 Cumulative Stress from Different Passage Routes (Hypothesis ⑤-1)
Spring/Summer Chinook Salmon
Survival is greatest through the spill bays, followed by the bypass system, and then the turbines (Muir et al. 2001). However, more recent studies would indicate this may not always be the case (Ploskey et al. 2011). Ferguson et al. (2006) presented evidence that fish passing through turbines running outside the range of peak efficiency produced a form of delayed mortality. With MCN turbines running within 1% of peak efficiency, survival was 0.87 at 14 km downstream of the dam and 0.86 at 46 km downstream of the dam. Outside the 1% peak efficiency envelope, survivals were 0.86 at 14 km and 0.81 at 46 km. The decreased survival associated with passing through turbines outside the peak efficiency range was likely due to the disruption of the fish's sensory system and increased vulnerability to predators in the tailrace. In a more recent study, survival rates were examined 1 h and 48 h after turbine passage at five different efficiencies (Normandeau Associates, Inc. et al. 2008). Lower survival was observed after 48 h than after 1 h when the turbine efficiencies during fish passage were at the lower 1%, intermediate, and upper 1% of
H2: Relative Effects of spill vs. transportation (i.e., reduced spill)
H1: Cumulative stress from different passage routes

4.20
turbine efficiencies. No difference between survival over 1 and 48 h was detected at peak and maximum efficiencies. Thus, cumulative stress from turbine passage appears to decrease survival to some degree. However, the effects of cumulative stress from turbine passage on SARs and D are largely unknown. Moreover, recent turbine survival research suggests that survival post turbine passage is likely more related to hydraulic conditions in the trailrace of the dam than direct injury caused by the turbine runner. Hydraulic conditions in the tailrace vary considerably as units are run within and outside of the 1% best operating turbine efficiency range. These hydraulic conditions directly relate to tailrace egress times of migrating salmon and steelhead and the distribution of piscivorous fish in the tailrace.
However, the analysis in Ferguson et al. (2006) did not account for tag bias. Recent studies by PNNL (Brown et al 2009; Carlson et al. 2010) indicate a significant tag bias associated with the exposure of internally tagged fish to turbine pressures. The study shows juvenile salmonids surgically implanted with telemetry tags have a much higher risk of mortal injury than non-tagged fish when exposed to simulated turbine pressures. The disparity in mortal injury increased with increased tag burden. The increased mortality due to tag burden would also agree with finding in Ferguson et al. (2006) that there was “a trend of higher mortality in smaller fish than larger fish” at the 12,000 cfs discharge. Ferguson et al. (2006) attributed the difference to turbulence affecting the smaller fish, but it is more likely due to the higher tag burden borne by the smaller fish. The effects of the tag bias associated with exposure to turbine pressures likely contribute to increased delayed mortality, since death during the PNNL studies was not always immediate to the tagged fish sustaining mortal injury.
Moreover, recent turbine survival research suggests that survival post turbine passage may be significantly influenced by the tailrace hydraulic conditions, and less associated with direct injury sustained during turbine passage. Hydraulic conditions in the tailrace vary considerably and are dependent upon both the operation of the individual turbine unit as well as the operation of the powerhouse and spillway. These hydraulic conditions directly relate to tailrace egress times of migrating salmon (and steelhead) and the distribution of piscivorous fish in the tailrace.
Evidence has been found to suggest that undetected fish experience better in-river passage conditions than fish detected in the bypass system and returned to the river. Survival of Chinook salmon that have been bypassed at least once generally have lower SARs than fish that have never been detected (Tuomikoski et al. 2010; Buchanan et al. 2011) and are assumed to have passed via the spill route for the most part. Tuomikoski et al. (2010) concluded from their analyses of fish PIT-tagged and released from 1998–2009 that post-BON SARs of yearling Chinook were reduced by 10% for each bypass passage experienced. On average, non-bypassed spring/summer Chinook salmon averaged 52% higher SARs than those that were bypassed one or more times. Similarly, Buchanan et al. (2011) found the SARs of spring/summer Chinook salmon declined further with multiple bypass events. Furthermore, differences in the perceived bypass effect occurred across dams. It is possible that the characteristics that result in them avoiding entering bypass systems, such as the size (Zabel et al. 2005), condition, and health of the fish, may confer a survival benefit. However, Buchanan et al. (2011) found no consistent evidence of bypass selectivity for smaller fish. Ham et al. (2009) also did not detect significant bypass effects.
In addition, for fish entering the bypass system, transportation in barges has generally resulted in higher adult returns than for hatchery spring/summer Chinook salmon returned back to the river. The SARs of spring/summer Chinook salmon and steelhead from 1990 to 1997 were highest for those transported from LGR and Little Goose Dam (LGS) (Sandford and Smith 2002). These rates were only slightly higher than those for undetected fish. Recent analysis of SAR data (1996–2006) (Buchanan et al. 2011) identified more subtle effects of passage routes on delayed mortality. The analysis did not resolve

4.21
the magnitude of effects but did suggest that certain passage routes were likely to result in higher levels of post-hydrosystem mortality than what was observed on the average. Adult returns for spring/summer Chinook salmon that were bypassed at LGR and then transported from LGS were lower than the expected rates.
Fall Chinook Salmon
No information about fall Chinook salmon delayed mortality after dam passage through different routes was found.
Steelhead
Generally, survival of steelhead was highest through the spill bays, lower in the bypass system, and lowest through the turbine route (Muir et al. 2001). The Buchanan et al. (2011) study suggested the decline in SAR with number of dam bypass detections observed in Chinook also was evident in steelhead. Steelhead that experienced one bypass event showed no noticeable effects on SARs, but two or more bypass events did decrease SARs (Buchanan et al. 2011). Tuomikoski et al. (2010) determined that a decline of 6% in post-BON SARs occurred for steelhead per bypass event at Snake River dams, and 22% per bypass event at Columbia River dams. Non-bypassed steelhead averaged 91% higher SARs than those bypassed at least once.
4.2.6.2 Relative Effects of Spill-Transport (Hypothesis ⑤-2)
Spring/Summer Chinook Salmon and Steelhead
The balance between fish transportation and spill can affect the number of adult returns (ISAB 2008, 2010; DeHart 2010; NOAA 2010). Much of the research and discussion about the relative effects of spill and transport have primarily focused on T:I and to a lesser extent D. Assuming that spill increases in-river survival, it decreases the relative benefit of transportation. In years of high transport and low/no spill, such as 2001, 2004, and 2005, the relative benefit of transporting fish is enhanced by the low survival of ROR fish likely due to increased delay at dams with low spill, longer travel times with low flow, and higher predation rates. In years of low transport and high spill, the opposite scenario develops. The relative benefit of transportation decreases due to the increased survival rates of ROR fish. There are various other spill-transport operations than these two extremes, and much uncertainty still remains with regard to the effects of these other scenarios on SARs, T:I, and D. Since 2006, a mixed spill-transport program has been implemented. Also, a staggered schedule of transportation starting with LGR, LGS, and then LMN has been applied.
Various scenarios of spill-transport operations have been simulated in the Comprehensive Passage (COMPASS) model (Zabel et al. 2008b). Sensitivity analyses revealed that hatchery spring/summer Chinook salmon were more sensitive to spill, while steelhead were more sensitive to flow in the simulations. Generally, as the proportion of spill increased from 0% to 80%, overall dam survival increased from approximately 54% to 69% for Chinook salmon and from approximately 58% to 72% for steelhead. However, differences among dams existed, with BON being the least sensitive and John Day Dam (JDA) being the most sensitive to changes in proportion spill. As flow in the Columbia River increased from about 130 to 450 kcfs, the median travel time from the LGR forebay to the BON tailrace decreased exponentially from 45 to 13 days for Chinook salmon, and from approximately 35 to 10 days for steelhead. A change from 0% to 75% spill decreased the median travel time of steelhead by several
4.22
days, but not for spring/summer Chinook salmon. Furthermore, the absence (scenario 1) or presence (scenario 2) of spill at LGR, LGS, and LMN when barging begins, affects adult return rates. Simulation results indicated that the seasonal proportion of maximum adult return rates (maximum across scenarios 1 and 2) of spring/summer Chinook salmon and steelhead is most affected during low flow years, and least affected during high flow years. Spill also dampens the seasonal variability in both species. For example, without spill in a low flow year, the proportion of maximum adult return rate of spring/summer Chinook salmon decreases from 0.95 to 0.45 from March 24 to July 1, with a peak around May 1. Whereas, with 75% spill at the transport dams, the proportion of maximum adult return rate remains around 0.65. Likewise, in steelhead, with 0% spill in a low flow year, this proportion decreases from 1.0 to about 0.1; whereas, with 75% spill at the transport dams, the proportion changes slightly from about 0.15 to 0.1. In the model, as in the real world, the proportion of spill strongly influenced the proportion of fish transported.
Fall Chinook Salmon
Estimates of survival are difficult to determine because of limited sample sizes and the concurrent migration and rearing behaviors among different fall Chinook salmon during passage before, during, and after the hydrosystem (Williams et al. 2005; Ledgerwood et al. 2007; Marsh et al. 2010a). In 2005, increased spill and limited transportation were used in an effort to help fall Chinook salmon passage through the hydrosystem. The effects of this management strategy on D have yet to be ascertained.
4.2.6.3 Importance to D and Level of Uncertainty
High importance to D and extensive data gaps and uncertainty
Cumulative experiences from different passage routes and the balance between spill and transport can have a relatively strong effect on D. However, data gaps exist for the exact mechanisms underlying bypass effects, when they do occur, as well as for the relative effects of spill on post-BON SARs of barged and ROR fish.
4.2.6.4 Future Research Needs
A high degree of importance and extensive uncertainty make this factor have potentially high implications for management and high priority for research. For a summarized version of future research needs and approaches, please see Table 5.1.
With the mixed spill-transport strategy implemented since 2006, additional information about the relative benefit of transport across various scenarios of spill in high- and low-flow years will add to the range of conditions that have been investigated. Predicted survival rates and D related to this question would help evaluate the mixed spill-transport strategy. A better understanding of seasonal in-river conditions could also help determine appropriate times to begin and end barge transportation. Thus far, 2 years of low flow with spill have occurred: in 2007 with court-ordered spill, and in 2010 when the Independent Scientific Advisory Board (ISAB) concluded that another opportunity for data collection and to “spread the risk” among species such as lamprey and sockeye salmon was warranted. Possible research approaches include retrospective data analysis and simulations (e.g., COMPASS model) in which annual and seasonal patterns are examined. This research could take a few years. Uncertainty is an important part of the predicted responses. Expressing the uncertainty in a readily comprehensible way may be challenging. Also, as structural improvements occur over the next several years or decades, a re-analysis would be fitting.

4.23
4.2.7 Barging Conditions ⑥
Hypothesis 1 – Differential delayed mortality of fish barged from LGS and LMN is lower than those barged from LGR.
Hypothesis 2 – Dissolved metals and noise within barges are respectively toxic to the body and disruptive to the auditory sensitivity of barged fish.
Hypothesis 3 – High surface-water temperatures aggravate fish condition during barge transportation and decrease their post-hydrosystem survival.
Hypothesis 4 – Delayed mortality of fish barged to the site near Astoria (Alternative Barging Strategy) is lower than that to the traditional site downstream of BON (rkm 225) because of reduced predation by piscivorous fish and birds.
See barge collection and release sites for Hypotheses 1 through 4 in Figure 4.8.
Figure 4.8. Conditions Within Barges and Collection and Release Site Locations Can Affect the
Post-Barging Condition of Fish
4.2.7.1 Transport Collection Site (Hypothesis ⑥-1)
In hatchery spring/summer Chinook salmon from 1994 to 2000, D decreased across the LGR (0.700), LGS (0.654), and LMN (0.502) transport sites (Williams et al. 2005). This decreasing trend was not observed in wild spring/summer Chinook salmon or in hatchery steelhead. In wild steelhead, D increased across the LGR (0.550), LGS (0.842), and LMN (1.757) transport collection sites. NOAA (2010) reported seasonal estimates of T:I from 1998 to 2008 for wild and hatchery Chinook salmon and from 1998 to 2007 for wild and hatchery steelhead transported from upstream of LGR, at LGR, and at LGS. This was an opportunistic analysis of data available to explore alternative standards of T:I for run-at-large fish and was not intended to determine best practices in relation to barge-loading sites and D. The T:I ratios estimated with 95% confidence intervals (CIs) were equivalent when comparing between fish transported from LGR or LGS, by stock and by year. Overall, there is little support for or against the hypothesis that D is lower for fish transported from LGS and LMN than from LGR.
Transport is a benefit to hatchery spring Chinook salmon and steelhead adult returns for fish collected at MCN; however, the benefits of transportation are less than those observed from LGR and LGS (Giorgi et al. 2002). In more recent research, transportation of Columbia River hatchery spring Chinook salmon from MCN yielded higher SARs than those of bypassed ROR migrants, but not of undetected (i.e.,
H2, H3
H1
H4

4.24
spillway/turbine routes) ROR migrants (Marsh et al. 2010c). Transportation was beneficial to Columbia River hatchery steelhead regardless whether ROR migrants were bypassed or were undetected at MCN.
4.2.7.2 Dissolved Metals and Noise (Hypothesis ⑥-2)
In barged spring/summer Chinook salmon, concentrations of dissolved metals were below critical levels that would disrupt aquatic life, and olfactory neurons were found to be intact in spring/summer Chinook salmon. However, short-term disruption in the auditory sensory system of barged fish occurs because of the noise they experience during downstream passage (Halvorsen et al. 2009). The barged fish appear to recover auditory sensitivities after 7 or more days.
4.2.7.3 Water Temperature (Hypothesis ⑥-3)
The condition of fall Chinook salmon is generally poor in July–August when water temperatures often exceed 21°C (Schreck et al. 2005). Clemens et al. (2009) hypothesized that fall Chinook salmon transported in the mid- and late season had low survival rates in the LRE because of warm surface water circulating in the barges. The ROR fall Chinook salmon could select water depths of cooler temperatures than those experienced by barged fall Chinook salmon. In the COMPASS model (Zabel et al. 2008a, b), water temperatures influenced the survival of spring/summer Chinook salmon in the Snake River, but not in the Columbia River. Survival rates for these fish were greatest at 11°C.
High water temperatures likely stress fall Chinook salmon and Sauter et al. (2001) provides a possible mechanism. The authors observed juvenile fall Chinook salmon from the Columbia River to prefer lower water temperatures (16.7°C to 11.1°C) in laboratory experiments as the season progressed (May 5 to August 7) and acclimation temperatures increased (12°C to 18°C). The authors speculated that the preference for cooler waters may be to preserve the ATPase activity in the gills during smoltification.
Furthermore, temperature correlates with travel timing and SARs of spring/summer Chinook salmon and steelhead in the form of a residual temperature effect (Scheuerell et al. 2009).
4.2.7.4 Alternative Barging Strategy (Hypothesis ⑥-4)
Schreck et al. (2005) recommended testing a barge release site lower in the estuary at night on an outgoing (ebb) tide to reduce avian predation on spring/summer Chinook salmon and steelhead. Release of barged fish at rkm 10 (near Astoria) instead of the usual post-BON site at rkm 225 reduced the vulnerability of fish to avian predation (McMichael et al. 2006; Ryan et al. 2007; Marsh et al. 2008, 2010b). Ryan et al. (2007) determined that avian predation rates on PIT-tagged yearling Chinook released at Astoria (rkm 10) were one-seventh the rates of yearlings released at Skamania Landing (rkm 225). For yearling Chinook salmon in 2008, minimum predation rates were 3.9% for those released at rkm 225 and 0.9% for those released at rkm 10 (Marsh et al. 2010b). Similarly for steelhead, minimum predation rates were 14.9% for the rkm 225 release group and 4.4% for the rkm 10 release group. Results were similar in 2006 and 2007. The SARs for the 2006 release group showed benefits from the alternative barging strategy for steelhead (Skamania:Astoria = 1.20; 95% CI = 1.01–1.41), but disadvantages for yearling Chinook (Skamania:Astoria = 0.49; 95% CI = 0.18–1.31). Furthermore, rates of straying increased for barged steelhead and lowered conversion rates between BON and LGR. Fish from the alternative barging strategy may be physiologically unprepared for seawater entry and consequently experience delayed mortality.

4.25
A predictive model of smolt survival was developed primarily to determine predator-prey relationships, which include the degree of overlap in time and space, and the maximum energy needed in the predator population (ICF Jones & Stokes 2009). Although adult survival rates cannot be determined from this model, it does model aspects of the LRE that may be important determinants of D. Travel times through the estuary and proportions of release beyond the foraging radius of east Sand Island highly influenced results from the model. The model predicted that terns and cormorants were responsible for 5.4% of steelhead mortality and 3.6% of Chinook salmon mortality. The researchers assumed 17.4% mortality due to Northern pikeminnow (Ptychocheilus oregonensis) (Porter 2008). With the alternative barging strategy, mortality due to N. pikeminnow predation was eliminated, and mortality due to avian predation decreased for Astoria releases relative to the Skamania releases seven-fold for yearling Chinook and five-fold for steelhead. The analysis also showed that ROR migrants experienced very little additional mortality (< 0.03) caused by the lack of barged migrants that would have been released from Skamania. However, scenarios with reduced alternative prey such as non-salmonids and lower-river salmonids showed that survival of ROR migrants decreased.
4.2.7.5 Importance to D and Level of Uncertainty
Transport Site, Surface-Water Temperature, and Alternative Barging Strategy
Medium importance to D and extensive data gaps and uncertainty
The transport site sometimes influences D but relatively extensive data gaps and uncertainty remain. Warm surface-water experienced by barged fall Chinook salmon could negatively affect their condition relative to ROR migrants. However, differences between surface- and deep-water temperatures experienced by the juvenile salmonids particularly in the upper dams of the FCRPS have yet to be determined. Also, preliminary results of the alternative barging strategy appear to show benefits of reduced avian predation but also disadvantages of increased rates of straying for steelhead. The overall benefits, or lack thereof, from these two drivers have yet to be determined. Altogether, these three factors show some influence on D, but much uncertainty remains.
Dissolved Metals and Disrupted Auditory Senses
Low importance to D and limited data gaps and uncertainty
This factor is considered to be of relatively low importance to D because of its lack of significant effect from dissolved metals and the relatively short duration of disrupted auditory sense. Additional research could be conducted to determine whether this compromised auditory sensitivity affects predator avoidance during passage through the LRE. However, relative to all other potential factors of D considered, this was ranked as having limited data gaps and uncertainty.
4.2.7.6 Future Research Needs
For a summarized version of future research needs and approaches, please see Table 5.1.
Transport Site, Surface-Water Temperature, and Alternative Barging Strategy
Research on alternative transportation sites would need a two-pronged approach. The first prong is to determine if the SAR from alternative sites were statistically different across species. In the second
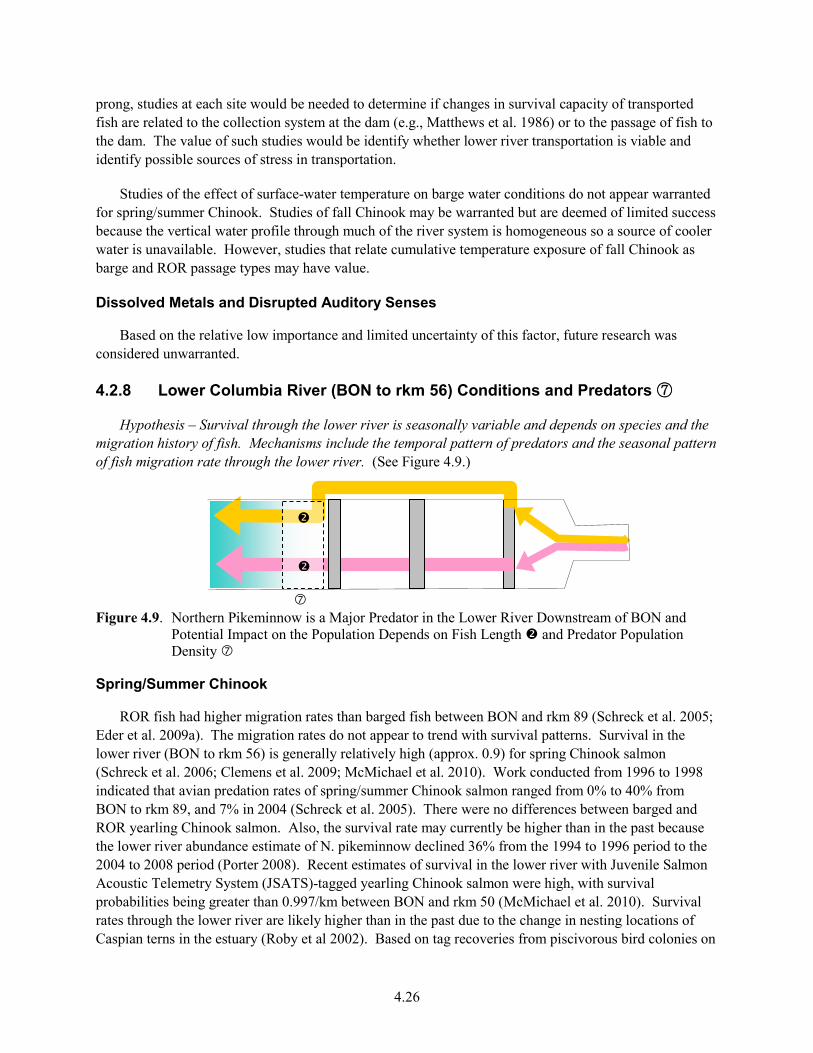
4.26
prong, studies at each site would be needed to determine if changes in survival capacity of transported fish are related to the collection system at the dam (e.g., Matthews et al. 1986) or to the passage of fish to the dam. The value of such studies would be identify whether lower river transportation is viable and identify possible sources of stress in transportation.
Studies of the effect of surface-water temperature on barge water conditions do not appear warranted for spring/summer Chinook. Studies of fall Chinook may be warranted but are deemed of limited success because the vertical water profile through much of the river system is homogeneous so a source of cooler water is unavailable. However, studies that relate cumulative temperature exposure of fall Chinook as barge and ROR passage types may have value.
Dissolved Metals and Disrupted Auditory Senses
Based on the relative low importance and limited uncertainty of this factor, future research was considered unwarranted.
4.2.8 Lower Columbia River (BON to rkm 56) Conditions and Predators ⑦
Hypothesis – Survival through the lower river is seasonally variable and depends on species and the migration history of fish. Mechanisms include the temporal pattern of predators and the seasonal pattern of fish migration rate through the lower river. (See Figure 4.9.)
Figure 4.9. Northern Pikeminnow is a Major Predator in the Lower River Downstream of BON and
Potential Impact on the Population Depends on Fish Length and Predator Population Density
Spring/Summer Chinook
ROR fish had higher migration rates than barged fish between BON and rkm 89 (Schreck et al. 2005; Eder et al. 2009a). The migration rates do not appear to trend with survival patterns. Survival in the lower river (BON to rkm 56) is generally relatively high (approx. 0.9) for spring Chinook salmon (Schreck et al. 2006; Clemens et al. 2009; McMichael et al. 2010). Work conducted from 1996 to 1998 indicated that avian predation rates of spring/summer Chinook salmon ranged from 0% to 40% from BON to rkm 89, and 7% in 2004 (Schreck et al. 2005). There were no differences between barged and ROR yearling Chinook salmon. Also, the survival rate may currently be higher than in the past because the lower river abundance estimate of N. pikeminnow declined 36% from the 1994 to 1996 period to the 2004 to 2008 period (Porter 2008). Recent estimates of survival in the lower river with Juvenile Salmon Acoustic Telemetry System (JSATS)-tagged yearling Chinook salmon were high, with survival probabilities being greater than 0.997/km between BON and rkm 50 (McMichael et al. 2010). Survival rates through the lower river are likely higher than in the past due to the change in nesting locations of Caspian terns in the estuary (Roby et al 2002). Based on tag recoveries from piscivorous bird colonies on

4.27
East Sand Island in recent years, no significant difference in spring Chinook predation rates has been detected between barged and ROR fish (Sebring et al. 2010a, 2010b, 2012), however these estimates reflect total predation in the lower river and estuary by avian colonies. Also, Mesa et al. (2008) found no evidence of size-selective predation by N. pikeminnow in a field survey of length frequency distributions of yearling Chinook salmon that were barged, ROR, and in N. pikeminnow diets. Overall, the literature shows high survival rates of spring/summer Chinook salmon in the lower river.
Fall Chinook Salmon
From BON to rkm 89, ROR fall Chinook had higher survival rates than barged fish in 2002 and 2003, particularly in the late season (Schreck et al. 2005; Clemens et al. 2009). ROR fall Chinook survival declined and remained around 1 across the season in 2002, while the survival of the barged counterparts declined from 0.8 to 0.6. In 2003, ROR survival declined from 0.8 to 0.5, while barged fish survival declined from about 0.8 to less than 0.1. Estimates for fall Chinook salmon survival between BON and rkm 46 were similar to the patterns from BON to rkm 89 (Clemens et al. 2009). The survival patterns do not appear to be related to travel rates or avian predation (Schreck et al. 2005; Clemens et al. 2009). Schreck et al. (2005) observed high variability in the migration rates of fall Chinook salmon that caused each release group to not reach the upper estuary as one distinct group. Ledgerwood et al. (2007) also found that the travel rates of barged and in-river migrating fall Chinook salmon did not significantly differ in the LRE. But, survival of fall Chinook salmon was negatively influenced by the seasonal decline of river flows (Clemens et al. 2009). More recent estimates show that the survival from BON to approximately rkm 56 of ROR fall Chinook collected at JDA declined across the season from about 0.9 to 0.5 (McMichael et al. 2010).
Steelhead
Barged and ROR steelhead had similar migration rates between BON and the estuary at rkm 89, and there was no relationship between migration rate and survival rates (Schreck et al. 2005). This is likely because steelhead survival between BON and rkm 46 is relatively high (Clemens et al. 2009).
4.2.8.2 Importance to D and Level of Uncertainty
Low importance to D and limited data gaps and uncertainty (for spring/summer Chinook salmon and steelhead)
Moderate importance to D and extensive data gaps and uncertainty (for fall Chinook salmon)
The minimal differences in lower-river survival rates between barged and ROR make this factor a non-significant contributor to D for spring/summer Chinook salmon and steelhead. However, for fall Chinook, the lower survival of barged fish relative to ROR fish make this factor of moderate importance to D but extensive data gaps remain.
4.2.8.3 Future Research Needs
A low degree of importance and a low level of uncertainty make this factor have potentially low implications for management and very low priority for research for spring/summer Chinook salmon and steelhead. Future research is not warranted for these species.
For fall Chinook salmon, future research could encompass determining differential survival rates of barged and ROR fish, and the causes of these differences. Some testable causes include arrival timing, physiological condition, disease, and size-selective predation.

4.28
4.2.9 Estuarine Conditions (below rkm 56) and Predators ⑧ Hypothesis – Bird predators consume smolts in the freshwater-seawater interface where
susceptibility depends on species, level of smoltification, stress, and other fish conditions. These factors may be significant in determining the seasonal variations in D. (See Figure 4.10.)
Figure 4.10. Representative Populations of Smolts in the Estuary (Top Graph) and Proportion of
Salmonids in the Diet of Caspian Terns (Middle Graph) and Double-Crested Cormorants (Bottom Graph). Top graph reproduced from ICF Jones & Stokes (2009) with permission. Middle and bottom graphs reproduced with permission from Bird Research Northwest, www.birdresearchnw.org accessed on 5 July 2011.
Caspian Tern Diet
Double-Crested Cormorant Diet

4.29
Spring/Summer Chinook Salmon
Studies, such as those by Schreck et al. (2006), Roby et al. (2011b), and ICF Jones & Stokes (2009), hypothesize that bird predation is a major factor in smolt consumption in the Columbia River Estuary (CRE). However, much of the research focuses on overall avian predation rates among different salmonid stocks, and not on stocks with different migration histories (i.e., barge versus ROR). We first synthesize research on avian predation rates, then survival rates in relation to travel rates, and finally seasonal patterns.
The avian predation rates from 2004 to 2009 by the tern colony on East Sand Island were greater among hatchery spring Chinook salmon (2.7%; 95% CI 2.5%–2.9%) relative to wild ones (1.2%; 0.8%–1.6%) (Roby et al. 2011b). Predation rates by the cormorants from East Sand Island were generally lower than those by terns. There was no statistically significant difference in cormorant predation rates between hatchery and wild spring/summer Chinook salmon. Based on tag recoveries from East Sand Island in recent years, no significant difference in spring Chinook predation rates has been observed between barged and ROR fish (Sebring et al. 2010a, 2010b, 2012). This finding, however, is based on yearly estimates with limited sample sizes for comparison.
It is hypothesized that the differential in arrival timing between ROR and transport fish can result in differential susceptibility to bird predators. Travel rates and survival rates of outmigrating spring/summer Chinook salmon both decline at approximately rkm 50 (Carter et al. 2009; Eder et al. 2009a; McMichael et al. 2010). Also, barged fish have lower travel rates and lower survival rates than ROR migrants (Eder et al. 2009a). In 2008, Eder et al. (2009a) observed ROR spring/summer Chinook salmon decreasing their travel rate from 98.4 km/d between rkm 202 and rkm 36 to a rate of 53.5 km/d between rkm 36 and rkm 8 (Appendix D, Appendix Section F.1.6). Their survival rates in these two reaches also decreased from 0.97 (SE 0.02) to 0.89 (SE 0.02). For the barged counterparts in these two respective reaches, their travel rate decreased from 49.3 km/d to 27.8 km/d, and their survival decreased from 0.92 (SE 0.02) to 0.78 (SE 0.03). Differences in where ROR and barged spring/summer Chinook salmon occur in the water column, if any exist, could also explain their differences in predation rates. McMichael et al. (2010) observed similar patterns in 2009, but the patterns were not as pronounced as those from Eder et al. (2009a). Median travel rates were at least 75 km/d between BON and rkm 50, and then decreased to approximately 45 km/d between rkm 50 and rkm 22. In the last reach, between rkm 22 and rkm 8, median travel rates were greater than 100 km/d, with 25th and 75th percentiles, respectively, at about 30 km/d and 175 km/d. The survival probabilities were greater than 0.996/km in different reaches downstream of BON up to rkm 22, after which rates dropped to 0.982/km. Differences in the patterns from these two studies are possibly due to differences in environmental conditions in the 2 years tested and because different stocks of fish were tested. Eder et al. (2009a) tested spring/summer Chinook salmon originating from upstream of LGR, while McMichael et al. (2010) tested those originating from upstream of JDA. Overall patterns show that survival per unit distance decreases with travel rate.
The seasonal proportion of salmonids in the diet of Caspian terns and double-crested cormorants generally coincides with the salmonid outmigration runs (Figure 4.10). However, the exact effects of the seasonal changes in bird behaviors and population densities on the avian predation rates of ROR and barged spring/summer Chinook salmon are unknown. In general, travel rate and survival increased across the season (McComas et al. 2008; Carter et al. 2009, Eder et al. 2009a; and McMichael et al. 2010), with travel rate likely being influenced by the increased river discharge (Schreck et al. 2005; Eder et al. 2009a). However, McMichael et al. (2010) have also shown that avian predation rates estimated from
4.30
recovered PIT tags on East Sand Island were greatest in the middle of the outmigration season (mid-May). The difference between these two seasonal trends may be due to the fact that the initial pattern captures overall survival rates that include predation by piscivorous birds and fish throughout the estuary and other types of mortality such as poor health, while the second pattern is only the avian predation from East Sand Island. This may indicate the importance of other sources of predation and types of mortality other than the avian predation from East Sand Island. Furthermore, the dilution of Snake River fish with alternative prey fish from the lower river lessens the predation pressure by birds. Approximately 60% of the smolts in the estuary are from stocks entering downstream of BON and 90% of these are of hatchery origin (ICF Jones & Stokes 2009).
Fall Chinook Salmon
Few estimates, if any, of survival and travel rates for ROR and barged fall Chinook salmon in the CRE exist. Only survival and travel rate estimates of ROR fall Chinook collected and tagged at JDA and BON are available (McComas et al. 2008; McMichael et al. 2010). Schreck et al. (2005) conducted laboratory experiments and found no difference between barged and ROR fish in their preference for saltwater or in their ability to osmoregulate in saltwater. Thus, there has been little or no support for different travel rates between fall Chinook salmon with the two types of migration histories. Below, we summarize the patterns of survival and travel rates observed for run-at-large fall Chinook salmon collected at JDA or BON.
In 2006, from BON to rkm 8.3, the survival rates of fall Chinook salmon, collected and tagged at BON, decreased from approximately 1.005 (SE 0.0458) to 0.179 (SE 0.0410) throughout the season (McComas et al. 2008). In 2009, similar results from fall Chinook, collected and tagged at JDA, were observed with survival rates from BON to rkm 8.3 ranging from 0.78 (0.003) to 0.36 (0.04) throughout the season (McMichael et al. 2010). Despite the patterns of seasonal decline in survival, fall Chinook salmon did not show a seasonal pattern in travel time from BON to rkm 8.3 (McComas et al. 2008).
Survival rates per unit distance decreased rapidly across the different reaches downstream of BON: from approximately 0.998/km between BON and rkm 50, to 0.9965/km between rkm 50 and rkm 22, and then 0.9945 between rkm 22 and rkm 8 (McMichael et al. 2010). Comparatively, travel rates decreased in this reach: median travel rates declined from approximately 75 km/d to about 25 km/d from BON to rkm 22. Travel rates were about 40 km/d with 25th and 75th percentiles at about 25 km/d and 175 km/d, respectively. The decline in travel rate from rkm 50 to rkm 8 might cause increased susceptibility to predation. Furthermore, the travel rates of barged fall Chinook salmon generally decreased with river flow (Ledgerwood et al. 2007). Ledgerwood et al. (2007) speculated that increased barging activity with decreasing flows late in the season would increase the propensity of fall Chinook salmon to residualize and overwinter in the estuary. They also observed several in-river residuals (yearling fall Chinook salmon) in the upper estuary in May. The effects of the two different juvenile life-history strategies (i.e., subyearling ocean-type versus residuals) on their predation risk in the estuary and on D are unknown.
Estimates of avian predation on fall Chinook salmon are as follows. Schreck et al. (2005) found that overall avian predation rates on fall Chinook salmon from the piscivorous bird colonies ranged between 0% and 9% between 2001 and 2003. McComas et al. (2008) observed avian predation rates in 2006 from East Sand Island, and estimated these to be at least 2.5% for fall Chinook salmon. The range was from 1.2% to 4.5% throughout the outmigration season. They also observed the highest rates of avian

4.31
predation occurred in the mid to late part of the season (mid-July). Roby et al. (2011b) observed from 2004 to 2009 that the avian predation rates on fall Chinook salmon were 1.4% (95% CI 1.3%–1.5%). Sebring et al (2012) observed weekly mean avian predation rates of fish detected at Bonneville Dam and those released concurrently from transport barges at Skamania Landing in 2010 of 3.6% for ROR fall Chinook and 2.5% for transported fish by Caspian terns and Double crested cormorants nesting at East Sand Island.
Patterns in avian predation rates may be explained by where the fish occur in the water column. Subyearling Chinook salmon tend to be found at greater depths than spring/summer Chinook salmon (Carter et al. 2009). Mean migration depths were 4.6–27.7 m for subyearlings and 4.1–10.5 m for spring/summer Chinook salmon. Lower avian predation rates on subyearlings than spring/summer Chinook salmon and steelhead support the hypothesis that subyearlings occupy deeper waters. Furthermore, smaller-sized fall Chinook salmon occupy shallow near-shore areas, while larger ones occupy deeper offshore channel areas of the estuary. More specifically, subyearlings < 60 mm in length were in < 1-m water, those 60–100 mm in length were in shoals and tributary channels, and those > 100 mm in length were in deep and shallow waters (Carlson et al. 2001; Bottom et al. 2005; Carter et al. 2009). Although the difference among barged and ROR migrants in where they occur in the water column could result in selective avian predation, predation rates have not been observed to significantly differ between fall Chinook salmon from the two migration histories (Schreck et al. 2005).
Steelhead
Sebring et al (2012) observed relatively similar mean weekly avian predation rates of fish detected at Bonneville Dam and those released concurrently from transport barges at Skamania Landing in 2010 of 12.4% for ROR steelhead and 13.6% for transported fish by Caspian terns and Double crested cormorants nesting at East Sand Island. Schreck et el (2005) found that ROR migrants had higher survival rates than barged steelhead to the upper estuary (rkm 89), but not to rkm 46. Avian predation for barged fish and ROR migrants and river outflow were, respectively: 6% barged, 1% ROR, 4.07 thousand cubic meters per second (kcms) in 2001; 11% barged, 17% ROR, 7.05 kcms in 2002; and 30% barged, 22% ROR, 7.83 kcms in 2003. Also, there were no differences between fish with these two migration histories in their saltwater preference or ability to osmoregulate even though ATPase activity was significantly greater among ROR migrants than barged fish. Thus, support for the hypothesis of increased susceptibility to avian predation due to incomplete smoltification remains ambiguous.
With regard to different rearing types, Roby et al. (2011b) found that tern predation rates were greater among wild fish (13.8%; 95% CI 12.9%–14.7%) than hatchery fish (10.6%; CI 10.3%–11.0%). Cormorant predation rates, however, showed the opposite pattern in which hatchery steelhead (7.1%; CI 6.6%–7.6%) experienced higher predation rates than wild steelhead (5.7%; CI 4.9%–6.6%). Also, Schreck et al. (2005) detected no differences between wild and hatchery steelhead survival rates from BON to rkm 89 or to rkm 46.
Avian predation rates were generally greater among steelhead than spring/summer Chinook salmon (Roby et al. 2011b; McMichael et al. 2010). Two possible reasons for this pattern were suggested by McMichael et al. (2010). The first is that steelhead migrate higher in the water column than Chinook salmon and are thus more vulnerable to avian predation. The second is that steelhead contain more energetic content due to their larger size, and thus are more targeted than spring/summer Chinook salmon. The pattern of survival per unit distance observed in steelhead was similar to that of spring/summer

4.32
Chinook salmon in that they both declined the closer they were to the mouth of the CRE. However, there was a steeper decline in survival between rkm 96 and rkm 22 for steelhead than for spring/summer Chinook salmon. Furthermore, avian predation rates from East Sand Island on steelhead were greatest in the middle of the outmigration season (McMichael et al. 2010). Spatially in the LRE and temporally across the season, the lowest survival rates of steelhead generally coincided with where the bird colonies on East Sand Island occur and also with when smolts make up the greatest proportion of the diet of Caspian terns and double-crested cormorants (Bird Research Northwest 2011).
Predation risk of Snake River Basin steelhead by Caspian terns has been determined to be significantly influenced by external condition, length, water discharge, and water clarity (Roby et al. 2011b). Although this study was conducted in the mid-Columbia, the results give us insight into what characteristics of the fish or what environmental conditions increase steelhead vulnerability to predation by Caspian terns. Predation risk increased as external fish condition declined, water discharge decreased, and water clarity decreased. Predation risk was generally positively correlated with fork length, peaked for steelhead measuring 202 mm, above which it became negatively correlated with fork length.
4.2.9.2 Importance to D and Level of Uncertainty
High importance to D and extensive data gaps and uncertainty
This factor is considered to be of high importance to D because of the significant declines in survival across the reaches of the CRE for spring/summer Chinook salmon, steelhead, and fall Chinook salmon, as well as the differential seasonal pattern in travel times and survival rates between barged and ROR Chinook salmon. There are still extensive data gaps and uncertainty because of the lack of differential survival estimates in the CRE between barged and ROR fish for fall Chinook and steelhead. Also, the exact mechanisms of the differential seasonal pattern in travel times and survival rates between barged and ROR Chinook salmon are unknown.
4.2.9.3 Future Research Needs
A high degree of importance and extensive uncertainty make this factor have potentially high implications for management and high priority for research. For a summarized version of future research needs and approaches, please see Table 5.1.
Estimates of differential survival rates in the CRE between barged and ROR fish for steelhead and fall Chinook salmon would fill a large data gap. This research could be conducted in a few years. Additional years of research would provide more insight and help solidify conclusions.
By determining what and how seasonal estuary conditions are associated with the differential survival of barged and ROR fish in the CRE, indices could be developed to determine appropriate times to implement barging. One approach to studying this is to run data analyses and simulations of estuary conditions (e.g., flow, turbidity, and percent smolt in avian predator diets) in relation to seasonal differential survival rates. Furthermore, field surveys and experimental studies can help provide a better understanding of the underlying mechanisms involved with the slower travel rates of barged fish relative to ROR fish. This information could help determine ways of increasing travel rates and possibly lower predation risk. Some hypothesized mechanisms include incomplete smoltification and disease. Also, differences in migratory pathways and swimming depths may also be associated with differential

4.33
susceptibilities of predation. However, methods of modifying migration pathways and swimming depths of fish in the CRE are likely not feasible. Simulation studies are estimated to span a few to several years, while field surveys and experimental studies can span several years to decades. One potential challenge is detecting a sufficient sample of JSATS-tagged fish for which fate within the CRE can reliably be assigned. Another potential challenge is determining indices with sufficient predictive power and time scales of forecast for seasonal management of the transportation program.
One avenue of research that is relatively unexplored is the density-dependent effects from hatchery releases on differential survival rates of barged and ROR fish in the CRE. The timing of hatchery releases could help alleviate predation risk of barged and ROR migrants. Investigating the effects from hatchery releases can include those that occur between the dams that participate in the juvenile fish transportation and BON, as well as those that occur downstream of BON. Data analyses and simulations to investigate these patterns can take a few years. Although barged and ROR Snake River Basin fish may experience reduced predation risk with the protection in numbers from other hatchery fish, these benefits may be counteracted by increased competition for food resources. Investigation of these indirect effects may take another few years.
4.2.10 Oceanic Conditions ⑨
Hypothesis – Arrival timing of fish to the ocean affects survival through seasonal patterns of onset of upwelling, spring productivity, arrival of ocean predators, and alternative prey. (See Figure 4.11.)
Figure 4.11. Seasonally and Interannually Varying Ocean Conditions Affect Ocean Survival of ROR
and Barged Fish
The arrival time of fish to the estuary (and essentially the ocean) can affect their survival rate (Scheuerell et al. 2009). Using data on Chinook and steelhead detected at BON from in-river passage, Scheuerell et al. (2009) found estuary arrival data (y and y2) were among the best predictors of SAR. Metrics indicating the status of the Pacific decadal oscillation in April, May, and June were determined to be significant predictor variables for adult returns and were also important in a population viability analysis (Zabel et al. 2006). Upwelling in April, September, and October also correlated with the spring Chinook time series return model (Scheuerell and Williams 2005). Spring and fall ocean upwelling is strongly correlated with smolt-to-adult survival (Scheuerell et al. 2005). In a more recent study, survival rates for Chinook salmon and steelhead decreased under warm ocean conditions and reduced spring upwelling (Petrosky and Schaller 2010). Furthermore, annual patterns of good and bad ocean conditions coupled with population density effects can strongly influence salmonid survival (Levin et al. 2001; Zabel et al. 2006). In general, upwelling conditions, populations of predators, density-dependent effects, and forage base are thought to be factors affecting the survival of juvenile salmon and steelhead when they enter the ocean.

4.34
The Columbia River plume is a habitat where juvenile salmonids can complete smoltification, grow by consuming the abundant and localized plankton, and find refuge from marine predators in the turbid, sediment and nutrient-rich water (NOAA 2007; De Robertis et al. 2005; Carter et al. 2009). But the pattern of highly abundant juvenile salmonids in the plume relative to marine waters appears to be ephemeral. Outside of the plume, juvenile salmonids tend to be larger while inside the plume, they tend to still be undergoing physiological adaptation to seawater and are of sizes susceptible to predation (Fisher and Pearcy 1995; De Robertis et al. 2005). Juvenile salmonids generally occupy the plume, but this pattern is not consistent across species or years, and fish outside the plume tend to have fuller stomachs. Ocean conditions can affect the critical size and critical period effects on salmon growth and survival (see Section 4.2.3.5 for more information). Furthermore, evidence for significant marine predation on salmonids that have migrated through the FCRPS has not been established (Emmett et al. 2006, 2008). The high variability in forage fish and zooplankton abundance over short time periods can make it difficult to determine the amount of effect from bottom-up and top-down ecological processes (Emmett and Muir 2009). Preliminary results suggest that the size of yearling Chinook salmon at ocean entry, determined through scale analysis, influences marine survival (Emmett and Muir 2009). Also, competition and predator aggregations appear to negatively affect ocean survival, and with influences from density-dependent effects and climatic conditions (see presentation abstract by K. Holsman in Appendix D).
4.2.10.1 Importance to D and Level of Uncertainty
High importance and extensive data gaps and uncertainty
We consider this factor to be of high importance because of the strong effects of ocean conditions on SARs. As well, there are extensive data gaps and uncertainty in the mechanisms that drive differential survival between barged and ROR fish.
4.2.10.2 Future Research Needs
A high degree of importance and extensive uncertainty make this factor have potentially high implications for management and high priority for research. For a summarized version of future research needs and approaches, please see Table 5.1.
By determining how seasonal and inter -annual ocean conditions are associated with D, indices could be developed to help determine when and under what conditions an effective execution of the juvenile fish transportation program would result to help increase SARs. Some indices include turbidity, upwelling, forage fish, and piscivorous fish. Retrospective data analyses and model simulations can help determine the patterns and degrees of uncertainty related to these time-sensitive forecasts. These analyses can take a few years to execute, and would need to be refined with ocean condition and SAR data collected over the next decades.
4.2.11 Straying and Fallback
Hypothesis – Barging affects in-river homing ability of adults and increases the rate of straying and fallback. (See Figure 4.12.)
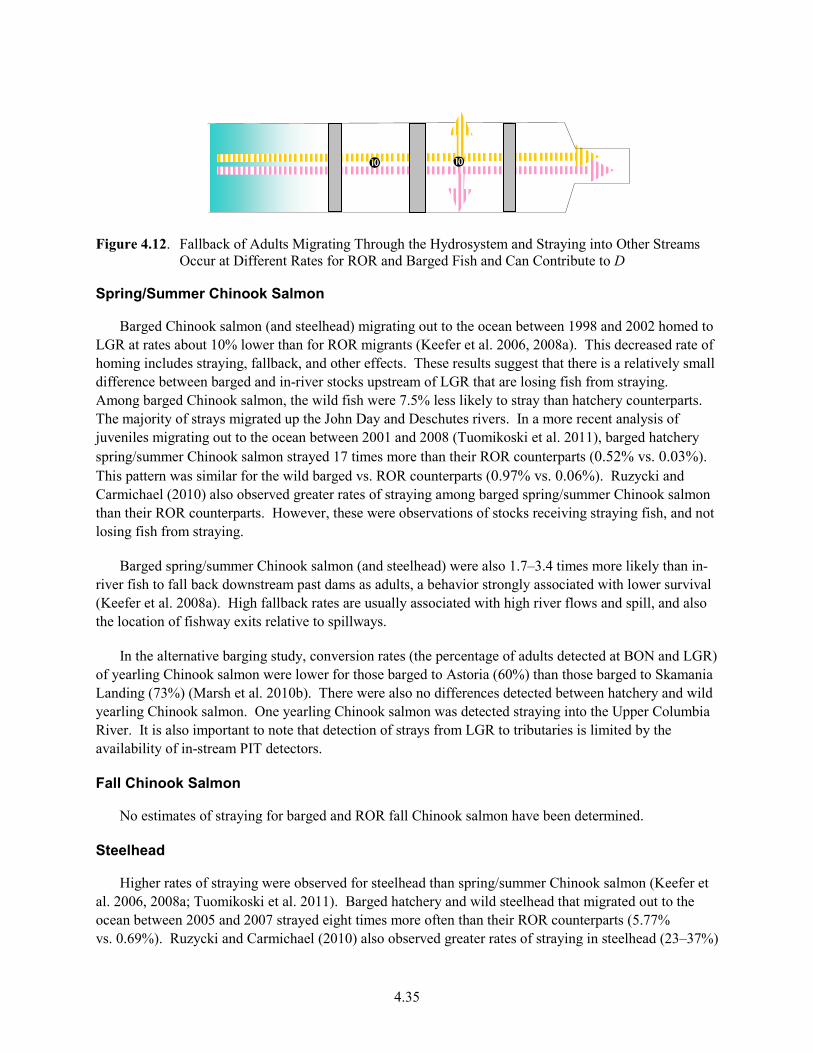
4.35
Figure 4.12. Fallback of Adults Migrating Through the Hydrosystem and Straying into Other Streams
Occur at Different Rates for ROR and Barged Fish and Can Contribute to D
Spring/Summer Chinook Salmon
Barged Chinook salmon (and steelhead) migrating out to the ocean between 1998 and 2002 homed to LGR at rates about 10% lower than for ROR migrants (Keefer et al. 2006, 2008a). This decreased rate of homing includes straying, fallback, and other effects. These results suggest that there is a relatively small difference between barged and in-river stocks upstream of LGR that are losing fish from straying. Among barged Chinook salmon, the wild fish were 7.5% less likely to stray than hatchery counterparts. The majority of strays migrated up the John Day and Deschutes rivers. In a more recent analysis of juveniles migrating out to the ocean between 2001 and 2008 (Tuomikoski et al. 2011), barged hatchery spring/summer Chinook salmon strayed 17 times more than their ROR counterparts (0.52% vs. 0.03%). This pattern was similar for the wild barged vs. ROR counterparts (0.97% vs. 0.06%). Ruzycki and Carmichael (2010) also observed greater rates of straying among barged spring/summer Chinook salmon than their ROR counterparts. However, these were observations of stocks receiving straying fish, and not losing fish from straying.
Barged spring/summer Chinook salmon (and steelhead) were also 1.7–3.4 times more likely than in-river fish to fall back downstream past dams as adults, a behavior strongly associated with lower survival (Keefer et al. 2008a). High fallback rates are usually associated with high river flows and spill, and also the location of fishway exits relative to spillways.
In the alternative barging study, conversion rates (the percentage of adults detected at BON and LGR) of yearling Chinook salmon were lower for those barged to Astoria (60%) than those barged to Skamania Landing (73%) (Marsh et al. 2010b). There were also no differences detected between hatchery and wild yearling Chinook salmon. One yearling Chinook salmon was detected straying into the Upper Columbia River. It is also important to note that detection of strays from LGR to tributaries is limited by the availability of in-stream PIT detectors.
Fall Chinook Salmon
No estimates of straying for barged and ROR fall Chinook salmon have been determined.
Steelhead
Higher rates of straying were observed for steelhead than spring/summer Chinook salmon (Keefer et al. 2006, 2008a; Tuomikoski et al. 2011). Barged hatchery and wild steelhead that migrated out to the ocean between 2005 and 2007 strayed eight times more often than their ROR counterparts (5.77% vs. 0.69%). Ruzycki and Carmichael (2010) also observed greater rates of straying in steelhead (23–37%)

4.36
than in spring/summer Chinook salmon (1.9%) since the year 2000. Again, these were observations of stocks receiving straying fish, and not losing fish from straying. Among barged steelhead, similar rates of straying occurred between hatchery and wild fish. Rates of straying in steelhead increased from 1992 to 2007, after which rates declined. The decline coincides with decreased numbers of barged smolts. These results from Ruzycki and Carmichael support the hypothesis that barging increases straying rates.
Conversion rates were significantly lower for steelhead smolts barged to an alternative site near Astoria (48%) than for those barged to the traditional release site at Skamania Landing (60%) in 2006 (Marsh et al. 2010b). No differences were observed between hatchery and wild steelheads. The majority (64%) of steelhead detected straying were from the barges releasing fish at the alternative site. Most (85%) of the strays were detected in the John Day River. Other tributaries where strays were detected include the Walla Walla, Yakima, and Umatilla rivers. Ten of the 53 strays were eventually detected at LGR. Again, it is important to note that detection of strays from LGR to tributaries is limited by the availability of in-stream PIT detectors.
These results suggest that juvenile transport impaired adult orientation or homing abilities, perhaps by disrupting sequential imprinting processes during juvenile outmigration. Other possible causes of wandering behavior include difficulty in detecting natal streams, evolutionary adaptation to spread to other sites, and use of non-native hatchery broodstock (Ferguson et al. 2005; Keefer et al. 2006). The mechanisms for greater straying among steelhead relative to Chinook salmon are unknown (Ruzycki and Carmichael 2010).
4.2.11.2 Importance to D and Level of Uncertainty
Low importance and limited data gaps and uncertainty (for spring/summer Chinook salmon) Moderate importance and limited data gaps and uncertainty (for steelhead)
The relatively small differences in straying and fallback between barged and ROR spring/summer Chinook salmon over several years of investigation make this factor of low importance to D and with limited uncertainty for this particular species and run. Overall, for ROR spring/summer Chinook salmon, there has been greater concern for stocks receiving strays than the Snake River stocks losing fish from impaired homing abilities. The higher differential rates observed between barged and ROR steelhead make this factor of moderate importance to D.
4.2.11.3 Future Research Needs
For steelhead, a moderate degree of importance and limited uncertainty make this factor have potentially moderate implications for management but low priority for research. Any future research should be directed toward new uncertainties that are identified during the course of management.
For spring/summer Chinook salmon, a low degree of importance and limited uncertainty make this factor have potentially low implications for management and very low priority for research. Relative to the other factors of D considered in this report, future research of Chinook salmon straying is not warranted in relation to D.
Although no estimates of straying and fallback for barged and ROR fall Chinook salmon have been determined, future research to determine these differential rates will likely be difficult. Estimates of D already result in high levels of uncertainty.

4.37
4.2.12 Estimation of Survival and Tagging Effects
Hypothesis 1 – Survival estimates by select passage routes through dams bias D.
Hypothesis 2 – Tag burden affects fish condition, growth, travel time, and indirectly D.
See Figure 4.13.
Figure 4.13. Survival Estimates From Only PIT-tag-detected Fish Bias D Estimates and Tagging Effects
Influence D
Estimation of Survival
Estimates of survival can be biased because they are based on PIT-tagged fish that are detected only when they pass through the bypass system and consequently experience lower survival than fish that pass undetected (i.e., spill or turbine routes). Because of this process, seasonal patterns of T:I have been determined to be biased high. An alternative standard for T:I has been developed to compensate for the bias related to reduced survival of bypassed fish (NOAA 2010). This alternative sets the bar higher than the traditional standard of T:I set at 1.0. Alternative standards ranged from 1.02 to 1.04 for wild Chinook and from 1.03 to 1.11 for wild steelhead at LGR, and from 1.08 to 1.22 for wild Chinook and from 1.08 to 1.31 for wild steelhead at LGS. Because T:I is computed from the point of collection and barging, it includes the survival benefit of barging relative to ROR migration upstream of the release point. For that reason, it tends to be larger than D. Estimates of D could be affected by lower survival rates of ROR migrants that have passed through one or more bypass system(s) relative to those that have never passed through a bypass system (i.e., no detection). These “control” fish have been referred to as C1 and C0, respectively, in CSS studies. Most estimates of D are estimated with C0 migrants, but when the data are not available, combinations of C1 and C0 fish or only C1 are used (e.g., during the low flow, low spill, and high transport year of 2001) (Petrosky 2010; Tuomikoski et al. 2010; Wilson 2010). The choice of which control fish type to use also relates to whether the study is intended to compare transport to fish that have never been collected (C0; unavailable for transport) or to fish that have been collected (C1) and must be either transported or returned to the river. For relative comparisons, it is helpful to begin with equivalent groups at hatchery release so that SARs can be compared among ROR and barged migration histories with less uncertainty about other factors.
Tagging Effects
A general assumption in estimating survival is that the tagged population is representative of the whole population. There is always a concern that tagging will influence the performance of fish in a study, but the relative differences in survival between barged to ROR fish are what’s important to understanding D. Differences between tagged and non-tagged fish (Appendix C) are likely to affect
4.38
estimates of D only if barged and ROR migrants were affected differently by tagging. Furthermore, while tag sizes have been decreasing over time, the exclusion of fish too small to tag without exceeding the accepted limits of tag burden could bias estimates of D. There are many other aspects of good experimental design that help avoid biased results in any study, and tagging studies would require just as much care in that regard as any other approach.
PIT Tags
The small size of PIT tags means that they typically compose a small fraction of the body mass of a tagged fish. In spite of the relatively low body burden that PIT tags create, it is still wise to consider whether these tags or the process of tagging may influence survival rates or study outcomes. Tag loss and decreased survival of PIT-tagged fish, two potential sources of bias, were found by Knudsen et al. (2009). Estimates of the SARs of PIT-tagged migrants were reduced by 25% on average because of tag loss and reduced survival, relative to non-PIT-tagged (NPT) fish on the basis of coded wire tag (CWT) results. After correcting for tag loss, PIT-tag-induced mortalities were as great as 33.3% (10.3% across brood years 1997–2001). Also, mean lengths and weights of PIT-tagged fish were generally lower than NPT fish, and significantly so for age-4 adults. Although these findings suggest a potential for a negative bias in SAR estimates using PIT-tagged fish, it is possible for estimates of D that are based upon those SARs to be biased in either direction, or to be unbiased if these factors cancel out between barged and in-river groups.
Acoustic Tags
Juvenile salmon migrants tagged with ATs, which are typically larger than a PIT, were generally more affected than PIT-tagged migrants. AT-tagged migrants had less visible fat than PIT-tagged migrants (Rub et al. 2009). Liver and kidney discoloration and abnormalities were more prevalent in AT-tagged migrants than in PIT-tagged migrants. Slower travel rates were observed in AT-tagged migrants than in PIT-tagged subyearling migrants. Among subyearlings, AT-tagged migrants had lower survival than PIT-tagged migrants at LGS and MCN. In laboratory holding experiments, survival was lower among AT-tagged yearlings and subyearlings than among their PIT-tagged counterparts after 14, 28, and 90 days of holding. Growth tended to be greater after 90 days of holding among surviving PIT-tagged migrants than AT-tagged migrants. Brown et al. (2010) also determined lower growth and survival rates over 30 days in fall Chinook salmon of 80- to 89-mm fork length with acoustic microtransmitter tag burdens > 8.2% and > 6.7%, respectively. However, a number of studies have also observed no effect of acoustic tags on swimming performance, survival, travel times, detection probabilities, and avian predation rates (Anglea et al. 2004; Brown et al. 2006; Hockersmith et al. 2008; Chittenden et al. 2009; see Appendix C). The influence of ATs on estimates of D would depend upon whether the potential effects were realized differently in barged and ROR fish.
Radio Tags
Radio tags are also typically larger than PIT tags. Unlike PIT or AT tags, radio tags typically have an external antenna that must be accommodated in attaching or implanting the tag in a fish. Radio-tagged fish had greater survival rates than AT-tagged fish travelling between BON and the estuary at rkm 46 (Schreck et al. 2005). Also, differences in migration rate between radio-tagged and acoustic-tagged yearling Chinook salmon could be attributed to a tagging effect or efficacy of detecting slow fish. As for

4.39
the other tag types, the influence of radio tags on estimates of D would depend upon whether the effects of tags were realized differently between barged and ROR groups.
4.2.12.2 Importance to D and Level of Uncertainty
Estimation of survival - Low importance and extensive data gaps and uncertainty Tagging effects – Low importance and extensive data gaps and uncertainty
Estimates of D with a higher alternative standard to compensate for bypass effects could be determined; but at this point, there are extensive data gaps and uncertainty related to this.
Tagging is considered to be of low importance to D because most studies have found no differences in the behavior, growth, and survival between untagged fish and PIT-, AT-, or JSATS-tagged fish that occur across a time period equivalent to the differential travel time through the FCRPS between barged and ROR fish hydrosystem passage (Appendix C).
4.2.12.3 Future Research Needs
A low degree of importance and high degree of uncertainty make this factor have potentially low implications for management and low priority for research. Because D is a ratio of two survivals, it is unclear how relatively small changes in bias from tagging would affect the ratio. Future research is not warranted.
4.3 Interaction of Fish Condition Versus Environmental Factors Affecting D
The condition of a fish influences its ability to respond to its environment. When factors affecting fish condition influence the relative ability of barged and ROR fish to respond to factors in their environment, the result is an interaction of these factors. The following sections evaluate some interactions among factors that are hypothesized to influence D.
Survival from smolt to adult is the result of a fish’s condition or behavior and its interactions with environmental factors. Table 4.2 tabulates those interactions and provides qualitative estimates of their potential magnitude of influence on D.

4.40
Table 4.2. Interactions Between Snake River Basin Fish Condition/Behavior and Environment. Dots qualitatively represent potential magnitude of effect on D.
Fish Condition/ Behavior
Environment
Prehydrosystem Conditions
Dam Operations
Barging Conditions
Lower River
Conditions & Predation
Estuarine Conditions
& Predation
Oceanic
Conditions
Arrival Time &
Travel Time
Achord et al.
2003
Schaller et al. 2007
Scheuerell et al. 2009; Eder et al.
2009a ; McMichael et al. 2010
Scheuerell et al.
2009
Length
Crozier et al.
2010
Zabel et al. 2005
Muir et al. 2006
Muir et al. 2006
Physiology
Budy et al. 2002
Congleton et al. 2000 ;
Budy et al. 2002; Wagner et al. 2004 ; Clemens et al. 2009
Schreck et al. 2006
De Robertis et al.
2005
Disease
Dietrich et al.
2011
Elliott et al. 1997;
Arkoosh et al. 2006; Van Gaest et al. 2011
Dietrich et al. 2010, 2011; Arkoosh et al.
2006; Van Gaest et al. 2011
Dietrich et al. 2008; Eder et al. 2009a, b
Straying & Fallback
Keefer et al. 2008a;
Ruzycki and Carmichael 2010; Tuomikoski et al.
2010
Survival
estimation and Tagging effects
NOAA 2010;
Buchanan et al. 2011
Knudsen et al. 2009;
Rub et al. 2009; Brown et al. 2010

4.41
4.4 Seasonal (Within-year) and Inter-annual (Across-year) D Patterns 4.4.1 Seasonal Pattern of Factors Affecting Survival of Barged and ROR Fish
Each of the graphs in Figure 4.14 addresses the hypothesized seasonal pattern of a different factor affecting the survival of barged and ROR fish, as follows:
• Graph A (fish length) indicates that ROR fish grow as they migrate through the hydropower system and are approximately the same size at BON throughout the season (Muir et al. 2006; Dietrich et al. 2007). Barged fish lose this opportunity to grow during hydrosystem passage, but still increase in size throughout the season. The survival rate generally increases with the relative length of the fish (Zabel and Achord 2004).
• Graph B (osmoregulation) indicates that ROR fish have high osmoregulatory ability throughout the season (Congleton et al. 2005). Barged fish increase in osmoregulatory ability throughout the season (Eder et al 2009a). The survival rate increases with osmoregulatory ability.
• Graph C (energy density) indicates that while hatchery ROR fish deplete their energetic reserves as they migrate through the hydropower system, the rate of decline exhibits no seasonal pattern (Congleton et al. 2005). Barged fish have a negligible loss. The parallel lines of energy density when plotted against arrival time at BON suggest that these factors do not interact. The survival rate is hypothesized to increase with energetic reserves.
• Graph D (disease susceptibility) indicates that although rates are variable, the pathogen prevalence in ROR fish generally decreases throughout the season (Dietrich et al. 2008), while in barged fish it generally increases (Eder et al. 2009b). Survival is hypothesized to decrease as disease susceptibility increases. However, the decreasing trend in disease susceptibility throughout the season in ROR fish may be due to culling of weak and diseased fish. As well, increased disease-related mortality in barged fish than ROR fish may be due to the fish’s condition prior to hydrosystem entrance (Dietrich et al. 2011).
• Graph E (LRE travel time) indicates that travel time in the LRE is greater in barged fish than ROR spring/summer Chinook salmon (Ledgerwood et al. 2007; Carter et al. 2009; Eder et al. 2009a; McMichael et al. 2010). Throughout the season, travel time decreases, especially in barged spring/summer Chinook salmon. Steelhead, on the other hand, do not differ in migration rate between barged and ROR migrants (Ledgerwood et al. 2007). Longer residence time generally increases susceptibility to predation and hence decreases survival.
• Graph F (density of birds) indicates that the predation intensity on barged and ROR fish increases then decreases throughout the nesting season of Caspian terns and cormorants, and concurrent to the salmonid outmigration run. The seasonal pattern of juvenile salmonid survival is affected by the seasonal pattern of the intensity of bird predation on salmonids.
• Graph G (alternative marine prey) represents the hypothesized increase in the survival rate of juvenile salmonids as the number of alternative marine prey increases. Although the high variability in alternative marine prey over short time scales can occur (Emmett and Muir 2009). Recent research shows that forage fish densities negatively affect SARs through possibly competitive effects or attraction of marine predators (Appendix D; Holsman et al. submitted).
• Graph H (upwelling) represents the hypothesized dependence of spring and summer growth and survival of juvenile salmonids in the ocean on the plume and nearshore forage base, which in turn depends on the cumulative upwelling prior to and during their ocean entry (Pearcy 1992; De Robertis et al. 2005). The thick line represents the averaged upwelling across the outmigration season.

4.42
Figure 4.14. Seasonal Pattern of Factors Affecting Survival of Barged and ROR Migrants
Arrival time at BON
F
ish
leng
th
Surv
ival
ROR
Barged
Arrival time at BON
O
smor
egul
ator
y st
atus
Surv
ival
ROR
Barged
Arrival time at BON
F
ish
ener
gy d
ensi
ty
Surv
ival
ROR
Barged
Arrival time at BON
Dis
ease
susc
eptib
ility
Surv
ival
ROR
Barged
Arrival time at BON
L
RE
Tra
vel t
ime
Surv
ival
ROR
Barged
Arrival time at BON
P
opul
atio
n de
nsity
of
bird
s or
salm
onid
s Su
rviv
al
ROR Barged
Arrival time at BON
P
opul
atio
n de
nsity
of
alte
rnat
ive
prey
or s
alm
onid
s
Surv
ival
Arrival time at BON
C
umul
ativ
e up
wel
ling
ROR
Barged
Surv
ival
Piscivorous birds
A B
C D
E F
G H
ROR Barged
Alternative marine prey
(as t
ern
popu
latio
n de
nsity
incr
ease
s)
(as a
ltern
ativ
e pr
ey in
crea
se)
0 –

4.43
Estimates of SARs for groups of migrating juvenile salmon can vary widely across a season. As these SARs vary differently for barged and ROR migrants, D also varies. D for spring/summer Chinook salmon and steelhead is generally below 1 in the early season, increases to above 1 beginning in late April to early May, and drops at the end of the outmigration season (Anderson et al. 2005; Figure 4.15).
In Period I of Figure 4.15, where D is < 1, we hypothesize barged spring/summer Chinook salmon and steelhead to be relatively small, to exhibit low levels of osmoregulation, to have slow travel rates in the LRE, and to have greater susceptibility to predation in the LRE than their in-river migrating counterparts. Thus, barged fish have lower survival rates than ROR fish.
In Period II, where D is ≥ 1, energetic reserves of ROR fish decrease while those of barged fish remain high and cumulative upwelling increases. Also, barged fish increase in their osmoregulatory ability and length, and decrease in their travel time in the LRE. All of these factors are hypothesized to result in higher survival rates in barged fish than in ROR fish.
In Period III, where D is again < 1, we hypothesize that the increased surface-water temperatures result in higher rates of disease and energy loss among barged fish. Thus, barged fish have lower survival rates than ROR fish. D for fall Chinook salmon is likely lower than 1. We hypothesize that in Period III of Figure 4.15 where D < 1, the low survival rates of barged fish relative to ROR fall Chinook salmon are caused by high surface-water temperatures, which decrease the condition and energetic reserves of barged fall Chinook salmon and increase disease prevalence.
Mechanisms contributing to the seasonal pattern of D discussed above were also stated in Section 3.7 of the 2004 CSS Workshop (Marmorek et al. 2004) under Hypothesis 2.2b, “The hydrosystem indirectly affects smolt-to-adult survival [rate](SAR) by changing and delaying the smolt development processes, through both altered timing of entry and stress.” As depicted in Figure 4.14, the fish’s condition and the environmental conditions are changing over the season; and the entirety of these interactions affect the seasonal patterns of D, with certain factors playing more influential roles in some years than others.
4.4.2 Inter-annual Variability
Studies have shown that inter-annual variability (i.e., differences between years) in SARs is related to ocean/climate conditions (Scheuerell and Williams 2005; Zabel et al. 2006; Petrosky and Schaller 2010), which supports the theory of year-class strength being associated with the first year in the ocean (Pearcy 1992; Gargett 1997; Beamish and Mahnken 2001). Levin et al. (2001) hypothesized that survival of wild spring Chinook is negatively correlated with the population of hatchery spring Chinook salmon in years with poor ocean conditions. High correlations between SARs and ocean upwelling in the spring and fall were also determined in a time-series model (Scheuerell and Williams 2005). Petrosky and Schaller (2010) found that lower SARs from 1964–2006 of wild spring/summer Chinook salmon and steelhead were associated with warm ocean conditions and reduced spring upwelling. In contrast, Scheuerell et al. (2009) determined that year was relatively the most important variable tested in their models of Chinook salmon and steelhead SARs. They found that models that included year and estuary arrival time performed better than models that included temperature and upwelling. Thus, significant inter-annual effects (i.e., year model parameter) on SARs occur in addition to explicitly tested factors. Furthermore, Deriso et al. (2001) found that inter-annual effects on the survival of spring/summer Chinook salmon can be uncorrelated to factors such as water travel time, the North Pacific Index, and an upwelling index. The existence of unidentified and unpredictable factors that have a strong influence on survival contribute to a more noisy set of results with which to evaluate D.
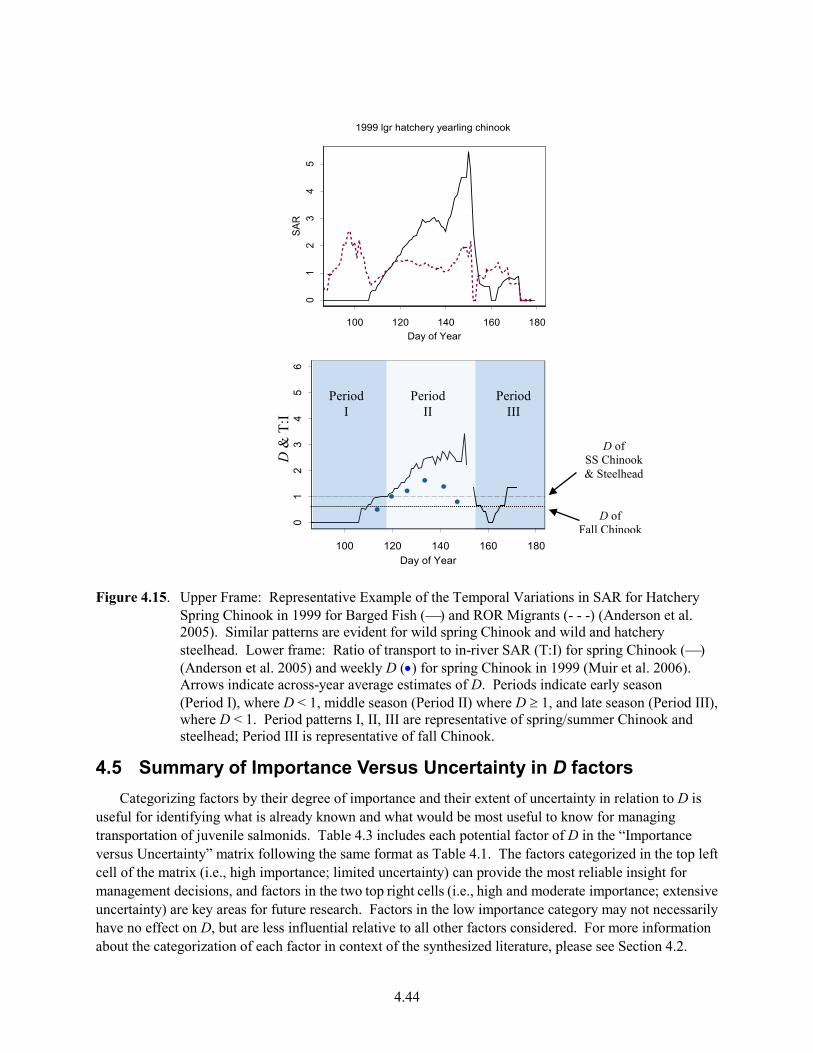
4.44
Figure 4.15. Upper Frame: Representative Example of the Temporal Variations in SAR for Hatchery
Spring Chinook in 1999 for Barged Fish () and ROR Migrants (- - -) (Anderson et al. 2005). Similar patterns are evident for wild spring Chinook and wild and hatchery steelhead. Lower frame: Ratio of transport to in-river SAR (T:I) for spring Chinook () (Anderson et al. 2005) and weekly D (•) for spring Chinook in 1999 (Muir et al. 2006). Arrows indicate across-year average estimates of D. Periods indicate early season (Period I), where D < 1, middle season (Period II) where D ≥ 1, and late season (Period III), where D < 1. Period patterns I, II, III are representative of spring/summer Chinook and steelhead; Period III is representative of fall Chinook.
4.5 Summary of Importance Versus Uncertainty in D factors Categorizing factors by their degree of importance and their extent of uncertainty in relation to D is
useful for identifying what is already known and what would be most useful to know for managing transportation of juvenile salmonids. Table 4.3 includes each potential factor of D in the “Importance versus Uncertainty” matrix following the same format as Table 4.1. The factors categorized in the top left cell of the matrix (i.e., high importance; limited uncertainty) can provide the most reliable insight for management decisions, and factors in the two top right cells (i.e., high and moderate importance; extensive uncertainty) are key areas for future research. Factors in the low importance category may not necessarily have no effect on D, but are less influential relative to all other factors considered. For more information about the categorization of each factor in context of the synthesized literature, please see Section 4.2.
100 120 140 160 180Day of Year
01
23
45
SAR
1999 lgr hatchery yearling chinook
100 120 140 160 180Day of Year
01
23
45
6T:
I
D &
T:I
D of SS Chinook & Steelhead
D of Fall Chinook
Period I
Period II
Period III

4.45
Table 4.3. Factors of D Categorized by Degree of Importance to D and Extent of Data Gaps and Uncertainty. Includes Supporting References
Limited Data Gaps
and Uncertainty Extensive Data Gaps
and Uncertainty
High Importance to D
Hydrosystem arrival time & travel time (Connor et al. 2004; Connor et al. 2005; Schreck et al. 2006; Clemens et al. 2009; Eder et al. 2009; Scheuerell et al. 2009)
Fish length (Zabel and Williams 2002; Congleton et al. 2003; Connor et al. 2004; Zabel and Achord 2004; Williams et al. 2005; Zabel et al. 2005; Muir et al. 2006; Eder et al. 2009b)
⑤ Dam operations (ISAB 2008a; Zabel et al. 2008; ISAB 2010; NOAA 2010)
⑧ Estuary conditions and predators (Schreck et al. 2006; Roby et al. 2008; McMichael et al. 2010; Roby et al. 2011a, b
⑨ Ocean conditions (Scheuerell and Williams 2005; Zabel et al. 2006; Keefer et al. 2008b; Scheuerell et al. 2009)
Moderate Importance to D
Adult straying in steelhead (Keefer et al. 2008a; Ruzycki and Carmichael 2010)
Pre-hydrosystem conditions (Zabel and Williams 2002; Achord et al. 2003; Connor et al. 2003; Smith et al. 2003; Achord et al. 2007; Sykes et al. 2009; Tiffan et al. 2009; Crozier et al. 2010)
Fish physiology (Budy et al. 2002; Congleton et al. 2001, 2003, 2005; Schreck et al. 2006; Dietrich et al. 2007, 2008; Eder et al. 2009b)
Disease (Arkoosh et al. 2006 ; Dietrich et al. 2007 ; Dietrich et al. 2008 ; Mesa et al. 2008 ; Eder et al. 2009a, b ; Marsh et al. 2010b; Dietrich et al. 2011; Van Gaest et al. 2011)
⑥ Barging conditions – density; alternative barging strategy; warm surface water (Congleton et al. 2000; Wagner et al. 2004; Congleton et al. 2005; McMichael et al. 2007; Ryan et al. 2007; Marsh et al. 2008; Clemens et al. 2009; Marsh et al. 2010b; Sandford et al. 2012)
⑦ Lower river conditions and predators in fall Chinook (Schreck et al. 2005; Clemens et al. 2009)
Low Importance to D
⑥ Barging conditions – dissolved metals, disrupted auditory senses (Halvorsen et al. 2009)
⑦ Lower river conditions and predators in spring/summer Chinook and steelhead (Schreck et al. 2005; Schreck et al. 2006; Mesa et al. 2008; Clemens et al. 2009)
Adult straying in Chinook (Keefer et al. 2008a; Ruzycki and Carmichael 2010)
Tagging effects & estimation of survival (Anglea et al. 2004; Brown et al. 2006; Hockersmith et al. 2008; Chittenden et al. 2009; Knudsen et al. 2009; Rub et al. 2009; Brown et al. 2010; NOAA 2010)

4.46
4.6 Conclusion About the Synthesis of Literature on D
Many factors have been hypothesized to play a role in D, and multiple factors are involved. Seasonal trends transpire in many of these factors, including hydrosystem arrival timing, travel time, fish length, estuarine conditions, and avian predation. Annual variation also occurs and is largely important in ocean conditions. It is clear that to predict D, multiple factors need to be considered in the same framework, and a hazard model is a good conceptual starting point. Furthermore, the analysis from the culling model demonstrates that the effect of heterogeneity in fish condition on delayed mortality and D can be formulated in a mathematically tractable and realistic manner. The examples presented suggest that the effects of hydrosystem passage on survival capacity, expressed as vitality, and the subsequent effect of vitality on post-hydrosystem survival are likely to be important in determining SARs and D.
The literature provides ample support for the potential of many factors to either 1) influence the actual value of D, or 2) influence our ability to estimate D. One challenge in understanding whether a change will increase or decrease D is that many of these factors have the potential to alter the actual or estimated SARs of both barged and ROR fish. A clear understanding of how barged and ROR fish will differ in their responses for most factors is lacking to date. Without that understanding, it will be difficult to predict the direction of change in D, and even more difficult to predict the magnitude of that change. If the changes in D for management’s actions are difficult to predict, it will be necessary to monitor D through time after changes are implemented and adaptively manage D as results become known.
5.1
5.0 Identifying Research Needed to Support Management
With the goal of determining how D can be used to evaluate and increase the benefits of the Juvenile Fish Transportation Program and ultimately increase SARs, we consider key management questions related to barging operations and broad research approaches in Section 5.1, and then specific research questions in Section 5.2. We first present the main management questions of "When to Barge?", "What Proportion of Fish to Barge?", and "Which fish to barge?" in a flow chart, and suggest how the existing methods of transport decisions can be improved. We then delve into more detail about research approaches that target mechanistic processes that are hypothesized to underlie patterns of D, and that could ultimately help improve SARs. We suggest that future research can help develop real-time management of the transportation program in which within-season data collection of environmental and fish conditions help predict when it is most optimal to transport fish and help increase their SARs (Section 5.2.2).
5.1 Addressing Key Management Questions
Traditionally, transport decisions included increasing transportation and reducing spill in low flow years and beginning on a fixed transport date based on historical, seasonal patterns of T:I (Figure 5.1). We suggest four alternative ways of implementing transport decisions: 1) selecting transport dates based on the environmental conditions in the river, estuary, and ocean, 2) selecting when to barge fish based on their condition (e.g. lipid content, disease, and stock), 3) selecting transport dates based on both environmental and fish conditions, and 4) selecting which collected fish to transport based on their size. In the next subsections, we synthesize the research related to several key management questions. Also, there are many aspects of D where uncertainties could be addressed, but it is those factors with moderate and high importance to D where uncertainties remain that provide the greatest potential for helping improve management actions.
5.1.1 When to Barge
Overall, the data and analyses available show that D increases throughout the season (Anderson et al. 2005; NOAA 2010). Thus, the current strategy is to begin transportation at LGR generally around May 1 and stagger the initiation of barging at lower dams. In some years, the seasonal pattern is more pronounced than in others, some recent analyses suggest that barging can occur before May 1 while maintaining T:I above 1 (NOAA 2010). Although the NOAA (2010) report was an opportunistic analysis of data currently available, this preliminary conclusion may be enough to instigate a need for more formal analyses to re-examine the appropriate time to begin barging. Also, with the recently implemented spill-transport program, we believe a seasonal analysis of D that encompasses recent management actions is warranted.
Suggested method of transportation decision: selecting a transport start date that depends on within-season river, estuary, and ocean conditions and also fish conditions.
Main research needed: Within-season data collection of environmental conditions and fish conditions to develop a predictive model of D and SARs.
Related specific research questions in Table 5.1: Questions number 1-3, 5, 7-9.

5.2
Figure 5.1. Flow Chart of General Management Decisions related to the Juvenile Fish Transportation Program. Existing methods of transport
decisions are in black text and suggested alternatives are in blue text.
River
Barge
To barge or not?
River Proportion to spill?
Fish collected (Bypass system)
Fish pass dam (spill, turbine, etc.)
Existing Transport Decision: Determine proportion spill (and proportion transported) according to river conditions (e.g. flow and temperature).
Existing Transport Decision: Determine fixed transport start date based on historical, seasonal patterns of T:I.
Suggested Alternatives of Transport Decisions: 1) Select transport dates based on
environmental conditions of the river, estuary, and ocean.
2) Select transport dates based on fish condition (e.g. lipid content, disease, stock).
3) Select transport dates based on both environmental (river, estuary, and ocean) and fish conditions.
Which
to barge?
4) Sort and select which fish to transport based on their size (and indirectly to some degree species and rearing type).
Legend Location of fish
Decision point

5.3
5.1.2 What Proportion of Fish to Barge
In general, transporting fish increases SARs relative to their in-river migrating counterparts based on estimates of T:I (Sandford and Smith 2002; Anderson et al. 2005; Williams et al. 2005; NOAA 2010; Tuomikoski et al. 2010). However, as spill increases, the relative benefit of transportation in terms of SARs decreases because of the increased survival of in-river migrants (ISAB 2010). Since 2006, a mixed strategy of spill and transport has been implemented to “spread the risk” among species and runs (e.g., lamprey and salmonids including Snake River sockeye salmon and Middle Columbia steelhead; ISAB 2008, 2010). Even in the 2007 and 2010 spring seasons of low flow, when transportation was thought to be most beneficial to the SARs of salmon relative to in-river passage, the spill-transport strategy was still implemented to “spread the risk” and to obtain additional data to help evaluate how flow affects in-river survival, T:I, and D. Results from these 2 years of low flow with spill will most importantly help determine whether a strategy of no spill and full transport yields higher SAR, T:I, and D rates than those from a mixed strategy of spill-transport. The various spill-transport operations will also help fill in data gaps across years of moderate and high flow.
Suggested method of transportation decision: Selection proportion spill and proportion of fish transported based on environmental conditions.
Main research needed: Data analysis and simulations of how flow, spill, proportion transported, water temperature, etc. affect fish survival through and after the FCRPS (e.g. COMPASS model). Additional data collected for scenarios such as low flow with spill through adaptive management.
Related specific research questions in Table 5.1: Question number 6.
5.1.3 Which Fish to Barge
Some species, runs, and rearing types of salmonids benefit more from the barge transportation program than others by exhibiting resultant higher SARs (Table 2.1). Based on estimates of D and T:I, steelhead benefit more from the transportation program than spring/summer Chinook salmon. Furthermore, hatchery spring/summer Chinook salmon benefit more from the transportation program than their wild counterparts. For fall Chinook salmon, it is largely unknown whether barge transportation increases their SARs relative to in-river migrants. One challenge is that the fish arriving at the hydrosystem are a mixed population, so that one mitigation strategy may not work for all species and rearing types of fish. It has been hypothesized that large-sized spring/summer Chinook salmon benefit from the barging program, while the small-sized ones do not (Appendix E). The relationship between size and survival may not be linear, but may significantly increase beyond a critical size threshold (Gregor Passolt, Univ. of Washington MS Thesis in progress). Sorting by size during collection at the transport dams could help separate fish also by species and rearing type so that those for which transportation is beneficial are diverted onto barges.
Suggested method of transportation decision: Separating fish by size and transporting fish greater than a critical size threshold that relates to higher D and SARs.
Main research needed: Determining a critical fish size threshold above which D and SARs are significantly increased. Test a prototype separation by size facility.
Related specific research question in Table 5.1: Question number 1

5.4
5.1.4 Where to Begin Barging Although there is generally a benefit to transporting at the lower dams for hatchery spring Chinook
salmon and steelhead in terms of adult returns, there is little support for or against the hypothesis that D is different across the three uppermost dams of the FCRPS with the limited analyses tested specifically to determine where it is best to begin transporting fish and given the large amount of uncertainty in these estimates. From 1994 to 2000, D values across LGR, LGS, and LMN decreased because the barge-loading site was further downstream for hatchery spring/summer Chinook (Williams et al. 2005). But the trend was of the opposite pattern for wild steelhead. No trend was apparent for wild spring/summer Chinook and hatchery steelhead. An opportunistic analysis of current data available for spring/summer Chinook salmon and steelhead transported from LGR and LGS showed no difference in D estimates by transport site when the confidence intervals were taken into consideration (NOAA 2010). With improvements in the structure and operations in the FCRPS in the last decade, a more recent analysis of D by transport site is to a certain extent warranted.
5.1.5 How to Barge Different barging conditions include fish densities, water exchange rates, fish release sites, timing of
releases relative to the time of day and tidal cycles, and duration of barge trips. Barging conditions found to be most conducive in minimizing transmission of pathogen among barged fish were low densities (< 0.3 lb/gal) and high water-exchange rates (5.5 exchanges per hour) (Dietrich et al. 2010). During periods of high surface-water temperature replenishing barge water with cooler water drawn from below may lessen stress on fish. This may be most advantageous when barging fall Chinook in the late spring and summer. Data and results are still being collected and analyzed for the investigation of the alternative barging strategy in which fish were released at rkm 10 instead of rkm 225. Preliminary results show that predation rates in the CRE were greatly reduced. Based on the relative adult return rates, barging to the alternative site was beneficial for steelhead but not for spring/summer Chinook salmon. However, increased rates of straying of steelhead were observed. Overall, relative to the research currently being conducted and to other research needs, investigating how to barge fish in order to increase D and SARs is moderate in importance.
5.1.6 What Environmental Conditions Increase Barging Success? As noted in Section 5.1.1, when barging is beneficial to fish post-BON survival depends on the
environmental conditions and fish conditions. Many environmental factors have the potential to influence the success of the Juvenile Fish Transportation program in increasing SARs. It is important to consider whether management actions can influence those factors and improve the SARs of fish. The environmental conditions in two different environments (upstream and through the FCRPS; Post-FCRPS) are considered below.
5.1.6.1 Conditions Upstream of and Through the FCRPS
It has been demonstrated that the conditions upstream of and through the FCRPS can affect the physiological condition, disease susceptibility, and post-hydrosystem survival of fish with barge and in-river passage histories. The short (1.5 days) passage by barge transportation through the hydropower system has been shown to result in sometimes lower osmoregulatory ability relative to ROR migrants (Dietrich et al. 2008; Mesa et al. 2008). Increased mortality from disease has been observed in barged fish relative to ROR fish (Dietrich et al. 2011). It has been hypothesized that incomplete smoltification, stress, and disease cause fish to swim higher in the water column at the freshwater-seawater interface in

5.5
the estuary, and consequently increase avian predation risk (Price and Schreck et al. 2003; Schreck et al. 2006). Also, first year ocean survival rates were negatively related to slower river velocity and warmer river temperatures (Petrosky and Schaller 2010). Thus, ways to increase smoltification, decrease stress, and decrease disease in fish prior to and during hydrosystem passage will likely increase their survival. For more information about fish physiology and disease related to D, see Sections 4.2.4 and. 4.2.5.
It is possible that minimizing the stress and disease upstream of and throughout the hydrosystem could reduce fish mortality passing through the LRE. However, this remains to be tested and could be challenging. Also, improvements to the structure of the dams, such as spillway weirs, are thought to decrease the delay in the forebays and decrease the stress experienced by migrating juvenile fish. Increasing flow is thought to allow fish to arrive to the estuary and ocean earlier in the season and increase their survival (Scheuerell et al. 2009). Various scenarios of operational conditions have been simulated in the COMPASS model (see Section 4.2.6.2) which can be updated with more recent conditions and additional covariates.
5.1.6.2 Lower River and Estuary
Efforts have been made to minimize overall predation of salmonids by piscivorous fish and birds through the Northern Pikeminnow Program and the Caspian Tern Management to Reduce Predation of Juvenile Salmonids in the Columbia River Estuary Program (USFWS 2005, 2006; Roby et al. 2011a, b). How these programs affect D is unknown.
Furthermore, increased flow has been observed to correlate with increased travel rates of salmonids through the LRE (Schreck et al. 2005; Eder et al. 2009a). Decreased temporal exposure could decrease predation risk in the estuary. The exact effects of increased flow on survival upon ocean entry are unclear but are thought to be related to matching the timing of coastal upwelling, avoiding avian and marine fish predators, and competing with other forage fish for food resources (Pearcy 1992; Scheuerell et al. 2009; Holsman et al. in review).
5.2 Roadmap of Future Research The existing literature about the effectiveness of transporting juvenile salmon and steelhead
documents temporal and spatial patterns of SAR and D. These patterns are evidence that some factors are more influential on D than others. What remains unknown has been ranked by degree of importance and extent of uncertainty to provide a roadmap that can guide future research. The goal of that research is to further improve the ability of fish managers to plan a transportation program that improves adult returns and to provide the understanding necessary to quickly adapt the program as conditions change.
5.2.1 Key Research Questions In general, the synthesis of factors affecting D revealed that in the current transportation program
barging improves post-hydrosystem survival of hatchery and wild steelhead while transportation later in the season improves survival in hatchery spring/summer Chinook salmon, and transportation is detrimental to or has neutral effects on wild spring/summer Chinook salmon and hatchery and wild fall Chinook salmon. In this synthesis report, the hypotheses identified to explain these patterns related to fish condition, fish behavior, and environmental conditions. Some hypotheses are well supported by the research conducted so far, while others that may be important to controlling the patterns of D are not well established. We suggest that improvements in the transportation program require research to further clarify the potentially important, but uncertain hypotheses, and identify which of the underlying factors in all the hypotheses can be addressed by changes in operation of the transportation program to help improve adult returns.

5.6
To assist in identifying future research we constructed a list of questions that cover the extensive data gaps in D mechanisms (Table 5.1), based on the synthesis of the literature, discussions at the workshop, and the categorization of factors in the “Importance versus Uncertainty” matrix. This roadmap is intended to identify the most promising areas of research for improving the ability to select among actions for the management of transportation. In addition, the roadmap is intended to identify studies that can resolve data gaps and key uncertainties related to D as well as identify conditions and practices that could result in higher values of D and SAR of barged fish. The proposed future research falls into the three major categories of 1) fish condition, 2) fish behavior and 3) environmental conditions (Table 5.1). Interactions between these categories occur and are identified within the structure of the roadmap where necessary.
5.2.2 Towards a Real-Time Transportation Program
It is evident from the synthesis that fish condition and behavior and the condition of the environment are dynamic processes that vary throughout the transport season and across years. Fish condition and behavior can vary dramatically across the season as different runs, rearing types, and species enter the hydrosystem. Likewise, the LRE and ocean environments are highly dynamic. The spring transition results in the onset of upwelling and changes in the coastal current structure, while the river flows increase with the spring freshet and then decrease in the summer. Although an improved understanding of these factors and their interactions is expected to increase with the conduct of the research identified in Table 5.1, it is evident that to take advantage of the knowledge and maximize the effectiveness of the transportation program decisions about when and which fish to transport will require real-time information about fish entering the hydrosystem and projections of the LRE and ocean environments when they exit the hydrosystem. Developing such a transportation program will require integration of real-time fish and environmental monitoring programs. Indices to be monitored not only require mechanistic and statistical foundations, they also need to be quickly and routinely measured. Some potential indices that are identified in the roadmap to future research (Table 5.1) include the following:
• fish length • fish physiological condition, e.g., insulin-like growth factor, condition factor • fish pathogen load • water travel time in the lower river downstream of BON and in the CRE • proportion of water spilled across various levels of water flow • timing, location, and number of hatchery releases • biomass of zooplankton • number of forage fishes • number of piscivorous predators in the CRE and coastal ocean.
We anticipate that decisions of which fish and when to transport them will need to be based on predictive models that account for changes in fish condition and culling of weaker fish within and downstream of the hydrosystem (see examples in Section 3.0). In addition, transport decisions to help increase adult returns will require real-time monitoring and predictions of the estuary and coastal ocean environments over times scales of days to weeks, i.e., over the travel times of barged and ROR fish through the hydrosystem. Finally, we envision decisions being implemented via a web-based decision support tool that combines relevant historical and real-time data and predictive models of D and SAR.

5.7
Table 5.1. Key Research Questions of Differential Delayed Mortality with Comments on Relevance to Transportation Program and Research Approaches
D Factor Research Questions
Relevance to Transportation Program Research Approaches
Research Duration Research Challenges
Fish
Con
ditio
n
Fish size Question 1: Is low D expressed in small-sized fish and not in the large-sized fish?
If yes, structures and procedures could be developed to collect larger-sized fish for transport. This would help increase D, improve the effectiveness of the transportation program, and ultimately increase SARs.
Analysis of length and SAR of PIT-tagged fish. Also, determining whether critical sizes are associated with species, runs, and rearing types throughout the season. Determine fish lengths from scales and otoliths.
A few to several years
Measuring length of fish near the times they enter and exit the hydrosystem is difficult. Accounting for growth after measurement may be important. Analysis of fish scales and otoliths may alleviate this challenge.
Physiological Condition
Question 2: What physiological conditions are associated with low D, particularly in the LRE?
A mechanistic understanding would help illuminate processes that influence seasonal patterns of D. Efforts examining physiological indices could be continued to determine appropriate times to barge fish.
Monitoring energetic reserves, degree of smoltification, stress indices, and IGF-1 at LGR, BON, in the LRE (via mobile Separation by Code), and in the coastal ocean Challenge studies in laboratory or field setting can complement PIT-tag surveys of SARs, especially for fall Chinook salmon, which require extensive tagging to obtain reliable SARs.
Several years to decades depending on type of study or monitoring program
Substantial variation can occur in indices of fish physiological condition, making it difficult to relate to SARs and D. Composite variables may help alleviate this challenge (Wagner and Congleton 2004).

5.8
Table 5.1 (contd)
D Factor Research Questions Relevance to Transportation Program Research Approaches
Research Duration Research Challenges
Fish
Con
ditio
n (c
ontd
)
Fish size Question 3: Do pathogens differentially affect post-BON survival of barged and ROR fish?
If yes, procedures could be developed to minimize pathogen transmission during collection and within barges. Barge conditions that minimize pathogen transmission have been determined (Dietrich et al. 2010) and could be implemented. Pathogen controls could be developed if pathogens were determined to be a major contributor to low SARs.
Longitudinal field studies to measure pathogen prevalence and pathogen load of independent but parallel groups of barged fish and their ROR counterparts at LGR, BON, and in the LRE throughout the season.
Several years to decades
Pathogen prevalence varies seasonally, annually, spatially, and across pathogen species, making it challenging to determine effects of pathogens on SARs or D. However, tools are available for determining associations between pathogens and D (see Section 5.1.3; Van Gaest et al. 2011).
Fish
Beh
avio
r
Behavior in the River
Question 4: Is there a collection bias for weaker(a) fish in the juvenile bypass system? If so, does condition cause fish to swim higher in the water column where entrainment into the bypass system occurs?
If yes, a mechanism underlying the procedures of the transportation program that contribute to low D and SARs is revealed. Corrections in biased estimates of D that include undetected fish could be implemented. Also, improvements in the structures and operations could be implemented to help increase adult returns.
PIT-tagging fish over a range of lengths, physiological conditions, and health statuses and releasing them upstream of a dam. Determine the relationship between fish characteristics and probability of entrainment into the bypass system.
Several years Ensuring the passage behavior of test fish mimics that of the run-at-large fish.
Behavior in the Estuary
Question 5: What causes slow travel rates in the estuary in barged fish relative to their ROR counterparts?
A mechanistic understanding of the relatively slow travel rates in barged fish could help determine ways to increase travel rates and possibly lower predation risk.
Determine whether incomplete smoltification, especially in early season barged fish, results in lower travel rates in the CRE.
Several years Sampling JSATS-tagged fish after passage through portions of the CRE may be challenging. Sample sizes may be insufficient for robust conclusions.

5.9
Table 5.1 (contd)
D Factor Research Questions Relevance to Transportation Program Research Approaches
Research Duration Research Challenges
Env
iron
men
tal C
ondi
tions
Mixed Spill-Transport Strategy
Question 6: What are the effects of proportion of water spilled and proportion of fish transported (which are closely linked) on D across a range of flow rates?
Predicted survival rates and D related to this question would help evaluate the mixed spill-transport strategy implemented since 2006. A better understanding of seasonal in-river conditions could also help determine appropriate times to begin and end barging.
Data analysis and simulations (e.g., COMPASS model). Annual and seasonal patterns could be examined.
Several years Uncertainty is an important part of the predicted responses. Expressing the uncertainty in a readily comprehensible way may be challenging. Also, passage improvements will require re-analysis.
Hatchery Releases
Question 7: How do hatchery releases downstream of BON and MCN(b) affect survival of barged and ROR fish in the estuary and D?
Timing of hatchery releases could help alleviate predation risk of barged and ROR migrants. Also, timing of barging in conjunction with these downstream hatchery releases can also help alleviate predation risk of barged fish.
Data analysis and simulations.
Several years Although large numbers of hatchery fish may reduce predator exposure for both barged and ROR fish, these benefits may be reduced by increased competition for food resources. Such competition could reduce growth of fish during critical periods and poor ocean conditions
Estuary Conditions
Question 8: What and how are seasonal estuary conditions associated with survival of barged and ROR migrants in the CRE?
Indices could be developed to determine appropriate times to implement barging and hatchery releases.
Data analysis and simulations of estuary conditions indices (e.g., flow, turbidity, and percent smolt in avian predator diets) in relation to seasonal differential survival rates.
Several years to decades
Determining indices with sufficient predictive power and time scale of forecast for seasonal management of the transportation program and improvement of adult returns.

5.10
Table 5.1 (contd)
D Factor Research Questions Relevance to Transportation Program Research Approaches
Research Duration Research Challenges
Env
iron
men
tal C
ondi
tions
(con
td) Ocean
Conditions Question 9: How do seasonal ocean conditions affect D?
Indices could be developed to gain a better understanding of mechanisms affecting D.
Data analysis and modeling of ocean condition indices (e.g., water temperature, turbidity, upwelling, forage fish, and predators) in relation to differential SARs across the season and years
Several years to decades
Determining indices with sufficient predictive power and time scale of forecast for seasonal management of the transportation program and improvement of adult returns.
(a) Weaker fish may be considered weaker based on the metrics of fish size, physiological condition, and disease status. (b) Post-BON refers to the area where hatchery releases can affect ROR and barged fish survival, while post-MCN refers to the area where hatchery releases
downstream of the dams that participate in the barge transportation program can affect ROR fish survival.

6.1
6.0 References
Achord S, PS Levin, and RW Zabel. 2003. “Density-dependent mortality in Pacific salmon: The ghost of impacts past?” Ecology Letters 6(4):335-342.
Achord S, RW Zabel, and BP Sandford. 2007. “Migration Timing, Growth, and Estimated Parr-to-Smolt Survival Rates of Wild Snake River Spring-Summer Chinook Salmon From the Salmon River Basin, Idaho, to the Lower Snake River.” Transactions of the American Fisheries Society 136(1):142-154.
Anderson JJ. 2000. “A vitality-based model relating stressors and environmental properties to organism survival.” Ecological Monographs 70(3):445-470.
Anderson JJ, RA Hinrichsen, C Van Holmes, and KD Ham. 2005. Historical Analysis of PIT Tag Data for Transportation of Fish at Lower Granite, Little Goose, Lower Monumental and McNary Dams - Task 1: Analysis of In-River Environmental Conditions. PNWD-3514, prepared for the U.S. Army Corps of Engineers, Walla Walla District, Walla Walla, Washington, by Battelle–Pacific Northwest Division, Richland, Washington. Biological Services Contract no. DACW68-02-D-0001, Task Order 0009.
Anderson JJ, MC Gildea, DW Williams, and T Li. 2008. “Linking Growth, Survival, and Heterogeneity through Vitality.” The American Naturalist 171:E20-E43.
Anderson JJ, JL Gosselin, JL, WD Muir and RA Hinrichsen. In progress. “A model to identify significant factors generating seasonal patterns in differerntial delayed mortality.” Prepared by the School of Aquatic and Fishery Sciences, University of Washington, Seattle, Washington. ([email protected])
Anglea SM, DR Geist, RS Brown, KA Deters, and RD McDonald. 2004. “Effects of Acoustic Transmitters on Swimming Performance and Predator Avoidance of Juvenile Chinook Salmon.” North American Journal of Fisheries Management 24(1):162-170.
Arkoosh MR, AN Kagley, BF Anulacion, DA Boylen, BP Sandford, FJ Loge, LL Johnson, and TK Collier. 2006. “Disease Susceptibility of Hatchery Snake River Spring-Summer Chinook Salmon with Different Juvenile Migration Histories in the Columbia River.” Journal of Aquatic Animal Health 18(4):223-231.
Banner CR, Long JJ, Fryer JL and Rohovec JS. 1986. “Occurrence of salmonid fish infected with Renibacterium salmoninarum in the Pacific Ocean.” Journal of Fish Diseases 9:273-275.
Bath RN and Eddy FB. 1979. “Salt and water balance in rainbow trout (Salmo gairdneri) rapidly transferred from freshwater to sea water.” Journal of Experimental Biology 83:193-202.
Badil S, DG Elliott, T Kurobe, K Clemens, M Blair, and MK Purcell. 2011. “Comparative evaluation of molecular diagnostic tests for Nucleospora salmonis and prevalence in migrating juvenile salmonids from the Snake River, USA.” Journal of Aquatic Animal Health 23:19-29.
Beamish RJ and Mahnken C. 2001. “A critical size and period hypothesis to explain natural regulation of salmon abundance and the linkage to climate and climate change.” Progress in Oceanography 49:423-437.

6.2
Beamish RJ, C Mahnken, and CM Neville. 2004. “Evidence That Reduced Early Marine Growth Is Associated with Lower Marine Survival of Coho Salmon.” Transactions of the American Fisheries Society 133:26–33.
Bird Research Northwest. 2011. East Sand Island Caspian Tern Colony Data for 2011 Nesting Season. Retrieved July 5, 2011, from http://www.birdresearchnw.org/Project-Info/Project-Data/Caspian-Tern-Data/East-Sand-Island-Tern-Data2/default.aspx, and from http://www.birdresearchnw.org/Project-Info/Project-Data/Double-Crested-Cormorant-Data/East-Sand-Island-Cormorant-Data/default.aspx.
Bottom DL, CA Simenstad, J Burke, AM Baptista, DA Jay, KK Jones, E Casillas, and MH Schiewe. 2005. “Salmon at river's end: The role of the estuary in the decline and recovery of Columbia River salmon.” U.S. Department of Commerce NOAA Technical Memorandum NMFS-NWFSC-68, Northwest Fisheries Center, National Marine Fisheries Service, National Oceanic Atmospheric Administration, Seattle, Washington.
Brown RS, DR Geist, KA Deters, and A Grassell. 2006. “Effects of surgically implanted acoustic transmitters >2% of body mass on the swimming performance, survival and growth of juvenile sockeye and Chinook salmon.” Journal of Fish Biology 69(6):1626-1638.
Brown RS, TJ Carlson, AE Welch, JR Stephenson, CS Abernethy, BD Ebberts, M Langeslay, ML Ahmann, DH Feil, JR Skalski, and RL Townsend. 2009. “Assessment of Barotrauma from Rapid Decompression of Depth-Acclimated Juvenile Chinook Salmon Bearing Radiotelemetry Transmitters.” Transactions of the American Fisheries Society 138(6):1285-1301.
Brown RS, RA Harnish, KM Carter, JW Boyd, KA Deters, and MB Eppard. 2010. “An Evaluation of the Maximum Tag Burden for Implantation of Acoustic Transmitters in Juvenile Chinook Salmon.” North American Journal of Fisheries Management 30(2):499-505.
Buchanan RA, JR Skalski, and SG Smith. 2006. “Estimating the Effects of Smolt Transportation from Different Vantage Points and Management Perspectives.” North American Journal of Fisheries Management 26(2):460-472.
Buchanan RA, JR Skalski, RL Townsend and KH Ham. 2011. The Effect of Bypass Passage and Adult Returns of Salmon and Steelhead: An Analysis of PIT-Tag Data Using the Program ROSTER. Draft Final Report. PNWD-4241, prepared by the University of Washington, Seattle, Washington and Battelle, Pacific Northwest Division, Richland, Washington, for the U.S. Army Corps of Engineers, Walla Walla District under contract W912EF-08-D-0004 DO4..
Budy P, GP Thiede, N Bouwes, CE Petrosky, and H Schaller. 2002. “Evidence Linking Delayed Mortality of Snake River Salmon to their Earlier Hydrosystem Experience.” North American Journal of Fisheries Management 22(1):35-51.
Carlson TJ, GR Ploskey, RL Johnson, RP Mueller, and MA Weiland. 2001. Observations of the Behavior and Distribution of Fish in Relation to the Columbia River Navigation Channel and Channel Maintenance Activities. PNNL-13595, prepared by the Pacific Northwest National Laboratory, Richland, Washington, for the U. S. Army Corps of Engineers, Portland District, Portland, Oregon. Contract no. DE-AC06-76RL01830.

6.3
Carlson TJ and MJ Myjak. 2010. Juvenile Salmon Acoustic Telemetry System Transmitter Downsize Assessment. PNNL-19366, prepared by the Pacific Northwest National Laboratory, Richland, Washington, for the U.S. Army Corps of Engineers, Portland District, Portland, Oregon. Contract no. DE-AC05-76RL01830.
Carter JA, GA McMichael, ID Welch, RA Harnish, and BJ Bellgraph. 2009. Seasonal Juvenile Salmonid Presence and Migratory Behavior in the Lower Columbia River. PNNL-18246, prepared for the U.S. Army Corps of Engineers, Portland, Oregon, by the Pacific Northwest National Laboratory, Richland, Washington. Contract no. DE-AC05-76RL01830.
Chittenden C, K Butterworth, K Cubitt, M Jacobs, A Ladouceur, D Welch, and R McKinley. 2009. “Maximum tag to body size ratios for an endangered coho salmon (O-kisutch) stock based on physiology and performance.” Environmental Biology of Fishes 84(1):129-140.
Claiborne AM, JP Fischer, SA Hayes, and RL Emmett. 2011. “Size at Release, Size-Selective Mortality, and Age of Maturity of Willamette River Hatchery Yearling Chinook Salmon.” Transactions of the American Fisheries Society 140(4):1135-1144.
Clemens BJ, SP Clements, MD Karnowski, DB Jepsen, AI Gitelman, and CB Schreck. 2009. “Effects of Transportation and Other Factors on Survival Estimates of Juvenile Salmonids in the Unimpounded Lower Columbia River.” Transactions of the American Fisheries Society 138(1):169-188.
Congleton JL, J Evavold, D Jones, M Santora, B Sun, and T Wagner. 2005. Evaluation of Physiological Condition of Transported and Inriver Migrating Juvenile Salmonids and Effects on Survival (DACW68-00-C-0030): Annual Report, 2003. Prepared for the U.S. Army Corps of Engineers, Walla Walla District, Walla Walla, Washington, by Idaho Cooperative Fish and Wildlife Research Unit, Department of Fish and Wildlife Resources, University of Idaho, Moscow, Idaho.
Congleton JL, WJ LaVoie, D Fryer, J Evavold, and B Sun. 2001. Evaluation of Procedures for Collection, Transportation, and Downstream Passage of Outmigrating Salmonids (MPE-W-95-3): Annual Report, 1998. Prepared for the U.S. Army Corps of Engineers, Walla Walla District, Walla Walla, Washington, by the Idaho Cooperative Fish and Wildlife Research Unit, Department of Fish and Wildlife Resources, University of Idaho, Moscow, Idaho.
Congleton JL, WJ LaVoie, CB Schreck, and LE Davis. 2000. “Stress Indices in Migrating Juvenile Chinook Salmon and Steelhead of Wild and Hatchery Origin Before and After Barge Transportation.” Transactions of the American Fisheries Society 129(4):946-961.
Congleton J, T Wagner, J Evavold, and B Sun. 2003. Evaluation of the Effects of Physiological Condition on Comparative Survival of Transported Juvenile Salmon (DACW.68-00-C-0030) Annual Report, 2001. Prepared by Idaho Cooperative Fish and Wildlife Research Unit, Department of Fish and Wildlife Resources, University of Idaho, Moscow, Idaho, for the U.S. Army Corps of Engineers, Walla Walla District, Walla Walla, Washington.
Connor WP, BD Arnsberg, SG Smith, DM Marsh, and WD Muir. 2007. Postrelease Performance of Natural and Hatchery Subyearling Fall Chinook Salmon in the Snake and Clearwater Rivers. Prepared by the Idaho Fisheries Resource Office, United States Fish and Wildlife Service, Ahsahka, Idaho, the Nez

6.4
Perce Tribe Department of Fisheries Resources Management, Orofino, Idaho, and the Northwest Fisheries Science Center, National Oceanic and Atmospheric Administration, Seattle, Washington, for the U.S. Army Corps of Engineers, Walla Walla District, Walla Walla, Washington.
Connor WP, HL Burge, R Waitt, and TC Bjornn. 2002. “Juvenile Life History of Wild Fall Chinook Salmon in the Snake and Clearwater Rivers.” North American Journal of Fisheries Management 22(3):703-712.
Connor WP, SG Smith, T Andersen, SM Bradbury, DC Burum, EE Hockersmith, ML Schuck, GW Mendel, and RM Bugert. 2004. “Post-release Performance of Hatchery Yearling and Subyearling Fall Chinook Salmon Released into the Snake River.” North American Journal of Fisheries Management 24(2):545-560.
Connor WP, JG Sneva, KF Tiffan, RK Steinhorst, and D Ross. 2005. “Two Alternative Juvenile Life History Types for Fall Chinook Salmon in the Snake River Basin.” Transactions of the American Fisheries Society 134(2):291-304.
Connor WP, RK Steinhorst, and HL Burge. 2003. “Migrational behavior and seaward movement of wild subyearling fall chinook salmon in the Snake River.” North American Journal of Fisheries Management 23:414-430.
Cross AD, DA Beauchamp, JH Moss, and KW Myers. 2009. “Interannual Variability in Early Marine Growth, Size-Selective Mortality, and Marine Survival for Prince William Sound Pink Salmon.” Marine and Coastal Fisheries: Dynamics, Management, and Ecosystem Science 1:57–70.
Crozier L and RW Zabel. 2006. “Climate impacts at multiple scales: Evidence for differential population responses in juvenile Chinook salmon.” Journal of Animal Ecology 75(5):1100-1109.
Crozier LG, RW Zabel, EE Hockersmith, and S Achord. 2010. “Interacting effects of density and temperature on body size in multiple populations of Chinook salmon.” Journal of Animal Ecology 79(2):342-349.
DeHart M. 2010. “Review of the NOAA Transportation analyses and potential effects of reducing spill for fish passage in May and beginning the transportation program earlier inthe spring and supporting analyses.” Memorandum from M. DeHart, Fish Passage Center, Portland, Oregon to the Fish Passage Advisory Committee, R. Boyce, Oregon Department of Fish and Wildlife, Clackamas, Oregon and Tom Lorz, Columbia River Inter-Tribal Fish Commission, Portland, Oregon, dated February 9, 2010.
Deriso RB, DR Marmorek, and IJ Parnell. 2001. “Retrospective patterns of differential mortality and common year-effects experienced by spring and summer chinook salmon (Oncorhynchus tshawytscha) of the Columbia River.” Canadian Journal of Fisheries and Aquatic Sciences 58(12):2419-2430.
De Robertis A, CA Morgan, RA Schabetsberger, RW Zabel, RD Brodeur, RL Emmett, CM Knight, GK Krutzikowsky, and E Casillas. 2005. “Columbia River plume fronts. II. Distribution, abundance, and feeding ecology of juvenile salmon.” Marine Ecology-Progress Series 299:33-44.
Dietrich J, D Boylen, B Fleenor, J Groff, G Hutchinson, J Osborn, S Strickland, D Thompson, A Van Gaest, T Collier, M Arkoosh, and F Loge. 2008. Estimate of Hydrosystem Delayed Mortality Associated

6.5
with Barged and In-River Outmigration Life-History Strategies of Snake River Spring/Summer Chinook Salmon. Prepared by the Northwest Fisheries Science Center, National Oceanic and Atmospheric Administration, Newport, Oregon, for the U.S. Army Corps of Engineers, Walla Walla District, Walla Walla, Washington. Study Code BPS-00-10.
Dietrich J, D Boylen, D Spangenberg, C Bravo, D Thompson, E Loboschefsky, M Arkoosh, T Collier, and F Loge. 2007. Disease Susceptibility of Hatchery-Reared Yearling Snake River Spring/Summer Chinook Salmon with Different Migration Histories in the Columbia River. Prepared by the University of California, Davis, California, and the Northwest Fisheries Science Center, National Oceanic and Atmospheric Administration, Newport, Oregon, for the U.S. Army Corps of Engineers, Walla Walla District, Walla Walla, Washington. Study Code BPS-00-10.
Dietrich J, J Osborn, D Boylen, G Hutchinson, S Strickland, A Van Gaest, T Collier, and M Arkoosh. 2010. Disease Transmission Among Snake River Spring/Summer Chinook Salmon Under Laboratory Controlled Transportation Conditions. Prepared by the Northwest Fisheries Science Center, National Oceanic and Atmospheric Administration, Newport, Oregon, the University of California, Davis, and the Northwest Fisheries Science Center, National Oceanic and Atmospheric Administration, Seattle, Washington, for the U.S. Army Corps of Engineers, Walla Walla District, Walla Walla,Washington. Study Codes BPS-W-00-10 and TPE-W-04-1.
Dietrich JP, DA Boylen, DE Thompson, EJ Loboschefsky, CF Bravo, DK Spangenberg, GM Ylitalo, TK Collier, DS Fryer, MR Arkoosh, and FJ Loge. 2011. “An Evaluation of the Influence of Stock Origin and Out-migration History on the Disease Susceptibility and Survival of Juvenile Chinook Salmon.” Journal of Aquatic Animal Health 23:35-47.
Duffy EJ and Beauchamp DA. 2011. “Rapid growth in the early marine period improves the marine survival of Chinook salmon (Oncorhynchus tshawytscha) in Puget Sound, Washington.” Canadian Journal of Fisheries and Aquatic Sciences 68: 232–240.
Eder K, D Thompson, R Buchanan, J Heublein, J Groff, J Dietrich, J Skalski, C Peery, M Arkoosh, T Collier, and F Loge. 2009a. Survival and Travel Times of In-River and Transported Yearling Chinook Salmon in the Lower Columbia River and Estuary with Investigation into Causes of Differential Mortality. Prepared by the University of California, Davis, California, the University of Washington, Seattle Washington, the Northwest Fisheries Science Center, National Oceanic and Atmospheric Administration, Newport, Oregon, the University of Idaho, Moscow, Idaho, and the Northwest Fisheries Science Center, National Oceanic and Atmospheric Administration, Seattle, Washington, for the U.S. Army Corps of Engineers, Walla Walla District, Walla Walla, Washington. Study Codes BPS-00-10 and SPE-06-2.
Eder K, D Thompson, J Dietrich, D Boylen, A Van Gaest, S Strickland, J Groff, M Arkoosh, and F Loge. 2009b. Hydrosystem Delayed Mortality Associated with Barge and In-River Outmigration Histories of Snake River Spring/Summer Chinook Salmon with Investigation into Possible Causes of Differential Mortality – DRAFT. Prepared by the University of California, Davis, California, and the Northwest Fisheries Science Center, National Oceanic and Atmospheric Administration, Newport, Oregon, for the U.S. Army Corps of Engineers, Walla Walla District, Walla Walla, Washington. Study Code BPS-W-00-10.

6.6
Elliott DG, RJ Pascho, and LM Jackson, GM Matthews, and JR Harmon. 1997. “Renibacterium salmoninarum in Spring-Summer Chinook Salmon Smolts at Dams on the Columbia and Snake Rivers.” Journal of Aquatic Animal Health 9:114-126.
Emmett RL and WD Muir. 2009. Juvenile Salmon Marine Survival Related to Ocean Entry Time. Prepared by the Northwest Fisheries Science Center, National Oceanic and Atmospheric Administration Fisheries, Seattle, Washington for Anadromous Fish Evaluation Program (AFEP), U.S. Army Corps of Engineers, Walla Walla and Portland Districts. Presentation at the AFEP Meeting, December 1, 2009.
Emmett RL and GK Krutzikowsky. 2008. “Nocturnal Feeding of Pacific Hake and Jack Mackerel Off the Mouth of the Columbia River, 1998-2004: Implications for Juvenile Salmon Predation.” Transactions of the American Fisheries Society 137(3):657-676.
Emmett RL, GK Krutzikowsky, and P Bentley. 2006. “Abundance and distribution of pelagic piscivorous fishes in the Columbia River plume during spring/early summer 1998-2003: Relationship to oceanographic conditions, forage fishes, and juvenile salmonids.” Progress in Oceanography 68:1-26.
Farley, E.V., J.H. Moss, and R.J. Beamish. 2007a. A review of the critical size, critical period hypothesis for juvenile Pacific salmon. North Pacific Anadromous Fish Commission Bulletin 4: 311–317.
Farley EV, JM Murphy, M Adkison, and L Eisner. 2007b. “Juvenile sockeye salmon distribution, size, condition and diet during years with warm and cool spring sea temperatures along the eastern Bering Sea shelf.” Journal of Fish Biology 74(4):1145-1158.
Farley EV, JM Murphy, MD Adkison, LB Eisner, JH Helle, JH Moss, and J Nielsen. 2007c. Early marine growth in relation to marine-stage survival rates for Alaska sockeye salmon (Oncorhynchus nerka). Fishery Bulletin 105(1):121-130.
Ferguson JW, RF Absolon, TJ Carlson, and BP Sandford. 2006. “Evidence of Delayed Mortality on Juvenile Pacific Salmon Passing Through Turbines at Columbia River Dams.” Transactions of the American Fisheries Society 135(1):139-150.
Ferguson JW, GM Matthews, RL McComas, RF Absolon, DA Brege, MH Gessel, and LG Gilbreath. 2005. Passage of Adult and Juvenile Salmonids Through Federal Columbia River Power System Dams. National Oceanic and Atmospheric Administration Technical Memorandum NMFS-NWFSC-64, National Marine Fisheries Service, Northwest Fisheries Science Center, National Oceanic and Atmospheric Administration, Seattle, Washington.
Fisher JP and WG Pearcy. 1995. “Distribution, migration, and growth of juvenile Chinook salmon Oncorhynchus tshawytscha, off Oregon and Washington.” Fishery Bulletin 93:274–289.
Friedland KD, LP Hansen, DA Dunkley, and JC MacLean. 2000. “Linkage between ocean climate, post-smolt growth, and survival of Atlantic salmon (Salmo salar L.) in the North Sea area.” Ices Journal of Marine Science 57(2):419-429.
Fryer DS. 2008. “Swimming Performance of Hatchery-Reared Yearling Chinook Salmon Oncorhynchus tshawytscha Before and After Passage Through the Snake-Columbia River Hydropower System.” Thesis, University of Idaho, Moscow, Idaho.

6.7
Gargett AE. 1997. “The optimal stability 'window': a mechanism underlying decadal fluctuations in North Pacific salmon stocks?” Fisheries Oceanography 6(2):109-117.
Ginn TR and FJ Loge. 2007. “Dose-structured population dynamics.” Mathematical Biosciences 208:325-343.
Giorgi A, M Miller, and J Stevenson. 2002. Mainstem Passage Strategies in the Columbia River System: Transportation, Spill, and Flow Augmentation. Prepared by BioAnalysts, Inc., Redmond, Washington, for the Northwest Power Planning Council, Portland, Oregon.
Gosselin, JL. 2011. “Cumulative Experiences and Heterogeneity Affect Fish Survival: Examples from a model species (Poecilia reticulata) and salmonid species (Oncorhynchus spp.).” Ph.D. dissertation, University of Washington, Seattle, Washington.
Greene CM and TJ Beechie. 2004. “Consequences of potential density-dependent mechanisms on recovery of ocean-type chinook salmon (Oncorhynchus tshawytscha).” Canadian Journal of Fisheries and Aquatic Sciences 61(4):590-602.
Hall JE, J Chamberlin, AN Kagley, C Greene, and KL Fresh. 2009. “Effects of Gastric and Surgical Insertions of Dummy Ultrasonic Transmitters on Juvenile Chinook Salmon in Seawater.” Transactions of the American Fisheries Society 138(1):52-57.
Halvorsen MB, LE Wysocki, CM Stehr, DH Baldwin, DR Chicoine, NL Scholz, and AN Popper. 2009. “Barging Effects on Sensory Systems of Chinook Salmon Smolts.” Transactions of the American Fisheries Society 138(4):777-789.
Ham KD, CII Arimescu, MA Simmons, JP Duncan, MA Chamness, and A Solcz. 2009. Synthesis of biological research on juvenile fish passage and survival 1990-2006: McNary Dam. Report prepared by Pacific Northwest National Laboratory, Richland, Washington, for the U.S. Army Corps of Engineers, Contract W9127N-06-D-005.
Handeland SO, A Berge, BT Bjornsson, SO Stefansson. 1998. “Effects of temperature and salinity on osmoregulation and growth of Atlantic salmon (Salmo salar L.) smolts in seawater.” Aquaculture 168:289-302.
Hockersmith EE, RS Brown, and TL Liedtke. 2008. Comparative Performance of Acoustic-Tagged and Passive Integrated Transponder-Tagged Juvenile Salmonids. Prepared by the Northwest Fisheries Science Center, National Oceanic and Atmospheric Administration, Seattle, Washington, the Pacific Northwest National Laboratory, Richland, Washington, and the U.S. Geological Survey, Cook, Washington, for the Environmental Resources Branch, Planning and Engineering Division, Portland District, U.S. Army Corps of Engineers, Portland, Oregon. Contract no. W66QKZ60441152.
Holecek DE, KJ Cromwell, and BP Kennedy. 2009. “Juvenile Chinook Salmon Summer Microhabitat Availability, Use, and Selection in a Central Idaho Wilderness Stream.” Transactions of the American Fisheries Society 138(3):633-644.

6.8
Holsman KK, Scheuerell MD, Buhle E., and Emmett R. “Varying effects of environmental and management practices on the marine survival of Chinook salmon.” Submitted to Conservation Biology. [email protected]
Holtby LB, BC Andersen, RK Kadowaki. 1990. “Importance of Smolt Size and Early Ocean Growth to Interannual Variability in Marine Survival of Coho Salmon (Oncorhynchus kisutch).” Canadian Journal of Fisheries and Aquatic Sciences 47:2181-2194.
ICF Jones & Stokes (ICF J&S). 2009. Evaluation of Effects of Extended Transport on Survival of Salmonid Smolts: Impacts of Fish Predation in the Lower Columbia River. Final Report ICF J&S 00776.08, prepared by ICF J&S, Vashon, Washington, for the U.S. Army Corps of Engineers, Walla Walla District, Walla Walla, Washington.
Independent Scientific Advisory Board (ISAB). 2008. Snake River Spill-Transport Review. ISAB 2008-5, Portland, Oregon.
Independent Scientific Advisory Board (ISAB). 2010. Review of NOAA Fisheries’ 2010 Low Flow Fish Transport Operations Proposal. Report no. ISAB 2010-2, Portland, Oregon.
Jacobson K, B Peterson, M Trudel, J Ferguson, C Morgan, D Welch, A Baptista, B Beckman, R Brodeur, E Casillas, R Emmett, J Miller, D Teel, T Wainwright, L Weitkamp, J Zamon, and K Fresh. 2012. The Marine Ecology of Juvenile Columbia River Basin Salmonids: A Synthesis of Research 1998-2011. Prepared by the National Marine Fisheries Service, National Oceanic and Atmospheric Administration, the Department of Fisheries and Oceans Canada, Kintama Research Services, Ltd., and Oregon State University, for the Northwest Power and Conservation Council.
Keefer ML, CA Peery CA, and CC Caudill. 2006. “Long-distance downstream movements by homing adult chinook salmon.” Journal of Fish Biology 68(3):944-950.
Keefer ML, CC Caudill, CA Peery, and SR Lee. 2008a. “Transporting juvenile salmonids around dams impairs adult migration.” Ecological Applications 18(8):1888-1900.
Keefer ML, CA Peery CA, and CC Caudill. 2008b. “Migration timing of Columbia River Spring Chinook Salmon: Effects of Temperature, River Discharge, Anti Ocean Environment.” Transactions of the American Fisheries Society 137(4):1120-1133.
Kelsey DA, CB Schreck, JL Congleton, and LE Davis. 2002. “Effects of juvenile steelhead on juvenile chinook salmon behavior and physiology.” Transactions of the American Fisheries Society 131:676-689.
Knudsen CM, MV Johnston, SL Schroder, WJ Bosch, DE Fast, and CR Strom. 2009. “Effects of Passive Integrated Transponder Tags on Smolt-to-Adult Recruit Survival, Growth, and Behavior of Hatchery Spring Chinook Salmon.” North American Journal of Fisheries Management 29(3):658-669.
Ledgerwood RD, AS Cameron, BP Sandford, LB Way, and GM Matthews. 2007. Detection of PIT-Tagged Juvenile Salmonids in the Columbia River Estuary Using Pair-Trawls. Prepared by Northwest Fisheries Science Center, National Oceanic and Atmospheric Administration, Seattle, Washington. Contract no. 56ABNF100030.

6.9
Levin PS, Zabel RW, and Williams JG. 2001. “The road to extinction is paved with good intentions: negative association of fish hatcheries with threatened salmon.” Proceedings of the Royal Society of London Series B-Biological Sciences 268:1153-1158.
Li T and JJ Anderson. 2009. “The vitality model: A way to understand population survival and demographic heterogeneity.” Theoretical Population Biology 76: 118-131.
Li T and JJ Anderson. In press. “Shaping human mortality patterns through intrinsic and extrinsic processes.” Demographic Research.
Mahnken, C, E Prentice, W Waknitz, G Monan, C Sims, and J Williams. 1982. The application of recent smoltification research to public hatchery releases: An assessment of size/time requirements for Columbia River hatchery coho salmon (Oncorhynchus kisutch). Aquaculture 28(1-2):251-268.
Marmorek DR, M Porter, IJ Parnell, and C Peters (eds.). 2004. Comparative Survival Study Workshop, February 11–13, 2004; Bonneville Hot Springs Resort. Compiled and edited by ESSA Technologies Ltd., Vancouver, British Columbia, for the Fish Passage Center, Portland Oregon, and the U.S. Fish and Wildlife Service, Columbia River Fisheries Program Office, Vancouver, Washington.
Marsh DM, JR Harmon, NN Paasch, KL Thomas, KW McIntyre, BP Sandford, and GM Matthews. 2004. Transportation of Juvenile Salmonids on the Columbia and Snake Rivers,2003: Final report for 2000 and 2001 Steelhead Juveniles. Prepared by the Northwest Fisheries Science Center, National Oceanic and Atmospheric Administration, Seattle, Washington, for the U.S. Army Corps of Engineers, Walla Walla District, Walla Walla, Washington. Delivery Order E86960099.
Marsh DM, KW McIntyre, BP Sandford, SG Smith, WD Muir, and GM Matthews. 2010a. Transportation of Snake River Fall Chinook Salmon 2008: Final Report for the 2004 Juvenile Migration. Prepared by the Northwest Fisheries Science Center, National Oceanic and Atmospheric Administration, Seattle, Washington, for the U.S. Army Corps of Engineers Walla Walla District, Walla Walla, Washington. Delivery Order E86960099.
Marsh DM, WD Muir, D Elliott, T Murray, L Applegate, C McKibben, and S Mosterd. 2008. Alternative Barging Strategies to Improve Survival of Transported Juvenile Salmonids, 2007. Prepared by the Northwest Fisheries Science Center, National Oceanic and Atmospheric Administration, Seattle, Washington, and the U.S. Geological Survey, Seattle, Washington, for the U.S. Army Corps of Engineers Walla Walla District, Walla Walla, Washington. Contract no. W68SBV60307671 and W68SBV60418618.
Marsh DM, WD Muir, BP Sandford, D Elliott, L Applegate, C McKibben, S Mosterd, S Badil, and J Woodson. 2010b. Alternative Barging Strategies to Improve Survival of Transported Juvenile Salmonids, 2008 DRAFT. Prepared by the Northwest Fisheries Science Center, National Oceanic and Atmospheric Administration, Seattle, Washington, and the U.S. Geological Survey, Seattle, Washington, for the U.S. Army Corps of Engineers Walla Walla District, Walla Walla, Washington. Contract no. W68SBV60307671 and W68SBV60418618.
Marsh DM, BP Sandford, SG Smith, GM Matthews, and WD Muir. 2010c. Transportation of Columbia River Salmonids from McNary Dam: Final Adult Returns from the 2002-2004 Hatchery Spring Chinook
6.10
and 2003-2005 Hatchery Steelhead Juvenile Migrations–DRAFT Report. Prepared by Prepared by the Northwest Fisheries Science Center, National Oceanic and Atmospheric Administration, Seattle, Washington, for the U.S. Army Corps of Engineers Walla Walla District, Walla Walla, Washington. Delivery Order E86960099.
Marubini E and MG Valsecchi. 1995. Analysing Survival Data from Clinical Trials and Observational Studies. J. Wiley, Chichester, New York.
McComas RL, GA McMichael, JA Vucelick, L Gilbreath, JP Everett, SG Smith, T Carlson, G Matthews, and JW Ferguson. 2008. A Study to Estimate Salmonid Survival through the Columbia River Estuary Using Acoustic Tags, 2006. Prepared by the Northwest Fisheries Science Center, National Oceanic and Atmospheric Administration, Seattle, Washington, and Pacific Northwest National Laboratory, Richland, Washington, for the U.S. Army Corps of Engineers Portland District, Portland, Oregon. Delivery Order E86910060.
McCormick SD and Bern HA. 1989. “In vitro stimulation of Na+-K+-ATPase activity and ouabain binding by cortisol in coho salmon gill.” American Journal of Physiology 256(3):R707-R715.
McMichael, GA, RA Harnish, BJ Bellgraph, JA Carter, KD Ham, PS Titzler, and MS Hughes. 2010. Survival and Migratory Behavior of Juvenile Salmonids in the Lower Columbia River Estuary in 2009. PNNL-19545, prepared by Battelle–Pacific Northwest Division, Richland, Washington, for the U.S. Army Corps of Engineers, Portland District, Portland, Oregon. Pacific Northwest National Laboratory, Richland, Washington. Contract no. DE-AC05-76RL01830.
McMichael GA, JA Vucelick, B Ryan, L Gilbreath, R L McComas, S Smith, M Carper, D Elliott, T Murray, L Applegate, and C McKibben. 2006. Alternative Barging Strategies to Improve Survival of Transported Juvenile Salmonids – 2005. PNNL-15575, prepared by Battelle–Pacific Northwest Division, Richland, Washington, the National Oceanic and Atmospheric Administration, Fisheries Service, the U.S. Geological Survey, Western Fisheries Research Center, Seattle, Washington, for the U.S. Army Corps of Engineers, Walla Walla District, Walla Walla, Washington. Contract no. DACW57-00-D-0009 #11.
Mesa MG, MH Averbeck, AG Maule, DG Elliott, amd AL Miracle. 2008. Mechanisms of Delayed Mortality in Juvenile Salmonids Outmigrating in the Columbia River Basin – Draft Final Report FY 2008. Prepared by the U.S. Geological Survey, Western Fisheries Research Center, Cook, Washington, the USGS, Seattle, Washington, and the Pacific Northwest National Laboratory, Richland, Washington, for the U. S. Army Corps of Engineers, Walla Walla District, Walla Walla, Washington.
Metzger DC, DG Elliott, A Wargo, LK Park, and MK Purcell. 2010. “Pathological and immunological responses associated with differential survival of Chinook salmon following Renibacterium salmoninarum challenge.” Diseases of Aquatic Organisms 90(1):31-41.
Moss JH, DA,Beauchamp AD Cross, KW Myers, EV Farley Jr., JM Murphy, and JH Helle. 2005. Evidence for Size-Selective Mortality after the First Summer of Ocean Growth by Pink Salmon. Transactions of the American Fisheries Society 134:1313–1322.

6.11
Muir WD and TC Coley. 1996. “Diet of Yearling Chinook Salmon and Feeding Success During Downstream Migration in the Snake and Columbia Rivers.” Northwest Science 70(4):298-305.
Muir WD, DM Marsh, BP Sandford, SG Smith, and JG Williams. 2006. “Post-Hydropower System Delayed Mortality of Transported Snake River Stream-Type Chinook Salmon: Unraveling the Mystery.” Transactions of the American Fisheries Society 135(6):1523-1534.
Muir WD, SG Smith, JG Williams, and BP Sanford. 2001. “Survival of Juvenile Salmonids Passing through Bypass Systems, Turbines, and Spillways with and without Flow Deflectors at Snake River Dams.” North American Journal of Fisheries Management 21:135–146
Muir WD and JG Williams. In press. Improving connectivity between freshwater and marine environments for salmon migrating through the lower Snake and Columbia River hydropower system. Ecological Engineering.
National Oceanic and Atmospheric Administration (NOAA). 2007. Columbia River Estuary ESA Recovery Plan Module for Salmon and Steelhead. Prepared by the Lower Columbia River Estuary Partnership, for NMFS, National Oceanic and Atmospheric Administration Fisheries, Portland, Oregon.
National Oceanic and Atmospheric Administration (NOAA). 2010. “Analyses of juvenile Chinook salmon and steelhead transport from Lower Granite and Little Goose dams, 1998-2008.” Northwest Fisheries Science Center, Seattle, Washington.
Normandeau Associates, Inc., JR Skalsi, and RL Townsend. 2008. Turbine Operational Effects on Survival/Condition of Yearling Chinook Salmon, Oncorhynchus tshawytscha, at Ice Harbor Dam, march 2007. Prepared by Normandeau Associates, Inc., Drumore, Pennsylvania, and the University of Washington, Seattle, Washington, for the U.S. Army Corps of Engineers, Walla Walla District, Walla Walla, Washington. Contract no. DACW68-02-D-0002, Task Order 29.
Pascho RJ, Elliott DG, and Achord, S. 1993. “Monitoring of the in-river migration of smolts from two groups of spring chinook salmon, Oncorhynchus tshawytscha (Walbaum), with different profiles of Renibacterium salmoninarum infection.” Aquaculture Research 24(2):163–169.
Petrosky CE. 2010. “Annual SARs by Study Category, TIR and D: Patterns and Significance.” Comparative Survival Study Annual Meeting. Presented by C Petrosky, April 2, 2010.
Petrosky CE and HA Schaller. 2010. "Influence of river conditions during seaward migration and ocean conditions on survival rates of Snake River Chinook salmon and steelhead." Ecology of Freshwater Fish (in press).
Pearcy WG. 1992. Ocean Ecology of North Pacific Salmonids. Books in Recruitment Fishery Oceanography,Washington Sea Grant Program, University of Washington, Seattle, Washington.
Ploskey GR, MA Weiland, JS Hughes, CM Woodley, Z Deng, TJ Carlson, J Kim, IM Royer, GW Batten, AW Cushing, SM Carpenter, DJ Etherington, DM Faber, ES Fischer, T Fu, MJ Hennen, TD Mitchell, TJ Monter, JR Skalski, RL Townsend, and SA Zimmerman. 2011. Survival and Passage of Juvenile Chinook Salmon and Steelhead Passing Through Bonneville Dam, 2010. PNNL-20835, prepared by the

6.12
Pacific Northwest National Laboratory, Richland, Washington, for the U.S. Army Corps of Engineers, Portland District, Portland, Oregon. Contract no. DE-AC05-76RL01830.
Plumb JM, RW Perry, NS Adams, and DW Rondorf. 2006. “The effects of river impoundment and hatchery rearing on the migration behavior of juvenile steelhead in the lower Snake River, Washington.” North American Journal of Fisheries Management 26:438-452.
Porter R. 2008. Report on the Predation Index, Predator Control Fisheries, and Program Evaluation for the Columbia River Basin Experimental Northern Pikeminnow Management Program. 2008 Annual Report, prepared by Pacific States Marine Fisheries Commission, Bonneville Power Administration, Portland, Oregon. Project Number 199007700 and Contract no. 00026763.
Price CS and CB Schreck. 2003. “Stress and saltwater-entry behavior of juvenile chinook salmon (Oncorhynchus tshawytscha): Conflicts in physiological motivation.” Canadian Journal of Fisheries and Aquatic Sciences 60(8):910-918.
Purcell MK, G Kurath, KA Garver, RP Herwig, and JR Winton. 2004. Quantitative expression profiling of immune response genes in rainbow trout following infectious haematopoietic necrosis virus (IHNV) infection or DNA vaccination. Fish and Shellfish Immunology 17(5):447-462.
Purcell MK, KM Nichols, JR Winton, G Kurath, GH Thorgaard, P Wheeler, JD Hansen, RP Herwig, and LK Park. 2006. Comprehensive gene expression profiling following DNA vaccination of rainbow trout against infectious hematopoietic necrosis virus. Molecular Immunology 43(13):2089-2106.
Purcell MK, LK Park, and DG Elliott (In Preparation) “Bacterial replication and immunological biomarkers in Chinook salmon families with differential resistance to Renibacterium salmoninarum.” Prepared by U.S. Geological Survey, Seattle, Washington. ([email protected])
Purcell MK, SE LaPatra, JC Woodson, G Kurath, and JR Winton. 2010. “Early viral replication and induced or constitutive immunity in rainbow trout families with differential resistance to Infectious hematopoietic necrosis virus (IHNV).” Fish and Shellfish Immunology 28(1):98-105.
Roberts RJ. 2001. The mycology of teleosts. RJ R, editor. London: W.B. Saunders.
Roby DD, K Collis, DE Lyons, DP Craig, J Adkins, AM Myers, and RM Suryan. 2002. Effects of colony relocation on diet and productivity of Caspian terns. Journal of Wildlife Management 66:662-673.
Roby DD, K Collis, DE Lyons, Y Suzuki, JY Adkins, L Reinalda, N Hostetter, L Adrean, A Evans, M Hawbecker, and S Sebring. 2008. Research, Monitoring, and Evaluation of Avian Predation on Salmonid Smolts in the Lower and Mid-Columbia River – 2007 Final Season Summary. Prepared by the U.S. Geological Survey – Oregon Cooperative Fish and Wildlife Research Unit, Department of Fisheries and Wildlife, Oregon State University, Corvallis, Oregon, Real Time Research, Inc., Bend, Oregon, and the Pacific States Fisheries Commission, Hammond, Oregon, for the Bonneville Power Administration and the U.S. Army Corps of Engineers, Portland, Oregon.
Roby DD, K Collis, DE Lyons, JY Adkins, P Loschl,Y Suzuki, D Battaglia,T Marcella, T Lawes, A Peck-Richardson, L Bayliss, L Faulquier, D Harvey, E Tompkins, J Tennyson, A Evans, N Hostetter, B Cramer, M Hawbecker, RD Ledgerwood, and S Sebring. 2011a. Research, Monitoring, and Evaluation

6.13
of Avian Predation on Salmonid Smolts in the Lower and Mid-Columbia River – Final 2010 Annual Report. Prepared by the U.S.Geological Survey – Oregon Cooperative Fish and Wildlife Research Unit, Department of Fisheries and Wildlife, Oregon State University, Corvallis, Oregon, Real Time Research, Inc., Bend, Oregon, and the Pacific States Fisheries Commission, Hammond, Oregon, for the Bonneville Power Administration and the U.S. Army Corps of Engineers, Portland, Oregon.
Roby DD, K Collis, DE Lyons, JY Adkins, P Loschl, Y Suzuki, T Marcella, L Kerr, A Evans, B Cramer, N Hostetter, BP Sandord, RD Ledgerwood, DR Kuligowski and S Sebring. 2011b. Impacts of Avian Predation on Salmonid Smolts from the Columbia and Snake Rivers – 2004-2009 Synthesis Report. Prepared by the U.S. Geological Survey – Oregon Cooperative Fish and Wildlife Research Unit, Department of Fisheries and Wildlife, Oregon State University, Corvallis, Oregon, Real Time Research, Inc., Bend, Oregon, and the Pacific States Fisheries Commission, Hammond, Oregon, for the U.S. Army Corps of Engineers, Walla Walla District, Walla Walla, Washington.
Rub AMW, RS Brown, BP Sandford, KA Deters, LG Gilbreath, MS Myers, ME Peterson, RA Harnish, EW Oldenburg, JA Carter, IW Welch, GA McMichael, JW Boyd, EE Hockersmith, and GM Matthews. 2009. Comparative Performance of Acoustic-Tagged and Passive Integrated Transponder-Tagged Juvenile Salmonids in the Columbia and Snake Rivers, 2007. Prepared by Northwest Fisheries Science Center, National Oceanic and Atmospheric Administration, Seattle, Washington, and the Pacific Northwest National Laboratory, Richland, Washington, for Environmental Resources Branch, Planning and Engineering Division, Portland District, U.S. Army Corps of Engineers, Portland, Oregon. Contract no. W66QKZ60441152.
Ruzycki JR and RW Carmichael. 2010. Preliminary Summary of Out-of-Basin Steelhead Strays in the John Day River Basin. Oregon Department of Fish and Wildlife, La Grande, Oregon.
Ryan BA, M Carper, DM Marsh, D Elliott, T Murray, L Applegate, C McKibben, and S Mosterd. 2007. Alternative Barging Strategies to Improve Survival of Transported Juvenile Salmonids, 2006. Prepared by the Northwest Fisheries Science Center, National Oceanic and Atmospheric Administration, Seattle Washington, and the U.S. Geological Survey, Seattle, Washington, for the U.S. Army Corps of Engineers, Walla Walla District, Walla Walla Washington. Contract no. W68SBV60307671 and W68SBV60418618.
Sanders JE, JJ Long, CK Arakawa, JL Bartholomew, and JS Rohovec. 1992. “Prevalence of Renibacterium salmoninarum among downstream migrating salmonids in the Columbia River.” Journal of Aquatic Animal Health 4:72-75.
Sandford BP and SG Smith. 2002. “Estimation of smolt-to-adult return percentages for Snake River Basin anadromous salmonids, 1990-1997.” Journal of Agricultural Biological and Environmental Statistics 7:243-263.
Sandford, BP, Zabel, RW, Gilbreath, LG, and Smith, SG. 2012. Exploring Latent Mortality of Juvenile Salmonids Related to Migration through the Columbia River Hydropower System.

6.14
Schaller H, P Wilson, S Haeseker, C Petrosky, E Tinnus, T Dalton, R Woodin, E Weber, N Bouwes, T Berggren, J McCann, S Fassk, H Franzoni, P McHugh, and M Dehart. 2007. Comparative Survival Study (CSS) of PIT-Tagged Spring/Summer Chinook and Steelhead in the Columbia River Basin – Ten-Year Retrospective Analyses Report. Prepared by the U.S. Fish and Wildlife Service, the Idaho Department of Fish and Game, the Oregon Department of Fish and Wildlife, the Washington Department of Fish and Wildlife, the Columbia River Inter-Tribal Fish Commission, EcoLogic, and the Fish Passage Center, for the Bonneville Power Administration, Portland, Oregon. Project no. 1996-020-00, BPA Contract no. 25634, 25264, 20620; and Project no. 1994-033-00, BPA Contract no. 25247.
Scheuerell MD and JG Williams. 2005. “Forecasting climate-induced changes in the survival of Snake River spring/summer Chinook salmon (Oncorhynchus tshawytscha).” Fisheries Oceanography 14(6):448-457.
Scheuerell MD, PS Levin, RW Zabel, JG Williams, and BL Sanderson. 2005. “A new perspective on the importance of marine-derived nutrients to threatened stocks of Pacific salmon (Oncorhynchus spp.).” Canadian Journal of Fisheries and Aquatic Sciences 62:961-964.
Scheuerell MD, RW Zabel, and BP Sandford. 2009. “Relating juvenile migration timing and survival to adulthood in two species of threatened Pacific salmon (Oncorhynchus spp.).” Journal of Applied Ecology 46(5):983-990.
Schreck CB, MD Karnowski, BJ Clemens. 2005. Evaluation of Post Release Losses and Barging Strategies that Minimize Post Release Mortality. Prepared by Oregon Cooperative Fish and Wildlife Research Unit, Department of Fisheries and Wildlife, Oregon State University, Corvallis, Oregon, for the U.S. Army Corps of Engineers, Walla Walla District, Walla Walla, Washington. Contract no. DACW68-00-C-0028.
Schreck CB, TP Stahl, LE Davis, DD Roby, and BJ Clemens. 2006. “Mortality Estimates of Juvenile Spring-Summer Chinook Salmon in the Lower Columbia River and Estuary, 1992-1998: Evidence for Delayed Mortality?” Transactions of the American Fisheries Society 135(2):457-475.
Sebring SH, RD Ledgerwood, BP Sandford, A Evans, and GM Matthews. 2010a. Detection of Passive Integrated Transponder (PIT) Tags on Piscivorous Avian Colonies in the Columbia River Basin, 2008. Prepared by the National Marine Fisheries Service, National Oceanic and Atmospheric Administration, Seattle, Washington, for the Army Corps of Enginneers, Walla Walla District, Walla Walla, Washington. Contract no. 2RL4SPTP00.
Sebring SH, M Morrow, RD Ledgerwood, BP Sandford, A Evans, and GM Matthews. 2010b. Detection of Passive Integrated Transponder (PIT) Tags on Piscivorous Avian Colonies in the Columbia River Basin, 2009. Prepared by the National Marine Fisheries Service, National Oceanic and Atmospheric Administration, Seattle, Washington, for the Army Corps of Enginneers, Walla Walla District, Walla Walla, Washington. Contract no. 2RL4SPTP00.
Sebring SH, RD Ledgerwood, M Morrow, BP Sandford, and A Evans. 2012. Detection of Passive Integrated Transponder (PIT) Tags on Piscivorous Avian Colonies in the Columbia River Basin, 2010. Prepared by the National Marine Fisheries Service, National Oceanic and Atmospheric Administration, Seattle, Washington, for the Army Corps of Enginneers, Walla Walla District, Walla Walla, Washington.

6.15
Contract no. 2RL4SPTP00.Sigholt T, Staurnes M, Jakobsen HJ, Asgard T. 1995. “Effects of continuous light and short-day photoperiod on smolting, seawater survival and growth in Atlantic salmon (Salmo salar).” Aquaculture 130:373-388.
Smith SG, WD Muir, EE Hockersmith, RW Zabel, RJ Graves, CV Ross, WP Connor, and BD Arnsberg. 2003. “Influence of River Conditions on Survival and Travel Time of Snake River Subyearling Fall Chinook Salmon.” North American Journal of Fisheries Management 23(3):939-961.
Stefansson SO, AI Berge, and GS Gunnarsson. 1998. “Changes in seawater tolerance and gill Na+,K+-ATPase activity during desmoltification in Atlantic salmon kept in freshwater at different temperatures.” Aquaculture 168:271-277.
Sykes GE, CJ Johnson, and JM Shrimpton. 2009. “Temperature and Flow Effects on Migration Timing of Chinook Salmon Smolts.” Transactions of the American Fisheries Society 138(6):1252-1265.
Tiffan KF, CA Haskell, and DW Rondorf. 2003. “Thermal exposure of juvenile fall Chinook salmon migrating through a lower Snake reservoir.” Northwest Science 77:100-108.
Tiffan KF, TJ Kock, CA Haskell, WP Connor, and RK Steinhorst. 2009. “Water Velocity, Turbulence, and Migration Rate of Subyearling Fall Chinook Salmon in the Free-Flowing and Impounded Snake River.” Transactions of the American Fisheries Society 138(2):373-384.
Tuomikoski J, J McCann, T Berggren, H Schaller, P Wilson, S Haeseker, J Fryer, C Petrosky, E Tinus, T Dalton, and R Ehlke, and M DeHart. 2010. Comparative Survival Study (CSS) of PIT-tagged Spring/Summer Chinook and Summer Steelhead 2010 Annual Report. Prepared by the Fish Passage Center, the U.S. Fish and Wildlife Service, the Columbia River Intertribal Fish Commission, the Idaho Department of Fish and Game, the Oregon Department of Fish and Wildlife, and the Washington Department of Fish and Wildlife, for the Bonneville Power Administration, Portland, Oregon. BPA Contract no. 19960200.
Van Gaest AL, JP Dietrich, DE Thompson, DA Boylen, SA Strickland, TK Collier, FJ Loge, and MR Arkoosh. 2011. “Survey of Pathogens in Hatchery Chinook Salmon with Different Out-Migration Histories through the Snake and Columbia Rivers.” Journal of Aquatic Animal Health 23:62-77.
Wagner T, JL Congleton, and DM Marsh. 2004. “Smolt-to-adult return rates of juvenile chinook salmon transported through the Snake-Columbia River hydropower system, USA, in relation to densities of co-transported juvenile steelhead.” Fisheries Research 68(1-3):259-270.
Welker TL and JL Congleton. 2003. “Relationship between dietary lipid source, oxidative stress, and the physiological response to stress in sub-yearling chinook salmon (Oncorhynchus tshawytscha).” Fish Physiology and Biochemistry 29:225-235.
Welker TL and JL Congleton. 2009. “Preliminary examination of oxidative stress in juvenile spring Chinook salmon Oncorhynchus tshawytscha of wild origin sampled from transport barges.” Journal of Fish Biology 75(7):1895-1905.

6.16
Williams JG, SG Smith, RW Zabel, WD Muir, MD Scheuerell, BP Sandford, DM Marsh, RA McNatt, and S Achord. 2005. Effects of the Federal Columbia River Power System on Salmonid Populations. NOAA Technical Memorandum NMFS-NWFSC-63, U.S. Departhment of Commerce, Northwest Fisheries Center, National Oceanic Atmospheric Administration, Seattle, Washington.
Wilson P. 2010. “A Synthesis of Annual Estimates of TIR and D for Wild Populations.” Comparative Survival Study Annual Meeting. Presented by P Wilson, April 2, 2010. U.S. Army Corps of Engineers.
Yanke J 2006. “Effects of Passive Integrated Transponder (PIT) Tags and Elevated Water Temperatures on Survival, Growth, and Physiology of Snake River Fall Chinook Salmon Subyearlings (Oncorhynchus tshawystscha).” Thesis, University of Idaho, Moscow, Idaho.
Ylitalo GM, JE Stein, T Hom, LL Johnson, KL Tilbury, AJ Hall, T Rowles, D Greig, LJ Lowenstine, and FMD Gulland. 2005. “The role of organochlorines in cancer-associated mortality in California sea lions (Zalophus californianus).” Marine Pollution Bulletin 50:30-39.
Zabel RW and S Achord. 2004. “Relating size of juveniles to survival within and among populations of chinook salmon.” Ecology 85(3):795-806.
Zabel RW, J Faulkner, SG Smith, JJ Anderson, C Van Holmes, N Beer, S Iltis, J Krinke, G Fredricks, B Bellerud, J Sweet, and A Giorgi. 2008a. “Comprehensive passage (COMPASS) model: A model of downstream migration and survival of juvenile salmonids through a hydropower system.” Hydrobiologia 609:289-300.
Zabel RW, J Faulkner, SG Smith, JJ Anderson, C Van Homes, N Beer, S Iltix, J Krinke, G Fredricks, B Bellerud, J Sweet, and A Giorgi. 2008b. Comprehensive Passage (COMPASS) Model – Version 1.1, Review DRAFT. Prepared by the National Oceanic and Atmospheric Administration, National Marine Fisheries Service, Seattle, Washington, the University of Washington, Seattle Washington, the National Marine Fisheries Service, Portland, Oregon, the Bonneville Power Administration, Portland, Oregon, and BioAnalysts, Inc., Redmond, Washington.
Zabel RW, MD Scheuerell, MM McClure, and JG Williams. 2006. “The Interplay Between Climate Variability and Density Dependence in the Population Viability of Chinook Salmon.” Conservation Biology 20(1):190-200.
Zabel RW, T Wagner, JL Congleton, SG Smith, and JG Williams. 2005. “Survival and selection of migrating salmon from capture-recapture models with individual traits.” Ecological Applications 15:1427-1439.
Zabel RW and JG Williams. 2002. “Selective mortality in Chinook salmon: What is the role of human disturbance?” Ecological Applications 12(1):173-183.
Zaugg WS. 1982, “A simplified preparation for adenosine triphosphatase determination in gill tissue.” Canadian Journal of Fisheries and Aquatic Sciences 39:215–217
Copyright © 2022 FDOKUMEN