Raman microspectroscopy based sensor of algal lipid unsaturation
Upload
independentCategory
view
1download
0
DOI: 10.2478/s11535-007-0014-1Research article
CEJB 2(2) 2007 169–181
Delayed fluorescence in algal growth inhibition tests
Maja Berden-Zrimec1∗, Luka Drinovec1, Alexis Zrimec1, Tatjana Tisler2
1 Institute of Physical Biology,SI – 1290 Grosuplje, Slovenia
2 National Institute of Chemistry,SI – 1000 Ljubljana, Slovenia
Received 30 January 2007; accepted 8 March 2007
Abstract: A series of 72-hour growth inhibition tests with green alga Desmodesmus (Scenedesmus)subspicatus (ISO 8692) has been performed to test the delayed fluorescence (DF) parameters as possibleendpoint measurements. Sensitivity to five toxicants with direct and indirect effects on photosynthesiswas tested, and the median effective concentration (EC50) values derived from the cell concentration,absorbance and DF were compared. The sensitivity of DF intensity (DFI) was comparable with thetwo endpoints suggested in ISO 8692 for all five toxicants: potassium dichromate, 3,5-dichlorophenol(3,5-DCP), DCMU, copper and cadmium. In the case of potassium dichromate and copper, DFI wasmore sensitive than the other endpoints in this study. The analysis of DF relaxation kinetics showeda specific response to the herbicide DCMU. Additionally, a 24-hour test was performed with the sametoxicant concentrations (except copper), where DFI was measured 30 minutes, one hour and 24 hoursafter the exposure. The influence of toxicants on DFI after a 24-hour exposure was comparable with theeffects after 72 hours. Only 3,5-DCP influenced DFI after 30 minutes. DF proved to be a simple, reliableand rapid measurement to assess toxicity in algal tests, which can to some extent differentiate amongvarious toxicants.c© Versita Warsaw and Springer-Verlag Berlin Heidelberg. All rights reserved.
Keywords: Delayed fluorescence intensity, relaxation kinetics, Desmodesmus (Scenedesmus) subspicatus,algal toxicity testing, short-term test
1 Introduction
Algae are the dominant primary producer in most aquatic habitats and have an impor-
tant role in food chains, indirectly affecting also humans. They are very sensitive to a
variety of potential toxicants [1, 2], thus being very applicable in to toxicity testing. The
∗ E-mail: [email protected]
170 M. Berden-Zrimec et al. / Central European Journal of Biology 2(2) 2007 169–181
main holdback for an extensive use of algal growth inhibition tests are probably relatively
demanding protocols and measurements. At least two estimates of the biomass and/or
physiological response are recommended when monitoring algal cultures in toxicity tests
[3, 4]. Cell counting under a microscope is relatively simple, but can be less precise
than some other methods, although visual inspection provides important information on
the morphology of the cells [4]. On the other hand, electronic particle counting can be
time-consuming in many cases and the equipment costs are high [1]. Photometric deter-
mination of cell density is sensitive to interferences from suspended material and coloured
substances at low cell densities, which limits their use with environmental samples. Mea-
surements of extracted chlorophyll a are mostly preceded by a sample manipulation,
which represents an important source of errors [1]. These problems can be avoided by
simpler in vivo measurements, which do not demand an extensive handling of algae.
There are only a few means by which the abundance and physiological responses of
microalgae may be measured without destructive sampling [4]. These methods usually
require very sensitive measuring devices, but the procedures are simple with minimal
disturbance to the cells. In vivo chlorophyll fluorescence, which is a measure of prompt
fluorescence from the organisms, is already widely used in phyto-physiology studies [5, 6].
Flow cytometry is also a perspective method, offering many possibilities in toxicity testing
[7–9].
Delayed fluorescence (DF) is another in vivo measurement of the biomass and physi-
ological state of photosynthetic organisms, and can be observed as a long-lived low-level
photon emission after a short illumination pulse [10]. The emission spectrum resem-
bles the fluorescence emission spectrum of chlorophyll a [11–13]. The difference between
prompt fluorescence and DF is in the origin of the excited singlet state of the emitting
pigment molecule [13]. DF originates from the repopulation of excited states of chloro-
phyll from the stored energy after charge separation, whereas fluorescence reflects the
radiative de-excitation of excited chlorophyll molecules before the charge separation [13].
The fluorescence emission ceases within several nanoseconds after the illumination, which
populates the excited singlet state, is switched off [13]. DF lifetimes are much longer and
the measurement usually lasts from milliseconds to seconds after the illumination [13].
The main source of DF are back reactions in the photosystem II (PSII) [14], whereas the
photosystem I contributes much less to the DF emission [13]. In PSII, charge pairs are
generated during the illumination with positive charges located on the oxygen evolving
complex (OEC) and negative charges on quinone acceptors (QA and QB). The slow com-
ponents of DF originate in back reactions between the S2 and S3 states of the OEC and
quinones QA and QB [15]. The half-times of these reactions in isolated chloroplasts are
1.5 s for QA+S2/3 and 25 s for QB+S2/3 [14].
DF has a monotonic decay kinetics in the first seconds, which is sometimes followed
by a transient peak [16–18]. DF is affected by chemical and physical parameters, such
as different chemicals [19–21] or temperature [22, 23]. This variety of influences has in
common that they affect the reduction state of the plastoquinone pool or its coupling
with PSII by inhibiting the reversed electron flow [24]. Most important, DF is a feature
M. Berden-Zrimec et al. / Central European Journal of Biology 2(2) 2007 169–181 171
of living cells with active photosynthesis and DF intensity (DFI) can be used as a measure
of the living algal biomass [25].
DF has been used in research of metals’ effects on photosynthesis of algae and higher
plants [19, 25, 26]. Simple, reliable and rapid measurements as well as minimal sample
manipulation, e.g. incubating tested organisms in measuring cuvettes, lead to the stud-
ies of possible DF use in ecotoxicological tests. Drinovec and co-workers [20] tested DF
applicability as an endpoint of a 24-hour test with duckweed Lemna minor and showed
comparable sensitivity and reproducibility for testing metals to the standard 7-day test
and prompt fluorescence measurements. Sensitivity of DF of green alga Pseudokirchner-
iella subcapitata to Simazine (CAT) and 3,5-DCP has recently been studied by Katsumata
and co-workers [21] and DF proposed as a rapid ecotoxicological bioassay.
Many research groups have suggested that low algal densities and short duration of
the test improve the environmental relevance and reproducibility of laboratory-derived
toxicity data [1, 7, 8, 27]. High algal densities change the physico-chemical properties
of the medium and can also directly affect the bioavailability and toxicity of the tested
substances [1, 8]. On the other hand, low algal densities require highly sensitive methods
for the measurement such as the flow cytometry [7]. Photosynthesis parameters have
been proposed as a good endpoint of short tests with low algal densities [28]. Because
DF enables detection of changes at low algal densities, we tested a 24-hour procedure as
a possible short and simple method for algal toxicity testing.
The aim of our research was to evaluate DF as a possible endpoint of algal growth
inhibition test in a standard 72-hour test and 24-hour exposure. DF intensity and relax-
ation kinetics were analysed. We compared the proposed endpoint to the two methods
recommended by the ISO standard [3]. Two standard reference toxicants, potassium
dichromate and 3,5-dichlorophenol (3,5-DCP), as well as chemicals specifically influenc-
ing photosynthesis were used. Additionally, DF was measured after 30 minutes and 1 hour
of exposure to the toxicants.
2 Experimental procedures
2.1 Culturing of Desmodesmus (Scenedesmus) subspicatus
Green unicellular alga Desmodesmus (Scenedesmus) subspicatus Chodat 1926 (CCAP
276/20) was cultured in a nutrient solution prepared according to Jaworski [29] on an
orbital shaker (Tehtnica Zelezniki, EV 403), alternating 15 min agitation at 150 rpm
and 15 min resting, at the constant room temperature of 23±1◦C and under continuous
illumination (60±5 µmol m−2 s−1 PAR) with cool-white fluorescent lights.
2.2 72-hour growth inhibition test (ISO 8692)
The growth inhibition tests were performed following the protocol suggested in interna-
tional standard ISO 8692 [3]. A pre-culture of algae was started three days before the

172 M. Berden-Zrimec et al. / Central European Journal of Biology 2(2) 2007 169–181
beginning of the test with the growth medium recommended in the ISO 8692. For the
main experiment, algae were harvested from the batch culture during their exponential
growth phase. 40 ml cultures were prepared in 100 ml Erlenmeyer flasks, with the initial
algal concentration of 104 cells ml−1. The flasks were continuously shaken at 150 rpm
under a permanent cool-white fluorescent light (80±8 µmol m−2 s−1 Photosynthetically
Active Radiation (PAR)) and temperature 23±1◦C. At least two preliminary experiments
were conducted for each tested toxicant to select the appropriate concentration range for
toxicity tests [3] (ISO 8692). For each toxicant, two or more definitive tests with three
replicates were performed.
Cells for the measurements were harvested at the beginning of the test and subse-
quently every 24 hours. The cell concentration was determined in Burker counting cell
(Brand). Delayed fluorescence was measured in 1 ml samples in the luminometer [20].
Optical density of the same samples was measured in a spectrophotometer (Ocean Optics
USB2000-VIS-NIR). Absorbance in 400-700 nm range was measured in standard cuvettes
with 10 mm optical path (Sarstedt 67.740).
2.3 Tested toxicants
Algae were exposed to concentration series of two toxicants, which are used as a refer-
ence toxicants in many standardized toxicity tests: 0.18, 0.32, 0.58, 1.05 and 1.89 mg l−1
(0.61–6.42 µmol l−1) of potassium dichromate (K2Cr2O7) and 1, 2, 3, 4 and 5 mg l−1
(6.14–30.68 µmol l−1) of 3,5-DCP (3,5-dichlorophenol, Cl2C6H3OH). Cr(VI) has many
toxic effects on growth and physiological processes in photosynthetic organisms [30].
3,5-DCP is an inhibitor of respiration [21], of electron transport in thylakoids and of
photophosphorylation [31].
Copper and cadmium can influence photosynthesis by inhibiting processes in pho-
tosynthetic electron chain [32, 33]. The tested concentrations were 0.03, 0.045, 0.0675,
0.101, 0.152 mg l−1 (0.27–1.35 µmol l−1) of Cd2+ (as CdCl2), and 0.02, 0.06, 0.18, 0.54,
1.62 mg l−1 (0.32 – 25.49 µmol l−1) of Cu2+ (as CuCl2).
The herbicide DCMU (diuron, 3-(3,4-dichlorophenyl)-1,1-dimethylurea) is a PSII-
specific inhibitor, blocking electron transport and is routinely used in photosynthesis
research [31, 34]. It was prepared in acetone, which was non-toxic to D. subspicatus in
the final tested concentration (0.0027 v/v%). Toxicity of different concentrations of ace-
tone to D. subspicatus was preliminary tested to select appropriate solvent for DCMU.
The algae were exposed to 0.0033, 0.01, 0.03, 0.09, 0.27 mg l−1 (0.014–1.158 µmol l−1)
DCMU with the same concentration of acetone, which was also used in controls for DCMU
testing.
2.4 24-hour delayed fluorescence test
The cultures for the tests were prepared following the same protocol as in the growth
inhibition tests with the initial algal concentration of 104 cells ml−1 [3]. The toxicants used
M. Berden-Zrimec et al. / Central European Journal of Biology 2(2) 2007 169–181 173
were potassium dichromate, 3,5-DCP, DCMU and Cd2+. After the toxicants addition
in the same final concentrations as for the growth inhibition tests, 1 ml samples were
transferred to 6 ml round cuvettes (Sarstedt 58.485), which were used for measurements
in the luminometer [20]. The cuvettes were closed with a transparent plastic foil and
incubated under continuous cool white fluorescent light 100±10 µmol m−2 s−1 PAR at
23±0.5◦C. Higher light intensity than in the 72-hour test was used to promote culture
growth. DFI of the samples was measured immediately after toxicant addition and after
24 hours. In one series of experiments the influence of exposure to toxicants on DFI was
measured also after 30 minutes and after one hour.
2.5 Delayed fluorescence measurements
DF was measured in a custom-made photon-counting luminometer [20]. The samples
were illuminated by a 20 W halogen lamp equipped with a heat-absorbing filter, which
provided 400-800 nm light with a maximum at 650 nm. The illumination intensity at
sample position was 60 µmol m−2 s−1 PAR. The sample was illuminated from above for
3 s in a temperature-controlled holder adjusted to 23±0.2◦C. DF was measured in the
interval 1-60 s after the illumination pulse. Before each DF measurement, the background
DF signal and dark count from the photomultiplier tube were measured and subtracted
from the DF values in the analysis. The detector was a red-light-sensitive photomultiplier
tube (Hamamatsu R1104) with a Hamamatsu C3866 Photon Counting Unit for signal
conditioning and amplification. The integration time was 100 ms.
2.6 Data analyses
The median effective concentration (EC50) was defined as a toxicant concentration that
resulted in the 50% reduction of growth rate compared to the control (cultures without
added toxicants). Values were obtained by the linear regression analysis on the growth
rates in different toxicant concentrations. Data were statistically analysed by means of the
Student’s t-test using a significance level of 0.05 [35]. DF intensity (DFI) was calculated
from the relaxation curve as an average DF in the time interval from 1 to 60 s after the
illumination.
3 Results
3.1 72-hour growth inhibition test - comparison of EC50 values of different
endpoints derived from growth rates
EC50 values for the measured endpoints were calculated from the growth rates and are
presented in the Table 1. In general, DFI sensitivity to the tested toxicants was compara-
ble to the sensitivity of the cell concentration and absorbance. DFI was significantly more
sensitive to potassium dichromate, 3,5-DCP and copper than the cell concentration. DFI
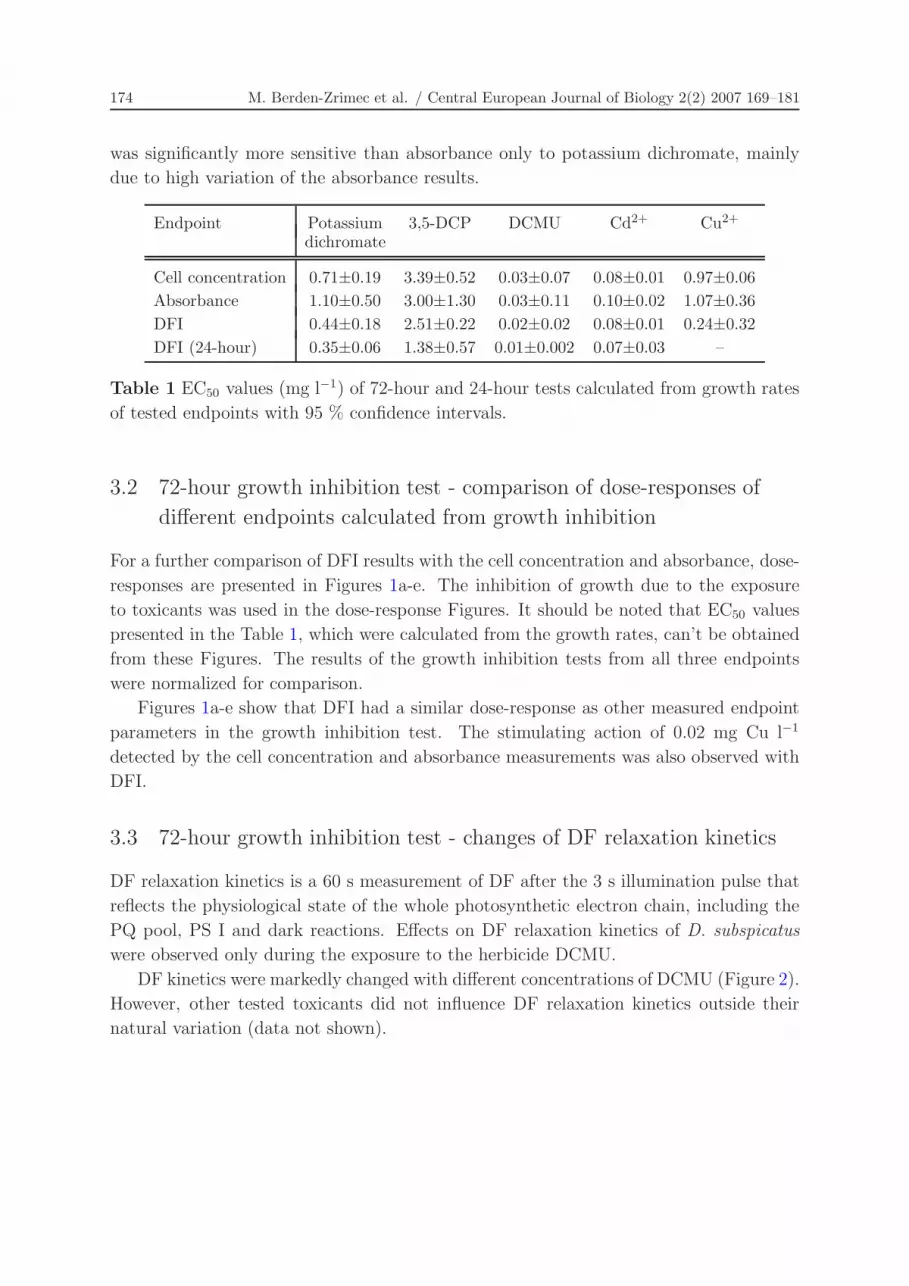
174 M. Berden-Zrimec et al. / Central European Journal of Biology 2(2) 2007 169–181
was significantly more sensitive than absorbance only to potassium dichromate, mainly
due to high variation of the absorbance results.
Endpoint Potassium 3,5-DCP DCMU Cd2+ Cu2+
dichromate
Cell concentration 0.71±0.19 3.39±0.52 0.03±0.07 0.08±0.01 0.97±0.06Absorbance 1.10±0.50 3.00±1.30 0.03±0.11 0.10±0.02 1.07±0.36DFI 0.44±0.18 2.51±0.22 0.02±0.02 0.08±0.01 0.24±0.32DFI (24-hour) 0.35±0.06 1.38±0.57 0.01±0.002 0.07±0.03 –
Table 1 EC50 values (mg l−1) of 72-hour and 24-hour tests calculated from growth rates
of tested endpoints with 95 % confidence intervals.
3.2 72-hour growth inhibition test - comparison of dose-responses of
different endpoints calculated from growth inhibition
For a further comparison of DFI results with the cell concentration and absorbance, dose-
responses are presented in Figures 1a-e. The inhibition of growth due to the exposure
to toxicants was used in the dose-response Figures. It should be noted that EC50 values
presented in the Table 1, which were calculated from the growth rates, can’t be obtained
from these Figures. The results of the growth inhibition tests from all three endpoints
were normalized for comparison.
Figures 1a-e show that DFI had a similar dose-response as other measured endpoint
parameters in the growth inhibition test. The stimulating action of 0.02 mg Cu l−1
detected by the cell concentration and absorbance measurements was also observed with
DFI.
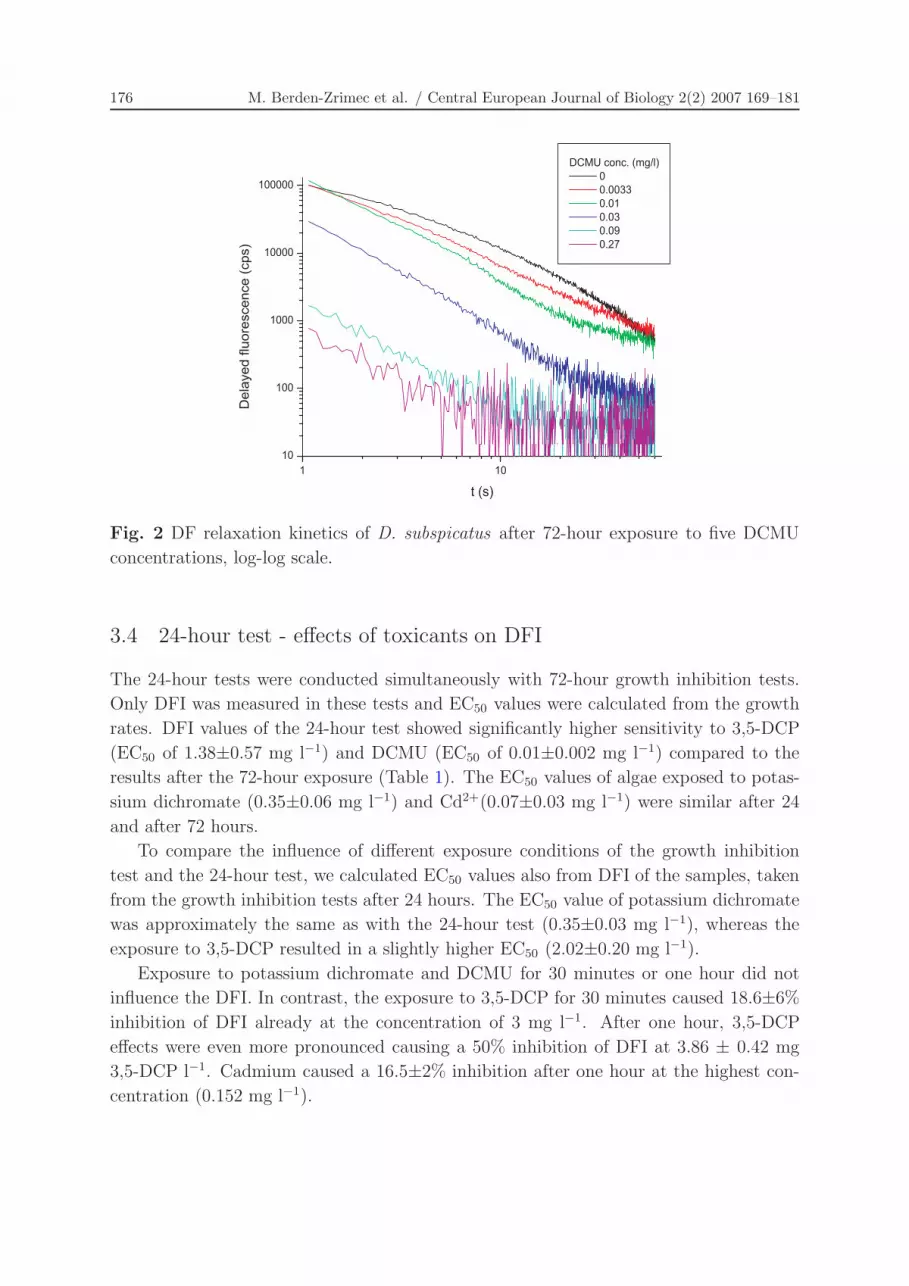
3.3 72-hour growth inhibition test - changes of DF relaxation kinetics
DF relaxation kinetics is a 60 s measurement of DF after the 3 s illumination pulse that
reflects the physiological state of the whole photosynthetic electron chain, including the
PQ pool, PS I and dark reactions. Effects on DF relaxation kinetics of D. subspicatus
were observed only during the exposure to the herbicide DCMU.
DF kinetics were markedly changed with different concentrations of DCMU (Figure 2).
However, other tested toxicants did not influence DF relaxation kinetics outside their
natural variation (data not shown).

M. Berden-Zrimec et al. / Central European Journal of Biology 2(2) 2007 169–181 175
a) b)
c) d)
e)
Fig. 1 Normalized dose-response of different endpoint measurements, presented as
inhibition of growth due to exposure to toxicants: (a) Potassium dichromate;
(b) 3,5-dichlorophenol; (c) DCMU; (d) Cadmium; (e) Copper. Error bars represent stan-
dard deviation. The concentrations indicated as “0” represent non-exposed algae and are
all normalized to value “1” for easier comparison.
176 M. Berden-Zrimec et al. / Central European Journal of Biology 2(2) 2007 169–181
Fig. 2 DF relaxation kinetics of D. subspicatus after 72-hour exposure to five DCMU
concentrations, log-log scale.
3.4 24-hour test - effects of toxicants on DFI
The 24-hour tests were conducted simultaneously with 72-hour growth inhibition tests.
Only DFI was measured in these tests and EC50 values were calculated from the growth
rates. DFI values of the 24-hour test showed significantly higher sensitivity to 3,5-DCP
(EC50 of 1.38±0.57 mg l−1) and DCMU (EC50 of 0.01±0.002 mg l−1) compared to the
results after the 72-hour exposure (Table 1). The EC50 values of algae exposed to potas-
sium dichromate (0.35±0.06 mg l−1) and Cd2+(0.07±0.03 mg l−1) were similar after 24
and after 72 hours.
To compare the influence of different exposure conditions of the growth inhibition
test and the 24-hour test, we calculated EC50 values also from DFI of the samples, taken
from the growth inhibition tests after 24 hours. The EC50 value of potassium dichromate
was approximately the same as with the 24-hour test (0.35±0.03 mg l−1), whereas the
exposure to 3,5-DCP resulted in a slightly higher EC50 (2.02±0.20 mg l−1).
Exposure to potassium dichromate and DCMU for 30 minutes or one hour did not
influence the DFI. In contrast, the exposure to 3,5-DCP for 30 minutes caused 18.6±6%
inhibition of DFI already at the concentration of 3 mg l−1. After one hour, 3,5-DCP
effects were even more pronounced causing a 50% inhibition of DFI at 3.86 ± 0.42 mg
3,5-DCP l−1. Cadmium caused a 16.5±2% inhibition after one hour at the highest con-
centration (0.152 mg l−1).

M. Berden-Zrimec et al. / Central European Journal of Biology 2(2) 2007 169–181 177
4 Discussion
In general, DFI was equally or more sensitive to the tested toxicants compared with the
cell concentration and absorbance, which are standard parameters in the algal growth
inhibition tests. Although all the three tested endpoints are a measure of the biomass,
DFI detects only living cells with active photosynthesis, whereas distinguishing live and
dead cells can be problematic under a microscope or with absorbance measurements.
Regarding this, the differences in sensitivity were not surprising.
The 24-hour test was even more sensitive, especially to DCMU, and to 3,5-DCP, which
influenced DFI within 30 minutes of the exposure. However, other tested toxicants did not
have any effects on DFI after 30 minutes. 3,5-DCP influenced the DFI of several other
unicellular algae almost instantly after having been added, for example in the marine
alga Dunaliella tertiolecta [23] and the freshwater alga Pseudokirchneriella subcapitata
(previously Selenastrum capricornutum) [21]. After one hour, cadmium also inhibited
the DFI of D. subspicatus.
A strong inhibition of DFI by potassium dichromate was expected due to the known
deleterious effects of Cr(VI) on photosynthesis [30]. DFI sensitivity to copper could be
the consequence of influence of Cu2+ ions on PSII system [33], although it is possible that
effects on dark reactions and plastoquinone pool prevailed [20]. The stimulating action
of 0.02 mg Cu l−1 is in agreement with other studies [7, 33, 36]. Cadmium concentrations
of more than 0.3 mg l−1clearly perturbed PSII function in the Barraza and Carballeira
study [37]. In our case, much lower concentrations resulted in the 50% DFI inhibition
within 24 hours.
The suitability of photosynthesis as an endpoint of algal toxicity tests has already been
shown on numerous occasions. The response of P. subcapitata to potassium dichromate
calculated from the fluorescence measurements was comparable to the response evaluated
from the measurements of the cell concentration, or even more sensitive for concentrations
higher than 1 mg l−1 [1]. The relative intensity of P. subcapitata DF after the 15-minute
exposure to Simazine (CAT) and 3,5-DCP was comparable to the results of a standard
algal inhibition test [21].
From the DF measurements, various parameters can be derived, such as DFI, DF
kinetics and DF excitation spectra. Their various responses can enable selectivity for
certain groups of toxicants that influence different sites in the photosynthetic electron
chain. In our study, herbicide DCMU, which directly blocks the electron transport in PSII
[31, 34], changed the DF relaxation kinetics in a dose dependent manner. Conversely,
Cr(VI) and copper did not influence DF relaxation kinetics of D. subspicatus, but inhibited
DFI more than the cell concentration and absorbance.
Our results support the findings of many authors who have already shown that short-
term algal toxicity tests are more sensitive to toxicants than standard growth inhibition
tests [2, 21, 27]. In comparison to many measurements of the photosynthesis response in
algal assays, DF measurements are much simpler and quicker, minimizing the handling of
samples and the associated errors. The additional advantage of the presented 24-hour test

178 M. Berden-Zrimec et al. / Central European Journal of Biology 2(2) 2007 169–181
is the use of small volumes of samples, incubated in a measuring cuvette, which enables
utilisation of numerous parallels under a more homogenous illumination compared to tests
using Erlenmayer flasks [6]. The illumination in algal toxicity tests is of major importance,
because uncontrollable variations in the light regime are probably the largest source of
experimental error [38]. Similar volumes have already been used in a miniscale algal
toxicity test suggested for standardization [39].
An important advantage of many short-term tests is also the utilization of low cell
concentrations. In the growth inhibition test ISO 8692, final cell concentrations after 72
hours are in the range of 106 cells ml−1. High algal densities are problematic, because
they change the physico-chemical properties of the medium and can directly affect the
bioavailability and toxicity of the tested substances [1]. DFI allows a precise determina-
tion of the living biomass for cell densities 103 cells ml−1 or less, but with the equipment
used in this study [20] concentrations of 104 cells ml−1 were necessary to follow also DF
relaxation kinetics. With further optimisation of the measuring device [20] for toxicity
testing, DF relaxation kinetics could be measured at lower cell concentrations.
Apart from the high cost equipment usually required for high sensitivity, short-term
tests are mostly more cost-effective as standard tests, which makes them very applicable
for extensive toxicity studies, rapid toxicity screening of large polluted areas or areas
considered for ecological agriculture, where the environment has to be non-toxic. Nu-
merous sampling sites are extremely important in assessing the extent of pollution in the
environment. Assessing toxicity of complex matrices with DF measurements excludes
problems with the fluorescent background [28], which can be problematic for example in
waste water effluents.
5 Conclusions
DF measurements are rapid, sensitive and well reproducible, which makes them a good
choice for toxicity tests.
Various endpoints can be derived from DF measurements, potentially enabling specific
detection of certain groups of toxicants.
DF measurements showed comparable or more sensitive results than the measured
standard growth inhibition tests’ endpoints for the tested toxicants.
Minimal sample handling is required for DF measurements, which reduces the sample
manipulation connected errors.
DF is sensitive enough to enable short-term miniscale tests with relatively low cell
concentrations and thus higher relevance of toxicity tests.
DF measurements in complex matrices exclude problems with fluorescent background.
Acknowledgment
This work was financed by the Slovenian Research Agency (grants L4-6222, V4-0106 and
P1-0237). We are grateful to Emil Meden and Tanja Urh for their assistance with the
measurements and Lidija Berden for revising the language.

M. Berden-Zrimec et al. / Central European Journal of Biology 2(2) 2007 169–181 179
References
[1] P. Mayer, R. Cuhel and N. Nyholm: “A simple in vitro fluorescence method for
biomass measurements in algal growth inhibition tests”, Water Res., Vol. 31, (1997),
pp. 2525–2531.
[2] H. Kaneko, A. Shimada and K. Hirayama: “Short-term algal toxicity test based on
phosphate uptake”, Water Res., Vol. 38, (2004), pp. 2173-2177.
[3] ISO 8692: Water quality – Freshwater algal growth inhibition test with unicellular
green algae, International Organization for Standardization, Geneve, Switzerland,
2004.
[4] H.L. MacIntyre and J.J. Cullen: “Using cultures to investigate the physiological
ecology of microalgae”, In: R.A. Andersen: Algal culturing techniques, Phycological
Society of America, Elsevier Academic Press, 2005, pp. 287–326.
[5] DIN 38412: Testverfahren mit Wasserorganismen (Gruppe L) – Bestimmung
der nicht giftigen Wirkung von Abwasser gegenuber Grunalgen (Scenedesmus-
Chlorophyll-Fluoreszenztest) uber Verdunnungsstufen (L 33), Deutsches Institut fur
Normung e.V., Beuth Verlag GmbH, Berlin, 1991.
[6] A. Eisentraeger, W. Dott, J. Klein and S. Hahn: “Comparative studies on algal
toxicity testing using fluorimetric microplate and Erlenmayer flask growth-inhibition
assays”, Ecotoxicol. Environ. Saf., Vol. 54, (2003), pp. 346–354.
[7] N.M. Franklin, J.L. Stauber and R.P. Lim: “Development of flow cytometry-based
algal bioassays for assessing toxicity of copper in natural waters”, Environ. Toxicol.
Chem., Vol. 20, (2001), pp. 160–170.
[8] N.M. Franklin, J.L. Stauber, S.C. Apte and R.P. Lim: “Effect of initial cell density on
the bioavailability and toxicity of copper in microalgal bioassays”, Environ. Toxicol.
Chem., Vol. 21, (2002), pp. 742–751.
[9] N.M. Franklin, J.L. Stauber and R.P. Lim: “Development of multispecies algal bioas-
says using flow cytometry”, Environ. Toxicol. Chem., Vol. 23, (2004), pp. 1452–1462.
[10] B.L. Strehler and W. Arnold: “Light production by green plants”, J. Gen. Physiol.,
Vol. 34, (1951), pp. 809–20.
[11] W. Arnold and J.B. Davidson: “The identity of the fluorescent and delayed light
emission spectra in Chlorella”, J. Gen. Physiol., Vol. 37, (1954), pp. 677–684.
[12] R. Van Wijk, A. Scordino, A. Triglia, F. Musumeci: ”Simultaneous measurements
of Delayed Luminescence and chloroplast organization from Acetabularia”, J. Pho-
tochem. Photobiol., B Biol., Vol. 40, (1999), pp. 142–149.
[13] P.A. Jursinic: “Delayed fluorescence: Current concepts and status”, In: A.J. Govind-
jee and D.C. Fork: Light emission by plant and bacteria, Academic Press, New York,
1986, pp. 291–328.
[14] A.W. Rutherford and Y. Inoue: “Oscillation of delayed luminescence from PS II:
recombination of S2Q−B and S3Q
−B”, FEBS Lett., Vol. 165, (1984), pp. 163–170.

180 M. Berden-Zrimec et al. / Central European Journal of Biology 2(2) 2007 169–181
[15] P. Joliot, A. Joliot, B. Bouges and G. Barbieri: “Studies of a system II photocenters
by comparative measurements of luminescence, fluorescence, and oxygen emission”,
Photochem. Photobiol., Vol. 14, (1971), pp. 287–305.
[16] E. Hideg, M. Kobayashi and H. Inaba: “The far red induced slow component of
delayed light from chloroplasts is emitted from photosystem-II – evidence from
emission-spectroscopy”, Photosynth. Res., Vol. 29, (1991), pp. 107–112.
[17] Y. Yan, F.A. Popp, S. Sigrist, D. Schlesinger, A. Dolf, Z. Yan, S. Cohen and A.
Chotia: “Further analysis of delayed luminescence of plants”, J. Photochem. Photo-
biol., B Biol., Vol. 78, (2005), pp. 235–244.
[18] M. Monti, A. Zrimec, A. Beran, M. Berden-Zrimec, L. Drinovec, G. Kosi and F.
Tamberlich: “Delayed luminescence of Prorocentrum minimum under controlled con-
ditions”, Harmful Algae, Vol. 4, (2005), pp. 643–650.
[19] P. Joliot and A. Joliot: “Dependence of delayed luminescence upon adenosine triphos-
phatase activity in Chlorella”, Plant Physiol., Vol. 65, (1980), pp. 691–696.
[20] L. Drinovec, D. Drobne, I. Jerman and A. Zrimec: “Delayed fluorescence of Lemna
minor : A biomarker of the effects of copper, cadmium, and zinc”, Bull. Environ.
Contam. Toxicol., Vol. 72, (2004), pp. 896–902.
[21] M. Katsumata, T. Koike, M. Nishikawa, K. Kazumura and H. Tsuchiya: “Rapid
ecotoxicological bioassay using delayed fluorescence in the green alga Pseudokirch-
neriella subcapitata”, Water Res., Vol. 40, (2006), pp. 3393–3400.
[22] C. Wang, D. Xing and Q. Chen: “A novel method for measuring photosynthesis
using delayed fluorescence of chloroplast”, Biosens. Bioelectron., Vol. 20, (2004), pp.
454–459.
[23] A. Zrimec, L. Drinovec and M. Berden-Zrimec: “Influence of chemical and physical
factors on long-term delayed fluorescence in Dunaliella tertiolecta”, Electromagn.
Biol. Med., Vol. 24, (2005), pp. 309–318.
[24] S. Mellvig and J.E. Tillberg: “Transient peaks in the delayed luminescence from
Scenedesmus obtusiusculus induced by phosphorus starvation and carbon dioxide
deficiency”, Physiol. Plant., Vol. 68, (1986), pp. 180–188.
[25] K.H. Wiltshire, S. Harsdorf, B. Smidt, G. Blocker, R. Reuter and F. Schroeder: “The
determination of algal biomass (as chlorophyll) in suspended matter from the Elbe
estuary and the German Bight: A comparison of high-performance liquid chromatog-
raphy, delayed fluorescence and prompt fluorescence methods”, J. Exp. Mar. Biol.
Ecol., Vol. 222, (1998), pp. 113–131.
[26] N. Mohanty, I. Vass and S. Demeter: “Copper toxicity affects Photosystem II electron
transport at the secondary quinine acceptor, QB”, Plant Physiol., Vol. 90, (1989),
pp. 175–179.
[27] J.H. Lin, W.C. Kao, K.P. Tsai and C.Y. Chen: “A novel algal toxicity testing tech-
nique for assessing the toxicity of both metallic and organic toxicants”, Water Res.,
Vol. 39, (2005), pp. 1869–1877.
[28] J.A. Thompson: “Cellular fluorescence capacity as an endpoint in algal toxicity test-
ing”, Chemosphere, Vol. 35, (1997), pp. 2027–2037.

M. Berden-Zrimec et al. / Central European Journal of Biology 2(2) 2007 169–181 181
[29] A.S. Thompson, J.C. Rhodes and I. Pettman: Culture collection of algae and pro-
tozoa, Catalogue of strains, Culture Collection of Algae and Protozoa Freshwater
Biological Association, Cumbria, 1988.
[30] A.K. Shanker, C. Cervantes, H. Loza-Tavera and S. Avudainayagam: “Chromium
toxicity in plants, review article”, Environ. Int., Vol. 31, (2005), pp. 739–753.
[31] M. Tissut, G. Taillandier, P. Ravanel and J.L. Benoit-Guyod: “Effects of chlorophe-
nols on isolated class A chloroplasts and thylacoids: a QSAR study”, Ecotoxicol.
Environ. Saf., Vol. 13, (1987), pp. 32–42.
[32] S.E. Plekhanov and Y.K. Chemeris: “Early toxic effects of zinc, cobalt, and cadmium
on photosynthetic activity of the green alga Chlorella pyrenoidosa Chick S-39”, Biol.
Bull., Vol. 30, (2003), pp. 506–511.
[33] K. Burda, J. Kruk, K. Strzalka and G.H. Schmid: “Stimulation of oxygene evolution
in Photosystem II by copper(II) ions”, Z. Naturforsch., Vol. 57c, (2002), pp. 853–857.
[34] M.J. Behrenfeld, O. Prasil, Z.S. Kolber, M. Babin and P.G. Falkowski: “Compen-
satory changes in Photosystem II electron turnover rates protect photosynthesis from
photoinhibition”, Photosynth. Res., Vol. 58, (1998), pp. 259–268.
[35] H.J. Motulski and A. Chrisopoulos: Fitting models to biological data using linear
and nonlinear regression – A practical guide to curve fitting, GraphPad Software
Inc., San Diego, California, USA, 2003.
[36] J.D. Schaffer and M.J. Sebetich: “Effects of aquatic herbicides on primary produc-
tivity of phytoplankton in laboratory”, Bull. Environ. Contam. Toxicol., Vol. 72,
(2004), pp. 1032–1037.
[37] J.E. Barraza and A. Carballeira: “Chlorophyll fluorescence analysis and cadmium-
copper bioaccumulation in Ulva rigida (C. Agardh)”, Boletin del Instituto Espanol
de Oceanografia, Vol. 15, (1999), pp. 395–399.
[38] A.T. Smith: “Comparison of information-yield from different experimental designs
used in algal toxicity testing of chemical mixtures”, Environ. Pollut., Vol. 102, (1998),
pp. 205–212.
[39] P. Arensberg, V.H. Hemmingsen and N. Nyholm: “A miniscale algal toxicity test”,
Chemosphere, Vol. 30, (1995), pp. 2103–2115.
Copyright © 2022 FDOKUMEN