Mortality Expectations of Older Mexicans
54
A RAND LABOR AND POPULATION CENTER Center for Latin American Social Policy For More Information Visit RAND at www.rand.org Explore RAND Center for Latin American Social Policy View document details Support RAND Browse Reports & Bookstore Make a charitable contribution Limited Electronic Distribution Rights is document and trademark(s) contained herein are protected by law as indicated in a notice appearing later in this work. is electronic representation of RAND intellectual property is provided for non- commercial use only. Unauthorized posting of RAND electronic documents to a non-RAND website is prohibited. RAND electronic documents are protected under copyright law. Permission is required from RAND to reproduce, or reuse in another form, any of our research documents for commercial use. For information on reprint and linking permissions, please see RAND Permissions. Skip all front matter: Jump to Page 16 e RAND Corporation is a nonprofit institution that helps improve policy and decisionmaking through research and analysis. is electronic document was made available from www.rand.org as a public service of the RAND Corporation. CHILDREN AND FAMILIES EDUCATION AND THE ARTS ENERGY AND ENVIRONMENT HEALTH AND HEALTH CARE INFRASTRUCTURE AND TRANSPORTATION INTERNATIONAL AFFAIRS LAW AND BUSINESS NATIONAL SECURITY POPULATION AND AGING PUBLIC SAFETY SCIENCE AND TECHNOLOGY TERRORISM AND HOMELAND SECURITY
Transcript of Mortality Expectations of Older Mexicans

A RAND LABOR AND POPULATION CENTER
Center for Latin American Social Policy
For More InformationVisit RAND at www.rand.org
Explore RAND Center for Latin American Social Policy
View document details
Support RANDBrowse Reports & Bookstore
Make a charitable contribution
Limited Electronic Distribution RightsThis document and trademark(s) contained herein are protected by law as indicated in a notice appearing later in this work. This electronic representation of RAND intellectual property is provided for non-commercial use only. Unauthorized posting of RAND electronic documents to a non-RAND website is prohibited. RAND electronic documents are protected under copyright law. Permission is required from RAND to reproduce, or reuse in another form, any of our research documents for commercial use. For information on reprint and linking permissions, please see RAND Permissions.
Skip all front matter: Jump to Page 16
The RAND Corporation is a nonprofit institution that helps improve policy and decisionmaking through research and analysis.
This electronic document was made available from www.rand.org as a public service of the RAND Corporation.
CHILDREN AND FAMILIES
EDUCATION AND THE ARTS
ENERGY AND ENVIRONMENT
HEALTH AND HEALTH CARE
INFRASTRUCTURE AND TRANSPORTATION
INTERNATIONAL AFFAIRS
LAW AND BUSINESS
NATIONAL SECURITY
POPULATION AND AGING
PUBLIC SAFETY
SCIENCE AND TECHNOLOGY
TERRORISM AND HOMELAND SECURITY

This product is part of the RAND Corporation technical report series. Reports may include research findings on a specific topic that is limited in scope; present discussions of the methodology employed in research; provide literature reviews, survey instru-ments, modeling exercises, guidelines for practitioners and research professionals, and supporting documentation; or deliver preliminary findings. All RAND reports un-dergo rigorous peer review to ensure that they meet high standards for research quality and objectivity.
A RAND LABOR AND POPULATION CENTER
Center for Latin American Social Policy
TECHNICAL REPORT
Mortality Expectations of Older Mexicans
Development and Testing of Survey Measures
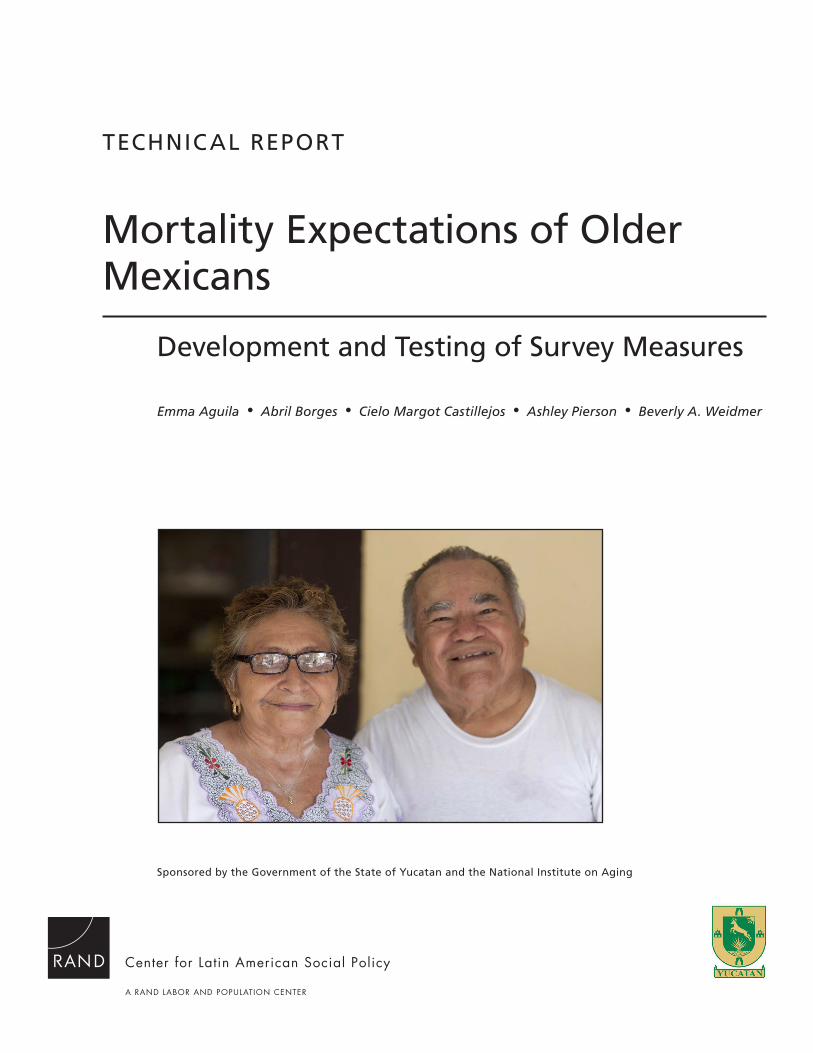
Emma Aguila • Abril Borges • Cielo Margot Castillejos • Ashley Pierson • Beverly A. Weidmer
Sponsored by the Government of the State of Yucatan and the National Institute on Aging

The RAND Corporation is a nonprofit institution that helps improve policy and decisionmaking through research and analysis. RAND’s publications do not necessarily reflect the opinions of its research clients and sponsors.
R® is a registered trademark.
© Copyright 2014 RAND Corporation
Permission is given to duplicate this document for personal use only, as long as it is unaltered and complete. Copies may not be duplicated for commercial purposes. Unauthorized posting of RAND documents to a non-RAND website is prohibited. RAND documents are protected under copyright law. For information on reprint and linking permissions, please visit the RAND permissions page (http://www.rand.org/publications/ permissions.html).
Published 2013 by the RAND Corporation1776 Main Street, P.O. Box 2138, Santa Monica, CA 90407-2138
1200 South Hayes Street, Arlington, VA 22202-50504570 Fifth Avenue, Suite 600, Pittsburgh, PA 15213-2665
RAND URL: http://www.rand.orgTo order RAND documents or to obtain additional information, contact
Distribution Services: Telephone: (310) 451-7002; Fax: (310) 451-6915; Email: [email protected]
Title page photo courtesy of Mariana Musi.
The research described in this report was made possible with funding from the government of the state of Yucatan, the U.S. National Institute on Aging (NIA) (through grants R01AG035008, P01AG022481, and R21AG033312), the RAND Center for the Study of Aging (with grant P30AG012815 from NIA), RAND Labor and Population, and the RAND Center for Latin American Social Policy (CLASP).

iii
Preface
The government of the state of Yucatan, Mexico, and the RAND Corporation are working collaboratively to design and evaluate a state-government program to alleviate poverty among the elderly by providing noncontributory pensions to adults age 70 and older. The evaluation of this program includes the assessment of the noncontributory pension program’s effects on the health and well-being of beneficiaries. A series of RAND reports describes the program, its implementation, and evaluation, and related topics. (See Aguila, Kapteyn, et al., 2013, and Aguila, Borges, et al., 2013, for a detailed description of the larger project.)
Part of the survey for impact evaluation included questions to measure subjective mor-tality expectations among the elderly—that is, elderly respondents’ expectations about their own mortality. Although they were adapted from those used in the Health and Retirement Study surveys of older people in the United States, as well as those used in similar surveys of older people in many other nations, the questions were difficult for most Yucatan respon-dents to understand. As a result, we decided to develop and test other measures to collect such information.
This report describes the development and testing of these new survey questions to mea-sure subjective mortality expectations among the elderly in Mexico. It should be of interest to those involved in survey development and methods, as well as those conducting research projects that collect primary data, particularly in developing countries or among an older population.
This research was made possible with funds from the government of the state of Yucatan; the U.S. National Institute on Aging (NIA) (through grants R01AG035008, P01AG022481, and R21AG033312); the RAND Center for the Study of Aging (with grant P30AG012815 from NIA); RAND Labor and Population; and the RAND Center for Latin American Social Policy (CLASP). Part of this research also is supported by an international advisory board of experts affiliated with University College London, Yale University, and the RAND Corporation.
RAND Labor and Population has built an international reputation for conducting objective, high-quality, empirical research to support and improve policies and organizations around the world. Its work focuses on children and families, demographic behavior, education and training, labor markets, social welfare policy, immigration, international development, financial decisionmaking, and issues related to aging and retirement with a common aim of understanding how policy and social and economic forces affect individual decisionmaking and human well-being.
CLASP, a part of RAND Labor and Population, unites a distinguished collective of inter-national researchers invested in addressing the most-pressing challenges and finding unique

iv Mortality Expectations of Older Mexicans: Development and Testing of Survey Measures
solutions that can contribute to a path of sustainable development for Latin Americans at home, in the United States, and around the world.
For questions and comments regarding CLASP, please contact Lucrecia Santibanez, director, CLASP, at 310-393-0411 x6310, or by email at [email protected].
For questions and comments regarding this report, please contact the project leader, Emma Aguila, at 310-393-0411 x6682; by email at [email protected]; or at the Uni-versity of Southern California, Sol Price School of Public Policy, 213-821-0702, or [email protected].
Materials related to this survey project, including the list of appendix materials and the list of technical reports and research papers, are available at http://www.rand.org/labor/centers/clasp/research/projects/social-security-program.html.

v
Contents
Preface . . . . . . . . . . . . . . . . . . . . . . . . . . . . . . . . . . . . . . . . . . . . . . . . . . . . . . . . . . . . . . . . . . . . . . . . . . . . . . . . . . . . . . . . . . . . . . . . . . . . . . . . . . . iiiFigures . . . . . . . . . . . . . . . . . . . . . . . . . . . . . . . . . . . . . . . . . . . . . . . . . . . . . . . . . . . . . . . . . . . . . . . . . . . . . . . . . . . . . . . . . . . . . . . . . . . . . . . . . . . viiTables . . . . . . . . . . . . . . . . . . . . . . . . . . . . . . . . . . . . . . . . . . . . . . . . . . . . . . . . . . . . . . . . . . . . . . . . . . . . . . . . . . . . . . . . . . . . . . . . . . . . . . . . . . . . ixSummary . . . . . . . . . . . . . . . . . . . . . . . . . . . . . . . . . . . . . . . . . . . . . . . . . . . . . . . . . . . . . . . . . . . . . . . . . . . . . . . . . . . . . . . . . . . . . . . . . . . . . . . . xiAcknowledgments . . . . . . . . . . . . . . . . . . . . . . . . . . . . . . . . . . . . . . . . . . . . . . . . . . . . . . . . . . . . . . . . . . . . . . . . . . . . . . . . . . . . . . . . . . . . xiiiAbbreviations . . . . . . . . . . . . . . . . . . . . . . . . . . . . . . . . . . . . . . . . . . . . . . . . . . . . . . . . . . . . . . . . . . . . . . . . . . . . . . . . . . . . . . . . . . . . . . . . . . . xv
ChAPTer One
Introduction . . . . . . . . . . . . . . . . . . . . . . . . . . . . . . . . . . . . . . . . . . . . . . . . . . . . . . . . . . . . . . . . . . . . . . . . . . . . . . . . . . . . . . . . . . . . . . . . . . . . . 1
ChAPTer TwO
Identifying Measures of Subjective Mortality. . . . . . . . . . . . . . . . . . . . . . . . . . . . . . . . . . . . . . . . . . . . . . . . . . . . . . . . . . . . . 3Expectation Elicitation in Developing Countries . . . . . . . . . . . . . . . . . . . . . . . . . . . . . . . . . . . . . . . . . . . . . . . . . . . . . . . . . . . . 5
ChAPTer Three
Initial Subjective Mortality Questions Implemented . . . . . . . . . . . . . . . . . . . . . . . . . . . . . . . . . . . . . . . . . . . . . . . . . . . . 7Initial Subjective Mortality Questions . . . . . . . . . . . . . . . . . . . . . . . . . . . . . . . . . . . . . . . . . . . . . . . . . . . . . . . . . . . . . . . . . . . . . . . . 7Results from the Baseline and Follow-Up Surveys . . . . . . . . . . . . . . . . . . . . . . . . . . . . . . . . . . . . . . . . . . . . . . . . . . . . . . . . . . . 8
ChAPTer FOur
Developing and Testing Measures of Subjective Mortality expectations . . . . . . . . . . . . . . . . . . . . . . . . . . . 17Overview of the Survey Questions on Mortality Expectations . . . . . . . . . . . . . . . . . . . . . . . . . . . . . . . . . . . . . . . . . . . . 18
Practice Questions . . . . . . . . . . . . . . . . . . . . . . . . . . . . . . . . . . . . . . . . . . . . . . . . . . . . . . . . . . . . . . . . . . . . . . . . . . . . . . . . . . . . . . . . . . . . 18Mortality-Expectation Questions . . . . . . . . . . . . . . . . . . . . . . . . . . . . . . . . . . . . . . . . . . . . . . . . . . . . . . . . . . . . . . . . . . . . . . . . . . . 19Visual Aids . . . . . . . . . . . . . . . . . . . . . . . . . . . . . . . . . . . . . . . . . . . . . . . . . . . . . . . . . . . . . . . . . . . . . . . . . . . . . . . . . . . . . . . . . . . . . . . . . . . . 20
Cognitive Interview Methods . . . . . . . . . . . . . . . . . . . . . . . . . . . . . . . . . . . . . . . . . . . . . . . . . . . . . . . . . . . . . . . . . . . . . . . . . . . . . . . . . 21Overview of U.S. Cognitive Interviews . . . . . . . . . . . . . . . . . . . . . . . . . . . . . . . . . . . . . . . . . . . . . . . . . . . . . . . . . . . . . . . . . . . . . . 25Overview of Mexico Cognitive Interviews . . . . . . . . . . . . . . . . . . . . . . . . . . . . . . . . . . . . . . . . . . . . . . . . . . . . . . . . . . . . . . . . . . 27
Round 1 . . . . . . . . . . . . . . . . . . . . . . . . . . . . . . . . . . . . . . . . . . . . . . . . . . . . . . . . . . . . . . . . . . . . . . . . . . . . . . . . . . . . . . . . . . . . . . . . . . . . . . . 27Round 2 . . . . . . . . . . . . . . . . . . . . . . . . . . . . . . . . . . . . . . . . . . . . . . . . . . . . . . . . . . . . . . . . . . . . . . . . . . . . . . . . . . . . . . . . . . . . . . . . . . . . . . . . 29
ChAPTer FIve
Conclusion . . . . . . . . . . . . . . . . . . . . . . . . . . . . . . . . . . . . . . . . . . . . . . . . . . . . . . . . . . . . . . . . . . . . . . . . . . . . . . . . . . . . . . . . . . . . . . . . . . . . . . 33
references . . . . . . . . . . . . . . . . . . . . . . . . . . . . . . . . . . . . . . . . . . . . . . . . . . . . . . . . . . . . . . . . . . . . . . . . . . . . . . . . . . . . . . . . . . . . . . . . . . . . . . . 35


vii
Figures
1.1. Mexico, the State of Yucatan, and the City of Merida . . . . . . . . . . . . . . . . . . . . . . . . . . . . . . . . . . . . . . . . . 2 3.1. Visual Aid for Baseline and Follow-Up Surveys: Ruler . . . . . . . . . . . . . . . . . . . . . . . . . . . . . . . . . . . . . . . . 8 3.2. Cumulative Distribution of Baseline and Follow-Up Responses to Mortality-
Expectation Question . . . . . . . . . . . . . . . . . . . . . . . . . . . . . . . . . . . . . . . . . . . . . . . . . . . . . . . . . . . . . . . . . . . . . . . . . . . . . 10 4.1. Visual Aid for U.S. Cognitive Interviews on Mortality Expectations: Trapezoidal
Modified Ruler . . . . . . . . . . . . . . . . . . . . . . . . . . . . . . . . . . . . . . . . . . . . . . . . . . . . . . . . . . . . . . . . . . . . . . . . . . . . . . . . . . . . . 21 4.2. Visual Aid for Mexico Cognitive Interviews on Mortality Expectations: Sliding
Modified Ruler . . . . . . . . . . . . . . . . . . . . . . . . . . . . . . . . . . . . . . . . . . . . . . . . . . . . . . . . . . . . . . . . . . . . . . . . . . . . . . . . . . . . 22 4.3. Visual Aid for U.S. and Mexico Cognitive Interviews on Mortality Expectations:
Stones . . . . . . . . . . . . . . . . . . . . . . . . . . . . . . . . . . . . . . . . . . . . . . . . . . . . . . . . . . . . . . . . . . . . . . . . . . . . . . . . . . . . . . . . . . . . . . . 22 4.4. Visual Aid for U.S. and Mexico Cognitive Interviews on Mortality Expectations:
Continuous Measure . . . . . . . . . . . . . . . . . . . . . . . . . . . . . . . . . . . . . . . . . . . . . . . . . . . . . . . . . . . . . . . . . . . . . . . . . . . . . 23 4.5. Visual Aid for U.S. and Mexico Cognitive Interviews on Mortality Expectations:
Stick Figures . . . . . . . . . . . . . . . . . . . . . . . . . . . . . . . . . . . . . . . . . . . . . . . . . . . . . . . . . . . . . . . . . . . . . . . . . . . . . . . . . . . . . . . 24


ix
Tables
3.1. Descriptive Statistics of Baseline Respondents, Valladolid and Motul, First Phase. . . . . . . . . 9 3.2. Item-Level Missing Data on Baseline and Follow-Up Surveys, by Geographic Area . . . . . . 11 3.3. Item-Level Missing Data on Baseline and Follow-Up Surveys, by Mayan-Speaking
Status . . . . . . . . . . . . . . . . . . . . . . . . . . . . . . . . . . . . . . . . . . . . . . . . . . . . . . . . . . . . . . . . . . . . . . . . . . . . . . . . . . . . . . . . . . . . . . . . 12 3.4. Item-Level Missing Data on Baseline and Follow-Up Surveys, by Education Level . . . . . . 12 3.5. Item-Level Missing Data on Baseline and Follow-Up Surveys, by Ability to Read
and Write Messages in Spanish . . . . . . . . . . . . . . . . . . . . . . . . . . . . . . . . . . . . . . . . . . . . . . . . . . . . . . . . . . . . . . . . . . 13 3.6. Mean Response of Chances of Living to Be a Certain Age, Baseline and Follow-Up
Surveys . . . . . . . . . . . . . . . . . . . . . . . . . . . . . . . . . . . . . . . . . . . . . . . . . . . . . . . . . . . . . . . . . . . . . . . . . . . . . . . . . . . . . . . . . . . . . . 13 3.7. Overview of Measurement Problems with Mortality-Expectation Questions . . . . . . . . . . . . . . 14 4.1. List of Practice Questions Used in Mortality-Expectation Cognitive Interviews . . . . . . . . . . 18 4.2. Visual Aids and Mortality-Expectation Question Series . . . . . . . . . . . . . . . . . . . . . . . . . . . . . . . . . . . . . 24 4.3. Visual Aids Used in U.S. Cognitive Interviews of Mortality Expectations . . . . . . . . . . . . . . . . . 25 4.4. Mexico Round 1 Interviews of Mortality Expectations, Spanish . . . . . . . . . . . . . . . . . . . . . . . . . . . 28 4.5. Mexico Round 1 Interviews of Mortality Expectations, Mayan . . . . . . . . . . . . . . . . . . . . . . . . . . . . 28 4.6. Stick-Figure Results, Round 2 Mexico Cognitive Interviews . . . . . . . . . . . . . . . . . . . . . . . . . . . . . . . 30 4.7. Mexico Round 2 Interviews of Mortality Expectations, Spanish . . . . . . . . . . . . . . . . . . . . . . . . . . . . 31 4.8. Mexico Round 2 Interviews of Mortality Expectations, Mayan . . . . . . . . . . . . . . . . . . . . . . . . . . . . . 32


xi
Summary
Individual subjective forecasts of one’s own mortality or survival, referred to as mortality expectations, can affect economic decisions, such as consumption and saving. People expect-ing to live few additional years, for example, are likely to consume more and save less than those expecting to live many more years. Therefore, longitudinal surveys of older people often include measures of mortality expectations. Such measures may be particularly useful when evaluating social programs serving older populations or otherwise analyzing populations with potentially high mortality rates.
In 2007, the government of the state of Yucatan in southeastern Mexico implemented a noncontributory pension program to reduce poverty among the elderly. This program, designed in collaboration with the RAND Corporation, included an evaluation component to assess its impact. The evaluation seeks to measure the effects of the program on the health, nutri-tion, and well-being of elderly pension recipients and includes a series of surveys that collect individual- and household-level data.
The baseline surveys for the evaluation were implemented in late 2008 in the cities of Valladolid and Motul and included a series of questions on mortality expectations. These ques-tions were adapted from the Health and Retirement Study (HRS), a longitudinal survey of older persons conducted in the United States. In the adapted mortality-expectation question, each respondent was shown a ruler with a 0-to-100 scale and instructed to select a number that represented his or her percentage chance of living five more years. The visual aid of the ruler was designed to make it easier for the older population, many of whom are illiterate, to under-stand the question.
Early in the implementation of the baseline survey, we received reports from data-collection staff that respondents had difficulty understanding and answering the question on mortality expectations (also known as subjective mortality). All the data collectors reported that many, if not most, respondents had difficulty with this question and that the difficulties were most marked among respondents with little or no education and among Mayan speakers—groups that made up large portions of the sample. We included the mortality-expectation ques-tion in the follow-up survey administered one year after the baseline survey because we wished to further test the question and had retrained interviewers on how to ask the question. Field observations and reports indicated serious measurement problems in adapting the HRS ques-tion for use among an elderly population in Mexico. We therefore decided to drop the question from the next round of data collection and assess whether it could be modified to address the measurement problems we identified.
We gathered information on ways to measure expectations in other contexts (e.g., of the weather or of a game of chance), as well as on mortality and life expectancy. We paid particular

xii Mortality Expectations of Older Mexicans: Development and Testing of Survey Measures
attention to methods for collecting information on expectations among elderly populations or populations with low levels of literacy, particularly in developing countries, to identify which questions and visual aids worked best among such respondents. Overall, we found little varia-tion in methods to elicit data on expectations among respondents in developing countries. The two methods we found that appeared to be most promising were asking respondents to think about others like themselves and then predict the future for these others, and the use of stones or beans as a visual aid.
After this review, we developed a set of mortality-expectation questions, practice ques-tions, and visual aids to be tested through cognitive interviews in both the United States and Mexico. In developing practice questions, we aimed to develop questions that would make sense in the Mexican context and that would familiarize the respondent with the visual aid. We wished to test multiple visual aids in addition to the previously used ruler and to test vari-ous methods of eliciting mortality expectations. We conducted three iterative rounds of cogni-tive interviews to evaluate the validity of each of the draft questions. Cognitive interviewing allows one to study how respondents understand, mentally process, and respond to survey items and to use this information to modify and refine survey measures.
Our cognitive interviews to test these questions were conducted among Mexican-origin persons age 70 and older in Spanish in Santa Monica, California, and in Spanish and Mayan in Yucatan. The first round of testing found some promising avenues for further experimenta-tion, such as a revised ruler, but also reinforced the difficulty of working with a low-literacy population. We determined that more testing was necessary on all measures and questions.
In the second round of testing, we conducted two sets of ten cognitive interviews each in Yucatan, Mexico, for a total of 20 interviews, half in Mayan and half in Spanish. We tested the original ruler, sliding ruler, stones, and stick figures, using these as visual aids for various mortality-expectation questions. We tested questions that were direct (asking respondents to answer for themselves), indirect (asking them to answer for others like them), conditional (with answers bounded by that on a previous question), and unconditional (with answers not bounded by that on a previous question). We used the findings from each set of tests to fur-ther refine the survey questions in both languages before including them in a follow-up survey for evaluating the noncontributory pension program. Informed by feedback from interviewers and our examination of the data from the Mexico tests, we determined that using stick figures in conditional questions and counting stones on direct questions worked best in this popula-tion of older Mexicans with low levels of education and a high proportion of Mayan speak-ers. Accordingly, we included such questions in a follow-up evaluation survey fielded in 2012 in Merida, Yucatan. In other populations, different types of questions and visual aids may be more effective.
We found that cognitive interviewing in populations like the one of interest in this study can provide valuable information on how respondents understand survey items. We recom-mend testing survey items this way with small groups of respondents before including them in a larger survey. We did learn through the cognitive interview process that some visual aids might hinder rather than help in eliciting a response. We also confirmed that, in a population with low levels of literacy, eliciting numerical answers poses a particular challenge.

xiii
Acknowledgments
Above all, we thank the Yucatan pension-program beneficiaries and their families who so gen-erously agreed to participate in the evaluation surveys. Without them, this study would not be possible.
We thank the many individuals, listed below, from the RAND Corporation, the govern-ment of the state of Yucatan, and academic institutions who contributed to the design, devel-opment, and implementation of the pension program and the impact evaluation. We would particularly like to thank those who provided feedback on the development and testing of subjective mortality measures. We would especially like to thank Ivonne Ortega Pacheco, gov-ernor of the state of Yucatan, for her commitment to the well-being of the elderly population in the state of Yucatan and for her support of the program and the evaluation project. Other individuals we wish to acknowledge are
• RAND Corporation: Joanna Carroll, Gabriela Castro, Sandy Chien, Corinne Goldberg, Michael Hurd, Arie Kapteyn, Norely Martínez, Adrian Montero, Alfonso Rivera, Martha Timmer, Bas Weerman
• Yucatan government: Luis Felipe Canche, Saúl Canche, Ulises Carrillo, Mabell Cisneros, Gloria María Dzib, Uriel Ezequiel Palma, Ismael Panty, Sergio Danilo Patrón, Jorge Isaac Peniche, Israel Iván Poot, Rosalba Robles, Sergio Enrique Tun, José Alfredo Uc, and Santos Betulio Ucan for their contributions to the subjective mortality design and pilot-test process
• academic institutions: Orazio Attanasio (University College London) and Costas Meghir (Yale University) for their excellent feedback and ideas throughout the design of the sub-jective mortality questions.


xv
Abbreviations
ANOVA analysis of variance
CAPI computer-assisted personal interviewing
CLASP RAND Center for Latin American Social Policy
HIV human immunodeficiency virus
HRS Health and Retirement Study
NIA National Institute on Aging
PPP purchasing power parity


1
ChapTEr OnE
Introduction
Individual subjective forecasts of one’s own mortality or survival, referred to as mortality expec-tations, can affect economic decisions, such as consumption and saving (see, for example, Hurd and McGarry, 2002; Salm, 2010). People expecting to live few additional years, for example, are likely to consume more and save less than those expecting to live many more.
Longitudinal surveys of older people therefore often include measures of mortality expec-tations. Such measures may be particularly useful when evaluating social programs serving older populations or populations with potentially high mortality rates. Surveys seeking to evaluate the effects of a noncontributory pension program in the state of Yucatan, in southeast-ern Mexico, initially included mortality-expectation questions. We planned to use mortality expectations as an outcome in the study because it may be that receipt of the pension causes changes in mortality expectations. Yet these questions proved difficult to ask among an older population with limited levels of education in Yucatan.
The pension program itself was instituted in 2007, when the government of the state of Yucatan sought to reduce poverty among the elderly population. The program provides a monthly pension worth MXN $550 (or about USD $67 at 2011 purchasing power parity [PPP]) to adults age 70 and older.1 The pension program was introduced in phases through-out the state, beginning in rural areas (localities with populations of 2,500 to 6,500) and then expanding to cities with populations of 20,000 or more, including Merida (see Figure 1.1).2
The state government designed the pension program in collaboration with the RAND Corporation and included an evaluation component for the program. The evaluation compo-nent included surveys of program beneficiaries, their families, and control populations. The surveys included questions to measure subjective mortality expectations among the elderly.
The research objectives of the evaluation are to measure the effects of the program on the health, nutrition, and well-being of elderly recipients. The evaluation involves conduct-ing a series of in-person surveys that collect extensive individual- and household-level data. In addition to the data on mortality expectations, these data include selected biomarkers, dietary practices, self-reported health, health behaviors, stress, depression, health care use and expen-ditures, access to health care services, household food security and availability of food, labor history, income and assets, social support, and family transfers. A series of RAND reports
1 The PPP exchange rate, which accounts for the amount of money needed to purchase an identical basket of goods and services in different countries, from Mexican pesos to U.S. dollars in 2011 was 8.19. For more information, see Organisation for Economic Co-operation and Development (undated [a], undated [b]).2 Beneficiaries in rural areas received a pension of MXN $500 (approximately USD $62 at 2011 PPP) and a food basket worth MXN $50. Beneficiaries in urban areas received a pension of MXN $550.

2 Mortality Expectations of Older Mexicans: Development and Testing of Survey Measures
describes the program, its implementation, and evaluation, as well as related topics. (For more information about the implementation and design of the noncontributory pension program and the design of its impact evaluation, see the fi rst two reports in this series, Aguila, Kapteyn, et al., forthcoming, and Aguila, Borges, et al., forthcoming.)
Th is report describes the development and testing of a series of survey questions designed to measure subjective mortality among the elderly in Yucatan. We discuss the original measure used, diffi culties with it, the development of new measures, and testing of the new measures. We do not, in this report, present or analyze the data collected from these new measures.
We present this research in fi ve chapters. In Chapter Two, we explore prior research in this area and then describe the development and testing of alternative measures of subjective mortality. In Chapter Th ree, we discuss our experience in using a measure of subjective mor-tality that had been used and validated in other large-scale, longitudinal studies in the United States and what led us to explore, develop, and test alternative measures. In Chapter Four, we summarize our fi ndings throughout the process and discuss the use of the alternative measures we developed for collecting information on subjective mortality among the elderly in develop-ing countries. In Chapter Five, we present our conclusions.
Figure 1.1Mexico, the State of Yucatan, and the City of Merida
SOURCE: Instituto Nacional de Estadística y Geografía (INEGI). Used with permission. RAND TR1288/6-1.1
Yucatan
Mexico

3
ChapTEr TwO
Identifying Measures of Subjective Mortality
We reviewed information on methods and measures to collect information on expectations on mortality and life expectancy and in other contexts. We searched for publications in both peer-reviewed journals and other literature (e.g., monographs and reports) from any time period that mentioned subjective mortality expectations.1 We paid particular attention to studies that had developed questions or used methods to collect information on expectations from elderly or low-literacy populations, especially in developing countries, because we hoped to find infor-mation about the questions and visual aids that worked best among such respondents.
Questions regarding the expectations of individuals toward the future are useful in under-standing decisionmaking in a variety of topics, including risk-taking; health and economic decisions, such as bequests, spending, and saving; and perceptions of future events. Researchers began asking respondents about subjective probabilities in the early 1990s in order to combine this information with choice data (Manski, 2004). Combining subjective expectation data and choice data provides more information about how people make decisions, particularly in most decisionmaking situations, in which only partial information is available.
Manski (2004) found that, when asking questions on a scale of 0 to 100-percent chance, respondents use the full scale, although they tend to bunch at 50 and round to the near-est 5 percent in the middle (but not the ends) of the scale. His review also found it useful to familiarize respondents with the scale through instructions and a practice question, such as one about the percentage chance of rain tomorrow. His review concluded that probabilistic questions can elicit useful information and that responses in some examples are internally consistent.
In an early example of mortality expectations, Hamermesh (1985) asked a nonrandom sample of white males 20 to 70 years of age to express, in percentages, their “subjective prob-ability of living to at least age (60 or 80).” He found that their expectations were similar to what life tables predicted and were correlated as expected with health-status variables.
The Health and Retirement Study (HRS), a longitudinal panel survey that began in 1992, also asks, as noted earlier, about mortality expectations.2 In the 1992 survey, the researchers asked respondents, then 51 to 61 years of age, to rate, on a 0-to-10 scale, with 0 meaning abso-lutely no chance 10 meaning absolutely certain, their chances of living at least to age 75. The survey asked respondents answering anything but 0 their chances of living at least to age 85.
1 We searched Google Scholar, as well as Academic Search Complete, EconLit, and other EBSCO-hosted databases.2 The HRS surveys more than 26,000 respondents. It is conducted every two years and is representative of U.S. residents age 50 and older. Blacks, Hispanics, and residents of Florida are oversampled. For more information, please see HRS (undated).

4 Mortality Expectations of Older Mexicans: Development and Testing of Survey Measures
Researchers can rescale these responses to represent subjective probability distributions for use in decisionmaking models, such as those to test the effects that mortality expectation can have on decisions related to aging and retirement, such as saving and medical expenditures (Hurd and McGarry, 1995).
The 1992 HRS used a visual aid for in-person interviews that showed numbers on a scale from 0 on the left to 10 on the right. There were some discrepancies in responses, including 2.5 percent of respondents who gave a lower number for survival to 75 than to 85 years of age, and 9.2 percent responding 10 to both, indicating possible misunderstanding of the question (Hurd and McGarry, 1995). Nevertheless, overall, the questions appeared to function well, with responses similar to those one might anticipate from life-table averages or predict from variables, such as socioeconomic or health status (Hurd and McGarry, 1995).
Indeed, follow-up research indicated that the subjective expectations predicted actual outcomes relatively well. Using 1992 and 1994 HRS data,3 Hurd and McGarry (2002) found, as they had previously (Hurd and McGarry, 1995), that subjective expectations of mortality reflected life-table averages. They also found that the expectations roughly reflected actual mortality in the respondents. Those who died by 1996 had expressed, on average, a 0.45 prob-ability of living to age 75, while those who had survived had expressed, on average, a 0.65 prob-ability of living to 75 (Hurd and McGarry, 2002).4
The HRS has continued to elicit mortality expectations in each wave of the survey. In the 2010 survey, it asked respondents, “What is the percent chance that you will live to be 75 or more?” It showed respondents a scale from 0 to 100, listing numbers in intervals of 10. It repeated the question for five-year intervals, i.e., it asked respondents, “What is the percent chance that you will live to be (80, 85, 90, 95, 100) or more?” Ages in question depended on the respondent’s current age, with the future age ten to 15 years above the respondent’s cur-rent age (HRS, 2010). Hurd (2009) discusses in more detail subjective expectations used in the HRS.
Delavande and Rohwedder (2008) studied the use of a visual aid on the HRS (applied through the Internet) in eliciting expectations of Social Security benefits; this visual aid had respondents virtually allocate balls across bins to express the chances of their future Social Security benefits being of the amount shown for that bin. They found that the visual aid gen-erated usable responses for more than 97 percent of responses, while the percentage-chance format (in which a respondent indicates a number from 0 to 100 to represent the chance that his or her future benefits would be more or less than a certain amount) resulted in a loss of approximately 20 percent of responses. This indicates that visual aids (and innovation in visual aids) may lead to better data collection in expectation questions.
3 In 1994, the questions regarding mortality remained the same, but the response scale changed to 0–100. Rescaling to 0–10 for both waves made responses comparable (Hurd and McGarry, 2002).4 In 1992, the respondents would have been age 46–65. Those who survived to the 1994 wave would have been age 48–67, so they would not have reached 75. Those who died earlier had less of an expectation of reaching 75 than those who did not die, showing that the expectations reflect actual mortality. The age of 75 is not itself important; the researchers in this case were looking at two-year survival and whether the question about living to age 75 was related to two-year survival.

Identifying Measures of Subjective Mortality 5
Expectation Elicitation in Developing Countries
Elicitation of expectations in developing countries, where respondents may have low liter-acy and numeracy levels, poses different challenges from those in developed countries, where respondents are familiar with the concept of probability and are exposed to it in their daily lives (such as through weather forecasts). The questions asked in developed countries typi-cally ask for percentage chance or probability on a scale of 0 to 100. The rationale for eliciting expectations on a variety of subjects, including mortality, is the same for developing-country populations as for developed: Expectations of future events influence decisionmaking in the present. There is a small but growing body of literature on subjective expectations in develop-ing countries.
Delavande, Giné, and McKenzie (2011) reviewed the existing literature and determined that elicitation of expectations in a developing country is feasible, even among populations with low literacy, and valuable for research and policy design. Similarly, Attanasio (2009) also concluded that subjective expectation questions can be used successfully in developing countries.
Delavande, Giné, and McKenzie (2011) also found that using visual aids, such as beans or stones to be placed into a number of piles or bins to indicate an answer, was helpful. In Malawi, for example, they found that having respondents use ten beans and a plate to elicit expectations on mortality and human immunodeficiency virus (HIV) infection worked well among a population with low levels of education. Their survey explicitly tied their questions to probability or chance, while other bean- or stone-allotment aids ask for “likelihood,” which respondents might interpret differently.
In Mexico, Attanasio and Kaufmann (2009) asked 15- to 25-year-old people who had graduated from junior high school about their income expectations. They used a ruler to elicit an answer on a scale of 0 to 100 and included a practice question on the chance of rain. Although their particular elicitation in Mexico was successful, we note that their population consisted of urban youth who were considering high school or college education, while the population for the Yucatan study is older adults who have relatively low levels of education (see Table 3.1 in Chapter Three). Older adults may also be more likely to have issues with viewing the visual aid, as we saw earlier (see Table 3.2 in Chapter Three).
In their study of small businesses in Sri Lanka, de Mel, McKenzie, and Woodruff (2008) employed an indirect approach in asking firm owners (with an average of six to ten years of education) to think of 20 businesses like theirs and predict how many would have profits. This question did not use a visual aid but appeared to be effective (Delavande, Giné, and McKenzie, 2011).
Overall, we found little variation in methods of eliciting expectations in developing coun-tries. Nevertheless, this is a relatively new field of research, and other forthcoming papers and works in progress may include new methods.


7
ChapTEr ThrEE
Initial Subjective Mortality Questions Implemented
Initial Subjective Mortality Questions
The initial baseline surveys for evaluation of the noncontributory pension program were imple-mented from September through November 2008 in the cities of Valladolid and Motul. Val-ladolid residents age 70 and older were selected to receive the pension, forming the treatment group. Motul residents would be part of the evaluation but would not receive the pension, forming the control group.1
The baseline survey included a series of questions to collect information on mortality expectations. These questions were adapted from the HRS, a longitudinal survey of people age 50 and older in the United States (for more information, see Hurd and McGarry, 1995), and have been used in many other studies (see review by Manski, 2004). We also asked this series of questions on the first follow-up survey for the Yucatan program evaluation, applied in both cities in July and August 2009.
Our initial mortality-expectation question survey asked respondents to report their expec-tation regarding the chance of living to be 80, 85, 90, 95, or 100 years of age. The age prompt included in the question depended on the respondent’s age and was between 11 and 15 years in the future (e.g., a respondent age 70–74 at the time of the survey was asked his or her chance of living to be 85).2 The phrasing of the question was modeled after the 2006 HRS core data set. The HRS asks respondents to give “a number from 0 to 100, where ‘0’ mean[s] that you think there is absolutely no chance, and ‘100’ means that you think the event is absolutely sure to happen,” to estimate the likelihood of such events as a change in weather, receiving or leav-ing an inheritance, experiencing a change in employment, and, ultimately, living to be 75 or 85 years of age.
In our baseline survey, we showed each respondent a ruler numbered from 0 to 100 (see Figure 3.1) and instructed him or her to select a number that he or she thought represented the percentage chance of living to be the age specified. We used the ruler as a visual aid in order to provide respondents with an image to help gauge their responses. We designed the ruler to make it easier for the older population, many of whom are illiterate, to understand the ques-tion. We modeled the ruler after another successfully used in Mexico for questions on income
1 Part of the Motul sample was age 68 and 69 at the time of the baseline survey; this was purposefully done in order to create a different control group. All Valladolid participants were age 70 or older.2 Those age 65 to 69 were asked to respond for age 80, those age 70 to 74 were asked for age 85, those age 75 to 79 were asked for age 90, those age 80 to 84 were asked for age 95, and those age 85 to 89 were asked for age 100. Those age 90 and older at the time of the survey were not asked this question.

8 Mortality Expectations of Older Mexicans: Development and Testing of Survey Measures
expectations in the 2003 Encuesta de Evaluación de los Hogares Rurales (Evaluation Survey of Rural Homes).
Our expectation questions were two-fold. First, we asked the respondent,
Please look at this ruler, which has a scale from 0 to 100. When I ask you a question, I’d like for you to give me a number from 0 to 100, where “0” means that you think there is absolutely no chance that something will happen and “100” means that you think that something is absolutely sure to happen. Now let’s practice. Can you show me on the ruler how sure you are that it is going to rain tomorrow?
Once he or she had indicated the possibility of rain the next day, we asked the respondent, “What do you think are the chances that you will live to be at least (80, 85, 90, 95, or 100)?”
Results from the Baseline and Follow-Up Surveys
Although the use of a ruler had, as noted, been validated in another Mexican survey on income expectations, we received reports early in the course of implementing the baseline survey from data-collection staff that respondents were having difficulty understanding and responding to our expectation questions, both the “practice” question on weather and the “real” question on mortality. In debriefing interviewers at a team meeting, we found that all 35 data collec-tors reported that many, if not most, respondents were experiencing difficulty in understand-ing this question and that the difficulties were most marked among respondents with little or no education and among Mayan speakers. This concentration was particularly problematic given the concentration of survey respondents among these populations. As Table 3.1 indi-cates, nearly 90 percent of respondents had not completed primary education, and 74 percent were Mayan speakers.
Figure 3.1Visual Aid for Baseline and Follow-Up Surveys: Ruler
NOTE: We did not translate the text on the ruler into Mayan because those who preferred to complete the survey in Mayan typically were not literate in Mayan.RAND TR1288/6-3.1
Absolutely will nothappen
It will definitelyhappen
It might not happen It might happen
908580757065605550454035302520151050 95 100
908580757065605550454035302520151050 95 100
Totalmenteseguro de que no
Totalmenteseguro de que sí
Es más posibleque no
Es más posibleque sí
a. English
b. Spanish

Initial Subjective Mortality Questions Implemented 9
Interviewers reported having to read the questions multiple times. They said that many respondents did not know an answer or did not understand the question. Other respondents appeared to simply pick a response in order to move to the next question. Some became annoyed by the question. Many interviewers also reported that some respondents did not understand how to use or read the ruler because of poor vision or illiteracy. Finally, several interviewers reported that, even among respondents who were able to read the ruler, many seemed to think that the numbers represented age and therefore picked the number they thought represented the age to which they expected to live rather than the number representing the percentage chance they thought they had of living to be the selected age.
Table 3.1Descriptive Statistics of Baseline Respondents, Valladolid and Motul, First Phase
Variable Value
Mean age (years) 76.0
Standard deviation 5.3
Male (%) 48.9
Marital status (%)
Single, separated, divorced, or widowed 43.8
Couple (consensual union or married) 56.2
Education level (%)
none 33.2
Incomplete primary 54.4
Completed primary or above 11.6
Mayan speaker (%) 74.1
read and write message in Spanish (%) 63.5
Lives alone (%) 12.7
Mean number of household residents 3.4
Standard deviation 2.1
has children (%) 91.8
Self-reported health status (%)
Excellent, very good, or good 17.5
Fair or poor 82.4
number of observations 1,824
nOTE: Statistics are presented only for baseline respondents who were eligible to be asked the mortality question (those not answering the survey through a proxy and with a birth year between 1918 and 1943). Those eligible were the members of the control group who were younger than 70 and included as an additional control group with a younger age.

10 Mortality Expectations of Older Mexicans: Development and Testing of Survey Measures
We reviewed the question with interviewers and retrained them by role-playing how to handle the issues they were encountering in asking the question. Project staff responsible for the design and implementation of the survey conducted a series of field observations on how interviewers were asking the question and how respondents were reacting and responding to it. The field observations confirmed interviewer reports. Field observers also reported that, when respondents began to get annoyed or frustrated with the question, some interviewers tried to help the respondent choose an answer. Observers emphasized to interviewers the importance of not leading respondents to an answer (thus biasing data). Nevertheless, a second interviewer debriefing at the end of baseline data collection confirmed the initial field reports of problems with the mortality-expectation question. We included the question in the follow-up survey administered approximately one year after the baseline survey in order to test the question fur-ther and see whether our efforts to retrain interviewers on this question improved the quality of the data.
The response distributions do not necessarily indicate problems with the mortality-expectation question. Figure 3.2 presents the response distributions for this question in the baseline survey and the follow-up survey fielded in Motul and Valladolid. The distributions indicate a bunching effect;3 only 0.5 percent of baseline responses and 0.2 percent of follow-up
3 Analyses of survey data (e.g., consumption, expenditure) show that respondents frequently round responses to values ending in 0 or 5. Survey respondents commonly answer questions at certain round numbers that result in the heaping of data (Huan, 2006; Pudney, 2008).
Figure 3.2Cumulative Distribution of Baseline and Follow-Up Responses to Mortality-Expectation Question
NOTE: The age choice itself is not shown in this figure. The point here is that responses bunch at multiples of five. Each respondent was asked the chances of living to be age x, where x was 11–15 years older than his or her age atthe time of the survey. To show the response distribution overall, we decided not to break out by age prompt.RAND TR1288/6-3.2
Res
po
nd
ents
rep
ort
ing
th
at t
he
chan
ceis
at
or
bel
ow
th
e se
lect
ed v
alu
e (%
)
Reported chance of living to be a certain age
0 5 10 15 20 25 30 35 40 45 50 55 60 65 70 75 80 85 90 95 100
100
80
60
40
20
0
BaselineFollow-up

Initial Subjective Mortality Questions Implemented 11
responses were not given in multiples of 5. Given that the numbers presented in the ruler were provided in increments of 5, this is, perhaps, to be expected.
We also examined the item-level missing data for the mortality-expectation question at both baseline and follow-up. We consider both don’t-know responses and item-level refusals as having missing values. (The survey was administered through a computer-assisted personal interviewing [CAPI] protocol that does not allow interviewers to leave a question blank or inadvertently skip it; no item-level missing data should be missing because of interviewer error.) Table 3.2 shows that, for the 1,823 respondents for the baseline in Valladolid and Motul, we received a valid numerical response to this question from 83.8 percent of respondents, a don’t-know response from 10.1 percent, and refusals from 6.1 percent. For the follow-up survey, for the 1,539 respondents, we received a valid numerical response from 86.4 percent, a don’t-know response from 10.4 percent, and refusals from 3.2 percent. In total, the item-level missing-data rate was 16 percent at baseline and 14 percent at follow-up. This compares unfavorably to a 98.3-percent response rate from the 1992 HRS and a 97.4-percent response rate for the 1994 HRS (Hurd and McGarry, 2002), indicating potential problems with the question. In the 1993 Asset and Health Dynamics Among the Oldest Old study, which used a similar ques-tion to that on the HRS (asking for survival to 12 years in the future for a population 70 and older at the time of the survey), Hurd, McFadden, and Merrill (2001) found much higher nonresponse rates of 25 percent for single respondents and 21 percent of married respon-dents; lower income quartiles showed higher nonresponse rates. This implies that older and less wealthy respondents may have more problems answering the subjective mortality question.4 See Tables 3.2–3.5 for breakdowns by geography, Mayan-speaking status, education level, and ability to read or write a message in Spanish.
4 Overall, our population is older and not well educated (a proxy for wealth, which is more complicated to present; see Table 3.1). The inference is drawn from the research presented and cited previously, not from the tables that follow.
Table 3.2Item-Level Missing Data on Baseline and Follow-Up Surveys, by Geographic Area
Data
Valladolid Motul Total
Observations % Observations % Observations %
Baseline
responses 797 80.9 730 87.1 1,527 83.8
Don’t know 124 12.6 61 7.3 185 10.1
refusal 64 6.5 47 5.6 111 6.1
Total 985 100.0 838 100.0 1,823 100.0
Follow-up
responses 706 95.4 624 78.1 1,330 86.4
Don’t know 27 3.7 133 16.6 160 10.4
refusal 7 0.9 42 5.3 49 3.2
Total 740 100.0 799 100.0 1,539 100.0

12 Mortality Expectations of Older Mexicans: Development and Testing of Survey Measures
We did receive what appeared to be valid numerical responses from most respondents. Table 3.6 summarizes the mean numerical response to the question regarding chances (from 0 to 100 percent) of living to be a certain age for the baseline and follow-up surveys. These mean responses are grouped by the age about which respondents were asked (the age prompt). Most respondents for both the baseline and follow-up were prompted for the ages 85, 90, and 95 for the mortality question. In Table 3.6, the mean response of those prompted for 85 years of age was higher than of those prompted for 80 years of age for the baseline. Also for the baseline, the means for age prompts of 90 and 95 are successively lower than the mean for 85, but we see
Table 3.3Item-Level Missing Data on Baseline and Follow-Up Surveys, by Mayan-Speaking Status
Data
Mayan Speaker Non–Mayan Speaker Total
Observations % Observations % Observations %
Baseline
responses 1,150 85.0 377 80.0 1,527 83.8
Don’t know 124 9.2 61 13.0 185 10.1
refusal 78 5.8 33 7.0 111 6.1
Total 1,352 100.0 471 100.0 1,823 100.0
Follow-up
responses 1,029 87.1 301 84.1 1,330 86.4
Don’t know 118 10.0 42 11.7 160 10.4
refusal 34 2.9 15 4.2 49 3.2
Total 1,181 100.0 358 100.0 1,539 100.0
Table 3.4Item-Level Missing Data on Baseline and Follow-Up Surveys, by Education Level
Data
No Schooling Some Schooling Total
Observations % Observations % Observations %
Baseline
responses 460 75.9 1,067 87.7 1,527 83.8
Don’t know 89 14.7 96 7.9 185 10.1
refusal 57 9.4 54 4.4 111 6.1
Total 606 100.0 1,217 100.0 1,823 100.0
Follow-up
responses 397 81.2 933 88.9 1,330 86.4
Don’t know 79 16.2 81 7.7 160 10.4
refusal 13 2.7 36 3.4 49 3.2
Total 489 100.0 1,050 100.0 1,539 100.0
nOTE: Some percentages may not sum to 100 because of rounding.

Initial Subjective Mortality Questions Implemented 13
an increase in the mean for 100. In the follow-up survey, we see a similar successive decrease for age prompts of 90 and 95 from the high mean at 85, but the mean for 100 is the lowest of all age prompts (in contrast to the baseline survey, in which the mean for 100 is the highest). This variation at the 100 age prompt could be due to the mean being influenced by a few con-fident respondents in the baseline survey because there are few respondents for this age prompt.
Table 3.5Item-Level Missing Data on Baseline and Follow-Up Surveys, by Ability to Read and Write Messages in Spanish
Data
Able to Read or Write Message Not Able Total
Observations % Observations % Observations %
Baseline
responses 1,028 88.8 499 75.0 1,527 83.8
Don’t know 81 7.0 104 15.6 185 10.1
refusal 49 4.2 62 9.3 111 6.1
Total 1,158 100.0 665 100.0 1,823 100.0
Follow-up
responses 906 88.8 424 81.7 1,330 86.4
Don’t know 84 8.2 76 14.6 160 10.4
refusal 30 2.9 19 3.7 49 3.2
Total 1,020 100.0 519 100.0 1,539 100.0
nOTE: Some percentages may not sum to 100 because of rounding.
Table 3.6Mean Response of Chances of Living to Be a Certain Age, Baseline and Follow-Up Surveys
Age Prompt (years)
Baseline Survey Follow-Up Survey
Mean Observations Mean Observations
80 56.1 117 57.7 183
85 58.7 743 59.3 709
90 57.8 528 55.1 491
95 53.9 424 51.8 372
100 62.5 12 40.6 11
nOTE: we tested whether the means by age were statistically significantly different using one-way analysis of variance (anOVa) and the Tukey-Kramer method (studentized range distribution). For both surveys, only the means at ages 85 and 95 are statistically significantly different from each other at the 5-percent level. we conducted t-tests to determine whether there were significant differences by whether the respondent was a Mayan speaker, his or her education level, and his or her ability to write a message in Spanish. we found that, for the baseline survey, there was a statistically significant difference at the 10-percent level between the mean responses of those with primary or higher education levels and those with less than primary or no schooling (those with more schooling reported lower chances on average). Means by Mayan-speaking status and ability to write a message were not statistically significant on the baseline survey. For the follow-up survey, only means by ability to write a message in Spanish were statistically significantly different (at the 5-percent level), with those who could write a message in Spanish reporting higher chances on average.

14 Mo
rtality Expectatio
ns o
f Old
er Mexican
s: Develo
pm
ent an
d Testin
g o
f Survey M
easures
Table 3.7Overview of Measurement Problems with Mortality-Expectation Questions
Data
Don’t Understand Vision Problems Not Literate or Numerate Other Total
Observations % Observations % Observations % Observations % Observations %
practice question, baseline
Don’t know 4 66.7 7a 33.3 8a 88.9 0 0.0 19 48.7
refusal 0 0.0 8a 38.1 0a 0.0 2 66.7 10 25.6
numerical response 2 33.3 6a 28.6 1 11.1 1b 33.3 10 25.6
Total 6 100.0 21 100.0 9 100.0 3 100.0 39 100.0
Mortality-expectation question, baseline
Don’t know 6 23.1 8 33.3 12 30.0 6 27.3 32 28.6
refusal 4 15.4 11 45.8 19 47.5 8 36.4 42 37.5
numerical response 16 61.5 5 20.8 9 22.5 8 36.4 38 33.9
Total 26 100.0 24 100.0 40 100.0 22 100.0 112 100.0
Total baseline 32 — 45 — 49 — 25 — 151 —
practice question, follow-up
Don’t know 2a 11.1 3a 33.3 29a 72.5 6a 22.2 40 42.6
refusal 14 77.8 6a 66.7 11a 27.5 20b 74.1 51 54.3
numerical response 2a 11.1 0 0.0 0 0.0 1c 3.7 3 3.2
Total 18 100.0 9 100.0 40 100.0 27 100.0 94 100.0
Mortality-expectation question, follow-up
Don’t know 10 17.5 7 24.1 53 63.9 88 47.6 158 44.6
refusal 14 24.6 7 24.1 15 18.1 20 10.8 56 15.8
numerical response 33 57.9 15 51.7 15 18.1 77 41.6 140 39.5

Initial Su
bjective M
ortality Q
uestio
ns Im
plem
ented
15
Data
Don’t Understand Vision Problems Not Literate or Numerate Other Total
Observations % Observations % Observations % Observations % Observations %
Total 57 100.0 29 100.0 83 100.0 185 100.0 354 100.0
Total follow-up 75 — 38 — 123 — 212 — 448 —
a a comment appeared in both the practice and mortality questions, so it was removed from the practice-question count.b numerical responses were removed from the total. This table shows the interviewer comments, organized by response to the question (don’t know, refused, or a numerical response) and by the type of comment (respondent did not understand, vision problems, not literate or numerate, or some other reason). In many cases, the interviewer marked a numerical response down as the answer to the question and marked the numerical response as a comment. To accurately tally the comments related to problems with the question, we had to remove these numerical responses from the total because they really are not a problem. however, if someone were to simply tally the responses without looking at their contents, the data would appear to have many more problems.c Both duplicates and numerical responses were removed. we removed duplicates from the practice-question counts if the same interviewer comment were given for that respondent in both the practice and actual questions; the comment was counted for the actual question. For this cell, there were also numerical responses to exclude.
Table 3.7—Continued

16 Mortality Expectations of Older Mexicans: Development and Testing of Survey Measures
We also reviewed item-level missing data and comments recorded at the time of the interview on the computer by the interviewer. Table 3.7 summarizes the numbers of these comments by response to the question itself and by the type of comment recorded by the inter-viewer. At baseline, 32 of the 187 don’t-know responses (17 percent) for the mortality question occasioned an interviewer comment, as did 42 of the 119 refusals (35 percent) and 38 of the 1,560 numerical responses (2 percent).
In addition to respondents not understanding the question, respondents were noted as having vision problems preventing them from answering the question or as being not literate or numerate (based on the interviewer’s impression), also preventing them from answering the question. In “other” comments, interviewers noted, particularly in the follow-up survey, that many respondents would answer “only God knows” in response to these questions.5 This may indicate that, beyond issues related to literacy or numeracy, there are conceptual challenges leading to measurement problems in asking such questions of this population.
Although the numerical responses did not seem unreasonable, the information from field reports, interviewer debriefings, and field observations, as well as a review of the survey admin-istration statistics, convinced us that there were potentially serious problems in using this particular measure among an elderly population in Mexico. We therefore decided to drop the question from the next round of data collection and assess whether this question could be modified to address the measurement issues we identified. In particular, we sought to identify other measures that have been used to collect information on mortality expectations from low-literacy and low-numeracy populations in developing countries (see Chapter Two for this review). In the next chapter, we discuss how we developed new methods for eliciting expecta-tions among elderly respondents in Yucatan.
5 Some Mexicans believe that faith in God and God’s will are related to disabilities, illness, and death. For example, God is seen by some to be “directly involved in illness” and that “Catholic Saints are physically capable of altering one’s health in a positive direction” (Glover and Blankenship, 2007).

17
ChapTEr FOur
Developing and Testing Measures of Subjective Mortality Expectations
Through our literature review, we identified various measures of subjective expectations. From these, we selected certain measures to test in addition to the ruler used in the 2008 survey (see “Visual Aids” in this chapter). The new measures include an approach that uses a visual aid with ten stones on a plate (following Delavande and Kohler, 2009), a continuous measure, and small cardboard figures. We decided to include the Delavande and Kohler (2009) measure in our testing because this had been fielded in a population with low literacy. The continuous measure was developed to allow respondents to give answers at any interval of the scale, rather than being restricted to five- or ten-unit response intervals as occurs with the ruler or asking respondents to allot ten beans or stones to represent their answers.1 The small cardboard figures were a useful visual aid in asking respondents indirect questions to think of people like them rather than directly of themselves.
After choosing our visual aids and elicitation methods, we developed a set of mortality-expectation questions, practice questions, and visual aids to test through cognitive interviews in the United States and Mexico. All the questions and materials we developed were adapted from measures that have been used in other studies. In developing practice questions, we aimed to develop questions that would make sense in the Mexican context and that would familiarize the respondent with the visual aid. We also wished to test multiple visual aids and various methods of eliciting mortality expectations. In the following section, we first describe the practice questions used, then the mortality-expectation questions, and lastly the visual aids (ruler, stones, continuous measure, and cardboard figures) that we tested to help respondents answer the practice and mortality questions.
1 Each of the visual aids has positive and negative aspects; all but the continuous measure naturally lead to bunching at certain values. This may exclude responses at the high and low ends of the percentage scale, such as less than 5 percent or more than 95 percent. Some research shows that people tend to inflate the psychological impact of a low-probability or rare event relative to that event’s likelihood (Burns, Chiu, and Wu, 2010). However, experimental data also show that people are less likely to consider small probabilities (Ungemach, Chater, and Stewart, 2009). This apparent contradiction may be due to reliance on small samples and overemphasis of outcomes from recent samples; regardless of the likelihood of a respondent selecting a very low or high percentage, we may be excluding those responses from the data because of the nature of the visual aid used.

18 Mortality Expectations of Older Mexicans: Development and Testing of Survey Measures
Overview of the Survey Questions on Mortality Expectations
Practice Questions
We tested seven types of practice questions in the United States on seven older Mexicans living in the United States in October and November 2010 and added one new practice question for the 20 interviews conducted in December 2011 in Yucatan, Mexico.2 Table 4.1 summarizes these practice questions. We asked respondents to show us their answers using the visual aid (explained below) and then probed to determine the respondents’ thought process and whether the respondents understood the visual aid.
The first question was a coin toss. We asked respondents to estimate the possibility that the coin would turn up heads. The interviewer had a physical coin (a MXN $10 coin) that was tossed in front of the respondent and then hidden from view until answers were given.
The second question related to a die throw; respondents were asked to estimate the possi-bility of the die showing 1. Again, the interviewer physically threw a die and covered the result until after the respondent answered the question. The interviewer also used the visual-aid probes (the ruler, bean method, and continuous measure) with this question. We then tested two questions involving colored Ping-Pong balls, asking the respondent the chance of draw-ing a red ball out of a bag containing a certain number of white balls (three, four, or nine) and one red. The interviewer showed the respondent clear plastic bags containing the appropriate number and color of Ping-Pong balls to illustrate the question.
The next practice question had been used in the original survey and asked respondents to tell the interviewer how likely they thought it was that it would rain the following day. We then used a question developed specifically for Mexican-origin respondents based on a popular game called “lottery,” or lotería. We asked each respondent to gauge the likelihood that he or she would beat the interviewer in a game of lottery. We also included a question on losing the game.
2 As is described later in the chapter in more detail, the seven Mexican American respondents interviewed for the U.S. tests were recruited through connections with local Mexican American organizations. Most had primary education or no formal schooling, similar to our population of interest and to the 20 Mexicans we interviewed in the December 2011 test.
Table 4.1List of Practice Questions Used in Mortality-Expectation Cognitive Interviews
Question Number Question Topic U.S. Mexico
1 Coin toss x x
2 Die throw x
3 ping-pong balls (2 questions) x
4 rain tomorrow x x
6 Lottery (2 questions) x
7 nested events, visit of a friend (2 questions) x
8 horse race x

Developing and Testing Measures of Subjective Mortality Expectations 19
The next two practice questions described a series of nested events. In the first, we asked the respondent how likely it was that a friend would visit his or her home in the next two days. In the second, we asked the respondent the likelihood of such a visit in the next two weeks. The probability given for the second question should be equal to or greater than the probability for the first because the chance of such an event should stay the same or increase over time. We considered using other nested events, such as going to the market or purchasing a staple food item, but decided against them given that many respondents in our population have limited mobility and may not do their own shopping or be able to leave their homes.
Following the cognitive interviews in the United States, we evaluated the results and made changes to the practice questions, visual aids, and mortality-expectation questions, drop-ping several measures that did not seem to work well. We then tested the revised measures in Yucatan. For the second and third rounds of cognitive interviews conducted in Mexico, we continued to use the coin-toss and rain questions because those seemed to work best in the U.S. cognitive interviews. We added a practice question on a race between two horses, includ-ing information about which horse was normally faster, asking respondents how likely it was that the faster horse would win.
Mortality-Expectation Questions
After the practice questions, we asked the respondent his or her age in order to confirm infor-mation we previously collected and to anchor the series of mortality-expectation questions. The mortality-expectation questions took one of four forms:
1. unconditional and direct2. unconditional (one person) and indirect3. unconditional (ten people) and indirect4. conditional (ten people) and indirect.
Unconditional-question series do not restrict the response choices based on the response to the previous question, while the conditional series does restrict based on one’s prior answer. Direct asks the respondent to answer for him- or herself, while indirect asks the respondent to answer for someone like him- or herself.
The first series, unconditional and direct, asks respondents the likelihood of living five more years. For respondents answering that there is a nonzero possibility, the series then asks the possibility of living an additional five years, or ten years in the future. The series continues in five-year jumps until the respondent claims a zero possibility of living to that age or until the projection is 20 or 25 years from the respondent’s current age.3 This question series is labeled unconditional because one’s response to each of the questions in the series is not conditional (limited) by one’s response to the prior question; it is direct in that it asks the respondent to give an answer about his or her own mortality.
The second series, one-person unconditional and indirect, follows the same age jumps (every five years) but asks the respondent to think about someone similar to him or her in age,
3 Some protocols included question series going to 20 years from current age, while others went to 25. This question formulation follows Delavande and Kohler (2009), who asked respondents the chances of dying within a five- or ten-year period. We flipped the question to ask about chances of being alive in five and ten years and included additional five-year increments for testing purposes.

20 Mortality Expectations of Older Mexicans: Development and Testing of Survey Measures
gender, health status, and place of origin and then give the likelihood of that person living five more years rather than answering for him- or herself directly. The third series, ten-person unconditional and indirect, asks the respondent to imagine ten people similar to him or her in age, gender, health status, and place of origin and say how many of the ten will live for an additional five years. For each five-year increment, the respondent is asked to answer thinking of ten people, regardless of whether he or she answered that only one person would live to be that age.
The fourth series of questions asks the respondent to imagine ten people similar to him or her in age, gender, health status, and place of origin and answer how many of the ten will live an additional five years. However, unlike the third series, this is a conditional series restricting the possible answers based on the response to the previous question. For example, if a respon-dent thinks that seven of the ten will live five more years, the series asks the respondent how many of those seven will live another five years, or ten years beyond the respondent’s current age.4 Both the third and fourth question series are used with the cardboard visual aid (a collec-tion of ten stick figures; see “Visual Aids”).
Visual Aids
As noted, we developed various visual aids to help respondents answer the question. We used the ruler in Figure 3.1 in Chapter Three for the original survey and expectation question but then modified it, as in Figure 4.1, for the cognitive interviews conducted in the United States. The U.S. modification, by placing the ruler in a trapezoid, helped respondents visualize that the chance of something happening increased as the numbers increased and the trapezoid grew wider. We further modified the ruler to include a slide and shading for the cognitive interviews conducted in Mexico, as shown in Figure 4.2; the shading changed gradually from light to dark as the ruler slide was pulled to the right and the number selection increased. This allowed each respondent to manipulate the slide to show his or her response and have additional visual cues of the level of his or her answer.
We decided to use identical glass “stones” rather than beans for the visual aid we devel-oped based on Delavande and Kohler (2009) because beans can have slight variations in color and size. We had each respondent use two plates—a response plate and a storage plate—to indicate his or her answer by moving ten stones from one plate to another. Each of the ten stones represented a 10-percent interval. Figure 4.3 shows an example of the glass stones we purchased, typically used in aquariums.
We also developed a continuous measure using empty plastic bottles and rice with rulers attached to the sides (see Figure 4.4). The respondent would turn the measure over, pull the stopper, and allow rice to flow to the other bottle until he or she felt that it represented his or her answer. We developed this to help interviewees better visualize their responses and to avoid response bunching at certain values.
We used the ruler, the stones, and the continuous-measure visual aids to ask the uncondi-tional and direct, as well as the unconditional and indirect, mortality series. We used the stick figures, shown in Figure 4.5, as noted, for conditional indirect questions, asking the respon-
4 Potential drawbacks of this conditional series are that (1) an incorrect or unrealistic answer to the first question in the series influences all further answers and (2) discreteness worsens as the series progresses (e.g., if only two stick figures are left, then the corresponding choices are 0, 50, or 100 percent). An advantage is that it forces respondents to answer with logical consistency.

Developing and Testing Measures of Subjective Mortality Expectations 21
dent to move from one plate to the other the number of people like him or her that he or she thought would live to the designated age. Table 4.2 summarizes which visual aids were used for the various mortality series in all three pilot rounds.
Cognitive Interview Methods
We used three iterative rounds of cognitive interviews to evaluate and test the draft subjective mortality questions that we adapted. In this section, we review the details of these interviews. Our ultimate test of these questions was implementation of the final version of the measures in the follow-up surveys being conducted as part of the evaluation of the noncontributory pension program. We will review the results of those questions in future publications.
Cognitive interviewing allows one to study how respondents understand, process, and respond to survey items and to use this information to modify and refine survey measures. Cognitive interviews are useful in detecting and minimizing some sources of measurement error by identifying questions or terms that are difficult to comprehend or are misinterpreted by respondents, as well as response options that are inappropriate or that fail to capture the full range of a respondent’s experience (Jobe and Mingay, 1991; Hughes, 2004; Willis, 2005).
We conducted multiple rounds of cognitive interviews to assess respondents’ understand-ing of the draft mortality-expectation questions. Cognitive testing enabled us to assess whether Spanish- and Mayan-speaking respondents and, in particular, low-literacy respondents under-
Figure 4.1Visual Aid for U.S. Cognitive Interviews on Mortality Expectations: Trapezoidal Modified Ruler
RAND TR1288/6-4.1
Absolutely will nothappen
It will definitelyhappen
It might not happen It might happen
908580757065605550454035302520151050 95 100

22 Mortality Expectations of Older Mexicans: Development and Testing of Survey Measures
Figure 4.2Visual Aid for Mexico Cognitive Interviews on Mortality Expectations: Sliding Modified Ruler
RAND TR1288/6-4.2
Figure 4.3Visual Aid for U.S. and Mexico Cognitive Interviews on Mortality Expectations: Stones
RAND TR1288/6-4.3

Developing and Testing Measures of Subjective Mortality Expectations 23
stood the draft questions and were able to provide appropriate responses. The cognitive inter-views helped us verify that the respondents’ answers reflected what the draft questions were designed to measure. During the interviews, we tested a variety of practice questions to famil-iarize each respondent with the visual aid. We also, as noted, tested multiple visual aids in order to evaluate various methods for eliciting mortality expectations in an elderly population.
We conducted all interviews using a scripted protocol that required respondents to “think aloud” as they answered each question, meaning that respondents were encouraged but not required to talk about what they were thinking as they responded to the survey questions. (The online appendix presents the cognitive interview protocol used in the second round of Mexico testing, as well as the final survey questions.) Interviewers also used scripted probes after each survey question to assess the respondent’s understanding of the survey item and of key con-cepts, as well as to identify terms, items, or response options that were problematic.
Figure 4.4Visual Aid for U.S. and Mexico Cognitive Interviews on Mortality Expectations: Continuous Measure
RAND TR1288/6-4.4

24 Mortality Expectations of Older Mexicans: Development and Testing of Survey Measures
We conducted seven interviews in Spanish in Santa Monica, California, in October and November 2010 and 20 interviews in Spanish and Mayan in Yucatan, Mexico, in December 2011. Interviews took approximately 90 minutes and were conducted in person by staff trained by a survey methodologist with cognitive-interview experiences.
After the first round of interviews in the United States, we evaluated the findings from the cognitive interviews and identified items that were problematic and needed to be modified or dropped, as well as wording changes that had to be made in the Spanish version. We then translated the questions to Mayan and conducted two rounds of cognitive interviews in Span-ish and Mayan in Mexico with the revised survey questions. We used the findings from each round of testing to further refine the survey questions in both languages prior to including them in follow-up surveys for the impact evaluation of the noncontributory pension program. We present more details about each round below.
Figure 4.5Visual Aid for U.S. and Mexico Cognitive Interviews on Mortality Expectations: Stick Figures
RAND TR1288/6-4.5
Table 4.2Visual Aids and Mortality-Expectation Question Series
Question Number Mortality Series
Ruler (original or modified) Stones
Continuous Measure Stick Figures
1 unconditional and direct (about the respondent)
x x x
2 unconditional and indirect (about someone like the respondent)
x x
3 unconditional and indirect (ten people like the respondent)
x
4 Conditional and indirect (ten people like the respondent)
x

Developing and Testing Measures of Subjective Mortality Expectations 25
Overview of U.S. Cognitive Interviews
The first round of cognitive testing occurred at RAND’s main campus in Santa Monica, California, in October and November 2010 and involved interviews with seven respondents, including three training interviews. Table 4.3 shows the visual aids used in each of the seven U.S. interviews. We changed the interview protocol between each of these interviews; in par-ticular, although most of the changes were grammatical corrections and clarifications, we changed the protocol between the first three and last four interviews such that these two groups of interviews are not comparable. During all interviews, project leaders and staff were present to observe, with one person asking questions, another person taking notes, and two to three observers.
We recruited the seven Mexico-born interviewees through connections with local Mexi-can American organizations: three through the Consulate General of Mexico, two from a community organization, and two from a local church. We compensated the respondents USD $100 for their time and travel expenses. The age of these pilot interviewees ranged from 74 to 87 years and averaged 77.9 years. Five were female and two male. Three had no formal education, three had a primary school (fifth-grade) education, and one had completed the eighth grade.
The ruler used on the prior mortality questions (see Figure 4.1) was fully tested in only one of the training interviews (interview 1). It seemed to work for some questions but not all, with the respondent alternately using the ruler correctly and misunderstanding the numbers. We attempted to test the ruler in the second interview, but the respondent had no formal edu-cation and was not comfortable with the numbers. We decided to not pursue the ruler further and continued the interview using other tools (rice and stick figures).
We modified the ruler, as noted, by placing it inside a large trapezoid (see Figure 4.1). We tested this version in the third training interview with some practice questions. It appeared to work for that respondent, but we did not test it further on subjects with low levels of numeracy.
We tested the stones during only one of the training interviews, interview 3; they did not seem to work well for that respondent, who confused them with the number of attempts for the Ping-Pong practice question. This method may work better in Malawi (see Delavande and Kohler, 2009), where games using stones or beans seem to be more common than in Mexico.
Table 4.3Visual Aids Used in U.S. Cognitive Interviews of Mortality Expectations
Interview Number
Ruler (original or modified) Stones
Continuous Measure Stick Figures
1 x (original) x (conditional)
2 x x (conditional)
3 x (modified) x x (conditional)
4 x x (conditional)
5 x (conditional and unconditional)
6 x (conditional and unconditional)
7 x x (conditional and unconditional)

26 Mortality Expectations of Older Mexicans: Development and Testing of Survey Measures
We tested the continuous measure in one practice interview, interview 2, and two pilot interviews, interviews 4 and 7. We used this measure only for the rain and lottery practice questions because the other practice questions required a precise response difficult to demon-strate with the rice.5 This visual aid seemed promising, but we did not test further because con-structing a continuous measure on a large scale for the impact evaluation survey would have posed both budget and logistical problems. There were also concerns regarding the accuracy of recording the selected values.
Using stick figures as a visual aid for conditional mortality-expectation questions appeared to work well during the U.S. interviews. The cardboard figures seemed to help respondents visualize the question and understand the diminishing probability as the figures aged through-out the question series. Individuals also seemed to consider several variables, such as the lon-gevity of parents, friends, and acquaintances and their health status and will to live, in giving their responses. Upon reviewing the responses, we determined that, of the seven cases in which the stick figures were used, the conditional questions worked well in four cases, moderately well in one case, and not well in two cases.
We added an unconditional question series (numbers 4 through 7) using the figures for three pilot U.S. interviews, in which each age prompt starts anew with ten people like the respondent; we tested them in tandem with conditional questions using the figures. This proved confusing to respondents given this protocol because the conditional and uncondi-tional sections that used the stick figures were very similar. Upon reviewing the responses for the unconditional question series, we found that the stick figures worked moderately well in two of the three interviews.
During the pilot tests, the fourth through seventh interviews, we used, as noted, five dif-ferent types of practice questions: coin toss, die throw, colored Ping-Pong balls, rain prediction, and lottery questions. We did not ask the nested-event question after the first three training interviews because respondents seemed to be confused by it. Among the piloted practice ques-tions, the coin toss was simple and seemed to work; the rain question worked in some cases, but it is easy to “flip” the response to the negative and record the incorrect answer.6 Some respon-dents did not appear to be familiar with dice, and others seemed confused by the die throw. For example, in one practice interview, a respondent said that he thought that the possibility that the die would show the number 1 to be “very difficult” and that he believed that the die would show 3 and not 1 upon revealing the throw (interview 3). Others did not understand the Ping-Pong ball question; for example, interviewee 1 responded that the possibility of select-ing a red ball from a bag with three white balls and one red was 60 because “there are three white [balls], and there are more chances [to select a white ball].” The lottery question seemed confusing for all respondents and had lengthy instructions. We decided to retain the rain and coin questions after the pilot tests but to not test the other practice questions further; this was by mutual agreement within the research team after we reviewed the notes from the interviews and our observations.
5 In trying to show 50 for the coin toss, for example, a project team member instead mistakenly demonstrated 65. A margin of error of ±15 does not give much information, so the practice questions with an expected answer were not asked with this visual aid.6 Respondents occasionally answered the question by remarking on the chance the weather tomorrow would be nice, rather than giving the chance of rain; an interviewer may inadvertently record this “flipped” answer.

Developing and Testing Measures of Subjective Mortality Expectations 27
The first round of testing revealed some promising avenues for further experimentation, such as a revised ruler, but also reinforced the difficulty of working with a low-literacy popu-lation. We dropped the use of the continuous measure as a visual aid because of logistical problems and dropped the questions related to the die throw and Ping-Pong balls because the respondents associated these questions with personal beliefs or preferences (e.g., gambling). Also, we determined that more testing was necessary for the ruler, the stones, and particularly the cardboard figures, which appeared to be the most promising new approach to collecting information on subjective mortality.
Overview of Mexico Cognitive Interviews
We conducted two rounds of cognitive interviews in Yucatan in December 2011. In all, we completed interviews with 20 respondents in Yucatan, half in Mayan and half in Spanish. The interviews in Mayan were conducted in the locality of Mama, a small locality south of Merida, because the population in the study contains some Mayan speakers who prefer to take the survey in Mayan. The remaining ten interviews were conducted in Spanish in the state capi-tal of Merida. The cognitive interviews in Mexico sought to refine and test the questions and visual aids in a population similar to that of the larger study.
Round 1
The first round of cognitive interviews in Mexico occurred in early December 2011. Five inter-viewers went into the field and interviewed ten respondents, five female and five male. Three interviewers conducted five Spanish interviews among them, and two interviewers conducted five Mayan interviews between them. The age of the respondents ranged from 70 to 82 years and averaged 72.4 years. One respondent had no formal education; five had completed the fifth grade, and four had a sixth- to eighth-grade education. Time for the interviews ranged from 65 to 130 minutes and averaged 92 minutes.
In these interviews, we asked each respondent three practice questions in addition to the indirect and direct mortality-expectation series of questions using the original ruler, the sliding ruler, or the stones as a visual aid. We also asked each the unconditional or conditional series of indirect mortality-expectation questions using the stick figures. Table 4.4 summarizes the series of questions we asked in each interview in Spanish, and Table 4.5 in Mayan. We had originally planned to test an additional visual aid with this group but realized that doing so would pose an excessive time burden on interviewees. We compensated the interviewees with MXN $100 (approximately USD $12, in 2011 PPP) for their time.
The three practice-question types we tested in our first round of Mexico interviews were the coin toss, the rain, and the horse race. We asked these in random order for the Spanish and Mayan interviews (manually changing the order if necessary to have variation in the pilot tests).
Although we varied most of the visual aids by interview, we asked in all interviews a series of mortality-expectation questions using the stick figures. After the unconditional-and-direct and unconditional-and-indirect mortality-expectation series, we asked the interviewees to consider ten stick figures, similar to themselves in age, gender, hometown, and health, and to answer questions regarding the number of people who would live a specified number of additional years. We used this procedure for both unconditional questions, in which each age

28 Mortality Expectations of Older Mexicans: Development and Testing of Survey Measures
interval begins with ten stick figures, and conditional ones, in which the number of stick fig-ures available for each age interval depends on the answer to the prior age-interval question. Whether a respondent was asked the unconditional or conditional stick-figure question series was decided by random assignment.
Because the series of questions was fairly complicated and had a specific order that had to be followed, we prepared separate documents for each interview to facilitate the process for field staff. After the interviews were conducted, the survey documents and a page detailing the interviewer impressions of the interviews generally and each tool specifically were scanned and emailed to team members in the United States. We also spoke with the interviewers by phone to receive their feedback and then decided which tools and questions to test in the second round of Mexico pilots.
Regarding the practice questions, we found that each of the practice questions (coin, horse, and rain) seemed to work in seven of ten interviews and “more or less worked” for the
Table 4.4Mexico Round 1 Interviews of Mortality Expectations, Spanish
Description Interview 1 Interview 2 Interview 3 Interview 4 Interview 5
practice question 1-1
Coin horse rain horse Coin
practice question 2-1
horse Coin Coin rain rain
practice question 3-1
rain rain horse Coin horse
probability tool 1: direct and indirect
hrS ruler Sliding ruler Stones hrS ruler Sliding ruler
Indirect Direct Indirect Direct Indirect
Direct Indirect Direct Indirect Direct
Indirect mortality 1: figures
unconditional Conditional Conditional unconditional Conditional
Table 4.5Mexico Round 1 Interviews of Mortality Expectations, Mayan
Description Interview 6 Interview 7 Interview 8 Interview 9 Interview 10
practice question 1-1
Coin horse horse rain rain
practice question 2-1
horse rain Coin horse Coin
practice question 3-1
rain Coin rain Coin horse
probability tool 1: direct and indirect
hrS ruler Sliding ruler Stones Stones hrS ruler
Indirect Indirect Direct Direct Indirect
Direct Direct Indirect Indirect Direct
Indirect mortality 1: figures
Conditional Conditional unconditional unconditional Conditional

Developing and Testing Measures of Subjective Mortality Expectations 29
remaining three interviews, according to interviewer categorization at the time of questioning. Interviewers reported that all three practice questions had “more or less worked” for one inter-viewee and two practice questions had “more or less worked” for another interviewee.
For the five-year indirect, unconditional mortality-expectation questions using the origi-nal ruler, interviewers reported positive feedback for three of four cases for the five- and ten-year questions and in one of one case for the 15-year question (three interviewees were not asked this question). None of the four respondents was asked the 20-year question because of either “aging out” of the question series or their responses to previous questions. For the direct, unconditional questions using the original ruler, results were as follows: It worked well for the five-, ten-, and 15-year questions for all four interviews, and, for the 20-year question, it worked well for the two respondents who were asked the question.
For indirect, unconditional questions using the sliding ruler, interviewers reported the following:
• It worked for the five-year question in one of three interviews. • It worked for the ten-year question in two of three interviews.• It worked for the 15-year question in one of three interviews.• It worked for the 20-year question in two of three interviews.
For the direct, unconditional questions using the sliding ruler, interviewers reported that the aid worked for the five- and ten-year questions in two of the three interviews, the 15-year question in one of three interviews, and the 20-year question in two of two interviews.
The unconditional questions using stick figures seemed to work well. For the five-, ten-, and 15-year questions, we had positive results in three of four interviews, while, for the 20-year question, results were positive for two of two interviews. The conditional questions using the stick figures also seemed promising: For the five-, ten-, 15-, and 20-year questions, interviewers documented that these questions worked well in five out of the six interviews in which they were applied.
For the unconditional, indirect questions in which the stones were used, interviewers reported that the aid worked well in the three cases for five- and ten-year questions; for the 15-year questions in two out of three; and, for the 20-year question, it worked well in the case in which it was used. In the case of unconditional, direct questions using stones, for the five-, ten-, and 15-year questions, it worked in all the three cases for each question; for the 20-year question, it worked in the two cases in which it was used.
Round 2
The second round of ten cognitive interviews in Mexico, five in Spanish and five in Mayan, occurred in mid-December 2010 (see Table 4.6). We continued testing the direct and indirect unconditional mortality-expectation series of questions. We used the stones and the sliding ruler as visual aids but discontinued use of the original ruler, which we felt had been proven to be confusing to respondents.7 We also continued to test the stick figures and their related ques-tion series (unconditional/indirect and conditional/indirect) but randomized whether these
7 For example, in one interview, the respondent said that it was unlikely that the slow horse would beat the fast horse in a race but gave a probability of 50 using the original ruler, explaining, “I feel that 50-100 is positive and 0-50 is negative.” In another interview, the respondent said that it was unlikely to rain but showed 60 on the ruler.

30 Mortality Expectations of Older Mexicans: Development and Testing of Survey Measures
questions came at the beginning or the end of the interview. In previous tests, the stick-figure series was always at the end. We tested both conditional and unconditional stick-figure series, as before, as well as the practice questions we used in the first round of Mexico testing. The order of questions and visual aids was randomly assigned as before, following the same prac-tice as the first Mexico pilot (see above). We tested the three practice questions again because the results from previous testing had been inconclusive as to which seemed to work best. We continued to compensate respondents MXN $100 for their time.
In the second group of ten Mexico respondents, five were male and five female. Respon-dent ages ranged from 70 to 93 years and averaged 75.8 years. Two of the ten had no formal education, seven had an education level of fifth grade or less, and one reported having an edu-cation level between sixth and eighth grades. Interview time ranged from 30 to 115 minutes and averaged 81 minutes.
As before, the interview transcripts were scanned and emailed to project staff in the United States, and we spoke with the interviewers regarding their impressions in order to decide what to include in the larger survey. Given their feedback and our examination of the data (presented below), we determined that the ten conditional stick figures (applied before the other tool) and the direct unconditional stones (using the horse-race practice question) worked best. Accordingly, we included these in the follow-up survey fielded in 2012 in Merida.
For the practice questions, the coin-toss question seemed to not work as well as the other two questions, with it marked as having worked well in only six of ten interviews by inter-viewees at the time of questioning. For the horse-race question, it worked well in eight of ten interviews performed, while, for the rain questions, it seemed to work well in seven of ten interviews. Overall, the horse-race question seemed to work the best of the three practice ques-tions, particularly given previous issues with the rain question in the 2008 and 2009 surveys.
Interviewers reported that, for the unconditional, direct mortality-expectation questions using the stones, the aid worked well in
• five of five interviews for the five-year question• two of three interviews for the ten-year question (two interviewees were not asked this)• three of three interviews for the 15- and 20-year questions (two interviewees were not
asked this).
Table 4.6Stick-Figure Results, Round 2 Mexico Cognitive Interviews
Question
Before Other Sections After Other Sections
Conditional Unconditional Conditional Unconditional
5 years 3/3 2/2 1/2 2/3
10 years 3/3 1/2 2/2 0/2a
15 years 3/3 2/2 2/2 2/2
20 years 3/3 2/2 2/2 0/0b
a One interviewee was not asked this question.b none of the three interviewees was asked this question.

Developing and Testing Measures of Subjective Mortality Expectations 31
For the unconditional, indirect mortality-expectation questions using the stones, the interviewers reported that this series worked well for the five-year question in two of four interviews administered (one interview did not answer this question) and, for the ten-year question, in two of two interviews (three interviews did not complete this question). The aid did not work well for the 15- and 20-year questions for the one interview (four interviewees were not asked these questions).
The sliding ruler worked well for the unconditional, direct questions for the five-year question in four out of five cases; it work well in five of five cases for the ten-year question; for the 15-year question, it worked in four out of four cases; and, for the 20-year question, it worked in the three interviews performed. For the unconditional, indirect questions, in the case of the five-year question, it worked well in four out of five cases; for the ten-year question, it worked well in all the cases (five out of five); it worked well for the 15-year question in four out of five, and the 20-year in four out of four.
We tested the stick figures before and after other sections to see whether this would affect respondents’ understanding of the section (see Table 4.6). For the “before” stick figures, we found that, for the unconditional questions, the aid worked in two of the two interviews for five-, 15-, and 20-year questions and in one of two interviews for the ten-year question. The aid with conditional questions applied before other sections worked well in three of three inter-views for five-, ten-, 15-, and 20-year questions.
For the question series using stick figures after other tools, we found that, for the condi-tional series, this aid seemed to work in two of two interviews for the ten-, 15-, and 20-year questions and in one of two for the five-year question. For the unconditional questions, it worked in two of three interviews for the five-year question; for the ten-year question, we observed that it did not work for the two interviews performed (one interviewee was not asked this question). For the 15-year question, it worked in two of two interviews, and, for the 20-year question, none of the three interviews was asked this question.
For the results of the second-round interviews in Spanish and Mayan, see Tables 4.7 and 4.8, respectively.
Table 4.7Mexico Round 2 Interviews of Mortality Expectations, Spanish
Description Interview 1 Interview 2 Interview 3 Interview 4 Interview 5
Indirect: stick figures
Conditional Conditional
practice question 1 horse horse Coin rain Coin
practice question 2 rain Coin rain Coin horse
practice question 3 Coin rain horse horse rain
Visual aid: direct and indirect
Stones Stones Sliding ruler Sliding ruler Stones
Direct Direct Indirect Direct Indirect
Indirect Indirect Direct Indirect Direct
Indirect: stick figures
Conditional unconditional unconditional

32 Mortality Expectations of Older Mexicans: Development and Testing of Survey Measures
Table 4.8Mexico Round 2 Interviews of Mortality Expectations, Mayan
Description Interview 6 Interview 7 Interview 8 Interview 9 Interview 10
Indirect: stick figures
unconditional unconditional Conditional
practice question 1 horse Coin Coin rain rain
practice question 2 Coin horse rain horse Coin
practice question 3 rain rain horse Coin horse
Visual aid: direct and indirect
Stones Sliding ruler Stones Sliding ruler Sliding ruler
Indirect Indirect Direct Indirect Direct
Direct Direct Indirect Direct Indirect
Indirect: stick figures
unconditional Conditional

33
ChapTEr FIVE
Conclusion
The objective of the cognitive interviews conducted in both the United States and Mexico was to evaluate and contrast a set of visual aids, practice questions, and questions that aim to elicit subjective mortality expectations developed for a series of household surveys conducted as part of an evaluation of a noncontributory pension program in Yucatan. These questions were adapted from mortality-expectation questions that have been used in other countries, including the United States. The questions that we developed and tested asked the respondent to consider his or her own life expectancy, as well as to think about the mortality of others similar to him or her.
We found, given interviewer debriefings, analysis of nonresponse, and interviewer com-ments, that the question originally asked on the baseline and follow-up surveys (the chances of living to be a certain age) did not work well. We tested various visual aids and mortality-expectation question series in the United States and Mexico. We determined from the U.S. interviews that the stick figures and the corresponding question series appeared to work well. In Mexico, we tested the original ruler, the sliding ruler, the stones, and the stick figures, using these as visual aids for the various mortality-expectation question series. From these tests, we determined that the stones with the direct, unconditional series and the stick figures with the indirect, conditional series worked best. We included these series, with questions based on five-year increments up to 20 years above the respondent’s current age, on the follow-up survey for the impact evaluation fielded in Merida in 2012.
Overall, we found that cognitive interviewing in this population can provide valuable information on how respondents understand survey items. We recommend testing survey items this way with small groups of respondents prior to including those items on a larger survey. Through the cognitive interview process, we learned that some visual aids might hinder rather than help in eliciting a response. We also confirmed that, in a population with low levels of literacy, eliciting numerical answers poses a particular challenge. In an older Mexican popu-lation with low levels of education and a high percentage of Mayan speakers, we found that asking respondents to think of others like themselves (using the visual aid of the stick figures) was helpful, as was the visual aid of stones paired with direct mortality-expectation questions. In other populations, different types of questions and visual aids may be more effective and testing should occur prior to data collection.


35
References
Aguila, Emma, Abril Borges, Arie Kapteyn, Rosalba Robles, and Beverly A. Weidmer, A Noncontributory Pension Program for Older Persons in Yucatan, Mexico: Implementing and Designing the Evaluation of the Program in Merida, Santa Monica, Calif.: RAND Corporation, TR-1288/2-SOY/NIA, forthcoming.
Aguila, Emma, Arie Kapteyn, Rosalba Robles, Oscar Vargas, and Beverly A. Weidmer, A Noncontributory Pension Program for Older Persons in Yucatan, Mexico: Implementing and Designing the Evaluation of the Program in Valladolid, Santa Monica, Calif.: RAND Corporation, TR-1288/1-SOY/NIA, forthcoming.
Attanasio, Orazio P., “Expectations and Perceptions in Developing Countries: Their Measurement and Their Use,” American Economic Review, Vol. 99, No. 2, 2009, pp. 87–92.
Attanasio, Orazio, and Katja Kaufmann, Educational Choices, Subjective Expectations, and Credit Constraints, Cambridge, Mass.: National Bureau of Economic Research Working Paper 15087, July 2009. As of July 16, 2013: http://www.nber.org/papers/w15087
Burns, Zach, Andrew Chiu, and George Wu, “Overweighting of Small Probabilities,” Wiley Encyclopedia of Operations Research and Management Science, 2010.
de Mel, Suresh, David McKenzie, and Christopher Woodruff, “Returns to Capital in Microenterprises: Evidence from a Field Experiment,” Quarterly Journal of Economics, Vol. 123, No. 4, 2008, pp. 1329–1372.
Delavande, Adeline, Xavier Giné, and David McKenzie, “Measuring Subjective Expectations in Developing Countries: A Critical Review and New Evidence,” Journal of Development Economics, Vol. 94, No. 2, March 2011, pp. 151–163.
Delavande, Adeline, and Hans-Peter Kohler, “Subjective Expectations in the Context of HIV/AIDS in Malawi,” Demographic Research, Vol. 20, No. 31, 2009, pp. 817–875.
Delavande, Adeline, and Susann Rohwedder, “Eliciting Subjective Probabilities in Internet Surveys,” Public Opinion Quarterly, Vol. 72, No. 5, 2008, pp. 866–891.
Glover, Noreen M., and Charlene J. Blankenship, “Mexican and Mexican Americans’ Beliefs About God in Relation to Disability,” Journal of Rehabilitation, Vol. 73, No. 4, October–December 2007, p. 41.
Hamermesh, Daniel S., “Expectations, Life Expectancy, and Economic Behavior,” Quarterly Journal of Economics, Vol. 100, No. 2, May 1985, pp. 389–408.
Health and Retirement Study, home page, undated. As of July 16, 2013: http://hrsonline.isr.umich.edu/
———, “2010 Core: Section P—Expectations,” Ann Arbor, Mich.: University of Michigan, 2010. As of May 14, 2012: http://hrsonline.isr.umich.edu/modules/meta/2010/core/codebook/h10p_r.htm#PMP028R
HRS—See Health and Retirement Study.
Huan, Tzung-Cheng, “0–5 Heaping of Tourism Survey Expenditure Responses: Does It Matter?” e-Review of Tourism Research, Vol. 4, No. 5, October 2006, pp. 100–107.

36 Mortality Expectations of Older Mexicans: Development and Testing of Survey Measures
Hughes, Kristen Ann, Comparing Pretesting Methods: Cognitive Interviews, Respondent Debriefing, and Behavior Coding, Washington, D.C.: Statistical Research Division, U.S. Bureau of the Census, Survey Methodology 2004-02, September 30, 2004. As of July 16, 2013: http://www.census.gov/srd/papers/pdf/rsm2004-02.pdf
Hurd, Michael D., “Subjective Probabilities in Household Surveys,” Annual Review of Economics, Vol. 1, June 2009, pp. 543–562.
Hurd, Michael D., Daniel McFadden, and Angela Merrill, “Predictors of Mortality Among the Elderly,” in David A. Wise, ed., Themes in the Economics of Aging, Chicago, Ill.: University of Chicago Press, 2001, pp. 171–198.
Hurd, Michael D., and Kathleen McGarry, “Evaluation of the Subjective Probabilities of Survival in the Health and Retirement Study,” Journal of Human Resources, Vol. 30, 1995, pp. S268–S292.
———, “The Predictive Validity of Subjective Probabilities of Survival,” Economic Journal, Vol. 112, No. 482, October 2002, pp. 966–985.
Jobe, Jared B., and David J. Mingay, “Cognition and Survey Measurement: History and Overview,” Applied Cognitive Psychology, Vol. 5, No. 3, May–June 1991, pp. 175–192.
Manski, Charles F., “Measuring Expectations,” Econometrica, Vol. 72, No. 5, September 2004, pp. 1329–1376.
Organisation for Economic Co-operation and Development, “PPPs and Exchange Rates,” undated (a). As of July 16, 2013: http://stats.oecd.org/Index.aspx?DataSetCode=SNA_TABLE4
———, “Prices and Purchasing Power Parities (PPP),” undated (b). As of July 16, 2013: http://www.oecd.org/std/prices-ppp/
Pudney, Stephen, Heaping and Leaping: Survey Response Behaviour and the Dynamics of Self-Reported Consumption Expenditure, Essex, UK: Institute for Social and Economic Research, University of Essex, Working Paper 2008-09, February 2008. As of July 16, 2013: https://www.iser.essex.ac.uk/publications/working-papers/iser/2008-09.pdf
Salm, Martin, “Subjective Mortality Expectations and Consumption and Saving Behaviours Among the Elderly,” Canadian Journal of Economics, Vol. 43, No. 3, August 2010, pp. 1040–1057.
Ungemach, Christoph, Nick Chater, and Neil Stewart, “Are Probabilities Overweighted or Underweighted When Rare Outcomes Are Experienced (Rarely)?” Psychological Science, Vol. 20, No. 4, April 2009, pp. 473–479.
Willis, Gordon B., Cognitive Interviewing: A Tool for Improving Questionnaire Design, Thousand Oaks, Calif.: Sage Publications, 2005.